development of balanced scor card e ... - iaeme
TRANSCRIPT
http://iaeme.com/Home/journal/IJM 214 [email protected]
International Journal of Management (IJM) Volume 10, Issue 6, November-December 2019, pp. 214 234, Article ID: IJM_10_06_021 –Available online at http://iaeme.com/Home/issue/IJM?Volume=10&Issue=6 Journal Impact Factor (2019 9.6780 (Calculated by GISI) www.jifactor.com ): ISSN Print: 0976-6502 and ISSN Online: 0976-6510 © IAEME Publication
DEVELOPMENT OF BALANCED SCOR CARD E FRAMEWORK FOR PERFORMANCE
EVALUATION OF AIRLIN ESYandava Karun Kumar
Part-time Ph.D. Scholar in Department of Mechanical Engineering, College of Engineering(A), Andhra University, Visakhapatnam, India
V.V.S. Kesava Rao Professor, Department of Mechanical Engineering,
College of Engineering(A), Andhra University, Visakhapatnam, India
ABSTRACT The paper aims to design a multidimensional performance measurement system for
airlines in order to address the complexity of balancing objectives and operational activities. The research design and methodology uses secondary data collection i.e. annual reports and business reports of airlines which are collected from the airlines
own website. The paper develops and applies a customized version of balanced scorecard based on a new set of performance measures. Data on eleven performance enablers for a case study of 100 world major airlines during 2009 to 2013 is considered
in the study to develop performance measurement framework of Airlines based on balanced scorecard. The Measurement of Research Construct Adopted from Wu and
Laio (2014) is validated through confirmatory factor analysis using Lisrel 8.8 and developed modified set of indicators of the constructs. Further, CRITIC method is used to determine relative weights of the indicators under respective perspectives of balanced scorecard.
Keywords: Balance score card, Confirmatory analysis, critic method.Cite this Article: Yandava Karun Kumar and V.V.S. Kesava Rao, Development of Balanced Score Card Framework for Performance Evaluation of Airlines, International Journal of Management (IJM), 10 (6), 2019, pp. 214 234. –http://iaeme.com/Home/issue/IJM?Volume=10&Issue=6
1. INTRODUCTION In any business environment the measurement of performance of productive system of goods or services is basic management instrument for taking of decisions and for the establishment of new actions, also serving as an aid for new strategically plans for business improvement. An
efficient and accurate performance evaluation system is essential as a useful tool for the managers to control, monitor and improve the performance of the organization. Effective
performance evaluation systems have the following features: Comprehensiveness,
Yandava Karun Kumar and V.V.S. Kesava Rao
http://iaeme.com/Home/journal/IJM 215 [email protected]
Comparability, Measurability and compatibility with goals. Among the advantages of performance evaluation are identification of opportunities for improvement and justification of the decisions for stakeholders.
The global airline industry provides a service to virtually every country in the world, and has played an integral role in the creation of a global economy. The airline industry itself is a major economic force, in terms of both its own operations and its impacts on related industries. Currently, airlines have suffered from high levels of competition and economic pressure, with
high volatility in fuel and foreign exchange rates, shrinking fuelled by consolidation and bankruptcies, mergers, capacity cuts, bankruptcy filings, large scale losses and high debt levels. Over the last few decades, the problem of performance evaluation has attracted significant
attention which led to variety of methods that seek to develop measures to assess the performance of organizations in general and airline industry in specific to deal with the
performance measurement technique. The balanced scorecard approach is makes explicit links between different performance
dimensions for the evaluation of a complex system, such as airline organizations. Major issue with the BSC is the tendency towards financial measures that managers may pay insufficient attention to leading and non-financial measures causes the failure of the purpose of the Balanced Scorecard. The Balanced Scorecard has been successfully implemented across a wide number of industries and geographical locations. Organizations must foster involvement, consistency
and adaptability in order to achieve measurable results from the implementation of a BSC (Deem, et al., 2010).
2. LITERATURE SURVEY Gusnardi et al., (2017) aimed to analyze the dimensions of balanced scorecard as a
representation of strategic planning and management system as a new style of government areas through CFA. The population and the sample used are of local government officials serving the financial statements of local government in North Sumatra as many as 361 respondents with purposive sampling methods.
Najafi, et al., (2009) identified the four perspectives including financial, customer, internal processes, and learning and growth perspectives and tries make a balance between financial togoals and the other remained perspectives.
The BSC particularly identifies the cause-and-effect relationship among leading indicators and lagging indicators (Eilat et. al., 2008).
The balanced scorecard facilitates decision making using a variety of accounting measures from different entity perspectives; traditionally, these perspectives are labeled financial,
customer, internal business process, and learning and growth (Hank et al., 2015). Balanced Scorecard measures are specifically selected to assess whether strategic objectives are being achieved (Cheng & Humphreys, 2012; Humphreys & Trotman, 2011; Kaplan,
Petersen, & Samuels, 2012; Libby, Malina et al., 2007 ).Hasan Dinçer et al., (2017) evaluated the performance of the European airlines, using a
balanced scorecard perspective and recommend European airlines to focus on these aspects in order to improve their performance.
Anirut Pipatprapa et al., (2016) combined structural equation modeling (SEM) and fuzzy analytic hierarchy process (FAHP) to identify the priority weight of factors for assessing the
Environmental Performance (EP) of Taiwan’s food industry. A SEM approach was used to develop and define EP factors and sub-factors using a questionnaire designed to gather data from 163 managers in the food industry. A FAHP approach was employed to prioritize the scores using a questionnaire to interview 21 experts regarding the different aspects of EP.
Development of Balanced Score Card Framework for Performance Evaluation of Airlines
http://iaeme.com/Home/journal/IJM 216 [email protected]
Bojuwon Mustapha and Bojuwon Yusuf Bolaji (2015) measur ed lecturers’ commitment scale using second other confirmatory factor analysis on the hypothesized model with four latent variables of commitment to student, commitment to teaching, commitment to school and commitment to the profession.
Shahid Hussain et al., (2018) applied SEM approach to identify the critical factors affecting quality in social infrastructure projects. The authors developed a quantitative approach using smart-PLS version 3.2.7.
David Staš et al., (2015) design a conceptual framework for creating the Green Transport ed(GT) Balanced Scorecard (BSC) models from the viewpoint of industrial companies and supply chains using Analytic network Process (ANP).
Agnieszka Tubis and Sylwia Werbińska-Wojciechowska (2017) presented elements of the BSC corresponding to the general trends of changes and strategies currently being undertaken by the companies in the road passenger transport sector.
Frederico, Guilherme F and Cavenaghi, Vagner (2008), present a performance edmanagement model, based in the Balanced Scorecard, through a case study of Brazilian freights
railroad transportation and approaches four Balanced Scorecard’s perspectives (financial, customers, processes and learning and growth ).
Hamed Rahimi et al., (2017) analyzed systematic relations between key indicators of hospital performance evaluation, identifying causal relations and prioritizing indicators based on the 4 perspectives described by the balanced scorecard (BSC).
Saif Hassan Ali Alzaabi and Hassan Al-Dhaafri (2018) investigated the effects of Strategy Management (ST) and Balanced Scorecard (BSC) on Organizational Performance (OP). Based on a theoretical foundation and a wide review of the literature, the model of the research was proposed 220 Questionnaires were distributed among random selected sample of Civil Defense departments in the Northern Emirates using structured equation modeling
Vinh V. Thai (2015), investigated the concept of Port Service Quality (PSQ) and examines its influence on customer satisfaction in the port sector. Following a literature review, a
conceptual model of PSQ and its influence on customer satisfaction is proposed. Confirmatory factor analysis, followed by multiple regression is conducted to confirm the PSQ construct and examine the relationship between PSQ and customer satisfaction.
3. CONFIRMATORY FACTOR ANALYSIS OF BALANCED SCORECARD Wu and Laio (2014) proposed balanced scorecard indicators in respect of airline organizations and ar presented in Table-1. e
Table 1: Balanced scorecard constructs (Wu and Laio, 2014)
Construct Indicator Financial Perspective Operating Revenue (OR)
Return On Investment (ROI) Return On Assets (ROA)
Net Income (NI) Customer Perspective Revenue Passenger Kilometer (RPK)
Number of Passengers (NP) Revenue Ton Kilometer (RTK)
Internal Business Perspective Energy (Fuel) Cost ( EC) Capital Cost (CC)
Learning and Growth Perspective Labor Cost (LC) Operating Expenses per employee (OE)
Yandava Karun Kumar and V.V.S. Kesava Rao
http://iaeme.com/Home/journal/IJM 217 [email protected]
4. METHODOLOGY To conduct CFA, initially items are generated that accurately reflect the proposed constructs of the subject under consideration based on a comprehensive literature review and comments from an expert panel. A questionnaire is developed for each of the construct with measurement items.
Respondents (stake holders) are asked to measure their level of agreement for each of the construct items on a Likert scale (i.e. strongly disagree to agree strongly). Then CFA is
implemented to assess how well the observed variables reflect the proposed constructs using some statistical softwares like AMOS, Lisrel etc. In this study, instead of primary data
collection from questionnaire, secondary data collection from annual reports, financial statements etc. is made to conduct CFA.
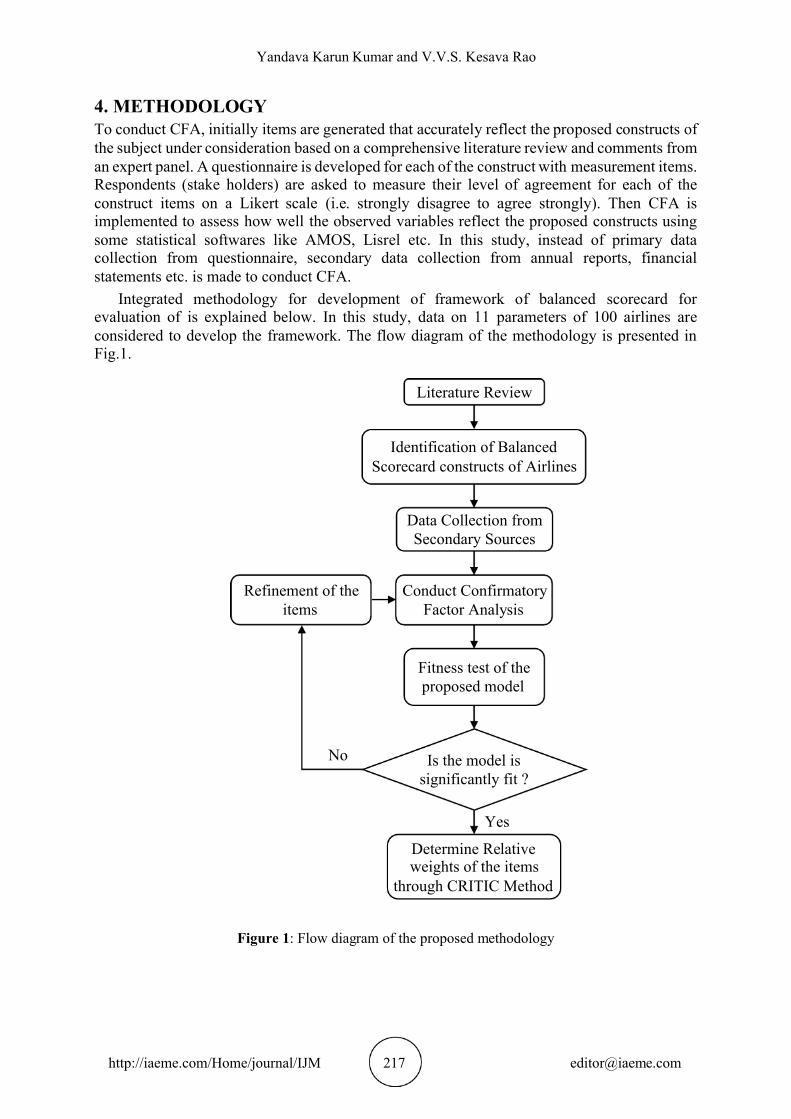
Integrated methodology for development of framework of balanced scorecard for evaluation of is explained below. In this study, data on 11 parameters of 100 airlines are
considered to develop the framework. The flow diagram of the methodology is presented in Fig.1.
Figure 1: Flow diagram of the proposed methodology
Literature Review
Identification of Balanced Scorecard constructs of Airlines
Data Collection from Secondary Sources
Conduct Confirmatory Factor Analysis
Fitness test of the proposed model
Refinement of the items
Is the model is significantly fit ?
Determine Relative weights of the items
through CRITIC Method
No
Yes
Development of Balanced Score Card Framework for Performance Evaluation of Airlines
http://iaeme.com/Home/journal/IJM 218 [email protected]
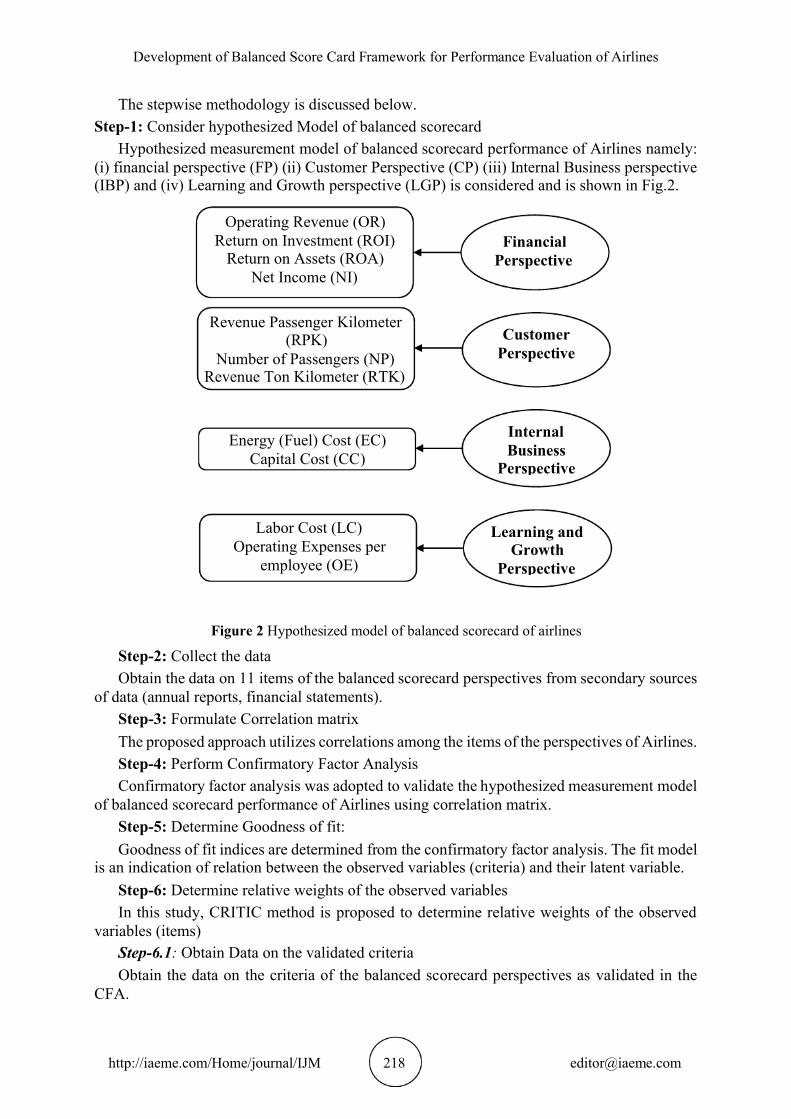
The stepwise methodology is discussed below. Step-1: Consider hypothesized Model of balanced scorecard
Hypothesized measurement model of balanced scorecard performance of Airlines namely: (i) financial perspective (FP) (ii) Customer Perspective (CP) (iii) Internal Business perspective (IBP) and (iv) Learning and Growth perspective (LGP) is considered and is shown in F .2. ig
Figure 2 Hypothesized model of balanced scorecard of airlines
Step-2: Collect the data Obtain the data on 11 items of the balanced scorecard perspectives from secondary sources
of data (annual reports, financial statements). Step-3: Formulate Correlation matrix The proposed approach utilizes correlations among the items of the perspectives of Airlines. Step-4: Perform Confirmatory Factor Analysis Confirmatory factor analysis was adopted to validate the hypothesized measurement model
of balanced scorecard performance of Airlines using correlation matrix. Step-5: Determine Goodness of fit: Goodness of fit indices are determined from the confirmatory factor analysis. The fit model
is an indication of relation between the observed variables (criteria) and their latent variable. Step-6: Determine relative weights of the observed variables In this study, CRITIC method is proposed to determine relative weights of the observed
variables (items) Step-6.1: Obtain Data on the validated criteria Obtain the data on the criteria of the balanced scorecard perspectives as validated in the
CFA.
Financial Perspective
Customer Perspective
Internal Business
Perspective
Learning and Growth
Perspective
Operating Revenue (OR) Return on Investment (ROI)
Return on Assets (ROA) Net Income (NI)
Revenue Passenger Kilometer (RPK)
Number of Passengers (NP) Revenue Ton Kilometer (RTK)
Energy (Fuel) Cost (EC) Capital Cost (CC)
Labor Cost (LC) Operating Expenses per
employee (OE)
Yandava Karun Kumar and V.V.S. Kesava Rao
http://iaeme.com/Home/journal/IJM 219 [email protected]
Step-6.2: Normalize the data Normalize the data using the relations as discussed in section 4.1 Step-6.3: Determine Standard deviation Standard deviations of the criteria are determined as discussed in section 4.2 Step-6.4: Determine measure of conflict Measures of conflict of the criteria are determined as discussed in section 4.3 Step-6.5: Determine Information content Information content of the all the criteria are determined as discussed in section 4.4 Step-6.6: Determine relative weight Relative weights of the criteria are determined as discussed in section 4.4
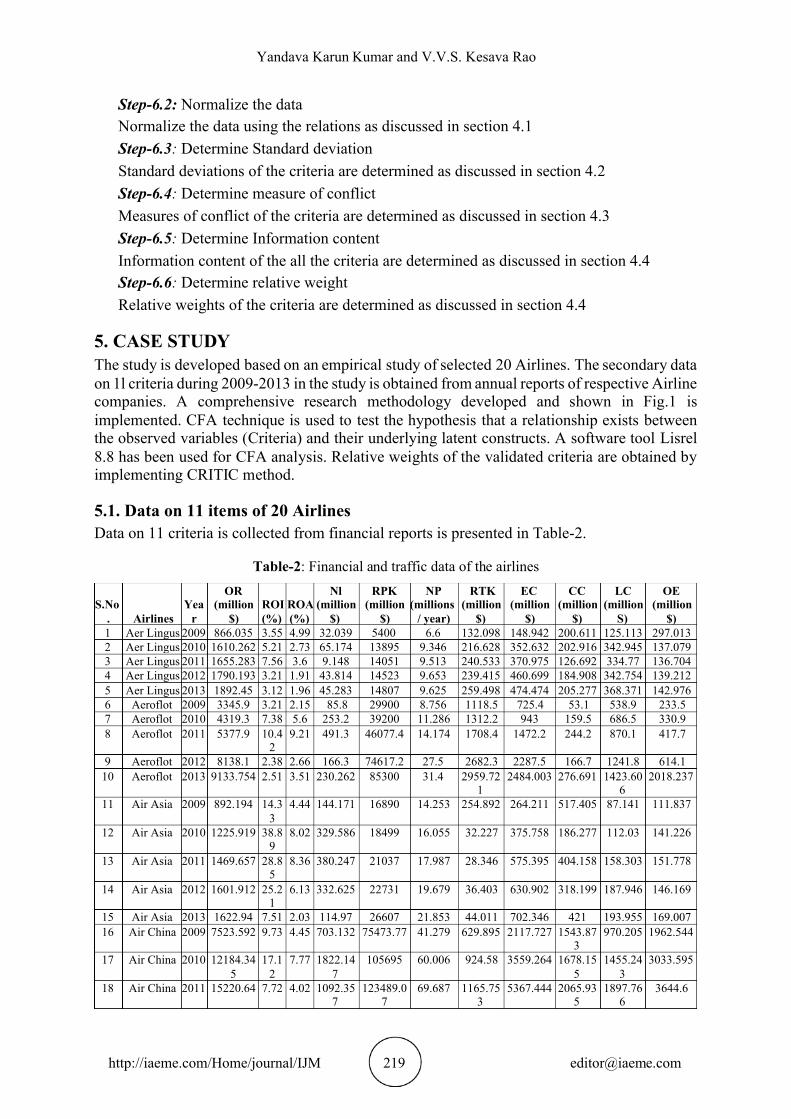
5. CASE STUDY The study is developed based on an empirical study of selected 20 Airlines. The secondary data on 1l criteria during 2009-2013 in the study is obtained from annual reports of respective Airline
companies. A comprehensive research methodology developed and shown in Fig.1 is implemented. CFA technique is used to test the hypothesis that a relationship exists between the observed variables (Criteria) and their underlying latent constructs. A software tool Lisrel 8.8 has been used for CFA analysis. Relative weights of the validated criteria are obtained by implementing CRITIC method.
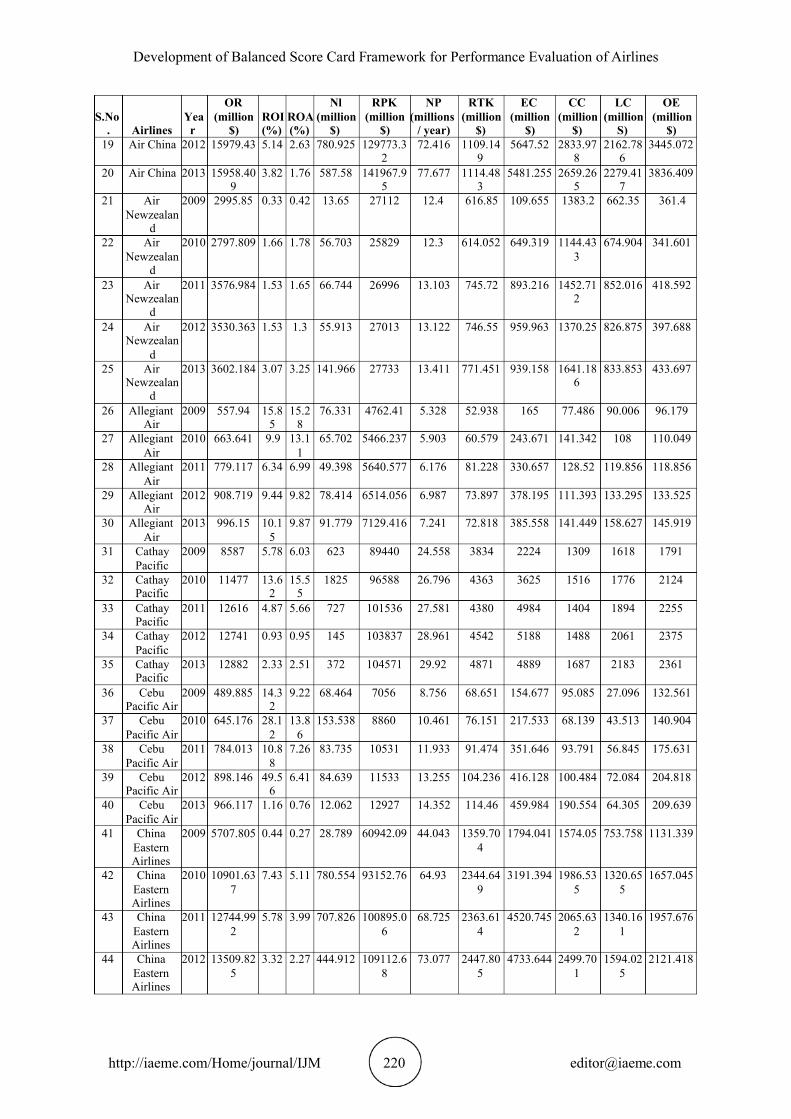
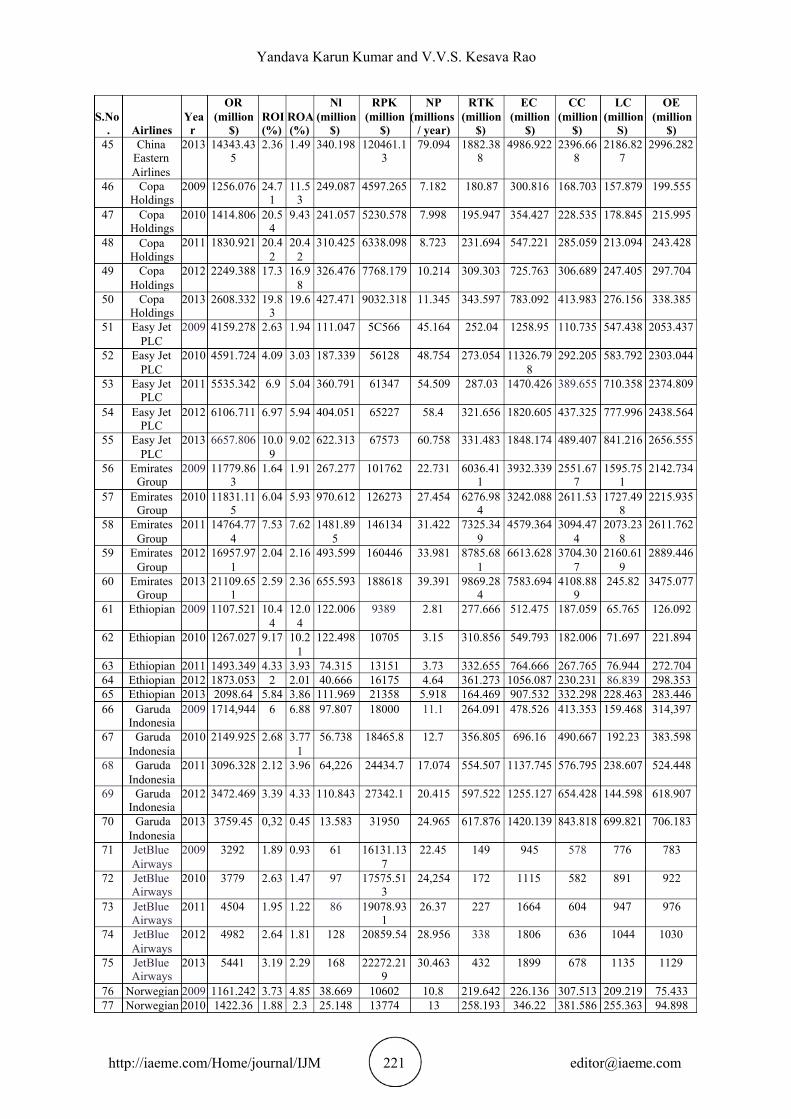
5.1. Data on 11 items of 20 Airlines Data on 11 criteria is collected from financial reports is presented in Table-2.
Table-2: Financial and traffic data of the airlines
S.No. Airlines
Year
OR (million
$) ROI (%)
ROA(%)
Nl (million
$)
RPK (million
$)
NP (millions
/ year)
RTK (million
$)
EC (million
$)
CC (million
$)
LC (million
S)
OE (million
$) 1 Aer Lingus 2009 866.035 3.55 4.99 32.039 5400 6.6 132.098 148.942 200.611 125.113 297.013 2 Aer Lingus 2010 1610.262 5.21 2.73 65.174 13895 9.346 216.628 352.632 202.916 342.945 137.079 3 Aer Lingus 2011 1655.283 7.56 3.6 9.148 14051 9.513 240.533 370.975 126.692 334.77 136.704 4 Aer Lingus 2012 1790.193 3.21 1.91 43.814 14523 9.653 239.415 460.699 184.908 342.754 139.212 5 Aer Lingus 2013 1892.45 3.12 1.96 45.283 14807 9.625 259.498 474.474 205.277 368.371 142.976 6 Aeroflot 2009 3345.9 3.21 2.15 85.8 29900 8.756 1118.5 725.4 53.1 538.9 233.5 7 Aeroflot 2010 4319.3 7.38 5.6 253.2 39200 11.286 1312.2 943 159.5 686.5 330.9 8 Aeroflot 2011 5377.9 10.4
2 9.21 491.3 46077.4 14.174 1708.4 1472.2 244.2 870.1 417.7
9 Aeroflot 2012 8138.1 2.38 2.66 166.3 74617.2 27.5 2682.3 2287.5 166.7 1241.8 614.1 10 Aeroflot 2013 9133.754 2.51 3.51 230.262 85300 31.4 2959.72
1 2484.003 276.691 1423.60
6 2018.237
11 Air Asia 2009 892.194 14.33
4.44 144.171 16890 14.253 254.892 264.211 517.405 87.141 111.837
12 Air Asia 2010 1225.919 38.89
8.02 329.586 18499 16.055 32.227 375.758 186.277 112.03 141.226
13 Air Asia 2011 1469.657 28.85
8.36 380.247 21037 17.987 28.346 575.395 404.158 158.303 151.778
14 Air Asia 2012 1601.912 25.21
6.13 332.625 22731 19.679 36.403 630.902 318.199 187.946 146.169
15 Air Asia 2013 1622.94 7.51 2.03 114.97 26607 21.853 44.011 702.346 421 193.955 169.007 16 Air China 2009 7523.592 9.73 4.45 703.132 75473.77 41.279 629.895 2117.727 1543.87
3 970.205 1962.544
17 Air China 2010 12184.345
17.12
7.77 1822.147
105695 60.006 924.58 3559.264 1678.155
1455.243
3033.595
18 Air China 2011 15220.64 7.72 4.02 1092.357
123489.07
69.687 1165.753
5367.444 2065.935
1897.766
3644.6
Development of Balanced Score Card Framework for Performance Evaluation of Airlines
http://iaeme.com/Home/journal/IJM 220 [email protected]
S.No. Airlines
Year
OR (million
$) ROI (%)
ROA(%)
Nl (million
$)
RPK (million
$)
NP (millions
/ year)
RTK (million
$)
EC (million
$)
CC (million
$)
LC (million
S)
OE (million
$) 19 Air China 2012 15979.43 5.14 2.63 780.925 129773.3
2 72.416 1109.14
9 5647.52 2833.97
8 2162.78
6 3445.072
20 Air China 2013 15958.409
3.82 1.76 587.58 141967.95
77.677 1114.483
5481.255 2659.265
2279.417
3836.409
21 Air Newzealan
d
2009 2995.85 0.33 0.42 13.65 27112 12.4 616.85 109.655 1383.2 662.35 361.4
22 Air Newzealan
d
2010 2797.809 1.66 1.78 56.703 25829 12.3 614.052 649.319 1144.433
674.904 341.601
23 Air Newzealan
d
2011 3576.984 1.53 1.65 66.744 26996 13.103 745.72 893.216 1452.712
852.016 418.592
24 Air Newzealan
d
2012 3530.363 1.53 1.3 55.913 27013 13.122 746.55 959.963 1370.25 826.875 397.688
25 Air Newzealan
d
2013 3602.184 3.07 3.25 141.966 27733 13.411 771.451 939.158 1641.186
833.853 433.697
26 Allegiant Air
2009 557.94 15.85
15.28
76.331 4762.41 5.328 52.938 165 77.486 90.006 96.179
27 Allegiant Air
2010 663.641 9.9 13.11
65.702 5466.237 5.903 60.579 243.671 141.342 108 110.049
28 Allegiant Air
2011 779.117 6.34 6.99 49.398 5640.577 6.176 81.228 330.657 128.52 119.856 118.856
29 Allegiant Air
2012 908.719 9.44 9.82 78.414 6514.056 6.987 73.897 378.195 111.393 133.295 133.525
30 Allegiant Air
2013 996.15 10.15
9.87 91.779 7129.416 7.241 72.818 385.558 141.449 158.627 145.919
31 Cathay Pacific
2009 8587 5.78 6.03 623 89440 24.558 3834 2224 1309 1618 1791
32 Cathay Pacific
2010 11477 13.62
15.55
1825 96588 26.796 4363 3625 1516 1776 2124
33 Cathay Pacific
2011 12616 4.87 5.66 727 101536 27.581 4380 4984 1404 1894 2255
34 Cathay Pacific
2012 12741 0.93 0.95 145 103837 28.961 4542 5188 1488 2061 2375
35 Cathay Pacific
2013 12882 2.33 2.51 372 104571 29.92 4871 4889 1687 2183 2361
36 Cebu Pacific Air
2009 489.885 14.32
9.22 68.464 7056 8.756 68.651 154.677 95.085 27.096 132.561
37 Cebu Pacific Air
2010 645.176 28.12
13.86
153.538 8860 10.461 76.151 217.533 68.139 43.513 140.904
38 Cebu Pacific Air
2011 784.013 10.88
7.26 83.735 10531 11.933 91.474 351.646 93.791 56.845 175.631
39 Cebu Pacific Air
2012 898.146 49.56
6.41 84.639 11533 13.255 104.236 416.128 100.484 72.084 204.818
40 Cebu Pacific Air
2013 966.117 1.16 0.76 12.062 12927 14.352 114.46 459.984 190.554 64.305 209.639
41 China Eastern Airlines
2009 5707.805 0.44 0.27 28.789 60942.09 44.043 1359.704
1794.041 1574.05 753.758 1131.339
42 China Eastern Airlines
2010 10901.637
7.43 5.11 780.554 93152.76 64.93 2344.649
3191.394 1986.535
1320.655
1657.045
43 China Eastern Airlines
2011 12744.992
5.78 3.99 707.826 100895.06
68.725 2363.614
4520.745 2065.632
1340.161
1957.676
44 China Eastern Airlines
2012 13509.825
3.32 2.27 444.912 109112.68
73.077 2447.805
4733.644 2499.701
1594.025
2121.418
Yandava Karun Kumar and V.V.S. Kesava Rao
http://iaeme.com/Home/journal/IJM 221 [email protected]
S.No. Airlines
Year
OR (million
$) ROI (%)
ROA(%)
Nl (million
$)
RPK (million
$)
NP (millions
/ year)
RTK (million
$)
EC (million
$)
CC (million
$)
LC (million
S)
OE (million
$) 45 China
Eastern Airlines
2013 14343.435
2.36 1.49 340.198 120461.13
79.094 1882.388
4986.922 2396.668
2186.827
2996.282
46 Сора Holdings
2009 1256.076 24.71
11.53
249.087 4597.265 7.182 180.87 300.816 168.703 157.879 199.555
47 Сора Holdings
2010 1414.806 20.54
9.43 241.057 5230.578 7.998 195.947 354.427 228.535 178.845 215.995
48 Сора Holdings
2011 1830.921 20.42
20.42
310.425 6338.098 8.723 231.694 547.221 285.059 213.094 243.428
49 Сора Holdings
2012 2249.388 17.3 16.98
326.476 7768.179 10.214 309.303 725.763 306.689 247.405 297.704
50 Сора Holdings
2013 2608.332 19.83
19.6 427.471 9032.318 11.345 343.597 783.092 413.983 276.156 338.385
51 Easy Jet PLC
2009 4159.278 2.63 1.94 111.047 5C566 45.164 252.04 1258.95 110.735 547.438 2053.437
52 Easy Jet PLC
2010 4591.724 4.09 3.03 187.339 56128 48.754 273.054 11326.798
292.205 583.792 2303.044
53 Easy Jet PLC
2011 5535.342 6 .9 5.04 360.791 61347 54.509 287.03 1470.426 389.655 710.358 2374.809
54 Easy Jet PLC
2012 6106.711 6.97 5.94 404.051 65227 58.4 321.656 1820.605 437.325 777.996 2438.564
55 Easy Jet PLC
2013 6657.806 10.09
9.02 622.313 67573 60.758 331.483 1848.174 489.407 841.216 2656.555
56 Emirates Group
2009 11779.863
1.64 1.91 267.277 101762 22.731 6036.411
3932.339 2551.677
1595.751
2142.734
57 Emirates Group
2010 11831.115
6.04 5.93 970.612 126273 27.454 6276.984
3242.088 2611.53 1727.498
2215.935
58 Emirates Group
2011 14764.774
7.53 7.62 1481.895
146134 31.422 7325.349
4579.364 3094.474
2073.238
2611.762
59 Emirates Group
2012 16957.971
2.04 2.16 493.599 160446 33.981 8785.681
6613.628 3704.307
2160.619
2889.446
60 Emirates Group
2013 21109.651
2.59 2.36 655.593 188618 39.391 9869.284
7583.694 4108.889
245.82 3475.077
61 Ethiopian 2009 1107.521 10.44
12.04
122.006 9389 2.81 277.666 512.475 187.059 65.765 126.092
62 Ethiopian 2010 1267.027 9.17 10.21
122.498 10705 3.15 310.856 549.793 182.006 71.697 221.894
63 Ethiopian 2011 1493.349 4.33 3.93 74.315 13151 3.73 332.655 764.666 267.765 76.944 272.704 64 Ethiopian 2012 1873.053 2 2.01 40.666 16175 4.64 361.273 1056.087 230.231 86.839 298.353 65 Ethiopian 2013 2098.64 5.84 3.86 111.969 21358 5.918 164.469 907.532 332.298 228.463 283.446 66 Garuda
Indonesia 2009 1714,944 6 6.88 97.807 18000 11.1 264.091 478.526 413.353 159.468 314,397
67 Garuda Indonesia
2010 2149.925 2.68 3.771
56.738 18465.8 12.7 356.805 696.16 490.667 192.23 383.598
68 Garuda Indonesia
2011 3096.328 2.12 3.96 64,226 24434.7 17.074 554.507 1137.745 576.795 238.607 524.448
69 Garuda Indonesia
2012 3472.469 3.39 4.33 110.843 27342.1 20.415 597.522 1255.127 654.428 144.598 618.907
70 Garuda Indonesia
2013 3759.45 0,32 0.45 13.583 31950 24.965 617.876 1420.139 843.818 699.821 706.183
71 JetBlue Airways
2009 3292 1.89 0.93 61 16131.137
22.45 149 945 578 776 783
72 JetBlue Airways
2010 3779 2.63 1.47 97 17575.513
24,254 172 1115 582 891 922
73 JetBlue Airways
2011 4504 1.95 1.22 86 19078.931
26.37 227 1664 604 947 976
74 JetBlue Airways
2012 4982 2.64 1.81 128 20859.54 28.956 338 1806 636 1044 1030
75 JetBlue Airways
2013 5441 3.19 2.29 168 22272.219
30.463 432 1899 678 1135 1129
76 Norwegian 2009 1161.242 3.73 4.85 38.669 10602 10.8 219.642 226.136 307.513 209.219 75.433 77 Norwegian 2010 1422.36 1.88 2.3 25.148 13774 13 258.193 346.22 381.586 255.363 94.898
Development of Balanced Score Card Framework for Performance Evaluation of Airlines
http://iaeme.com/Home/journal/IJM 222 [email protected]
S.No. Airlines
Year
OR (million
$) ROI (%)
ROA(%)
Nl (million
$)
RPK (million
$)
NP (millions
/ year)
RTK (million
$)
EC (million
$)
CC (million
$)
LC (million
S)
OE (million
$) 78 Norwegian 2011 1878.824 1.19 1.36 21.786 17421 15.7 302.158 551.858 534,875 330.042 114,276 79 Norwegian 2012 2209.266 3.94 3.83 78.455 20353 17.7 321.262 642.645 537.416 357.708 130.21 80 Norwegian 2013 2649.832 2.11 2.06 54.255 26881 20.7 385.61 800.597 797.935 424.002 158.024 81 Singapore
Airlines 2009 8973.514 8.8 4,63 788.599 16604.88 18.293 915.815 4406.749 1904.65
8 127.009 1607.111
82 Singapore Airlines
2010 7441.988 2.61 1.24 205.031 82882.5 16.48 981.433 3076.926 1908.289
112.528 1779.475
83 Singapore Airlines
2011 9338.751 9.69 4.68 913.899 84801.3 16.647 1048.741
3639.767 2518.633
106.362 2118.723
84 Singapore Airlin es
2012 9647.382 3.15 1.8 317.154 87824 17.155 1131.86 4638.538 1976.138
112.539 2213.444
85 Singapore Airlines
2013 12067.68 3.46 1.97 352.962 93765.6 18.21 1255.348
4715.269 1976.138
118.453 2141.269
86 Southwest Airlines Co
2009 10350 0.97 0.69 99 46275.146
86.31 719 3044 965 3468 2055
87 Southwest Airlines Co
2010 12104 3.94 2.97 459 48506.505
88.191 751 3620 1345 3704 2225
88 Southwest Airlines Co
2011 15658 1.15 0.99 178 60647.937
103.974 955 5644 1672 4371 2838
89 Southwest Airlines Co
2012 17088 2.53 2.26 421 63937.215
109.347 1132 6120 1584 4749 3082
90 Southwest Airlines Co
2013 17699 4.45 3.9 754 64852.838
108.076 1080 5763 1838 5035 3229
91 Turkish Airlines
2009 4557.787 6.39 0.07 362.165 40130 25.1 2215.188
987.259 865.272 913.47 691.376
92 Turkish Airlines
2010 5588.998 2.77 2.69 190.072 47950 29.119 2489.34 1434.938 916.438 1170.566
860.47
93 Turkish Airlines
2011 7031.518 0.13 0.12 11.022 58933 32.649 2895.822
2381.139 1154.099
1331.431
1082.116
94 Turkish Airlines
2012 8198.595 6.64 6.15 641.865 74410 39.045 2657.441
2867.251 1017.549
1371.7 17467.909
95 Turkish Airlines
2013 9855.085 2.65 2.69 358.322 91997 48.268 4074.998
3451.314 1605.453
1614,897
2799.297
96 WestJet 2009 1998.47 2.99 2.81 86.013 22260.131
14.039 182.513 499.871 313.321 409.918 1474.315
97 WestJet 2010 2531.953 2.44 2.53 87.525 25121.513
15.174 217.986 654.62 374.526 514.572 1823.575
98 WestJet 2011 3104.689 3.51 4,28 150,307 27177.524
16.041 288.822 925.762 453.008 582.469 2036.999
99 WestJet 2012 3427.419 5.24 6.47 242.393 29384.451
17.423 310.818 992.79 492.142 663.758 2163.678
100 WestJet 2013 3555.241 5.45 6.49 260.874 31522.197
18.691 335.996 1009.091 492.459 700.278 2250.874
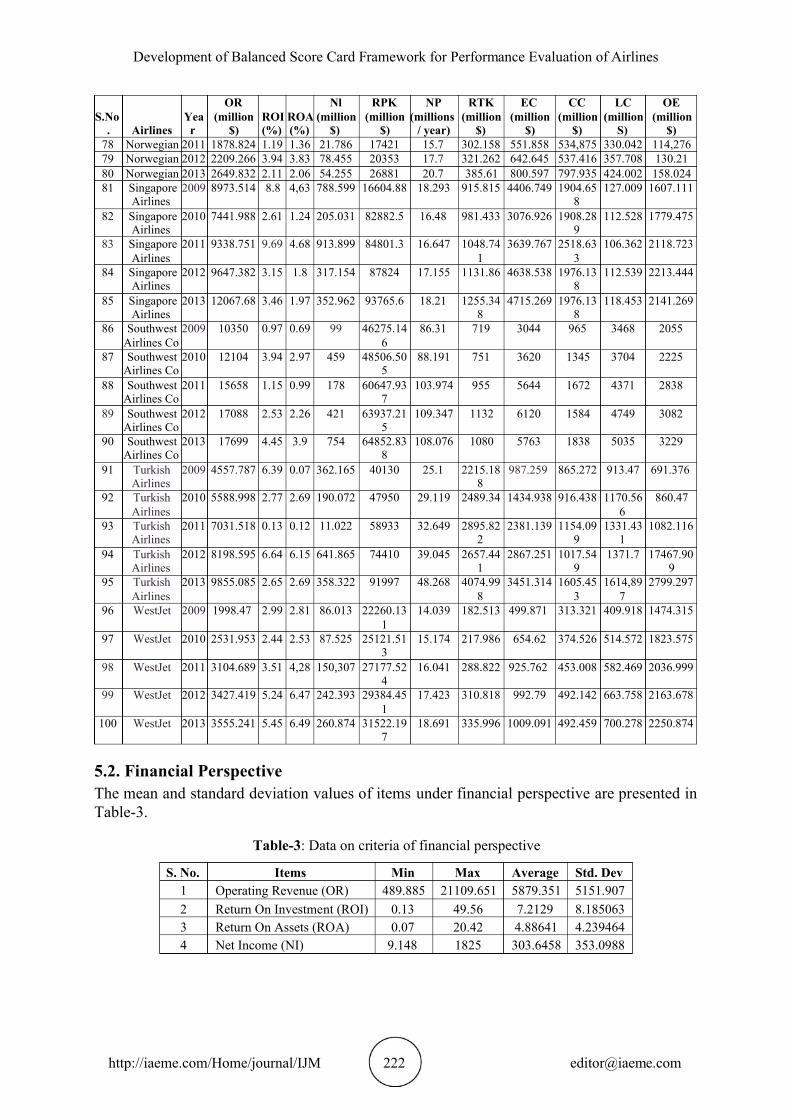
5.2. Financial Perspective The mean and standard deviation values of items under financial perspective are presented in Table-3.
Table-3: Data on criteria of financial perspective
S. No. Items Min Max Average Std. Dev 1 Operating Revenue (OR) 489.885 21109.651 5879.351 5151.907 2 Return On Investment (ROI) 0.13 49.56 7.2129 8.185063 3 Return On Assets (ROA) 0.07 20.42 4.88641 4.239464 4 Net Income (NI) 9.148 1825 303.6458 353.0988
Yandava Karun Kumar and V.V.S. Kesava Rao
http://iaeme.com/Home/journal/IJM 223 [email protected]
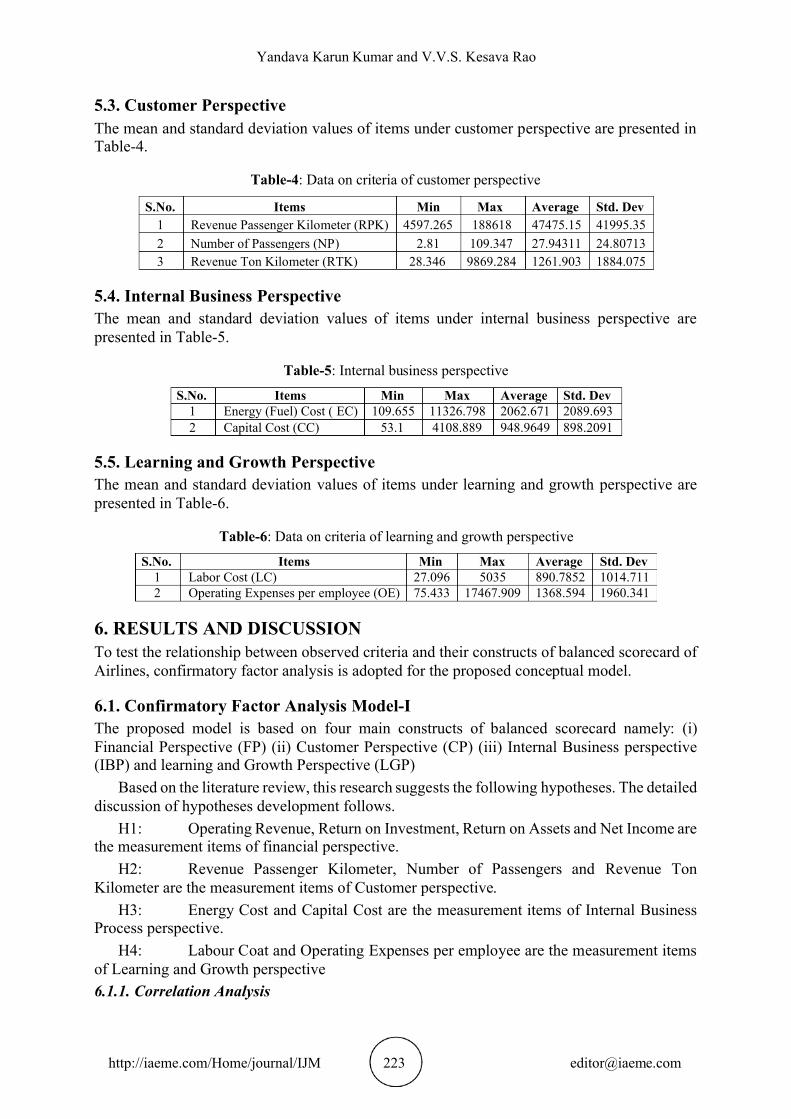
5.3. Customer Perspective The mean and standard deviation values of items under customer perspective are presented in Table-4.
Table-4: Data on criteria of customer perspective
S.No. Items Min Max Average Std. Dev 1 Revenue Passenger Kilometer (RPK) 4597.265 188618 47475.15 41995.35 2 Number of Passengers (NP) 2.81 109.347 27.94311 24.80713 3 Revenue Ton Kilometer (RTK) 28.346 9869.284 1261.903 1884.075
5.4. Internal Business Perspective The mean and standard deviation values of items under internal business perspective are
presented in Table-5.
Table-5: Internal business perspective
S.No. Items Min Max Average Std. Dev 1 Energy (Fuel) Cost ( EC) 109.655 11326.798 2062.671 2089.693 2 Capital Cost (CC) 53.1 4108.889 948.9649 898.2091
5.5. Learning and Growth Perspective The mean and standard deviation values of items under learning and growth perspective are presented in Table-6.
Table-6: Data on criteria of learning and growth perspective
S.No. Items Min Max Average Std. Dev 1 Labor Cost (LC) 27.096 5035 890.7852 1014.711 2 Operating Expenses per employee (OE) 75.433 17467.909 1368.594 1960.341
6. RESULTS AND DISCUSSI ONTo test the relationship between observed criteria and their constructs of balanced scorecard of Airlines, confirmatory factor analysis is adopted for the proposed conceptual model.
6.1. Confirmatory Factor Analysis Model-I The proposed model is based on four main constructs of balanced scorecard namely: (i)
Financial Perspective ( ) (ii) Customer Perspective ( ) (iii) Internal Business perspective FP CP(IBP) and learning and Growth Perspective (LGP )
Based on the literature review, this research suggests the following hypotheses. The detailed discussion of hypotheses development follows.
H1: Operating Revenue, Return on Investment, Return on Assets and Net Income are the measurement items of financial perspective.
H2: Revenue Passenger Kilometer, Number of Passengers and Revenue Ton Kilometer are the measurement items of Customer perspective.
H3: Energy Cost and Capital Cost are the measurement items of Internal Business Process perspective.
H4: Labour Coat and Operating Expenses per employee are the measurement items of Learning and Growth perspective 6.1.1. Correlation Analysis
Development of Balanced Score Card Framework for Performance Evaluation of Airlines
http://iaeme.com/Home/journal/IJM 224 [email protected]
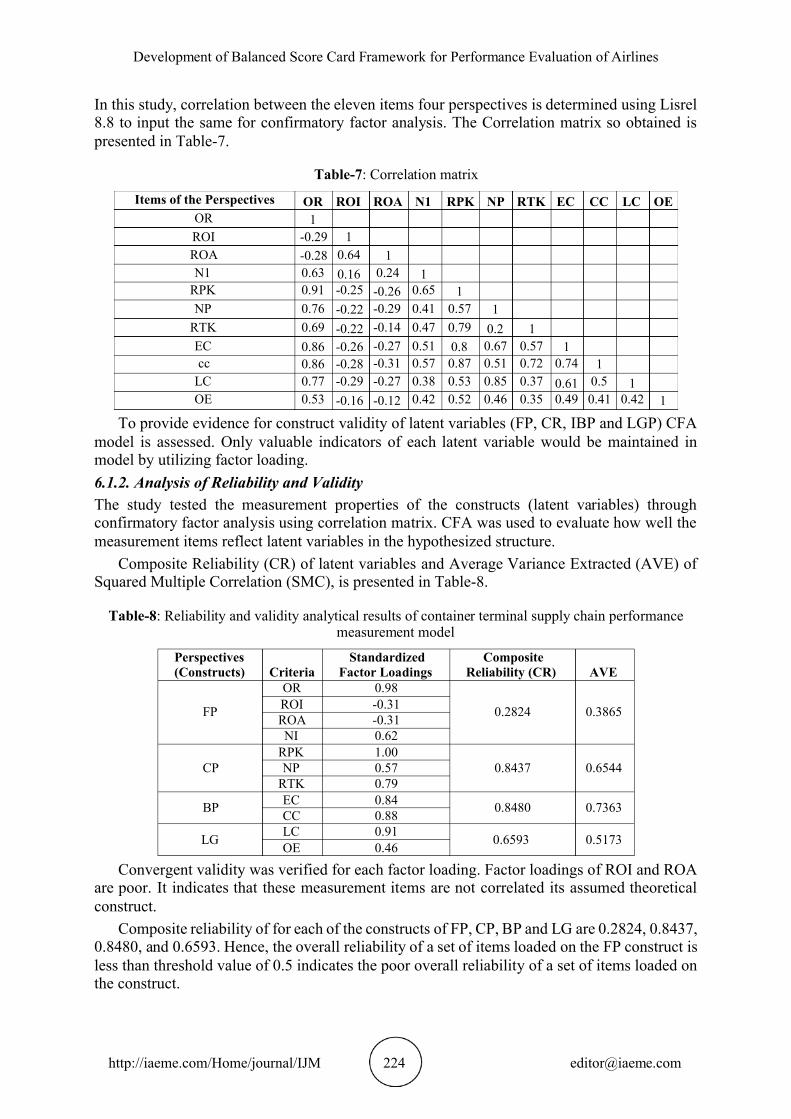
In this study, correlation between the eleven items four perspectives is determined using Lisrel 8.8 to input the same for confirmatory factor analysis. The Correlation matrix so obtained is presented in Table-7.
Table-7: Correlation matrix
Items of the Perspectives OR ROI ROA N1 RPK NP RTK EC CC LC OE OR 1 ROI -0.29 1 ROA -0.28 0.64 1 N1 0.63 0.16 0.24 1
RPK 0.91 -0.25 -0.26 0.65 1 NP 0.76 -0.22 -0.29 0.41 0.57 1
RTK 0.69 -0.22 -0.14 0.47 0.79 0.2 1 EC 0.86 -0.26 -0.27 0.51 0.8 0.67 0.57 1 cc 0.86 -0.28 -0.31 0.57 0.87 0.51 0.72 0.74 1
LC 0.77 -0.29 -0.27 0.38 0.53 0.85 0.37 0.61 0.5 1 OE 0.53 -0.16 -0.12 0.42 0.52 0.46 0.35 0.49 0.41 0.42 1
To provide evidence for construct validity of latent variables (FP, CR, IBP and LGP) CFA model is assessed. Only valuable indicators of each latent variable would be maintained in model by utilizing factor loading. 6.1.2. Analysis of Reliability and Validity
The study tested the measurement properties of the constructs (latent variables) through confirmatory factor analysis using correlation matrix. CFA was used to evaluate how well the measurement items reflect latent variables in the hypothesized structure.
Composite Reliability (CR) of latent variables and Average Variance Extracted (AVE) of Squared Multiple Correlation (SMC), is presented in Table-8.
Table-8: Reliability and validity analytical results of container terminal supply chain performance measurement model
Perspectives (Constructs) Criteria
Standardized Factor Loadings
Composite Reliability (CR) AVE
FP
OR 0.98
0.2824 0.3865 ROI -0.31 ROA -0.31 NI 0.62
CP RPK 1.00
0.8437 0.6544 NP 0.57 RTK 0.79
BP EC 0.84 0.8480 0.7363 CC 0.88
LG LC 0.91 0.6593 0.5173 OE 0.46
Convergent validity was verified for each factor loading. Factor loadings of ROI and ROA are poor. It indicates that these measurement items are not correlated its assumed theoretical construct.
Composite reliability of for each of the constructs of FP, CP, BP and LG are 0.2824, 0.8437, 0.8480, and 0.6593. Hence, the overall reliability of a set of items loaded on the FP construct is less than threshold value of 0.5 indicates the poor overall reliability of a set of items loaded on the construct.
Yandava Karun Kumar and V.V.S. Kesava Rao
http://iaeme.com/Home/journal/IJM 225 [email protected]
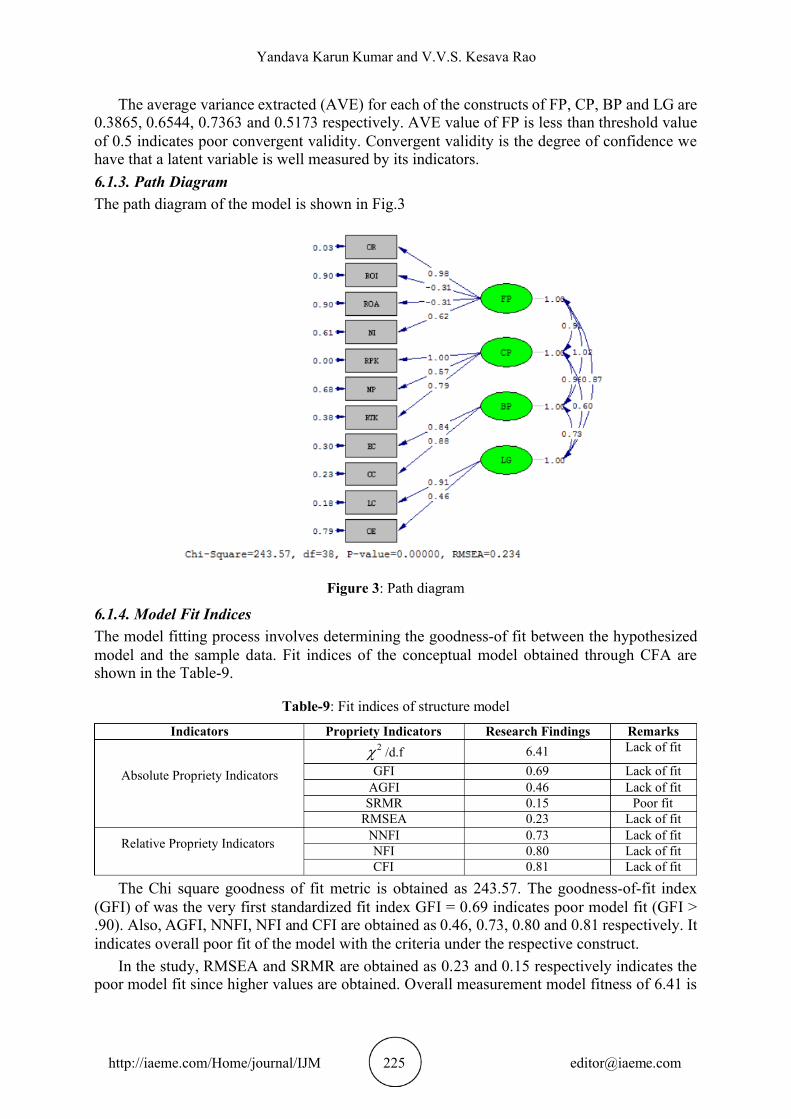
The average variance extracted (AVE) for each of the constructs of , CP, BP and are FP LG0.3865, 0.6544, 0.7363 and 0.5173 respectively. AVE value of FP is less than threshold value of 0.5 indicates poor convergent validity. Convergent validity is the degree of confidence we have that a latent variable is well measured by its indicators. 6.1.3. Path Diagram The path diagram of the model is shown in Fig.3
Figure 3: Path diagram
6.1.4. Model F Indices it The model fitting process involves determining the goodness-of fit between the hypothesized model and the sample data. Fit indices of the conceptual model obtained through CFA are shown in the Table-9.
Table-9: Fit indices of structure model
Indicators Propriety Indicators Research Findings Remarks
Absolute Propriety Indicators
2 /d.f 6.41 Lack of fit
GFI 0.69 Lack of fit AGFI 0.46 Lack of fit SRMR 0.15 Poor fit
RMSEA 0.23 Lack of fit
Relative Propriety Indicators
NNFI 0.73 Lack of fit NFI 0.80 Lack of fit CFI 0.81 Lack of fit
The Chi square goodness of fit metric is obtained as 243.57. The goodness-of-fit index (GFI) of was the very first standardized fit index GFI = 0.69 indicates poor model fit (GFI > .90). Also, AGFI, NNFI, NFI and CFI are obtained as 0.46, 0.73, 0.80 and 0.81 respectively. It indicates overall poor fit of the model with the criteria under the respective construct.
In the study, RMSEA and SRMR are obtained as 0.23 and 0.15 respectively indicates the poor model fit since higher values are obtained. Overall measurement model fitness of 6.41 is
Development of Balanced Score Card Framework for Performance Evaluation of Airlines
http://iaeme.com/Home/journal/IJM 226 [email protected]
obtained. It indicates that the overall measurement model fitness is poor since 2 /d.f value ismore than 3.0.
Hence, the confirmatory factor analyses with 4 constructs having 11 items is not valid measurement model of balanced scorecard of Airlines and proceed for further analysis by
removing ROI and ROA factors of financial perspective.
6.2. Confirmatory Factor Analysis Model- II The proposed model is based on four main constructs of balanced scorecard namely: (i)
Financial Perspective ( ) (ii) Customer Perspective ( ) (iii) Internal Business perspective FP CP(IBP) and learning and Growth Perspective (LGP )
Based on the literature review, this research suggests the following hypotheses. The detailed discussion of hypotheses development follows.
H1: Operating Revenue and Net Income are the measurement items of financial perspective.
H2: Revenue Passenger Kilometer, Number of Passengers and Revenue Ton Kilometer are the measurement items of Customer perspective.
H3: Energy Cost and Capital Cost are the measurement items of Internal Business Process perspective.
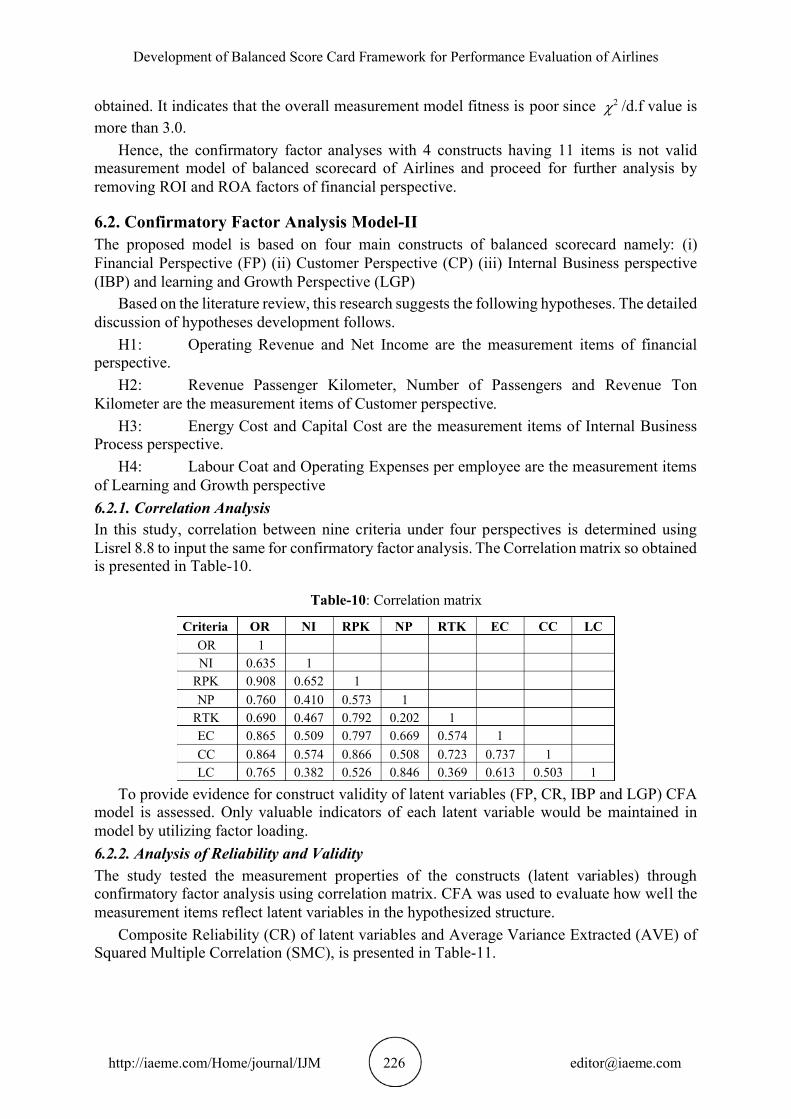
H4: Labour Coat and Operating Expenses per employee are the measurement items of Learning and Growth perspective 6.2.1. Correlation Analysis In this study, correlation between nine criteria under four perspectives is determined using Lisrel 8.8 to input the same for confirmatory factor analysis. The Correlation matrix so obtained is presented in Table-10.
Table-10: Correlation matrix
Criteria OR NI RPK NP RTK EC CC LC OR 1 NI 0.635 1
RPK 0.908 0.652 1 NP 0.760 0.410 0.573 1
RTK 0.690 0.467 0.792 0.202 1 EC 0.865 0.509 0.797 0.669 0.574 1 CC 0.864 0.574 0.866 0.508 0.723 0.737 1 LC 0.765 0.382 0.526 0.846 0.369 0.613 0.503 1
To provide evidence for construct validity of latent variables (FP, CR, IBP and LGP) CFA model is assessed. Only valuable indicators of each latent variable would be maintained inmodel by utilizing factor loading. 6.2.2. Analysis of Reliability and Validity
The study tested the measurement properties of the constructs (latent variables) through confirmatory factor analysis using correlation matrix. CFA was used to evaluate how well the measurement items reflect latent variables in the hypothesized structure.
Composite Reliability (CR) of latent variables and Average Variance Extracted (AVE) of Squared Multiple Correlation (SMC), is presented in Table-11.
Yandava Karun Kumar and V.V.S. Kesava Rao
http://iaeme.com/Home/journal/IJM 227 [email protected]
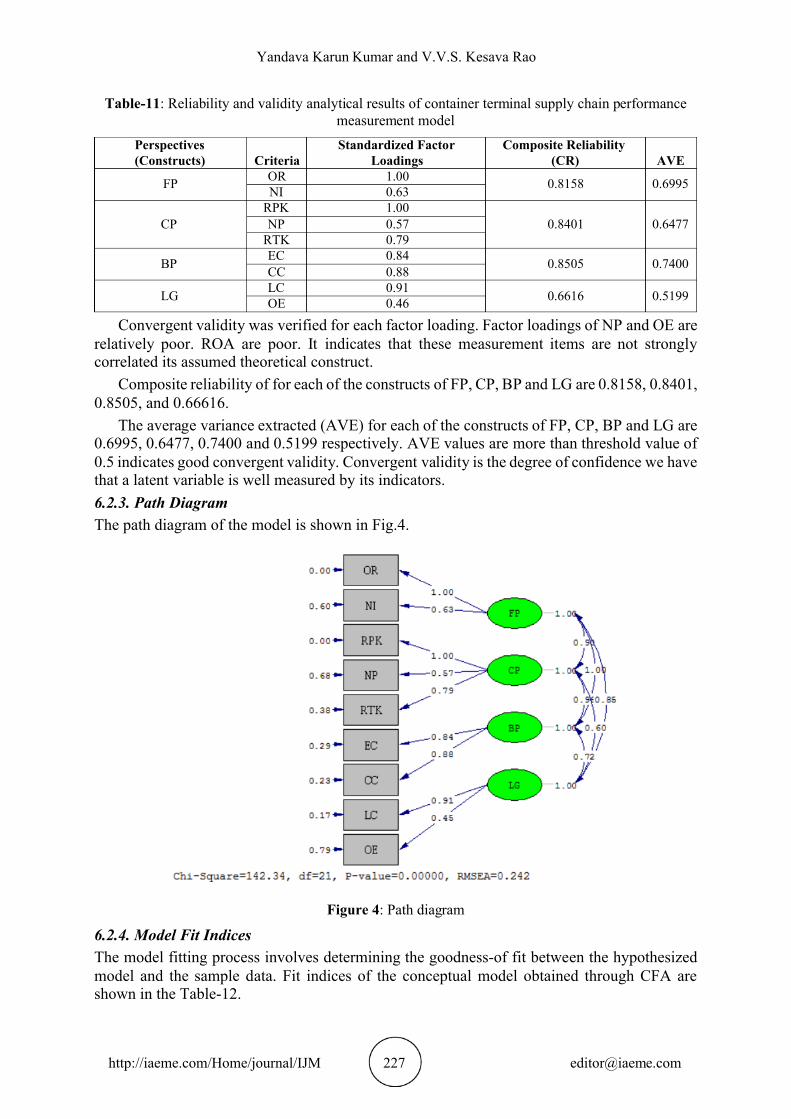
Table-11: Reliability and validity analytical results of container terminal supply chain performance measurement model
Perspectives (Constructs) Criteria
Standardized Factor Loadings
Composite Reliability (CR) AVE
FP OR 1.00 0.8158 0.6995 NI 0.63
CP RPK 1.00
0.8401 0.6477 NP 0.57 RTK 0.79
BP EC 0.84 0.8505 0.7400 CC 0.88
LG LC 0.91 0.6616 0.5199 OE 0.46
Convergent validity was verified for each factor loading. Factor loadings of NP and OE are relatively poor. ROA are poor. It indicates that these measurement items are not strongly
correlated its assumed theoretical construct. Composite reliability of for each of the constructs of FP, CP, BP and LG are 0.8158, 0.8401,
0.8505, and 0.66616. The average variance extracted (AVE) for each of the constructs of FP, CP, BP and are LG
0.6995, 0.6477, 0.7400 and 0.5199 respectively. AVE values are more than threshold value of 0.5 indicates good convergent validity. Convergent validity is the degree of confidence we have that a latent variable is well measured by its indicators. 6.2.3. Path Diagram The path diagram of the model is shown in Fig.4.
Figure 4: Path diagram
6.2.4. Model F Indices it The model fitting process involves determining the goodness-of fit between the hypothesized model and the sample data. Fit indices of the conceptual model obtained through CFA are shown in the Table-12.
Development of Balanced Score Card Framework for Performance Evaluation of Airlines
http://iaeme.com/Home/journal/IJM 228 [email protected]
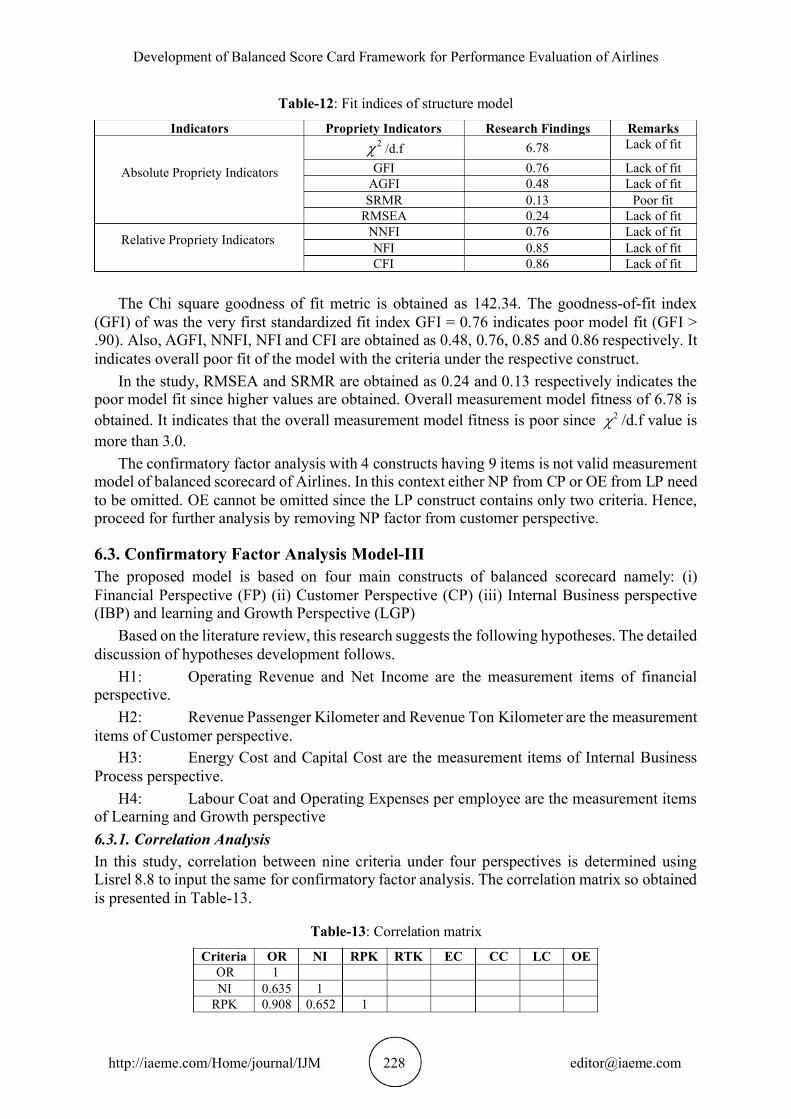
Table-12: Fit indices of structure model
Indicators Propriety Indicators Research Findings Remarks
Absolute Propriety Indicators
2 /d.f 6.78 Lack of fit
GFI 0.76 Lack of fit AGFI 0.48 Lack of fit SRMR 0.13 Poor fit
RMSEA 0.24 Lack of fit
Relative Propriety Indicators
NNFI 0.76 Lack of fit NFI 0.85 Lack of fit CFI 0.86 Lack of fit
The Chi square goodness of fit metric is obtained as 142.34. The goodness-of-fit index
(GFI) of was the very first standardized fit index GFI = 0.76 indicates poor model fit (GFI > .90). Also, AGFI, NNFI, NFI and CFI are obtained as 0.48, 0.76, 0.85 and 0.86 respectively. It indicates overall poor fit of the model with the criteria under the respective construct.
In the study, RMSEA and SRMR are obtained as 0.24 and 0.13 respectively indicates the poor model fit since higher values are obtained. Overall measurement model fitness of 6.78 is obtained. It indicates that the overall measurement model fitness is poor since 2 /d.f value ismore than 3.0.
The confirmatory factor analysis with 4 constructs having 9 items is not valid measurement model of balanced scorecard of Airlines. In this context either NP from CP or OE from LP need to be omitted. OE cannot be omitted since the LP construct contains only two criteria. Hence, proceed for further analysis by removing NP factor from customer perspective.
6.3. Confirmatory Factor Analysis Model-III The proposed model is based on four main constructs of balanced scorecard namely: (i)
Financial Perspective ( ) (ii) Customer Perspective ( ) (iii) Internal Business perspective FP CP(IBP) and learning and Growth Perspective (LGP )
Based on the literature review, this research suggests the following hypotheses. The detailed discussion of hypotheses development follows.
H1: Operating Revenue and Net Income are the measurement items of financial perspective.
H2: Revenue Passenger Kilometer and Revenue Ton Kilometer are the measurement items of Customer perspective.
H3: Energy Cost and Capital Cost are the measurement items of Internal Business Process perspective.
H4: Labour Coat and Operating Expenses per employee are the measurement items of Learning and Growth perspective 6.3.1. Correlation Analysis In this study, correlation between nine criteria under four perspectives is determined using Lisrel 8.8 to input the same for confirmatory factor analysis. The correlation matrix so obtained is presented in Table-13.
Table-13: Correlation matrix
Criteria OR NI RPK RTK EC CC LC OE OR 1 NI 0.635 1
RPK 0.908 0.652 1
Yandava Karun Kumar and V.V.S. Kesava Rao
http://iaeme.com/Home/journal/IJM 229 [email protected]
RTK 0.690 0.467 0.792 1 EC 0.865 0.509 0.797 0.574 1 CC 0.864 0.574 0.866 0.723 0.737 1 LC 0.765 0.382 0.526 0.369 0.613 0.503 1 OE 0.532 0.419 0.523 0.348 0.489 0.413 0.415 1
To provide evidence for construct validity of latent variables (FP, CR, IBP and LGP) CFA
model is assessed. Only valuable indicators of each latent variable would be maintained in model by utilizing factor loading. 6.3.2. Analysis of Reliability and Validity
The study tested the measurement properties of the constructs (latent variables) through confirmatory factor analysis using correlation matrix. CFA was used to evaluate how well the measurement items reflect latent variables in the hypothesized structure.
Composite Reliability (CR) of latent variables and Average Variance Extracted (AVE) of Squared Multiple Correlation (SMC), is presented in Table-14.
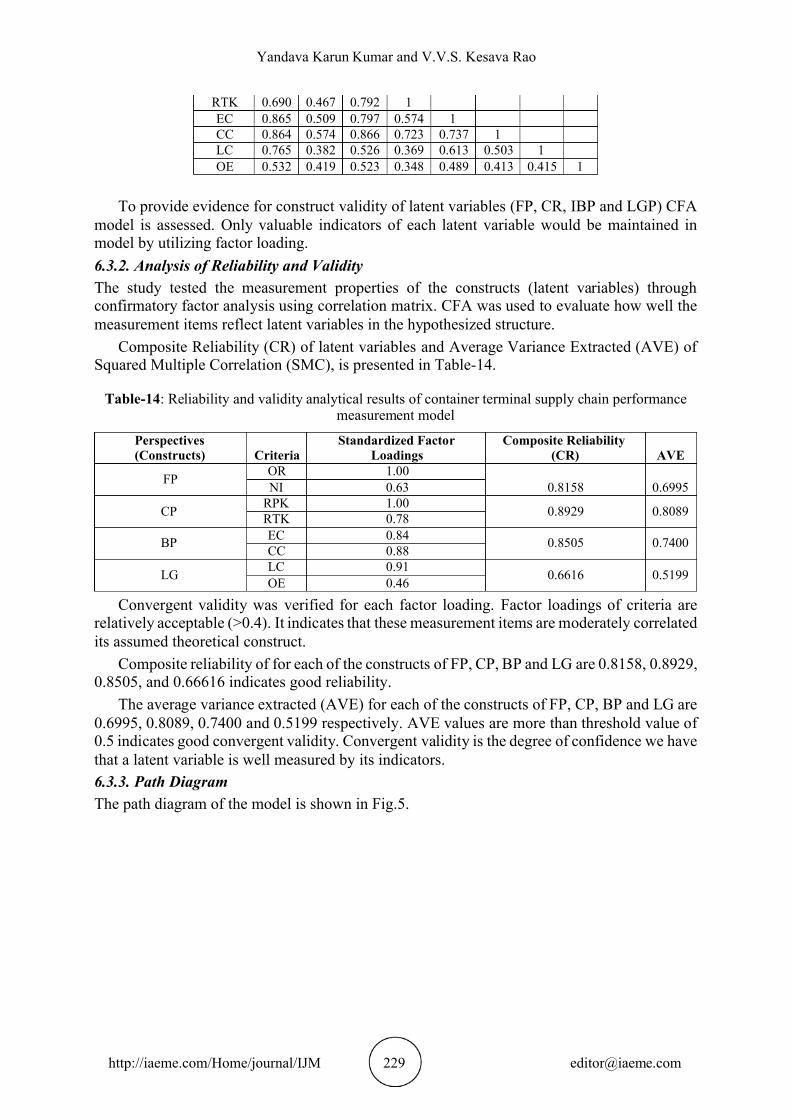
Table-14: Reliability and validity analytical results of container terminal supply chain performance measurement model
Perspectives (Constructs) Criteria
Standardized Factor Loadings
Composite Reliability (CR) AVE
FP OR 1.00 0.8158 0.6995 NI 0.63
CP RPK 1.00 0.8929 0.8089 RTK 0.78
BP EC 0.84 0.8505 0.7400 CC 0.88
LG LC 0.91 0.6616 0.5199 OE 0.46
Convergent validity was verified for each factor loading. Factor loadings of criteria are relatively acceptable (>0.4). It indicates that these measurement items are moderately correlated its assumed theoretical construct.
Composite reliability of for each of the constructs of FP, CP, BP and LG are 0.8158, 0.8929, 0.8505, and 0.66616 indicates good reliability.
The average variance extracted (AVE) for each of the constructs of FP, CP, BP and are LG0.6995, 0.8089, 0.7400 and 0.5199 respectively. AVE values are more than threshold value of 0.5 indicates good convergent validity. Convergent validity is the degree of confidence we have that a latent variable is well measured by its indicators. 6.3.3. Path Diagram The path diagram of the model is shown in Fig.5.
Development of Balanced Score Card Framework for Performance Evaluation of Airlines
http://iaeme.com/Home/journal/IJM 230 [email protected]
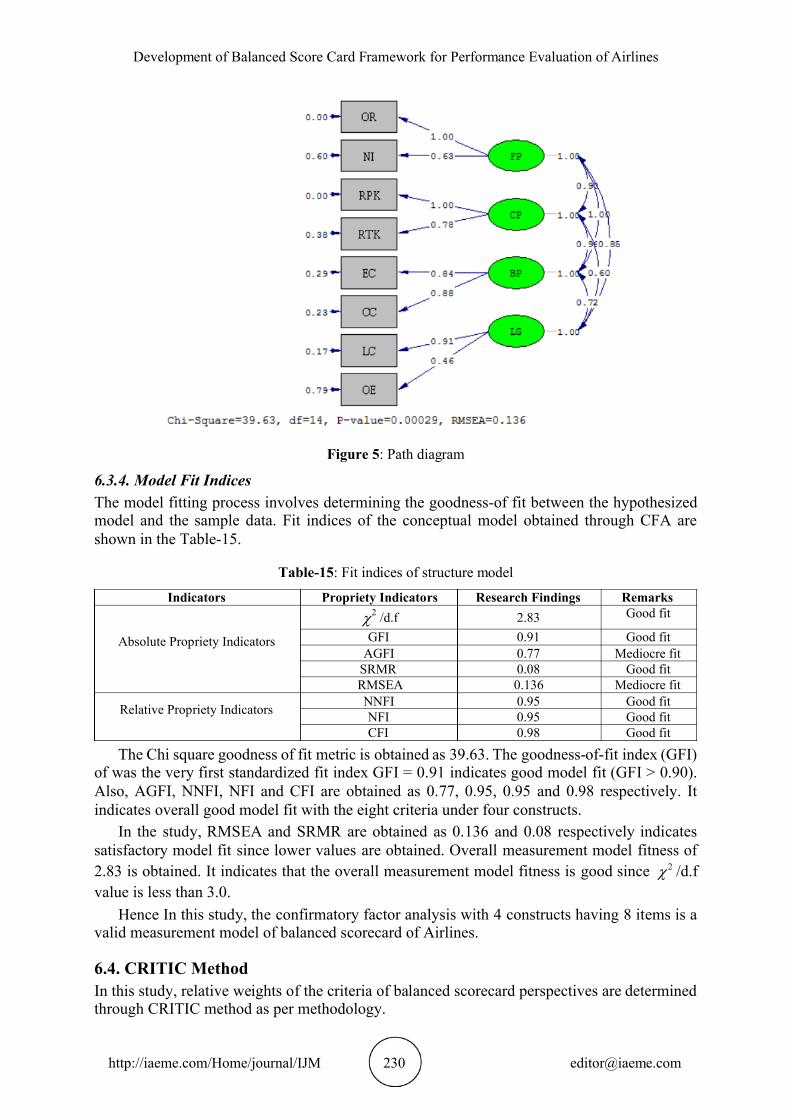
Figure 5: Path diagram
6.3.4. Model Fit Indices The model fitting process involves determining the goodness-of fit between the hypothesized model and the sample data. Fit indices of the conceptual model obtained through CFA are shown in the Table-15.
Table-15: Fit indices of structure model
Indicators Propriety Indicators Research Findings Remarks
Absolute Propriety Indicators
2 /d.f 2.83 Good fit
GFI 0.91 Good fit AGFI 0.77 Mediocre fit
SRMR 0.08 Good fit RMSEA 0.136 Mediocre fit
Relative Propriety Indicators
NNFI 0.95 Good fit NFI 0.95 Good fit CFI 0.98 Good fit
The Chi square goodness of fit metric is obtained as 39.63. The goodness-of-fit index (GFI) of was the very first standardized fit index GFI = 0.91 indicates good model fit (GFI > 0.90). Also, AGFI, NNFI, NFI and CFI are obtained as 0.77, 0.95, 0.95 and 0.98 respectively. It indicates overall good model fit with the eight criteria under four constructs.
In the study, RMSEA and SRMR are obtained as 0.136 and 0.08 respectively indicates satisfactory model fit since lower values are obtained. Overall measurement model fitness of 2.83 is obtained. It indicates that the overall measurement model fitness is good since 2 /d.f value less than 3.0. is
Hence In this study, the confirmatory factor analysis with 4 constructs having 8 items is a valid measurement model of balanced scorecard of Airlines.
6.4. CRITIC Method In this study, relative weights of the criteria of balanced scorecard perspectives are determined through CRITIC method as per methodology.
Yandava Karun Kumar and V.V.S. Kesava Rao
http://iaeme.com/Home/journal/IJM 231 [email protected]
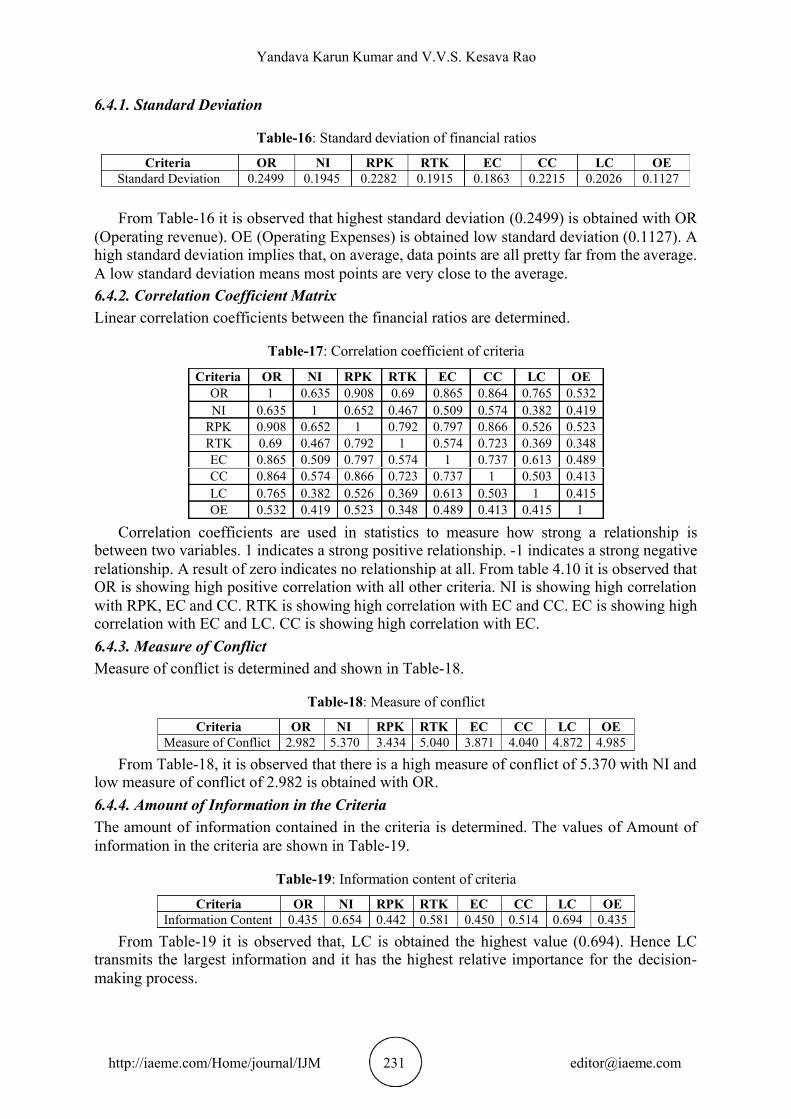
6.4.1. Standard Deviation
Table-16: Standard deviation of financial ratios
Criter ia OR NI RPK RTK EC CC LC OE Standard Deviation 0.2499 0.1945 0.2282 0.1915 0.1863 0.2215 0.2026 0.1127
From Table-16 it is observed that highest standard deviation (0.2499) is obtained with OR
(Operating revenue). OE (Operating Expenses) is obtained low standard deviation (0.1127). A high standard deviation implies that, on average, data points are all pretty far from the average. A low standard deviation means most points are very close to the average. 6.4.2. Correlation Coefficient Matrix Linear correlation coefficients between the financial ratios are determined.
Table-17: Correlation coefficient of criteria
Criteria OR NI RPK RTK EC CC LC OE OR 1 0.635 0.908 0.69 0.865 0.864 0.765 0.532 NI 0.635 1 0.652 0.467 0.509 0.574 0.382 0.419
RPK 0.908 0.652 1 0.792 0.797 0.866 0.526 0.523 RTK 0.69 0.467 0.792 1 0.574 0.723 0.369 0.348 EC 0.865 0.509 0.797 0.574 1 0.737 0.613 0.489 CC 0.864 0.574 0.866 0.723 0.737 1 0.503 0.413 LC 0.765 0.382 0.526 0.369 0.613 0.503 1 0.415 OE 0.532 0.419 0.523 0.348 0.489 0.413 0.415 1
Correlation coefficients are used in statistics to measure how strong a relationship is between two variables. 1 indicates a strong positive relationship. -1 indicates a strong negative relationship. A result of zero indicates no relationship at all. From table 4.10 it is observed that OR is showing high positive correlation with all other criteria. NI is showing high correlation with RPK, EC and CC. RTK is showing high correlation with EC and CC. EC is showing high correlation with EC and LC. CC is showing high correlation with EC. 6.4.3. Measure of Conflict Measure of conflict is determined and shown in Table-18.
Table-18: Measure of conflict
Criteria OR NI RPK RTK EC CC LC OE Measure of Conflict 2.982 5.370 3.434 5.040 3.871 4.040 4.872 4.985
From Table-18, it is observed that there is a high measure of conflict of 5.370 with NI and low measure of conflict of 2.982 is obtained with OR. 6.4.4. Amount of Information in the Criteria The amount of information contained in the criteria is determined. The values of Amount of information in the criteria are shown in Table-19.
Table-19: Information content of criteria
Criteria OR NI RPK RTK EC CC LC OE Information Content 0.435 0.654 0.442 0.581 0.450 0.514 0.694 0.435
From Table-19 it is observed that, LC is obtained the highest value (0.694). Hence LC transmits the largest information and it has the highest relative importance for the decision-making process.
Development of Balanced Score Card Framework for Performance Evaluation of Airlines
http://iaeme.com/Home/journal/IJM 232 [email protected]
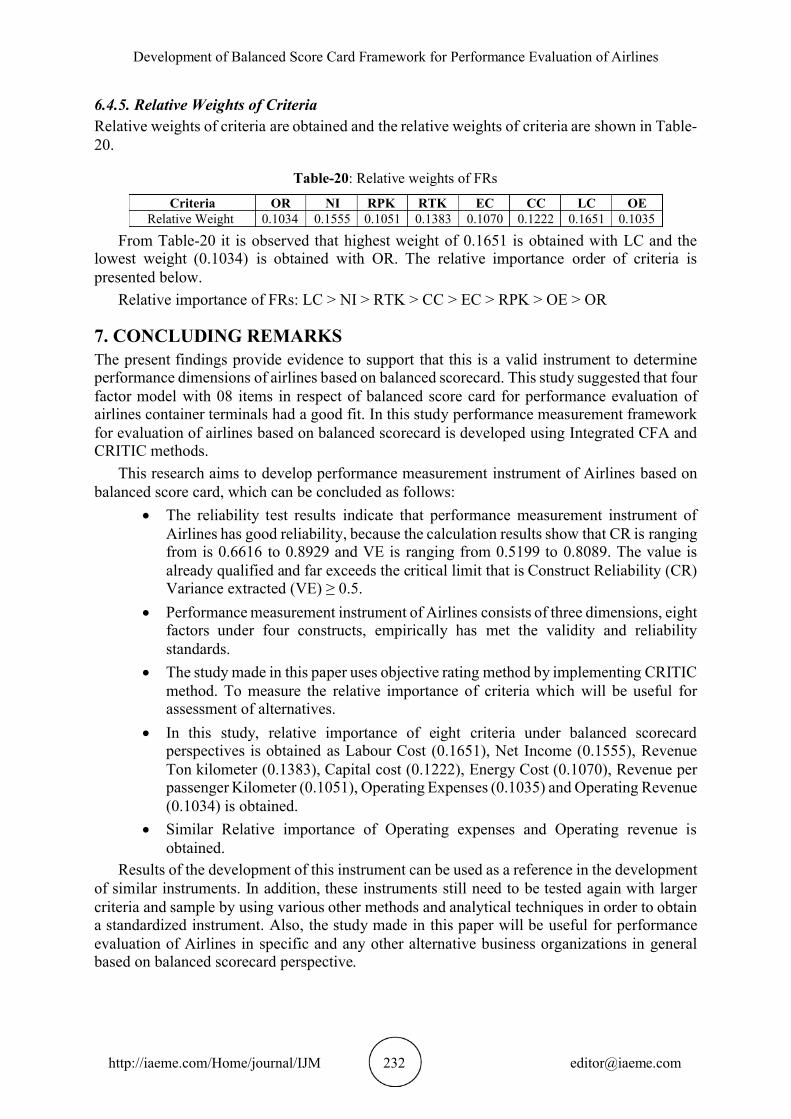
6.4.5. Relative Weights of Criteria Relative weights of criteria are obtained and the relative weights of criteria are shown in Table-20.
Table-20: Relative weights of FRs
Criteria OR NI RPK RTK EC CC LC OE Relative Weight 0.1034 0.1555 0.1051 0.1383 0.1070 0.1222 0.1651 0.1035
From Table-20 it is observed that highest weight of 0.1651 is obtained with LC and the lowest weight (0.1034) is obtained with OR. The relative importance order of criteria is
presented below. Relative importance of FRs: LC > NI > RTK > > > RPK > > CC EC OE OR
7. CONCLUDING REMARKS The present findings provide evidence to support that this is a valid instrument to determine performance dimensions of airlines based on balanced scorecard. This study suggested that four factor model with 08 items in respect of balanced score card for performance evaluation of airlines container terminals had a good fit. In this study performance measurement framework for evaluation of airlines based on balanced scorecard is developed using Integrated CFA and CRITIC methods.
This research aims to develop performance measurement instrument of Airlines based on balanced score card, which can be concluded as follows:
The reliability test results indicate that performance measurement instrument of Airlines has good reliability, because the calculation results show that CR is ranging from is 0.6616 to 0.8929 and VE is ranging from 0.5199 to 0.8089. The value is already qualified and far exceeds the critical limit that is Construct Reliability (CR) Variance extracted (VE) ≥ 0.5.
Performance measurement instrument of Airlines consists of three dimensions, eight factors under four constructs, empirically has met the validity and reliability
standards. The study made in this paper uses objective rating method by implementing CRITIC
method. To measure the relative importance of criteria which will be useful for assessment of alternatives.
In this study, relative importance of eight criteria under balanced scorecard perspectives is obtained as Labour Cost (0.1651), Net Income (0.1555), Revenue Ton kilometer (0.1383), Capital cost (0.1222), Energy Cost (0.1070), Revenue per passenger Kilometer (0.1051), Operating Expenses (0.1035) and Operating Revenue (0.1034) is obtained.
Similar Relative importance of Operating expenses and Operating revenue is obtained.
Results of the development of this instrument can be used as a reference in the development of similar instruments. In addition, these instruments still need to be tested again with larger criteria and sample by using various other methods and analytical techniques in order to obtain a standardized instrument. Also, the study made in this paper will be useful for performance evaluation of Airlines in specific and any other alternative business organizations in general based on balanced scorecard perspective.
Yandava Karun Kumar and V.V.S. Kesava Rao
http://iaeme.com/Home/journal/IJM 233 [email protected]
REFERENCES [1] Kaplan, R.S and Norton, D.P., The Balanced Scorecard-Measures That Drive Performance,
Harvard Business Review, 70, 1992, pp.71-79.
[2] Kaplan, R.S., Norton, D.P. Linking the Balanced Scorecard to Strategy, California Management Review. 1996, 39, pp.53-79.
[3] Wang, Y.G.; Li, -M.; Jan, C.L. and Chang, K.W.,Evaluating firm performance with Y.balanced scorecard and data envelopment analysis, WSEAS Transaction on Business and Economics, 10, 2013, pp.24-39.
[4] Gusnardi, Rina Selva Johan and Iskandar Muda, Confirmatory Factor Analysis of Dimensions of The Balanced Scorecard as a Strategy for Local Government Capacity
Apparatus, International Journal of Sciences and Research, Vol.73, No.1, 2017, pp.170-175
[5] Najafi, E., Aryanegad, M., Lotfi, F., & Ebnerasould, A, Efficiency and effectiveness rating of organization with combined DEA and BSC. Applied Mathematical Sciences, Vol.3,
2009, pp.239-265.
[6] Eilat H., Golany, B., & Shtub, A, R&D project evaluation: An Intergrade DEA and Balanced Scorecard approach, Omega, Vol.36, 2008, pp.895-912.
[7] Mandy M. Cheng and Kerry A. Humphreys, The Differential Improvement Effects of the Strategy Map and Scorecard Perspectives on Managers' Strategic Judgments. The
Accounting Review: May 2012, Vol.87, No.3, 2012, pp.899-924.
[8] Iskandar Muda, Erlina, Idhar Yahya and Abdillah Arif Nasution, Performance Audit and Balanced Scorecard Perspective, International Journal of Civil Engineering and
Technology, 9(5), 2018, pp. 1321 1333 –
[9] Humphreys and Trotman, The Balanced Scorecard: The Effect of Strategy Information on Performance Evaluation Judgments, Journal of Management Accounting Research
American Accounting Association, Vol.23, 2011, pp.81-98
[10] Kaplan, S., Petersen, M. J., & Samuels, J. A, An examination of the effect of positive and negative performance on the relative weighting of strategically and non-strategically linked
balanced scorecard measures. Behavioral Research in Accounting, Vol.2,No2, 2012, pp.133-151.
[11] Malina and Selto, Communicating and Controlling Strategy: An Empirical Study of the Effectiveness of the Balanced Scorecard, Journal of Management Accounting Research, Vol.13, 2007, pp.1-53.
[12] Hasan Dinçer , Ümit Hacıoglu and Serhat Yüksel, Balanced scorecard based performance measurement of European airlines using a hybrid multicriteria decision making approach under the fuzzy environment, Journal of Air Transport Management, Vol.63, 2017, pp-17-33.
[13] Anirut Pipatprapa, Hsiang-Hsi Huang, Ching-Hsu Huang, An Integrated Approach For Developing Environmental Performance Evaluation Of Taiwan’s Food Industry,
International Journal Of Scientific & Technology Research, Vol.5, No.06, 2016, pp.301-305.
[14] Bojuwon Mustapha and Bojuwon Yusuf Bolaji, Measuring Lecturers Commitment Scales: A Second order Confirmatory Factor Analysis (CFA), International Journal of Education and Research, Vol.3, No.3, 2015, pp.505-516.
[15] Shahid Hussain, Zhu Fangwei , Ahmed Faisal Siddiqi , Zaigham Ali and Muhammad Salman Shabbir, Structural Equation Model for Evaluating Factors Affecting Quality of Social Infrastructure Projects, Sustainability, Vol.10, No.1415, 2018, pp.1-25.
Development of Balanced Score Card Framework for Performance Evaluation of Airlines
http://iaeme.com/Home/journal/IJM 234 [email protected]
[16] S. Gopinath, Boda Sagar Kantilal, S. Sreelakshmi, Mohammed Roshan. Performance Measurement of Residential Projects in India: A Balanced Scorecard Approach.
International Journal of Civil Engineering and Technology, 7(6), 2016, pp. 698 706. –
[17] David Staš, Radim Lenort , Pavel Wicher and David Holman, Green Transport Balanced Scorecard Model with Analytic Network Process Support, Sustainability, Vol.7, 2015,
pp.15243-15261
[18] Agnieszka Tubis and Sylwia -Wojciechowska, Balanced Scorecard Use in Werbińska Passenger Transport Companies Performing at Polish Market, Procedia Engineering,
Vol.187, 2017, pp.538-547.
[19] Frederico, Guilherme F and Cavenaghi, Vagner, The Application of the Balanced Scorecard in the Operators of Freights Railroad Transportation, POMS 19th Annual Conference La Jolla, Califórnia, U.S.A., 2008, pp.1-20.
[20] Hamed Rahimi, Jamshid Bahmaei, Payam Shojaei, Zahra Kavo and Mohammad Khavasi si , Developing a Strategy Map to Improve Public Hospitals Performance with Balanced
Scorecard and DEMATEL Approach, Shiraz E-Med J., Vol.19, No.7, 2017, pp.1-12.
[21] Saif Hassan Ali Alzaabi and Hassan Al-Dhaafri, The Effect of Strategy Management and Balanced Scorecard on Organizational Performance of UAE Civil Defense, Business Management and Strategy, Vol.18, No.1, 2018, pp.84-104.
[22] Vinh V Thai, The Impact of Port Service Quality on Customer Satisfaction: The Case of Singapore, Maritime Economics & Logistics, DOI:10.1057/mel.2015.19, 2015, pp.1-24