assessment of flood mitigation measure ... - iaeme
TRANSCRIPT
ttp://iaeme.com/Home/journal/IJCIET 56 [email protected] h
International Journal of Civil Engineering and Technology (IJCIET) Volume 7, Issue 3 May June 6, pp. , Article ID: IJCIET_07_ 06 , – 201 56–66 03_0Available online at ttp://iaeme.com/Home/issue/IJCIET?Volume=7&Issue=3 h
Journal Impact Factor (2016): 9.7820 (Calculated by GISI) www.jifactor.com ISSN Print: 0976-6308 and ISSN Online: 0976-6316 © IAEME Publication
ASSESSMENT OF FLOOD MITIGATION MEASURE FOR MITHI RIVER A CASE –
STUDY Rituparna Choudhury, B.M. Patil, Vipin Chandra
Bharati Vidyapeeth Deemed University, College of Engineering, Department of Civil Engineering, Pune 43, –
Maharashtra, India
Uday B. Patil, T. Nagendra
CWPRS, Khadakwasla, Pune 23, Maharashtra, India –
ABSTRACT Mumbai city which has an area of 437sq km with a population of 12
million came to an abrupt halt because of the unprecedented rainfall of 944mm during the 24 hours starting on 26th July 2005; with 380mm occurring
in just 3 hours between 14:30 to 17:30 and hourly rainfall exceeding 126 mm/hr. This particular event is considered to be an extra-ordinary event.
Numerical model study using one dimensional mathematical model HEC-RAS is carried out to simulate unsteady flow in Mithi river with the existing
conditions and with the telescopic channelization as suggested by MMRDA for 100 years return period and 6 hours storm duration. The appropriate
boundary conditions at the upstream, downstream and the internal boundaries were applied. The results indicated that due to the channelization, the average reduction in the water level is of the order of 20 % to25 % and the increase in
the conveyance capacity of Mithi River causing rapid flushing of floods, is found to vary from 23% to 340% which is quite significant compared to
existing conditions at various locations along the river. Thus the telescopic channelization is found to be effective for mitigating floods.
Keywords: Mithi River, HEC-RAS, Floods, Unsteady flow, Hydrograph, Channelization Cite this Article: Rituparna Choudhury, B.M. Patil, Vipin Chandra, Uday B.
Patil and T. Nagendra, Assessment of Flood Mitigation Measure For Mithi River A Case Study, – International Journal of Civil Engineering and
Technology, 7(3 56 66. ), 2016, pp. –
ttp://iaeme.com/Home/issue/IJCIET?Volume=7&Issue=3 h
Assessment of Flood Mitigation Measure For Mithi River A Case Study –
ttp://iaeme.com/Home/journal/IJCIET 57 [email protected] h
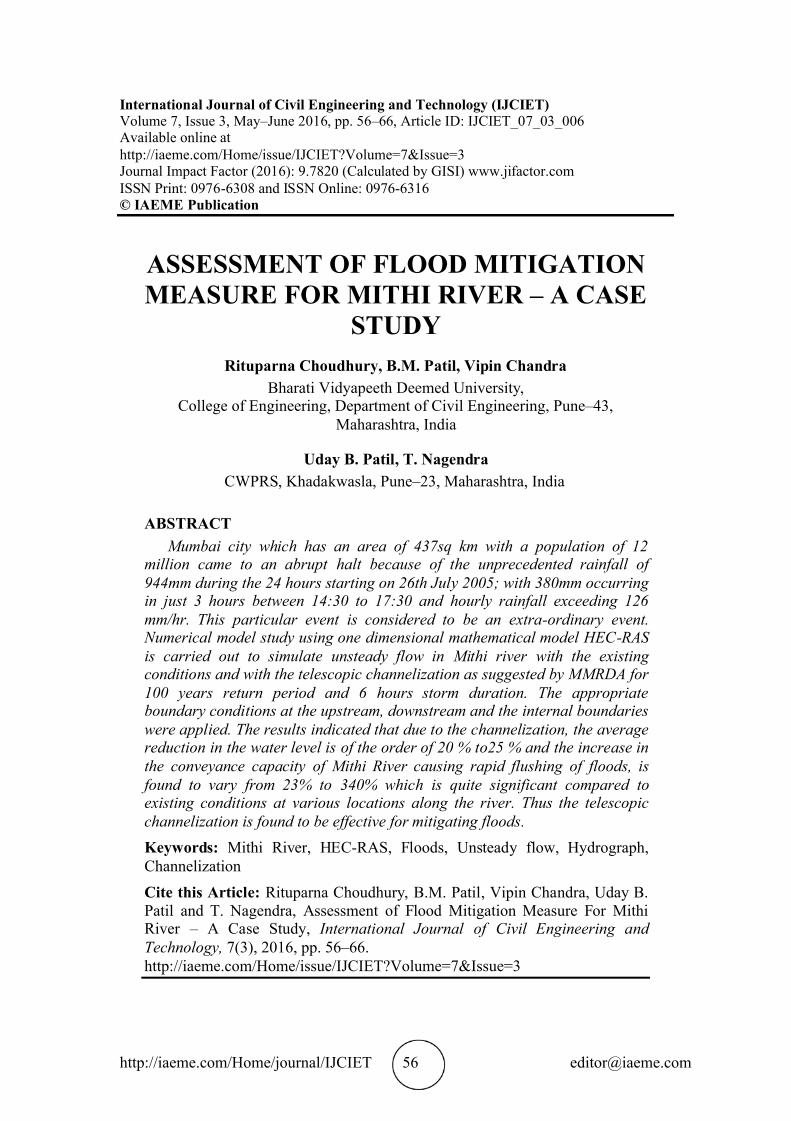
1. INTRODUCTION Flooding is a condition in which the dry land areas are normally inundated due to various reasons like overflow of inland or tidal water, unusual and rapid accumulation of surface waters from any source. In case of rivers if the rate of flow exceeds the capacity of the river channel, flooding occurs. In India the main causes of floods are urbanization, bank erosion, drainage issues etc. The problems mainly depend on the flow phenomenon and river system topography. Another important reason of flooding is tidal variation if the area is close to sea, within the tidal zone. Mithi River is also one such river which is subject to tidal flows because of which the water level changes substantially. The location map of Mithi river is given in Fig. 1. Mumbai city which has an area of 437sq km with a population of 12 million came to an abrupt halt because of the unprecedented rainfall of 944mm during the 24 hours starting on 26th July 2005; with 380mm occurring in just 3 hours. The flood was very severe as it took away 447 lives in Mumbai. It affected the entire trading, commercial and industrial activity for 3 days
Figure 1 Location map of Mithi River
Various studies have been done to mitigate floods. Flood resilience study for Mithi river catchment in Mumbai, indicated that identifying the most severe flood prone areas will help to plan future flood mitigation measures (Vinay Nikamet al,
2013).Simulation results from the flood mitigation study of Mithi River using detention pond revealed that the maximum peak reduced by 21% with the help of detention pond located at Jogeshwari-Vikhroli link road (Khan Mujiburrehman et , al2014a). More emphasis must be given to mitigation of floods and its management in
order to plan and achieve proper development in the Mumbai region (Khan Mujiburrehman, 2014b).
Mangrove forests reduce the flood wave height by 21% (Khan Mujiburrehman (2014c)
One dimensional numerical simulation of the unsteady flow in Mithi river has been carried out using HEC-RAS software and is presented in this paper. The study is
carried out for existing condition and for proposed channelization condition. The effect of the channelization for mitigating the flood intensity is analyzed and
discussed.
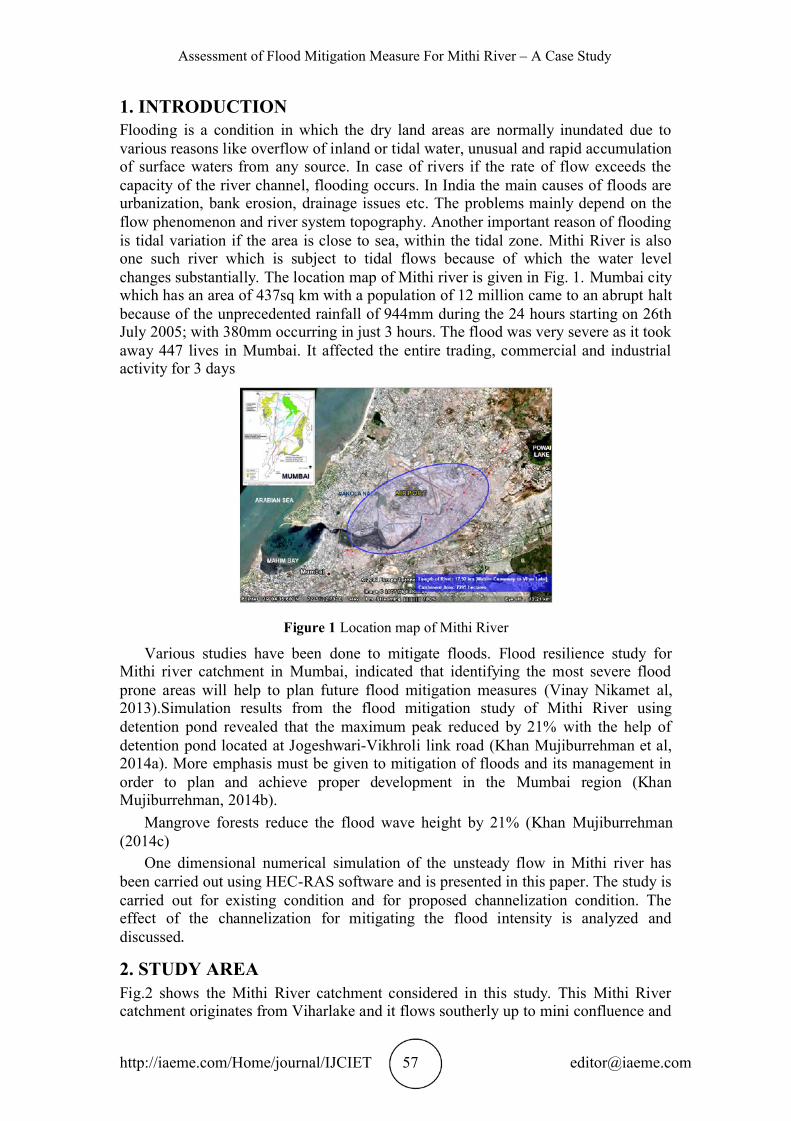
2. STUDY AREA Fig.2 shows the Mithi River catchment considered in this study. This Mithi River
catchment originates from Viharlake and it flows southerly up to mini confluence and
Rituparna Choudhury B.M. Patil Vipin Chandra Uday B. Patil and T. Nagendra , , ,
ttp://iaeme.com/Home/journal/IJCIET 58 [email protected] h
turns westerly joining Arabian Sea through Mahim Bay. The Mithi river receives water from the freshet discharges of Powai, Vihar and Tulsi lakes. It further travels 17.84 Km to the Mahim Bay. Its catchment area is 7295 ha. The river is narrow at the initial stretch but its width gradually increases and is widest at Bandra-Kurla complex. It is an estuarine river as its flow consists of freshet discharge as well as tidal flow. Mithi river is a natural drainage channel. During the monsoon period, the river carries
the excess water from the catchment area, storm water drains and the overflowing lakes. The condition of Mithi River fails to improve because of some hazardous
activities such as daily addition of liquid and solid wastes through opennallas and drainages. The situation further keeps worsening because of the tidal effects of
Arabian Sea. The present model studies are conducted for the Mithi river reach of length 13.289 Km, from Mahim Bay to Mathur Das Vasanji road location in the upstream. The
further upstream region contains very steep gradients causing the flow to become supercritical and hence the model becomes unstable. Hence it is not considered in this study.
Figure 2 Mithi River catchment
3 MODELING TECHNIQUE . Hydrologic Engineering Centre’s River Analysis System”, i.e. “HEC RAS” - -
developed by Hydrologic Engineering Centre , Institute of Water Resources , U.S Army Corps of Engineers, Davis, CA, USA is a software (HEC-RAS 4.1, 2010) that
is capable to perform one dimensional steady and unsteady hydraulic flow computations including sediment transport mobile bed modeling and water
temperature analysis in rivers. This software has been used for our present study. HEC-RAS software is an integrated system. It is designed for interactive use in a
multi-tasking environment. The system consists of graphical user interface, separate analysis components, data storage and management capabilities, graphics and
reporting facilities.
4 MODEL SIMULATION . The various data that have been used for the study are cross-section, bridges, tidal
levels and rainfall data. The model is developed for Mithi River, Mumbai. The entire Mithi catchment along with its various sub-catchments is shown in Fig.2.
Assessment of Flood Mitigation Measure For Mithi River A Case Study –
ttp://iaeme.com/Home/journal/IJCIET 59 [email protected] h
VakolaNalla, a major tributary of Mithi river having catchment area of 907 ha has a part of entire Mithi river basin, which joins the Mithi river to form a junction named as Mini Confluence. The total catchment area of Mithi River basin is about 7295 Ha (Br stowad, 1993). The whole Mithi river basin is divided into six sub-catchment imareas as A1, A2, A3, A4, A5 and A6 based on the characteristics of basins like slope, alignment, roughness etc. The areas for the sub-catchments are given in Table. 1.
Table 1 Area of sub-catchments
Sr. No. Catchment name Area in ha 1 A1 1869 2 A2 1922 3 A3 570 4 A4 607 5 A5 1420 6 A6 907
As mentioned earlier the Mithi river reach of length 13.289 Km, from Mahim Bay to Mathur Das Vasanji road location in the upstream is considered for simulation.
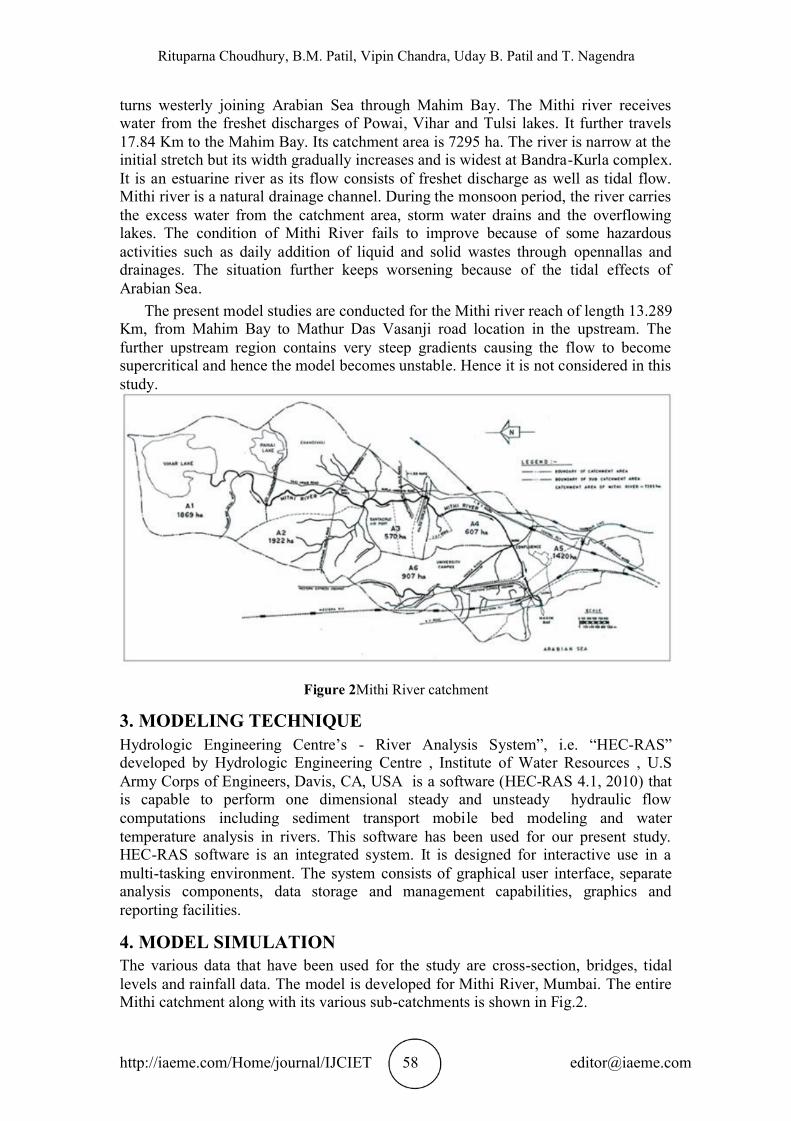
Fig.3 shows the model schematization of the entire reach considered of Mithi river. The entire reach has been divided into three different reaches namely Reach-1,
Reach-2 and Reach-3. The stretch from Mahim Bay to Mini-confluence with a distance of about 6.2 Km has been named as Reach-2. Further from Mini-confluence to Vihar Lake the reach has been named as Reach-1 which extends upto 13.289 Km with a reach distance of about 7 Km. Further from Mini-confluence to a distance of 2.4 Km, which is VakolaNalla, is named as Reach-3. Mini Confluence is basically the junction of all the three reaches.
In Re - 2, total five bridges have been simulated. Various existing bridges that achhave been considered in the model are Mahim Causeway Bridge, 72” dia. Tansa Pipe Line Bridge, Western Railway Bridge, 96”dia. Vaitarna Pipe Line Bridge and Dharavi Bridge.
Figure 3 Schematization of Mithi River in HEC-RAS model
Manning’s n values are also given for each cross-section. The roughness co-efficient is specified based on the topographic condition of main channels and flood plain bank on either side. The main channel consists of RCC retaining wall on the either side. Hence, the computation of equivalent or composite roughness co-efficient has been carried out using the formula below:-
Rituparna Choudhury B.M. Patil Vipin Chandra Uday B. Patil and T. Nagendra , , ,
ttp://iaeme.com/Home/journal/IJCIET 60 [email protected] h
3/2
32
23
)(p
pnn ii
(1)
Where P = wetted perimeter, n = roughness co-efficient of a particular location. The three different values for the main channel have been considered viz. 0.017,
0.035 and 0.017. The composite roughness co-efficient for the main channel which works out to be 0.031 is adopted for further simulation.
4.1 Model simulation for the existing condition . The survey of Mithi River conducted in 2005 is used for the study. The manning’s n for the main channel is taken as 0.031 and for flood plain on left over bank and right over bank it is considered as 0.042. One dimensional mathematical model studies for existing conditions are conducted for 100 years return period. The tide at Mumbai is
of semi-diurnal nature having tidal period of 12 hours 15 min. For generating the worst combination of flooding 6 hours storm duration has been considered.
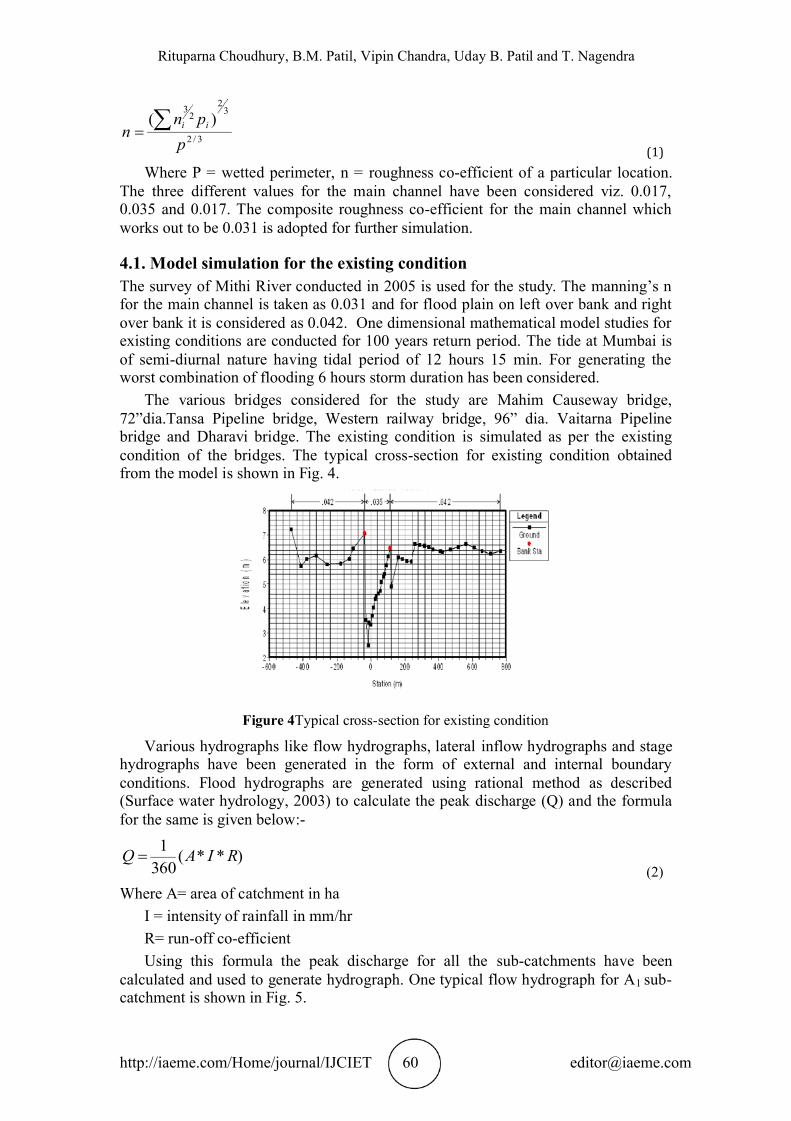
The various bridges considered for the study are Mahim Causeway bridge, 72” ge, Western railway bridge, 96” dia. dia.Tansa Pipeline brid Vaitarna Pipeline
bridge and Dharavi bridge. The existing condition is simulated as per the existing condition of the bridges. The typical cross-section for existing condition obtained
from the model is shown in Fig. 4.
Figure 4Typical cross-section for existing condition
Various hydrographs like flow hydrographs, lateral inflow hydrographs and stage hydrographs have been generated in the form of external and internal boundary
conditions. Flood hydrographs are generated using rational method as described (Surface water hydrology, 2003) to calculate the peak discharge (Q) and the formula for the same is given below:-
)**(3601 RIAQ
(2) Where A= area of catchment in ha
I = intensity of rainfall in mm/hr R= run-off co-efficient
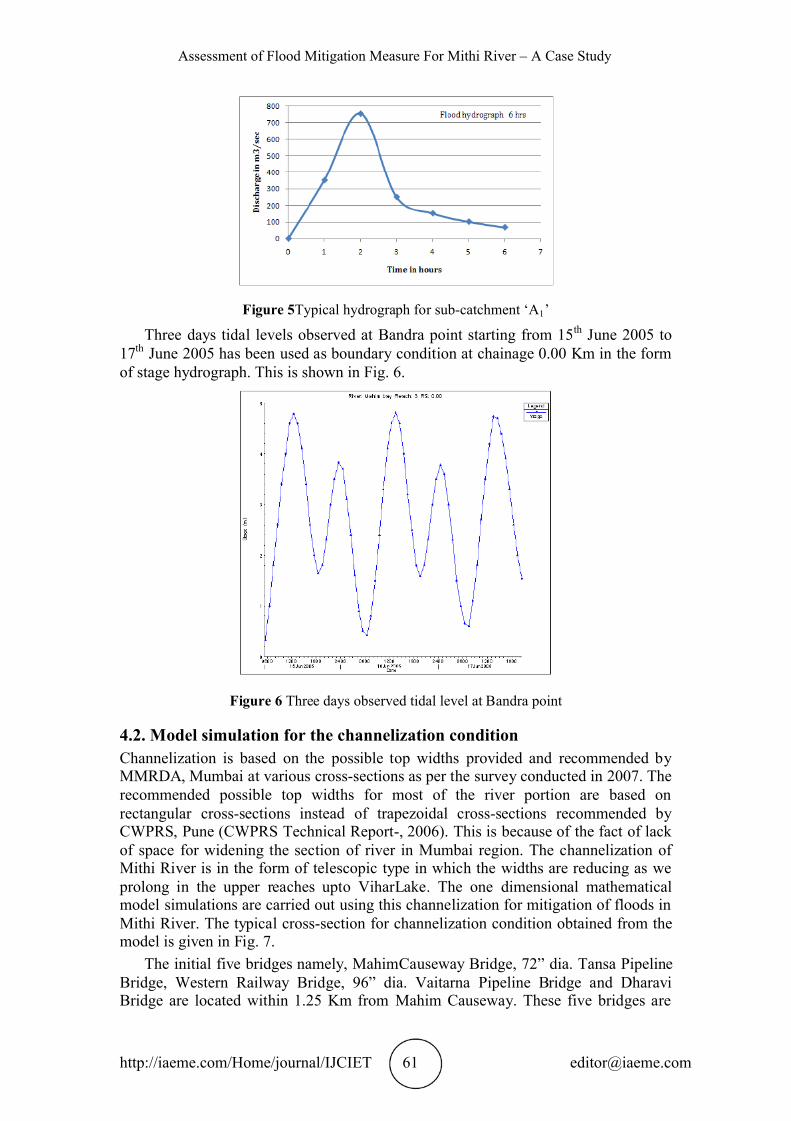
Using this formula the peak discharge for all the sub-catchments have been calculated and used to generate hydrograph. One typical flow hydrograph for A1 sub- catchment is shown in Fig. 5.
Assessment of Flood Mitigation Measure For Mithi River A Case Study –
ttp://iaeme.com/Home/journal/IJCIET 61 [email protected] h
Figure 5Typical hydrograph for sub-catchment A‘ 1’
Three days tidal levels observed at Bandra point starting from 15th June 2005 to 17th June 2005 has been used as boundary condition at chainage 0.00 Km in the form of stage hydrograph. This is shown in Fig. 6.
Fig e 6 ur Three days observed tidal level at Bandra point
4.2 Model simulation for the channelization condition . Channelization is based on the possible top widths provided and recommended by
MMRDA, Mumbai at various cross-sections as per the survey conducted in 2007. The recommended possible top widths for most of the river portion are based on
rectangular cross-sections instead of trapezoidal cross-sections recommended by CWPRS, Pune (CWPRS Technical Report-, 2006). This is because of the fact of lack of space for widening the section of river in Mumbai region. The channelization of Mithi River is in the form of telescopic type in which the widths are reducing as we
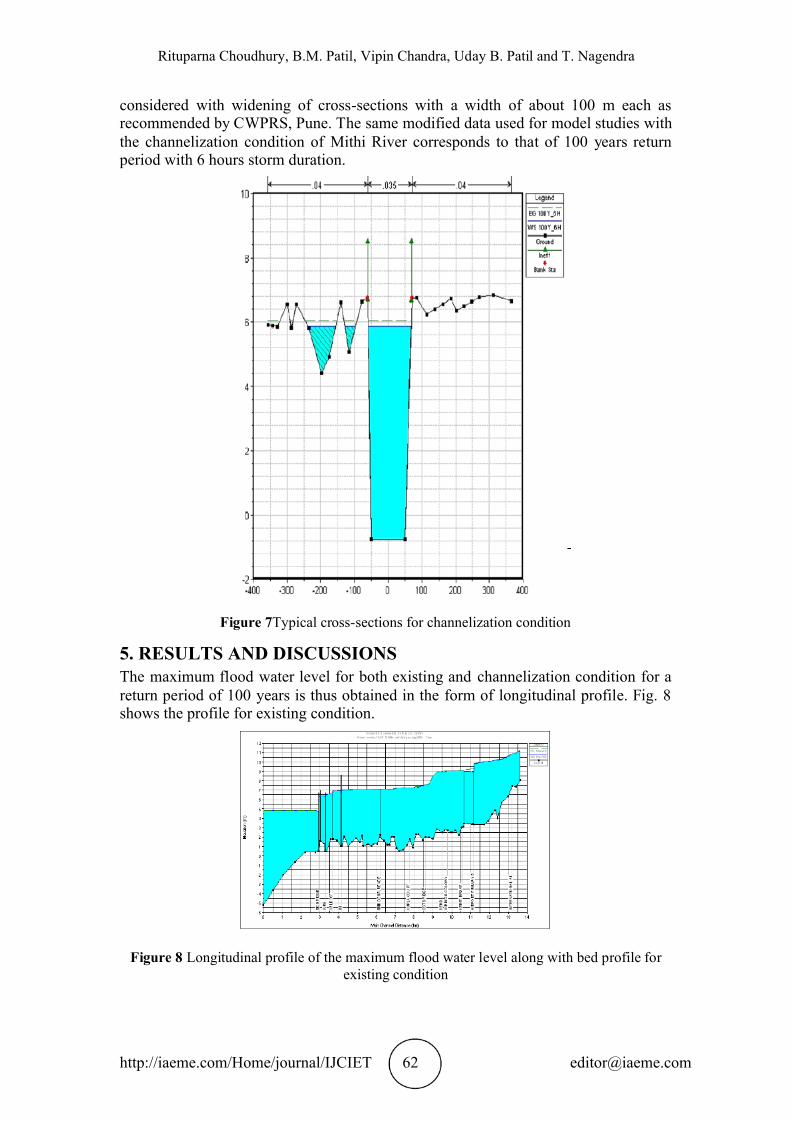
prolong in the upper reaches upto ViharLake. The one dimensional mathematical model simulations are carried out using this channelization for mitigation of floods in Mithi River. The typical cross-section for channelization condition obtained from the model given in Fig. 7. is
The initial five bridges namely, MahimCauseway Bridge dia. Tansa Pipeline , 72”
Bridge, Western Railway Bridge dia. Vaitarna Pipeline Bridge and Dharavi , 96”Bridge are located within 1.25 Km from Mahim Causeway. These five bridges are
Rituparna Choudhury B.M. Patil Vipin Chandra Uday B. Patil and T. Nagendra , , ,
ttp://iaeme.com/Home/journal/IJCIET 62 [email protected] h
considered with widening of cross-sections with a width of about 100 m each as recommended by CWPRS, Pune. The same modified data used for model studies with the channelization condition of Mithi River corresponds to that of 100 years return period with 6 hours storm duration.
Figure 7Typical cross-sections for channelization condition
5. RESULTS AND DISCUSSIONS The maximum flood water level for both existing and channelization condition for a return period of 100 years is thus obtained in the form of longitudinal profile. Fig. 8 shows the profile for existing condition.
Figure 8 Longitudinal profile of the maximum flood water level along with bed profile for existing condition
Assessment of Flood Mitigation Measure For Mithi River A Case Study –
ttp://iaeme.com/Home/journal/IJCIET 63 [email protected] h
The figure indicates the maximum flood water levels at various locations. The cascade effect is observed near bridge location which is due to the reason that the five bridges are located within 1.25 Km from Mahim causeway. The heading up of water causes the formation of afflux on upstream side of bridge station because of which the cascade effect of maximum water level is seen in the longitudinal profile. It is seen
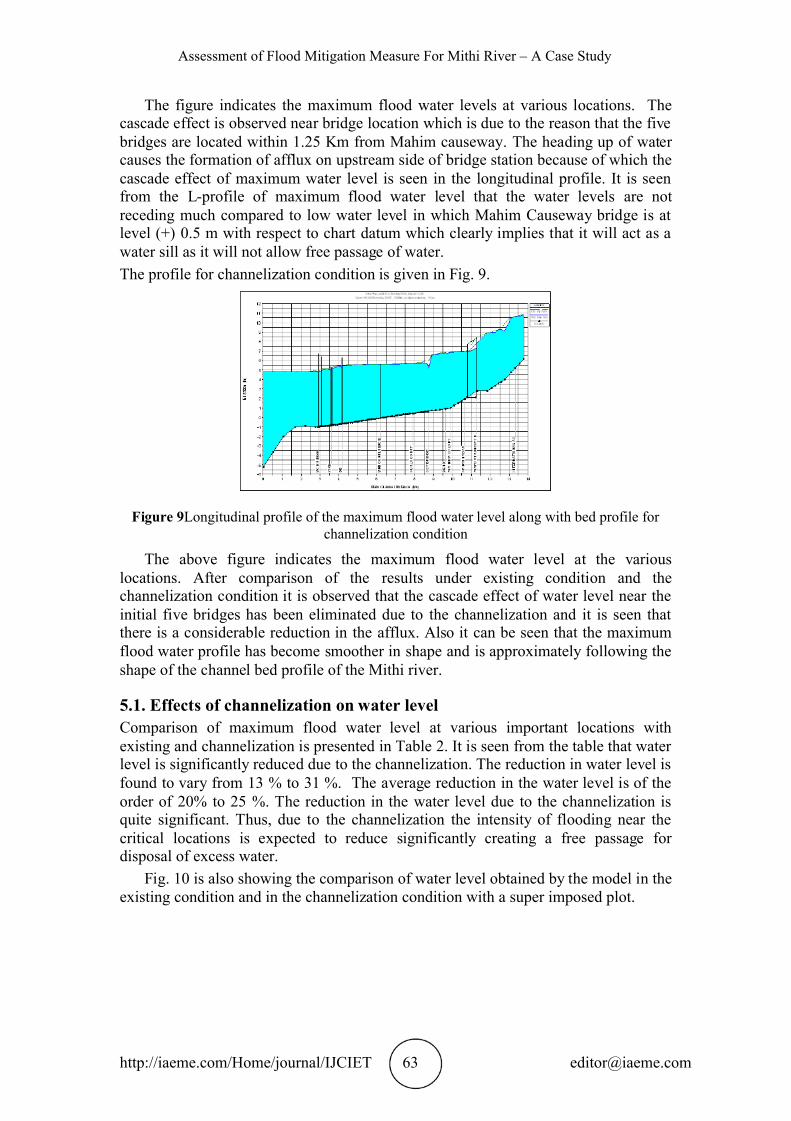
from the L-profile of maximum flood water level that the water levels are not receding much compared to low water level in which Mahim Causeway bridge is at level (+) 0.5 m with respect to chart datum which clearly implies that it will act as a water sill as it will not allow free passage of water. The profile for channelization condition is given in Fig. 9.
Figure 9Longitudinal profile of the maximum flood water level along with bed profile for channelization condition
The above figure indicates the maximum flood water level at the various locations. After comparison of the results under existing condition and the
channelization condition it is observed that the cascade effect of water level near the initial five bridges has been eliminated due to the channelization and it is seen that there is a considerable reduction in the afflux. Also it can be seen that the maximum flood water profile has become smoother in shape and is approximately following the shape of the channel bed profile of the Mithi river.
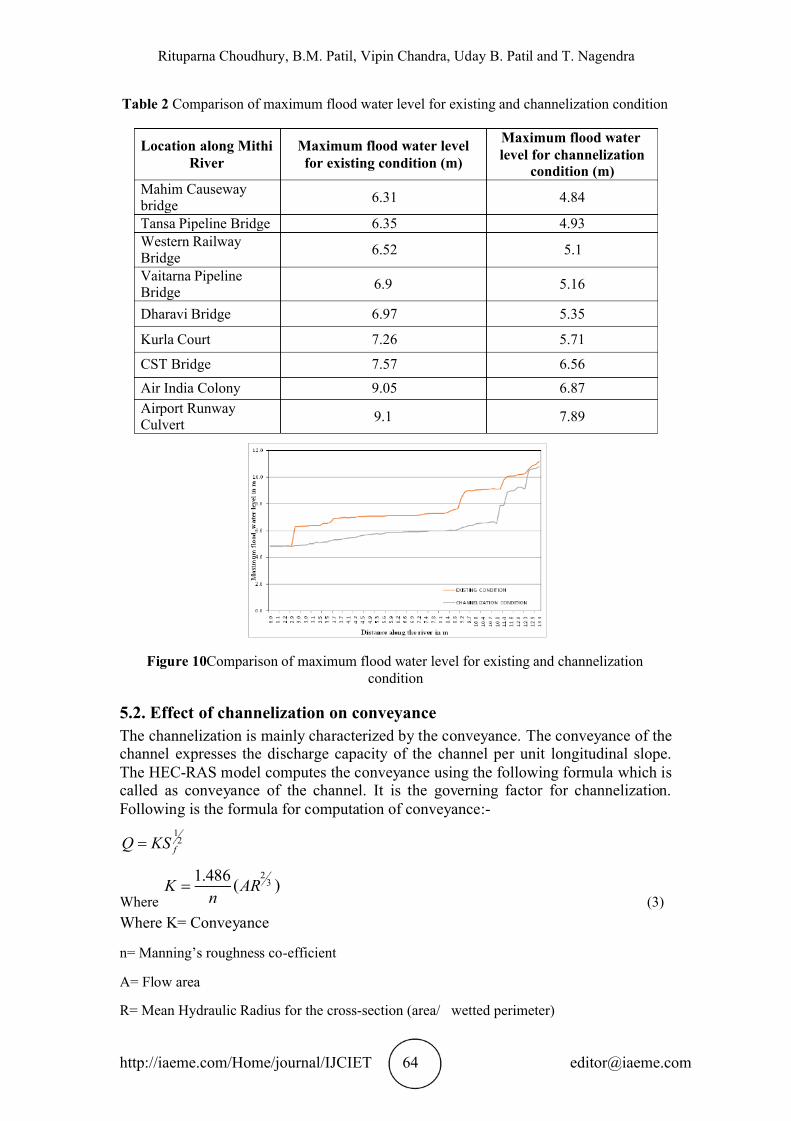
5.1 Effects of channelization on water level . Comparison of maximum flood water level at various important locations with
existing and channelization is presented in Table 2. It is seen from the table that water level is significantly reduced due to the channelization. The reduction in water level is found to vary from 13 % to 31 %. The average reduction in the water level is of the order of 20% to 25 %. The reduction in the water level due to the channelization is quite significant. Thus, due to the channelization the intensity of flooding near the
critical locations is expected to reduce significantly creating a free passage for disposal of excess water.
Fig. 10 is also showing the comparison of water level obtained by the model in the existing condition and in the channelization condition with a super imposed plot.
Rituparna Choudhury B.M. Patil Vipin Chandra Uday B. Patil and T. Nagendra , , ,
ttp://iaeme.com/Home/journal/IJCIET 64 [email protected] h
Table 2 Comparison of maximum flood water level for existing and channelization condition
Figure 10Comparison of maximum flood water level for existing and channelization condition
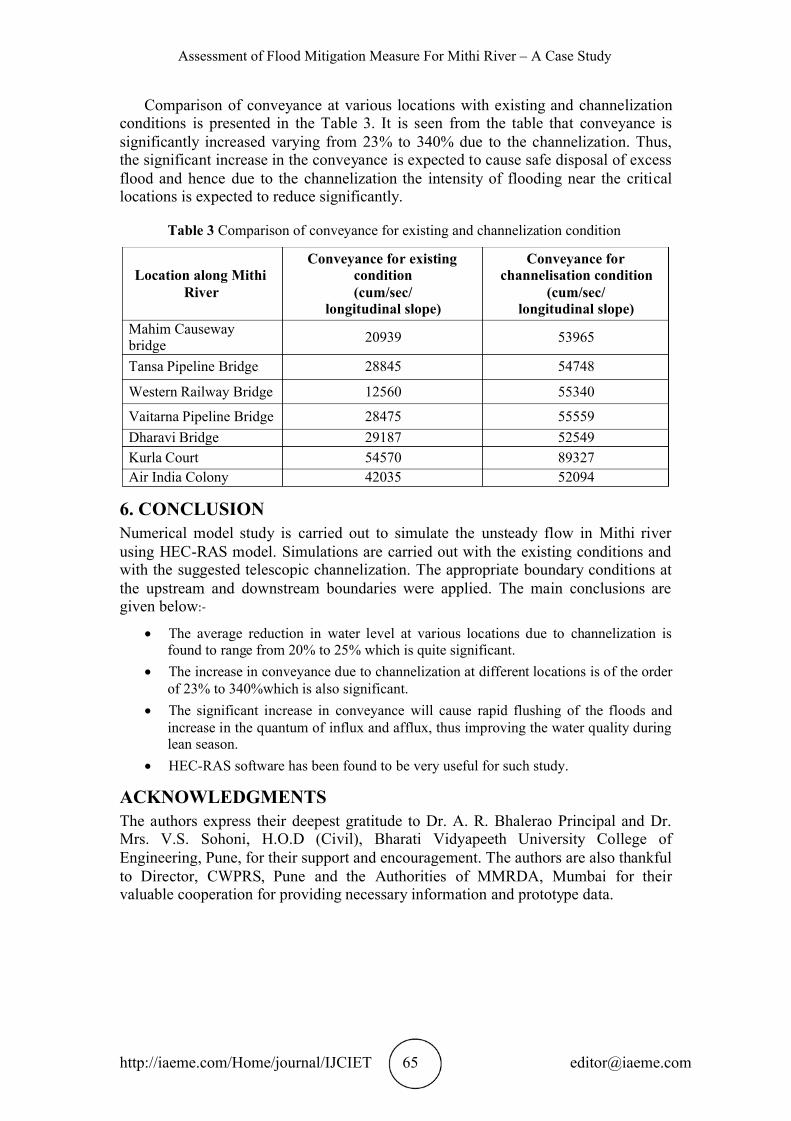
5.2 Effect of channelization on conveyance . The channelization is mainly characterized by the conveyance. The conveyance of the channel expresses the discharge capacity of the channel per unit longitudinal slope. The HEC-RAS model computes the conveyance using the following formula which is
called conveyance of the channel. It is the governing factor for channelization. asFollowing is the formula for computation of conveyance:-
21
fKSQ
Where )(486.1 3
2AR
n K
(3) Where K= Conveyance
n= Manning’s roughness co-efficient
A= Flow area
R= Mean Hydraulic Radius for the cross-section (area/ wetted perimeter)
Location along Mithi River
Maximum flood water level for existing condition (m)
Maximum flood water level for channelization
condition (m) Mahim Causeway bridge 6.31 4.84
Tansa Pipeline Bridge 6.35 4.93 Western Railway Bridge 6.52 5.1
Vaitarna Pipeline Bridge 6.9 5.16
Dharavi Bridge 6.97 5.35
Kurla Court 7.26 5.71
CST Bridge 7.57 6.56 Air India Colony 9.05 6.87 Airport Runway Culvert 9.1 7.89
Assessment of Flood Mitigation Measure For Mithi River A Case Study –
ttp://iaeme.com/Home/journal/IJCIET 65 [email protected] h
Comparison of conveyance at various locations with existing and channelization conditions is presented in the Table 3. It is seen from the table that conveyance is significantly increased varying from 23% to 340% due to the channelization. Thus, the significant increase in the conveyance is expected to cause safe disposal of excess flood and hence due to the channelization the intensity of flooding near the critical locations is expected to reduce significantly.
Table 3 Comparison of conveyance for existing and channelization condition
Location along Mithi River
Conveyance for existing condition (cum/sec/
longitudinal slope)
Conveyance for channelisation condition
(cum/sec/ longitudinal slope)
Mahim Causeway bridge 20939 53965
Tansa Pipeline Bridge 28845 54748
Western Railway Bridge 12560 55340
Vaitarna Pipeline Bridge 28475 55559 Dharavi Bridge 29187 52549 Kurla Court 54570 89327 Air India Colony 42035 52094
6. CONCLUSION Numerical model study is carried out to simulate the unsteady flow in Mithi river
using HEC-RAS model. Simulations are carried out with the existing conditions and with the suggested telescopic channelization. The appropriate boundary conditions at
the upstream and downstream boundaries were applied. The main conclusions are given below:-
The average reduction in water level at various locations due to channelization is found to range from % to % which is quite significant.20 25
The increase in conveyance due to channelization at different locations is of the order of 23% to 340%which is also significant.
The significant increase in conveyance will cause rapid flushing of the floods and increase in the quantum of influx and afflux, thus improving the water quality during lean season.
HEC-RAS software has been found to be very useful for such study.
ACKNOWLEDGMENTS The authors express their deepest gratitude to Dr. A. R. Bhalerao Principal and Dr.
Mrs. V.S. Sohoni, H.O.D (Civil), Bharati Vidyapeeth University College of Engineering, Pune, for their support and encouragement. The authors are also thankful
to Director, CWPRS, Pune and the Authorities of MMRDA, Mumbai for their valuable cooperation for providing necessary information and prototype data.
Rituparna Choudhury B.M. Patil Vipin Chandra Uday B. Patil and T. Nagendra , , ,
ttp://iaeme.com/Home/journal/IJCIET 66 [email protected] h
REFERENCES
[1] A Ramachandra, Rao, (2003), Surface Water Hydrology, Press LLC. CRC [2] Brimstowad Project Report, (1993), Master Planning of Greater Bombay Storm
Drainage and Sewer Rehabilitation. [3] HEC-RAS, Hydraulic Reference Manual, (2010).Version 4.1. [4] Khan, Mujiburrehman, et al, (2014a),Flood mitigation on Mithi river using
detention pond, IOSR Journal of Environmental Science, Toxicology and Food Technology, Vol. 8. pp. 34-39.
[5] Khan, Mujiburrehman., (2014b), Hydrological Response to Urbanization of Mithi River, Mumbai, India, Journal of Environmental Research and
Development. [6] Khan, Mujiburrehman., (2014c),Significance of Mangroves in Flood Protection
of Coastal Area: A case study of Mithi River, Mumbai, India, World Journal of Environmental Biosciences.
[7] Technical report no. 4297, CWPRS, (2006), 1-D mathematical model and desk studies for mitigating floods of Mithi river of Mumbai, Pune.
[8] Dr. Yerramsettyabbulu, Dr. P. Chandan Kumar And V.K.V.Bhadrudu , Approaches For Obtaining Design Flood Peak Discharges In Sarada River,
International Journal of Civil Engineering and Technology, 4(4), 2013, pp. 113–
118. [9] Prof. Hemraj R Kumavat and Prof. Ganesh V Tapkire Experimental ,
Investigation of Flooding Problem- A Case Study on Arunavati River In Shirpur City by Total Station Survey International Journal of Civil Engineering and ,
Technology, 7(1), 2016, pp. 172 179. –
[10] Vinay, Nikam., and Kapil, Gupta., (2013), Flood resilience Study for Mithi River Catchment in Mumbai, India, Collaborative Research On Flood Resilience in Urban Areas.