development of a 30 kw inductively coupled plasma torch facility for advanced aerospace material...
TRANSCRIPT

REPORT DOCUMENTATION PAGE Form Approved OMB No. 0704-0188
The public reportmg burden for th1s collection of mformation is estimated to average 1 hour per response. includmg the time for rev>ewing instruct>ons. searclhing existing data sources. gathering and mmnta1mng the data needed. and completing and rev1ew1ng the collection of 1nforma t1 on. Send comments regarding th1s burden est1mate or any other aspect o fth1s collection of mformat1on . 1nclud1ng suggestions for reduc1ng the burden. to the Department of Defense. ExecutiVe Serv1ce D>rectorate (0704-0188) Respondents should be aware that notwithstanding any other prov1s1on of law. no person shall be sub;ect to any penalty for fall ing to comply w1th a collect>on of 1nformat1on if 1t does not display a currently valid OMB control number
PLEASE DO NOT RETURN YOUR FORM TO THE ABOVE ORGANIZATION.
1. REPORT DATE (DD-MM-YYYY) 12. REPORT TYPE 3. DATES COVERED (From- To)
28-02-2012 Final Aug 2008- Nov 2011
4. TITLE AND SUBTITLE Sa. CONTRACT NUMBER
Development of a 30 kW Inductively Coupled Plasma Torch Facility for Advanced Aerospace Material Investigations
Sb. GRANT NUMBER
F A9550-08-l-0414
Sc. PROGRAM ELEMENT NUMBER
6. AUTHOR(S) Sd. PROJECT NUMBER
Fletcher, Douglas, G Meyers, Jason, M Owens, Walten, P
Se. TASK NUMBER
Sf. WORK UNIT NUMBER
7. PERFORMING ORGANIZATION NAME(S) AND ADDRESS(ES) 8. PERFORMING ORGANIZATION
University of Vermont & State Agricultural College REPORT NUMBER
University of Vermont 85 S. Prospect St Burlington, VT 05405-1 704
9. SPONSORING/MONITORING AGENCY NAME(S) AND ADDRESS(ES) 10. SPONSOR/MONITOR'S ACRONYM(S)
Air Force Office of Scientific Research 875 N. Randolph St. Room 3112 Arlington, VA 22203 11. SPONSOR/MONITOR'S REPORT
NUMBER(S)
AFRL-OSR-VA-TR-2012-0281
12. DISTRIBUTION/AVAILABILITY STATEMENT
Distribution A - Approved for Public Release
13. SUPPLEMENTARY NOTES
14. ABSTRACT A 30 kW Inductively Coupled Plasma (ICP) Torch for testing high-temperature materials for aerospace applications has been designed, constructed, and made operational at the University of Vermont. A key advantage of the inductive heating approach to creating the plasma is the electrodeless operation, which avoids the copper contamination from electrode attachment of traditional arc heaters. Heat flux probes have been fabricated and used to characterize the heating rates. In addition, sample holders for both shape-stable and ablative material samples have been developed for use in the facility. Surface temperature measurements using a two-color optical pyrometer have been demonstrated. Tests have been conducted on graphite, SiC, and ZrB2-SiC samples. Current test capabilities for continuous operation include heat flux levels up to 120 W/cm2 for air and nitrogen plasmas at pressures between 100 and 200 torr, and surface temperatures to 1800 K for graphite. A unique feature of the ICP Torch Facility is the inclusion of optical access to allow emission and laser-spectroscopic measurements in the plasma/surface reaction zone. Emission measurements have been used to track the evolution of boron depletion and silicon-oxide layer formation over a UHTC test sample.
1S. SUBJECT TERMS
High temperature materials, plasma testing, UHTC, laser diagnostics
16. SECURITY CLASSIFICATION OF: 17. LIMITATION OF
a. REPORT b. ABSTRACT c. THIS PAGE ABSTRACT
uu uu uu
18. NUMBER OF PAGES
87
19a. NAME OF RESPONSIBLE PERSON
Douglas G. Fletcher
19b. TELEPHONE NUMBER (Include area code)
Reset
802 656 9863
Standard Form 298 (Rev. 8/98) Prescribed by ANSI Std Z39 18
Adobe Professional 7.0
Doc. 12/UVM/AFOSR/ICP-02 Issue 1. Rev. 0 Date: February 21, 2012 page 1 of 5
University of Vermont Mechanical Engineering 201 Votey Bldg 33 Colchester Ave Burlington, VT 05405
Development of a 30 kW Inductively Coupled Plasma Torch Facility for
Advanced Aerospace Material Investigations

Doc. 12/UVM/AFOSR/ICP-02 Issue 1. Rev. 0 Date: February 21, 2012 page 2 of 5
CLASSIFICATION CATEGORY
1. Unclassified 2. Industry 3. Restricted 4. Confidential
1. For approval 2. For review 3. Other
University of Vermont CONFIGURATION Mechanical Engineering
Controlled Not Controlled
Agency
AFOSR
Program High Temperature Materials
Contract number: FA9550-08-1-0414
Period: 08/01/08 to 11/30/11
TITLE:
Development of a 30 kW Inductively Coupled Plasma Torch for Advanced Aerospace Material Investigations
AUTHOR(S):
D. G. Fletcher, J. M. Meyers, and W. P. Owens ISSUE. Date: February 21, 2012 Issue 1 Rev. 0.
Internal Reference Number 12/UVM/AFOSR/ICP-02
Number of pages: 22 Number of included annexes: 0
SUMMARY: This final report summarizes the work performed to develop and exploit a 30 kW Inductively Coupled Plasma (ICP) Torch Facility for high-temperature testing of aerospace materials at the University of Vermont during the period from August 1, 2008 to November 30, 2011. The objectives of this work are briefly revisited and the progress toward meeting the objectives is summarized by archival conference papers describing some of the material investigations that have been carried out. The conference papers are included as appendices. HOST SYSTEM
HARDWARE EQUIPMENT. Nature: Mac
MEDIA. Nature & Type: Identification:
SOFTWARE. Name: Microsoft Word 2010
KEY WORDS LANGUAGE CODE ENG
APPROVAL.
Plasma torch, ground test, high temperature, thermal protection material, laser diagnostics, heat flux
Laboratory: D. G. Fletcher

Doc. 12/UVM/AFOSR/ICP-02 Issue 1. Rev. 0 Date: February 21, 2012 page 3 of 5
I. Investigation Objectives…………………………………………………….. 4 Appendices: A. W. P. Owens et al, “Development of a 30 kW Inductively Coupled Plasma Torch
Facility for Aerospace Material Testing”, AIAA 2010-4322, June 2010. ……………………………………………………………………………………..6
B. J. Marschall and D. G. Fletcher, “High enthalpy test environments, flow modelling, and in situ diagnostics for characterizing ultra-high temprature ceramics”, JECS, 30, (2010), pp. 2323-2336 ……...……………………………21
C. D. G. Fletcher et al, “Realization of a Gas-Surface Interaction Test Case for CFD Validation”, AIAA 2010-1249, 48th AIAA Aerospace Sciences Meeting, January 2010……………………………………………………………………………...34
D. M. Dougherty, W. Owens, J. Meyers, and D. Fletcher, “Investigation of Surface-Catalyzed Recombination Reactions in the Mars Atmosphere”, AIAA 2011-1326, 49th AIAA Aerospace Sciences Meeting, January 2011…………………………53
E. A. Lutz, W. Owens, J. Meyers, D. G. Fletcher, and J. Marschall, “Investigation of CN Production from Carbon Materials in Nitrogen Plasmas”, AIAA 2011-0901, 49th AIAA Aerospace Sciences Meeting, January, 2011………………………..64
F. D. G. Fletcher, A. J. Lutz, J. M. Meyers, W. P. Owens, and J. Uhl, “Species and Temperature Gradient Measurements in the Reacting Boundary Layer over ICP Test Samples”, Proceedings of the 7th European Symposium on the Aerothermodynamics of Space Vehicles, ESA Special Publication SP-692, May, 2011……………………………………………………………………………...80

Doc. 12/UVM/AFOSR/ICP-02 Issue 1. Rev. 0 Date: February 21, 2012 page 4 of 5
I. Investigation Objectives
The overall goal of the 4-year research program was to develop a 30 kW ICP Torch Facility for testing advanced candidate thermal protection materials in a harsh plasma environment. The operating capabilities of such a facility were expected to included variable species plasmas and high surface temperatures for the materials.
The investigation had five specific objectives:
1. Design and develop a 30 kW ICP Torch Facility for material testing with advanced gas-phase and material diagnostic capabilities.
2. Evaluate operation of the 30 kW ICP Torch Facility by systematically varying its operational parameters and quantifying its performance.
3. Develop the instrumental and analytical tools needed to characterize the plasma conditions and to determine material catalytic efficiency values (including sample holder, heat flux and pitot probe(s) and optical pyrometry).
4. Demonstrate the capability of the 30 kW ICP Torch Facility by performing tests of material samples in concert with duplicate tests at VKI.
5. Implement advanced material and gas-phase diagnostics, including emission spectrometry for the material and the material boundary layer, and laser-spectroscopic techniques for measuring key species flux rates toward and away from the material surface during testing.
Progress in achieving these objectives is described in a series of peer-reviewed papers that are attached to this document as appendices. The first paper was presented at the AIAA Thermophysics Conference in June, 2010, and it details the key design features of the 30 kW ICP Torch Facility, the test conditions achieved, and the means by which the facility as finally made operational. Thus, it also addresses the third specific objective listed above. Efforts continue to improve test condition stability, and to provide higher heating rates and higher surface temperatures. This paper also addresses part of the second objective, although this is not complete owing to current component limitations. It should be noted that the facility was built, and then rebuilt a second time to obtain the current level of performance. The remaining papers present examples of material and gas-surface interaction investigations that highlight the unique features of the 30 kW ICP Torch Facility. The first of these is a survey of the state-of-the-art for laser diagnostics applied to gas-surface interactions. This paper was written for the 2009 UHTC Workshop and was subsequently published in the Journal of the European Ceramic Society. The subsequent paper presents a detailed numerical investigation of the effect of surface-catalyzed recombination reaction efficiency on atomic species diffusion gradients in the reacting, non-equilibrium boundary layer above the material surface. This paper was presented at the 48th AIAA

Doc. 12/UVM/AFOSR/ICP-02 Issue 1. Rev. 0 Date: February 21, 2012 page 5 of 5
Aerospace Sciences Meeting in January, 2010, and the study was linked to the state-of-the-art survey. The two following papers were presented at the January, 2011 49th AIAA Aerospace Sciences Meeting. The first describes a laser spectroscopic investigation of the species gradients over a copper surface for a carbon dioxide plasma. The second paper describes laser spectroscopic measurements used to evaluate carbon nitridation of graphite samples. In each case, the gradient in species distribution within the thermal boundary layer over the surface is used to assess the relative surface reaction rate. For the latter case, carbon nitridation, additional measurements were performed to obtain absolute species concentrations, and a rate for this reaction was elucidated from the measured values. This paper was presented at the 7th European Symposium on Aerothermodynamics of Space Vehicles in June, 2011.

1 of 15
American Institute of Aeronautics and Astronautics
Development of a 30 kW Inductively Coupled Plasma Torch
Facility for Aerospace Material Testing
W. P. Owens*, J. Uhl*, M. Dougherty*, A. Lutz*, Jason Meyers† and D. G. Fletcher‡
Mechanical Engineering, University of Vermont, Burlington, VT, 05405
Abstract
The development of a new 30 kW Inductively Coupled Plasma (ICP) Torch Facility for testing advanced
aerospace materials is presented. The design of the facility and the fabrication of the major system
components are described. Operating capabilities and results of the preliminary tests are discussed. A major
objective of the facility design was to enable spectroscopic diagnostic access to the reacting boundary layer
over the material surface.
Nomenclature
b = load coil radius, m
c = specific heat of slug, J Kg-1
K-1
δ = plasma skin thickness, m
f = frequency, Hz
l = overall load coil length, m
L = length of slug, m
μ = magnetic permeability, H m-1
N = number of load coil turns
P = stagnation pitot pressure, atm
q = heat flux, W cm-2
ρ = density of slug, Kg m-3
R = plasma radius, m
σ = electrical conductivity, S m-1
t = time, s
T = temperature, K
I. Introduction
30 kW inductively coupled plasma (ICP) torch facility has been designed and assembled at the University of
Vermont. An ICP torch is a device designed to heat gases to very high temperatures through electron excitation
and heavy particle collisions. The inductively coupled approach is attractive to applications where a clean and stable
source of plasma is essential. The facility will test advanced aerospace materials for thermal protection of
hypervelocity vehicles.
Although inductive discharges have been studied for over a century, ICP torch facilities have not been extensively
developed in the U.S. to simulate the aero-thermal environments needed for the development of thermal protection
materials. Typical applications of ICP technology include synthesis of fine powders, spectrochemical elemental
analysis as well as other large scale industrial applications. Current US facilities designed for aerospace applications
use arc heaters, which rely on a direct arc discharge to produce a plasma. Owing to the attachment of the arc to
electrodes, arc-heated facilities tend to have electrode material in the stream as a contaminant. Arc-heated facilities
tend to be expensive to operate. For either type of plasma facility, stagnation point test conditions for materials are
based on duplicating total enthalpy, post shock total pressure and the velocity gradient from the hypersonic flight
environment.
In the following sections the design and fabrication of each different subsystem is described in detail. This is
followed by a discussion of the standard instruments that have been developed to characterize facility operation.
Data from these measurements are presented and are used to assess whether or not the facility design criteria are
met.
_________________________________
*Graduate student, Mechanical Engineering, 33 Colchester Ave, Burlington, VT 05405 USA
†Post-doctoral researcher, Mechanical Engineering, 33 Colchester Ave, Burlington, VT 05405 USA, Member AIAA
‡Professor, Mechanical Engineering, 33 Colchester Ave, Burlington, VT 05405 USA, Associate Fellow AIAA
A
2 of 15
American Institute of Aeronautics and Astronautics
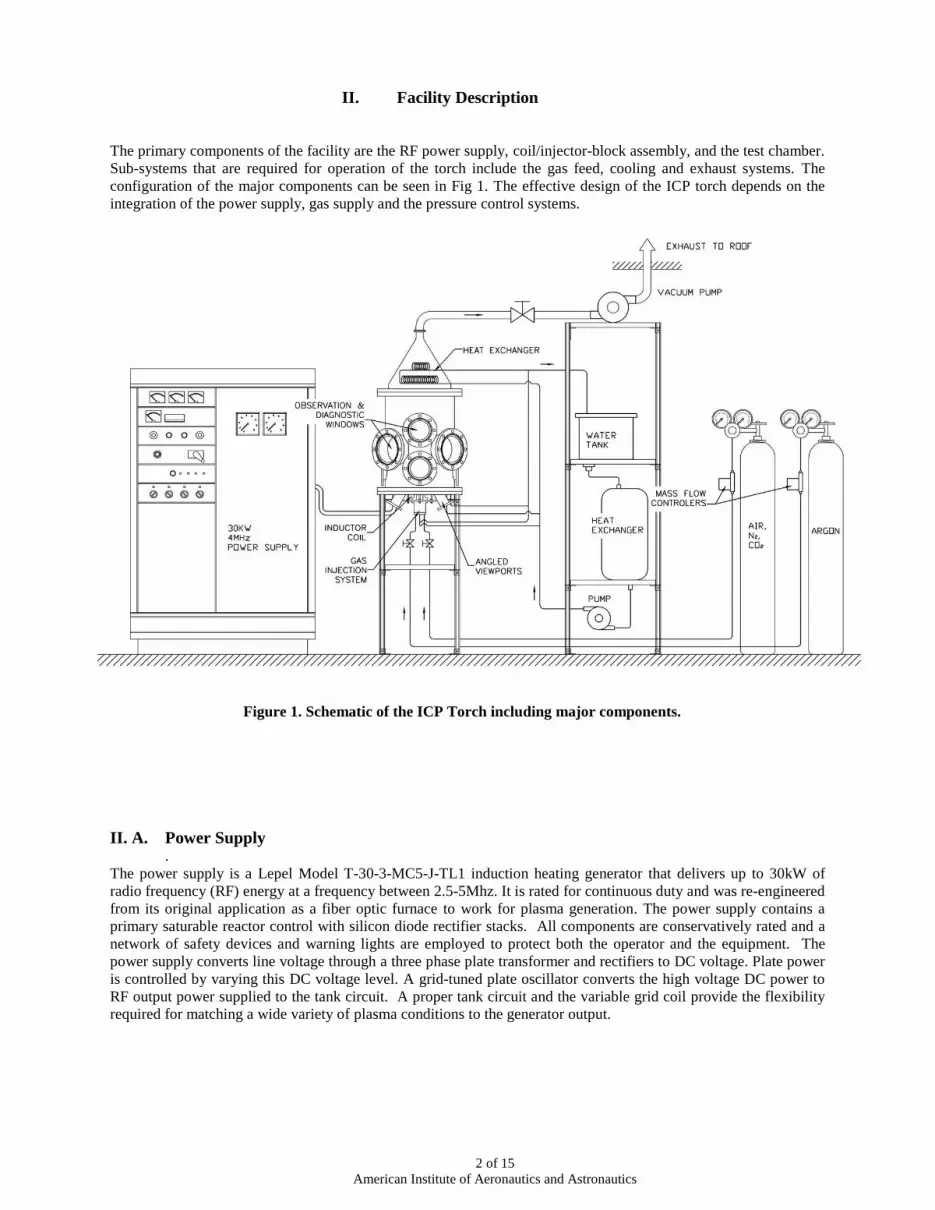
II. Facility Description
The primary components of the facility are the RF power supply, coil/injector-block assembly, and the test chamber.
Sub-systems that are required for operation of the torch include the gas feed, cooling and exhaust systems. The
configuration of the major components can be seen in Fig 1. The effective design of the ICP torch depends on the
integration of the power supply, gas supply and the pressure control systems.
II. A. Power Supply .
The power supply is a Lepel Model T-30-3-MC5-J-TL1 induction heating generator that delivers up to 30kW of
radio frequency (RF) energy at a frequency between 2.5-5Mhz. It is rated for continuous duty and was re-engineered
from its original application as a fiber optic furnace to work for plasma generation. The power supply contains a
primary saturable reactor control with silicon diode rectifier stacks. All components are conservatively rated and a
network of safety devices and warning lights are employed to protect both the operator and the equipment. The
power supply converts line voltage through a three phase plate transformer and rectifiers to DC voltage. Plate power
is controlled by varying this DC voltage level. A grid-tuned plate oscillator converts the high voltage DC power to
RF output power supplied to the tank circuit. A proper tank circuit and the variable grid coil provide the flexibility
required for matching a wide variety of plasma conditions to the generator output.
Figure 1. Schematic of the ICP Torch including major components.

3 of 15
American Institute of Aeronautics and Astronautics
The tank circuit allows coupling between
the power supply and the plasma to
provide efficient energy transfer. To
optimize energy transfer the tank circuit
must be designed in such a way to match
the impedance of the power supply with
the equivalent impedance of the plasma.
The impedance for both the power supply
and plasma gas can be found and
matched with the theory that the plasma
can be viewed as a transformer in short
circuit. The impedance of the tank circuit
is a function of the capacitance, inductance, and resistance. Impedance of the plasma ball can be determined from
the coil geometry and gas characteristics, such as the electrical conductivity. The equivalent plasma resistance and
inductance can be calculated using Eq (1) and Eq (2) respectively1.
(1)
(2)
Where the skin thickness δ is calculated using Eq (3).
(3)
A functional parallel tank circuit was developed experimentally with a combination of removable vacuum capacitors
and fixed air inductors. The current tank circuit wiring diagram can be seen in Fig 2. Because electrical conductivity
of the plasma is changing with conversion of gases, the impedance is also changing. This requires the ability to vary
the impedance of the tank circuit. Variable grid control is combined with adjustable capacitance to accommodate the
different plasma conditions with different gases.
II. B. Plasma Generation Components
The creation of the plasma occurs inside the induction region of the
torch. There are three major components of the plasma creation,
the coil, confinement tube and the gas injection system. Creation of
a plasma can be seen in Fig 3. The fundamental phenomena
governing the operation of inductively coupled plasmas are
essentially analogous to those of the induction heating of metals
with the “load” now being the conducting plasma gas. Unlike most
metals, plasmas have a substantially lower electrical conductivity,
which has a direct influence on the optimal frequency, size, and
power combination, necessary to sustain a stable plasma
The plasma is generated through an induced RF magnetic field
created by a helical load coil. Coils with 5 or 6 turns have proven
to work best with our power supply. The coil geometry is designed
to maximize the power into the plasma and enhance coupling
efficiency. The coil is made of 6mm outer diameter copper and
cooled with internal circulation of water flow from the power
supply.
Figure 3. Photograph of the induction
region of the plasma torch with a 5 turn
load coil and modified base plate
Figure 2. Tank circuit configuration
4 of 15
American Institute of Aeronautics and Astronautics
The ideal coil diameter is equivalent to that of the plasma diameter, however physical constraints determine the
minimum offset of the load coil. A close proximity to the confinement tube contributes to more efficient coupling.
Conversely, if the coil is too close to the quartz tube it will arc with increasing power.
The spacing between each turn of the coil was designed to maximize the concentration of the induced magnetic field
by making them as close as possible without making the gap so small that it will arc to the next coil. Coil height is
set as close as possible to the injector block without arcing and without overheating the bottom o-ring that seals the
injector block to the quartz tube. This takes advantage of the recirculation zone produced by the annular region of
the injector block. It also maximizes the impact of a sheath gas, which actively cools the quartz tube from the
plasma ball. Leads to the coil are kept short to limit transmission loss as well as to dampen vibration. The coil,
quartz tube, and o-rings are currently viewed as consumables with a limited operating life but great measures have
been taken to increase the time between replacements.
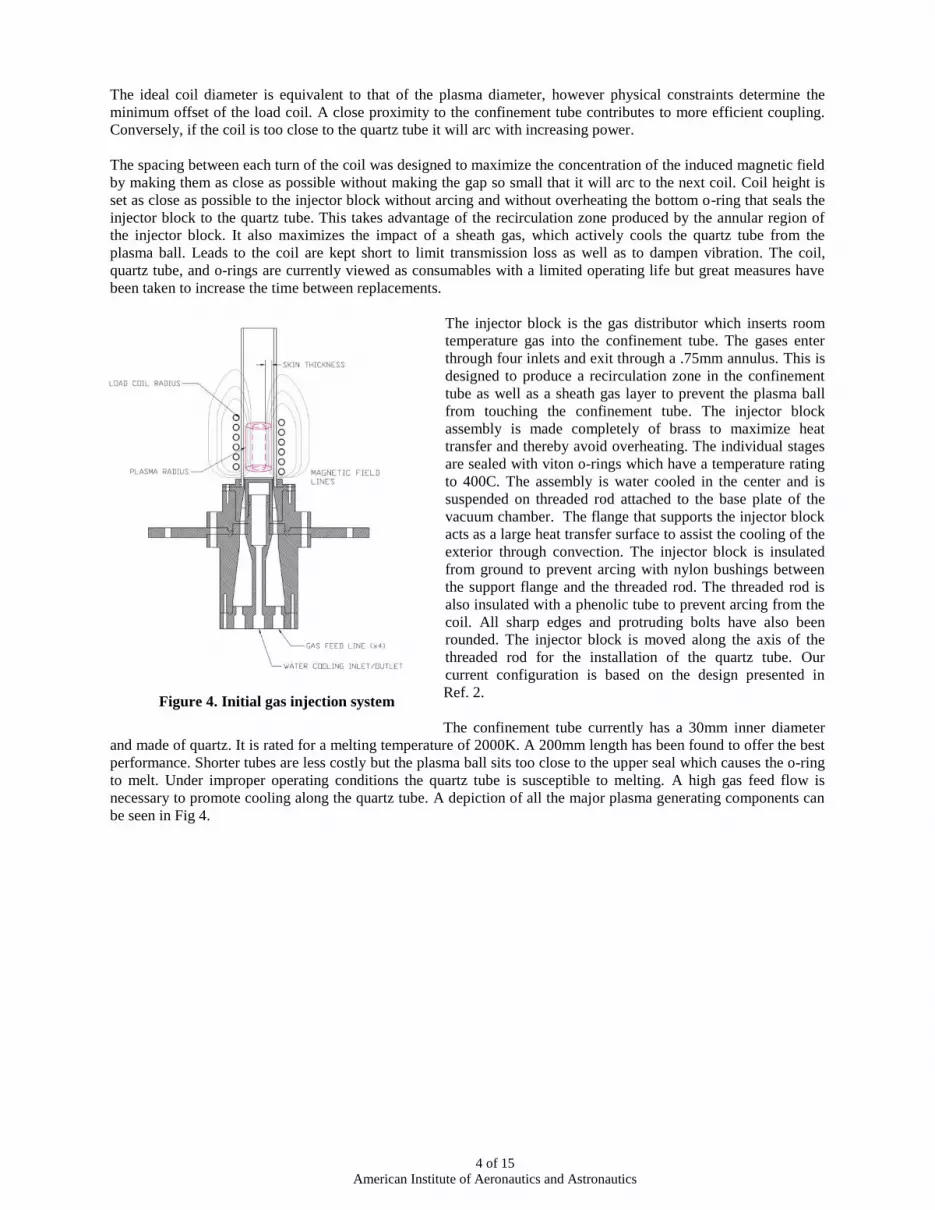
The injector block is the gas distributor which inserts room
temperature gas into the confinement tube. The gases enter
through four inlets and exit through a .75mm annulus. This is
designed to produce a recirculation zone in the confinement
tube as well as a sheath gas layer to prevent the plasma ball
from touching the confinement tube. The injector block
assembly is made completely of brass to maximize heat
transfer and thereby avoid overheating. The individual stages
are sealed with viton o-rings which have a temperature rating
to 400C. The assembly is water cooled in the center and is
suspended on threaded rod attached to the base plate of the
vacuum chamber. The flange that supports the injector block
acts as a large heat transfer surface to assist the cooling of the
exterior through convection. The injector block is insulated
from ground to prevent arcing with nylon bushings between
the support flange and the threaded rod. The threaded rod is
also insulated with a phenolic tube to prevent arcing from the
coil. All sharp edges and protruding bolts have also been
rounded. The injector block is moved along the axis of the
threaded rod for the installation of the quartz tube. Our
current configuration is based on the design presented in
Ref. 2.
The confinement tube currently has a 30mm inner diameter
and made of quartz. It is rated for a melting temperature of 2000K. A 200mm length has been found to offer the best
performance. Shorter tubes are less costly but the plasma ball sits too close to the upper seal which causes the o-ring
to melt. Under improper operating conditions the quartz tube is susceptible to melting. A high gas feed flow is
necessary to promote cooling along the quartz tube. A depiction of all the major plasma generating components can
be seen in Fig 4.
Figure 4. Initial gas injection system
5 of 15
American Institute of Aeronautics and Astronautics
Figure 6. Schematic of the revised base plate to
increase cooling and allow for the use of multiple
sized quartz tubes
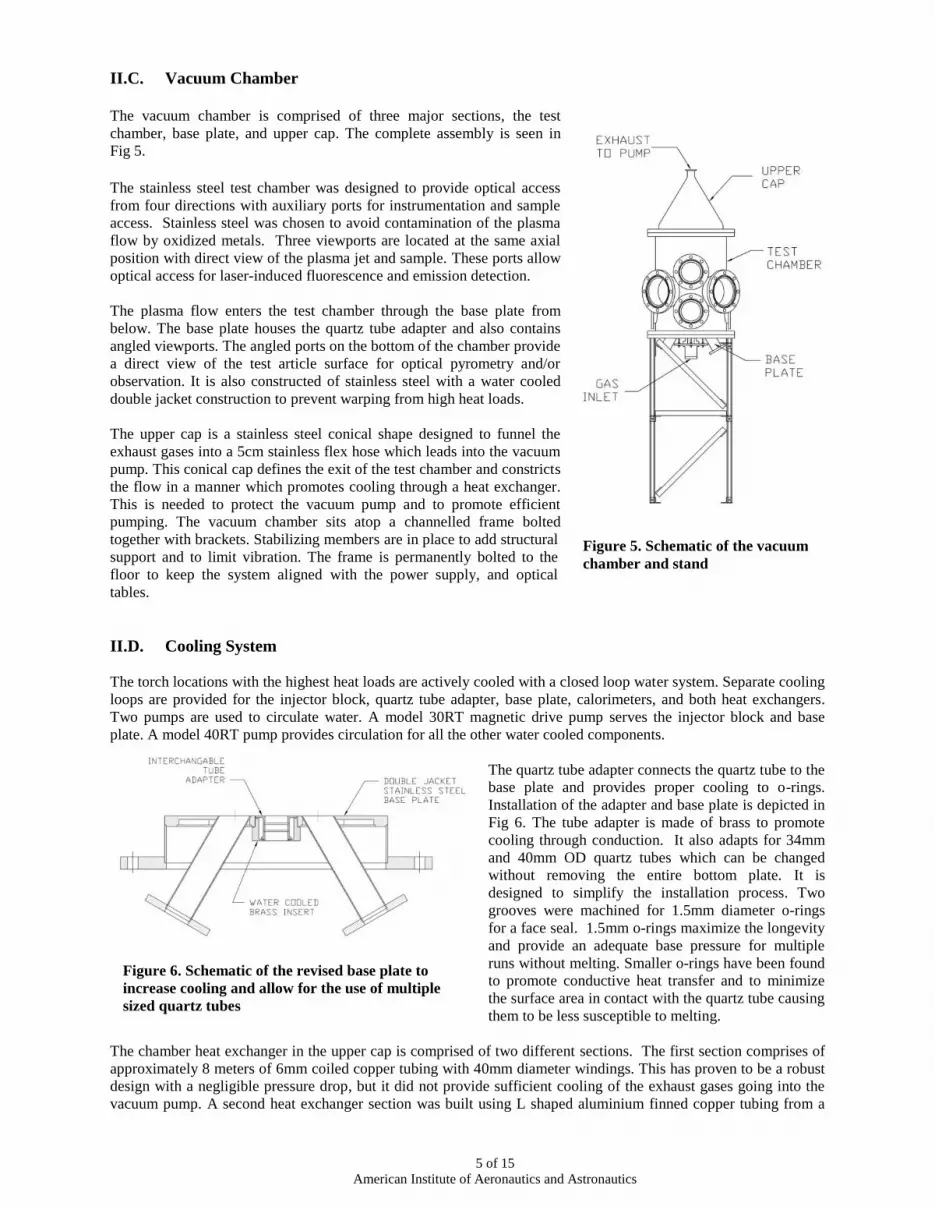
II.C. Vacuum Chamber
The vacuum chamber is comprised of three major sections, the test
chamber, base plate, and upper cap. The complete assembly is seen in
Fig 5.
The stainless steel test chamber was designed to provide optical access
from four directions with auxiliary ports for instrumentation and sample
access. Stainless steel was chosen to avoid contamination of the plasma
flow by oxidized metals. Three viewports are located at the same axial
position with direct view of the plasma jet and sample. These ports allow
optical access for laser-induced fluorescence and emission detection.
The plasma flow enters the test chamber through the base plate from
below. The base plate houses the quartz tube adapter and also contains
angled viewports. The angled ports on the bottom of the chamber provide
a direct view of the test article surface for optical pyrometry and/or
observation. It is also constructed of stainless steel with a water cooled
double jacket construction to prevent warping from high heat loads.
The upper cap is a stainless steel conical shape designed to funnel the
exhaust gases into a 5cm stainless flex hose which leads into the vacuum
pump. This conical cap defines the exit of the test chamber and constricts
the flow in a manner which promotes cooling through a heat exchanger.
This is needed to protect the vacuum pump and to promote efficient
pumping. The vacuum chamber sits atop a channelled frame bolted
together with brackets. Stabilizing members are in place to add structural
support and to limit vibration. The frame is permanently bolted to the
floor to keep the system aligned with the power supply, and optical
tables.
II.D. Cooling System
The torch locations with the highest heat loads are actively cooled with a closed loop water system. Separate cooling
loops are provided for the injector block, quartz tube adapter, base plate, calorimeters, and both heat exchangers.
Two pumps are used to circulate water. A model 30RT magnetic drive pump serves the injector block and base
plate. A model 40RT pump provides circulation for all the other water cooled components.
The quartz tube adapter connects the quartz tube to the
base plate and provides proper cooling to o-rings.
Installation of the adapter and base plate is depicted in
Fig 6. The tube adapter is made of brass to promote
cooling through conduction. It also adapts for 34mm
and 40mm OD quartz tubes which can be changed
without removing the entire bottom plate. It is
designed to simplify the installation process. Two
grooves were machined for 1.5mm diameter o-rings
for a face seal. 1.5mm o-rings maximize the longevity
and provide an adequate base pressure for multiple
runs without melting. Smaller o-rings have been found
to promote conductive heat transfer and to minimize
the surface area in contact with the quartz tube causing
them to be less susceptible to melting.
The chamber heat exchanger in the upper cap is comprised of two different sections. The first section comprises of
approximately 8 meters of 6mm coiled copper tubing with 40mm diameter windings. This has proven to be a robust
design with a negligible pressure drop, but it did not provide sufficient cooling of the exhaust gases going into the
vacuum pump. A second heat exchanger section was built using L shaped aluminium finned copper tubing from a
Figure 5. Schematic of the vacuum
chamber and stand

6 of 15
American Institute of Aeronautics and Astronautics
baseboard heating element. This provides efficient cooling but for higher pressures and higher power the un brazed
fins exhibited failure. A replacement section with 6mm brazed copper fins is being developed.
A rooftop chiller circulates glycol from the roof to the lab. It provides cooling to the power supply and to a glycol /
water heat exchanger. This chiller was designed for a 24kW capacity. The glycol is continuously circulated through
a bypass valve until needed during the operation of the facility.
The glycol / water heat exchanger provides cooling to the torch water cooling system. It is used to regulate the
temperature of the cooling system. The temperature is typically maintained at ± 3 degrees C of room temperature. If
the temperature rises too high it might not provide adequate cooling of the torch and if it drops too low condensation
will collect on the system and may cause damage to the electrical components. The water reservoir allows for water
to be drained or filled for the water cooling system. The heat exchanger can be seen in Fig. 1 located above the
pumps to provide adequate head to prime them. The additional water in the reservoir increases the thermal mass of
the system and helps to keep the water at a stable temperature. The large volume of water allows the torch to be run
at operating conditions for over 5 minutes without the rooftop chiller, while keeping the water at a safe operating
temperature. The average operating temperature of the cooling system is measured in the water reservoir.
II.E Exhaust and Pressure Control
The flow exits the vacuum chamber to an elevated vacuum pump, which exhausts into a ventilated duct terminating
on the roof. The vaccum pump is connected to the chamber with KF-flanges through a flexible tube on the top of
the upper cap. The vacuum pump was sized with the capability of reaching a base pressure in the test chamber of 0.2
torr. It allows the proper range of desirable pressures for start up and test conditions. A gate valve controls the
pressure inside the test chamber. It is necessary to vary the pressure from initiation of the plasma ball to conversion
to the test gas and to achieve desirable operating conditions. A refurbished 5cm inner diameter knobbed gate
controls the chamber pressure for operation at the required pressure.
II.F. Gas Feed
The gas that enters the vacuum chamber is from tanks fixed securely to the wall out of the way of the optical and
torch components. The gas tanks contained argon, nitrogen, carbon dioxide and air (N2, O2 mixture). Each tank has a
regulator and an auxiliary shut off valve. Poly tubing connects the tanks to a stainless steel manifold. Two separate
stainless steel lines are used to bring gases to the injector block to limit contamination. A 10mm diameter line
provides the argon start gas to the facility, and the larger 13mm line carries the pre-mixed gases for the plasma test.
All connections were made with Swagelock fittings. All gas feed lines have mass flow meters/controllers to allow
for appropriate gas mixtures. The mass flow meters operate from 0 to 50 slpm for argon and 0 to 50 slpm for the test
gas. The gas flow rate is changed with two gate valves. Initial operation has relied on gate valve control of mass
flow but for future operation precise flow rates will be preset on the controllers.
III. Probe and Sample Holder Access
Two ports on the vacuum chamber are designated for probe insertion in and out of the plasma flow. Two probes
were developed to allow multiple diagnostics to be performed during the same test run by inserting and removing
each probe individually. Each probe was designed to mount interchangeable diagnostic equipment and test samples.
The different probes are each described in the following sections.
III.A. Gooseneck Probe
A temporary copper probe was designed and built to take initial measurements while another probe was being
engineered for more permanent usage. The objective of the probe was to be built quickly and cheaply. The probe is
made of sweat copper tubing with internal plumbing providing water cooling throughout. This design has proven to
withstand the intense heat loads without leaking or becoming damaged. It has an internal vacuum-sealed tube that
allows thermocouple leads to be easily wired to the head of the probe. Its gooseneck design allows the probe to be
swung in and out the direct plasma flow by rotating the probe externally of the vacuum chamber as seen in Fig. 7.

7 of 15
American Institute of Aeronautics and Astronautics
Figure 7. Pictures of inside the vacuum chamber with the gooseneck probe removed from the plasma flow
(left) and in the stagnation point configuration for data collection (right)
Limitations of this probe include its inability to be easily disassembled if it ever needs to be modified. It must be
completely removed from the torch to interchange the diagnostics at the head of the probe. Its vertical height in the
flow cannot be changed while a vacuum is present. Another concern is the probe only allows for limited cooling
through conduction to the diagnostic apparatus causing them be damaged with prolonged exposure to the direct
plasma flow. Fortunately this simple design has shown to be very robust, require little care, and exceed the
requirements for initial tests.
III.B. Machined Brass Probe / Sample Holder
This design incorporates the use of three concentric tubes to provide
water cooling and to allow for instrument or thermocouple leads to
reach a sample or calorimeter. Attached to the front adapter is a cup
segment that will hold the material samples. This cup segment has
an insulating feature and has specific channelling features that allow
for the reversal of the water flow. The holder is designed in such a
way as to provide an effective, yet simple fastening mechanism that
allows its users to easily take apart and reattach the sample holder.
This probe/sample holder has
an adjustable, external support
apparatus, which allows
horizontal and vertical
movement. A series of five
compressed plates, a screw,
and a hand crank to provide
the capacity for vertical
movement. Compression of
the plates for sealing is
provided by a series of bolts
that connect the plates. This
design allows for the
external apparatus to be
adjusted while maintaining a
constant pressure in the
actual plasma chamber.
The mount also has a hinged section that allows easy opening and closure,
making the set up and adjustment of the material sample on the end of the
probe relatively simple.
Figure 8. Photo of the machined brass
probe holding a graphite sample in a
argon/carbon dioxide flow
Figure 9. Photo of the probe
and opened external support
apparatus

8 of 15
American Institute of Aeronautics and Astronautics
III.C. Optical Access
The test chamber was designed with optical access for spectroscopic measurements, as shown below in Fig. 10 for a
typical Laser-Induced Fluorescence (LIF) configuration. The four lower ports on the chamber are arranged
orthogonally, with two for laser beam access and one for fluorescence imaging. All ports accommodate 15 cm
windows, and the two laser access windows are coated with a broad uv anti-reflection coating to minimize scattered
light. The detection port has an uncoated 15 cm diameter window, and all windows are fused silica. To help reduce
stray light, the port opposite the detection side is covered by a stainless steel flange that contains bulkhead fittings
for additional cooling as needed within the chamber. Additional spectroscopic instruments that are being
implemented in the facility include a diode-laser absorption system and an emission spectrometer. Details of the
laser spectroscopic instrument implementation in this are presented in Ref. 3.
Figure 10. Optical access for spectroscopic measurements

9 of 15
American Institute of Aeronautics and Astronautics
IV. Facility Characterization
The 30 kW ICP Torch Facility currently provides
usable operating conditions and its capabilities are
continuously being improved; including its run
duration, peak heat flux, operational gas composition
and pressure range. The completely assembled torch is
shown in Fig. 11. Preliminary tests have been
conducted for a limited range of conditions for
different gases including: argon (100%), air (100%),
nitrogen (100%), carbon dioxide and variable mixtures
with argon.
A typical operation always starts with argon at a low
pressure of less than 10 torr. Argon is easily ignited
and then the flow rate and pressure are immediately
increased to prevent damage to the induction region of
the torch. A 100% argon plasma can be seen in Fig 12.
The test gas is then slowly added to the flow as the
power is increased. The ability to carefully control the
flow rates is essential for initiation of the argon
plasma and conversion to the test gas. An air/argon
plasma can be seen in Fig 12. Once the test gas is
added, the argon is slowly removed until the desired
flow rate is achieved. Typically a small flow rate of
argon is kept on to improve the stability of the plasma
and allow for continuous operation of the torch.
Complete removal of argon is possible at our facility
but run time and control is limited. A 100% nitrogen
plasma can be seen in Fig 17. Our current ICP torch
capabilities can be seen in Table 1.
Figure 11. A picture of the completely assembled
ICP Torch. The installation of initial diagnostic
equipment can be seen
Figure 12. Photograph of a graphite sample in an; argon plasma (left), air/argon plasma mixture (right)

10 of 15
American Institute of Aeronautics and Astronautics
Ablation of graphite test samples as well as a virgin
sample can be seen in Fig 13. Samples labelled 1
through 4 were exposed to increasing durations of an
air plasma flow in a stagnation point configuration.
Sample 5 is a virgin nitrogen sample housed inside a
machined ceramic insulator. Air samples are thicker
due to the more rapid ablation of the surface.
Improvements to the torch include increased cooling to
high heat load locations to increase run duration. The
base plate was redesigned and a more efficient heat
exchanger is in the process of being built. The tank
circuit and load coil designs are continuously being
optimized for the test gas to provide more efficient
energy transfer into the plasma.
______________________________________________________________________________
Max Run Time: 6 min. with manual shut down
Max Recorded Heat Flux: 85 W cm-2
(Slug)
Max Graphite Surface Temperature: 2123 K
Max Operating Chamber Pressure: 180 torr
Gas Composition: Ar, Air, N2, and CO2 mixtures
Operating Frequency: 2.7 MHz
__________________________________________________________________________________
Figure 13. Graphite samples with varying exposures to air
and nitrogen flows
Table 1. Current capabilities of the ICP Torch at UVM

11 of 15
American Institute of Aeronautics and Astronautics
IV.A. Surface Temperature Measurements
A Marathon two-color infrared optical pyrometer is used to measure surface
temperatures on test samples. Surface temperature provides a direct measure
of the performance of the test material exposed to the plasma flow. The
pyrometer is installed with a direct view of the leading surface through an
angled viewport on the base plate. The device that is used for our application
is a two color close focus pyrometer with a temperature range from 1000 to
3000 degrees C. The two color mode determines the temperature from the
ratio of two separate and overlapping infrared bands. This device is best for
measuring temperatures of partially obscured objects through viewing
windows that reduce energy.
Currently, the ICP torch is capable
of producing surface temperatures of
over 1800 degrees C with air
plasmas. These temperature values were measured on graphite which has a reliable emissivity value of ~.9 (Ref. 4).
In the original configuration of the sample holder, there is no insulating piece between the water cooled copper
holder and the graphite sample. Graphite has a very high thermal conductivity, so a significant amount of energy is
being transferred to the cooled holder by conduction. In fact, the cooling water was boiling in the sample holder at
these test conditions. From Fig. 15 it can be seen that the torch is capable of sustaining a steady high temperature
operating condition. The dynamic start up and shut down can be seen at the beginning and end of the plot. The
surface temperature appears to drift up over time which is due to a slow increase in chamber pressure.
Nevertheless, one can calculate a lower bound on the
convective heat flux assuming radiative equilibrium
conditions and neglecting the conduction loss, which
gives a value of approximately 70 W cm-2
for the peak
surface temperature of the test performed in Fig. 16.
Figure 15. Graphite surface temperature measured by the two-color
IR pyrometer during an air plasma test.
Figure 14. Schematic of the
pyrometer view of the sample
through the angled viewports
Figure 16. Graphite sample in 100% nitrogen
plasma at 100 torr

12 of 15
American Institute of Aeronautics and Astronautics
IV.B. Slug Calorimeter Heat Flux Measurements
A thermal capacitance calorimeter is used to measure the stagnation region heat transfer rate produced by the
plasma. The calorimeter is used for the purpose of calibrating the thermal environment into which test specimens are
placed for evaluation. The technique assumes one-dimensional heat conduction into a cylindrical piece of material
(slug) with known physical properties. Using the temperature-time curve recorded by a back-face thermocouple, and
knowing the slug’s dimensions and material properties, the heat flux can be calculated. Compared to other heat flux
measuring devices, slug calorimeters are simple to fabricate, inexpensive and easily installed since they are not
water-cooled. The primary disadvantages are its short lifespan and relatively long cool down time after exposure to
the plasma flow5.
The slug device is illustrated schematically in Fig. 17. The apparatus
shown is the current design of the slug calorimeter used in the UVM
30kW ICP Torch Facility. Velocity gradients must be matched, so the
brass body of the calorimeter is configured with the same size and shape
as that used for the ablation test samples to establish equivalent flow and
experimental conditions. The slug is made of oxygen-free high-
conductivity copper that is ultra-pure (99.99%) and is polished on the
front face. Copper was chosen because its high thermal conductivity will
minimize required exposure times for a linear thermocouple
measurement. In addition copper is known to provide a high rate of
surface-catalyzed recombination, which allows a measurement of the
fully-catalytic heat flux. The copper slug is held in place by compressing
the Teflon insulating ring when the brass body is bolted together. An
annular air gap and Teflon insulator serve to minimize heat transfer to or
from the body of the calorimeter, thus promoting one-dimensional heat
transfer. Teflon was chosen because of its relatively high melting point
and low thermal diffusivity. The air gap was limited to .05mm to reduce
pressure variations across the face of the calorimeter that might cause
flow in and out of the gap. A thermocouple is mechanically fixed to the
back face of the copper slug and linked to a computer based data
acquisition system. The brass body is conduction cooled from intimate
contact with the water cooled probe and is attached using 3 set screws.
The steady state heat transfer rate is derived from the heat equation. Assuming only 1-D heat transfer along the axis,
a steady heat flux on the front face, insulated boundary conditions on the back face, and a constant temperature
initial condition, the heat equation can be reduced to Eq. 5.
(4)
Slug calorimeter data were collected for the present range of torch operation. A plot of a typical run can be seen in
Fig. 18. The start-up and shut-down of the torch can be identified as well as the entry and exit of the calorimeter into
the plasma flow. The exposure to the plasma flow is seen as the sharp increase in the slug back-face thermocouple
reading. The slope of the temperature-time curve can be extracted from the plot. The initial and final temperature
transient effects must be eliminated by using only the linear portion of the curve for the heat flux calculations.
Figure 17. Schematic of the copper
slug calorimeter
13 of 15
American Institute of Aeronautics and Astronautics
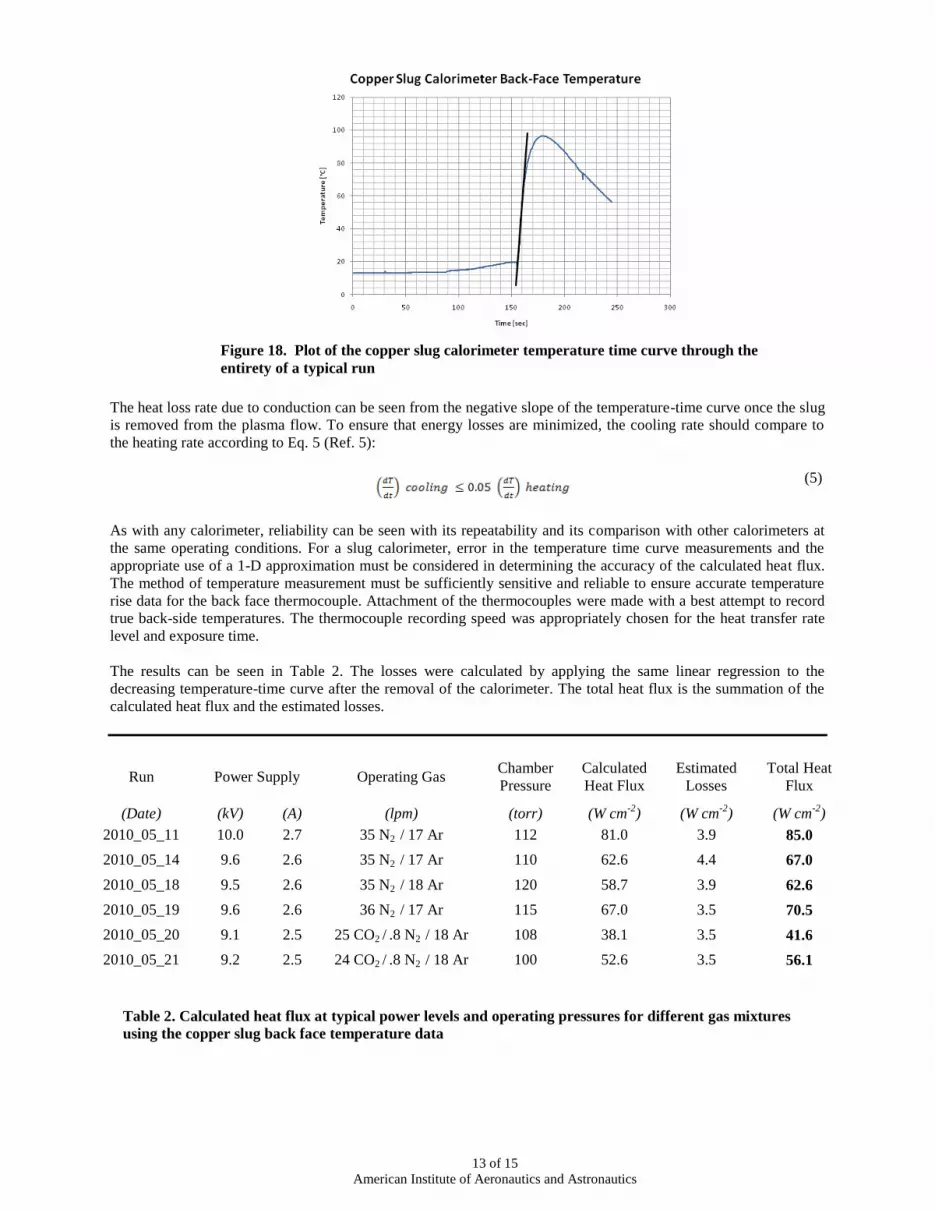
The heat loss rate due to conduction can be seen from the negative slope of the temperature-time curve once the slug
is removed from the plasma flow. To ensure that energy losses are minimized, the cooling rate should compare to
the heating rate according to Eq. 5 (Ref. 5):
(5)
As with any calorimeter, reliability can be seen with its repeatability and its comparison with other calorimeters at
the same operating conditions. For a slug calorimeter, error in the temperature time curve measurements and the
appropriate use of a 1-D approximation must be considered in determining the accuracy of the calculated heat flux.
The method of temperature measurement must be sufficiently sensitive and reliable to ensure accurate temperature
rise data for the back face thermocouple. Attachment of the thermocouples were made with a best attempt to record
true back-side temperatures. The thermocouple recording speed was appropriately chosen for the heat transfer rate
level and exposure time.
The results can be seen in Table 2. The losses were calculated by applying the same linear regression to the
decreasing temperature-time curve after the removal of the calorimeter. The total heat flux is the summation of the
calculated heat flux and the estimated losses.
Run Power Supply Operating Gas Chamber
Pressure
Calculated
Heat Flux
Estimated
Losses
Total Heat
Flux
(Date) (kV) (A) (lpm) (torr) (W cm-2
) (W cm-2
) (W cm-2
)
2010_05_11 10.0 2.7 35 N2 / 17 Ar 112 81.0 3.9 85.0
2010_05_14 9.6 2.6 35 N2 / 17 Ar 110 62.6 4.4 67.0
2010_05_18 9.5 2.6 35 N2 / 18 Ar 120 58.7 3.9 62.6
2010_05_19 9.6 2.6 36 N2 / 17 Ar 115 67.0 3.5 70.5
2010_05_20 9.1 2.5 25 CO2 / .8 N2 / 18 Ar 108 38.1 3.5 41.6
2010_05_21 9.2 2.5 24 CO2 / .8 N2 / 18 Ar 100 52.6 3.5 56.1
Table 2. Calculated heat flux at typical power levels and operating pressures for different gas mixtures
using the copper slug back face temperature data
Figure 18. Plot of the copper slug calorimeter temperature time curve through the
entirety of a typical run

14 of 15
American Institute of Aeronautics and Astronautics
V. Summary and Future Work
The design, construction and operation of the 30kW ICP Torch Facility at the University of Vermont have been
presented. Detailed descriptions of the facility subsystems were discussed and shortcomings were noted. Heat flux
and graphite surface temperature measurements from facility tests were also presented for a number of different test
cases using a range of gas mixtures.
Future work will include further optimization of the tank circuit, integration of the gas and material diagnostics, and
performance of aerospace material tests.
VI. Acknowledgements
This work was supported by AFOSR Grant #FA 9550-08-1-0414.
VII. References
1Lieberman, M. A., and Lichtenberg, A. J., Principles of Plasma Discharges and Material Processing, John Wiley &
Sons, New York, 1994, Chap. 12.
2Playez, M., “Titan Atmosphere Plasma Characterization Using Spectroscopic Measurement Techniques,” Ph.D.
Dissertation, Ecole Centrale. Paris, Laboratoire D’Energetique Moleculaire et Macroscopique Combustion, June 2006
3Meyers, J., and all, “Laser Spectroscopic Investigation of Surface-Catalyzed Reactions for Mars Exploration
Vehicles,” The University of Vermont, Burlington, Vermont, 2010
4Vancrayenest, B., “Heat Flux and Surface Temperature Measurements in High Enthalpy Plasma Flows,” von Karmin
Institute for Fluid Dynamics, Belgium, 2002.
5“Standard Test Method for Measuring Heat-Transfer Rate Using a Thermal Capacitance (Slug) Calorimeter,” ASTM.
6Tobin, C., and Uhl, J., “Hypersonic Plasma Probe,” The University of Vermont, Burlington, Vermont, 2009

15 of 15
American Institute of Aeronautics and Astronautics
VIII. Appendix

This article appeared in a journal published by Elsevier. The attachedcopy is furnished to the author for internal non-commercial researchand education use, including for instruction at the authors institution
and sharing with colleagues.
Other uses, including reproduction and distribution, or selling orlicensing copies, or posting to personal, institutional or third party
websites are prohibited.
In most cases authors are permitted to post their version of thearticle (e.g. in Word or Tex form) to their personal website orinstitutional repository. Authors requiring further information
regarding Elsevier’s archiving and manuscript policies areencouraged to visit:
http://www.elsevier.com/copyright

Author's personal copy
Available online at www.sciencedirect.com
Journal of the European Ceramic Society 30 (2010) 2323–2336
High-enthalpy test environments, flow modeling andin situ diagnostics for characterizing
ultra-high temperature ceramics
Jochen Marschall a,∗, Douglas G. Fletcher b
a SRI International, 333 Ravenswood Avenue, Menlo Park, CA 94025, USAb University of Vermont, 201 Votey Hall, 33 Clochester Avenue, Burlington, VT 05405, USA
Available online 19 February 2010
Abstract
Ultra-high temperature ceramic materials and composites under development as nose-tip and wing leading edge components for hypersonic flightvehicles must operate in extreme aerothermal heating environments. The performance of ultra-high temperature ceramics for this application isultimately evaluated using high-enthalpy, long duration flow facilities that simulate the reactive gas environment encountered in hypersonic flight.In this paper, we describe the test environments generated by two types of these ground test facilities – subsonic inductively coupled plasmatunnels and supersonic arc-jet tunnels – and discuss the important roles of computational fluid dynamics modeling and in situ optical diagnosticsfor interpreting test results from a materials science perspective.© 2010 Elsevier Ltd. All rights reserved.
Keywords: Ultra-high temperature ceramics; Borides
1. Introduction
Transition metal borides and carbides, as well as theircomposites with various sintering aids and glass formers, are col-lectively known as ultra-high temperature ceramics (UHTCs).The field of UHTC research has expanded substantially overthe last decade, motivated by the unique potential of theseceramics for applications in extreme high-temperature, reac-tive environments.1,2 A central driver for UHTC research isthe need for sharp leading edge and control surface compo-nents for future generations of hypersonic flight vehicles.3–5
Sharp leading edges enable vehicles with flight performanceat hypersonic speeds (e.g., maneuverability, extended cross-range capability) that cannot be achieved with blunt bodydesigns.6,7 The main hurdle for sharp vehicle designs is thesevere aerothermal heating environment that acts on sharp lead-ing edges. The concentrated combination of high temperatureand aggressive chemistry causes most materials to fail by melt-
∗ Corresponding author. Tel.: +1 650 859 2667; fax: +1 650 859 6196.E-mail address: [email protected] (J. Marschall).
ing, vaporization/sublimation, oxidation, ablation, spalling, orsome combination of these processes.
While a battery of conventional mechanical and thermal testsaid in the development of UHTC materials, the performanceof UHTCs intended for leading edge applications must ulti-mately be demonstrated in a representative aerothermal testenvironment. Such test environments are provided by arc-jetor inductively coupled plasma (ICP) wind tunnels which exposetest articles to high-enthalpy reactive gas flows. Tests of UHTCmaterials in arc-jet facilities have been reported in the scientificliterature by Kaufman,3 Metcalfe et al.,8 Wuchina and Opeka,9
Opila et al.,10 Gasch et al.,11 Chamberlain et al.,12 Savino etal.,13 Monteverde and Savino,14 and Zhang et al.15 Tests ofUHTC materials in ICP facilities have been reported by Ito etal.,16 Marschall et al.,17 and Playez et al.18
In this paper we discuss the test environments provided bythese two types of plasma wind tunnel facilities. We highlightthe coupling between the high-enthalpy reactive flow streamand the test specimen in determining UHTC material responseto these environments. The importance of computational fluiddynamics (CFD) modeling of the free-stream and boundarylayer flows is discussed, and the value of in situ diagnostics for
0955-2219/$ – see front matter © 2010 Elsevier Ltd. All rights reserved.doi:10.1016/j.jeurceramsoc.2010.01.010

Author's personal copy
2324 J. Marschall, D.G. Fletcher / Journal of the European Ceramic Society 30 (2010) 2323–2336
documenting test conditions and monitoring UHTC evolutionduring testing is emphasized.
2. High-enthalpy test environments
2.1. Plasma wind tunnel facilities
The need for long-duration, high-enthalpy gas flows for thecharacterization and qualification of thermal-protection system(TPS) materials and components led to the development ofplasma wind tunnel facilities for aerospace applications.19 Avariety of different designs have been investigated and imple-mented for plasma wind tunnels but in general all facilitiesconsist of an electrical power supply, an input gas supply, an arc-discharge or inductively coupled heater section, a test section,and an exit gas handling system.
Arc-discharge devices in which a current passes directlythrough a flowing gas were developed extensively in the USAbecause of their large energy deposition rates. Stable arc dis-charges are achieved in large length-to-diameter ratio heatersconstructed of segmented metal elements and fitted with mag-netically spun electrodes. Various arc-jets are now in operationaround the world, including facilities in the USA, Europe, andAsia.19 Direct-arc heating facilities can typically operate withlarge test gas mass flows and with pressures on the order of1–2 MPa within the heater, enabling supersonic flow conditionsin the test section. Most constricted-arc plasma facilities use con-ical nozzles to produce supersonic flows and can operate stablyfor long test times. The United States Air Force (USAF) arc-jetfacilities have been developed to simulate aero-heating for bal-listic atmospheric trajectories, while the National Aeronauticsand Space Administration (NASA) arc-jet facilities have beentailored to simulate lower pressure trajectories associated withupper atmospheric and planetary entry.19
In ICP devices energy is coupled into the test gas flow induc-tively using high-frequency, high-power, high-voltage electricalsupplies. Gases flow through a quartz tube (typically) in theheater section and direct contact between the gas stream andhot metal surfaces is avoided. One advantage of the ICP designfor materials science studies is that the free-stream is usuallyfree of metal contaminants (e.g., copper) often found in arc-jetflows. Such contaminates may interfere with important chemi-cal processes like oxidation, reactive volatilization and surfacecatalysis, or change important surface properties like the emit-tance. Although these devices were investigated in the USA,20
they were developed extensively in Russia and large-scale ICPfacilities are now also in operation in Europe and Asia.19 Thesedevices can generate either subsonic or supersonic flows, how-ever because of their more limited capability for supporting highgas pressures in the heater section, most ICP testing is done inthe subsonic regime.
The test environments generated by these two types of facil-ities differ in significant ways, both from each other and fromactual flight environments. No ground facility can reproduceall features of hypersonic flight accurately, because of physi-cal constraints and operating envelope limitations. Choices fortest conditions are usually made to match particularly important
Fig. 1. Flow features for arc-jet and ICP free-streams interacting with a testspecimen.
trajectory parameters like the anticipated peak heat flux, peakpressure, maximum heat load, etc. The extrapolation of groundtest conditions to flight environments is an on-going area of con-cern and research21,22 and will not be addressed further here.Rather, we focus on differences between supersonic arc-jet andsubsonic ICP environments as they impact TPS materials testingin general and UHTC testing in particular.
2.2. Test conditions
Each plasma facility has its unique envelope of operation thatlimits the range of free-stream enthalpies that can be obtained.Together with the model size, shape, and chemical composition,the available free-stream enthalpy determines the heat flux thatcan be applied to a test specimen. Typically, the power deliv-ered to the heater, the mass flow rate of the test gas, and the testsection static pressure can be adjusted within prescribed ranges.The stagnation point conditions achieved for a particular combi-nation of facility settings are then measured using a calibrationprobe (or probes) of the same geometry as the test sample, butfitted with a calorimeter to measure heat flux and a Pitot gaugeto measure pressure. These calibration probes are usually madeof copper and are water cooled.
Fig. 1 illustrates the salient features of the flow interactionswith a test specimen for the each type of facility. An importantdifference between supersonic arc-jet and subsonic ICP flows isthe thermochemical state of the gas approaching the test article.Because of the relative fluid dynamic and chemical relaxationtime scales in arc-jet facilities, gases exiting the nozzle and flow-ing into the test chamber are typically in a chemically frozen ornon-equilibrium state. This means that the chemical composi-tion of the free-stream gas may differ considerably from thethermodynamic equilibrium composition associated with thetranslational gas temperature. In supersonic arc-jet flows theinteraction of the free-stream with the test article produces a bowshock in which the gas undergoes adiabatic compression. Highenergy intermolecular collisions heat the gas, depositing energy
Author's personal copy
J. Marschall, D.G. Fletcher / Journal of the European Ceramic Society 30 (2010) 2323–2336 2325
into a manifold of excited electronic, vibrational, and rotationalstates, and driving ionization and molecular dissociation pro-cesses. Behind the shock front, where the flow is subsonic,the residence time is now longer than typical chemical reactiontimes and gases undergo thermal and chemical relaxation as theyapproach the boundary layer edge.23 The gas temperature at theboundary layer edge may be 1000s of degrees hotter than thesurface of the test specimen. As the gas flow passes through theboundary layer edge to the surface, chemical reactions changethe gas composition further. However, the chemical and flowtime scales in the boundary layer may be such that the gas inter-acting directly with the specimen is not in chemical equilibriumat the surface temperature.
In contrast, in ICP facilities the flow path and timescales aretypically such that gases can relax towards their thermochemicalequilibrium state in the free-stream before reaching the bound-ary layer edge at the test article, making the prediction of theboundary layer edge composition much more straight forward.22
In a subsonic ICP flow, no bow shock is produced when the flowencounters the test specimen, but a reactive boundary layer isstill formed. There is still a large temperature difference betweenthe boundary layer edge and the specimen, and similar driversfor chemical non-equilibrium in the gases at the surface exist.24
In supersonic arc-jet flows the pressure at the stagnation pointof a test article is largely determined by the dynamic pressureof the flow stream, while in subsonic ICP flows the stagnationpressure is largely determined by the static pressure in the testsection because the dynamic pressure of the flow stream is small.The aerodynamic shear stresses exerted on model surfaces canbe much higher in supersonic arc-jet flows than in subsonic ICPflows. While UHTC materials should have sufficient mechanicalstrength to withstand aerodynamic shear stresses, this may not betrue for developing surface oxides. At sufficiently high temper-atures in oxygen-bearing environments, many UHTC materialsform glassy oxide phases (e.g., B2O3 and SiO2) that permeateand seal porous poly-crystalline oxides (like ZrO2 and HfO2)creating a composite scale that acts as an efficient oxygen diffu-sion barrier.25–28 Aerodynamic shear stresses may redistributelow-viscosity glassy phases and alter the formation of such com-posite oxide scales.
Survey probe heat flux measurements are often reported aspart of UHTC test conditions, but it is important to recognize thatthis heat flux is a cold wall heat flux to a highly catalytic surface,which is not the same as the heat flux delivered to a UHTCtest specimen under identical test conditions. The convectiveheat flux to a specimen is driven by the temperature differencebetween the specimen surface and the hotter gas at the boundarylayer edge. A UHTC surface will reach very high temperaturesduring an arc-jet or ICP test because it is not actively cooled.Because of the smaller temperature difference, the hot wall heatflux to a hot sample surface is always lower than the cold wallheat flux measured by a water-cooled survey probe. In addition,a UHTC surface may be less efficient than a copper surface atcatalyzing the recombination of atomic species in the flow andwill therefore experience less chemical heating from exothermicsurface recombination reactions like O + O→O2, N + N→N2,and O + N→NO.
The primary utility of cold wall heat flux measurements isto provide experimental calibration data to aid in the recon-struction of the free-stream enthalpy using CFD computations(discussed further below). Cold wall heat flux measurements arealso useful for confirming the reproducibility of test conditions,but caution must be used when using free-stream enthalpy orcold wall heat flux to compare test conditions from supersonicarc-jet tests with subsonic ICP tests. Previous investigations haveshown that three parameters must be replicated to match stagna-tion point convective heating conditions in ground test facilities:(1) stagnation point enthalpy; (2) stagnation (or impact) pres-sure; and (3) velocity gradient at the boundary layer edge.22,29
The velocity gradient is the rate that the velocity increases asgas flows around the test article. Thus, the convective heattransfer to the same test specimen exposed to arc-jet and ICPflows with similar free-stream enthalpy and total pressure val-ues can be substantially different, owing to the large differencein velocity gradients between subsonic and supersonic test facil-ities. When differences in the velocity gradients in the twotypes of facilities are properly considered (for example, byscaling test article dimensions appropriately) similar boundarylayer edge compositions and surface heat flux values can beobtained.22,29
We note that the characterization of high-enthalpy flow testenvironments remains an active research area and that compar-ison of flow configurations and boundary layer environmentscan also be made on the basis of non-dimensional similarityparameters such as the Reynolds, Schmidt, and Damköhler num-bers. The use of non-dimensional similarity parameters is avalid approach, but one practical aspect worth mentioning isthat (with some work) the stagnation enthalpy, stagnation pres-sure, and velocity gradient can be measured more easily thanmost non-dimensional similarity parameters in arc-jet and ICPtest facilities.
From a materials science perspective, and particularly forstudies of UHTC oxidation, the most relevant metrics for com-paring different tests are the surface temperature, the stagnationpoint pressure, and the gas composition at the sample surface.This information is vital for associating physical changes intest specimens with specific environmental conditions, and fordeveloping models of thermal and chemical material response.The first two quantities are routinely measured during arc-jetand ICP tests, but the gas composition at the surface – whichcan be influenced both by chemical and transport kinetics – isnot currently experimentally accessible.
3. CFD modeling
Since the chemical nature of the gas at the test specimen sur-face is not measured, a combination of facility data, calibrationprobe measurements and CFD modeling must be used to com-pute the gas composition at the specimen surface for each testrun. This process involves two steps. First, CFD model inputsare adjusted until free-stream flow conditions result in computedheat flux and pressure values consistent with those measuredusing calibration probes; then the free-stream flow conditionsare held fixed and the CFD model is used to compute the tem-

Author's personal copy
2326 J. Marschall, D.G. Fletcher / Journal of the European Ceramic Society 30 (2010) 2323–2336
perature drop and the changing gas composition through theboundary layer to the sample surface.
This procedure was described in detail for a recent seriesof UHTC oxidation tests run in the 1.2 MW Plasmatron facil-ity at the von Karman Institute for Fluid Dynamics (VKI).17
The CFD codes used for this procedure are the VKI BoundaryLayer Code24,30 and the VKI ICP Code,31,32 both of which usethe PEGASE library to perform thermodynamic and transportproperty calculations.33 The ICP code solves the time-averagedmagneto-hydrodynamic equation at low Mach and low magneticReynolds numbers, assuming axisymmetric flow and local ther-modynamic equilibrium, to simulate the flow inside the plasmatorch and around the test article in the vacuum chamber. TheBoundary Layer Code solves the boundary layer equations for anaxisymmetric or two-dimensional, steady, laminar flow of chem-ically reacting gas over a catalytic surface, including thermaland chemical non-equilibrium. The temperature and velocity atthe boundary layer edge are adjusted until the computed andmeasured heat flux agrees.
At NASA Ames Research Center, arc-jet flows are com-puted using the Data Parallel Line Relaxation (DPLR) code.34
DPLR is a parallel multiblock finite-volume code that solves theNavier–Stokes equations including finite-rate chemistry and theeffects of thermal non-equilibrium. The code is used to com-pute non-equilibrium expanding flow in the arc-jet nozzle andsupersonic jet entering the test section, as well as the react-ing flow around test articles.35–37 Thermodynamic propertiesare taken from NASA Glenn curve fits.38 Transport propertiesare computed using the self-consistent effective binary diffusionmethod39 and expressions and mixing rules presented by Guptaet al.,40 together with collision integrals compiled by Wrightet al.41,42 Simulations are typically started at the nozzle throatassuming thermochemical equilibrium flow properties and someradial profile of enthalpy and mass flux. Facility and calibrationdata include measurements of the chamber pressure, mass flowrate, and test section pressure, calorimeter probe heat flux andpressure measurements. The total enthalpy of the arc-jet flowand its radial distribution are inferred from facility data and pre-vious survey measurements. In the CFD reconstruction, theseinferred values and distributions serve as the starting point foriterative adjustments to match computational predictions to theheat flux measured by the calibration probe.
The energy balance at the surface of a test article or cali-bration probe is the key relationship that couples the gas-phaseand the solid material. For an environment free of gas radiation,the energy balance for any non-ablating/non-pyrolyzing materialsurface can be written as
qconv + qchem = qrad + qcond, (1)
where the terms on the left-hand side account for convec-tive and chemical heating by the gas stream and those on theright-hand side represent cooling by radiation and in-depth heatconduction. With some simplifying assumptions (a sensible gasenthalpy convective transfer coefficient representation, inde-pendent surface recombination of O and N atoms with equalcatalytic efficiencies, negligible gas radiation) this equation can
be expanded as
CH [He (Te)−Hs (Ts)]+ γ ′ (Ts) �EO2nO
√RTs
8πMO
+γ ′ (Ts) �EN2nN
√RTs
8πMN= εσT 4
s − k (Ts)dT
dx
∣∣∣∣s
, (2)
where CH is the convective transfer coefficient; He and Hs arethe gas enthalpies at the boundary layer edge and at the surface;�EO2 and �EN2 are molecular dissociation energies; nO and nNare atom number densities above the surface; MO and MN aremolar masses; R is the universal gas constant; T is temperature;σ is the Stefan–Boltzmann constant; and x is the coordinate intothe surface. Eq. (2) also shows how the surface energy balancedepends explicitly on temperature-dependant surface and bulkmaterial properties: the total catalytic efficiencyγ ′, the emittanceε, and the thermal conductivity, k. The total catalytic efficiencyis defined as γ ′ = γβ, where γ is the species recombination effi-ciency (the fraction of collisions with the surface that resultin atom loss) and β is the energy accommodation coefficient(the fraction of exothermic reaction energy transferred to thesurface).
In calibration measurements the right-hand side of Eq. (2) ismeasured directly using water-cooled calorimeters. Then CFDinputs are adjusted to reproduce this calibration heat flux mea-surement, usually with values of γ ′ fixed at 1 (a fully catalyticsurface) and Ts fixed to a low temperature like 300 K (a coldwall). This process derives the convective transfer coefficient CH
and the boundary layer edge temperature Te for a particular testcondition, quantities that are then kept fixed in simulations seek-ing to reproduce surface temperatures subsequently measuredduring UHTC tests.
When qcond is negligible, and with CH, Te, and Ts fixed, Eq.(2) shows that the energy balance is determined by γ ′ and ε
through the chemical and surface radiation fluxes. (For sharpUHTC test articles, a thermal model of the heat transfer withinthe UHTC is likely required to evaluate qcond. However for otherconfigurations, like stagnation point testing with disk specimensin a flat-faced cylinder configuration, qcond can be set to zero withminimal error.) If a numerical value is assigned to the surfaceemittance, the total catalytic efficiency can be adjusted itera-tively until Eq. (2) is satisfied, and the gas composition at thesurface is computed simultaneously. In practice, it is not straight-forward to choose the “correct” value of emittance for a UHTCcomponent at high temperature.17
As an illustrative example of the process described above,we show some results obtained for a recent series of stagnationpoint oxidation tests performed in the VKI Plasmatron on UHTCspecimens of a hot-pressed ZrB2 material containing 30 volumepercent SiC (termed ZrB2–30SiC).17 Tests were performed atstatic chamber pressures of 104 Pa with an air mass flow rate of16 g s−1 over a range of Plasmatron powers from 150 to 210 kW.
The upper portion of Fig. 2 shows the cold wall heat fluxmeasured by a calibration probe and the steady-state UHTCsample surface temperature measured using a two-color pyrom-eter during each test run. Both the cold wall heat flux and the

Author's personal copy
J. Marschall, D.G. Fletcher / Journal of the European Ceramic Society 30 (2010) 2323–2336 2327
Fig. 2. Heat fluxes and surface temperatures versus Plasmatron power.17 Thecold wall heat flux is measured by a calibration probe and the sample surfacetemperature is measured by a two-color pyrometer during each test run. Thehot wall heat fluxes are estimated from qhw = εσT 4
s with ε = 0.90 and ε = 0.75,assuming qcond≈ 0.
specimen surface temperature increase with Plasmatron poweras expected. The lower portion of Fig. 2 shows the hot wall heatflux for each test run computed from qhw = εσT 4
s with ε = 0.90and ε = 0.75, assuming qcond≈ 0. Both values of emittance arereasonable estimates for oxidized ZrB2–SiC composites.14,17,43
Without an in situ method for determining the high-temperatureemittance during testing, such a level of uncertainty (∼15%) inemittance is unavoidable. Note that the hot wall heat fluxes areonly about half of the corresponding cold wall heat fluxes, whichsuggests that the surface catalytic efficiencies of the oxidizedUHTC surface must be low.
Fig. 3 plots the total catalytic efficiency obtained for eachtest condition from the surface energy balance constraint, forvalues of ε = 0.90 and ε = 0.75. The derived catalytic efficienciesare much less than 1 consistent with a surface of low catalyticactivity. Catalytic efficiencies derived for ε = 0.90 are 2–6 times
Fig. 3. Recombination efficiency versus surface temperature calculated for sur-face emittances of 0.75 and 0.90.17 The total catalytic efficiencies for O + O andN + N are assumed identical.
higher than those for ε = 0.75. Thus uncertainties in emittancebecome amplified in derived catalytic efficiencies.
Fig. 4 shows the calculated number densities of O, N, N2,O2, and NO at the UHTC surface for emittance values of 0.90and 0.75. N2, O and N (in that order) are the dominant specieswith number densities around 1023 molecules per cubic meter;the number densities of O2 and NO are about 2 orders of mag-nitude smaller. Atomic oxygen number densities are relativelyunaffected by the choice of emittance values, but atomic nitro-gen number densities computed for ε = 0.90 are only 55–75% ofthe magnitudes computed for ε = 0.75. The number densities ofthe minor species are larger for ε = 0.90 than ε = 0.75, by factorsof about 3–7 for O2 and about 2–3.5 for NO.
As this example demonstrates, considerable uncertaintiescan propagate into CFD-derived quantities like catalytic effi-ciency and surface gas composition, by errors in experimentalmeasurements and material properties. Additional, and hard toquantify, error is also undoubtedly present in the details of theformulations, assumptions, solution procedures, and the chem-ical, transport and thermodynamic data employed in particularCFD codes. Nevertheless, CFD modeling is a crucial elementof UHTC testing, because it offers the best tool currently avail-able for evaluating the state of the gas interacting directly withthe test surface specimen. It is also the only practical way toestimate quantities like the surface shear stress or to map outchanges in gas composition over the surface of more complexthree-dimensional UHTC test articles.
We note that most published accounts of UHTC testing in arc-jet or ICP facilities have not reported quantitative estimates ofthe gas composition at the sample surface during testing. From amaterials science perspective, this makes the comparison of dif-ferent experiments problematic and the construction of materialsresponse models more difficult. The value of UHTC arc-jet andICP test results would be greatly increased if surface gas com-positions, and the numerical procedures used to estimate them,were routinely reported. Further benefits would result from mea-
Fig. 4. Number densities at specimen surfaces versus surface temperature, com-puted for surface emittances of 0.75 and 0.90.

Author's personal copy
2328 J. Marschall, D.G. Fletcher / Journal of the European Ceramic Society 30 (2010) 2323–2336
surements of boundary layer gas compositions and gradients, asdiscussed in the following section.
4. Optical diagnostics
In this section we examine different optical techniques forobtaining information about the test environment and the evo-lution of UHTC specimens exposed to high-enthalpy flows.
4.1. Surface radiometry
Surface temperature is perhaps the most important quantityrequired for the interpretation of test results. Surface temper-atures are typically measured in situ by collecting thermalradiation emitted by the hot specimen using one-color or two-color radiometers. One-color radiometers collect radiation overa single wavelength range, while two-color radiometers collectradiation over two wavelength ranges (which may overlap). Bothtypes of radiometers are calibrated as a function of emissiontemperature using blackbody radiation sources (special furnaceswith an effective normal emittance approaching 1). One-colorradiometers require knowledge of the specimen emittance overthe detection wavelength range to convert radiation intensity tosurface temperature. Two-color radiometers only require that theratio of emittance values for the two detection ranges be known;for a surface with wavelength-independent emittance this ratiois 1. Typical experimental issues include transmittance lossesdue to windows, interference by absorbing gases, parasitic col-lection of reflected light, and geometric limitations for viewingthe sample surface. Single-color radiometers typically respondto the average temperature in the field of view, while two-colorradiometers tend to reflect the peak temperature in the field ofview. Facility geometry usually dictates that specimen surfacesbe viewed at non-normal incidence, enlarging the surface areaseen by the radiometer. The possibility off non-uniform surfacetemperatures in the field of view must be considered for UHTCspecimens with small stagnation regions like sharp wedges orcones.
Radiometry can also be used to obtain information aboutthe emittance of UHTC specimens at high temperature.Laboratory measurements of UHTC emittance at high tem-perature are difficult and rare. The emittance measurementsof Scatteia et al. on various UHTC composites (ZrB2–15SiC,ZrB2–15SiC–2MoSi2, and ZrB2–15SiC–10HfB2) are notablein this regard.43,44 Scatteia et al. have also demonstrated howUHTC emittance is influenced by surface finish and oxidation.Because it may be difficult to reproduce oxidized UHTC sur-faces in the laboratory that are the same as those formed in thelow-pressure, highly dissociated-oxygen environments of arc-jetand ICP flows, in situ measurements would be preferred.
If both one- and two-color radiometers are trained on the samesurface location, surface temperature can be measured using thetwo-color instrument and, with the surface temperature known,the in situ emittance can be derived from the one-color instru-ment. Such a procedure was used by Monteverde and Savino14
to find ε ∼= 0.9 for a hot-pressed ZrB2–15SiC composite dur-ing testing in a 80-kW plasma torch. This type of measurement
could in principle be done using a single instrument, by calibrat-ing and collecting both channels of a two-color radiometer. Afurther extension of this procedure would be the use of a spectralradiometer to capture wavelength-resolved emission intensityover a broad wavelength range. The captured intensity curve isfit by the Planck blackbody radiation function, Eb(λ,T), con-voluted with a wavelength-dependent emittance, yielding bothsurface temperature and emittance values. Spectral radiometersare expensive instruments and their application in arc-jet or ICPtesting of UHTC materials has not yet been reported.
Emittance is a function of wavelength, emission direction,and temperature. The surface energy balance requires the totalhemispherical emittance – the emittance averaged over all wave-lengths and emission directions – as input, where it plays acrucial role in the determination of surface catalytic efficiencyand thus the computed gas-phase species concentrations abovethe surface. The emittance obtained by Monteverde and Savino14
yields a directional value valid over the wavelength range of theirone-color radiometer. The direct use of this value in the surfaceenergy balance implies assumptions of wavelength indepen-dence (a gray surface) and directional independence (a diffusesurface) which may not be true. Extension of this method usinga spectral radiometer would produce a wavelength–dependantdirectional emittance that can be averaged over wavelengthto yield a total, directional emittance value. However, someassumptions or approximations would still have to be madeabout the relationship between total directional and total hemi-spherical emittance before this derived value could be used inthe surface energy balance. Since it does not seem possibleto make a total hemispherical emittance measurement in situ,the best available alternative is probably the extrapolation of insitu emittance measurements with the directional and/or spec-tral dependencies documented in pre- and post-test laboratorymeasurements.
4.2. Gas emission spectroscopy
The radiation emitted by gases in the free-stream or in thenear-surface region of test specimens contains information aboutthe species present. Atoms and molecules emit radiation whenthey transition from higher to lower energy states. Each specieshas a unique set of energy levels and the energies of emitted pho-tons correspond precisely to differences between these levels.Emission spectroscopy collects this emitted light and dispersesit by wavelength, generating spectra with characteristic intensityfeatures (atomic lines and molecular bands) that can be asso-ciated with individual species. Emission is a path-integratedmeasurement technique without spatial resolution along thelight collection axis. Reconstruction of the spatial distributionof emission requires measurements along multiple axes and/orassumptions of symmetry together with a mathematical pro-cedure known as an Abel inversion.45 Further complicationsensue if the gas is optically thick and significant re-absorptionof emitted radiation occurs along the collection axis.
During the Plasmatron testing of hot-pressed ZrB2–30SiCmaterials described in Section 3, prominent bluish-greenemissions were observed around the test articles. These emis-

Author's personal copy
J. Marschall, D.G. Fletcher / Journal of the European Ceramic Society 30 (2010) 2323–2336 2329
Fig. 5. Raw signal versus emission wavelength 55 s after injection of sampleinto the free-stream. Background emissions from the Plasmatron free-streamhave been subtracted to remove contributions from the N2
+ band system. Thestrong line at 589 nm can be assigned to sodium. The bandhead positions forBO and BO2 are from Spalding et al.46 and atomic lines were identified fromthe NIST Atomic Spectra Database.47 Arrows indicate the wavelengths used tomonitor B, BO, and BO2 as a function of test time.
sions first appeared and intensified as the sample temperatureincreased, then reached a plateau, and finally decreased in inten-sity at longer test times. Follow-on tests were performed inwhich emission spectra were collected directly adjacent to thespecimen surface as a function of test time. Light was capturedthrough an aperture, focused onto the end of an optical fiberby a spherical mirror, and transmitted to a spectrometer with awavelength range of 200–1100 nm and a resolution of 0.25 nm.Spectra were collected at 1 Hz during the test.
These measurements confirmed that the visible emissionoriginated from electronically excited BO and BO2 molecules,and in addition detected ultraviolet emission associated withatomic boron. An example of these spectra is shown in Fig. 5,which plots background-subtracted raw signal against emissionwavelength (background subtraction removes N2
+ emissionsoriginating from the Plasmatron free-stream). The band headpositions for the BO (A2Π → X2Σ+) and BO2 (A2Πu→X2Πg) systems are from Spalding et al.46 and the B (2S1/2 →2P1/2,3/2) doublet was identified from the NIST Atomic SpectraDatabase.47 Since all boron species must originate from ZrB2,emission spectroscopy in this case provides an in situ monitorfor the oxidation of the UHTC composite and the volatilizationof boron from the resulting oxide scale.
UHTC composites containing both ZrB2 and SiC oxidize toform complex oxide scales with an outer glassy layer rich in sil-ica and an inner layer depleted of SiC. The structure of theseoxide scales has been extensively investigated with post-testanalytic techniques (microscopy, X-ray diffraction, chemicalanalysis),26,48,49 and their formation hypothesized in terms oftransport processes and thermodynamic arguments.27,28
In dissociated-oxygen environments, the passive oxidationof zirconium diboride forms zirconia and boron oxide, and thepassive oxidation of silicon carbide forms silica and carbonmonoxide:
ZrB2+ 5O(g) → ZrO2+B2O3 (3)
SiC + 3O(g) → SiO2+CO(g) (4)
The oxidation rate of ZrB2 at moderate temperatures (below1000 ◦C) is significantly faster than the oxidation rate of SiC.Therefore the initial oxide scale is expected to be predominantlyB2O3. Amorphous B2O3 has a very low softening temperature(∼560–630 ◦C)50 and liquid B2O3 seals the surface slowinginward oxygen transport. At higher temperatures, the SiC oxi-dation rate increases and the oxide scale becomes a borosilicateglass. However liquid B2O3 has a much larger vapor pressurethan silica and boron oxides are predicted to volatilize prefer-entially from the oxide surface leaving a silica rich glass. Asthe glassy scale thickens and becomes more silica rich, inwardoxygen diffusion slows further and oxygen concentrations at thereaction interface decrease. Under these conditions active SiCoxidation becomes favored over ZrB2 oxidation, slowing B2O3production and leading to the formation of a porous SiC-depletedsub-layer via:
SiC + 2O(g) → SiO(g) + CO(g) (5)
Gaseous SiO formed at the bottom of the SiC-depleted layerdiffuses to the top of that layer where it is thought to condense,augmenting the glassy top scale from below.
In detail this process is quite complicated, involving het-erogeneous media, transitions between different controllingchemistries, the growth of multiple oxide layers, movinginterfaces, changing glass compositions, evolving transportproperties, etc. However, a simple “shape function” for theexpected time variation of boron species volatilization can beconstructed based on the premise that boron oxide is formedby reaction (3) at the bottom of the glassy scale and diffusesthrough the scale to the surface where it evaporates according toa Hertz–Langmuir relationship. The diffusion and evaporationfluxes can be written in terms of the boron oxide concentrationsat the reaction interface, CB2O3,i, and the outer surface, CB2O3,s,as
JB2O3,dif = DB2O3
CB2O3,i − CB2O3,s
�glass(6)
JB2O3,ev =PB2O3,v√
2πMB2O3RT
CB2O3,s[ρ/M
]glass
. (7)
These expressions can be combined by assuming diffusionand evaporation fluxes are in quasi-steady-state at any time:
JB2O3,ev =CB2O3,i(√
2πMB2O3 RT[ρ/M
]glass
/PB2O3,v
)+
(�glass/DB2O3
) .
(8)
Both the vapor pressure and the diffusion coefficient arepresumed to follow Arrhenius dependencies on tempera-ture: PB2O3,v ∝ exp(−Ev/RT ) and DB2O3 ∝ exp(−ED/RT ). Ifparabolic scale growth is assumed, �glass ∝
√t, and if falling
boron oxide production with growing scale thickness is approx-imated by an inverse power law, CB2O3,i ∝ t−n, the followingshape function for the temperature and time dependencies of the

Author's personal copy
2330 J. Marschall, D.G. Fletcher / Journal of the European Ceramic Society 30 (2010) 2323–2336
Fig. 6. Experimental temperature and emission signal history collected dur-ing a Plasmatron test of a hot-pressed ZrB2–30SiC specimen (left-hand panel)and representative volatilization profiles computed by Eq. (9) (right-hand panel).Emission was collected at the three wavelengths indicated in Fig. 5; the radiome-ter cut-on temperature was ∼1100 ◦C. The B2O3 fluxes and concentrationsleading to the shape function model are illustrated in the right-hand panel. Shapefunctions were computed with k2 = 104, Ev = 320 kJ/mole, and ED = 10 kJ/mole,and the values of n and k1 listed on the figure.
boron oxide vaporization flux results:
JB2O3,ev∼= k1t
−n
√T exp(Ev/RT )+ k2
√t exp(ED/RT )
, (9)
where k1, k2, n, Ev, and ED are constants.Fig. 6 compares the experimental temperature and emission
signal history (in the left-hand panel) collected during a Plas-matron test to some representative volatilization profiles (in theright-hand panel) computed by Eq. (9) for a piecewise linear tem-perature history and several numerical choices of constants. Theexperimental emission signals were collected at the wavelengthsindicated in Fig. 5; the experimental temperature was collectedby a radiometer with a low temperature cut-on of∼1100 ◦C. Ev
was fixed at a low 10 kJ/mole on the premise that boron diffu-sion in high temperature amorphous or liquid silica is very fast.ED was adjusted to 320 kJ/mole to reproduce the sharp rise inboron emission signatures observed between 40 and 50 s. Theactivation energy predicted by thermodynamic calculations forthe vapor pressure of B2O3 over liquid boron oxide is closer to380 kJ/mole.25,51 The decay of the shape function with time iscontrolled by the exponent n. Computations are shown for n = 0,0.5 and 1.0, with k2 fixed to 1014 and k1 adjusted to maintainsimilar peak magnitudes for all profiles and to put the shapefunction on the same (arbitrary) scale as the emission data.
In general this very simple model captures the qualitativetrends seen in the emission data quite well. The largest expo-nent (n = 1) seems to reproduce the relatively steep emissionsignal decay the best. This is consistent with the idea that theconcentration of B2O3 produced at the reaction interface shouldvary inversely with time at least as fast as the scale grows andprobably faster as the decreasing oxygen pressure at the interfacebegins to favor active SiC oxidation over ZrB2 oxidation.
At higher temperatures (above ∼1750 ◦C), the vapor pres-sure of silica increases significantly and a similar process ofvolatilization from the UHTC oxide scale should lead to Si-containing species in the gas-phase. Hirsch et al.,52 Altman etal.,53 and Jentschke et al.54 have monitored Si atom densitiesin front of C/C-SiC composites exposed to nitrogen–oxygenplasma flows, using high-resolution spectroscopy of Si I mul-tiplet emissions in the 250–253-nm range. Herdrich et al.55
observed Si emission near 252 nm and 288 nm while testingSiC specimens in oxygen–nitrogen plasmas, and also capturedemission from SiO2 molecules near 423 nm. Emission from SiOmolecules was not reported in any of these studies, which issurprising given that reaction mechanism (5) should have beenoperating under some of the test conditions reported.
4.3. Laser induced fluorescence
Laser induced fluorescence (LIF) is a species selective,non-intrusive diagnostic that has been widely applied for thecharacterization of combustion and plasma environments.56,57 Apulsed, tunable laser source is used to generate monochromaticlight at a unique atomic or molecular absorption wavelength.The absorbed photon energy excites the target species to a higherelectronic energy level, from which it subsequently decays to alower energy level (or levels) emitting radiation at a character-istic wavelength (or wavelengths).
One advantage of the LIF technique is that ground-statespecies populations can be probed, whereas emission spec-troscopy detects only electronically excited species. Even atrelatively high temperatures, the ground electronic state pop-ulations typically predominate over the populations in higherelectronic levels. Another advantage of LIF is that spatiallyresolved measurements are more easily made and interpretedthan by emission spectroscopy, since the fluorescence collec-tion optics field-of-view and the excitation laser beam axis canbe independently oriented to intersect at a desired location,as shown schematically on the left side of Fig. 7. Generallyspeaking LIF detection works best for light atoms and diatomicmolecules.
Fig. 7. Energy level diagrams for two common two-photon LIF schemes forprobing atomic oxygen and atomic nitrogen. The spatial resolution of the LIFapproach is indicated by the cartoon at the left.

Author's personal copy
J. Marschall, D.G. Fletcher / Journal of the European Ceramic Society 30 (2010) 2323–2336 2331
Applications of LIF to plasma stream characterization typ-ically involve measurement of three variables: translationaltemperature, convective velocity, and species concentration. Airand nitrogen plasma species probed by LIF have included Oatoms, N atoms, and nitric oxide (NO).58–62 For NO, single-photon excitation in either the ultraviolet γ band (A←X) or β
band (B←X) is possible. However, the large energy level spac-ing of the oxygen and nitrogen atoms requires a two-photonexcitation scheme, and the excitation cross sections are corre-spondingly smaller.63–66 The energy levels involved in commontwo-photon excitation schemes for atomic oxygen and nitrogenare shown in the center and right side of Fig. 7. Atomic nitrogenis a useful target species for highly dissociated air or nitrogenplasmas, because its concentration is a sensitive indicator ofthe degree of plasma dissociation.58,59 Atomic oxygen numberdensities are critical for quantifying both passive and active sur-face oxidation processes. Both atomic species are involved inexothermic surface recombination processes that can contributesubstantially aerothermal heating.
The experimental arrangement for probing either atomic oxy-gen or nitrogen is essentially the same, as shown in Fig. 8. ANd:YAG-pumped dye laser provides the fundamental output,which is converted by the appropriate tripling crystal arrange-ment to the desired ultraviolet, two-photon wavelength. Asindicated in the figure, the ultraviolet output is split into threedifferent paths. The first is directed toward the plasma stream(either ICP or arc-jet), while the other two paths are directedtoward a NO reference cell and a microwave-discharge flowreactor, respectively. The NO cell is used to assess the laser per-formance and to guide laser tuning toward the relatively sparsetwo-photon excitation wavelengths. Within the flow reactor, themicrowave discharge creates a stable, non-equilibrium popu-lation of atoms at known pressure and temperature, and thefluorescence from this population can be used to calibrate thefluorescence signals from the plasma stream. This calibrationenables measurement of translation temperature, flow velocity(depending on the facility and beam orientation), and numberdensity of the target species.
Fig. 8. Schematic of the experimental configuration for two-photon LIF imple-mentation in arc-jet and ICP facilities. In addition to measuring LIF from theplasma facility, measurements are made in a nitric oxide cell for laser wavelengthmonitoring and in a flow reactor for calibration of the facility measurements.The temperature and atomic number density in the flow reactor are knownindependently of the laser measurements.
Fig. 9. Two-photon LIF signals from excitation of the 207-nm transition ofatomic nitrogen at the boundary layer edge in the VKI Plasmatron ICP TorchFacility. Despite the fact that the beam is angled with respect to the axial streamvelocity (as shown in Fig. 8) the subsonic flow speed does not provide a measur-able shift between the flow-reactor and ICP stream transition line centers. Thespectral fit assumes that Doppler broadening is the dominant line broadeningmechanism.
An example of atomic nitrogen fluorescence acquired in anICP facility is shown in Fig. 9, where the atomic nitrogen flu-orescence is plotted as a function of the dye laser fundamentalwavelength. The broader of the two traces is the signal collectedfrom plasma stream at the boundary layer edge and the narrower,less noisy signal is from a microwave-discharge flow reactor. Thesmooth curves for each LIF signal are nonlinear least-squaresfits to the line profiles using a spectral model that includes therelevant broadening mechanisms and uses the total line width asa fitting parameter. Line shape fit results from the flow reactorsignal are used to extract information from the plasma streammeasurements as explained in the following paragraphs. Finally,the temperature value derived for this particular measurement isindicated on the figure, along with the flow reactor temperatureused to extract the laser line width.
The translation gas temperature is derived from a measure-ment of the total width of the transition once the laser line widthis determined from the flow reactor line shape as
T = MNc2
8 ln (2) kBnAν2
[�ν2
T,F −(�ν2
T,R −�ν2D,R
)], (10)
where M is the molar mass, c is the speed of light, kB is the Boltz-mann constant, nA is Avogadro’s number, and ν is the transitionfrequency in cm−1. The different widths �ν2 (also in cm−1)are labeled with subscripts that designate Total or Doppler andFlow or Reactor. The flow velocity can be determined from theDoppler shift of the central transition wavelength, λ, as
υ = c �λ
λ cos θ, (11)
and only a separate measurement of the angle between the veloc-ity and laser propagation vectors, θ, is needed. While the Dopplershift in the free-stream of supersonic arc-jet facilities is quitelarge, and can be used to reliably measure the free-stream veloc-

Author's personal copy
2332 J. Marschall, D.G. Fletcher / Journal of the European Ceramic Society 30 (2010) 2323–2336
ity, the Doppler shift in subsonic ICP facilities is too small forvelocity determination, as is clearly evident in Fig. 9.
Finally, the local number density of atomic nitrogen isdetermined from integrated LIF signal. Several additional mea-surements are required to obtain absolute values of numberdensity, including characterization of the fluorescence collectionefficiency, the temporal and spatial characteristics of the laserbeam, and finally the use of either a known N-atom referencepopulation, a rare gas calibration,67–69 or a two-photon exci-tation cross-section measurement.64–66 For the latter approach,the expression for nitrogen atom number density is
nN = 4π
D
τrad
τobs
Ap∫F2 (t) dt
(hv)2
G(2)σ(2)
∫SN
E2p
(ω) dω, (12)
where SN is the LIF signal in volts, τi are the radiative andobserved lifetimes, AP is the beam area, D is the collection opticscalibration factor, F2(t) is the square of the temporal laser pulseshape and the G(2)σ(2) product represents the two-photon LIFcross section.
Two-photon LIF has been implemented in arc-jets to char-acterize the free-stream conditions58,59 and to investigatefree-stream property gradients.61,70 By measuring the threequantities noted above in nitrogen/argon plasma flows, and mak-ing use of a pitot pressure measurement and facility data, it ispossible to calculate the stream total enthalpy and to quantifythe different contributions: thermal, kinetic, and chemical. Thisis extremely useful for establishing stream conditions, extrap-olating the free-stream test conditions to a flight environment,and provides experimental data against which a CFD compu-tation of gas flow through the arc-jet nozzle and towards thetest article can be tested. However, arc-jet free-stream measure-ments still only provide a different starting point for the eventualassessment of the boundary layer conditions above a test article.
The arc-jet free-stream measurements indicate low transla-tional temperatures, high velocity and non-equilibrium atomnumber densities.58,59 In contrast, the boundary layer edge mea-surement from the ICP facility discussed above (Fig. 9) indicateshigh translational temperature and low velocity. It is reason-able to expect that within the boundary layer in an arc-jet test,LIF measurements would be quite different from those of thefree-stream, and more likely, similar to those of the ICP facilityboundary layer edge.
For material test applications temperature and species infor-mation from the reacting boundary layer is extremely important.While LIF measurements in the boundary layer are relativelyrare, recent experiments indicate their feasibility.60,70 Twostrategies exist for measuring species and temperature profilesabove the surface. The first is a point-wise approach that involvestranslating the laser probe volume toward the surface, as indi-cated in Fig. 10, and the other is a planar approach that requiressufficient laser pulse energy to spread the beam into a light sheet.In the latter, an intensified camera is needed to record the flu-orescence signals, which complicates the interpretation of themeasured signals.
Fig. 11 shows computed boundary layer profiles of temper-ature, and total and species number densities, for an air plasma
Fig. 10. Translation of either the test article or the beam delivery and collectionoptics to measure the species number densities and temperature in the boundarylayer approaching the test article in the stagnation region.
along the stagnation streamline for a particular high-enthalpytest condition.17 The catalytic efficiency of the surface was setto a relatively low 10−4 for these computations. Temperatureand number densities are normalized by their boundary layeredge values. Different information is available from differentspecies measurements. All species number densities increasewith approach to the surface because of the decreasing gastemperature in a constant pressure boundary layer. The rela-tive O-atom number density and total mixture number densitycurves overlay each other in Fig. 11, indicating that for these
Fig. 11. Computed temperature, mixture density, and species number densityvariations along the stagnation streamline for the flow over a low-catalycitysample in the VKI Plasmatron ICP Torch Facility. The number densities arenormalized by their free-stream (boundary layer edge) values. Note that thetotal and O-atom number density curves overlay one another, indicating that forthese boundary layer conditions there is little gas-phase recombination of O toO2.

Author's personal copy
J. Marschall, D.G. Fletcher / Journal of the European Ceramic Society 30 (2010) 2323–2336 2333
plasma conditions, relatively little gas-phase recombination ofO to O2 occurs. The N-atom number density increases moreslowly and the N2 number density more rapidly than the totalnumber density, indicating that gas-phase recombination of Nto N2 is important at these conditions.
Whether probing N or O, if a simultaneous measurement ofthe atom number density and translational temperature can beobtained (as described above) as a function of distance from thesample surface, the total number density can then be computedfrom a pressure measurement and the translational temperatureusing the ideal gas equation of state n = P/kBT. This, along withthe measured atom number density, gives the mole fraction ofthe probed atomic species. For a pure nitrogen plasma this cancompletely characterize the local thermodynamic conditions, aslong as ionization is not significant, since the N2 number densitycan be found from nN2 = n− nN. For an air plasma, measure-ments of both O-atom and N-atom number densities are neededfor a complete understanding of the local thermodynamic state.
The relative species density profiles presented in Fig. 11show trends characteristic of a low catalycity, non-reacting sur-face, wherein the relative number densities increase towardsthe wall as determined by the gas temperature profile and gas-phase recombination reactions. For a highly catalytic surfacethe atomic species number densities should trend downwardapproaching the surface to very small levels. Reported speciesdensity uncertainties60,70 suggest that measurement of gradientswith density changes of two to four are realizable, especiallywhen relative LIF signals are used to measure the trend of anormalized species density.
The monitoring of volatile products during high-enthalpyUHTC testing by LIF is also possible, although such work hasnot yet been reported. Both B atoms71 and BO molecules72,73
have been detected by LIF schemes, as have Si atoms74,75 andSiO molecules.74,76 Feigl and Auweter-Kurtz77 have used LIFto monitor SiO concentrations in front of SiC materials oxi-dized in argon–oxygen–nitrogen plasma flows, by exciting theSiO (AlΠ ← XlΣ+(0, 0)) transition near 234 nm and collect-ing fluorescence near 260 nm from the (AlΠ → XlΣ+(0, 3))band. They associate rapid rises of SiO in the gas-phase withthe transition between passive and active SiC oxidation (i.e.,between reactions (4) and (5)). Beyond the simple detection ofvolatile species, spatially resolved LIF of volatiles in the bound-ary layer would enable the measurement of species gradients thatcould in principle be related to volatilization rates from the sur-face. No measurements of this type have yet been attempted andtheir interpretation would require additional gas-phase chem-istry inputs to existing CFD programs.
4.4. Other techniques
4.4.1. Fourier transform infrared spectroscopyFourier Transform Infrared (FTIR) spectroscopy is a tech-
nique used to capture and spectrally resolve infrared radiationusing a scanning interferometer, typically at wavelengthsbetween 1 and 40 �m. Transmission FTIR spectroscopy is oftenused as a laboratory technique to identify chemical species ingas or liquid samples, by absorption features that occur at char-
acteristic energies (wavelengths) related to particular vibrationalmodes of different chemical bonds. These characteristic absorp-tion features are relatively sharp in the gas-phase, and oftenbroaden and shift slightly in the liquid phase. A similar tech-nique is used to detect molecules on surfaces by reflection FTIRand can be used to monitor thin film growth.
Estimates of the temperature-dependant total, hemisphericalemittance are often derived from spectrally resolved, hemispher-ical reflectance measurements performed at room temperatureusing FTIR instruments fit with integrating spheres.17 Themeasured spectral reflectance, ρ298(λ), is converted to spec-tral absorbance, α298(λ), using the relation α298(λ) = 1− ρ298(λ)valid for an opaque surface, and the spectral absorbance isequated to the spectral emittance based on Kirchhoff’s law,ε298(λ) = α298(λ). Total hemispherical emittance at any tem-perature is then computed by averaging the room-temperatureemittance over the Planck blackbody radiation function:
ε (T ) ∼=∫ λ2λ1
ε298 (λ) Eb (λ, T ) dλ∫ λ2λ1
Eb (λ, T ) dλ. (13)
This process assumes that the temperature dependence oftotal emittance is dominated by the temperature dependence ofthe Planck function and not by the optical constants of the mate-rial. It also presumes that the spectral range of the measurement,λ1 to λ2, is sufficiently broad that it contains the spectral regiondominating the emissive power at each temperature.
A variant of this technique – emission FTIR – was recentlyused in a laboratory setting to capture thermal emissionfrom C/ZrB2–SiC composites over the 200–800 ◦C temperaturerange and an effective temperature-dependant emittance wascomputed.78 However, the spectral range of the FTIR instru-ment used in this work was only 8–14 �m and this limited rangecontains just ∼40% of the radiative power emitted at 200 ◦Cand less than 10% of the emitted power at 800 ◦C. The derivedemittance values are thus tenuous approximations for the totalemittance.
Marschall et al.17 have shown how a broad feature in the FTIRreflectance spectra of virgin ZrB2–30SiC in the 10–13-�m rangewas removed and replace by a sharper feature centered near 9 �mafter oxidation. The former feature can be related to stretch-ing mode vibrations of Si–C bonds and the latter to stretchingmode vibrations of Si–O bonds. A similar enhanced reflectancefeature predicted for ZrO2 near 14 �m was not observed in oxi-dized samples, consistent with the fact that the outer scale wasdominated by silica rich glass.
Related spectral features should appear as emittance modi-fications to the Planck blackbody radiation function in thermalemission. This suggests that FTIR emission spectroscopy mightbe used as an in situ monitor for changing surface compositionsduring high-enthalpy testing. Measurements of this type weremade by Hirsch et al.52 for characterizing the oxidation behav-ior of carbon/carbon and carbon/silicon carbide composites inthe ICP wind tunnels. However, this concept has never beenexplored as an in situ diagnostic for UHTC materials systems.
Even without reference to a blackbody standard, the broadmid-IR spectral features associated with SiO2, SiC, ZrO2 and

Author's personal copy
2334 J. Marschall, D.G. Fletcher / Journal of the European Ceramic Society 30 (2010) 2323–2336
HfO2 are sufficiently separated that difference spectra shouldtrack shifts in the dominant surface composition with time. Thisapproach has the potential to monitor important thermodynamicand chemical transitions as test conditions are varied or as con-stituents are depleted over time. For example, changes in therelative strengths of the SiO2 and SiC spectral features could beused to track the important transition from passive SiC oxidationwith the formation of condensed silica to active SiC oxidationwith the formation of volatile SiO. The identification of temper-ature and pressure thresholds at which the loss of SiO2 from theoxide scale becomes large – be it by active oxidation, evapora-tion, or melt flow – is critical to UHTC performance and shouldbe evidenced by the appearance of the ZrO2 or HfO2 featuresabove 14 �m.
4.4.2. Absorption spectroscopyThe spatial resolution advantage of the LIF technique has
been contrasted above with path-integrated emission measure-ments, which can also clearly provide useful information formaterial test applications. Similarly, absorption measurementscan provide useful information since they typically probe eitherground or low-lying electronic states even though this infor-mation is also path-integrated. One such application is themeasurement of molecular species formed by gas/surface inter-actions.
Advances in semiconductor processing have enabled rapiddevelopment of Tunable Diode Laser Absorption Spectroscopy(TDLAS). Relatively inexpensive, but tunable, diode lasersoperating with narrow line widths can be optimized for over-lap with favorable rotational–vibrational transition features ofimportant molecular species that have dipole moments, suchas NO, CO2, CO, H2O, SiO, and BO. Access to ground elec-tronic state population information is often available by probingrotational-vibrational transitions in the 1–5-�m wavelengthregion. Neither O2 nor N2 have dipole moments, and so arenot considered candidate species for this approach; however, inthe case of O2, it is possible to probe the ground state by absorp-tion via the A electronic band transition (b1Σ+g ← X3Σ−g ) near760 nm. This approach has been used to characterize shock tubeflows,79 but has not yet been applied to either arc-jet or ICPfacility measurements.
Recently, the TDLAS technique was used to probe CO ina Mars atmosphere study in an arc-jet facility, where path-integrated values of translation temperature, velocity, and COconcentration were obtained.80 To date however, the applica-tion of TDLAS in the boundary layer near a catalytic or reactingmaterial surface in a plasma facility to quantify recombined orreaction-produced molecules has not been reported.
4.4.3. Raman spectroscopyRaman scattering, like LIF, is an inelastic scattering pro-
cess, but involves excitation to a virtual upper energy level. InRaman spectroscopy, a laser beam illuminates the gas mixtureand Raman scattered photons are detected at wavelengths off-set from the illumination wavelength by increments determinedby the vibrational and rotational energy spacing of moleculesin gas. By choosing an appropriate laser wavelength (typically
in the ultraviolet since Raman cross sections scale as frequencyto the fourth power), and using a high-resolution spectral fil-ter (often a spectrometer), scattered signals from molecules in agas mixture can be recorded and analyzed for species concen-tration and temperature. Details of this common spectroscopictechnique can be found in Eckbreth.56
An attractive attribute of Raman scattering is that, as in thecase of LIF, it provides spatially resolved information, and socan be used to map temperature and species gradients. In addi-tion, each molecular species present scatters at its characteristicRaman wavelengths, so a single laser frequency can access mul-tiple species, depending on the strength of their Raman crosssections. Since all molecules are Raman-active, this techniquecan detect important species involved in UHTC oxidation andvolatilization processes, like SiO, SiO2, BO, BO2, CO, andCO2.
While applications to plasma flows in arc-jet and ICPfacilities are relatively sparse, one recent investigation hasdemonstrated the potential of this technique in the area of recom-bined molecular species quantification.81 In this investigation afrequency tripled Nd:YAG laser operating at 355 nm was usedto probe the boundary layer of an air plasma flowing over a flatstainless steel plate in an ICP facility. Despite the relatively weakRaman cross sections (∼10−31 cm2 sr−1) profiles of N2 and O2number density, rotational temperature, and vibrational temper-ature were obtained in the boundary layer flow. Long steady testtimes were needed to achieve usable signal-to-noise levels, butthe results are promising for future applications.
5. Summary
Arc-jet and ICP plasma tunnels remain the primary facil-ities used to ground test the performance of UHTC TPSmaterials and components for hypersonic flight. We havehighlighted the main features of the test conditions obtainedin these two types of facilities and discussed their similari-ties and differences. Various in situ optical diagnostics, bothestablished and under development, were described, that canprovide information to document test conditions, monitor theevolution of test articles, and provide data that can be usedto strengthen the accuracy of CFD models. The importanceof CFD modeling of the arc-jet and ICP test environments,and in particular the computation of species concentrationsat specimen surfaces, is emphasized as essential for materialsscience interpretations of UHTC test results. The increasingintegration of CFD modeling and in situ optical diagnosticsin plasma tunnel testing is sure to enhance the understandingand optimization of UHTC material performance in aerothermalenvironments.
Acknowledgements
This work was supported by the High-TemperatureAerospace Materials Program of the Air Force Office ofScientific Research through contracts FA9550-08-C-0049 (J.Marschall) and FA9550-08-1-0414 (D. Fletcher). We acknowl-edge Jan Thömel for the CFD results presented in Sections 3

Author's personal copy
J. Marschall, D.G. Fletcher / Journal of the European Ceramic Society 30 (2010) 2323–2336 2335
and 4.3, and Mickaël Playez for the emission measurementshighlighted in Section 4.2.
References
1. Fuller J, Blum Y, Marschall J. Topical issue on ultra-high-temperatureceramics. J Am Ceram Soc 2008;91:1397–502.
2. Fuller J, Sacks M. Special section: ultra-high temperature ceramics. J MaterSci 2004;39:5885–6066.
3. Kaufman L. Boride composites—a new generation of nose cap and leadingedge materials for reusable lifting re-entry systems. In: AIAA advancedspace transportation meeting, AIAA Paper 70-278. February 1970.
4. Bull J, Kolodziej P, Salute J, Keese D. Design, instrumentation and pre-flight testing of a sharp ultra-high temperature ceramic nosetip. NASATM-1998–112229; October 1998.
5. Kolodziej P, Bull J, Salute J, Keese DL. First flight demonstration of a sharpultra-high temperature ceramic nosetip. NASA TM-112215; December1997.
6. Kinney DJ, Bowles JV, Yang LH, Roberts CD. Conceptual design of a“SHARP”-CTV. In: 35th AIAA thermophysics conference, AIAA Paper2001-2887. June 2001.
7. Reuther J, Kinney D, Smith S, Kontinos D, Gage P, Saunders D. A reusablespace vehicle design study exploring sharp leading edges. In: 35th AIAAthermophysics conference, AIAA Paper 2001-2884. June 2001.
8. Metcalfe AG, Elsner NB, Allen DT, Wuchina E, Opeka M, Opila E. Oxi-dation of hafnium diboride. Electrochem Soc Proc 1999;99–38:489–501.
9. Wuchina EJ, Opeka MM. Oxidation of Hf-based ceramics. ElectrochemSoc Proc 1999;99–38:477–88.
10. Opila E, Levine S, Lorincz J. Oxidation of ZrB2- and HfB2-based ultra-hightemperature ceramics: effect of Ta additions. J Mater Sci 2004;39:5969–77.
11. Gasch M, Ellerby D, Irby E, Beckman S, Gusman M, Johnson S. Process-ing, properties, and arc jet oxidation of hafnium diboride/silicon carbideultra high temperature ceramics. J Mater Sci 2004;39:5925–37.
12. Chamberlain A, Fahrenholtz W, Hilmas G, Ellerby D. Oxidation ofZrB2–SiC ceramics under atmospheric and reentry conditions. Refract ApplTrans 2005;1:2–8.
13. Savino R, De Stefano Fumo M, Silvestroni L, Sciti D. Arc-jet testingon HfB2 and HfC-based ultra-high temperature ceramic materials. J EurCeram Soc 2008;28:1899–907.
14. Monteverde F, Savino R. Stability of ultra-high temperature ZrB2–SiCceramics under simulated atmospheric re-entry conditions. J Eur CeramSoc 2007;27:4797–805.
15. Zhang X, Hu P, Han J, Meng S. Ablation behavior of ZrB2–SiC ultra hightemperature ceramics under simulated atmospheric re-entry conditions.Compos Sci Technol 2008;68:1718–26.
16. Ito T, Kurotaki T, Sumi T, Fujita K, Ishida K, Mizuno M. Evaluation ofsurface catalytic effect on TPS in 110 kW ICP-heated wind tunnel. In:43rd AIAA aerospace sciences meeting and exhibit, AIAA Paper 2005-189.January 2005.
17. Marschall J, Pejakovic DA, Fahrenholtz WG, Hilmas GE, Zhu S, RidgeJ, Fletcher DG, Asma CO, Thömel J. Oxidation of ZrB2–SiC ultra-hightemperature ceramic composites in dissociated air. J Thermo Heat Trans2009;23:267–78.
18. Playez M, Fletcher DG, Marschall J, Fahrenholtz WG, Hilmas GE,Zhu S. Optical emission spectroscopy during plasmatron testing ofZrB2–SiC ultra-high temperature ceramic composites. J Thermo HeatTrans 2009;23:279–85.
19. Smith RK, Wagner DA, Cunningham J. A survey of current and futureplasma arc-heated test facilities for aerospace and commercial applications.In: 36th Aerospace sciences meeting and exhibit, AIAA Paper 1998-0146.January 1998.
20. Ragsdale R, Lanzo C, Randall D, Thorpe M. Reentry heating experimentsusing an induction heated plasma. NASA TM X-1978, Cleveland, OH;March 1970.
21. Bose D, Skokova K, Wright MJ, Reuther J. Ground-to-flight traceabilityanalysis of arcjet testing for the crew exploration vehicle. In: 41st AIAAthermophysics conference, AIAA Paper 2009-3845. June 2009.
22. Kolesnikov AF. The concept of local simulation for stagnation point heattransfer in hypersonic flows: applications and validation. In: 21st AIAAaerodynamic measurement technology and ground testing conference,AIAA Paper 2000-2515. June 2000.
23. Gökcen T. Effects of flowfield nonequilibrium on convective heat transferto a blunt body. In: 34th Aerospace sciences meeting and exhibit, AIAAPaper 96-0352. January 1996.
24. Barbante PF, Chazot O. Flight extrapolation of plasma wind tunnel stag-nation region flowfield. J Thermo Heat Trans 2006;20:493–9.
25. Parthasarathy TA, Rapp RA, Opeka M, Kearns RJ. A model for the oxida-tion of ZrB2, HfB2, and TiB2. Acta Mater 2007;55:5999–6010.
26. Rezaie A, Fahrenholtz WG, Hilmas GE. Evolution of structure during theoxidation of zirconium diboride-silicon carbide in air up to 1500 ◦C. J EurCeram Soc 2007;27:2495–501.
27. Fahrenholtz WG. Thermodynamic analysis of ZrB2–SiC oxidation: forma-tion of a SiC-depleted region. J Am Ceram Soc 2007;90:143–8.
28. Li J, Lenosky TJ, Först CJ, Yip S. Thermochemical and mechanical stabil-ities of the oxide scale of ZrB2 + SiC and oxygen transport mechanisms. JAm Ceram Soc 2008;91:1475–80.
29. Fletcher DG, Playez M. Characterization of supersonic and subsonicplasma flows. In: 25th AIAA aerodynmaic measurement technology andground test conference, AIAA Paper 2006-3294. June 2006.
30. Barbante PF, Degrez G, Sarma GSR. Computation of nonequilibrium high-temperature axisymmetric boundary-layer flows. J Thermo Heat Trans2002;16:490–7.
31. Magin T, Vanden Abeele DP, Degrez G. An implicit multiblock solverfor inductive plasma flows. In: Fluids 2000, AIAA Paper 2000-2480. June2000.
32. Vanden Abeele DP, Degrez G. Numerical model of high-pressure airinductive plasma under thermal and chemical non-equilibrium. In: 31stAIAA plasmadynamics and laser conference, AIAA Paper 2000-2416. June2000.
33. Bottin B, Vanden Abeele DP, Carbonaro M, Degrez G, Sarma GSR. Ther-modynamic and transport properties for inductive plasma modeling. JThermo Heat Trans 1999;13:343–50.
34. Wright MJ, Candler GV, Bose D. Data-parallel line relaxation method forthe Navier–Stokes equations. AIAA J 1998;36:1603–9.
35. Gökcen T, Chen Y-K, Skokova KA, Milos FS. Computational analysis ofarc-jet stagnation tests including ablation and shape change. In: 41st AIAAthermophysics conference, AIAA Paper 2009-3596. June 2009.
36. Gökcen T, Skokova K, Balboni JA, Terrazas-Salinas I, Bose D. Compu-tational analysis of arc-jet wedge calibration tests in IHF 6-inch conicalnozzle. In: 47th AIAA aerospace sciences meeting, AIAA Paper 2009-1348.January 2009.
37. Gökcen T, Stewart DA. Computational analysis of semi-elliptical nozzlearc-jet experiments: calibration plate and wing leading edge. In: 35th AIAAfluid dynamics conference and exhibit, AIAA Paper 2005-4887. June 2005.
38. Gordon S, McBride BJ. Computer program for calculation of complexchemical equilibrium compositions and applications I. Analysis. NASARP-1311, Cleveland, OH; October 1994.
39. Ramshaw JD. Self-consistent effective binary diffusion in multicomponentgas mixtures. J Non-Equilib Thermodyn 1990;15:295–300.
40. Gupta R, Yos J, Thompson R, Lee K, A review of reaction rates and thermo-dynamic and transport properties for an 11-species air model for chemicaland thermal nonequilibrium calculations to 30000 K. NASA RP-1232;August 1990.
41. Wright MJ, Bose D, Palmer GE, Levine E. Recommended collision inte-grals for transport property computations. Part 1. Air species. AIAA J2005;43:2558–64.
42. Wright MJ, Hwang HH, Schwenke DW. Recommended collision integralsfor transport property computations. Part 2. Mars and Venus entries. AIAAJ 2007;45:281–8.
43. Scatteia L, Borrelli R, Cosentino G, Bêche E, Sans J-L, Balat-PichelinM. Catalytic and radiative behaviors of ZrB2–SiC ultrahigh temperatureceramic composites. J Spacecraft Rock 2006;43:1004–12.
44. Scatteia L, Alfano D, Monteverde F, Sans J-L, Balat-Pichelin M. Effect ofmachining method on the catalytic and emissivity of ZrB2 and ZrB2–HfB2-based ceramics. J Am Ceram Soc 2008.

Author's personal copy
2336 J. Marschall, D.G. Fletcher / Journal of the European Ceramic Society 30 (2010) 2323–2336
45. Park C, Moore D. A polynomial method for determining local emissionintensity by Abel inversion. NASA TN D-5677; February 1970.
46. Spalding MJ, Krier H, Burton RL. Boron suboxides measured during igni-tion and combustion of boron in shocked Ar/F/O2 and Ar/N2/O2 mixtures.Comb Flame 2000;120:200–10.
47. Ralchenko Y, Kramida AE, Reader J. NIST atomic spectra database(Version 3.1.5). National Institute of Standards and Technology.http://physics.nist.gov/asd3; 2008.
48. Monteverde F, Bellosi A. Oxidation of ZrB2-based ceramics in dry air. JElectrochem Soc 2003;150:B552–9.
49. Monteverde F, Bellosi A. The resistance to oxidation of an HfB2–SiCcomposite. J Eur Ceram Soc 2005;25:1025–31.
50. Rizzo HF. Oxidation of boron at temperatures between 400 and 1300 ◦Cin air. In: Kohn JA, Nye WF, editors. Boron—synthesis, structure, andproperties. New York: Plenum Press; 1968. p. 175–89.
51. Roine A. HSC chemistry for windows, version 5.11. Pori, Finland: Out-okumpu Research Oy; 2006.
52. Hirsch K, Roth B, Altmann I, Barth K-L, Jentschke H, Lunk A, Schu-macher U. Plasma-induced silica-like protection layer formation onC/C–SiC heat-shield materials for re-entry vehicles. High Temp–High Press1999;31:455–65.
53. Altmann I, Bauer G, Hirsch K, Jentschke H, Klenge S, Roth B, SchinköthD, Schumacher U. In-situ diagnostics of the interaction region betweena nitrogen–oxygen plasma jet and hot C/C–SiC ceramic materials. HighTemp–High Press 2000;32:573–9.
54. Jentschke H, Hirsch K, Klenge S, Schumacher U. High resolution emis-sion and absorption spectroscopy for erosion product analysis in boundaryplasmas. Rev Sci Instrum 1999;70:336–9.
55. Herdrich G, Fertig M, Löhle S, Pidan S, Augweter-Kurtz M. Oxidationbehavior of siliconcarbide-based materials by using new probe techniques.J Spacecraft Rock 2005;42:817–24.
56. Eckbreth AC. Laser diagnostics for combustion temperature and species.Cambridge: Abacus Press; 1988.
57. Crosley DR, Jeffries JB, Smith GP. Absolute concentration measurementsof chemically-important flame radicals. Isr J Chem 1999;39:41–8.
58. Fletcher D. Arc-jet flow properties determined from laser-induced fluores-cence of atomic nitrogen. Appl Opt 1999;38:1850–8.
59. Fletcher DG, Bamford DJ. Arcjet flow characterization using laser-inducedfluorescence of atomic species. In: 7th AIAA/ASME joint thermophysics andheat transfer conference, AIAA Paper 98-2458. June 1998.
60. Löhle S, Auweter-Kurtz M, Herdrich G, Laux T. Measurements of NO inN2/O2 and N2/CO2 plasma flows. In: 36th AIAA thermophysics conference,AIAA Paper 2003-3487. June 2003.
61. Grinstead J, Driver D, Raiche G. Radial profiles of arc-jet flow proper-ties measured with laser-induced fluorescence of atomic nitrogen. In: 41stAerospace sciences meeting and exhibit, AIAA Paper 2003-0400. January2003.
62. Laux T, Feigl M, Stöckle T, Auweter-Kurtz M. Estimation of the surfacecatalyticity of PVD-coatings by simultaneous heat flux and LIF measure-ments in high enthalpy air flows. In: 34th AIAA thermophysics conference,AIAA Paper 2000-2364. June 2000.
63. Bamford DG, Dyer MJ, Bischel WK. Single-frequency laser measurementsof two-photon cross sections and Doppler-free spectra for atomic oxygen.Phys Rev A 1987;36:3497–500.
64. Bamford DJ, Bischel WK, Hickman AP, Dyer MJ.Proceedings of the soci-ety of photo-optical instrumentation engineers; vol. 912. 1988. p. 139–44.
65. Bamford DJ, Jusinski LE, Bischel WK. Absolute two-photon absorptionand three-photon ionization cross sections for atomic oxygen. Phys Rev A1986;34:185–98.
66. Fletcher DG. Arcjet flow properties determined from laser-induced fluores-cence of atomic nitrogen. In: 36th Aerospace sciences meeting and exhibit,AIAA Paper 98-0205. January 1998.
67. Goehlich A, Kawetzki T, Döbele HF. On absolute calibration with xenonof laser diagnostic methods based on two-photon absorption. J Chem Phys1998;108:9362–70.
68. Niemi K, Gathen VS-vd, Döbele HF. Absolute atomic oxygen densitymeasurements by two-photon absorption laser-induced fluorescence spec-troscopy in an RF-excited atmospheric pressure plasma jet. Plasma SourSci Technol 2005;14:375–86.
69. Niemi K, Gathen VS-vd, Döbele HF. Absolute calibration of atomicdensity measurements by laser-induced fluorescence spectroscopy withtwo-photon excitation. J Phys D Appl Phys 2001;34:2330–5.
70. Koch U, Gülhan A, Esser B. Two dimensional spatially resolved two photonoxygen atom laser induced fluorescence measurements in the flow field ofthe arc heated facility L3K. In: Danesy D, editor. Proceedings of the fifthEuropean symposium on aerothermodynamics for space vehicles (SP-563).Noordwijk, The Netherlands: European Space Agency; 2005. p. 493.
71. Canosa A, Le Picard SD, Geppert WD. Experimental kinetics study of thereaction of boron atoms, B(2PJ), with ethylene at very low temperatures(23–295 K). J Phys Chem A 2004;108:6183–5.
72. Stanton CT, Garland NL, Nelson HH. Temperature dependence of thekinetics of the reaction BO + O2. J Phys Chem 1991;95:8741–4.
73. Hinchen JJ. Kinetics for quenching and relaxation of boron oxide. J ChemPhys 1993;99:4403–10.
74. Takahara A, Tezaki A, Matsui H. Production of SiO and Si(3P) in thereaction of silane with O(1D). J Phys Chem A 1999;103:11315–20.
75. Okano A, Takayanagi K. Laser-induced fluorescence from collisionallyexcited Si atoms in laser ablation plume. J Appl Phys 1999;86:3964–72.
76. Walkup RE, Raider SI. In situ measurements of SiO(g) production duringdry oxidation of crystalline silicon. Appl Phys Lett 1988;53:888–90.
77. Feigl M, Auweter-Kurtz M. Investigation of SiO production in front of Si-based material surfaces to determine the transition from passive to activeoxidation using planar laser-induced fluorescence. 35th AIAA Thermo-physics Conference, AIAA Paper 2001-3022.
78. Tang S, Deng J, Wang S, Liu W. Comparison of thermal and ablationbehavior of C/SiC composites and C/ZrB2–SiC composites. Corros Sci2009;51:54–61.
79. Philippe L, Hanson R. Tunable diode laser absorption sensor for tempera-ture and velocity measurement of O2 in air flows. In: 29th AIAA aerospacesciences meeting and exhibit, AIAA Paper 91-0360. January 1991.
80. Koch U, Riehmer J, Esser B, Gülhan A. Laser induced fluorescence anddiode laser absorption spectroscopy measurements in CO/CO2 hypersonicflow of LBK. In: Lacoste H, Ouwehand L, editors. Proceedings of the sixthEuropean symposium on aerothermodynamics for space vehicles (SP-659).Noordwijk, The Netherlands: European Space Agency; 2009.
81. Studer D, Vervisch P. Raman scattering measurements within a flat plateboundary layer in an inductively coupled plasma wind tunnel. J Appl Phys2007;102, 03303-1-8.
Realization of a Gas-Surface Interaction Test Case for Model Validation
D. G. Fletcher J. Thömel & O. Chazot J. Marschall
U. Vermont von Karman Institute SRI International Burlington, VT Rhode-St-Genese, Belgium Menlo Park, CA
Abstract: This paper describes a numerical investigation of a surface exposed to a plasma flow for different plasma and material boundary conditions to allow an assessment of laser diagnostic measurements in the boundary layer. The eventual goal is to develop a test case to validate physical and chemical models underlying current gas-surface interaction simulations. Using an existing numerical model, boundary layer gradients of temperature and key species are predicted for different boundary layer edge and surface conditions in an inductively coupled plasma facility. These predictions are then used to assess which species can be measured quantitatively with sufficient accuracy for model validation purposes.
I. Introduction One of the critical issues in the development of economical yet robust atmospheric entry vehicles is the accurate modeling of aero-thermal heating of the vehicle thermal protection system (TPS). This issue has also been identified as a risk driver for the development of a new manned exploration vehicle [1] as well as an enabling technology for better-equipped unmanned exploration of the solar system. While understanding the physical and chemical processes that determine the surface heat flux has been an active pursuit of the aero-thermal research community for many years, investigations that couple accurate modeling of convective and radiative heating with the material response remain at an empirically limited level. As part of an international effort to improve this situation, a dedicated session of the 6th European Aerothermodynamics Symposium was held to establish the state of the art in this field for one of the many critical gas-surface interaction phenomena: surface catalysis. Different research groups participating in this session were asked to document their method for determining surface catalycity for candidate thermal protection materials tested in plasma facilities. This activity was expected to establish a reference point for further activities directed toward validation of the physical and chemical models that comprise the methods. All of the approaches for determining surface catalycity values that could be used to model material boundary conditions in flight relied largely on computational simulations of the test environment that included conservative and possibly limiting assumptions. Professor, Associate Fellow AIAA. PhD Candidate, Member AIAA. Associate Professor, Member AIAA. Senior Research Scientist, Senior Member, AIAA.
Copyright 2009 by the University of Vermont. Published by the American Institute of Aeronautics and Astronautics, Inc. with permission.
48th AIAA Aerospace Sciences Meeting Including the New Horizons Forum and Aerospace Exposition4 - 7 January 2010, Orlando, Florida
AIAA 2010-1249
Copyright © 2010 by University of Vermont. Published by the American Institute of Aeronautics and Astronautics, Inc., with permission.

In this paper, we present an analysis of stagnation-point testing that may lead to a useful experimental test case for validation of the underlying physical and chemical models that are used to interpret heat flux measurements in plasma facilities. As these same models are used in codes that estimate aero-thermal heating for entry and re-entry trajectories, interest in such a test case extends beyond plasma testing. By validation we mean a data set that allows an assessment of the surface-driven and gas-phase chemical reaction rates, physical transport properties and fluid dynamics of a reacting boundary layer above a well-known material exposed to high-temperature, or plasma gas flow. Since gas-surface interactions depend directly on the material exposed to the plasma, this first analysis cannot address all interactions. Instead, we have chosen to consider a stable surface material (non-eroding) with a relatively low surface temperature, such as a metallic material, to illustrate the approach. Subsequent efforts may involve more interesting materials that could offer a wider range of complex, and likely coupled, gas-surface interactions, such as oxidation, nitridation, erosion, sublimation, pyrolysis, or ablation. The work described in the following sections begins with a discussion of stagnation point heating as the basis for the choice of test conditions for this study. The discussion includes consideration of trajectory conditions, available diagnostic techniques, and test facility considerations. Following this discussion, predictions of species density and temperature gradients in the reacting boundary layer above the material surface are presented, with a description of the limiting assumptions used for these predictions. Key parameters are varied to establish which variables should be quantified to provide the most information about the state of the boundary layer. This is followed by an analysis of which diagnostic techniques can be used to accurately measure target species and thermodynamic property gradients, along with estimations of likely measurement signal levels. All of these precedent sections lead to a recommendation of a candidate test case for validating gas-surface interaction models.
II. Stagnation Point Heating and Plasma Testing Since stagnation point heating rates are the highest on any atmospheric entry, or re-entry, vehicle, all plasma ground-test facilities have stagnation point testing capability. Thus, our analysis considers only the stagnation test configuration. Two different types of plasma facility have been developed for testing thermal protection materials, and both are designed to replicate the local trajectory-heating rate for a wide range of trajectories and for different test gas mixtures. Tests of TPS materials are done to evaluate material performance at peak heating and total heat load conditions. Arc-jet facilities are the most common plasma test facilities in the US, with large-scale installations at NASA, AEDC, and Boeing [2]. These plasma tunnels use a constricted-arc heater to operate at the high-reservoir conditions needed to produce supersonic plasma streams that provide post-shock stagnation conditions that match trajectory conditions. While arc-jet facilities exist in Europe and Russia, inductively coupled plasma (ICP) facilities are also used to simulate trajectory-heating conditions for stagnation-point testing [3]. Owing to the inductor designs, ICP facilities are typically operated in the subsonic flow regime, and thus provide a shock free subsonic plasma flow over the test article. Duplication of the

flight post-shock stagnation pressure is achieved by controlling the static pressure in the test chamber. Arc-jets and ICP facilities each have advantages and disadvantages. Clearly, the arc-jets provide a closer, but still not exact, match of the flight fluid dynamic conditions, but the energy deposition is based on a direct arc discharge that must attach to specially designed electrodes. Arc attachment in these devices results in avoidable entrainment of electrode material, typically copper, in the plasma stream as a contaminant. As yet there is no proof that copper in the plasma stream has a significant impact on the interpretation of material test results. In contrast, the ICP facilities use inductive coupling at radio frequency to energize the plasma, and there are no electrodes present in the flow path. This not only ensures contaminant-free operation, but also allows operation on a wide range of test gas mixtures. Another important difference between these facilities exists in the flow processes leading to the boundary layer edge conditions over a test sample. In the case of supersonic arc-jet operation, the rapid acceleration through a converging-diverging nozzle can lead to nonequilibrium or frozen conditions ahead of the detached shock at the test article. From these conditions, the plasma is compressed flowing through the shock, and then relaxation processes drive the plasma toward equilibrium at the boundary layer edge. For a subsonic ICP flow the plasma leaves the induction zone and flows toward the sample with a velocity less than 100 m/s along a roughly 150 cm length at nearly constant pressure. As with the post-shock arc-jet flow, relaxation processes drive the plasma toward equilibrium as it flows toward the boundary layer edge. Note that, to date, there have been no measurements that establish whether or not thermo-chemical equilibrium is actually reached at the boundary layer limit. For both facility types TPS material test conditions are established by a combination of heat flux (usually with a fully catalytic, cold-wall probe), pitot pressure, and surface temperature measurements. As long as the heat-flux probe has the same geometry as the probe holding the test sample, the test conditions at the boundary layer edge above the sample are expected to be the same as those above the cold-wall calorimeter (discussed further below). While these probe measurements alone may be able to characterize the aero-thermal heating conditions, they are not at all sufficient to establish the free stream plasma conditions in either facility. In both cases, unless there are additional measurements, modeling is required to extract free stream conditions [3-6]. This modeling is based on physical and chemical models that have been developed for aerothermal heating analysis, along with some assumptions about either initial conditions or the thermochemical state of the plasma at a certain location. Continued reliance on modeling to determine the boundary layer edge conditions presents a challenge for detailed investigations of gas-surface interactions, since any investigation must be able to establish edge conditions as a starting point. In a previous paper heat flux measurements from a standard model tested in both arc-jet and ICP facilities were shown to give the same results when the three similarity parameters: enthalpy, pressure, and velocity gradient; were properly accounted for. This is consistent with the theoretical view of stagnation point heating, as shown in the earlier paper [7]. While either facility can and should be used for detailed gas-surface interaction investigations, we have chosen to focus on ICP facilities for the remainder of
this paper, owing to easier access to the boundary layer in the shock-free flow and to contaminant-free operation. For incompressible flow, as in the subsonic ICP facilities, stagnation point heat transfer to a hemisphere can be represented by the following correlation of non-dimensional parameters:[8]
(1) where the Stanton Number, St, is the non-dimensional heat transfer, defined as:
(2) Rex is the length-based Reynolds number, and Pr is the Prandtl number. After substituting for the Stanton number, Eq. (1) can be rearranged and solved for the actual stagnation point heat transfer:
(3) where h is the enthalpy, is the density, μ is the viscosity and is the velocity gradient at the boundary layer edge, =du/dx. The velocity gradient characterizes the acceleration of the plasma flow around the test article. In a previous paper, measured values of free-stream velocity were used to compute velocity gradients in the 6 MW L3K arc-jet at the Deutsches Zentrum für Luft und Raumfahrt (DLR) and the 1.2 MW Plasmatron ICP at the von Karman Institute for Fluid Dynamics (VKI). These calculations showed that the velocity gradient in the ICP facility was nearly a factor of 10 less than in the supersonic arc-jet flow at the same nominal enthalpy and pressure [7]. Since the flow residence time is inversely proportional to the local velocity gradient, this implies that there is more time available for gas-phase and surface-initiated reactions in ICP facilities than in arc-jets, which provides an additional motivation for choosing an ICP test facility for this study. With this scaling for heat flux in mind, the VKI Boundary Layer Code was used to calculate stagnation-line profiles of temperature and species number densities in the boundary layer above a material surface for different test and boundary conditions with a nearly constant value of the stream enthalpy. These calculations are presented in the following section.
III. Boundary Layer Calculations The aero-thermal test conditions for the proposed investigation were selected based on considerations of typical re-entry vehicle design trajectories. Although other planetary atmospheres pose significant challenges to exploration vehicle design, earth re-entry was chosen for this investigation since all plasma ground-test facilities are designed to operate with air. In addition, because of the efforts of the combustion community, there are diagnostic techniques available for probing most species of interest, and some of these diagnostic techniques have already been implemented in plasma facilities as part of stream characterization activities. [9-14] The VKI Boundary Layer Code was developed as a computationally efficient means for analyzing stagnation point heating for trajectory simulation and for simulation of test

conditions in plasma facilities [15]. Rather than solving the full Navier-Stokes equations, the code instead solves the transformed boundary layer equations for chemically reacting flows over two-dimensional or axisymmetric stagnation region geometries. This allows the diffusion fluxes to be accurately modeled with the exact Stefan-Maxwell equations [16]. A full description of the code and comparisons with Navier-Stokes simulations can be found in Ref. 17. The surface recombination reactions converting O atoms to O2 and N atoms to N2 are assumed to proceed independently and with the same efficiency. This reaction efficiency is specified by the recombination coefficient, , defined as the fraction of atoms that collide with the surface that result in loss of the atom from the gas phase. Nitric oxide production at the surface is assumed to be zero (despite evidence to the contrary [18]). In addition, full energy accommodation at the surface from the recombination reactions is assumed for calculating heat flux for the different recombination rates. Gas phase chemistry is modeled with a 5 species chemical non-equilibrium air chemical model under the thermal equilibrium assumption. Chemical reaction rate constants from Dunn & Kang [19] are computed using the Arrhenius constants given in Appendix A. This particular chemical kinetics model has been widely used within VKI and also in the literature. Minor differences in terms of heat flux have been found using alternative kinetics models, such as that of Park [20]. For the present study, the VKI Boundary Layer Code has been used in its “classical” mode, which means a high Re number outer flow and an infinitely thin boundary layer is assumed [17]. All computations are well converged and the 100 point discretization that was used has been shown to be sufficiently grid independent in an earlier study. [17] In all cases, we assume that the surface conditions are not varying with time. The baseline configuration for the calculations was chosen to represent test capability in “small” ICP facilities, such as the 15 kW VKI Minitorch and the 30 kW ICP Facility at U. Vermont. The parameters for this configuration include a probe radius of 12.5 mm (with corresponding edge velocity gradient of 5000 s-1), a boundary layer edge temperature of 6000 K, static pressure of 50 hPa, and a non-catalytic surface. For an air plasma at this temperature and pressure, the corresponding enthalpy value is 25.9 MJ/kg, which represents an atmospheric entry speed of about 7.2 km/s. To assess the influence of changing parameters 8 computations were carried out varying: static pressure (50 hPa to 200 hPa), probe radius (12.5 mm to 25 mm) and surface recombination coefficient ( = 0 to =1). For all computations, the boundary layer edge temperature is kept constant, and the wall surface temperature is arbitrarily set to 1000 K. Finally, the boundary layer edge plasma is considered to be in thermo-chemical equilibrium, thereby fixing the chemical composition to be nearly identical for all cases. The boundary layer properties for the baseline configuration (p = 50 hPa, R = 12.5 mm, and = 0) are shown below in Fig. 1. Rather than using either mass fraction or mole fraction, species number densities are shown, along with temperature as a function of distance from the material surface. This is done because number density and temperature are the basic measurable quantities for laser diagnostics of reacting species. At these conditions, the air plasma is highly dissociated, and the major species are N, O, and N2 in
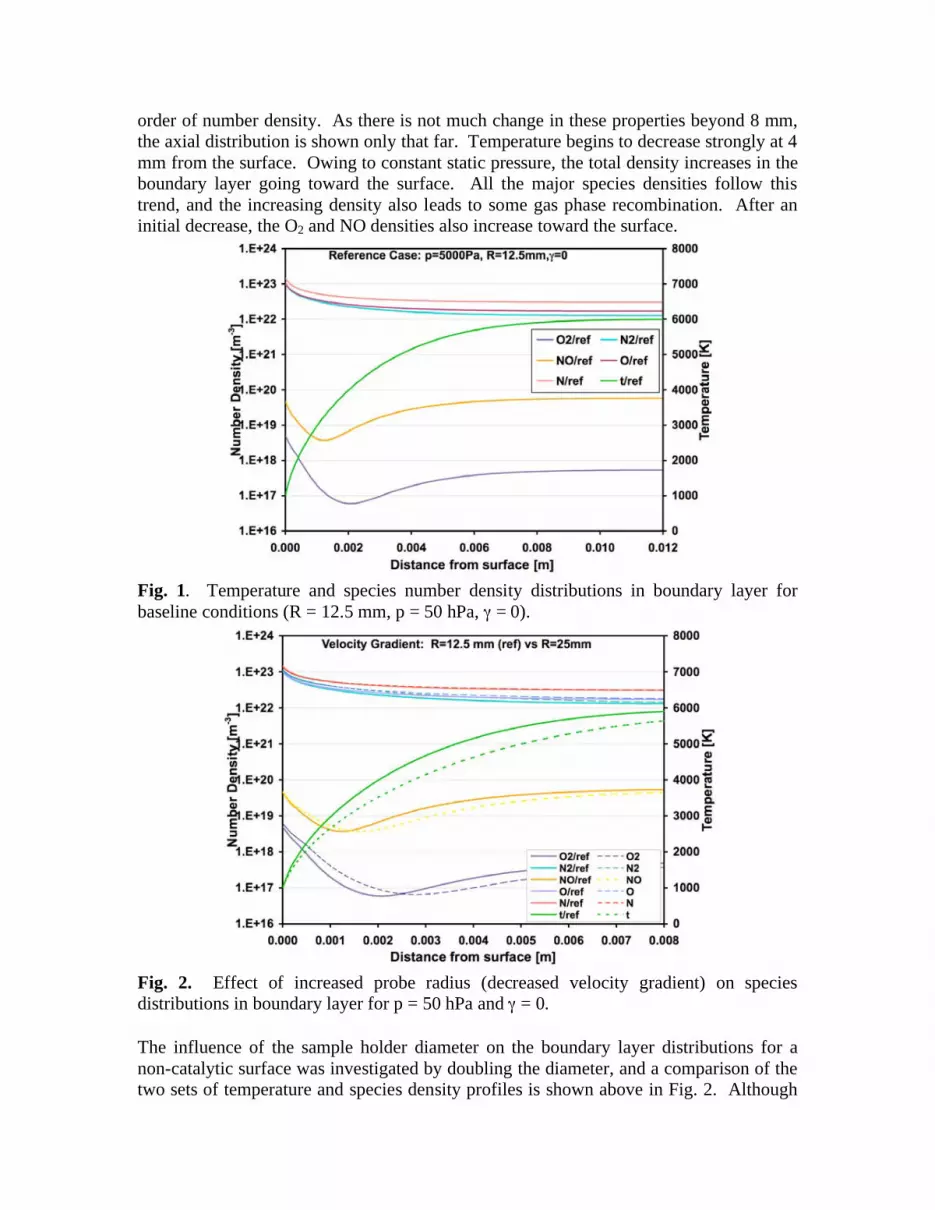
order of number density. As there is not much change in these properties beyond 8 mm, the axial distribution is shown only that far. Temperature begins to decrease strongly at 4 mm from the surface. Owing to constant static pressure, the total density increases in the boundary layer going toward the surface. All the major species densities follow this trend, and the increasing density also leads to some gas phase recombination. After an initial decrease, the O2 and NO densities also increase toward the surface.
Fig. 1. Temperature and species number density distributions in boundary layer for baseline conditions (R = 12.5 mm, p = 50 hPa, = 0).
Fig. 2. Effect of increased probe radius (decreased velocity gradient) on species distributions in boundary layer for p = 50 hPa and = 0. The influence of the sample holder diameter on the boundary layer distributions for a non-catalytic surface was investigated by doubling the diameter, and a comparison of the two sets of temperature and species density profiles is shown above in Fig. 2. Although
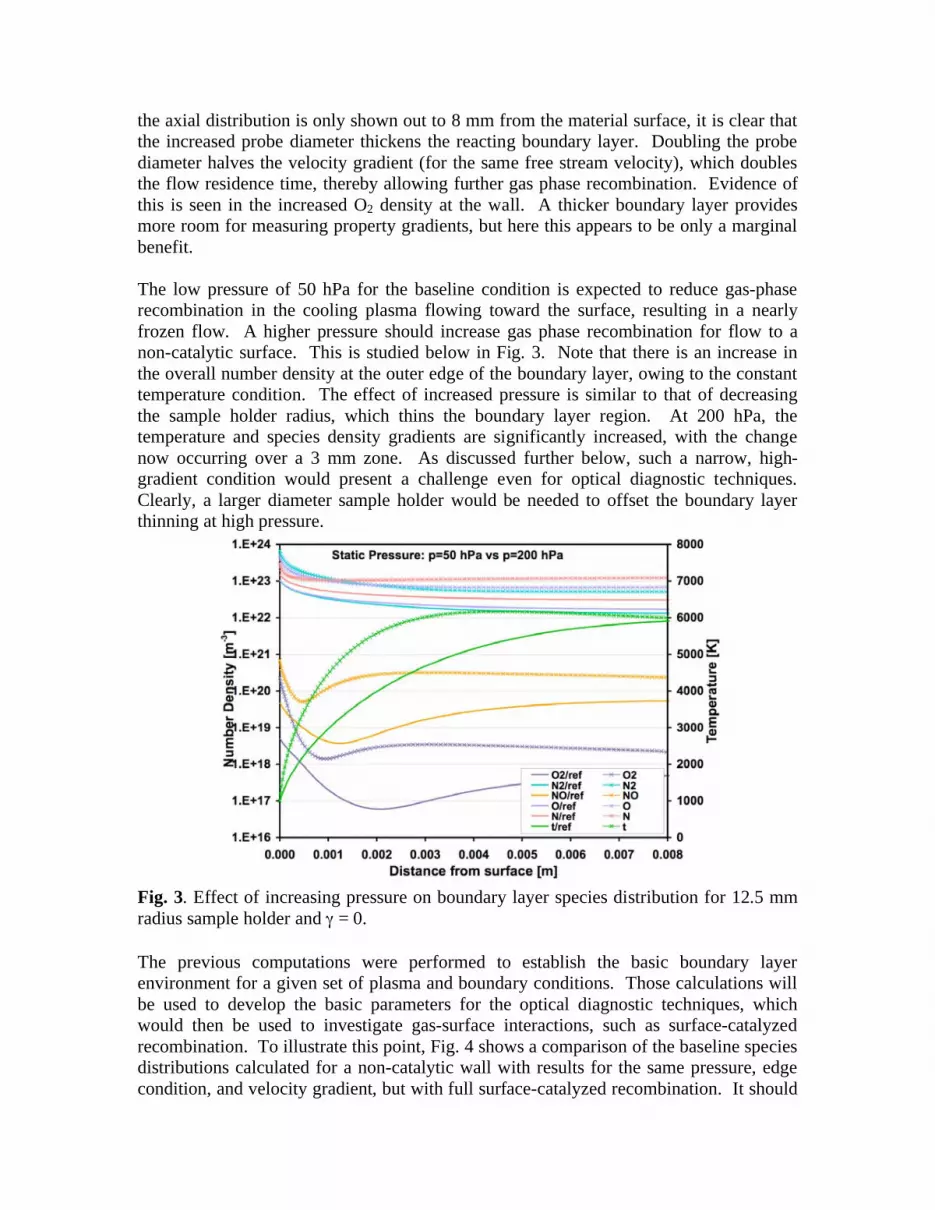
the axial distribution is only shown out to 8 mm from the material surface, it is clear that the increased probe diameter thickens the reacting boundary layer. Doubling the probe diameter halves the velocity gradient (for the same free stream velocity), which doubles the flow residence time, thereby allowing further gas phase recombination. Evidence of this is seen in the increased O2 density at the wall. A thicker boundary layer provides more room for measuring property gradients, but here this appears to be only a marginal benefit. The low pressure of 50 hPa for the baseline condition is expected to reduce gas-phase recombination in the cooling plasma flowing toward the surface, resulting in a nearly frozen flow. A higher pressure should increase gas phase recombination for flow to a non-catalytic surface. This is studied below in Fig. 3. Note that there is an increase in the overall number density at the outer edge of the boundary layer, owing to the constant temperature condition. The effect of increased pressure is similar to that of decreasing the sample holder radius, which thins the boundary layer region. At 200 hPa, the temperature and species density gradients are significantly increased, with the change now occurring over a 3 mm zone. As discussed further below, such a narrow, high-gradient condition would present a challenge even for optical diagnostic techniques. Clearly, a larger diameter sample holder would be needed to offset the boundary layer thinning at high pressure.
Fig. 3. Effect of increasing pressure on boundary layer species distribution for 12.5 mm radius sample holder and = 0. The previous computations were performed to establish the basic boundary layer environment for a given set of plasma and boundary conditions. Those calculations will be used to develop the basic parameters for the optical diagnostic techniques, which would then be used to investigate gas-surface interactions, such as surface-catalyzed recombination. To illustrate this point, Fig. 4 shows a comparison of the baseline species distributions calculated for a non-catalytic wall with results for the same pressure, edge condition, and velocity gradient, but with full surface-catalyzed recombination. It should

be noted that these two limiting cases are ideal. The surface-catalyzed reactions significantly alter the temperature gradient, which shows much steeper change closer to the surface. As expected, there is a strong influence on the species distributions owing to the surface driven production of O2 and N2. Instead of increasing N atom density toward the surface with increasing density, as for a non-catalytic wall, there is a strong decrease for the fully catalytic wall. Finally, although there is no surface production of NO, a strong increase in NO density approaching the surface is also evident.
Fig. 4 Species density distributions for p = 50 hPa, R = 12.5 mm and for different surface recombination rates ( = 1 and = 0).
Fig. 5. Distribution of N number density for different values of surface recombination rate for the 12.5 mm radius sample holder and 50 hPa pressure.

Again, it should be noted that fully catalytic condition is based on the assumption of independent O+O and N+N surface recombination reactions. Moreover, the recombination rate that produces = 1 is equivalent to assuming an infinitely fast surface reaction rate, which is not realistic. Actual species density distributions for real surface materials will probably lie between the two extremes shown in Fig. 4. This point is further examined in Fig. 5 for the N number density using four additional intermediate values of effective recombination rate. As the surface recombination efficiency decreases, the temperature-driven number density increase toward the wall overcomes N atom losses by the surface recombination to produce an upward trend at the wall. For N atoms, this occurs between = 0.1 and 0.01.
Fig. 6 Distribution of O number density for different values of surface recombination rate for the 12.5 mm radius sample holder and 50 hPa pressure.
Fig. 7 Distribution of NO number density for different values of surface recombination rate for the 12.5 mm radius sample holder and 50 hPa pressure.
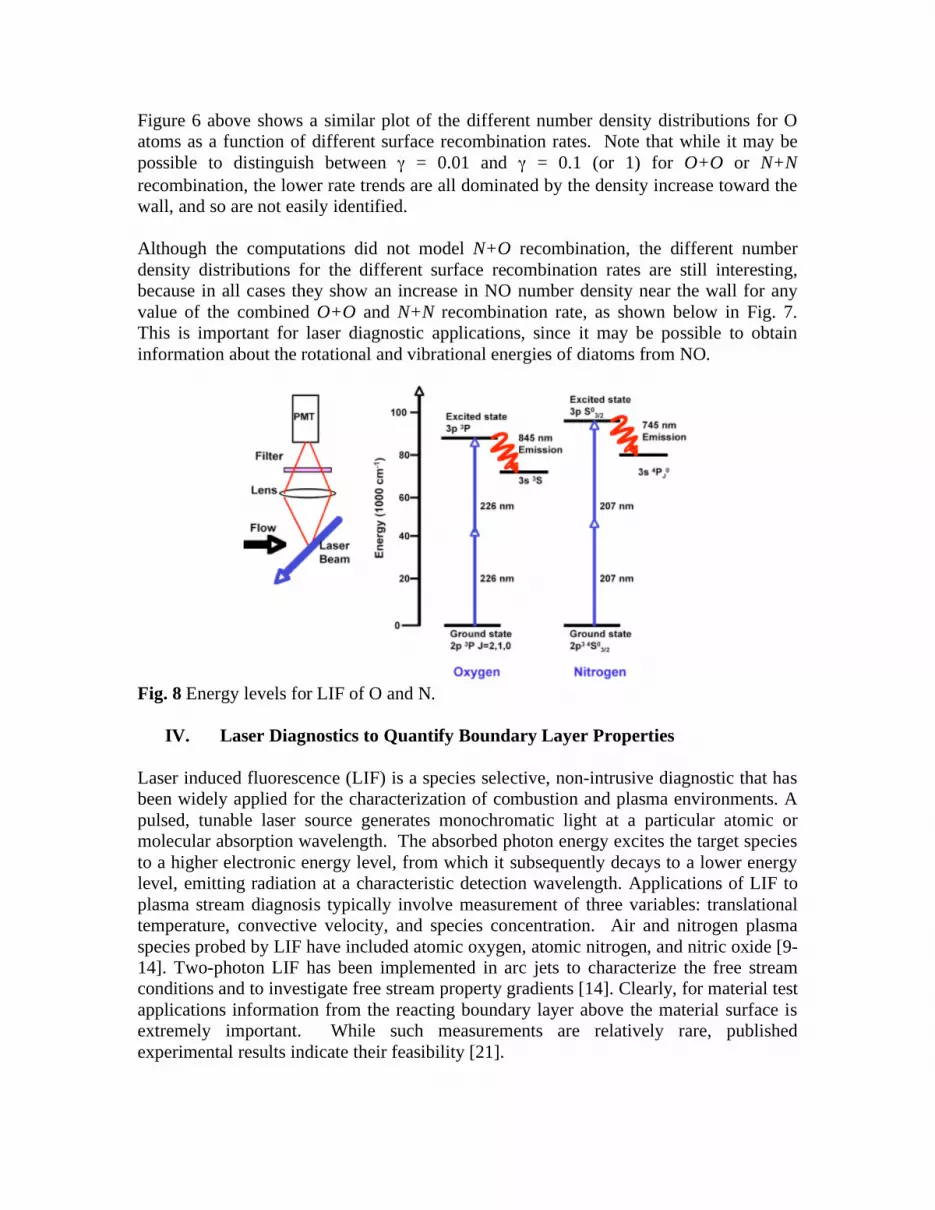
Figure 6 above shows a similar plot of the different number density distributions for O atoms as a function of different surface recombination rates. Note that while it may be possible to distinguish between = 0.01 and = 0.1 (or 1) for O+O or N+N recombination, the lower rate trends are all dominated by the density increase toward the wall, and so are not easily identified. Although the computations did not model N+O recombination, the different number density distributions for the different surface recombination rates are still interesting, because in all cases they show an increase in NO number density near the wall for any value of the combined O+O and N+N recombination rate, as shown below in Fig. 7. This is important for laser diagnostic applications, since it may be possible to obtain information about the rotational and vibrational energies of diatoms from NO.
Fig. 8 Energy levels for LIF of O and N.
IV. Laser Diagnostics to Quantify Boundary Layer Properties Laser induced fluorescence (LIF) is a species selective, non-intrusive diagnostic that has been widely applied for the characterization of combustion and plasma environments. A pulsed, tunable laser source generates monochromatic light at a particular atomic or molecular absorption wavelength. The absorbed photon energy excites the target species to a higher electronic energy level, from which it subsequently decays to a lower energy level, emitting radiation at a characteristic detection wavelength. Applications of LIF to plasma stream diagnosis typically involve measurement of three variables: translational temperature, convective velocity, and species concentration. Air and nitrogen plasma species probed by LIF have included atomic oxygen, atomic nitrogen, and nitric oxide [9-14]. Two-photon LIF has been implemented in arc jets to characterize the free stream conditions and to investigate free stream property gradients [14]. Clearly, for material test applications information from the reacting boundary layer above the material surface is extremely important. While such measurements are relatively rare, published experimental results indicate their feasibility [21].

One advantage of the LIF technique is that ground-state species populations can be probed, since even at relatively high temperatures, the ground electronic state populations typically predominate over the populations in higher electronic levels. Another advantage of LIF is that spatially resolved measurements are more easily made given that the fluorescence collection optics field-of-view and the excitation laser beam axis can be oriented to intersect at a desired location, as shown schematically on the left side of Fig. 8. For highly dissociated air or nitrogen plasmas, a useful target species is atomic nitrogen, which is a sensitive indicator of the degree of plasma dissociation [12]. Owing to the large electronic energy level spacing, LIF of either oxygen or nitrogen atoms requires two-photon excitation, which yields smaller excitation cross-sections than for single photon LIF. Energy levels involved in one approach for two-photon excitation of atomic nitrogen are shown on the right of Fig. 8 (the other approach is based at 211 nm), while energy levels for the most common excitation strategy for atomic oxygen are shown in the middle. For NO, single-photon excitation in either the ultraviolet band (A X), near 226 nm or the band (B X) near 207 nm is possible. The convenient overlap between NO single-photon and the two-photon excitation wavelengths for either O or N suggests that two of the three species can likely be probed during a single facility test.
Fig. 9 Experimental configuration for laser diagnostics of N, O and NO. For probing either atomic oxygen or atomic nitrogen, the experimental arrangement is essentially the same, as shown below in Fig. 9. A Nd:YAG-pumped dye laser provides the fundamental output, which is converted by the appropriate doubling or tripling crystal arrangement to the desired ultraviolet, two-photon wavelength. Unfortunately, it is not possible with current laser dyes to access both the 207 nm or 226 nm UV wavelengths. As indicated in the figure, the UV output is split into three different paths. The first is directed toward the plasma stream (either ICP or arc-jet), while the other two paths are directed toward a NO reference cell and a microwave-discharge flow reactor, respectively. The NO cell is used to assess the laser performance and to guide laser tuning toward the relatively sparse two-photon excitation wavelengths, and it also provides a mechanism for calibrating NO LIF measurements in the plasma stream.
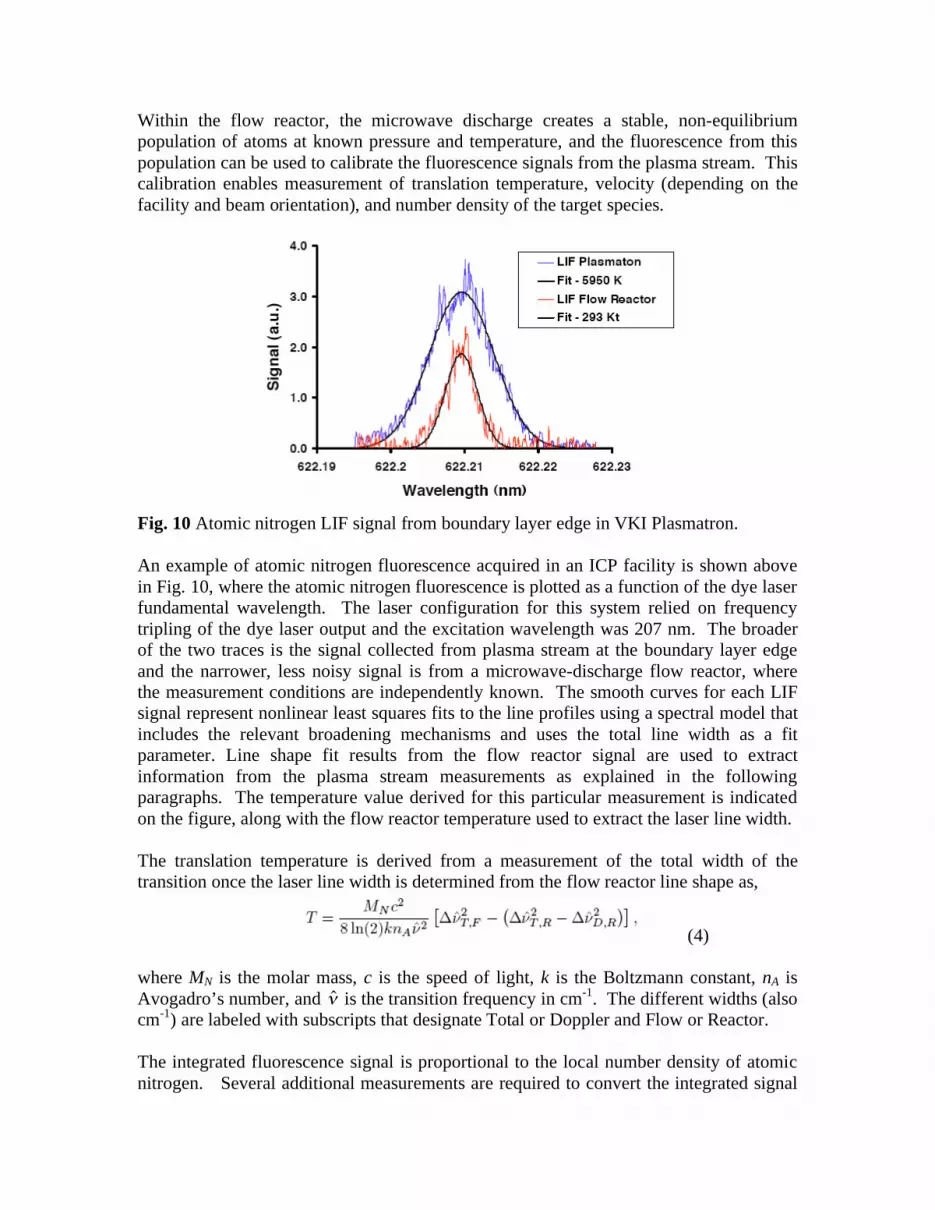
Within the flow reactor, the microwave discharge creates a stable, non-equilibrium population of atoms at known pressure and temperature, and the fluorescence from this population can be used to calibrate the fluorescence signals from the plasma stream. This calibration enables measurement of translation temperature, velocity (depending on the facility and beam orientation), and number density of the target species.
Fig. 10 Atomic nitrogen LIF signal from boundary layer edge in VKI Plasmatron. An example of atomic nitrogen fluorescence acquired in an ICP facility is shown above in Fig. 10, where the atomic nitrogen fluorescence is plotted as a function of the dye laser fundamental wavelength. The laser configuration for this system relied on frequency tripling of the dye laser output and the excitation wavelength was 207 nm. The broader of the two traces is the signal collected from plasma stream at the boundary layer edge and the narrower, less noisy signal is from a microwave-discharge flow reactor, where the measurement conditions are independently known. The smooth curves for each LIF signal represent nonlinear least squares fits to the line profiles using a spectral model that includes the relevant broadening mechanisms and uses the total line width as a fit parameter. Line shape fit results from the flow reactor signal are used to extract information from the plasma stream measurements as explained in the following paragraphs. The temperature value derived for this particular measurement is indicated on the figure, along with the flow reactor temperature used to extract the laser line width. The translation temperature is derived from a measurement of the total width of the transition once the laser line width is determined from the flow reactor line shape as,
(4)
where MN is the molar mass, c is the speed of light, k is the Boltzmann constant, nA is Avogadro’s number, and ˆ is the transition frequency in cm-1. The different widths (also cm-1) are labeled with subscripts that designate Total or Doppler and Flow or Reactor. The integrated fluorescence signal is proportional to the local number density of atomic nitrogen. Several additional measurements are required to convert the integrated signal
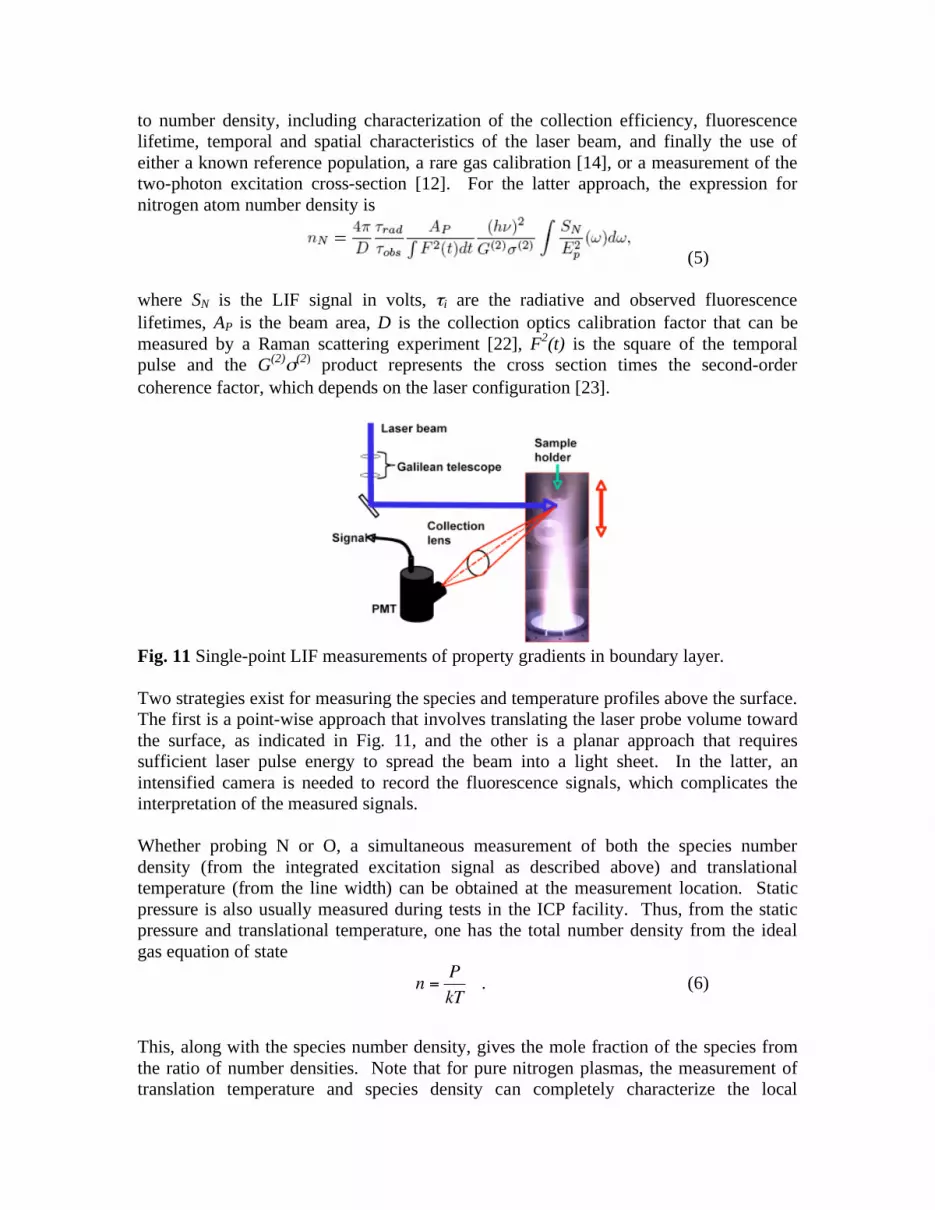
to number density, including characterization of the collection efficiency, fluorescence lifetime, temporal and spatial characteristics of the laser beam, and finally the use of either a known reference population, a rare gas calibration [14], or a measurement of the two-photon excitation cross-section [12]. For the latter approach, the expression for nitrogen atom number density is
(5)
where SN is the LIF signal in volts, i are the radiative and observed fluorescence lifetimes, AP is the beam area, D is the collection optics calibration factor that can be measured by a Raman scattering experiment [22], F2(t) is the square of the temporal pulse and the G(2) (2) product represents the cross section times the second-order coherence factor, which depends on the laser configuration [23].
Fig. 11 Single-point LIF measurements of property gradients in boundary layer. Two strategies exist for measuring the species and temperature profiles above the surface. The first is a point-wise approach that involves translating the laser probe volume toward the surface, as indicated in Fig. 11, and the other is a planar approach that requires sufficient laser pulse energy to spread the beam into a light sheet. In the latter, an intensified camera is needed to record the fluorescence signals, which complicates the interpretation of the measured signals. Whether probing N or O, a simultaneous measurement of both the species number density (from the integrated excitation signal as described above) and translational temperature (from the line width) can be obtained at the measurement location. Static pressure is also usually measured during tests in the ICP facility. Thus, from the static pressure and translational temperature, one has the total number density from the ideal gas equation of state
n =P
kT . (6)
This, along with the species number density, gives the mole fraction of the species from the ratio of number densities. Note that for pure nitrogen plasmas, the measurement of translation temperature and species density can completely characterize the local
thermodynamic conditions, as long as ionization is not significant, since the N2 number density can be found from
nN2 = n nN . (7)
For air plasmas, measurement of both O and N number densities is required to provide a more complete understanding of the boundary layer conditions. Based on the species density distributions shown in Fig 4 for the two limiting cases of zero and complete surface recombination, any LIF approach must have a spatial resolution of at least 0.5 mm. This would allow at least eight separate measurements within the steepest gradient region. Both single photon and two-photon LIF techniques have to address nonlinear signal behavior that can result from too great a laser intensity (laser power/beam area) in the probe volume. One example is the onset of multi-photon ionization in the case of two-photon excitation of atomic oxygen, where the limit for avoiding ionization has been published by Bamford [24] as 25 MW/cm2. If we assume a uniform energy profile over a 0.5 mm diameter and a square temporal pulse of 5 ns, this limits the beam energy to about 250 μJ. This limit can be tested in situ by monitoring LIF signals as the beam energy is varied and then fitting the slope, which should be linear for single photon LIF and quadratic for two-photon LIF. However, to evaluate the feasibility of measuring the N atom density gradients, we can use the 0.5 mm beam diameter and 250 μJ pulse energy to calculate the expected signal levels for comparison with previously published values. By rearranging Eq. 5 to solve for the integrated signal as
S( )d =D
4obs
rad
F(t)2dt
Ap
G(2) (2)
(h )2Ep2nN , (8)
and values for some of the terms on the right hand side from previously published arc-jet measurements [12], the expected integrated signal level for the 211 nm transition of N can be estimated for different values of nN. (Here we use the 211 nm transition instead of the 207 nm transition shown in Fig. 8, owing to the availability of the experimental data.) However, for the arc-jet measurements the photomultiplier tube was far from the measurement location, giving a low value of the detector calibration factor for the f/18 optical system. For our application in a smaller ICP facility, we expect to achieve f/6, and so our value of D here is set to 4.6(10)-7 V-cm-sr, rather than the value of 1.93 (10)-8 given in Table 2 of [12]. Our static pressure of 50 hPa is considerably greater than the arc-jet value of approximately 2 hPa, and so our fluorescence quantum yield is lower ( obs/ rad = 0.26, rather than 0.82 as in [12). We also use our limiting value of beam area (0.02 cm2) and energy (250 μJ) calculated above. This gives
S( )d =1.8(10) 12nN (V-rad-s-1) , (9)
and for a nitrogen atom number density of 1020 m-3 (1014 cm-3) we expect an integrated signal level of appoximately180 V-rad-s-1. This is very close to the value of integrated signal (230 V-rad-s-1) for the lowest N number density measured in the arc-jet. While the uncertainty in the absolute number densities may be high owing to the low signal levels, the relative number densities are more precisely known, as discussed in [12]. This may allow a reasonable assessment of the predicted species density gradients.

This result suggests that direct measurements of temperature and atomic species density can be used to assess the surface-catalyzed recombination rate for materials with a catalysis parameter between 0.001 and 0.1 (refer to Fig. 5). For example, the use of a material surface with a catalysis parameter that has been quantified in a side-arm diffusion reactor (as in [18]) at a controlled surface temperature value in a pure nitrogen plasma would significantly limit the number of free parameters for modeling. While we have used the air plasma calculations as a basis for proposing a test case for reacting boundary layer model assessment, we recognize that the NO chemistry will complicate the interpretation of the test results. Thus, a better starting point for these experimental investigations would be to use a pure nitrogen plasma. Note that another interesting test case would be to measure the N atom density gradient for a non-catalytic material at different pressures. From such measurements it may be possible to assess the gas-phase recombination rate at the boundary layer condition. The next step in the development of a validation test case is to conduct boundary layer measurements of atomic nitrogen and oxygen for some of the cases discussed here. Specifically, we recommend:
1. Measurement of the temperature and N atom density gradients in a nitrogen plasma for pressures ranging from 50 hPa to 200 hPa (at least) in the region near a non-catalytic material to assess the gas phase reaction: N+N+M N2+M.
2. Measurement of the same variables plus the O atom and NO density gradients at the same conditions in air plasma.
3. Measurement of the temperature and N atom density gradient at 50 hPa in a nitrogen plasma in the near wall region of a highly catalytic material (with previously measured recombination probability to assess surface recombination.
4. Measurement of the same variables plus O atom and NO density gradients at the same conditions for air plasma.
For all of these cases, the stream conditions at the boundary layer edge must be well characterized. Based on the documented uncertainty in the measurements, future test case development should focus on the isolation of simpler gas/surface interaction rates for similar investigations.
V. Summary The VKI Boundary Layer Code has been used to estimate temperature and species density gradients in the stagnation region of an axisymmetric sample holder. These calculations were done assuming a 5 species air model and using a simplified surface recombination model (equal rates for O+O and N+N, with no NO production). Calculations of the gradients for different diameter sample holders, different static pressures, and varying surface recombination rates show that at the lowest pressure (50 hPa) there are significant differences in the gradients of N and NO approaching the surface. Results of the calculations for the 50 hPa and smaller sample diameter were then used to assess N atom detection for the 211 nm transition based on published values of
experimental parameters for that two-photon excitation scheme. The estimated integrated signal value compares reasonably well with that from previous measurements, and suggests that N density measurements from two-photon LIF can provide a reliable indication of the reacting boundary layer gradient, which can provide useful information about gas/surface interactions, such as surface catalyzed recombination.
VI. Acknowledgements The work of U. Vermont is supported by NASA Grant NNX08AC98A and by AFOSR High-Temperature Aerospace Materials Program Grant FA9550-08-1-0414. The work of SRI International is supported by the High-Temperature Aerospace Materials Program of the Air Force Office of Scientific Research through contract FA9550-08-C-0049.
VII. References
1. Z. Krevor, G. Epstein, P. Benfield, and G. Deckert, “Leveraging Reliability in Support of Risk Balancing and Weight Reduction on Orion”, AIAA 2009-6725, AIAA SPACE 2009, Pasadena, 12-14 September (2009).
2. R. K. Smith, D. A.Wagner, and J. W. Cunningham, “A Survey of Current and Future Plasma Arc-Heated TestFacilities for Aerospace and Commercial Applications”, AIAA Paper No. 98-0146, 36th Aerospace Sciences Meeting, 12-15 January, Reno, NV, (1998).
3. B. Bottin, O. Chazot, M. Carbonaro, V. Vander Haegen, and S. Paris, “ The VKI Plasmatron Characteristics and Performance”, NATO RTO EN-8, Neuilly-sur-Seine Cedex, France, pp. 6/1-26, (1999).
4. A. Gülhan and B. Esser, “ A Study on Heat Flux Measurements in High Enthalpy Flows”, AIAA Paper No. 2001-3011, 35th AIAA Thermophysics Conference, 11-14 June, Anaheim, CA (2001).
5. A. F. Kolesnikov, “ Extrapolation from High Enthalpy Tests to Flight Based on the Concept of Local Heat Transfer Simulation”, NATO RTO EN-8, Neuilly-sur-Seine Cedex, France, pp. 8B/1-14, (1999).
6. J. Grinstead, G. Raiche, T. Gökçen, “Test Engineering for Arc Jet Testing of Thermal Protection Systems: Design, Analysis, and Validation Methodologies”, AIAA-2006-3290, 25th AIAA Aerodynamic Measurement Technology and Ground Testing Conference, San Francisco, California, June 5-8, (2006).
7. D. G. Fletcher and M. Playez, “Characterization of Supersonic and Subsonic Plasma Flows”, AIAA 2006-3294, 25th AIAA Aerodynamic Measurement Technology and Ground Testing Conference, San Francisco, California, June 5-8, (2006).
8. F. M. White, Viscous Fluid Flow, McGraw-Hill, New York, p. 183, (1974). 9. D. J. Bamford, A. O’Keefe, D. S. Babikian, D. A. Stewart, and A. W. Strawa,
“Characterization of Arc-Jet Flows Using Laser-Induced Fluorescence”, J. Thermophysics and Heat Transfer, 9, pp. 26-33, (1995).
10. U. Koch, A. G¨ulhan, B. Esser, F. Grisch, and P. Bouchardy, “ Rotational and Vibrational Temperature and Density Measurements by Planar Laser-Induced NO Fluorescence in a Nonequilibrium High Enthalpy Flow”, RTO/AGARD Fluid

Dynamics Panel Symposium, Advanced Aerodynamic Measurement Technology, Seattle, Wa 22-25 September, (1997).
11. M. Feigl, and M. Auweter-Kurtz, “ Investigation of Nitric Oxide in a High Enthalpy Air Plasma Flow Using Laser-Induced Fluorescence”, AIAA Paper No. 98-2459, 7th AIAA/ASME Joint Thermophysics Conference, Albuquerque, NM, July, (1998).
12. D. G. Fletcher, “ Arcjet Flow Properties Determind from Laser-Induced Fluorescence of Atomic Nitrogen”, Applied Optics, 38, No. 9, pp. 1850-1858, March, (1999).
13. D. G. Fletcher and D. G. Bamford, “ Arcjet Flow Characterization Using Laser-Induced Fluorescence of Atomic Species”, AIAA Paper No. 98-2458, 7th AIAA/ASME Joint Thermophysics Conference, Albuquerque, NM, July, (1998).
14. J. H. Grinstead, D. M. Driver, and G. A. Raiche, “ Radial Profiles of Arcjet Flow Properties Measured with Laser-Induced Fluorescence of Atomic Nitrogen”, AIAA Paper No. 2003-0400, AIAA 41st Aerospace Sciences Meeting, Reno, NV, 6-9 Janurary, (2003).
15. P. F. Barbante, “Accurate and Efficient Modeling of High Temperature Non-equilibrium Air Flows,” Ph.D. Thesis, Univ. Libre de Bruxelles, Bruxelles, Belgium, (2001).
16. P. F. Barbante, “How Diffusion Modeling Affects Prediction of Heat Flux Loads,” Sixth European Symposium on Aerothermodynamics of Space Vehicles, SP-659, ESA, Noordwijk, The Netherlands, p. 14-1, 3–6 Nov. (2008).
17. P. F. Barbante, “Heat Flux Duplication Between Ground Facility and Hypersonic Flight”, J. Thermophysics and Heat Transfer, 23, pp. 684-692, October-December, (2009).
18. D.A. Pejakovic, J. Marschall, L. Duan, and M.P. Martin, “Nitric Oxide Production from Surface Recombination of Oxygen and Nitrogen Atoms,” J. Thermophysics and Heat Transfer, 22, pp. 178-186, (2008).
19. M. G. Dunn and S. W. Kang, “Theoretical and Experimental Studies of Reentry Plasmas”, NASA Technical Report CR-2232, (1973).
20. C. Park, “Review of Chemical-Kinetic Problems of Future NASA Missions, I: Earth Entries, J. Thermophysics and Heat Transfer, 7, pp. 385-398, (1993).
21. T. Laux, M. Feigl, T. Stockle, and M. Auweter-Kurtz, “Estimation of the surface catalycity of PVD-coatings by simultaneous heat flux and LIF measurements in high enthalpy air flows,” AIAA 34th Thermophysics Conference, Denver, CO, 2000.
22. W. K. Bischel, D. J. Bamford, and L. E. Jusinski, “Absolute calibration of a fluorescence collection system by Raman scattering of H2”, Appl. Opt, 25, pp. 1215-1221, (1986).
23. D. J. Bamford, W. K. Bischel, A. P. Hickman, and M. J. Dyer, “Measurement of Two-Photon Absorption Cross Sections inAtomic Oxygen at 226 nm: Single-Frequency versus Multi-mode Lasers”, SPIE, 912, pp. 139-144, (1988).
24. D. J. Bamford, L. E. Jusinski, and W. K. Bischel, “Absolute two-photon absorption and three-photon ionization cross sections for atomic oxygen”, Phys. Rev. A, 34, pp. 185-198, (1986).
VIII. Appendix A
Chemical model for the mixture air5.mix (Dunn & Kang)
--------------------------------------------------------------------
The constants for the chemical reactions are in the order: cf bf ef
CGS Unit system
NR = 17.0
O2 + N = 2O + N
3.600e+18 -1.00 5.950e+04
O2 + NO = 2O + NO
3.600e+18 -1.00 5.950e+04
O2 + O = 2O + O
9.000e+19 -1.00 5.950e+04
O2 + O2 = 2O + O2
3.240e+19 -1.00 5.950e+04
O2 + N2 = 2O + N2
7.200e+18 -1.00 5.950e+04
N2 + O = 2N + O
1.900e+17 -0.50 1.130e+05
N2 + NO = 2N + NO
1.900e+17 -0.50 1.130e+05
N2 + O2 = 2N + O2
1.900e+17 -0.50 1.130e+05
N2 + N = 2N + N
4.085e+22 -1.50 1.130e+05
N2 + N2 = 2N + N2
4.700e+17 -0.50 1.130e+05
NO + O2 = N + O + O2
3.900e+20 -1.50 7.550e+04
NO + N2 = N + O + N2
3.900e+20 -1.50 7.550e+04
NO + O = N + O + O
7.800e+21 -1.50 7.550e+04
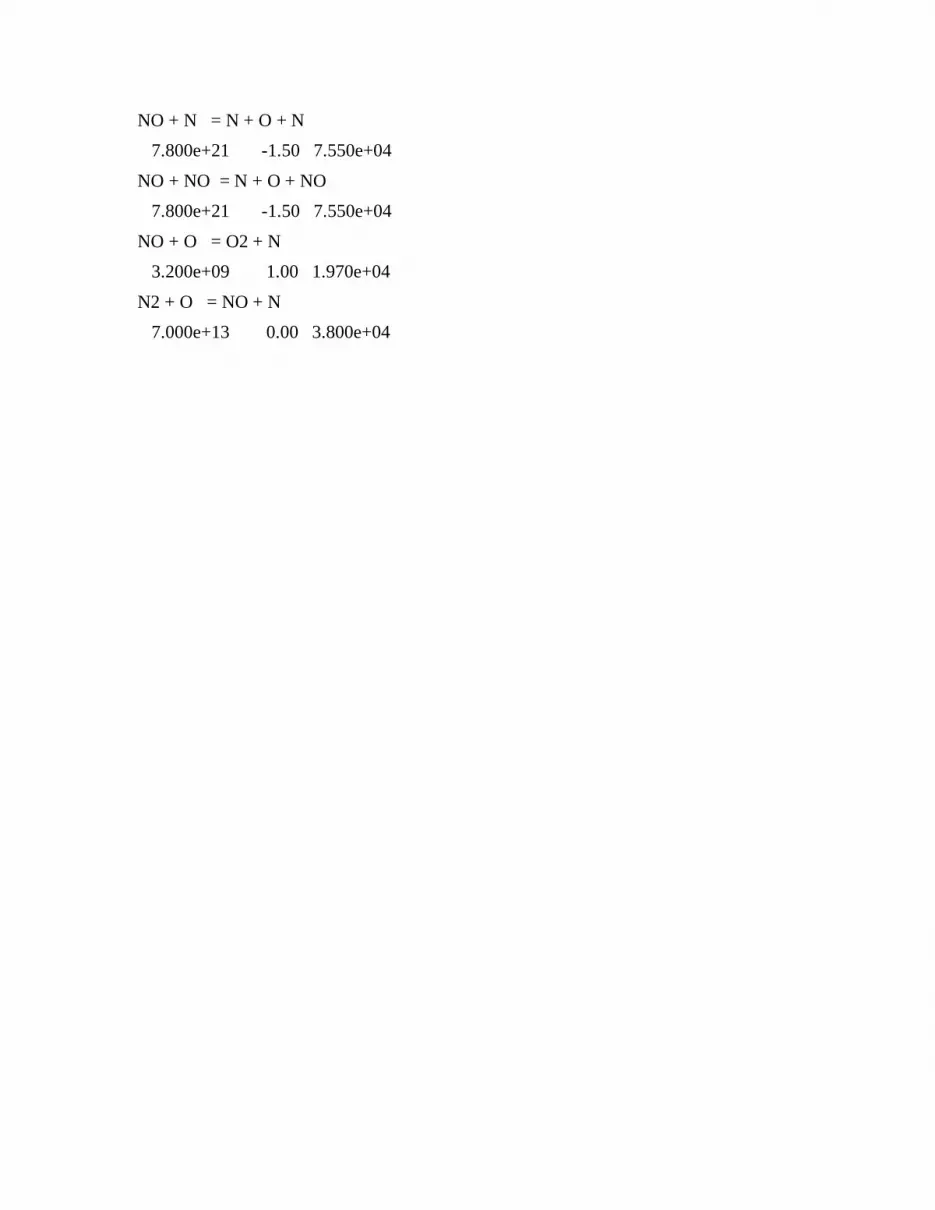
NO + N = N + O + N
7.800e+21 -1.50 7.550e+04
NO + NO = N + O + NO
7.800e+21 -1.50 7.550e+04
NO + O = O2 + N
3.200e+09 1.00 1.970e+04
N2 + O = NO + N
7.000e+13 0.00 3.800e+04

Investigations of Surface-Catalyzed Recombination
Reactions in the Mars Atmosphere
Max Dougherty∗, Walt Owens∗, Jason Meyers†, and Douglas Fletcher‡
University of Vermont, Burlington, Vermont, 05401, USA
In the design of a thermal protection system (TPS) for a planetary entry vehicle, ac-curate modeling of the trajectory aero-heating poses a significant challenge owing to largeuncertainties in chemical processes taking place at the surface. Even for surface-catalyzedreactions, which have been investigated extensively, there is no consensus on how theyshould be modeled; or, in some cases, on which reactions are likely to occur. Current TPSdesigns for Mars missions rely on a supercatalytic boundary condition, which assumes thatall dissociated species recombine to the free stream composition. While this is recognizedto be the the most conservative approach and leads to an increased TPS mass, discrepan-cies in aero-heating measurements in ground test facilities preclude less conservative designoptions. The present work is aimed at providing more information about surface catalyzedreactions for Mars exploration missions. Measurements of dissociated species above a cat-alytic surface are obtained using two-photon absorption laser-induced fluorescence (TALIF)implemented in a new 30 kW inductively coupled plasma torch facility.
I. Introduction
Aerothermodynamic heating presents a significant challenge in the design of a thermal protection systemfor atmospheric reentry. Surface catalyzed recombination reactions must be considered in any heat fluxanalysis of a candidate TPS due to the significant chemical energy produced during recombination.3 Despitea sustained effort to investigate surface catalyzed reactions and to develop realistic physics based models forimplementation in design codes, the state of the art relies on relatively simple surface boundary conditions.These are (in order of predicted heat flux level): a) supercatalytic, which assumes that all dissociated speciesrecombine to their free stream values; b) fully-catalytic, in which surface catalytic reactions occur with aninfinite rate; c) partially catalytic, which is used when catalytic properties of the surface material are knownfor all recombining species and includes finite reaction rates; and d) non-catalytic, which assumes that nosurface recombination reactions occur. Depending on the gas composition and entry velocity, the differencein predicted heat flux between non-catalytic and fully catalytic can be a factor of two or more. Figure 1shows a comparison of computed heat flux values for different surface recombination models. The extremedifference in heating between non-catalytic and supercatalytic is readily apparent.
Owing to high interest in scientific missions to Mars, surface catalysis in the Mars atmosphere is a topicthat merits further study. The Martian atmosphere contains approximately 97% CO2 and 3% N2 by volume,and trace amounts of other species (Ar, O2, etc.). During entry into this atmosphere, CO2 molecules readilydissociate into CO and O when a shockwave is encountered. The major species of interest are therefore CO,O, C, N, and NO.
The Mitcheltree model4 considers the following reactions:
O + (s)→ Os; CO + Os → CO2;CO + (s)→ COs; O + COs → CO2;
∗Graduate student, School of Engineering, 33 Colchester Ave, Burlington, VT 05401 USA†Post-doctoral researcher, School of Engineering, 33 Colchester Ave, Burlington, VT 05401 USA, member AIAA‡Professor, School of Engineering, 33 Colchester Ave, Burlington, VT 05401 USA, Associate Fellow AIAA
1 of 11
American Institute of Aeronautics and Astronautics

Figure 1: Computed heat flux for various catalytic models for Mars Science Laboratory trajectory peakheating5
where (s) represents a surface adsorption site. These reactions assume an Eley-Rideal (ER) recombinationmechanism. Because it produces the dominant free stream molecule, it closely resembles the supercatalyticassumption. This model ignores the competing reaction:
O + O → O2
However, in laboratory side-arm diffusion reactor tests,12 it has been found that the oxygen recombinationoccurs more readily than carbon dioxide recombination and as a result, it is likely that the supercatalyticassumption is overly conservative.
For this reason, surface catalyzed reactions in the Mars atmosphere are being studied using laser spec-troscopic techniques in a new 30 kW Inductively Coupled Plasma (ICP) Torch Facility. Despite its normallysubsonic operation, an ICP facility has two main benefits over arc-jet facilities: 1) plasma is generated usingradio-frequency coupling, without electrodes, and therefore is free of contaminants; and 2) the composition ofthe test gas can be varied quickly and accurately. Moreover, scaling of the stagnation point heat flux betweenan ICP facility and arc-jets is understood, as both facilities must match the same set of flight parameters:total enthalpy, post-shock total pressure, and stagnation point velocity gradient. In principle, the boundarylayer of such a facility is very similar to that found in a flight condition at the stagnation point providedthat these similarity parameters are duplicated.
The goal of the current work is to characterize surface catalyzed reactions in the Martian atmosphere bymeasuring the major species in the boundary layer, including the arriving species flux rates. It is expectedthat the results of these experiments will show which recombination reactions prevail for a Mars entry flightcondition and will provide a basis from which to create more accurate surface recombination models for CO2
and N2 plasmas.After a brief discussion of the thermodynamics of the Mars atmosphere mixture, the 30 kW ICP Torch
Facility is described and the laser diagnostic strategies being implemented for this investigation are presented.Preliminary results from boundary layer surveys of the reactants are presented and discussed, and the presentfindings are summarized.
II. Computational approach
In order to determine equilibrium properties for gas mixtures used in the ICP facility, the MUTATION(MUtli-component Transport And Thermodynamic properties/chemistry for IONized gases) library7 is used.
2 of 11
American Institute of Aeronautics and Astronautics

MUTATION is a thermodynamic library that provides thermodynamic and transport properties for user-defined gas mixtures. Figure 2 is a plot of the equilibrium mass fraction for an 8 species CO2 model (e−, C,O, CO, CO2, O2, C+, O+) at 100 torr from 600 to 10,000 K. At roughly 2000 K, CO2 begins to dissociateinto O and CO. There is an increase in O2 with a maximum at 3000 K. Between 4000 and 6000 K, CO andO are the dominant species in the mixture. At roughly 6500 K, the ratio of CO to O is one-to-one. Beyondthis point, CO dissociates and its constituent atoms begin to ionize. For pure CO2, the 30 kW ICP TorchFacility has achieved boundary layer edge temperatures approaching 5500 K, suggests a CO:O mass ratio ofapproximately 65:35 entering the boundary layer.
Temperature (K)
Speciesmassfraction
2000 4000 6000 8000 100000
0.2
0.4
0.6
0.8
1 e-COCOCO2O2C+O+
Figure 2: Equilibrium composition of 8 species CO2 from MUTATION
III. Facility description
The plasma diagnostics lab at the University of Vermont is built around a 30 kW ICP Torch. Thetorch itself is comprised of three main systems: the radio frequency (RF) power supply, the injector blockassembly, and the test chamber. The power supply can generate up to 30 kW at frequencies from 2.5 to 4MHz. The plasma is generated within a quartz tube connected to the injector block. Quartz is used becauseit is considered to be a non-reacting material and thus will not alter the plasma chemistry. Surrounding thequartz tube is a water-cooled copper coil through which current is run from the power supply, inducing anRF magnetic field within the quartz tube and thus creating the plasma. A table of the ICP Torch Facilityparameters is given in Table 1. Gas flows are metered by mass flow controllers, usually with a predeterminedflow rate and a vacuum pump is used to regulate the static pressure in the test chamber.
Inductive heater power [kW] 30
Enthalpy range [MJ kg−1] 10 - 40 (for air)
Mach range < 0.3 to 1
qstag, [W cm−1] 10-290
Pstag, [atm] 0.05 - 1.0
Plasma jet diameter [mm] 36
Test gas air, Ar, N2, CO2, variable mixture fractions
Table 1: Plasma torch parameters
3 of 11
American Institute of Aeronautics and Astronautics

Test sample surface temperature is measured with a two-color pyrometer that observes the sample surfacedirectly through an angled viewport on the bottom flange of the test chamber. A two-color pyrometer isused because it can provide a surface temperature measurement without having to know the material surfaceemissivity. By calibrating both pyrometer channels, the device can also provide an emissivity value for thedetection wavelength. Heat flux measurements are taken with either a slug calorimeter or a gardon gagebefore samples are placed in the plasma flow. Temperature measurements for the slug calorimeter areobtained from a thermocouple attached to the back of the copper slug. Measured heat flux values from thefacility have been reported elsewhere.9 Test chamber static pressure measurements are obtained from a porton the chamber. Table 2 shows a list of the current capabilities of the ICP facility.
Figure 3 shows a picture of the test chamber and the power supply. Although the photo is fairly crowded,the 30 kW RF power supply is on the left, and the stainless steel test chamber is in the center. Below thechamber, the two valves that provide back-up control of the start gas (argon) and gas mixture (variable) arevisible, and the pyrometer is just above these two valves. The facility vacuum pump is seen at the upperright of the photo, and the optical bench containing the three-axis staging that allows translation of thephotomultiplier tube (PMT) and detection optics is just to the right of the chamber.
Maximum run time [min] 60
Maximum recorded heat flux [W cm−2] 105
Maximum operating pressure [torr] 180
Table 2: Current ICP capabilities
F acility Character ization
Basic Operation
The ICP Torch currently provides usable operating conditions and its capabilities are continuously being improved. This includes its run duration, peak heat flux, operational gas composition and pressure range. Preliminary tests have been conducted for a limited range of conditions for different gases and mixtures including: argon (100%), air (100%), nitrogen (100%) and mixtures of both air and nitrogen with argon.
Target operational capability for the 30 kW ICP Facility is summarized in the table below:
Improvements to the torch include increased cooling to high heat load locations to increase run duration. The base plate was redesigned and a more efficient heat exchanger is in the process of being built. The tank circuit and load coil designs are continuously being optimized for the test gas to provide more efficient energy transfer into the plasma. Quartz tube failure is attributed to improper coupling and inadequate sheathing gas. A new injector block is being built with a larger tube diameter and thicker annulus in attempt to solve this problem.
Our current capabilities are:
!"#$%&'$()*+,$ -$*)'$.)/0$*"'&"1$20&/$34.'$
!"#$%+5463+3$7+"/$81&#,$ 9:$.;5*<=$
!"#$>?+6"/)'@$A0"*B+6$C6+22&6+,$ :9D$/466$
E"2$A4*?42)/)4',$ Ar, Air, N2, and CO2 *)#/&6+2$
>?+6"/)'@$86+F&+'5G,$$ =HI$!7J$
F ig. 3 A picture of the completely assembled ICP Torch. The installation of initial diagnostic equipment can be seen (right)
Inductive heater power: 30 kW (max) at 4 MHz Enthalpy range, MJ kg-1 10 40 (for air) Mach range < 0.3 to 1 qstag, W cm-2 10 290 Pstag, atm 0.05 1.0 Plasma jet diameter: 30 mm Test gas: Ar, Air, N2, O2, CO2
Figure 3: Picture of the test chamber and power supply9
4 of 11
American Institute of Aeronautics and Astronautics
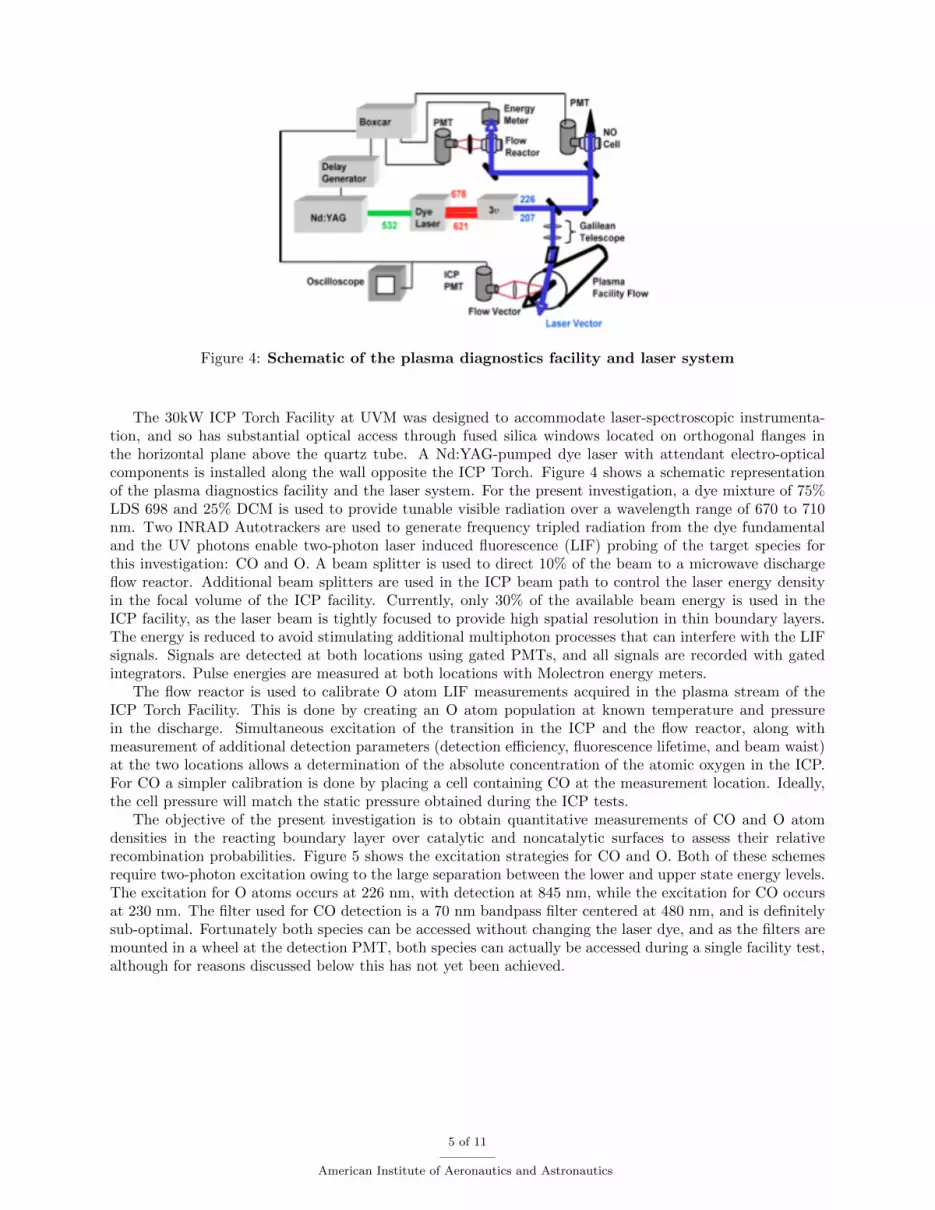
Figure 4: Schematic of the plasma diagnostics facility and laser system
The 30kW ICP Torch Facility at UVM was designed to accommodate laser-spectroscopic instrumenta-tion, and so has substantial optical access through fused silica windows located on orthogonal flanges inthe horizontal plane above the quartz tube. A Nd:YAG-pumped dye laser with attendant electro-opticalcomponents is installed along the wall opposite the ICP Torch. Figure 4 shows a schematic representationof the plasma diagnostics facility and the laser system. For the present investigation, a dye mixture of 75%LDS 698 and 25% DCM is used to provide tunable visible radiation over a wavelength range of 670 to 710nm. Two INRAD Autotrackers are used to generate frequency tripled radiation from the dye fundamentaland the UV photons enable two-photon laser induced fluorescence (LIF) probing of the target species forthis investigation: CO and O. A beam splitter is used to direct 10% of the beam to a microwave dischargeflow reactor. Additional beam splitters are used in the ICP beam path to control the laser energy densityin the focal volume of the ICP facility. Currently, only 30% of the available beam energy is used in theICP facility, as the laser beam is tightly focused to provide high spatial resolution in thin boundary layers.The energy is reduced to avoid stimulating additional multiphoton processes that can interfere with the LIFsignals. Signals are detected at both locations using gated PMTs, and all signals are recorded with gatedintegrators. Pulse energies are measured at both locations with Molectron energy meters.
The flow reactor is used to calibrate O atom LIF measurements acquired in the plasma stream of theICP Torch Facility. This is done by creating an O atom population at known temperature and pressurein the discharge. Simultaneous excitation of the transition in the ICP and the flow reactor, along withmeasurement of additional detection parameters (detection efficiency, fluorescence lifetime, and beam waist)at the two locations allows a determination of the absolute concentration of the atomic oxygen in the ICP.For CO a simpler calibration is done by placing a cell containing CO at the measurement location. Ideally,the cell pressure will match the static pressure obtained during the ICP tests.
The objective of the present investigation is to obtain quantitative measurements of CO and O atomdensities in the reacting boundary layer over catalytic and noncatalytic surfaces to assess their relativerecombination probabilities. Figure 5 shows the excitation strategies for CO and O. Both of these schemesrequire two-photon excitation owing to the large separation between the lower and upper state energy levels.The excitation for O atoms occurs at 226 nm, with detection at 845 nm, while the excitation for CO occursat 230 nm. The filter used for CO detection is a 70 nm bandpass filter centered at 480 nm, and is definitelysub-optimal. Fortunately both species can be accessed without changing the laser dye, and as the filters aremounted in a wheel at the detection PMT, both species can actually be accessed during a single facility test,although for reasons discussed below this has not yet been achieved.
5 of 11
American Institute of Aeronautics and Astronautics
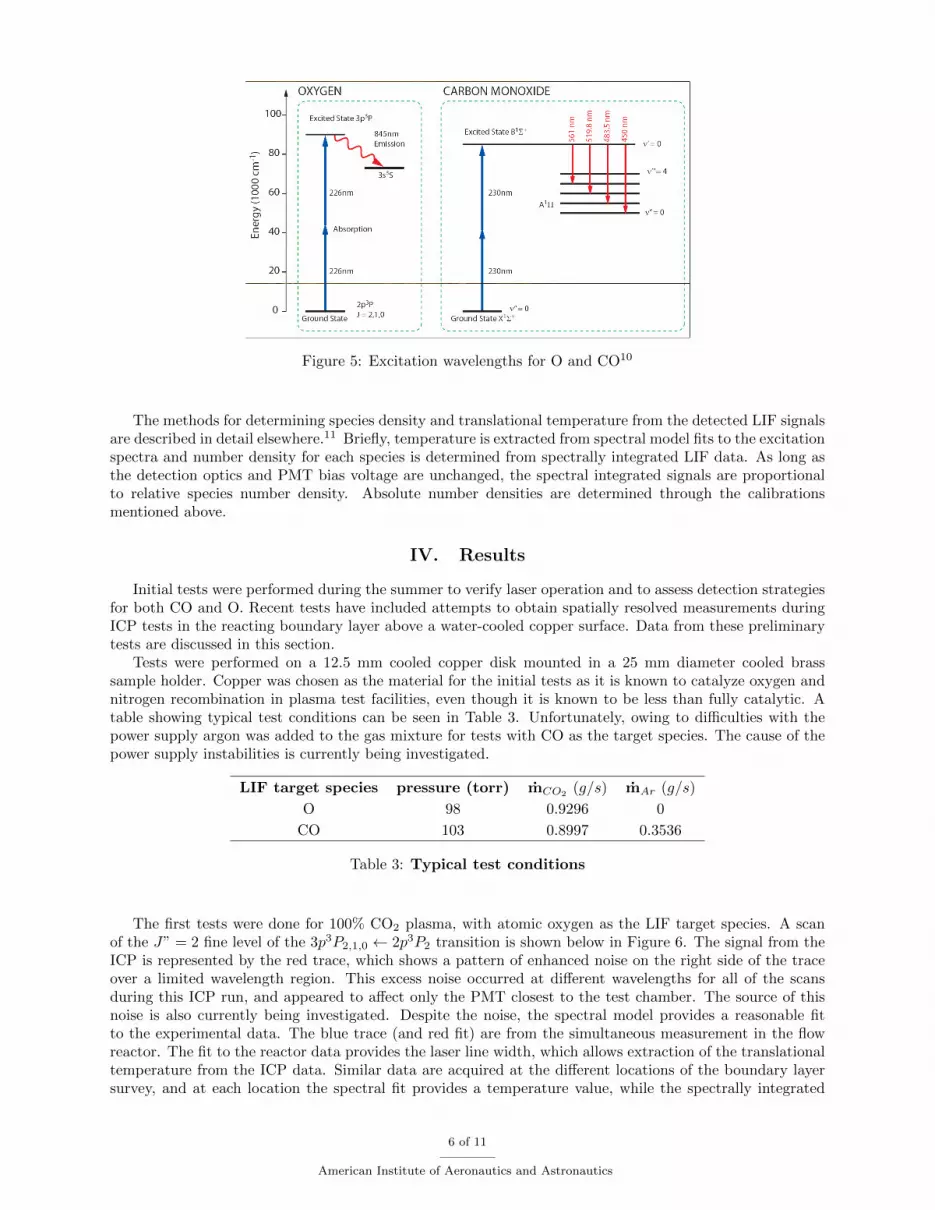
!"#$%&!' ()* +' ,-./0,- 1234565) #$% 65 (77-88 (995:-* 6,()80605)8'&()*&+'&,-./0,-&1 34565)&#$%&65&(77-88&(995:-*&6,()80605)8!;-8306-&:-(<-,&7,58828-7605)=&0)>5,?(605)&08&>,5?&@,5/)*&86(6-!%5,6/065/8&3,5A0?06B&5>&-A706(605)&:(C-9-)@64&:0640)&*B-&6/)0)@&,()@-!;-6-7605)&>096-,&,-./0,-?-)68&*0>>-,
%9/5,-87-)7-&874-?-8&5>&'&()*&+'&6(,@-6&6,()80605)8&
1D64&"$""&"-,5*B)(?07&E-(8/,-?-)6&!-74)595@B&()*&F,5/)*&!-860)@&+5)>-,-)7-=&&GH&I/)-&1HJH=&+407(@5=&$990)508 IK&EK&E-B-,8&L&M??-B-,8N/C?K-*/O JG
@Figure 5: Excitation wavelengths for O and CO10
The methods for determining species density and translational temperature from the detected LIF signalsare described in detail elsewhere.11 Briefly, temperature is extracted from spectral model fits to the excitationspectra and number density for each species is determined from spectrally integrated LIF data. As long asthe detection optics and PMT bias voltage are unchanged, the spectral integrated signals are proportionalto relative species number density. Absolute number densities are determined through the calibrationsmentioned above.
IV. Results
Initial tests were performed during the summer to verify laser operation and to assess detection strategiesfor both CO and O. Recent tests have included attempts to obtain spatially resolved measurements duringICP tests in the reacting boundary layer above a water-cooled copper surface. Data from these preliminarytests are discussed in this section.
Tests were performed on a 12.5 mm cooled copper disk mounted in a 25 mm diameter cooled brasssample holder. Copper was chosen as the material for the initial tests as it is known to catalyze oxygen andnitrogen recombination in plasma test facilities, even though it is known to be less than fully catalytic. Atable showing typical test conditions can be seen in Table 3. Unfortunately, owing to difficulties with thepower supply argon was added to the gas mixture for tests with CO as the target species. The cause of thepower supply instabilities is currently being investigated.
LIF target species pressure (torr) mCO2(g/s) mAr (g/s)
O 98 0.9296 0
CO 103 0.8997 0.3536
Table 3: Typical test conditions
The first tests were done for 100% CO2 plasma, with atomic oxygen as the LIF target species. A scanof the J” = 2 fine level of the 3p3P2,1,0 ← 2p3P2 transition is shown below in Figure 6. The signal from theICP is represented by the red trace, which shows a pattern of enhanced noise on the right side of the traceover a limited wavelength region. This excess noise occurred at different wavelengths for all of the scansduring this ICP run, and appeared to affect only the PMT closest to the test chamber. The source of thisnoise is also currently being investigated. Despite the noise, the spectral model provides a reasonable fitto the experimental data. The blue trace (and red fit) are from the simultaneous measurement in the flowreactor. The fit to the reactor data provides the laser line width, which allows extraction of the translationaltemperature from the ICP data. Similar data are acquired at the different locations of the boundary layersurvey, and at each location the spectral fit provides a temperature value, while the spectrally integrated
6 of 11
American Institute of Aeronautics and Astronautics
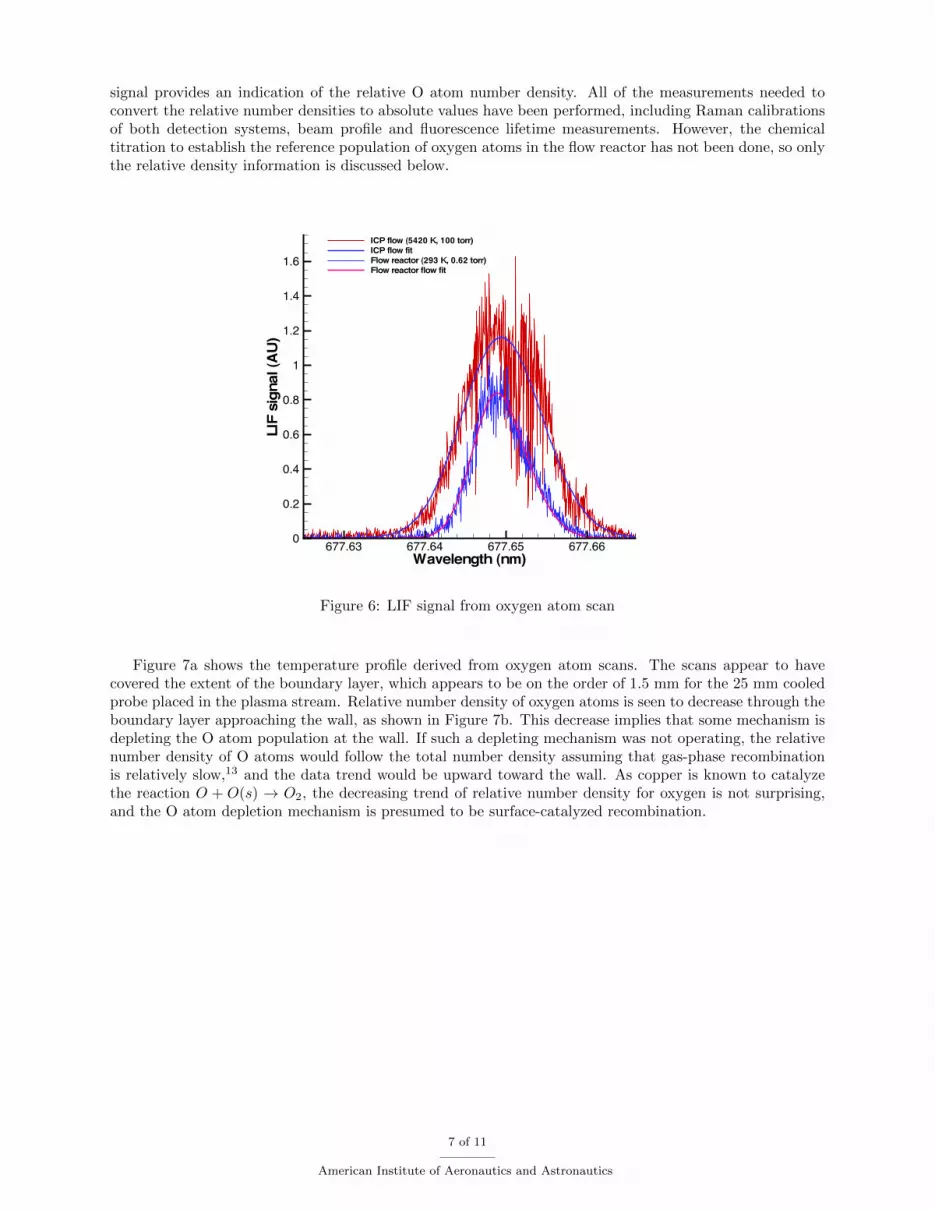
signal provides an indication of the relative O atom number density. All of the measurements needed toconvert the relative number densities to absolute values have been performed, including Raman calibrationsof both detection systems, beam profile and fluorescence lifetime measurements. However, the chemicaltitration to establish the reference population of oxygen atoms in the flow reactor has not been done, so onlythe relative density information is discussed below.
Wavelength (nm)
LIFsignal(AU)
677.63 677.64 677.65 677.660
0.2
0.4
0.6
0.8
1
1.2
1.4
1.6
ICP flow (5420 K, 100 torr)ICP flow fitFlow reactor (293 K, 0.62 torr)Flow reactor flow fit
Figure 6: LIF signal from oxygen atom scan
Figure 7a shows the temperature profile derived from oxygen atom scans. The scans appear to havecovered the extent of the boundary layer, which appears to be on the order of 1.5 mm for the 25 mm cooledprobe placed in the plasma stream. Relative number density of oxygen atoms is seen to decrease through theboundary layer approaching the wall, as shown in Figure 7b. This decrease implies that some mechanism isdepleting the O atom population at the wall. If such a depleting mechanism was not operating, the relativenumber density of O atoms would follow the total number density assuming that gas-phase recombinationis relatively slow,13 and the data trend would be upward toward the wall. As copper is known to catalyzethe reaction O + O(s) → O2, the decreasing trend of relative number density for oxygen is not surprising,and the O atom depletion mechanism is presumed to be surface-catalyzed recombination.
7 of 11
American Institute of Aeronautics and Astronautics

Distance from wall (mm)
Temperature(K)
0 0.5 1 1.5 2 2.5 31000
1500
2000
2500
3000
3500
4000
4500
5000
5500
6000
(a) Temperature
Distance from wall (mm)
Relativenumberdensity
0 0.5 1 1.5 2 2.5 35
5.5
6
6.5
7
7.5
8
8.5
9
9.5
10
(b) Relative number density
Figure 7: Temperature and relative number density for oxygen atom scans
Following the O atom measurements, several repairs had to be made to facility components, includinga complete rebuild of the injector block. From that point, facility operation proved difficult or inconsistentwith pure CO2 and further modifications were made to the power supply tank circuit. Finally, owing totime constraints operation was attempted with the CO2:Ar mixture defined in Table 3. above, and thisallowed steady operation for relatively short test times. Each test lasted for approximately two limited (0.1nm) wavelength scans of the CO (B1Σ+ ← X) (0,0) absorption band at the predetermined boundary layerlocations. Following each shut-down the facility was restarted at approximately the same test conditions.
Figure 8 shows normalized (S/E2p) scan data in the 690.80 to 690.90 nm range, which contains rotational
transitions with quantum numbers near ≈ 30. The distance from the surface for each measurement locationis indicated under the separate images. Looking at the images sequentially starting with the location outsidethe boundary layer, one can see that the signal reflects that the rotational population of CO is shiftingto lower quantum number rotational levels (toward higher wavelength) as the measurements approach thecooled copper surface. This is expected given the translational temperature gradient seen in the oxygen atommeasurements. The scans are very noisy, as the filter admitted both LIF signals and visible emission fromthe plasma at the detection wavelength. To reduce the background signal level, a second boxcar gate wasset to record the signal approximately 60 ns after the laser pulse, and so each point of the scan is correctedby subtracting this background signal. This improved the signal relative to the noise, but clearly a betterfilter is needed for these measurements.
8 of 11
American Institute of Aeronautics and Astronautics

(a) 2.032 mm from surface
(b) 1.524 mm from surface
(c) 1.016 mm from surface
(d) 0.762 mm from surface
(e) 0.508 mm from surface
(f) 0.254 mm from surface
Figure 8: Scans of the CO (B ← X) (0,0) absorption band at varying distances from the surface
Figure 9 shows the CO (B1Σ+ ←1 Σ+X) (0,0) bandhead at 691 nm. This measurement was obtainedwith the beam partially blocked by the probe, and so sampled the region adjacent to the copper surface,which is relatively cool. Note that the signal is normalized by the raw energy measurement, which does notaccount for the sample blockage, and so the signal level is artificially lowered.
Figure 9: CO (B ← X) (0,0) bandhead, 0.127 mm from surface
Despite the noise in the data, fits were made using a spectral model of the CO B ← X absorptionincluding all rotational transitions up to a rotational quantum number of 100. The spectroscopic constantsfor this model were taken from Huber and Herzberg14 for the X1Σ+ state and Eidelsberg and Rostas15
for the B1Σ+ state. An example fit is shown for the furthest point from the surface in Figure 10. Thetemperature sensitivity of the fit is limited owing to the relatively short spectral range of the scan. However,even with the difference in mixture, the best fit temperature value appears to be in reasonable agreementwith the temperature derived from the oxygen atom line shape analysis, as seen in Figure 11 where fit-derivedtemperature values are shown for all of the measurement locations. We expect that the uncertainties in thesetemperature values are on the order of at least 1000 K. A longer wavelength scan range would have helped,but this was not possible given the power supply issues.
9 of 11
American Institute of Aeronautics and Astronautics

Wavelength (nm)
LIFsignal(AU)
690.7 690.72 690.74 690.76 690.78 690.80
0.05
0.1
0.15
0.2
0.25
0.3
0.35
0.4
0.45 ICP flow (5500 K, 100 torr)ICP flow fit
Figure 10: Spectral model fits to CO absorption for the nearest and furthest points from the surface
Distance from wall (mm)
Temperature(K)
0 0.5 1 1.5 2 2.5 3
1000
2000
3000
4000
5000
6000
OCO
(a) Temperature
rev2.pdf
(b) Relative number density
Figure 11: Temperature and relative number density for CO scans
A more interesting parameter to evaluate is the relative CO number density, and an estimate of thisvalue for the different measurements was obtained by spectrally integrating the model over all rotationaltransitions, once the model value was adjusted to the measured voltage at each location. As the bias voltagewas constant for all tests and no adjustments were made to the detection system, this integral value isexpected to be a reasonable representation of the relative number density. The distribution of these valuesis shown in Figure 11. Although the data are preliminary and of very low quality as indicated by the largeerror bars, it is interesting to note that they show a trend of either constant or slightly increasing density(except at the last location on the surface) toward the surface. This trend would be consistent with frozenchemistry, and a low value of surface catalycity for promoting the reaction CO+O(s)→ CO2. As mentionedabove, at the location nearest to the surface the laser beam was partially blocked by the edge of the cooledprobe. During the measurements, the fourth boxcar channel was used to measure the background signal
10 of 11
American Institute of Aeronautics and Astronautics
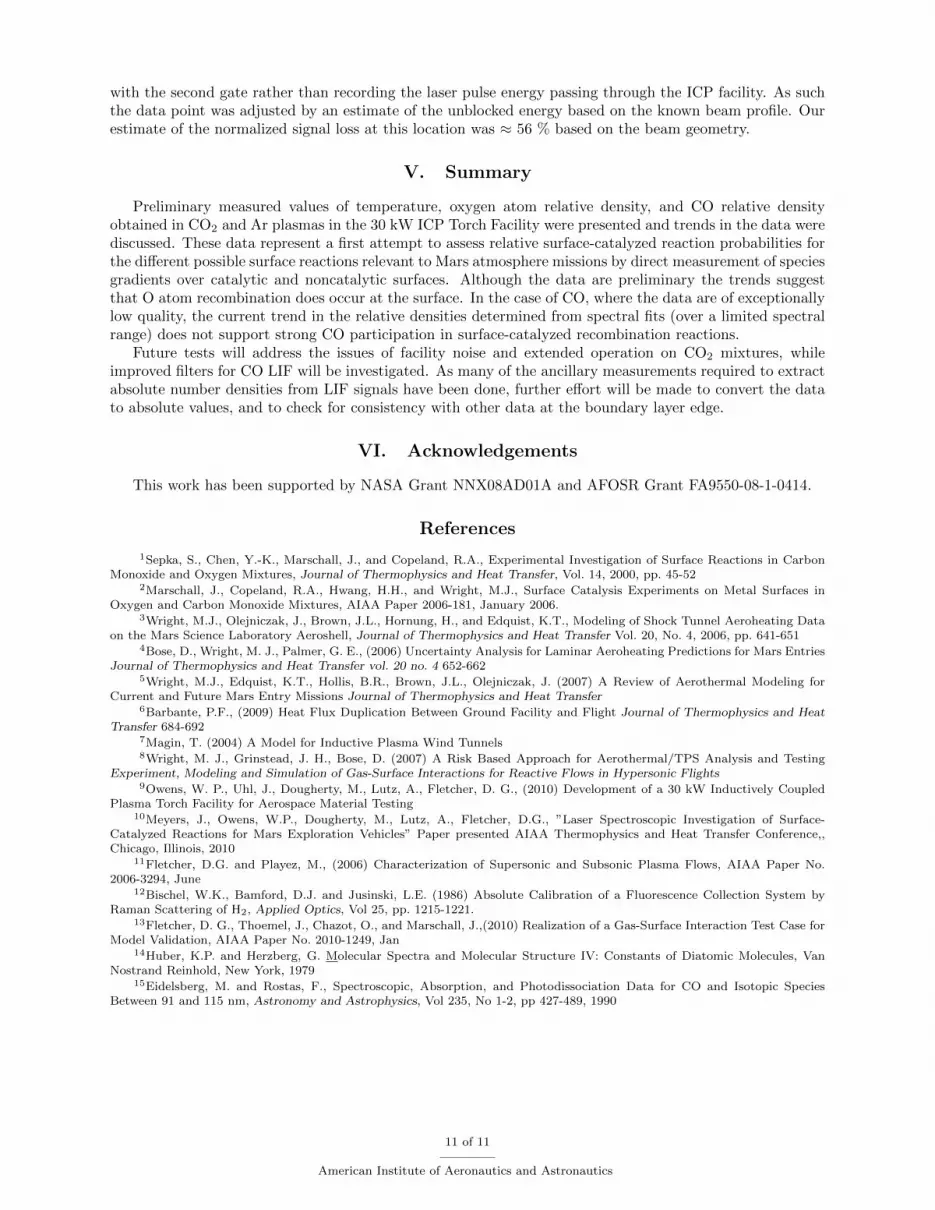
with the second gate rather than recording the laser pulse energy passing through the ICP facility. As suchthe data point was adjusted by an estimate of the unblocked energy based on the known beam profile. Ourestimate of the normalized signal loss at this location was ≈ 56 % based on the beam geometry.
V. Summary
Preliminary measured values of temperature, oxygen atom relative density, and CO relative densityobtained in CO2 and Ar plasmas in the 30 kW ICP Torch Facility were presented and trends in the data werediscussed. These data represent a first attempt to assess relative surface-catalyzed reaction probabilities forthe different possible surface reactions relevant to Mars atmosphere missions by direct measurement of speciesgradients over catalytic and noncatalytic surfaces. Although the data are preliminary the trends suggestthat O atom recombination does occur at the surface. In the case of CO, where the data are of exceptionallylow quality, the current trend in the relative densities determined from spectral fits (over a limited spectralrange) does not support strong CO participation in surface-catalyzed recombination reactions.
Future tests will address the issues of facility noise and extended operation on CO2 mixtures, whileimproved filters for CO LIF will be investigated. As many of the ancillary measurements required to extractabsolute number densities from LIF signals have been done, further effort will be made to convert the datato absolute values, and to check for consistency with other data at the boundary layer edge.
VI. Acknowledgements
This work has been supported by NASA Grant NNX08AD01A and AFOSR Grant FA9550-08-1-0414.
References
1Sepka, S., Chen, Y.-K., Marschall, J., and Copeland, R.A., Experimental Investigation of Surface Reactions in CarbonMonoxide and Oxygen Mixtures, Journal of Thermophysics and Heat Transfer, Vol. 14, 2000, pp. 45-52
2Marschall, J., Copeland, R.A., Hwang, H.H., and Wright, M.J., Surface Catalysis Experiments on Metal Surfaces inOxygen and Carbon Monoxide Mixtures, AIAA Paper 2006-181, January 2006.
3Wright, M.J., Olejniczak, J., Brown, J.L., Hornung, H., and Edquist, K.T., Modeling of Shock Tunnel Aeroheating Dataon the Mars Science Laboratory Aeroshell, Journal of Thermophysics and Heat Transfer Vol. 20, No. 4, 2006, pp. 641-651
4Bose, D., Wright, M. J., Palmer, G. E., (2006) Uncertainty Analysis for Laminar Aeroheating Predictions for Mars EntriesJournal of Thermophysics and Heat Transfer vol. 20 no. 4 652-662
5Wright, M.J., Edquist, K.T., Hollis, B.R., Brown, J.L., Olejniczak, J. (2007) A Review of Aerothermal Modeling forCurrent and Future Mars Entry Missions Journal of Thermophysics and Heat Transfer
6Barbante, P.F., (2009) Heat Flux Duplication Between Ground Facility and Flight Journal of Thermophysics and HeatTransfer 684-692
7Magin, T. (2004) A Model for Inductive Plasma Wind Tunnels8Wright, M. J., Grinstead, J. H., Bose, D. (2007) A Risk Based Approach for Aerothermal/TPS Analysis and Testing
Experiment, Modeling and Simulation of Gas-Surface Interactions for Reactive Flows in Hypersonic Flights9Owens, W. P., Uhl, J., Dougherty, M., Lutz, A., Fletcher, D. G., (2010) Development of a 30 kW Inductively Coupled
Plasma Torch Facility for Aerospace Material Testing10Meyers, J., Owens, W.P., Dougherty, M., Lutz, A., Fletcher, D.G., ”Laser Spectroscopic Investigation of Surface-
Catalyzed Reactions for Mars Exploration Vehicles” Paper presented AIAA Thermophysics and Heat Transfer Conference,,Chicago, Illinois, 2010
11Fletcher, D.G. and Playez, M., (2006) Characterization of Supersonic and Subsonic Plasma Flows, AIAA Paper No.2006-3294, June
12Bischel, W.K., Bamford, D.J. and Jusinski, L.E. (1986) Absolute Calibration of a Fluorescence Collection System byRaman Scattering of H2, Applied Optics, Vol 25, pp. 1215-1221.
13Fletcher, D. G., Thoemel, J., Chazot, O., and Marschall, J.,(2010) Realization of a Gas-Surface Interaction Test Case forModel Validation, AIAA Paper No. 2010-1249, Jan
14Huber, K.P. and Herzberg, G. Molecular Spectra and Molecular Structure IV: Constants of Diatomic Molecules, VanNostrand Reinhold, New York, 1979
15Eidelsberg, M. and Rostas, F., Spectroscopic, Absorption, and Photodissociation Data for CO and Isotopic SpeciesBetween 91 and 115 nm, Astronomy and Astrophysics, Vol 235, No 1-2, pp 427-489, 1990
11 of 11
American Institute of Aeronautics and Astronautics

INVESTIGATION OF CN PRODUCTION FROM CARBON
MATERIALS IN NITROGEN PLASMAS
A. Lutz*, W. Owens†, J. Meyers‡ and D.G. Fletcher§University of Vermont
Burlington, VTand
J. Marschall**SRI InternationalMenlo Park, CA
The numerical approaches used to calculate ablative heat shield thickness have come into questionrecently, with particular attention given to uncertainties in chemical reaction rates. One such exampleis the carbon nitridation reaction, C(s) + N → CN where atomic nitrogen extracts solid carbon from aheat shield surface. Few measurements have been performed for this reaction at conditions relevant tore-entry, and large differences exist in reported values. Experiments aimed at measuring this particularreaction rate have been conducted recently in the 30 kW Inductively Coupled Plasma Torch Facility atthe University of Vermont, which simulates re-entry conditions on scaled material samples. Two-photonlaser-induced fluorescence is used to measure nitrogen atom density and translational temperature in thereacting boundary layer above the graphite surface. These measurements are used to calculate the nitrogenatom flux reaching the surface. Combining this result with measurements of sample mass loss allows anestimation of the nitridation rate for the test conditions. Initial tests were done with modest surfacetemperatures in the range of 1620 to 1800 K. Preliminary results from this investigation are reported.
1. Introduction
Planetary exploration and Earth re-entry vehicles experience extremely high convective and radiativeheat loads during hypersonic flight, especially in stagnation regions. Accurate prediction of these heat fluxlevels remains a key objective in the development of next-generation space-exploration vehicles. At present,thermal protection systems (TPS) are designed with large safety factors owing to the limited understandingof gas-surface interactions at elevated temperatures. This conservative design approach adds mass to theTPS at the expense of vehicle payload and presents a barrier to the deployment of novel TPS designsthat may provide better performance with lower mass penalty. Clearly, detailed studies of gas-surfaceinteractions are needed to improve this situation.
Heat shields are typically classified as either ablative or non-ablative TPS depending on their composi-tion. Figure 1 below shows the processes that occur for both ablative and non-ablative materials at high
*Graduate Student, Mechanical Engineering Department, 211 Perkins Hall, 33 Colchester Ave; [email protected].†Graduate Student, Mechanical Engineering Department, 211 Perkins Hall, 33 Colchester Ave;[email protected].‡Post-doctoral Researcher, Mechanical Engineering Department, 109 Votey Hall, 33 Colchester Ave,Member AIAA.§Professor, Mechanical Engineering Department, 201 Votey Hall, 33 Colchester Ave; [email protected]. Associate Fellow AIAA.**Senior Research Scientist, Molecular Physics Laboratory, 333 Ravenswood Avenue;[email protected]. Senior Member AIAA.
1

2 INVESTIGATION OF CN PRODUCTION FROM CARBON MATERIALS IN NITROGEN PLASMAS
temperatures. Non-ablative materials are restricted to aerothermal trajectories where the vehicle does notencounter heat fluxes that drive the material beyond its melting point. Ablative materials are designeddifferently as they allow for a controlled burn of a low-temperature phase-change material impregnatedwithin a stronger, matrix material to provide blockage of the convective heating; thus mitigating heatingby phase change and mass efflux. For ablative TPS, carbon has proven to be the most performant matrixmaterial.
Figure 1. Diagram summarizing heat and mass transfer processes with ablating and non-
ablating heat shields.
A key aspect of ablative TPS is understanding all carbon based reactions, including carbon nitridation,which may play an important role in high-speed earth re-entry missions, such as outer planet sample return.This reaction is known to result in formation of the cyanogen (CN) molecule, which is a very strong radiatorat high temperatures. Despite the role of nitridation in the ablation of carbon based heat shields, a reliablegas-surface CN reaction efficiency has not been measured. Historically, surface recession rates have beencalculated through B’ tables, which assume a chemical equilibrium model. However, evidence of chemicalnon-equilibrium between the surface and ambient gas has been proven, making finite-rate chemistry modelsnecessary [1].
Previous experiments have attempted to measure the carbon nitridation reaction efficiency. One ofthe first attempts to classify this efficiency was performed by Goldstein [2]. AGOT and TSX graphitesamples were exposed to a stream of microwave-discharge generated nitrogen and liquid-nitrogen cooledtraps were used to gather byproducts. CN production was measured relative to the approaching N-atomconcentration. Reaction efficiency was found to vary between 0.00041 to 0.0017 over a temperature rangeof 1694K to 2365K in TSX graphite. With AGOT samples, the efficiency range varied between 0.00045 and0.00069 within 2031K and 2237K respectively. There is some uncertainty regarding the accuracy of thesefindings, however the data do not seem unreasonable.
One of the more surprising results was obtained by Park and Bogdanoff [4]. In their experiment, tungstenwire coated in lampblack was subjected to a stream of highly dissociated nitrogen, produced within a shocktube. The N-atom concentrations were calculated assuming post-shock equilibrium conditions and the CNproduction was inferred from spectrally integrated emission at 386 nm. The authors determined a reactionefficiency of γN = 0.3 from this experiment. This value is higher than expected and it does not havea temperature dependence, which is physically unlikely [1]. In contrast, carbon oxidation has a strongdependence on temperature, where γO is known to vary between 0.01 and 0.3 for room temperature and

INVESTIGATION OF CN PRODUCTION FROM CARBON MATERIALS IN NITROGEN PLASMAS 3
3000 K, respectively. Also, carbon oxidation should be a more efficient than nitridation, but the Park andBogdanoff result does not reflect this.
Recently, Suzuki et. al utilized a 110 kW Inductively Coupled Plasma (ICP) wind tunnel to study CNproduction in a stream of pure nitrogen [3]. The experiments were performed at a pressure of 10 kPa anda mass flow rate of 2 g s−1. These experiments yielded reaction efficiencies ranging from 0.0025 and 0.0032at surface temperatures of 1822K to 2184K respectively. These numbers appear to agree in magnitudewith the Goldstein experiments. No direct measurements of N-atom were made for these tests. Instead acomputational fluid dynamics code was used to estimate N-atom concentration.
For graphite, enhanced oxidation efficiency with respect to nitridation is easily proven. A sample placedin an air plasma will show signs of oxidation, including significant surface recession for high heating rateconditions within a few minutes. A similar sample will not show signs of deformation until much laterat identical conditions in a pure nitrogen plasma. This is illustrated in Figure 2 where several sampleswere subjected to different plasma streams at varying exposure times. The sample exposed to nitrogen washeld within the stream on the order of 10 minutes. It appears unchanged from the virgin sample whereassamples exposed to air plasmas for equivalent or shorter durations show significant surface erosion.
Figure 2. Graphite samples used in the UVM ICPT test facility. These samples show
the different stages of decomposition from 1) nitrogen plasma (10 min) 2-3) air-argon plasma in
successively longer exposure times up to 10 minutes [5].
To provide a better measure of nitridation, and thereby resolve some of the existing discrepancies a seriesof experiments are being conducted at SRI International using a high temperature diffusion reactor and atthe University of Vermont (UVM) in the 30 kW (ICP) Torch Facility. Results from the diffusion reactortests have been reported [1], and the results appear to be consistent with those of Goldstein and Suzuki.The present paper reports on the status of the measurements in the ICP Torch Facility.
In the present investigation, numerical simulations of the ICP stagnation point boundary layer conditionsare used to estimate the boundary layer thickness and property gradients to help define the required spatialresolution for LIF measurements. These simulations are described in the next section, and this is followedby descriptions of the ICP facility and laser diagnostic approach used for these investigations. Finally,results are presented and discussed and a summary is given.
2. Boundary Layer Code
Several numerical codes have been developed at the von Karman Institute (VKI) in Belgium for modelingstagnation point testing in ICP facilities. The Non-Equilibrium Boundary Layer (NEBOULA) flow codeis a computational tool that calculates surface heat flux for different boundary edge conditions at thestagnation point in user-defined gas mixtures [6]. Output from NEBOULA includes temperature, density,

4 INVESTIGATION OF CN PRODUCTION FROM CARBON MATERIALS IN NITROGEN PLASMAS
velocity, enthalpy and mass and molar fractions of species along the stagnation stream line. The samplebody diameter determines the velocity gradient around the body. NEBOULA requires plasma mixtureproperties, including transport, chemical and thermodynamic properties at various conditions within thereacting boundary layer. The Multicomponent Transport, Thermodynamic and Chemistry Properties forIonized Gases (MUTATION) library calculates gas mixture properties at prescribed temperatures andpressures [7], providing an accurate description of the behavior of gases at plasma conditions. For the presentinvestigation of carbon nitridation, MUTATION and NEBOULA are used as an aid in the interpretationof experimental results.
Figure 3a shows the mass fraction of a 5-species N2 mixture as a function of temperature over the rangeof 1500 to 7000K for a static pressure of 115 Torr. These conditions closely correspond to the experimentaltest conditions in the 30 kW ICP Torch Facility, and show clearly that N2 dissociation will be significant attemperatures above 5000 K. These calculations are done for thermodynamic equilibrium, which is believedto pertain to the boundary layer edge conditions. Investigation of the boundary layer edge condition forthe present experiments is ongoing. These data, along with enthalpy, mass density and viscosity serve asinitial conditions for the NEBOULA stagnation-point calculation.
(a) MUTATION Output (b) NEBOULA Output
Figure 3. a. Mass fraction of the 5-species N2 mixture created in MUTATION as a functionof temperature. The primary species present are N2 and atomic Nitrogen. All other species do notappear in large quantities at these conditions. b. Molar composition and mixture temperature of
the 5-species N2 gas created in NEBOULA. Prominent species include N2 and N.
Figure 3b shows a sample output from the NEBOULA code. Species number densities and the bulkgas temperature are plotted along the stagnation point streamline. The boundary layer edge and walltemperatures were set to 7000K and 1500K respectively for this particular case. Again, the prominentspecies for these conditions are molecular and atomic nitrogen. Three traces are shown for each species,corresponding to non-catalytic (solid), fully catalytic (dotted) and partially catalytic (dot-dash). Surfacecatalysis in this case is used as a qualitative indicator of nitridation, as both represent mechanisms forremoving atomic nitrogen from the boundary layer, which affects the nitrogen atom density gradient. Anincreasing N-atom density gradient towards the surface would indicate infinitely slow nitridation, while adecreasing N-atom density gradient indicates a higher nitridation rate.

INVESTIGATION OF CN PRODUCTION FROM CARBON MATERIALS IN NITROGEN PLASMAS 5
3. Facility and Instrumentation Description
The 30 kW ICP Torch Facility at UVM is designed to test samples in high enthalpy gas flows forsimulation of planetary entry and earth atmosphere re-entry trajectory heating conditions. It is currentlyconfigured for operation with subsonic flow to simulate the post-shock conditions of high-enthalpy flight for astagnation point geometry. As described in [8], the facility test conditions can be related to flight trajectoryconditions (or to supersonic arc-jet facility test conditions) through the similarity parameters that controlstagnation point heating: total flow enthalpy, stagnation pressure, and stagnation-point velocity gradient.A key advantage of ICP facilities is their electrode-less operation and their ability to operate on a widerange of gas mixtures. The design specifications for the UVM 30 kW ICP Torch Facility are summarizedin Table 1.
Table 1. UVM ICPT System Specifications [5]
Parameter Rating
Inductive heater power 30 kW (max) @ 4 MHzEnthalpy range 10 - 40 MJ kg−1 (for air)
Mach range 0.3 to 1Stagnation heat transfer rate 10 - 290 W cm−2
Stagnation pressure 0.05 - 1.0 atm
(a) Facility
[5]
(b) Injector Block(c) Plasma Test
Figure 4. a. The University of Vermont ICPT test chamber and 30kW power source. b.The gas injector block assembly is located below the test chamber and is responsible for injecting
steady, laminar gas flow through the quartz tube [5]. c. Experimental setup with graphite sampleface held perpendicular to major flow axis. Sample shown tested in nitrogen plasma.
The primary components of the ICP facilities are the power source, gas injection assembly, test chamber,cooling circuit, vacuum pump and gas supply system. The power supply, test chamber and vacuum pump

6 INVESTIGATION OF CN PRODUCTION FROM CARBON MATERIALS IN NITROGEN PLASMAS
are shown in Figure 4. The inductance coil and quartz tube assembly are more easily illustrated with adrawing, which is shown in Figure 4b, along with the gas injection system. The injection system is based ona design by Playez [9] and consists of the main injector block, quartz tube and inductance coil. The maininjector block is constructed from brass components to allow cooling in hot regions created by the plasma.It is designed to provide a laminar gas flow evenly distributed around the outer annulus of the quartz tubewall to prevent hot plasma contact. The quartz tube has a 36 mm internal diameter and is centered withinthe inductance coil loops.
A Lepel Model T-30-3-MC5-TLI RF power supply, shown in Figure 4a, is used to provide a radiofrequency AC current to the inductance coil. De-ionized water is used within the power supply to cool theelectronic components and the load coil. A stable plasma ”ball” is created inside the tube and is centeredwithin the induction zone. Hot plasma gas generated in the plasma ball region flows out of the tube towardthe test sample. Pressure and mass flow are controlled to provide laminar flow conditions for the free jet.Figure 4c shows a sample placed in the stagnation point configuration, where it is mounted such that theleading face is perpendicular to the axis of the flow during operation.
The test chamber, shown in Figure 4 was fabricated from stainless steel to avoid contamination fromoxidation byproducts. It is equipped with portholes in six locations to provide optical and measurementaccess. Feed-throughs are included in other locations as well for the sample holder and auxilliary measure-ment probes. Currently, heat flux is measured using a probe that is equipped with a slug calorimeter or agardon gage. The head is designed to match the shape of the material test sample geometry and replicatesthe velocity gradient. Additional viewports are installed in the bottom flange of the test chamber to allowoptical pyrometric measurements of sample surface temperatures. By assuming radiative equilibrium andknowing the emissivity, the hot-surface heat flux values are obtained and compared with the cold wallreference values measured with the calorimeters [5].
Figure 5. Laser and instrumentation configuration for making two-photon LIF measure-
ments in the 30 kW ICP Torch Facility.
Laser diagnostic instrumentation is installed at the UVM ICP facility to measure gas-phase flow prop-erties. The full beam path is shown in Figure 5. The 532 nm output from a Powerlite 8000 Nd:YAGlaser pumps a ND6000 dye laser, and the dye laser output is frequency tripled through consecutive InradAutotrackers. For the present investigation, the dye laser was operated with DCM, which, after frequency
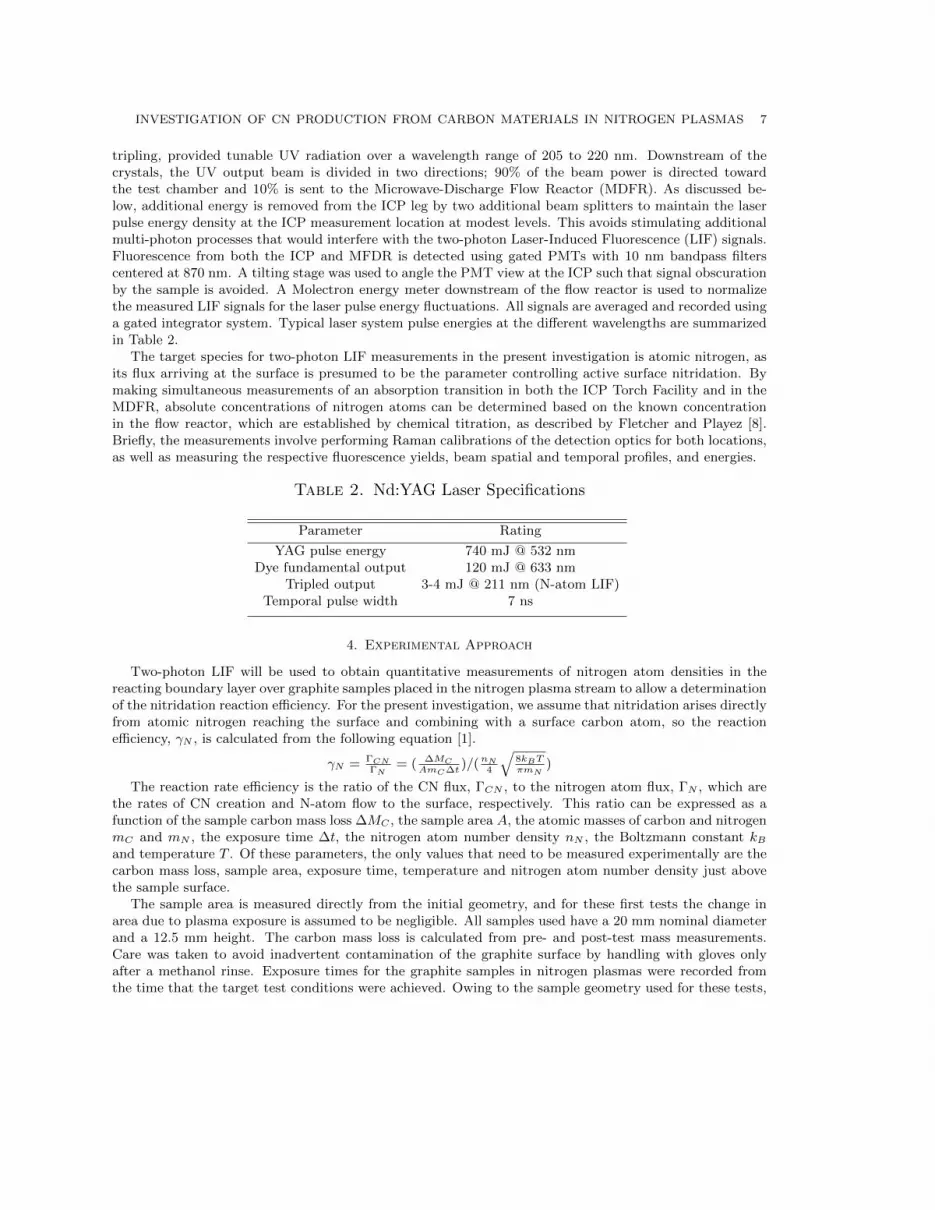
INVESTIGATION OF CN PRODUCTION FROM CARBON MATERIALS IN NITROGEN PLASMAS 7
tripling, provided tunable UV radiation over a wavelength range of 205 to 220 nm. Downstream of thecrystals, the UV output beam is divided in two directions; 90% of the beam power is directed towardthe test chamber and 10% is sent to the Microwave-Discharge Flow Reactor (MDFR). As discussed be-low, additional energy is removed from the ICP leg by two additional beam splitters to maintain the laserpulse energy density at the ICP measurement location at modest levels. This avoids stimulating additionalmulti-photon processes that would interfere with the two-photon Laser-Induced Fluorescence (LIF) signals.Fluorescence from both the ICP and MFDR is detected using gated PMTs with 10 nm bandpass filterscentered at 870 nm. A tilting stage was used to angle the PMT view at the ICP such that signal obscurationby the sample is avoided. A Molectron energy meter downstream of the flow reactor is used to normalizethe measured LIF signals for the laser pulse energy fluctuations. All signals are averaged and recorded usinga gated integrator system. Typical laser system pulse energies at the different wavelengths are summarizedin Table 2.
The target species for two-photon LIF measurements in the present investigation is atomic nitrogen, asits flux arriving at the surface is presumed to be the parameter controlling active surface nitridation. Bymaking simultaneous measurements of an absorption transition in both the ICP Torch Facility and in theMDFR, absolute concentrations of nitrogen atoms can be determined based on the known concentrationin the flow reactor, which are established by chemical titration, as described by Fletcher and Playez [8].Briefly, the measurements involve performing Raman calibrations of the detection optics for both locations,as well as measuring the respective fluorescence yields, beam spatial and temporal profiles, and energies.
Table 2. Nd:YAG Laser Specifications
Parameter Rating
YAG pulse energy 740 mJ @ 532 nmDye fundamental output 120 mJ @ 633 nm
Tripled output 3-4 mJ @ 211 nm (N-atom LIF)Temporal pulse width 7 ns
4. Experimental Approach
Two-photon LIF will be used to obtain quantitative measurements of nitrogen atom densities in thereacting boundary layer over graphite samples placed in the nitrogen plasma stream to allow a determinationof the nitridation reaction efficiency. For the present investigation, we assume that nitridation arises directlyfrom atomic nitrogen reaching the surface and combining with a surface carbon atom, so the reactionefficiency, γN , is calculated from the following equation [1].
γN = ΓCNΓN
= ( ∆MCAmC∆t
)/(nN4
√8kBTπmN
)
The reaction rate efficiency is the ratio of the CN flux, ΓCN , to the nitrogen atom flux, ΓN , which arethe rates of CN creation and N-atom flow to the surface, respectively. This ratio can be expressed as afunction of the sample carbon mass loss ∆MC , the sample area A, the atomic masses of carbon and nitrogenmC and mN , the exposure time ∆t, the nitrogen atom number density nN , the Boltzmann constant kBand temperature T . Of these parameters, the only values that need to be measured experimentally are thecarbon mass loss, sample area, exposure time, temperature and nitrogen atom number density just abovethe sample surface.
The sample area is measured directly from the initial geometry, and for these first tests the change inarea due to plasma exposure is assumed to be negligible. All samples used have a 20 mm nominal diameterand a 12.5 mm height. The carbon mass loss is calculated from pre- and post-test mass measurements.Care was taken to avoid inadvertent contamination of the graphite surface by handling with gloves onlyafter a methanol rinse. Exposure times for the graphite samples in nitrogen plasmas were recorded fromthe time that the target test conditions were achieved. Owing to the sample geometry used for these tests,
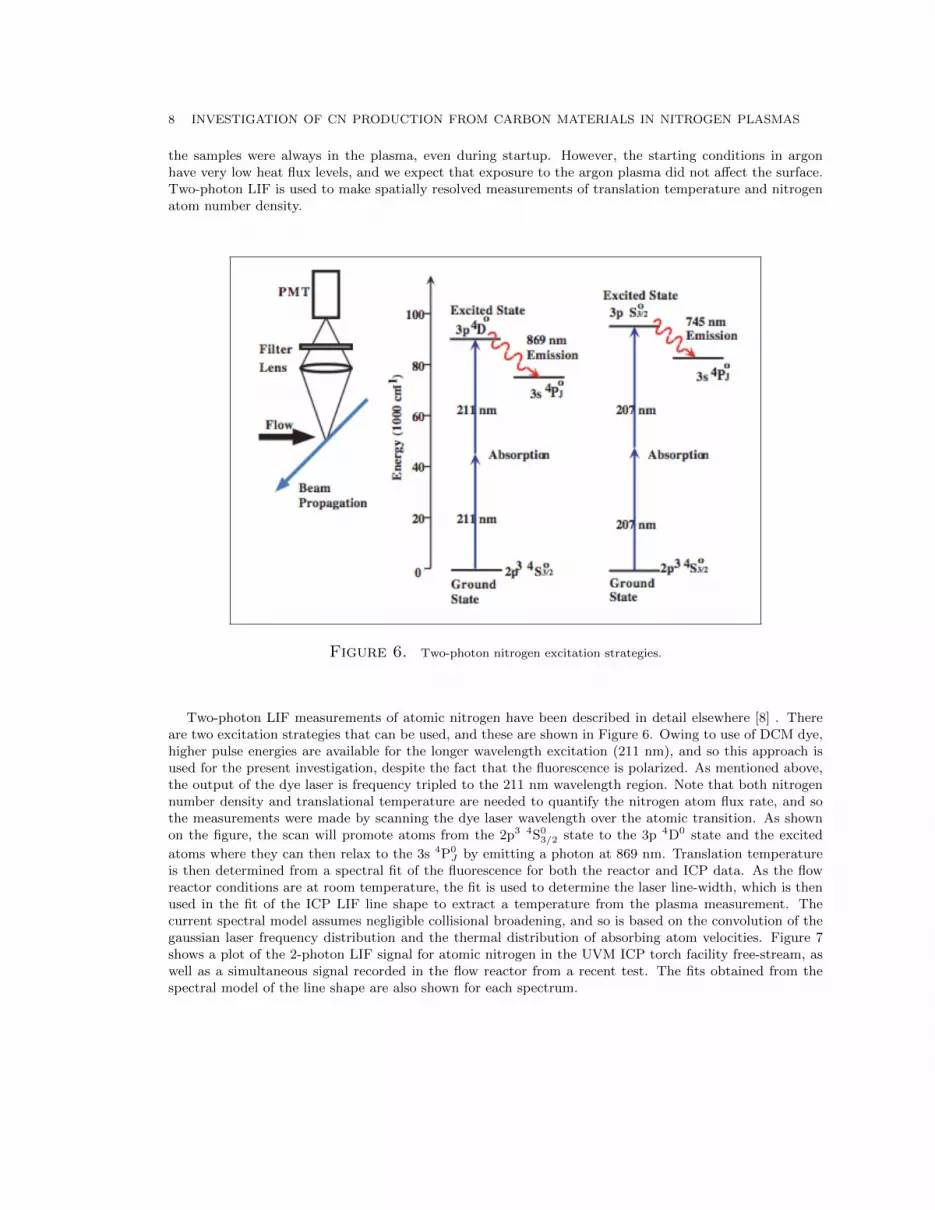
8 INVESTIGATION OF CN PRODUCTION FROM CARBON MATERIALS IN NITROGEN PLASMAS
the samples were always in the plasma, even during startup. However, the starting conditions in argonhave very low heat flux levels, and we expect that exposure to the argon plasma did not affect the surface.Two-photon LIF is used to make spatially resolved measurements of translation temperature and nitrogenatom number density.
Figure 6. Two-photon nitrogen excitation strategies.
Two-photon LIF measurements of atomic nitrogen have been described in detail elsewhere [8] . Thereare two excitation strategies that can be used, and these are shown in Figure 6. Owing to use of DCM dye,higher pulse energies are available for the longer wavelength excitation (211 nm), and so this approach isused for the present investigation, despite the fact that the fluorescence is polarized. As mentioned above,the output of the dye laser is frequency tripled to the 211 nm wavelength region. Note that both nitrogennumber density and translational temperature are needed to quantify the nitrogen atom flux rate, and sothe measurements were made by scanning the dye laser wavelength over the atomic transition. As shownon the figure, the scan will promote atoms from the 2p3 4S0
3/2 state to the 3p 4D0 state and the excited
atoms where they can then relax to the 3s 4P0J by emitting a photon at 869 nm. Translation temperature
is then determined from a spectral fit of the fluorescence for both the reactor and ICP data. As the flowreactor conditions are at room temperature, the fit is used to determine the laser line-width, which is thenused in the fit of the ICP LIF line shape to extract a temperature from the plasma measurement. Thecurrent spectral model assumes negligible collisional broadening, and so is based on the convolution of thegaussian laser frequency distribution and the thermal distribution of absorbing atom velocities. Figure 7shows a plot of the 2-photon LIF signal for atomic nitrogen in the UVM ICP torch facility free-stream, aswell as a simultaneous signal recorded in the flow reactor from a recent test. The fits obtained from thespectral model of the line shape are also shown for each spectrum.
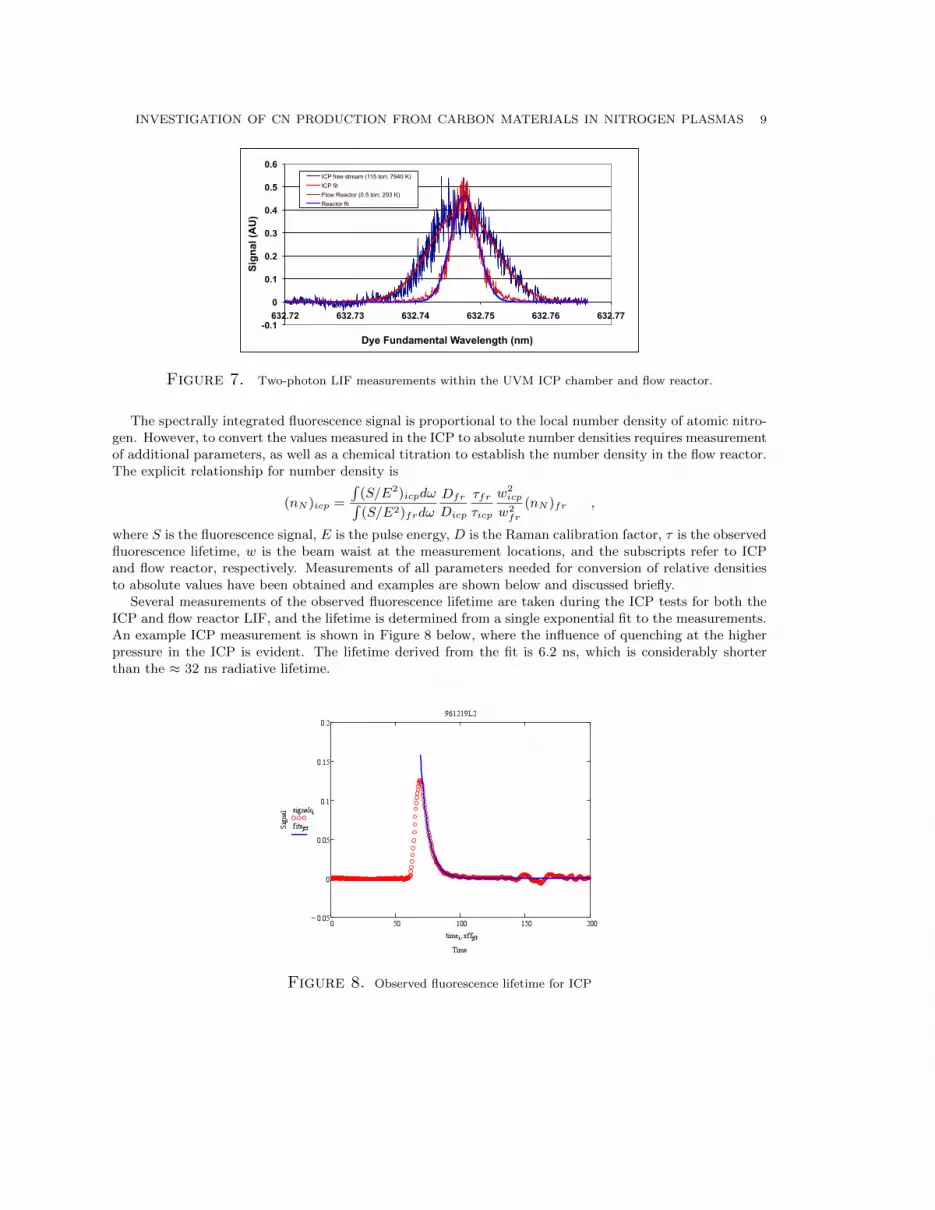
INVESTIGATION OF CN PRODUCTION FROM CARBON MATERIALS IN NITROGEN PLASMAS 9
-0.1
0
0.1
0.2
0.3
0.4
0.5
0.6
632.72 632.73 632.74 632.75 632.76 632.77
Sign
al (A
U)
Dye Fundamental Wavelength (nm)
ICP free stream (115 torr, 7940 K) ICP fit Flow Reactor (0.5 torr, 293 K) Reactor fit
Figure 7. Two-photon LIF measurements within the UVM ICP chamber and flow reactor.
The spectrally integrated fluorescence signal is proportional to the local number density of atomic nitro-gen. However, to convert the values measured in the ICP to absolute number densities requires measurementof additional parameters, as well as a chemical titration to establish the number density in the flow reactor.The explicit relationship for number density is
(nN )icp =
∫(S/E2)icpdω∫(S/E2)frdω
DfrDicp
τfrτicp
w2icp
w2fr
(nN )fr ,
where S is the fluorescence signal, E is the pulse energy, D is the Raman calibration factor, τ is the observedfluorescence lifetime, w is the beam waist at the measurement locations, and the subscripts refer to ICPand flow reactor, respectively. Measurements of all parameters needed for conversion of relative densitiesto absolute values have been obtained and examples are shown below and discussed briefly.
Several measurements of the observed fluorescence lifetime are taken during the ICP tests for both theICP and flow reactor LIF, and the lifetime is determined from a single exponential fit to the measurements.An example ICP measurement is shown in Figure 8 below, where the influence of quenching at the higherpressure in the ICP is evident. The lifetime derived from the fit is 6.2 ns, which is considerably shorterthan the ≈ 32 ns radiative lifetime.
Figure 8. Observed fluorescence lifetime for ICP

10 INVESTIGATION OF CN PRODUCTION FROM CARBON MATERIALS IN NITROGEN PLASMAS
A Spiricon beam profiler is used to record images of the laser energy distribution at each measurementlocation when the facility is not running, and the waist values are extracted from these images. Oneexample beam image is shown below in Figure 9a for the focal region in the ICP. At this location, thebeam is not perfectly circular, but the narrowest dimension is aligned along the direction perpendicular tothe surface, which provides a spatial resolution of about 0.4 mm in this direction As the beam is tightlyfocused, periodic evaluations of the energy density at the measurement locations are done by recordingPMT and energy meter signals as the polarization rotator between the doubling and tripling crystals isadjusted. If the power-law fit to the data gives a slope close to two, then the correct two-photon scaling isassumed to apply for the experiment. Results from these tests led us to reduce the energy brought to theICP flow by installing two additional beam splitters and shifting the focal position of the lens, as discussedbelow. Following this six-fold reduction in laser energy density in the focal region, the LIF signal scaledvery nearly with the square of the pulse energy, as shown below in Figure 9b.
(a) Beam Profile (b) Signal vs Pulse Energy
Figure 9. a. Beam profile measured at the ICP detection region. b. ICP LIF signal plotted
against laser pulse energy (exponent from power law fit is 1.97, compared to theoretical value of
2.)
Raman calibrations have also been done for both the ICP and flow reactor detection instrumentation.Unfortunately, the mass flow controller that is used to monitor the titration gas is currently being repaired,and so we have to postpone the conversion of the relative number density values to absolute values. Thetitration of the nitrogen atoms by the fast reaction N +NO → N2 +O is described in [8].
The graphite sample test procedure involved aligning the sample in the center of the plasma with thefacility not running and registering the laser beam stage micrometer and PMT stage micrometer to thecold sample leading surface location. The facility is then closed and evacuated, and the plasma is initiatedwith argon. After pressure is raised to the target level, nitrogen is added and argon is removed until fullnitrogen plasma flow is established. Moving away from the sample in small steps, laser wavelength scansare performed at each measurement location, and pressure and mass flow are maintained at constant levels.If time allows, some measurements are repeated to judge how steady conditions are maintained.
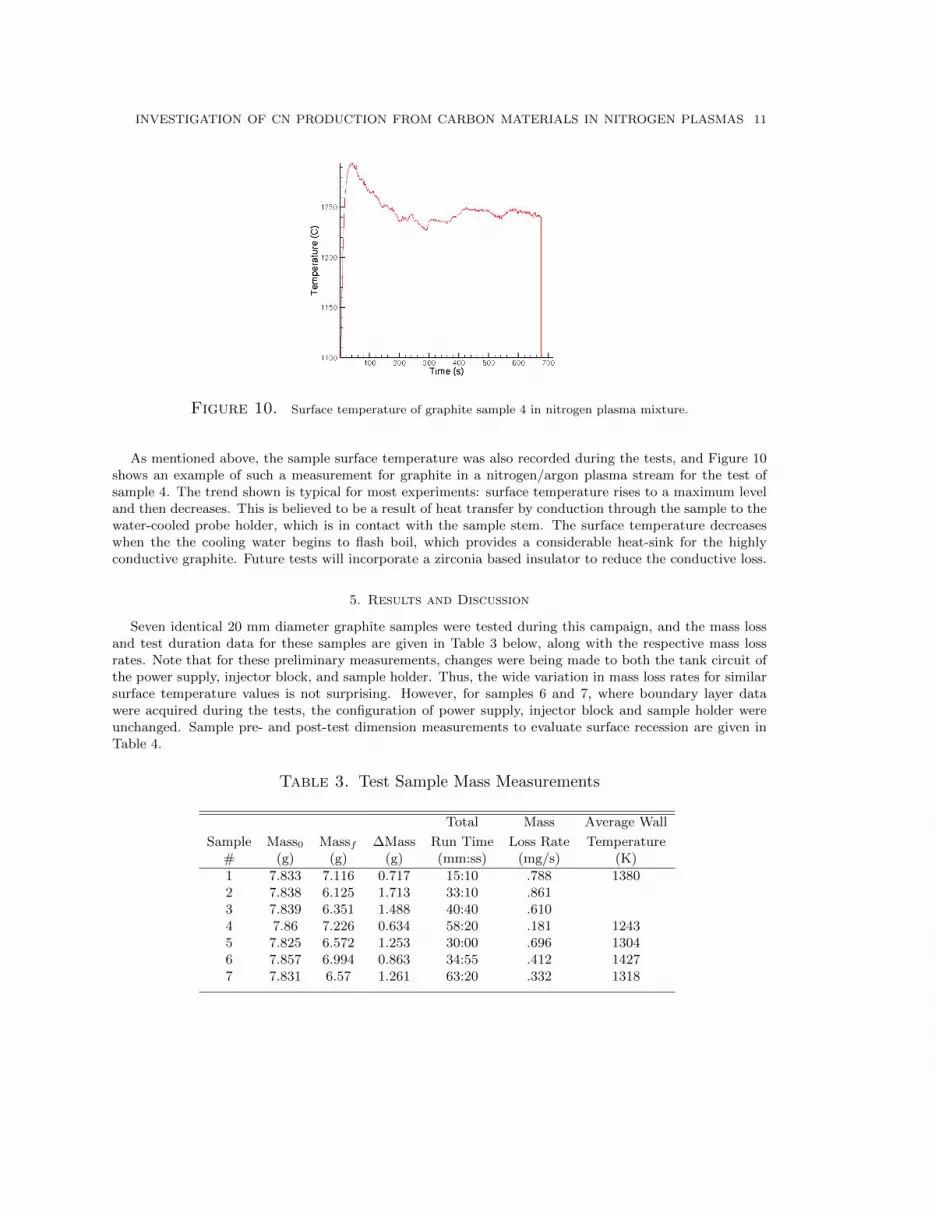
INVESTIGATION OF CN PRODUCTION FROM CARBON MATERIALS IN NITROGEN PLASMAS 11
Figure 10. Surface temperature of graphite sample 4 in nitrogen plasma mixture.
As mentioned above, the sample surface temperature was also recorded during the tests, and Figure 10shows an example of such a measurement for graphite in a nitrogen/argon plasma stream for the test ofsample 4. The trend shown is typical for most experiments: surface temperature rises to a maximum leveland then decreases. This is believed to be a result of heat transfer by conduction through the sample to thewater-cooled probe holder, which is in contact with the sample stem. The surface temperature decreaseswhen the the cooling water begins to flash boil, which provides a considerable heat-sink for the highlyconductive graphite. Future tests will incorporate a zirconia based insulator to reduce the conductive loss.
5. Results and Discussion
Seven identical 20 mm diameter graphite samples were tested during this campaign, and the mass lossand test duration data for these samples are given in Table 3 below, along with the respective mass lossrates. Note that for these preliminary measurements, changes were being made to both the tank circuit ofthe power supply, injector block, and sample holder. Thus, the wide variation in mass loss rates for similarsurface temperature values is not surprising. However, for samples 6 and 7, where boundary layer datawere acquired during the tests, the configuration of power supply, injector block and sample holder wereunchanged. Sample pre- and post-test dimension measurements to evaluate surface recession are given inTable 4.
Table 3. Test Sample Mass Measurements
Total Mass Average Wall
Sample Mass0 Massf ∆Mass Run Time Loss Rate Temperature# (g) (g) (g) (mm:ss) (mg/s) (K)
1 7.833 7.116 0.717 15:10 .788 13802 7.838 6.125 1.713 33:10 .8613 7.839 6.351 1.488 40:40 .6104 7.86 7.226 0.634 58:20 .181 12435 7.825 6.572 1.253 30:00 .696 13046 7.857 6.994 0.863 34:55 .412 14277 7.831 6.57 1.261 63:20 .332 1318

12 INVESTIGATION OF CN PRODUCTION FROM CARBON MATERIALS IN NITROGEN PLASMAS
Table 4. Test Sample Recession Measurements
Total
Sample Length0 Lengthf ∆Length Diameter0 Diameterf ∆Diameter Run Time# (mm) (mm) (mm) (mm) (mm) (mm) (mm:ss)
1 7.833 7.116 0.717 19 18.5 0.5 15:102 7.838 6.125 1.713 19 18 1 33:103 7.839 6.351 1.488 19 18 1 40:404 7.86 7.226 0.634 19 18.5 0.5 58:205 7.825 6.572 1.253 19 19 0 30:006 7.857 6.994 0.863 19 18.5 0.5 34:557 7.831 6.57 1.261 19 18 1 63:20
Figure 11. Sample 2 after a long duration, high temperature run alongside a virgin sample,
showing how a sample changes in length and profile dimensions during nitridation.
As expected, the greatest amount of mass loss came from the shortening of the sample. However, therewas also an effect on the profile as well. With high temperature conditions and a long exposure time, thediameter changed significantly, as shown in Table 4. Figure 11 shows sample 2 post-run alongside a virginsample. This illustrates how the perimeter evolves from a cylindrical shape to a tapered profile, whichsuggests an enhanced heat transfer rate at the sample corner region.
Although boundary layer measurements of nitrogen atom number density and temperature were at-tempted for each of the sample tests, reliable results were obtained for just two samples (samples 6 and 7).The translational temperature distribution is shown as a function of distance from the surface in Figure12a below and the corresponding relative nitrogen atom density is shown in 12b. The outer flow temper-atures for this test are not reliable, owing to having too high an energy density in the focal volume (thiswas checked after and the intensity was reduced by a factor of ≈ 6 for subsequent experiments). Basedon tests performed the next day in the plasma stream, we estimate that the temperature values beyond1 mm are about 1500 K too high owing to some undetermined multi-photon process interfering with the
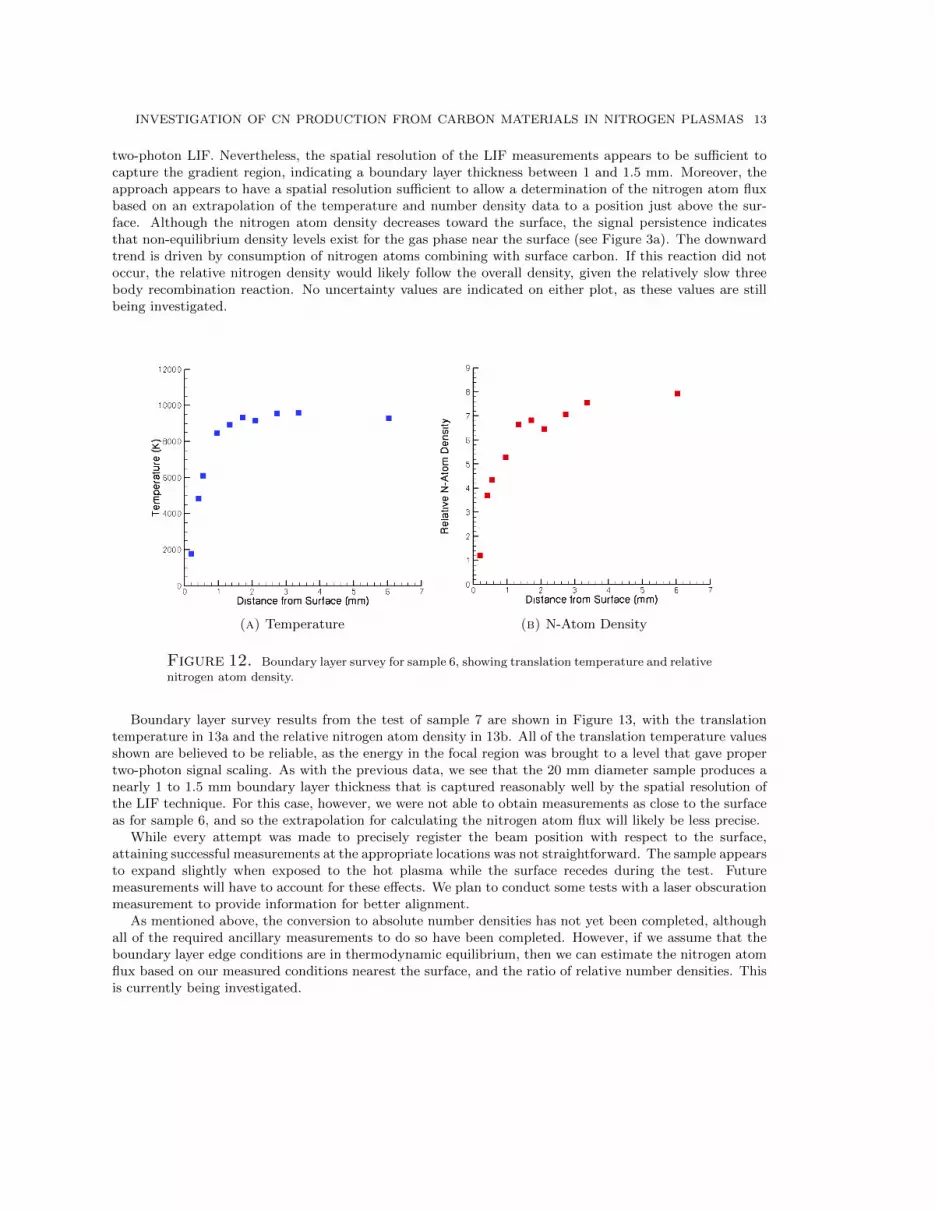
INVESTIGATION OF CN PRODUCTION FROM CARBON MATERIALS IN NITROGEN PLASMAS 13
two-photon LIF. Nevertheless, the spatial resolution of the LIF measurements appears to be sufficient tocapture the gradient region, indicating a boundary layer thickness between 1 and 1.5 mm. Moreover, theapproach appears to have a spatial resolution sufficient to allow a determination of the nitrogen atom fluxbased on an extrapolation of the temperature and number density data to a position just above the sur-face. Although the nitrogen atom density decreases toward the surface, the signal persistence indicatesthat non-equilibrium density levels exist for the gas phase near the surface (see Figure 3a). The downwardtrend is driven by consumption of nitrogen atoms combining with surface carbon. If this reaction did notoccur, the relative nitrogen density would likely follow the overall density, given the relatively slow threebody recombination reaction. No uncertainty values are indicated on either plot, as these values are stillbeing investigated.
(a) Temperature (b) N-Atom Density
Figure 12. Boundary layer survey for sample 6, showing translation temperature and relative
nitrogen atom density.
Boundary layer survey results from the test of sample 7 are shown in Figure 13, with the translationtemperature in 13a and the relative nitrogen atom density in 13b. All of the translation temperature valuesshown are believed to be reliable, as the energy in the focal region was brought to a level that gave propertwo-photon signal scaling. As with the previous data, we see that the 20 mm diameter sample produces anearly 1 to 1.5 mm boundary layer thickness that is captured reasonably well by the spatial resolution ofthe LIF technique. For this case, however, we were not able to obtain measurements as close to the surfaceas for sample 6, and so the extrapolation for calculating the nitrogen atom flux will likely be less precise.
While every attempt was made to precisely register the beam position with respect to the surface,attaining successful measurements at the appropriate locations was not straightforward. The sample appearsto expand slightly when exposed to the hot plasma while the surface recedes during the test. Futuremeasurements will have to account for these effects. We plan to conduct some tests with a laser obscurationmeasurement to provide information for better alignment.
As mentioned above, the conversion to absolute number densities has not yet been completed, althoughall of the required ancillary measurements to do so have been completed. However, if we assume that theboundary layer edge conditions are in thermodynamic equilibrium, then we can estimate the nitrogen atomflux based on our measured conditions nearest the surface, and the ratio of relative number densities. Thisis currently being investigated.

14 INVESTIGATION OF CN PRODUCTION FROM CARBON MATERIALS IN NITROGEN PLASMAS
(a) Temperature (b) Relative N-Atom Density
Figure 13. Boundary layer survey for sample 7, showing translational temperature and
relative nitrogen atom density.)
(a) Temperature (b) Relative N-Atom Density
Figure 14. Variation in temperature and N atom density in radial direction at a height of1.52 mm above sample 7 (at boundary layer edge).
Finally, recalling that the laser beam shape is elongated, and noting that the largest dimension is in theradial direction relative to the sample, it is reasonable to question whether or not radial averaging has asignificant influence on the results. To assess this, we performed a radial scan at the boundary layer edgewith sample 7 in the plasma stream. Radial profiles of translation temperature and relative nitrogen atomdensity are shown below in Figure 14. The results show modest variation in atom density and temperature.

INVESTIGATION OF CN PRODUCTION FROM CARBON MATERIALS IN NITROGEN PLASMAS 15
In the region near the center of the sample there is relatively little variation in nitrogen atom density.Additional radial surveys will be performed closer to the surface in the future to better assess uniformityof the atom flux to the surface.
6. Summary
Preliminary results from an investigation of graphite nitridation in an ICP Torch Facility have beenpresented. The diagnostic approach includes measurements of carbon mass loss along with two-photon LIFmeasurements of the nitrogen atom flux to the surface for 20 mm graphite samples installed in a nitrogenplasma stream. Boundary layer profiles of translational temperature and nitrogen number density wereobtained for two of the seven graphite samples tested. In one case, the boundary layer survey includedmeasurements very near the sample surface, but with questionable outer flow temperature levels owing toexcess beam energy density in the focal region. For the second case, following adjustments to the energydensity, reliable temperature values were obtained for the entire survey, but the survey did not include ameasurements as near to the surface as desired. Nevertheless, these preliminary results clearly indicate thatthe approach can provide species density and temperature measurements that are sufficiently well resolvedto allow a calculation of the atom flux reaching the surface. Based on the carbon loss rate and nitrogenatom arrival flux, the nitridation efficiency can be determined, once the chemical titration of the flow reactoratom population is performed and the measured relative density values are converted to absolute densities.
Further work to complete the nitridation efficiency determination and to quantify the uncertainties inthe measurements is ongoing. Additional samples, with a 25 mm diameter to increase the boundary layerthickness, are available for further measurements, and the test range will be extended to include highersurface temperature levels, which will be aided by use of an insulator to reduce the conductive heat loss.Efforts will also be made to take the initial sample surface expansion and subsequent recession into accountduring the boundary layer survey.
The approach used to assess nitridation is an example of the type of in situ measurements that needto be performed in plasma test facilities to provide a better understanding of gas-surface interactions ingeneral.
7. Acknowledgements
This work was supported by NASA Grant NNX08AC98A and AFOSR Grant FA9550-08-1-0414.

16 INVESTIGATION OF CN PRODUCTION FROM CARBON MATERIALS IN NITROGEN PLASMAS
References
[1] D.A. Pejakovic, J. Marschall, L. Duan and M.P. Martin (2008) Nitric Oxide Production from SurfaceRecombination of Oxygen and Nitrogen Atoms Journal of Thermophysics and Heat Transfer, vol. 22no. 2 10.2514/1.33073
[2] Goldstein, H.W., ”The Reaction of Active Nitrogen with Graphite,” Journal of Physical Chemistry,Vol. 68, 1964, pp. 39-42.
[3] T. Suzuki, K. Fujita, K. Ando, and T. Sakai, ”Experimental Study of Graphite Ablation in NitrogenFlow,” J. Thermo. Heat Trans., 22 [3] 382-89 (2008).
[4] C. Park and D. Bogdanoff (2006) Shock-Tube Measurement of Nitridation Coefficient of Solid CarbonJ. Thermophsyics and Heat Transfer, vol 20, no. 3, pp. 487-492
[5] W.P Owens, J. Uhl, M. Dougherty, A. Lutz and D.G. Fletcher (2010) Development of a 30 kW Induc-tively Coupled Plasma Torch Facility for Aerospace Material Testing University of Vermont
[6] P.F. Barbante (2001) Accurate and Efficient Modeling of High Temperature Non-equilibrium Air Flowsvon Karman Institute for Fluid Dynamics
[7] T. Magin (2004) A Model for Inductive Plasma Wind Tunnels von Karman Institute for Fluid Dynamics[8] D.G. Fletcher and M. Playez (2006) Characterization of Supersonic and Subsonic Plasma Flows von
Karman Institute for Fluid Dynamics AIAA 2006-3294[9] M. Playez ’Titan Atmosphere Plasma Characterization using Spectroscopic Measurement Techniques,
Ph.D. Dissertation, Ecole Centrale Paris, Laboratoire dEnergetique Moleculaire et Macroscopique, Com-bustion, June 2006.

SPECIES AND TEMPERATURE GRADIENT MEASUREMENTS IN THE REACTINGBOUNDARY LAYER OVER ICP TEST SAMPLES
D. G. Fletcher, A. J. Lutz, J. M. Meyers, W. P. Owens, and J. Uhl
University of Vermont, Burlington, Vermont 05405 USA
ABSTRACT
Improved estimations of stagnation point heat transferrequire more physically realistic gas-surface interactionmodels. This paper reports on the ongoing developmentof spatially resolved laser diagnostic measurements ofkey reacting species in the thermal boundary layer overmaterial samples placed in the flow of an inductively cou-pled plasma torch facility in stagnation point configura-tion. The specific case of carbon extraction from graphiteby atomic nitrogen (nitridation) is used to illustrate themethodology, which provides translational temperatureand species concentration along the stagnation stream-line. These measurements are used to make a prelimi-nary estimate of the nitridation rate for graphite surfacetemperature of 1590 K.
1. INTRODUCTION
There are many gas-surface interactions that are impor-tant in atmospheric entry aero-thermal heating rate calcu-lations. These include surface catalyzed recombinationfor both homogeneous and heterogeneous molecule for-mation at lower heating rates, and oxidation and nitrida-tion reactions for more severe heating [1]. Many of theserates have been determined in laboratory experiments un-der carefully controlled conditions using techniques thatare well suited to the particular test environment. How-ever, the test conditions for such laboratory measure-ments are often very different from the trajectory condi-tions that a material will encounter in an eventual atmo-spheric entry application. This situation motivates effortsto develop in situ diagnostic techniques for plasma facil-ities that more closely reproduce the trajectory aerother-mal environment. One such effort is underway at the Uni-versity of Vermont, where laser diagnostic techniques arebeing used to probe key species and thermodynamic con-ditions in the reacting boundary layer formed by a plasmaflowing over a material sample placed in stagnation pointconfiguration. These measurements are aimed at provid-ing data that can be used to guide the development ofbetter physical and chemical models for gas-surface in-teractions.
The specific example of extraction of carbon atoms from
hot graphite in a nitrogen plasma is chosen to illustratethis general laser-diagnostic based approach. We use ni-tridation to refer to this process, which has the followingchemical description
N + Cs → CN− (1)
This reaction is of interest because carbon is the mostcommon base material, often as a fiber matrix, for ther-mal protection systems designed to handle the highestheat flux levels through ablation. In addition to its con-tribution to erosion of the carbon base material at highheating conditions, active nitridation of carbon may alsobe an important source of radiant heat flux to the stag-nation region as the cyanogen radical is known to be astrong radiator owing to its permanent dipole.
While this reaction has been studied previously [2][3][4]in a number of different experimental facilities, the re-sults have varied widely as discussed by Zhang et al [5].Two of the existing published values for this reaction rateshow it to be slower than the corresponding rate for car-bon oxidation, while the third published value [4] is morerapid than oxidation. This disparity in published reactiv-ity values, coupled with the fact that none of the experi-mental facilities used in the studies were designed explic-itly to produce trajectory relevant aerothermal test con-ditions, provides additional motivation for the investiga-tion.
Following brief descriptions of the Inductively CoupledPlasma (ICP) Torch facility, the laser and optical instru-mentation, and the experimental approach, measurementsfrom several different carbon nitridation experiments arepresented. These results are discussed and a preliminaryvalue of the nitridation rate is derived from the measure-ments.
2. FACILITY DESCRIPTION
The 30 kW ICP Torch Facility at the University of Ver-mont is designed to test materials that are being devel-oped for high-temperature aerospace applications with
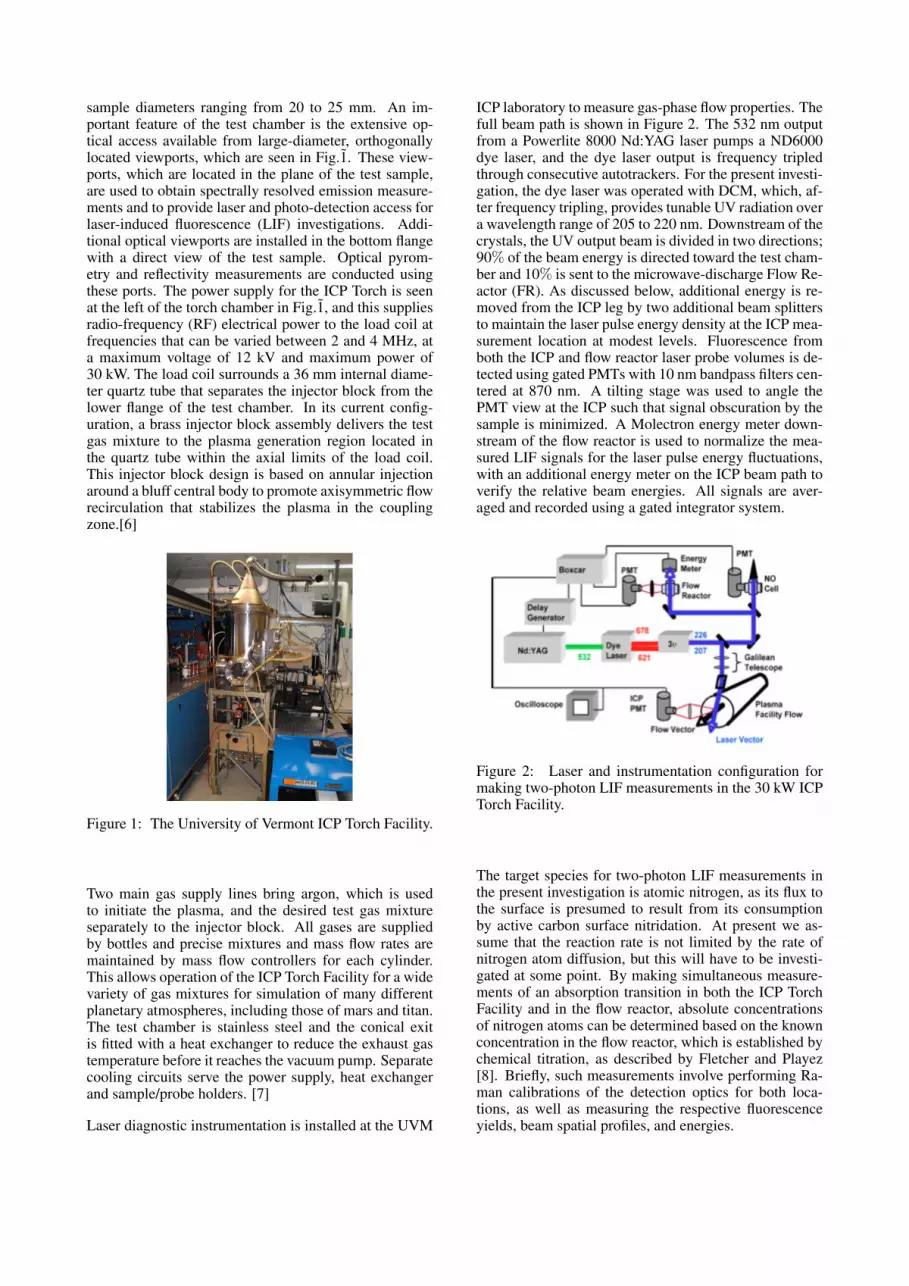
sample diameters ranging from 20 to 25 mm. An im-portant feature of the test chamber is the extensive op-tical access available from large-diameter, orthogonallylocated viewports, which are seen in Fig.1. These view-ports, which are located in the plane of the test sample,are used to obtain spectrally resolved emission measure-ments and to provide laser and photo-detection access forlaser-induced fluorescence (LIF) investigations. Addi-tional optical viewports are installed in the bottom flangewith a direct view of the test sample. Optical pyrom-etry and reflectivity measurements are conducted usingthese ports. The power supply for the ICP Torch is seenat the left of the torch chamber in Fig.1, and this suppliesradio-frequency (RF) electrical power to the load coil atfrequencies that can be varied between 2 and 4 MHz, ata maximum voltage of 12 kV and maximum power of30 kW. The load coil surrounds a 36 mm internal diame-ter quartz tube that separates the injector block from thelower flange of the test chamber. In its current config-uration, a brass injector block assembly delivers the testgas mixture to the plasma generation region located inthe quartz tube within the axial limits of the load coil.This injector block design is based on annular injectionaround a bluff central body to promote axisymmetric flowrecirculation that stabilizes the plasma in the couplingzone.[6]
Figure 1: The University of Vermont ICP Torch Facility.
Two main gas supply lines bring argon, which is usedto initiate the plasma, and the desired test gas mixtureseparately to the injector block. All gases are suppliedby bottles and precise mixtures and mass flow rates aremaintained by mass flow controllers for each cylinder.This allows operation of the ICP Torch Facility for a widevariety of gas mixtures for simulation of many differentplanetary atmospheres, including those of mars and titan.The test chamber is stainless steel and the conical exitis fitted with a heat exchanger to reduce the exhaust gastemperature before it reaches the vacuum pump. Separatecooling circuits serve the power supply, heat exchangerand sample/probe holders. [7]
Laser diagnostic instrumentation is installed at the UVM
ICP laboratory to measure gas-phase flow properties. Thefull beam path is shown in Figure 2. The 532 nm outputfrom a Powerlite 8000 Nd:YAG laser pumps a ND6000dye laser, and the dye laser output is frequency tripledthrough consecutive autotrackers. For the present investi-gation, the dye laser was operated with DCM, which, af-ter frequency tripling, provides tunable UV radiation overa wavelength range of 205 to 220 nm. Downstream of thecrystals, the UV output beam is divided in two directions;90% of the beam energy is directed toward the test cham-ber and 10% is sent to the microwave-discharge Flow Re-actor (FR). As discussed below, additional energy is re-moved from the ICP leg by two additional beam splittersto maintain the laser pulse energy density at the ICP mea-surement location at modest levels. Fluorescence fromboth the ICP and flow reactor laser probe volumes is de-tected using gated PMTs with 10 nm bandpass filters cen-tered at 870 nm. A tilting stage was used to angle thePMT view at the ICP such that signal obscuration by thesample is minimized. A Molectron energy meter down-stream of the flow reactor is used to normalize the mea-sured LIF signals for the laser pulse energy fluctuations,with an additional energy meter on the ICP beam path toverify the relative beam energies. All signals are aver-aged and recorded using a gated integrator system.
Figure 2: Laser and instrumentation configuration formaking two-photon LIF measurements in the 30 kW ICPTorch Facility.
The target species for two-photon LIF measurements inthe present investigation is atomic nitrogen, as its flux tothe surface is presumed to result from its consumptionby active carbon surface nitridation. At present we as-sume that the reaction rate is not limited by the rate ofnitrogen atom diffusion, but this will have to be investi-gated at some point. By making simultaneous measure-ments of an absorption transition in both the ICP TorchFacility and in the flow reactor, absolute concentrationsof nitrogen atoms can be determined based on the knownconcentration in the flow reactor, which is established bychemical titration, as described by Fletcher and Playez[8]. Briefly, such measurements involve performing Ra-man calibrations of the detection optics for both loca-tions, as well as measuring the respective fluorescenceyields, beam spatial profiles, and energies.

3. EXPERIMENTAL APPROACH
Two-photon LIF will be used to obtain quantitative mea-surements of nitrogen atom densities in the reactingboundary layer over graphite samples placed in the nitro-gen plasma stream to allow a determination of the nitri-dation reaction efficiency. For the present investigation,we assume that nitridation arises directly from atomic ni-trogen reaching the surface and combining with a surfacecarbon atom, so the reaction efficiency, γN , is calculatedfrom the following equation [5].
γN =ΓCN
ΓN=
(∆MC
AmC∆t
)/
(nN4
√8kBT
πmN
)(2)
The reaction rate efficiency is the ratio of the CN fluxleaving the surface, ΓCN , to the nitrogen atom flux arriv-ing at the surface, ΓN , which are the rates of CN creationand N-atom flow to the surface, respectively. Note thatthis is based on the presumed mechanism of a nitrogenatom extracting a carbon atom from the surface. The fluxratio can be expressed as a function of the sample carbonmass loss ∆MC , the sample area A, the atomic massesof carbon and nitrogen mC and mN , the exposure time∆t, the nitrogen atom number density nN , the Boltzmannconstant kB and temperature T . Of these parameters, theonly values that need to be measured experimentally arethe carbon mass loss, sample area, exposure time, tem-perature and nitrogen atom number density just above thesample surface.
The sample area is measured directly from the initial ge-ometry, and for these first tests the change in area due toplasma exposure is assumed to be negligible. All sam-ples used have a 20 mm nominal diameter and a 12.5mm height. The carbon mass loss is calculated from pre-and post-test mass measurements. Exposure times for thegraphite samples in nitrogen plasmas were recorded fromthe time that the target test conditions were achieved.Owing to the sample geometry used for these tests, thesamples were always in the plasma, even during startup.However, the starting conditions in argon have very lowheat flux levels, and we expect that exposure to the ar-gon plasma did not affect the surface. Two-photon LIF isused to make spatially resolved measurements of transla-tion temperature and nitrogen atom number density.
Two-photon LIF of atomic nitrogen can be done using ei-ther of two excitation strategies, and these are shown inFigure 3. Owing to use of DCM dye, higher pulse en-ergies are available for the longer wavelength excitation(211 nm), and so this approach is used for the present in-vestigation, despite the fact that the fluorescence is polar-ized. As mentioned above, the output of the dye laser isfrequency tripled to the 211 nm wavelength region. Notethat both nitrogen number density and translational tem-perature are needed to quantify the nitrogen atom fluxrate, and so the measurements were made by scanning the
dye laser wavelength over the atomic transition. Transla-tion temperature is determined from a spectral fit of thefluorescence for both the reactor and ICP data. As theflow reactor conditions are at room temperature, the fit isused to determine the laser line-width, which is then usedin the fit of the ICP LIF line shape to extract a temper-ature from the plasma measurement. The current spec-tral model assumes negligible collisional broadening, andso is based on the convolution of the gaussian laser fre-quency distribution and the thermal distribution of ab-sorbing atom velocities. Figure 4 shows a plot of the 2-photon LIF signal for atomic nitrogen in the UVM ICPtorch facility free-stream, as well as a simultaneous sig-nal recorded in the flow reactor from a recent test. Thefits obtained from the spectral model of the line shapeare also shown for each spectrum. As the flow reactorcondition is near room temperature, the transition widthis considerably narrower for the transition in the reactorthan in the ICP Torch plasma flow.
Figure 3: Two-photon nitrogen excitation strategies.
-0.1
0
0.1
0.2
0.3
0.4
0.5
0.6
632.72 632.73 632.74 632.75 632.76 632.77
Sign
al (A
U)
Dye Fundamental Wavelength (nm)
ICP free stream (115 torr, 7940 K) ICP fit Flow Reactor (0.5 torr, 293 K) Reactor fit
Figure 4: Two-photon LIF measurements within theUVM ICP chamber and flow reactor.
The spectrally integrated fluorescence signal is propor-tional to the local number density of atomic nitrogen.However, to convert the values measured in the ICP toabsolute number densities requires measurement of addi-tional parameters, as well as a chemical titration to estab-lish the number density in the flow reactor. The explicit
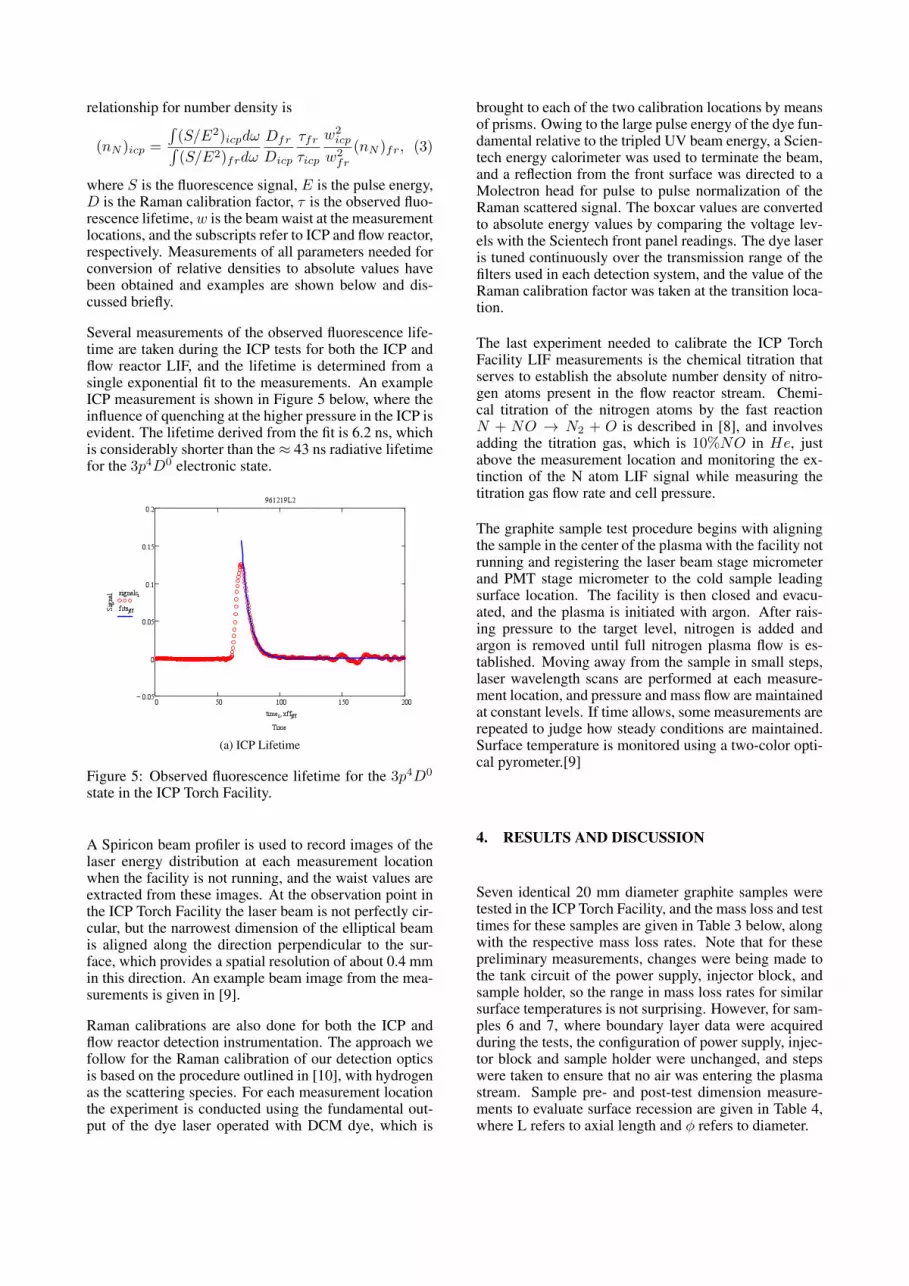
relationship for number density is
(nN )icp =
∫(S/E2)icpdω∫(S/E2)frdω
Dfr
Dicp
τfrτicp
w2icp
w2fr
(nN )fr, (3)
where S is the fluorescence signal, E is the pulse energy,D is the Raman calibration factor, τ is the observed fluo-rescence lifetime,w is the beam waist at the measurementlocations, and the subscripts refer to ICP and flow reactor,respectively. Measurements of all parameters needed forconversion of relative densities to absolute values havebeen obtained and examples are shown below and dis-cussed briefly.
Several measurements of the observed fluorescence life-time are taken during the ICP tests for both the ICP andflow reactor LIF, and the lifetime is determined from asingle exponential fit to the measurements. An exampleICP measurement is shown in Figure 5 below, where theinfluence of quenching at the higher pressure in the ICP isevident. The lifetime derived from the fit is 6.2 ns, whichis considerably shorter than the≈ 43 ns radiative lifetimefor the 3p4D0 electronic state.
(a) ICP Lifetime
Figure 5: Observed fluorescence lifetime for the 3p4D0
state in the ICP Torch Facility.
A Spiricon beam profiler is used to record images of thelaser energy distribution at each measurement locationwhen the facility is not running, and the waist values areextracted from these images. At the observation point inthe ICP Torch Facility the laser beam is not perfectly cir-cular, but the narrowest dimension of the elliptical beamis aligned along the direction perpendicular to the sur-face, which provides a spatial resolution of about 0.4 mmin this direction. An example beam image from the mea-surements is given in [9].
Raman calibrations are also done for both the ICP andflow reactor detection instrumentation. The approach wefollow for the Raman calibration of our detection opticsis based on the procedure outlined in [10], with hydrogenas the scattering species. For each measurement locationthe experiment is conducted using the fundamental out-put of the dye laser operated with DCM dye, which is
brought to each of the two calibration locations by meansof prisms. Owing to the large pulse energy of the dye fun-damental relative to the tripled UV beam energy, a Scien-tech energy calorimeter was used to terminate the beam,and a reflection from the front surface was directed to aMolectron head for pulse to pulse normalization of theRaman scattered signal. The boxcar values are convertedto absolute energy values by comparing the voltage lev-els with the Scientech front panel readings. The dye laseris tuned continuously over the transmission range of thefilters used in each detection system, and the value of theRaman calibration factor was taken at the transition loca-tion.
The last experiment needed to calibrate the ICP TorchFacility LIF measurements is the chemical titration thatserves to establish the absolute number density of nitro-gen atoms present in the flow reactor stream. Chemi-cal titration of the nitrogen atoms by the fast reactionN + NO → N2 + O is described in [8], and involvesadding the titration gas, which is 10%NO in He, justabove the measurement location and monitoring the ex-tinction of the N atom LIF signal while measuring thetitration gas flow rate and cell pressure.
The graphite sample test procedure begins with aligningthe sample in the center of the plasma with the facility notrunning and registering the laser beam stage micrometerand PMT stage micrometer to the cold sample leadingsurface location. The facility is then closed and evacu-ated, and the plasma is initiated with argon. After rais-ing pressure to the target level, nitrogen is added andargon is removed until full nitrogen plasma flow is es-tablished. Moving away from the sample in small steps,laser wavelength scans are performed at each measure-ment location, and pressure and mass flow are maintainedat constant levels. If time allows, some measurements arerepeated to judge how steady conditions are maintained.Surface temperature is monitored using a two-color opti-cal pyrometer.[9]
4. RESULTS AND DISCUSSION
Seven identical 20 mm diameter graphite samples weretested in the ICP Torch Facility, and the mass loss and testtimes for these samples are given in Table 3 below, alongwith the respective mass loss rates. Note that for thesepreliminary measurements, changes were being made tothe tank circuit of the power supply, injector block, andsample holder, so the range in mass loss rates for similarsurface temperatures is not surprising. However, for sam-ples 6 and 7, where boundary layer data were acquiredduring the tests, the configuration of power supply, injec-tor block and sample holder were unchanged, and stepswere taken to ensure that no air was entering the plasmastream. Sample pre- and post-test dimension measure-ments to evaluate surface recession are given in Table 4,where L refers to axial length and φ refers to diameter.
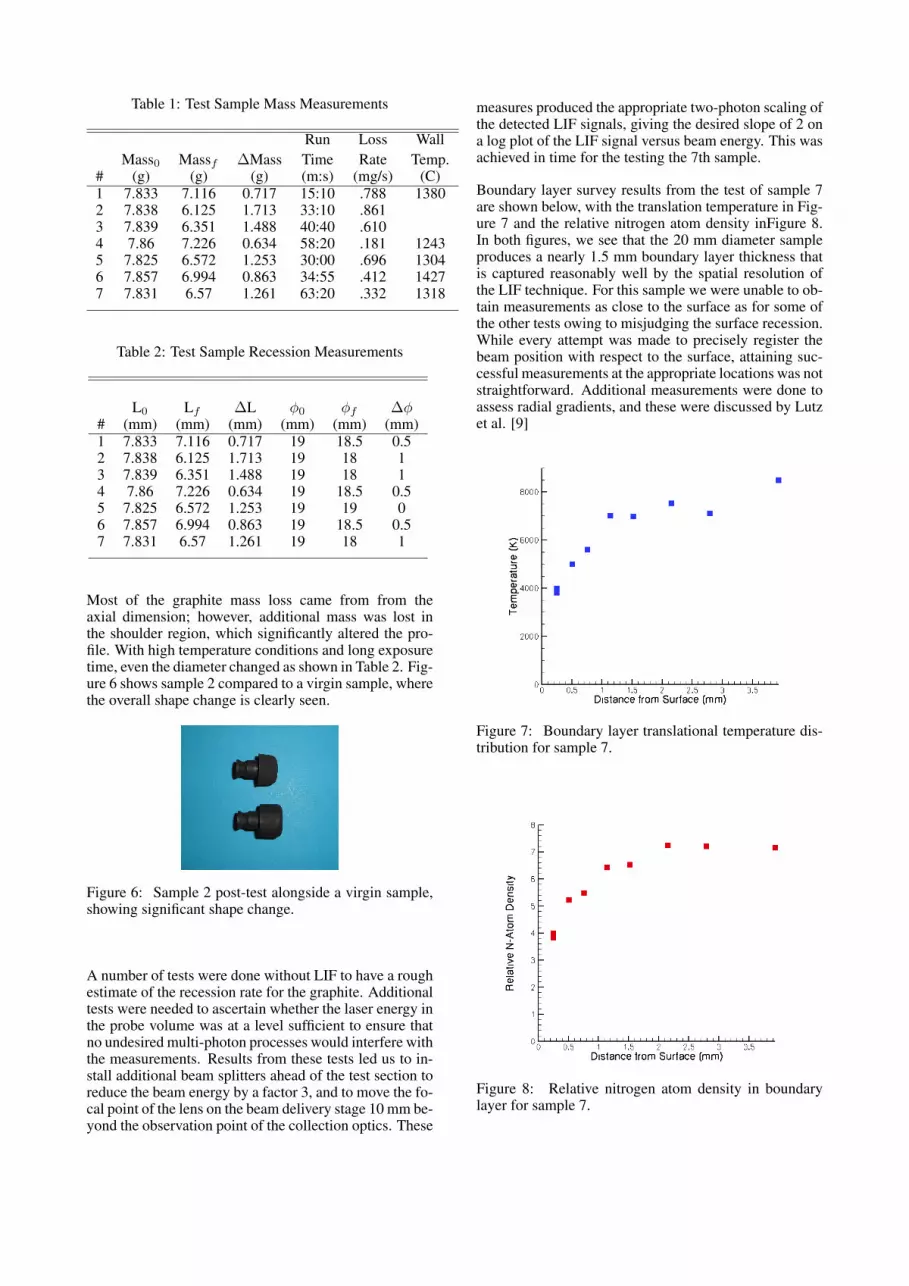
Table 1: Test Sample Mass Measurements
Run Loss WallMass0 Massf ∆Mass Time Rate Temp.
# (g) (g) (g) (m:s) (mg/s) (C)1 7.833 7.116 0.717 15:10 .788 13802 7.838 6.125 1.713 33:10 .8613 7.839 6.351 1.488 40:40 .6104 7.86 7.226 0.634 58:20 .181 12435 7.825 6.572 1.253 30:00 .696 13046 7.857 6.994 0.863 34:55 .412 14277 7.831 6.57 1.261 63:20 .332 1318
Table 2: Test Sample Recession Measurements
L0 Lf ∆L φ0 φf ∆φ# (mm) (mm) (mm) (mm) (mm) (mm)1 7.833 7.116 0.717 19 18.5 0.52 7.838 6.125 1.713 19 18 13 7.839 6.351 1.488 19 18 14 7.86 7.226 0.634 19 18.5 0.55 7.825 6.572 1.253 19 19 06 7.857 6.994 0.863 19 18.5 0.57 7.831 6.57 1.261 19 18 1
Most of the graphite mass loss came from from theaxial dimension; however, additional mass was lost inthe shoulder region, which significantly altered the pro-file. With high temperature conditions and long exposuretime, even the diameter changed as shown in Table 2. Fig-ure 6 shows sample 2 compared to a virgin sample, wherethe overall shape change is clearly seen.
Figure 6: Sample 2 post-test alongside a virgin sample,showing significant shape change.
A number of tests were done without LIF to have a roughestimate of the recession rate for the graphite. Additionaltests were needed to ascertain whether the laser energy inthe probe volume was at a level sufficient to ensure thatno undesired multi-photon processes would interfere withthe measurements. Results from these tests led us to in-stall additional beam splitters ahead of the test section toreduce the beam energy by a factor 3, and to move the fo-cal point of the lens on the beam delivery stage 10 mm be-yond the observation point of the collection optics. These
measures produced the appropriate two-photon scaling ofthe detected LIF signals, giving the desired slope of 2 ona log plot of the LIF signal versus beam energy. This wasachieved in time for the testing the 7th sample.
Boundary layer survey results from the test of sample 7are shown below, with the translation temperature in Fig-ure 7 and the relative nitrogen atom density inFigure 8.In both figures, we see that the 20 mm diameter sampleproduces a nearly 1.5 mm boundary layer thickness thatis captured reasonably well by the spatial resolution ofthe LIF technique. For this sample we were unable to ob-tain measurements as close to the surface as for some ofthe other tests owing to misjudging the surface recession.While every attempt was made to precisely register thebeam position with respect to the surface, attaining suc-cessful measurements at the appropriate locations was notstraightforward. Additional measurements were done toassess radial gradients, and these were discussed by Lutzet al. [9]
Figure 7: Boundary layer translational temperature dis-tribution for sample 7.
Figure 8: Relative nitrogen atom density in boundarylayer for sample 7.
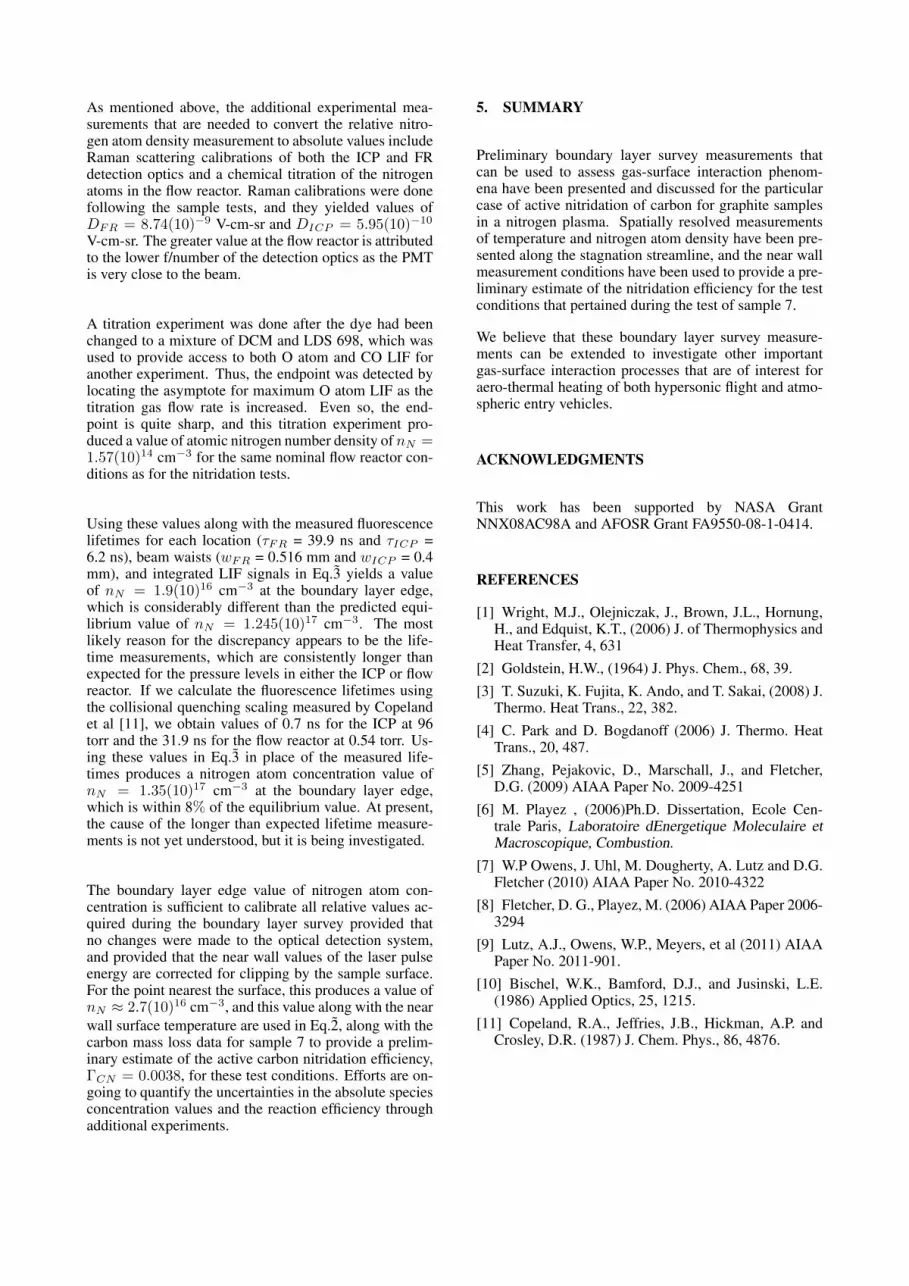
As mentioned above, the additional experimental mea-surements that are needed to convert the relative nitro-gen atom density measurement to absolute values includeRaman scattering calibrations of both the ICP and FRdetection optics and a chemical titration of the nitrogenatoms in the flow reactor. Raman calibrations were donefollowing the sample tests, and they yielded values ofDFR = 8.74(10)−9 V-cm-sr and DICP = 5.95(10)−10
V-cm-sr. The greater value at the flow reactor is attributedto the lower f/number of the detection optics as the PMTis very close to the beam.
A titration experiment was done after the dye had beenchanged to a mixture of DCM and LDS 698, which wasused to provide access to both O atom and CO LIF foranother experiment. Thus, the endpoint was detected bylocating the asymptote for maximum O atom LIF as thetitration gas flow rate is increased. Even so, the end-point is quite sharp, and this titration experiment pro-duced a value of atomic nitrogen number density of nN =1.57(10)14 cm−3 for the same nominal flow reactor con-ditions as for the nitridation tests.
Using these values along with the measured fluorescencelifetimes for each location (τFR = 39.9 ns and τICP =6.2 ns), beam waists (wFR = 0.516 mm and wICP = 0.4mm), and integrated LIF signals in Eq.3 yields a valueof nN = 1.9(10)16 cm−3 at the boundary layer edge,which is considerably different than the predicted equi-librium value of nN = 1.245(10)17 cm−3. The mostlikely reason for the discrepancy appears to be the life-time measurements, which are consistently longer thanexpected for the pressure levels in either the ICP or flowreactor. If we calculate the fluorescence lifetimes usingthe collisional quenching scaling measured by Copelandet al [11], we obtain values of 0.7 ns for the ICP at 96torr and the 31.9 ns for the flow reactor at 0.54 torr. Us-ing these values in Eq.3 in place of the measured life-times produces a nitrogen atom concentration value ofnN = 1.35(10)17 cm−3 at the boundary layer edge,which is within 8% of the equilibrium value. At present,the cause of the longer than expected lifetime measure-ments is not yet understood, but it is being investigated.
The boundary layer edge value of nitrogen atom con-centration is sufficient to calibrate all relative values ac-quired during the boundary layer survey provided thatno changes were made to the optical detection system,and provided that the near wall values of the laser pulseenergy are corrected for clipping by the sample surface.For the point nearest the surface, this produces a value ofnN ≈ 2.7(10)16 cm−3, and this value along with the nearwall surface temperature are used in Eq.2, along with thecarbon mass loss data for sample 7 to provide a prelim-inary estimate of the active carbon nitridation efficiency,ΓCN = 0.0038, for these test conditions. Efforts are on-going to quantify the uncertainties in the absolute speciesconcentration values and the reaction efficiency throughadditional experiments.
5. SUMMARY
Preliminary boundary layer survey measurements thatcan be used to assess gas-surface interaction phenom-ena have been presented and discussed for the particularcase of active nitridation of carbon for graphite samplesin a nitrogen plasma. Spatially resolved measurementsof temperature and nitrogen atom density have been pre-sented along the stagnation streamline, and the near wallmeasurement conditions have been used to provide a pre-liminary estimate of the nitridation efficiency for the testconditions that pertained during the test of sample 7.
We believe that these boundary layer survey measure-ments can be extended to investigate other importantgas-surface interaction processes that are of interest foraero-thermal heating of both hypersonic flight and atmo-spheric entry vehicles.
ACKNOWLEDGMENTS
This work has been supported by NASA GrantNNX08AC98A and AFOSR Grant FA9550-08-1-0414.
REFERENCES
[1] Wright, M.J., Olejniczak, J., Brown, J.L., Hornung,H., and Edquist, K.T., (2006) J. of Thermophysics andHeat Transfer, 4, 631
[2] Goldstein, H.W., (1964) J. Phys. Chem., 68, 39.[3] T. Suzuki, K. Fujita, K. Ando, and T. Sakai, (2008) J.
Thermo. Heat Trans., 22, 382.[4] C. Park and D. Bogdanoff (2006) J. Thermo. Heat
Trans., 20, 487.[5] Zhang, Pejakovic, D., Marschall, J., and Fletcher,
D.G. (2009) AIAA Paper No. 2009-4251[6] M. Playez , (2006)Ph.D. Dissertation, Ecole Cen-
trale Paris, Laboratoire dEnergetique Moleculaire etMacroscopique, Combustion.
[7] W.P Owens, J. Uhl, M. Dougherty, A. Lutz and D.G.Fletcher (2010) AIAA Paper No. 2010-4322
[8] Fletcher, D. G., Playez, M. (2006) AIAA Paper 2006-3294
[9] Lutz, A.J., Owens, W.P., Meyers, et al (2011) AIAAPaper No. 2011-901.
[10] Bischel, W.K., Bamford, D.J., and Jusinski, L.E.(1986) Applied Optics, 25, 1215.
[11] Copeland, R.A., Jeffries, J.B., Hickman, A.P. andCrosley, D.R. (1987) J. Chem. Phys., 86, 4876.