developing seismogenic source models based on geologic fault data
TRANSCRIPT
Seismological Research Letters Volume 82, Number 4 July/August 2011 519doi: 10.1785/gssrl.82.4.519
E
developing seismogenic source models based on geologic fault dataKathleen M. Haller and Roberto Basili
Kathleen M. Haller1 and Roberto Basili2
Online material: Documentation of the minimum set of required parameters to characterize seismogenic sources in seis-mic hazard assessment and conversions for making our models compatible.
INTRODUCTION
Calculating seismic hazard usually requires input that includes seismicity associated with known faults, historical earthquake catalogs, geodesy, and models of ground shaking. This paper will address the input generally derived from geologic studies that augment the short historical catalog to predict ground shaking at time scales of tens, hundreds, or thousands of years (e.g., SSHAC 1997). A seismogenic source model, terminol-ogy we adopt here for a fault source model, includes explicit three-dimensional faults deemed capable of generating ground motions of engineering significance within a specified time frame of interest. In tectonically active regions of the world, such as near plate boundaries, multiple seismic cycles span a few hundred to a few thousand years. In contrast, in less active regions hundreds of kilometers from the nearest plate bound-ary, seismic cycles generally are thousands to tens of thousands of years long. Therefore, one should include sources having both longer recurrence intervals and possibly older times of most recent rupture in less active regions of the world rather than restricting the model to include only Holocene faults (i.e., those with evidence of large-magnitude earthquakes in the past 11,500 years) as is the practice in tectonically active regions with high deformation rates.
During the past 15 years, our institutions independently developed databases to characterize seismogenic sources based on geologic data at a national scale. Our goal here is to compare the content of these two publicly available seismogenic source models compiled for the primary purpose of supporting seis-mic hazard calculations by the Istituto Nazionale di Geofisica e Vulcanologia (INGV) and the U.S. Geological Survey (USGS); hereinafter we refer to the two seismogenic source models as INGV and USGS, respectively. This comparison is timely because new initiatives are emerging to characterize seismo-
genic sources at the continental scale (e.g., SHARE in the Euro-Mediterranean, http://www.share-eu.org/; EMME in the Middle East, http://www.emme-gem.org/) and global scale (e.g., GEM, http://www.globalquakemodel.org/; Anonymous 2008). To some extent, each of these efforts is still trying to resolve the level of optimal detail required for this type of compilation. The comparison we provide defines a common standard for consid-eration by the international community for future regional and global seismogenic source models by identifying the nec-essary parameters that capture the essence of geological fault data in order to characterize seismogenic sources. In addition, we inform potential users of differences in our usage of com-mon geological/seismological terms to avoid inappropriate use of the data in our models and provide guidance to convert the data from one model to the other (for detailed instructions, see the electronic supplement to this article). Applying our recom-mendations will permit probabilistic seismic hazard assessment codes to run seamlessly using either seismogenic source input.
The USGS and INGV database schema compare well at a first-level inspection. Both databases contain a set of fields rep-resenting generalized fault three-dimensional geometry and additional fields that capture the essence of past earthquake occurrences. Nevertheless, there are important differences. When we further analyze supposedly comparable fields, many are defined differently. These differences would cause anoma-lous results in hazard prediction if one assumes the values are similarly defined. The data, however, can be made fully com-patible using simple transformations.
SEISMOGENIC SOURCE MODELS RATIONALE
In this section we define the similarities and differences in our databases and provide details and guidance for data conversion (also see the electronic supplement to this article). Primarily, our approaches differ due to the level of difficulty in identify-ing seismogenic sources at the surface in the very different tec-tonic settings of Italy and the United States. Most seismogenic sources in the United States are in the western half of the con-terminous states and Alaska where, thanks to long-lived tec-tonic processes and low erosion rates, they are well expressed in the landscape. However, in Italy, the youngest faults that deform the surface of the earth are less obvious. Blind faults,
1. U.S. Geological Survey, Denver, Colorado, U.S.A.2. Istituto Nazionale di Geofisica e Vulcanologia, Rome, Italy

520 Seismological Research Letters Volume 82, Number 4 July/August 2011
common in Italy, southern California, and many other places in the world, have caused very damaging earthquakes and are extremely difficult to recognize and furthermore characterize as seismogenic sources. The approach that is implemented in the INGV database can successfully be used in other regions of the world that have blind faults, whereas the approach that is used in the USGS database is appropriate in regions that have well-expressed faults at the surface.
Both datasets contain geometric and behavioral attributes of their respective seismogenic sources. We only address here the required set of parameters for probabilistic seismic hazard assessment even though both schemas contain additional fields that support other applications, e.g., scenario earthquakes and geodetic and geodynamic analyses.
INGV Seismogenic Source ModelThe Database of Individual Seismogenic Sources (DISS) was planned and designed at INGV in the second half of the 1990s to highlight the knowledge of active tectonics gained in Italy during the previous decade. It was developed as a permanent, updatable interface between the data providers and the final users. After several years of development, it was first presented and distributed to the seismological community in 2000 (DISS1) and 2001 (DISS2; Valensise and Pantosti 2001). The prototype of the current version of the database schema (DISS3) was released in 2004 (Basili et al. 2008, Basili et al. 2009), and its content has since been updated several times. Recent seismic zonation (Meletti et al. 2008) relied on DISS data and even-tually led to the national seismic hazard map of Italy (MPS
Working Group 2004) and has been used in several other haz-ard applications. Currently, the model contains 98 seismogenic sources located in Italy and neighboring countries (Figure 1A). Overall, the DISS incorporated information from about 2,500 publications, which are cited in comments. In addition, figures from these publications also are included in the database.
As the database name suggests, DISS initially contained a seismogenic source model of individual fault ruptures. These were mainly the preferred fault representations of the sources of known past earthquakes, that is, historical earthquakes associated with faults recognized by geological and geophysi-cal methods. Most faults in and near Italy are blind or inacces-sible; for example, numerous known faults are located offshore, buried faults are prevalent in the River Po alluvial plains (from Turin to Venice), and lower-crust fault sources have revealed themselves in several recent damaging earthquakes. The his-torical catalog is too short to capture all sources. Thus, the group at INGV realized that many of the potential seismogenic sources remained uncharacterized and, as such, could not be considered in future seismic hazard analyses.
Recognizing these inherent difficulties in identifying fault segments in the Italian geologic/geomorphic record, we added a new category, currently named “Composite Seismogenic Sources,” in DISS3 (http://diss.rm.ingv.it/diss/) to extend the completeness of the model. The ends of a composite seis-mogenic source can be defined either at the end of an adjacent identified seismogenic source or at a significant structural change. Therefore, sources may span a number of individual potential ruptures and can generate earthquakes of any size up
▲ Figure 1. Maps showing location of seismogenic sources for (A) the INGV model and (B) western United States USGS model. The upper edge of the seismogenic sources in the INGV model are shown by solid lines; the planes depicting the sources, projected to the surface, are shown by the gray boxes. The upper edge of the seismogenic sources in the USGS model is shown by solid lines.
(A) (B)
Seismological Research Letters Volume 82, Number 4 July/August 2011 521
to an assigned maximum. However, a minimum magnitude of M 5.5 is required for a source to be included in the database. Although defining a composite seismogenic source instead of rupture segments precludes the use of seismological relations based on fault length, it dramatically increases the ability of mapping fault sources in areas where the information about actual fault ruptures is scarce.
So far, over twenty scientists, either from INGV or other institutions and universities, contributed records to the data-base. The project was funded by the European Union, the Italian Department for Civil Defense, INGV, and other Italian funding bodies. Based on Web site monitoring, mailing, and referring publications, the DISS user community consists of not only seis-mic hazard specialists and other Earth scientists but also profes-sional geologists, earthquake engineers, planners, and insurers.
USGS Seismogenic Source ModelIn contrast to the effort at INGV, the USGS seismogenic source model was developed decades after the release of the first seismic hazard maps for the country (Algermissen and Perkins 1976; Algermissen et al. 1982). The evolution from source zones in the 1970s and composite fault and zone sources in the 1980s to fully incorporating geologic data to augment the short historical earthquake catalog was first realized in 1996 (Frankel et al. 1996; Petersen et al. 1996). The USGS contin-ues to update the national seismic hazard maps and the seis-mogenic source model (as well as all other components of the model) on a regular basis (Frankel et al. 2002, Petersen et al. 2008). Currently, the USGS seismogenic source model consists of 584 crustal faults (Figure 1B; http://geohazards.usgs.gov/cfusion/hazfaults_search/hf_search_main.cfm), mostly located in the western United States, that have long been recognized by their obvious geomorphic expression. However, the model only contains about one-fourth of the known Quaternary faults in the United States. Several reasons contribute to the omission of potentially hazardous faults from the USGS model. First, the seismogenic source model consists of faults that have gen-erated earthquakes that permanently deformed the surface of the earth. According to Wells and Coppersmith (1993), that represents slightly more than 50 percent of M 6.3–6.5 and 80 percent of M 7.0 earthquakes, based on analysis of historical earthquake data. In addition, their study shows that crustal earthquakes of M 7.5 or greater always result in surface rup-ture. Another study by Coppersmith and Youngs (2000) sug-gests that only 50 percent of M 5.8–M 6 rupture the surface and 95 percent of M 7 earthquakes rupture the surface in the western United States. Obviously, many potentially damaging earthquakes are below these thresholds of observation. Second, many known faults in the western United States either remain virtually unstudied or the documented epistemic uncertainty is so large that parameters cannot be assigned. The USGS seis-mogenic source model is based on data from over 5,000 pub-lished sources. Faults that are recognized but not further char-acterized in publications are not included in the model.
The USGS seismogenic source model evolves with every update of the national seismic hazard maps, and each genera-
tion of the seismic hazard maps has its own seismogenic source model. The 1996 maps were based on the available geologic field data at the time, and many faults were characterized by a study at a single site along the fault. Since then, additional site investigations were completed and published and addi-tional faults examined. One major change in the 2008 model was to include explicit alternative models for some seismogenic sources. For example, the 2008 model includes three alterna-tives for the dip of normal faults in the extensional part of the western United States. In this vast region, historical seismicity rates are low, and there is little geophysical data to constrain the dip of individual faults. Therefore, default alternative dips of 40°, 50°, and 60° were assigned to all normal faults in the Basin and Range and Northern and Southern Rocky Mountains Provinces. Each alternative, whether it might be slip rate, rate of recurrence, or fault geometry, was assigned a probability and calculations were based on logic-tree methodology (see Petersen et al. 2008).
The USGS seismogenic source model (Haller et al. 2002; Petersen et al. 2008) is the result of contributions from individ-ual scientists to statewide working groups. Most parameters are vetted in meetings and workshops that precede each update of the maps. Similar to INGV, the USGS model serves the needs of a diverse audience.
CHARACTERIZING SEISMOGENIC SOURCE PARAMETERS
Geologic data used to characterize the occurrences of ruptur-ing events on seismogenic sources come from several subdisci-plines including paleoseismology, geomorphology, and other geologic studies, which address the timing of the fault’s most recent earthquakes and displacement history. All of these types of investigations report observations and interpretations at one or more point locations along the fault. There are a number of tacit assumptions we make when generalizing these point observations to a three-dimensional source in a seismic hazard model. One assumption is that the paleoearthquake history is complete at the study site and that interpretations of displace-ment and timing of events are representative for the entire seis-mogenic source. Another assumption is that the data are from sites that are randomly distributed and in sufficient quantity to define a statistical mean and uncertainty. The latter condition is rarely met, even in regions where paleoseismology is a well-established practice; most seismogenic source models are com-monly based on sparse, often conflicting, field observations and interpretations. Regardless, these geologic studies provide the only samples we have, and their data, through careful analysis, expert elicitation, modeling assumptions, and by incorporat-ing uncertainty, become the basis of the idealized fault sources used in seismic hazard assessments.
Seismogenic source models for probabilistic seismic haz-ard assessments also include the locations of the fault sources and additional parameters that further characterize the fault’s geometry and coseismic behavior. Each parameter, whether in a database or compiled otherwise, must be precisely defined such
522 Seismological Research Letters Volume 82, Number 4 July/August 2011
that the data is internally consistent and properly implemented in the seismic hazard analysis. In the following discussion we illustrate that although our definitions are not identical, the same set of optimal parameters are included in both datasets (for full technical details for conversion, see Appendix A in the electronic supplement to this article).
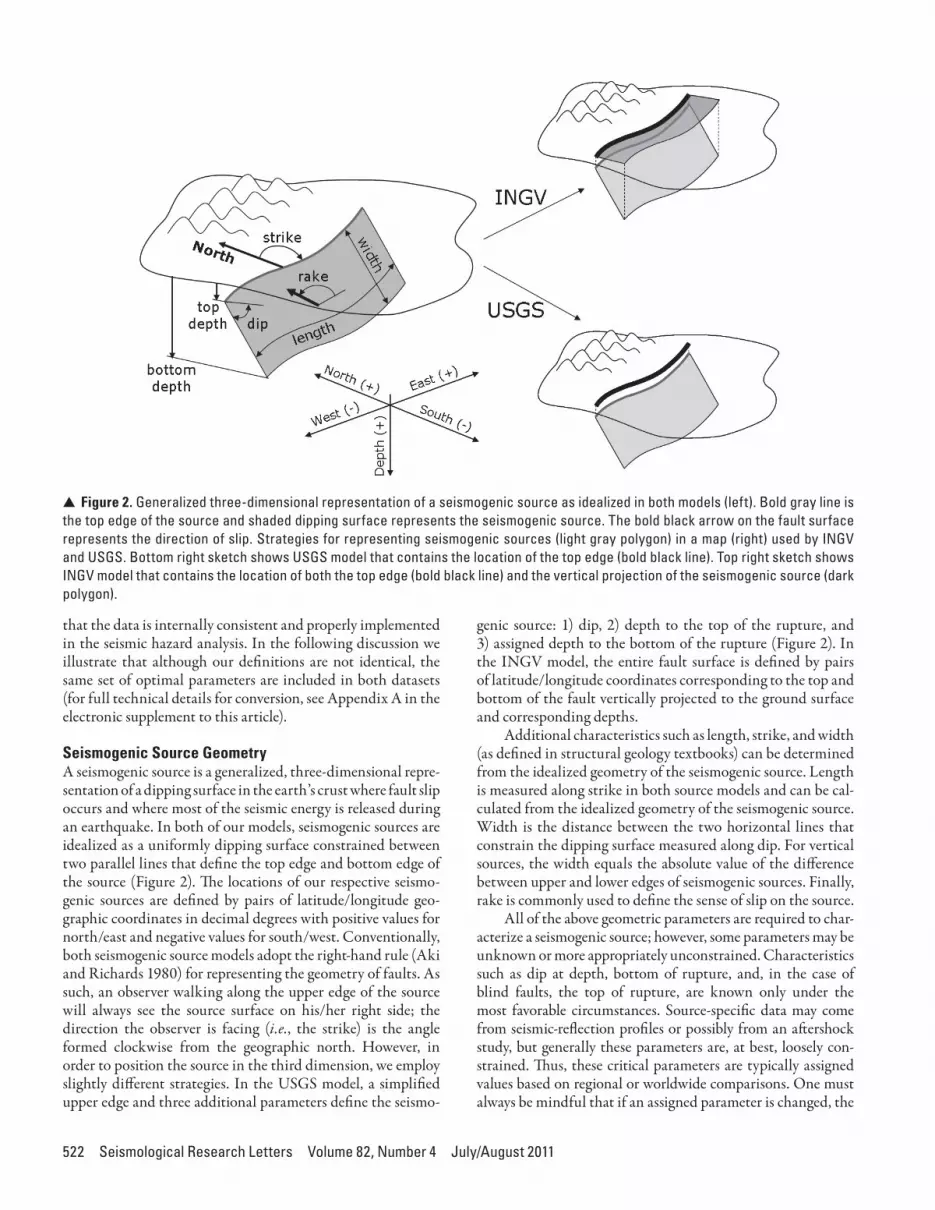
Seismogenic Source GeometryA seismogenic source is a generalized, three-dimensional repre-sentation of a dipping surface in the earth’s crust where fault slip occurs and where most of the seismic energy is released during an earthquake. In both of our models, seismogenic sources are idealized as a uniformly dipping surface constrained between two parallel lines that define the top edge and bottom edge of the source (Figure 2). The locations of our respective seismo-genic sources are defined by pairs of latitude/longitude geo-graphic coordinates in decimal degrees with positive values for north/east and negative values for south/west. Conventionally, both seismogenic source models adopt the right-hand rule (Aki and Richards 1980) for representing the geometry of faults. As such, an observer walking along the upper edge of the source will always see the source surface on his/her right side; the direction the observer is facing (i.e., the strike) is the angle formed clockwise from the geographic north. However, in order to position the source in the third dimension, we employ slightly different strategies. In the USGS model, a simplified upper edge and three additional parameters define the seismo-
genic source: 1) dip, 2) depth to the top of the rupture, and 3) assigned depth to the bottom of the rupture (Figure 2). In the INGV model, the entire fault surface is defined by pairs of latitude/longitude coordinates corresponding to the top and bottom of the fault vertically projected to the ground surface and corresponding depths.
Additional characteristics such as length, strike, and width (as defined in structural geology textbooks) can be determined from the idealized geometry of the seismogenic source. Length is measured along strike in both source models and can be cal-culated from the idealized geometry of the seismogenic source. Width is the distance between the two horizontal lines that constrain the dipping surface measured along dip. For vertical sources, the width equals the absolute value of the difference between upper and lower edges of seismogenic sources. Finally, rake is commonly used to define the sense of slip on the source.
All of the above geometric parameters are required to char-acterize a seismogenic source; however, some parameters may be unknown or more appropriately unconstrained. Characteristics such as dip at depth, bottom of rupture, and, in the case of blind faults, the top of rupture, are known only under the most favorable circumstances. Source-specific data may come from seismic-reflection profiles or possibly from an aftershock study, but generally these parameters are, at best, loosely con-strained. Thus, these critical parameters are typically assigned values based on regional or worldwide comparisons. One must always be mindful that if an assigned parameter is changed, the
▲ Figure 2. Generalized three-dimensional representation of a seismogenic source as idealized in both models (left). Bold gray line is the top edge of the source and shaded dipping surface represents the seismogenic source. The bold black arrow on the fault surface represents the direction of slip. Strategies for representing seismogenic sources (light gray polygon) in a map (right) used by INGV and USGS. Bottom right sketch shows USGS model that contains the location of the top edge (bold black line). Top right sketch shows INGV model that contains the location of both the top edge (bold black line) and the vertical projection of the seismogenic source (dark polygon).

Seismological Research Letters Volume 82, Number 4 July/August 2011 523
magnitude-rate relations for the source also changes because of its reliance on width, area, and rake-parallel slip rate.
Seismogenic Source BehaviorPredicted probabilistic ground motions from seismogenic sources are based on magnitude-rate distributions that reflect the recurrent production of earthquakes of certain sizes. We acknowledge that choosing to use the Poisson equation (time independent), as in the USGS seismic hazard maps, as opposed to other models, directly affects the probability of ground shaking events. However, this topic is well beyond the scope of this paper. We instead will focus on the geologic input to capture the mean behavior of a source. Most probabilistic seis-mic hazard assessments are typically based on slip rate or less frequently, in our experience, on the number of earthquakes during a specified interval of time, or recurrence rate.
Simply stated, slip rate is the amount of slip as a function of geologic time. In the following discussion we break down the components of slip rate and identify those aspects that are often misunderstood or misrepresented. Both INGV and USGS seis-mogenic source models provide a range of variability in rake-parallel slip rates, in mm/year; however, the USGS calculates its rake-parallel slip rates from vertical or horizontal rates explic-itly stored in the database. The conversion from vertical and/or horizontal rates to rake-parallel rate is straightforward, but sometimes this step is overlooked or presumed irrelevant.
Analyses of field observations provide estimates of single-event slip, cumulative (multi-event) slip, or both at a given location, which carry considerable and usually unrecognized uncertainty. In most studies, slip is typically observed (and thus, reported) as vertical or horizontal components of displacement (Figure 3) because the dip and/or the rake of the fault at depth are poorly constrained by field studies. In addition, reported slip not only includes the sum of individual seismic events but also
any aseismic slip on the fault (e.g., pre- and/or post-seismic slip and aseismic slip at the surface). These components of slip are not distinguishable in the geologic record and may be defined only under the most favorable conditions in conjunction with well-studied modern earthquakes. Therefore, reported slip at a site includes considerable uncertainty due to inability to differ-entiate the different sources of slip. However, mapping of off-set features in the days and months following historical events highlights an additional source of uncertainty due to the vari-ability in the amount of displacement along strike, where ends of the surface rupture undergo less slip than the center of the rupture. We recognize that field data contain some measure-ment uncertainty, but it is likely that most of the random fluc-tuation around the expected distribution of slip along strike is due to this aleatory variability. In standard practice, however, data from one or a limited number of point observations com-monly are accepted as representing some presumed average dis-placement along strike for the time frame under consideration.
Likewise, the time component of slip rate also is associated with large uncertainties. Geologic and paleoseismologic field data may span considerably different time frames. The historical record reaches back a few hundred years worldwide and on the millennial scale locally. Some paleoseismology studies address time frames that extend the record to tens of thousands of years through radiometric, luminescence, or other forms of dating. Some geologic studies may address fault behavior on the scale of millions of years. In general, analysis of field samples can-not date a prehistoric earthquake; the results only bracket the time of the earthquake because the datable material is incor-porated into deposits that are either younger or older than the earthquake causing the displacement. Although we must con-cede and use the reported time component for calculating slip rate, the unrecognized (and usually unreported) uncertainty in event timing further impacts the range of possible slip rates.
▲ Figure 3. Sketch illustrating displaced stream channel (horizontal component of displacement), eroded scarp (vertical component of displacement), and additional field measurements that constrain rake-parallel slip (RPS) for seismic hazard assessment.

524 Seismological Research Letters Volume 82, Number 4 July/August 2011
As we begin to unravel the surface faulting history of faults throughout the world, it is becoming evident that few (if any) faults have regularly repeating earthquakes with similar amounts of slip. Although some faults do show regularity or only modest variability in the timing of repeating earthquakes, other faults seem to have short bursts of activity (temporal cluster) following extremely long periods of inactivity, which appears to be espe-cially true in stable continental regions (e.g., Crone et al. 1997). These complications make it very difficult to access the “mean” behavior of a source from geologic data alone, much less the behavior to be expected in the next few decades; however, vari-ability can be captured using a variety of strategies that include, for example, logic-tree treatment of alternative slip rates to best reflect the variability in slip rate for closely clustered earthquakes versus that between clusters. In the absence of geologically based slip rates, recurrence interval derived from a known number of events spanning a known time interval is a viable alternative.
In both INGV and USGS models, earthquake magnitude is measured in the moment-magnitude scale (M) and represents the size of the largest earthquake that a seismogenic source can generate. However, the methods we use to assign magnitude to seismogenic sources differ considerably. In the USGS model, maximum earthquake magnitude is directly determined using published empirical relations based on the length or the area of the source (e.g., Wells and Coppersmith 1994; Hanks and Bakun 2002; Ellsworth 2003), assuming that the largest potential earthquake ruptures the entire source as defined in the model. Similar to other parameters, alternative sources defined by their spatial extent address uncertainty in rupture length and, thereby, maximum magnitude. In addition, earth-quakes smaller than the maximum magnitude are allowed to float along the length of the source. In contrast, due to the extreme difficulty in positively identifying individual ruptures, especially for composite seismogenic sources, maximum mag-nitude in the INGV model is assigned using data independent from the mapped object. The maximum magnitude is con-strained by the largest historical earthquake that can be asso-ciated with that source or the largest fault segment that com-poses the source; as such, the largest potential earthquake will not necessarily rupture the entire source. This bears important consequences in applications that require individual fault rup-tures; the INGV sources must be split into sections of appro-priate dimension consistent with the assigned earthquake mag-nitude. Examples on how this can be done are given in Lorito et al. (2008), Tiberti et al. (2008), and Rotondi (2010).
Even though converting assigned magnitude from one seis-mogenic source model to another is straightforward (for detailed instructions, see the electronic supplement to this article), users should be aware that in the INGV model magnitude and size of the source are not necessarily related one to another and that try-ing to recalculate magnitude from source size (length, width, or area) is not recommended and will lead to unwanted overestima-tion of magnitude. Both INGV and USGS models also assume that the seismogenic source may release earthquakes of smaller
size than the maximum magnitude reported, which is in both cases an expected maximum.
FINAL REMARKS
We describe here only part of the seismogenic source informa-tion needed to run a probabilistic seismic hazard application, and our discussion addresses parameters that can be directly derived from geological field analyses. Additional informa-tion, such as earthquake rates and earthquake magnitude dis-tribution derived from a variety of renewal models or seismic history for each seismogenic source, can also be derived from both INGV and USGS seismogenic source models but require additional model assumptions not addressed here. We inten-tionally have not broached other probabilistic seismic hazard assessment topics such as earthquake catalogs and attenuation equations. In addition, if one wishes to perform deterministic seismic hazard analysis or site-specific assessments, our seismo-genic source model may lack important seismogenic sources.
A critical concept to bear in mind is that identifying and characterizing a seismogenic source becomes more challeng-ing as time from the earthquake rupture increases. Therefore, assigned values for seismogenic sources in seismic hazard anal-ysis inevitably have large intrinsic uncertainties, which both model developers and users must recognize. Future improve-ments in both datasets will include additional sources, but more importantly will address the data uncertainty in ways that improve the use of the model. It is important that credible alternative models intended to capture variable fault behavior through time are compared to the historic rate and to geodetic rates to illuminate and understand discrepancies.
The issues we have raised here come from an experience of several years in our respective countries. Even though the main purpose of our seismogenic source models is to support proba-bilistic seismic hazard assessment at national scales, they illus-trate the necessary parameters to capture the essence of geologi-cal data that can realistically be available in other places. Our understanding of the process of developing a seismogenic source model can lay the groundwork for the new initiatives to stan-dardize seismogenic source characterization worldwide. Flexible strategies are to be sought to adjust the building of such models depending on local tectonic setting and scientific legacy.
ACKNOWLEDGMENTS
We would like to thank all of our associates who over many years have assisted with developing the data in our respective databases. We greatly appreciate the comments from Kathryn Hanson, Carlo Meletti, Chuck Mueller, and Dave Perkins. Their detailed reviews led to an improved manuscript. We also thank our respective institutions for providing finan-cial support and facilities to complete the final stages of the manuscript. R. B. also thanks the USGS Senior Scientist In Residence program, Geologic Hazards Science Center, USGS, Golden, Colorado.
Seismological Research Letters Volume 82, Number 4 July/August 2011 525
REFERENCES
Aki, K., and P. G. Richards (1980). Quantitative Seismology: Theory and Methods. Vol. 1. San Francisco: W. H. Freeman and Company, 557 pp.
Algermissen, S. T., and D. M. Perkins (1976). Probabilistic Estimates of Maximum Acceleration and Velocity in Rock in the Contiguous United States. USGS Open-File Report 76-0416, 45 pp.
Algermissen, S. T., D. M. Perkins, P. C. Thenhaus, S. L. Hanson, and B. L. Bender (1982). Probabilistic Estimates of Maximum Acceleration and Velocity in Rock in the Contiguous United States. USGS Open-File Report 82-1033, 107 pp.
Anonymous (2008). Globalizing quake information. Nature Geoscience 1, 803.
Basili, R., V. Kastelic, G. Valensise, and DISS Working Group 2009 (2009). DISS3 Tutorial Series. Guidelines for Compiling Records of the Database of Individual Seismogenic Sources, Version 3. Rapporti Tecnici INGV 108, 20 pp.; http://portale.ingv.it/produzione-sci-entifica/rapporti-tecnici-ingv/archivio/rapporti-tecnici-2009/
Basili, R., G. Valensise, P. Vannoli, P. Burrato, U. Fracassi, S. Mariano, M. M. Tiberti, and E. Boschi (2008). The Database of Individual Seismogenic Sources (DISS), version 3: Summarizing 20 years of research on Italy’s earthquake geology. Tectonophysics 453, 20–43; doi:10.1016/j.tecto.2007.04.014.
Coppersmith, K. J., and R. R. Youngs (2000). Data needs for probabilis-tic fault displacement hazard analysis. Journal of Geodynamics 29, 329–343.
Crone, A. J., M. N. Machette, and J. R. Bowman (1997). The episodic nature of surface-faulting earthquakes in the stable interior of con-tinents—evidence from Australia and North America. Australian Journal of Earth Sciences 44, 203–214.
Ellsworth, W. (2003). Magnitude and area data for strike slip earthquakes. In Working Group on California Earthquake Probabilities, Earthquake Probabilities in the San Francisco Bay Region—2002–2031. Appendix D, USGS Open-File Report 03-214, 6 pp.
Frankel, A., C. Mueller, T. Barnhard, D. Perkins, E. Leyendecker, N. Dickman, S. Hanson, and M. Hopper (1996). National Seismic Hazard Maps—Documentation June 1996. USGS Open-File Report 96-532, 110 pp.
Frankel, A. D., M. D. Petersen, C. S. Mueller, K. M. Haller, R. L. Wheeler, E. V. Leyendecker, R. L. Wesson, S. C. Harmsen, C. H. Cramer, D. M. Perkins, and K. S. Rukstales (2002). Documentation for the 2002 Update of the National Seismic Hazard Maps. USGS Open-File Report 2002-420, 39 pp.
Haller, K. M., R. L. Wheeler, and K. S. Rukstales (2002). Documentation of Changes in Fault Parameters for the 2002 National Seismic Hazard Maps—Conterminous United States except California. USGS Open-File Report 02-467, 32 pp.; http://pubs.usgs.gov/of/2002/ofr-02-467/.
Hanks, T. C., and W. H. Bakun (2002). A bilinear source-scaling model for M–log A observations of continental earthquakes. Bulletin of the Seismological Society of America 92, 1,841–1,846.
Lorito S., M. M. Tiberti, R. Basili, A. Piatanesi, and G. Valensise (2008). Earthquake-generated tsunamis in the Mediterranean Sea: Scenarios of potential threats to southern Italy. Journal of Geophysical Research 113, B01301; doi.10.1029/2007JB004943.
Meletti C., F. Galadini, G. Valensise, M. Stucchi, R. Basili, S. Barba, G. Vannucci, and E. Boschi (2008). A seismic source zone model for
the seismic hazard assessment of the Italian territory. Tectonophysics 450, 85–108; doi.10.1016/j.tecto.2008.01.003.
MPS Working Group (2004). Redazione della Mappa di Pericolosità Sismica Prevista dall’Ordinanza PCM 3274 del 20 Marzo 2003. Rapporto Conclusivo per il Dipartimento della Protezione Civile. Milano-Roma, INGV, 2004 April. 65 pp., 5 appendixes; http://zonesismiche.mi.ingv.it.
Petersen, M. D., A. D. Frankel, S. C. Harmsen, C. S. Mueller, K. M. Haller, R. L. Wheeler, R. L. Wesson, Y. Zeng, O. S. Boyd, D. M. Perkins, N. Luco, E. H. Field, C. J. Wills, and K. S. Rukstales (2008). Documentation for the 2008 Update of the National Seismic Hazard Maps. USGS Open-File Report 2008-1128, 128 pp.
Petersen, M. D., W. A. Bryant, C. H. Cramer, T. Cao, M. S. Reichle, A. D. Frankel, J. J. Lienkaemper, P. A. McCrory, and D. P. Schwartz (1996). Probabilistic Seismic Hazard Assessment for the State of California. California Division of Mines and Geology Open-File Report 96-08, USGS Open-File Report 96-706.
Rotondi, R. (2010). Bayesian nonparametric inference for earthquake recurrence time distributions in different tectonic regimes. Journal of Geophysical Research—Solid Earth 115, B01302; doi:10.1029/2008jb006272.
Senior Seismic Hazard Analysis Committee (SSHAC), R. J. Budnitz (chair), G. Apostolakis, D. M. Boore, L. S. Cluff, K. J. Coppersmith, C. A. Cornell, and P. A. Morris (1997). Recommendations for Probabilistic Seismic Hazard Analysis. Guidance on Uncertainties and Use of Experts. Report NUREG/CR-6372, 2 vols. Washington, DC: U.S. Nuclear Regulatory Commission.
Tiberti, M. M., S. Lorito, R. Basili, V. Kastelic, A. Piatanesi, and G. Valensise (2008). Scenarios of earthquake-generated tsunamis in the Adriatic Sea. In Tsunami Science Four Years After the 2004 Indian Ocean Tsunami, Part I. Modeling, ed. P. Cummins, L. Kong, and K. Satake, Pure and Applied Geophysics Pageoph Topical Volumes Series 165, 2,117–2,142; doi.10.1007/s00024-008-0417-6.
Valensise, G., and D. Pantosti, eds. (2001). Database of potential sources for earthquakes larger than M 5.5 in Italy. Annali di Geofisica 44, Suppl. 1, with CD-ROM.
Wells, D. L., and K. J. Coppersmith (1993). Likelihood of surface rup-ture as a function of magnitude. Seismological Research Letters 68, 54 (abstract).
Wells, D. L., and K. J. Coppersmith (1994). New empirical relationships among magnitude, rupture length, rupture width, and surface displacements. Bulletin of the Seismological Society of America 84, 974–1,002.
U.S. Geological SurveyP.O. Box 25046, MS 966
Denver, Colorado 80225 [email protected]
(K. M. H.)
Istituto Nazionale di Geofisica e VulcanologiaSezione di Roma 1
Via di Vigna Murata, 605I-00143 Rome, Italy
[email protected](R. B.)

Electronic Supplement to Developing Seismogenic Source Models Based on Geologic Fault Data
by Kathleen M. Haller and Roberto Basili
This electronic supplement documents the minimum set of required parameters to characterize seismogenicsources in seismic hazard assessment.
Appendix A
Detailed comparison of parameters in the two data models that are derived directly from geological observations.
Tables
Table S1. Definitions for Istituto Nazionale di Geofisica e Vulcanologia (INGV) seismogenic source modelparameter fields.
The INGV seismogenic source model is managed by a relational MapInfo spatial database. Table S1 defines only theparameters in the database that were discussed in the text, except for the geographic coordinates of the mappedfeatures that are stored implicitly in the GIS files. This table is not intended to depict the entire data model or to beexhaustive. For further data model and data content information see Basili et al. (2008) and Basil et al. (2009) and
visit the DISS web site:
http://diss.rm.ingv.it/diss.
Table S2. Definitions for United States Geological Survey (USGS) seismogenic source model parameter fields.
The USGS database is a relation Oracle spatial database. Table S2 defines parameters in the database that werediscussed previously, except for the geographic coordinates of the mapped features that are stored implicitly in theGIS files. This table is not intended to depict the entire data model or to be exhaustive. The USGS database stores
computational values as well as expert judgment values that are the foundation of the source model for each versionof the national seismic hazard map. As such, the USGS seismogenic source model can be tested in its entirety forreproducibility and can provide customized input files for use in other applications available at:
http://geohazards.usgs.gov/cfusion/hazfaults_search/hf_search_main.cfm.
[ Back ]
Electronic Supplement to Developing Seismogenic Source Models Based on Geologic Fault Data
by Kathleen M. Haller and Roberto Basili
Appendix A
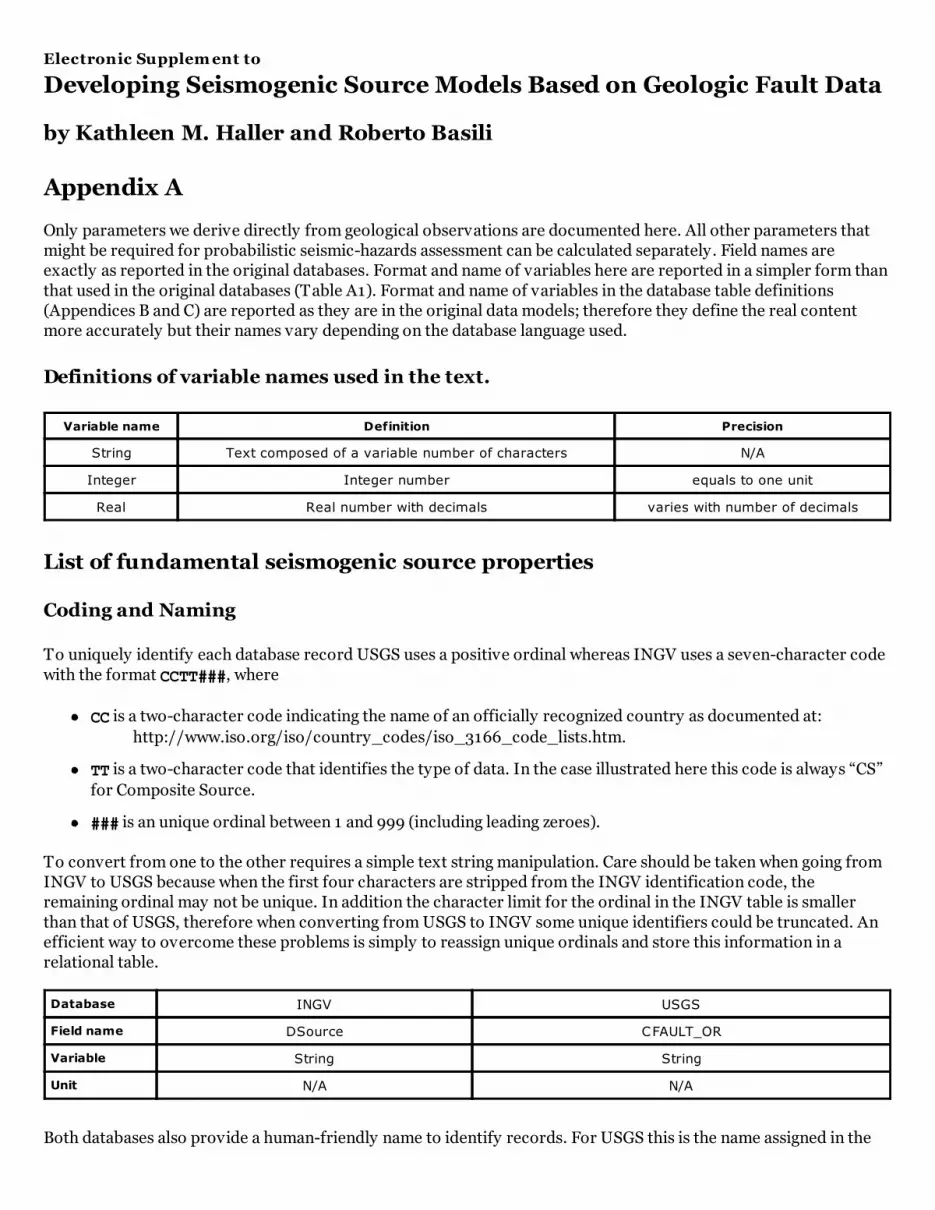
Only parameters we derive directly from geological observations are documented here. All other parameters thatmight be required for probabilistic seismic-hazards assessment can be calculated separately. Field names areexactly as reported in the original databases. Format and name of variables here are reported in a simpler form than
that used in the original databases (Table A1). Format and name of variables in the database table definitions(Appendices B and C) are reported as they are in the original data models; therefore they define the real contentmore accurately but their names vary depending on the database language used.
Definitions of variable names used in the text.
Variable name Definition Precision
String Text composed of a variable number of characters N/A
Integer Integer number equals to one unit
Real Real number with decimals varies with number of decimals
List of fundamental seismogenic source properties
Coding and Naming
To uniquely identify each database record USGS uses a positive ordinal whereas INGV uses a seven-character code
with the format CCTT###, where
CC is a two-character code indicating the name of an officially recognized country as documented at:
http://www.iso.org/iso/country_codes/iso_3166_code_lists.htm.
TT is a two-character code that identifies the type of data. In the case illustrated here this code is always “CS”
for Composite Source.
### is an unique ordinal between 1 and 999 (including leading zeroes).
To convert from one to the other requires a simple text string manipulation. Care should be taken when going fromINGV to USGS because when the first four characters are stripped from the INGV identification code, theremaining ordinal may not be unique. In addition the character limit for the ordinal in the INGV table is smaller
than that of USGS, therefore when converting from USGS to INGV some unique identifiers could be truncated. Anefficient way to overcome these problems is simply to reassign unique ordinals and store this information in arelational table.
Database INGV USGS
Field name DSource CFAULT_OR
Variable String String
Unit N/A N/A
Both databases also provide a human-friendly name to identify records. For USGS this is the name assigned in the

literature to the tectonic structure that forms the record. For INGV this is an assigned local geographic name. Thecharacter limit in the INGV table is smaller than that of USGS, therefore when converting from USGS to INGV someof the names could be truncated. The resulting loss of information should not be critical because this field need not
be unique for manipulating or using the database in calculations.
Database INGV USGS
Field name SourceName NAME
Variable String String
Unit N/A N/A
Seismogenic Source Definition
Geographic location: Reference datum is WGS84 in both. Conversion from the original datum and projectionsystem into others can also be done using standard tools available in any GIS. Usage of conformal projections as
opposed to equal-area or other equivalent projections is recommended.
Depth: Depth defines the location of seismogenic sources in the third dimension within the crust. Both INGV andUSGS databases provide the depth of the upper and lower edges of seismogenic sources, in kilometers. The USGSreference is local topography whereas the INGV reference is sea level. For exact conversion between the twodatabases a Digital Elevation Model (DEM) is needed to calculate average terrain elevation to add to INGV or
subtract from USGS seismogenic source depth values. Worldwide, freely available DEMs, such as ETOPO2 orGTOPO30, are accurate enough to provide this information for the purpose of seismogenic source modeling.Special care should be taken with depth of sources when compared with hypocenters of seismic events that areusually provided as depth below sea level.
Database INGV USGS
Field name 1 MinDepth PREF_UPPER_DEPTH
Field name 2 MaxDepth PREF_LOWER_DEPTH
Variable Real Real
Unit kilometer kilometer
Strike: Although both databases use the same concept for strike, USGS does not include strike values as anattribute. Strike can be calculated from the map object, an operation that is easy to perform within any GIS. In ourexperience, short localized changes in strike that represents less than 20 percent of the entire length could be
ignored or weighted such that they do not contribute to the derived strike value. Conversion between the twodatasets does not require any manipulation and the user can rely on the internal consistency of map features andstrike intervals.
Database INGV USGS
Field name 1 StrikeMin N/A
Field name 2 StrikeMax N/A
Variable Integer N/A
Unit degree N/A
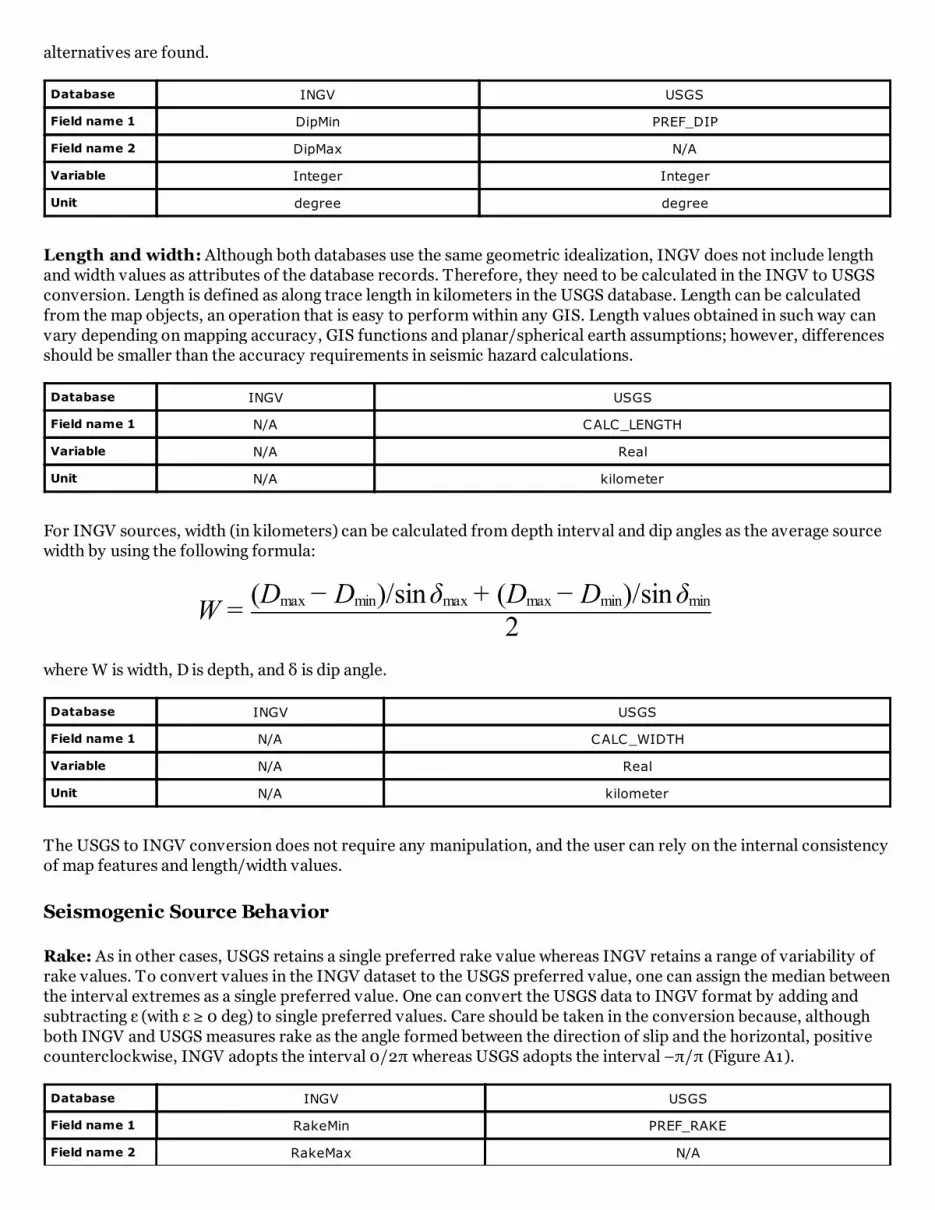
Dip: As in other cases, USGS retains a single preferred dip value or three alternative values whereas INGV retains arange of variability of dip values. To convert values in the INGV dataset to the USGS preferred value, one canassign the median between the interval extremes as a single preferred value or assign three alternative solutions for
each record as minimum, median, and maximum. Conversion from the USGS to INGV format can be done byadding and subtracting ε (with ε ≥ 0 deg) to single preferred values and by taking the extreme values when the three
W =
alternatives are found.
Database INGV USGS
Field name 1 DipMin PREF_DIP
Field name 2 DipMax N/A
Variable Integer Integer
Unit degree degree
Length and width: Although both databases use the same geometric idealization, INGV does not include lengthand width values as attributes of the database records. Therefore, they need to be calculated in the INGV to USGSconversion. Length is defined as along trace length in kilometers in the USGS database. Length can be calculated
from the map objects, an operation that is easy to perform within any GIS. Length values obtained in such way canvary depending on mapping accuracy, GIS functions and planar/spherical earth assumptions; however, differencesshould be smaller than the accuracy requirements in seismic hazard calculations.
Database INGV USGS
Field name 1 N/A CALC_LENGTH
Variable N/A Real
Unit N/A kilometer
For INGV sources, width (in kilometers) can be calculated from depth interval and dip angles as the average sourcewidth by using the following formula:
(D − D )/sinδ + (D − D )/sinδ
2
where W is width, D is depth, and δ is dip angle.
Database INGV USGS
Field name 1 N/A CALC_WIDTH
Variable N/A Real
Unit N/A kilometer
The USGS to INGV conversion does not require any manipulation, and the user can rely on the internal consistencyof map features and length/width values.
Seismogenic Source Behavior
Rake: As in other cases, USGS retains a single preferred rake value whereas INGV retains a range of variability ofrake values. To convert values in the INGV dataset to the USGS preferred value, one can assign the median betweenthe interval extremes as a single preferred value. One can convert the USGS data to INGV format by adding and
subtracting ε (with ε ≥ 0 deg) to single preferred values. Care should be taken in the conversion because, althoughboth INGV and USGS measures rake as the angle formed between the direction of slip and the horizontal, positivecounterclockwise, INGV adopts the interval 0/2π whereas USGS adopts the interval –π/π (Figure A1).
Database INGV USGS
Field name 1 RakeMin PREF_RAKE
Field name 2 RakeMax N/A
max min max max min min

Variable Integer Integer
Unit degree degree
▲Figure A1. Rake represents the direction of slip parallel to the seismogenic source surface. Both INGV and USGS
measure rake as the angle formed between the direction of slip and the horizontal, positive counterclockwise.
INGV (red) in the interval 0/2π; USGS (blue) in the interval –π/π.
Slip rate: As in other cases, USGS retains a single preferred slip rate value whereas INGV retains a range of
variability of slip rate values. To convert values in the INGV dataset to the USGS preferred value, one can assignthe average between the interval extremes as a single preferred value. One can convert the USGS data to INGVformat by adding and subtracting ε (with ε ≥ 0 deg) to single preferred values.
Database INGV USGS
Field name 1 SlipRateMinCALC_FAULT_PAR_SR
FAULT_PAR_SR (CA only)
Field name 2 SlipRateMax N/A
Variable Real Real
Unit mm/year mm/year
Magnitude: Since USGS and INGV use the same magnitude scale, the conversion is straight forward. The USGS
uses alternative magnitude relations for sources in California shown in brackets.
Database INGV USGS
Field name 1 MaxMagCALC_WC_MAG_L
[CALC_HB_MAG; CALC_ELLS_MAG]
Variable Real Real
Unitscalar scalar
References
Ellsworth, W., 2003, "Appendix D—Magnitude and area data for strike slip earthquakes", in Working Group on California
Earthquake Probabilities, Earthquake Probabilities in the San Francisco Bay Region—2002–2031 . U.S. Geological

Surv ey Open-File Report 03–21 4, 6 pps.
Hanks, T. C., and W. H. Bakun (2002). A bilinear source-scaling model for M–log A observ ations of continental earthquakes.
Bulletin of the Seismological Society of America 92, 1 841 –1 846.
[ Back ]
Electronic Supplement to Developing Seismogenic Source Models Based on Geologic Fault Data
by Kathleen M. Haller and Roberto Basili
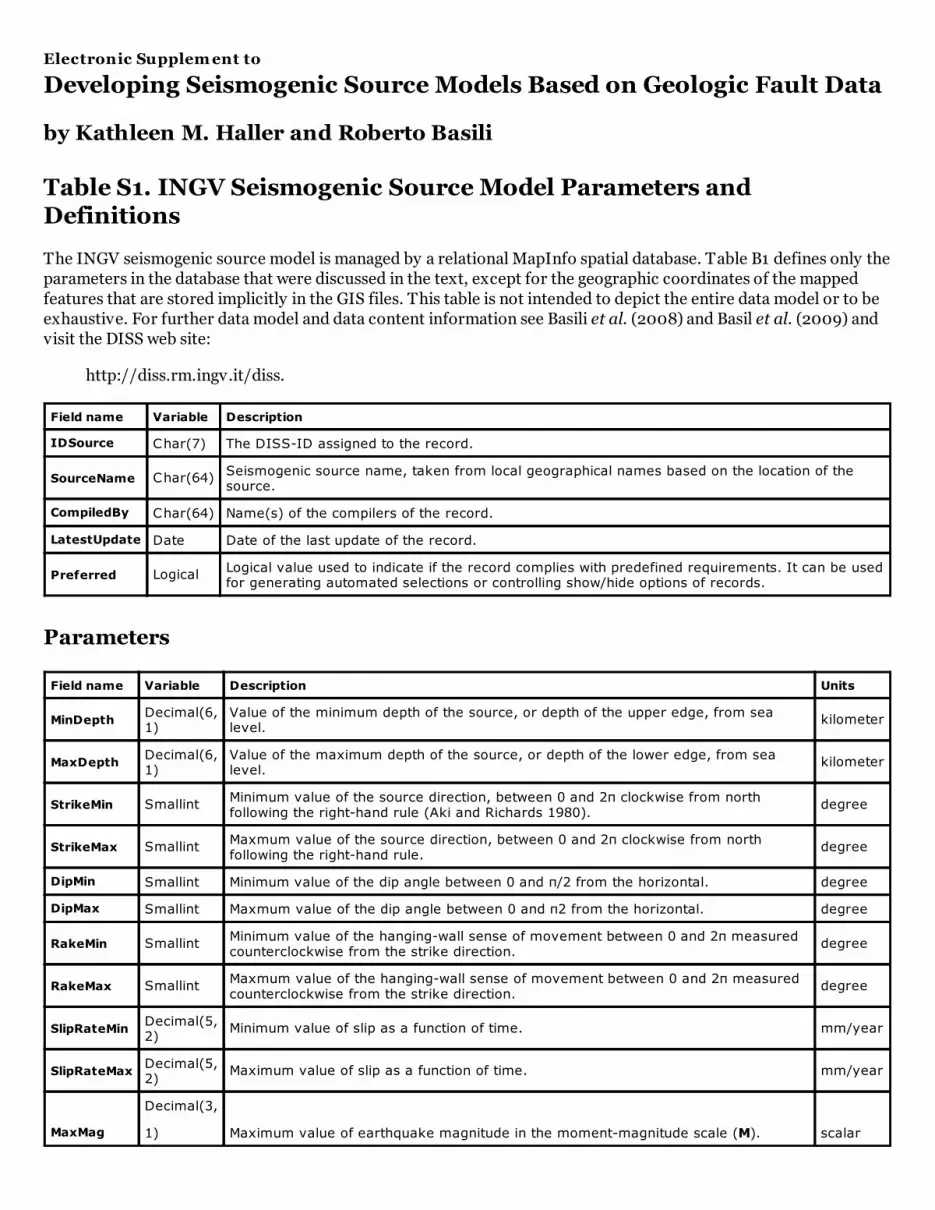
Table S1. INGV Seismogenic Source Model Parameters andDefinitions
The INGV seismogenic source model is managed by a relational MapInfo spatial database. Table B1 defines only theparameters in the database that were discussed in the text, except for the geographic coordinates of the mapped
features that are stored implicitly in the GIS files. This table is not intended to depict the entire data model or to beexhaustive. For further data model and data content information see Basili et al. (2008) and Basil et al. (2009) andvisit the DISS web site:
http://diss.rm.ingv.it/diss.
Field name Variable Description
IDSource Char(7) The DISS-ID assigned to the record.
SourceName Char(64)Seismogenic source name, taken from local geographical names based on the location of thesource.
CompiledBy Char(64) Name(s) of the compilers of the record.
LatestUpdate Date Date of the last update of the record.
Preferred LogicalLogical value used to indicate if the record complies with predefined requirements. It can be usedfor generating automated selections or controlling show/hide options of records.
Parameters
Field name Variable Description Units
MinDepthDecimal(6,1)
Value of the minimum depth of the source, or depth of the upper edge, from sealevel.
kilometer
MaxDepthDecimal(6,1)
Value of the maximum depth of the source, or depth of the lower edge, from sealevel.
kilometer
StrikeMin SmallintMinimum value of the source direction, between 0 and 2π clockwise from northfollowing the right-hand rule (Aki and Richards 1980).
degree
StrikeMax SmallintMaxmum value of the source direction, between 0 and 2π clockwise from northfollowing the right-hand rule.
degree
DipMin Smallint Minimum value of the dip angle between 0 and π/2 from the horizontal. degree
DipMax Smallint Maxmum value of the dip angle between 0 and π2 from the horizontal. degree
RakeMin SmallintMinimum value of the hanging-wall sense of movement between 0 and 2π measuredcounterclockwise from the strike direction.
degree
RakeMax SmallintMaxmum value of the hanging-wall sense of movement between 0 and 2π measuredcounterclockwise from the strike direction.
degree
SlipRateMinDecimal(5,2)
Minimum value of slip as a function of time. mm/year
SlipRateMaxDecimal(5,2)
Maximum value of slip as a function of time. mm/year
MaxMag
Decimal(3,
1) Maximum value of earthquake magnitude in the moment-magnitude scale (M). scalar
References
Aki, K., P. G. Richards (1 980). Quantitative Seismology, Theory and Methods, v ol. I, 557 pps. San Francisco: W.H. Freeman
and Company .
Basili R., G. Valensise, P. Vannoli, P. Burrato, U. Fracassi, S. Mariano, M. M. Tiberti, and E. Boschi (2008). The Database of
Indiv idual Seismogenic Sources (DISS), v ersion 3: Summarizing 20 y ears of research on Italy 's earthquake geology .
Tectonophysics 453, 20–43, doi:1 0.1 01 6/j.tecto.2007 .04.01 4.
Basili, R., V. Kastelic, G. Valensise, and DISS Working Group 2009 (2009). DISS3 tutorial series. Guidelines for Compiling
Records of the Database of Indiv idual Seismogenic Sources, Version 3 . Rapporti Tecnici INGV 1 08, 20 pps.,
<http://portale.ingv .it/produzione-scientifica/rapporti-tecnici-ingv /archiv io/rapporti-tecnici-2009/>.
[ Back ]
Electronic Supplement to Developing Seismogenic Source Models Based on Geologic Fault Data
by Kathleen M. Haller and Roberto Basili
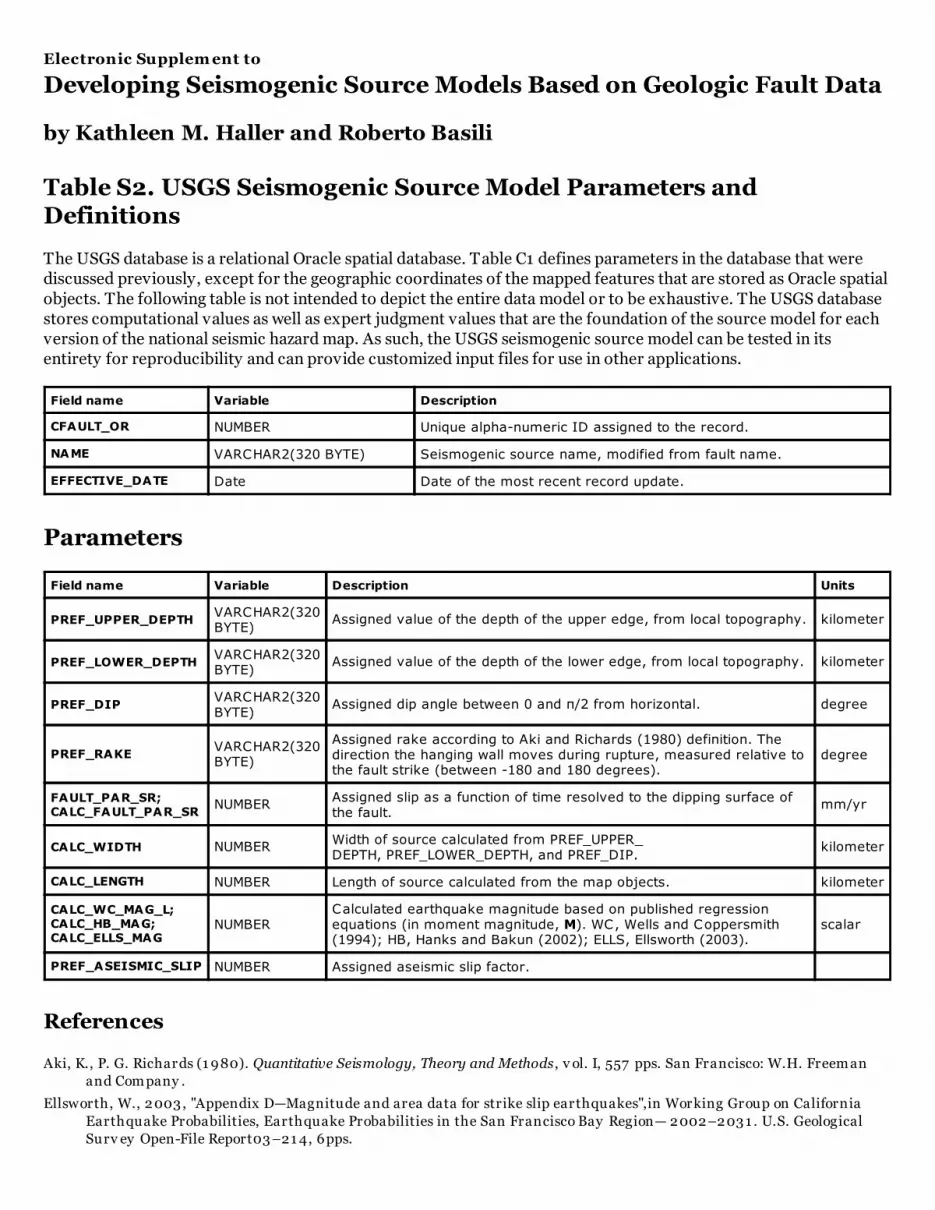
Table S2. USGS Seismogenic Source Model Parameters andDefinitions
The USGS database is a relational Oracle spatial database. Table C1 defines parameters in the database that werediscussed previously, except for the geographic coordinates of the mapped features that are stored as Oracle spatial
objects. The following table is not intended to depict the entire data model or to be exhaustive. The USGS databasestores computational values as well as expert judgment values that are the foundation of the source model for eachversion of the national seismic hazard map. As such, the USGS seismogenic source model can be tested in itsentirety for reproducibility and can provide customized input files for use in other applications.
Field name Variable Description
CFAULT_OR NUMBER Unique alpha-numeric ID assigned to the record.
NAME VARCHAR2(320 BYTE) Seismogenic source name, modified from fault name.
EFFECTIVE_DATE Date Date of the most recent record update.
Parameters
Field name Variable Description Units
PREF_UPPER_DEPTHVARCHAR2(320BYTE)
Assigned value of the depth of the upper edge, from local topography. kilometer
PREF_LOWER_DEPTHVARCHAR2(320BYTE)
Assigned value of the depth of the lower edge, from local topography. kilometer
PREF_DIPVARCHAR2(320BYTE)
Assigned dip angle between 0 and π/2 from horizontal. degree
PREF_RAKEVARCHAR2(320BYTE)
Assigned rake according to Aki and Richards (1980) definition. Thedirection the hanging wall moves during rupture, measured relative tothe fault strike (between -180 and 180 degrees).
degree
FAULT_PAR_SR;CALC_FAULT_PAR_SR
NUMBERAssigned slip as a function of time resolved to the dipping surface ofthe fault.
mm/yr
CALC_WIDTH NUMBERWidth of source calculated from PREF_UPPER_DEPTH, PREF_LOWER_DEPTH, and PREF_DIP.
kilometer
CALC_LENGTH NUMBER Length of source calculated from the map objects. kilometer
CALC_WC_MAG_L;CALC_HB_MAG;CALC_ELLS_MAG
NUMBERCalculated earthquake magnitude based on published regressionequations (in moment magnitude, M). WC, Wells and Coppersmith(1994); HB, Hanks and Bakun (2002); ELLS, Ellsworth (2003).
scalar
PREF_ASEISMIC_SLIP NUMBER Assigned aseismic slip factor.
References
Aki, K., P. G. Richards (1 980). Quantitative Seismology, Theory and Methods, v ol. I, 557 pps. San Francisco: W.H. Freeman
and Company .
Ellsworth, W., 2003, "Appendix D—Magnitude and area data for strike slip earthquakes",in Working Group on California
Earthquake Probabilities, Earthquake Probabilities in the San Francisco Bay Region— 2002–2031 . U.S. Geological
Surv ey Open-File Report03–214, 6pps.

Hanks, T. C., and W. H. Bakun (2002). A bilinear source-scaling model for M–log A observ ations of continental earthquakes.
Bulletin of the Seismological Society of America 92, 1 841–1846.
Wells, D. L., and K. J. Coppersmith (1 994). New empirical relationships among magnitude, rupture length, rupture width,
and surface displacements. Bulletin of the Seismological Society of America 84, 97 4–1002.
[ Back ]