determinants of sovereign risk and differences between
TRANSCRIPT

1
Determinants of sovereign risk and differences between
developed and emerging countries Mario Arend and Pablo Sánchez1
Study Note No. 4
CFA/NE/04
June 24, 2020
Executive summary
• In the context of the economic crisis triggered by the Covid-19 pandemic, and in view of the inquiries made by the Special Joint Budget Committee of the National Congress to the Autonomous Fiscal Council (CFA), this note aims to study the determinants of sovereign risk (or country risk) and the factors that explain how they differ between developed and emerging countries.
• The sovereign-risk indicators considered are: (i) the public debt rating by credit-rating agencies (Moody's, Standard & Poor's and Fitch Ratings); (ii) the spread of foreign currency government bond yields on US Treasury bond yields at similar maturities; and (iii) the spread of credit default swap premiums.
• The literature identifies a number of factors that determine the level and evolution of these indicators. These can be classified into domestic macroeconomic fundamentals, domestic open-economy macroeconomic fundamentals, domestic institutional or political factors, and global factors.
• Empirical evidence shows that, unlike the case of developed countries, the evolution of economic and financial determinants has a significant impact on the sovereign risk of emerging countries.
• The literature indicates that the main determinants of sovereign risk in emerging economies include external accounts and balance of payments indicators, macroeconomic policies that enable economic stability and accountability, the level of dependence on commodities, the volatility of the terms of trade, liquidity conditions and the history of recent debt default events.
• The possible consequences of a higher sovereign risk are increased financing costs for the state, companies and families; deteriorated credit access capacity of companies and households, reduced liquidity, investment and economic growth, and lessened effectiveness of fiscal policy.
1 The authors appreciate the comments of Paula Benavides, Jorge Desormeaux, Aldo Lema, Jorge Rodríguez and Gonzalo Sanhueza.

2
1. Introduction
This Study Note seeks to respond to the queries made in the Special Joint Budget Committee of the National Congress to the CFA, on the determinants of sovereign risk and the factors that explain their differences between developed and emerging countries.
Based on the literature and international evidence, this note examines the main determinants of sovereign risk2 and the explanatory factors behind their differences between developed and emerging economies. It also seeks to clarify the determinants of the rise in sovereign risk indicators in the context of an economic crisis such as the current one, differentiating between local elements and those associated with the global economic scenario. In addition, this analysis illustrates the potential consequences of a downgrade in sovereign risk indicators.
Section 2 presents a theoretical framework and a classification of the main sovereign risk indicators, and explains the domestic and international factors that affect them. Section 3 introduces a description of these indicators in Chile and the rest of the world, with a special focus on the current economic crisis. In Section 4, potential consequences of increased sovereign risk are discussed. Finally, Section 5 presents some reflections to be taken into account in the current scenario.
2. Theoretical framework
This section presents the general concepts and definitions that allow characterizing the different sovereign risk indicators. It first introduces the literature that provides the main definitions of the variables measuring sovereign risk, which is then complemented with a review of the variables that determine these indicators, differentiating between developed and emerging countries.
2.1. Different sovereign risk measurements
Sovereign risk indicators are measurements of a state's ability to repay its debt. Although there are different types, they all share certain characteristics, mainly their incidence on the behavior of financial market players and their implications for financial stability (Schiavone, 2018). Furthermore, they influence the cost of public-sector financing, which in turn has implications for short- and long-term public finances, the corporate sector and households.
Balima et al. (2017) identify three indicators for measuring sovereign risk:
i. Public debt rating by rating agencies.
ii. Yield spreads of government bonds in foreign currency on bonds of some benchmark country, considering similar maturities.
iii. Credit default swap yield spreads.
2 Hereinafter, the concepts "sovereign risk" and "country risk" are used interchangeably.

3
2.1.1. Public debt rating by rating agencies
According to Balima et al. (2017), sovereign debt rating by specialized agencies consists of an assessment of a state's willingness and ability to repay its debts and commitments within the maturity period.
The three main rating agencies are Moody's, Standard & Poor's (S&P) and Fitch Ratings.3 In the early twentieth century these agencies began to develop and publish their ratings of states. It was Fitch Ratings that in 1924 introduced the rating system that is used to this day (see Table 1).4
Table 1. Sovereign risk ratings
Moody’s Standard & Poor’s Fitch Ratings
Highest quality Aaa AAA AAA
Very high
Aa1 AA+ AA+
Aa2 AA AA
Aa3 AA- AA-
High
A1 A+ A+
A2 A A
A3 A- A-
Good
Baa1 BBB+ BBB+
Baa2 BBB BBB
Baa3 BBB- BBB-
Speculative
Ba1 BB+ BB+
Ba2 BB BB
Ba3 BB- BB-
Highly speculative
B1 B+ B+
B2 B B
B3 B- B-
Highly risky
Caa1 CCC+
CCC Caa2 CCC
Caa3 CCC-
Near default Ca CC CC
C C
In default C SD/D RD/D
Source: Fitch Ratings (2020), Moody’s (2020) and S&P (2020). Blue-shaded cells show investment-grade ratings; plain cells show high-yield ratings. Chile's rating (as of the date of this note) is highlighted in bold in each of the risk agencies considered.
These three agencies rate countries' creditworthiness up to AAA (the highest credit quality); Moody’s lowest grade is C for the most vulnerable or in risk of default, while both S&P and Fitch go down to D. The different assessment categories allow rating a country's credit quality as "Highest", "Very high", "High", "Good", "Speculative", "Highly
3 The first two share 80% of the market, while Fitch covers nearly 15% (Balima et al., 2017).
4 Moody’s has produced and published its government bond rating since the creation of Moody’s Investors Service in 1914. S&P first published sovereign debt ratings in 1906, through Standards Statistics. Fitch has been reporting its credit statistics since 1913.

4
speculative", "Highly risky", "Near default" or "In default" (Fitch Ratings, 2020; Moody's, 2020; Standard & Poor's, 2020).
The three agencies use their ratings to generate two categories, which allow them to report on the solvency of the country being assessed. In particular, investment grade ratings are those equal to or higher than Baa3 for Moody's and BBB- for S&P and Fitch, which are associated with a higher level of solvency. Ratings below these levels, indicative of lower solvency, are called high yield (or speculative grade).
The agencies deliver their sovereign risk assessments twice a year. In addition, along with the risk rating, they prepare and provide an "outlook" for the future credit status, which may be: "Positive" (if an upgrade is expected); "Negative" (if likely to downgrade); "Stable" (if likely to remain unchanged); or "Developing" (if contingent on some future event).
2.1.2. Spreads on government bond yields
As a sovereign risk indicator, the difference between the interest rate paid on a state's foreign currency-denominated bonds and the sovereign bonds of a benchmark country (at a similar maturity), considered "risk-free" is typically used. (U.S. Treasury Bonds are typically used as the benchmark spread for dollar debt). This difference is called "spread" and is expressed in "basis points" (bp). For example, a value of 100 bp means that the state would be paying 1% (one percentage point) above the yield on risk-free bonds.
In the case of emerging economies, the JP Morgan Bank develops and publishes a market index called the Emerging Markets Bonds Index, or EMBI, which measures the spread that foreign investors require for foreign currency government debt, above the benchmark interest rate on U.S. Treasury bonds.5
2.1.3. Credit default swap
According to Anton (2011), credit default swaps (hereinafter CDSs) are bilateral financial contracts that represent agreements between a buyer, who agrees to pay a predetermined amount to a seller, for protection or insurance against credit events, in the case of this study, of sovereign debt. In particular, the seller agrees to pay, or acquire, debt from the buyer, upon the occurrence of a specific credit contingency. The definition of a credit event is standardized under the International Swap and Derivative Association (ISDA) agreements.
There are similarities between a CDS and an insurance policy: in both cases, the buyer pays a premium to the seller so that the latter assumes the risk of default and, if a credit event occurs, the seller is obliged to assume this loss. However, the main difference between the two is that CDSs are instruments tradable in financial markets (Anton, 2009; Anton, 2011).
5 The EMBI records the total return on debt instruments issued by sovereign entities in emerging economies, including Brady bonds (denominated in US dollars), loans and Eurobonds. The index corresponds to a weighted market capitalization, and is equivalent to the weighted averaged spread of the included bonds (Akitoby and Stratmann, 2006).
5
The premium of a CDS is called spread and is determined by the probability of default and the percentage of the bond's value that is agreed to be recovered in case a credit event occurs (Anton, 2011).6 As with Treasury bond yields, the spread is measured in basis points.7
2.2. Domestic and global factors affecting sovereign risk indicators
This section presents the main variables that, according to the literature, determine sovereign risk indicators. Table 2 summarizes these variables, distinguishing between internal macroeconomic determinants, open economy macroeconomic determinants, institutional or political determinants, and global determinants.
Internal macroeconomic determinants are those idiosyncratic to each economy. Among them, gross government debt is of particular interest (Anton, 2011; Haugh et al., 2009; Rowland and Torres, 2004) it determines the evolution of the three sovereign risk measures explained in the previous section.
Global determinants, in turn, are those that affect all economies across the board. These include investor risk perceptions and spillover effects between countries.
Investor risk perceptions in international markets are usually measured by the Volatility Index (VIX), the US monetary policy rate and investor risk aversion8 (Barrios et al. 2009; Gang and Li, 2011).
Spillover effects refer to the possibility of a deterioration of sovereign risk being passed through or transmitted to other economies. In particular, the literature refers to a contagion of the volatility (but not the level) of sovereign risk from deteriorated economies to more robust economies (Calani, 2012).
6 According to Anton (2011), the premium of a CDS is calculated using the following formula: CDS premium=PD*(1-TR), where PD denotes the probability of defaulting on debt and TR is the recovery rate, i.e., the percentage of a bond's value that is recovered after a credit event occurs (Zapata and Ochoa, 2008).
7 Theoretically, the difference between bond spreads and CDS spreads can be arbitraged. However, some market imperfections, associated mainly with liquidity differences between markets, do not always allow for this arbitrage. (Gyntelberg et al. 2017).
8 One example of a risk aversion indicator is the Global Risk Aversion Index (GRAI), which correlates the variance of past bond yields with the expectation of future returns. This indicator is used by the IMF and JP Morgan (Courdet and Gex, 2006).

6
Table 2. Determinants of sovereign risk indicators
Category Variable Source
Domestic macroeconomic determinants
GDP per capita Balima et al. (2017)
GDP growth Anton (2011), Balima et al. (2017)
Debt-to-GDP ratio Anton (2011), Haugh et al. (2009)
Fiscal debt solvency Rowland and Torres (2004)
Inflation Min (1998), Balima et al. (2017), Heinemann et al. (2014)9
Fiscal budget balance to GDP ratio Anton (2011), Heinemann et al. (2014), Laubach (2013)
Liquidity Barrios et al. (2009), Haugh et al. (2009)
Domestic open-economy macroeconomic
determinants
External debt Baldacci et al. (2011)
Current account Baldacci et al. (2011), Balima et al. (2017)
International reserves and investment
Edwards (1984), Baldacci et al. (2011), Balima et al. (2017)
Net international assets (Min, 1998)
Terms of trade volatility and commodity dependence
Hilscher and Nosbusch (2010)
Institutional or political
(domestic) determinants
Political risk and quality of institutions
Block and Valeer (2004), Baldacci et al. (2011), Heinemann et al. (2014)10
Existence of a fiscal and/or inflationary rule
Heinemann et al. (2014), Balima et al. (2017)
Stability, transparency and fiscal consolidation
Hameed (2005), Baldacci et al. (2011)
History of recent defaults Cantor and Packer (1996), Reinhart et al. (2003)
Future pension expenditure Haugh et al. (2009)
Global determinants Investor risk perception
Barrios et al. (2009), Haugh et al. (2009), Anton (2011)
Spillover effect Anton (2011), Calani (2012)
Source: as shown in table.
Although there is evidence that stresses the importance of global determinants over domestic ones, it has been documented that the influence of the latter increases in episodes of crisis and economic shocks (Barrios et al., 2009).11
It is important to emphasize that not all the determinants of sovereign risk indicators affect all countries equally, there being a difference between developed and emerging countries. Bissoondoyal-Bheenick (2005) finds that, for advanced economies with a long history of financial stability, the relative importance of economic and financial variables is
9 The variable constructed in this paper is "inflationary history."
10 In particular, political and economic stability, confidence in government and government ideology.
11 Arend and Herrera (2016) show the relevance of domestic factors, finding that the main determinants of debt classification by rating agencies are the growth of Gross Domestic Product (GDP) per capita, GDP per capita in level (in dollars), inflation, net-debt-to-GDP ratio, an indicator of democracy, an indicator of the rule of law, an indicator of government effectiveness, and the ratio of commodity exports to GDP.

7
substantially less than for emerging countries, which are usually facing structural changes.12
On the other hand, Kiff et al. (2010) highlight among the institutional, structural and other relevant variables in credit rating the effectiveness and efficiency of the public sector, openness to capital markets and international trade, robustness of the business environment, human capital, the rule of law, respect for property rights, control of corruption, transparency, level of innovation, investment in human capital, Central Bank independence, income distribution, labor flexibility, level of protectionism and other anti-market practices, and the timeliness, coverage and transparency of private sector competitiveness and profits.
Additionally, Kiff et al. (2010) mention political variables, such as legitimacy of the political regime, relationship with the international community and institutions, the degree of political consensus, political chaos, efficiency and predictability of government actions, transparency of policies, stability and legitimacy of political institutions, citizens’ involvement in political processes, order of leadership succession, transparency in economic policy decisions and objectives, public security, and geopolitical and war risks. It should be noted that for these variables the performance of developed countries is generally superior to that of emerging economies.
According to Bissoondoyal-Bheenick (2005), the various external account and balance of payment indicators stand out as relevant important economic variables in the risk rating of emerging economies. Hilscher and Nosbusch (2010) mention that for these economies the macroeconomic policies that allow economic stability, the level of dependence on commodities and the volatility of the terms of trade are relevant. Baldacci et al. (2011) mention liquidity conditions and the development of capital markets. Likewise, the history of recent default events and responsible macroeconomic behavior also play a fundamental role (Reinhart et al., 2003).13
An additional element that should be mentioned is that emerging countries generally cannot borrow in local currency, so they must acquire obligations in a foreign currency. This phenomenon, known as "original sin", has been of great importance for emerging economies with a long history of high inflation and currency depreciation (Eichengreen et al., 2005). The literature has found evidence that the existence of this "original sin" affects not only the probability of defaulting on foreign debt, but also the probability of default on instruments issued in local currency (Souissi and Paget-Blanc, 2012).
12 Bissoondoyal-Bheenick (2005) finds that, for developed economies, macroeconomic variables such as unemployment rate, labor costs, inflation, fiscal balance, debt-to-GDP ratio, international reserves, and net exports to GDP, statistical significance is not present throughout the sample.
13 To identify the history of default, a variable is constructed that counts the number of years from the last default event. The variable is truncated at 10 years, and for countries that have never defaulted, its value is set at 11 years. This, to avoid outliers in the case of economies that have never entered into default, and because it is thought that, for such countries, each additional year without a default event is of minor incremental importance (Baldacci et al., 2011).

8
3. Evolution of Chile's sovereign risk and international comparisons
This section presents the recent evolution of sovereign risk indicators for a group of countries, with a focus on the classification of Chile and similar countries in terms of their risk rating. This comparison also includes the variables that, according to the previous review, determine sovereign risk.
3.1. International comparison
Figure 1, which considers 86 countries, shows that the risk premium faced by emerging economies is higher than that of developed economies. It also shows that a downgraded credit rating means a wider sovereign spread.14
Figure 1: Sovereign spread and risk rating (2019)
Sources: JP Morgan and rating agencies (Moody's, S&P, Fitch).
Sample countries: Angola, Argentina, Armenia, Australia, Azerbaijan, Bahrain, Barbados, Belarus, Belgium, Belize, Bolivia, Brazil, Cameroon, Canada, Chile, China, Colombia, Costa Rica, Croatia, Denmark, Dominican Republic, Ecuador, Egypt, El Salvador, Ethiopia, France, Gabon, Georgia, Germany, Ghana, Guatemala, Honduras, Hungary, India, Indonesia, Iraq, Italy, Jamaica, Japan, Jordan, Kazakhstan, Kenya, Kuwait, Lebanon Lithuania, Malaysia, Mexico, Mongolia, Morocco, Mozambique, Namibia, Netherlands, Nigeria, Oman, Pakistan, Panama, Papua New Guinea, Paraguay, Peru, Philippines, Poland, Qatar, Romania, Russia, Saudi Arabia, Senegal, Serbia, Slovakia, South Africa, Spain, Sri Lanka, Suriname, Sweden, Trinidad and Tobago, Tunisia, Turkey, Ukraine, United Kingdom, United States, Uruguay, Uzbekistan, Vietnam, and Zambia. Venezuela is excluded as it lies outside the figure's scale.
Table 3 compares Chile's ranking in recent years with a set of similar countries in terms of their risk rating: countries up to two grades above Chile's rating; and countries up to two
14 The countries in the sample are those having both sovereign spread and risk rating information.
(250)
(50)
150
350
550
750
950
1,150
AAA Aa1-Aa3 A1-A3 Baa1-Baa3 Ba1-Ba3 B1-B2 Caa1-Caa3 Ca-C
Sove
reig
n s
pre
ad (
bas
is p
oin
ts)
Risk rating
Developed
Emerging
Chile

9
grades below, totaling 24 countries (10 emerging including Chile, and 14 developed). Additionally, each country's ranking is included for a set of variables determining sovereign risk.15 The criterion used for the selection of these variables was to choose some from each group, considering those most frequently mentioned as significant in empirical works.
15 The Annex shows a chart with the values of each variable (i.e., not in the form of a ranking).

10
Table 3. Sovereign risk and determinants, comparison by country(*)
Risk rating
agency (Moody’s)
GDP per capita
(2017-2019 average)
GDP growth
(2015-2019 average)
Current account as % of GDP
(2015-2019 average)
Gross debt as % of GDP (2017-2019
average)
Cash balance as % of GDP
(2017-2018 average)
Structural balance as % of trend GDP (2017-
2019 average)
Commodity dependence1 (2013-2017)
Government effectiveness2 (2013-2018)
Rule of Law2
(2013-2018)
United Kingdom Aa2 11 19 24 21 16 11 9 3 1
France Aa2 10 22 21 22 20 15 7 6 6
United Arab Emirates
Aa2 3 14 3 4 9 n/a 17 7 19
South Korea Aa2 14 13 5 12 4 1 4 11 14
Kuwait Aa2 4 24 4 3 1 n/a 21 24 23
Belgium Aa3 9 21 18 23 13 10 9 8 7
Czech Republic Aa3 16 8 15 7 5 3 3 16 12
Hong Kong Aa3 5 16 7 1 2 19 n/a 1 2
Qatar Aa3 1 17 9 16 6 n/a 21 19 17
Taiwan Aa3 8 18 1 8 17 12 n/a 9 11
Chile A1 23 15 23 6 18 12 19 13 9
China A1 24 3 13 17 23 20 1 22 24
Japan A1 13 23 8 24 22 16 2 2 5
Estonia A1 19 7 12 2 11 7 9 12 8
Israel A1 15 11 10 19 19 16 12 10 13
Saudi Arabia A1 6 20 14 4 24 n/a 18 23 22
Ireland A2 2 1 16 20 10 5 6 5 3
Iceland A2 7 5 6 11 7 5 20 4 4
Malta A2 12 2 2 13 3 2 14 15 10
Poland A2 20 6 20 14 15 14 8 21 18
Slovakia A2 17 10 22 15 12 8 4 20 20
Lithuania A3 18 12 17 9 8 3 16 14 15
Latvia A3 22 9 18 10 14 8 15 17 16
Malaysia A3 21 4 11 18 21 18 13 18 21
(*) For each variable, a ranking is generated which ranks the countries from best to worst performance. Note: Blue-shaded cells show developed countries, as defined by the IMF. Emerging economies are presented in plain cells.
(1) Commodity dependence: a country’s total commodity exports over total exports. This indicator is obtained from the United Nations, which considers that a country is commodity dependent if its exports exceed 60% of total exports.
(2) Government Effectiveness and Rule of Law are indicators prepared by the World Bank and range from -2.5 (worst) to 2.5 (best).
Source: Authors’ calculations based on data from the World Economic Outlook Database of the International Monetary Fund, the World Bank and the United Nations.

11
The data shows that Chile stands out for its low indebtedness level compared to the group of comparable countries; therefore its risk rating is relatively privileged. However, there are other determinants of sovereign risk for which Chile's relative position is lower; such is the case of GDP per capita, the current account, and commodity dependence (see figures 2, 3 and 4).
Another aspect of considerable attention is GDP growth, which —according to authors such as Anton (2011) and Balima et al. (2017)— has an impact on country-risk indicators. In particular, this factor has been relevant in recent times in Chile, so that country-risk rating agencies have published a "negative" credit forecast for our country, considering the risks of lower economic growth.
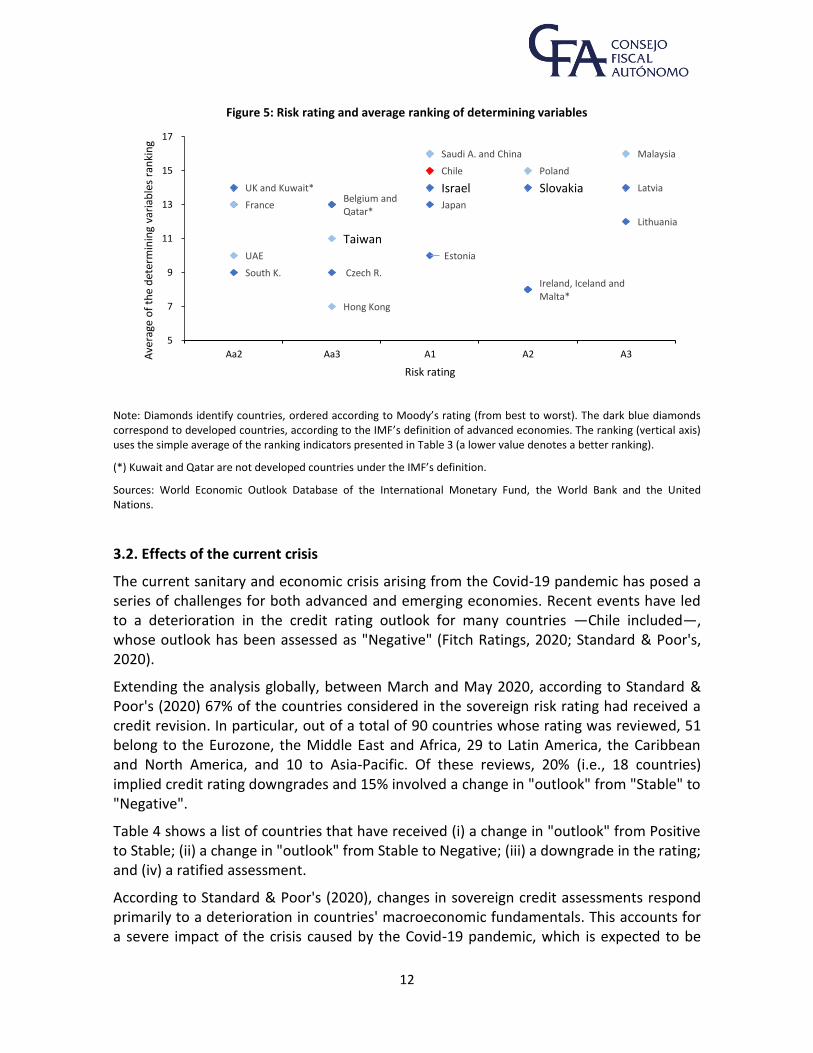
On the other hand, with respect to proxy variables for political risks, quality of government and institutions and democracy, Chile is in an intermediate to favorable position in terms of the Rule of Law indicator. Similarly, the aggregate ranking of the variables considered in Table 3 also shows that Chile's characteristics profile tends to be similar to that of countries with lower credit quality (see Figure 5). Indeed, although Chile is in the A1 credit rating group, its average ranking is somewhat worse than that of the rest of the countries in this group, and is comparable to the ranking of countries with a lower credit rating. It can also be noted that Chile's ranking is lower than that of countries identified as developed.
Note: Dotted lines represent the group of countries' median with the same risk rating as Chile (represented by the red diamond) according to Moody’s (China, Japan, Estonia, Israel and Saudi Arabia).
Sources: World Economic Outlook Database of the International Monetary Fund, the World Bank and the United Nations.
0
50
100
150
200
250
0% 5% 10%
Gro
s s
Deb
t (%
of
GD
P)
Growth (%)
Figure 2: Growth and gross debt for A1
countries (2015-2019 average)
9.0
9.5
10.0
10.5
11.0
11.5
12.0
-5% 5%
log
GD
P p
er c
apit
a P
PP
Current Account (% of GDP)
Figure 3: Current Account and log GDP per capita
PPP for A1 countries (2015-2019 average)
-0.5
0.0
0.5
1.0
1.5
-10% 40% 90%
Ru
le o
f La
w
Commodity Exports (% of exports)
Figure 4: Commodity dependence and Rule of
Law for A1 countries (2013-2017 average)
12
Note: Diamonds identify countries, ordered according to Moody’s rating (from best to worst). The dark blue diamonds correspond to developed countries, according to the IMF’s definition of advanced economies. The ranking (vertical axis) uses the simple average of the ranking indicators presented in Table 3 (a lower value denotes a better ranking).
(*) Kuwait and Qatar are not developed countries under the IMF’s definition.
Sources: World Economic Outlook Database of the International Monetary Fund, the World Bank and the United Nations.
3.2. Effects of the current crisis
The current sanitary and economic crisis arising from the Covid-19 pandemic has posed a series of challenges for both advanced and emerging economies. Recent events have led to a deterioration in the credit rating outlook for many countries —Chile included—, whose outlook has been assessed as "Negative" (Fitch Ratings, 2020; Standard & Poor's, 2020).
Extending the analysis globally, between March and May 2020, according to Standard & Poor's (2020) 67% of the countries considered in the sovereign risk rating had received a credit revision. In particular, out of a total of 90 countries whose rating was reviewed, 51 belong to the Eurozone, the Middle East and Africa, 29 to Latin America, the Caribbean and North America, and 10 to Asia-Pacific. Of these reviews, 20% (i.e., 18 countries) implied credit rating downgrades and 15% involved a change in "outlook" from "Stable" to "Negative".
Table 4 shows a list of countries that have received (i) a change in "outlook" from Positive to Stable; (ii) a change in "outlook" from Stable to Negative; (iii) a downgrade in the rating; and (iv) a ratified assessment.
According to Standard & Poor's (2020), changes in sovereign credit assessments respond primarily to a deterioration in countries' macroeconomic fundamentals. This accounts for a severe impact of the crisis caused by the Covid-19 pandemic, which is expected to be
FranceBelgium and Qatar*
Chile
Ireland, Iceland and Malta*
Lithuania
UK and Kuwait*
Czech R.
Saudi A. and China
Latvia
UAE
Hong Kong
Japan
Malaysia
South K.
Estonia
Poland
Taiwan
Israel Slovakia
5
7
9
11
13
15
17
Aa2 Aa3 A1 A2 A3Ave
rage
of
the
det
erm
inin
g va
riab
les
ran
kin
g
Risk rating
Figure 5: Risk rating and average ranking of determining variables

13
long-lasting. It should be noted that in countries whose credit assessment was ratified, defense mechanisms against the crisis are observed, which, at least in the short term, will allow them to contain the deterioration of their economy structure, which would contribute to recovering once the crisis is over (Standard & Poor's, 2020).
On the other hand, it cannot be ruled out that in the medium term actions to lower the credit rating of some countries will deepen, even for those economies whose "outlook" was recently ratified, in the event that the effects of the pandemic become structural (Standard & Poor's, 2020).
Finally, it is important to stress that more often than not, credit rating downgrades and changes in risk "outlook" are for emerging countries. This is mainly because, although both developed and developing economies have implemented economic stimuli to deal with the crisis, the scope and effectiveness of these policies is more limited in emerging countries than in developed countries (Standard & Poor's, 2020).

14
Table 4. Effects of the Covid-19 crisis on sovereign risk rating
Change in “outlook” from Positive to Stable
Change in "outlook” from Stable to Negative
Lower rating Ratification
Malta, Bahrain, Brazil, Thailand, Bermuda,
Andorra, Greece, Portugal, Hungary,
Bosnia & Herzegovina, Serbia
Curacao, Bahamas, Colombia, Australia, El
Congo, Ethiopia, Jamaica, Aruba,
Dominican Republic, Indonesia, Bolivia,
Panama, Chile, Ghana, Montenegro
Curacao, Lebanon, Ecuador(*), Kuwait,
Mexico, Nigeria, Oman, Trinidad and Tobago,
Angola, Botswana, Suriname, Argentina, Cameroon, Bahamas,
Belize, Papua New Guinea, South Africa
Ukraine, Austria, Ghana, Jordan, Kenya,
Luxembourg, Norway, Belgium, Croatia, Spain,
Costa Rica, Malaysia, Iraq, Qatar, Saudi
Arabia, Azerbaijan, Russia, Kazakhstan, USA,
Belarus, France, Germany, Japan,
Morocco, Saint Helena, Poland, Barbados, Turks
and Caicos Islands, Montserrat, Guatemala, Egypt, Nicaragua, South Korea, El Salvador, Italy,
Mozambique, Togo, United Kingdom,
Singapore, Taiwan, Uruguay, Czech
Republic, New Zealand, Peru, Paraguay,
Honduras, Turkey
Note: Information available as of 11 May 2020. The rating of Costa Rica and Italy was ratified as Negative "outlook". Countries in blue are developed economies, as defined by the IMF.
(*) Initially, Ecuador received a “Negative Watch” status, which indicates circumstances that could imply a rating downgrade in the short term. Finally, in May, this downgrade was materialized.
Source: Standard & Poor's (2020).
In addition, when looking at sovereign spreads, an increase in these is identified for both advanced and emerging economies. However, the level of increase differs according to credit rating degree (Figure 6), with the highest rated countries, generally developed economies, showing the least increase in their sovereign risk. Countries with lower risk ratings show a more pronounced increase in sovereign spreads.
It should be noted that the average increase in sovereign spreads in the face of the crisis for countries with "high" ratings (AAA to A3) is around 100 basis points; while countries rated Baa see an average increase in their sovereign spread of around 170 basis points; and countries in "speculative grade" show an average increase in their sovereign spread of over 700 basis points.

15
Figure 6: Sovereign spread and pre- and post- Covid-19 crisis risk rating
Source: Authors’ calculations based on data from JP Morgan and rating agencies (Moody's, S&P, Fitch).
Regarding the evolution of credit default swaps (CDSs) in the countries considered in the comparative analysis in Table 5, it can be seen that sovereign risk measured by the CDS premium rises during 2020 in all countries, except in Iceland, where the spread has fallen. The average indicator rises, although it still remains below the 2018 level, while the spread also increases.
For the particular case of Chile, the indicator almost doubles to an even higher level than in 2018. Although the country had remained around the average CDS of the group considered in 2018 and 2019, for the current year its value is 20 basis points above the mean.
It is important to emphasize that there is a difference in the evolution of sovereign risk as measured by CDSs among the set of developed and emerging economies. The average CDS premiums for developed countries are 47 bp, 43 bp and 45 bp for 2018, 2019 and 2020, respectively. In contrast, for the same years, the CDS average for emerging countries is 74 bp, 41 bp and 69 bp. That is, in addition to reaching an equal value (in 2019) or greater (in 2018 and 2020), country risk as measured by CDSs is more volatile in developing economies.
(250)
750
1,750
2,750
3,750
4,750
5,750
AAA Aa1-Aa3 A1-A3 Baa1-Baa3 Ba1-Ba3 B1-B2 Caa1-Caa3 Ca-C
Spve
reig
n s
pre
ad (
bas
is p
oin
ts)
Risk rating
Post Covid-19 crisis (April 2020)
Pre Covid-19 crisis (average 2019)

16
Table 5. Credit default swap (annual closure*) for selected countries
CDS annual closure* 2018 2019 2020
United Kingdom 33 16 24
France n/a n/a 24
United Arab Emirates 67 36 73
South Korea 39 24 27
Kuwait 66 37 76
Belgium 26 15 23
Czech Republic n/a n/a 45
Hong Kong 38 39 45
Qatar 83 36 73
Chile 63 42 84
China 67 31 48
Japan 21 n/a 19
Estonia 61 53 56
Israel n/a n/a 73
Saudi Arabia 105 57 94
Ireland n/a n/a 30
Iceland 62 78 75
Malta n/a n/a n/a
Poland 67 58 60
Slovakia 46 35 53
Lithuania 66 59 67
Latvia 69 62 65
Malaysia 110 35 70
Average 61 42 55
Standard deviation 24 17 26
Blue-shaded cells show developed countries, as defined by the IMF. (*) For the year 2020, the information published as of June 4 was taken as the closing date. Source: Bloomberg.
4. Consequences of increased sovereign risk
In the current scenario, it is important to analyze the negative consequences that an increase in country-risk indicators would have. The literature identifies potential effects such as:
i. Higher financing costs for the government: the sovereign risk increase, as measured by the interest rate differential implies an increase in interest payments by the Treasury, negatively affecting the dynamics and sustainability of the public debt (OECD, 2019).
ii. Impact on the corporate sector and households: the tighter financing conditions can be transmitted to companies and households (Bank for International Settlements,

17
2013; Castro and Mencía, 2014). A transmission channel is the real-estate sector; there is evidence that a higher country risk can affect the real estate sector, reducing households' access to credit (Bank for International Settlements, 2013).
iii. Increased financing costs for the banking sector: higher sovereign risk adversely affects banks' financing in a number of ways, namely, a direct impact through losses in the balance sheets of banking institutions, less collateral for wholesale financing, and lower financing returns and impaired risk ratings (Davies, 2011).
iv. Amplification of the cycle and a self-fulfilling prophecy: a more vulnerable economy can lead the private sector to expect an economic downturn and thus contribute to causing it, increasing risk premiums and affecting demand. Furthermore, an increase in sovereign risk can amplify the effect of cyclical shocks (Corsetti et al., 2013).
v. Lower liquidity and deleveraging: higher sovereign risk can tighten financing constraints on the banking sector, reducing its resources to finance companies. In turn, by anticipating this impact on their financing sources and assigning a greater risk probability to the event that the companies they finance incur losses, deleveraging is generated for precautionary reasons (Boccola, 2016).
vi. Effects on private investment: the impact of changes in country risk (in particular, in risk rating) on private investment has been documented. In this sense, an upgrade (downgrade) in risk rating translates into an increase (reduction) in private investment. Chen et al. (2013) find these effects to be transitory.
vii. Country risk and economic growth: the pace at which the economy grows responds significantly to changes in country risk. It has been documented that an upgrade (downgrade) in credit rating causes an increase (reduction) in the growth rate of a country, both in annual and quarterly activity indicators (Chen et al. 2015).
viii. Fiscal policy effectiveness: it has been documented that an increase in risk indicators can have negative implications on the effectiveness of fiscal policy, especially in a context where the debt/GDP indicator is high (Romer and Romer, 2019). This occurs due to potential hikes in risk premiums to prohibitive levels (and, consequently, in borrowing costs), reduced access to international markets and less willingness to act on the part of policymakers.
5. Concluding remarks
Sovereign risk involves the possibility that an economy will lose its ability to repay its debt (i.e., will default). Its analysis and the study of its determinants are of special interest in a context of economic crisis such as the current one.
This study note has identified the main sovereign risk indicators, the variables that determine their levels and variations, and their evolution during the ongoing crisis, differentiating between advanced and emerging economies, with a focus on Chile's performance.
The sovereign risk indicators considered are: (i) public debt rating by the rating agencies (Moody's, Standard & Poor's and Fitch Ratings); (ii) the spread of yields on government

18
bonds in foreign currency on the yield of US Treasury bonds, considering similar maturities; and (iii) the premium spread on credit default swaps.
These indicators are the most widely used to measure country risk, although each has its pros and cons. In the case of the EMBI, it should be noted that an increase or decrease in the indicator does not mean that the intrinsic quality of country risk has varied, since it could be due to market anticipations regarding the evolution of interest rates, exchange rates, inflation, changes in tax rules, and liquidity, among others (Fuenzalida et al., 2005). Finally, with respect to CDS premiums, the literature emphasizes that their predictive power on sovereign events is greater, but they have the disadvantage of being excessively procyclical (Rodríguez et al., 2017).
The literature identifies a number of factors that determine the level and evolution of sovereign risk indicators, which can be classified among local macroeconomic fundamentals, open economy domestic macroeconomic determinants, domestic institutional or political factors, and global factors. Empirical evidence shows that, unlike in developed countries, the evolution of economic and financial determinants has a significant impact on sovereign risk of emerging countries.
The literature indicates that the main determinants of sovereign risk in emerging economies are external accounts and balance of payments indicators, macroeconomic policies that enable economic stability and responsibility, the level of commodity dependence, the volatility of the terms of trade, liquidity conditions and the history of recent events of default.
Finally, this note presents the potential consequences for a country of an increase in country risk indicators, such as a higher cost of financing for the state, companies and families; a deterioration of the capacity of access to credit by companies and households, less liquidity, reduced investment, slower economic growth and less effectiveness of fiscal policy.

19
REFERENCES
Akitoby, B., & Stratmann, T. (2008). Fiscal policy and financial markets. The Economic Journal, 118(533), 1971-1985.
Anton, S. G. (2011). The local determinants of emerging market sovereign CDS spreads in the context of the debt crisis. An explanatory study. Analele Ştiinţifice ale Universităţii» Alexandru Ioan Cuza «din Iaşi. Ştiinţe economice, 58(1), 41-52.
Anton, S. G., & Voinea, G. (2009). Lessons from the current financial crisis. a risk management approach. Review of Economic and Business Studies, 3(1), 139-147.
Arend, M., & Herrera, L. O. (2016). What is the probability of a downgrade to Chile´s sovereign rating? Macroeconomic Research, BTG Pactual.
Baldacci, E., Gupta, S., & Mati, A. (2011). Political and fiscal risk determinants of sovereign spreads in emerging markets. Review of Development Economics, 15(2), 251-263.
Balima, W. H., Combes, J. L., & Minea, A. (2017). Sovereign debt risk in emerging market economies: Does inflation targeting adoption make any difference? Journal of International Money and Finance, 70, 360-377.
Bank for International Setlementt. (2013). Sovereign Risk–a World without Risk-free Assets. In BIS Conference on (Vol. 8).
Barrios, S., Iversen, P., Lewandowska, M., & Setzer, R. (2009). Determinants of intra-euro area government bond spreads during the financial crisis (No. 388). Directorate General Economic and Financial Affairs (DG ECFIN), European Commission.
Bissoondoyal-Bheenick, E. (2005). An analysis of the determinants of sovereign ratings. Global Finance Journal, 15(3), 251-280.
Block, S. A., & Vaaler, P. M. (2004). The price of democracy: sovereign risk ratings, bond spreads and political business cycles in developing countries. Journal of International Money and Finance, 23(6), 917-946.
Bocola, L. (2016). The pass-through of sovereign risk. Journal of Political Economy, 124(4), 879-926.
Calani, M. (2012). Spillovers of the credit default swap market. Banco Central de Chile.
Cantor, R., & Packer, F. (1996). Determinants and impact of sovereign credit ratings. Economic policy review, 2(2).
Castro, C., & Mencía, J. (2014). Sovereign risk and financial stability. Revista de Estabilidad Financiera, 26, 73-107.
Cavallo, E. A., Powell, A., & Rigobón, R. (2008). Do credit rating agencies add value? Evidence from the sovereign rating business institutions.
Chen, S. S., Chen, H. Y., Chang, C. C., & Yang, S. L. (2013). How do sovereign credit rating changes affect private investment? Journal of Banking & Finance, 37(12), 4820-4833.

20
Chen, S. S., Chen, H. Y., Chang, C. C., & Yang, S. L. (2016). The relation between sovereign credit rating revisions and economic growth. Journal of Banking & Finance, 64, 90-100.
Corsetti, G., Kuester, K., Meier, A., & Müller, G. J. (2013). Sovereign risk, fiscal policy, and macroeconomic stability. The Economic Journal, 123(566), F99-F132.
Coudert, V., & Gex, M. (2006). Can risk aversion indicators anticipate financial crises. Banque de France Financial Stability Review, 9, 67-87.
Davies, M. R. L., & Ng, T. (2011). The rise of sovereign credit risk: implications for financial stability. BIS Quarterly Review, September.
Edwards, S. (1984). LDC foreign borrowing and default risk: An empirical default risk, 1976–1980. American Economic Review, 74, 726-734.
Eichengreen, B., Hausmann, R., & Panizza, U. (2005). The pain of original sin. Other people’s money: Debt denomination and financial instability in emerging market economies, 13-47.
Engen, E. M., & Hubbard, R. G. (2004). Federal government debt and interest rates. NBER macroeconomics annual, 19, 83-138.
Fitch Ratings. (2020). Fitch Revises Chile's Outlook to Negative; Affirms IDR at 'A', marzo.
Fuenzalida, D., Mongrut, S. A., & Nash, M. (2005). Riesgo país y riesgo soberano: Concepto y medición. Mexican Journal of Economics and Finance (Revista Mexicana de Economia y Finanzas), 4(4), 347-367.
Gang, J., & Li, X. (2014). Risk perception and equity returns: evidence from the SPX and VIX. Bulletin of Economic Research, 66(1), 20-44.
Gyntelberg J., Hördahl P., Ters K. and Urban J. (2017), “Arbitrage costs and the persistent non-zero CDS-bond basis: Evidence from intraday euro area sovereign debt markets”, BIS Working Papers, No 631.
Hameed, F. (2005). Fiscal transparency and economic outcomes (No. 2005-2225). International Monetary Fund.
Haugh, D., Ollivaud, P., & Turner, D. (2009). What Drives Sovereign Risk Premiums? An Analysis of Recent Evidence from the Euro Area, OECD Economics Department Working Paper No. 718.
Heinemann, F., Osterloh, S., & Kalb, A. (2014). Sovereign risk premiums: The link between fiscal rules and stability culture. Journal of International Money and Finance, 41, 110-127.
Hilscher, J., & Nosbusch, Y. (2010). Determinants of sovereign risk: Macroeconomic fundamentals and the pricing of sovereign debt. Review of Finance, 14(2), 235-262.
Kiff, J., Holland, A., Kisser, M., Nowak, S., Saab, S., Schumacher, L., & Westin, A. M. (2010). The uses and abuses of sovereign credit ratings. Global Financial Stability Report, 10.
Laubach, T. (2009). New evidence on the interest rate effects of budget deficits and debt. Journal of the European Economic Association, 7(4), 858-885.
21
Leduc S. and Rudebusch G. (2014), “Does Slower Growth Imply Lower Interest Rates?”, Federal Reserve Bank of San Francisco, Economic Letter, 2014-33
Manasse, P., Roubini, N., & Schimmelpfennig, M. A. (2003). Predicting sovereign debt crises (No. 3-221). International Monetary Fund.
Min, H. G. (1999). Determinants of emerging market bond spread: do economic fundamentals matter? The World Bank.
OCDE, O. (2019). OECD Sovereign Borrowing Outlook 2019. OECD Publishing.
Poghosyan, T. (2014). Long-run and short-run determinants of sovereign bond yields in advanced economies. Economic Systems, 38(1), 100-114.
Reinhart, C. M., Rogoff, K. S., & Savastano, M. A. (2003). Debt intolerance (No. w9908). National Bureau of Economic Research.
Rodríguez, I. M., Dandapani, K., & Lawrence, E. R. (2019). Measuring Sovereign Risk: Are CDS Spreads Better than Sovereign Credit Ratings? Financial Management, 48(1), 229-256.
Romer, C. D., & Romer, D. H. (2019). Fiscal space and the aftermath of financial crises: how it matters and why (No. w25768). National Bureau of Economic Research.
Rowland, P., & Torres, J. L. (2004). Determinants of spread and creditworthiness for emerging market sovereign debt: A panel data study. Borradores de Economía No. 295, Banco de la República de Colombia.
Schiavone, A. (2018). Estimating the contagion effect through the portfolio channel using a network approach. Bank of Italy Occasional Paper, (429).
Souissi, Slim & Paget-Blanc, Eric. (2012). On the Determinants of the Sovereign Default Risk: Does Original Sin Matter? SSRN Electronic Journal.
Standard & Poor’s. (2020). Chile Outlook Revised To Negative On Risks To Growth Prospects; 'A+/A-1' Foreign Currency Ratings Affirmed, abril.
Standard & Poor’s. (2020). An Overview Of Sovereign Rating Actions Related To COVID-19, mayo.
Zapata, J. C. A., & Ochoa, C. M. (2008). Valoración de Credit Default Swaps (CDS): una aproximación con el método Monte Carlo. Cuadernos de administración, 21(36).

22
Annex: Sovereign risk and determinants, cross-country comparison
Risk rating
(agency Moody’s)
GDP per capita (2017-2019
average, USD)
Growth (2015-2019 average)
Current Account as % of GDP (2015-2019 average)
Gross Debt as % of GDP
(2017-2019 average)
Cash Balance as % of GDP (2017-2018
average)
Structural Balance as % of
trend GDP (2017-2019
average)
Commodity Dependence1 (2013-2017)
Government Effectiveness2 (2013-2018)
Rule of Law2 (2013-2018)
United Kingdom Aa2 $40,617 1.7% -4.3% 86.5% -1.6% -1.6% 28% +1.5 +1.8
France Aa2 $40,721 1.5% -0.6% 98.7% -2.7% -2.5% 19% +1.4 +1.4
United Arab Emirates
Aa2 $61,444 2.4% +6.6% 19.8% -0.1% n/a 67% +1.4 +0.7
South Korea Aa2 $38,383 2.7% +5.3% 38.6% +2.4% +2.1% 12% +1.1 +1.0
Kuwait Aa2 $59,118 0.4% +6.0% 16.9% +7.5% n/a 88% -0.1 +0.1
Belgium Aa3 $42,898 1.5% +0.1% 102.2% -0.8% -1.3% 28% +1.4 +1.4
Czech Republic Aa3 $33,135 3.5% +0.7% 33.0% +1.2 +0.6% 11% +1.0 +1.1
Hong Kong Aa3 $56,554 2.4% +4.4% 0.0% +3.9 -3.8% n/a +1.9 +1.7
Qatar Aa3 $115,786 2.2% +3.6% 50.5% +1.2 n/a 88% +0.8 +0.8
Taiwan Aa3 $47,077 2.0% +12.6% 34.7% -1.9% -1.7% n/a +1.3 +1.1
Chile A1 $22,721 2.4% -2.8% 25.5% -2.0% -1.7% 86% +1.1 +1.3
China A1 $16,096 6.6% +1.5% 51.0% -4.4% -5.0% 6% +0.3 -0.4
Japan A1 $39,334 1.1% +3.7% 236.6% -3.2% -3.1% 7% +1.7 +1.5
Estonia A1 $30,216 3.6% +2.0% 8.5% -0.4% -0.7% 28% +1.1 +1.3
Israel A1 $33,732 3.3% +3.4% 61.0% -2.1% -3.1% 32% +1.3 +1.1
Saudi Arabia A1 $49,228 1.5% +0.9% 19.8% -7.6% n/a 79% +0.2 +0.2
Ireland A2 $69,890 9.9% +0.4% 64.1% -0.1% -0.4% 13% +1.4 +1.7
Iceland A2 $49,165 4.3% +5.1% 38.1% +0.8% -0.4% 87% +1.5 +1.6
Malta A2 $40,121 7.0% +7.2% 45.9% +2.7% +1.7% 37% +1.0 +1.2
Poland A2 $28,356 4.2% -0.3% 49.1% -1.0% -1.8% 21% +0.7 +0.7
Slovakia A2 $31,081 3.4% -2.5% 49.4% -0.8% -1.2% 12% +0.8 +0.5
Lithuania A3 $30,751 3.1% +0.3% 35.1% +0.6% +0.6% 40% +1.0 +1.0
Latvia A3 $26,386 3.5% +0.1% 37.4% -0.8% -1.2% 38% +1.0 +0.9
Malaysia A3 $27,798 4.9% +2.7% 55.4% -3.0% -3.2% 35% +1.0 +0.5
Note: Blue-shaded cells show developed countries, as defined by the IMF; Emerging economies are presented in plain cells.
(1) Commodity dependence: total exports of commodities over total exports of the country. The indicator is produced by the United Nations, and a country is considered dependent on commodity exports if these exceed 60%.
(2) Government Effectiveness and Rule of Law are indicators prepared by the World Bank and range from -2.5 (worst) to 2.5 (best).
Sources: World Economic Outlook Database of the International Monetary Fund, the World Bank and the United Nations.