detection function of t-pods and estimation of porpoise densities
TRANSCRIPT
Static Acoustic Monitoring of Cetaceans, European Cetacean Society, Gdynia, 2006
1. Detection function of T-PODs and estimation of porpoise densities
Jacob Tougaard1, Linda Rosager Poulsen2, Mats Amundin3, Finn Larsen4,
Jacob Rye5, and Jonas Teilman1
1National Environmental Research Institute, Fredriksborgvej 399, DK-4000 Roskilde, Denmark2Fjord & Bælt Centre, Margrethesplads 1, 5300 Kerterminde, Denmark
3Kolmården Djurpark, 61892 Kolmården, Sweden4Danish Institute for Fisheries Research, Charlottenlund Castle, 2920 Charlottenlund, Denmark 5FTZ Westküste, Christian Albrecht University of Kiel, Hafentorn, D-25761 Büsum, Germany
Currently, T-PODs are used mainly used in two ways: • to detect patterns of presence and absence, and • to investigate quantitative changes in abundance and behaviour.
While presence/absence only requires a high rate of sound production by animals and specificity of detection, to investigate quantitative changes in abundance or behaviour using static acoustic methods, we must also assume:
• comparability across monitoring units; and• lack of significant influence from co-variates such as weather and water depth.
If we are to use acoustic monitoring as a means of examining quantitative differences in abundance and habitat use of porpoises between locations, we must further assume that there is a link between:
• changes in click activity and porpoise abundance; • click train parameters and behaviour;
and to calculate absolute densities, we also require, as in visual surveys:• a valid detection function.
Visual surveys typically• give good spatial coverage• are expensive• are biased towards good weather conditions.
Static acoustic monitoring, on the other hand, • gives good temporal coverage of a single area; • is cost efficient; • but requires indirect interpretation of the resulting data.
As part of a NAPER study on the effects of pingers, 10 T-PODs were deployed close together off Fyens Hoved, in Denmark. Observers were positioned on a headland overlooking the coastal deployment site (Fig. 1.1). Porpoise positions were recorded
7

Static Acoustic Monitoring of Cetaceans, European Cetacean Society, Gdynia, 2006
visually through triangulation – this provided distance and angle measurements for the porpoises relative to the T-PODs.
Fig. 1.1: Calculations for estimating porpoise positions from a land-based station
An example of a track is shown in Fig. 1.2. The visual track is shown in black, and parts of the track where clicks were recorded on the T-POD are shown in red. Tracks showed that porpoises were not always detected even when within 100m of the T-POD. Porpoises were detected on the approach to the T-POD, but once they had passed it, if travelling directionally, no further clicks were recorded. However, on some occasions, porpoises were detected when further than 200m away from the T-POD.
8

Static Acoustic Monitoring of Cetaceans, European Cetacean Society, Gdynia, 2006
Porpoise clicks are narrow band and are thus highly directional in nature. The directionality of porpoise signals is less important at close range, but very important at large distances.
#52n:Minutes with clicks: 2 + 2Clicks: 84 + 26
Fig. 1.2: Track #52, showing positions of porpoise relative to the T-POD (central dot) and the 100m and 200m contours (yellow circles).
9
Track #52Track duration: 26:30 minPositions: 96Closest position:
51 m and 66 mDistance moved: 1670 mMinutes with clicks: 2 + 2Clicks: 84 + 268

Static Acoustic Monitoring of Cetaceans, European Cetacean Society, Gdynia, 2006
Fig. 1.3: The detection probability for an animal falls with distance, while the proportion of detections made at increasing distance initially risesIn theory, detection probability decreases with distance, with the fraction of detections rising initially because a larger sea area is encompassed in successive bands of equal width (Fig. 1.3).
When tracks and acoustic detections were matched (Fig. 1.4), the 50 to 100m radial band produced the largest number of T-POD detections, with very few beyond 250m.
1
Static Acoustic Monitoring of Cetaceans, European Cetacean Society, Gdynia, 2006
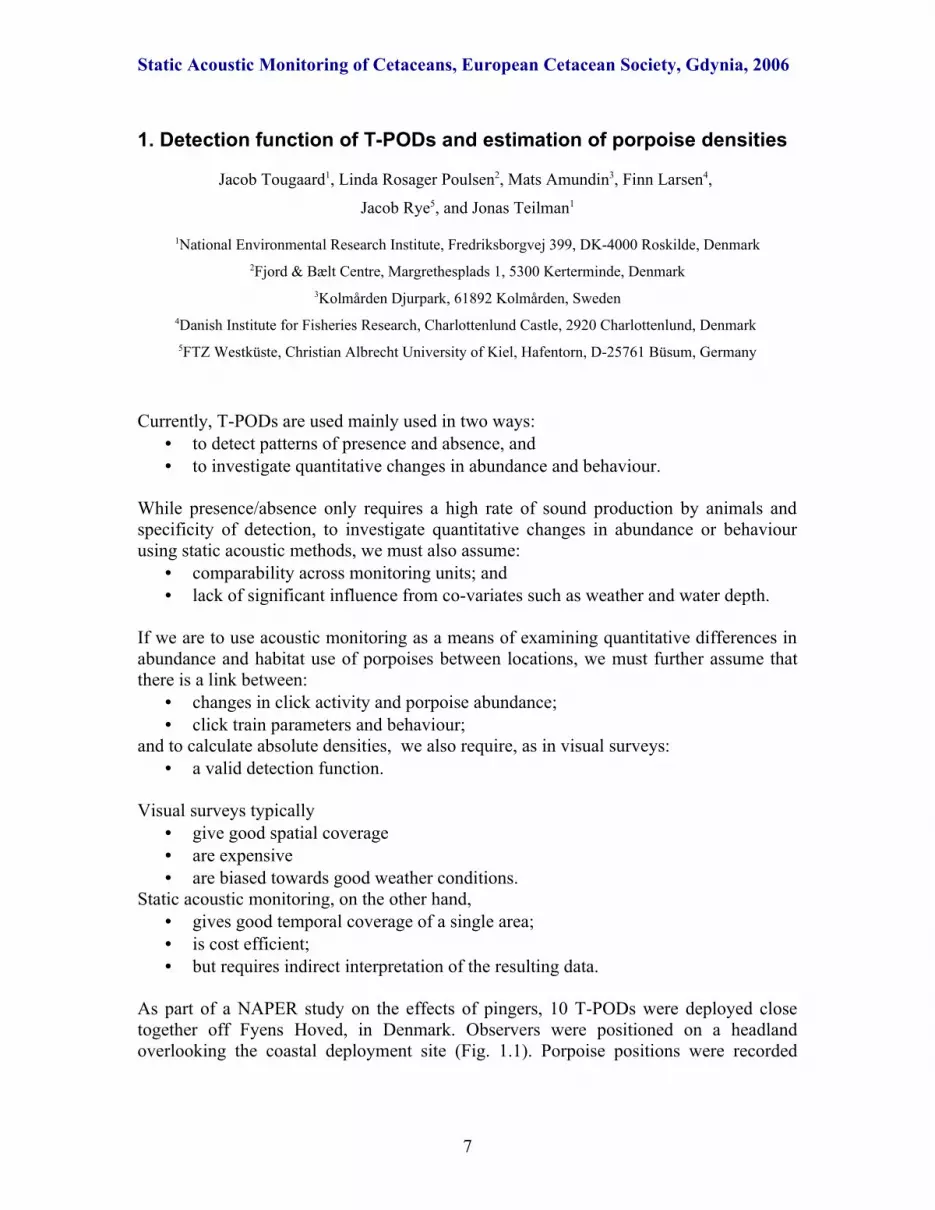
Fig. 1.4: Acoustic and visual detections by distance of closest approach to the T-POD
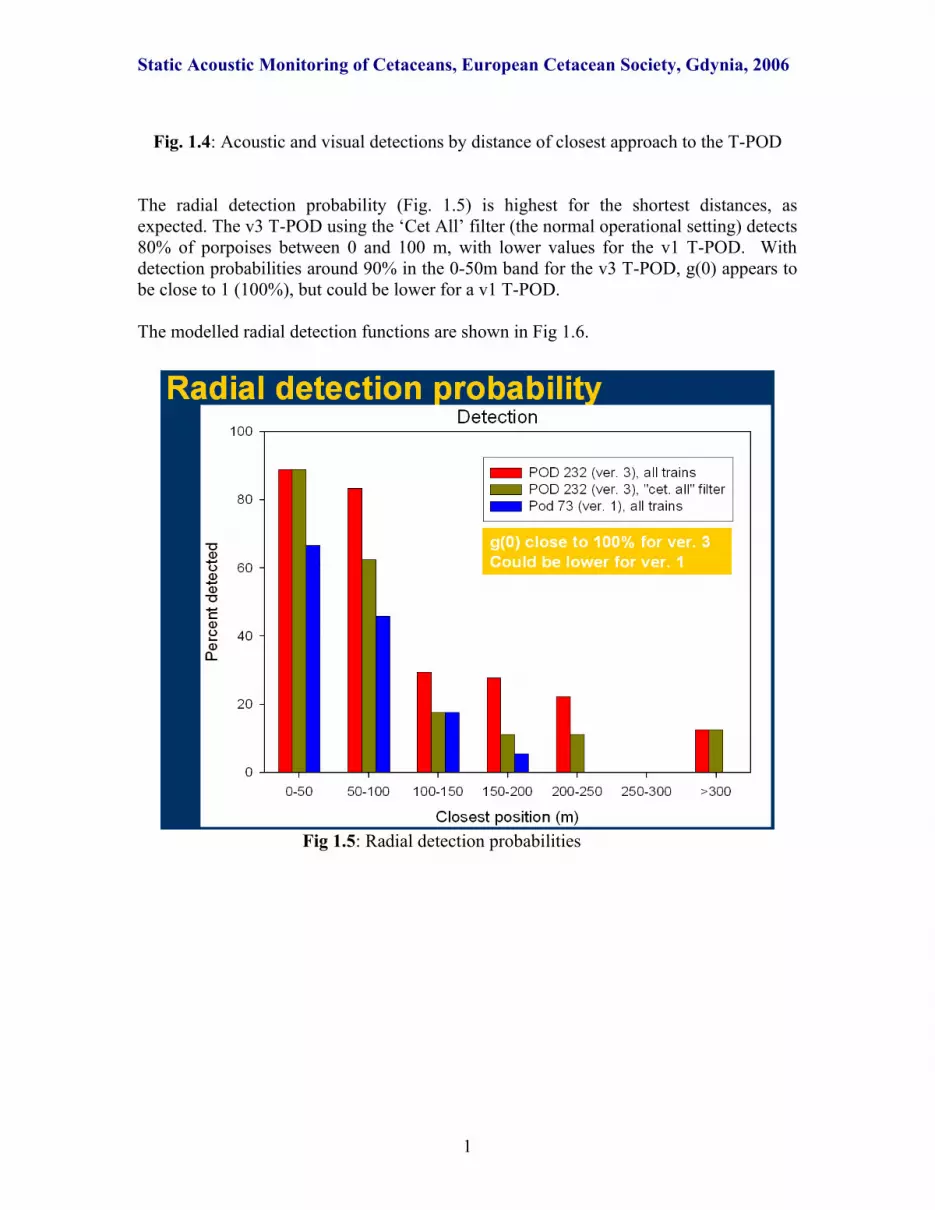
The radial detection probability (Fig. 1.5) is highest for the shortest distances, as expected. The v3 T-POD using the ‘Cet All’ filter (the normal operational setting) detects 80% of porpoises between 0 and 100 m, with lower values for the v1 T-POD. With detection probabilities around 90% in the 0-50m band for the v3 T-POD, g(0) appears to be close to 1 (100%), but could be lower for a v1 T-POD.
The modelled radial detection functions are shown in Fig 1.6.
Fig 1.5: Radial detection probabilities
1
Static Acoustic Monitoring of Cetaceans, European Cetacean Society, Gdynia, 2006
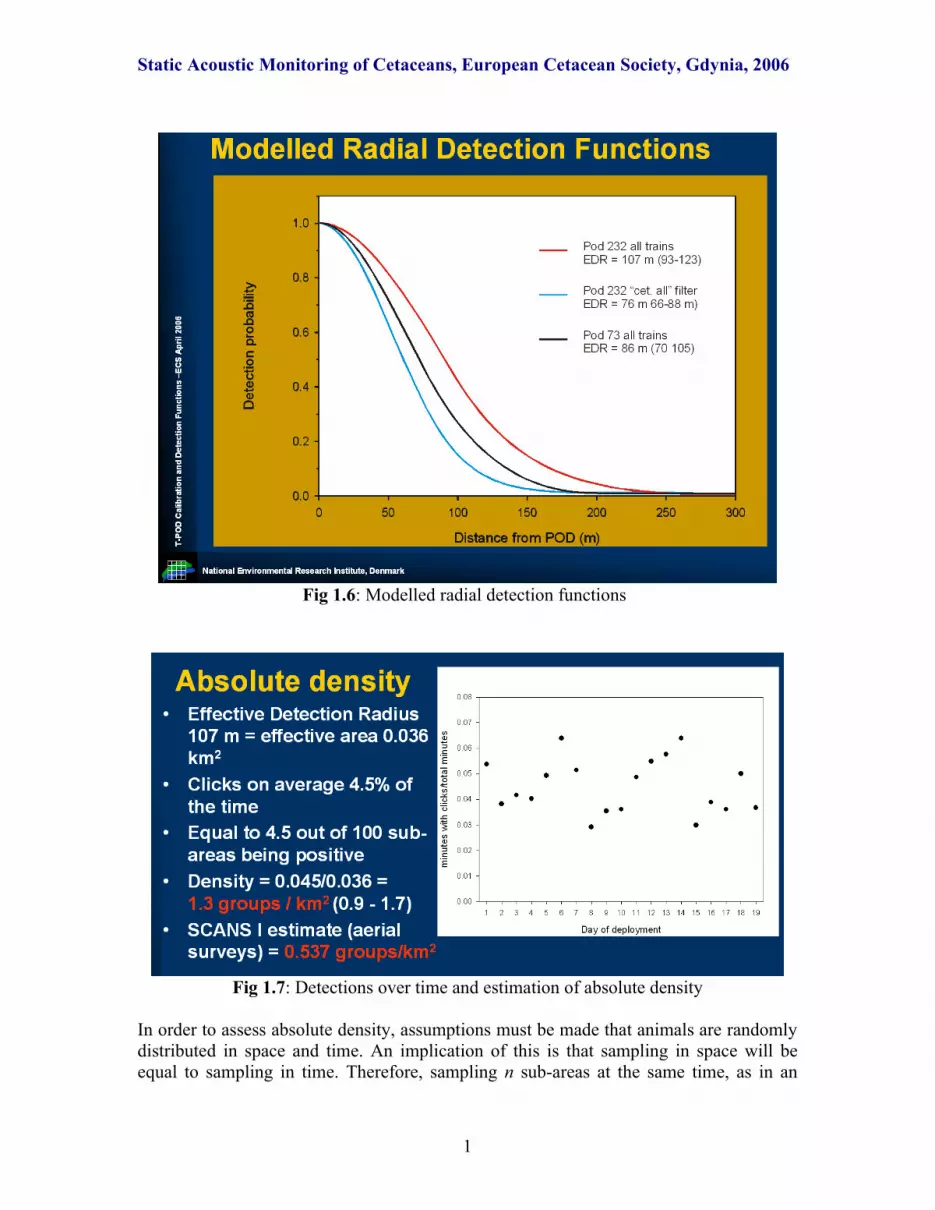
Fig 1.6: Modelled radial detection functions
Fig 1.7: Detections over time and estimation of absolute density
In order to assess absolute density, assumptions must be made that animals are randomly distributed in space and time. An implication of this is that sampling in space will be equal to sampling in time. Therefore, sampling n sub-areas at the same time, as in an
1

Static Acoustic Monitoring of Cetaceans, European Cetacean Society, Gdynia, 2006
aerial survey, is the same as sampling an identical area n times, as in a static acoustic survey.
From our data, we attempted to determine absolute density (Fig 1.7). An effective detection radius of 107m (Fig 1.6) gives an effective area of detection of 0.036 km2. Clicks were detected on average 4.5% of the time, which translates to 4.5 out of 100 sub-areas being porpoise-positive. This gives a density estimate of 0.045/ 0.036, which is equal to 1.3 groups/ km2. The SCANS I estimate for this area (from aerial surveys) gave an estimate of 0.537 groups/ km2.
Some important remaining issues are:• the generality of the detection function• the determination of group size from static acoustic monitoring data.
These issues require further investigation.
Acknowledgements This work was funded by the Nordic Council of Ministers and the Kolmården Foundation. Thanks go to N. Tregenza, O.D. Henriksen and M.S. Wisz for their help.
Discussion
This is ground-breaking work. The track data showed the expected pattern of detection of animals either close the T-POD or facing it from further away, but would that hold in deeper water where an animal at point zero can be further from the T-POD? This will probably affect the optimum depth for a SAM.
The validity of the assumptions is a key issue, particularly as there are known to be local variations in density over quite small scales. The sampling regimes required for wider density or trend estimates are still undefined. Analysis of existing data to quantify the variation between geographically spaced SAMs, and to identify any explanatory variables, is needed.
Are multiple detections of the same animal a problem? The same question applies to line transect survey methods. Provided the animal is not associating with the survey method itself (the boat or the SAM) it doesn’t bias the results, although the variance will be higher if animals stay for long periods in small areas than if they move around a lot. Tracking studies generally show very large movements of animals compared with the size of a SAM detection zone.
1

Static Acoustic Monitoring of Cetaceans, European Cetacean Society, Gdynia, 2006
How can you relate SCANS densities to this site? - Not very well at all as the spatial resolution of the SCANS data is so much lower, but at least the two figures are similar.
1