detecting radio pulses from air showers
TRANSCRIPT

2008 IEEE Nuclear Science Symposium Conference Record
Detecting Radio Pulses from Air ShowersA. Horneffera , W.D. Apelb, 1.C. ArteagaC
, T. Aschd, 1. Auffenberge , F. Badeab, L. Biihrena , K. Bekkb,
M. Bertainaf , P.L. Biermann9, 1. Bliimerb,c, H. Bozdogb, I.M. Brancush, M. Briiggemanni , P. Buchholzi ,
S. Buitinka , E. Cantonif,j, A. Chiavassaf , F. Cossavellac, K. Daumillerb, V. de Souzac, F. Di Pierrof , P. Dollb,
R. Engelb, H. Falckea,k, M. Fingerb, D. Fuhrmanne , H. Gemmeked, P.L. Ghiaj , R. Glasstettere , C. Grupeni ,
A. Haungsb, D. Heckb, J.R. Horandela , T. Huegeb, P.G. Isarb, K.-H. Kamperte , D. KangC, D. Kickelbicki ,
Y. Kolotaevi , O. Kromerd, 1. Kuijpersa, S. Lafebrea
, P. Luczakl , H.J. Mathesb, H.J. Mayerb, J. Milkeb,B. Mitricah, C. Morello1, G. Navarraf , S. Nehlsb, A. Nigla , 1. Oehlschliigerb, S. Overi , M. Petcuh , T. Pierogb,
J. Rautenberge , H. Rebelb, M. Rothb, A. Saftoiuh, H. Schielerb, A. Schmidtd, F. Schroderb, O. Simam , K. Singha ,
M. StiimpertC, G. Tomah, G.C. Trinchero1, H. Ulrichb, W. Walkowiaki , A. Weindlb, J. Wocheleb, M. Wommerb,
J. Zabierowskil , J.A. Zensus9 LOPES Collaboration
N60-1
Abstract-Cosmic rays are energetic particles from outsidethe earth's atmosphere. When a high energy cosmic ray hitsthe atmosphere it triggers a cascade of secondary particlesproduced in nuclear interactions, an air shower. Up to now theestablished methods of measuring air showers are detection ofthe particles that reach the ground level or optical observationof the Cherenkov or ftuorescent light.
The measurement of radio pulses from air showers has anumber of advantages: It gives a much higher duty cycle thanmeasuring optical light, it measures the whole shower evolutionthus being complementary to measuring the particles that reachthe ground level, and it has the potential of giving a betterdirection estimate of the primary cosmic ray.
Historically these radio measurements have been plagued byman- and self-made radio interference. But the advent of fastdigital computers and high bandwidth, high dynamic range ADCsenables us to use digital filtering and beam forming to suppressthe radio interference. Online processing in fast FPGAs will evenallow to trigger on air showers from the radio data alone.
LOPES was the first experiment designed to take advantage ofthis new technologies to measure radio pulses from air showers. Itis a LOFAR Prototype Station for LOFAR, a new digital radiointerferometer, that is being build in the Netherlands. LOPESconsists of 30 dipole antennas operating in the frequency bandof 40-80 MHz that are set up at the site of the KASCADE-Grandeair shower array. At this site inside the ForschungszentrumKarlsruhe, there is significant radio interference present fromintentional and unintentional transmitters. With digital filteringof narrow band interference and digital beam forming LOPESis able to suppress most of this and reliably pick out radio pulsesfrom air showers.
Manuscript received November 12, 2008A. Homeffer can be contacted at: [email protected] affiliations are: a Dept. of Astrophysics, Radboud University Nijmegen,
The Netherlands b Institut fUr Kemphysik, Forschungszentrum Karlsruhe,Germany c Institut flir Experimentelle Kemphysik, Universitiit Karlsruhe,Germany d Inst. Prozessdatenverarbeitung und Elektronik, ForschungszentrumKarlsruhe, Germany e Fachbereich Physik, Universitat Wuppertal, Germanyf Dipartimento di Fisica Generale dell'Universita Torino, Italy 9 Max-PlanckInstitut fiir Radioastronomie, Bonn, Germany h National Institute of Physicsand Nuclear Engineering, Bucharest, Romania i Fachbereich Physik, Universitiit Siegen, Germany j Istituto di Fisica dello Spazio Interplanetario,INAF Torino, Italy k ASTRON, Dwingeloo, The Netherlands l Soltan Institutefor Nuclear Studies, Lodz, Poland m Department of Physics, University ofBucharest, Romania
lC. Arteaga is now at: Universidad Michoacana, Morelia, Mexico.V. de Souza is now at: Instituto de Fisica de Sao Carlos, Universidade SaoPaulo, Brasil. K. Singh is now at: KVI, Groningen, The Netherlands
I. INTRODUCTION
THE study of cosmic rays is one of the most active fieldsin astroparticle physics. Their origin, acceleration, and
transport to the earth has been one of the unsolved problems inastrophysics for nearly 100 years. To resolve these questions,larger detectors with. higher duty cycles and which combinemultiple detection techniques are needed. We have investigatedan alternative way to study cosmic rays: measuring the radioemission from cosmic ray air showers.
High energetic cosmic rays that hit the earth interact withthe atmosphere and produce a cascade of secondary particles,an air shower. Radio pulses from air showers were firstdiscovered by Jelley et al. in 1965 at 44 MHz [1]. The resultswere soon verified and in the late 1960's emission from 2 MHzup to 520 MHz was found. These historical experiments werelimited by the existing technology. They could only measurewith a relatively small bandwidth of a few MHz and they werelimited to total power receiving systems. The latter includesthat the radio signal is integrated with a time constant on theorder of hundreds of nanoseconds, which also smears out theair shower pulse. A system like this is susceptible to RFI1, itis impossible to filter out transmitter stations that leak into thefrequency band and one cannot distinguish air shower pulsesfrom RFI pulses. Consequently measurements were often onlydone at night when commercial TV and radio stations wereturned off and access to the site could be restricted.
The advent of high bandwidth, high dynamic range ADCsallows us to digitize the whole radio frequency waveform andprocess the data with digital computers. This enables us touse digital filtering and digital beam forming to suppress theRFI and pick out air shower pulses. To test this technologyand demonstrate its ability to measure radio pulses fromair showers we built LOPES a prototype for the upcomingLOFAR radio telescope. LOFAR, the Low Frequency Array,is a new digital radio telescope designed to take advantage ofthe new technology. It will work in the frequency range of10 to 270 MHz which is in the range of interest for cosmic
1Short form of radio frequency interference.
978-1-4244-2715-4/08/$25.00 ©2008 IEEE 3339

Fig. 1. Outline of the LOPES hardware. The signal is picked up by theantenna, sent via a coaxial cable to the receiver module, digitized and sent tothe memory module. From there it can be read out by the front-end PC andtransmitted to the central data acquisition PC. The clock signals are generatedby the master clock module and, together with the sync-signal, sent to theslave modules for further distribution.
ray measurements. LOPES is set up at the site of KASCADEGrande an existing air shower array.
Tn this paper the hardware, configuration, calibration, andthe analysis software of LOPES is presented. A more detaileddescription of LOPES can be found in [2], details about theSelf Trigger Array LOPES-STAR can be found in [3].
II. EXPERIMENTAL SETUP
A. The Hardware of LOPES
LOPES operates in the frequency range of 40 MHz to80 MHz. This is a band with relatively little RFI in betweenthe short-wave- and the FM-band. Additionally this frequencyrange is low enough that the emission from air showers isstrong, but not so low that the background emission from theGalactic plane is too strong.
Although we chose a relatively quiet frequency bandLOPES still has to deal with significant RFI (see fig. 8). ButLOPES must also be able to detect faint radio pulses fromair showers. This leads to two design goals for the hardware.The first is that the noise added by the hardware should beless than the background noise from the sky. As the averagesky temperature in our frequency band ranges from 2000 K at80 MHz to f'.J 10000 K at 40 MHz this goal is relatively easy tomeet. The second goal is that the dynamic range of the systemhas to be large enough to handle both the RFI and the smallsignals, i.e. distortions of the signal caused by the RFI in ourelectronics should be also less than the background noise. Thisputs a significant restriction on the kind of ADCs we can use,i.e. we cannot use 8-bit ADCs. The availability of ADCs witha sufficient dynamic range limited the bandwidth to 40 MHzand thus prevented us from using the range between 40 MHzand the short-wave-band.
The outline of the hardware used for LOPES can be seen infigure 1. It samples the radio frequency signal after minimalanalog treatment without the use of a local oscillator.
1) Antenna: The antennas for LOPES are short dipoleantennas with an "inverted V" shape. One of the LOPESantennas at the KASCADE-Grande site is shown in figure 2.The visible parts are commercial PVC pipes holding the activeparts in place, while being transparent to the radiation. The
Fig. 2. One of the LOPES antennas at the KASCADE-Grande site. Theactive balun resides inside the container at the top of the antenna. The radiatorconsists of cables in two opposing edges of the pyramid. By choosing theeast-west or north-south edges our antenna is sensitive to the east-west resp.north-south polarized component of the radiation.
Fig. 3. Gain pattern of a single LOPES antenna [4]. The vertical direction(azimuth = 0° or = 180°) is the direction perpendicular to the dipole, thehorizontal direction is the one parallel to the dipole. The contours (dashedlines) are at the 50% and 10% levels.
radiator consists of two copper cables extending from the topdown two thirds of two opposing edges of the pyramid. ThePVC exterior of the antenna resides on an aluminum pedestal.This acts as a ground screen and protects the antenna frombeing damaged by lawn mowers.
This geometry determines the antenna pattern of the single antenna. The pattern, as obtained from simulations [4],is shown in figure 3. The half power beam width of theantenna ranges from f'.J 850 in the direction parallel to thedipole (E-plane) to f'.J 1300 in the direction perpendicular tothe dipole (H-plane). The four edges can be used for twoorthogonal linear polarizations of the signal. If one measuresboth polarization directions one can do full polarimetry of thesignal.
Inside the container at the top resides the active balun.Its main functions are balanced to unbalanced conversion,amplification of the signal and transformation of the antennaimpedance to the 50 n impedance of the cable. The amplifieris a negative feedback amplifier, with a passive feedback net-
3340

Fig. 4. A LOPES receiver module with amplifier (left), band-pass filter (top)and AID-converter board with an optical transmitter board piggybacked ontoit (bottom right). The connectors are: signal input (left), power (bottom left),ADC-clock (bottom right) and digital data out (right).
work. The feedback network is designed, so that the resultinginput impedance is matched to the output impedance of theradiator over a wide frequency range. This gives sensitivityover a wide frequency range with good linearity and noiseperformance.
2) Receiver Module: Figure4 shows one of the receivermodules for LOPES (RML). It consists of an amplifier (left),band-pass filter (top), ADC-board (bottom right, partiallycovered) and an optical transmitter board for the digital datapiggybacked onto the ADC-board.
The amplifier is needed to bring the signal level from theantenna to the level needed for the ADC-module. The highbackground from the Galactic noise and the low absolutepower result in relaxed requirements for noise and intermodulation performance of the amplifier. These could beachieved with a relatively cheap, off-the-shelf amplifier.
Next in the signal path is the anti-aliasing and band-passfilter. This filter should provide the largest usable bandwidth,while suppressing the strong transmitters outside our bandof interest. Usable bandwidth is defined as the bandwidthin which we have significant power in our band and wherecontributions from outside the band are suppressed below thenoise level. This requires high stopband attenuation and steepedges. The filters used for LOPES give us a usable frequencyband from 43 MHz to 76 MHz for LOPES 10 and from 43 MHzto 74 MHz for LOPES30. (Figure 7 shows the shape of thefilters as part of the total electronics gain.)
The last analog device in the signal path is the AIDconverter board. It includes an amplifier, that matches the 50 ninput impedance of the board to the impedance of the ADC.To detect weak pulses while not saturating the ADC with radiointerference we need a dynamic range of about 60 dB. This isachieved by using 12-bit ADCs. The ADCs are running at aconverter clock of 80 MHz. Thus we are sampling the signalin the second Nyquist domain of the ADCs. Piggybacked ontothe AID-converter board is an optical transmitter board. Thischanges the digital data of the ADCs from an electrical to anoptical signal and transmits the data to the backend module.
3) Digital Backend and Clock Module: The digital datais transferred via fiber optics to the memory modules. These
I~adio Antrnna (LOPES-3())
Fig. 5. Layout of LOPES inside the KASCADE array. The triangles show thepositions of the 30 LOPES antennas, the circles highlight the 10 antennas ofLOPES 10. The fat squares mark the electronic stations that house the LOPESelectronics, each station connecting to ten antennas. The upper highlightedstation was the station used for LOPES 10. It now holds the master clockmodule and the card for the KASCADE timestamp.
modules have standard PCI-connectors and fit into the frontend PCs. A module has 2 GByte memory and two inputs withf"V 1.2 GBit/sec each, which allows to store up to 6.25 secondsof data. Several of these modules can be used together bysynchronizing them with a common synchronization-signal,which can be used to either start or stop writing the data intomemory.
To be able to do beam forming with the data, the ADCs haveto use the same conversion clock. Even small differences inthe frequency of the conversion clock lead to offsets of severalsamples during the time of one dataset. Also the clock forthe ADCs not only needs to be stable over long times, butalso over short times. This is particularly true if one uses 2ndNyquist sampling of the signal, as jitter on the sample-clockdistributes part of the power from narrow band RFI over allfrequency channels. Sending the clock signal over the opticaltransmission path added too much jitter, thus we distributethe clock via coaxial cables. To achieve this the clock forthe ADCs is generated with a low noise crystal on a centralmaster clock module and then distributed via slave modules tothe receiver modules. They also distribute a synchronous clockfor the memory modules and the synchronization-signal.
A clock card provides an accurate time-stamp and interfacesto the trigger from KASCADE-Grande.
B. LOPES at KASCADE-Grande
1) Layout: The layout of the LOPES antennas inside theKASCADE array can be seen in figure 5. In the first phase,named LOPESI0, it had 10 antennas in a cross like patternaround the electronics station with the receiver electronics. Inthe second phase, called LOPES30, we have 30 antennas, ofwhich 26 are inside the KASCADE array and 4 are outsideon a meadow next to the KASCADE array. In the first two
3341

222018
(f)>.o
G> 0a
Time [days since 1. 1.2004]
Fig. 6. Time delay deviations for one LOPES antenna, as computed fromthe relative phases of a TV transmitter. The three flagged spikes are wherethe algorithm failed e.g. due to excessive noise.
to the reference antenna one can get additional calibrationinformation:
• At the frequencies where the power is dominated by thesolar burst, the relative phases give the phase differenceof the electronics.
• At the frequencies dominated by the TV transmitter onecan get the reference values for the second calibrationmethod.
2) Calibration on a TV-Transmitter: By monitoring therelative phases of a TV transmitter we can monitor the phasestability of our system and get time delay calibration valuesfor every day. As the position of the TV transmitter does notchange, the relative delays and thus the relative phases of itssignal in the different antennas remains constant. Additionally,its picture carrier and the two audio sub-carriers are strongenough that they are visible in every antenna and can be easilyidentified.
The signal from the TV transmitter does not have enoughfine structure to allow us to directly get the relative delayvia the cross-correlation. Checking the relative phases of justa single frequency cannot detect larger shifts due to theambiguity of the phase. But by checking three frequenciesthis ambiguity can be reduced so far that not only delays bya small fraction of a sample time but also shifts of an integernumber of samples can be detected.
The resulting delay corrections for one antenna over a fewdays are shown in figure 6. The three spikes belong to eventswhere the algorithm failed. The delay-axis is given in sampletimes, so even without the correction the delay error stayswithin the ±0.1 sample times range.
(f)Q)
a.E --:o 0~
ci ~------------~
B. Gain Calibration
With a setup like LOPES the directly measured values areADC-counts. The values of interest are the field strength of theradio pulse. To get from the recorded ADC-values to valuesfor the field strength one has to consider the properties of theADC, the gain and attenuation of the electronic parts in thesignal chain and the gain of the antenna.
1) AID-Converter: For single samples the "power into theADC" can then be calculated with the formula for DCcurrents: PADC = U1DC / RADC The actual value of theinput impedance of the ADC does not need to be known,
phases all antennas were configured to measure the east-westpolarization component. In the third phase half of the antennaswere reconfigured for north-south polarization measurement.
The electronics are housed in three racks, each in theelectronic station of a different cluster (in clusters 2, 6, and10). Each station houses a slave clock module, ten receivermodules, five memory modules in three front-end PCs andsupport electronics (power supplies etc.).
The position of the antennas in relation to each other hasbeen measured with high precision with a differential GPSsystem2
• The accuracy of these positions, as given by thesoftware, is better than 10 cm with less error in the horizontalplane than in the height.
2) Data Acquisition: The data acquisition is done with onemaster PC and nine front-end PCs connected via standardEthernet. The front-end PCs house the memory modules andthe clock the clock card. The DAQ software consists of amaster program running on the master PC and one clientprogram for each memory module and the clock card runningon the front-end PCs. After a trigger has been received, themaster program collects the data from all clients, writes out anevent file, starts all memory modules and then frees the vetoon the clock card.
3) Trigger: To get good frequency resolution rv 0.82 ms ofdata is saved for each trigger, giving a frequency resolution ofrv 1.2 kHz. The data is selected so that the air shower signalis in the center of the data.
LOPES is triggered by a large event trigger fromKASCADE-Grande. This is either a 10 out of the 16 coincidence of the KASCADE array clusters, or a coincidence of3 trigger hexagons of the Grande array. This results in a triggerrate of rv 2 triggers per minute. Considering a dead time ofLOPES of rv 1.5 seconds this means that about 5% of theevents are lost to the dead time.
III. CALIBRATION OF LOPES
A. Delay Calibration
In order to be able to do beam forming, the instrumentalsignal delays of the different antennas has to be known withgood accuracy. Even small errors in the relative delays of theantennas with respect to each other degrade the coherence.
Tolerances of the electronics, unequal aging of the parts anddifferent temperatures can cause a variation of the delay forthe different channels. Additionally the digital electronics cancause the time index of a channel to be off by two samples,due to a glitch in the relative timing of the boards.
1) Calibration on the Sun: During solar bursts the sun becomes by far the brightest source in the sky at our frequencies.It can even become so bright, that only the strongest RFIsources are visible in a single antenna spectrum. Due to thelow spatial resolution of LOPES the sun is seen as a singlepoint. This allows us to use the bursting sun as a calibrationsource for the relative delays.
The result of this is a relative delay calibration for thisevent. After correcting for this delay, going to the frequencydomain, and calculating the relative phases of an antenna
2A Promark2 system from Thales.
3342
50 55 60 65 70 75 80frequency v[MHz]
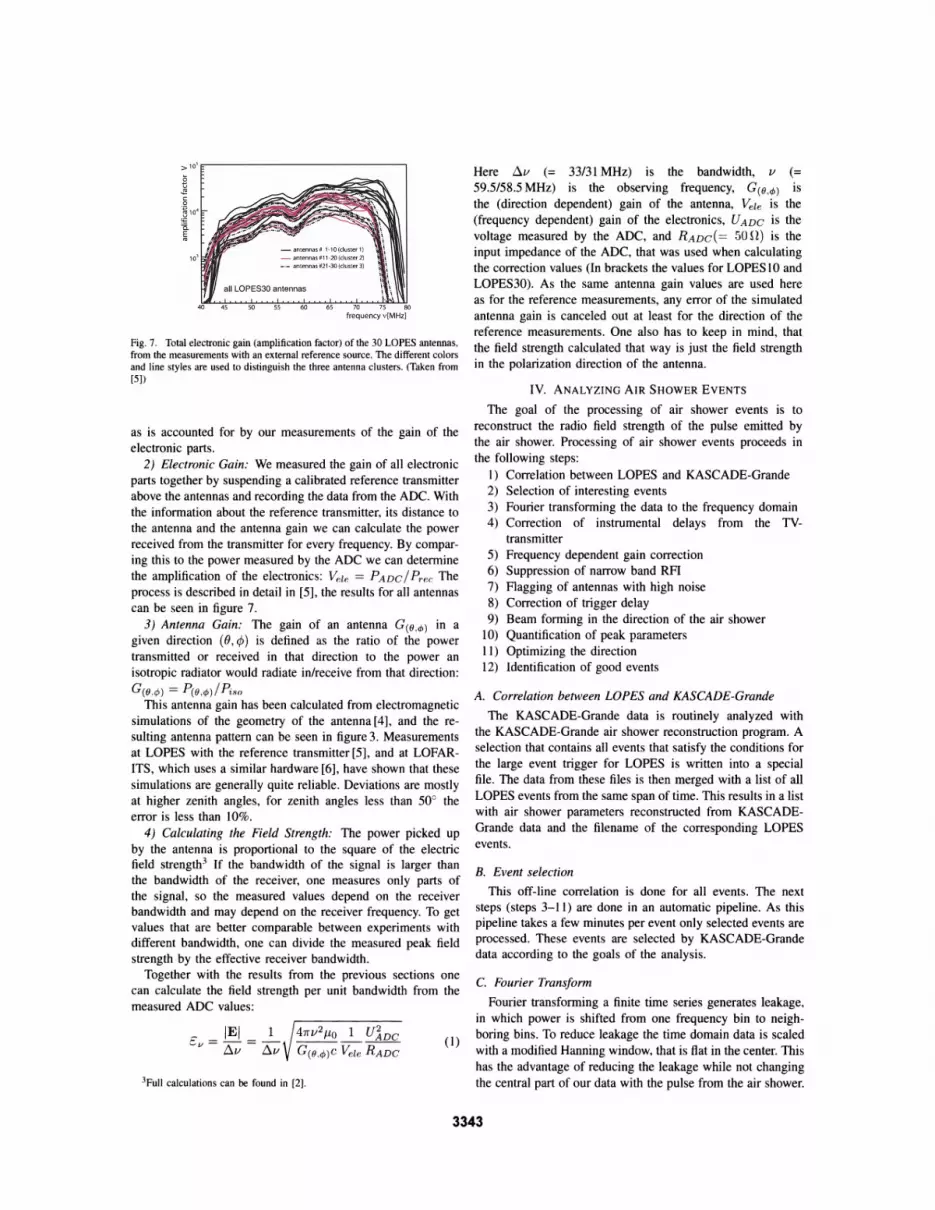
Fig. 7. Total electronic gain (amplification factor) of the 30 LOPES antennas,from the measurements with an external reference source. The different colorsand line styles are used to distinguish the three antenna clusters. (Taken from[5])
as is accounted for by our measurements of the gain of theelectronic parts.
2) Electronic Gain: We measured the gain of all electronicparts together by suspending a calibrated reference transmitterabove the antennas and recording the data from the ADC. Withthe information about the reference transmitter, its distance tothe antenna and the antenna gain we can calculate the powerreceived from the transmitter for every frequency. By comparing this to the power measured by the ADC we can determinethe amplification of the electronics: Vel e == PADC / Pree Theprocess is described in detail in [5], the results for all antennascan be seen in figure 7.
. 3) A~ten~a Gain: ~e gain of an antenna G(O,d» in agIven dIrectIon ((), ¢) IS defined as the ratio of the powertransmitted or received in that direction to the power anisotropic radiator would radiate in/receive from that direction:
G(O~¢) == p(O,¢»/Piso
This antenna gain has been calculated from electromagneticsimulations of the geometry of the antenna [4], and the resulting antenna pattern can be seen in figure 3. Measurementsat LOPES with the reference transmitter [5], and at LOFARITS, which uses a similar hardware [6], have shown that thesesimulations are generally quite reliable. Deviations are mostlyat higher zenith angles, for zenith angles less than 50° theerror is less than 10%.
4) Calculating the Field Strength: The power picked upby the antenna is proportional to the square of the electricfield strength3 If the bandwidth of the signal is larger thanthe bandwidth of the receiver, one measures only parts ofthe signal, so the measured values depend on the receiverbandwidth and may depend on the receiver frequency. To getvalues that are better comparable between experiments withdifferent bandwidth, one can divide the measured peak fieldstrength by the effective receiver bandwidth.
Together with the results from the previous sections onecan calculate the field strength per unit bandwidth from themeasured ADC values:
B. Event selection
This off-line correlation is done for all events. The nextsteps (steps 3-11) are done in an automatic pipeline. As thispipeline takes a few minutes per event only selected events areprocessed. These events are selected by KASCADE-Grandedata according to the goals of the analysis.
IV. ANALYZING AIR SHOWER EVENTS
The goal of the processing of air shower events is toreconstruct the radio field strength of the pulse emitted bythe air shower. Processing of air shower events proceeds inthe following steps:
1) Correlation between LOPES and KASCADE-Grande2) Selection of interesting events3) Fourier transforming the data to the frequency domain4) Correction of instrumental delays from the TV-
transmitter5) Frequency dependent gain correction6) Suppression of narrow band RFI7) Flagging of antennas with high noise8) Correction of trigger delay9) Beam forming in the direction of the air shower
10) Quantification of peak parameters11) Optimizing the direction12) Identification of good events
C. Fourier Transform
Fourier transforming a finite time series generates leakage,in which power is shifted from one frequency bin to neighboring bins. To reduce leakage the time domain data is scaledwith a modified Hanning window, that is flat in the center. Thishas the advantage of reducing the leakage while not changingthe central part of our data with the pulse from the air shower.
A. Correlation between LOPES and KASCADE-Grande
The KASCADE-Grande data is routinely analyzed withthe KASCADE-Grande air shower reconstruction program. Aselection that contains all events that satisfy the conditions forthe large event trigger for LOPES is written into a specialfile. The data from these files is then merged with a list of allLOPES events from the same span of time. This results in a listwith air shower parameters reconstructed from KASCADEGrande data and the filename of the corresponding LOPESevents.
Here ~1/ (= 33/31 MHz) is the bandwidth, 1/ (=59.5/58.5 MHz) is the observing frequency, G(O,¢» isthe (direction dependent) gain of the antenna, Vele is the(frequency dependent) gain of the electronics, UADC is thevoltage measured by the ADC, and RADC (= 50 n) is theinput impedance of the ADC, that was used when calculatingthe correction values (In brackets the values for LOPES 10 andLOPES30). As the same antenna gain values are used hereas for the reference measurements, any error of the simulatedantenna gain is canceled out at least for the direction of thereference measurements. One also has to keep in mind, thatthe field strength calculated that way is just the field strengthin the polarization direction of the antenna.
( 1)4nv2 J-lo 1 U1DC
G(O,¢»C Vel e RADC
- antennas # 1-10 (cluster 1)- antennas #11-20 (cluster 2)
_.- antennas #21·30 (cluster 3)
3Full calculations can be found in [2].
>10'~--------------
3343

' ..... , ....:.~
Frequency[MHz)
Time[~econds)
d) ~~ ~,E
':::-r~ I
~ ~..............._ ......1.9......................_...J....1.S...............'---"_...J..1.......7 ...L.!...L-_.....J1
.6
c) ~~ II?,0E
':::-oto~ ~~ I
~ ~~-""""1.9"""""""'--'---'-1.""""S..............._..........1........7....t.....i.-~_1.6
Time[~econds)
a) ~~~E
':::-00
fO'-r-
~ I
~ ...............~-........1.9...............--'---'-1.......s ..............._..........1--'-.7~.o......J_1.6
Time[#,SecondS)
(2)
Fig. 8. a) Section of the unfiltered data. The different colors show tracesfrom different antennas. b) Gain calibrated power spectrum of one antennawith a block-size of 65536 samples. The red/dark spikes sticking out fromthe noise floor are narrow band RFI. In green the spectrum after filtering.c) Filtered data, after filtering with a block-size of 65536 samples. A coherentpulse at -1.78 tLs is clearly visible. d) Filtered data, but with a block-size of128 samples (Le. 4 times the plotted data). In contrast to c) the coherent pulseis not easily visible.
D. Delay and Gain Correction
The algorithm used for the determination of instrumentaldelays is described in section III-A2. The delay correctionsobtained this way are added to the other delays and appliedduring the beam forming process.
The gain calibration values from section III-B2 are multiplied to the data. In this step the frequencies outside our bandare multiplied by a smaller number, thus effectively removingthem.
E. Suppression of Narrow Band RFI
Narrow band RFI occupies only few channels in frequencyspace, while a short time pulse is spread over all frequencychannels. So by flagging the channels with RFI one can greatlyreduce the background without affecting the air shower pulsemuch. Figure 8 illustrates the effect of this. Panel a) shows asection of unfiltered data with traces for all antennas. Panel b)shows the power spectrum of one antenna before and afterthe filtering. After filtering the RFI lines stay in the regionof the noise. Panel c) shows the time domain data after thefiltering. A coherent pulse at -1.78 J.ts is clearly visible (i.e.all the traces fall onto each other). Panel d) shows the effectof insufficient frequency resolution. Less frequency resolutionhas two effects. The first is that with each filtered line a greaterportion of the radio pulse is cut away. The second is that RFIis more prone to be hidden in the noise and thus not filtered.In this example the second effect is dominant, the amplitudeof the signals is only a little lower than in the unfiltered data.
F. Flagging of Antennas
Antennas are flagged and not used if:
• They have an unusual amount of noise, i.e. their peakvalue is significantly larger than those of the other antennas.
Fig. 9. Geometry within the plane containing the source point and antennas 1and 2. A radio pulse from the source point first arrives at antenna 2 and laterat antenna 1.
• They have an extremely small signal, e.g. because theywere not connected.
• They are standing next to the muon tracking detector andthe shower core falls on top it. In this case lots of particlespenetrate the shielding of the detector and the detectorgenerates a large amount of RFI.
• The antenna is manually deselected.
G. Beam Forming
The essence of beam forming is to add the signals from different antennas in order to achieve sensitivity to one direction.This direction is determined by time shifts of the signals fromthe antennas. As an example figure 9 shows the geometry ofthe source and two antennas. A pulse originating at the sourcewill first arrive at antenna 2 and then at antenna 1. To havethe pulse at the same position in both datasets the datasetof antenna 1 has to be shifted in relation to the one fromantenna 2 by the delay that corresponds to the distance fromantenna 1 to pointA. If both datasets are then added up, thepulse will be enhanced in the resulting data, while a pulsefrom another direction will be smeared out. We choose thereference position for the calculation of the geometric delaysso that the radio pulse is always at about the same array indexin our time series.
The geometrical delays and the delay corrections are addedto give the final delays. The shift itself is done by multiplying aphase gradient to the frequency space data before transformingit back to the time domain. From the shifted data we calculateseveral so called beams, that combine the data in differentways:
• The data from all antennas is added pixel by pixel, butthen normalized by the number of antennas to have valuescomparable to a single antenna.
lINf[t] = NF[t] = N Lsdt ]
i=l
Where F[t] is the unnonnalized field strength of theformed beam, f[t] is the normalized field strength, N the
3344

This gives a peak if there is lots of power in the antennas,independent of it being coherent or incoherent.
• The data from each unique pair of antennas is multiplied,the resulting values are averaged, and then the square rootis taken while preserving the sign.
(5)[ ] == []·I < ee[t] > 1xt eet []<pt >
I. Direction Optimization
weighted by the absolute value of the relation of thesmoothed CC-beam to the smoothed power-beam.
H. Quantification of Peak Parameters
The response of the analog electronics to a short pulse isan oscillation over a short time. The major contribution tothis oscillation comes from the anti-aliasing filter. Filteringof the lower frequencies causes an oscillation around zero,while the finite bandwidth broadens the pulse. Sampling sucha signal with an ADC gives a certain fine structure inside thepulse that is not part of the original pulse but is caused by theelectronics. To suppress this fine structure the data is smoothedby block averaging over 3 samples. Although the pulse shapeis not really Gaussian, fitting a Gaussian to the smoothed datagives a robust value for the peak strength. Other methods, like,e.g., the maximum of the peak or the sum over the pixels ofthe peak, can change their values when the data is shifted intime or suffer from problems in determining where the pulsestarts and where it ends.
As coherent peaks have the same height in both beamsthey are not changed much, but incoherent peaks usuallyhave a larger value in the power-beam than in the CCbeam, so they are reduced. This is called the excess-beamor X-beam.
Figure 10 shows the different kinds of beams. Panel a) showsthe data from all antennas, while panels b)-d) show the fieldstrength, the CC-beam, and the X-beam, all together with thepower-beam. The peak from the coherent pulse at -1.8 JLs isseen in all panels with about the same height. The incoherentnoise between -1.75 JLS and -1.3 JLs produces significantpeaks in the field strength, smaller peaks in the CC-beam andno significant peaks in the X-beam.
(3)
-1.5
-1.5-2
Time[#-,Seconds]
Time[~Seconds]
-2
1 N
N Ls;[t]i=l
-1.5
p[t] ==
-2
TIme[#-,Seconds]
b) ~["""""""'T"--.---r--"'T"'"""""'l.----r-"-"""""--T"""""TIr---T""> J: N ......--r-"--'--"T'""""""""I--""'-"--'--""""""r--r-"I
~,E If)
~....:
g"i~
g'~
~ 0
¥ 0 ~~------_I" ,--""i.i:
number of antennas, Si [t] the time shifted field strengthof the single antennas, and t the time or pixel index.This is the normal beam forming process. With this theparts of a coherent pulse can have both positive andnegative sign, so to see a peak one has to look at theabsolute values.
• For comparison the squared values of all antennas areaveraged and then the square root is taken, called thepower-beam.
Fig. 10. a) Section of the filtered data for all antennas. At -1.8 J-LS acoherent pulse can be seen (all traces fall onto each other), between -1.75 J-LSand -1.3 J-LS there is incoherent noise in several antennas (noise from theKASCADE particle detectors). b) Absolute values of the field strength afternormal beam forming in dark blue. c) The cross-correlation beam. Thecoherent pulse stays the same, but some of the noise peaks have negativesign marking them as incoherent peaks. d) The so called X-Beam. The onlyremaining peak is the coherent peak from the air shower. For comparison thepower-beam is plotted in green (light grey) in panels b)-d), and all the beamsare smoothed by block averaging over 3 samples.
N Pairs is the number of unique pairs of antennas. Thenegative sign is taken if the sum had a negative signbefore taking the absolute values, and the positive signotherwise.We call this the cross-correlation beam or CC-beam. Theadvantage of this is that a peak from a coherent pulsealways has a positive sign. Peaks from incoherent pulsescan also have a negative sign, e.g., if one antenna hasa large value but the other antennas have values withopposite sign.
• To better bring out the significance of a pulse in thepresence of rapidly changing noise, the CC-beam is
ee[t] == ~
1 N-l N
~ L Lsdt]sj[t]PQ,~rs i=l j>i
(4)
The beam-forming direction is optimized in three parameters: azimuth, elevation, and radius of curvature. The radiopulse of an air shower does not arrive on the ground as a planewave, but it has some curvature. For the distances of LOPESthe shape of the wavefront can be represented by a sphere witha finite radius of curvature. Figure 11 shows the differencebetween plane wave beam forming and beam forming with anoptimized radius of curvature.
The optimization is done in two steps. In the first stepthe pulse height is evaluated on a small grid around thedirection given by KASCADE-Grande. This is done in aneffort of keeping the following step from running into alocal maximum. The position at which the pulse height hasa maximum is then used as the starting point for a simplexmaximization routine. This routine adjusts the three directionparameters, so that the pulse height is maximized.
3345

V. FIRST DETECTION
Fig. II. Left: Data of a good event but shifted for beam forming as a planewave. The pulse at -1.8I-£s is not coherent. Right: The same event, but witha radius of curvature of 2250 m. The coherent pulse is clearly visible.
and the muon number N/-L > 4 x 10⁵ , selecting 15 events intotal. In all of those events we detected a radio pulse from theair shower, proving that indeed there are indeed radio pulsesassociated with air showers and that it is possible to measurethem, even in radio loud environments, with a digital radiotelescope. The analysis of the pulse heights of these eventsshowed that there is a dependence of the pulse height on theangle of the air shower axis to the geomagnetic field and anindependent, nearly linear dependence on the muon number.In particular the geomagnetic dependence is of interest, as itsupports our theory of a geosynchrotron emission process.
VI. SUMMARY AND OUTLOOK
LOPES is a digital radio telescope aimed at the detection ofradio pulses from cosmic ray air showers. It directly samplesthe radio waveform in the frequency range of 40 MHz to80 MHz with fast analog to digital converters, after onlyminimal analog treatment of the signal. Digital processing ofthe stored data then allows us to form a beam after an airshower has been recorded.
LOPES is set up at the site of the KASCADE-Grandeexperiment, and triggered by a large event trigger from theparticle detectors. In the first two phases 10 resp. 30 antennasmeasured the east-west polarized signal, currently 15 antennasmeasure the east-west polarization and 15 antennas measurethe north-south polarization. For the air shower analysis thedata is offline correlated with data from KASCADE-Grandearray, radio interference is digitally filtered, and a beam in thedirection given by KASCADE-Grande is formed.
LOPES was the first experiment to unambiguously detectradio pulses from air showers with the new technology. Thusdemonstrating that it is possible to measure radio emissionfrom air showers even in a radio loud environment. This initialsuccess of LOPES has led to a revival of this topic with agrowing community. The effort to measure air showers withthe LOFAR telescope is the direct continuation of LOPES.The high sensitivity and precise calibration of LOFAR willallow a detailed view on single air showers. Another projectis working on adding radio detection capability to the PierreAuger Observatory.
Time[/oLSeconds]
-1.9 -1.8 -1.7 -1.6
Time[JIoSeconds]
Time[}LSeconds]
:x:~
'EN~o
t~IV L.....l~.....I..-l...................&.......l...-L.....L......&---I........I.......I........I...L-L..J
-1.9 -1.8 -1.7 -1.6 iL:
Time[JIoSeconds]
Fig. 12. Left: Field strength of the single antennas of the first unambiguousradio pulse from an air shower detected with LOPES. Right: The formedbeam of this event. One can clearly distinguish between the coherent radiopulse at -1.8I-£s and the detector RFI between -1.7 I-£S and -l.4l-£s.
J. Event Identification
Not every selected air shower is accompanied by a radiopulse that is detectable by LOPES. If there is no pulse fromthe air shower there can be an incoherent noise peak that isas high as an average air shower peak, even in the X-beam.So one cannot select events with air shower pulses just bythe height of the fitted Gaussian, but has to classify events inan extra step. Simple methods using only a small number ofparameters turned out to have a significant number of falseclassifications. The low absolute number of events makes itdesirable to have the lowest number of false classificationsthat is possible. But it also allowed us to classify all selectedevents by eye, which turned out to be the most effective wayfor now.
The first unambiguous radio pulse from an air showerdetected with LOPES was taken on the 12. January 2004.Figure 12 shows the field strength of the single antennas andthe block averaged CC-Beam for this event. It showed, that thecontribution between -1.7 JLS and -1. JLS matches the noiseexpected from the particle detectors and that at -1.8 JLS thereis an additional, coherent signal that was then identified as theradio pulse from the air shower itself. This event was takenduring a thunderstorm which increased its radio signal [7]. Thismade this particular event unusable for a quantitative analysis,but it showed us how to distinguish air shower pulses fromdetector RFI.
A first analysis based on this discovery used a ratherrestrictive set of events with relatively high signal to noise [8].Using events from the first half year of operation, startingJanuary 2004, all events were selected with a shower corewithin 70m of the center of LOPES, a zenith angle < 45°,
REFERENCES
[I] Jelley, 1. v., Fruin, J. H., Porter, N. A., Weekes, T. C., Smith, F. G., &Porter, R. A. Nature, 205 :327, 1965
[2] Homeffer, A., LOPES Collaboration, The LOPES System for the Detection of Radio Pulses from Air Showers, in preperation
[3] Kroemer, 0., LOPES Collaboration, Optimization of Radio Detection ofUltra High Energy Cosmic Rays, these proceedings
[4] Arts, M., EM simulations of a LOFAR LBH antenna, ASTRON-Report,2005
[5] Nehls, S. et al., Nucl. Instr. and Meth. A. 589:350-361, 2008[6] Spreeuw, H., Gain properties of the inner 25 antennae of Lofar's ITS,
ASTRON-Report, 2005.[7] Buitink, S., LOPES Collaboration, Astronomy & Astrophysics, 467:385,
2007[8] Falcke, H., LOPES Collaboration, Nature, 435:313-316, May 2005.
3346