destabilization of lih by li insertion into ge
TRANSCRIPT
Destabilization of LiH by Li Insertion into GeAnkur Jain,*,† Erika Kawasako,‡ Hiroki Miyaoka,§ Tao Ma,∥ Shigehito Isobe,∥ Takayuki Ichikawa,*,†,‡
and Yoshitsugu Kojima†,‡
†Institute for Advanced Materials Research, ‡Graduate school of Advanced Sciences of Matter, and §Institute for Sustainable Sciencesand Development, Hiroshima University, Higashi-Hiroshima 739-8530, Japan∥Graduate School of Engineering, Hokkaido University, N-13, W-8, Sapporo 060-8278, Japan
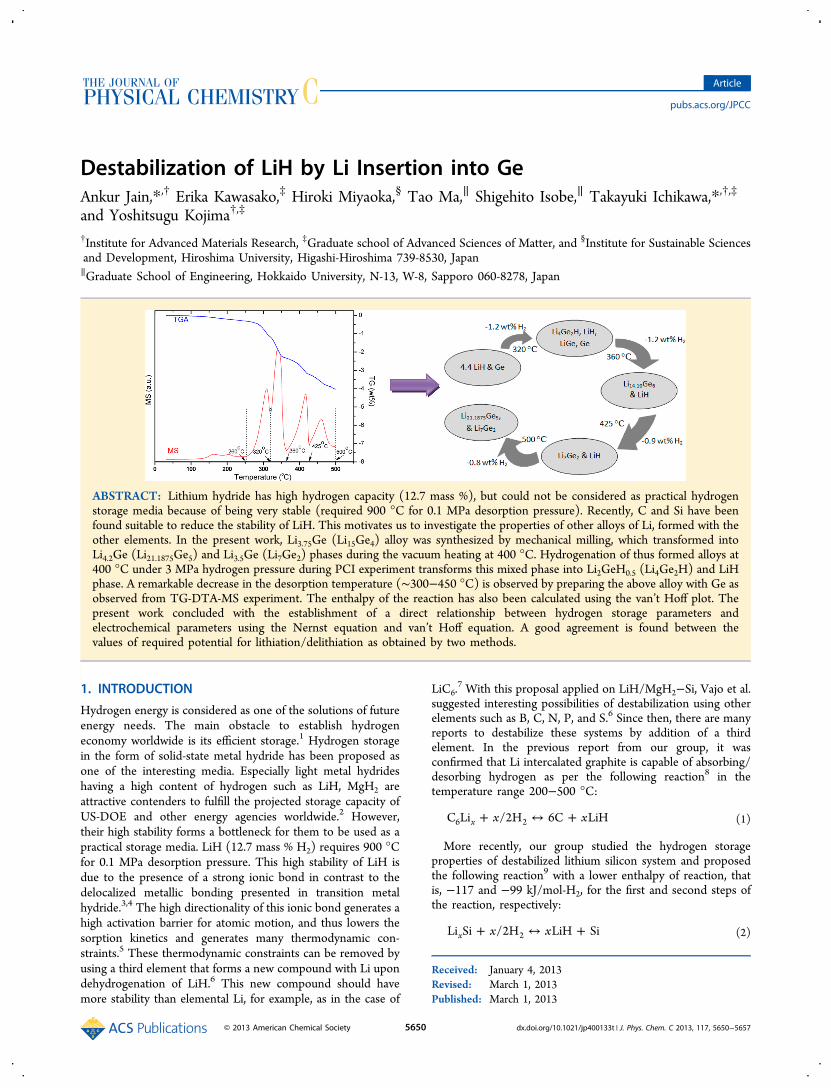
ABSTRACT: Lithium hydride has high hydrogen capacity (12.7 mass %), but could not be considered as practical hydrogenstorage media because of being very stable (required 900 °C for 0.1 MPa desorption pressure). Recently, C and Si have beenfound suitable to reduce the stability of LiH. This motivates us to investigate the properties of other alloys of Li, formed with theother elements. In the present work, Li3.75Ge (Li15Ge4) alloy was synthesized by mechanical milling, which transformed intoLi4.2Ge (Li21.1875Ge5) and Li3.5Ge (Li7Ge2) phases during the vacuum heating at 400 °C. Hydrogenation of thus formed alloys at400 °C under 3 MPa hydrogen pressure during PCI experiment transforms this mixed phase into Li2GeH0.5 (Li4Ge2H) and LiHphase. A remarkable decrease in the desorption temperature (∼300−450 °C) is observed by preparing the above alloy with Ge asobserved from TG-DTA-MS experiment. The enthalpy of the reaction has also been calculated using the van’t Hoff plot. Thepresent work concluded with the establishment of a direct relationship between hydrogen storage parameters andelectrochemical parameters using the Nernst equation and van’t Hoff equation. A good agreement is found between thevalues of required potential for lithiation/delithiation as obtained by two methods.
1. INTRODUCTION
Hydrogen energy is considered as one of the solutions of futureenergy needs. The main obstacle to establish hydrogeneconomy worldwide is its efficient storage.1 Hydrogen storagein the form of solid-state metal hydride has been proposed asone of the interesting media. Especially light metal hydrideshaving a high content of hydrogen such as LiH, MgH2 areattractive contenders to fulfill the projected storage capacity ofUS-DOE and other energy agencies worldwide.2 However,their high stability forms a bottleneck for them to be used as apractical storage media. LiH (12.7 mass % H2) requires 900 °Cfor 0.1 MPa desorption pressure. This high stability of LiH isdue to the presence of a strong ionic bond in contrast to thedelocalized metallic bonding presented in transition metalhydride.3,4 The high directionality of this ionic bond generates ahigh activation barrier for atomic motion, and thus lowers thesorption kinetics and generates many thermodynamic con-straints.5 These thermodynamic constraints can be removed byusing a third element that forms a new compound with Li upondehydrogenation of LiH.6 This new compound should havemore stability than elemental Li, for example, as in the case of
LiC6.7 With this proposal applied on LiH/MgH2−Si, Vajo et al.
suggested interesting possibilities of destabilization using otherelements such as B, C, N, P, and S.6 Since then, there are manyreports to destabilize these systems by addition of a thirdelement. In the previous report from our group, it wasconfirmed that Li intercalated graphite is capable of absorbing/desorbing hydrogen as per the following reaction8 in thetemperature range 200−500 °C:
+ ↔ +x xC Li /2H 6C LiHx6 2 (1)
More recently, our group studied the hydrogen storageproperties of destabilized lithium silicon system and proposedthe following reaction9 with a lower enthalpy of reaction, thatis, −117 and −99 kJ/mol-H2, for the first and second steps ofthe reaction, respectively:
+ ↔ +x xLi Si /2H LiH Six 2 (2)
Received: January 4, 2013Revised: March 1, 2013Published: March 1, 2013
Article
pubs.acs.org/JPCC
© 2013 American Chemical Society 5650 dx.doi.org/10.1021/jp400133t | J. Phys. Chem. C 2013, 117, 5650−5657
Besides their destabilization property for hydrogen storagematerials, these group IV elements are considered as a veryimportant and attractive anode material for Li-ion batteries.10
One can estimate the possibility of destabilization of LiHthrough their electrochemical behavior and vice versa. Becauseof the positive potential values (V vs Li/Li+) for the lithiation ofthese materials,10 these Li absorbing alloys should be morestable than Li; thus these all should be suitable for thedestabilization of LiH.Germanium is the next element that belongs to the same
group after C and Si. The potential for lithiation of Ge also liesin the positive range, that is, 0.1−0.7 V, as observed in severalreports.11−14 Thus we expect the formation of more stabilizedLi−Ge compounds in comparison to elemental Li, so Geshould be helpful for the destabilization of LiH through thefollowing reaction:
+ ↔ +x xLi Ge /2H LiH Gex 2 (3)
Recently, Ge has shown its potential as a destabilizing agentfor MgH2
15 with a drastic decrease of dehydrogenationenthalpy from −76 to −14 kJ mol−1 H2. However, there arevery few reports on Li−Ge−H systems that exist in theliterature,16,17 where only the structure of Li−Ge−H ternaryhydride was established using neutron techniques and firstprinciple calculations. Moreover, hydrogen storage propertiesof Li−Ge system have not been reported so far.In this work, we have chosen Li4.4Ge as a starting material, as
it is the highest Li-containing alloy according to the phasediagram.18 A mixture of Li and Ge was mechanically alloyed,and the prepared alloy was used to investigate the hydrogenstorage properties. Also, we have started from a mixture of LiHand Ge in the same proportion. This mixture was also ball-milled and used for the understanding of the destabilizationpathway.
2. EXPERIMENTAL SECTIONLiH−Ge and Li−Ge mixture/alloy were prepared using FritschP7 ball milling apparatus started from LiH (95%, SigmaAldrich), Ge (99.999%, Sigma Aldrich), and Li (≥99%, SigmaAldrich) with a 4.4:1 molar ratio for both systems. The millingwas performed at 370 rpm for 2 h with 30 min rest after 1 hunder 0.1 MPa Ar atmosphere using 20 balls (SUJ-2, 7 mm indiameter). All of the handling of materials was done in a highpurity Ar (99.9999%) filled glovebox (Miwa MFG, MP-P60W).The structural characterization was made by powder X-raydiffraction technique (Rigaku, RINT-2100) using Cu Kαradiation. To avoid direct interaction with air and moisture,the XRD sample was covered by polimide sheet (Kapton,Dupont−Toray Co. Ltd.). In addition to XRD, transmissionelectron microscopy (TEM) observation was taken out forbetter understanding of the reaction mechanism using 200 kVTEM (JEOL JEM-2010). The sample was dispersed on a MoTEM grid, and then transferred into a TEM chamber. Plasticbag method19 was used to protect the sample from oxidation.To investigate the thermal behavior of the mixture/alloy,differential scanning calorimetry (TA Instruments, Q10PDSC)was used under 0.15 MPa Ar flow and 3.0 MPa H2 pressurewith a heating rate of 5 °C/min up to 500 °C. Thehydrogenation of Li−Ge sample was carried out by twomethods: (1) Fill 3.0 MPa H2 in the sample holder and thenheat the sample to 400 °C at a heating rate of 10 °C/min andkeep it for 8 h; and (2) heat the sample first to 400 °C at aheating rate 10 °C/min under vacuum and then introduce 3.0
MPa hydrogen into the sample holder and keep it for 8 h. Thehydrogen desorption properties of the above hydrogenatedsamples and LiH−Ge system were measured using a combinedTG, DTA (Rigaku, TG 8120), and TDMS (Anelva, M-QA 200TS) system installed inside an Ar-filled glovebox. Themeasurements were performed in the temperature range fromroom temperature to 500 °C at a heating rate of 5 °C/minunder He flow. PCIs were measured using Sievert typeapparatus (Suzuki Shokan Co. Ltd.) in pressure and temper-ature ranges of 0.0001−3.0 MPa and 400−500 °C.
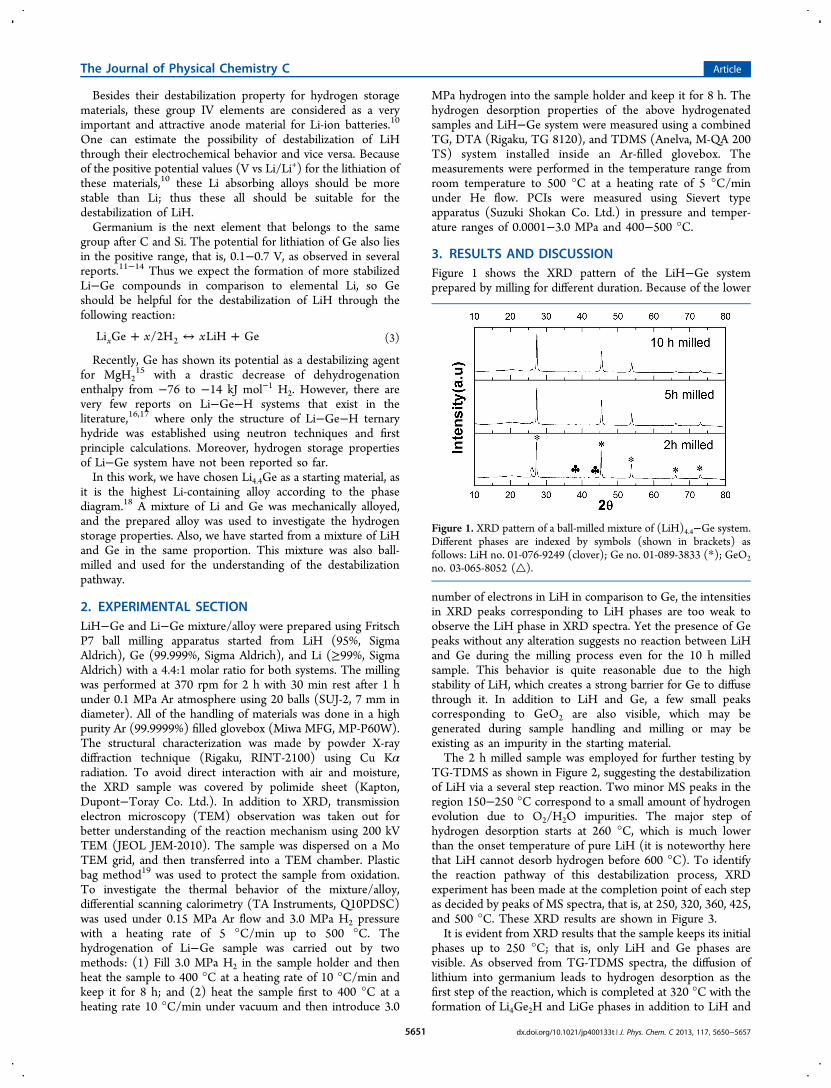
3. RESULTS AND DISCUSSIONFigure 1 shows the XRD pattern of the LiH−Ge systemprepared by milling for different duration. Because of the lower
number of electrons in LiH in comparison to Ge, the intensitiesin XRD peaks corresponding to LiH phases are too weak toobserve the LiH phase in XRD spectra. Yet the presence of Gepeaks without any alteration suggests no reaction between LiHand Ge during the milling process even for the 10 h milledsample. This behavior is quite reasonable due to the highstability of LiH, which creates a strong barrier for Ge to diffusethrough it. In addition to LiH and Ge, a few small peakscorresponding to GeO2 are also visible, which may begenerated during sample handling and milling or may beexisting as an impurity in the starting material.The 2 h milled sample was employed for further testing by
TG-TDMS as shown in Figure 2, suggesting the destabilizationof LiH via a several step reaction. Two minor MS peaks in theregion 150−250 °C correspond to a small amount of hydrogenevolution due to O2/H2O impurities. The major step ofhydrogen desorption starts at 260 °C, which is much lowerthan the onset temperature of pure LiH (it is noteworthy herethat LiH cannot desorb hydrogen before 600 °C). To identifythe reaction pathway of this destabilization process, XRDexperiment has been made at the completion point of each stepas decided by peaks of MS spectra, that is, at 250, 320, 360, 425,and 500 °C. These XRD results are shown in Figure 3.It is evident from XRD results that the sample keeps its initial
phases up to 250 °C; that is, only LiH and Ge phases arevisible. As observed from TG-TDMS spectra, the diffusion oflithium into germanium leads to hydrogen desorption as thefirst step of the reaction, which is completed at 320 °C with theformation of Li4Ge2H and LiGe phases in addition to LiH and
Figure 1. XRD pattern of a ball-milled mixture of (LiH)4.4−Ge system.Different phases are indexed by symbols (shown in brackets) asfollows: LiH no. 01-076-9249 (clover); Ge no. 01-089-3833 (*); GeO2no. 03-065-8052 (△).
The Journal of Physical Chemistry C Article
dx.doi.org/10.1021/jp400133t | J. Phys. Chem. C 2013, 117, 5650−56575651
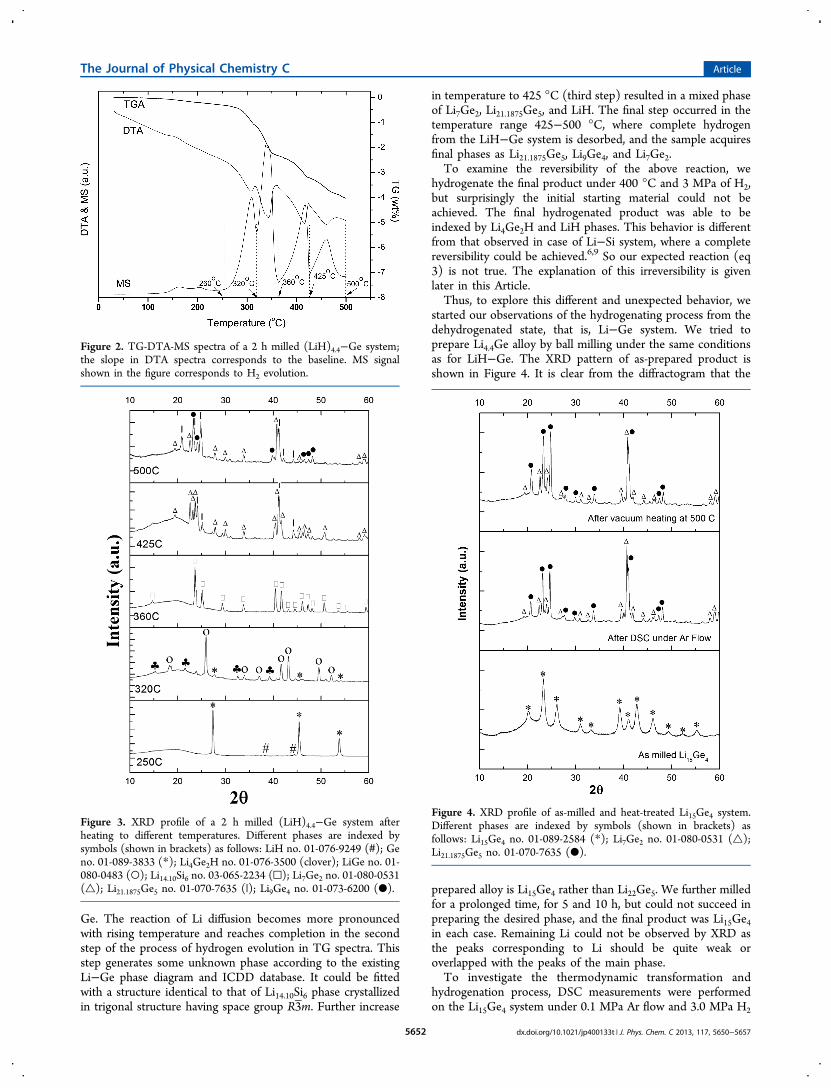
Ge. The reaction of Li diffusion becomes more pronouncedwith rising temperature and reaches completion in the secondstep of the process of hydrogen evolution in TG spectra. Thisstep generates some unknown phase according to the existingLi−Ge phase diagram and ICDD database. It could be fittedwith a structure identical to that of Li14.10Si6 phase crystallizedin trigonal structure having space group R3 m. Further increase
in temperature to 425 °C (third step) resulted in a mixed phaseof Li7Ge2, Li21.1875Ge5, and LiH. The final step occurred in thetemperature range 425−500 °C, where complete hydrogenfrom the LiH−Ge system is desorbed, and the sample acquiresfinal phases as Li21.1875Ge5, Li9Ge4, and Li7Ge2.To examine the reversibility of the above reaction, we
hydrogenate the final product under 400 °C and 3 MPa of H2,but surprisingly the initial starting material could not beachieved. The final hydrogenated product was able to beindexed by Li4Ge2H and LiH phases. This behavior is differentfrom that observed in case of Li−Si system, where a completereversibility could be achieved.6,9 So our expected reaction (eq3) is not true. The explanation of this irreversibility is givenlater in this Article.Thus, to explore this different and unexpected behavior, we
started our observations of the hydrogenating process from thedehydrogenated state, that is, Li−Ge system. We tried toprepare Li4.4Ge alloy by ball milling under the same conditionsas for LiH−Ge. The XRD pattern of as-prepared product isshown in Figure 4. It is clear from the diffractogram that the
prepared alloy is Li15Ge4 rather than Li22Ge5. We further milledfor a prolonged time, for 5 and 10 h, but could not succeed inpreparing the desired phase, and the final product was Li15Ge4in each case. Remaining Li could not be observed by XRD asthe peaks corresponding to Li should be quite weak oroverlapped with the peaks of the main phase.To investigate the thermodynamic transformation and
hydrogenation process, DSC measurements were performedon the Li15Ge4 system under 0.1 MPa Ar flow and 3.0 MPa H2
Figure 2. TG-DTA-MS spectra of a 2 h milled (LiH)4.4−Ge system;the slope in DTA spectra corresponds to the baseline. MS signalshown in the figure corresponds to H2 evolution.
Figure 3. XRD profile of a 2 h milled (LiH)4.4−Ge system afterheating to different temperatures. Different phases are indexed bysymbols (shown in brackets) as follows: LiH no. 01-076-9249 (#); Geno. 01-089-3833 (*); Li4Ge2H no. 01-076-3500 (clover); LiGe no. 01-080-0483 (○); Li14.10Si6 no. 03-065-2234 (□); Li7Ge2 no. 01-080-0531(△); Li21.1875Ge5 no. 01-070-7635 (|); Li9Ge4 no. 01-073-6200 (●).
Figure 4. XRD profile of as-milled and heat-treated Li15Ge4 system.Different phases are indexed by symbols (shown in brackets) asfollows: Li15Ge4 no. 01-089-2584 (*); Li7Ge2 no. 01-080-0531 (△);Li21.1875Ge5 no. 01-070-7635 (●).
The Journal of Physical Chemistry C Article
dx.doi.org/10.1021/jp400133t | J. Phys. Chem. C 2013, 117, 5650−56575652
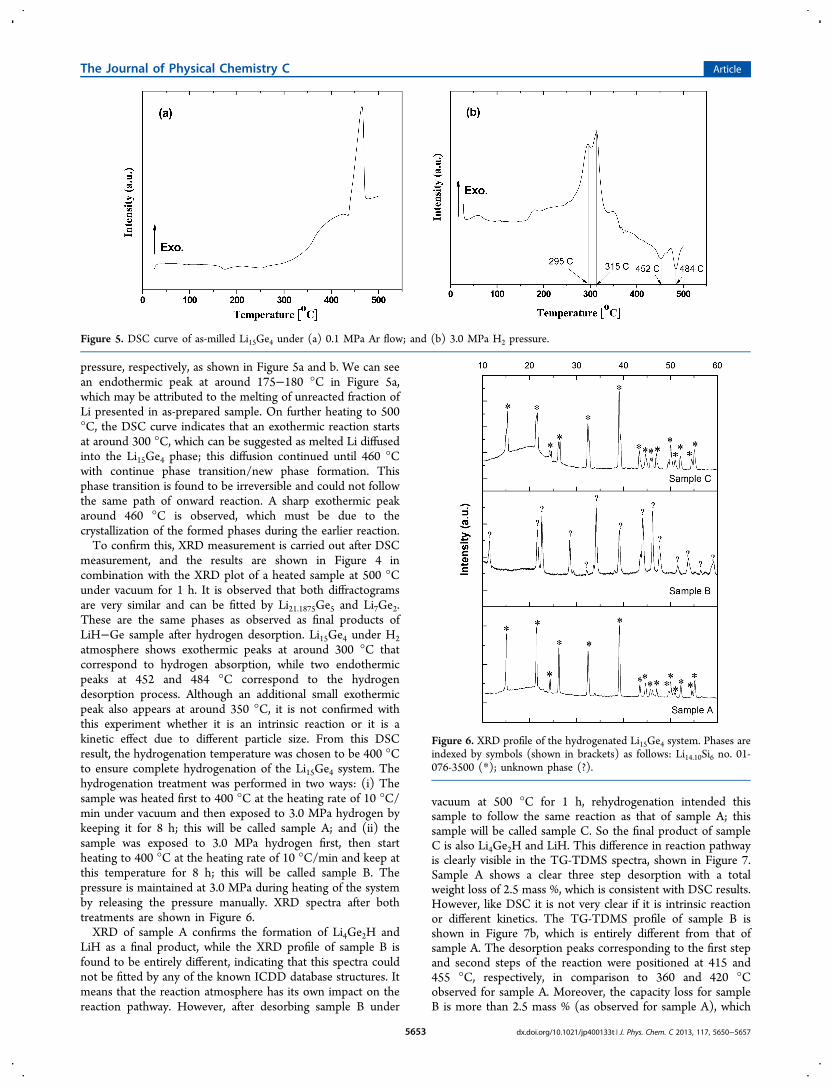
pressure, respectively, as shown in Figure 5a and b. We can seean endothermic peak at around 175−180 °C in Figure 5a,which may be attributed to the melting of unreacted fraction ofLi presented in as-prepared sample. On further heating to 500°C, the DSC curve indicates that an exothermic reaction startsat around 300 °C, which can be suggested as melted Li diffusedinto the Li15Ge4 phase; this diffusion continued until 460 °Cwith continue phase transition/new phase formation. Thisphase transition is found to be irreversible and could not followthe same path of onward reaction. A sharp exothermic peakaround 460 °C is observed, which must be due to thecrystallization of the formed phases during the earlier reaction.To confirm this, XRD measurement is carried out after DSC
measurement, and the results are shown in Figure 4 incombination with the XRD plot of a heated sample at 500 °Cunder vacuum for 1 h. It is observed that both diffractogramsare very similar and can be fitted by Li21.1875Ge5 and Li7Ge2.These are the same phases as observed as final products ofLiH−Ge sample after hydrogen desorption. Li15Ge4 under H2atmosphere shows exothermic peaks at around 300 °C thatcorrespond to hydrogen absorption, while two endothermicpeaks at 452 and 484 °C correspond to the hydrogendesorption process. Although an additional small exothermicpeak also appears at around 350 °C, it is not confirmed withthis experiment whether it is an intrinsic reaction or it is akinetic effect due to different particle size. From this DSCresult, the hydrogenation temperature was chosen to be 400 °Cto ensure complete hydrogenation of the Li15Ge4 system. Thehydrogenation treatment was performed in two ways: (i) Thesample was heated first to 400 °C at the heating rate of 10 °C/min under vacuum and then exposed to 3.0 MPa hydrogen bykeeping it for 8 h; this will be called sample A; and (ii) thesample was exposed to 3.0 MPa hydrogen first, then startheating to 400 °C at the heating rate of 10 °C/min and keep atthis temperature for 8 h; this will be called sample B. Thepressure is maintained at 3.0 MPa during heating of the systemby releasing the pressure manually. XRD spectra after bothtreatments are shown in Figure 6.XRD of sample A confirms the formation of Li4Ge2H and
LiH as a final product, while the XRD profile of sample B isfound to be entirely different, indicating that this spectra couldnot be fitted by any of the known ICDD database structures. Itmeans that the reaction atmosphere has its own impact on thereaction pathway. However, after desorbing sample B under
vacuum at 500 °C for 1 h, rehydrogenation intended thissample to follow the same reaction as that of sample A; thissample will be called sample C. So the final product of sampleC is also Li4Ge2H and LiH. This difference in reaction pathwayis clearly visible in the TG-TDMS spectra, shown in Figure 7.Sample A shows a clear three step desorption with a totalweight loss of 2.5 mass %, which is consistent with DSC results.However, like DSC it is not very clear if it is intrinsic reactionor different kinetics. The TG-TDMS profile of sample B isshown in Figure 7b, which is entirely different from that ofsample A. The desorption peaks corresponding to the first stepand second steps of the reaction were positioned at 415 and455 °C, respectively, in comparison to 360 and 420 °Cobserved for sample A. Moreover, the capacity loss for sampleB is more than 2.5 mass % (as observed for sample A), which
Figure 5. DSC curve of as-milled Li15Ge4 under (a) 0.1 MPa Ar flow; and (b) 3.0 MPa H2 pressure.
Figure 6. XRD profile of the hydrogenated Li15Ge4 system. Phases areindexed by symbols (shown in brackets) as follows: Li14.10Si6 no. 01-076-3500 (*); unknown phase (?).
The Journal of Physical Chemistry C Article
dx.doi.org/10.1021/jp400133t | J. Phys. Chem. C 2013, 117, 5650−56575653
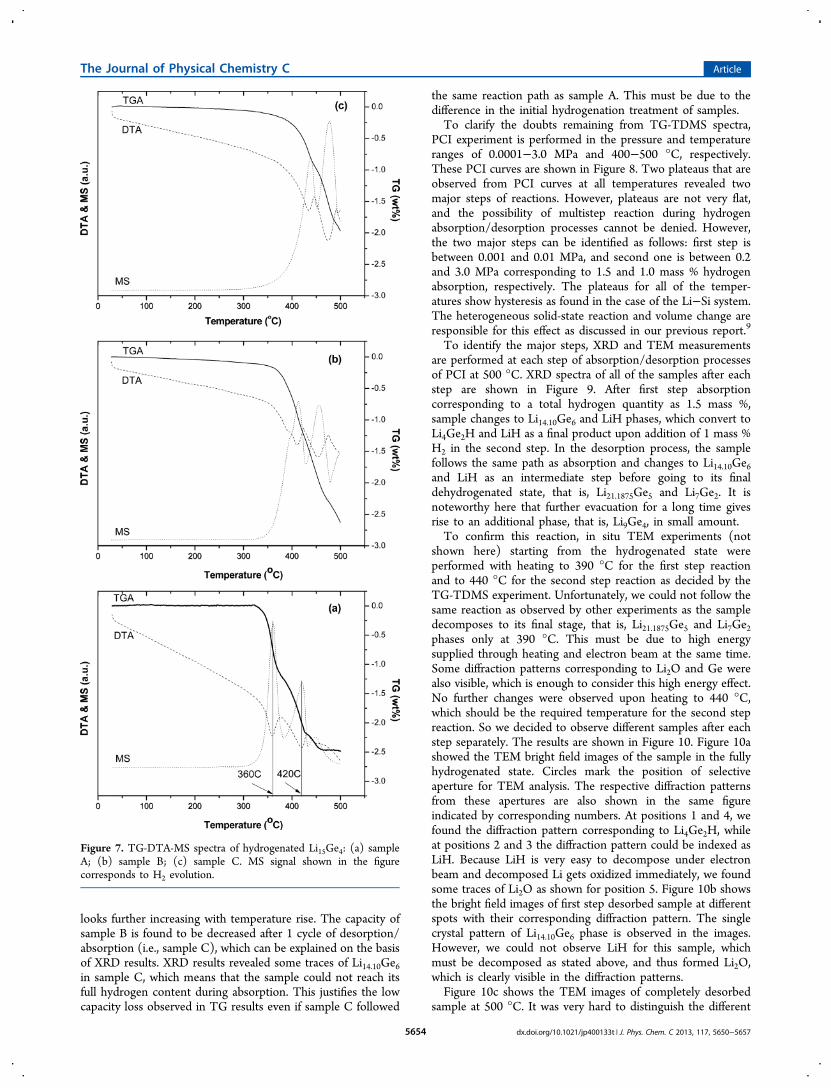
looks further increasing with temperature rise. The capacity ofsample B is found to be decreased after 1 cycle of desorption/absorption (i.e., sample C), which can be explained on the basisof XRD results. XRD results revealed some traces of Li14.10Ge6in sample C, which means that the sample could not reach itsfull hydrogen content during absorption. This justifies the lowcapacity loss observed in TG results even if sample C followed
the same reaction path as sample A. This must be due to thedifference in the initial hydrogenation treatment of samples.To clarify the doubts remaining from TG-TDMS spectra,
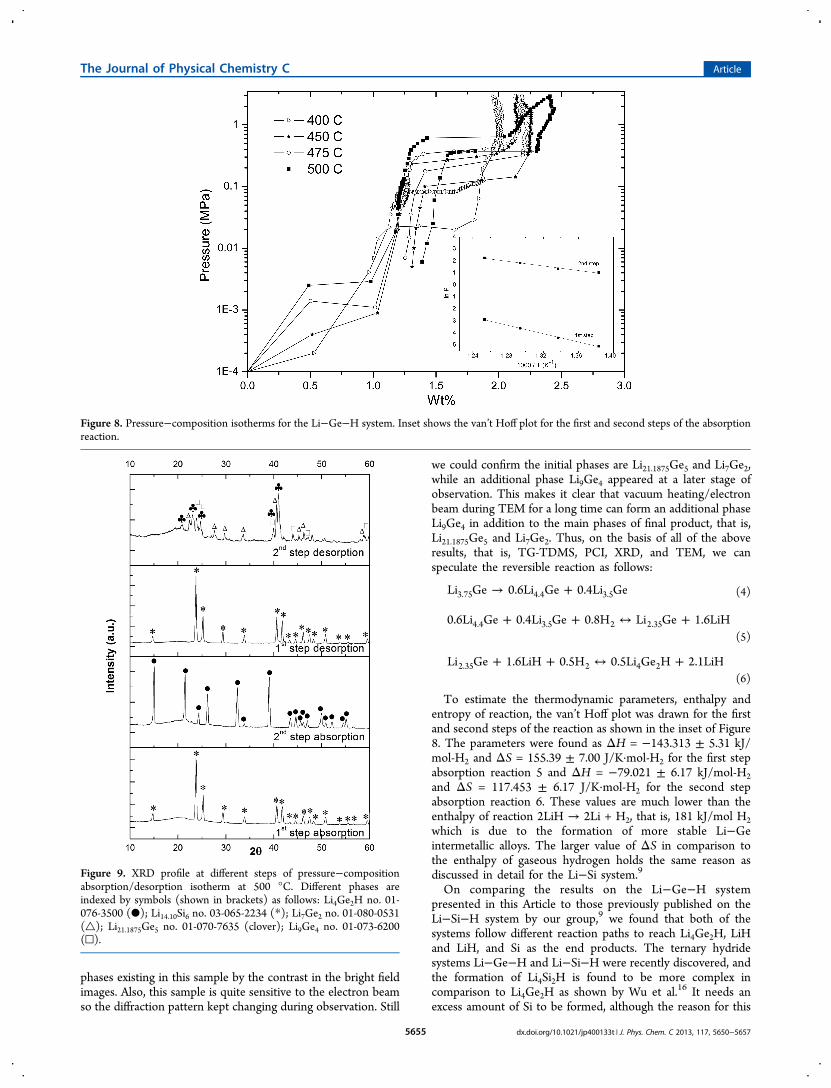
PCI experiment is performed in the pressure and temperatureranges of 0.0001−3.0 MPa and 400−500 °C, respectively.These PCI curves are shown in Figure 8. Two plateaus that areobserved from PCI curves at all temperatures revealed twomajor steps of reactions. However, plateaus are not very flat,and the possibility of multistep reaction during hydrogenabsorption/desorption processes cannot be denied. However,the two major steps can be identified as follows: first step isbetween 0.001 and 0.01 MPa, and second one is between 0.2and 3.0 MPa corresponding to 1.5 and 1.0 mass % hydrogenabsorption, respectively. The plateaus for all of the temper-atures show hysteresis as found in the case of the Li−Si system.The heterogeneous solid-state reaction and volume change areresponsible for this effect as discussed in our previous report.9
To identify the major steps, XRD and TEM measurementsare performed at each step of absorption/desorption processesof PCI at 500 °C. XRD spectra of all of the samples after eachstep are shown in Figure 9. After first step absorptioncorresponding to a total hydrogen quantity as 1.5 mass %,sample changes to Li14.10Ge6 and LiH phases, which convert toLi4Ge2H and LiH as a final product upon addition of 1 mass %H2 in the second step. In the desorption process, the samplefollows the same path as absorption and changes to Li14.10Ge6and LiH as an intermediate step before going to its finaldehydrogenated state, that is, Li21.1875Ge5 and Li7Ge2. It isnoteworthy here that further evacuation for a long time givesrise to an additional phase, that is, Li9Ge4, in small amount.To confirm this reaction, in situ TEM experiments (not
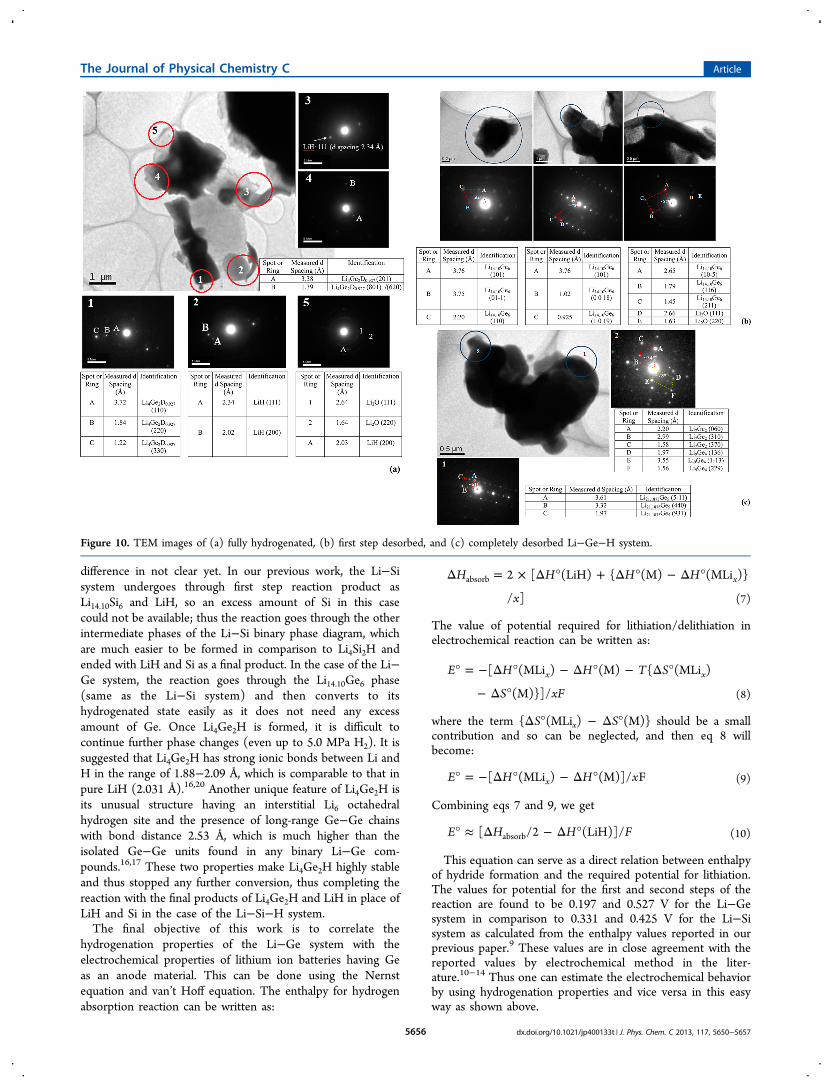
shown here) starting from the hydrogenated state wereperformed with heating to 390 °C for the first step reactionand to 440 °C for the second step reaction as decided by theTG-TDMS experiment. Unfortunately, we could not follow thesame reaction as observed by other experiments as the sampledecomposes to its final stage, that is, Li21.1875Ge5 and Li7Ge2phases only at 390 °C. This must be due to high energysupplied through heating and electron beam at the same time.Some diffraction patterns corresponding to Li2O and Ge werealso visible, which is enough to consider this high energy effect.No further changes were observed upon heating to 440 °C,which should be the required temperature for the second stepreaction. So we decided to observe different samples after eachstep separately. The results are shown in Figure 10. Figure 10ashowed the TEM bright field images of the sample in the fullyhydrogenated state. Circles mark the position of selectiveaperture for TEM analysis. The respective diffraction patternsfrom these apertures are also shown in the same figureindicated by corresponding numbers. At positions 1 and 4, wefound the diffraction pattern corresponding to Li4Ge2H, whileat positions 2 and 3 the diffraction pattern could be indexed asLiH. Because LiH is very easy to decompose under electronbeam and decomposed Li gets oxidized immediately, we foundsome traces of Li2O as shown for position 5. Figure 10b showsthe bright field images of first step desorbed sample at differentspots with their corresponding diffraction pattern. The singlecrystal pattern of Li14.10Ge6 phase is observed in the images.However, we could not observe LiH for this sample, whichmust be decomposed as stated above, and thus formed Li2O,which is clearly visible in the diffraction patterns.Figure 10c shows the TEM images of completely desorbed
sample at 500 °C. It was very hard to distinguish the different
Figure 7. TG-DTA-MS spectra of hydrogenated Li15Ge4: (a) sampleA; (b) sample B; (c) sample C. MS signal shown in the figurecorresponds to H2 evolution.
The Journal of Physical Chemistry C Article
dx.doi.org/10.1021/jp400133t | J. Phys. Chem. C 2013, 117, 5650−56575654
phases existing in this sample by the contrast in the bright fieldimages. Also, this sample is quite sensitive to the electron beamso the diffraction pattern kept changing during observation. Still
we could confirm the initial phases are Li21.1875Ge5 and Li7Ge2,while an additional phase Li9Ge4 appeared at a later stage ofobservation. This makes it clear that vacuum heating/electronbeam during TEM for a long time can form an additional phaseLi9Ge4 in addition to the main phases of final product, that is,Li21.1875Ge5 and Li7Ge2. Thus, on the basis of all of the aboveresults, that is, TG-TDMS, PCI, XRD, and TEM, we canspeculate the reversible reaction as follows:
→ +Li Ge 0.6Li Ge 0.4Li Ge3.75 4.4 3.5 (4)
+ + ↔ +0.6Li Ge 0.4Li Ge 0.8H Li Ge 1.6LiH4.4 3.5 2 2.35(5)
+ + ↔ +Li Ge 1.6LiH 0.5H 0.5Li Ge H 2.1LiH2.35 2 4 2(6)
To estimate the thermodynamic parameters, enthalpy andentropy of reaction, the van’t Hoff plot was drawn for the firstand second steps of the reaction as shown in the inset of Figure8. The parameters were found as ΔH = −143.313 ± 5.31 kJ/mol-H2 and ΔS = 155.39 ± 7.00 J/K·mol-H2 for the first stepabsorption reaction 5 and ΔH = −79.021 ± 6.17 kJ/mol-H2and ΔS = 117.453 ± 6.17 J/K·mol-H2 for the second stepabsorption reaction 6. These values are much lower than theenthalpy of reaction 2LiH → 2Li + H2, that is, 181 kJ/mol H2which is due to the formation of more stable Li−Geintermetallic alloys. The larger value of ΔS in comparison tothe enthalpy of gaseous hydrogen holds the same reason asdiscussed in detail for the Li−Si system.9On comparing the results on the Li−Ge−H system
presented in this Article to those previously published on theLi−Si−H system by our group,9 we found that both of thesystems follow different reaction paths to reach Li4Ge2H, LiHand LiH, and Si as the end products. The ternary hydridesystems Li−Ge−H and Li−Si−H were recently discovered, andthe formation of Li4Si2H is found to be more complex incomparison to Li4Ge2H as shown by Wu et al.16 It needs anexcess amount of Si to be formed, although the reason for this
Figure 8. Pressure−composition isotherms for the Li−Ge−H system. Inset shows the van’t Hoff plot for the first and second steps of the absorptionreaction.
Figure 9. XRD profile at different steps of pressure−compositionabsorption/desorption isotherm at 500 °C. Different phases areindexed by symbols (shown in brackets) as follows: Li4Ge2H no. 01-076-3500 (●); Li14.10Si6 no. 03-065-2234 (*); Li7Ge2 no. 01-080-0531(△); Li21.1875Ge5 no. 01-070-7635 (clover); Li9Ge4 no. 01-073-6200(□).
The Journal of Physical Chemistry C Article
dx.doi.org/10.1021/jp400133t | J. Phys. Chem. C 2013, 117, 5650−56575655
difference in not clear yet. In our previous work, the Li−Sisystem undergoes through first step reaction product asLi14.10Si6 and LiH, so an excess amount of Si in this casecould not be available; thus the reaction goes through the otherintermediate phases of the Li−Si binary phase diagram, whichare much easier to be formed in comparison to Li4Si2H andended with LiH and Si as a final product. In the case of the Li−Ge system, the reaction goes through the Li14.10Ge6 phase(same as the Li−Si system) and then converts to itshydrogenated state easily as it does not need any excessamount of Ge. Once Li4Ge2H is formed, it is difficult tocontinue further phase changes (even up to 5.0 MPa H2). It issuggested that Li4Ge2H has strong ionic bonds between Li andH in the range of 1.88−2.09 Å, which is comparable to that inpure LiH (2.031 Å).16,20 Another unique feature of Li4Ge2H isits unusual structure having an interstitial Li6 octahedralhydrogen site and the presence of long-range Ge−Ge chainswith bond distance 2.53 Å, which is much higher than theisolated Ge−Ge units found in any binary Li−Ge com-pounds.16,17 These two properties make Li4Ge2H highly stableand thus stopped any further conversion, thus completing thereaction with the final products of Li4Ge2H and LiH in place ofLiH and Si in the case of the Li−Si−H system.The final objective of this work is to correlate the
hydrogenation properties of the Li−Ge system with theelectrochemical properties of lithium ion batteries having Geas an anode material. This can be done using the Nernstequation and van’t Hoff equation. The enthalpy for hydrogenabsorption reaction can be written as:
Δ = × Δ ° + Δ ° − Δ °H H H H
x
2 [ (LiH) { (M) (MLi )}
/ ]xabsorb
(7)
The value of potential required for lithiation/delithiation inelectrochemical reaction can be written as:
° = − Δ ° − Δ ° − Δ °
− Δ °
E H H T S
S xF
[ (MLi ) (M) { (MLi )
(M)}]/x x
(8)
where the term {ΔS°(MLix) − ΔS°(M)} should be a smallcontribution and so can be neglected, and then eq 8 willbecome:
° = − Δ ° − Δ °E H H x[ (MLi ) (M)]/ Fx (9)
Combining eqs 7 and 9, we get
° ≈ Δ − Δ °E H H F[ /2 (LiH)]/absorb (10)
This equation can serve as a direct relation between enthalpyof hydride formation and the required potential for lithiation.The values for potential for the first and second steps of thereaction are found to be 0.197 and 0.527 V for the Li−Gesystem in comparison to 0.331 and 0.425 V for the Li−Sisystem as calculated from the enthalpy values reported in ourprevious paper.9 These values are in close agreement with thereported values by electrochemical method in the liter-ature.10−14 Thus one can estimate the electrochemical behaviorby using hydrogenation properties and vice versa in this easyway as shown above.
Figure 10. TEM images of (a) fully hydrogenated, (b) first step desorbed, and (c) completely desorbed Li−Ge−H system.
The Journal of Physical Chemistry C Article
dx.doi.org/10.1021/jp400133t | J. Phys. Chem. C 2013, 117, 5650−56575656
4. CONCLUSIONSThe Li−Ge−H ternary system has been explored in detail interms of its structural, morphological, and thermodynamicalproperties. The hydrogenation properties of this system havealso been established with a reaction pathway systematically.Li15Ge4 phase could be formed by ball milling. After the firststep of the reaction of hydrogen absorption, an unknown phaseappeared, which does not exist in the Li−Ge phase diagram butcould be identified as an alloy having the same structure asLi14.10Si6. After completion of hydrogenation up to 3 MPapressure, the material could not be converted to LiH and Ge asobserved in the case of Si substitution, but it follows a differentpathway with concluding Li4Ge2H and LiH phases. Theenthalpies of formation for the first and second steps of thereaction are found to be 143 and 79 kJ/mol-H2, which aremuch lower than that of pure LiH (182 kJ/molH2). Thecalculated values of electrochemical voltage plateaus from H2storage properties are in good agreement with the valuesreported through the direct electrochemical method.
■ AUTHOR INFORMATIONCorresponding Author*Tel./fax: +81-(0)82-424-5744. E-mail: [email protected] (A.J.); [email protected] (T.I.).
NotesThe authors declare no competing financial interest.
■ ACKNOWLEDGMENTSThis work is partially supported by JSPS under “PostdoctoralFellowship Programme for International Researchers(P11068)” and KAKENHI (21686068) of the Grant-in-Aidfor Young Scientists (A). We gratefully acknowledge Mr. ToruKimura for his help in this work.
■ REFERENCES(1) Zuttel, A. Hydrogen storage methods. Naturwissenschaften 2004,91, 157−172.(2) Satyapal, S.; Petrovic, J.; Read, C.; Thomas, G.; Ordaz, G. TheU.S. Department of Energy’s National Hydrogen Storage Project:Progress towards meeting hydrogen-powered vehicle requirements.Catal. Today 2007, 120, 246−256.(3) Wiberg, E.; Amberger, E. Hydrides of the Elements of Main GroupsI−IV; Elsevier: Amsterdam, 1971.(4) Miwa, K.; Ohba, N.; Towata, S.; Nakamori, Y.; Orimo, S. I. First-principles study on lithium borohydride LiBH4. Phys. Rev. B 2004, 69,245120.(5) Vajo, J. J.; Olson, G. L. Hydrogen storage in destabilized chemicalsystems. Scr. Mater. 2007, 56, 829−834.(6) Vajo, J. J.; Mertens, F.; Ahn, C. C.; Bowman, R. C., Jr.; Fultz, B.Altering hydrogen storage properties by hydride destabilizationthrough alloy formation: LiH and MgH2 destabilized with Si. J. Phys.Chem. B 2004, 108, 13977−13983.(7) Reynier, Y. F.; Yazami, R.; Fultz, B. Thermodynamics of lithiumintercalation into graphites and disordered. J. Electrochem. Soc. 2004,151, A422−A426.(8) Miyaoka, H.; Ishida, W.; Ichikawa, T.; Kojima, Y. Synthesis andcharacterization of lithium−carbon compounds for hydrogen storage.J. Alloys Compd. 2011, 509, 719−723.(9) Doi, K.; Hino, S.; Miyaoka, H.; Ichikawa, T.; Kojima, Y.Hydrogen storage properties of lithium silicon alloy synthesized bymechanical alloying. J. Power Sources 2011, 196, 504−507.(10) Park, C. M.; Kim, J. H.; Kim, H.; Sohn, H. J. Li-alloy basedanode materials for Li secondary batteries. Chem. Soc. Rev. 2010, 39,3115−3141.
(11) Yoon, S.; Park, C. M.; Sohn, H. J. Electrochemical character-izations of germanium and carbon-coated germanium compositeanode for lithium-ion batteries. Electrochem. Solid-State Lett. 2008, 11,A42−A45.(12) St. John, M. R.; Furgala, A. J.; Sammells, A. F. Thermodynamicstudies of Li-Ge alloys: Application to negative electrodes for moltensalt batteries. J. Electrochem. Soc. 1982, 129, 246−250.(13) Graetz, J.; Ahn, C. C.; Yazami, R.; Fultz, B. Nanocrystalline andthin film germanium electrodes with high lithium capacity and highrate capabilities. J. Electrochem. Soc. 2004, 151, A698−A702.(14) Lee, H.; Kim, H.; Doo, S. G.; Cho, J. Synthesis and optimizationof nanoparticle Ge confined in a carbon matrix for lithium batteryanode material. J. Electrochem. Soc. 2007, 154, A343−A346.(15) Walker, G. S.; Abbas, M.; Grant, D. M.; Udeh, C. Destabilisationof magnesium hydride by germanium as a new potential multi-componenthydrogen storage system. Chem. Commun. 2011, 47,8001−-8003.(16) Wu, H.; Hartman, M. R.; Udovic, T. J.; Rush, J. J.; Zhou, W.;Bowman, R. C., Jr.; Vajo, J. J. Structure of the novel ternary hydridesLi4Tt2D (Tt = Si and Ge). Acta Crystallogr. 2007, B63, 63−68.(17) Wu, H.; Zhou, W.; Udovic, T. J.; Rush, J. J.; Yildirim, T.;Hartman, M. R.; Bowman, R. C., Jr.; Vajo, J. J. Neutron vibrationalspectroscopy and first-principles calculations of the ternary hydridesLi4Si2H(D) and Li4Ge2H(D): Electronic structure and lattice. Phys.Rev. B 2007, 76, 224301.(18) Sangster, J.; Pelton, A. D. The Ge-Li (germanium-lithium)system. J. Phase Equilib. 1997, 18, 289−294.(19) Yao, H.; Isobe, S.; Wang, Y.; Hashimoto, N.; Ohnuki, S. Plasticbag method for active sample loading into transmission electronmicroscope. J. Electron Microsc. 2011, 60, 375−378.(20) Calder, R. S.; Cochran, W.; Griffiths, D.; Lowde, R. D. An X-rayand neutron diffraction analysis of lithium hydride. J. Phys. Chem. Solids1962, 23, 621−632.
The Journal of Physical Chemistry C Article
dx.doi.org/10.1021/jp400133t | J. Phys. Chem. C 2013, 117, 5650−56575657