designing sustainable technologies, products and policies
TRANSCRIPT
Designing Sustainable Technologies, Products and Policies
Enrico Benetto Kilian GerickeMélanie Guiton Editors
From Science to Innovation

Designing Sustainable Technologies, Productsand Policies
Enrico Benetto • Kilian GerickeMélanie GuitonEditors
Designing SustainableTechnologies, Productsand PoliciesFrom Science to Innovation

EditorsEnrico BenettoDepartment ERIN—EnvironmentalResearch and Innovation
Luxembourg Institute of Scienceand Technology (LIST)
Esch-sur-AlzetteLuxembourg
Kilian GerickeDepartment of EngineeringUniversity of Luxembourg, CampusKirchberg
Kirchberg, LuxembourgLuxembourg
Mélanie GuitonDepartment ERIN—EnvironmentalResearch and Innovation
Luxembourg Institute of Scienceand Technology (LIST)
Esch-sur-AlzetteLuxembourg
ISBN 978-3-319-66980-9 ISBN 978-3-319-66981-6 (eBook)https://doi.org/10.1007/978-3-319-66981-6
Library of Congress Control Number: 2018938354
© The Editor(s) (if applicable) and The Author(s) 2018. This book is an open access publication.Open Access This book is licensed under the terms of the Creative Commons Attribution 4.0International License (http://creativecommons.org/licenses/by/4.0/), which permits use, sharing, adap-tation, distribution and reproduction in any medium or format, as long as you give appropriate credit tothe original author(s) and the source, provide a link to the Creative Commons license and indicate ifchanges were made.The images or other third party material in this book are included in the book’s Creative Commonslicense, unless indicated otherwise in a credit line to the material. If material is not included in the book’sCreative Commons license and your intended use is not permitted by statutory regulation or exceeds thepermitted use, you will need to obtain permission directly from the copyright holder.The use of general descriptive names, registered names, trademarks, service marks, etc. in this publi-cation does not imply, even in the absence of a specific statement, that such names are exempt from therelevant protective laws and regulations and therefore free for general use.The publisher, the authors and the editors are safe to assume that the advice and information in thisbook are believed to be true and accurate at the date of publication. Neither the publisher nor theauthors or the editors give a warranty, express or implied, with respect to the material contained herein orfor any errors or omissions that may have been made. The publisher remains neutral with regard tojurisdictional claims in published maps and institutional affiliations.
Printed on acid-free paper
This Springer imprint is published by the registered company Springer International Publishing AGpart of Springer NatureThe registered company address is: Gewerbestrasse 11, 6330 Cham, Switzerland
Preface
Life Cycle Management (LCM) can be considered an integrated concept and toolboxof methods and operational approaches aimed at improving the environmental,social and economic sustainability of technologies, products, services, policies andorganizations from a life cycle perspective. Businesses and policy-making organi-zations use LCM frameworks to explicitly identify, document, inform and com-municate their strategy and to chart a course from this strategy towards a moresustainable society.
The LCM conference series is the leading Life Cycle Assessment forumworldwide, bringing together 700+ LCM scholars and practitioners from 40+countries working in industry, academia and public institutions. LCM 2017 hasbeen the 8th time this conference has taken place, following the inaugural con-ference in 2001 in Copenhagen, and highly successful events in Barcelona (2005),Zurich (2007), Cape Town (2009), Berlin (2011), Gothenburg (2013) and Bordeaux(2015).
LCM 2017 was held from the 3 to 6 September 2017 at the EuropeanConvention Centre Luxembourg (ECCL) and was organized by the LuxembourgInstitute of Science and Technology (LIST), in collaboration with the University ofLuxembourg and ArcelorMittal. LCM 2017 attracted 730 international scientistsand practitioners of Life Cycle Management from 46 countries. Top-tier interna-tional companies, along with senior representatives of European institutions andnational governments, took part in the event, which featured a series of starspeakers and visionary leaders of the field, such as Bertrand Piccard and MathisWackernagel. Delegates also had the opportunity to meet with His Royal HighnessGrand Duke Henri of Luxembourg who, accompanied by his son, His RoyalHighness Prince Louis, spontaneously took part in the closing session of theconference.
LCM 2017 was thus an opportunity for the whole community of researchers whobelieve in the effectiveness of LCM to gather together, but it was more than that.With the rise of the Circular Economy as a new paradigm for market growth,several methods and certification schemes to quantify and communicate the impactsand benefits of circular systems have emerged. The LCM toolbox can indeed
v

provide a legitimate and scientifically founded, quantitative basis to steer andmonitor the transition towards a more sustainable and healthier society. The LCMcommunity must, however, confront important challenges to reach this objective, inparticular, in terms of positioning LCM on the political and business agendas,simplifying and standardizing LCM methods without oversimplifying andneglecting complexity, ensuring efficient communication and promoting innovationbased on LCM concepts and tools.
LCM 2017 was designed to tackle these challenges and offer to the LCMcommunity the opportunity to take LCM to the next level, to effectively contributeto the journey towards a safer and more sustainable society.
First, the programme of LCM 2017 was designed around new (smart) tech-nologies (and related implementation sectors) which, on the one hand, are likely todisrupt the LCM practice in the coming years (e.g. smart sensors making datacollection much easier) and, on the other hand, for which the LCM toolbox hasgreat development potential. In over more than 35 sessions, there were sessions onsmart agricultural, smart manufacturing and smart mobility systems, includingurban infrastructures and energy for the built environment, sessions specificallytargeting the role of LCM for Circular Economies and vice versa, sessions onsectors which are historically under-represented in the LCM series (like pharma-ceutical industry or textiles). New technologies such as Blockchain, BuildingInformation Management (BIM), Nature-based Solutions for Cities, and ArtificialIntelligence were discussed. The focus on bridging the gap between science andinnovation was also pursued in the exhibition area, where companies have show-case technologies developed using the LCM toolbox.
Second, communication (BtoB and BtoC) is historically an improvement leverfor our community. The LCM toolbox is often considered by policy-makers andbusiness leaders too difficult, complex and expensive to understand, implement andcommunicate. Indeed, this is certainly one of the reasons why other approaches,simpler albeit sometimes less rigorous scientifically speaking, could have a muchstronger impact on business than LCM.
LCM 2017 included a number of sessions focusing on current standardizationapproaches, LCM guidelines and best practices as well as on the visualization andinterpretation of LCM results.
Finally, from our perspective, it is very important for the LCM community tobridge the gap with other scientific and business communities, pursuing similarobjectives, often in a complementary way. This combination can bring highervisibility to policy to the LCM toolbox and to other influential institutions and thusavoid the risk of being considered the result of a niche community of users andacademics. With this objective in mind, a number of transversal sessions were run,such as a discussion panel devoted to the funding of LCM and Circular Economies,thanks to the involvement of the European Investment Bank.
This book is a selection of the most relevant contributions to the LCM 2017together with a resume of the discussion and outcomes from each session.
vi Preface
I would like to thank my co-chairs, Kilian Gericke (University of Luxembourg)and Jan Bollen (ArcelorMittal), for their support in shaping the programme of theconference and the members of the organizing committee, whose tireless work hasmade LCM 2017 happen: Mélanie Guiton, Marylène Martin, Céline Goncalves,Tomás Navarrete Gutierrez and Lugdivine Unfer. The Event and Communicationdepartments of LIST and Uni.lu are also gratefully acknowledged for their supportin the communication and dissemination actions.
A large conference such as LCM 2017 would never have been possible withoutthe financial help of external institutions. I am very grateful to the LuxembourgNational Research Fund (FNR), the Luxembourg Ministry of the Economy and theEuropean Investment Bank for their invaluable support. I would also like toacknowledge the extraordinary level of financial funding from private companies:Evonik Nutrition & Care GmbH, PRé Consultants B.V., Thinkstep AG andKronospan Luxembourg S.A. (Platinum Sponsors); BASF SE, Ipoint SystemsGmbH and Quantis International (Gold Sponsors); Delphi Automotive SystemsLuxembourg, Plastics Europe, Nestlé S.A., Steelcase Werndl AG and Tarkett GDLS.A. (Silver Sponsors). The sponsors contributed to shape an attractive programmeof keynote lectures and discussion panels in a fair and constructive atmosphere, toadd valuable content to the conference programme.
We acknowledge the partnership with the Luxembourg Chamber of Commercefor the b2fair matchmaking event, a new feature introduced to the LCM conferenceseries to facilitate networking among participants.
Finally, I would like to thank all the abstract and session contributors, chairs andreviewers, exhibitors and delegates. It is your commitment and interest that made itall happen.
Esch-sur-Alzette, Luxembourg Enrico BenettoChair LCM 2017
Preface vii

Contents
Part I LCM, Circular Economy and Product Value Chain
Life Cycle Management Approaches to Support CircularEconomy . . . . . . . . . . . . . . . . . . . . . . . . . . . . . . . . . . . . . . . . . . . . . . . . 3Sébastien Zinck, Anne-Christine Ayed, Monia Niero, Megann Head,Friedrich-W. Wellmer, Roland W. Scholz and Stéphane Morel
Sustainability Performance Evaluation for Selecting the BestRecycling Pathway During Its Design Phase . . . . . . . . . . . . . . . . . . . . . 11Guilhem Grimaud, Nicolas Perry and Bertrand Laratte
A Synthesis of Optimization Approaches for LCA-IntegratedIndustrial Process Modeling: Application to Potable WaterProduction Plants . . . . . . . . . . . . . . . . . . . . . . . . . . . . . . . . . . . . . . . . . . 21Florin Capitanescu, Antonino Marvuglia and Enrico Benetto
A Bi-dimensional Assessment to Measure the Performance of CircularEconomy: A Case Study of Tires End-of-Life Management . . . . . . . . . . 33Geoffrey Lonca, Romain Muggéo, Hugue Tétreault-Imbeault,Sophie Bernard and Manuele Margni
Bio-based Materials Within the Circular Economy: Opportunitiesand Challenges . . . . . . . . . . . . . . . . . . . . . . . . . . . . . . . . . . . . . . . . . . . . 43Birgit Brunklaus and Ellen Riise
Bio-Economy Contribution to Circular Economy . . . . . . . . . . . . . . . . . . 49Sara Corrado and Serenella Sala
Life Cycle Management and Circular Economy Challenges for theTextile Sector: Session Wrap Up . . . . . . . . . . . . . . . . . . . . . . . . . . . . . . 61Keith James and Julian Lings
Life Cycle Assessment of Organic, BCI and Conventional Cotton:A Comparative Study of Cotton Cultivation Practices in India . . . . . . . 67Pragnesh Shah, Abhishek Bansal and Rajesh Kumar Singh
ix

Life Cycle Management in the Pharmaceutical Industry Using anApplicable and Robust LCA-Based Environmental SustainabilityAssessment Approach . . . . . . . . . . . . . . . . . . . . . . . . . . . . . . . . . . . . . . . 79Yasmine Emara, Marc-William Siegert, Annekatrin Lehmannand Matthias Finkbeiner
Establishing LCA in the Healthcare Sector . . . . . . . . . . . . . . . . . . . . . . 89Nanja Hedal Kløverpris
Improving the Life Cycle Performance of Chemical Products andMaterials Through Data Exchange Along the Value Chain—Synthesisof LCM2017 Session Presentations . . . . . . . . . . . . . . . . . . . . . . . . . . . . . 95Guido Sonnemann and Carmen Alvarado
Biomass Balance: An Innovative and Complementary Methodfor Using Biomass as Feedstock in the Chemical Industry . . . . . . . . . . . 101Christian Krüger, Andreas Kicherer, Claudius Kormannand Nikolaus Raupp
Greening Agri-food Value Chains in Emerging Economies . . . . . . . . . . 109Matthias Stucki and Anél Blignaut
Assessment of Cleantech Options to Mitigate the EnvironmentalImpact of South African Dairy Farming . . . . . . . . . . . . . . . . . . . . . . . . 115Regula Keller, Lea Eymann, Sarah Wettstein, Deborah Scharfyand Matthias Stucki
Food Waste Management (Sector) in a Circular Economy . . . . . . . . . . . 127Nicole Unger and Francesco Razza
The Role of Compost in Bio-waste Management and CircularEconomy . . . . . . . . . . . . . . . . . . . . . . . . . . . . . . . . . . . . . . . . . . . . . . . . 133Francesco Razza, Lorenzo D’Avino, Giovanni L’Abate and Luca Lazzeri
Agri-Food Waste Streams Utilization for Development of MoreSustainable Food Substitutes . . . . . . . . . . . . . . . . . . . . . . . . . . . . . . . . . 145Sergiy Smetana, Kemal Aganovic, Stefan Irmscher and Volker Heinz
Implementation and Management of Life Cycle Approaches inBusiness—Challenges, Opportunities, Business Learnings andBest Practice . . . . . . . . . . . . . . . . . . . . . . . . . . . . . . . . . . . . . . . . . . . . . . 157Lena Landström and Sara Palander
Neuro-marketing Tools for Assessing the CommunicationEffectiveness of Life Cycle Based EnvironmentalLabelling—Procedure and Methodology . . . . . . . . . . . . . . . . . . . . . . . . 163Anna Lewandowska, Barbara Borusiak, Christian Dierks,Pasquale Giungato, Ewa Jerzyk, Przemyslaw Kurczewski,Jagna Sobierajewicz, Sangwon Suh and Joanna Witczak
x Contents

Part II Innovation for Sustainable Production and Urban Systems
LCM for Transport and Mobility . . . . . . . . . . . . . . . . . . . . . . . . . . . . . 177Stephan Krinke and Mara Neef
Conceptual Development of Hybrid Structures Towards Eco-EfficientVehicle Lightweighting . . . . . . . . . . . . . . . . . . . . . . . . . . . . . . . . . . . . . . 181Alexander Kaluza, Tim Fröhlich, Sebastian Kleemann, Wolfgang Walk,Christoph Herrmann, Stephan Krinke and Thomas Vietor
LCA in Strategic Decision Making for Long Term UrbanTransportation System Transformation . . . . . . . . . . . . . . . . . . . . . . . . . 193Florian Ansgar Jaeger, Katrin Müller, Cornelia Petermann and Eric Lesage
Management of Construction Waste: LCA and Complex SystemModeling . . . . . . . . . . . . . . . . . . . . . . . . . . . . . . . . . . . . . . . . . . . . . . . . 205Anne Ventura and Maxime Trocmé
Guidelines for Effective and Sustainable Recycling of Constructionand Demolition Waste . . . . . . . . . . . . . . . . . . . . . . . . . . . . . . . . . . . . . . 211Serena Giorgi, Monica Lavagna and Andrea Campioli
Environmental Assessment of Energy Related Productsand Energy Systems Across Their Life Cycle . . . . . . . . . . . . . . . . . . . . . 223N. Espinosa and Y. J. Suh
Is It Useful to Improve Modelling of Usage Scenarios to Improvethe Environmental Footprint of Energy-Using Product? . . . . . . . . . . . . 231Charlotte Heslouin, Véronique Perrot-Bernardet, Lionel Pourcheresseand Nicolas Perry
Life Cycle Management of Energy and Energy Transitions—Managing the Complexity of Todays and Future Energy Systemswith a Life Cycle Focus: Challenges and MethodologicalSolutions . . . . . . . . . . . . . . . . . . . . . . . . . . . . . . . . . . . . . . . . . . . . . . . . . 243Karin Treyer, Roberto Turconi and Alicia Boyano
Integrating Energy System Models in Life Cycle Management . . . . . . . 249Miguel F. Astudillo, Kathleen Vaillancourt, Pierre-Olivier Pineauand Ben Amor
LCM at the Urban Scale: BIM and Nature Based Solutions . . . . . . . . . 261Antonino Marvuglia, Benedetto Rugani and Germain Adell
Design-Integrated LCA Using Early BIM . . . . . . . . . . . . . . . . . . . . . . . 269Alexander Hollberg, Julia Tschetwertak, Sven Schneiderand Guillaume Habert
Contents xi

A Proposition to Extend CityGML and ADE Energy Standards forExchanging Information for LCA Simulation at Urban Scale . . . . . . . . 281Adélaïde Mailhac, Emmanuelle Cor, Marine Vesson, Elisa Rolland,Pascal Schetelat, Nicoleta Schiopu and Alexandra Lebert
Dynamic Assessment of Nature Based Solutions Through UrbanLevel LCA . . . . . . . . . . . . . . . . . . . . . . . . . . . . . . . . . . . . . . . . . . . . . . . 293Duygu Başoğlu, Emre Yöntem, Seda Yöntem, Beril Şenyurtand Özge Yılmaz
Role of Carbon Capture and Storage (CCS) or Use (CCU)on Climate Mitigation . . . . . . . . . . . . . . . . . . . . . . . . . . . . . . . . . . . . . . 307Jan Bollen
Part III Development of LCM Methods and Tools
Potentials and Limitations of Combined Life Cycle Approaches andMulti-dimensional Assessment . . . . . . . . . . . . . . . . . . . . . . . . . . . . . . . . 313Johanna Berlin and Diego Iribarren
Propagating Uncertainty in Life Cycle Sustainability Assessmentinto Decision-Making Problems: A Multiple Criteria Decision AidApproach . . . . . . . . . . . . . . . . . . . . . . . . . . . . . . . . . . . . . . . . . . . . . . . . 317Breno Barros Telles do Carmo, Manuele Margni and Pierre Baptiste
The Value of Transdisciplinary Perspectives During Transition to aBio-based Economy: The Prospect for Converting Mixed Food Wasteinto Bio-based Chemicals . . . . . . . . . . . . . . . . . . . . . . . . . . . . . . . . . . . . 327Birgit Brunklaus, Emma Rex, Johanna Berlin, Frida Røyne,Johanna Ulmanen and Graham Aid
Improving Interpretation, Presentation and Visualisationof LCA Studies for Decision Making Support . . . . . . . . . . . . . . . . . . . . 337Serenella Sala and Jessica Andreasson
Visualizing the Effects of Parameter Variability on ComparativeLCA Results . . . . . . . . . . . . . . . . . . . . . . . . . . . . . . . . . . . . . . . . . . . . . . 343Céline Alexandre, Elisabeth van Overbeke, Maxime Dupriez,Johan Lhotellier and Bernard De Caevel
Life Cycle Management in Industry—Supporting Business with LifeCycle Based Assessments . . . . . . . . . . . . . . . . . . . . . . . . . . . . . . . . . . . . 351Andreas Bednarz, Julia Beier, Thomas Grünenwald, Birgit Himmelreich,Bärbel Hundt, Florian A. Jaeger, Martin Kirchner, Stephan Krinke,Ulla Létinois, Christina Merz, Lisa Mohr, David Morris, Nikolaj Otte,Gerald Rebitzer, Peter Saling, Urs W. Schenker, Diederik Schowanek,Gerd Vollmer, Niklas von der Assen and Alain Wathelet
xii Contents
Sustainable Design of Complex Systems, Products and Serviceswith User Integration into Design . . . . . . . . . . . . . . . . . . . . . . . . . . . . . . 365Nicolas Perry and Julien Garcia
Implementation of Environmental Considerations in the InnovationProcess of Complex Systems: Groupe PSA Case Study . . . . . . . . . . . . . 371Julien Garcia, Pierre Tonnelier and Sophie Richet
Development of an Environmental Evaluation Tool in the TransportSector and Its Impact on Decision-Making in the Early Stages ofDesign . . . . . . . . . . . . . . . . . . . . . . . . . . . . . . . . . . . . . . . . . . . . . . . . . . 381Sergio A. Brambila-Macias, Lisbeth Dahllöf, Karin Erikssonand Tomohiko Sakao
Discussion Panel—Assessment of Externalities: Monetisationand Social LCA . . . . . . . . . . . . . . . . . . . . . . . . . . . . . . . . . . . . . . . . . . . 391Stéphane Morel, Marzia Traverso and Philipp Preiss
Applying LCA to Estimate Development Energy Needs: The Casesof India and Brazil . . . . . . . . . . . . . . . . . . . . . . . . . . . . . . . . . . . . . . . . . 397Narasimha D. Rao, Alessio Mastrucci and Jihoon Min
Integrating the Concept of Planetary Boundaries into DecisionMaking Processes . . . . . . . . . . . . . . . . . . . . . . . . . . . . . . . . . . . . . . . . . . 407Marcial Vargas-Gonzalez
Exploring the Linkages Between the Environmental SustainableDevelopment Goals and Planetary Boundaries Using the DPSIRImpact Pathway Framework . . . . . . . . . . . . . . . . . . . . . . . . . . . . . . . . . 413Chanjief Chandrakumar and Sarah J. McLaren
Part IV How to Develop and Sustain LCM-Based Innovations
Financing Innovation and Circular Economy . . . . . . . . . . . . . . . . . . . . . 427L. Goovaerts, C. Schempp, L. Busato, A. Smits, L. Žutelijaand R. Piechocki
Life Cycle Approaches to Sustainable Regional Development . . . . . . . . 433Fritz Balkau and Timothy Grant
Turning the Lens Around: LCA Success Stories Outside-In . . . . . . . . . 439Eric Mieras and Alain Wathelet
Integrated Product Development at Nestlé . . . . . . . . . . . . . . . . . . . . . . . 447Namy Espinoza-Orias, Karen Cooper and Sofiane Lariani
The City Performance Tool-How Cities Use LCM BasedDecision Support . . . . . . . . . . . . . . . . . . . . . . . . . . . . . . . . . . . . . . . . . . 457Jens-Christian Holst, Katrin Müller, Florian-Ansgar Jägerand Klaus Heidinger
Contents xiii

Sustainability of Bio-based Products: Linking Life Cycle Thinkingwith Standards, Certification and Labelling Schemes . . . . . . . . . . . . . . . 469Mauro Cordella and Renata Kaps
Sustainability Assessment of Blue Biotechnology Processes:Addressing Environmental, Social and Economic Dimensions . . . . . . . . 475Paula Pérez-López, Gumersindo Feijoo and María Teresa Moreira
Integrating Life Cycle Assessment and Eco-design Strategies for aSustainable Production of Bio-based Plastics . . . . . . . . . . . . . . . . . . . . . 487Venkateshwaran Venkatachalam, Sebastian Spierling, Hans-Josef Endresand Andrea Siebert-Raths
Using LCA and EPD in Public Procurement Within the ConstructionSector . . . . . . . . . . . . . . . . . . . . . . . . . . . . . . . . . . . . . . . . . . . . . . . . . . . 499Kristian Jelse and Kristof Peerens
Green Public Procurement and Construction Sector: EPD and LCABased Benchmarks of the Whole-Building . . . . . . . . . . . . . . . . . . . . . . . 503Sara Ganassali, Monica Lavagna, Andrea Campioliand Sergio Saporetti
Special Session on Product Environmental Footprint . . . . . . . . . . . . . . . 515Mélanie Guiton and Enrico Benetto
xiv Contents

Part ILCM, Circular Economy and Product
Value Chain
Life Cycle Management Approachesto Support Circular Economy
Sébastien Zinck, Anne-Christine Ayed, Monia Niero, Megann Head,Friedrich-W. Wellmer, Roland W. Scholz and Stéphane Morel
Abstract This article summarizes the panel session “Life Cycle Managementapproaches to support Circular Economy” of the 8th International Conference onLife Cycle Management (LCM2017 conference, Luxembourg). Four panellistswere invited to share their point of view on this topic. Each of them brought adifferent perspective, addressing the topic from both the academic and industrialpoint of view; focusing on a raw materials aspect or considering a life cycle (oreco-design) related scope; in the context of a certification process (for products oractivities) or of an eco-innovation process (including new business models forcircular economy). After short presentation by each of the panellists, the discussionespecially addressed the complementarity between several LCM concepts to beconsidered jointly when developing circular concepts and models.
S. Zinck (&)Environmental Research and Innovation, Life Cycle Sustainabilityand Risk Assessment, Luxembourg Institute of Science and Technology,4422 Belvaux, Luxembourge-mail: [email protected]
A.-C. AyedTarkett, R&I Centre, Z.A. Salzbaach, 9559 Wiltz, Luxembourg
M. NieroDivision for Quantitative Sustainability Assessment, Technical Universityof Denmark, DTU Management Engineering, 2800 Kongens Lyngby, Denmark
M. HeadSteelcase Inc., Global Sustainability, 901 44th St. SE, Grand Rapids MI, USA
F.-W. WellmerFederal German Institute of Geosciences and Natural Resources (BGR),Neue Sachlichkeit 32, 30655 Hannover, Germany
R. W. ScholzNatural and Social Science Interface, Swiss Federal Institute of Technology,Zurich, Switzerland
S. MorelRenault, Technocentre, 1, Avenue du Golf, 78280 Guyancourt, France
© The Author(s) 2018E. Benetto et al. (eds.), Designing Sustainable Technologies,Products and Policies, https://doi.org/10.1007/978-3-319-66981-6_1
3
1 Introduction
Circular Economy (CE) is a concept that has gained some significant traction forsome years, both on the policy and the industrial levels. It helps further structureSustainability strategies and initiatives. And it can be described as an organizationalprinciple which aims at evolving from the current linear economic model—whereresources are extracted, manufactured, consumed and wasted—to an economicmodel which values resource efficiency, not only from a today’s perspective, atevery stage of the value chain and enables the biodiversity protection, as well as adevelopment suitable for the well-being of individuals.
From the definition of a CE strategy to the implementation of action plans, aswell as for the development of new business models in this field, processes, indi-cators and tools are necessary to support decision-making [1]. Life CycleManagement (LCM) approaches and expertise are thus suitable to ensure theSustainability performance of decision-making. In this discussion panel session, 4speakers from companies and academia presented some examples of LCMapproaches (e.g. environmental impact assessment methods, eco-design, recycling,etc.), but also collaborative tools, in support of CE strategy definition andimplementation.
2 A Decision Support Framework for Circular EconomyImplementation in the Packaging Sector
Monia Niero (Technical University of Denmark) presented a decision supportframework for the development of continuous loop packaging systems, whichbuilds on the combined use of Life Cycle Assessment (LCA) and the Cradle toCradle® (C2C) certification program [2]. The C2C design framework [3] inspiredthe creation in January 2014 of the Carlsberg Circular Community, i.e. a cooper-ation platform involving Carlsberg and a selection of global partners with theambition to develop packaging products that are optimized for recycling and reuse,while retaining their quality and value [4]. As a first step of the framework, theenvironmentally optimal beverage packaging life cycle scenario is identified, bothin terms of defined use and reuse. Second, the limiting factors for the continuoususe of materials in multiple loops are identified considering the two requirements inthe C2C certification process that address the material level (i.e. “material health”and “material reutilization” criteria) and the “renewable energy” criterion [5]. Then,alternative scenarios are built to meet C2C certification criteria, and LCA is used toquantify the environmental impacts of the resulting improvement strategies, forexample, change in material composition, in order to guide the identification of theoptimal scenario from an eco-efficiency point of view. Finally, the business per-spective is addressed by assessing the potential for a green value network businessmodel for a closed-loop supply [6]. The outcome is a list of prioritized actions
4 S. Zinck et al.
needed to implement the most eco-efficient and eco-effective strategy for the bev-erage packaging, both from an environmental and an economic point of view. Thedecision support framework was tested in the case of the aluminium cans, withmain recommendation from both the LCA [7] and C2C perspective [8] to ensure asystem that enables can-to-can recycling. Designing packaging for “zero contam-ination” and improving transparency in materials composition to assure high qualityrecycling were the main lessons learnt from the Carlsberg Circular Community [2].The suggested framework for optimization of continuous loop system can beapplied and adapted by any other company familiar with LCA and C2C certificationtools, based on eco-efficiency and eco-effectiveness approaches, respectively.
3 Leveraging an Ecodesign Foundation to EnableCircular Value Creation
Megann Head (Steelcase) presented Steelcase’s strong foundation of eco-designpractices, rooted in LCM principles. In the company, the three pillars that guideefforts to innovate, improve, and deliver on product promises include materialschemistry, life cycle thinking, and reuse/recycle. Each of these pillars are necessaryaspects of product performance as the company transitions to circular businessmodels. However, they may need to adapt, and new capabilities will need toemerge. New design sensibilities need to be utilized, expanding upon those alreadyexisting, such as design for disassembly and recycling. The new design sensibilitiescould be designing for refurbishment and remanufacturing and harvesting parts thatfeed new products. The products and services (business models) need to worktogether in a circular economy, so they both need to be developed with a systemsmind-set. The existing tools used to evaluate these product-service systems, likeLife Cycle Assessment, can be useful in initial evaluations, but do need someupdates, such as for allocation, in a circular economy.
4 Raw Materials Are Products of Our Brain—What DoesThis Mean for LCM?
For Friedrich-W. Wellmer (Federal German Institute of Geosciences and NaturalResources) and Roland W. Scholz (former chair of Natural and Social ScienceInterface, Swiss Federal Institute of Technology), raw materials are products of thebrain [9]. They are not afixed parameter or quantity. They vary according to creativity,demand and supply, and technology. This means that URR (ultimate recoverableresources) cannot be a fixed quantity, as long as economic activity and innovationscontinue. Individuals do not need raw materials as such. They need an intrinsicproperty to fulfil a function. For finding solutions for functions, individuals have three
Life Cycle Management Approaches … 5

spheres at their disposal: resources of the geosphere (natural resources), resources ofthe technosphere (atoms do not get lost) and the human ingenuity. Therefore, thedriver proposed for finding solutions in a market economy is the price. Technologyand human demand decide what of mineral resources are needed with what propertiesand to what amount. We also have to acknowledge that an increase of prices inducesan increase of reserves. Thus the concept of scarcity is relative and may have to beadjusted also from amid- and long-term perspective. Via the feedback control cycle ofmineral supply in times of shortages and price peaks, there are incentives on the supplyside to produce more functions from primary and secondary materials, and on thedemand side to use less or to substitute materials, Fig. 1 [10]. More production, lessconsumption will re-establish a market equilibrium. This feedback control cycle alsoregulates the finding of the optimum in LCM. LCAhelps to find better solutions whilethe market optimum will be determined by price incentives.
5 Collective Action to Settled New Circular EconomyBusiness Models
A recent report from AFEP (2017) pinpointed that Multi Actor Action is a lever toset up new circular economy activities. Stéphane Morel (Renault) proposal is todiscuss this statement and the potential for the life cycle community to contribute.
Fig. 1 The feedback control cycle of mineral supply [9]
6 S. Zinck et al.
The creation of a new business model needs two pillars [11]. In one hand it is anexplorative activity, on the other hand, it is a collective action. In the case ofCircular Economy Business Models, we can particularly point out the necessity toset a dialogue between stakeholders from various horizons and motivations. Inshorter recycling loops, you may introduce the notion of second hand parts andremanufacturing to customers and industrial plants. In longer loops you may designthe product in a way that improve dismantling and sorting efficiency at its end oflife. Collective action will involve all stakeholders committed in the new businessmodel construction. But they are not spontaneous and need to be managed.
One proposal to manage this dialogue is to use the Collaborative Life CycleActivities (Co-LCA) way [12] developed during the environmental footprintassessment of Renault first electric vehicle [13]. This scheme embeds three levels(Purpose, People and Action) and follow five steps: E1: Explore the topic; E2:Engage with appropriate stakeholders; E3: Elucidate the questions; E4: Evaluate thebenefits; and finally E5: Extend to other activities.
To anchor the new business model and transform it into a dominant model,Stéphane Morel underlined the need for economic actors to measure the creation ofshared value [14]. In order to proceed, four fields of benefits are proposed: 1/financial income; 2/brand improvement; 3/knowledge sharing and 4/decision andanticipation accuracy.
As a conclusion, the LCA community is well grounded in collective action tocarry comprehensive and complex studies [15]. Therefore, they are effective sup-port to facilitate the creation of circular economy businesses. As a challenge for thenext decade, though, this community shall continue to dig into data, but shall alsoopen more largely to social and management science to build the bridge from utopiato real life businesses.
6 Key Issues and Learnings from the Discussion
One of the conclusion is that LCA and C2C can be complementary approaches toaddress circular economy issues. Indeed, C2C provides a vision for continuous useof materials through the avoidance of chemicals of concern, therefore facilitatingthe valorisation of materials over biological or technical cycles, while LCA allowsto identify the intermediary milestones to be reached and provides a quantitativeassessment of environmental impacts, both required to reach the vision set throughC2C concept in a sustainable way.
It was also pointed out that one of the main challenge to overcome in the LCAfield, within the circular economy context is the quantification of the benefits fromrecycling, both in terms of substituted materials and quality of the secondarymaterial [16–20]. It was also noticed that an important contribution to solve therelated issue of multi-functionality and substitution of primary material has beenprovided by the Product Environmental Footprint (PEF) pilots initiative through thedefinition of the Circular Footprint Formula [21].
Life Cycle Management Approaches … 7
As a more general finding, the assessment of circularity through the consistentmeasurement of positive aspects/benefits of circular economy strategies on theenvironment and society is one of the major evolutions to be addressed by LCMmethodologies.
Another technical challenge for LCM tools is to bridge the gap between themeasurement of CE indicators at a micro-level (e.g. product) and at a macro-level(e.g. national policy). This would support a better translation and management oftop-down strategic initiatives into action plans (e.g. European Commission CEobjectives implementation at a company level).
Finally, it was demonstrated that considering a market incentive (i.e. economicindicator, like a price signal) is often necessary to find the optimum level ofresources consumption, when applying LCM approaches. A methodological chal-lenge would be to integrate this indicator into LCA practices.
References
1. Bertrand A, Guiton M, Zinck S, Scientific approaches and tools supporting Circular Economyconcepts, Revue Technique Luxembourgeoise, 2-2017.
2. Niero M, Hauschild MZ, Hoffmeyer SB, Olsen SI, Combining eco-efficiency andeco-effectiveness for continuous loop beverage packaging systems: learnings from theCarlsberg Circular Community. Journal of Industrial Ecology Vol. 21, No 3, 2017, pp. 742–753.
3. McDonough W, Braungart M, Cradle to cradle, New York: North Point Press, 2002.4. Carlsberg Group, Corporate Sustainability Report 2014, Growing Responsibly Together,
2015.5. Cradle to Cradle Products Innovation Institute, Cradle to Cradle Certified Product Standard
Version 3.1., 2016.6. Stewart R, Niero M, Murdock K, Olsen SI, Exploring the implementation of a circular
economy strategy: the case of a closed-loop supply of aluminum beverage cans, To besubmitted to Procedia CIRP (September 2017).
7. Niero M, Olsen SI, Circular economy: to be or not to be in a closed product loop? A LifeCycle Assessment of aluminium cans with inclusion of alloying elements, ResourcesConservation and Recycling, Vol. 114, 2016, pp. 18–31.
8. Niero M, Negrelli AJ, Hoffmeyer SB, Olsen SI, Birkved M, Closing the loop for aluminiumcans: Life cycle assessment of progression in Cradle-to-Cradle certification levels, Journal ofCleaner Production, Vol.126, 2016, pp. 352–362.
9. Wellmer FW, Scholz RW, Peak minerals: what we can learn from the history of mineraleconomics and the cases of gold and phosphorus?, Mineral Economics, 30,2, 2017, 73–93.
10. Wellmer FW, Hagelüken C, The feedback control cycle of mineral supply, increase of rawmaterial efficiency, and sustainable development, Minerals, 5, 2015, 815–836.
11. Beulque R, Franck A, “Circular Business Model Innovation: Key Patterns and Challenges tounleash recycling value creation potential”, EGOS, 2016.
12. Morel S, Unger L, Buet G, “Behind-the-scenes of eco-innovation at Renault: from collectiveaction to breakthrough concepts”, International Journal on Interactive Design andManufacturing (IJIDeM), 10.3 (2016): 251–255.
13. Morel, S. L’empreinte environnementale à l’ère de la société collaborative: de l’Analyse duCycle de Vie comme outil expert à une instrumentation collaborative pour conduire unetransition organisationnelle Diss. Ecole Nationale Supérieure des Mines de Paris, 2014.
8 S. Zinck et al.

14. Kramer MR, Porter M, “Creating shared value”, Harvard business review, 89.1/2 (2011):62–77.
15. Morel, S., Beulque R, “Dynamiques collaboratives de co-construction et pilotage renforcé del’action collective: quels enseignements de l’ACV pour l’économie circulaire?”, 7thInternational Conference on Life Cycle Management–Life Cycle Management for productsustainability value creation, 2015.
16. Rigamonti L, Grosso M, Sunseri MC, Influence of assumptions about selection and recyclingefficiencies on the LCA of integrated waste management systems, International Journal ofLife Cycle Assessment, Vol.14 No.5, 2009, pp. 411–419.
17. Gala AB, Raugei M, Fullana-i-Palmer P, Introducing a new method for calculating theenvironmental credits of end-of-life material recovery in attributional LCA, InternationalJournal of Life Cycle Assessment, Vol.20, 2015, pp. 645–654.
18. Schrijvers DL, Loubet P, Sonnemann G, Developing a systematic framework for consistentallocation in LCA, International Journal of Life Cycle Assessment, Vol.21, No.7, 2016,pp. 976–993.
19. Vadenbo C, Astrup T F, Hellweg S, Let’s be clear(er) about substitution—a reportingframework to account for product displacement in LCA, Journal of Industrial Ecology, 2016https://doi.org/10.1111/jiec.12519.
20. Zink T, Geyer R, Startz R, A Market-Based Framework for Quantifying Displaced Productionfrom Recycling or Reuse, Journal of Industrial Ecology, Vol.20 No.4, 2015, pp. 719–729.
21. Zampori L, Pant R, Schau EM, De Schryver A, Galatola M, Circular Footprint Formula,Circular Footprint Formula, Ispra, Italy: European Commission, 2016. display/EUENVFP/Technical + Advisory + Board + workspace. (Accessed 04.01.2017).
Open Access This chapter is licensed under the terms of the Creative Commons Attribution 4.0International License (http://creativecommons.org/licenses/by/4.0/), which permits use, sharing,adaptation, distribution and reproduction in any medium or format, as long as you give appropriatecredit to the original author(s) and the source, provide a link to the Creative Commons license andindicate if changes were made.The images or other third party material in this chapter are included in the chapter’s Creative
Commons license, unless indicated otherwise in a credit line to the material. If material is notincluded in the chapter’s Creative Commons license and your intended use is not permitted bystatutory regulation or exceeds the permitted use, you will need to obtain permission directly fromthe copyright holder.
Life Cycle Management Approaches … 9
Sustainability Performance Evaluationfor Selecting the Best Recycling PathwayDuring Its Design Phase
Guilhem Grimaud, Nicolas Perry and Bertrand Laratte
Abstract As the end of life products are becoming more and more complex, therecycling systems encountered many difficulties in valuing all the materials con-tained in each product. This involves not only recovering a large number ofmaterials but also doing so with the minimal environmental impact. Although thebenefits of recycling are well established, the industrial processes need to bedesigned in regard with their environmental impacts. Therefore recyclers needrobust assessment tools to make the right choices during the design of recyclingprocesses. This approach should enable them to choose the right recycling solutionsfor a wide range of end of life products. In this article, we present a methodologydevelopped for evaluating the performance of recycling processes during theirdesign phase. This methodology is our answer to help the optimisation of therecycling of multi materials products based on the evaluation of the sustainabilityperformance of the processes chosen.
1 Introduction
The growth of world’s population and its life conditions go hand in hand with thegrowth of energy and raw material consumption as well as the steady growth ofCO2 concentration in the atmosphere [1, 2]. As the economy is mostly linear, thegrowth of consumption comes with an increase in the amount of waste producedannually [3]. In this context, the demand for primary resources is not tenable in along-term [4, 5]. It is therefore required to find industrial solutions to maintain orimprove standards of living while also decoupling resource use and demand [6].
G. Grimaud (&)MTB Recycling, Trept, Francee-mail: [email protected]
G. Grimaud � N. Perry � B. LaratteArts et Métiers ParisTech, CNRS, I2M Bordeaux, F-33400 Talence, France
B. LaratteAPESA-Innovation, Talence, France
© The Author(s) 2018E. Benetto et al. (eds.), Designing Sustainable Technologies,Products and Policies, https://doi.org/10.1007/978-3-319-66981-6_2
11
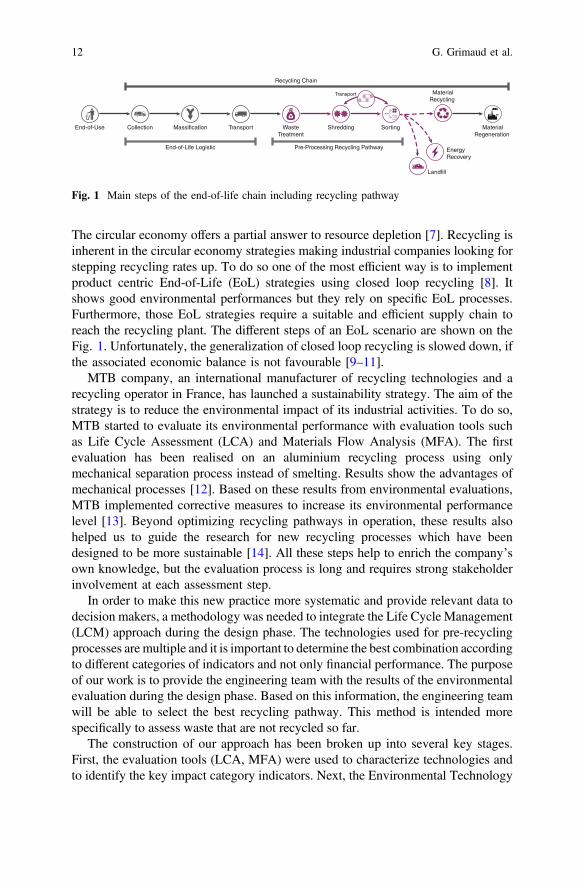
The circular economy offers a partial answer to resource depletion [7]. Recycling isinherent in the circular economy strategies making industrial companies looking forstepping recycling rates up. To do so one of the most efficient way is to implementproduct centric End-of-Life (EoL) strategies using closed loop recycling [8]. Itshows good environmental performances but they rely on specific EoL processes.Furthermore, those EoL strategies require a suitable and efficient supply chain toreach the recycling plant. The different steps of an EoL scenario are shown on theFig. 1. Unfortunately, the generalization of closed loop recycling is slowed down, ifthe associated economic balance is not favourable [9–11].
MTB company, an international manufacturer of recycling technologies and arecycling operator in France, has launched a sustainability strategy. The aim of thestrategy is to reduce the environmental impact of its industrial activities. To do so,MTB started to evaluate its environmental performance with evaluation tools suchas Life Cycle Assessment (LCA) and Materials Flow Analysis (MFA). The firstevaluation has been realised on an aluminium recycling process using onlymechanical separation process instead of smelting. Results show the advantages ofmechanical processes [12]. Based on these results from environmental evaluations,MTB implemented corrective measures to increase its environmental performancelevel [13]. Beyond optimizing recycling pathways in operation, these results alsohelped us to guide the research for new recycling processes which have beendesigned to be more sustainable [14]. All these steps help to enrich the company’sown knowledge, but the evaluation process is long and requires strong stakeholderinvolvement at each assessment step.
In order to make this new practice more systematic and provide relevant data todecision makers, a methodology was needed to integrate the Life Cycle Management(LCM) approach during the design phase. The technologies used for pre-recyclingprocesses are multiple and it is important to determine the best combination accordingto different categories of indicators and not only financial performance. The purposeof our work is to provide the engineering team with the results of the environmentalevaluation during the design phase. Based on this information, the engineering teamwill be able to select the best recycling pathway. This method is intended morespecifically to assess waste that are not recycled so far.
The construction of our approach has been broken up into several key stages.First, the evaluation tools (LCA, MFA) were used to characterize technologies andto identify the key impact category indicators. Next, the Environmental Technology
Fig. 1 Main steps of the end-of-life chain including recycling pathway
12 G. Grimaud et al.

Verification (ETV) was used to draw the evaluation framework for recyclingpathway. Then, the final stage was the implementation of a decision-making tool forthe engineering team. In this article, we present the interlinking of tools to conductan evaluation during the design phase of recycling processes.
2 Methodological Framework
2.1 Segmentation of Recycling Processes
The recycling pathways are mostly based on common elementary technologies. Theelementary technology selection and order have a strong influence on the overallperformance of the recycling chain [15]. This assembly achieves the targets ofpurity and quality specific to processed waste. The performances largely depend onthe pathway rather than technological innovations [16], hence, the assembly choicesof common sub-processes are one of the key points to design efficient recyclingpathways. The Fig. 2 shows EoL’s pathway alternatives for the same waste. Thetechnologies used and the streams vary with recycling process choices. We havedetermined that recycling processes can be classified in three types [17]: shredding,separation and transport. In addition to these three families of process unit, there isthe flow unit family.
2.2 Unit Process Database
To support the evaluation, we launched the construction of a database for recyclingprocesses. This database includes technical, environmental and economic datasets.On the one hand, for each data a part of the values is fixed. They are invariant dataregardless the type of transformation performed by the unit process. This is mainlythe impact of manufacturing, its price without the options or the weight of the
(a) (b)
(c)
Fig. 2 Presentation of different pathways for the same waste
Sustainability Performance Evaluation … 13
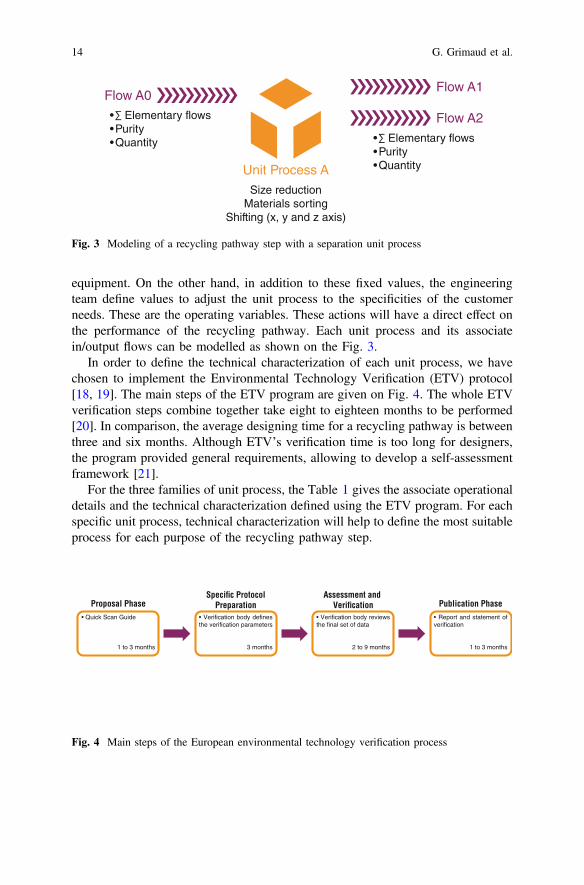
equipment. On the other hand, in addition to these fixed values, the engineeringteam define values to adjust the unit process to the specificities of the customerneeds. These are the operating variables. These actions will have a direct effect onthe performance of the recycling pathway. Each unit process and its associatein/output flows can be modelled as shown on the Fig. 3.
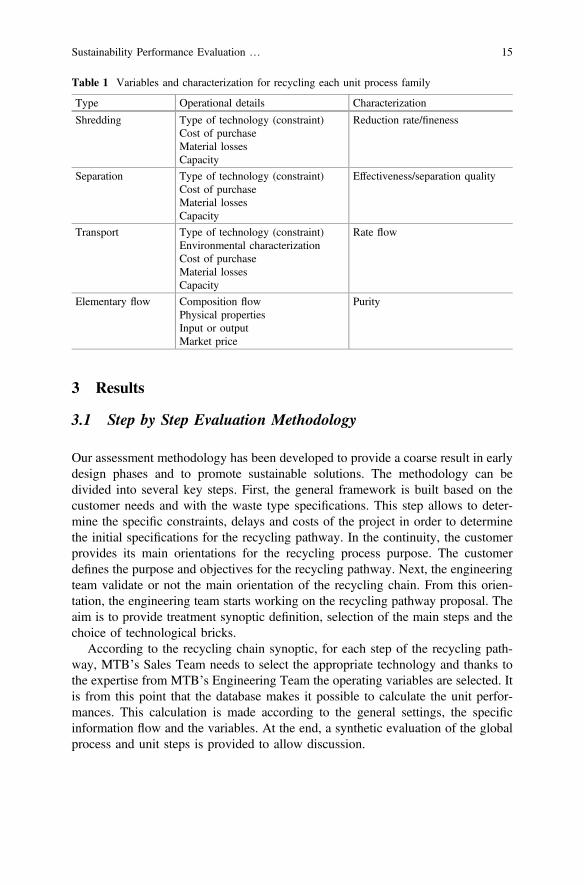
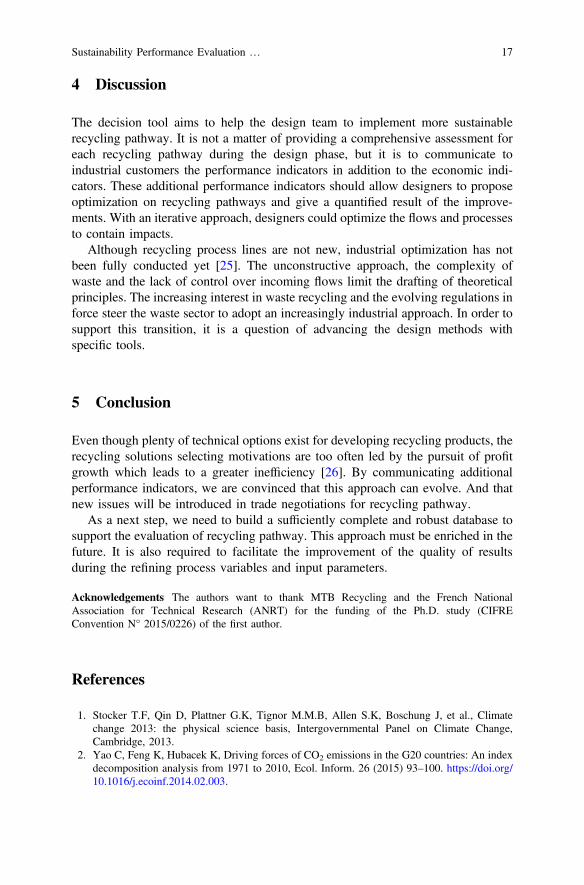
In order to define the technical characterization of each unit process, we havechosen to implement the Environmental Technology Verification (ETV) protocol[18, 19]. The main steps of the ETV program are given on Fig. 4. The whole ETVverification steps combine together take eight to eighteen months to be performed[20]. In comparison, the average designing time for a recycling pathway is betweenthree and six months. Although ETV’s verification time is too long for designers,the program provided general requirements, allowing to develop a self-assessmentframework [21].
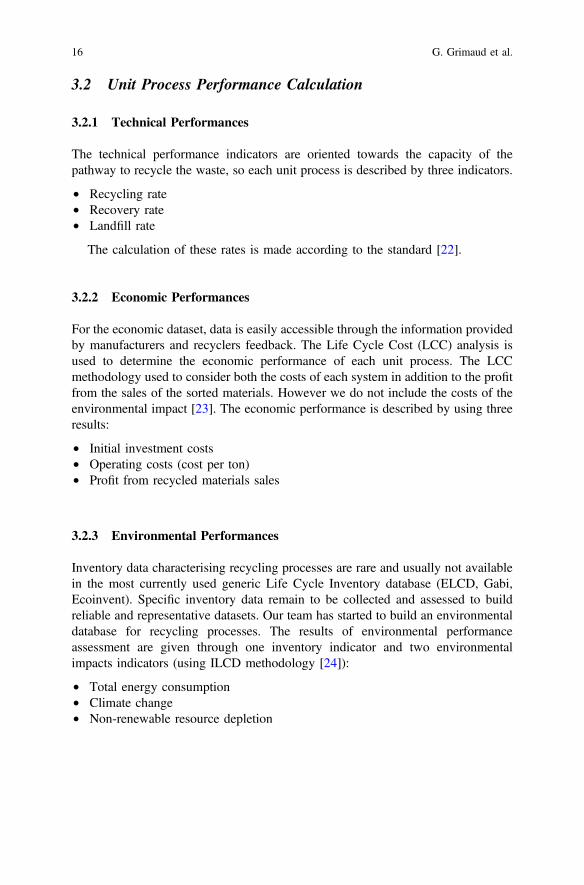
For the three families of unit process, the Table 1 gives the associate operationaldetails and the technical characterization defined using the ETV program. For eachspecific unit process, technical characterization will help to define the most suitableprocess for each purpose of the recycling pathway step.
Fig. 3 Modeling of a recycling pathway step with a separation unit process
Fig. 4 Main steps of the European environmental technology verification process
14 G. Grimaud et al.
3 Results
3.1 Step by Step Evaluation Methodology
Our assessment methodology has been developed to provide a coarse result in earlydesign phases and to promote sustainable solutions. The methodology can bedivided into several key steps. First, the general framework is built based on thecustomer needs and with the waste type specifications. This step allows to deter-mine the specific constraints, delays and costs of the project in order to determinethe initial specifications for the recycling pathway. In the continuity, the customerprovides its main orientations for the recycling process purpose. The customerdefines the purpose and objectives for the recycling pathway. Next, the engineeringteam validate or not the main orientation of the recycling chain. From this orien-tation, the engineering team starts working on the recycling pathway proposal. Theaim is to provide treatment synoptic definition, selection of the main steps and thechoice of technological bricks.
According to the recycling chain synoptic, for each step of the recycling path-way, MTB’s Sales Team needs to select the appropriate technology and thanks tothe expertise from MTB’s Engineering Team the operating variables are selected. Itis from this point that the database makes it possible to calculate the unit perfor-mances. This calculation is made according to the general settings, the specificinformation flow and the variables. At the end, a synthetic evaluation of the globalprocess and unit steps is provided to allow discussion.
Table 1 Variables and characterization for recycling each unit process family
Type Operational details Characterization
Shredding Type of technology (constraint)Cost of purchaseMaterial lossesCapacity
Reduction rate/fineness
Separation Type of technology (constraint)Cost of purchaseMaterial lossesCapacity
Effectiveness/separation quality
Transport Type of technology (constraint)Environmental characterizationCost of purchaseMaterial lossesCapacity
Rate flow
Elementary flow Composition flowPhysical propertiesInput or outputMarket price
Purity
Sustainability Performance Evaluation … 15
3.2 Unit Process Performance Calculation
3.2.1 Technical Performances
The technical performance indicators are oriented towards the capacity of thepathway to recycle the waste, so each unit process is described by three indicators.
• Recycling rate• Recovery rate• Landfill rate
The calculation of these rates is made according to the standard [22].
3.2.2 Economic Performances
For the economic dataset, data is easily accessible through the information providedby manufacturers and recyclers feedback. The Life Cycle Cost (LCC) analysis isused to determine the economic performance of each unit process. The LCCmethodology used to consider both the costs of each system in addition to the profitfrom the sales of the sorted materials. However we do not include the costs of theenvironmental impact [23]. The economic performance is described by using threeresults:
• Initial investment costs• Operating costs (cost per ton)• Profit from recycled materials sales
3.2.3 Environmental Performances
Inventory data characterising recycling processes are rare and usually not availablein the most currently used generic Life Cycle Inventory database (ELCD, Gabi,Ecoinvent). Specific inventory data remain to be collected and assessed to buildreliable and representative datasets. Our team has started to build an environmentaldatabase for recycling processes. The results of environmental performanceassessment are given through one inventory indicator and two environmentalimpacts indicators (using ILCD methodology [24]):
• Total energy consumption• Climate change• Non-renewable resource depletion
16 G. Grimaud et al.
4 Discussion
The decision tool aims to help the design team to implement more sustainablerecycling pathway. It is not a matter of providing a comprehensive assessment foreach recycling pathway during the design phase, but it is to communicate toindustrial customers the performance indicators in addition to the economic indi-cators. These additional performance indicators should allow designers to proposeoptimization on recycling pathways and give a quantified result of the improve-ments. With an iterative approach, designers could optimize the flows and processesto contain impacts.
Although recycling process lines are not new, industrial optimization has notbeen fully conducted yet [25]. The unconstructive approach, the complexity ofwaste and the lack of control over incoming flows limit the drafting of theoreticalprinciples. The increasing interest in waste recycling and the evolving regulations inforce steer the waste sector to adopt an increasingly industrial approach. In order tosupport this transition, it is a question of advancing the design methods withspecific tools.
5 Conclusion
Even though plenty of technical options exist for developing recycling products, therecycling solutions selecting motivations are too often led by the pursuit of profitgrowth which leads to a greater inefficiency [26]. By communicating additionalperformance indicators, we are convinced that this approach can evolve. And thatnew issues will be introduced in trade negotiations for recycling pathway.
As a next step, we need to build a sufficiently complete and robust database tosupport the evaluation of recycling pathway. This approach must be enriched in thefuture. It is also required to facilitate the improvement of the quality of resultsduring the refining process variables and input parameters.
Acknowledgements The authors want to thank MTB Recycling and the French NationalAssociation for Technical Research (ANRT) for the funding of the Ph.D. study (CIFREConvention N° 2015/0226) of the first author.
References
1. Stocker T.F, Qin D, Plattner G.K, Tignor M.M.B, Allen S.K, Boschung J, et al., Climatechange 2013: the physical science basis, Intergovernmental Panel on Climate Change,Cambridge, 2013.
2. Yao C, Feng K, Hubacek K, Driving forces of CO2 emissions in the G20 countries: An indexdecomposition analysis from 1971 to 2010, Ecol. Inform. 26 (2015) 93–100. https://doi.org/10.1016/j.ecoinf.2014.02.003.
Sustainability Performance Evaluation … 17

3. EUROSTAT, Statistics on Waste in Europe, Stat. Explain. (2015). <http://ec.europa.eu/eurostat/statistics-explained/index.php/Waste_statistics/fr> (accessed April 3, 2016).
4. Miehe R, Schneider R, Baaij F, Bauernhansl T, Criticality of Material Resources in IndustrialEnterprises—Structural Basics of an Operational Model, 23rd CIRP Conf. Life Cycle Eng.48 (2016) 1–9. https://doi.org/10.1016/j.procir.2016.03.035.
5. Hametner M, Dimitrova A, Schindler P, Sustainable development in the European Union—2016 Edition, EUROSTAT, Brussels, 2016, doi:10.1002/ (SICI)1099-0976 (199711)7:6 <181::AID-EET134> 3.0.CO; 2-S.
6. Schandl H, Decoupling global environmental pressure and economic growth: scenarios forenergy use, materials use and carbon emissions, J. Clean. Prod. (2015) 1–12. https://doi.org/10.1016/j.jclepro.2015.06.100.
7. McDonough W, Braungart M, Cradle to cradle: Remaking the Way We Make Things, Editional, Manifesto, Paris, 2012.
8. Rebitzer G, Fullana P, Weidema B.P, Jolliet O, Recycling, Close-Loop Economy, SecondaryResources, in: 10th LCA Case Study Symp., 2003: pp. 106–108.
9. Butterworth J, Morlet A, Nguyen H.P, Oppenheim J, Stuchtey M, Towards the CircularEconomy: Economic and Business Rationale for an Accelerated Transition, Ellen MacArthurFoundation, Vol. 1, 2013 98. https://doi.org/10.1162/108819806775545321.
10. Gahleitner A, Closing the loop: Next steps critical for Europe’s Circular Economy, Eur.Alum. Assoc. 2, 2015, 2.
11. Lavery G, Pennell N, Le Nouveau Modèle Industriel : Plus de bénéfices, plus d’emplois etmoins d’impact sur l’environnement, Interface, 2014.
12. Grimaud G, Perry N, Laratte B, Life Cycle Assessment of Aluminium Recycling Process:Case of Shredder Cables, in: Procedia CIRP, Berlin, 2016. https://doi.org/10.1016/j.procir.2016.03.097.
13. Grimaud G, Perry N, Laratte B, Reducing Environmental Impacts of Aluminium RecyclingProcess Using Life Cycle Assessment, 12th Bienn. Int. Conf. EcoBalance. October, 2016, 7.https://doi.org/10.1016/j.procir.2016.03.097.
14. Grimaud G, Laratte B, Perry N, To Transport Waste or Transport Recycling Plant: Insightsfrom Life-Cycle Analysis, in: Soc. Mater. Int. Conf. (SAM 11), SOVAMAT, Trondheim,2017: pp. 1–18.
15. UNEP, Recycling Rates of Metals, Paris, 2011.16. Fisher A, Functional versus Innovative Products, 2012, 8.17. Heiskanen K, Theory and Tools of Physical Separation/Recycling, in: Handb. Recycl.,
Elsevier Inc., Amsterdam, 2014: pp. 39–61. https://doi.org/10.1016/b978-0-12-396459-5.00005-2.
18. European Commission, General Verification Protocol for EU Environmental TechnologyVerification programme—Version 1.1, 2014, 74.
19. European Commission, EU Environmental Technology Verification, Environ. Technol. Verif.Progr., 2016, 15. <http://ec.europa.eu/environment/etv/> (accessed July 13, 2016).
20. European Commission, A Comprehensive Guide for Proposers to the EU EnvironmentalTechnologies Verification Pilot Programme, Project Ad, European Commission,Luxembourg, 2012.
21. Grimaud G, Perry N, Laratte B, Decision Support Methodology for Designing SustainableRecycling Process Based on ETV Standards, Int. Conf. Sustain. Mater. Process. Manuf.SMPM 2017. 7, 2017, 72–78. doi:http://dx.doi.org/10.1016/j.promfg.2016.12.020.
22. International Standard Organization, ISO 22628:2002—Road vehicles—Recyclability andrecoverability—Calculation method, 2002. <https://www.iso.org/standard/35061.html> (ac-cessed May 31, 2017).
23. Office of Acquisition and Project Management, LIFE CYCLE COST HANDBOOK Guidancefor Life Cycle Cost Estimation and Analysis, 2014, 89. http://energy.gov/sites/prod/files/2014/10/f18/LCC Handbook Final Version 9-30-14. pdf.
18 G. Grimaud et al.
24. JRC, European Commission—Institute for Environment and Sustainability, Characterizationfactors of the ILCD Recommended Life Cycle Impact Assessment methods—EUR 25167,Brussels, 2012. https://doi.org/10.2788/60825.
25. Martínez Leal J, Charbuillet C, Pompidou S, Perry N, Recycling Chains: A proposal for anExhaustive Definition, 10th Int. Conf. Soc. Mater., Roma, 2016: p. 21.
26. Allwood J.M,AshbyM.F,Gutowski T.G,Worrell E,Material efficiency:Awhite paper, Resour.Conserv. Recycl., 55, 2011, 362–381. https://doi.org/10.1016/j.resconrec.2010.11.002.
Open Access This chapter is licensed under the terms of the Creative Commons Attribution 4.0International License (http://creativecommons.org/licenses/by/4.0/), which permits use, sharing,adaptation, distribution and reproduction in any medium or format, as long as you give appropriatecredit to the original author(s) and the source, provide a link to the Creative Commons license andindicate if changes were made.The images or other third party material in this chapter are included in the chapter’s Creative
Commons license, unless indicated otherwise in a credit line to the material. If material is notincluded in the chapter’s Creative Commons license and your intended use is not permitted bystatutory regulation or exceeds the permitted use, you will need to obtain permission directly fromthe copyright holder.
Sustainability Performance Evaluation … 19
A Synthesis of Optimization Approachesfor LCA-Integrated Industrial ProcessModeling: Application to Potable WaterProduction Plants
Florin Capitanescu, Antonino Marvuglia and Enrico Benetto
Abstract This paper synthesizes the authors’ experience in the area of integratedapproaches coupling multi-objective optimization (MOO), industrial processmodeling and simulation, and life cycle assessment (LCA), with particular appli-cation to the sector of drinking water production. An industrial process is intendedas any process using a certain technology to produce a product or deliver a service.The paper discusses comparatively the suitability for the optimization of areal-world drinking water production plant (DWPP) of four optimization approa-ches, namely: (1) off-the-shelf global search metaheuristic algorithms, (2) hybridoptimizers combining global search and local search, (3) surrogate model basedoptimizers, and (4) local search.
1 Introduction
The combination between various optimization methods and life cycle assessment(LCA) has been initiated two decades ago [1], with the aim to empower decisionmakers with Pareto trade-off cost-effective solutions to decrease environmentalimpacts of processes. Many approaches have been proposed since then (e.g. [2–4])in this research area; the reader is referred to [5] for a relatively comprehensivesurvey. Rooted in the same research field, but focusing on the computationallyexpensive optimization problem of eco-design of drinking water production plants(DWPPs), the 3-year project “Optimization based integrated process modelling-LCA: application to potable water production” (OASIS) has further explored thebest paths for the threefold coupling (process modeling, LCA and optimization)along four major optimization research streams namely: (1) off-the-shelf globalsearch metaheuristic optimization algorithms [6], (2) hybrid optimizers combiningglobal search and local search [7], (3) surrogate model based optimizers [8, 9], and(4) local search [10].
F. Capitanescu (&) � A. Marvuglia � E. BenettoLuxembourg Institute of Science and Technology (LIST), Belvaux, Luxembourge-mail: [email protected]
© The Author(s) 2018E. Benetto et al. (eds.), Designing Sustainable Technologies,Products and Policies, https://doi.org/10.1007/978-3-319-66981-6_3
21
The outline of the remaining of the paper is as follows. Section 2 presents thestatement of the problem and the tool components. Section 3 briefly describes themain optimization algorithms employed in the four research streams. Section 4provides optimization results with these algorithms for a realistic model of areal-world DWPP. Section 5 concludes and provides directions for future work.
2 Statement of the Optimization-Process Modelling-LCAProblem
2.1 Problem Formulation
The multi-objective optimization (MOO) problem corresponding to a DWPP can becompactly expressed, assuming a single relevant aggregated operating scenario, asfollows:
minx
f1 xð Þ; f2 xð Þf gsubject to: g xð Þ ¼ 0
h xð Þ� hx� x� x
ð1Þ
where: x denotes the vector of decision variables (e.g. design and operationparameters of the DWPP unit processes), f1 models the operation cost of the DWPP(comprising especially raw materials, chemicals, and electricity), f2 models theenvironmental impacts of the DWPP (calculated using ReCiPe method applied atmidpoint level [11]). The equality constraints g xð Þ ¼ 0 model the input-outputmass flow for each unit process in the entire chain. The inequality constraintsh xð Þ� h enforce the outlet water quality [6]. The latter is represented only by sevenrelevant aggregated parameters (e.g. total coliforms, total trihalomethanes, totalorganic carbon, Escherichia coli, faecal streptococci, turbidity, and conductivity).Finally, the inequality constraints x� x� �x model the physical bounds of thedecision variables.
Note that, because there is no qualitative or quantitative benefit to express ana-lytically the hundreds of complex chemical reactions involved in the optimizationproblem (1), these are assessed (by the specialized software PHREEQC® [12]) byrunning the DWPP simulator, called EVALEAU [13], for specific values of thedecision variables.
22 F. Capitanescu et al.
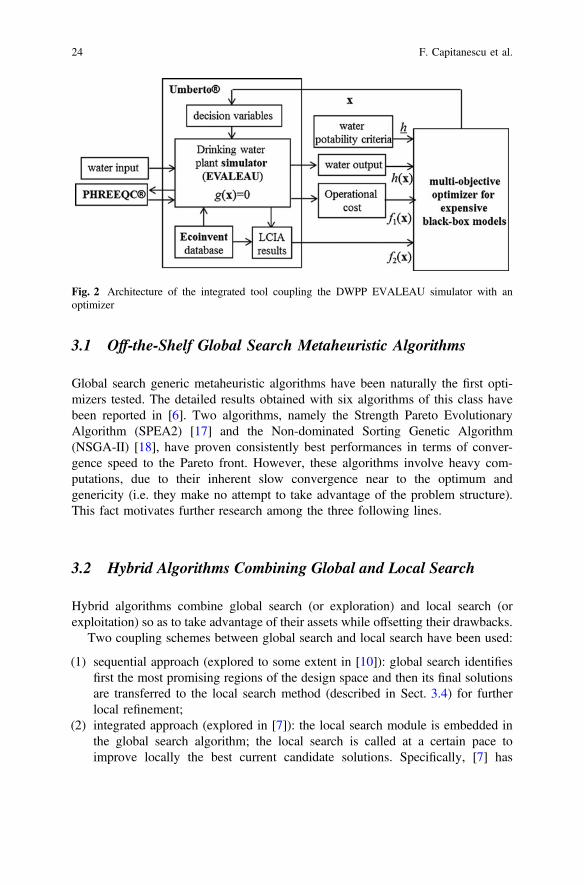
2.2 EVALEAU: The DWPP Simulator
EVALEAU is a simulator of DWPPs (see Fig. 1) which integrates detailed modellingof DWPPs unit operationswith state of the art LCA tools [13]. It consists in a library ofunit process (UPs) models for water treatment, allowing life cycle inventory calcu-lation (LCI) as a function of process parameters. The tool is embedded in the LCAsoftware Umberto® and relies on the Ecoinvent database. It also includes a sensitivityanalysis toolbox based on the Morris method for the identification of the processparameters mainly affecting the life cycle impact assessment (LCIA) results. Moredetails about it can be found in the literature [13–15].
2.3 The Proposed Integrated Simulation-OptimizationApproach
The approach proposed in the OASIS project for solving the simulation-optimization problem (1) consists in decomposing the problem into two modules(the EVALEAU simulator and a multi-objective optimizer) which interact in a loop,as shown in Fig. 2.
Because the simulator is intrinsically computationally expensive (it takes inaverage around two minutes per simulation) and can be seen by the optimizer as ablack-box, suitable optimizers have been sought as described in the next section.
3 Optimization Approaches
While the benefits of using optimization techniques for DWPP eco-design (e.g.reduction in both operating cost and environmental impacts) have been quantified inour previous works (e.g. [6–10, 16]), this section summarizes chronologically themain four lines of research pursued in the OASIS project, whose performances willbe compared in the next section.
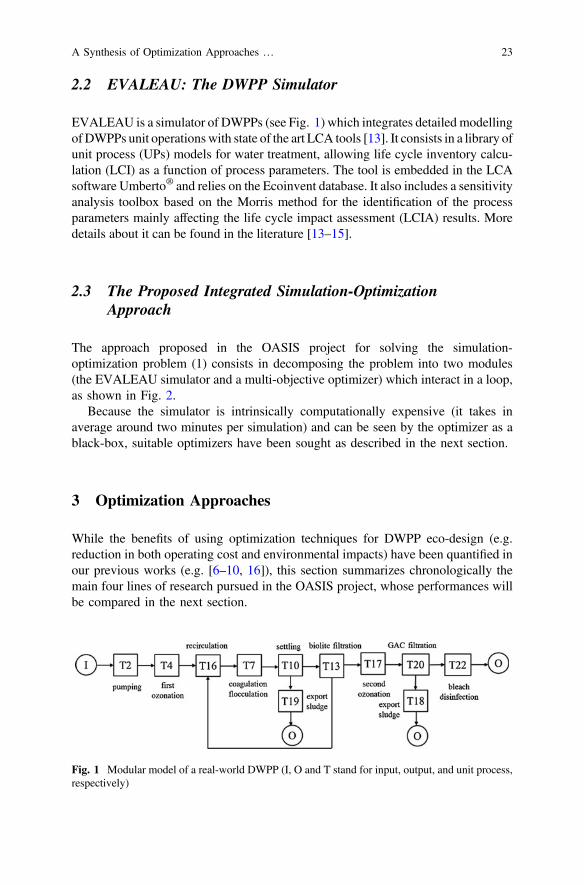
Fig. 1 Modular model of a real-world DWPP (I, O and T stand for input, output, and unit process,respectively)
A Synthesis of Optimization Approaches … 23
3.1 Off-the-Shelf Global Search Metaheuristic Algorithms
Global search generic metaheuristic algorithms have been naturally the first opti-mizers tested. The detailed results obtained with six algorithms of this class havebeen reported in [6]. Two algorithms, namely the Strength Pareto EvolutionaryAlgorithm (SPEA2) [17] and the Non-dominated Sorting Genetic Algorithm(NSGA-II) [18], have proven consistently best performances in terms of conver-gence speed to the Pareto front. However, these algorithms involve heavy com-putations, due to their inherent slow convergence near to the optimum andgenericity (i.e. they make no attempt to take advantage of the problem structure).This fact motivates further research among the three following lines.
3.2 Hybrid Algorithms Combining Global and Local Search
Hybrid algorithms combine global search (or exploration) and local search (orexploitation) so as to take advantage of their assets while offsetting their drawbacks.
Two coupling schemes between global search and local search have been used:
(1) sequential approach (explored to some extent in [10]): global search identifiesfirst the most promising regions of the design space and then its final solutionsare transferred to the local search method (described in Sect. 3.4) for furtherlocal refinement;
(2) integrated approach (explored in [7]): the local search module is embedded inthe global search algorithm; the local search is called at a certain pace toimprove locally the best current candidate solutions. Specifically, [7] has
Fig. 2 Architecture of the integrated tool coupling the DWPP EVALEAU simulator with anoptimizer
24 F. Capitanescu et al.
proposed such a hybrid approach in which a memory-based adaptive parti-tioning algorithm was embedded into an archive-based multi-objective evolu-tionary algorithm, developed relying on the structure of NSGA II [18].
3.3 Surrogate Model-Based Optimizers
This research line consists in building tailored computationally cheap surrogatemodels of the optimization problem, aiming to accelerate the convergence andreduce the computational burden. Two approaches have been developed [8, 9] inwhich the surrogate model of the optimization problem is based on:
(1) mixed-integer linear programming (MILP) [8,16]. This surrogate model relieson piecewise linear approximations, via brute-force sensitivity computation, ofthe objective functions and inequality constraints. Additionally, the use ofconstraint programming [19] for solving the MILP problem at the core of thesurrogate model has been explored in [9].
(2) nonlinear programming (NLP). This surrogate model relies on curve fitting ofobjectives and inequality constraints via either quadratic polynomial functionsor higher order polynomial functions (e.g. cubic) [9].
In both proposed methodologies which include such surrogate models, theapproximation of the Pareto front is generated upon applying the well-knowne-constraint method [20] to the MOO surrogate problems.
3.4 Local Search
The last optimization research strand investigated in this project concerns the localsearch [10]. The latter is useful not only in the context of hybrid algorithms (seeSect. 3.2) but also in many real-world computationally expensive simulation-basedapplications, where the aim is to improve a given system state locally with limitedcomputational budget. To this end, a new neighborhood-based iterative local searchmethod has been proposed [10]. This method aims at steering the search along anydesired direction in the objectives space and resorting to first derivatives approxi-mation and linear programming optimization.
A Synthesis of Optimization Approaches … 25

4 Numerical Results
4.1 Short Description of the DWPP
The optimization approaches developed in the frame of the OASIS project havebeen applied to a realistic model of an existing DWPP from France [13].The DWPP treatment chain of the inlet river water contains the main unit process(see Fig. 1): pumping, a first ozonation, coagulation/flocculation, settling, biolitefiltration, a second ozonation, granular activated carbon filtration, and bleach dis-infection. A set of six relevant decision variables is considered, namely (see Fig. 1):the ozone transfer efficiency and the pure oxygen fraction in feed gas in units T4and T17, the coagulant dose in unit T7, and the granular activated carbon regen-eration frequency in unit T20.
4.2 Results Using off-the-Shelf Global Search Algorithms
Figures 3 shows three snapshots retrieved during the convergence to the Paretofront obtained with SPEA2 and NSGA-II algorithms. For all the algorithms thePareto front corresponds to roughly 50 generations of simulation.
By comparing the two sides of Fig. 3 one can note that, while after 10 gener-ations NSGA-II front approximation is substantially better (in terms ofnon-dominance and spread of solutions) than the one of SPEA2, as generationsevolve, SPEA2 slightly outperforms NSGA-II.
Fig. 3 Progress toward the Pareto front obtained with SPEA2 (left) and NSGA II (right)optimizers [6]
26 F. Capitanescu et al.
4.3 Results Using Hybrid Algorithms
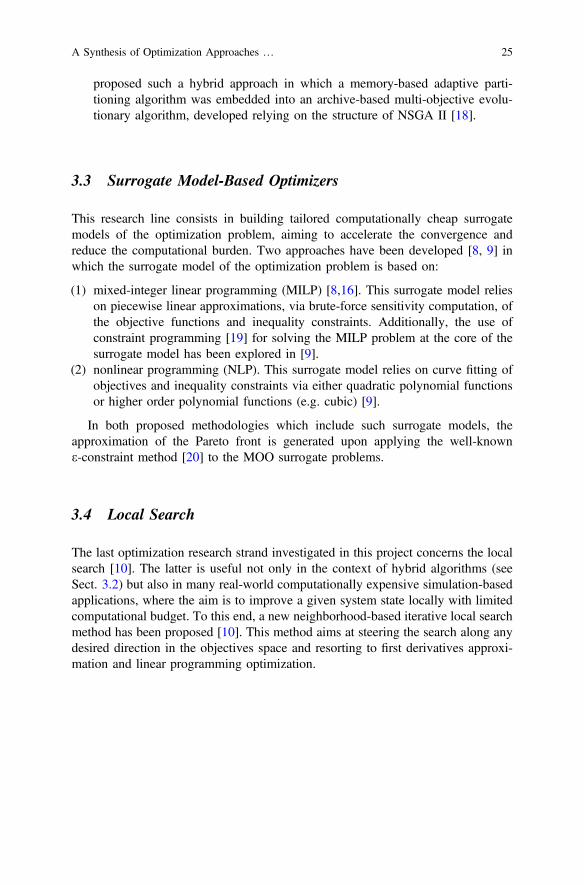
Figures 4 and 5 present results obtained with two hybrid algorithms: a sequentialtwo step algorithm (Fig. 4) and an integrated algorithm (Fig. 5).
Figure 4 shows that, although the local search is launched (starting from bestsolutions provided by the global search algorithm SPEA2 after 120 evaluations)relatively far from the Pareto front, despite the limited budget, it behaves well (i.e. afew solutions converge already on the front and their spread is good) [10].
Figure 5 shows the results obtained with an integrated hybrid algorithm calledArchive-based Multi-Objective Evolutionary Algorithm with Memory-basedAdaptive Partitioning of search space (AMOEA-MAP) [7]. Despite the limitedcomputational budget allowed (200 evaluations) this algorithm exhibits excellentperformances compared to NSGA-II. It also outperforms the sequential algorithm.
Fig. 4 Solution path of thelocal search method appliedafter 120 evaluations of globalsearch algorithm SPEA2 [8]
0.043
0.045
0.047
0.049
0.051
0.053
0.055
0.07 0.12 0.17 0.22 0.27 0.32oper
atio
nal c
osts
(mon
etar
y un
its)
climate change GWP100 (kg. CO2-Eq)
AMOEA-MAP (200)NSGAII (200)NSGAII (1000)
Fig. 5 Approximation of thePareto front as a function ofthe number of simulatorevaluations: hybrid algorithm(AMOEA-MAP) versusNSGAII optimizer [7]
A Synthesis of Optimization Approaches … 27
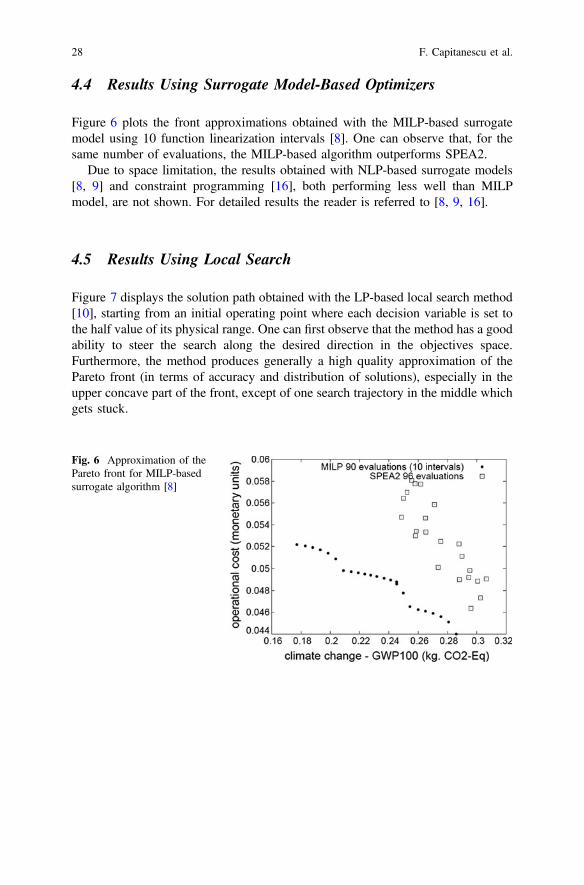
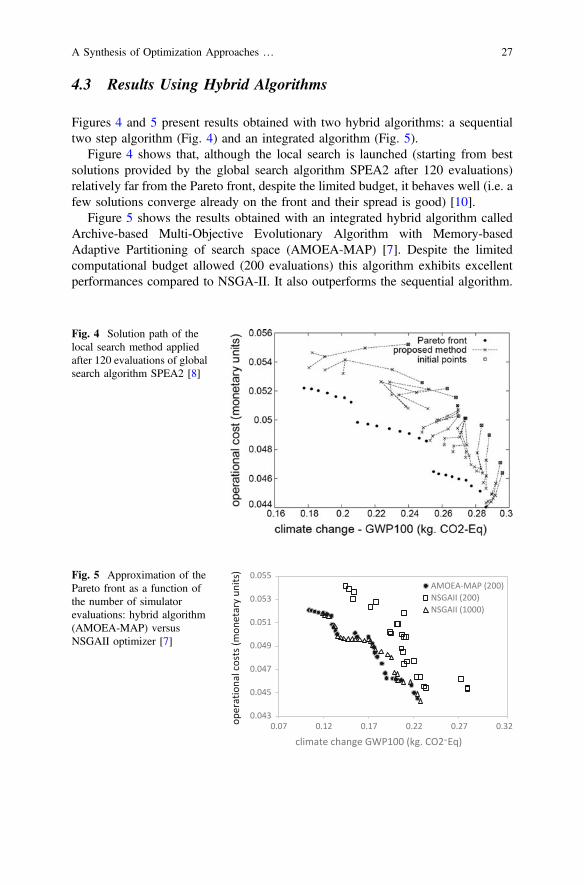
4.4 Results Using Surrogate Model-Based Optimizers
Figure 6 plots the front approximations obtained with the MILP-based surrogatemodel using 10 function linearization intervals [8]. One can observe that, for thesame number of evaluations, the MILP-based algorithm outperforms SPEA2.
Due to space limitation, the results obtained with NLP-based surrogate models[8, 9] and constraint programming [16], both performing less well than MILPmodel, are not shown. For detailed results the reader is referred to [8, 9, 16].
4.5 Results Using Local Search
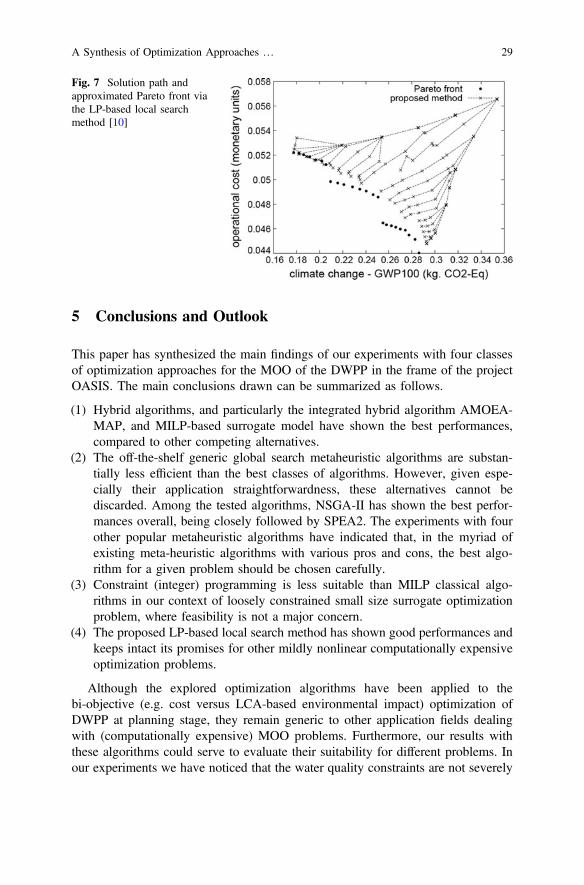
Figure 7 displays the solution path obtained with the LP-based local search method[10], starting from an initial operating point where each decision variable is set tothe half value of its physical range. One can first observe that the method has a goodability to steer the search along the desired direction in the objectives space.Furthermore, the method produces generally a high quality approximation of thePareto front (in terms of accuracy and distribution of solutions), especially in theupper concave part of the front, except of one search trajectory in the middle whichgets stuck.
Fig. 6 Approximation of thePareto front for MILP-basedsurrogate algorithm [8]
28 F. Capitanescu et al.
5 Conclusions and Outlook
This paper has synthesized the main findings of our experiments with four classesof optimization approaches for the MOO of the DWPP in the frame of the projectOASIS. The main conclusions drawn can be summarized as follows.
(1) Hybrid algorithms, and particularly the integrated hybrid algorithm AMOEA-MAP, and MILP-based surrogate model have shown the best performances,compared to other competing alternatives.
(2) The off-the-shelf generic global search metaheuristic algorithms are substan-tially less efficient than the best classes of algorithms. However, given espe-cially their application straightforwardness, these alternatives cannot bediscarded. Among the tested algorithms, NSGA-II has shown the best perfor-mances overall, being closely followed by SPEA2. The experiments with fourother popular metaheuristic algorithms have indicated that, in the myriad ofexisting meta-heuristic algorithms with various pros and cons, the best algo-rithm for a given problem should be chosen carefully.
(3) Constraint (integer) programming is less suitable than MILP classical algo-rithms in our context of loosely constrained small size surrogate optimizationproblem, where feasibility is not a major concern.
(4) The proposed LP-based local search method has shown good performances andkeeps intact its promises for other mildly nonlinear computationally expensiveoptimization problems.
Although the explored optimization algorithms have been applied to thebi-objective (e.g. cost versus LCA-based environmental impact) optimization ofDWPP at planning stage, they remain generic to other application fields dealingwith (computationally expensive) MOO problems. Furthermore, our results withthese algorithms could serve to evaluate their suitability for different problems. Inour experiments we have noticed that the water quality constraints are not severely
Fig. 7 Solution path andapproximated Pareto front viathe LP-based local searchmethod [10]
A Synthesis of Optimization Approaches … 29

constraining the feasible region of the problem; this is however case-dependent andthe impact of these constraints may be more pronounced for other DWPPs.
As a side complementary experiment of the project, a detailed discussionregarding the pros and cons of expressing environmental impacts in MOO utilizingthe midpoint categories versus endpoint score has been conducted in [21].
Finally, the algorithms developed and the experience gained in this project,could be applied (with due adaptations) to other case studies. In particular, a veryappealing and timely research area would be the optimization of supply chains,under resiliency constraints and risk-based decision making.
Acknowledgements The authors acknowledge the funding from Luxembourg National ResearchFund (FNR) in the framework of the OASIS project (CR13/SR/5871061).
References
1. A. Azapagic, R. Clift, Life cycle assessment and multiobjective optimisation, Journal ofCleaner Production, Vol. 7, 1999, pp. 135–143.
2. I.E. Grossman, G Guillén-Gosálbez, Scope for the Application of Mathematical ProgrammingTechniques in the Synthesis and Planning of Sustainable Processes, Computers & ChemicalEngineering, Vol. 34, 2010, pp. 1365–1376.
3. G. Guillén-Gosálbez, J.A. Caballero, L. Jiménez, Application of Life Cycle Assessment to theStructural Optimization of Process Flowsheets, Industrial & Engineering ChemistryResearch, Vol. 47, 2008, pp. 777–789.
4. F. You, L. Tao, D.J. Graziano, S.W. Snyder, Optimal design of sustainable cellulosic biofuelsupply chains: Multiobjective optimization coupled with life cycle assessment and input–output analysis, AIChE Journal, Vol. 58, 2012, pp. 1157–1180.
5. C. Pieragostini, M.C. Mussati, P Aguirre, On process optimization considering LCAmethodology, Journal of Environmental Management, Vol. 96, 2012, pp. 43–54.
6. F. Capitanescu, S. Rege, A. Marvuglia, E. Benetto, A. Ahmadi, T. Navarrete-Gutierrez, L.Barna, Cost versus life cycle assessment-based optimization of drinking water productionplants, Journal of Environmental Management, Vol. 177, 2016, pp. 278–287.
7. A. Ahmadi, L. Barna, F. Capitanescu, A. Marvuglia, E. Benetto, An archive-basedmulti-objective evolutionary algorithm with adaptive search space partitioning to deal withexpensive optimisation problems: application to process eco-design, Computers & ChemicalEngineering, Vol. 87, 2016, pp. 95–110.
8. F. Capitanescu, A. Ahmadi, E. Benetto, A. Marvuglia, L. Barna, Some efficient approachesfor multi-objective constrained optimization of computationally expensive black-box modelproblems, Computers & Chemical Engineering, Vol. 82, No. 2, 2015, pp. 228–239.
9. F. Capitanescu, A. Marvuglia, E. Benetto, A. Ahmadi, L. Barna, Assessing the uses ofNLP-based surrogate models for solving expensive multi-objective optimization problems:application to potable water chains, Enviroinfo Conference, Copenhagen (Denmark), 2015.
10. F. Capitanescu, A. Marvuglia, E. Benetto, A. Ahmadi, L. Barna, Linear programming-baseddirected local search for expensive multi-objective optimization problems: application todrinking water production plants, European Journal of Operational Research, Vol. 262,2017, pp. 322–334.
11. M.J. Goedkoop, R. Heijungs, M. Huijbregts, A. De Schryver, J. Struijs, R. Van Zelm, ReCiPe2008—A life cycle impact assessment method which comprises harmonised categoryindicators at the midpoint and the endpoint level, First edition Report I: Characterisation, 6January 2009.
30 F. Capitanescu et al.
12. D.L. Parkhurst, C.A.J. Appelo, User’s guide to PHREEQC (version 2)—A computer programfor speciation, batch-reaction, one-dimensional transport, and inverse geochemical calcula-tions. U.S.G.S., 1999.
13. Y. Méry, L. Tiruta-Barna, E. Benetto, I. Baudin, An integrated “process modelling-life cycleassessment” tool for the assessment and design of water treatment processes, InternationalJournal of Life Cycle Assessment, Vol. 18, 2013, pp. 1062–1070.
14. Y. Méry, L. Tiruta-Barna, I. Baudin, E. Benetto, E. Igos, Formalization of a technicalprocedure for process ecodesign dedicated to drinking water treatment plants, Journal ofCleaner Production, Vol. 68, 2014, pp. 16–24.
15. Y. Méry, Development of an integrated tool for Process Modelling and Life CycleAssessment—Ecodesign of process plants and application to drinking water treatment.Chemical and Process Engineering. INSA de Toulouse, 2012. English.
16. F. Capitanescu, A. Marvuglia, E. Benetto, A. Ahmadi, L. Barna, Constraint Programmingversus MIP for LCA-based Multi-Objective Optimization of Sustainable Potable WaterProduction Plant, iEMSs Conference, Toulouse (France), 2016.
17. E. Zitzler, M. Laumanns, L. Thiele, SPEA2: Improving the Strength Pareto EvolutionaryAlgorithm for Multiobjective Optimization, In: Evolutionary Methods for Design,Optimisation and Control with Application to Industrial Problems (Eds. Giannakoglou K.C.et al.), Proceedings of the EUROGEN2001 Conference, Athens, Greece, 2002, pp. 95–100.
18. K. Deb, S. Agrawal, A. Pratap, T. Meyarivan, A Fast Elitist Non-dominated Sorting GeneticAlgorithm for Multi-objective Optimization: NSGA-II, PPSN VI, LNCS, 1917, 2000,pp. 849–858.
19. T. Achterberg, SCIP: solving constraint integer programs, Mathematical ProgrammingComputation, 2009, pp. 1–41.
20. G. Mavrotas, Effective implementation of the e-constraint method in Multi-ObjectiveMathematical Programming problems. Applied Mathematics and Computation, 2009; Vol.2013, pp. 455–65.
21. F. Capitanescu, E. Igos, A. Marvuglia, E. Benetto, Midpoint vs single score in multi-criteriaoptimization under life cycle assessment constraints: the case of potable water treatmentchains, Enviroinfo Conference, Copenhagen (Denmark), 2015.
Open Access This chapter is licensed under the terms of the Creative Commons Attribution 4.0International License (http://creativecommons.org/licenses/by/4.0/), which permits use, sharing,adaptation, distribution and reproduction in any medium or format, as long as you give appropriatecredit to the original author(s) and the source, provide a link to the Creative Commons license andindicate if changes were made.The images or other third party material in this chapter are included in the chapter’s Creative
Commons license, unless indicated otherwise in a credit line to the material. If material is notincluded in the chapter’s Creative Commons license and your intended use is not permitted bystatutory regulation or exceeds the permitted use, you will need to obtain permission directly fromthe copyright holder.
A Synthesis of Optimization Approaches … 31
A Bi-dimensional Assessmentto Measure the Performance of CircularEconomy: A Case Study of TiresEnd-of-Life Management
Geoffrey Lonca, Romain Muggéo, Hugue Tétreault-Imbeault,Sophie Bernard and Manuele Margni
Abstract Although circular initiatives emerge around the world, the process ofdecoupling the economic activity from resource consumption and environmentalimpacts is far of being achieved. The concept of circular economy embodies theopportunity to reconcile an improved resource use while reducing the environ-mental footprint. Appropriate assessment metrics and methodologies are needed toidentify potential trade-off between these 2 sides of a single coin. In this paper, weapply the Material Circularity Indicator (MCI) and Life Cycle Assessment (LCA) toanalyse tires end-of-life strategies aiming at improving the circular flow of all tirematerials. Results reveal re-treading is interesting to produce trade-offs on envi-ronmental impacts while re-grooving offers a fully decoupled strategy that improvesmaterial circularity avoiding environmental burdens. Further improvements shouldintegrate environmental assessment as well as economic factors to link micro scaleto macro scale contributions to sustainable development.
1 Introduction
Decoupling the economic activity from any form of social and ecological degra-dation is gaining recognition as a universal condition to increase—or at leastmaintain—social welfare throughout generations (e.g. [1]). Since the idea of asustainable development appeared, it gave birth to some concepts related to more
G. Lonca (&) � H. Tétreault-Imbeault � M. MargniDepartment of Chemical Engineering, CIRAIG, École Polytechniquede Montréal, PO Box 6079 Stn. Centre-Ville, Montréal, QC H3C 3A7, Canadae-mail: [email protected]
R. MuggéoCentre de Technologies de Ladoux, M.F.P Michelin, 23 place des Carmes Déchaux,Clermont-Ferrand 63040, France
S. BernardDepartment of Mathematical and Industrial Engineering, École Polytechnique de Montréal,PO Box 6079 Stn. Centre-Ville, Montréal, QC H3C 3A7, Canada
© The Author(s) 2018E. Benetto et al. (eds.), Designing Sustainable Technologies,Products and Policies, https://doi.org/10.1007/978-3-319-66981-6_4
33
specific goals. Among them, the circular economy (CE) focuses on decoupling theeconomic activity from resource depletion, providing an appealing concept forcompanies to support the development of strategies benefitting from both savingmoney and resources.
CE is still a not well-defined concept that heavily builds on past ones, as sug-gested in the CIRAIG’s white paper on circular economy released in 2015.Nonetheless, a narrow scope definition of CE jeopardizes its contribution to thebigger picture of a sustainable development. Without a clear identification of thedimensions that define a CE, practitioners are willing to choose inadequateassessment tools that account for only a small part of the complete CE model.According to several definitions and metrics of CE, a company that consumes morematerials and less energy is less circular than the one that consumes fewer materialsand more energy [2]. This is due to an unclear definition of the boundaries betweenof material circularity and burden shifting, and all the more, environmental benefitsare not quantitatively linked to circular strategies (i.e. circular economy loops) [3].As the world faces a growing amount of complex products coming to theirend-of-life to manage as well as recycling efficiency challenges, recycling strategiestend to consume more energy as the amount of recovered material rises [4, 5].Besides, technological progress make sometimes the reusing a worse environmentalstrategy [6], e.g. innovation on energetically efficient products leads reusing oldproducts less efficient to increase its overall environmental impacts. Hence, the needfor adequate quantifying tools for circular strategies—to enlighten decision makerstowards sustainable practices—is gaining increasing attention [7].
This paper attempts to provide an approach that allows identifying trade-offsbetween increasing material circularity and decreasing environmental burdens toassess CE strategies through a case study on tire end-of-life management. We firstidentify suitable tools to assess both circularities of material flows and environ-mental burdens and we provide a novel approach to evaluate CE strategies (SeeChapter “Sustainability performance evaluation for selecting the Best RecyclingPathway During its Design Phase”). We apply it to a case study on tire end-of-lifemanagement to identify trade-offs of CE strategies (See Chapter “A synthesis ofoptimization approaches for LCA-integrated industrial process modeling: applica-tion to potable water production plants”), we then discuss some limitations of ourapproach (See in this Chapter). Finally, concluding remarks provide insights forfuture works on CE assessment (See Chapter “Bio-based materials within thecircular economy: opportunities and challenges”).
34 G. Lonca et al.

2 Approaches for Circular Economy Assessment
2.1 A Short Review on Circular Economy Assessment
Elia et al. provide a critical review of environmental assessment tools and CE indexmethods [8]. They evaluate the level of alignment of the identified tools regardingfive CE requirements inspired by the European Environmental Agency [9]—thereport provides an outlook on resource-efficient, low-carbon economic and socialdevelopment goals to achieve in 2050:
• Reducing inputs and use of natural resources;• Reducing emission levels;• Reducing valuable materials losses;• Increasing the share of renewable and recyclable resources;• Increasing the value durability of products.
Amongst the 14 environmental assessment methodologies analysed, the LifeCycle Assessment (LCA) turns out to have the best level of alignment with the 5 CErequirements aforementioned. This is the same level of alignment as the SubstanceFlowAnalysis (SFA), and better than theMaterial FlowAnalysis (MFA) that does notcomplete requirement 3 and the Water Footprint (WF) deprived of the secondrequirement.
Only three out of the sixteenCE indexmethods published in the scientific literaturein the last ten years, suits for micro-scale material circularity assessment, i.e. productor company level. Amongst the Reuse Potential Indicator (RPI) developed by Parkand Chertow [10], the Circular Economy Index (CEI) by Di Maio and Rem [11] andthe Material Circularity Indicator (MCI) by Ellen Mc Arthur Foundation and GrantaDesign [12], only the latter one accounts for the loss of material as well as productdurability [8]. Even if it does not account for emission reduction (requirement 2)—butnone of the micro scale CE indexes does—it appears to be the best attempt to complywith the mentioned CE requirements (Table 1).
The MCI is an index ranging between 0 and 1. It derives from the multiplicationof a Linear Flow Index (LFI) with a Utility Factor (F(X)):
MCI ¼ max 0;MCI�ð Þ ð1Þ
MCI� ¼ 1� LFI� F Xð Þ ð2Þ
The LFI is a mass-based indicator that can be considered as an adapted MFAlayout [13]. The LFI integrates 4 elements [see Eq. (3)]:
• The virgin feedstock fraction (v) deducted from the mass fraction of a product’sfeedstock from recycled sources (FR) and from reused sources (FU);
• The total waste (w) including the waste fraction from upstream (wF) anddownstream (wc) recycling processes and waste fraction directly to landfill (w0)
A Bi-dimensional Assessment to Measure the Performance … 35
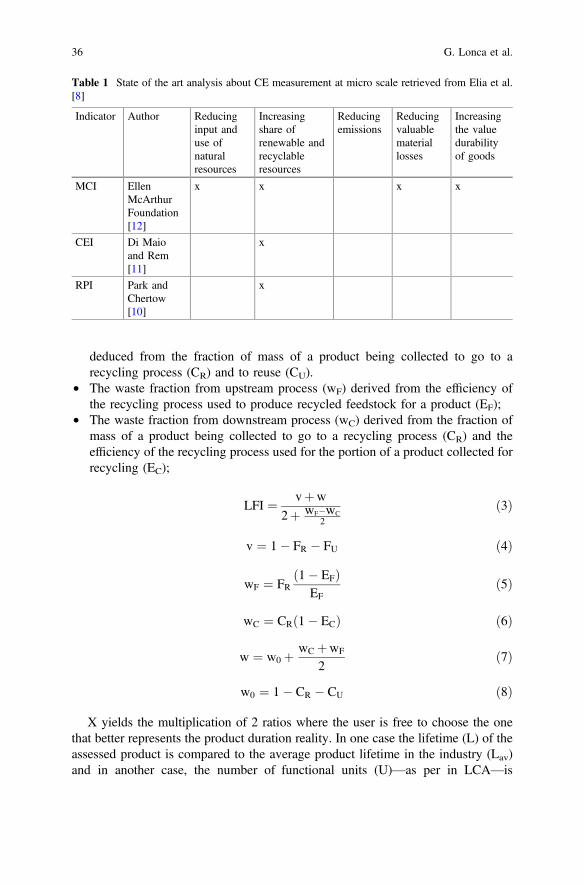
deduced from the fraction of mass of a product being collected to go to arecycling process (CR) and to reuse (CU).
• The waste fraction from upstream process (wF) derived from the efficiency ofthe recycling process used to produce recycled feedstock for a product (EF);
• The waste fraction from downstream process (wC) derived from the fraction ofmass of a product being collected to go to a recycling process (CR) and theefficiency of the recycling process used for the portion of a product collected forrecycling (EC);
LFI ¼ vþw
2þ wF�wC2
ð3Þ
v ¼ 1� FR � FU ð4Þ
wF ¼ FR1� EFð ÞEF
ð5Þ
wC ¼ CR 1� ECð Þ ð6Þ
w ¼ w0 þ wC þwF
2ð7Þ
w0 ¼ 1� CR � CU ð8Þ
X yields the multiplication of 2 ratios where the user is free to choose the onethat better represents the product duration reality. In one case the lifetime (L) of theassessed product is compared to the average product lifetime in the industry (Lav)and in another case, the number of functional units (U)—as per in LCA—is
Table 1 State of the art analysis about CE measurement at micro scale retrieved from Elia et al.[8]
Indicator Author Reducinginput anduse ofnaturalresources
Increasingshare ofrenewable andrecyclableresources
Reducingemissions
Reducingvaluablemateriallosses
Increasingthe valuedurabilityof goods
MCI EllenMcArthurFoundation[12]
x x x x
CEI Di Maioand Rem[11]
x
RPI Park andChertow[10]
x
36 G. Lonca et al.
compared to the industry average (Uav). It is up to the user either to choose the ratiothat best fits and then to set the other at 1, or in some particular cases to use both aslong as it does not produce any double counting.
F Xð Þ ¼ 0:9X
ð9Þ
X ¼ LLav
� �� U
Uav
� �ð10Þ
As the MCI builds on a simplified methodology, some calculation features canbe hard to identify in reality. For instance, the distinction between lifetime exten-sion and reuse is not always clear. Furthermore, calculating the MCI of a productalong one life cycle is ineffective to embrace the service it provides. E.g. in ourcase, one sole tire life cycle cannot be sufficient to provide a transportation servicefor a whole truck. It requires a repairing or a replacement to provide the sameservice along the whole truck’s lifetime. Then, some components add up to theoriginal product to make it last longer, resulting in a weight surplus in the productmass balance sheet. To avoid any confusion, we applied a mass-based weightingcalculation that consists in dividing the product into components with any specialcircular feature. Thus, the MCItotal of the product accounts for the number (ni), themass (mi) and the MCIi of every component (i) of the product [see Eq. (9)]. In ourcase, this equation allows incorporating the MCI value of the tire casing, the treadand the retreaded rubber band.
MCItotal ¼P
i ni �mi �MCIið ÞPiðni �miÞ ð11Þ
2.2 An Approach Based on Trade-off Issuesin Circular Economy
Capital theory, in the field of natural resources economics, translates the objectiveof decoupling the economic activity from environmental degradation as anincreasing substitutability between manufactured capital (capital goods) andnon-renewable resources (natural capital) [14], traducing the essentialness of aresource and thus, providing a good indication of progress toward a CE. Besides,the ecological economics divides the use of the environment in 2 subsets: (1) a “useof mineral and biotic resources” that we call here “natural feedstock” and (2) adepository for waste products or residuals that we call here “environmental reser-voirs” [15]. The CE should embody both environmental issues to align the capitaltheory of resources economics with the definition of environmental preservationfrom ecological economics.
A Bi-dimensional Assessment to Measure the Performance … 37
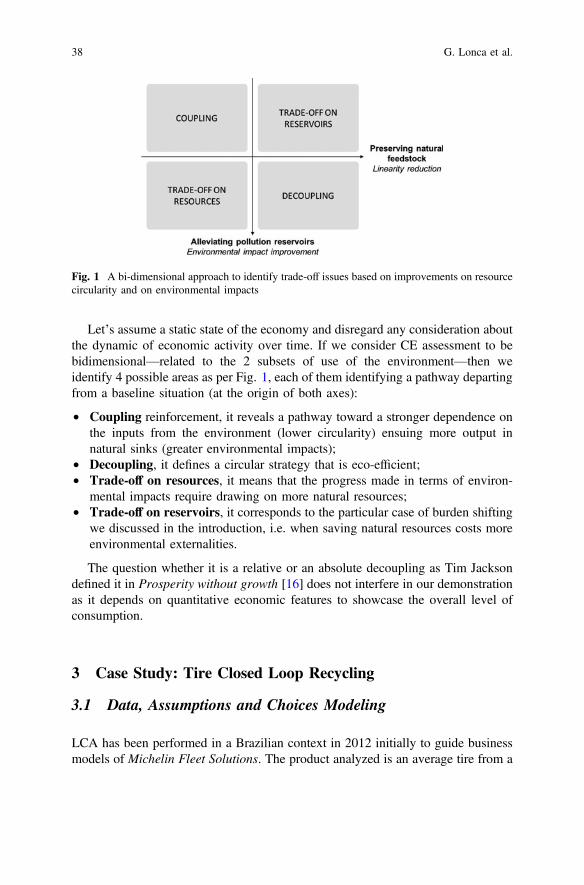
Let’s assume a static state of the economy and disregard any consideration aboutthe dynamic of economic activity over time. If we consider CE assessment to bebidimensional—related to the 2 subsets of use of the environment—then weidentify 4 possible areas as per Fig. 1, each of them identifying a pathway departingfrom a baseline situation (at the origin of both axes):
• Coupling reinforcement, it reveals a pathway toward a stronger dependence onthe inputs from the environment (lower circularity) ensuing more output innatural sinks (greater environmental impacts);
• Decoupling, it defines a circular strategy that is eco-efficient;• Trade-off on resources, it means that the progress made in terms of environ-
mental impacts require drawing on more natural resources;• Trade-off on reservoirs, it corresponds to the particular case of burden shifting
we discussed in the introduction, i.e. when saving natural resources costs moreenvironmental externalities.
The question whether it is a relative or an absolute decoupling as Tim Jacksondefined it in Prosperity without growth [16] does not interfere in our demonstrationas it depends on quantitative economic features to showcase the overall level ofconsumption.
3 Case Study: Tire Closed Loop Recycling
3.1 Data, Assumptions and Choices Modeling
LCA has been performed in a Brazilian context in 2012 initially to guide businessmodels of Michelin Fleet Solutions. The product analyzed is an average tire from a
Fig. 1 A bi-dimensional approach to identify trade-off issues based on improvements on resourcecircularity and on environmental impacts
38 G. Lonca et al.
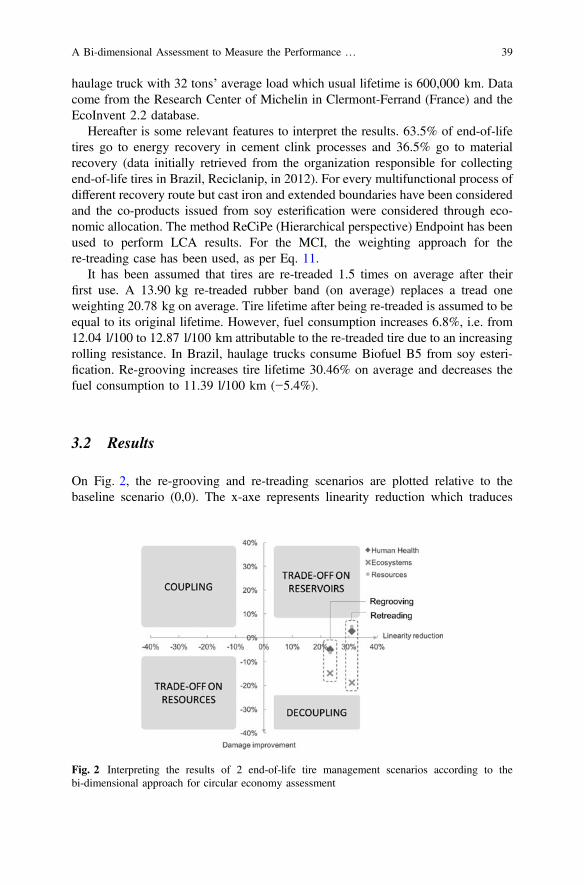
haulage truck with 32 tons’ average load which usual lifetime is 600,000 km. Datacome from the Research Center of Michelin in Clermont-Ferrand (France) and theEcoInvent 2.2 database.
Hereafter is some relevant features to interpret the results. 63.5% of end-of-lifetires go to energy recovery in cement clink processes and 36.5% go to materialrecovery (data initially retrieved from the organization responsible for collectingend-of-life tires in Brazil, Reciclanip, in 2012). For every multifunctional process ofdifferent recovery route but cast iron and extended boundaries have been consideredand the co-products issued from soy esterification were considered through eco-nomic allocation. The method ReCiPe (Hierarchical perspective) Endpoint has beenused to perform LCA results. For the MCI, the weighting approach for there-treading case has been used, as per Eq. 11.
It has been assumed that tires are re-treaded 1.5 times on average after theirfirst use. A 13.90 kg re-treaded rubber band (on average) replaces a tread oneweighting 20.78 kg on average. Tire lifetime after being re-treaded is assumed to beequal to its original lifetime. However, fuel consumption increases 6.8%, i.e. from12.04 l/100 to 12.87 l/100 km attributable to the re-treaded tire due to an increasingrolling resistance. In Brazil, haulage trucks consume Biofuel B5 from soy esteri-fication. Re-grooving increases tire lifetime 30.46% on average and decreases thefuel consumption to 11.39 l/100 km (−5.4%).
3.2 Results
On Fig. 2, the re-grooving and re-treading scenarios are plotted relative to thebaseline scenario (0,0). The x-axe represents linearity reduction which traduces
Fig. 2 Interpreting the results of 2 end-of-life tire management scenarios according to thebi-dimensional approach for circular economy assessment
A Bi-dimensional Assessment to Measure the Performance … 39

improvements on the MCI whilst y-axe represents improvements on human health,ecosystems and resources damage scores.
Results reveal that the two types of tire end-of-life management analysed tend toimprove the level of circularity from the baseline scenario, as per the MCI, but it isnot fully conclusive on environmental damages. Re-grooving follows on adecoupling pathway on all impact categories, whereas re-treading potentially shiftsburdens on human health and resources. This is due to the increased fuel con-sumption required to offset the rolling resistance.
It could be tempting to conclude that re-treading improvements on circularityand ecosystem quality indicators are substantial enough to balance the smallincrease of damages on human health and resources, but this typical conclusionjeopardizes the preservation of natural capital itself—and consequently the con-tribution of circular strategies to a sustainable development. A more conservativeapproach then would be to conclude that only re-grooving improve natural capitalpreservation.
4 Discussion
Preceding results display areas of protection—as per ReCiPe—as the ultimateexpression of environmental reservoirs subsets. Two important discussions stemfrom this observation. First, one could say that other trade-off on environmentalreservoirs can occur when downscaling to mid-point categories. We consideredreasonable to assume that mid-point categories can offset one another when con-tributing to the same damage category. Note that this works also for circularitywhen resource preservation refers to different subsets of stock of resources yet, thisdoes not concern the MCI as it has no subcategories. The second logical issue isabout comparing resources at damage category level and the MCI. The precedingillustration makes them appearing complementary as they derive from distinctassessment methodology. However, as both refer to natural feedstock preservation,they should follow the same trends, yet they do not.
The MCI methodology contains many limitations. For instance, systemboundaries definition is narrower than in LCA, which makes the MCI ineffective toprevent from consequences of shifting resources consumption at macro scale as itrefers only to one specific resource at the foreground level. Moreover, it excludesenergy flows which entail neither consideration for the fuel consumption due to theincreased rolling resistance nor for end-of-life energy recovery routes. Whereas, theLCA resource indicator refers to the marginal increase in costs for future extractiondue to the extraction of a resource over the life cycle of the assessed product, i.e. theadditional costs society has to pay as a result of an extraction [17], embodyingresource depletion issues, unlike the MCI.
Finally, as the CE is meant to contribute to a sustainable development, the othersustainability dimensions are also relevant concerns. Not only social aspects arehere neglected, but excluding economic factors fails to account for the dreaded
40 G. Lonca et al.

rebound effects as per the Jevons’ paradox. Economic features require specialattention for future research in the field for the preceding reason, and also to assessabsolute improvements on both natural resource and pollution reservoir preserva-tion according to the approach presented in this paper.
5 Conclusion
Through this work, we developed a novel bi-dimensional approach to measure theperformance of circular economy beyond the sole objective of resource preserva-tion. It allows a straight forward interpretation of MCI and LCA results revealingtrade-offs between improved material circularity and the risk of burden shifting overgiven LCA damages categories. A case study comparing 2 end-of-life tire man-agement CE strategies revealed that re-grooving offers a fully decoupled pathway,compared to re-treading where trade-offs are identified with the increase of potentialhuman health and resources damages. In fact, re-treading worse off impacts onhuman health by only 2.72%, while improving circularity by 31.1% from thebaseline scenario, we could question the significance of such results. Performing anuncertainty analysis would help to get fair conclusions on this issue.
To identify resource impact category as one particular environmental reservoirsubset is controversial in the approach we propose. This point definitely requiresfurther clarifications for which we recommend future research on CE tools to focuson the connection between micro scale and macro scale assessment. Substantialimprovements should be made on the MCI, as it fails to prevent from any kind ofburden shifting by excluding energy and background flows of its boundaries def-inition. Although the bi-dimensional analysis provides a good representation oftrade-off issues, it is relative to a baseline scenario whereas absolute values arepreferable, requiring economic features to be included as well.
References
1. Hotelling H, The economics of exhaustible resources, Journal of political Economy, 1931. 39(2): p. 137–175.
2. Kampelmann S, Mesurer l’économie circulaire à l’échelle territoriale, Revue de l’OFCE, 2016(1): p. 161–184.
3. Geyer R, et al., Common misconceptions about recycling, Journal of Industrial Ecology,2015.
4. Bihouix P, L’Âge des low tech. Vers une civilisation techniquement soutenable, Éditions duSeuil, collection Anthropocène, 2014.
5. Bihouix P, De Guillebon B, Quel futur pour les métaux? raréfaction des métaux: un nouveaudéfi pour la société, 2010: EDP sciences.
6. Cooper D.R, Gutowski T.G, The Environmental Impacts of Reuse: A Review, Journal ofIndustrial Ecology, 2015.
A Bi-dimensional Assessment to Measure the Performance … 41
7. Su B, et al., A review of the circular economy in China: moving from rhetoricto implementation, Journal of Cleaner Production, 2013, 42: p. 215–227.
8. Elia V, Gnoni M.G, Tornese F, Measuring circular economy strategies through indexmethods: A critical analysis, Journal of Cleaner Production, 2017, 142: p. 2741–2751.
9. European Environmental Agency, Circular Economy in Europe—Developing the KnowledgeBase (No. 2), 2016.
10. Park J.Y, Chertow M.R, Establishing and testing the “reuse potential” indicator for managingwastes as resources, Journal of environmental management, 2014, 137: p. 45–53.
11. Di Maio F, Rem P.C, A robust indicator for promoting circular economy through recycling,Journal of Environmental Protection, 2015, 6(10): p. 1095.
12. Ellen Mc Arthur Foundation and Granta Design, Circularity indicators: an approach tomeasuring circular economy, in Project Overview, 2015.
13. Linder M, Sarasini S, Loon P, A Metric for Quantifying Product‐Level Circularity, Journal ofIndustrial Ecology, 2017.
14. Perman R, Natural resource and environmental economics, Pearson Education, 2003.15. Victor P.A, Indicators of sustainable development: some lessons from capital theory,
Ecological economics, 1991, 4(3): p. 191–213.16. Jackson T, Senker P, Prosperity without growth: Economics for a finite planet, Energy &
Environment, 2011. 22(7): p. 1013–1016.17. Goedkoop M, et al., ReCiPe 2008, A life cycle impact assessment method which comprises
harmonised category indicators at the midpoint and the endpoint level, 2009. 1.
Open Access This chapter is licensed under the terms of the Creative Commons Attribution 4.0International License (http://creativecommons.org/licenses/by/4.0/), which permits use, sharing,adaptation, distribution and reproduction in any medium or format, as long as you give appropriatecredit to the original author(s) and the source, provide a link to the Creative Commons license andindicate if changes were made.The images or other third party material in this chapter are included in the chapter’s Creative
Commons license, unless indicated otherwise in a credit line to the material. If material is notincluded in the chapter’s Creative Commons license and your intended use is not permitted bystatutory regulation or exceeds the permitted use, you will need to obtain permission directly fromthe copyright holder.
42 G. Lonca et al.
Bio-based Materials Within the CircularEconomy: Opportunities and Challenges
Birgit Brunklaus and Ellen Riise
Abstract In a circular society, material consumption should be a circular processwhere renewable resources and waste streams are used for new bio-based materials.In such a society, bio-based materials are also reused, repaired, recycled, andremanufactured. Not only choices on resources, but also other life cycle choicespertaining to circularity must be done based on technological, environmental andeconomic basis. For this session, presentations and discussions regarding life cyclemanagement of bio-based materials were suggested. The session had five oralpresentations and six poster presentations that gave a general picture of a broaderenvironmental and a positive economic result on a life cycle basis when renewableraw materials are used, while further exploration of the technical aspects withincircularity and end-of-life challenges are needed in the future.
1 Introduction
The linear economy is based on the notion “Take, make and dispose”, which is notin line with resource restriction posed on society today. Instead, there is a need foran economy that aims for circularity based on the notion “Restore, rebuilt andregenerate”. In a circular society, material consumption should be a circular processwhere both renewable resources as well as finite resources are reused, recovered orrecycled, inducing not only choices on resources, but also other life cycle choicespertaining to circularity that must be done based on technological, environmentaland economic basis. This turns the linear life cycle “upside-down” to some extent
B. Brunklaus (&)RISE Research Institutes of Sweden, Energy and Circular Economy,Sustainable Society, Energy and Environmental Systems Analysis,41296 Göteborg, Swedene-mail: [email protected]
E. RiiseEssity, SCA Hygiene Products AB Group Function Sustainability,40503 Göteborg, Sweden
© The Author(s) 2018E. Benetto et al. (eds.), Designing Sustainable Technologies,Products and Policies, https://doi.org/10.1007/978-3-319-66981-6_5
43
since it also puts another value of resources that earlier was only regarded as wasteand as a burden to be minimised. This is one of the differences to be considered inthe life cycles of the two material streams, linear and circular. In circular materialstreams, there are also some differences to be done when considering renewableresources or finite resources cycles. Therefore, the session was focusing on circu-larity opportunities and challenges for bio-based materials.
2 Session Contributions
For this session, both theoretical and practical examples, relating to a variety ofindustrial sectors and bio-based materials were welcomed, and the submission ofabstracts resulted in five oral presentations and six posters. The session ended witha brief panel discussion where the presenters were invited to share their view on thevariety of challenges and opportunities for their product or sector.
2.1 Oral Presentations
The first presentation on “Wood products circularity and the biodiversity challenge”was given by Christian Bauer, SIG [1]. Wood is a major input for many circularproducts, including half of all packaging material. Within the assessment methodsto quantify the circularity potential, such as Life Cycle Assessment, there arelimitations regarding the evaluation of impacts on biodiversity, for instance due tothe complexity of the characterization of land use and land use change, and to thelack of consideration of forest management on landscape level and labelling, asdone through certified forestry management. Therefore, practitioners anddecision-makers prefer to look at other impact categories, such as climate changeand water use. Starting from the existing work of UNEP SETAC and other sig-nificant existing methods, a new methodology relying on landscape managementsystem was proposed in order to establish characterization factors aiming at inte-grating forest management practices and biodiversity.
The second presentation by Serenella Sala, European Commissions had the title“Bioeconomy contribution to Circular Economy” [2]. Focusing on food waste, thepresentation demonstrated the potential for circularity from the bio-economy andhighlighted the added-value and shortcomings of Life Cycle Thinking basedapproaches applied as supporting tools. Based on the quantification of food lossesand waste at the EU scale, and the valorisation options, LCT and LCA approacheswere applied in order to support the identification of the best options. The mainchallenges in order to improve LCT methods are related to the characterization ofbiotic resources in LCIA, and to the integration of eco-system, water, food, land andenergy into LCA, considering all these issues as correlated.
44 B. Brunklaus and E. Riise

“Assessing the availability of bio-based materials in product design” was pre-sented by Vanessa Bach from TU Berlin [3]. The use of bio-based materials can beconsidered as a key strategy in eco-design approach, also contributing to circulareconomy at some points. However, several socio-economic factors induced bymarket conditions or disrupting political structures within society can constraintheir availability. The presented work proposed a method for assessing bio-basedmaterials availability constraints, aiming at supporting eco-design strategies. Themethod considers five main sources of constrains (environmental, socio-economicand physical constraints to plants growth), over the materials supply chain, andresults in a set of availability indicators. For this study, the indicators were appliedto energy-related products, such as production of biodiesel from rapeseed and soybeans, and showed that the indicators seem appropriate and that interpretation leadsto meaningful conclusions while methodological robustness of some indicatorscould be refined.
The fourth presentation dealt with “Integratedmarket orientation in technical R&Dprocesses—opportunities and challenges for environmentally friendly bio-basedresins” by Miriam Lettner from K Plus, Austria [4]. The use of lignin, anunder-utilized by-product from the pulp and paper industry, has the potential to beused as a valuable source for sustainable bio-based products. The market assessmentof emerging lignin products aims at support R&D process by providing informationon challenges and opportunities for such products at early design stage. Based on theSmartli H2020 project outcomes and a case study performed with Delphi, it wasshown that the life cycle thinking integrated technical R&D processes based on theinvolvement of stakeholders and on a multi-perspective assessment (economic,environmental and technological) of newly developed products are highly valuable toface the barriers and incentives for the product market diffusion.
Sebastian Sperling, Institute for Bioplastics and Bio-composites, University ofHannover, gave the presentation “The sustainability of bio-based plastics—quanti-fying environmental and socio-economic aspects of a computer mouse for a circulareconomy” [5]. Through the presentation of the environmental and socio-economicimpacts of a bio-based plastic housing of a computer mouse, the importance ofsourcing bio-based plastics and the associated social aspects in different countries wasrevealed, despite the fact that these socio-economic aspects are often neglected and theavailability of such information is limited. An important conclusion is that a jointguideline for bio-based plastic and fossil-based plastics is needed to reduce themethodological gaps existing for the assessment for such materials.
3 Messages and Outcomes of the Session
The messages and outcomes of the session are manifold. Among the bio-basedprocesses there are both the well-proven processes (e.g. corn-based) and newprocesses (e.g. waste-based), which span a large technical variety of technologicalopportunities for the future to match with the objectives of circular economy.
Bio-based Materials Within the Circular Economy: Opportunities … 45

However, the session demonstrated that to ensure the sustainability of these pro-cesses and materials, it is required to develop further the characterization of therelated environmental impacts, and to integrate the systematic assessment ofsocio-economic aspects along the bio-based products value chain. Also thewaste-based processes will turn the waste into economic value and so would reversethe value chain from end-of-life to new resource, leading to adapt consideration inLife Cycle modelling approaches. Indeed, taking the example of wood-based ligninor coconut fibre as waste-based (by-product) bio-materials, they become morevaluable than the main product (timber, coconut), which leads to rethink the allo-cation system from mass to economic allocation.
At the end of the session, every presenter got the chance to give their view on thevariety of challenges: the technical, the environmental or the economic challenge,as well as future implications. The discussion addressed many new aspects, such asthe variety of related environmental and socio-economic challenges (impacts onbiodiversity [1], resource availability and market of bio-based materials [3–5]),while the technical challenges were addressed in a lower extent.
4 Future Perspectives Based on the Session
The opportunity of bio-based materials to contribute to circular economy goes handin hand with challenges mentioned for the business society, such as the challenge ofreverse logistics and infrastructure, the new resource management and value cre-ation from no cost waste to high profit products, the business opportunity to createnew services, placing the consumer at the centre of the value chain.
Bio-based materials within the circular economy are one of the emerging areaswhere life cycle management can connect bio-based resources supply chain man-agement with waste management systems. One of the next practical challenge forbio-based materials will be the management of their End of Life (EoL). Indeed,these resources and products they are part of will be sooner or later subject toEuropean waste legislation or directives, as it is already the case for many sectors inEurope. For instance EoL directives exist for the automotive and electronic prod-ucts, setting high targets for products and materials recycling and/or reuse rates. Atthe time these objectives are not achievable for bio-based materials and products,due to the lack of technological solutions. However, the biodegradability of some ofthese resources could present an advantage.
To our knowledge there are several other technical challenges based on ongoingand recent research projects the Research Institute of Sweden RISE have beeninvolved in with the area of: food waste and bio-refinery, eco-cycle in buildingconstruction, forest-based plastics, recycling of green plastics and industrial waste.Within the construction sector, companies recycle and apply their products, butrarely sell further or even buy recycled products! Within bio-based plastics thedurability and quality requirements for industrial products are important, while the
46 B. Brunklaus and E. Riise
health aspects are important for consumer products. Within bio-based waste andbio-refineries the upgrading process is essential and the downcycling of poorerquality products occurs.
References
1. Vionnet S, Bauer C, Cockburn D, Brunberg B, Stevenson M, Wood products circularity andthe biodiversity. challenge, LCM 2017 Conference, Luxembourg, 2017.
2. Sala S, Bioeconomy contribution to Circular Economy, International Conference on Life CycleManagement, 3–6 September, Luxemburg, 2017.
3. Bach V, Berger M, Finogenova N, Finkbeiner M, Assessing the availability of bio-basedmaterials in product design, LCM 2017 Conference, Luxembourg, 2017.
4. Lettner M, Greiner D, Stern T, Hesser F, Integrated Market Orientation in Technical R&DProcesses—Opportunities and Challenges for environmentally Friendly Bio-Based Resins,LCM 2017 Conference, Luxembourg, 2017.
5. Spierling S, Knüpffer E, Venkatachalam V, Mudersbach M, Behnsen H, Krieg H, Albrecht S,Endres H-J, The sustainability of bio-based plastics—quantifying environmental andsocio-economic aspects of a computer mouse for a circular economy, LCM 2017Conference, Luxembourg, 2017.
Open Access This chapter is licensed under the terms of the Creative Commons Attribution 4.0International License (http://creativecommons.org/licenses/by/4.0/), which permits use, sharing,adaptation, distribution and reproduction in any medium or format, as long as you give appropriatecredit to the original author(s) and the source, provide a link to the Creative Commons license andindicate if changes were made.The images or other third party material in this chapter are included in the chapter’s Creative
Commons license, unless indicated otherwise in a credit line to the material. If material is notincluded in the chapter’s Creative Commons license and your intended use is not permitted bystatutory regulation or exceeds the permitted use, you will need to obtain permission directly fromthe copyright holder.
Bio-based Materials Within the Circular Economy: Opportunities … 47

Bio-Economy Contribution to CircularEconomy
Sara Corrado and Serenella Sala
Abstract European policies are advocating a transition toward “bio-economy”, aneconomy aiming at reducing the dependence from fossil-based resources, limitinggreenhouse gas emissions and environmental impacts, safeguarding food securityand ensuring a sustainable economic growth. Besides, circular economy policies areaiming at closing the loop of resources as much as possible. The application ofcircular economy principles to bio-economy could represent a valuable contributionto bio-economy performance optimisation. The present paper investigates thecontribution of bio-economy to circular economy. It proposes a conceptualframework to assess the potential for circularity for bio-waste and relatedby-products and it puts forward some considerations on the application of thisframework to food waste. However, both bio-economy and circular economy mayimply environmental burdens if an integrated assessment encompassing all lifecycle stages of production and consumption is missing. Hence, adopting life cycleassessment is crucial to unveil trade-offs and ensuring identifying the best optionsfor bio-economy and circular economy implementation.
1 Introduction
Natural resources provided by the Earth, both biotic and abiotic (i.e. raw materials,energy, water, air, land and soil as well as biodiversity and ecosystems) representcrucial economy and life-support elements for human societies worldwide. Indeed,natural resources are a building block in the supply chain, thus pushing the eco-nomic growth, and providing global functions, as in climate regulation. However,in a globalised world where population is in continuous expansion and the demandfor finite resources continues to increase, the current production and consumptionpatterns in developed and developing countries are generating concerns about their
S. Corrado � S. Sala (&)European Commission, Joint Research Centre, Directorate D-Sustainable Resources,Bio-Economy Unit, via Enrico Fermi 2749, 21027 I-Ispra, VA, Italye-mail: [email protected]
© The Author(s) 2018E. Benetto et al. (eds.), Designing Sustainable Technologies,Products and Policies, https://doi.org/10.1007/978-3-319-66981-6_6
49
sustainability, with particular regard to the potential repercussion on the environ-ment and climate. On such a background, a transition toward bio-based economy,called “bio-economy”, represents an opportunity to comprehensively addressinter-connected societal challenges such as food security, natural resource scarcity,fossil resource dependence and climate change, while achieving sustainable eco-nomic growth [1, 2]. However, not only fossil-based products carry an environ-mental burden, but also bio-based ones. Furthermore, the use of bio-based resourcesmay raise issues on land competition for food production. Hence, to be effective,bio-economy strategies should be founded on resource efficiency andeco-innovation principles [3].
The concept of circular economy—a system in which the final disposal of wasteand by-products is minimised by promoting their reuse and valorisation—can besuccessfully applied to bio-based production chains. Recent research developments,indeed, have highlighted several options for the conversion of bio-waste andbio-based by-products into either bioenergy, biofuels or valuable secondary rawmaterials [4]. Bio-based waste, indeed, represents a considerable amount of materialat the global level, in the order of magnitude of gigatonnes per year [5]. Thebio-economy contribution to circular economy may arise from very differenttypologies of bio-based products, such as wood, food, fibres, leathers and rubbers.Moreover, each step in the supply chain of bio-based products may provide wasteor by-products with different characteristics, which can be valorised in various ways[2].
The present paper proposes a framework which may unveil the potential forcircularity of bio-waste and bio-based by-products, coherently with the Europeanlegislative framework for waste management [6]. Furthermore, some considerationson the application of such framework to food waste and by-products, taken as acase-study are reported. Firstly, strengths and weaknesses of existing data sourcesand estimations approaches for food waste and by-products accounting are high-lighted. Then, an overview of the options for valorisation for food waste andby-products is presented. Finally, the challenges of optimising the use of Life CycleAssessment (LCA) when assessing the environmental performance of bio-economyvalue chains are discussed.
2 Valorisation of Bio-Waste and Bio-Based By-Products
In the European context, bio-economy is considered an important area of research,whose potential has still to be further disclosed. At present, the production ofbio-materials and bioenergy is using about 36% of the biomass in Europe.However, further investigations are required to evaluate the potential availability ofadditional biomass, currently unused, without compromising the positive effectsthat biomass not removed from the field may have on soil fertility [7]. In thiscontext, the European bio-economy sector is growing, showing a 7% increase in theturnover between 2008 and 2014. Particularly, some bio-economy branches
50 S. Corrado and S. Sala

increased faster than others and the highest turnover rise occurred in the manu-facturing of liquid biofuels (+25%), the production of bio-based chemicals, phar-maceuticals, plastics and rubber (+22%), and in the forestry sector (+21%) [2].Furthermore, biofuels use is estimated to increase and cover between 27% and 48%of road transport fuel need in 2030 [8], whereas the demand for bioplastics, cur-rently representing 1% of the total plastic used in Europe, is expected to increase by50% in the period 2016–2021 [9].
Nowadays, the use of bio-waste and bio-based residues in bio-refineries is still aniche. Indeed, despite bio-waste and bio-based residues are potential sources ofseveral high-values compounds [15], technical and non-technical barriers, such asuncertainty on the quality of materials and limited experiences at the industrialscale, are currently affecting the diffusion of their cascading use [10]. Therefore,further investigations on the practicability of valorisation strategies based on aholistic perspective are needed to foster the contribution of bio-economy to circulareconomy.
3 Assessing the Potential for Circularity: The OverallConceptual Framework and Application to Food Waste
In order to assess the potential for circularity of bio-waste and bio-basedby-products, a conceptual framework has been defined. It aims to guide in theidentification of most preferable valorisation options for bio-based waste andby-products streams, as defined within the European legislation on waste [6](Fig. 1). Therefore, it can be applied for either the identification of valorisationroutes for material streams commonly disposed or the investigation of more valu-able options for material flows, which are already somehow valorised.
The proposed framework, for which an example of application to food waste isreported in Fig. 2, combines the principles of the European waste hierarchy [6] andthe European circular economy action plan for biomass and bio-based products[11], which promotes cascading use of renewable resource, with several reuse andrecycling cycles. The underlying and key principle for defining the hierarchy ofpreferred actions is the minimisation of the dissipative use of high-value resourcesand the maximisation of the cascading use of bio-materials, meaning that reusedbio-materials or the residues from the extraction of high values compounds may bereused for other purposes, e.g. animal feeding. Coherently with the European WasteFramework Directive [6], the proposed logical framework considers that a departurefrom the “standard” hierarchy may be justified according to the environmentalpreferability criterion, evaluated through a life cycle thinking approach. Otheridentified elements, which may limit the applicability of a certain valorisation route,are technical feasibility, economical profitability and legislation compliance.
Waste prevention should, in principle, be the preferred option. However, thismight not be applicable, e.g. in case of certain by-products unavoidably deliveredby a transformation process, such as bones and peels separated from the edible
Bio-Economy Contribution to Circular Economy 51

fractions of food or sawdust generated during wood transformation. The secondoption, the re-use, implies that the material can be utilised for the same purpose forwhich it was initially conceived. It applies, for example, to the harder discardedfractions of vegetables, which may be not suitable to be eaten directly, but can beused in the other preparations, such as soups. Bio-waste and by-products allow awide range of recycling options, and their preferability strongly depends on thematerial characteristics, e.g. homogeneity and composition. Lignocellulosic bio-mass, for example, is composed mainly by the polymers cellulose, hemicelluloseand lignin and the specific content of each of them may influence the preferableoption for valorisation [12]. Furthermore, the extraction of high-value compoundsis practicable when a homogeneous material stream is available, whereas it is hardlyfeasible in case of heterogeneous streams. Among the less preferable recyclingoptions, anaerobic digestion was considered better than composting, because itallows a less dissipative use of the bio-based resources, recycling nutrients andproducing methane at the same time. It has to be noted that the hierarchy could besubjected to modifications, according to specific sustainability priorities. Forexample, the maximisation of the uses for sustaining the food system may implygiving preference to the use of food waste as animal feed, rather than to be exploitedas basis for bio-based materials.
Considering Fig. 2, “practicable” implies that the option is environmentallypreferable, technically feasible, economically profitable and compliant to
Definitions according to the European Waste Framework Directive [6]:- waste: any substance or object which the holder discards or intends or isrequired to discard;- bio-waste: biodegradable garden and park waste, food and kitchen waste fromhouseholds, restaurants, caterers and retail premises and comparable waste fromfood processing plants;- by product: substance or object, resulting from a production process, theprimary aim of which is not the production of that item, may be regarded as notbeing waste referred to in point (1) of Article 3 but as being a by-product onlyif the following conditions are met:
(a) further use of the substance or object is certain;(b) the substance or object can be used directly without any further processing
other than normal industrial practice;(c) the substance or object is produced as an integral part of a production
process; and(d) further use is lawful, i.e. the substance or object fulfils all relevant
product, environmental and health protection requirements for the specific useand will not lead to overall adverse environmental or human health impacts.
Fig. 1 Definitions reported in the European Waste Framework Directive [6]
52 S. Corrado and S. Sala
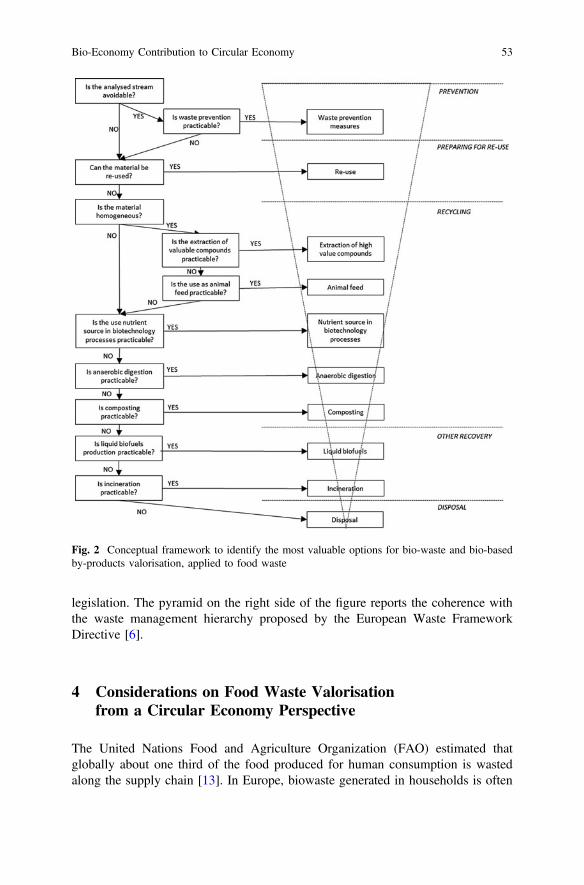
legislation. The pyramid on the right side of the figure reports the coherence withthe waste management hierarchy proposed by the European Waste FrameworkDirective [6].
4 Considerations on Food Waste Valorisationfrom a Circular Economy Perspective
The United Nations Food and Agriculture Organization (FAO) estimated thatglobally about one third of the food produced for human consumption is wastedalong the supply chain [13]. In Europe, biowaste generated in households is often
Fig. 2 Conceptual framework to identify the most valuable options for bio-waste and bio-basedby-products valorisation, applied to food waste
Bio-Economy Contribution to Circular Economy 53

mixed with other waste [14]. However, food waste has generally a moisture contentsuch that makes it unsuitable for incineration or thermal treatment and its presencein landfills may raise environmental concerns due to the production of leachate andmethane emissions [15]. Therefore, this huge amount of bio-based materials rep-resents a considerable potential contribution of bio-economy to circular-economy,which not only may optimise resources use, but also help facing the problem offood waste management.
4.1 Food Waste Generation Accounting
Being aware of the extent and the type of the waste and by-products streams is thefirst step towards the identification of valuable valorisation pathways for bio-basedmaterials in general, including food waste [11]. Food waste and by-productsgeneration encompasses all the stages of the food supply chain, from primaryproduction to consumption. Therefore the adoption of a life cycle thinking(LCT) approach for supporting the accounting is advisable to fully capture thepotentialities of food waste and by-products valorisation.
Currently, waste generation has been investigated on different geographicalscales and breakdowns of the food supply chain (Fig. 3). Besides its relevance foraddressing the type of food waste accounting, the matrix in Fig. 3 is also useful forthe definition of specific interventions. For example, data on food waste for aspecific commodity group at national/regional level may allow depicting tailoredscenarios of food waste valorisation.
Results of the studies may differ due to various elements, such data sources,quantification methods, food waste definitions, system boundaries. The selection ofthe waste flows accounted may be a critical element, influenced by food wastedefinition and data sources considered. In the study by FAO on global food wastegeneration [13], for example, only the edible fractions of food are accounted,whereas inedible parts such as bones and fruit peels are excluded. Another criti-cality may be the inhomogeneity and the uncertainty of statistical data, which maylimit the comparability of statistical data provided by different countires [13, 16].
These criticalities highlight the need of an accurate understanding of theunderlying assumptions on the quantification approaches, in the interpretation ofexisting studies [17].
4.2 Valorisation of Food Waste, Possible Options
The rapidly growing attention for the circular use of bio-based resources has led tothe realisation of several studies exploring potential for circularity for food wasteand by-products. Not all the analysed solutions are currently developed at theindustrial scale application [18].
54 S. Corrado and S. Sala
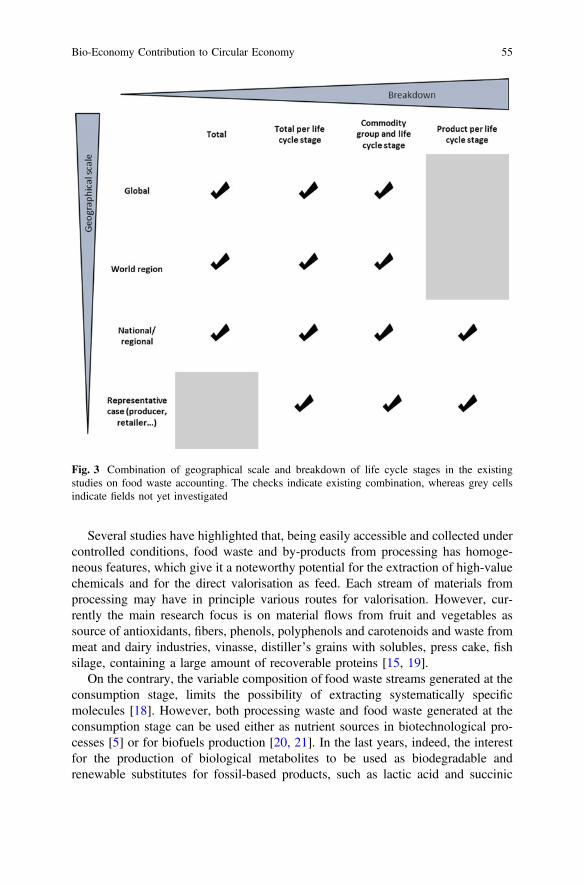
Several studies have highlighted that, being easily accessible and collected undercontrolled conditions, food waste and by-products from processing has homoge-neous features, which give it a noteworthy potential for the extraction of high-valuechemicals and for the direct valorisation as feed. Each stream of materials fromprocessing may have in principle various routes for valorisation. However, cur-rently the main research focus is on material flows from fruit and vegetables assource of antioxidants, fibers, phenols, polyphenols and carotenoids and waste frommeat and dairy industries, vinasse, distiller’s grains with solubles, press cake, fishsilage, containing a large amount of recoverable proteins [15, 19].
On the contrary, the variable composition of food waste streams generated at theconsumption stage, limits the possibility of extracting systematically specificmolecules [18]. However, both processing waste and food waste generated at theconsumption stage can be used either as nutrient sources in biotechnological pro-cesses [5] or for biofuels production [20, 21]. In the last years, indeed, the interestfor the production of biological metabolites to be used as biodegradable andrenewable substitutes for fossil-based products, such as lactic acid and succinic
Fig. 3 Combination of geographical scale and breakdown of life cycle stages in the existingstudies on food waste accounting. The checks indicate existing combination, whereas grey cellsindicate fields not yet investigated
Bio-Economy Contribution to Circular Economy 55
acid, is growing fast [5, 18]. Furthermore, the valorisation of food waste for theproduction of bioethanol, biogas, hydrogen and biodiesel has attracted increasingattention [20].
4.3 LCA Applied to Bio-Economy Value Chains:Future Challenges
The assessment of the environmental preferability of the different pathways is oneof the pillars of the proposed conceptual framework. On such purpose, the use ofLCA, based on LCT approach, has had large diffusion both in the research and inthe legislative fields. LCA, indeed, has been widely used to compare different wastemanagement and treatment options [22, 23] and to assess the environmental per-formance of various bio-economy value chains [24, 25]. Furthermore, LCT is at thecore of the European policies on waste management [6] to support the identificationof the most environmentally sound options. One of the main advantages of thisapproach is the accounting of the so-called burden shifting, namely the transfer ofenvironmental impacts between environmental compartments or supply chainstages, which may happen when pushing for resource efficiency. However, despiteLCA broad acceptance and diffusion, past experiences have highlighted someshortcomings, which may limit a clear quantitative understanding of the environ-mental aspects of bio-economy value chains [25]. These shortcomings encompassboth the product system modelling and the impact assessment side.
As mentioned previously, the interest for the valorisation of food waste andby-products as a resource is quite recent, therefore inventory data on innovativerecovery processes are currently lacking. Besides, when considering circular sys-tem, setting the system boundaries may not be straightforward, influencing con-siderably the results of the study [26, 27]. Allocation of impacts can be anotherissue when dealing with food waste valorisation. Indeed, the production of foodwaste or by-product is, per definition, not the first target of the food system.Therefore, all the steps of the food supply chain, from primary production toconsumption, can be considered multi-functional processes delivering food andfood waste or by-products. The approach used to partition the impacts betweenco-products, namely, e.g., system expansion, bio-physical allocation or economicallocation, can importantly influence the LCA results and consequent considera-tions on food waste [28], limiting, therefore, their comparability [25]. Furthermore,if allocation of the impacts is performed, the allocation criteria can influenceimportantly the environmental performance of a bio-based product. For example, aby-product, which is commonly disposed has no economic value, whereas if itstarts to be valorised as resource it would probably acquire economic value. Ifeconomic allocation is performed, the environmental burden of the by-product willincrease together with its commercial value, with the potential risk of reaching orovercoming the environmental impacts of the virgin material, which is supposed to
56 S. Corrado and S. Sala
substitute. On the contrary, bio-physical allocation may attribute to the by-product aconsiderable burden of the production process, above all when a huge amount ofby-product is delivered.
Concerning the impact assessment, Cristobal and colleagues [25] noted that it isa common practice to consider only a narrow number of impact categories, affectingthe comprehensiveness of the results. Besides, some impact categories are based onweak calculations models, which limit their applicability. Furthermore, impactcategories traditionally considered in LCA are often not enough to capture theenvironmental pressures exerted by food waste generation [26]. The impacts onbiotic resources, for example, are generally not investigated in LCA [29]. Otherrelevant impact categories are still under refinement for being comprehensive inaddressing issues such soil quality, biodiversity, water scarcity. All these aspectsare crucial when accounting for the impacts of food waste or when comparing theenvironmental performance of bio-based and fossil-based products.
5 Conclusions
Applying circular economy principles to bio-economy represents a valuableopportunity for our society, which is called to cope with complex and importantchallenges, such as food security, competition for natural resources, fossil resourcesdependence and climate change.
A broad range of options exists for valorising bio-based waste and by-products,including already accomplished and innovative solutions, and the present paperintroduced a conceptual framework to support the identification of the most valu-able ones. The application of such framework is not straightforward, reflecting thecomplexity of multi-criteria decision-making processes and of the biological sys-tems to which it is applied.
The main elements of the framework have been briefly introduced and discussedin relation to a specific type of bio-based material: food waste and relatedby-products. The accounting of food waste should be based on LCT, encompassingall the potential sources of food waste within the supply chain. Existing estimationsshowed some shortcomings mainly due to lack of data, uncertainties and datainhomogeneity, therefore their interpretation requires a deep knowledge of theunderlying assumptions. The exploration of valorisation routes for food waste andbio-based by-products have raised considerable interests in the last years in theresearch field, however, part of the innovative solutions need to be further inves-tigated, assessing their applicability at the industrial scale. Finally, LCA has showngreat potentialities in supporting the assessment of the most preferable environ-mental options for food waste management, however still some efforts are needed toimprove the comprehensiveness and robustness of LCA applied to bio-based andcircular systems.
Bio-Economy Contribution to Circular Economy 57
Future industrial developments focused on valorisation of food waste should bebased on robust accounting of available quantities, analysis of techno-economicpotential coupled with life cycle based environmental assessment of benefits andburdens.
References
1. European Commission (EC), Innovating for Sustainable Growth: A Bioeconomy for EuropeCommunication from the Commission, COM (2012) 60.
2. Ronzon T, Lusser M, Klinkenberg M (ed.), Landa L, Sanchez Lopez J (ed.), M’Barek R,Hadjamu G (ed.), Belward A (ed.), Camia A (ed.), Giuntoli J, Cristobal J, Parisi C, Ferrari E,Marelli L, Torres de Matos C, Gomez Barbero M, Rodriguez Cerezo E, Bioeconomy Report2016. JRC Scientific and Policy Report, 2017.
3. Mahro B, Timm M, Potential of biowaste from the food industry as a biomass resource,Engineering in Life Science, Vol. 7, No. 5, 2007, pp. 457–468.
4. Mohan S.V, Nikhil G.N, Chiranjeevi P, Reddy C.N, Rohit M.V, Kumar A.N, Sarkar O, Wastebiorefinery models towards sustainable circular bioeconomy: critical review and futureperspectives, Bioresource technology, Vol. 215, 2016, pp. 2–12.
5. Pleissner D, Qi Q, Gao C, Rivero C.P, Webb C, Lin C.S.K, Venus J, Valorization of organicresidues for the production of added value chemicals: a contribution to the bio-basedeconomy, Biochemical Engineering Journal, Vol. 116, 2016, pp. 3–16.
6. European Parliament, Directive 2008/98/EC of the European Parliament and of the Council of19 November 2008 on waste and repealing certain Directives, DIRECTIVE 2008/98/EC.
7. Ronzon T, Santini F, M’Barek R, The Bioeconomy in the European Union in numbers – Factsand figures on biomass, turnover and employment, European Commission, Joint ResearchCentre, Institute for Prospective Technological Studies, Spain, 2015.
8. European Commission (EC), Biofuels in the European Union – A vision for 2030 andbeyond, 2006.
9. European Bioplastics, Nova Institute, Bioplastics market data, 2016.10. Ladu L, Quitzow R, Bio-Based Economy: Policy Framework and Foresight Thinking,
Springer International Publishing, 2017.11. European Commission (EC), Closing the loop – An EU action plan for the Circular Economy,
COM (2015) 0614.12. Isikgor F.H, Becer C.R, Lignocellulosic biomass: a sustainable platform for the production of
bio-based chemicals and polymers. Polymer Chemistry, Vol 6 (25), 20015, pp. 4497–4559.13. Food and Agriculture Organization of the United Nations (FAO), Global food losses and food
waste – Extent, causes and prevention, 2011.14. European Commission (EC), Measuring progress towards circular economy in the European
Union – Key indicators for a monitoring framework, SWD (2018) 17 final.15. Mirabella N, Castellani V, Sala S, Current options for the valorization of food manufacturing
waste: a review. Journal of Cleaner Production, Vol. 65, 2014, pp. 28–41.16. Monier V, Mudgal S, Escalon V, O’Connor C, Gibon T, Anderson G, Morton G, Preparatory
study on food waste across EU 27, Report for the European Commission [DG ENV—Directorate C], 2010.
17. Tostivint C, Östergren K, Quested T, Soethoudt J.M, Stenmarck A, Svanes E, O’Connor C,Food waste quantification manual to monitor food waste amounts and progression, 2016.
18. Girotto F, Alibardi L, Cossu R, Food waste generation and industrial uses: a review, WasteManagement, Vol. 45, 2015, pp. 32–41.
19. Tuck C, Pérez E, Horváth I.T, Sheldon R.A, Poliakoff M, Valorization of Biomass: DerivingMore Value from Waste, Science, Vol. 337, 2012, pp. 695–699.
58 S. Corrado and S. Sala
20. Kiran E.U, Trzcinski A. P, Ng W.J, Liu Y., Bioconversion of food waste to energy: a review,Fuel, 2014, Vol. 134, 2014, pp. 389–399.
21. Pham T. P. T, Kaushik R, Parshetti G. K, Mahmood R, Balasubramanian, R, Foodwaste-to-energy conversion technologies: Current status and future directions, WasteManagement, Vol. 38, 2015, pp. 399–408.
22. Manfredi S, Cristobal J, de Matos C.T, Giavini M, Vasta A, Sala S, Tuomisto H, ImprovingSustainability and Circularity of European Food Waste Management with a Life CycleApproach, JRC technical report, 2015.
23. Laurent A, Bakas I, Clavreul J, Bernstad A, Niero M, Gentil E, Christensen T.H, Review ofLCA studies of solid waste management systems–Part I: Lessons learned and perspecties,Waste Management, Vol. 34, No. 3, 2014, pp. 573–588.
24. Secchi M, Castellani V, Collina E, Mirabella N, Sala S, Assessing eco-innovations in greenchemistry: Life Cycle Assessment (LCA) of a cosmetic product with a bio-based ingredient,Journal of Cleaner Production, Vol. 129, 2016, pp. 269–281.
25. Cristóbal J, Torre de Matos C, Aurambout J.P, Manfredi S, Kavalov B, Environmentalsustainability assessment of bioeconomy value chains, Biomass and Bioenergy, 89, 2016,159–171.
26. Corrado S, Ardente F, Sala S, Saouter E, Modelling of food loss within life cycle assessment:from current practice towards a systematisation, Journal of Cleaner Production, Vol. 140,2017, pp. 847–859.
27. Saraiva A.B, System boundary setting in life cycle assessment of biorefineries: a review,International Journal of Environmental Science and Technology, Vol. 14, No. 2, 2017,pp. 435–452.
28. Bernstad A.K, Cánovas A, Valle R, Consideration of food wastage along the supply chain inlifecycle assessments: A mini-review based on the case of tomatoes, Waste Management &Research, Vol. 35, No. 1, 2017, pp. 29–39.
29. Crenna E, Sozzo S, Sala S, Natural biotic resources: towards an impact assessment frameworkfor sustainable supply chain management, Journal of Cleaner Production, Vol. 172, 2017,pp. 3669–3684.
Open Access This chapter is licensed under the terms of the Creative Commons Attribution 4.0International License (http://creativecommons.org/licenses/by/4.0/), which permits use, sharing,adaptation, distribution and reproduction in any medium or format, as long as you give appropriatecredit to the original author(s) and the source, provide a link to the Creative Commons license andindicate if changes were made.The images or other third party material in this chapter are included in the chapter’s Creative
Commons license, unless indicated otherwise in a credit line to the material. If material is notincluded in the chapter’s Creative Commons license and your intended use is not permitted bystatutory regulation or exceeds the permitted use, you will need to obtain permission directly fromthe copyright holder.
Bio-Economy Contribution to Circular Economy 59
Life Cycle Management and CircularEconomy Challenges for the TextileSector: Session Wrap Up
Keith James and Julian Lings
Abstract This session demonstrated the added-value of applying Life CycleAssessment to address different types of issues related to the textiles sector. Each ofthe four presentations in the session was based on case-studies, also highlighted theimportant challenges to be faced regarding methodological issues and marketissues, to make LCA fully efficient for the sector. In particular, it has beendemonstrated that one of the main concern for the sector is toxicity assessment,which is currently limited due to lack of data inducing weaknesses in characteri-sation of substances contributing to this impact. It also has been shown that in theobjective of developing circular models, multiple issues must be addressedsimultaneously. For example, to increase recycling of clothing unsuitable for reuse,markets must be developed at the same time that infrastructure is developed andcollection mechanisms are put in place. It must also be tackled in a sustainable way,supported by Life Cycle Assessment and Life Cycle Costing.
1 Introduction
The textiles sector faces a number of challenges. Clothing is the eighth largestsector in the EU ranking of household expenditure, but the fourth largest when itcomes to environmental impacts [1]. Only transport, housing and food have greaterimpacts. As part of the European Clothing Action Plan (ECAP), a Life+ fundedprogramme, WRAP estimate that over 6.4 million tonnes of clothing were pur-chased across the EU in 2015, and that this clothing is associated with 195 milliontonnes CO2eq, 46 billion m3 of water and 11 million tonnes of waste across thewhole life cycle of the clothing.
K. James (&)WRAP, Banbury, UKe-mail: [email protected]
J. LingsThe North Face, Stabio, Switzerland
© The Author(s) 2018E. Benetto et al. (eds.), Designing Sustainable Technologies,Products and Policies, https://doi.org/10.1007/978-3-319-66981-6_7
61
However, these are just some of the challenges faced. At the LCM2017 con-ference, Sandra Roos from the Swedish research institute Swerea presented thetoxicity footprint of Swedish Clothing Consumption [2]. Many environmentalorganizations have reported on the damage caused by dyeing and finishing oftextiles, both humans and the environment. In addition, the use of pesticides incotton production accounts for 25% of global pesticide use, despite the cropoccupying only 2% of agricultural land. Roos et al. attempted to compare thetoxicity impact of these three different stages. As part of the research Roos et al.identified only 7 out of 58 LCA studies focussed on textiles had included textilechemicals in the inventory, and of these only 4 studies had also developed LCIA tomatch these flows. It was therefore necessary to create additional inventories anddevelop characterisation factors. Characterisation factors are complex to develop; adata source selection strategy is recommended in order to keep consistency. Thefactors developed were combined with data on Swedish clothing consumption. Theresults suggest that eco-toxicity associated with wet treatment (dyeing and finish-ing) was one order of magnitude higher than for the cotton cultivation (all toxicityin the fibre production stems from cotton cultivation). This shows the value of LifeCycle Management and the need to understand life cycle stages to address priorityissues.
2 Framing and Responding to the Challenge
The challenges may be framed and addressed in terms of a number of initiatives,such as the United Nations Sustainable Development Goals, the EuropeanCommission’s Circular Economy Package, Product Environmental FootprintInitiative, and EU Garment Initiative, as well as Action Plans led by NationalGovernments and Industry Associations.
Within each of these frameworks, different options are open to businesses acrossthe clothing value chain. A key challenge is selecting the right strategy for thebusiness, their products and their customers: they may consider increased dura-bility, recyclability, or look more deeply at their business model to consider optionssuch as subscription services, repair and advice on caring for clothing. Companiessuch as VF Corporation are seeking to address these challenges. Founded in 1899,VF is one of the world’s largest apparel, footwear and accessories companies,incorporating over 30 brands such as North Face. Their sustainability mission is toprotect our outdoor playgrounds and communities through the design and devel-opment of environmentally and socially responsible products and business prac-tices. Through Life Cycle Assessment (LCA) they have determined that themajority of their environmental impact comes from materials processing, andproduct manufacturing. The North Face is now shifting the business away fromfinite materials, eliminating supply chain waste and developing closed loop solu-tions for post-consumer waste.
62 K. James and J. Lings
Life Cycle Management can help to realise the potential environmental benefitsof such changes and prioritise actions. Roos’ work also identifies that, for climatechange potential, there is little contribution from activity within Sweden, with thelife cycle impacts dominated by yarn spinning, weaving and dyeing. However, inthe UK, consumer care contributes significantly to the overall footprint.Regionalised tools, such as the ECAP Footprint tool, are therefore required to helpbusinesses to make such changes based on representative information relevant forthe appropriate supply chain and consumer.
Life Cycle Management is important at every decision point in the life cycle ofclothing. Fierro [3] and Holmquist [4] both presented the role of life cycle man-agement in choosing a raincoating, substituting out the most hazardous chemicals.Any substitution has the potential to lead to regrettable substitutions, and thereforeneeds to be holistic, and also ensure that the product functionality is maintained.Durable water and oil repellents (DWOR) are textile finishings which impart water(and oil) repellency, with three main chemistry types. Whilst the Long-chain per-and polyfluoroalkyl substances (PFAS) are being phased out, the alternatives alsogive rise to emissions of hazardous substances.
Hanna Holmquist presented an ecotoxicity assessment of the three mainchemistry types showing little difference between them, though USEtox does notcapture PFAS hazards. A life cycle perspective however reveals that the ecotoxicityassociated with the DWOR is dwarfed by the fabric manufacture, and the fabric andthe membrane is important for Global Warming Potential. Change in the length ofthe product life therefore have the potential for large effects on the total potentialecotoxicity impact. This can be achieved through re-impregnation of DWOR,which has a relatively small contribution to ecotoxicity potential.
Julio Fierro presented the Life MIDWOR project and draft LCA results.DWORs have a complex structure (comb-like) with several side chains. Over time,perfluorinated chains are severed from DWOR structure and released to the envi-ronment. Consequently, PFC degradation compounds can be detected all over theworld, with most originating from production sites. Their stability means thecompounds can bio-accumulate, with concerns relating to potential mutagenic,carcinogenic and reprotoxic impacts. The MIDWOR project explores six differenttextile industries with a common finishing process. Two finishing products wereconsidered: Short-chain DWOR and Silicone based DWOR. The draft LCA resultssuggest little difference between these when the impact of fabric production is alsoincluded, with differences only becoming apparent when considering finishing only.This is in line with Holmquist’s conclusions.
In order to apply life cycle management principles to DWOR there is a need forfurther information on their production. The composition of DWORs is not alwaysspecified in Safety datasheets and is often a trade secret. These barriers must beovercome for life cycle management principles to be applied. In addition, life cyclemethodologies do not reflect the impact of PFCs. Only the Ecological Scarcitymethodology was identified as including the impact of PFCs, and this yieldsnotably different results to other methodologies based on the same data.
Life Cycle Management and Circular Economy … 63

All frameworks identify a need to address multiple issues. Often these must beaddressed simultaneously. For example, to increase recycling of clothing unsuitablefor reuse, markets must be developed at the same time that infrastructure isdeveloped, collection mechanisms are put in place and public communicationsoccur; if any three of these occur without the fourth, then the system will not be ableto change. Projects such as ECAP and RESYNTEX are seeking to address thesecomplex challenges.
Harbi [5] presented the RESYNTEX project which addresses two objectives of acircular economy; to reduce waste and to reduce resource extraction through use oftextile waste to generate secondary raw materials. RESYNTEX is a partnershipbetween 20 organisations funded by Horizon 2020 to take the clothing currentlysent to landfill or incineration and, through biochemical processing, generate resin,bioethanol, bottle-grade PET granulate and value added chemicals. The project willuse both LCA and Life Cycle Costing (LCC) to assess the performance of theprocess, and will further explore biochemical treatment to understand the differentcontributions and optimise performance. The RESYNTEX system will also becompared with reference systems and global textile/chemical markets will beassessed.
3 Future Perspectives
The conference session achieved broad consensus on the scale of the challenge forthe textiles sector, and the growth of these challenges if action is not taken. There isa recognition of the value of life cycle management in guiding organisations, andthe need for fundamental change across the value chain.
There was consensus in the conference session that there is a need to considermultiple environmental issues, and that there are data barriers to understandingtoxicity impacts. However, these are surmountable. There is a need for character-isation factors to reflect properly environmental impact of conventional and alter-native DWORs and improvements in knowledge about DWOR production andcomposition. There is also a need to address multiple market challenges to realise asystemic change in the way clothes are managed at end of life and used as rawmaterials again. Further research and development in this area will be required.
References
1. EEA, Environmental Indicators Report 2014, pp 26, 114, 115.2. Roos S, Arvidsson R, Jönsson C, Calculating the toxicity footprint of Swedish clothing
consumption, LCM 2017 conference, Luxembourg, 2017.3. Fierro J, Martínez C, Environmental analysis of the best available finishing products to provide
water, oil and dirt repellency in the textile sector - A Life Cycle Assessment approach, LCM2017 conference, Luxembourg, 2017.
64 K. James and J. Lings
4. Holmquist H, Roos S, Jönsson C, Peters G, Choosing a rain coating – Life Cycle Assessmentto guide substitution of hazardous durable water repellent chemistry, LCM 2017 conference,Luxembourg, 2017.
5. Magaud V, Dauriat A, Mzikian P, Troppenz V, Harbi S, Recycling textile waste into secondarymaterial: Experience from the innovative RESYNTEX project using circular economyconcepts, LCM 2017 conference, Luxembourg, 2017.
Open Access This chapter is licensed under the terms of the Creative Commons Attribution 4.0International License (http://creativecommons.org/licenses/by/4.0/), which permits use, sharing,adaptation, distribution and reproduction in any medium or format, as long as you give appropriatecredit to the original author(s) and the source, provide a link to the Creative Commons license andindicate if changes were made.The images or other third party material in this chapter are included in the chapter’s Creative
Commons license, unless indicated otherwise in a credit line to the material. If material is notincluded in the chapter’s Creative Commons license and your intended use is not permitted bystatutory regulation or exceeds the permitted use, you will need to obtain permission directly fromthe copyright holder.
Life Cycle Management and Circular Economy … 65
Life Cycle Assessment of Organic,BCI and Conventional Cotton:A Comparative Study of CottonCultivation Practices in India
Pragnesh Shah, Abhishek Bansal and Rajesh Kumar Singh
Abstract Cotton, the most important cash crop of India plays a dominant role in itsagrarian and industrial economy. In India, the area under cotton cultivation is thehighest in the world and industry provides livelihood to over seven million people.However, cotton productivity in India is low and farmers rely on heavy dosage offertilizers and insecticides/pesticides to control insects, pests, weeds and growthregulators. Organic cotton farming is the process of growing cotton without the useof synthetic pesticides and chemical fertilizers. Better Cotton Initiative (BCI), is aconcept to grow cotton with judicious use of water, chemical fertilizers and pes-ticides, to reduce the environmental footprint of cotton farming. The objective ofthe study was to quantify the environmental benefits associated with the productionof organic seed cotton and BCI seed cotton compared to the conventional pro-duction of seed cotton, using Life Cycle Assessment approach. The aim was also toidentify hotspots across the cultivation process. The study was based on primarydata collected from farming sites managed by Arvind Group under contract farmingmodel for BCI cotton and organic cotton cultivation in the state of Maharashtra,India. When compared with the conventional cotton system, the organic and BCIcotton show considerable advantage for several impacts categories.
1 Introduction
Cotton is an indispensable part of today’s human life and India is now the secondlargest producer of cotton in the world, producing around 18% of the world’s cotton[1]. It has the largest area under cotton cultivation in the world (8.9 Million hec-tare), representing about 25% of the world area under cotton cultivation [2]. For the
P. Shah � A. BansalArvind Limited, Naroda Road, Ahmedabad, Gujarat, India
R. K. Singh (&)Thinkstep Sustainability Solutions Pvt. Ltd., 421, Sahar Plaza,Andheri (E), Mumbai, Maharashtra, Indiae-mail: [email protected]
© The Author(s) 2018E. Benetto et al. (eds.), Designing Sustainable Technologies,Products and Policies, https://doi.org/10.1007/978-3-319-66981-6_8
67
financial year 2015–16 total production of cotton was 338 hundred thousand bales(1 Indian bale = 170 kg), out of which 20% was exported [1]. Environmentalsustainability of cotton fibres production has gained more and more attention fromboth suppliers and consumers in recent years due to the associated resourcesconsumption and pollutant emissions. There are mainly three types of cotton cul-tivation practices: Conventional, Organic and BCI cotton seed farming.Conventional Cotton farming is the process of growing cotton with use of insec-ticides, pesticides, herbicides, defoliants, fertilizers, and lot of water. Many con-ventional systems use rain fed water instead irrigation thus conserving surface andgroundwater and also limiting the use of agricultural inputs (fertilizers, pesticides,and machinery) [3]. Organic cotton farming is done without use of synthetic pes-ticides and chemical fertilizers and the only additives comes in the form of manures,while soil quality is controlled by crop rotation. The impact on the environment istherefore reduced drastically, producing clean and safe cotton while creating asustainable cycle [4]. It is best suited for small and marginal farms and ArvindLimited is working closely with the farmers of Akola in the Vidarbha region ofMaharashtra to grow organic cotton; initiative has helped to improve the livelihoodof the farmers by increasing their per-acre income. BCI is a concept to grow cottonwith judicious use of water, chemical fertilizers and pesticides. This techniqueworks well in fertile and irrigated regions where organic farming is not economi-cally viable. Since 2010, Arvind as implementation partners of BCI in India havebeen working with over four thousand farmers in the Akola region covering over15,815 ha of farmland. In 2014, the total production of BCI cotton was 283,000 MTon 456,000 ha. Better Cotton is produced in ten states of India and year-on-yearfigures for BCI Farmers, Better Cotton lint produced, and hectares under cultivationhave increased [5]. Several studies based on Life Cycle Assessment (LCA) [6] havebeen done on the environmental footprint of cotton cultivation which includesMurugesh and Selvadass [7], Khabbaz et al. [8], Barnes [9], Cotton Incorporated[10], Textile Exchange and PE International [4], Cotton Made in Africa [3].Conventional seed cotton fibres have greater environmental impacts compared tothe organic cotton fibres [7] and irrigation has the highest contribution for bothconventional and organic seed cotton fibres [7]. Field emissions and fertilizersmanufacturing contribute significantly to most of the environmental impacts cate-gories [Global Warming Potential (GWP), Ozone Depletion Potential (ODP), andPrimary Energy Demand (PED)] [9]. Cotton Incorporated, a pioneer research andmarketing company, has done an LCA of cotton fibres with the help of thinkstepAG (former PE International) [10]. The foreground data have been collected fromthree countries U.S., China, and India; representing 67% of the world cotton fibresproduction. GWP and PED for 1 kg of cotton fibres were estimated to be 15 MJand 0.268 kg CO2eq. According to other literature references, cotton fibres pro-duction induces an energy consumption of 46.40 MJ per kg produced [8] to67.1 MJ/kg [11].
68 P. Shah et al.
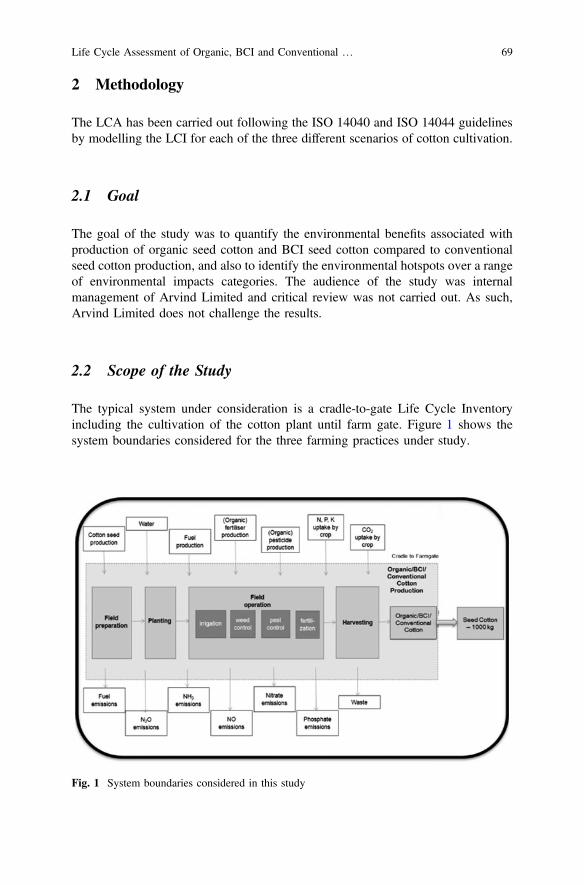
2 Methodology
The LCA has been carried out following the ISO 14040 and ISO 14044 guidelinesby modelling the LCI for each of the three different scenarios of cotton cultivation.
2.1 Goal
The goal of the study was to quantify the environmental benefits associated withproduction of organic seed cotton and BCI seed cotton compared to conventionalseed cotton production, and also to identify the environmental hotspots over a rangeof environmental impacts categories. The audience of the study was internalmanagement of Arvind Limited and critical review was not carried out. As such,Arvind Limited does not challenge the results.
2.2 Scope of the Study
The typical system under consideration is a cradle-to-gate Life Cycle Inventoryincluding the cultivation of the cotton plant until farm gate. Figure 1 shows thesystem boundaries considered for the three farming practices under study.
Fig. 1 System boundaries considered in this study
Life Cycle Assessment of Organic, BCI and Conventional … 69
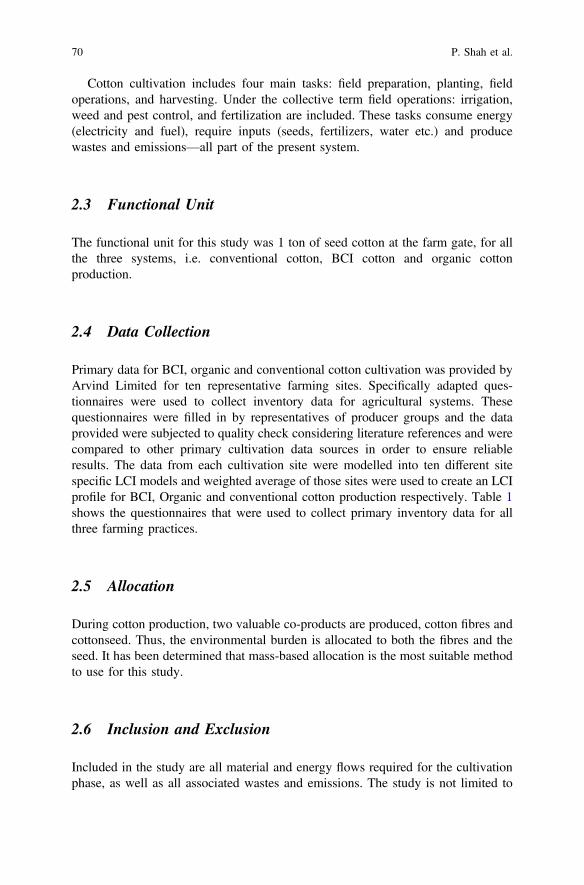
Cotton cultivation includes four main tasks: field preparation, planting, fieldoperations, and harvesting. Under the collective term field operations: irrigation,weed and pest control, and fertilization are included. These tasks consume energy(electricity and fuel), require inputs (seeds, fertilizers, water etc.) and producewastes and emissions—all part of the present system.
2.3 Functional Unit
The functional unit for this study was 1 ton of seed cotton at the farm gate, for allthe three systems, i.e. conventional cotton, BCI cotton and organic cottonproduction.
2.4 Data Collection
Primary data for BCI, organic and conventional cotton cultivation was provided byArvind Limited for ten representative farming sites. Specifically adapted ques-tionnaires were used to collect inventory data for agricultural systems. Thesequestionnaires were filled in by representatives of producer groups and the dataprovided were subjected to quality check considering literature references and werecompared to other primary cultivation data sources in order to ensure reliableresults. The data from each cultivation site were modelled into ten different sitespecific LCI models and weighted average of those sites were used to create an LCIprofile for BCI, Organic and conventional cotton production respectively. Table 1shows the questionnaires that were used to collect primary inventory data for allthree farming practices.
2.5 Allocation
During cotton production, two valuable co-products are produced, cotton fibres andcottonseed. Thus, the environmental burden is allocated to both the fibres and theseed. It has been determined that mass-based allocation is the most suitable methodto use for this study.
2.6 Inclusion and Exclusion
Included in the study are all material and energy flows required for the cultivationphase, as well as all associated wastes and emissions. The study is not limited to
70 P. Shah et al.
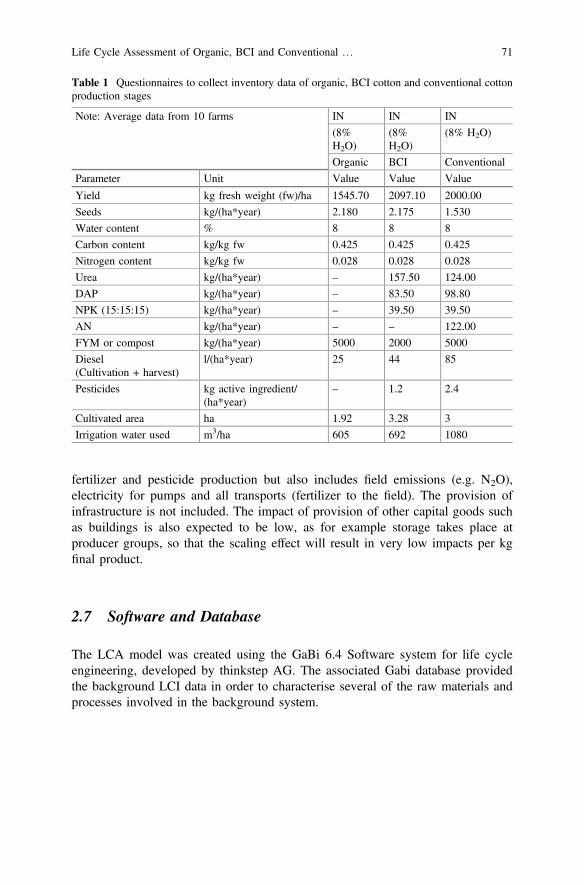
fertilizer and pesticide production but also includes field emissions (e.g. N2O),electricity for pumps and all transports (fertilizer to the field). The provision ofinfrastructure is not included. The impact of provision of other capital goods suchas buildings is also expected to be low, as for example storage takes place atproducer groups, so that the scaling effect will result in very low impacts per kgfinal product.
2.7 Software and Database
The LCA model was created using the GaBi 6.4 Software system for life cycleengineering, developed by thinkstep AG. The associated Gabi database providedthe background LCI data in order to characterise several of the raw materials andprocesses involved in the background system.
Table 1 Questionnaires to collect inventory data of organic, BCI cotton and conventional cottonproduction stages
Note: Average data from 10 farms IN IN IN
(8%H2O)
(8%H2O)
(8% H2O)
Organic BCI Conventional
Parameter Unit Value Value Value
Yield kg fresh weight (fw)/ha 1545.70 2097.10 2000.00
Seeds kg/(ha*year) 2.180 2.175 1.530
Water content % 8 8 8
Carbon content kg/kg fw 0.425 0.425 0.425
Nitrogen content kg/kg fw 0.028 0.028 0.028
Urea kg/(ha*year) – 157.50 124.00
DAP kg/(ha*year) – 83.50 98.80
NPK (15:15:15) kg/(ha*year) – 39.50 39.50
AN kg/(ha*year) – – 122.00
FYM or compost kg/(ha*year) 5000 2000 5000
Diesel(Cultivation + harvest)
l/(ha*year) 25 44 85
Pesticides kg active ingredient/(ha*year)
– 1.2 2.4
Cultivated area ha 1.92 3.28 3
Irrigation water used m3/ha 605 692 1080
Life Cycle Assessment of Organic, BCI and Conventional … 71
2.8 Life Cycle Impact Assessment (LCIA)
The following impacts categories were considered of high relevance: GWP, PED,Acidification Potential (AP), Eutrophication Potential (EP) and Water Consumption(WC). The CML impact assessment methodology was used (Institute ofEnvironmental Sciences of the University of Leiden framework, CML2001, 2013).The impact categories identified above are also considered by Cotton Inc. [8] andTextile Exchange [5].
3 Modelling Approach—Agriculture Model
Various factors like the variety of different locations, large number and diversity offarms, variety of agricultural management practices applied, lack of a determinedborder to the environment, complex and indirect dependence of the output (harvest,emissions) from the input (fertilizers, location conditions, etc.), variable weatherconditions within and between different years, and variable pest populations(insects, weeds, disease pathogens, etc.) contribute to the complexity of agriculturalmodelling. Due to the inherent complications characterizing an agricultural system,a non-linear agrarian calculation model is applied displaying plant production(jointly developed by the LBP of the University of Stuttgart and thinkstep AG).This software model covers a multitude of input data, emission factors andparameters. The agricultural model accounts for the nitrogen cycle in agriculturalsystems. Specifically, the model includes emissions of nitrate (NO3
−) in water andemissions of nitrous oxide (N2O), nitrogen oxide (NO) and ammonia (NH3) into air.The model ensures that emissions from erosion, the reference system (comparablenon-cultivated land area) and nutrient transfers within crop rotations are modelledconsistently. Carbon-based emissions such as CH4, CO, CO2 are considered inforeground and background datasets. Background datasets include emissionsresulting from production of fertilizer, pesticides, electricity, and diesel whileforeground datasets contain direct emissions such as CO2 due to combustion offossil fuels by the tractor or irrigation engines and application and decomposition ofurea fertilizers in the soil.
4 Results and Discussion
Table 2 shows the comparative LCIA results on absolute basis for all three farmingpractices. It clearly reflects that LCA results of organic cotton is better than BCIcotton and conventional cotton production for all the environmental impacts cate-gories. There has not been significant difference of yield between conventional andBCI cotton production in this study. However, if the yield of BCI cotton increases
72 P. Shah et al.
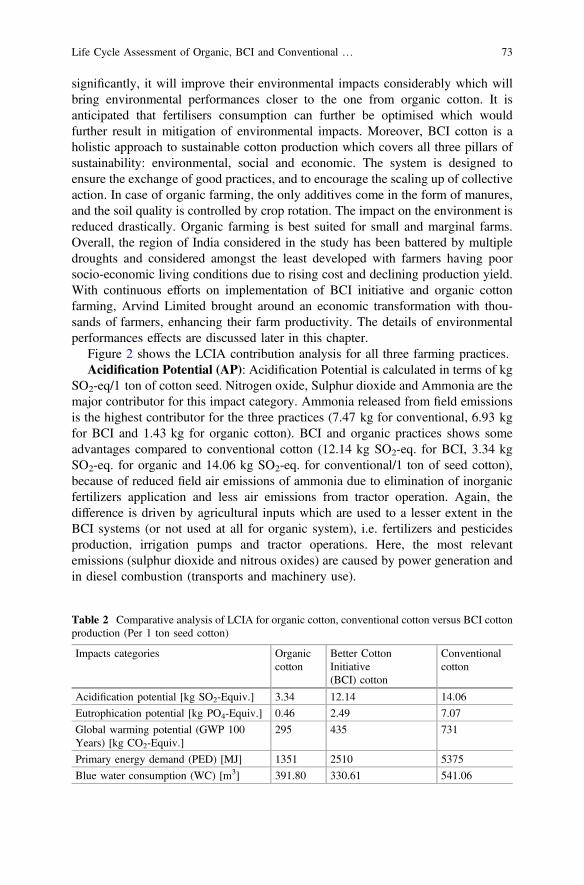
significantly, it will improve their environmental impacts considerably which willbring environmental performances closer to the one from organic cotton. It isanticipated that fertilisers consumption can further be optimised which wouldfurther result in mitigation of environmental impacts. Moreover, BCI cotton is aholistic approach to sustainable cotton production which covers all three pillars ofsustainability: environmental, social and economic. The system is designed toensure the exchange of good practices, and to encourage the scaling up of collectiveaction. In case of organic farming, the only additives come in the form of manures,and the soil quality is controlled by crop rotation. The impact on the environment isreduced drastically. Organic farming is best suited for small and marginal farms.Overall, the region of India considered in the study has been battered by multipledroughts and considered amongst the least developed with farmers having poorsocio-economic living conditions due to rising cost and declining production yield.With continuous efforts on implementation of BCI initiative and organic cottonfarming, Arvind Limited brought around an economic transformation with thou-sands of farmers, enhancing their farm productivity. The details of environmentalperformances effects are discussed later in this chapter.
Figure 2 shows the LCIA contribution analysis for all three farming practices.Acidification Potential (AP): Acidification Potential is calculated in terms of kg
SO2-eq/1 ton of cotton seed. Nitrogen oxide, Sulphur dioxide and Ammonia are themajor contributor for this impact category. Ammonia released from field emissionsis the highest contributor for the three practices (7.47 kg for conventional, 6.93 kgfor BCI and 1.43 kg for organic cotton). BCI and organic practices shows someadvantages compared to conventional cotton (12.14 kg SO2-eq. for BCI, 3.34 kgSO2-eq. for organic and 14.06 kg SO2-eq. for conventional/1 ton of seed cotton),because of reduced field air emissions of ammonia due to elimination of inorganicfertilizers application and less air emissions from tractor operation. Again, thedifference is driven by agricultural inputs which are used to a lesser extent in theBCI systems (or not used at all for organic system), i.e. fertilizers and pesticidesproduction, irrigation pumps and tractor operations. Here, the most relevantemissions (sulphur dioxide and nitrous oxides) are caused by power generation andin diesel combustion (transports and machinery use).
Table 2 Comparative analysis of LCIA for organic cotton, conventional cotton versus BCI cottonproduction (Per 1 ton seed cotton)
Impacts categories Organiccotton
Better CottonInitiative(BCI) cotton
Conventionalcotton
Acidification potential [kg SO2-Equiv.] 3.34 12.14 14.06
Eutrophication potential [kg PO4-Equiv.] 0.46 2.49 7.07
Global warming potential (GWP 100Years) [kg CO2-Equiv.]
295 435 731
Primary energy demand (PED) [MJ] 1351 2510 5375
Blue water consumption (WC) [m3] 391.80 330.61 541.06
Life Cycle Assessment of Organic, BCI and Conventional … 73

Global Warming Potential (GWP 100 Years): Global Warming Potential iscalculated in terms of kg CO2eq./1 ton of cotton seed. The combustion of fossil fuelfor agricultural machinery, irrigation and other upstream processes are majorcontributors for GWP. Carbon dioxide emissions are mostly induced by irrigationand agriculture-machinery for all three practices and field emissions are due to N2Oand CH4. Conventional cotton cultivation depicts the highest among the threepractices for carbon dioxide emissions, followed by BCI and organic cultivation.The difference in results is mainly due to the contribution of agricultural inputs, i.e.fertilizer production, provision of pesticides, tractor operations and energy use forirrigation in the conventional system. For all three practices GWP from N2Oemissions from field is the highest. This is mainly due to the various fertilizers used,water management system and soil use pattern. BCI and organic practices showssome advantages compared to conventional cotton because of reduced field airemissions of Nitrous oxide due to reduction of inorganic fertilizers use, savings ofCO2 emissions due to production of less inorganic fertilizers and less CO2 emis-sions from tractor operation.
Eutrophication Potential (EP): Eutrophication Potential is calculated in termsof kg PO4eq./1 ton of cotton seed. Ammonia, nitrogen oxides, nitrous oxide are themajor air emissions and nitrate, nitrogen and phosphate are major water emissionsresulting in eutrophication potential. Ammonia emissions from field is the highestcontributor for BCI and conventional cultivation. This is mainly due to the use offertilisers in these practices. Nitrogen oxides are major contributors for Organiccultivation. When comparing with the eutrophication potential of all three pro-duction practices, conventional cotton scores are much higher (7.07 kg PO4-eq.)
-40% -20% 0% 20% 40% 60% 80% 100% 120%Organic
BCIConv.
OrganicBCI
Conv.Organic
BCIConv.
OrganicBCI
Conv.
APEP
GWP(10
0years)
PED
Agriculture Machinery Basic Emissions Fer liser
Field Emissions Irriga on Tractor
Fig. 2 Comparative analysis of the three cotton cultivation practices
74 P. Shah et al.
than BCI and Organic which scores 2.40 kg PO4-eq. and 0.46 kg PO4eq. respec-tively. This can be explained by the fact that eutrophication in the BCI as well asconventional system is dominated by soil erosion, and soil erosion data refer to areaand are not influenced by production yield. That means that the lower the yield perhectare, the higher the soil erosion per kg final product. BCI and organic practicesshows some advantages compared to conventional cotton in this impact categorybecause of reduced field air emissions of ammonia due to reduction of inorganicfertilizers application.
Primary Energy Demand (PED): PED represents an indicator for fossilresources. Conventional system shows highest PED followed by BCI and organicsystems (Conventional—5375 MJ, BCI—2510 MJ and Organic—1351 MJ). BCIand organic practices shows some advantages compared to conventional cotton inthis impact category because of savings of energy associated to the production ofinorganic fertilizers used in a lower extent, reduced fuel requirement for tractoroperation and low fuel requirement for irrigation process.
Water Consumption (WC): Water consumption is smaller for BCI Cotton(330 m3/1 ton of seed cotton) and organic cotton (391 m3/1 ton of seed cotton)than for the conventional Cotton (541 m3/1 ton of seed cotton). BCI and organicpractices shows some advantages compared to conventional cotton in this impactcategory because of less irrigation water requirement.
5 Limitations
At the level of primary inventory, considering average data over different yearswould improve their representativeness. Also, increasing the number of farmsamples for all the cultivation systems would further enhance the quality androbustness of the inventory data. It is also important to note that for many relevantaspects (such as soil types, nutrient content of soils, soil erosion) primary data werevery hard to obtain, there for some of the data proxy values were applied, notnecessarily representative of local conditions. An important parameter is also thedifference between manual and mechanised farming practices carried out by mar-ginal farmers and rich farmers respectively. Then, Indian geography has differentclimatic conditions but the study focused only on the western part of the country.Aggregating data into regional averages is an additional challenge and can poten-tially lead to distortions in a model trying to represent a realistic cultivation system.Finally, some environmental impact routes (biodiversity, carbon sequestration insoils) are difficult to assess in a LCA framework and are not investigated in thisstudy. Hence, some are omitted from the assessment where organic and BCI cottonCultivation could potentially also show advantages over conventional productionsystems.
Life Cycle Assessment of Organic, BCI and Conventional … 75
6 Conclusion
To summarize, BCI cotton production system and organic system are extensivecultivation systems that are well adapted to available resources and geographicalenvironment, as well as to existing social and socio-economic conditions. Organiccotton has shown the lowest impacts across all categories assessed, due to non-useof synthetic pesticides and chemical fertilizers, the only additives being manures,and the soil quality being controlled by crop rotation. BCI systems employ goodcultivation practices like intercropping and reduce use of mineral fertilizers forcultivation. These systems intend to minimise the harmful impact of crop protectionpractices, use water efficiently, take care of soil health and conserve natural habitatswhile preserving the quality of the fibres. Farmers, traders, retailers and consumers,benefit from the economic, social and ecological advantages of responsible cottonprojects.
References
1. < http://www.cotcorp.gov.in/index.aspx> (Accessed 30.04.2017).2. <https://www.indiaagronet.com/indiaagronet/seeds/organiccottonarticle-seeds.htm>
(Accessed 12.04.2017).3. Cotton Made in Africa and PE International, Life Cycle Assessment of Cotton Made in
Africa, Study report, 2014.4. Textile Exchange and PE International, Life Cycle Assessment of Organic Cotton – A Global
average, 2014.5. <http://bettercotton.org/about-better-cotton/where-is-better-cotton-grown/india/> (Accessed
11.05.2017).6. International Organization for Standardization, ISO Series 14040 and 14044, Environmental
Management – Life Cycle Assessment – Principles and Framework, 2006.7. Murugesh B.K, Selvadass M, Life Cycle Assessment for Cultivation of Conventional and
Organic Seed Cotton fibres, International Journal of Research in Environmental Science andTechnology 3(1): 39–45, 2013.
8. Khabbaz B. G, University of Southern Queensland Life Cycle Energy Use and GreenhouseGas Emissions of Australian Cotton: Impact of Farming Systems, 2010.
9. Barnes E, The Cotton Life Cycle Inventory Project EDWARD BARNES, 2010.10. Cotton Inc. and PE International, Life Cycle Assessment of Cotton Fibre and Fabric.
A Project of the Cotton Foundation and managed by Cotton Incorporated, Cotton CouncilInternational and The National Cotton Council. 2012.
11. The Food and Environment Research Agency of UK, The role and business case for existingand emerging fibres in sustainable clothing, 2010.
76 P. Shah et al.
Open Access This chapter is licensed under the terms of the Creative Commons Attribution 4.0International License (http://creativecommons.org/licenses/by/4.0/), which permits use, sharing,adaptation, distribution and reproduction in any medium or format, as long as you give appropriatecredit to the original author(s) and the source, provide a link to the Creative Commons license andindicate if changes were made.The images or other third party material in this chapter are included in the chapter’s Creative
Commons license, unless indicated otherwise in a credit line to the material. If material is notincluded in the chapter’s Creative Commons license and your intended use is not permitted bystatutory regulation or exceeds the permitted use, you will need to obtain permission directly fromthe copyright holder.
Life Cycle Assessment of Organic, BCI and Conventional … 77
Life Cycle Managementin the Pharmaceutical Industry Usingan Applicable and Robust LCA-BasedEnvironmental SustainabilityAssessment Approach
Yasmine Emara, Marc-William Siegert, Annekatrin Lehmannand Matthias Finkbeiner
Abstract Despite growing concerns over the environmental impacts of pharma-ceuticals, the use of Life Cycle Assessment (LCA) within the pharma-sectorremains quite fragmentary. The aim of this paper is to present gaps and challenges,impeding a full adoption of LCA in the pharma-sector. A review of existingpharma-LCAs revealed a considerable degree of inconsistency and inhomogeneityin their methodological choices, highlighting the need for product category rules(PCRs) for the pharmaceutical industry to harmonize and facilitate the future use ofLCA in that sector. Additionally, existing life cycle impact assessment (LCIA)methods fail to model several pharma-specific impact pathways (e.g. endocrinedisruption). Preliminary thoughts on the development of pharma-PCRs and theinclusion of pharma-specific impact pathways into LCIA are presented, providingimportant stimulus for further research.
1 Introduction
A global rise in pharmaceutical consumption has come hand in hand with a parallelsurge in environmental contamination with active pharmaceutical ingredients(APIs), their metabolites and transformation products [1, 2]. The eco-toxicologicalconcerns regarding the presence of pharmaceuticals in surface waters, together withthe pharmaceutical industry’s resource- and energy-intensive environmental profile,have prompted the sector to increasingly integrate green chemistry and greenengineering principles into its production processes [3–6].
Despite some drug companies recognizing the merits of utilizing Life CycleAssessment (LCA) to measure their progress towards ‘greener’ production, LCAs
Y. Emara (&) � M.-W. Siegert � A. Lehmann � M. FinkbeinerChair of Sustainable Engineering, Institute of Environmental Technology,Technische Universität Berlin, Berlin, Germanye-mail: [email protected]
© The Author(s) 2018E. Benetto et al. (eds.), Designing Sustainable Technologies,Products and Policies, https://doi.org/10.1007/978-3-319-66981-6_9
79
remain far from becoming common practice in the pharmaceutical industry [7, 8].Furthermore, existing pharma-LCAs are quite inhomogeneous in multiple respects,e.g. the choice of functional unit or of impact categories. This, in turn, reduces therobustness of their results and their reproducibility and makes industry-wideinsights with respect to typical environmental ‘hotspots’ or possible strategies for‘greener’ drug designs practically futile. Naturally, the distinct goals ofpharma-LCAs are partly responsible for the diversity of methodological choicesamong the studies. However, given the high degree of flexibility provided by theISO 14040/14044 standards, it is fair to assume that even two studies of the samedrug done by two different LCA-practitioners would show considerable disparity. Itis exactly that realisation that has led over the last few years to the need—andconsequently the parallel rise—of so-called ‘product category rules’ (PCRs), i.e. aset of harmonized rules on specific LCA modelling requirements for a given pro-duct category [9]. With the aim to develop PCRs for the pharma-sector, a three-yearproject, entitled ‘Development of a sector-specific environmental sustainabilityassessment approach for pharmaceutical products and processes’ (German abbre-viation: SERUM), was launched last year at the Technische Universität Berlin.
The purpose of this paper is to present current gaps and challenges impeding afull adoption of LCA into the sustainability practices and product developmentprocesses of the pharma-sector and to provide preliminary recommendations onhow to tackle some of those challenges. Following a short review of existing LCAsin the pharma-sector in Sect. 2, Sect. 3 will briefly describe the current state of LifeCycle Impact Assessment (LCIA) in pharma-LCAs and introduce some of thepresent constraints in modelling the toxicity of pharmaceutical compounds.Section 4 addresses early considerations on the way to developing PCRs for thepharmaceutical sector. Finally, a few concluding remarks and implications forfuture research within the LCA community will be presented.
2 Review of LCAs in the Pharmaceutical Industry
A comprehensive review on the state of LCA-application in the pharmaceuticalindustry, specifically human pharmaceuticals, was initially performed in order toidentify common LCA-practices within the sector (e.g. choice of functional unit),regularly identified ‘Hotspots’ in the life cycle of drugs, as well as often encoun-tered challenges and remaining gaps. Results of the review were meant to lay theground for harmonized sector-specific rules—in the form of PCRs—and revealthematic focal points for achieving greater LCA-application within thepharma-sector. Given the unique characteristics of the pharmaceutical industry (e.g.exceptionally high standards of cleanliness maintained during production) and therelatively young age of ‘green pharmacy’-practices, the focus of the literaturereview was on LCA case studies of human pharmaceutical products (i.e. APIs orfinal drug, incl. packaging) or pharmaceutical processes, performed in or after theyear 2000. LCAs of precursor chemicals (e.g. enzymes) were only included if
80 Y. Emara et al.
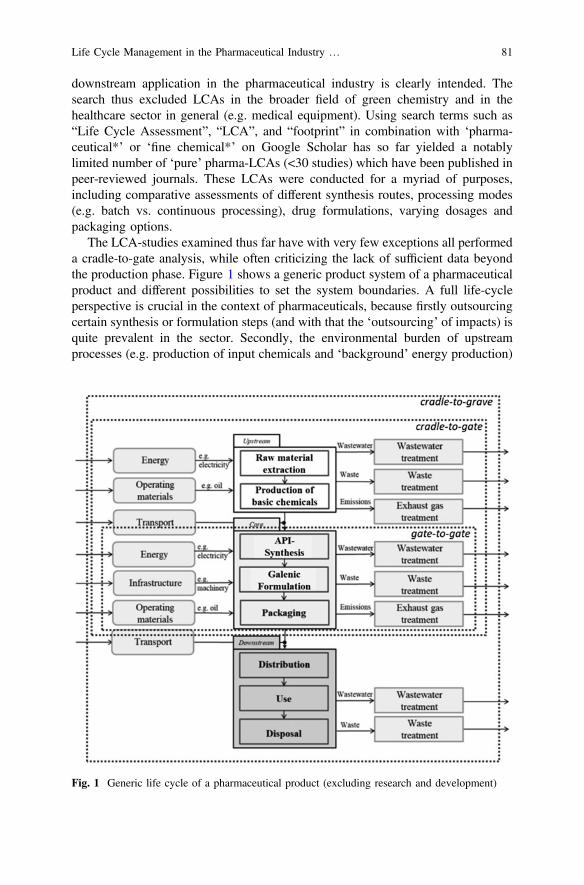
downstream application in the pharmaceutical industry is clearly intended. Thesearch thus excluded LCAs in the broader field of green chemistry and in thehealthcare sector in general (e.g. medical equipment). Using search terms such as“Life Cycle Assessment”, “LCA”, and “footprint” in combination with ‘pharma-ceutical*’ or ‘fine chemical*’ on Google Scholar has so far yielded a notablylimited number of ‘pure’ pharma-LCAs (<30 studies) which have been published inpeer-reviewed journals. These LCAs were conducted for a myriad of purposes,including comparative assessments of different synthesis routes, processing modes(e.g. batch vs. continuous processing), drug formulations, varying dosages andpackaging options.
The LCA-studies examined thus far have with very few exceptions all performeda cradle-to-gate analysis, while often criticizing the lack of sufficient data beyondthe production phase. Figure 1 shows a generic product system of a pharmaceuticalproduct and different possibilities to set the system boundaries. A full life-cycleperspective is crucial in the context of pharmaceuticals, because firstly outsourcingcertain synthesis or formulation steps (and with that the ‘outsourcing’ of impacts) isquite prevalent in the sector. Secondly, the environmental burden of upstreamprocesses (e.g. production of input chemicals and ‘background’ energy production)
Fig. 1 Generic life cycle of a pharmaceutical product (excluding research and development)
Life Cycle Management in the Pharmaceutical Industry … 81
typically dwarfs impacts of the actual in-house synthetic processes [10, 11].Furthermore, the use phase and end-of-life of a pharmaceutical product may as wellbear considerable environmental impacts, especially if eco- andhuman-toxicological effects due to API-emissions into sewage systems (andeventually into surface waters) are to be included in the analysis (for further detailssee next section). Consequently, pharmaceutical corporations should strive towardscomplete cradle-to-grave analyses.
A closer examination of the existing pharma-LCAs quickly revealed that theindividual studies are quite inhomogeneous in a number of respects: e.g. theirchoice of functional unit (FU), system boundaries setting, use of backgrounddatabases and data quality, choice of impact assessment methods and the impactcategories they consider. For instance, while Brunet et al. [12] set the FU at20,840,000 kg of penicillin V produced over a time horizon of 20 years, De Soeteet al. [13] chose 1 daily dosage of PREZISTA (anti-HIV medication) as their FU.The majority of reviewed studies though opted for 1 kg of API as FU. Similarly,while Wernet et al. [10] chose to assess sixteen impact categories (both at midpoint-and endpoint level) using 5 different impact assessment methods, Kim et al. [14]considered 5 impact categories using one method only.
In light of the different goals and scopes of the reviewed studies and the inherentuniqueness of individual APIs/drug formulations, a certain degree of method-ological variation among pharma-LCAs is only logical, if not expedient.Nevertheless, lack of sufficient experience and guidance has led to large discrep-ancies in the application of LCA in the pharma-sector, often jeopardizing thecoherence and reliability of pharma-LCAs. Consequently, there is an evident needfor PCRs for the pharmaceutical industry to guide and facilitate futurepharma-LCAs. Preliminary thoughts on pharma-PCRs are discussed in Sect. 4.
3 Life Cycle Impact Assessment (LCIA) in Pharma-LCAs
The LCIA phase of the reviewed pharma-LCAs was carried out using quitedivergent impact categories and impact assessment methods. A streamlined LCAtool developed by the American Chemical Society Green Chemistry Institute(ACS-GCI) Pharmaceutical Roundtable (hereinafter ‘the Roundtable’) sets forthnine impact categories/indicators to be assessed in LCAs of drug synthesis routes[11]. Table 1 lists these nine impact categories, next to the top five assessed impactcategories in the reviewed pharma-LCAs, as well as a preliminary selection of eightcategories recognized by the authors as the most relevant for pharma-LCAs. Thelatter list was determined in consultation with the SERUM advisory committee,which comprises experts from academia, politics and the pharmaceutical industry.
Quite notably, impacts—especially toxicity-related impacts—which have beenidentified as relevant for the pharmaceutical industry within the SERUM project arenot often considered in LCA studies nor recommended in the Roundtable’sstreamlined tool. Given the desired functionality of pharmaceuticals—e.g. to kill
82 Y. Emara et al.
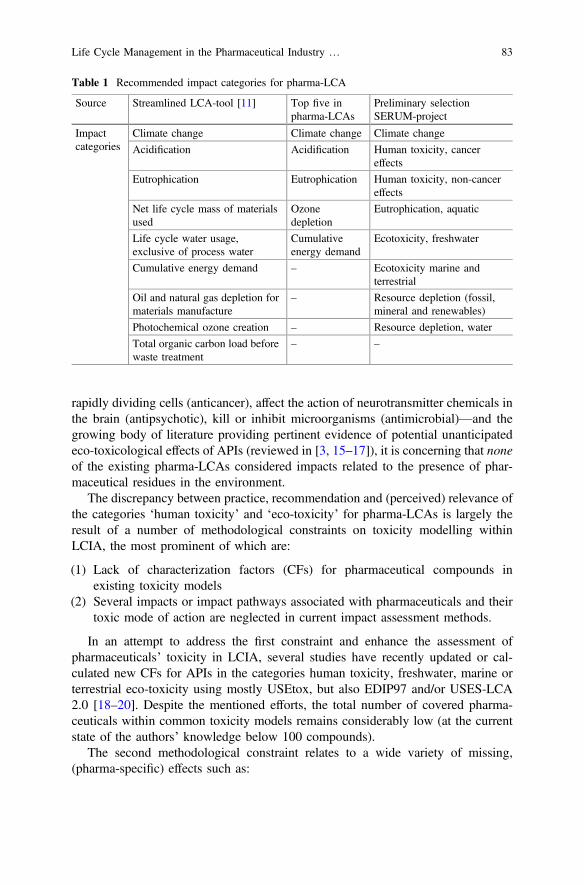
rapidly dividing cells (anticancer), affect the action of neurotransmitter chemicals inthe brain (antipsychotic), kill or inhibit microorganisms (antimicrobial)—and thegrowing body of literature providing pertinent evidence of potential unanticipatedeco-toxicological effects of APIs (reviewed in [3, 15–17]), it is concerning that noneof the existing pharma-LCAs considered impacts related to the presence of phar-maceutical residues in the environment.
The discrepancy between practice, recommendation and (perceived) relevance ofthe categories ‘human toxicity’ and ‘eco-toxicity’ for pharma-LCAs is largely theresult of a number of methodological constraints on toxicity modelling withinLCIA, the most prominent of which are:
(1) Lack of characterization factors (CFs) for pharmaceutical compounds inexisting toxicity models
(2) Several impacts or impact pathways associated with pharmaceuticals and theirtoxic mode of action are neglected in current impact assessment methods.
In an attempt to address the first constraint and enhance the assessment ofpharmaceuticals’ toxicity in LCIA, several studies have recently updated or cal-culated new CFs for APIs in the categories human toxicity, freshwater, marine orterrestrial eco-toxicity using mostly USEtox, but also EDIP97 and/or USES-LCA2.0 [18–20]. Despite the mentioned efforts, the total number of covered pharma-ceuticals within common toxicity models remains considerably low (at the currentstate of the authors’ knowledge below 100 compounds).
The second methodological constraint relates to a wide variety of missing,(pharma-specific) effects such as:
Table 1 Recommended impact categories for pharma-LCA
Source Streamlined LCA-tool [11] Top five inpharma-LCAs
Preliminary selectionSERUM-project
Impactcategories
Climate change Climate change Climate change
Acidification Acidification Human toxicity, cancereffects
Eutrophication Eutrophication Human toxicity, non-cancereffects
Net life cycle mass of materialsused
Ozonedepletion
Eutrophication, aquatic
Life cycle water usage,exclusive of process water
Cumulativeenergy demand
Ecotoxicity, freshwater
Cumulative energy demand – Ecotoxicity marine andterrestrial
Oil and natural gas depletion formaterials manufacture
– Resource depletion (fossil,mineral and renewables)
Photochemical ozone creation – Resource depletion, water
Total organic carbon load beforewaste treatment
– –
Life Cycle Management in the Pharmaceutical Industry … 83

• endocrine disruption mediated by exposure to endocrine disrupting chemicals(EDCs) (reviewed in [21]),
• the development of antibiotic resistance [22] or• behavioural alterations such as change in feeding behaviour or predator
avoidance due to wildlife-exposure to antidepressants (reviewed in [23]).
Such examples of more subtle and sub-lethal toxic effects with possibly sig-nificant repercussions on species’ ecological fitness and population-relevant end-points are often not captured by endpoints that are typically assessed in regulatoryecotoxicology. Consequently, using toxicity data on traditional endpoints (e.g.mortality, growth and reproduction) as recommended by USEtox to calculate CFsfor pharmaceutical compounds fails to reflect certain impact pathways of individualpharmaceuticals with specific toxic modes of action such as EDCs or antibiotics[24].
In an attempt to tackle the second methodological constraint, Larsen et al. [24]sought to integrate endocrine disruption into LCA by suggesting to use test resultsfrom fish laboratory tests with the endpoint sex ratio as effect data when estimatingeco-toxicity characterization factors for estrogenic compounds [24]. Consideringthe complexity of the endocrine system—whether in humans or in wildlife—andthe variety of EDCs’ mechanisms of action (e.g. (anti)estrogenic/(anti)androgenicor interference with thyroid hormone pathways) more endpoints will have to beeventually included to capture and map the ‘full’ array of EDCs and their potentialtoxic effects.
When seeking to include other missing pharma-specific impact pathways such asthe development of antibiotic resistance, it is less likely that the same approach, i.e.to broaden the endpoints used to calculate effect factors, would suffice to reflect thespecific mechanisms in which bacteria develop or transfer antibiotic resistant genes.Consequently, a new indicator and characterization model for the inclusion ofantibiotic resistance into LCIA may need to be developed.
4 Product Category Rules (PCRs) for the PharmaceuticalIndustry
PCRs are usually defined for a group of products which have an equivalent orsimilar function, making them largely comparable. Despite the compelling case fora harmonized framework in the form of PCRs to guide LCAs of pharmaceuticalproducts, so far there has only been one PCR developed for vaccines [25]. On thebasis of this PCR, Pfizer conducted and published an Environmental ProductDeclaration (EPD) for IMPROVAC, an immunological product used as alternativeto physical castration in pig management [26]. However the EPD for IMPROVACis no longer valid since 2015.
To develop new PCRs, there are no rules on how ‘narrow’ or ‘broad’ a productcategory should be defined. In other words, the ‘granularity’ of PCRs is entirely up
84 Y. Emara et al.
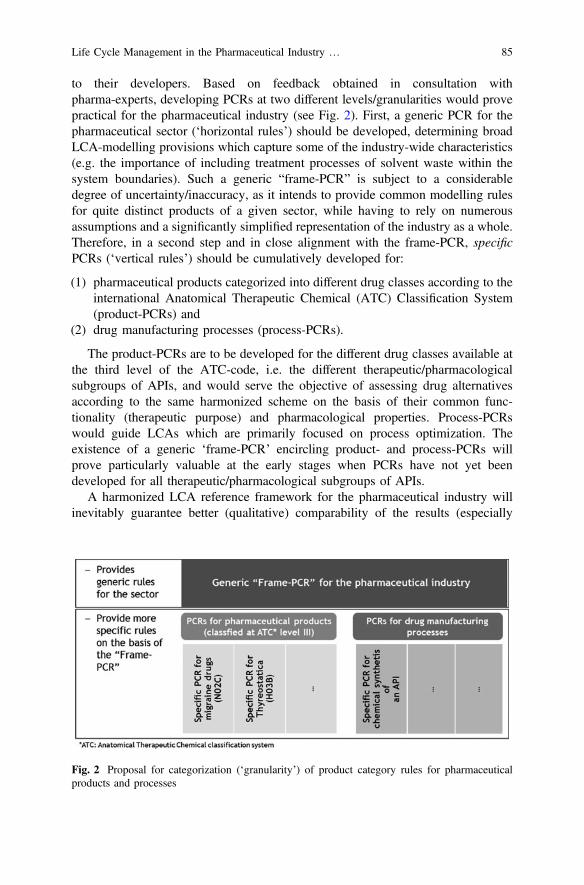
to their developers. Based on feedback obtained in consultation withpharma-experts, developing PCRs at two different levels/granularities would provepractical for the pharmaceutical industry (see Fig. 2). First, a generic PCR for thepharmaceutical sector (‘horizontal rules’) should be developed, determining broadLCA-modelling provisions which capture some of the industry-wide characteristics(e.g. the importance of including treatment processes of solvent waste within thesystem boundaries). Such a generic “frame-PCR” is subject to a considerabledegree of uncertainty/inaccuracy, as it intends to provide common modelling rulesfor quite distinct products of a given sector, while having to rely on numerousassumptions and a significantly simplified representation of the industry as a whole.Therefore, in a second step and in close alignment with the frame-PCR, specificPCRs (‘vertical rules’) should be cumulatively developed for:
(1) pharmaceutical products categorized into different drug classes according to theinternational Anatomical Therapeutic Chemical (ATC) Classification System(product-PCRs) and
(2) drug manufacturing processes (process-PCRs).
The product-PCRs are to be developed for the different drug classes available atthe third level of the ATC-code, i.e. the different therapeutic/pharmacologicalsubgroups of APIs, and would serve the objective of assessing drug alternativesaccording to the same harmonized scheme on the basis of their common func-tionality (therapeutic purpose) and pharmacological properties. Process-PCRswould guide LCAs which are primarily focused on process optimization. Theexistence of a generic ‘frame-PCR’ encircling product- and process-PCRs willprove particularly valuable at the early stages when PCRs have not yet beendeveloped for all therapeutic/pharmacological subgroups of APIs.
A harmonized LCA reference framework for the pharmaceutical industry willinevitably guarantee better (qualitative) comparability of the results (especially
Fig. 2 Proposal for categorization (‘granularity’) of product category rules for pharmaceuticalproducts and processes
Life Cycle Management in the Pharmaceutical Industry … 85

within one therapeutic/pharmacological subgroup using the same product-PCR) andimprove the reliability of future pharma-LCAs. Additionally, it paves the way forEPDs to establish themselves within the sector, with potentially significant socialimplications (e.g. doctors/consumers opting for ‘greener’ drug alternatives).
5 Conclusions and Outlook
Despite recent efforts of the pharmaceutical industry to integrate green chemistryand green engineering principles into their production processes and drug designs,the utilization of LCA to monitor and measure progress towards ‘greener’ phar-maceutical products remains far from common practice. A review of availablepharma-LCAs revealed a considerable degree of inconsistency and inhomogeneityin their modelling choices, often leading to quite unreliable results. The problem iscompounded by the fact that existing life cycle impact assessment methods fail toinclude a variety of pharma-specific impact pathways within their toxicity mod-elling (e.g. endocrine disruption or antibiotic resistance) and provide a noticeablylimited number of characterization factors for pharmaceutical compounds.
The development of product category rules for pharmaceutical products andprocesses is regarded as a necessary development to harmonize, facilitate andexpand the future use of LCA in the sector. Additionally, calculating new CFs forpharmaceutical compounds within established toxicity models or developing newcharacterization models that reflect pharma-specific toxicological effects is imper-ative to delivering a comprehensive and accurate quantification of the environ-mental impacts of human drugs.
Only when an applicable and robust LCA-based environmental sustainabilityassessment approach is adapted to the needs and specificities of the pharmaceuticalindustry can life cycle management establish itself within the sector and truly guideeco-innovation towards ‘green pharmacy’.
References
1. Taylor D, The Pharmaceutical Industry and the Future of Drug Development, In Pharmaceuticalsin the Environment, Hester, R. E., Harrison, R. M., Eds., Issues in Environmental Science andTechnology No. 41, The Royal Society of Chemistry, 2015, pp 1–33.
2. Christen V, Hickmann S, Rechenberg B, Fent K, Highly active human pharmaceuticals inaquatic systems: A concept for their identification based on their mode of action, Aquatictoxicology, Vol. 96, No. 3, 2010, pp 167–181.
3. Arnold, K. E, Brown A. R, Ankley G. T, Sumpter J. P, Medicating the environment: assessingrisks of pharmaceuticals to wildlife and ecosystems, Phil. Trans. R. Soc. B, Vol. 369, 2014.
4. Caldwell D. J, Sources of Pharmaceutical Residues in the Environment and their Control, InPharmaceuticals in the Environment, Hester, R. E., Harrison, R. M., Eds., Issues inEnvironmental Science and Technology No. 41, The Royal Society of Chemistry, 2015,pp 92–119.
86 Y. Emara et al.

5. Voulvoulis N, Barceló D, Verlicchi P, Pharmaceutical Residues in Sewage Treatment Worksand their Fate in the Receiving Environment, In Pharmaceuticals in the Environment, Hester,R. E., Harrison, R. M., Eds., Issues in Environmental Science and Technology No. 41, TheRoyal Society of Chemistry, 2015, pp 120–179.
6. Jiménez-González C, Constable D. C, Ponder C. S, Evaluating the “greenness” of chemicalprocesses and products in the pharmaceutical industry–a green metrics primer, ChemicalSociety reviews, Vol. 41, No. 4, 2012, pp 1485–1498.
7. Jiménez-González C, Overcash M. R, The evolution of life cycle assessment in pharmaceu-tical and chemical applications – a perspective, Green Chem., Vol. 16, No. 7, 2014, p 3392.
8. Mata T. M, Martins A. A, Neto B, Martins M. L, Salcedo, R, Costa C, LCA Tool forSustainability Evaluations in the Pharmaceutical Industry, Chemical EngineeringTransactions, Vol. 26, 2012.
9. Minkov N, Schneider L, Lehmann A, Finkbeiner M, Type III Environmental DeclarationProgrammes and harmonization of product category rules: Status quo and practicalchallenges, Journal of Cleaner Production, Vol. 94, 2015, pp 235–246.
10. Wernet G, Conradt S, Isenring H. P, Jiménez-González C, Hungerbühler K, Life cycleassessment of fine chemical production: A case study of pharmaceutical synthesis, Int J LifeCycle Assess, Vol. 15, No. 3, 2010, pp 294–303.
11. Jiménez-González C, Ollech C, Pyrz W, Hughes D, Broxterman Q. B, Bhathela N.,Expanding the Boundaries: Developing a Streamlined Tool for Eco-Footprinting ofPharmaceuticals, Org. Process Res. Dev., Vol. 17, No. 2, 2013, pp 239–246.
12. Brunet R, Guillén-Gosálbez G, Jiménez L, Combined simulation–optimization methodologyto reduce the environmental impact of pharmaceutical processes: Application to theproduction of Penicillin V, Journal of Cleaner Production, Vol. 76, 2014, pp 55–63.
13. De Soete W, Boone L, Willemse F, Meyer E, Heirman B, van Langenhove H, Dewulf J,Environmental resource footprinting of drug manufacturing: Effects of scale-up and tabletdosage, Resources, Conservation and Recycling, Vol. 91, 2014, pp 82–88.
14. Kim S, Jiménez-González C, Dale B. E, Enzymes for pharmaceutical applications—acradle-to-gate life cycle assessment, Int J Life Cycle Assess, Vol. 14, No. 5, 2009, pp 392–400.
15. Taggart M. A, Richards N, Kinney C. A, Impacts of Pharmaceuticals on Terrestrial Wildlife,In Pharmaceuticals in the Environment, Hester, R. E., Harrison, R. M., Eds., Issues inEnvironmental Science and Technology No. 41, The Royal Society of Chemistry, 2015,pp 216–254.
16. Crane M, Watts C, Boucard T, Chronic aquatic environmental risks from exposure to humanpharmaceuticals, Science of the Total Environment, Vol. 367, 2006, pp 23–41.
17. Santos L. H. M. L. M, Araujo A. N, Fachini A, Pena A, Delerue-Matos C, Montenegro M.C. B. S. M., Ecotoxicological aspects related to the presence of pharmaceuticals in the aquaticenvironment, Journal of hazardous materials, Vol. 175, 1–3, 2010, pp 45–95.
18. Alfonsín C, Hospido A, Omil F, Moreira M. T, Feijoo G, PPCPs in wastewater – Update andcalculation of characterization factors for their inclusion in LCA studies, Journal of CleanerProduction, Vol. 83, 2014, pp 245–255.
19. Ortiz de García S, García-Encina P. A, Irusta-Mata R, The potential ecotoxicological impactof pharmaceutical and personal care products on humans and freshwater, based on USEtox™characterization factors. A Spanish case study of toxicity impact scores, The Science of thetotal environment, Vol. 609, 2017, pp 429–445.
20. Muñoz I, José Gómez M, Molina-Díaz A, Huijbregts M. A, Fernández-Alba A. R,García-Calvo E, Ranking potential impacts of priority and emerging pollutants in urbanwastewater through life cycle impact assessment, Chemosphere, Vol. 74, No. 1, 2008,pp 37–44.
21. Bergman Å, Heindel J. J, Jobling S, Kidd K. A, Zoeller R. T, Eds., State of the Science ofEndocrine Disrupting Chemicals - 2012: An assessment of the state of the science ofendocrine disruptors, WHO; UNEP, 2013.
Life Cycle Management in the Pharmaceutical Industry … 87
22. Kümmerer K, Antibiotics in the aquatic environment–a review–part II, Chemosphere, Vol.75, No. 4, 2009, pp 435–441.
23. Brodin T, Piovano S, Fick J, Klaminder J, Heynen M, Jonsson M, Ecological effects ofpharmaceuticals in aquatic systems–impacts through behavioural alterations, Phil. Trans.R. Soc. B, Vol. 369, No. 1656, 2014.
24. Larsen H. F, Olsen S. I, Hauschild M. Z, Laurent A, New sustainable concepts and processesfor optimization and upgrading municipal wastewater and sludge treatment: Deliverable 4.2.Methodology for including specific biological effects and pathogen aspects into LCA,NEPTUNE Contract-No. 036845 (FP6 project), 2009.
25. International EPD System, Vaccines for human or veterinary medicine, whether or not put upas medicaments: Product group classification: UN CPC 35270, prepared by Life CycleEngineering, 2011.
26. Pfizer, Environmental Product Declaration for IMPROVAC: EPD No.: S-P-00261,BUREAU VERITAS Certification No. SE00250-1, 2012 (accessed May 5, 2017).
Open Access This chapter is licensed under the terms of the Creative Commons Attribution 4.0International License (http://creativecommons.org/licenses/by/4.0/), which permits use, sharing,adaptation, distribution and reproduction in any medium or format, as long as you give appropriatecredit to the original author(s) and the source, provide a link to the Creative Commons license andindicate if changes were made.The images or other third party material in this chapter are included in the chapter’s Creative
Commons license, unless indicated otherwise in a credit line to the material. If material is notincluded in the chapter’s Creative Commons license and your intended use is not permitted bystatutory regulation or exceeds the permitted use, you will need to obtain permission directly fromthe copyright holder.
88 Y. Emara et al.
Establishing LCA in the HealthcareSector
Nanja Hedal Kløverpris
Abstract Novo Nordisk has used Life Cycle Assessment (LCA) for many yearsand a few years ago the company took a major step forward and completed amapping of the product carbon footprint of the company’s key products. Throughsuccessful cross-organisational collaboration, technical LCA data and results havebeen translated into easy-to-understand messages that have helped the organisationto understand the LCA concept, drive improvements across the life cycle and tocommunicate about the environmental impact of products to external stakeholderssuch as patients, healthcare professionals, payers and policy-makers.
1 Introduction
Novo Nordisk is a global healthcare company with more than 90 years of inno-vation and leadership in diabetes care. Headquartered in Denmark, Novo Nordiskemploys approximately 42,000 people in 77 countries and markets its products inmore than 165 countries.
A key element in Novo Nordisk business philosophy is the triple bottom lineprinciple, which is about balancing financial, social and environmental considera-tions. This is anchored in the Novo Nordisk Articles of Association. The companyhas a long history of optimising the environmental performance through ambitiousstrategies and partnerships. One example is the Kalundborg Symbiosis, where NovoNordisk was one of the founders of an industrial symbiosis partnership. Anotherexample is the 10-year long partnership between Novo Nordisk and DONG Energy,which has resulted in major energy savings and ensured that all Novo Nordiskproduction sites in Denmark are powered by renewable energy from an offshorewind farm.
Novo Nordisk has taken the next step in the journey towards environmentalresponsibility and intensified the focus on the environmental impact at the product
N. H. Kløverpris (&)Novo Nordisk A/S, Bagsvaerd, Denmarke-mail: [email protected]
© The Author(s) 2018E. Benetto et al. (eds.), Designing Sustainable Technologies,Products and Policies, https://doi.org/10.1007/978-3-319-66981-6_10
89
level. This allows Novo Nordisk to make choices in R&D and production thatminimise carbon emissions from products and at the same time, support the com-mercial part of the organisation with environmental messages. This article describeshow Novo Nordisk has taken the lead in reducing carbon emissions at the productlevel.
2 Building a Common Framework for Product CarbonFootprints in the Healthcare Sector
For more than 25 years, Novo Nordisk has used LCA as the basic methodology tomeasure environmental impacts across the product life cycle. These LCAs followthe international LCA standards ISO 14040 and 14044.
In 2008, the UK NHS identified pharmaceuticals as one of the key contributorsto the carbon footprint of the UK healthcare system [1]. This sparked the need formore detailed guidelines on how to calculate the carbon footprint of pharmaceuticalproducts. Together with the NHS, Novo Nordisk and a handful of other healthcarecompanies founded the international Coalition of Sustainable Pharmaceuticals andMedical Devices (CSPM). The coalition initiated the development of asector-specific guideline on product carbon footprint. In 2012, the Greenhouse GasAccounting Sector Guidance for Pharmaceutical Products and Medical Devices [2]was published. It was reviewed by WRI for conformance with the GHG ProtocolProduct Life Cycle Standard and earned the “Built on GHG Protocol” mark.
Novo Nordisk was the first diabetes company to apply the guideline for productcarbon footprint of pharmaceuticals and medical devices. The first two carbonfootprint reports were carried out by an external consultant and finalised in 2013.To ensure compliance with the new guideline, a third party review was performedby the consultancy company ERM, who had prepared the sector guideline for theCSPM. Since 2013, Novo Nordisk has had internal LCA expertise and has con-tinued to use the guideline.
The sector-specific guideline and the ISO 14040/44 LCA standards ensure ascientifically solid approach to calculating product carbon footprints. Thesector-specific guideline gives clear guidance on scoping, data collection andreporting specifically focusing on the production processes and products in thehealthcare sector. All product carbon footprints within the healthcare industryshould comply with this guideline as it is considered best practice.
All Novo Nordisk product carbon footprint reports are third party validatedaccording to the international guidelines by an internationally recognised accoun-tancy company. The pharmaceutical industry has a large responsibility of ensuringpatient safety, and the industry is strictly regulated to protect the patients. Therefore,third party validation of product carbon footprint ought to be standard in thehealthcare industry.
90 N. H. Kløverpris
3 Implementing LCA in Novo Nordisk
Novo Nordisk has used LCA as a tool for decision support for more than 25 years.During these years, the LCA methodology and data availability has improvedsignificantly. In 2011, LCA became an integrated part of Novo Nordisk environ-mental strategy, and a programme was launched with the aim of mapping thecarbon footprint of the diabetes portfolio. Novo Nordisk was the first to calculatethe carbon footprint of one year diabetes treatment, including the active pharma-ceutical ingredient (API), device and needle.
The programme was anchored in an executive management committee and wasdriven by a cross-organisational team with representatives from production, R&D,marketing and stakeholder engagement. The top management commitment andcollaboration across organisational boundaries were essential to the success of theprogramme.
Achieving a sufficiently high quality of data is critical when LCA is used forsupporting decisions. Novo Nordisk has a long history of environmental reporting,which focuses on resource consumption, emissions and waste amounts.Environmental data has for many years been monitored and reported on building/site/company level and related to KPIs. However, it is a challenge to convert thesedatasets to the product level, and it requires close collaboration with local pro-duction experts. Novo Nordisk has proven that it is worth the effort: It provides theorganisation with a completely new perspective on environmental impacts, which inthe longer term allows for new approaches to setting targets and benchmarkingacross production units, e.g. by measuring energy consumption per unit producedinstead of energy consumption per building.
LCA screenings have for several years been an integrated part of the devicedevelopment process in Novo Nordisk. One of the keys to ensure that thescreenings are carried out is the integration into the development manual, whichmeans that the LCA screenings are obligatory. The LCA screenings are based onthe same LCA model as is used for the marketed products, which ensures con-sistency across the organisation.
Life cycle thinking was introduced in the ISO14001 standard on environmentalmanagement systems in 2015. Product carbon footprint is a great method to helpdetermine the environmental hotspots and focus environmental initiatives withinproduction to create the most impact. Moreover, Novo Nordisk uses LCA andcarbon footprint calculations as decision-support tool across the organisation, bothin relation to initiatives and projects driven by the environmental organisation andin relation to projects and changes with a significant environmental impact.
Novo Nordisk has built an advanced LCA model for APIs, devices and needlesand it creates a strong fundament for updating the carbon footprint of products andadding new scenarios. Since the LCA model covers the majority of Novo Nordiskproducts and relates to most production sites, new LCA calculations are made veryeffectively. This allows for providing quick answers to the organisation to supportdecision processes.
Establishing LCA in the Healthcare Sector 91
4 Communicating About LCA and Product CarbonFootprint in the Healthcare Sector
Novo Nordisk experiences an increasing interest in the environmental impact ofhealthcare products from authorities, insurance companies, doctors and patients.Novo Nordisk believes that stakeholders have the right to know about the envi-ronmental impact of the products. This was one of the reasons why Novo Nordiskdecided to map the carbon footprints across the diabetes portfolio.
The cross-organisational collaboration has been crucial in ensuring that theextensive work on the mapping of product carbon footprints is also translated intostories and messages that are understandable for non-experts.
Many LCA practitioners experience that it is difficult to communicate the rela-tively technical results of an LCA including the underlying assumptions. Thedetails of LCA conflict with the need for clear and short statements that can bedisseminated to a wide audience with no previous knowledge on product carbonfootprint. Translating the technical results into easy-to-understand messagesrequires a close collaboration between environmental experts and communicatorsand that both parties have the resources and willingness to listen and learn fromeach other. This is a challenge that is common in many companies, and NovoNordisk is actively seeking sparring with other companies on this and other issuesrelated to the use of LCA in large companies. Novo Nordisk was one of fourinitiators of a Danish LCA and ecodesign network consisting of representativesfrom major companies and academia in Denmark working within the field of LCA.The purpose of the network is to share knowledge and learn from each other withfocus on implementation of LCA in companies.
In Novo Nordisk, it became clear that communicating the specific carbonfootprint in kg CO2 equivalent did not hold value for the target audiences as theyfound it difficult to relate to this number. Therefore, we focus on comparisons withother consumables. An example of a message that has resonated well with the targetgroups is that daily diabetes treatment has a carbon footprint equivalent to a cup oftea [3]. We also use comparisons like driving a car and air travel to put productcarbon footprints into perspective. It helps both internal and external stakeholders tounderstand, remember and communicate the size of the footprint.
A comparison with competing products is not relevant, as this requires that thecarbon footprints are calculated using the same system boundaries and assumptionsand that we would have access to competitor production data. As a patent-drivenpharmaceutical company, most of our products are unique and thereforeproduct-to-product comparisons e.g. per unit of insulin are not relevant.
Communication to doctors and other healthcare professionals is in manycountries strictly regulated and marketing claims related to specific products mustbe based on peer reviewed publications that documents the clinical efficiency of adrug on the basis of clinical trials. There are no guidelines on the use of
92 N. H. Kløverpris

environmental messages in the marketing of pharmaceutical products. TheGuidelines for Providing Product Sustainability Information being developed byUNEP and International Trade Centre points at third party validation as the mostreliable assurance model for sustainability claims [4]. Klöppfer [5] points to the factthat an LCA study can only be claimed to be in accordance with the ISO 14040 and14044 standards if a third party review has been performed, whereas an LCApublished in a peer reviewed scientific journal cannot be claimed to be ISO com-pliant based on the peer review process alone as this does not follow the require-ments for the review process set out in the ISO standards. A third party reviewerwill often have access to more background data, LCA models etc. and have moretime assigned for a review than peer reviewers appointed by a scientific journal.Therefore, Novo Nordisk supports the use of third party validation as the best wayto ensure validity of the LCA results.
5 The Future of LCA in Healthcare
Novo Nordisk has demonstrated that product carbon footprints provide a basis forcommunicating with internal and external audiences about the environmentalimpact of pharmaceutical products. There is a great potential for driving furtherimprovements across the product life cycle of Novo Nordisk current and futureproducts and LCA will play an increasingly important role in ensuring that theenvironmental perspective is present in decision making across the organisation.
In the healthcare sector, LCA can bring valuable knowledge about the envi-ronmental impact of treating patients. However, it is important that pharmaceuticalsare considered in a full care pathway perspective—or what Novo Nordisk calls the‘patient carbon footprint’. The impact from treating patients goes beyond phar-maceuticals and medical devices. Diabetes can lead to complications such as eyeproblems, kidney disease, amputations etc. that are also associated with carbonemissions from hospitalisation, surgeries, frequent visits to clinics etc. This meansthat more efficient treatment leads to a reduced carbon emissions related to com-plications. Methods for quantifying the environmental impact of the patient carbonfootprint are currently being developed [6].
References
1. Stockholm Environment Institute (SEI), NHS Sustainable Development Unit, NHS EnglandCarbon Emissions: Carbon Footprinting Report, 2008.
2. Penny T, Fisher K, Collins M, Allison C, Greenhouse Gas Accounting Sector Guidance forPharmaceutical Products and Medical Devices, 2012.
Establishing LCA in the Healthcare Sector 93
3. Kløverpris N.H, Jensen N.D, Product Carbon Footprint, FlexPen® incl. API and needle, 2017.4. UNEP, ITC, Guidelines for Providing Product Sustainability Information, Draft for Global
Stakeholder Consultation, 2016.5. Klöppfer W, The critical review of life cycle assessment studies according to ISO 14040 and
14044, Int J Life Cycle Assess, Vol. 17, No. 9, 2002, pp. 1087–1093.6. Penny T, Collins M, Whiting A, Aumônier S, Care Pathways: Guidance on Appraising
Sustainability—Main Document, 2015.
Open Access This chapter is licensed under the terms of the Creative Commons Attribution 4.0International License (http://creativecommons.org/licenses/by/4.0/), which permits use, sharing,adaptation, distribution and reproduction in any medium or format, as long as you give appropriatecredit to the original author(s) and the source, provide a link to the Creative Commons license andindicate if changes were made.The images or other third party material in this chapter are included in the chapter’s Creative
Commons license, unless indicated otherwise in a credit line to the material. If material is notincluded in the chapter’s Creative Commons license and your intended use is not permitted bystatutory regulation or exceeds the permitted use, you will need to obtain permission directly fromthe copyright holder.
94 N. H. Kløverpris
Improving the Life Cycle Performanceof Chemical Products and MaterialsThrough Data Exchange Alongthe Value Chain—Synthesisof LCM2017 Session Presentations
Guido Sonnemann and Carmen Alvarado
Abstract This paper provides a summary of what has been presented anddiscussed at the 8th international conference on Life Cycle Management (LCM2017 conference, Luxembourg), during the session entitled “Improving the lifecycle performance of chemical products and materials through data exchange alongthe value chain”. The purpose of the session was to demonstrate how to assess andmanage the global sustainability of chemical products and materials, taking intoaccount their whole life cycle, to achieve real improvements. Over the six oralpresentations, the most challenging issues regarding availability and transparencyof Life Cycle Inventory data from the chemicals industry were discussed. Someapproaches developed in order to face these challenges were detailed, illustratedalso with the presentation of some specific case-studies.
1 Introduction
Most companies are part of long and sometimes complex supply chains. Often thecontrol over the environmental impacts along the value chain is limited for onesingle company. The purpose of the session was to demonstrate how to assess andmanage the global sustainability of chemical products and materials, taking intoaccount their whole life cycle, to achieve real improvements. This includes theidentification of hot spots and work towards sustainable innovation. Radicalimprovement along the value chain is only possible with close collaboration with
G. Sonnemann (&)University of Bordeaux, CNRS, UMR 5255, 33405 Talence Cedex, Francee-mail: [email protected]
C. AlvaradoAkzo Nobel Chemicals, 3818 LE Amersfoort, The Netherlands
G. SonnemannCNRS, ISM, UMR 5255, 33405 Talence Cedex, France
© The Author(s) 2018E. Benetto et al. (eds.), Designing Sustainable Technologies,Products and Policies, https://doi.org/10.1007/978-3-319-66981-6_11
95

suppliers, for example, through sharing supplier specific data on environmentalimpacts of raw materials. There are many obstacles which need to be overcomebefore sharing data along the value chain: trust, data formats, methodology har-monization, etc. The PEF (Product Environmental Footprint), together withSustainability and the WBCSD life cycle metrics for chemical products are goodexamples of platforms that can help companies share information in a safe, fair andefficient way to steer to real improvements towards sustainable development. Sixpresentations were selected for the session. The main outcomes of each of them aresummarised in this paper.
2 Rapid Estimation of Life Cycle Inventories
Many regulations and company sustainability activities are based on the applicationof Life Cycle Assessment. A significant challenge is the amount of data that needsto be compiled, harmonized and modelled before obtaining meaningful and robustresults.
In this context, the United States Environmental Protection Agency (U.S. EPA)developed an approach to rapidly generate more comprehensive and reliable lifecycle inventories (LCI) than those currently available. The basic approach togenerating such inventories is to combine four individual efforts:
(1) top-down data mining,(2) bottom-up simulation (combining material and energy balances with emissions
modelling),(3) LCI chemical lineage (computationally tracing the ancestry of a chemical
alternative), and(4) LCI reconciliation of both the top-down and bottom-up approaches.
Life Cycle Inventories developed through this approach can be updated oncenew datasets are available [1].
3 Current Models and Approaches for Data Matchingand Modelling of Chemical Production
Ecoinvent is a data provider for the Product Environmental Footprint (PEF) pilotphase, driven by the European Commission. In this context many of the datatenders are based on ecoinvent LCI data in the background and ecoinvent wasselected as the direct data supplier for 270 products and over 800 datasets, on theproduction of chemicals. The challenge was to deal with significant data needs onchemical products on short notice (3 months), while delivering quality and inte-grating primary data.
96 G. Sonnemann and C. Alvarado
Around 80 chemicals needed completely new datasets. Around 200 newchemicals unit process datasets were created. The industry stakeholders groupdiscussion involved in the PEF pilot phase was organised jointly with the creationof these datasets. The short timeframe made the collaboration difficult, but severalsources provided data. A framework model that provides a unit process result, wascreated in a way that each part of the process is adaptable. Thanks to the “modularmodel” approach chosen, the datasets can be upgraded on specific topics when databecomes available. A stoichiometric model of the reactions was required, withreactants and other reagents. Average values for yield, heat electricity, water andsupporting processes were available from industry reports. The air emission modelwas based on vapour pressure, filtering systems and toxicity. The waste watertreatment model used determines the water emissions. Previous models existed butall aspects of the new model have been updated and extended for this project.
The project was an interesting combination of data format and data requirementissues and high efficiency data generation. The flexible model of chemical unitprocesses allows users to work with various data availabilities. The model isaccessible, with all values and sources. The datasets list source types andacknowledge industry sources in coordination with the data providers. The data arenow used in the PEF pilot projects, and many will also be published in theupcoming ecoinvent 3.4 [2].
4 PlasticsEurope Experience in Managing InformationAlong the Value Chain for RA and LCA
Risk assessments are carried out by PlasticsEurope members for each substance. Ittakes the form of lists of substances with maximum limit of concentration ormigration. The full chemical composition of the plastics must be known, includingtraces of starting substances, additives, impurities at very low thresholds. Theinformation must be transmitted in the supply chain so that the one putting thepacked product on the market has the data on the plastics available. When there isno sectorial organisation, each actor interprets differently the requirements ofinformation and sends questionnaires upstream. They are all different and tend toask more than required. Suppliers hesitates to send information downstream sincethey are afraid of misinterpretation and misuse due to the fear of being challenged(substance ban, deselection…). There is a need for a common playing field in thesupply chain with a common interpretation of regulation, mutual understanding,respect of confidentiality and trust.
The situation for life cycle inventory data is similar: confidentiality issues pro-tection of competitiveness and know-how, competition law with a large grey zoneof interpretation, fear of giving readability on costs and of being deselected, etc.That means also here it is primordial to build mutual understanding and trust. Theglobal guidance principles on Life Cycle Assessment (LCA) databases are a good
Improving the Life Cycle Performance of Chemical Products … 97
starting point. For the way forward an approach is proposed that differentiatesaveraged and individual datasets. For averaged datasets partial disaggregation ispossible for commodities (large number of producers) but partial disaggregation isnot possible when there are not enough producers (3 being an absolute minimum).For individual dataset, it is up to business to decide. Most often, it is confidential.Overall there is a need for common rules. As an example PlasticsEurope’s rec-ommendation on Steam Cracker allocation for the sake of comparability of petro-chemical products was given [3].
5 Biomass Balance Approach: An Innovativeand Complementary Approach for Using Biomassin the Chemical Industry
BASF recognises four drivers for including renewables in their portfolio: com-petitiveness, upcoming regulations, climate change and raw material diversification.BASF has developed a methodology to account and communicate the renewablecontent of his materials to customers. This approach is an intermediate situation onthe way to dedicate production of materials with renewable content. The latter isoften costly as the market is not matured yet.
The biomass balance approach is similar to that for “green” electricity: The fossilraw materials needed to produce a customer’s products are replaced by renewableraw materials. Only the quantities of renewable raw materials requested by a cus-tomer are purchased up front by BASF and managed in the SAP system. When acustomer places an order, the required quantities of renewable feedstock are allo-cated to the products purchased.
The advantages of this approach are the production of drop-in products, easyaccountability and it can be implemented directly [4].
6 Sustainability at Teijin: Customer Benefit Modeland Case Study Tires
Being eco-effective is important for Teijin and for this reason eco-efficiencyassessments are often made to their products. With the help of this assessmentTeijin is able to assess the real eco-performance of its products. The presented casestudy was about car tires, where 90% of the impact along the value chain is in theuse phase, due to consumption of fuel. Therefore, products with lower weight andless rolling resistance turn out to show a better eco-efficiency performance [5].
98 G. Sonnemann and C. Alvarado

7 Life Cycle Assessment of Acrylic Fibre and Garmentin Thailand
A case study is presented that aims first at the quantification of environmentalimpacts by LCA according to ISO 14040/44 standard [6, 7], for one tonne ofAcrylic Fibre manufactured at Thai Acrylic Fibre Co. Ltd, i.e. cradle to gate study,and then for one piece of Acrylic Garment of 450 g throughout the entire life cycle,i.e. cradle to grave study with 100 washes. Acrylonitrile, electricity and steamconsumption were identified as major hot-spots in the value chain across the variousidentified environmental impacts. Use-stage electricity and water consumption arealso hot-spots in cradle to grave study. This information is used for the developmentof a report for communication to stakeholders. Improvements are possible in thecaptive power plant efficiency, the steam and electricity consumption in poly-merisation, the solvent recovery and the wet-spinning processes. Scenarios of dif-ferent usages of acrylonitrile produced through the propane route will be analysedin the future to further understand the processes and improve them [8].
8 Conclusions
The presentations provided a good overview of how Life Cycle Assessment is usedto assess chemical products and materials and which challenges exist with regard tothe data exchange along the value chain. The session shows how companies useLCA results to improve the chemical products in their journey towards sustain-ability, in which they use life cycle management. Some presentations also gave aninsight in the progress made in the quality and the possibilities of preparing LCIs ofchemical products and materials.
Overall, including also poster presentations, it can be said that the chemicalsindustry has achieved an important degree of maturity in implementing life cyclemanagement since the beginning of this century. In the future it can be expectedthat the data exchange along the value chain will be further improved, using as anexample the established exchange of toxicity information stemming from riskassessment.
References
1. Smith R-L, Meyer D-E, Ruiz-Mercado G-J, Gonzalez M-A, Abraham J-P, Barrett W-M,Randall P-M, Niblick B, Mittal V-K, Rapid Estimation of Life Cycle Inventory, LCM 2017conference, Luxembourg, 2017.
2. Wernet G, Levova T, Bourgault G, Current models and approaches for data matching andmodeling of chemical production, LCM 2017 conference, Luxembourg, 2017.
Improving the Life Cycle Performance of Chemical Products … 99
3. Castelan G, De Hults Q, PlasticsEurope experience in managing information along the valuechain for RA and LCA, LCM 2017 conference, Luxembourg, 2017.
4. Krüger C, Kicherer A, Kormann C, Raupp N, Biomass Balance: an innovative andcomplementary approach for using biomass in the chemicals industry, LCM 2017 conference,Luxembourg, 2017.
5. Beers H, Bosman H, Kamer M, Huguet Ferran P, Sustainability at Teijin: Customer BenefitModel and Case Study Tires, LCM 2017 conference, Luxembourg, 2017.
6. ISO 14040: Environmental management—Life cycle assessment—Principles and framework,Geneva, 2006.
7. ISO 14044: Environmental management—Life cycle assessment—Requirements and guide-lines, Geneva, 2006.
8. Barik J, Singh R, Life Cycle Assessment of Acrylic Fiber and Garment in Thailand, LCM 2017conference, Luxembourg, 2017.
Open Access This chapter is licensed under the terms of the Creative Commons Attribution 4.0International License (http://creativecommons.org/licenses/by/4.0/), which permits use, sharing,adaptation, distribution and reproduction in any medium or format, as long as you give appropriatecredit to the original author(s) and the source, provide a link to the Creative Commons license andindicate if changes were made.The images or other third party material in this chapter are included in the chapter’s Creative
Commons license, unless indicated otherwise in a credit line to the material. If material is notincluded in the chapter’s Creative Commons license and your intended use is not permitted bystatutory regulation or exceeds the permitted use, you will need to obtain permission directly fromthe copyright holder.
100 G. Sonnemann and C. Alvarado

Biomass Balance: An Innovativeand Complementary Method for UsingBiomass as Feedstock in the ChemicalIndustry
Christian Krüger, Andreas Kicherer, Claudius Kormannand Nikolaus Raupp
Abstract Fossil resource and greenhouse gas savings can be claimed when cer-tified biomass is co-fed with fossil raw materials into a highly efficient interlinkedproduction network. BASF and partners have developed a novel biomass balancecertification standard for chemical synthesis. It offers a reliable response to cus-tomers and end consumers who are increasingly interested in solutions that arebased on renewable feedstock without compromising resource efficiency and per-formance. The new standard describes how renewable feedstock is attributed to agiven sales product. Existing products can thus be derived from biomass andprovided with third-party certification. Highest technical product standards can bemaintained while fostering the strategic goals of a bio-economy, often requestedfrom different stakeholders.
1 BASF’s Biomass Balance Approach
The Circular Economy (CE) concept has gained a broad momentum in politics,industry, and society within the past few years [1]. One of the six levers is the shift torenewable energy and materials, which allow companies to reclaim, retain, andregenerate the health of ecosystems. For the chemical industry, it is still a big challengeto use renewable feedstocks. Bio-based chemistry is currently no solution to a rapidswitch to renewable feedstocks because of fundamental limits. Only some productscan be produced and large investments must be executed in R&D and productionassets. BASF found a concept to introduce biomass by using existing chemicalpathways in a cost-efficient way. The sustainability offeedstocks and themass balancebetween feedstocks and final products is proven by an independent certificate:
C. Krüger (&) � A. Kicherer � C. KormannBASF SE, Sustainability Strategy, 67056 Ludwigshafen, Germanye-mail: [email protected]
N. RauppBASF SE, Global Sustainability Manager Dispersions & Pigments,67056 Ludwigshafen, Germany
© The Author(s) 2018E. Benetto et al. (eds.), Designing Sustainable Technologies,Products and Policies, https://doi.org/10.1007/978-3-319-66981-6_12
101
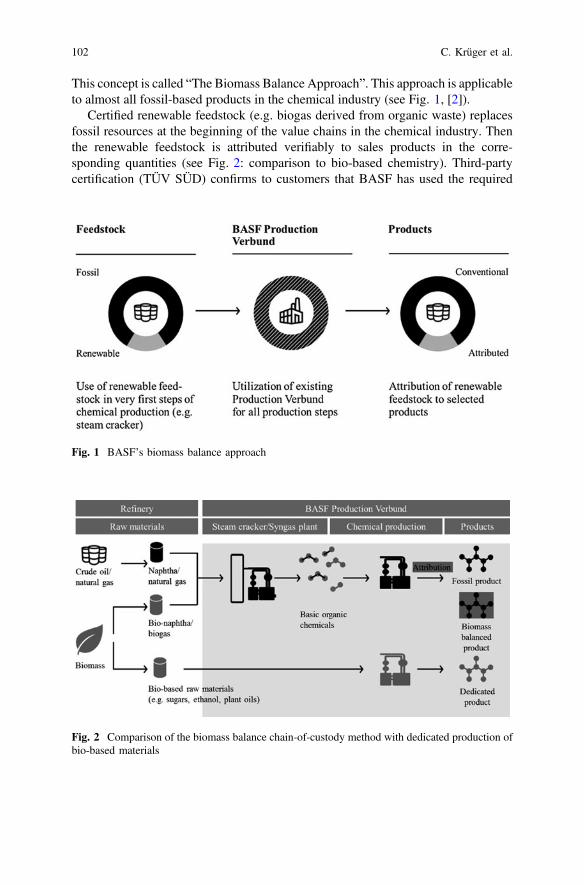
This concept is called “The Biomass Balance Approach”. This approach is applicableto almost all fossil-based products in the chemical industry (see Fig. 1, [2]).
Certified renewable feedstock (e.g. biogas derived from organic waste) replacesfossil resources at the beginning of the value chains in the chemical industry. Thenthe renewable feedstock is attributed verifiably to sales products in the corre-sponding quantities (see Fig. 2: comparison to bio-based chemistry). Third-partycertification (TÜV SÜD) confirms to customers that BASF has used the required
Fig. 1 BASF’s biomass balance approach
Fig. 2 Comparison of the biomass balance chain-of-custody method with dedicated production ofbio-based materials
102 C. Krüger et al.

quantities of renewable feedstock for the products they purchase [3]. The resultingproducts are called “Biomass balanced products”. They are technically identical totheir fossil comparatives but they are associated with quantifiably lower greenhousegas (GHG) emissions due to the renewable feedstock used. The biomass balancechain-of-custody method is applicable to almost all products in BASF’s portfolio,for example Acronal® binders used for premium decorative paints. To date, morethan 50 BASF products have already been certified, and several of them have beenintroduced into the market, thus contributing to sustainable development by savingfossil resources and reducing GHG emissions. BASF has received great attentionthanks to the biomass balance method and has been selected as finalist for the “TheCirculars 2017 Award” in the category “Multinational”. The biomass balancemethod enables BASF to react quickly and flexibly to the increased interest to userenewable raw materials thus helping customers to differentiate in the market.
2 Biomass Balance in Chemical Processes
Comprehensive experience about mass balance methods is already available inother markets, especially in the biofuel, biogas and bioenergy markets [4].Therefore, only minor adaptation to existing standards is needed for using BASF’sbiomass balance method in chemical production.
The system boundary is defined as the integrated chemical production system,which represents a physically interconnected arrangement of production sites at thesame location, or the physical interconnection of operating facilities over differentlocations by means of dedicated transportation systems (e.g. pipelines, rollingpipelines).
Only sustainably sourced biomass or bio-based products are used to replacefossil comparatives to manufacture intermediates and final products. Bio-basedrenewable feedstock may strongly differ in value for a chemical synthesis. In orderto make renewable feedstock of varying “chemical value” comparable to fossilfeedstock, we introduced a correction factor for each raw material similar to thebiofuel sector. BASF uses the lower heating value (LHV) as the most appropriateone. Therefore, each consignment of raw material entering the system boundary(i.e. the input) is assessed according to its LHV.
The exchange of fossil raw materials with bio-based feedstocks for productionallows for new claims. For example, according to the TÜV SÜD standard [3] thefollowing sales claim is certifiable for BASF and customers: “Fossil resource savingproduct. 100% of the fossil feedstock required for the manufacturing of this productwas replaced in the production site by renewable raw materials.”
Only renewable feedstock that enters in intermediates or products is eligible forthe biomass balance chain-of-custody method. Raw materials needed for generatingenergy as steam or electricity are not counted.
Biomass Balance: An Innovative and Complementary Method … 103

3 Sustainability of Renewable Feedstocks
Typically, renewable raw materials are usually not superior in all environmentalcategories and pros and cons have to be considered. Therefore, BASF only usessustainable renewable feedstock, which is certified as sustainable according to thecriteria of the Renewable Energy Directive of the EU Commission. Under thisframework several standards (e.g. ISCC, REDcert) comply with principles such as:
(1) Sustainable production of feedstock(2) Fulfilment of social standards in agriculture(3) Protection of biodiversity(4) Reduction of greenhouse gas emissions(5) Minimized interference with local food supply
BASF strives to continuously improve the sustainability profile of purchasedbio-based feedstocks and therefore it is important to keep the share of 1st generationrenewables as low as possible. Thanks to new collections systems and innovativetechnologies, the production of renewable feedstocks based on wastes (e.g. kitchenor other residues) is getting more attractive, and BASF is cooperating with itssuppliers to broaden the sustainable feedstock portfolio.
For the chemical industry, naphtha and natural gas are among the most importantraw materials. BASF has identified certified bio-based comparatives withouttechnical compromises. By replacing naphtha and natural gas at the beginning ofthe value chain at highly optimized Verbund sites, BASF can principally producemany thousands of biomass balance products, which can be used as drop-in solu-tion for customers in various industries.
4 Implementation in LCA
Life Cycle Assessment (LCA) is an important tool to evaluate quantitatively theenvironmental impacts of products [5]. Therefore, BASF implemented the biomassbalance concept into LCA by respecting the appropriate ISO 14040 series.
The calculation for BMB products is conducted in GaBi software on the basis ofthe existing model for the fossil-based product. A material flow analysis is used thatenables calculating the feedstock use in the final product.
The respective BMB product is calculated on the basis of the fossil product byreplacing fossil-based naphtha and natural gas with biofeedstock derived naphtha(= bionaphtha) and biofeedstock derived natural gas (= biogas). In Fig. 3 the cal-culation principle of the environmental burden B for biomass balance products isshown, which is the sum of the difference of the bio-based feedstocks and its fossilcomparatives.
104 C. Krüger et al.

The calculation of the life cycle inventory for BMB products is according to theequation as shown below:
B ¼ Bfossil þ a� (cvBN=N � BBN � BN)þ b� (cvBG=NG � BBG � BNGÞ
where:
B, Bfossil, BBN, BBG, BN, BNG: environmental burdensa: amount of naphtha substituted by bionaphthab: amount of natural gas substituted by biogascv: “chemical value” factor (dimensionless): cv = LHVfossil feedstock (substituted) /LHVbiofeedstock
LHV: lower heating valueIndices: BN = bionaphtha, N = naphtha, BG = biogas, NG = natural gas
4.1 Chemical Value Factor (cv)
Fossil feedstocks cannot always be replaced equally on a mass basis by bio-basedcomparatives, because of its different chemical nature in many cases. Sometimesbio-based feedstocks are used instead of fossil, where the carbon content is similar,but the energetic value is lower. Therefore, it is necessary to consider the “chemicalvalue” of feedstock (the term coined by BASF in the context of the BMB approach,although it is not necessarily related to chemical parameters but is used to denotethe use of feedstocks as chemicals rather than energy sources). The main feedstocksin the chemical industry are naphtha and natural gas, which are further processedeither by cracking or oxidation, which takes place at high temperatures. Thecalorific value of those feedstocks can be used as an approximation of the chemicalvalue, assuming lower heating value (LHV). The latter is also the determiningfactor for the design of the plant.
Fig. 3 Biomass balance calculation principle (example: bionaphtha and biogas)
Biomass Balance: An Innovative and Complementary Method … 105
5 Conclusions
BASF’s biomass balance is an innovative approach to introduce biomass to thechemical industry, which is certified by an independent party. We believe that it iscomplementary to bio-based chemistry to further increase the consumption ofrenewable materials as feedstock for the chemical industry. Our customersacknowledge two main advantages:
(1) The customer can use a biomass balanced product as drop-in solution withoutany compromise in performance. For most existing fossil-based products wecan provide biomass balanced alternatives by introducing sustainably sourcedbionaphtha and biogas into our interconnected production sites.
(2) There is no need for investment into R&D and new assets (which will usuallymake new products more expensive).
A certification standard from TÜV SÜD requires the sustainability of therenewable feedstocks and its correct use for the production of biomass balancedproducts. BASF is able to easily calculate LCAs without building up the wholevalue chains separately from the fossil route in a LCA model by respecting existingISO standards.
References
1. Peter Lacy et al., Waste to Wealth: The Circular Economy Advantage, Palgrave, 2015.2. <https://www.basf.com/en/company/sustainability/environment/resources-and-ecosystems/
renewable-raw-materials/biomass-balance.html> BASF’s biomass balance approach, websitefrom BASF (Accessed DD:05.2017).
3. <http://www.tuev-sued.de/plants-buildings-technical-facilities/focal-topics/renewable-energies/renewable-resources> Renewable Resources, website from TÜV SÜD (Accessed DD.05.2017).
4. <http://www.ble.de/SharedDocs/Downloads/DE/Klima-Energie/Nachhaltige-Biomasseherstellung/LeitfadenNachhaltigeBiomasseherstellung.html?nn=8911410> Leitfaden NachhaltigeBiomasseherstellung, BLE 2010, Website from German Federal Office for Agriculture andFood (Accessed DD.05.2017).
5. Peter Saling, The BASF Eco-Efficiency Analysis—A 20-year success story, BASF, 2016.
106 C. Krüger et al.

Open Access This chapter is licensed under the terms of the Creative Commons Attribution 4.0International License (http://creativecommons.org/licenses/by/4.0/), which permits use, sharing,adaptation, distribution and reproduction in any medium or format, as long as you give appropriatecredit to the original author(s) and the source, provide a link to the Creative Commons license andindicate if changes were made.The images or other third party material in this chapter are included in the chapter’s Creative
Commons license, unless indicated otherwise in a credit line to the material. If material is notincluded in the chapter’s Creative Commons license and your intended use is not permitted bystatutory regulation or exceeds the permitted use, you will need to obtain permission directly fromthe copyright holder.
Biomass Balance: An Innovative and Complementary Method … 107

Greening Agri-food Value Chainsin Emerging Economies
Matthias Stucki and Anél Blignaut
Abstract Emerging economies play an increasingly important role in global foodsecurity. They often rely on fossil fuels, lag behind on food governance and arecharacterised by subtropical climates, often requiring energy intensive irrigationand refrigerated storage. Mitigation options for agri-food value chains in emergingeconomies are novel and have substantial sustainability potential. The session onGreening Agri-food Value Chains in Emerging Economies at the 8th InternationalConference on Life Cycle Management showed the manifold challenges ofemerging economies on their transition path to contributing to a sustainable globalfood system. LCA can support this path by identifying specific environmentalhotspots in food value chains as well as by evaluating and prioritising potentialsolutions from an environmental perspective.
1 Introduction
Emerging economies such as Brazil, India, China and South Africa play anincreasingly important role in global food security since they are among the world’slargest producers of crops. Recently, their economies have experienced rapidgrowth and increased integration into the global economy [1]. Sustainable devel-opment in agricultural value chains of emerging economies is thus of high rele-vance for global food security. While the reduction of environmental impacts offood value chains has been widely studied in industrialised countries, mitigationoptions for food value chains in emerging economies are new and have substantialsustainability potential. Many emerging economies rely heavily on fossil fuels, lagbehind on food governance and are characterised by climate subtropical conditions,
M. Stucki (&)Institute of Natural Resource Sciences, Zurich Universityof Applied Sciences, 8820 Wädenswil, Switzerlande-mail: [email protected]
A. BlignautBlue North Sustainability, Stellenbosch, South Africa
© The Author(s) 2018E. Benetto et al. (eds.), Designing Sustainable Technologies,Products and Policies, https://doi.org/10.1007/978-3-319-66981-6_13
109

often requiring energy intensive irrigation and refrigerated storage [2–5]. In order togreen agri-food value chains in emerging economies, these specific conditions needto be taken into consideration. Therefore, the development and implementation ofsustainable technologies and production methods along the entire agri-food valuechain is a crucial step towards a global sustainable food system.
During the session on Greening Agri-food Value Chains in EmergingEconomies at the 8th International Conference on Life Cycle Management inLuxembourg in September 2017 successful projects and options for reducingenvironmental impacts of agri-food value chains in emerging economies werediscussed.
2 Summary of the Session Presentations
Within the session on Greening Agri-food Value Chains in Emerging Economiesfive presentations from four different continents were held. Subsequently, eachpresentation is referenced at the beginning of each section and therefore notrepeated again.
2.1 Rice, Sugarcane and Oil Palm Cultivation in Thailand
Trakarn Prapaspongsa analysed technology choices by farmers within the rice,sugarcane and oil palm industries in Thailand [6]. An eco-efficiency assessment wasperformed using the ISO 14045:2012 standard, whilst the environmental assess-ment was performed using Life Cycle Assessment (LCA).
Overall, rice cultivation had the largest negative impact on terrestrial acidifica-tion and marine eutrophication, with land use change (LUC) playing the mostimportant role. Prapaspongsa determined toxicity and marine eutrophication to bemost significant in sugarcane production. Significant environmental impacts arerelated to burning land. In palm oil production, pesticide use has a high impact.
Financial incentives were recommended: for example, higher prices for sugar-cane when the fields are not burnt. Environmental impacts in Thailand could besignificantly lowered if pesticide use in palm oil production were reduced and ifsugarcane producers refrained from field burning practises.
2.2 Dairy and Maize Farming in South Africa
Regula Keller from the Zurich University of Applied Sciences conducted a LCA onthe South African dairy industry, where she identified environmental impacts andevaluated the environmental mitigation potential of cleantech options [7]. The study
110 M. Stucki and A. Blignaut
led to the development of recommendations for sustainable production and theinclusion of datasets in the ecoinvent database.
A methane inhibitor (3NOP) can be used to reduce the enteric emissions of dairycows, leading to an 18% reduction in greenhouse gas (GHG) emissions, with noobservable trade-off in the other impact categories. Variable Frequency Drives(VFD) that reduce the electricity demand for pumping water, led to a reduction of34% of GHG emissions from maize cultivation. The environmental impacts arisingfrom irrigated maize fodder production could be reduced by 47% by using solarpowered irrigation compared to using South African grid electricity. The addition ofa methane inhibitor only reduced the climate change impact category but did nothave a significant effect on the other impact categories. Additionally, the long-termsafety needs to be proven and public acceptance needs to increase.
It was clear that the irrigation of maize for feed production benefitted from theuse of both VFD and, to an even greater extent, from solar photovoltaic energy use.All three options can generally be recommended and early implementation ofcleantech could potentially have a significant effect. Different cleantech measurescould also be combined to minimise the environmental impacts of milk production.
2.3 Pork Meat Production in South Africa
Valentina Russo from the University of Cape Town analysed the water footprint ofthe commercial pork value chain in South Africa [8]. Meat production in SouthAfrica is on the rise and there is a perception that the water footprints of meatproducts are large. In addition, South Africa is a water stressed country withphysical water scarcity predicted by 2040. The goals of this study were to assess thestress-adjusted blue consumptive water footprint in order to locate the environ-mental hotspots in meat production and to determine whether South Africa shouldbe concerned about meat consumption in regards to water intensity.
The WSI & AWARE methods were used to determine the water footprint. Thewater stress index (WSI [9]) relates water consumption to water scarcity in the samewatershed and the AWARE method [10] indicates the available water remainingand quantifies the potential of water deprivation, either to humans or to ecosystems.
The study concluded that the centre of South Africa and the Western Cape arehotspots for meat production. Most of the water is used for feed production (43%)and farming activities (54%). It was recommended that feed production be locatedin water management areas that experiences less stress and that practices shouldmove away from irrigation or toward more efficient irrigation systems. Water use,water stress and water efficiency need to be considered in feed optimisation forintensive animal finishing.
Greening Agri-food Value Chains in Emerging Economies 111
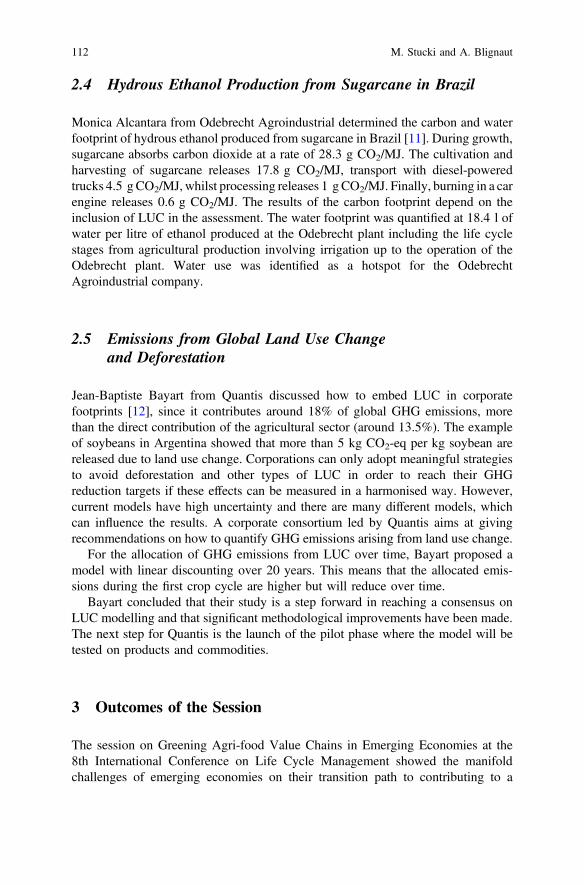
2.4 Hydrous Ethanol Production from Sugarcane in Brazil
Monica Alcantara from Odebrecht Agroindustrial determined the carbon and waterfootprint of hydrous ethanol produced from sugarcane in Brazil [11]. During growth,sugarcane absorbs carbon dioxide at a rate of 28.3 g CO2/MJ. The cultivation andharvesting of sugarcane releases 17.8 g CO2/MJ, transport with diesel-poweredtrucks 4.5 gCO2/MJ, whilst processing releases 1 gCO2/MJ. Finally, burning in a carengine releases 0.6 g CO2/MJ. The results of the carbon footprint depend on theinclusion of LUC in the assessment. The water footprint was quantified at 18.4 l ofwater per litre of ethanol produced at the Odebrecht plant including the life cyclestages from agricultural production involving irrigation up to the operation of theOdebrecht plant. Water use was identified as a hotspot for the OdebrechtAgroindustrial company.
2.5 Emissions from Global Land Use Changeand Deforestation
Jean-Baptiste Bayart from Quantis discussed how to embed LUC in corporatefootprints [12], since it contributes around 18% of global GHG emissions, morethan the direct contribution of the agricultural sector (around 13.5%). The exampleof soybeans in Argentina showed that more than 5 kg CO2-eq per kg soybean arereleased due to land use change. Corporations can only adopt meaningful strategiesto avoid deforestation and other types of LUC in order to reach their GHGreduction targets if these effects can be measured in a harmonised way. However,current models have high uncertainty and there are many different models, whichcan influence the results. A corporate consortium led by Quantis aims at givingrecommendations on how to quantify GHG emissions arising from land use change.
For the allocation of GHG emissions from LUC over time, Bayart proposed amodel with linear discounting over 20 years. This means that the allocated emis-sions during the first crop cycle are higher but will reduce over time.
Bayart concluded that their study is a step forward in reaching a consensus onLUC modelling and that significant methodological improvements have been made.The next step for Quantis is the launch of the pilot phase where the model will betested on products and commodities.
3 Outcomes of the Session
The session on Greening Agri-food Value Chains in Emerging Economies at the8th International Conference on Life Cycle Management showed the manifoldchallenges of emerging economies on their transition path to contributing to a
112 M. Stucki and A. Blignaut
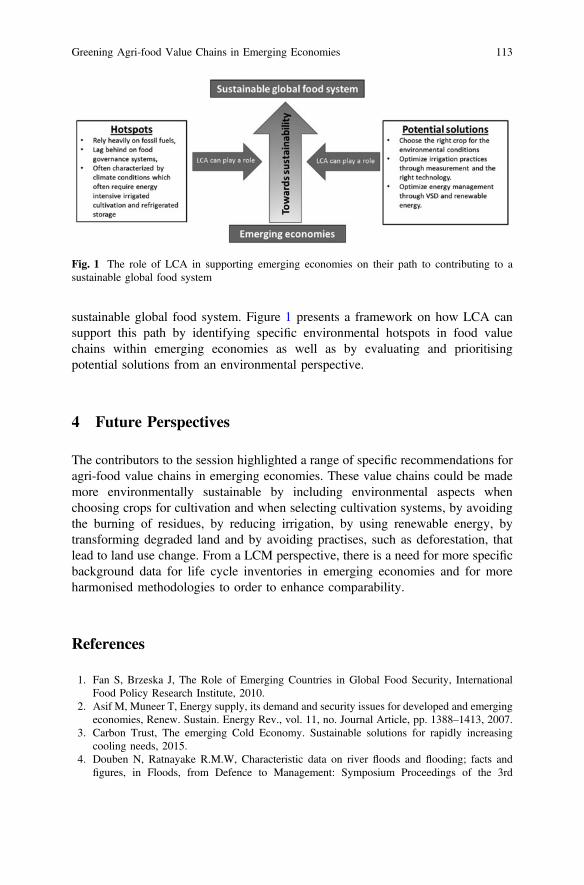
sustainable global food system. Figure 1 presents a framework on how LCA cansupport this path by identifying specific environmental hotspots in food valuechains within emerging economies as well as by evaluating and prioritisingpotential solutions from an environmental perspective.
4 Future Perspectives
The contributors to the session highlighted a range of specific recommendations foragri-food value chains in emerging economies. These value chains could be mademore environmentally sustainable by including environmental aspects whenchoosing crops for cultivation and when selecting cultivation systems, by avoidingthe burning of residues, by reducing irrigation, by using renewable energy, bytransforming degraded land and by avoiding practises, such as deforestation, thatlead to land use change. From a LCM perspective, there is a need for more specificbackground data for life cycle inventories in emerging economies and for moreharmonised methodologies to order to enhance comparability.
References
1. Fan S, Brzeska J, The Role of Emerging Countries in Global Food Security, InternationalFood Policy Research Institute, 2010.
2. Asif M, Muneer T, Energy supply, its demand and security issues for developed and emergingeconomies, Renew. Sustain. Energy Rev., vol. 11, no. Journal Article, pp. 1388–1413, 2007.
3. Carbon Trust, The emerging Cold Economy. Sustainable solutions for rapidly increasingcooling needs, 2015.
4. Douben N, Ratnayake R.M.W, Characteristic data on river floods and flooding; facts andfigures, in Floods, from Defence to Management: Symposium Proceedings of the 3rd
Fig. 1 The role of LCA in supporting emerging economies on their path to contributing to asustainable global food system
Greening Agri-food Value Chains in Emerging Economies 113

International Symposium on Flood Defence, Book, Section vols., J. van Alphen, E. van Beek,and M. Taal, Eds. 2006, pp. 19–35.
5. IFPRI, 2014–2015 Global Food Policy Report, International Food Policy Research Institute,Washington, 2015.
6. Prapaspongsa T, Gheewala S.H, Right Product or Technology for Sustainable Agri-FoodValue Chains? Lessons Learned from Rice, Sugarcane and Oil Palm Cultivation in Thailand,presented at the 8th International Conference on Life Cycle Management, Luxembourg,06-Sep-2017.
7. Keller R.L, Eyman L, Wettstein S, von Blottnitz H, Scharfy D, Stucki M, Assessment ofCleantech Options to Mitigate Environmental Impacts of South African Dairy and Maizefarming, presented at the 8th International Conference on Life Cycle Management,Luxembourg, 06-Sep-2017.
8. Russo V, et al., Life Cycle Inventories of South Africa Agricultural Products, ecoinvent centrein cooperation with University of Cape Town, Blue North, The Green House and ZurichUniversity of Applied Sciences, Zürich, 2017.
9. Pfister S, Koehler A, Hellweg S, Assessing the environmental impacts of freshwaterconsumption in LCA, Env. Sci Technol, vol. 43, no. 11, pp. 4098–4104, 2009.
10. Boulay A.-M, et al., The WULCA consensus characterization model for water scarcityfootprints: assessing impacts of water consumption based on available water remaining(AWARE), Int. J. Life Cycle Assess., pp. 1–11, Jun. 2017.
11. Sodré C, Alcântara M, Fernandes M, Koszka Kiss B.C, Carbon and water footprint ofhydrous ethanol from Brazilian sugarcane produced by Odebrecht Agroindustrial, presentedat the 8th International Conference on Life Cycle Management, Luxembourg, 06-Sep-2017.
12. Zollinger M, Dettling J, Rossi V, Humbert S, Bayart J.-B, How to embed land use change/deforestation-related emissions from corporate supply chains into corporate footprints andcorporate GHG targets in an accurate and credible manner, presented at the 8th InternationalConference on Life Cycle Management, Luxembourg, 06-Sep-2017.
Open Access This chapter is licensed under the terms of the Creative Commons Attribution 4.0International License (http://creativecommons.org/licenses/by/4.0/), which permits use, sharing,adaptation, distribution and reproduction in any medium or format, as long as you give appropriatecredit to the original author(s) and the source, provide a link to the Creative Commons license andindicate if changes were made.The images or other third party material in this chapter are included in the chapter’s Creative
Commons license, unless indicated otherwise in a credit line to the material. If material is notincluded in the chapter’s Creative Commons license and your intended use is not permitted bystatutory regulation or exceeds the permitted use, you will need to obtain permission directly fromthe copyright holder.
114 M. Stucki and A. Blignaut

Assessment of Cleantech Optionsto Mitigate the Environmental Impactof South African Dairy Farming
Regula Keller, Lea Eymann, Sarah Wettstein, Deborah Scharfyand Matthias Stucki
Abstract Milk production in South Africa has increased substantially over the pastten years and is associated with various environmental impacts. These can bereduced by different means, four of which were analysed in this study: choice ofbreed, the use of methane emission reducing feed additives, solar power as well asvariable frequency drive usage in fodder irrigation. The results showed thatHolstein cows had a lower impact than Ayrshire cows per litre of milk, but thatdifferences between farms were greater than between breeds alone. The feedadditive 3-nitrooxypropanol (3NOP) led to an 18% reduction in the climate changeimpact category, and did not have negative effects in other categories. Using solarpower for irrigation decreased the environmental impact by a larger degree thanintegrating a variable frequency drive to reduce the electricity demand of the waterpump. All four are adequate means of reducing the environmental impact of milk.
1 Introduction
Agriculture is the main contributor to global anthropogenic non-CO2 greenhousegas emissions [1] and also contributes considerably to air pollution, land, soil andwater degradation, and the reduction of biodiversity [2]. As in most emergingeconomies, livestock is one of the fastest growing sectors of the agriculturaleconomy in South Africa. Milk production increased by 26% in South Africa from2004 to 2014 [3] and rising meat consumption could exacerbate water stress inSouth Africa [4]. Given the considerable environmental impacts caused by dairyproduction systems and the industry’s growth, environmental mitigation strategiesare required.
Enteric emissions are responsible for the largest share of greenhouse gasemissions of milk at farm gate [5]. Effective measures to reduce enteric methane
R. Keller (&) � L. Eymann � S. Wettstein � D. Scharfy � M. StuckiZurich University of Applied Sciences, Institute of Natural Resource Sciences,Life Cycle Assessment, 8820 Wädenswil, Switzerlande-mail: [email protected]
© The Author(s) 2018E. Benetto et al. (eds.), Designing Sustainable Technologies,Products and Policies, https://doi.org/10.1007/978-3-319-66981-6_14
115
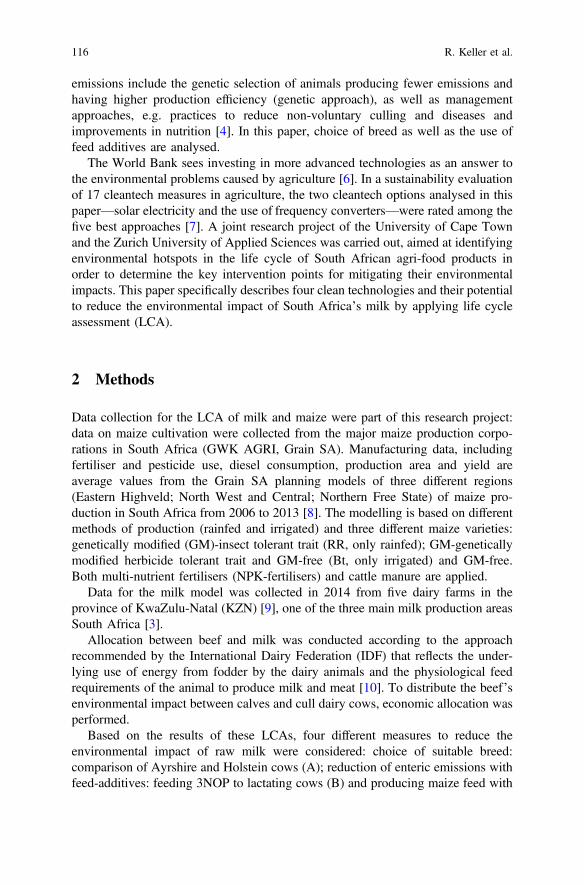
emissions include the genetic selection of animals producing fewer emissions andhaving higher production efficiency (genetic approach), as well as managementapproaches, e.g. practices to reduce non-voluntary culling and diseases andimprovements in nutrition [4]. In this paper, choice of breed as well as the use offeed additives are analysed.
The World Bank sees investing in more advanced technologies as an answer tothe environmental problems caused by agriculture [6]. In a sustainability evaluationof 17 cleantech measures in agriculture, the two cleantech options analysed in thispaper—solar electricity and the use of frequency converters—were rated among thefive best approaches [7]. A joint research project of the University of Cape Townand the Zurich University of Applied Sciences was carried out, aimed at identifyingenvironmental hotspots in the life cycle of South African agri-food products inorder to determine the key intervention points for mitigating their environmentalimpacts. This paper specifically describes four clean technologies and their potentialto reduce the environmental impact of South Africa’s milk by applying life cycleassessment (LCA).
2 Methods
Data collection for the LCA of milk and maize were part of this research project:data on maize cultivation were collected from the major maize production corpo-rations in South Africa (GWK AGRI, Grain SA). Manufacturing data, includingfertiliser and pesticide use, diesel consumption, production area and yield areaverage values from the Grain SA planning models of three different regions(Eastern Highveld; North West and Central; Northern Free State) of maize pro-duction in South Africa from 2006 to 2013 [8]. The modelling is based on differentmethods of production (rainfed and irrigated) and three different maize varieties:genetically modified (GM)-insect tolerant trait (RR, only rainfed); GM-geneticallymodified herbicide tolerant trait and GM-free (Bt, only irrigated) and GM-free.Both multi-nutrient fertilisers (NPK-fertilisers) and cattle manure are applied.
Data for the milk model was collected in 2014 from five dairy farms in theprovince of KwaZulu-Natal (KZN) [9], one of the three main milk production areasSouth Africa [3].
Allocation between beef and milk was conducted according to the approachrecommended by the International Dairy Federation (IDF) that reflects the under-lying use of energy from fodder by the dairy animals and the physiological feedrequirements of the animal to produce milk and meat [10]. To distribute the beef’senvironmental impact between calves and cull dairy cows, economic allocation wasperformed.
Based on the results of these LCAs, four different measures to reduce theenvironmental impact of raw milk were considered: choice of suitable breed:comparison of Ayrshire and Holstein cows (A); reduction of enteric emissions withfeed-additives: feeding 3NOP to lactating cows (B) and producing maize feed with
116 R. Keller et al.
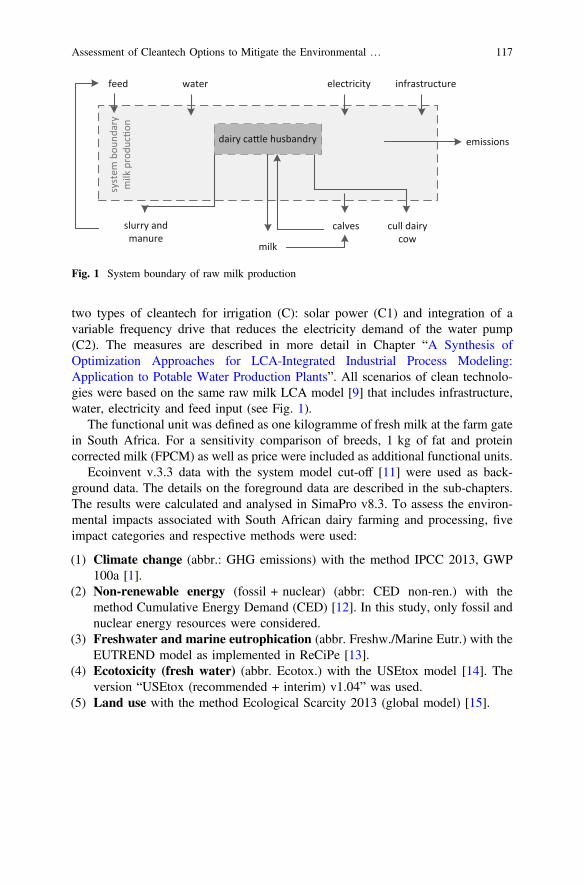
two types of cleantech for irrigation (C): solar power (C1) and integration of avariable frequency drive that reduces the electricity demand of the water pump(C2). The measures are described in more detail in Chapter “A Synthesis ofOptimization Approaches for LCA-Integrated Industrial Process Modeling:Application to Potable Water Production Plants”. All scenarios of clean technolo-gies were based on the same raw milk LCA model [9] that includes infrastructure,water, electricity and feed input (see Fig. 1).
The functional unit was defined as one kilogramme of fresh milk at the farm gatein South Africa. For a sensitivity comparison of breeds, 1 kg of fat and proteincorrected milk (FPCM) as well as price were included as additional functional units.
Ecoinvent v.3.3 data with the system model cut-off [11] were used as back-ground data. The details on the foreground data are described in the sub-chapters.The results were calculated and analysed in SimaPro v8.3. To assess the environ-mental impacts associated with South African dairy farming and processing, fiveimpact categories and respective methods were used:
(1) Climate change (abbr.: GHG emissions) with the method IPCC 2013, GWP100a [1].
(2) Non-renewable energy (fossil + nuclear) (abbr: CED non-ren.) with themethod Cumulative Energy Demand (CED) [12]. In this study, only fossil andnuclear energy resources were considered.
(3) Freshwater and marine eutrophication (abbr. Freshw./Marine Eutr.) with theEUTREND model as implemented in ReCiPe [13].
(4) Ecotoxicity (fresh water) (abbr. Ecotox.) with the USEtox model [14]. Theversion “USEtox (recommended + interim) v1.04” was used.
(5) Land use with the method Ecological Scarcity 2013 (global model) [15].
dairy ca le husbandry
calves cull dairy cow
slurry andmanure
infrastructurefeed
syst
em b
ound
ary
milk
pro
duc
on
water electricity
emissions
milk
Fig. 1 System boundary of raw milk production
Assessment of Cleantech Options to Mitigate the Environmental … 117

3 Life Cycle Inventory
This study uses the “Tier 2” approach described in the IPCC Guidelines to calculatemethane emissions from enteric fermentation [16]. Thereby, the methane emissionsfrom enteric fermentation of a dairy cow during its lifetime are calculated from thegross energy intake (GE), the methane conversion rate (Ym) and the energy contentof methane (55.56 MJ/kg). Based on the IPCC standard, the methane conversionrate (Ym) was assumed to be 6%, the value for dairy cows in developing countries.Further details of modelling are described for each measure individually.
Different breeds (A)
The four major dairy breeds in South Africa are Holstein, Jersey, Guernsey andAyrshire [3]. This study analysed the environmental impact of raw milk fromAyrshire and Holstein breeds.
A production mix of the five farms where data was collected (see Chapter“Sustainability Performance Evaluation for Selecting the Best Recycling PathwayDuring Its Design Phase”) with an equal share from each farm was modelled. Threefarms keep only Holstein cows and two farms keep both Holstein and Ayrshire cows.The number of dairy cows per farm varied between 260 and 1345. Data on feedquantities were collected from each farm. Silage maize and grain maize in concen-trated feed was modelled based on kg input and published inventories [8]. Thequantity of hay, pasture grass and kikuyu silage was included based on the productionarea on each farm. Ryegrass was irrigated on all farms, whereas kikuyu grass wascultivated under rainfed conditions. For silage and grain maize, the share of irrigationwas based on the average share in South Africa from 2006 to 2013 [17].
Addressing enteric fermentation (B)
Enteric fermentation was responsible for about 20% of the worldwide greenhousegas emissions from agriculture, forestry and other land use (AFOLU) from 2000 to2010, of which cattle contributed the largest share (75%). The enteric emissionsincreased most in Africa during this period (by 2.4% per year) [1].
Due to the importance of bovine enteric methane emissions, research has beencarried out to determine means of reduction. Feed supplements have been found toachieve a significant reduction in methane emissions from enteric fermentation. Theeffect of administering the methane inhibitor 3-nitrooxypropanol (3NOP) wasanalysed during a 12-week experiment in Pennsylvania (US): 48 Holstein cowswere fed 60–80 mg of 3NOP per kg dry feed [18]. The feed consisted mainly ofmaize silage (42.2%) and alfalfa haylage (18%). The rumen methane emissionswere measured five times during this period. An average reduction of 30% in rumenmethane emissions was observed for the cows that were fed with 3NOP, while themilk yield was not affected.
To estimate the effect of the methane inhibitor 3NOP on the environmental impacton South African milk, 3NOP supplementation was modelled for one farm with
118 R. Keller et al.
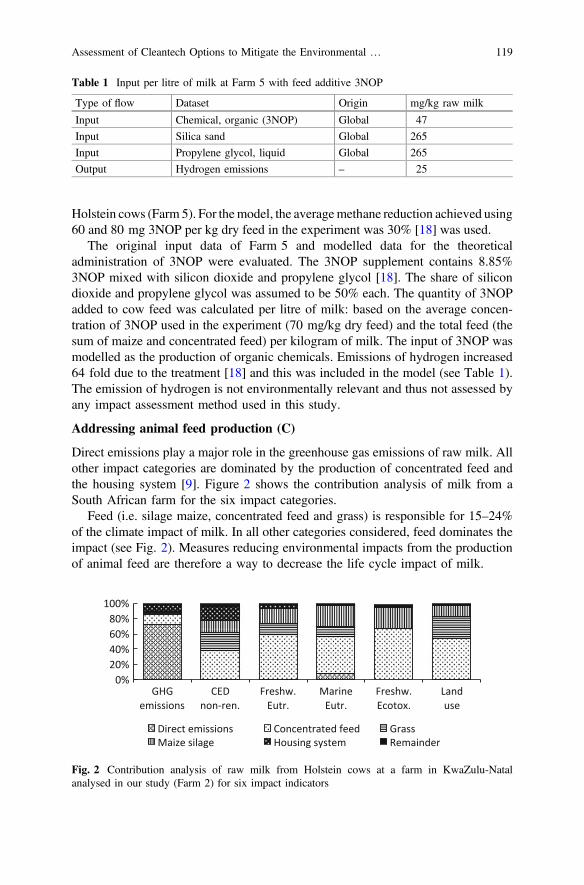
Holstein cows (Farm 5). For themodel, the averagemethane reduction achieved using60 and 80 mg 3NOP per kg dry feed in the experiment was 30% [18] was used.
The original input data of Farm 5 and modelled data for the theoreticaladministration of 3NOP were evaluated. The 3NOP supplement contains 8.85%3NOP mixed with silicon dioxide and propylene glycol [18]. The share of silicondioxide and propylene glycol was assumed to be 50% each. The quantity of 3NOPadded to cow feed was calculated per litre of milk: based on the average concen-tration of 3NOP used in the experiment (70 mg/kg dry feed) and the total feed (thesum of maize and concentrated feed) per kilogram of milk. The input of 3NOP wasmodelled as the production of organic chemicals. Emissions of hydrogen increased64 fold due to the treatment [18] and this was included in the model (see Table 1).The emission of hydrogen is not environmentally relevant and thus not assessed byany impact assessment method used in this study.
Addressing animal feed production (C)
Direct emissions play a major role in the greenhouse gas emissions of raw milk. Allother impact categories are dominated by the production of concentrated feed andthe housing system [9]. Figure 2 shows the contribution analysis of milk from aSouth African farm for the six impact categories.
Feed (i.e. silage maize, concentrated feed and grass) is responsible for 15–24%of the climate impact of milk. In all other categories considered, feed dominates theimpact (see Fig. 2). Measures reducing environmental impacts from the productionof animal feed are therefore a way to decrease the life cycle impact of milk.
Table 1 Input per litre of milk at Farm 5 with feed additive 3NOP
Type of flow Dataset Origin mg/kg raw milk
Input Chemical, organic (3NOP) Global 47
Input Silica sand Global 265
Input Propylene glycol, liquid Global 265
Output Hydrogen emissions – 25
0%20%40%60%80%
100%
GHGemissions
CEDnon-ren.
Freshw.Eutr.
MarineEutr.
Freshw.Ecotox.
Landuse
Direct emissions Concentrated feed GrassMaize silage Housing system Remainder
Fig. 2 Contribution analysis of raw milk from Holstein cows at a farm in KwaZulu-Natalanalysed in our study (Farm 2) for six impact indicators
Assessment of Cleantech Options to Mitigate the Environmental … 119
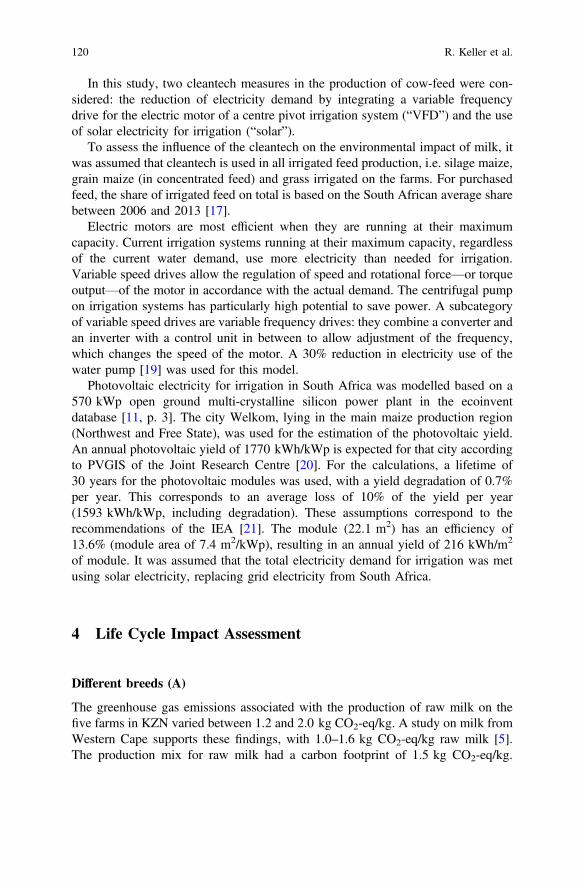
In this study, two cleantech measures in the production of cow-feed were con-sidered: the reduction of electricity demand by integrating a variable frequencydrive for the electric motor of a centre pivot irrigation system (“VFD”) and the useof solar electricity for irrigation (“solar”).
To assess the influence of the cleantech on the environmental impact of milk, itwas assumed that cleantech is used in all irrigated feed production, i.e. silage maize,grain maize (in concentrated feed) and grass irrigated on the farms. For purchasedfeed, the share of irrigated feed on total is based on the South African average sharebetween 2006 and 2013 [17].
Electric motors are most efficient when they are running at their maximumcapacity. Current irrigation systems running at their maximum capacity, regardlessof the current water demand, use more electricity than needed for irrigation.Variable speed drives allow the regulation of speed and rotational force—or torqueoutput—of the motor in accordance with the actual demand. The centrifugal pumpon irrigation systems has particularly high potential to save power. A subcategoryof variable speed drives are variable frequency drives: they combine a converter andan inverter with a control unit in between to allow adjustment of the frequency,which changes the speed of the motor. A 30% reduction in electricity use of thewater pump [19] was used for this model.
Photovoltaic electricity for irrigation in South Africa was modelled based on a570 kWp open ground multi-crystalline silicon power plant in the ecoinventdatabase [11, p. 3]. The city Welkom, lying in the main maize production region(Northwest and Free State), was used for the estimation of the photovoltaic yield.An annual photovoltaic yield of 1770 kWh/kWp is expected for that city accordingto PVGIS of the Joint Research Centre [20]. For the calculations, a lifetime of30 years for the photovoltaic modules was used, with a yield degradation of 0.7%per year. This corresponds to an average loss of 10% of the yield per year(1593 kWh/kWp, including degradation). These assumptions correspond to therecommendations of the IEA [21]. The module (22.1 m2) has an efficiency of13.6% (module area of 7.4 m2/kWp), resulting in an annual yield of 216 kWh/m2
of module. It was assumed that the total electricity demand for irrigation was metusing solar electricity, replacing grid electricity from South Africa.
4 Life Cycle Impact Assessment
Different breeds (A)
The greenhouse gas emissions associated with the production of raw milk on thefive farms in KZN varied between 1.2 and 2.0 kg CO2-eq/kg. A study on milk fromWestern Cape supports these findings, with 1.0–1.6 kg CO2-eq/kg raw milk [5].The production mix for raw milk had a carbon footprint of 1.5 kg CO2-eq/kg.
120 R. Keller et al.
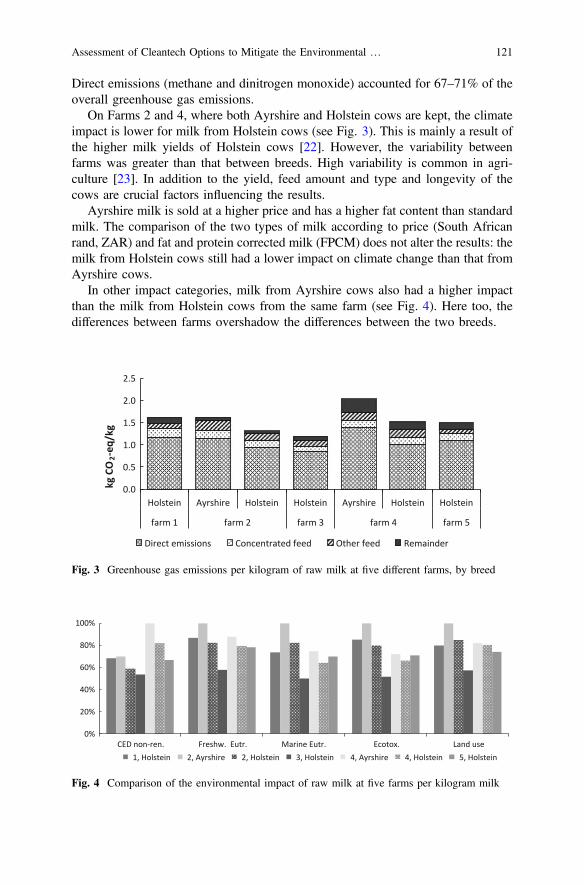
Direct emissions (methane and dinitrogen monoxide) accounted for 67–71% of theoverall greenhouse gas emissions.
On Farms 2 and 4, where both Ayrshire and Holstein cows are kept, the climateimpact is lower for milk from Holstein cows (see Fig. 3). This is mainly a result ofthe higher milk yields of Holstein cows [22]. However, the variability betweenfarms was greater than that between breeds. High variability is common in agri-culture [23]. In addition to the yield, feed amount and type and longevity of thecows are crucial factors influencing the results.
Ayrshire milk is sold at a higher price and has a higher fat content than standardmilk. The comparison of the two types of milk according to price (South Africanrand, ZAR) and fat and protein corrected milk (FPCM) does not alter the results: themilk from Holstein cows still had a lower impact on climate change than that fromAyrshire cows.
In other impact categories, milk from Ayrshire cows also had a higher impactthan the milk from Holstein cows from the same farm (see Fig. 4). Here too, thedifferences between farms overshadow the differences between the two breeds.
0.0
0.5
1.0
1.5
2.0
2.5
Holstein Ayrshire Holstein Holstein Ayrshire Holstein Holstein
farm 1 farm 2 farm 3 farm 4 farm 5
kg C
O2-
eq/k
g
Direct emissions Concentrated feed Other feed Remainder
Fig. 3 Greenhouse gas emissions per kilogram of raw milk at five different farms, by breed
0%
20%
40%
60%
80%
100%
CED non-ren. Freshw. Eutr. Marine Eutr. Ecotox. Land use1, Holstein 2, Ayrshire 2, Holstein 3, Holstein 4, Ayrshire 4, Holstein 5, Holstein
Fig. 4 Comparison of the environmental impact of raw milk at five farms per kilogram milk
Assessment of Cleantech Options to Mitigate the Environmental … 121
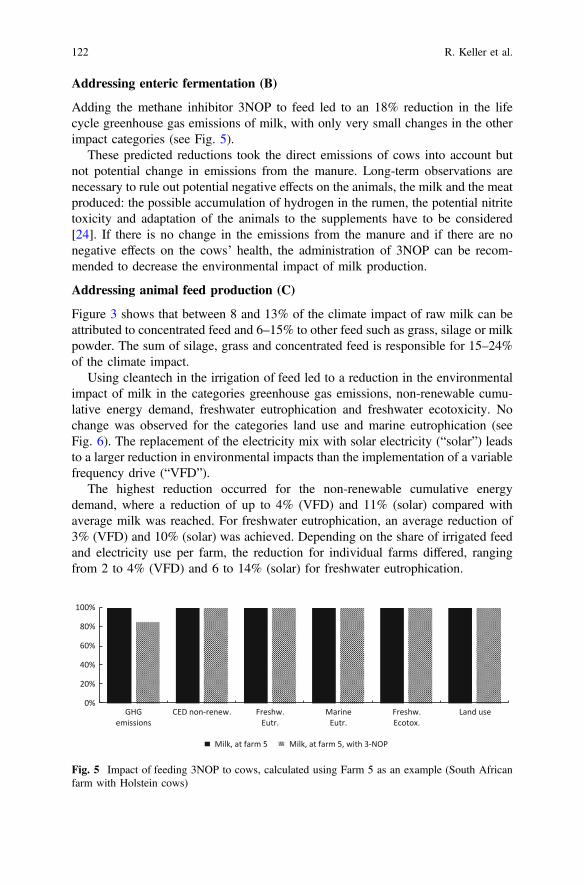
Addressing enteric fermentation (B)
Adding the methane inhibitor 3NOP to feed led to an 18% reduction in the lifecycle greenhouse gas emissions of milk, with only very small changes in the otherimpact categories (see Fig. 5).
These predicted reductions took the direct emissions of cows into account butnot potential change in emissions from the manure. Long-term observations arenecessary to rule out potential negative effects on the animals, the milk and the meatproduced: the possible accumulation of hydrogen in the rumen, the potential nitritetoxicity and adaptation of the animals to the supplements have to be considered[24]. If there is no change in the emissions from the manure and if there are nonegative effects on the cows’ health, the administration of 3NOP can be recom-mended to decrease the environmental impact of milk production.
Addressing animal feed production (C)
Figure 3 shows that between 8 and 13% of the climate impact of raw milk can beattributed to concentrated feed and 6–15% to other feed such as grass, silage or milkpowder. The sum of silage, grass and concentrated feed is responsible for 15–24%of the climate impact.
Using cleantech in the irrigation of feed led to a reduction in the environmentalimpact of milk in the categories greenhouse gas emissions, non-renewable cumu-lative energy demand, freshwater eutrophication and freshwater ecotoxicity. Nochange was observed for the categories land use and marine eutrophication (seeFig. 6). The replacement of the electricity mix with solar electricity (“solar”) leadsto a larger reduction in environmental impacts than the implementation of a variablefrequency drive (“VFD”).
The highest reduction occurred for the non-renewable cumulative energydemand, where a reduction of up to 4% (VFD) and 11% (solar) compared withaverage milk was reached. For freshwater eutrophication, an average reduction of3% (VFD) and 10% (solar) was achieved. Depending on the share of irrigated feedand electricity use per farm, the reduction for individual farms differed, rangingfrom 2 to 4% (VFD) and 6 to 14% (solar) for freshwater eutrophication.
0%
20%
40%
60%
80%
100%
GHGemissions
CED non-renew. Freshw.Eutr.
MarineEutr.
Freshw.Ecotox.
Land use
Milk, at farm 5 Milk, at farm 5, with 3-NOP
Fig. 5 Impact of feeding 3NOP to cows, calculated using Farm 5 as an example (South Africanfarm with Holstein cows)
122 R. Keller et al.

Theoretically, a reduction in global warming potential of 34% is possible if gridelectricity is replaced with photovoltaic-generated electricity [8]. Due to the highshare of coal (92%) in South Africa’s electricity production [25], greenhouse gasemissions can effectively be decreased by reducing grid electricity demand. Sincemethane emissions of cows are responsible for the largest share of the globalwarming potential, the indirect effect of cleantech on the global warming potentialof milk remained small.
5 Conclusions
On the five farms analysed, milk from Holstein cows had a lower impact than milkfrom Ayrshire cows. However, the influence of farm management was more rele-vant than the choice of breed. For climate change, enteric emissions are responsiblefor the highest share of impact. Therefore, the reduction of direct emissions of cowscan generally be recommended. However, only the impact of one environmentalcategory is reduced and the long-term safety of 3NOP has not yet been demon-strated. Reducing impacts associated with feed production may be a more suitableapproach, as it dominates the other impact categories. Addressing animal feedproduction with the use of a variable speed drive or the production of solar elec-tricity decreased the impact in three of the six impact categories considered whilethere was no trade-off in the other categories. These can therefore be recommended.Using solar electricity for irrigation reduced the impact to a higher degree than theintegration of a VFD and is therefore more effective.
In view of the importance of agriculture for sustainable development and the risein production and consumption of animal products in South Africa, early imple-mentation of cleantech could potentially have a considerable influence on the stateof the environment both in South Africa as well as worldwide.
Many measures are available that decrease the environmental impact of milk anddifferent means should be combined to reach the goal of environmentally soundproduction. Both the cost of implementation of these technologies and potentialmonetary benefits for the farms, i.e. arising from the reduction of grid electricity
0%20%40%60%80%
100%
GHGemissions
CED non-renew.
Freshw.Eutr.
MarineEutr.
Freshw.Ecotox.
Land use
Milk, conven onal feed Milk, VFD Milk, solar
Fig. 6 Influence of cleantech in the irrigation of feed on the environmental impact of milk
Assessment of Cleantech Options to Mitigate the Environmental … 123

consumption, have to be analysed to evaluate the financial sustainability of thesemeasures. Since the lack of acceptance from consumers or farmers could be apotential barrier to the implementation of improvement strategies, the acceptance ofthese technologies also has to be investigated. Finally, the analysis of social effectswould complete the sustainability evaluation of these measures.
References
1. IPCC, Climate Change 2013: The physical science basis. Contribution of working group I tothe fifth assessment report of the Intergovernmental Panel on Climate Change, CambridgeUniversity Press, 2013.
2. Steinfeld H, Gerber P, Wassenaar T, Castel V, Rosales M, Haan C, Livestock’s long shadow -environmental issues and options, FAO, Rome, 2006.
3. DAFF, A profile of the South African dairy market value chain 2014, Department ofAgriculture, Forestry and Fisheries, 2015.
4. Harding G, Courtney C, Russo V, When geography matters. A location-adjusted blue waterfootprint of commercial beef in South Africa, Journal of Cleaner Production, 2017, Vol. 151,pp. 494–508.
5. Notten P, Mason-Jones K, Life cycle assessment of milk production in the Western Cape,2011.
6. The World Bank, World development report 2008—overview, Washington D.C., USA, 2007.7. Scharfy D, Boccali N, Stucki M, Clean technologies in agriculture—how to prioritise
measures?, Sustainability, 2017, Vol. 9, No. 8, p. 1303.8. Wettstein S, Muir K, Scharfy D, Stucki, M, The environmental mitigation potential of
photovoltaic-powered irrigation in the production of South African maize, Manuscriptsubmitted for publication, 2017.
9. Eymann L, Stucki M, Schwab S, Wettstein S, Environmental impact of South African milk: Acomparison of Ayrshire and Holstein breeds, in 10th International conference on Life CycleAssessment of Food, University College Dublin, Ireland, 2016, pp. 99–105.
10. IDF, A common carbon footprint approach for the dairy sector. The IDF guide to standard lifecycle assessment methodology, International Dairy Federation, 2015.
11. Ecoinvent Centre, ecoinvent data v3.3, Swiss Centre for Life Cycle Inventories, Zürich, 2016.12. Hischier R, Weidema B, Althaus H, Bauer C, Frischknecht R, Doka G, Dones R, Hellweg S,
Humbert S, Jungbluth N, Köllner T, Loerinck Y, Margni M, Nemecek T, Implementation oflife cycle impact assessment methods, Swiss Centre for Life Cycle Inventories, Dübendorf,CH, 2010.
13. Goedkoop M, Heijungs R, Huijbregts M.A.J, De Schryver A, Struijs J, van Zelm R, ReCiPe2008—A life cycle impact assessment method which comprises harmonised categoryindicators at the midpoint and the endpoint level. First edition. Report I: Characterisation, NL,2013.
14. Rosenbaum R.K, Bachmann T.M, Gold L.S. Huijbregts M.A.J, Jolliet O, Juraske R,Koehler A, Larsen H.F, MacLeod M, Margni M, McKone T.E, Payet J, Schuhmacher M, vande Meent D, Hauschild M.Z, USEtox—the UNEP-SETAC toxicity model: recommendedcharacterisation factors for human toxicity and freshwater ecotoxicity in life cycle assessment,International Journal of Life Cycle Assessment, 2008, Vol. 13, No. 7, pp. 532–546.
15. Frischknecht R, Büsser Knöpfel S, Swiss Eco-Factors 2013 according to the EcologicalScarcity Method. Methodological fundamentals and their application in Switzerland, FederalOffice for the Environment, Berne, 2013.
16. IPCC, IPCC Good Practice Guidance and Uncertainty Management in National GreenhouseGas Inventories—Chapter 4 Agriculture, 2006.
124 R. Keller et al.
17. Grain SA, Operational planning of white maize grain production in the production year 2011/2012 in Eastern Highveld, Northwest, and Central and Northern Free State, South Africa;Maize production in South Africa from 2006 to 2013, 2014.
18. Hristov A.N, Oh J, Giallongo F, Frederick T.W, Harper M.T, Weeks H.L, Branco A.F,Moate P.J, Deighton M.H, Williams S.R.O, Kindermann M, Duval S, An inhibitorpersistently decreased enteric methane emission from dairy cows with no negative effect onmilk production, Proceedings of the National Academy of Sciences, 2015, Vol. 112, No. 34,pp. 10663–10668.
19. Eskom, Variable Speed Drives: Reducing the energy cost of irrigation on farms, EskomIntegrated Demand Management, 2015.
20. European Commission, Photovoltaic Geographical Information System (PVGIS)—geograph-ical assessment of solar resource and performance of photovoltaic technology, 2012.
21. Fthenakis V, Frischknecht R, Raugei M, Chul K.H, Alsema E, Held M, Scholten M.W,Methodology guidelines on life cycle assessment of photovoltaic electricity, Subtask 20“LCA”, IEA PVPS Task 12, 2011.
22. Moore R.K, Kennedy B.W, Schaeffer L.R, Moxley J.E, Relationships between age and bodyweight at calving and production in first lactation Ayrshires and Holsteins, Journal of DairyScience, 1991, Vol. 74, No. 1, pp. 269–278.
23. Hersener J-L, Baumgartner D.U, Dux D, Zentrale Auswertung von Ökobilanzen land-wirtschaftlicher Betriebe (ZA-ÖB)., Agroscope, Forschungsanstalt Agroscope Reckenholz-Tänikon ART, Zürich/Ettenhausen, 2011.
24. Hristov A.N, Oh J, Firkins J.L, Dijkstra J, Kebreab E, Waghorn G, Makkar H.P.S,Adesogan A.T, Yang W, Lee C, Special topics—Mitigation of methane and nitrous oxideemissions from animal operations: I. A review of enteric methane mitigation options, Journalof Animal Science, 2013, Vol. 91, No. 11, pp. 5045–5069.
25. International Energy Agency, South Africa: electricity and heat for 2014, 2017, https://www.iea.org/statistics/statisticssearch/report/?country=SouthAfric&product=electricityandheat,(Accessed 25.05.2017).
Open Access This chapter is licensed under the terms of the Creative Commons Attribution 4.0International License (http://creativecommons.org/licenses/by/4.0/), which permits use, sharing,adaptation, distribution and reproduction in any medium or format, as long as you give appropriatecredit to the original author(s) and the source, provide a link to the Creative Commons license andindicate if changes were made.The images or other third party material in this chapter are included in the chapter’s Creative
Commons license, unless indicated otherwise in a credit line to the material. If material is notincluded in the chapter’s Creative Commons license and your intended use is not permitted bystatutory regulation or exceeds the permitted use, you will need to obtain permission directly fromthe copyright holder.
Assessment of Cleantech Options to Mitigate the Environmental … 125
Food Waste Management (Sector)in a Circular Economy
Nicole Unger and Francesco Razza
Abstract The presentations addressed the topic of food waste management in acircular economy from various angles. Understanding the amount of food wastegenerated and setting measures to prevent it should be the starting point. Any notprevented food waste should be valorised aiming at a positive triple bottom line(social, economic and environmental). The huge environmental and economicpotential of co-digestion of dairy manure and food wastes by linking waste producerswith costumers for derived products was demonstrated for the US. Further the linkbetween bio-waste, compost and soil quality is highlighted which contributes tofood security and the wider bio-economy. Looking forward research into the appli-cation of selected agri-food wastes to produce alternative sources of protein couldresult in more sustainable source of proteins able to compete with industrial chickenproduction. Overall, the presentations and discussions showed the multi-facettednature of food waste management emphasising that a range of measures by manystakeholders are required to move towards a circular economy society.
1 Introduction
The Sustainable Development Goal 12.3, focuses on the food waste sector and setsthe target to halve the per capita global food waste at the retail and consumer level by2030 and to reduce food losses along production and supply chains, includingpost-harvest losses. The European circular economy package [1] explicitly aligns tothis target and made food waste one of its priority areas. In the same document, the
N. Unger (&)University of Natural Resources and Life Sciences,Institute of Waste Management, Vienna, Muthgasse 107,1190 Vienna, Austriae-mail: [email protected]
F. RazzaNovamont—Ecology of Product and Environmental Communication,Piazz.le Donegani 4, 05100 Terni, Italy
© The Author(s) 2018E. Benetto et al. (eds.), Designing Sustainable Technologies,Products and Policies, https://doi.org/10.1007/978-3-319-66981-6_15
127
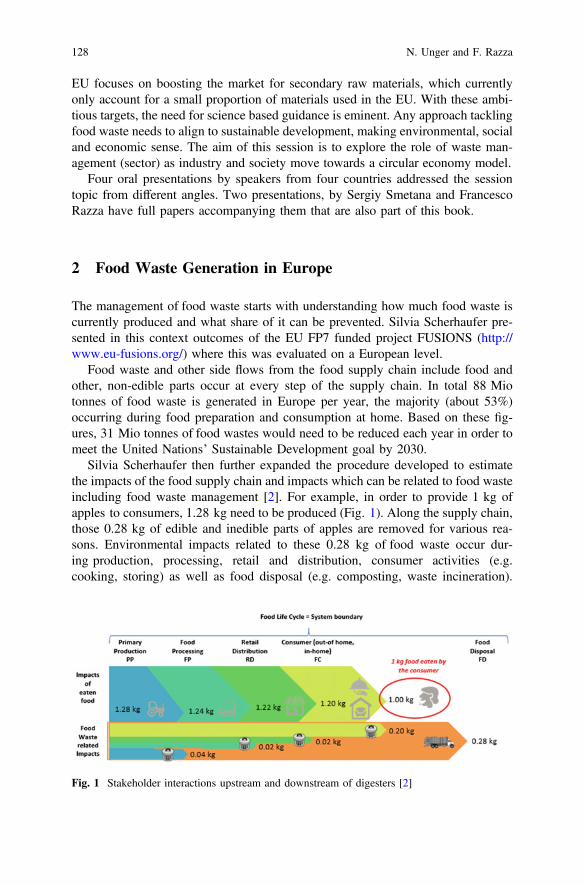
EU focuses on boosting the market for secondary raw materials, which currentlyonly account for a small proportion of materials used in the EU. With these ambi-tious targets, the need for science based guidance is eminent. Any approach tacklingfood waste needs to align to sustainable development, making environmental, socialand economic sense. The aim of this session is to explore the role of waste man-agement (sector) as industry and society move towards a circular economy model.
Four oral presentations by speakers from four countries addressed the sessiontopic from different angles. Two presentations, by Sergiy Smetana and FrancescoRazza have full papers accompanying them that are also part of this book.
2 Food Waste Generation in Europe
The management of food waste starts with understanding how much food waste iscurrently produced and what share of it can be prevented. Silvia Scherhaufer pre-sented in this context outcomes of the EU FP7 funded project FUSIONS (http://www.eu-fusions.org/) where this was evaluated on a European level.
Food waste and other side flows from the food supply chain include food andother, non-edible parts occur at every step of the supply chain. In total 88 Miotonnes of food waste is generated in Europe per year, the majority (about 53%)occurring during food preparation and consumption at home. Based on these fig-ures, 31 Mio tonnes of food wastes would need to be reduced each year in order tomeet the United Nations’ Sustainable Development goal by 2030.
Silvia Scherhaufer then further expanded the procedure developed to estimatethe impacts of the food supply chain and impacts which can be related to food wasteincluding food waste management [2]. For example, in order to provide 1 kg ofapples to consumers, 1.28 kg need to be produced (Fig. 1). Along the supply chain,those 0.28 kg of edible and inedible parts of apples are removed for various rea-sons. Environmental impacts related to these 0.28 kg of food waste occur dur-ing production, processing, retail and distribution, consumer activities (e.g.cooking, storing) as well as food disposal (e.g. composting, waste incineration).
Fig. 1 Stakeholder interactions upstream and downstream of digesters [2]
128 N. Unger and F. Razza

The later in the supply chain food is wasted the more environmental impacts areassociated with this food waste. Food waste reduction by prevention wouldtherefore avoid those impacts.
Concluding the presentation, she emphasised that taking measures to reducefood waste at the consumer level is key, also for industry. Governments have animportant role to play in providing transparency on legal options for food redis-tribution. By preventing food waste at the consumer level, around 26 Mio tonnes offood can be saved from being wasted (assuming that 57% of food waste isavoidable). This would result in a reduction potential of 69 Mio tonnes CO2 eq.(corresponding to the level of Finland’s total greenhouse gas emissions).
3 Business Opportunity Through Co-digestion of DairyManure in the US
Methane emissions from food waste landfill and dairy manure anaerobic lagoonsare causing significant greenhouse gas emissions (GHG). This case study, presentedby Ying Wang, shows how the introduction of a sustainable dairy anaerobicdigester system can have co-benefits across the supply chain by turning waste intouseful products through industry symbiosis. In this case study, Magic dirt, atrademark for digester-derived nutrient fibre, grew its business from 25 stores in 1state to 2800 stores in 41 states from 2014 to 2017.
The success of the business model, including complex stakeholder interactions(Fig. 2), depends on multiple factors: (1) Dairy association set up sector GHGreduction targets that incentivises big food companies to “insetting” carbon emis-sions along their own supply chain; (2) third party investors who construct andoperate anaerobic digesters take financial risks away from dairy farmers; (3) securedsubstrate supply agreements with manure providers and food waste producers, suchas commercial, retail and processing sites, and also “off-take agreements” thatsecure future contracts of selling produced energy to utility companies, nutrient
Fig. 2 Stakeholder interactions upstream and downstream of digesters
Food Waste Management (Sector) in a Circular Economy 129

fibres to retailers such as Walmart, as well as produced nitrogen and phosphorus tooffset commercial fertilisers. Carbon reductions can be also sold as offsettingcredits. In this business model, dairy farms and food companies achieved GHGreduction targets and investors profit by converting waste into product, which meetgreen supplier criteria. Target incentives, collaboration along supply chain, and abusiness model that balances business risk and opportunities largely contributed tothe success. The AgSTAR project of the U.S. EPA [3] analysed the possibility ofinstalling anaerobic digesters with energy generation and nutrient capture in con-fined animal feeding operations with 500+ cows in the US, suggesting 2647digesters to be installed nationwide. By implementing the proposed business modelto dairy operations and 3rd party digester companies, it could potentially generate12 Mio MWh of electricity, and also 42 Mio metric tons of CO2 offsetting creditsannually, mainly driven by reducing methane emissions from landfilling food wasteand manure lagoons, and also avoiding grid electricity production.
4 The Role of Composting in a Circular Economy
A decline in soil organic matter (SOM) can be observed in Europe. It is one of themost important indicators for soil quality which hugely affects the agricultural sectorand bio-economy. The sustainable management of SOM is an explicit requirementof several international standards and programmes e.g. the EC 16752 Bio-basedproduct sustainability criteria. Food waste and garden waste are common feedstocksfor the production of compost. The waste material is collected and biologicallytreated. The produced compost contains nutrients and humic substances whichdirectly contribute to increase the SOM pool in the soil. Applying compost toagricultural land contributes to improved soil quality and thus bio-economy.Compost use also affects the GHG balance of crops since 58% of SOM is carbon.
Francesco Razza reported on a case study where compost is applied in a cardooncropping system in North-East Sardinia. The crop system consists of a rotation of6 years of cardoon, 1 year of durum wheat and 1 year of field bean, analysed over atime frame of 22 years. One ‘compost’ scenario, where compost is applied duringthe 1st and the 4th year of cardoon is compared to a ‘no compost’ scenario, where theonly organic matter contribution was from above-ground biomass left in the soil afterharvest. The trials showed clearly higher levels in SOM increasing steadily over thetime frame of 22 years (carbon stock changes are generally calculated over a timeframe of 20 years). A GHG balance of the above crop system also showed benefitsfor the application of compost: CO2 uptakes linked to the increase of SOM in soilhave the same order of magnitude as the overall cardoon “Cradle to gate” GHGemissions. Consequently, taking into account SOM dynamics compost scenarioshows a reduction of its carbon footprint of 70% compared to ‘no compost’ scenario.
Putting this research into the bigger European context shows that only about 1/3of municipal bio-waste is collected and recycled into high quality compost anddigestate while demand for compost clearly outstrips availability. A better
130 N. Unger and F. Razza

acknowledgement of the link between bio-waste management, compost quality andthe sustainable biomass production required for food security and the widerbio-economy is crucial.
5 Agri-food Waste Streams Utilisation for FoodSubstitutes Development
Food production and consumption systems are changing. This reflects not only onthe nutritional need, but also on the popularity of diets such as vegan or flexitarian.Substitution of highly nutritional foods with analogs is gaining momentum. Theresearch presented by Sergiy Smetana focused on the valorisation of agri-foodwaste streams for food substitutes design. A LCA approach (cradle to plate) wasused to assess the environmental impact of different meat substitutes. It showed thatdepending on the impact or indicator (greenhouse gases, energy, land use or wateruse) different substitutes show advantages and disadvantages. The comparison wasdone per weight unit but it needs to be pointed out that different meat substitutes donot have the same nutritional profile. Further his research analysed the potential ofwaste-to-food application and Technology Readiness Level (TRL) for variousbiomass sources (e.g. insects, microalgae) in comparison against conventionalanimal derived products (e.g. chicken, whey concentrate) [4, 5].
Overall it was concluded that, traditional food substitution produced withalternative biomass sources is a necessity to design a more sustainable transition tothe new food system. For those considerations of TRL, nutritional profile andenvironmental impact are important to better understand their potential applicationin the future. State-of-the-art production of meat analogs based on milk, myco-proteins, insects and microalgae biomass are currently not competitive in terms ofenvironmental impact to the benchmark meat (chicken in this case). However, thereis a high positive potential of agri-food waste and side streams (molasses, distilledgrains, grain brans) application for insect and single cell protein products as foodsubstitutes. The application of agri-food waste streams is complicated but possiblefor the cultured media production. Application of selected agri-food wastes toproduce alternative sources of protein could result in more sustainable source ofproteins able to compete with industrial chicken production.
6 Discussion and Conclusions
The presentations addressed the topic of food waste management in a circulareconomy from various angles. Prevention of food waste will be key to meet the UN’sSustainable development goals. Any food waste not prevented should be valorised ina manner such that there is a clear business case, aligning food waste supply withdemand for the valorised products, as presented for the US by use of co-digestion.
Food Waste Management (Sector) in a Circular Economy 131
The role food waste can play to help mitigate agricultural soil quality losses is maybenot yet widely enough discussed but it is a key to ensure future food supply and inputinto the bio-economy. Lastly, using food waste as input into food substitute pro-duction is a promising technology for the future allowing to reduce pressures on theenvironment caused by food production. Overall, the presentations and discussionsshowed the multi-facetted nature of food waste management highlighting that arange of measures by many stakeholders are required to move towards a circulareconomy society. All of these will require changes in society, in the way we produceand consume food and how we best utilise generated side flows.
Acknowledgements This session was proposed based on work carried out in REFRESH project:‘Resource Efficient Food and Drink for Entire Supply Chain’. REFRESH is funded by the Horizon2020 Framework Programme of the European Union under Grant Agreement no. 641933 (http://www.eu-refresh.org).Moreover, we want to express our honour and gratitude to His Royal Highness Prince Louis of
Luxembourg who attended and contributed to this session.
References
1. European Commission, Closing loop—An EU action plan Circular Economy, Communicationfrom the Commission to the European parliament, the Council, the European economic andsocial committee and the committee of the regions, C.O.M. 0614, 2015.
2. Scherhaufer S, Moates G, Hartikainen H, Waldron K, Obersteiner G, Environmental impacts offood waste in Europe. Journal of Waste Management. Submitted.
3. U.S. Environmental Protection Agency (USEPA), Market Opportunities for STAR BiogasRecovery Systems at U.S. Livestock Facilities, 2011.
4. Smetana S, Palanisamy M, Mathys A, Heinz V, Sustainability of insect use for feed and food:life cycle assessment perspective, Journal of Cleaner Production, 2016, 137, 741–751.
5. Smetana S, Sandmann M, Rohn S, Pleissner D, Heinz V, Autotrophic and heterotrophicmicroalgae and cyanobacteria cultivation for food and feed: Life Cycle Assessment.Bioresource Technology, 2017, in press.
Open Access This chapter is licensed under the terms of the Creative Commons Attribution 4.0International License (http://creativecommons.org/licenses/by/4.0/), which permits use, sharing,adaptation, distribution and reproduction in any medium or format, as long as you give appropriatecredit to the original author(s) and the source, provide a link to the Creative Commons license andindicate if changes were made.The images or other third party material in this chapter are included in the chapter’s Creative
Commons license, unless indicated otherwise in a credit line to the material. If material is notincluded in the chapter’s Creative Commons license and your intended use is not permitted bystatutory regulation or exceeds the permitted use, you will need to obtain permission directly fromthe copyright holder.
132 N. Unger and F. Razza
The Role of Compost in Bio-wasteManagement and Circular Economy
Francesco Razza, Lorenzo D’Avino, Giovanni L’Abateand Luca Lazzeri
Abstract The increase of separate collections of bio-waste, largely represented byfood waste, and their biological treatment is an essential feature of the wastemanagement strategy. The aim of this paper was to highlight the role of compost inthe circular economy, and its use in the agricultural sector. An annual time-stepmodel for estimating soil organic matter (SOM) stock dynamics in a 22-year timeframe was developed and tested on cardoon cropping system. The model took intoaccount few soil parameters, mean annual temperature, and the cultural systemsmanagement, in particular organic fertilizers and crop residues. This work indicatesthat compost use in agriculture would be beneficial both for SOM increase andGHG reduction. The results showed how high-quality compost could represents theactual driving force of this change able to connect food, waste, economy andenvironment.
1 Introduction
In the EU between 118 and 138 million tonnes of bio-waste are produced every year,ofwhich about 88million tonnes come frommunicipalwaste [1]which corresponds atabout 170 kg of bio-waste per capita per year and about 150 kg per capita per year ofrealistic potentials [2]. Of the overall bio-waste amount, only 25% (i.e. 30 milliontonnes per year) is recycled into digestate or high-quality compost [3]. The latter must
F. Razza (&)Novamont S.p.A, 05100 Terni, Italye-mail: [email protected]
L. D’Avino � G. L’AbateConsiglio per la ricerca in agricoltura e l’analisi dell’economia agraria,Centro di ricerca Agricoltura e Ambiente (CREA-AA), 50125 Florence, Italy
L. LazzeriConsiglio per la ricerca in agricoltura e l’analisi dell’economia agraria,Centro di ricerca Cerealicoltura e Colture Industriali (CREA-CI), 40128 Bologna, Italy
© The Author(s) 2018E. Benetto et al. (eds.), Designing Sustainable Technologies,Products and Policies, https://doi.org/10.1007/978-3-319-66981-6_16
133
meet several requirements like: allowable heavy metals contents, absence of patho-genic bacteriology and phytopathogens, absence of plastic materials >10 mm etc.
Composting predominates over anaerobic digestion for the bio-waste separatelycollected, resulting over 90% of food and garden waste being processed intocompost. For the most part, food waste is still landfilled within Europe, leading tothe release of uncontrolled greenhouse gases [4].
The Circular Economy Package, published by the EU Commission in December2015, paved the way for a resource-efficient society and sustainable recyclingindustry across Europe and it contains also proposals addressing the EU wastelegislation with the aim of avoiding, reusing and recycling more waste in thefuture [4]. Of particular relevance, for bio-waste treatment in Europe, is the pro-posed changes to the EU Landfill Directive [5] whose aim is to reduce the landfillof municipal waste to 10% by 2030. In this ambit food waste fraction plays animportant role in recycling and in raising circular economy since up to 50% ofmunicipal solid waste is biogenic. Therefore, the 10% landfill target can be onlyachieved through sustainable bio-waste management, including composting andanaerobic digestion. In this paper, it is addressed the valuable effects of compost usein agriculture on Soil organic matter (SOM) management and GHG emissionsbalance of an industrial oil crop pointing out its role in the circular economy.
The SOM is primarily composed of carbon (C), and in soil plays a role inproviding four important ecosystem services: (i) resistance to soil erosion, (ii) soilwater retention, (iii) soil fertility for plants and (iv) soil biodiversity. SOM istherefore the main indicator of soil quality. Even small changes of the soil C poolcould have strong effects both on agricultural yield and on global greenhouse gascycle. Maintaining organic C-rich soils, restoring and improving degraded agri-cultural lands and, in general terms, increasing the soil C, could play a fundamentalrole in addressing food security and in mitigating the anthropogenic GHG emis-sions [6]. Organic matter (OM) in compost is rich in humifiable and humifiedmaterials and so it provides and improve SOM pool and consequently soil fertility.A specific SOM model has been developed and applied within BIT3G Italianproject funded by MIUR (Ministry of Education, Universities and Research) as partof the National Technology Cluster of Green Chemistry SPRING with the aim ofdefining a predictive tool suitable for estimating the site- specific SOM dynamics infunction both of pedoclimatic conditions and agricultural practices. Here arereported the experimental results defined on cardoon industrial crop (Cynara car-dunculus var Altilis DC) cultivated in the North-West of Sardinia following twoagricultural protocols: with and without compost application. In addition, this studyshows how compost can help to reach the objective of the ‘4 per 1000’ initiativelaunched at the COP21 that aspires to increase global soil organic matter stocks(SOMS) by 0.4% per year as a compensation for the global emissions of green-house gas (GHG) by anthropogenic sources [7].
The final aim is to point out the valuable role of compost which represents thebridge between bio-waste strategy targets and sustainable agriculture principles asqualitatively described through a virtuous circular economy model reported in thediscussion.
134 F. Razza et al.
2 Materials and Methods
An annual time-step model for estimating SOM dynamics was developed andtested [8, 9] in a 22-year time frame. Indeed, C stock changes are generally cal-culated in a duration longer than 20 years. The model takes into account the mainsoil characteristics, annual mean temperature, and management of cropping systemsand in particular organic fertilizers and crop residues. The analysed agriculturalsystem consists in a not irrigated 8-years rotation repeated until 22 years: 6-yearcardoon, one-year durum wheat (Triticum durum Desf.) one year field bean (Viciafaba cv Minor) and so on.
The model implements the Hénin-Dupuis equation [10–12] which apply twodifferent kinetic constants (k1 and k2) on annual step in the above complex croppingsystem.
DSOM ¼ k1 �M� k2 � SOM ð1Þ
where M (dry matter, Mg/ha) stands for raw OM, exogenous OM and/or cropresidues, k1 (% w/w) as the humification constant (i.e. the organic matter that arriveto become humus) and k2 (% w/w) as the mineralisation constant (i.e. how muchhumus is mineralised in CO2). Soil type did not affect significantly the minerali-sation behaviour of M according to Noirot-Cosson et al. [13], rather constant k1 isspecific for each M, and it is correlated to specific biological stability index (BSI, %w/w), calculated after a laboratory measurement of biochemical fractions [14], andOM, calculated as M without ashes content, by Eq. (2)
k1 ¼ BSI � OM/M ð2Þ
One gross estimate of the mineralisation constant k2 depends on agriculturalpractices (P, i.e. tillage frequency and depth, irrigation, crop residues and organicfertilizer frequency), clay content (A, g/kg), total carbonates (g/kg CaCO3), sitemean annual air temperature (T, °C):
k2 ¼ 1200 � 0:2 � ðT � 5Þ200þAð Þ � ð200 � 0:3 � CaCO3Þ ð3Þ
In addition, specific residual biomasses, agricultural practices (i.e. tillage fre-quency and depth, irrigation, crop residues and organic fertilizer frequency), wereconsidered [8]. The SOM stock (SOMS, Mg/ha) in 30 cm topsoil (h, m) wereestimated taking into account soil organic carbon (SOC, % w/w), bulk density (BD,Mg/m3), coarse materials (CM, % v/v):
SOMS ¼ SOC0:58
� BD � ð1� CMÞ � h ð4Þ
The Role of Compost in Bio-waste Management … 135

Six soils cultivated with cardoon were sampled within 10 km of Porto Torresarea, (Sassari, Sardinia Region, Italy) and assessed for required parameters to makepossible the model running (Table 1).
The mineralisation coefficient (k2) for a “derived soil” from parameter averages,was calculated according to Castoldi and Bechini [11], considering the lack ofirrigation (I = 1). The amount of resistant SOM fraction was estimated according toBoiffin et al. [15] or applying BSI [10,14] on cardoon above-ground residues:wheat 0.08, bean 0.1, and roots 0.15; above-ground cardoon was 0.18 experi-mentally estimated from compositional analysis. Even contribution of cardoonbasal leaves and renewal of roots was calculated and computed in the model. Thisissue will be the subject of a specific forthcoming publication.
Cardoon residues were harvested leaving on the ground 10% of above-groundbiomass (w/w as dry matter).
Two scenarios were considered: “compost” and “no compost”. Compost sce-nario planned for 20 Mg/ha compost application before cardoon sowing and15 Mg/ha on the crop during the 4th year of cultivation. Compost incorporationapplied dry matter (dm) 50% (w/w), Nitrogen (N) content 1.8% (w/w dm), organiccarbon 48% (w/w dm), BSI 0.53, k1 0.25 [16]. In “no compost” scenario thecontribution of OM is represented only from the cardoon above-ground biomass(i.e. 10%) that remains in soil after harvesting.
Cardoon C footprint was estimated using BioGrace tool [17] and IPCC [18]methodology applying 20-year time-horizon to assess global warming potential forCO2 CH4 and N2O [19]. In particular following IPCC [18], GHG emissions fixed inthe industrial production process of urea was taken into account along with directand indirect N2O emissions due to N-synthetic and organic fertilisers, crop residues
Table 1 Parameters implemented in the model for different soil samples (from 1 to 6) and if theircontribution in increasing (+) or containing (−) the SOM stock mineralisation rate, according to themodel
Sample/parameter SOMScorrelation
1 2 3 4 5 6 Mean ± st.dev.
Mean annualtemperature (°C)
+ 16.7 16.7 16.6 16.7 16.8 16.7 16.7 ± 0.1
Soil organic matter (%w/w)
+ 2.10 2.45 2.03 2.59 2.76 2.38 2.39 ± 0.31
Bulk density (g/cm3) + 1.32 1.28 1.31 1.26 1.26 1.26 1.28 ± 0.03
Coarse materials (% v/v) − 0.00 0.13 0.17 0.17 0.12 0.02 0.10 ± 0.07
Clay (g/kg) − 367 517 458 567 400 121 405 ± 82
Carbonates (g/kg) − 163 37 3 79 9 616 151 ± 66
136 F. Razza et al.
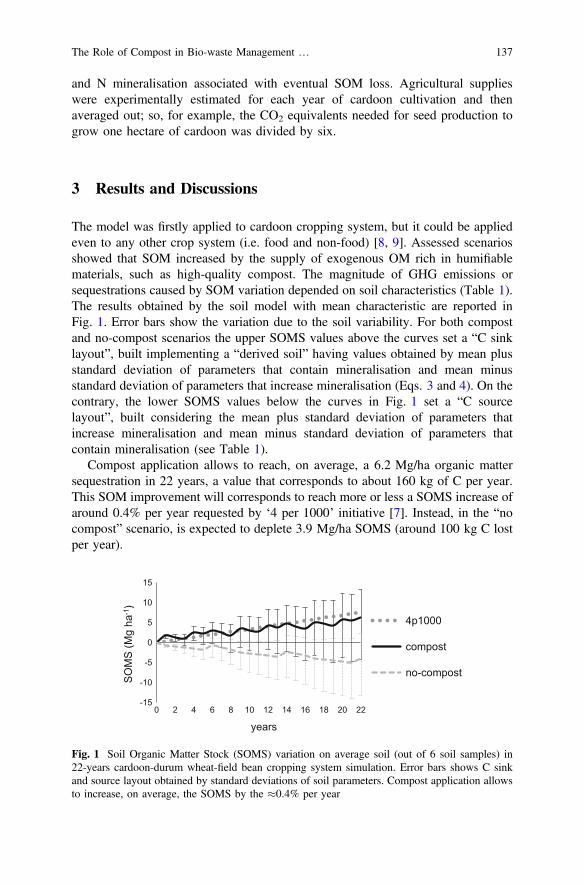
and N mineralisation associated with eventual SOM loss. Agricultural supplieswere experimentally estimated for each year of cardoon cultivation and thenaveraged out; so, for example, the CO2 equivalents needed for seed production togrow one hectare of cardoon was divided by six.
3 Results and Discussions
The model was firstly applied to cardoon cropping system, but it could be appliedeven to any other crop system (i.e. food and non-food) [8, 9]. Assessed scenariosshowed that SOM increased by the supply of exogenous OM rich in humifiablematerials, such as high-quality compost. The magnitude of GHG emissions orsequestrations caused by SOM variation depended on soil characteristics (Table 1).The results obtained by the soil model with mean characteristic are reported inFig. 1. Error bars show the variation due to the soil variability. For both compostand no-compost scenarios the upper SOMS values above the curves set a “C sinklayout”, built implementing a “derived soil” having values obtained by mean plusstandard deviation of parameters that contain mineralisation and mean minusstandard deviation of parameters that increase mineralisation (Eqs. 3 and 4). On thecontrary, the lower SOMS values below the curves in Fig. 1 set a “C sourcelayout”, built considering the mean plus standard deviation of parameters thatincrease mineralisation and mean minus standard deviation of parameters thatcontain mineralisation (see Table 1).
Compost application allows to reach, on average, a 6.2 Mg/ha organic mattersequestration in 22 years, a value that corresponds to about 160 kg of C per year.This SOM improvement will corresponds to reach more or less a SOMS increase ofaround 0.4% per year requested by ‘4 per 1000’ initiative [7]. Instead, in the “nocompost” scenario, is expected to deplete 3.9 Mg/ha SOMS (around 100 kg C lostper year).
-15
-10
-5
0
5
10
15
0 2 4 6 8 10 12 14 16 18 20 22
SOM
S (M
g ha
-1)
years
4p1000
compost
no-compost
Fig. 1 Soil Organic Matter Stock (SOMS) variation on average soil (out of 6 soil samples) in22-years cardoon-durum wheat-field bean cropping system simulation. Error bars shows C sinkand source layout obtained by standard deviations of soil parameters. Compost application allowsto increase, on average, the SOMS by the �0.4% per year
The Role of Compost in Bio-waste Management … 137
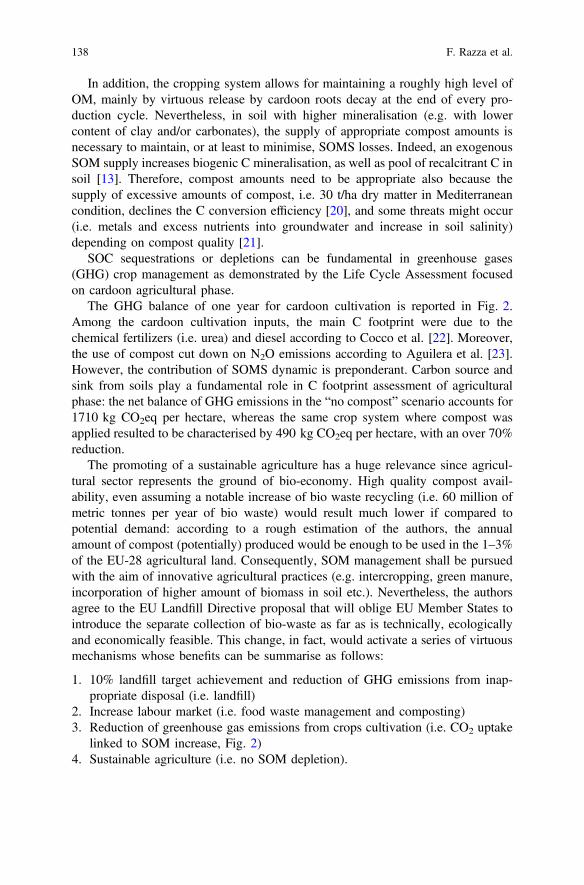
In addition, the cropping system allows for maintaining a roughly high level ofOM, mainly by virtuous release by cardoon roots decay at the end of every pro-duction cycle. Nevertheless, in soil with higher mineralisation (e.g. with lowercontent of clay and/or carbonates), the supply of appropriate compost amounts isnecessary to maintain, or at least to minimise, SOMS losses. Indeed, an exogenousSOM supply increases biogenic C mineralisation, as well as pool of recalcitrant C insoil [13]. Therefore, compost amounts need to be appropriate also because thesupply of excessive amounts of compost, i.e. 30 t/ha dry matter in Mediterraneancondition, declines the C conversion efficiency [20], and some threats might occur(i.e. metals and excess nutrients into groundwater and increase in soil salinity)depending on compost quality [21].
SOC sequestrations or depletions can be fundamental in greenhouse gases(GHG) crop management as demonstrated by the Life Cycle Assessment focusedon cardoon agricultural phase.
The GHG balance of one year for cardoon cultivation is reported in Fig. 2.Among the cardoon cultivation inputs, the main C footprint were due to thechemical fertilizers (i.e. urea) and diesel according to Cocco et al. [22]. Moreover,the use of compost cut down on N2O emissions according to Aguilera et al. [23].However, the contribution of SOMS dynamic is preponderant. Carbon source andsink from soils play a fundamental role in C footprint assessment of agriculturalphase: the net balance of GHG emissions in the “no compost” scenario accounts for1710 kg CO2eq per hectare, whereas the same crop system where compost wasapplied resulted to be characterised by 490 kg CO2eq per hectare, with an over 70%reduction.
The promoting of a sustainable agriculture has a huge relevance since agricul-tural sector represents the ground of bio-economy. High quality compost avail-ability, even assuming a notable increase of bio waste recycling (i.e. 60 million ofmetric tonnes per year of bio waste) would result much lower if compared topotential demand: according to a rough estimation of the authors, the annualamount of compost (potentially) produced would be enough to be used in the 1–3%of the EU-28 agricultural land. Consequently, SOM management shall be pursuedwith the aim of innovative agricultural practices (e.g. intercropping, green manure,incorporation of higher amount of biomass in soil etc.). Nevertheless, the authorsagree to the EU Landfill Directive proposal that will oblige EU Member States tointroduce the separate collection of bio-waste as far as is technically, ecologicallyand economically feasible. This change, in fact, would activate a series of virtuousmechanisms whose benefits can be summarise as follows:
1. 10% landfill target achievement and reduction of GHG emissions from inap-propriate disposal (i.e. landfill)
2. Increase labour market (i.e. food waste management and composting)3. Reduction of greenhouse gas emissions from crops cultivation (i.e. CO2 uptake
linked to SOM increase, Fig. 2)4. Sustainable agriculture (i.e. no SOM depletion).
138 F. Razza et al.

Figure 3 describes an ideal model of circular economy where food-waste areable to bring the benefits described in 1–4.
In order to put into practice this model and make real the social, economic andenvironmental benefit of bio-economy, specific incentives could be introduced forthose farmers that apply compost in their agricultural fields. This would increase thedemand of high quality compost which could/should be the driving force of thewhole system. It is worth to point out that sustainable SOM management is arequisite of emerging standards on the sustainable biomass production like theEuropean EN16751 [24].
Another important aspect for the success of this circular economy model is theexecution of an appropriate separate collection of bio-waste by the consumers as akey prerequisite to (i) ensure high quality compost and (ii) reduce the bio-wastemanagement costs of Citizen should be more and more informed about theimportance of their behaviour on the success of bio waste management chain. This
Fig. 2 Yearly average GHG balance for one hectare of cardoon cultivation, with or withoutcompost, * stands for negligible contribution
The Role of Compost in Bio-waste Management … 139
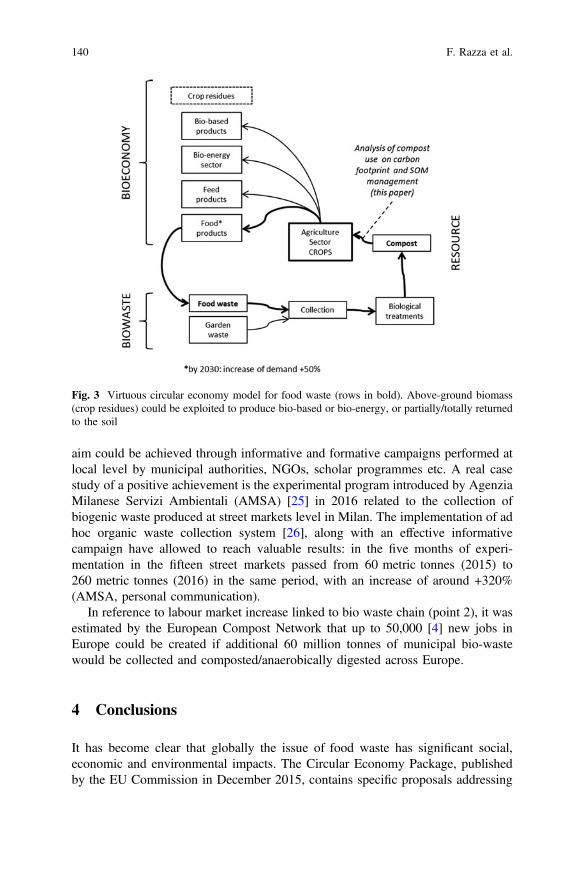
aim could be achieved through informative and formative campaigns performed atlocal level by municipal authorities, NGOs, scholar programmes etc. A real casestudy of a positive achievement is the experimental program introduced by AgenziaMilanese Servizi Ambientali (AMSA) [25] in 2016 related to the collection ofbiogenic waste produced at street markets level in Milan. The implementation of adhoc organic waste collection system [26], along with an effective informativecampaign have allowed to reach valuable results: in the five months of experi-mentation in the fifteen street markets passed from 60 metric tonnes (2015) to260 metric tonnes (2016) in the same period, with an increase of around +320%(AMSA, personal communication).
In reference to labour market increase linked to bio waste chain (point 2), it wasestimated by the European Compost Network that up to 50,000 [4] new jobs inEurope could be created if additional 60 million tonnes of municipal bio-wastewould be collected and composted/anaerobically digested across Europe.
4 Conclusions
It has become clear that globally the issue of food waste has significant social,economic and environmental impacts. The Circular Economy Package, publishedby the EU Commission in December 2015, contains specific proposals addressing
Fig. 3 Virtuous circular economy model for food waste (rows in bold). Above-ground biomass(crop residues) could be exploited to produce bio-based or bio-energy, or partially/totally returnedto the soil
140 F. Razza et al.
the EU waste legislation with the aim of avoiding, reusing and recycling morewaste in the future in order to save resources within Europe. One of the targetscontained in the proposals is the maximum percentage of municipal solid waste tobe disposed in landfill set equal to 10% by 2030. Food waste management istherefore a key topic of the expected strategic action plan since up to 50% ofmunicipal solid waste is biogenic. Biological treatments are well established inEurope with about 3500 treatment plants across Europe, nevertheless, still 25% ofbio waste is recycled into high quality compost [3]. These figures suggest e con-siderable potential for expansion, especially in the southern Europe areas where thetreatment capacity is still limited [4]. In this way, sustainable bio-waste manage-ment could also be used to strengthen the economy of rural areas and, at the sametime, could benefit of compost application in agricultural fields. The SOM modeldeveloped within BIT3G Italian projects, suggested that compost use in agriculturalsector is meaningful from a SOM management and carbon footprint perspectives aswell. The SOMS after 22 years of cardoon cropping system with compost appli-cation resulted incremented of 6.2 metric tonnes per ha (first 30 cm of soil) whereasthe scenario with zero inputs resulted decremented of 3.9 metric tonnes per hectare.In terms of GHG balance it was observed that average CO2 uptake has the sameorder of magnitude of the overall emissions coming from cardoon cultivation. Inspecific circumstances the CO2 uptake overcomes GHG emissions making cardooncrop cultivation GHG balance neutral or even negative.
The link between food waste management, compost production/use and food/biomass sustainable production is therefore a key element of both for circulareconomy and bio-economy to be further investigated by decision makers for itsvaluable implications in the medium and long term on social, economic andenvironmental pillars.
References
1. EU, Communication from the Commission to the Council and the European Parliamenton future steps in bio-waste management in the European Union, COM/2010/0235 final,2010. http://eur-lex.europa.eu/legal-content/EN/TXT/?uri=CELEX:52010DC0235 (Accessed30.05.2017).
2. Barth J, Amlinger F, Favoino E, Siebert S, Kehres B, Gottschall R, Bieker M, Löbig A,Bidlingmaier W, Final Report—Compost production and use in the EU, EuropeanCommission, DG Joint Research Centre/ITPS, 2008.
3. https://www.compost.it/materiali/Regolamento_Marchio_Qualita_CIC.pdf (Accessed 29.09.2017).
4. Siebert S, Bio-Waste Recycling in Europe Against the Backdrop of the Circular EconomyPackage, 161024 ECN Biowaste Recycling in Europe, 2016. http://www.compostnetwork.info/download/bio-waste-recycling-europe-backdrop-circular-economy-package/ (Accessed18.05.2017).
5. http://eur-lex.europa.eu/legal-content/EN/TXT/?uri=CELEX:52015DC0614 (Accessed 25.08.2017)[6] COM (2015) 594 final Proposal for a Directive of the European Parliament and ofthe Council Amending Directive 1999/31/ EC on the landfill of waste. http://eur-lex.europa.eu/legal-content/EN/TXT/?uri=COM:2015:594:FIN (Accessed 29.09.2017).
The Role of Compost in Bio-waste Management … 141
6. FAO, Unlocking the potential of soil organic carbon. Outcome document. Globalsymposyium on soil organic matter, Rome, Italy, 2017.
7. Minasny B, Malone B.P, McBratney A.B, Angers D.A, et al., Soil carbon 4 per mille.Geoderma, 292, 2017, pp. 59–86.
8. D’Avino L, Lazzeri L, Razza F, L’Abate G, Costantini E, Using SOM modelling outcomes tosupport the carbon footprint analysis of industrial crops: a case-study of perennial vs. annualoleaginous crops in Sardinia Region, in: abstract book of 5th International Symposium on soilorganic matter session 3.1. C dynamics and sequestration under Global Change, 2015.
9. D’Avino L, L’Abate G, Chiarini F, Correale F, Morari F, Estimation of the soil carbonsequestration in a four year rotation managed with conventional and conservative methods.Proceedings of the Global symposium on soil organic carbon, Rome, Italy, 2017, pp. 304–307. http://www.fao.org/3/a-i7565e.pdf (Accessed 29.09.2017).
10. Fernandez-Tirado F, Parra-Lopez C, Calatrava-Requena J, A methodological proposal forLife Cycle Inventory of fertilization in energy crops: The case of Argentinean soybean andSpanish rapeseed, Biomass and Bioenergy 58, 2013, pp. 104–116. https://doi.org/10.1016/j.biombioe.2013.07.022.
11. Castoldi N, Bechini L, Agro-ecological indicators of field-farming systems, Rivista Italiana diAgrometeorologia, Vol. 1, 2006. pp. 19–31.
12. Mary B, Guérif J, Intérets et limites des modèles de prévision de l’évolution des matièresorganiques et de l’azote dans le soil. Cah. Agric. 3, 1994, pp. 247–257.
13. Noirot-Cosson P.E, Dhaouadi K, Etievant V, Vaudour E, Houot S, Parameterisation of theNCSOIL model to simulate C and N short-term mineralisation of exogenous organic matter indifferent soils, Soil Biology and Biochemistry, 104, 2017, pp. 128–140. https://doi.org/10.1016/j.soilbio.2016.10.015.
14. Tremblay M.E, Nduwamungu C, Parent L.E, Bolinder M.A, Biological Stability of Carbonand Nitrogen in Organic Products and Crop Residues using Fourier-Transform Near-InfraredReflectance Spectroscopy, Communications in Soil Science and Plant Analysis, Vol. 41,Issue 8, 2010.
15. Boiffin J, Zagbahi J.K, Sebillotte M, Systèmes de culture et statut organique des sols dans leNoyonnais: application du modèle de Hénin-Dupuis. (in French.) Agronomie 6, 1986,pp. 437–446.
16. Houot S, Bodineau G, Rampon J.N, Annabi M, Francou C, Poitrenaud M, Agricultural use ofdifferent residual waste composts—current situation and experiences in France, Conference“The future of residual waste management in Europe”, 2005.
17. Hennecke A.M, Faist M, Reinhardt J, Junquera V, Neeft J, Fehrenbach H, Biofuel greenhousegas calculations under the European Renewable Energy Directive—A comparison of theBioGrace tool vs. the tool of the Roundtable on Sustainable Biofuels, Applied Energy, 102,2013, pp. 55–62.
18. IPCC, Agriculture, Forestry and Other Land Use, Guidelines for National Greenhouse GasInventories, Vol. 4, Japan, 2006.
19. Myhre G, Shindell D, Bréon F-M, Collins W, Fuglestvedt J, Huang J, Koch D, Lamarque J.-F, Lee D, Mendoza B, Nakajima T, Robock A, Stephens G, Takemura T, Zhang H,Anthropogenic and Natural Radiative Forc-ing, Climate Change 2013: The Physical ScienceBasis. Contribution of Working Group I to the Fifth Assessment Report of theIntergovernmental Panel on Climate Change, Cambridge University Press, 2013.
20. Morra L, Pagano L, Iovieno P, Baldantoni D, Alfani A, Soil and vegetable crop response toaddition of different levels of municipal waste compost under Mediterranean greenhouseconditions, Agronomy for sustainable development, 30,3, pp. 701–709.
21. Hargreaves J.C, Adl M.S, Warman P.R, A review of the use of composted municipal solidwaste in agriculture. Agriculture, Ecosystems & Environment, 123(1), 1–14, 2008.
22. Cocco D, Deligios P.A, Ledda L, Sulas L, Virdis A, Carboni G, LCA study of OleaginousBioenergy Chains in a Mediterranean Environment. In: Energies, 7(10), 2014, pp. 6258–6281. https://doi.org/10.3390/en7106258.
142 F. Razza et al.
23. Aguilera E, Lassaletta L, Sanz-Cobena A, Garnier J, Vallejo A, The potential of organicfertilizers and water management to reduce N2O emissions in Mediterranean climate croppingsystems. A review, Agriculture, Ecosystems and Environment, 164, 2013, pp. 32–52. https://doi.org/10.1016/j.agee.2012.09.006.
24. CEN, EN16751 Bio-based products - Sustainability criteria, 2016.25. http://www.amsa.it/gruppo/cms/amsa/multilingua/en (Accessed 30.05.2017).26. http://www.ecodallecitta.it/notizie/384800/raccolta-differenziata-umido-nei-mercati-di-milano-
dal-20-febbraio-si-fa-in-15-mercati-su-94/ (Accessed 30.05.2017).
Open Access This chapter is licensed under the terms of the Creative Commons Attribution 4.0International License (http://creativecommons.org/licenses/by/4.0/), which permits use, sharing,adaptation, distribution and reproduction in any medium or format, as long as you give appropriatecredit to the original author(s) and the source, provide a link to the Creative Commons license andindicate if changes were made.The images or other third party material in this chapter are included in the chapter’s Creative
Commons license, unless indicated otherwise in a credit line to the material. If material is notincluded in the chapter’s Creative Commons license and your intended use is not permitted bystatutory regulation or exceeds the permitted use, you will need to obtain permission directly fromthe copyright holder.
The Role of Compost in Bio-waste Management … 143
Agri-Food Waste Streams Utilizationfor Development of More SustainableFood Substitutes
Sergiy Smetana, Kemal Aganovic, Stefan Irmscher and Volker Heinz
Abstract Substitution of food out of alternative biomass sources is aimed to supplyconsumers with food products similar in nutrition and with lower environmentalimpact compared to conventional products. At current state of development, meatsubstitutes are not competitive with chicken meat, except for plant based meatanalogs (although they have weaker nutritional profile). Upscaling, further tech-nological development and use of agri-food waste as main source substrate canassure the environmental benefits of insects (2 kW h of energy, 1 kg CO2 eq.,1.5 m2 of land and 0.1 m3 of water) and single cell products (10 kW h, 2–4 kg CO2
eq., 0.5 m2 of land and 0.25 m3 of water), making them more competitive com-pared to industrial chicken production. The results of the current research arepreliminary and further studies are required to assure the industrial applicability ofagri-food wastes use for food production.
1 Introduction
Food production is one of the most important human industries, which can beresponsible for a majority of environmental impacts in developed countries [1]. Themain causes for such impacts relate to overpopulation, growing demand for con-sumption of animal derived products and high rates offoodwaste.While some researchtargets development of solutions for separate issues, more recent sources indicate theneed for a more holistic and systematic change of the complete food production chain[2, 3]. The substitution of traditional foods with alternative analogs produced bynon-traditional methods is foreseen as one example of sustainable transitions [4].However, considering a complete life cycle offood substitutes, their performance is notalways cost efficient and environmentally beneficial [5–7]. Therefore, a more sustain-able status offood transitions should be confirmedwith extensive research of economicefficiency, environmental advances and social acceptability.
S. Smetana (&) � K. Aganovic � S. Irmscher � V. HeinzGerman Institute of Food Technologies, (DIL e.v.), Quakenbrück 49610, Germanye-mail: [email protected]
© The Author(s) 2018E. Benetto et al. (eds.), Designing Sustainable Technologies,Products and Policies, https://doi.org/10.1007/978-3-319-66981-6_17
145
Substitution of environmentally high-impacting meat with more sustainablealternatives is becoming not only necessary, but also popular through vegetarian,vegan and flexitarian diets. Numerous food products are under recent developmentto cover the requirement of consumers in more environmentally sustainable and yetnutritionally beneficial food analogs. Several scientific studies indicated that meatsubstitutes had a lower environmental impact than meat [8–17]. Even though theenvironmental benefits of texturized plant protein substitutes (soybean, pea, lupine,etc.) are well-known and proven [18, 19], their nutritional and organoleptic qualitiesrequire improvement [20, 21]. Other analogs based on milk, mycoproteins, insects,microalgae, etc., are not environmentally beneficial in all of the cases [5, 6, 22, 23],but have improved nutritional profile, more similar to animal derived products[23–26]. Developments in cellular agriculture claim that creation of meat, milk,cheese and eggs without agricultural inputs is more environmentally friendly due tothe avoidance of agricultural stage [7, 27]. Despite the complete nutritional identitybetween cellular products and animal derived foods, the environmental impacts ofcultured food are usually higher due to low Technology Readiness Levels (TRL) andincreased use of energy as well as biotechnological raw materials [5, 7, 28].Although, few comparative studies of environmental performance and nutritionalvalue of meat substitutes to animal derived products were published [5, 10, 15], theanalyses did not cover complete variety of food analogs and production technolo-gies. Even though further environmental optimization measures for food substitutesare known, they are rarely analyzed and reported in literature. Upscaling of pro-duction, reduction of energy consumption, reduction of waste amounts and uti-lization of waste streams as raw materials are among the most known measures,which should be analyzed to identify future potential of food substitutes. Therefore,it is necessary to perform a holistic systematization of more sustainable productionpotential for “food of the future” based on innovative and emerging technologies ofalternative protein products supply. Such systematization should provide an answeron more sustainable ways to produce food substitutes with existing industrialinfrastructure and the potential of improvement with the use of agri-food waste.
2 Methods and Materials
The study included two main stages. First, it relied on a systematic review of researchliterature addressing the production of food substitutes and their associated envi-ronmental impacts. It was complied with own results on the LCA of food substitutes.Further, the authors assessed the technological potential of agri-food waste applica-tion for the design of food substitutes. This way, the first part of the study indicatedthe most promising options of food substitute’s production from environmentalperspective, while the second part estimated further potential for environmentalimpact improvement. The second part resulted in generalized comparison model(matrix) used for the assessment of environmental impact of food production sce-narios with application of waste streams as a main source of raw materials.
146 S. Smetana et al.
The study relied on the results of Life Cycle Assessment (LCA) according toISO standards (ISO 14040-14044) [29, 30] present in literature (Part 1 of the study)and own assessments (Part 1 and 2).
The first part of the research included literature search on Google Scholar onlineplatform with key words “environmental impact”, “LCA” and “Life CycleAssessment”, “substitutes”, “food products” for the period of 10 years (2007–2017)and returned with 580 publications identified. Further search was refined withadditional key words: “meat substitutes” (64 results), “meat analogs” (7 results),“cultured meat” (21 results), “milk substitutes” (12 results), “dairy substitutes”(10 results), “alternative protein sources” (21 result). The resulted literature(135 references) was analyzed in detail to identify the environmental impacts offood substitutes. It was identified that 41 study presented results on various aspectsof food substitutes LCA. We relied on the data from the literature with adaptation tothe requirements of current study (attributional LCA with four impact categories ofglobal warming potential, non-renewable energy use, land use and water footprintbased on IMPACT 2002+ and ReCiPe methodologies) [31, 32]. It was aimed toanswer the research question on identification of more sustainable food substitutespresented in literature. Environmental impact of food substitutes was compared inbetween and with conventional products.
The second part of the research addressed the potential of environmental impactimprovement with the use of agri-food waste streams. The estimation of thepotential required the assessment of current uses of agri-food wastes for foodbiomass production and further technological potential assessment for food design.The second part in a great degree relied on own data of industrial processing trials(DIL, Quakenbrueck) and background data available in literature and relevantdatabases (Agri-footprint and ecoinvent 3) [33, 34] with modelling in SimaPro 8software. The results on Technology Readiness Level (TRL) and potential ofagri-food waste use (includes all the types of food waste generated along the supplychain) was included into matrix (Table 1), which allowed overview of conventionalfoods substitution with potentially more sustainable alternatives. Furthermore, theanalysis of agri-food waste potential included the comparison of nutritional profileof resulting products with benchmark food.
3 Results and Discussion
3.1 Environmental Impact of Food Substitutes
The analysis of environmental performance of meat substitutes included productionand processing of protein sources based on plant proteins (soya, lupine, peas,gluten, etc.), dairy products, insect biomass, cultured meat, microalgae biomass,fungi, yeast and bacteria (Fig. 1). The analysis demonstrated that at despite certaincomparability of the impacts for different sources of protein biomass, in many
Agri-Food Waste Streams Utilization for Development … 147

cases, there were a few limitations for a reliable distinction between the comparableproducts. On the one hand, there were wide ranges of environmental impacts (e.g.due to land use for plant based substitutes, energy use for cultured meat andmicroalgae, water use for yeast and bacteria), and on the other hand there was a lack
Table 1 Matrix of agri-food waste application potential for the production of food substitutessource biomass in relevance to technology readiness levels
Source of biomass for substitutes Substituted animal derived products
Meat Dairy Eggs Fat
Plant IX/9 IX/6 VIII/6 IX/9
Milk IX/0 n/a VI/0 IX/0
Insect VI–IX/7 I–VII/8 VI–VII/8 IX/9
Cultured VI/4 VI/4 VI/4 VII/6
Single cell protein
Microalgae VII/5 VIII/5 VIII/5 IX/7
Fungi IX/6 IX/5 VIII/5 IX/9
Y&B VII/6 VI/6 VIII/6 VI/6
Note I–IX—Technology readiness level (TRL) after [48] for the application of source biomass tosubstitute animal derived products; 0–9—potential of agri-food waste application for the sourcebiomass production (with 0—no potential identified to 9 confirmed industrial applicationpossible); Y&B—yeast and bacteria
Fig. 1 Environmental impact of meat substitutes based on various alternative sources of proteins
148 S. Smetana et al.
of available studies, data sources and relevant models in order to narrow down theranges of environmental impacts (e.g. water use for dairy based, microalgae andcultured meat substitutes).
Despite mentioned limitations, it was possible to indicate that according to thecurrent state of TRL the most promising sources of proteins in terms of energyconsumption were plant and insect protein biomass (grown on commercial chickenfeed). Meat substitutes based on biomass derived from dairy, yeast and bacteria hadhigher level of energy consumption, but also high potential for further development.Alternative sources of proteins had low impact on climate change (comparable withchicken 2–4 kgCO2 eq. and pork 4–6 kgCO2 eq. per kg ofmeat) for all of the sources,except for meat substitutes from microalgae (related to variety of productionconditions). Land use impacts were comparable between alternative sources of pro-teins (2–4 m2 a per kg of product, vs. 5–7 m2 for chicken and 7–8 m2 for pork).Fungi, yeast and bacteria based sources of proteins were exception and had lower landuse impact (up to 2 m2 a year−1). Water footprint was quite similar betweendifferent protein sources with lower impacts associated with microalgae and fungibiomass. Benefits of water consumption of dairy and insect based meat substitutes,as well as of cultured meat could not be demonstrated due to the lower data quality.
In terms of nutritional quality, the most identical substitute to meat was producedby cellular agriculture methods (cultured meat). However, due to muscle purity,meat substitute produced by cellular agriculture usually consists of lower fat contentthen traditional meat. Plant based meat substitutes are well researched and docu-mented, with high presence on the market. At the same time, the diversity ofvegetable protein sources and their unbalanced nutritional composition set diffi-culties for the complete substitution of animal derived products.
Insect and dairy based food substitutes are characterized with excellent nutri-tional qualities similar, or often more beneficial than traditional meat products. Milkbased protein products usually have a moderate protein and fat content (10–14%and 8–10% respectively). However, dairy based protein concentrates and isolatescan serve as a high protein additive for human consumption. Insects can be con-sidered as a good source of proteins (up to 77% dry weight), fats (up to 62% dryweight) and polyunsaturated amino acids [42]. Moist cooked products, based onwhole mealworm and depending on the processing technology, resulted in productswith 22–30% proteins and 2–20% fat (own data). However, the limiting factor ofinsects’ application for food and feed could be low amounts of methionine [43].
Single cell production (fungi, algae, yeast and bacteria) can provide excellentsources of proteins (30–65% in dry weight) and fats (up to 20% in microalgae), butthey are also a source of nucleic acid (3–12%), which can be a serious obstacle forthe direct use in food, as it might cause health complications [44].
Agri-Food Waste Streams Utilization for Development … 149
3.2 Potential of Agri-Food Wastes Applicationfor Production of Food Substitutes Biomass
Application of agri-food waste can be foreseen as one of the key solutions toimprove the sustainability of current food production. The main options of dealingwith agri-food waste include prevention, creation of food banks (or storages),valorization for animal feed and other purposes (e.g. recovery of nutrients orextraction of highly valuable components, recycling of proteins for the new prod-ucts), reuse (application for other purposes like generation of energy and heat),compositing and landfilling [45–47]. Current study dealt with a combined approachaddressing prevention of food wasting and food waste valorization, when agri-foodwastes are assessed from the position of feeding substrate or media for insect andsingle cell production, as well as for meat culturing and direct application as asource of plant protein biomass (Table 1).
TRL plays an important role for the identification of opportunities for the agri-foodwaste application. Low TRL do not allow for the effective modelling of food sub-stitutes production based on agri-foodwaste. Nevertheless, it was identified that directapplication of agri-food waste for the plant based food substitutes is very challenging,but possible. Most known examples of such application include the use of soybeanmeal and okara as components of composite foods for direct human consumption.Side streams of plants processing usually fall in this category and can be utilized as asource for food. Main challenges were associated with assurance of food safety andadequate biomass quality (as in case of waste from consumers). On the other hand,application of processing side-streams (e.g. soybean meal, gluten), is well realized toproduce texturized vegetable protein foods (Fig. 1).
Cultured meat production could potentially rely on cultivation media generatedby bacteria fed on agri-food side and waste streams, however, such potential is onlyhighlighted as possible in literature [14, 27, 28, 49]. In this case, the environmentalimpact could be reduced and reach the lower levels of impact indicated in Fig. 1.Such results correspond well to the result of the study [14], where it was reportedthat cultivation of meat on the cultured media from cyanobacteria could be envi-ronmentally beneficial. It is a previous conclusion and confirmation to the appli-cability in industrial scale is required.
The application of agri-food waste streams for single cell and insect productionis an upcoming development, taking into consideration current improvements inTRL, performed and planned trials (projects CORNET “ENTOMOFOOD”, ERANET-LAC “EntoWaste”). The biggest challenge here is associated with properselection of suitable agri-food waste, which would assure the high efficiency ofproduction and therefore would have a beneficial nutritional composition. In manycases agri-food waste corresponding to the identified properties, is represented byside-stream of food processing, used for animal feeding. So, another challengerelates to the application of multiple agri-food wastes as animal feed. The need toreplace such feed material could result in higher environmental impacts than ben-efits from alternative proteins productions. At the same time, multiple sources of
150 S. Smetana et al.
agri-food wastes are not utilized as feed. In most of the cases the producer of areference product covers the costs of transportation to the farms and thus pays forthe utilization. Such precondition in combination with good nutritional qualitiesmakes such agri-food wastes (e.g. mill brans, distiller’s dried grains with solubles,brewery grains, milled pre-consumer waste) an excellent source for single cell andinsect production. Successful application of agri-food wastes could reduce theenvironmental impact of food substitutes production with existing technologies(Fig. 1). Thus, the impact of insect-based food (1 kg) could be decreased to 2 kW hof energy use, around 1 kg CO2 eq. of GWP, 1.5 m2 of land use and 0.1 m3 ofwater use. Single cell production can supply 1 kg of high quality protein foodwhich would require around 10 kW h, emit 2–4 kg CO2 eq., occupy 0.5 m2 of landand consume 0.25 m3 of water. Such environmental impact results make insectsand single cell products more sustainable alternatives to meat and other foods.
4 Conclusions
Traditional food substitution with alternative biomass sources is becoming anecessity to design a more sustainable transition to the new food system. Thecurrent analysis, which included comparison of alternative protein sourcesaccording to the technology readiness level, nutritional profile and environmentalimpact, indicated the potential for the substitution of traditional food. Alternativesources of biomass can be used as food substitutes if their environmental andeconomic benefits are assured. It could be done thought the application of agri-foodwastes and further development of production technologies.
The results of the current study indicated that state-of-the-art production of meatanalogs based on milk, mycoproteins, insects and microalgae biomass are notcompetitive in terms of environmental impact to the benchmark meat (chicken inthis case). The application of waste and side streams from agri-food production(molasses, distilled grains, grain brans) could potentially decrease the impact ofinsect and single cell products for their use as meat substitutes. Improvement intechnologies for biomass processing is vital for the optimization of analogs basedon single cell products. Similarly, processing stages play high importance forcellular-based products. However, high impact was associated with the productionof culture media for meat production and raw resources of yeast derived milk,cheese and eggs. Cellular meat production at current state of TRL has a higherenvironmental impact than traditional production meat. With scaling up approach, acompeting potential with beef and pork was shown, but not with chicken. Theapplication of agri-food waste streams is complicated due to the need of providing asterile culture media, although is possible for the cultured media production.Application of selected agri-food wastes to produce alternative sources of protein(specifically insects and single cell products) could result in more sustainable sourceof proteins able to compete with industrial chicken production.
Agri-Food Waste Streams Utilization for Development … 151
The results of this study are preliminary and are characterized with highassumption uncertainties. However, it is possible to conclude that the application ofcircular economy principles to the production of traditional foods via innovativeprocessing methods involving agri-food waste streams could allow for improve-ment of their environmental performances.
References
1. Tukker A, Goldbohm RA, de Koning A, Verheijden M, Kleijn R, Wolf O, et al,Environmental impacts of changes to healthier diets in Europe. Ecol. Econ. [Internet]. 70,2011; 1776–88. Available from: http://linkinghub.elsevier.com/retrieve/pii/S092180091100190X.
2. Nemecek T, Jungbluth N, Mila i Canals L, Schenck R, Environmental impacts of foodconsumption and nutrition: where are we and what is next? Int. J. Life Cycle Assess.[Internet]. 21, 2016; 607–20. Available from: http://link.springer.com/10.1007/s11367-016-1071-3.
3. Sala S, Anton A, McLaren S.J, Notarnicola B, Saouter E, Sonesson U, In quest of reducingthe environmental impacts of food production and consumption. J. Clean. Prod. [Internet].140, 2017;387–98. Available from: http://linkinghub.elsevier.com/retrieve/pii/S0959652616313956.
4. van der Goot A.J, Pelgrom P.J.M, Berghout J.A.M, Geerts M.E.J, Jankowiak L, Hardt N.A,et al, Concepts for further sustainable production of foods. J. Food Eng. [Internet]. 168, 2016;42–51. Available from: http://linkinghub.elsevier.com/retrieve/pii/S026087741500309X.
5. Smetana S, Mathys A, Knoch A, Heinz V, Meat alternatives: life cycle assessment of mostknown meat substitutes. Int. J. Life Cycle Assess. [Internet]. Springer Berlin Heidelberg; 20,2015; 1254–67. Available from: http://dx.doi.org/10.1007/s11367-015-0931-6.
6. Smetana S, Palanisamy M, Mathys A, Heinz V, Sustainability of insect use for feed and food:Life Cycle Assessment perspective. J. Clean. Prod. [Internet]. 137, 2016; 741–51. Availablefrom: http://linkinghub.elsevier.com/retrieve/pii/S0959652616310447.
7. Tuomisto H.L, Ellis M, Steer M, Could cellular agriculture reduce environmental impacts?Putt. LCA into Pract. Int. Conf. Life Cycle Assess. Food 2016. Dublin, Ireland; 2016.p. 1110–5.
8. Raats J, Meat (substitutes) comparing environmental impacts. A Case study comparing Quornand pork. Training thesis at Centre for Energy and Environmental Studies, University ofGroningen. Retrieved from http://www.temoa.info/node/209029. University of Groningen;2007.
9. Håkansson S, Gavrilita P, Bengoa X, Comparative Life Cycle Assessment Pork vs. Tofu.Stockholm; 2005.
10. Head M, Sevenster M, Croezen H, Life Cycle Impacts of Protein-rich Foods for Superwijzer.Delft; 2011.
11. Blonk H, Kool A, Luske B, de Waart S, ten Pierick E, Milieueffecten van Nederlandseconsumptie van eiwitrijke producten. Gevolgen van vervanging van dierlijke eiwitten anno2008.
12. Berardy A, A Consequential Comparative Life Cycle Assessment of Seitan and Beef.SSEBE-CESEM-2012-CPR-002 Course Project Report Series. 2012.
13. Finnigan T, Lemon M, Allan B, Paton I, Mycoprotein, Life Cycle Analysis and the Food 2030Challenge. Asp. Appl. Biol. 102, 2010; 81–90.
14. Tuomisto H.L, de Mattos M.J.T, Environmental impacts of cultured meat production.Environ. Sci. Technol. [Internet]. 45, 2011; 6117–23. Available from: http://www.ncbi.nlm.nih.gov/pubmed/21682287.
152 S. Smetana et al.
15. van Huis A, van Itterbeeck J, Klunder H, Mertens E, Halloran A, Muir G, et al, Edible insects:Future prospects for food and feed security. FAO Forest. Rome: FAO, United Nations; 2013.
16. Oonincx D.G.A.B, de Boer I.J.M, Environmental impact of the production of mealworms as aprotein source for humans—a life cycle assessment. PLoS One [Internet]. 7, 2012 [cited 2014Mar 19]; e51145. Available from: http://www.pubmedcentral.nih.gov/articlerender.fcgi?artid=3526541&tool=pmcentrez&rendertype=abstract.
17. Nonhebel S, Raats J, Environmental impact of meat substitutes: comparison between quornand pork. Proc. 5th Int. Conf. LCA foods. Gothenburg, Sweden; 2007. p. 73–5.
18. Zhu X, van Ierland E.C, Protein Chains and Environmental Pressures: A Comparison of Porkand Novel Protein Foods. Environ. Sci. [Internet]. 1, 2004; 254–76. Available from: http://www.tandfonline.com/doi/abs/10.1080/15693430412331291652.
19. Nijdam D, Rood T, Westhoek H, The price of protein: Review of land use and carbonfootprints from life cycle assessments of animal food products and their substitutes. FoodPolicy [Internet]. Elsevier Ltd; 37, 2012 [cited 2013 Aug 9]; 760–70. Available from: http://linkinghub.elsevier.com/retrieve/pii/S0306919212000942.
20. Sanders T.A.B, The nutritional adequacy of plant-based diets. Proc. Nutr. Soc. CambridgeUniv Press; 58, 1999; 265–9.
21. Kumar P, Chatli M.K, Mehta N, Singh P, Malav O.P, Verma A.K, Meat analogues: Healthpromising sustainable meat substitutes. Crit. Rev. Food Sci. Nutr. [Internet]. 57, 2017; 923–32. Available from: https://www.tandfonline.com/doi/full/10.1080/10408398.2014.939739.
22. Halloran A, Roos N, Eilenberg J, Cerutti A, Bruun S, Life cycle assessment of edible insectsfor food protein: a review. Agron. Sustain. Dev. [Internet]. 36, 2016; 57. Available from:http://link.springer.com/10.1007/s13593-016-0392-8.
23. Sturtewagen L, De Soete W, Dewulf J, Lachat C, Lauryssen S, Heirman B, et al, Resource useprofile and nutritional value assessment of a typical Belgian meal, catered or home cooked,with pork or QuornTM as protein source. J. Clean. Prod. [Internet]. 112, 2016; 196–204.Available from: http://linkinghub.elsevier.com/retrieve/pii/S0959652615012275.
24. Draaisma R.B, Wijffels R.H, Slegers P, Brentner L.B, Roy A, Barbosa M.J, Foodcommodities from microalgae. Curr. Opin. Biotechnol. [Internet]. 24, 2013; 169–77.Available from: http://linkinghub.elsevier.com/retrieve/pii/S095816691200153X.
25. Poma G, Cuykx M, Amato E, Calaprice C, Focant J.F, Covaci A, Evaluation of hazardouschemicals in edible insects and insect-based food intended for human consumption. FoodChem. Toxicol. [Internet]. 100. 2017; 70–9. Available from: http://linkinghub.elsevier.com/retrieve/pii/S0278691516304598.
26. Rumpold B.A, Schlüter O.K, Potential and challenges of insects as an innovative source forfood and feed production. Innov. Food Sci. Emerg. Technol. [Internet]. 17, 2013; 1–11.Available from: http://linkinghub.elsevier.com/retrieve/pii/S1466856412001452.
27. Post M.J, Cultured meat from stem cells: challenges and prospects. Meat Sci. [Internet].Elsevier Ltd; 92, 2012 [cited 2014 Feb 6]; 297–301. Available from: http://www.ncbi.nlm.nih.gov/pubmed/22543115.
28. Mattick C.S, Landis A.E, Allenby B.R, Genovese N.J, Anticipatory Life Cycle Analysis of InVitro Biomass Cultivation for Cultured Meat Production in the United States. Environ. Sci.Technol. [Internet]. 49, 2015; 11941–9. Available from: http://pubs.acs.org/doi/10.1021/acs.est.5b01614.
29. ISO 14044, Environmental management—Life cycle assessment—Requirements and guide-lines. International Organization for Standardization; 2006.
30. ISO 14040, Environmental Management—Life Cycle Assessment—Principles andFramework. 2006.
31. Jolliet O, Margni M, Charles R, Humbert S, Payet J, Rebitzer G, et al, IMPACT 2002+ : ANew Life Cycle Impact Assessment Methodology. Int. J. Life Cycle Assess. 8, 2003; 324–30.
32. Goedkoop M, Heijungs R, De Schryver A, Struijs J, van Zelm R. ReCiPe 2008, A LCIAmethod which comprises harmonised category indicators at the midpoint and the endpointlevel. Characterisation. Updated RIVM report. Bilthoven, Netherlands: RIVM. 2013.
Agri-Food Waste Streams Utilization for Development … 153
33. Blonk H, Ponsioen T, Kool A, Marinussen M, The Agri-footprint method;Methodological LCA framework, assumptions and applied data. Blonk Milieu Advis.Gouda. Version. 1, 2011.
34. Wernet G, Bauer C, Steubing B, Reinhard J, Moreno-Ruiz E, Weidema B, The ecoinventdatabase version 3 (part I): overview and methodology. Int. J. Life Cycle Assess. Springer;21, 2016; 1218–30.
35. Tuomisto H.L, Roy A.G, Could cultured meat reduce environmental impact of agriculture inEurope ? 8th Int. Conf. LCA Agri-Food Sect. Rennes, Fr. 2–4 Oct. 2012. 2012.
36. Pelletier N, Arsenault N, Tyedmers P, Scenario modeling potential eco-efficiency gains from atransition to organic agriculture: life cycle perspectives on Canadian canola, corn, soy, andwheat production. Environ. Manage. [Internet]. 42, 2008 [cited 2014 Jan 26]; 989–1001.Available from: http://www.ncbi.nlm.nih.gov/pubmed/18574623.
37. Miglietta P, De Leo F, Ruberti M, Massari S, Mealworms for Food: A Water FootprintPerspective. Water [Internet]. 7, 2015; 6190–203. Available from: http://www.mdpi.com/2073-4441/7/11/6190/.
38. Halloran A, Hanboonsong Y, Roos N, Bruun S, Life cycle assessment of cricket farming innorth-eastern Thailand. J. Clean. Prod. [Internet]. 156, 2017; 83–94. Available from: http://linkinghub.elsevier.com/retrieve/pii/S0959652617307163.
39. Harding K, A generic approach to environmental assessment of microbial bioprocessesthrough life cycle assessment (LCA). University of Cape Town; 2008.
40. Smetana S, Sandmann M, Rohn S, Pleissner D, Heinz V, Autotrophic and heterotrophicmicroalgae and cyanobacteria cultivation for food and feed: Life Cycle Assessment.Bioresour. Technol. [Internet]. 2017; Available from: http://linkinghub.elsevier.com/retrieve/pii/S096085241731427X.
41. Heinzle E, Biwer A.P, Cooney C.L, Development of sustainable bioprocesses: modeling andassessment. John Wiley & Sons; 2007.
42. Rumpold B.A, Schlüter O.K, Nutritional composition and safety aspects of edible insects.Mol. Nutr. Food Res. Wiley Online Library; 57, 2013; 802–23.
43. Grau T, Vilcinskas A, Joop G, Sustainable farming of the mealworm Tenebrio molitor for theproduction of food and feed. Zeitschrift für Naturforsch. C [Internet]. 2017; Available from:http://www.degruyter.com/view/j/znc.ahead-of-print/znc-2017-0033/znc-2017-0033.xml.
44. Nasseri A.T, Rasoul-Amini S, Morowvat M.H, Ghasemi Y, Single cell protein: productionand process. Am. J. food Technol. Academic Journals; 6, 2011; 103–16.
45. Xue L, Liu G, Parfitt J, Liu X, Van Herpen E, Stenmarck A, et al, Missing food, missing data?A critical review of global food losses and food waste data. Environ. Sci. Technol. ACSPublications; 2017.
46. Östergren K, Davis J, De Menna F, Vittuari M, Unger N, Loubiere M. Food supply chain sideflows management through Life Cycle Assessment and Life Cycle Costing: a practitioner’sperspective. Proc. Food Syst. Dyn. 2017; 300–3.
47. Davis J, De Menna F, Unger N, Östergren K, Loubiere M, Vittuari M. Generic strategy LCAand LCC: Guidance for LCA and LCC focused on prevention, valorisation and treatment ofside flows from the food supply chain. 2017.
48. Mankins J.C, Technology readiness levels. White Pap. April. 6, 1995.49. Mattick C.S, An Emerging Technology Assessment of Factory-grown Food. Arizona State
University; 2014.
154 S. Smetana et al.
Open Access This chapter is licensed under the terms of the Creative Commons Attribution 4.0International License (http://creativecommons.org/licenses/by/4.0/), which permits use, sharing,adaptation, distribution and reproduction in any medium or format, as long as you give appropriatecredit to the original author(s) and the source, provide a link to the Creative Commons license andindicate if changes were made.The images or other third party material in this chapter are included in the chapter’s Creative
Commons license, unless indicated otherwise in a credit line to the material. If material is notincluded in the chapter’s Creative Commons license and your intended use is not permitted bystatutory regulation or exceeds the permitted use, you will need to obtain permission directly fromthe copyright holder.
Agri-Food Waste Streams Utilization for Development … 155
Implementation and Managementof Life Cycle Approaches in Business—Challenges, Opportunities, BusinessLearnings and Best Practice
Lena Landström and Sara Palander
Abstract This paper presents a summary of the session “Implementation andmanagement of life cycle approaches in business—challenges, opportunities,business learnings and best practice”. In the session, the audience got the oppor-tunity to listen to examples from industry and ways to include life cycle approachesin their business decision making processes. The audience also attended presenta-tions where learnings from the environmental footprint process were discussed. Theconclusions from the presentations and the final panel discussion can be summa-rized in some key messages. To succeed we need to go together and that is whyharmonization of e.g. methods and regulations are important. As a basis whendeveloping the way forward it was concluded that the life cycle approach is animportant tool.
1 Introduction
During the latest decades, companies have implemented life cycle assessment(LCA) into business management processes, e.g. in strategy, investment, procure-ment, and marketing, with the objective to increase the environmental performanceof their products and services. In the latest update of the standard ISO 14001:2015(environmental management systems, EMS), companies shall use a life cycleperspective to fulfil the requirements when for instance identifying the mostimportant and relevant environmental impacts [1]. Also, the Product and
L. LandströmVattenfall, Gothenburg, Sweden
L. Landström � S. Palander (&)Chalmers University of Technology, Swedish Life Cycle Center,412 96 Gothenburg, Swedene-mail: [email protected]
S. PalanderChalmers University of Technology, Centre for Environmentand Sustainability, 412 96 Gothenburg, Sweden
© The Author(s) 2018E. Benetto et al. (eds.), Designing Sustainable Technologies,Products and Policies, https://doi.org/10.1007/978-3-319-66981-6_18
157
Organisation Environmental Footprint process of the European Commission willaffect the international market and business to apply the life cycle approach indecision making and communication [2]. So how does industry embed life cycleapproaches into their business? What is best practice? How are ISO 14001:2015and the Product/Organisation Environmental footprint process (respectively PEFand OEF) being used and can they support the work of improving the environ-mental performance of products, services and organizations?
The session invited industries to present different ways to implement the lifecycle perspective into their environmental management systems, learnings and bestpractices. The session also invited presenters to take up from results and learningsfrom the European PEF/OEF process. What is the next step for businesses,policy-makers and the life cycle management community in order to create a moresustainable industry and communicate results to customers, citizens and otherstakeholders? What actions have been seen and will be seen? What are theopportunities and challenges? The session attracted many abstracts with differentperspectives and the presenters were selected to reflect those perspectives with thehopes of a fruitful panel discussion at the end of the session.
2 Main Messages from the Presentations
Three oral presentations were selected to describe different ways of how life cycleapproaches and life cycle management were incorporated into business strategies.At Procter & Gamble, the OEF has been used to understand the corporate hot spotsand identify sustainability actions based on these, quantify progress over time andeffectively report to external programs such as CDP [3].
Aptar Italia’s roadmap towards sustainability was presented to give an insight inthe company’s use of LCA as a basis for their business. The organization’s mostimportant strategic principle is the customers’ awareness of the value of sustain-ability [4].
AkzoNobel has used monetization of externalities (expressing consequences ofan economic activity experienced by unrelated third party in monetary/financialterms) as an approach to integrate life cycle management in decision making. Themethods behind the “3D profit and loss account” were described and also themethods behind the economic, environmental and social capital for both positiveand negative externalities, e.g. the Environmental Priority Strategies (EPS) [5].
The last two presentations were selected to give insights and perspectives on theenvironmental footprint process from the European Commission. The OEF processwas discussed by one of the OEF pilots in the retail sector and from a communi-cation effectiveness perspective. The pilot study shows both a potential and a valueof OEF as it helps retailers to assess and improve their product portfolio and tomake sure their sustainability strategy targets major issues first [6].
The communication effectiveness was studied through how human brainsinterpret environmental information on products and how to use this information in
158 L. Landström and S. Palander
communication of life cycle based environmental labelling. The key message fromthe research group behind the presentation is education of consumers in all levels ofthe society [7].
3 Discussion on Messages and Outcomes
After their talk, the presenters were invited to be part of a panel discussion to raisethe perspective of the individual company to a society level.
They were first invited to discuss the actions needed in order to make progresstowards a more sustainable industry, what actions are needed.
Need for harmonization and collaboration were agreed on among the participantsin the panel. According to Mr. Van Hoof, “International harmonization is a key wordto drive sustainability actions”. Mr. Van Hoof andMr. Van Hemelryck also discussedthe importance of communicating products’ environmental impact and understandcustomers’ needs and interest were also discussed.Mr. Sonnen added the perspectiveson financial rewarding systems to the table, and Mrs. Lewandowska highlighted theimportance of education and to educate employees, business partners, customers,students, children, advising the use of the life cycle perspective as a basis to give trust.
Then the panelists were questioned about that key aspects needed for theenvironmental footprint methodologies to be put into practice.
The panel highlighted important factors such as the need to develop sometrainings for companies and non-LCA experts and guidelines translated into dif-ferent languages (Mrs. Lewandowska), make it trustable for the consumers and notrisk to lose trust within some years (Mr. Sonnen), create incentives on communi-cation and make LCA tools and data accessible (Mr. Del Grosso).
Other questions raised by the audience resulted in a discussion about respon-sibilities for the consumers, retailers and policy makers. It was raised by Mrs.Schreiber and Mr. Van Hemelryck that some of the requirements, coming by any ofthe three types of stakeholders can drive the environmental performance of productsor companies in the wrong direction and could be harmful. For instance, retailersare fighting to satisfy their customers and therefore they put requirements onfarmers for e.g. limiting or prohibiting pesticides and herbicides use. Otherrequirements coming from the European Commission and/or national governmentslegislation also exist regarding these substances. Then farmers have to deal with somany different regulations that they do not know how to act. The panel alsoreflected on a market with only eco-labeled products, but as highlighted by Mr.Sonnen it seems to be a long way to go.
The panelists ended with key messages for the session. All agreed on the needfor incentives for collaborations along the value chain, with other companies andwith consumers. Life cycle based information appeared as the best way forward togain trust in the market. As a scientific based method, life cycle based approached
Implementation and Management of Life Cycle Approaches … 159

will give trust in the communication process. To succeed in this process,Mrs. Lewandowska once again highlighted education as one of the most powerfultools to succeed.
4 Conclusion and Future Perspectives
The session demonstrated that life cycle based approaches are being used amongindustry to identify where to act in the most efficient way when it comes to sus-tainability, in particular environmental sustainability. This session only gives a fewperspectives on how the life cycle perspectives are being used for business man-agement and their actions based on this information.
There was a consensus on the need to build a harmonized, scientifically basedframework and methodology to produce life cycle based information one of thepriority being to ensure the public trust. The European Commission works for a“Single market for green products” by developing guidelines and tools such as thePEF and OEF, aiming at harmonizing LCA practices, and Lewandowska et al.showed that eco-labelling is something that consumers pay attention to [8].
Harmonization came up and was discussed many times during the session as amean to make a progress on the road towards sustainable businesses. From theauthors’ perspectives, and based on the experience of running the Swedish LifeCycle Centre, an increasing interest from government agencies to act for a har-monization at the society level has been noticed. This perspective needs to be raisedto create an equal basis to operate within the market. One of the success factors forharmonization, agreed by the panelists and also identified by the Swedish LifeCycle Centre, is the important part of working together in cross-industry collabo-ration and not as an individual industry or organization.
The roles of ISO 14001:2015 and the PEF/OEF process on the market, and theireffects at the societal level were brought up during the session. However, morediscussions are required before finding a consensus on this question.
References
1. International Organization for Standardizations (ISO), ISO 14001:2015 Environmentalmanagement systems—requirements with guideline for use, ISO, 2015.
2. http://ec.europa.eu/environment/eussd/smgp/index.htm (Accessed 26.09.2017).3. Van Hoof G, Smith C, Mcaneny J; Desylva J, Informing corporate sustainability strategies with
life cycle assessment: the Procter & Gamble footprint, LCM 2017 Conference, Luxembourg,2017.
4. Del Grosso M, Simboli A, Cutarella N, Raggi A, Business strategies to improve theenvironmental performances: life cycle approaches and tools an Aptar Italia, LCM 017Conference, Luxembourg, 2017.
160 L. Landström and S. Palander
5. Sonnen M, Hallberg K, Integration of life cycle management in decision making: amonetisation approach, LCM 2017 Conference, Luxembourg, 2017.
6. Schreiber H, Humbert S, van Hemelryck S, Poivet R, Developing common rules to quantify theorganisation environmental footprint in the retail sector with support of the chain-OEFapproach, LCM 2017 Conference, Luxembourg, 2017.
7. Borusiak B, Jerzyk E, Kurczewski P, Lewandowska A, Sobierajewicz J, Witczak J, Dierks C,Giungato P; Suh S, How human brains interpret the environmental information on theproducts? A Polish case of neuro-marketing tools to assess a communication effectiveness oflite cycle based environmental labelling, LCM 2017 Conference, Luxembourg, 2017.
8. Swedish Life Cycle Centre, Life cycle based innovation—A research and innovation agendafor a leading position within industrial and societal development where the life cycle thinkingand sustainability is used as a basis for innovation, CPM report no 2013:3, 2013.
Open Access This chapter is licensed under the terms of the Creative Commons Attribution 4.0International License (http://creativecommons.org/licenses/by/4.0/), which permits use, sharing,adaptation, distribution and reproduction in any medium or format, as long as you give appropriatecredit to the original author(s) and the source, provide a link to the Creative Commons license andindicate if changes were made.The images or other third party material in this chapter are included in the chapter’s Creative
Commons license, unless indicated otherwise in a credit line to the material. If material is notincluded in the chapter’s Creative Commons license and your intended use is not permitted bystatutory regulation or exceeds the permitted use, you will need to obtain permission directly fromthe copyright holder.
Implementation and Management of Life Cycle Approaches … 161
Neuro-marketing Tools for Assessingthe Communication Effectiveness of LifeCycle Based Environmental Labelling—Procedure and Methodology
Anna Lewandowska, Barbara Borusiak, Christian Dierks,Pasquale Giungato, Ewa Jerzyk, Przemyslaw Kurczewski,Jagna Sobierajewicz, Sangwon Suh and Joanna Witczak
Abstract The paper presents a procedure and a methodology of research whichaimed at assessing and comparing the effectiveness of different variants of labels incommunicating life cycle based environmental information (EU ecolabel, draft PEFlabels). Based on a survey, an electroencephalography (EEG) and an eye-tracking,the information regarding consumers’ ecological awareness, their neurologicalreaction and a visual attention is gathered and used for identifying the ecolabels’elements with the highest communication potential. A potential target audience ofthe project is not limited to the specialists in the environmental labelling, butincludes also the readers involved in green marketing, Product EnvironmentalFootprint and Life Cycle Assessment practitioners.
A. Lewandowska (&) � B. Borusiak � E. Jerzyk � J. WitczakPoznan University of Economics and Business, al. Niepodleglosci 10,61-875 Poznan, Polande-mail: [email protected]
C. DierksFraunhofer-Institut für Silicatforschung, Brentanostrasse 2,63755 Alzenau, Germany
P. GiungatoUniversity of Bari “Aldo Moro”, Taranto district—via Alcide de Gasperi,Taranto, Italy
P. KurczewskiPoznan University of Technology, Piotrowo 3, 60-965 Poznan, Poland
J. SobierajewiczAdam Mickiewicz University in Poznan, Wieniawskiego 1, 61-712 Poznan, Poland
S. SuhBren School of Environmental Science and Management, University of California,Santa Barbara, CA 93106-5131, USA
© The Author(s) 2018E. Benetto et al. (eds.), Designing Sustainable Technologies,Products and Policies, https://doi.org/10.1007/978-3-319-66981-6_19
163
1 Introduction
Information regarding the environmental performance of products or organisationsplays a more and more important role in consumers’ decisions. There are differentcommunication vehicles and many strategies of green marketing which allowincorporating environmental information into the communication between variousstakeholders representing both sides of the market (supply and demand). A way ofperforming this incorporation has come a long way from disclosing general,qualitative, unverified and single-issue information (“bio”, “eco”, “eco-friendly”) tomove toward verified, quantitative, specific and multi-issue statements.Sustainability has become an integral aspect of product quality and organisationimage and it goes beyond a single environmental dimension. Today the productsdon’t need to be declared as green, they just need to be green [1]. Consumers differconsiderably in their sense of sustainability and ecological awareness. Some ofthem are not susceptible to greenwashing. They have a tendency to use verifiedproduct-related information taken not only from informal sources, but also fromprofessionals and trusted third parties [2]. Green consumers—as early adopters andleaders—influence purchasing behaviour [1]. Also, the role of authorities and idols(e.g. celebrities) in the popularisation of “sustainable everyday” [3] can be signif-icant [4]. From this perspective, an interesting issue is to ask about the importanceof life cycle thinking (LCT) in communication between producers and consumers.Of among twenty new rules of green marketing listed by Ottman [1], at least sevencan be directly or indirectly linked with life cycle thinking (LCT) and Life CycleAssessment (LCA). However, the above question should not be limited to apotential role of LCA in marketing communication, but it should also address theissue of measuring the effectiveness of this communication. While papers on theformer issue can be found in the literature, only single examples of work onthe latter were found. Moreover, no information was found about the research onusing neuroscience to measure the effectiveness of communication based on theresults of LCA. For this reason, a core goal of this paper is to present a procedureand a methodology aimed at estimating the human neurological reaction as a resultof exposure to life cycle based environmental labels and advertisements.
2 Life Cycle Based Environmental Informationas Part of Product-Related Communication
A relationship between eco-design or LCA and green marketing has been discussedin literature. In 1993, Bhat [5] talked about the general strategies of eco-design (e.g.Design for Disassembly, Design for Recycling, and Design for Durability) as abasis for formulating marketing strategies. While there are many publications abouteco-labelling and green marketing, only a few works can be found regarding adiscussion narrowed to a role of LCA [6–10]. Some authors discussed this issue
164 A. Lewandowska et al.
more generally by presenting good practice in communicating LCA results [11–13].The discussion has been dominated by positive opinions, showing that eco-designand LCA are good fundaments for marketing claims. However, there are also somevoices advising caution when using LCA results in marketing communications. Thescepticism doesn’t relate to the LCA as a method, but rather to its subjectivity and,especially, a high flexibility in formulating the initial assumptions [14, 15].
Besides being discussed in the literature, LCA is more and more present inbusiness practices and communication. LCA results are usually released as a part oforganisation-related sustainability report or product-related communication. Theresults can be disclosed in comprehensive, quantitative and third party verifiedforms (EPD declarations, the environmental certificates), but can also include moregeneral content of advertising spots, brochures and websites. Some recent examplesof using LCA in product advertising can be found. Life cycle based advertisingvideo spots are published on mainstream media channels, for example, the adspublished on YouTube by Beiersdorf AG (Nivea creams) [16], Toyota MotorCorporation (Toyota Prius) [17] and W. L. Gore & Associates (Gore-tex® footwear)[18]. In these cases, the spots are based on a presentation of general informationabout life cycle thinking and LCA results.
A question regarding life cycle based communication is pivotal, not onlybecause of an increase in the number of LCA-based ads, but also because of theEuropean Commission Initiative on Product and Organization EnvironmentalFootprints. PEFs and OEFs are intended for estimating and communicating the lifecycle environmental performance of products and organisations [19]. The verifi-cation and assessment of various communication vehicles are currently importantsubjects for the European Commission and for related pilot working groups.Different variants of PEF labels, as one of the communication vehicles, are underconsideration. A few years ago, in 2012, a study entitled “Different options forCommunicating Environmental Information for Products” was launched by theEuropean Commission—DG Environment. The aim of this study was to review andanalyse the existing knowledge about different ways of providing final consumerswith multi-criteria environmental information related to products [20].
As mentioned above, the papers about using LCA results as content of marketingcommunications can be found. However, no information was discovered in theliterature about using neuroscience to verify the effectiveness of this kind ofcommunication. In order to fill this gap, an initiative has been undertaken by theauthors to use neuromarketing tools to assess the human reaction to productslabelled with life cycle based environmental labels and to ads with life cycleenvironmental information included. Our project aims at answering the followingquestions:
(1) What, if any, are the differences in the neurological responses of consumers as aresult of exposure to eco-labelled and non-eco-labelled products?
(2) Which elements of environmental labels and the eco-labelled products attractthe visual attention most?
Neuro-marketing Tools for Assessing the Communication … 165
(3) Is there any correlation between consumers’ ecological awareness and theirresponse?
(4) What kind of neurological response (in terms of activated brain regions andresponse time) follows the exposure to environmental information?
(5) Are the selected ecolabels convincing enough for consumers to persuade themto select the eco-labelled products?
3 Project Procedure and Methodology
The project consists of three parts intended to be performed independently: a sur-vey, monitoring of purchasing behaviour (in a shopLAB) and monitoring of psy-chophysiological reactions (in an EEG laboratory). A description of the parts interms of placing, tools, key elements and their relationship with the project goals(questions to be answered) is presented in Table 1. A first part—the survey—isaimed at identifying the types of participants involved, in terms of their environ-mental awareness and tendency to practice the principles of sustainable develop-ment in daily life. This survey is assumed to play a supplementary role for thewhole project. The methodology and the consumer typology assessment tool havebeen described in [21]. The main purpose of the survey is to analyse the relationshipbetween consumer types (Voluntary Simplifiers, Beginner Voluntary Simplifiers,Accidental Simplifiers, Non-Voluntary Simplifiers) [21, 22] and their reaction toenvironmental labels and environmentally labelled products. Attensee Software[23] is intended to be used to verify the visual attention of the surveyed participants.The international scope of the survey provides a chance to compare results obtainedin different countries from the perspective of cultural and international differences.The same consumer assessment tool is intended to be used in the EEG laboratory.However, in this case, only Polish respondents will be involved and the focus is onfinding a relationship between consumer types and their reaction which will bemeasured by electroencephalograph (EEG) and the eye-tracker. More detailedinformation regarding the research in EEG lab can be found in a Sect. 4.
Another part of the project is to analyse consumer behaviour in a shoppingenvironment. This task is performed in a shopLAB—a laboratory where realshopping conditions are reflected. The research procedure is as follows: the prod-ucts with and without environmental labels are placed on the shelves and theparticipants—equipped with an eyetracker—make decisions about selecting prod-ucts. The participants are divided into three groups. All of them are provided withthe same shopping list on which the products to buy are listed. The members of thefirst group are fully free in their decision making (the only condition is to follow theshopping list). The second group is recommended to buy only green products. Theymake decisions based only on their current knowledge and experience, without anyprior training. The members of the third group take, before shopping, a short course
166 A. Lewandowska et al.
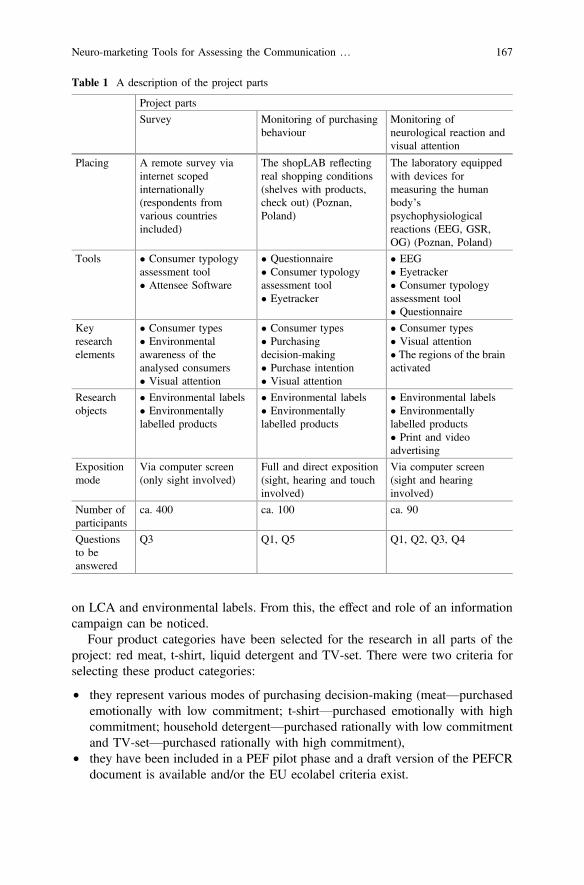
on LCA and environmental labels. From this, the effect and role of an informationcampaign can be noticed.
Four product categories have been selected for the research in all parts of theproject: red meat, t-shirt, liquid detergent and TV-set. There were two criteria forselecting these product categories:
• they represent various modes of purchasing decision-making (meat—purchasedemotionally with low commitment; t-shirt—purchased emotionally with highcommitment; household detergent—purchased rationally with low commitmentand TV-set—purchased rationally with high commitment),
• they have been included in a PEF pilot phase and a draft version of the PEFCRdocument is available and/or the EU ecolabel criteria exist.
Table 1 A description of the project parts
Project parts
Survey Monitoring of purchasingbehaviour
Monitoring ofneurological reaction andvisual attention
Placing A remote survey viainternet scopedinternationally(respondents fromvarious countriesincluded)
The shopLAB reflectingreal shopping conditions(shelves with products,check out) (Poznan,Poland)
The laboratory equippedwith devices formeasuring the humanbody’spsychophysiologicalreactions (EEG, GSR,OG) (Poznan, Poland)
Tools � Consumer typologyassessment tool� Attensee Software
� Questionnaire� Consumer typologyassessment tool� Eyetracker
� EEG� Eyetracker� Consumer typologyassessment tool� Questionnaire
Keyresearchelements
� Consumer types� Environmentalawareness of theanalysed consumers� Visual attention
� Consumer types� Purchasingdecision-making� Purchase intention� Visual attention
� Consumer types� Visual attention� The regions of the brainactivated
Researchobjects
� Environmental labels� Environmentallylabelled products
� Environmental labels� Environmentallylabelled products
� Environmental labels� Environmentallylabelled products� Print and videoadvertising
Expositionmode
Via computer screen(only sight involved)
Full and direct exposition(sight, hearing and touchinvolved)
Via computer screen(sight and hearinginvolved)
Number ofparticipants
ca. 400 ca. 100 ca. 90
Questionsto beanswered
Q3 Q1, Q5 Q1, Q2, Q3, Q4
Neuro-marketing Tools for Assessing the Communication … 167
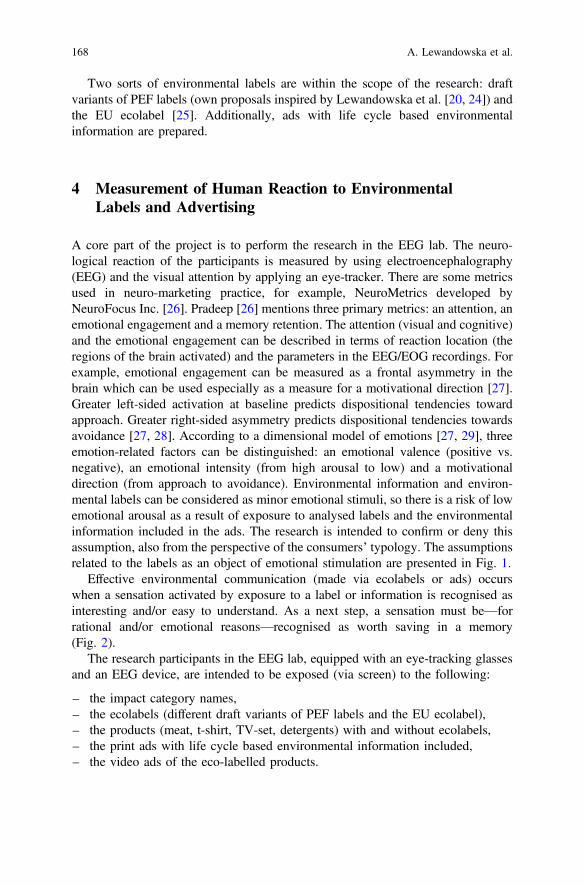
Two sorts of environmental labels are within the scope of the research: draftvariants of PEF labels (own proposals inspired by Lewandowska et al. [20, 24]) andthe EU ecolabel [25]. Additionally, ads with life cycle based environmentalinformation are prepared.
4 Measurement of Human Reaction to EnvironmentalLabels and Advertising
A core part of the project is to perform the research in the EEG lab. The neuro-logical reaction of the participants is measured by using electroencephalography(EEG) and the visual attention by applying an eye-tracker. There are some metricsused in neuro-marketing practice, for example, NeuroMetrics developed byNeuroFocus Inc. [26]. Pradeep [26] mentions three primary metrics: an attention, anemotional engagement and a memory retention. The attention (visual and cognitive)and the emotional engagement can be described in terms of reaction location (theregions of the brain activated) and the parameters in the EEG/EOG recordings. Forexample, emotional engagement can be measured as a frontal asymmetry in thebrain which can be used especially as a measure for a motivational direction [27].Greater left-sided activation at baseline predicts dispositional tendencies towardapproach. Greater right-sided asymmetry predicts dispositional tendencies towardsavoidance [27, 28]. According to a dimensional model of emotions [27, 29], threeemotion-related factors can be distinguished: an emotional valence (positive vs.negative), an emotional intensity (from high arousal to low) and a motivationaldirection (from approach to avoidance). Environmental information and environ-mental labels can be considered as minor emotional stimuli, so there is a risk of lowemotional arousal as a result of exposure to analysed labels and the environmentalinformation included in the ads. The research is intended to confirm or deny thisassumption, also from the perspective of the consumers’ typology. The assumptionsrelated to the labels as an object of emotional stimulation are presented in Fig. 1.
Effective environmental communication (made via ecolabels or ads) occurswhen a sensation activated by exposure to a label or information is recognised asinteresting and/or easy to understand. As a next step, a sensation must be—forrational and/or emotional reasons—recognised as worth saving in a memory(Fig. 2).
The research participants in the EEG lab, equipped with an eye-tracking glassesand an EEG device, are intended to be exposed (via screen) to the following:
– the impact category names,– the ecolabels (different draft variants of PEF labels and the EU ecolabel),– the products (meat, t-shirt, TV-set, detergents) with and without ecolabels,– the print ads with life cycle based environmental information included,– the video ads of the eco-labelled products.
168 A. Lewandowska et al.
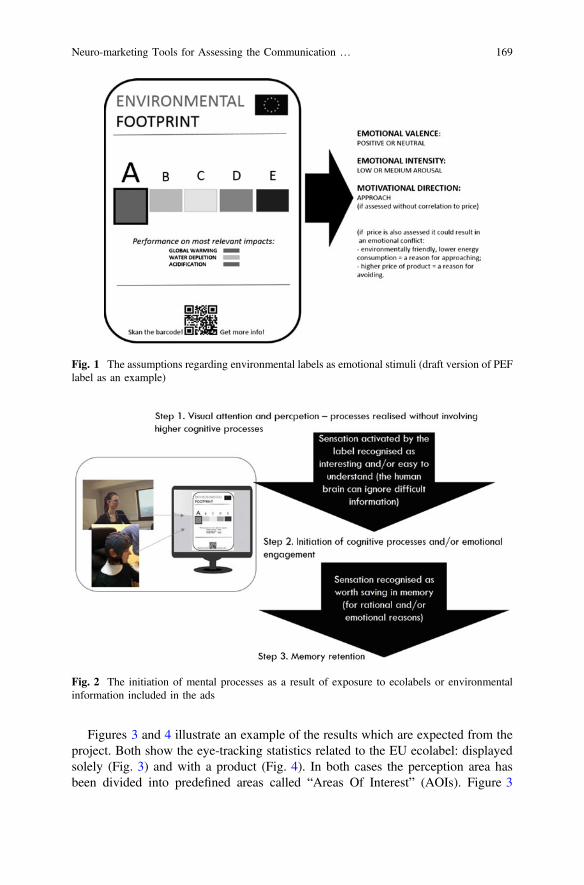
Figures 3 and 4 illustrate an example of the results which are expected from theproject. Both show the eye-tracking statistics related to the EU ecolabel: displayedsolely (Fig. 3) and with a product (Fig. 4). In both cases the perception area hasbeen divided into predefined areas called “Areas Of Interest” (AOIs). Figure 3
Fig. 1 The assumptions regarding environmental labels as emotional stimuli (draft version of PEFlabel as an example)
Fig. 2 The initiation of mental processes as a result of exposure to ecolabels or environmentalinformation included in the ads
Neuro-marketing Tools for Assessing the Communication … 169
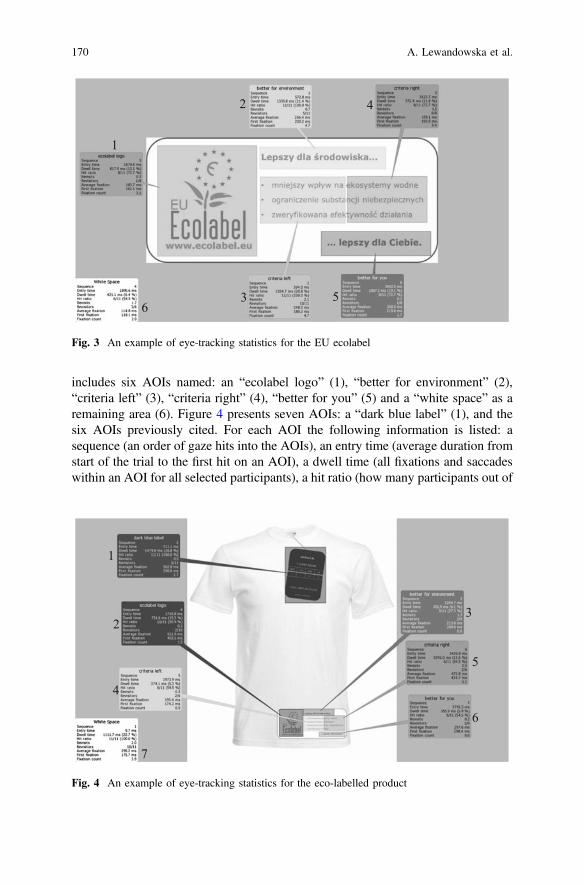
includes six AOIs named: an “ecolabel logo” (1), “better for environment” (2),“criteria left” (3), “criteria right” (4), “better for you” (5) and a “white space” as aremaining area (6). Figure 4 presents seven AOIs: a “dark blue label” (1), and thesix AOIs previously cited. For each AOI the following information is listed: asequence (an order of gaze hits into the AOIs), an entry time (average duration fromstart of the trial to the first hit on an AOI), a dwell time (all fixations and saccadeswithin an AOI for all selected participants), a hit ratio (how many participants out of
1
2
3
4
56
Fig. 3 An example of eye-tracking statistics for the EU ecolabel
1
23
7
4
5
6
Fig. 4 An example of eye-tracking statistics for the eco-labelled product
170 A. Lewandowska et al.
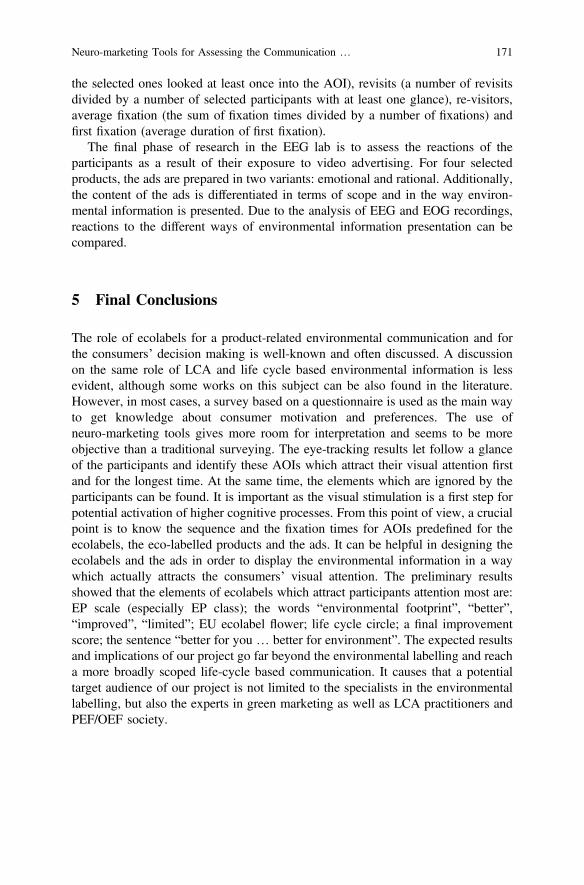
the selected ones looked at least once into the AOI), revisits (a number of revisitsdivided by a number of selected participants with at least one glance), re-visitors,average fixation (the sum of fixation times divided by a number of fixations) andfirst fixation (average duration of first fixation).
The final phase of research in the EEG lab is to assess the reactions of theparticipants as a result of their exposure to video advertising. For four selectedproducts, the ads are prepared in two variants: emotional and rational. Additionally,the content of the ads is differentiated in terms of scope and in the way environ-mental information is presented. Due to the analysis of EEG and EOG recordings,reactions to the different ways of environmental information presentation can becompared.
5 Final Conclusions
The role of ecolabels for a product-related environmental communication and forthe consumers’ decision making is well-known and often discussed. A discussionon the same role of LCA and life cycle based environmental information is lessevident, although some works on this subject can be also found in the literature.However, in most cases, a survey based on a questionnaire is used as the main wayto get knowledge about consumer motivation and preferences. The use ofneuro-marketing tools gives more room for interpretation and seems to be moreobjective than a traditional surveying. The eye-tracking results let follow a glanceof the participants and identify these AOIs which attract their visual attention firstand for the longest time. At the same time, the elements which are ignored by theparticipants can be found. It is important as the visual stimulation is a first step forpotential activation of higher cognitive processes. From this point of view, a crucialpoint is to know the sequence and the fixation times for AOIs predefined for theecolabels, the eco-labelled products and the ads. It can be helpful in designing theecolabels and the ads in order to display the environmental information in a waywhich actually attracts the consumers’ visual attention. The preliminary resultsshowed that the elements of ecolabels which attract participants attention most are:EP scale (especially EP class); the words “environmental footprint”, “better”,“improved”, “limited”; EU ecolabel flower; life cycle circle; a final improvementscore; the sentence “better for you … better for environment”. The expected resultsand implications of our project go far beyond the environmental labelling and reacha more broadly scoped life-cycle based communication. It causes that a potentialtarget audience of our project is not limited to the specialists in the environmentallabelling, but also the experts in green marketing as well as LCA practitioners andPEF/OEF society.
Neuro-marketing Tools for Assessing the Communication … 171
References
1. Ottman JA, The new rules of green marketing: strategies, tools, and Inspiration forSustainable branding, Greenleaf Publishing, 2011.
2. Oates C, McDonald S, Alevizoua P, Hwang K, Young W, McMorland LA, Marketingsustainability: Use of information sources and degrees of voluntary simplicity, Journal ofMarketing Communications, 14 (5), 2008: 351–365.
3. Janikowski R, Imperative for Sustainable Everyday (org. Nachhaltigkeit Als Imperativ desAlltags). Humanities and Social Science 19 (XIX) 21 (3), 2014: 71–82.
4. Eren-Erdogmus I, Lak HS, Çiçek M, Attractive or Credible Celebrities: Who Endorses GreenProducts Better?, Procedia—Social and Behavioral Sciences 235, 2016: 587–594.
5. Bhat VB, Green Marketing Begins with Green Design, Journal of Business and IndustrialMarketing (8)4, 1993: 26–31.
6. Nissinen, A., Heiskanen, E., Grönroos, J., Honkanen, A., Katajajuuri, J.-M., Kurppa, S.,Mäkinen, T., Seppälä, J., Timonen, P., Usva, K., Virtanen, Y., Voutilainen P, DevelopingLCA-based benchmarks for sustainable consumption—for and with users 2005 http://orgprints.org/11268/1/LCA.pdf accessed: 21st May 2017.
7. Molina-Murillo SA, Smith TM, Exploring the use and impact of LCA-based information incorporate communications, International Journal of Life Cycle Assessment, 14, 2009:184–194.
8. Lewandowska A, Witczak J, LCA in advertising, Ecomanager, 5, 2012:44–45 (in Polish).9. Dahlbo H, Koskela S, Pihkola H, Nors M, Federley M, Seppälä J, Comparison of different
normalised LCIA results and their feasibility in communication, International Journal of LifeCycle Assessment, 18, 2013:850–860.
10. Geyer R, DuBuisson MA, life cycle–based framework for environmental assessments ofeco-entrepreneurship IN: Gary D. Libecap (ed.) FRONTIERS INECO-ENTREPRENEURSHIP RESEARCH (Advances in the Study of Entrepreneurship,Innovation & Economic Growth, Volume 20) Emerald Group Publishing Limited, 2015,pp. 53–78.
11. Klöpffer W, Heinrich AB, How to Communicate LCA Results, The International Journal ofLife Cycle Assessment, 5 (3) 2000:125.
12. Heijungs R, Ten easy lessons for good communication of LCA, The International Journal ofLife Cycle Assessment, 19 (3), 2014:473–476.
13. Koffler C, Reply to “Ten easy lessons for good communication of LCA” by Reinout Heijungs,The International Journal of Life Cycle Assessment, 19 (4), 2014:1170–1171.
14. Two sides facts. Are “Go Green—Go Paperless” claims supported by sound and verifiableevidence? http://www.twosides.info/download/Understanding_generic_calculators_Life_Cycle_Assessments_and_risks_to_corporate_reputation.pdf (accessed: 21st May 2017).
15. Framework for Responsible Environmental Marketing Communications ICCDOCUMENTN°240-46/557—14 JANUARY2010 Prepared by ICCCommission onMarketing andAdvertisinghttp://www.iccwbo.org/Advocacy-Codes-and-Rules/Document-centre/2011/ICC-framework-for-responsible-environmental-marketing-communications-(2011)/ (accessed: 21stMay 2017).
16. https://www.youtube.com/watch?v=6RNnzfUHwY8 (accessed: 21st May 2017).17. https://www.youtube.com/watch?v=CVa4GBze3tU (accessed: 21st May 2017).18. https://www.youtube.com/watch?v=iD-m6qBij8Q (accessed: 21st May 2017).19. Commission Recommendation of 9 April 2013 on the use of common methods to measure
and communicate the life cycle environmental performance of products and organisations.20. BIO Intelligence Service, Study on different options for communicating environmental
information for products. Final report prepared for the European Commission – DGEnvironment, 2012.
172 A. Lewandowska et al.
21. Lewandowska A, Witczak J, Giungato P, Dierks C, Kurczewski P, Lemanska-Pawlak K,Inclusion of life cycle thinking in sustainability oriented consumer’s typology — a proposedmethodology and an assessment tool, 2018, Sustainability (under submission).
22. Mcdonald S, Oates C J, Alevizou P J, Young C W, Hwang K, Individual strategies forsustainable consumption. Journal of Marketing Management, 28 (3–4), 2012: 445–468.
23. http://www.attensee.com/method/ (accessed: 22nd May 2017).24. http://ec.europa.eu/environment/eussd/smgp/pdf/infographic-env-info.pdf (accessed: 23rd
May 2017).25. Eu Ecolabel logo guidelines http://ec.europa.eu/environment/ecolabel/documents/logo_
guidelines.pdf (accessed: 23rd May 2017).26. Pradeep AK, The Buying Brain: Secrets for Selling to the Subconscious Mind, Wiley, 2010
ISBN: 978-0-470-60177-8.27. Mauss IB, Robinson MD, Measures of emotion: A review, Cognition and Emotion, February
1, 23(2), 2009: 209–237.28. Keshava MGN, Zaved AK, Cognitive attention behaviour detection systems using
Electroencephalograph (EEG) signals, Research Journal of Pharmacy and Technology, 7(2), 2014:238–247.
29. Dabrowski A, What are emotions? Multicomponents theory of emotion, Analysis andExistence, 27, 2014:123–146.
Open Access This chapter is licensed under the terms of the Creative Commons Attribution 4.0International License (http://creativecommons.org/licenses/by/4.0/), which permits use, sharing,adaptation, distribution and reproduction in any medium or format, as long as you give appropriatecredit to the original author(s) and the source, provide a link to the Creative Commons license andindicate if changes were made.The images or other third party material in this chapter are included in the chapter’s Creative
Commons license, unless indicated otherwise in a credit line to the material. If material is notincluded in the chapter’s Creative Commons license and your intended use is not permitted bystatutory regulation or exceeds the permitted use, you will need to obtain permission directly fromthe copyright holder.
Neuro-marketing Tools for Assessing the Communication … 173

Part IIInnovation for Sustainable Production and
Urban Systems
LCM for Transport and Mobility
Stephan Krinke and Mara Neef
Abstract LCM studies of industry and academia show the increasing importanceof implementing life cycle thinking in the transport and mobility sector. Toolsfacilitating the use of LCA in product development processes increase the relevanceof this topic in companies. OEMs use LCM as decision support for decarbonisationstrategies and operationalization of greenhouse gas reduction targets. Next toenvironmental impacts, financial and social aspects are considered for a holisticassessment of vehicles. Regional impacts of alternative fuels and power trains needto be considered to support the development of sustainable mobility strategies innation states. Regional specifics are also included in new data sets for modelling flatsteel production along the value chain. Introducing voluntary credit transfer optionsin automotive legislation is proposed to incentivize low-carbon innovationsthroughout the whole life cycle of vehicles.
1 Implementing Life Cycle Management in Transportand Mobility Industry
In the Open Hybrid Lab Factory (OHLF) in Wolfsburg LCM is implementedthroughout the design and manufacturing process of eco-efficient lightweightcomponents. For this reason, an approach to interpret and apply LCA results in aneffective way during different development and production steps is necessary.However, most of the involved design and production experts have no backgroundin LCA. In order to facilitate the use Life Cycle Engineering (LCE) by non-LCEexperts, a tool that allows for intuitive handling of inventory data and fast
S. Krinke (&)Volkswagen AG, Environmental Affairs, Letter Box 1896,38436 Wolfsburg, Germanye-mail: [email protected]
M. NeefVolkswagen AG, Environmental Affairs Product, Letter Box 1774,38436 Wolfsburg, Germany
© The Author(s) 2018E. Benetto et al. (eds.), Designing Sustainable Technologies,Products and Policies, https://doi.org/10.1007/978-3-319-66981-6_20
177
interpretation of results was developed [1]. The integrated engineering process isvisualized on a number of screens to show system interdependencies. Like this,material choices or manufacturing processes can be compared and evaluated fastand effectively from a life cycle point of view. In the future, environmental hotspotsand trade-offs are visualized via spatial representation and cluster heat maps.
Likewise, Henkel set up an LCA tool (Henkel Easy LCA) to facilitate the use ofLCA by non-LCA experts in the development process of new products [2]. Thegoal was to develop a streamline LCA tool with the highest level of detail necessaryto make substantiated decisions in a first-tier assessment. For example, with thehelp of the tool, used raw materials can be assessed in less than two minutes. Forhigher-tier assessments, LCA specialists can be consulted for more detailed anal-yses. Until now, only greenhouse gas (GHG) emissions are considered in the rawmaterials assessment though water consumption will be included next. HenkelEasy LCA is also used to model and assess the logistics of products. It includesintermodal shifting, warehousing and capacity utilization.
At BMW, Life Cycle Sustainability Assessment (LCSA) on a component levelwas developed and adopted [3]. The three sustainability dimensions are assessed inan integrated way by combining Life Cycle Costing (LCC), Social-LCA (S-LCA)and LCA. Criticality points of up to 100 represent the respective impacts in eachdimension caused by a specific component. The dimensions are equally weighted sothat as a result, the average of criticality points of all dimensions show the relativeperformance of the assessed component in relation to all other components used.When applying LCSA it is possible to generate a higher environmental or financialimpact by choosing a material that causes least negative social impacts. The goal,however, is to improve the vehicle’s impacts in all of the sustainability dimensions.
At Volkswagen, different powertrains and fuels are assessed with LCA con-sidering current circumstances and developments until 2030 to provide long-termsupport for the Group’s decarbonisation strategy [4]. Different power trains arecompared via the Performance Feel Index that assures a comparison of vehicleswith similar user experiences in terms of overall driving dynamics. The whole lifecycle is assessed to avoid burden shifting between life cycle phases when alteringthe fleet’s power train and fuel composition. Like this, main drivers for efficiencyimprovements are analysed. The study showed that all power train systems stillhave significant improvement potentials. Special effort should be put into reducingthe carbon dioxide burden of lithium-ion battery production, e.g. via energy effi-ciency, green energy supply and closed-loop recycling.
Similarly, at Toyota a life cycle approach is pursued to reach their 2050 target ofreducing carbon emissions by 90% compared to 2010 [5]. Toyota will thereforefocus on hybrid and fuel-cell vehicles powered with renewable energy and alter-native fuels. Their LCAs further show that wrought alloy aluminium has a com-paratively low environmental impact and should therefore be used for light-weightmaterials. The supply of needed quantities of wrought alloy aluminium is prob-lematic though. Cooperation between academia, OEMs and other industries isproposed to solve the supply problem and develop more detailed data sets on there-use of aluminium in the automotive industry.
178 S. Krinke and M. Neef

An LCA study by the Zurich University of Applied Sciences focused on syn-thetic power-to-gas as fuel for transportation with a Volkswagen Golf as referencecar [6]. It showed that if synthetic power-to gas is produced with renewable energy,it emits less GHG per kilometre than fossil gas. Though at the moment, the Swissgrid mix includes a high share of nuclear power so that the electricity consumptionof the electrolysis causes 51% of the overall impact. Additional recommendationsare improving the electrolysis efficiency and using industrial waste gases as carbondioxide source rather than atmospheric carbon dioxide to be competitive withconventional natural gas production.
The Japanese National Institute of Advanced Industrial Science and Technologyassessed whether hydrogen is a suitable automotive energy carrier in Japan [7]. Itwas assumed that the hydrogen would be produced in Australia and subsequentlytransported to Japan. The LCA study showed that the hydrogen source, producerand transport need to be evaluated regionally in order to give meaningful results.Generally, liquid hydrogen should be produced with renewable energy to reduce itsenvironmental impact. Within the assessed scenarios, hybrid vehicles cause theoverall lowest environmental impact followed by hydrogen-powered andgasoline-powered vehicles.
The German Stahlinstitut VDEh developed regional specific datasets for flatsteel products that facilitate a detailed analysis along the value chain [8]. Themotivation for realizing the project was providing suitable data for customers andgovernments interested in modelling steel recycling. As steel producers either useiron ore or scrap to produce flat steel, both strategies are available in the datasets. Inorder to model steel recycling, the multiple recycling approach was applied. As aresult, after including six recycling steps, the carbon dioxide burden of 1 kg of steelis reduced by 50%.
2 Policy Framework
A study presented by the Technical University Berlin proposes an approach tofoster sustainable mobility by integrating a life cycle perspective in automotivelegislation [9]. Although policies concerning the automotive sector are becomingmore relevant they do not include an LCA point of view yet but mainly focus onregulating tailpipe emissions. As the introduction of BEVs is shifting the envi-ronmental burden from the use to the production phase, a life-cycle approach inpolicies is needed to display this development. Instead of introducing a singlelife-cycle based policy tailored to vehicles, voluntary credit options should beoperationalized within existing systems. Until now, automotive OEMs have nopolicy advantage if they save emissions in the production. Therefore, a credittransfer should be facilitated that values low-carbon innovations in the manufac-turing phase. Hence, improving the environmental burden of vehicles throughoutthe whole life cycle becomes more attractive for OEMs.
LCM for Transport and Mobility 179
3 Conclusions
The session on LCM in transport and mobility underlined the necessity of includinga life cycle perspective in the development of sustainable solutions in the sector.Companies and governments use a life cycle approach to develop decarbonisationstrategies and operationalize targets. LCM is applied by industry to fosterclimate-friendly innovations from the design to end-of-life phase of materials,components and final products. Streamline LCA tools help disseminating life cyclethinking and effective implementation of LCA results by different occupationalgroups. By shifting the current focus on tailpipe emission regulations to a life cycleperspective in automotive legislation, the use of LCM by OEMs could further beconsolidated.
References
1. Kaluza A, Kleemann S, Walk W, Vietor T, Herrmann C, Integrating life cycle engineering inthe development of eco-efficient lightweight concepts.
2. Otte N, Singh R, Engelmann K, Tolls J, Nawaz M, Parametric LCA for a first tier assessmentof products by the example of logistics.
3. Tarne P, Wagner V, Finkbeiner M, Adopting Life Cycle Sustainability Assessment in theAutomotive Industry.
4. Plaga B, LCA comparison of power trains and fuels today and 2030.5. Denis R, The Toyota 2050 Environmental Challenges.6. Wettstein S, Stucki M, Synthetic PtG as Fuel for Transportation.7. Kudoh Y, Kitagawa N, Muramatsu R, Ozawa A, Genchi Y, Environmental Footprint Profiles
of Hydrogen as Automotive Energy.8. Hatscher N, Kroop S, Mayr R, Meincke A, Mohr L, Redenius A, Schuster S, Regional specific
LCA data of flat steel products for detailed analysis along the value chain.9. Lehmann A, Berger M, Finkbeiner M, Life cycle-based CO2 emission credits—an approach to
foster sustainable mobility by integrating a life cycle perspective into automotive legislation.
Open Access This chapter is licensed under the terms of the Creative Commons Attribution 4.0International License (http://creativecommons.org/licenses/by/4.0/), which permits use, sharing,adaptation, distribution and reproduction in any medium or format, as long as you give appropriatecredit to the original author(s) and the source, provide a link to the Creative Commons license andindicate if changes were made.The images or other third party material in this chapter are included in the chapter’s Creative
Commons license, unless indicated otherwise in a credit line to the material. If material is notincluded in the chapter’s Creative Commons license and your intended use is not permitted bystatutory regulation or exceeds the permitted use, you will need to obtain permission directly fromthe copyright holder.
180 S. Krinke and M. Neef
Conceptual Development of HybridStructures Towards Eco-EfficientVehicle Lightweighting
Alexander Kaluza, Tim Fröhlich, Sebastian Kleemann,Wolfgang Walk, Christoph Herrmann, Stephan Krinkeand Thomas Vietor
Abstract Lightweight design is a major strategy in automotive development. Thedominant motivation is a reduction of use-phase energy demands while retaining orimproving technical performance. The application of new materials is the prevalentlightweighting strategy. Modern vehicle concepts extend material substitution up tothe combination of different materials on a component level, so called hybriddesigns. While engineering processes, methods and tools in design and productionengineering are well established for conventional designs, hybrid designs pose newchallenges. Lightweight materials as well as new manufacturing and recyclingprocesses may cause increased environmental impacts. In order to achieveeco-efficient lightweight structures, energy savings from the vehicles’ use phaseneed to compensate additional burdens in other lifecycle stages. The current workpresents findings gained in a public-private research collaboration. Its starting pointis the understanding of the role of life cycle engineering towards its impact onoverall sustainability goals. Based on derived key requirements, an integrated lifecycle engineering approach is developed. Activities and interfaces between lifecycle engineering, component design and manufacturing are elaborated. A specialfocus is set on the conceptual design stage, as emerging materials and manufac-turing technologies lead to a broader concept variety. This stage presents also amajor lever for shaping the life cycle environmental impact of components.
A. Kaluza (&) � T. Fröhlich � S. Kleemann � W. Walk � C. HerrmannS. Krinke � T. VietorOpen Hybrid LabFactory e.V., 38440 Wolfsburg, Germanye-mail: [email protected]
A. Kaluza � C. HerrmannChair of Sustainable Manufacturing and Life Cycle Engineering,Institute of Machine Tools and Production Technology (IWF),Technische Universität Braunschweig, 38106 Brunswick, Germany
T. Fröhlich � S. Kleemann � T. VietorInstitut for Engineering Design, Technische Universität Braunschweig,38106 Brunswick, Germany
W. Walk � S. KrinkeVolkswagen AG, 38440 Wolfsburg, Germany
© The Author(s) 2018E. Benetto et al. (eds.), Designing Sustainable Technologies,Products and Policies, https://doi.org/10.1007/978-3-319-66981-6_21
181

1 Introduction
Transport is accounting for a quarter of global greenhouse gas emissions with roadtransport being responsible for three thirds of this share. Towards increasing theenvironmental sustainability of the transport sector, use phase energy demandsgained significant importance in the development of mass-produced vehicles. Thisis induced by legal requirements targeting greenhouse gas emissions for manu-facturers’ vehicle fleets. Several measures enable to improve the use phase effi-ciency, i.e. drivetrain adaptions or optimised aerodynamics. Introducing lightweightstructures reduces energy demands during driving situations with frequent accel-eration and deceleration as well as elevations. There are different strategies toachieve lightweight design. The predominant approach in vehicle engineering ismaterial substitution. For instance, the application of high strength steels is wide-spread in the current vehicle generation. As those designs reach their limits inachieving further weight reductions, new approaches take the stage. Whilemulti-material designs assign different materials to each component, hybrid designscombine different materials on a component level.
The integrated framework by Hauschild et al. is presented (see Fig. 1) in order toprovide a perspective on the overall effect of lightweight structures regarding sus-tainability goals as well as the role of life cycle engineering (LCE) in this context [1].Within the framework an environmental impact axis and a temporal axis span spacesof different scopes. Those scopes set a frame for separate optimisation with spatial/geographical, organisational and technological implications. It is linked to the IPATthinking that relates central driving forces to the production and consumption pat-terns in a future sustainable society. The total environmental impact is presented(I) as a function of the human population (P), the human affluence (A) and thetechnology factor (T). While this represents a top-down approach within the abovementioned framework that is strongly interrelated with absolute sustainability limits,the publication on hand focuses on a complementary bottom-up approach. Here,product development plays a central role as a large share of the later environmentalimpact is already decided at this stage. Methods and tools should help to supportdecision making towards the upper scopes of concern, orienting it towards absolutesustainability. Within the framework, LCE is defined as sustainability-orientedproduct development activities within the scope of one to several product life cycles.The methods and tools used in LCE must support reducing the total environmentalimpact associated with technology change. Life cycle management (LCM) has tosupport this understanding on a company level [2]. As LCE activities relate to anintegrated product and process life cycle planning, the interface between LCM andLCE is explained as a floating transition zone [3].
The overarching goal of the presented research is the understanding and adaptionof engineering processes in conceptual design towards eco-efficient lightweightstructures. The term eco-efficiency in general is defined according to [4] as envi-ronmental impact per unit of product. The current research is focusing on a rathertechnological perspective of that definition. Findings from executing development
182 A. Kaluza et al.
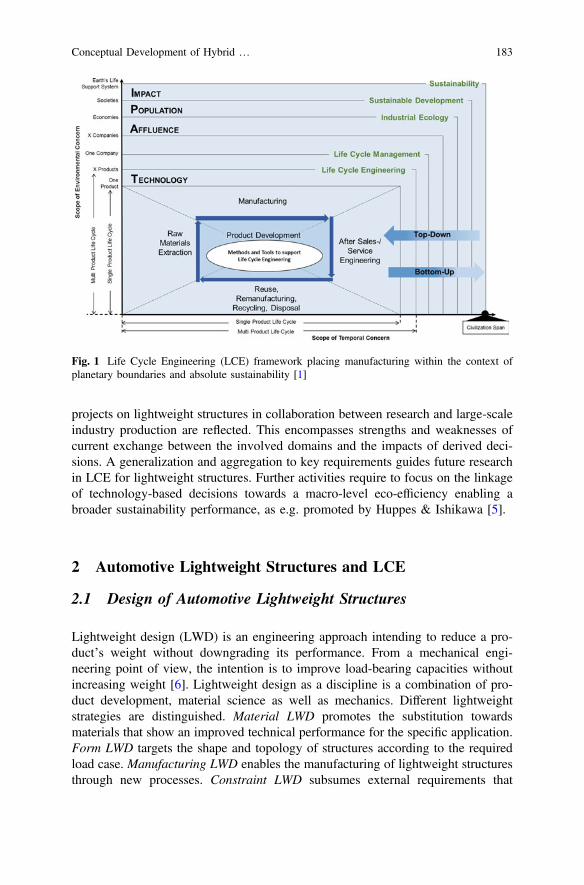
projects on lightweight structures in collaboration between research and large-scaleindustry production are reflected. This encompasses strengths and weaknesses ofcurrent exchange between the involved domains and the impacts of derived deci-sions. A generalization and aggregation to key requirements guides future researchin LCE for lightweight structures. Further activities require to focus on the linkageof technology-based decisions towards a macro-level eco-efficiency enabling abroader sustainability performance, as e.g. promoted by Huppes & Ishikawa [5].
2 Automotive Lightweight Structures and LCE
2.1 Design of Automotive Lightweight Structures
Lightweight design (LWD) is an engineering approach intending to reduce a pro-duct’s weight without downgrading its performance. From a mechanical engi-neering point of view, the intention is to improve load-bearing capacities withoutincreasing weight [6]. Lightweight design as a discipline is a combination of pro-duct development, material science as well as mechanics. Different lightweightstrategies are distinguished. Material LWD promotes the substitution towardsmaterials that show an improved technical performance for the specific application.Form LWD targets the shape and topology of structures according to the requiredload case. Manufacturing LWD enables the manufacturing of lightweight structuresthrough new processes. Constraint LWD subsumes external requirements that
Fig. 1 Life Cycle Engineering (LCE) framework placing manufacturing within the context ofplanetary boundaries and absolute sustainability [1]
Conceptual Development of Hybrid … 183
influence product weight, e.g. maximum payloads in civil engineering. ConceptLWD targets the reflection on component boundaries, e.g. aiming for functionalintegration [7].
LWD requires the joint consideration of all lightweighting strategies. Theinterplay between material selection and geometrical conceptualization is a majorinterface in LWD. Material selection based on material performance indicators, e.g.specific stiffness, shows major drawbacks. Those approaches often assume largecross-sections and thin-walled structures without any space restrictions. This is whythe theoretical weight reduction numbers are hard to achieve in practice. In contrastto that, Wanner considered the boundary condition of limited installation space [8].Additionally, automotive component development requires to strictly meet costrestrictions. Kleemann et al. as well as Fröhlich et al. discuss the dependencies ofmechanical performance, weight and costs for an automotive roof structure [9]. Themanufacturing of lightweight structures requires adaption of existing and qualifi-cation of new manufacturing processes, as summarized e.g. in [10]. Manufacturingroutes that enable the realization of hybrid designs combine process technologiesfrom the metals, plastics and textile industry. The integration of new processes incurrent process chains requires the development towards competitive cycle times,the qualification for sensitive process steps, e.g. the cathodic dip painting, as well asthe consideration of additional invest volumes as exemplary shown in [11]. Thevariety and complexity of LWDs and manufacturing suggests to jointly elaboratethe potentials and obstacles of a large-scale manufacturing from a design andmanufacturing perspective.
2.2 LCE for Automotive Lightweight Structures
Several research papers discuss the topic of LCE in automotive engineering. Threeconstituting aspects of LCE are distinguished as derived from [12]. First, the needfor an evaluation method, which enables to assess environmental impacts ofproducts and processes, second the incorporation of a life cycle perspective andthird the methods and tools required to achieve the consideration of those aspects inthe engineering of products and processes. Life Cycle Assessment (LCA) accordingto ISO 14040 serves as an established evaluation method enabling the analysis andinterpretation regarding different environmental impact categories. As illustrated inFig. 2, the consideration of the entire product life cycle is crucial within theengineering of lightweight structures. Compared to conventional (steel) designs,lightweight structures often show higher environmental impacts from raw materialsextraction. In order to enable eco-efficient LWDs on a product level, use phaseenergy savings need to compensate those burdens. In addition, potential efforts inthe end-of-life phase occur, as conventional processes are not suitable for hybridcomponents and new processes lack maturity compared to the steel reference.Figure 2 schematically shows the influence of two lightweight alternatives on theenvironmental impacts of a vehicle component manufacturing in comparison to a
184 A. Kaluza et al.
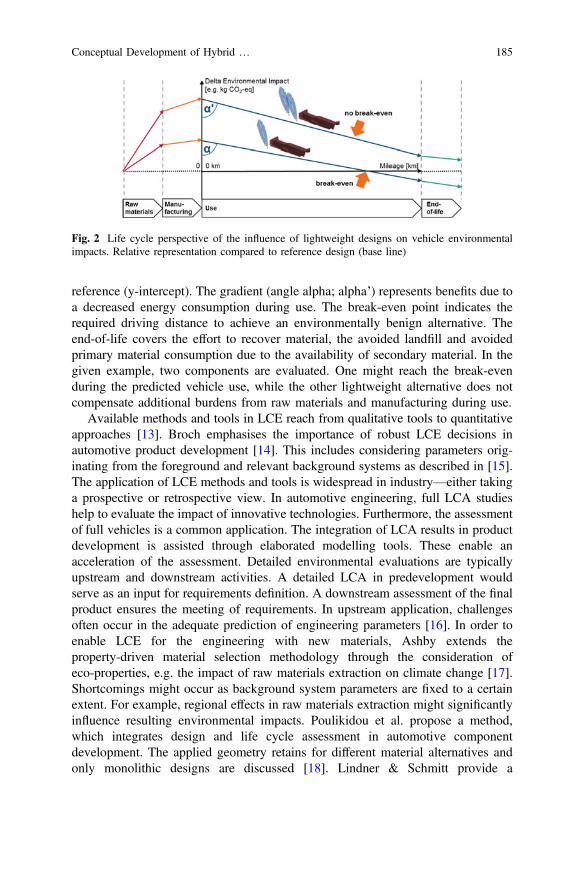
reference (y-intercept). The gradient (angle alpha; alpha’) represents benefits due toa decreased energy consumption during use. The break-even point indicates therequired driving distance to achieve an environmentally benign alternative. Theend-of-life covers the effort to recover material, the avoided landfill and avoidedprimary material consumption due to the availability of secondary material. In thegiven example, two components are evaluated. One might reach the break-evenduring the predicted vehicle use, while the other lightweight alternative does notcompensate additional burdens from raw materials and manufacturing during use.
Available methods and tools in LCE reach from qualitative tools to quantitativeapproaches [13]. Broch emphasises the importance of robust LCE decisions inautomotive product development [14]. This includes considering parameters orig-inating from the foreground and relevant background systems as described in [15].The application of LCE methods and tools is widespread in industry—either takinga prospective or retrospective view. In automotive engineering, full LCA studieshelp to evaluate the impact of innovative technologies. Furthermore, the assessmentof full vehicles is a common application. The integration of LCA results in productdevelopment is assisted through elaborated modelling tools. These enable anacceleration of the assessment. Detailed environmental evaluations are typicallyupstream and downstream activities. A detailed LCA in predevelopment wouldserve as an input for requirements definition. A downstream assessment of the finalproduct ensures the meeting of requirements. In upstream application, challengesoften occur in the adequate prediction of engineering parameters [16]. In order toenable LCE for the engineering with new materials, Ashby extends theproperty-driven material selection methodology through the consideration ofeco-properties, e.g. the impact of raw materials extraction on climate change [17].Shortcomings might occur as background system parameters are fixed to a certainextent. For example, regional effects in raw materials extraction might significantlyinfluence resulting environmental impacts. Poulikidou et al. propose a method,which integrates design and life cycle assessment in automotive componentdevelopment. The applied geometry retains for different material alternatives andonly monolithic designs are discussed [18]. Lindner & Schmitt provide a
Fig. 2 Life cycle perspective of the influence of lightweight designs on vehicle environmentalimpacts. Relative representation compared to reference design (base line)
Conceptual Development of Hybrid … 185
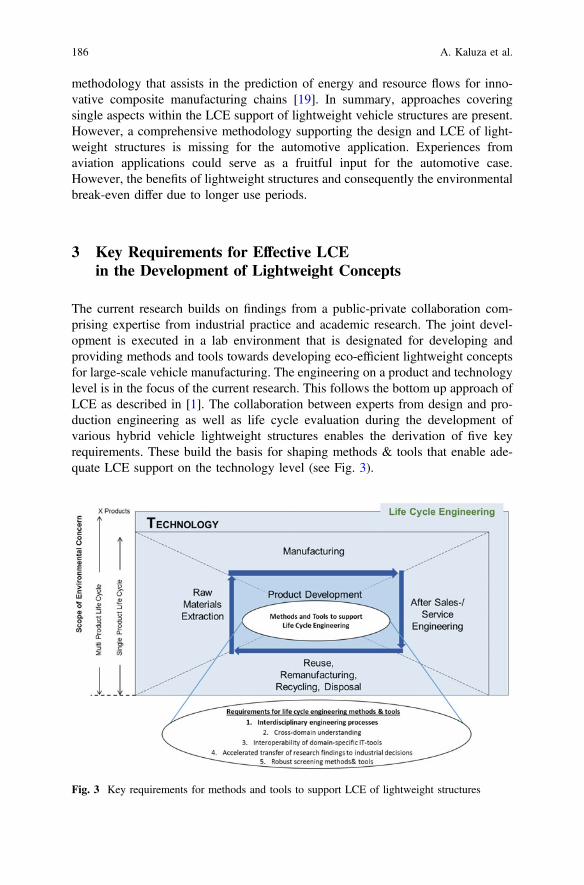
methodology that assists in the prediction of energy and resource flows for inno-vative composite manufacturing chains [19]. In summary, approaches coveringsingle aspects within the LCE support of lightweight vehicle structures are present.However, a comprehensive methodology supporting the design and LCE of light-weight structures is missing for the automotive application. Experiences fromaviation applications could serve as a fruitful input for the automotive case.However, the benefits of lightweight structures and consequently the environmentalbreak-even differ due to longer use periods.
3 Key Requirements for Effective LCEin the Development of Lightweight Concepts
The current research builds on findings from a public-private collaboration com-prising expertise from industrial practice and academic research. The joint devel-opment is executed in a lab environment that is designated for developing andproviding methods and tools towards developing eco-efficient lightweight conceptsfor large-scale vehicle manufacturing. The engineering on a product and technologylevel is in the focus of the current research. This follows the bottom up approach ofLCE as described in [1]. The collaboration between experts from design and pro-duction engineering as well as life cycle evaluation during the development ofvarious hybrid vehicle lightweight structures enables the derivation of five keyrequirements. These build the basis for shaping methods & tools that enable ade-quate LCE support on the technology level (see Fig. 3).
Fig. 3 Key requirements for methods and tools to support LCE of lightweight structures
186 A. Kaluza et al.

1. Interdisciplinary engineering processes: Concurrent engineering approachesare an established concept in the development of vehicle structures. When it comesto the design of hybrid or multi-material concepts, one has to face some specificchallenges. Lightweight structures based on hybrid or multi-material approachesrequire new designs compared to established materials, comprehensive experienceis currently missing. Manufacturing technologies for hybrid designs are developingrapidly with implications for parts’ design and life cycle evaluation. A particularlyhigh number of variations and gaps in LCA databases, e.g. manufacturing pro-cesses, disqualify click-and-rush LCA studies composed of standard modules. Allof the considered engineering disciplines have to deal with high uncertainties andengineering processes that are even more dynamic than in conventional vehicledevelopment. Especially product development and manufacturing technologydevelopment are to a certain extent parallel activities in the given case.
2 & 3. Cross-domain understanding and interoperability of domain-specific ITtools: All domain-specific engineering activities require the assistance of advancedmethods and tools, e.g. numerical simulation regarding crash behaviour or manu-facturing process simulations. In addition, the modelling of energy and resourcedemands relies on complex models incorporating different data sources—fromstatic life cycle inventories to the simulation of different use patterns or the con-sideration of live manufacturing data. Typically, simplified key performance indi-cators and visualization techniques are used to exchange information betweendisciplines. Their benefit lies in the easy interpretability. At the same time, theunderstanding for cross-disciplinary interlinkages decreases. As the decision scopeshifts from the gate-to-gate perspective towards the whole product life cycle as wellas across life cycles, domain-specific methods and tools should allow an infor-mation flow across disciplines.
4. Accelerated transfer of research findings to industrial decisions: In thecontext of lightweight structures, but similarly concerning technologies, innovationcycles become shorter including a dynamic innovation network. Thus, academicand industrial research to a certain extent parallel the development itself. Higherdynamics in the interaction of stakeholders are the result.
5. Robust screening methods & tools for the acceleration of engineering pro-cesses: The introduction hybrid or multi-material lightweight structures signifi-cantly increases the solution space during the development of vehicle components.This leads to suspension of traditional geometries, component boundaries orinstallation spaces creating new challenges for methods and tools in the designdomain. Cost assessment faces new challenges due to the fast changing designs andthe evaluation of new materials, processes and geometries. For both environmentalassessment and cost assessment, one major challenge is the scaling up of theapplied models in order to predict the behaviour in vehicle mass production. Thisincreased complexity in all disciplines, from engineering design over manufactur-ing planning up to LCE, needs to be reflected in developing evaluation tools thatbuild on the described complexity, but enable to derive reliable decisions.
Conceptual Development of Hybrid … 187
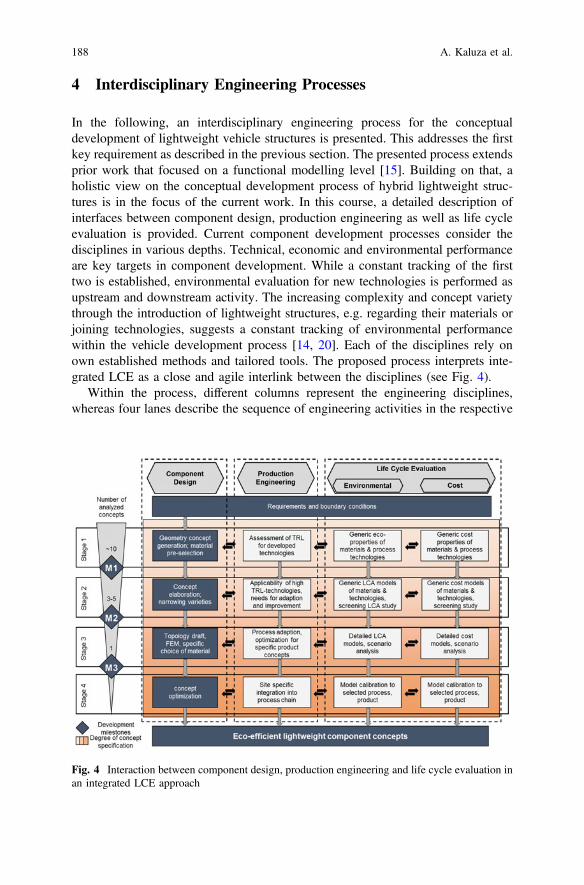
4 Interdisciplinary Engineering Processes
In the following, an interdisciplinary engineering process for the conceptualdevelopment of lightweight vehicle structures is presented. This addresses the firstkey requirement as described in the previous section. The presented process extendsprior work that focused on a functional modelling level [15]. Building on that, aholistic view on the conceptual development process of hybrid lightweight struc-tures is in the focus of the current work. In this course, a detailed description ofinterfaces between component design, production engineering as well as life cycleevaluation is provided. Current component development processes consider thedisciplines in various depths. Technical, economic and environmental performanceare key targets in component development. While a constant tracking of the firsttwo is established, environmental evaluation for new technologies is performed asupstream and downstream activity. The increasing complexity and concept varietythrough the introduction of lightweight structures, e.g. regarding their materials orjoining technologies, suggests a constant tracking of environmental performancewithin the vehicle development process [14, 20]. Each of the disciplines rely onown established methods and tailored tools. The proposed process interprets inte-grated LCE as a close and agile interlink between the disciplines (see Fig. 4).
Within the process, different columns represent the engineering disciplines,whereas four lanes describe the sequence of engineering activities in the respective
Fig. 4 Interaction between component design, production engineering and life cycle evaluation inan integrated LCE approach
188 A. Kaluza et al.
disciplines (stage 1 to stage 4). Based on a requirements definition by each of thedisciplines, a generic component engineering process is followed. The componentdesign provides the pace of the process (blue boxes). This complies with theestablished situation in vehicle manufacturers, where product development repre-sents the key business process. Contrary to the current practice, production engi-neering and environmental life cycle evaluation are included as continuous andsynergetic activities (white boxes). The sequence of engineering activities andinterplays between the disciplines is broken down into sub-activities and inter-changes. All activities on a horizontal level are executed as concurrent activities. Ateach stage, an interdisciplinary review is performed within defined milestones. Thisdoes not only result in a stepwise narrowing of uncertainties and the identificationof interdisciplinary trade-offs, but also helps to sort out succeeding options whiledropping other alternatives as represented by the funnel and respective milestonesin Fig. 4. The main outcome of the engineering process are concepts for lightweightcomponents that comply to the disciplines’ requirements.
Stage 1 of the proposed process opens up a broad solution space for achievingthe desired technical parameters through different geometries, materials and man-ufacturing routes. This stands in opposition to current component developmentprocesses, that rely on a strict breakdown of vehicle targets and thus limit variationsfor the developed concepts as described in [20]. The second stage represents aconcept realisation with the assistance of analytic and simplified numeric calcula-tions. As a result, further processing regards only a small number of concepts. Thethird stage covers numeric studies as measures to enable a detailed design with finalspecifications on material compositions as well as manufacturing routes for onlyone or few concepts. The fourth stage deals with the optimization of the concept infavour.
5 Discussion and Outlook
The introduction of hybrid lightweight structures poses new challenges on thesupport of LCE in automotive development. While the effect of lightweightstructures on a broader sustainability perspective defines the overarching researchdemands, the scope of the current research focuses on a technology perspective.This enables to understand engineering activities and decisions on a micro-level toallow a further integration into a broader LCE context. An increasing variety ofmaterials and manufacturing processes significantly widens the solution space inconceptual development of hybrid structures. In result, LCE methods & tools needfurther integration side-by-side to engineering design and production engineering.Key requirements towards the adaption of LCE methods & tools have been derivedand the introduction of integrated engineering processes is elaborated. Theapproach targets the requirements in a double sense: Firstly, the process ensures that
Conceptual Development of Hybrid … 189
non-succeeding options are eliminated in early stages and efforts can be focused.Secondly, the process enables an evolutionary building on established methods andtools.
Further activities are required to enhance the capabilities of the presentedapproach. The elaboration of technical interfaces between domain-specific toolswill accelerate the information exchange in the proposed manner. Coincidently, theidentification of further interdisciplinary trade-offs will be enabled. Yet a smallnumber of case studies have confirmed the presented approach. Within thepublic-private partnership Open Hybrid LabFactory further experience throughimplementation and adaption will be generated. The communication between dis-ciplines could be enhanced by providing visualizations that enable a low barrieraccessibility of the research results. One key facility at the Open Hybrid LabFactoryis the newly established ‘Life Cycle Design & Engineering Lab’, a workspace toexplore modes of cross-discipline cooperation and visualisation techniques in orderto support and promote integrated LCE.
Acknowledgements This research is funded by the German Federal Ministry of Education andResearch (BMBF) within the research campus “Open Hybrid Lab Factory” and managed by theProject Management Agency Karlsruhe (PTKA). The authors are responsible for the contents ofthis publication.
References
1. Hauschild M. Z, Herrmann C, Kara S, An Integrated Framework for Life Cycle Engineering.Procedia CIRP, 61, 2–9, 2017, https://doi.org/10.1016/j.procir.2016.11.257.
2. Herrmann C, Ganzheitliches Life Cycle Management. SpringerVerlag Berlin Heidelberg,2010, https://doi.org/10.1007/978-3-642-01421-5.
3. Umeda Y, Takata S, Kimura F, Tomiyama T, Sutherland J.W, Kara S, Duflou J. R, Towardintegrated product and process life cycle planning—An environmental perspective. CIRPAnnals—Manufacturing Technology, 61(2), 681–702, 2012, https://doi.org/10.1016/j.cirp.2012.05.004.
4. Huppes G, Ishikawa M, A framework for quantified eco-efficiency analysis. Journal ofindustrial ecology, 9(4), 25–41, 2005, https://doi.org/10.1162/108819805775247882.
5. Huppes G, Ishikawa M, Eco-efficiency guiding micro-level actions towards sustainability:Ten basic steps for analysis. Ecological Economics, 68(6), 1687–1700, 2009, https://doi.org/10.1016/j.ecolecon.2009.01.007.
6. Wiedemann J, Leichtbau. Berlin, Heidelberg: Springer Berlin Heidelberg, 2007, https://doi.org/10.1007/978-3-540-33657-0.
7. Friedrich H.E, Leichtbau in der Fahrzeugtechnik, 2013, https://doi.org/10.1007/978-3-8348-2110-2.
8. Wanner A, Minimum-weight materials selection for limited available space. Materials &Design, 31(6), 2834–2839, 2010, https://doi.org/10.1016/j.matdes.2009.12.052.
9. Kleemann S, Fröhlich T, Türck E, Vietor T, A Methodological Approach TowardsMulti-material Design of Automotive Components. Procedia CIRP, 60, 68–73, 2017, https://doi.org/10.1016/j.procir.2017.01.010.
190 A. Kaluza et al.

10. Taub A.I, Luo A.A, Advanced lightweight materials and manufacturing processes forautomotive applications. MRS Bulletin, 40(12), 1045–1054, 2015, https://doi.org/10.1557/mrs.2015.268.
11. Eckstein L, Ickert L, Goede M, Dölle N, Lightweight Floor Structure with Reinforcements ofCFRP and GFRP. ATZ Autotechnology, 11(2), 48–52, 2011.
12. Jeswiet J, Life Cycle Engineering. In CIRP Encyclopedia of Production Engineering(pp. 757–758), Berlin, Heidelberg: Springer Berlin Heidelberg, 2014, https://doi.org/10.1007/978-3-642-20617-7_6609.
13. Bovea M.D, Pérez-Belis V, A taxonomy of ecodesign tools for integrating environmentalrequirements into the product design process. Journal of Cleaner Production, 20(1), 61–71,2012. https://doi.org/10.1016/j.jclepro.2011.07.012.
14. Broch F, Warsen J, Krinke S, Implementing Life Cycle Engineering in AutomotiveDevelopment as a Helpful Management Tool to Support Design for Environment.In G. Sonnemann & M. Margni (Eds.), Life Cycle Management (pp. 319–329). Springer,2015, https://doi.org/10.1007/978-94-017-7221-1.
15. Kaluza A, Kleemann S, Fröhlich T, Herrmann C, Vietor T, Concurrent Design & Life CycleEngineering in Automotive Lightweight Component Development. Procedia CIRP, 66,16–21, 2017, https://doi.org/10.1016/j.procir.2017.03.293.
16. Broch F, Integration von ökologischen Lebenswegbewertungen in Fahrzeugentwicklungsprozesse.Springer, 2017.
17. Ashby M.F, Introduction. In Materials Selection in Mechanical Design (pp. 1–13). Elsevier,2011, https://doi.org/10.1016/b978-1-85617-663-7.00001-1.
18. Poulikidou S, Schneider C, Björklund A, Kazemahvazi S, Wennhage P, Zenkert D,A material selection approach to evaluate material substitution for minimizing the life cycleenvironmental impact of vehicles. Materials & Design, 83, 704–712, 2015, https://doi.org/10.1016/j.matdes.2015.06.079.
19. Lindner F, Schmitt R, Goal-oriented life cycle investigations for composite manufacturingchains. Procedia CIRP, 29, 438–443, 2015, https://doi.org/10.1016/j.procir.2015.02.043.
20. Kaluza A, Kleemann S, Broch F, Herrmann C, Vietor T, Analyzing decision-making inautomotive design towards life cycle engineering for hybrid lightweight components.Procedia CIRP, 50, 825–830, 2016, https://doi.org/10.1016/j.procir.2016.05.029.
Open Access This chapter is licensed under the terms of the Creative Commons Attribution 4.0International License (http://creativecommons.org/licenses/by/4.0/), which permits use, sharing,adaptation, distribution and reproduction in any medium or format, as long as you give appropriatecredit to the original author(s) and the source, provide a link to the Creative Commons license andindicate if changes were made.The images or other third party material in this chapter are included in the chapter’s Creative
Commons license, unless indicated otherwise in a credit line to the material. If material is notincluded in the chapter’s Creative Commons license and your intended use is not permitted bystatutory regulation or exceeds the permitted use, you will need to obtain permission directly fromthe copyright holder.
Conceptual Development of Hybrid … 191
LCA in Strategic Decision Makingfor Long Term Urban TransportationSystem Transformation
Florian Ansgar Jaeger, Katrin Müller, Cornelia Petermannand Eric Lesage
Abstract The paper provides an overview of how Siemens uses LCA methodologyand tools to support cities in the decision-making process to promote sustainableurban transportation systems. It focuses on GHGs and local air pollution.Determining the cause of GHG emissions and air pollution requires flexible scopesand a highly parameterized, hierarchical model, which can be adapted to any city’stransportation system. Emission forecasting capabilities are very important sincemotorized transportation modes quickly change properties over time. The modelscreens a large set of infrastructure improvement measures by the click of a buttonand analyses their impact on KPIs for different years. Applicability, challenges andlimits of LCA to the specific application of urban transportation system modellingare discussed.
1 Introduction
LCA methodology and tools have proven useful for assessing products or evencompanies in organizational LCA. Having used LCA-based methods and tools tomodel transport systems in more than 20 cities, we can say that this applies tomobility related infrastructure solutions in cities as well. This report shows how itwas done and that the variety of indicators and flexibility LCA offers, not onlymatters to different products and product categories, but is also crucial for cities.The cities in the world have different focuses on environmental, economic or social
F. A. Jaeger (&) � K. Müller � C. PetermannResearch in Energy and Electronics, Energy Systems,Sustainable Life Cycle Management and EnvironmentalPerformance Management, Siemens Corporate Technology,13629 Berlin, Germanye-mail: [email protected]
E. LesageBusiness Development and Strategy, Mobility Consulting,Siemens Mobility, Berlin, Germany
© The Author(s) 2018E. Benetto et al. (eds.), Designing Sustainable Technologies,Products and Policies, https://doi.org/10.1007/978-3-319-66981-6_22
193
aspects/KPIs. These differ by region, in scope (Carbon Accounting Scope 1–3) andin time (in terms of target setting, short term for air pollutants, long term forGHG-emissions). This diversity and the fact that there are vast differences in thelevel of maturity of cities with regard to data availability, setting targets anddeveloping plans on how to achieve them, sets the requirements for any communityscale model.
The aim of the transportation model is to support cities in creating climate actionplans or clean air plans and to support cross-department activities in city admin-istrations. The model is embedded in a process that supports city administrations inbuilding alternative future infrastructure scenarios. It reflects all generally accepted/assumed changes in technology, fleets and national policy over time by default andfocus on the cities’ core indicators.
2 Method
The methods and tools are a combination of conventional LCA, consequentialLCA, greenhouse gas accounting for cities and futurology. Even though the soft-ware and modelling concept such as the functional units are common LCA-based,the model is aligned with the GPC-Protocol [1]. Forecasting elements are includedfrom HBEFA [2] for market and technology development. Scenario workshopsenable the inclusion of the political agenda during the projects process.
2.1 Scope and Indicators
The scope of the transport system model follows the basic rules of theGPC-Protocol [1], since greenhouse gas accounting is a quite common procedurefor municipalities. It is a comparably well-defined process. The majority of citieswith which we have worked have experts with a good understanding of theGPC-Protocol methodology and relevant stakeholders in cities are likely to knowhow to interpret its results.
With regard to the scope of activities, traffic in a territory is included, whileemissions from airports and liquids or gases in pipelines are excluded. All processesare separated into the three scopes: direct, energy related indirect and other indirectemissions. By the click of a button, the model enables the inclusion and exclusionof different lifecycle phases or infrastructure categories and activities such as e.g.maintenance.
Despite these options being available, all cities we worked with decided tobalance the direct operation of vehicles and direct emissions of infrastructure suchas street lighting only. In addition to the standard activity data necessary to establisha baseline, the model also requires data to determine the level of maturity of thetransportation system and its individual components. This is necessary in order to
194 F. A. Jaeger et al.

calculate the impact of levers at a later stage. Levers are new technologies ormeasures that are introduced to the system. Available levers either shift transportvolume from a high to a low-emitting mode of transport or increase the efficiency ofan individual or several modes.
The transportation system model supports the common material flows andindicators, covered by the ecoinvent database, but its focus is on greenhouse gasesand regulated air pollutants. For levers only, the social dimension is addressed withthe KPI local job creation potential of project related infrastructure build-up. Aseconomic figures, CAPEX and OPEX of newly built infrastructure are calculated.The social and economic KPIs are not discussed in the following.
2.2 Structure of the Model
The model breaks down the general transportation demand within the cityboundaries, with the functional units being passenger kilometres and ton kilome-tres. The main mode categories are rail based, road based and non-motorizedtransportation. The two functional units are broken down into vehicle types, wherethey are converted into actual vehicle kilometres, regardless of whether the mode ismass rapid transit by metro or individual passenger transport by car. The individualvehicle types are then specified in a parameterized process.
The same structure applies to the power model, which is connected to all pro-cesses, consuming electricity in the urban transportation system. The power isdrawn on different grid levels, reflecting different T&D losses and the grid mix isspecified by fuel type and region.
Along with the transportation demand-oriented processes, a second streamquantifies basic road infrastructure such as lighting. The lighting demand isassessed based on lamp types and energy consumption and converted into lumen*has a functional unit.
In order to model the set of 38 transportation and some energy levers, additionalprocesses are modelled or the changes to the infrastructure are directly implementedin baseline processes. The calculations are each triggered by only one parameterand modelled on global (project) level or process level, depending on rather theinduced change effects several processes or just one process.
2.3 Parameterization
The baselining process starts out with the model of a default city and adjusts it stepby step to the actual city. The process can be compared to the fitting process of atailor, making a dress on demand. Just like the dress, which starts with a certainsize, but somewhat standard proportions, the city’s transportation system model isassembled from different parts that are pre-configured with default values and
LCA in Strategic Decision Making for Long … 195
assembled. In two to X fittings, data is adjusted to perfectly fit the city’s trans-portation system or match its official reporting. The necessary fitting parameters arenot hard coded, but part of questionnaire and fed to the model via calculationsetups. The level of parameterization is the result of constant adaptations to theneeds of numerous cities. In order to avoid having to feed thousands of parametersto the model for each calculation, most likely cases are defined, which can becombined and controlled with much fewer parameters. The hard-coded cases in themodel consist of extracts from external databases such as HBEFA, which wereimported via EcoSpold format previous to actual projects. This way, the number ofcommonly necessary data points was reduced to just 250 (not including forecastingparameters). Global project parameters define the scope of the model, whichobservation year to balance or the “flux” of transportation volumes of individualprocesses. Local process parameters are set to adapt individual processes. As one ofthe most relevant process categories, the mode type passenger cars for example arecategorized by fuel type and conversion technology (combustion, hybrid…).Parameterization includes the average fuel consumption or tank to wheel GHGemissions, the EURO-Class, the difference in yearly vehicle mileage between dieseland petrol vehicles, as well as newer versus older vehicles and the average journeydistance for cold start emission determination.
In addition to the parameters necessary for baselining, lever specific parametersare defined to obtain the current development or state of an individual infrastruc-ture. Others identify the maximum applicability of a lever. One Parameter is set foreach lever, to trigger it and set the degree to which it is implemented at a certaintime.
2.4 Forecasting
The model is built as a decision support too for city administrations. When makinglong term infrastructure decisions, it is of little use to know impacts of a lever if itwas in place today, if it takes 10 years in real world to construct the necessaryinfrastructure. The cause therefore requires forecasting options to determine thefuture baseline situation and lever impacts during the years the levers will actuallybe in place.
Forecasting elements are separated into three categories and treated differently:
• Forecasting parameters which are mainly influenced by the market developmentor can only be impacted by national or state union level governance areimplemented by default or by case selection. This concerns technologyimprovements and fleet turnovers.
– Example 1: Average ages of vehicle technology are automatically forecastedbased on vehicle fleet distributions in EURO classes.
196 F. A. Jaeger et al.
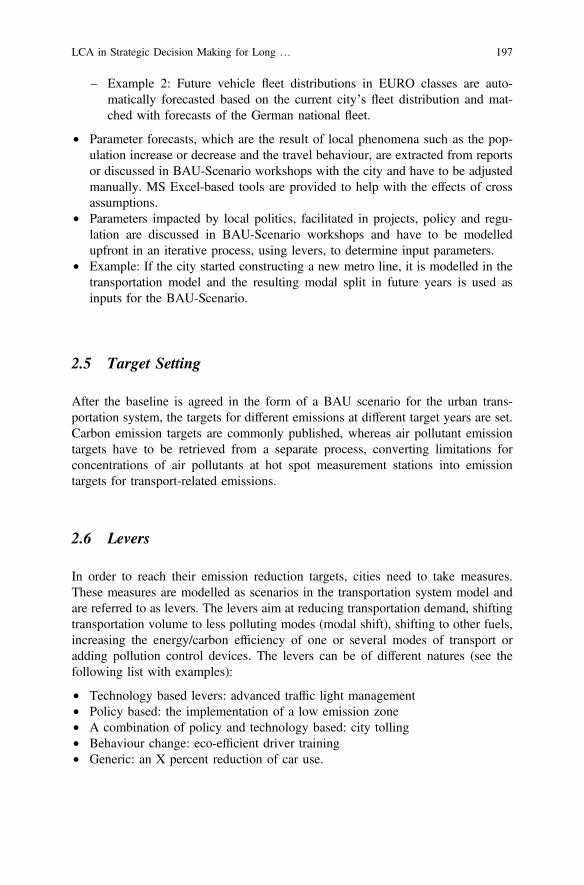
– Example 2: Future vehicle fleet distributions in EURO classes are auto-matically forecasted based on the current city’s fleet distribution and mat-ched with forecasts of the German national fleet.
• Parameter forecasts, which are the result of local phenomena such as the pop-ulation increase or decrease and the travel behaviour, are extracted from reportsor discussed in BAU-Scenario workshops with the city and have to be adjustedmanually. MS Excel-based tools are provided to help with the effects of crossassumptions.
• Parameters impacted by local politics, facilitated in projects, policy and regu-lation are discussed in BAU-Scenario workshops and have to be modelledupfront in an iterative process, using levers, to determine input parameters.
• Example: If the city started constructing a new metro line, it is modelled in thetransportation model and the resulting modal split in future years is used asinputs for the BAU-Scenario.
2.5 Target Setting
After the baseline is agreed in the form of a BAU scenario for the urban trans-portation system, the targets for different emissions at different target years are set.Carbon emission targets are commonly published, whereas air pollutant emissiontargets have to be retrieved from a separate process, converting limitations forconcentrations of air pollutants at hot spot measurement stations into emissiontargets for transport-related emissions.
2.6 Levers
In order to reach their emission reduction targets, cities need to take measures.These measures are modelled as scenarios in the transportation system model andare referred to as levers. The levers aim at reducing transportation demand, shiftingtransportation volume to less polluting modes (modal shift), shifting to other fuels,increasing the energy/carbon efficiency of one or several modes of transport oradding pollution control devices. The levers can be of different natures (see thefollowing list with examples):
• Technology based levers: advanced traffic light management• Policy based: the implementation of a low emission zone• A combination of policy and technology based: city tolling• Behaviour change: eco-efficient driver training• Generic: an X percent reduction of car use.
LCA in Strategic Decision Making for Long … 197

The levers are implemented in the model as scenarios, with a ramp up phase,followed by another phase where they constantly deliver benefits. The level ofpossible implementation is defined by an implementation rate and depends on thecurrent state and the maximum applicability. As an example: For the LeverAutomated train operation (ATO) metro, the current state is the share of metro linesthat have an ATO already and the maximum applicability would be 100% unlessthere are historic lines that shall keep human drivers.
The efficiency of each lever has to be quantified depending on the city specificconditions. And these conditions are assessed with individual parameters. In thecase of the ATO for metros, a simulation in FALKO [3] (a simulation tool for trainscheduling and simulation of energy consumption) was run for a typical metro lineto check which parameters have the most significant impact on energy consump-tion. It turned out that the distance between two consecutive stations has the mostsignificant correlation with the energy saving potential of an ATO. The citytransport system model is therefore fed with the average distance between stations.
All levers model relative changes and can be combined in scenarios, alsoreflecting impacts of one lever on another lever. Some levers address the samesaving potential and are therefore modelled combined in one process or on global/project level.
3 Results
The following section states first the results in terms of how appropriate andpractically feasible the above described methodology shows for the specific cause.Afterwards, the relevance of individual methodological aspects is illustrated in theform of actual modelling results from city projects.
3.1 Scope
The Scope of the model is in line with city’s requirements. Two large citiesrequested two separate analyses for their inner city and outer city. Three cities, twoof them in Scandinavian countries, requested the exclusion of Scope 3 GHGemissions in the energy upstream. Only one city in the south of Germany had Scope3 GHG emissions from the energy upstream in their carbon accounting (WTW). Allbut two cities could be convinced to include Scope 3 GHG emissions for thisrelative comparison between levers. It allows a better symmetry between systemsfor indicators that are only of relevance in their global context. Since the studies didnot aim to compare cities among each other, they did not have to fear an unfaircompetition.
It was a common request that for air pollutants, Scope 1 emissions should bereported individually. Especially traffic related urban emissions have a very high
198 F. A. Jaeger et al.
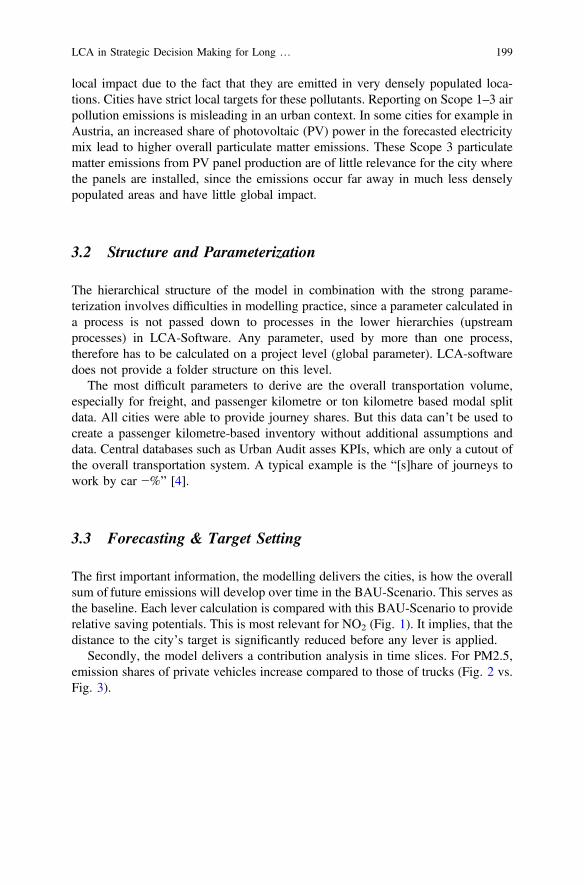
local impact due to the fact that they are emitted in very densely populated loca-tions. Cities have strict local targets for these pollutants. Reporting on Scope 1–3 airpollution emissions is misleading in an urban context. In some cities for example inAustria, an increased share of photovoltaic (PV) power in the forecasted electricitymix lead to higher overall particulate matter emissions. These Scope 3 particulatematter emissions from PV panel production are of little relevance for the city wherethe panels are installed, since the emissions occur far away in much less denselypopulated areas and have little global impact.
3.2 Structure and Parameterization
The hierarchical structure of the model in combination with the strong parame-terization involves difficulties in modelling practice, since a parameter calculated ina process is not passed down to processes in the lower hierarchies (upstreamprocesses) in LCA-Software. Any parameter, used by more than one process,therefore has to be calculated on a project level (global parameter). LCA-softwaredoes not provide a folder structure on this level.
The most difficult parameters to derive are the overall transportation volume,especially for freight, and passenger kilometre or ton kilometre based modal splitdata. All cities were able to provide journey shares. But this data can’t be used tocreate a passenger kilometre-based inventory without additional assumptions anddata. Central databases such as Urban Audit asses KPIs, which are only a cutout ofthe overall transportation system. A typical example is the “[s]hare of journeys towork by car −%” [4].
3.3 Forecasting & Target Setting
The first important information, the modelling delivers the cities, is how the overallsum of future emissions will develop over time in the BAU-Scenario. This serves asthe baseline. Each lever calculation is compared with this BAU-Scenario to providerelative saving potentials. This is most relevant for NO2 (Fig. 1). It implies, that thedistance to the city’s target is significantly reduced before any lever is applied.
Secondly, the model delivers a contribution analysis in time slices. For PM2.5,emission shares of private vehicles increase compared to those of trucks (Fig. 2 vs.Fig. 3).
LCA in Strategic Decision Making for Long … 199
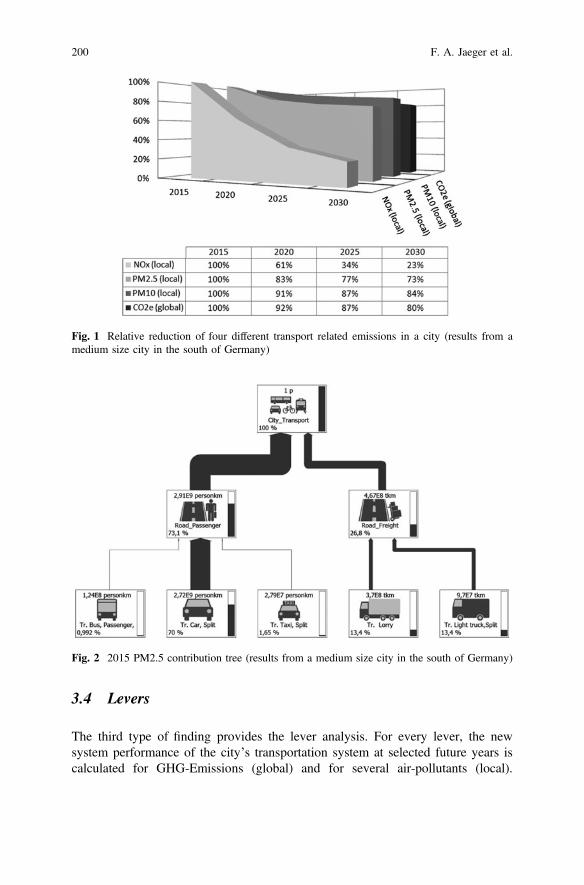
3.4 Levers
The third type of finding provides the lever analysis. For every lever, the newsystem performance of the city’s transportation system at selected future years iscalculated for GHG-Emissions (global) and for several air-pollutants (local).
Fig. 1 Relative reduction of four different transport related emissions in a city (results from amedium size city in the south of Germany)
Fig. 2 2015 PM2.5 contribution tree (results from a medium size city in the south of Germany)
200 F. A. Jaeger et al.
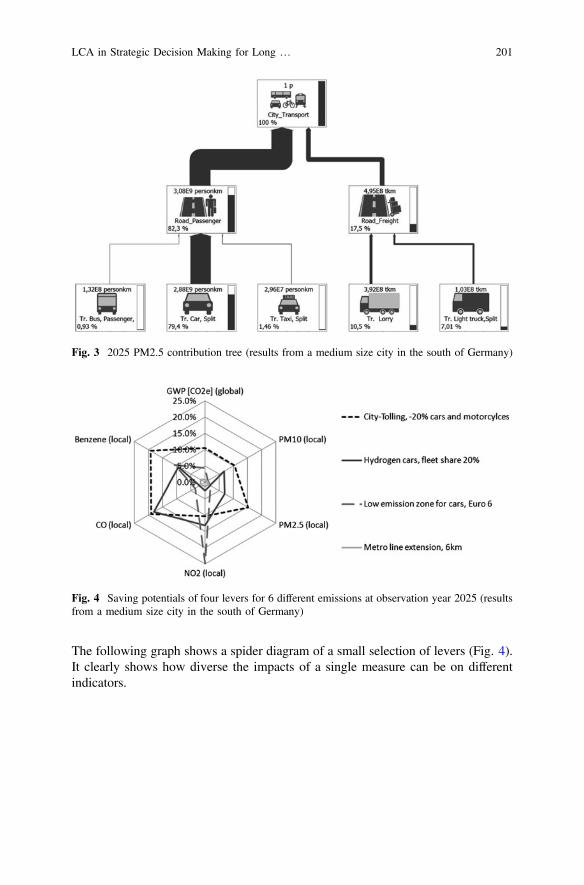
The following graph shows a spider diagram of a small selection of levers (Fig. 4).It clearly shows how diverse the impacts of a single measure can be on differentindicators.
Fig. 3 2025 PM2.5 contribution tree (results from a medium size city in the south of Germany)
Fig. 4 Saving potentials of four levers for 6 different emissions at observation year 2025 (resultsfrom a medium size city in the south of Germany)
LCA in Strategic Decision Making for Long … 201
4 Interpretation
4.1 Scope, Structure and Parameterization
The scope of the model must be flexible enough to adapt to any city’s carbonreporting guidelines or methodology. It creates trust in the model, if results turn outsimilar to what the city expects to see for a carbon baseline. Based on this trust,additional scopes can be included for lever comparison. Since the target of thismodel isn’t to compare cities, but levers within a city, the majority of all citiesshowed little reluctance to include additional scopes and therefore emissions.
The structural options of current LCA-Software provide limits to the complexityof models. Since parameters, calculated in one process can’t be passed down toprocesses of subordinate processes, any cross-functionality between processes hasto be modelled outside the processes on a project level, where it can’t be properlymanaged. Since processes of urban transportation systems influence each otherinherently, an increasing size of a model will eventually make it unmanageable inpractice.
The overall transportation volume in pkm or tkm is not a KPI that is tracked bymost cities. The determinations of the very basis of any urban transportation systembalance, therefore becomes a tedious process.
4.2 Forecasting and Target Setting
The bottom up forecasting, based on commonly available emission databases, thathave to be imported into the LCA-software, provide a good indication how emis-sions will develop in the future. For carbon, this is sufficient for target setting forlever selection and scenario definition, since carbon targets are expressed in annualemissions. For Air quality, it is a good indication, but hard to draw a final con-clusion. A distance to political target/threshold judgment can only be made incombination with a contribution analysis of an individual air pollution measurementstation, allowing an emission to concentration conversion. Some cities have thisavailable already [5].
The contribution analysis of different time slices identifies which transportationmode to address with levers at what time, to get the maximum benefit. As anexample: if a lever reduces the PM2.5 emissions of light trucks by 50%, the effectfor the overall transportation system related emissions will be almost twice as highin 2015 than in 2025 (see Figs. 2 and 3).
202 F. A. Jaeger et al.
4.3 Levers
The variety of measures that can be taken to improve an urban transportationinfrastructure is very broad. Therefore, the impacts differ significantly on the chosenset of indicators, making a wider set of KPIs recommendable as a decision basis.
5 Conclusion
LCA-Methodology and tools are suitable to assess the transportation systems of acity and provide strategic decisions relevant information about alternative futuredevelopments.
A model, which is flexibility in scope and can adapt to any city’s carbonaccounting, is crucial in order to match existing reporting at least during the vali-dation phase. This is true even if the final study later includes additional scopes. It ismuch easier and faster to check where differences are between the assessments. Inaddition, it allows the analysis of local effects such as air pollution.
Efficient model structuring and parameterization capabilities of LCA-softwarecould be significantly improved if processes were capable of passing on parametersto subsequent processes.
Forecasting is necessary, when assessing systems that quickly change propertieswhich effect target indicators and if the target is to compare systems that last long ortake long to build. Both are the case for urban transportation systems, especiallywhen focusing on air pollution. Otherwise absolute system emissions, as well asindividual process contributions, have a high inaccuracy and might lead to wrongdecisions.
The diversity in performance of a lever on different KPIs (Fig. 4) clearly showsthat making an infrastructure decision for sustainable urban transport requiresmulti-KPI-modelling. This is a strength of LCA-methodology and software.
To significantly improve the applicability of LCA for urban transportationsystems, KPI systems that cities report on should be adapted to assess indicatorswhich cover the system as a whole and not only segments and can be used to createinventories.
References
1. Fong W, Sotos M, Doust M, et al., The Global Protocol for Community-Scale Greenhouse GasEmission Inventories (GPC), 1st Ed., Greensouse Gas Protocol, 2014. < http://ghgprotocol.org/greenhouse-gas-protocol-accounting-reporting-standard-cities>, (Accessed 18.04.2017).
2. Keller M, Wuethrich P, Ickert L, Schmied M, Stutzer B, et al., Handbook Emission Factors forRoad Transport, 3.2 Ed., INFRAS AG, 25.7.2014.
LCA in Strategic Decision Making for Long … 203

3. Falko: Fahrplan-Konstruktion und -Validierung Optimierung betriebliche Planung undSteuerung, Siemens AG, 2007
4. Urban Audit, Eurostat, European Commission, 2016, < 2017http://appsso.eurostat.ec.europa.eu/nui/show.do?dataset=urb_ltran&lang=en>, (Accessed 17.05.2017).
5. Rusp A, Verursacheranalyse 2013 für NOX, NO2 und PM10 für den NürnbergerLÜB-Standort Von-der-Tann-Straße, TÜV, 2014
Open Access This chapter is licensed under the terms of the Creative Commons Attribution 4.0International License (http://creativecommons.org/licenses/by/4.0/), which permits use, sharing,adaptation, distribution and reproduction in any medium or format, as long as you give appropriatecredit to the original author(s) and the source, provide a link to the Creative Commons license andindicate if changes were made.The images or other third party material in this chapter are included in the chapter’s Creative
Commons license, unless indicated otherwise in a credit line to the material. If material is notincluded in the chapter’s Creative Commons license and your intended use is not permitted bystatutory regulation or exceeds the permitted use, you will need to obtain permission directly fromthe copyright holder.
204 F. A. Jaeger et al.
Management of Construction Waste:LCA and Complex System Modeling
Anne Ventura and Maxime Trocmé
Abstract Construction and demolition waste (CDW) generation, identified as apriority stream by the European Commission, accounts for approximately 25 to30% of all waste generated in the European Union. According to local specificities(e.g. regulations, waste management organization) best environmental options maydiffer for transforming waste into new resources. Five oral presentations were givenin the session which focused on innovative modelling initiatives combining LCAwith complex models in order to improve knowledge for more sustainable urbanconstruction waste management. During the discussions, all participants agreed thatre-use or recycling mass performance is a weak and unsufficient indicator forassessing waste management systems. There is an important need for better char-acterizing stocks and predicting nature and quality of output flows. Geospatializeddata combined with Material Flow Analysis was the methodology identified andused by the research community.
1 Introduction
Construction and demolition waste (CDW) generation, identified as a prioritystream by the European Commission, accounts for approximately 25–30% of allwaste generated in the European Union. Recent political consciousness about cir-cular economy has focused the spotlight on the construction sector, seen as a real
A. Ventura (&)Materials and Structures Department (MAST), Aggregates and MaterialsProcessing Laboratory (AMPL), IFSTTAR, Nantes, Francee-mail: [email protected]
A. VenturaGeM, Institut de Recherche En Génie Civil et Mécanique, CNRS UMR6183—Chaire Génie Civil Eco-Construction,Université de Nantes, Nantes, France
M. TrocméVinci Construction, Rueil-Malmaison, France
© The Author(s) 2018E. Benetto et al. (eds.), Designing Sustainable Technologies,Products and Policies, https://doi.org/10.1007/978-3-319-66981-6_23
205

opportunity to generate new resources and local employment based on urbanmining. Behind this will, many challenges arise. Indeed, reaching best environ-mental performances often relies on many interrelated aspects such as relationshipsbetween: territorial waste management, sorting practices and possible reuse orimprovements of recycled materials’ qualities; existing or innovative treatmenttechnologies, regulations and standards, and possible markets for future recycledproducts; disturbance of markets’ equilibrium by the introduction of recycledmaterials and possible avoided environmental impacts; environmental effects ofscale changing from small innovative experience to large territorial applications,etc. According to local specificities (e.g. regulations, waste management organi-zation) best environmental options may differ. Finding them is finding favorablecombinations of solutions all along the waste treatment chain for sustainable urbansystems, rather than ready-made preconceived ones. Introducing economic, tech-nological, or social mechanisms into LCA calculations provides knowledge that canbe adapted in various contexts.
Five oral presentations were given in the session which focused on innovativemodelling initiatives combining LCA with complex models in order to improveknowledge for more sustainable urban construction waste management.
2 Prospective and Regional Modelling of ConstructionMaterial Flows
The session started with a presentation from Niko Heeren [1] providing an over-view of a bottom-up dynamic MFA model he developped and applied forSwitzerland, and the relevance of construction material flows for the environmentalimpact of buildings. Future possible scenarios were compared and potentials forclosed loop recycling analysed [1]. The development is based on a GIS-basedbuilding stock model to determine material flow of the Swiss building stock. Bymerging a national building register with a three-dimensional dataset, it is possibleto quantify the material volumes for all residential buildings. In order to perform aprospective assessment, element and building service life are determined using astochastic approach. Therefore, the model accounts for the dynamics due to materialdwelling time. Life cycle assessment is used to assess the environmental impacts offuture material flow.
206 A. Ventura and M. Trocmé
3 Guidelines for Effective and Sustainable Recyclingof Construction and Demolition Waste
Serena Giorgi presented an analysis of actual re-use and recyling practices inEuropean countries [2]. Starting from a screening of current percentage of reuse andrecycling, types of waste and recycling destinations, as well as incentive policies inmember states of European Union-28, she explained that the objective of thedirective 2008/98/EC on waste that imposes a minimum of 70% re-use or recyclingby weight within 2020, can be easily reached or even already achieved by morethan half of European countries. Research data of the average material compositionof CDW percentage shows that 60–70% (by weight) is composed of concrete andmasonry, followed by minor percentages of asphalt, wood, metal, gypsum andplastic. Aggregates are therefore the largest amount of CDW. Based on these factsSerena Giorgi reported that since the Directive 2008/98/CE expresses the objectivein percentage of weight, it doesn’t value the best material to be recycled in terms ofeffectiveness and sustainability (e.g. recycling of plastic parts in Italy is only 21%),but heavier ones. Also she argued that there isn’t any assessment of the “quality” ofrecovery, i.e. differentiation between reuse, upcycling/downcycling or energyrecovery. In this way, it was found that in many countries, aggregates are mainlyrecycled for road foundations, earth works and backfilling. A further issue is theassessment of the effectiveness of recycling sustainability, especially for inertwaste. A study of the ecological balance of the concrete produced with recycledaggregates shows that there is a sharp increase of environmental impact, first due tothe increase of cement content used with recycled aggregates and second due to thetransport from supply points to the production facilities. Finally the speaker definedways to improve legislation and proposed some guidelines, aimed at making therecycling of CDW management more effective and sustainable through Life CycleManagement.
4 Adaptive Reuse of Buildings and Its Life CycleSustainability Benefits
Harn Wei Kua then presented a case study of primary school refurbishmentstrategies in Singapore, based on a life cycle based approach [3]. The environmentaland economic assessment was performed for alternate designs for school buildings,aiming at reducing the need or extent of future renovations and demolitions. Thisanalysis lead to design guidelines, in which alternate designs are compared in termsof potential net amount of C&D wastes that could be saved as well as net decreasein life cycle impacts and resources requirements. Also, for each alternate design, thepotential of each kind of generated C&D wastes for recycling or reuse, and the lifecycle costs of the buildings were estimated, as well as the social and cultural effectsof building preservation based on similar projects elsewhere in Singapore.
Management of Construction Waste: LCA … 207

Based on the life cycle sustainability values of adaptive reuse, policy strategieswere recommended to promote and incentivize this alternate design approach inSingapore.
5 Evaluating the Construction and Demolition WasteManagement System Implemented in Lombardy Region(Italy) Through Life Cycle Assessment
Among Italian regions, Lombardy was the largest producer of CDW in 2014, with arough equivalent of 1 ton of CDW per inhabitant during the year 2014. Hence, theestablishment of an effective and sustainable CDW management is essential toensure environmental protection and enhance waste valorisation towards aresource-efficient system. Lucia Rigamonti presented the results of the overallenvironmental performances of the CDW management system currently imple-mented in the region, based on LCA [4]. The quality of secondary productsobtained from CDW and their actual use has been considered. A focus has beenmade on the technical characteristics and the actual market of the recycled aggre-gates, allowing to estimate the type and amount of “avoided natural materials” thatcan be replaced by recycled products. The environmental benefits due to the“avoided impacts” have been calculated. Based on LCA results and a literaturestate-of-the-art of treatment technologies, alternative scenarios for CDW manage-ment strategies, innovative processes and/or alternative recovery solutions (i.e.“alternative scenarios”), have been defined. LCA results for the alternative sce-narios were compared to the results of the current situation to quantify the benefitsarising from the suggested improving actions. Results have been used to providerecommendations to the regional authorities to enhance the CDW recycling chain.
6 Alternatives for Materials from an End-of-Life Building,Evaluated with Life Cycle Costing and Life CycleAssessment
Valentina Prado-Lopez presented a study derived from the EU Horizon 2020HISER research and innovation program [5]. Two scenarios of demolition wastemanagement were compared, a ‘best practice’ (BP) and a ‘business as usual’(BAU) scenario, from an environmental and financial perspective. An integratedLife Cycle Costing and Life Cycle Assessment was performed to quantify andcompare the environmental implications and cost-effectiveness of the scenarios.The scenarios are based on field data collected in the BP demolition of a buildinglocated in Almere, the Netherlands. The BP alternatives favor the reuse of retrievedbuilding components and the upcycling of concrete rubble, over general recycling
208 A. Ventura and M. Trocmé
and final disposal. In the BP scenario, the reuse of ceiling tiles, wooden doors andstairs, gypsum walls, and metal beams are win-win situations, compared to thetreatments in the BAU scenario, which are more expensive and more pollutant. Inboth scenarios, the metal beams are the largest contributors to the environmentalburden. If metal beams are reused, the cost of onsite construction of a new buildingdrops dramatically. The overall BP scenario is cheaper than the BAU scenario. Asfurther recommendations, the impact of waste management of each material flowcan considerably decrease by shortening the transport distances. Selective dis-mantling and demolition, and the reuse of components should be promoted byincluding a phase prior to dismantling, in which reusable components and materialsare inventoried and potential buyers are contacted.
7 Conclusions
The whole session showed that the construction and demolition waste (C&D waste)management is a complex system to be modelled because several types of infor-mation must be considered and collected at different scales: at material, buildingand processes levels, defining the possibilities in terms of technical valorisation,and at regional level in order to consider regulations and urban planning policies.The temporal aspects are also crucial because today’s decisions on constructionengage consequences for the next 100 years, therefore with some potentialimportant repercussion for the waste management system despite its strong inertiato changes. All participants agreed that re-use or recycling mass performance is aweak and unsufficient indicator for assessing waste management systems. There isan important need for better characterizing stocks, to predict nature and quality ofoutput flows. Geospatialized data combined with Material Flow Analysis was themethodology identified and used by the research community. Predictions are basedon scenarios comparison, mainly comparing recycling technologies and possiblesubstituted materials. However, the link between sorting processes and quality ofoutput material is not enough investigated, and possible changes in building designmethods that are expected to avoid waste by favoring better adaptability ofbuildings should also be investigated. It should support the assessment of wasteprevention strategies efficiency. Finally, including economic market mechanisms,making the link with availability of material flows responding to the future mate-rials demand would also be relevant in the framework of the sustainable assessmentof C&D waste management.
Management of Construction Waste: LCA … 209
References
1. Heeren N, Hellweg S, Prospective and regional modelling of construction material flows,LCM2017 conference, Luxembourg, 2017.
2. Giorgi S, Lavagna M, Campioli A, Guidelines for effective and sustainable recycling ofconstruction and demolition waste, LCM2017 conference, Luxembourg, 2017.
3. Kua H.W, Adaptive reuse of buildings and its life cycle sustainability benefits, LCM2017conference, Luxembourg, 2017.
4. Rigamonti L, Pantini S, Evaluating the construction and demolition waste management systemimplemented in Lombardy Region (Italy) through Life Cycle Assessment, LCM2017conference, Luxembourg, 2017.
5. Miranda-Xicotencatln B, Ita-Nagy D, Hu M, Prado-Lopez V, Alternatives for materials froman end-of-life building, evaluated with Life Cycle Costing and Life Cycle Assessment,LCM2017 conference, Luxembourg, 2017.
Open Access This chapter is licensed under the terms of the Creative Commons Attribution 4.0International License (http://creativecommons.org/licenses/by/4.0/), which permits use, sharing,adaptation, distribution and reproduction in any medium or format, as long as you give appropriatecredit to the original author(s) and the source, provide a link to the Creative Commons license andindicate if changes were made.The images or other third party material in this chapter are included in the chapter’s Creative
Commons license, unless indicated otherwise in a credit line to the material. If material is notincluded in the chapter’s Creative Commons license and your intended use is not permitted bystatutory regulation or exceeds the permitted use, you will need to obtain permission directly fromthe copyright holder.
210 A. Ventura and M. Trocmé

Guidelines for Effective and SustainableRecycling of Constructionand Demolition Waste
Serena Giorgi, Monica Lavagna and Andrea Campioli
Abstract Directive 2008/98/EC on waste (WFD) provides that, within 2020, thepreparing for re-use and recycling of non-hazardous construction and demolitionwaste shall be increased to a minimum of 70% by weight. Beginning from ascreening of the current percentage of reuse and recycling, type of recycling (typesof waste and destinations) and incentive policies in Member States of EuropeanUnion-28, the research aims to evaluate the effectiveness of the Directive andpossible ways of improvement through a Life Cycle based approach. In this paperthe incentive policies and some critical issues regarding current regulations areanalysed. Further ways to improve legislation are proposed as well as guidelines,which would have an effect on a local level and are aimed at making the recyclingof CDW management more effective and sustainable through Life CycleManagement.
1 Introduction
Construction and demolition waste is receiving more attention recently followingnew circular economy policies [1, 2]. Action plans primarily move towardsreduction of waste by recycling, promoting the by-products exchange amongcompanies and supporting digital technology platforms in order to stimulate busi-ness opportunities. In this situation, the Waste Framework Directive (2008/98/EC)[3] regains a vital role. It establishes the waste hierarchy, defines the meaning ofby-product and the consequent cessation of waste classification. Furthermore, theWFD sets the target for reuse and recycling of non-hazardous construction anddemolition waste by 70% in terms of weight, within 2020. In order to define themain critical aspect of the Directive, it is important to highlight that the Article 11set out, does not include stone and soil. Moreover the percentage of recyclingincludes backfilling operations, which use waste to substitute other material.
S. Giorgi (&) � M. Lavagna � A. CampioliABC Department, Politecnico Di Milano, Milan, Italye-mail: [email protected]
© The Author(s) 2018E. Benetto et al. (eds.), Designing Sustainable Technologies,Products and Policies, https://doi.org/10.1007/978-3-319-66981-6_24
211
In the following section, at first, limitations in the statistical database are shown,causing difficulties in monitoring waste management. In spite of the diversity ofdata, in the second section, this paper gives an overall review of the amount ofconstruction and demolition waste in EU-28 and the material composition of waste,based on the more recent available statistical data, such as Eurostat data. Then, thethird part analyses Member States’ recycling and recovery rates. This information isbased on data provided by Bio Intelligence Services investigations [4] and theresearch “Resource Efficient Use of Mixed Waste” [5]. These sources give artic-ulated data and information already analysed and corrected, in comparison withEurostat data that are not so much detailed. Moreover, the destination of waste inrecycling processes is analysed. The fourth section analyses policies and incentivesof some Member State, with regards to legislative instrument and non-legislativeinstrument. Finally, in the last section, this paper discusses the main strategies toimprove the effect of WDF in order to make it more effective and sustainable withinthe circular economy vision. The application of Life Cycle Management is thestrategy toward sustainability.
2 Sources and Data Quality on CDW
In the countries of EU-28, to manage waste recycling and reuse, it’s necessary toknow CDW flows, but the first critical issue is that it isn’t monitored well. Indeed,in the reports published by European Commission and each Member State [4, 5]and in statistical data (e.g. Eurostat, ISPRA, etc.), it has been always reported thatthe data based on waste flow is uncertain and sometimes needs adjustments andestimations. For example, in Italy, data collection is difficult: the national produc-tion of special waste has been quantified from the information contained in theMUD statements (Modello Unico di Dichiarazione ambientale), specifically thedata presented in the ISPRA Report [7]. It should be noted that Legislative Decree152/2006 provides for several exemptions from the obligation to declare, therefore,MUD database processing cannot provide complete information on the productionof waste [6]. In addition, the reprehensible practice of the abandonment of waste isnot possible to estimate. Production data must therefore be correctly estimated andthis constitutes a major limitation of the analysis [7].
Another limit of the available data is that construction part and demolition partare not separated, even if demolition waste stream is larger by weight than con-struction waste stream, they are different. Construction waste (originated from newconstruction) is less mixed, less contaminated and its recovery potential is higherthan demolition waste because of these characteristics. Demolition waste stream ismore contaminated (with painting, adhesives etc.) and more mixed due to theintegration of different elements. Furthermore, there is very little information onwaste material type. CDW are composed by different quantities of concrete,cement, bricks, gypsum products (e.g. plasterboard, building plaster and gypsumblock), ceramic products (e.g. tiles and consumer products), glass and asphalt, each
212 S. Giorgi et al.

one with different recycling potential. Finally, the inclusion of excavated materialdoes not seem to be systematic in national reporting. As this flow represents a bigquantity in respect of the total amount in construction, demolition and excavationwaste (e.g. 80% in France): uncertainty about their inclusion in national CDWstatistic is a major source of doubt in the data on CDW. Data limitations make itdifficult and complex to compare the amount of waste made by the Member States,and it is the first obstacle to identify efficient waste management.
3 Amount of Waste and Material Composition of Waste
The most recent data regarding the amount of waste production in EU-28 and eachMember States, is represented by Eurostat Data (Construction—Code F—thatincludes general construction and specialized construction activities for buildingsand civil engineering works). According to the statistical data in EU-28, con-struction is the main activity that produces waste, contributing to 33.5% of the totalwaste generated by all economic activities and households in 2014 in the EU-28.The construction sector creates the biggest amount of waste followed by mining andquarrying (29.8%), manufacturing (9.8%), households (8.1%) and energy (3.7%)and other economic activities (15%) mainly including waste and water services andservices [8]. It is important to highlight that the value specified for the constructionsector includes the quantity of soil. On a European level, the 98% of CDW isnon-hazardous waste, that represents the percentage pointed out by WFD.
By observing the statistical data from Eurostat (Fig. 1), there are big differencesin total CDW yearly produced among the Member States: France (224 milliontons), Germany (199 million tons) and United Kingdom (119 million tons) are themajor producers of CDW, followed by Netherland (88 million tons) and Italy(51 million tons). Greece (479 thousand tons), Latvia (453 thousand tons) andLithuania (425 thousand tons) are the minor producers.
From the total CDW generated, 51% is divided into soil waste and 32% mineralwaste. Metal waste is almost 2%, and wood waste around 1%. Other types of waste(such as glass, paper and cardboard, rubber wastes) are less than 1%. The 13%missing from the total CDW represents heterogeneous, mixed and undifferentiatedwastes. By making a comparison with other research data, it is shown that whenexcluding the soil portion, 60–70% (by weight) of CDW is composed of concreteand masonry, followed by minor percentages of asphalt, wood, metal, gypsum andplastic [4]. Aggregates, therefore, are the largest amount of CDW. Asphalt con-stitutes another major share of the stream but it is usually treated separately, as thisfraction is largely collected unmixed with other CDW and it is often recoveredimmediately on-site.
Guidelines for Effective and Sustainable … 213
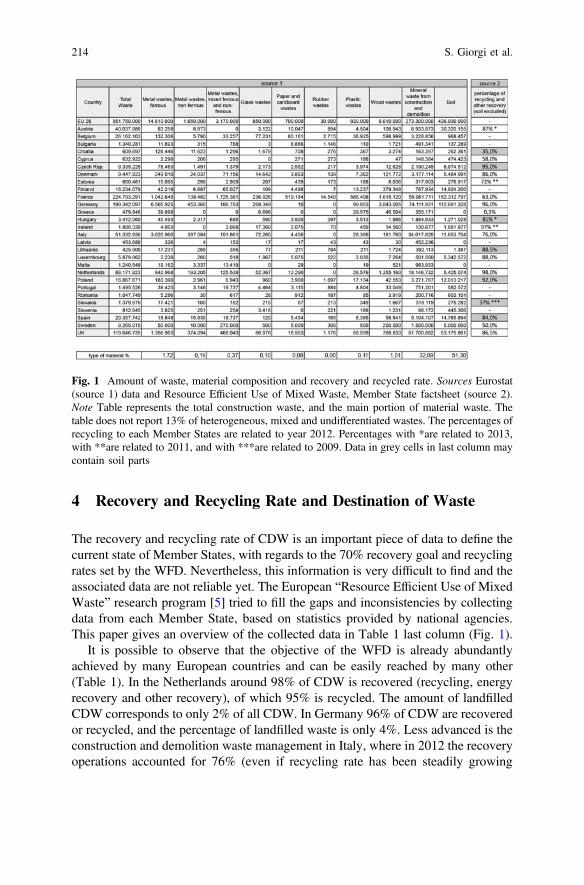
4 Recovery and Recycling Rate and Destination of Waste
The recovery and recycling rate of CDW is an important piece of data to define thecurrent state of Member States, with regards to the 70% recovery goal and recyclingrates set by the WFD. Nevertheless, this information is very difficult to find and theassociated data are not reliable yet. The European “Resource Efficient Use of MixedWaste” research program [5] tried to fill the gaps and inconsistencies by collectingdata from each Member State, based on statistics provided by national agencies.This paper gives an overview of the collected data in Table 1 last column (Fig. 1).
It is possible to observe that the objective of the WFD is already abundantlyachieved by many European countries and can be easily reached by many other(Table 1). In the Netherlands around 98% of CDW is recovered (recycling, energyrecovery and other recovery), of which 95% is recycled. The amount of landfilledCDW corresponds to only 2% of all CDW. In Germany 96% of CDW are recoveredor recycled, and the percentage of landfilled waste is only 4%. Less advanced is theconstruction and demolition waste management in Italy, where in 2012 the recoveryoperations accounted for 76% (even if recycling rate has been steadily growing
Fig. 1 Amount of waste, material composition and recovery and recycled rate. Sources Eurostat(source 1) data and Resource Efficient Use of Mixed Waste, Member State factsheet (source 2).Note Table represents the total construction waste, and the main portion of material waste. Thetable does not report 13% of heterogeneous, mixed and undifferentiated wastes. The percentages ofrecycling to each Member States are related to year 2012. Percentages with *are related to 2013,with **are related to 2011, and with ***are related to 2009. Data in grey cells in last column maycontain soil parts
214 S. Giorgi et al.
from 2010, when it stood at 68.4%) and landfilling remains 24% (however,recovered is over than 70%). However, according to WFD, the recycling rateincludes reuse, recycling (and other forms of material recovery), as well asbackfilling.
Moreover, there are still differences in national calculations: some countries’percentage still contains soil; others do not distinguish between hazardous andnon-hazardous CDW and consider total amount. One other main point is the des-tination of waste recycled to understand if the practices follow measures to promotehigh quality recycling, as promoted by WFD.
An important overview of the trade market of CDW and hence the destination ofwaste is given by the final report of European Commission, written by IDEAConsult [9]. This report shows the general situation of waste trade in the EU, inparticular the main stream of mineral waste, completed on collected data from manysources (Eurostat 2010, Koumpanis 2008, EAPA 2010, ANPAR 2011, UEPG2014). The 10% of waste is from new construction, 75% from demolition and 15%from road construction. The IDEA Consult report [9] demonstrates that after col-lection, around 11% of CDW is sent to backfilling, and 18% is brought to a landfill.The remaining 71% is separated into different materials. Metal, plastic and wood,which are a small percentage with respect to the total amount, come out of theprocess as recyclable material or energy recoverable. The remaining big amount ofinert is recycled (on-site, in order to produce secondary aggregates that are usedagain in the production of new construction materials, or off-site in stationaryrecycling plants, where it is separated and crushed) or, when the waste is notcontaminated, it is reused, after the cleaning or transforming operation. The 71%includes either reused, recycling, recovery and backfilling activities, such as the useof recycled aggregates (secondary material) to restore mining works. The secondarymaterial goes to the industries in a small portion and the remaining goes to thebackfilling (the percentage is unknown).
Concrete, masonry, and mixed demolition debris, after crushing (and certifyingthe quality) become recycled aggregates, constituting: Recycled ConcreteAggregates (with a large concrete content), Recycled Masonry Aggregates (with alarge bricks and mortar content) or Mixed Recycled Aggregates [10].
All of the recycled aggregates types can be used as low performance applicationin sub-base layers in roads, ground improvements and building foundations.Aggregate use in concrete production requires high density and cleaner fraction,and the use of recycled aggregates in asphalt is limited due to mechanical char-acteristics, as regulated by standards (e.g. EN 12,620, Aggregates for concrete; EN13,043 Aggregate for bituminous mixtures and surface treatments for roads, air-fields and other trafficked areas). In fact, in civil construction and industrial product(such as gypsum, concrete, ceramic and bricks productions) only 6% of materialused is from recycled material, while 94% come from virgin materials [9]. It ispossible to understand that the major applications of recycling aggregate aredowncycling. This issue is also favoured by the fact that in most countries theproduction of natural aggregates dominates [9]. In the Flemish Region, the mainCDW are recycled granulates, mainly used for road construction and similar
Guidelines for Effective and Sustainable … 215
activities. In Italy, ANPAR (National Association of Recycled Aggregates) reportsthe recovery percentages about the portion of recycled aggregates: these secondarymaterials are widely used in roadworks for substrates and fillings (almost 60% ofthe total recycled in 2013); the remaining is used for pavements and backfilling[11]. In Italy the use of recycled aggregates into new concrete production is notwidely practiced, due to the regulations (DM January 14, 2008). This regulationindicates the maximum percentage use of recycled aggregates into new concrete,compared to “concrete strength classes”. For example, concrete class C30/37 allowsa maximum 30% of inert derived from concrete or reinforced concrete waste.Buildings demolition rubble are only allowed for non-structural concrete C8/10[12]. In addition, the regulation imposes mandatory laboratory tests about aggre-gates compliance. Through interviews obtained, ANCE (National Association ofBuilders) states that the tests are too expensive and require too much time.
Price is another point that obstructs the use of secondary materials in newindustrial products. A defining factor is transport costs. Secondary materials are, ingeneral, not much cheaper than primary resources and can even be more expensive.The distances among natural aggregates buyers, suppliers, sellers and consumercannot be too large. Interviews evidence that the costs of transport could double forevery additional 30 kilometres travelled [9]. As a result, this characteristic makesthe markets for mineral CDW very local.
5 Policies and Incentives
Waste prevention and sustainable recovery strategy is achieved through a definedlegislative framework, favouring conditions for a sustainable management of CDWamong operators and consumers (designers, planning supervisors, public adminis-tration, construction companies). Overall policies that incentive the recycling andrecovery rate growth are related to waste disposal (landfill taxes) and exploitation ofnatural resources reduction (aggregates levies or taxes). Each of these actions canenhance price differences between recycled materials and virgin materials, towardsthe economic attractiveness of secondary materials. The largest obstacles for recy-cling CDW is cheap availability of low cost raw materials. Therefore, there is not alarge economic incentive for business. A solution could be to increase (throughtaxation) the price of rawmaterial goods [13]. Aggregates levies or taxes is consideredmore effective tomake economically advantageous secondarymaterials. It concerns adirect relationwith the price of virgin aggregates, instead landfill taxes could implicateillegal disposal risks [12]. Thefinal report of Bio Intelligence Service [14] provides anoverview between the CDW tax rate and the percentage of CDW recycled. It showsthat there is no significant relationship between the tax rate and the amount of wasterecycled. To reduce significantly illegal traffic, Belgium (Flanders) introduced amandatory pre-demolition inventory of the types/quantities of materials present in
216 S. Giorgi et al.
buildings (for non-residential buildings with an enclosed volume over 1000 m3) toidentify hazardous and other waste fractions [15].
To explore other main guidelines to incentive the recycling percentage, it isinteresting to analyse the countries that have the highest percentage of recycling,based on the country screening factsheet of the research “Resource Efficient Use ofMixed Waste”. Analysing Germany and The Netherland’s policies, it is noted thatboth countries had waste regulation before the WDF.
Germany took the initiative in 1996 through a voluntary commitment to cut inhalf the amounts of CDW landfilled. The high recycling rates were achievedalthough there is no national ban on landfilling of CDW material. The initiative“Kreislaufwirtschaft Bau” (Circular Economy in Building) has been documentingmineral construction and demolition waste arising and treatment since 1995, settingwaste reduction targets. It can be seen as one of the main reasons for the highrecovery rates that are observed today (96%).
With regard to The Netherlands, since January 1st, 1994, the Dutch legislationon waste can be found primarily in the Environmental Management Act (WetMilieubeheer; Wm), which already sets the waste hierarchy (used before the WFD).However, a large number of issues was not in the law itself, but was regulated atlocal level: provincial environmental regulations or municipal waste regulations(such as landfills and waste bans).
Furthermore, these countries have many legislative instruments that follow theWFD. In Germany the Ordinance on the Management of Municipal Wastes(Gewerbeabfallverordnung) contains national obligations for selective demolition.It defines on a national level, separation and requirements regarding thepre-treatment of CDW.
In The Netherland, in order to implement Directive 2008/98, the Minister of theEnvironment submitted a proposal in 2010 to amend the Environmental ProtectionAct (Wm), the Law on environmental taxes and the Law on economic offenses.
The main strategies present in the countries with high level of recycling, (dif-ferently to country with low level of recycling) are non-legislative instruments.They contribute to create good conditions for the management of CDW recycling.In Germany several municipalities already integrate the preferred use of recycledconstruction material in their calls for tenders (even if this is not a standard).Demolition has to be performed by authorized companies, which need to be cer-tified (Regional level). Moreover, different regional standards for recycled CDWexist and are defined in the respective waste management plans. In Germany,Sustainable Building Certificate is an important driver. A voluntary scheme run bythe German Sustainable Building Council (DGNB) encourages the practice ofrecycling. It sets particular criteria regarding CDW.
Also in The Netherland, the role of non-legislative instruments is strong.Relating to pre-demolition audits, it is mandatory to have a demolition license forevery demolition with more than 10 m3 of waste (Model Bouwverordening MBV).Selective demolition (Kaderrichtlijn Afvalstoffen) companies must be registered inorder to carry, collecting or trade waste. Moreover, a “passport” for buildings wasdeveloped which contains what substances are in the materials of the building.
Guidelines for Effective and Sustainable … 217
Tools are used to understand what is possible to do in construction and demolitionin order to be sustainable. Eventually it leads to obtaining the BREEAM certificate.The Netherlands promotes initiatives focused on trying to get the quality of reusableconcrete as high as possible and offering sustainable wood.
In Italy, there is the legislative instrument Decree 205/2010 as implementation ofWFD. In legislative framework the drive of Green Public Procurement (GPP)requirements, that incentive waste recovery, has important role. Indeed, the use ofrecycled materials becomes mandatory and strategic in the assignment of the tender.The project must contain second raw materials, at least 15% by weight on allmaterials used (with 5% in non-structural materials). This percentage must bedocumented. Moreover GPP requirements promotes the application ofEnvironmental Product Declaration. Instead, non-legislative instruments (such aspre-demolition audit, demolition license etc.) are not so much promoted.
Overall, in countries where non-legislative instruments are not highly used, therecycling percentage is low.
6 Guidelines for Sustainable Strategies
Given that the Directive 2008/98/CE shows the percentage in weight, and the 60–70% (by weight) of CDW is composed of concrete and masonry, as a result thedirective target is achieved in the majority of Member States. Indeed, as a result, itwas found that in many countries, the target is achieved through the recycling ofaggregates for road foundations, earth works and backfilling, even if these worksare not “high quality recycling” as required by Article 11 of WFD (and resulting ina loss of economic value of inert).
To achieve a sustainable recycling management, it is important to considermaterial recycling with the approach of Life Cycle Management, as an integratedapproach, based on technology and process defined considering LCA and LCCresults.
This approach can be useful to support the waste hierarchy of WFD, to make adecision about the best way to reuse, recycle or dispose waste materials. It is clearthat since the CDW has high “embodied” environmental impacts (in terms of theinvestment done to produce what turn into waste), the re-use or recycling caneliminate the need for further investment in primary production [16]. Obviouslyprevention is often the best possible solution for the environment avoiding thereplacement and prolonging the service life of components.
A life cycle approach is important to move towards an upcycling of waste, toimprove the economy and creating an effective sustainable market.
To make CDW recycling management more effective and sustainable it isimportant to apply a LCT in non-legislative instruments.
The objective of this paper is to suggest sustainable guidelines to improve workof legislative operators, and local authority action. Following, the main important
218 S. Giorgi et al.

point made by analysing the best practice and the application of Life Cycleapproach.
Regarding legislative improvements, it is important to suggest:
(1) to look at quality rather than quantity: value the best material to be recycled interms of effectiveness and sustainability, not heavier ones; through the sepa-ration of recycling targets (percentage well-defined for every type of wastematerial) related to the quality target;
(2) to improve the waste hierarchy: support decisions of the type of recovery withan assessment of quality of recovery, in term of environmental and economicalsustainability (support by LCA and LCC). As well as to promote upcyclingdirections;
(3) to reassess the inclusion of some actions considered in the percentage (70%) ofrecycling rate: “backfilling” (is a low quality recycling) and “preparing forre-use” (this is only storage of material to check, clean or for repair recoveryoperations, until the real recovery stage).
With regard to non-legislative action of local authorities, that is useful toimprove the sustainable local waste management, they should follow theseguidelines:
(1) to improve selective demolition, which helps prepare for the reuse process;(2) to use restrictive pre-demolition audit in order to have the information about the
consistency and quality of material; to evaluate the environmental impact withLCA and the market opportunities with LCC approach before deconstruct abuilding. This information is important to make a decision of end-of-life stage,to drive resource efficiency and effectiveness of refurbishment and demolitionprojects. Thus preventing unnecessary waste and maximizing the value andsustainable use of construction and demolition waste;
(3) to use mandatory building passport and material passport (for new construc-tion): encouraging the use of Environmental Product Declaration (EPD) inorder to facilitate the assessment of construction products and material sus-tainability, promoting recycled material. One of the current problems is the highapplication of composite materials (not recyclable at end-of-life) used due totheir high thermal performance in energy-efficient buildings or due to theirrecycled content.
(4) to apply mandatory environmental criteria in GPP on waste management: toimprove waste recovery and sustainability of buildings through buildingbenchmark LCA based in the assignment of public procurements.
To overcome the obstacles created by the lack of consumer and operatorawareness is fundamental:
(1) to increase skills and knowledge: to eliminate the lack of confidence in thequality of materials from recycled construction and demolition waste;
(2) to support professional training of the operators within the demolition sector;
Guidelines for Effective and Sustainable … 219
(3) to use environmental labelling of recycled (and non-recycled) products toencourage awareness and stimulate a sustainable waste market.
7 Conclusion
In this paper, an analysis of CDW recycling and recovery was conducted, with theobjective to find possible applications of a life cycle approach in support to recy-cling practices policies. The first obstacle to a sustainable waste flow managementis the gaps in the database for monitoring CDW quantities. CDW is the main streamof waste in EU-28, and almost 60% of the weight is composed of concrete andmasonry materials. It is possible to observe that many countries have alreadyabundantly achieved the target set by WFD of 70% recycled waste. The mainrecycling practice focuses on inert waste. It is used as low performance application(downcycling) of sub-base layers in roads and backfilling, since aggregate is used innew concrete production or asphalt it requires high performance (following stan-dard regulations).
Regarding the policies and incentives of some Member States, the analysisshows that the most exemplary countries have many legislative instruments andmany non-legislative instruments (e.g. criteria in public tenders). Non-legislativeinstruments play a crucial role in the waste management target. The Life Cycleapproach is needed in order to set more effective, for the environment, and morecost-efficient, for stakeholders, policy targets. Policies at regional level should beencouraged to move towards a Life Cycle Management, therefore achieving asustainable management of waste within a new definition of circular economy.
References
1. European Commission, COM 398 Towards a circular economy: A zero waste programme forEurope. Brussels, 2014.
2. European Commission, COM 614 Closing the loop—An EU action plan for the CircularEconomy. Brussels, 2015.
3. Directive 2008/98/EC on waste (Waste Framework Directive). Official Journal of theEuropean Union. L 312/3.
4. Bio Intelligence Service, Service Contract on management of construction and demolitionwaste SR1, 2011.
5. Member State, Resource Efficient Use of Mixed Waste, CDW Factsheet Final, 2015.6. Pantini S, Rigamonti L, Evaluation of the mass balance of the construction and demolition
waste management system in Lombardy Region (Italy), CRETE 2016 ConferenceProceedings, 2016.
7. ISPRA, L’Italia del Riciclo, 2013, pp. 196–177.8. Eurostat, Key figures on Europe, Belgium, 2016, pp. 161–164.9. IDEA Consult (lead partner), Analysis of certain waste streams and the potential of Industrial
Symbiosis to promote waste as a resource for EU Industry, Final Report, Brussels, 2015.
220 S. Giorgi et al.

10. Silva R.V, De Brito J, Dhir R.K, Properties and composition of recycled aggregates fromconstruction and demolition waste suitable for concrete production, Construction andBuilding Materials, 65, 2014, pp. 201–217.
11. ISPRA, L’Italia del Riciclo, 2014, pp. 176–185.12. Moriconi G. Aggregati riciclati nel calcestruzzo: le Norme, l’evoluzione in Italia e in Europa e
i pregiudizi da superare, in Concreto, December, 2013, pp. 1–8.13. [13] Dahlbo H., Bachér J., Lahtinen K. et al., Construction and demolition waste
management: a holistic evaluation of environmental performance, Journal of CleanerProduction, 107, 2015, pp. 333–341.
14. Bio Intelligence Service, Use of Economic Instruments and Waste ManagementPerformances, Final Report, 2012.
15. Resource Efficient Use of Mixed Waste, Minutes of the workshop—Task 5, Improvingmanagement of construction and demolition waste, 2016.
16. JRC, Supporting Environmentally Sound Decisions for Construction and Demolition (C&D)Waste Management, European Union, 2011.
Open Access This chapter is licensed under the terms of the Creative Commons Attribution 4.0International License (http://creativecommons.org/licenses/by/4.0/), which permits use, sharing,adaptation, distribution and reproduction in any medium or format, as long as you give appropriatecredit to the original author(s) and the source, provide a link to the Creative Commons license andindicate if changes were made.The images or other third party material in this chapter are included in the chapter’s Creative
Commons license, unless indicated otherwise in a credit line to the material. If material is notincluded in the chapter’s Creative Commons license and your intended use is not permitted bystatutory regulation or exceeds the permitted use, you will need to obtain permission directly fromthe copyright holder.
Guidelines for Effective and Sustainable … 221

Environmental Assessment of EnergyRelated Products and Energy SystemsAcross Their Life Cycle
N. Espinosa and Y. J. Suh
Abstract In a global context, where several international and national policiesattempt to define strategic energy plans that address environmental sustainability, itis necessary to adopt a holistic perspective. In this session, we want to stimulateinputs on how Life Cycle Assessment (LCA) models can capture the complexmanagement challenges in the whole energy sector. In that sense, the varioussectors related to energy (namely heat, power, etc.) will become more interrelated,which will be challenging to deal with in Life Cycle Management (LCM). The nextdecades, LCM modelling of energy systems will have to be quite innovative inorder to create realistic models. Furthermore, if LCA wants to do real LCM, themethodology should be widened to e.g. include long-term environmentalimplications.
1 Introduction
In the global energy context, where several international and national policiesattempt to define strategic energy plans that address environmental sustainability, itis necessary to adopt a holistic perspective.
A comprehensive quantification of environmental impacts in the energy sectorcan be done by means of Life Cycle Assessment (LCA). Current developments inenergy systems and energy products are limited in their scopes with strong focus ongreenhouse gas accountings with disregard for other environmental problems likethe impacts of chemical pollution and particulate matters on human health andecosystems. The session aims to address the importance of rooting environmentalsustainability assessments with broad impact coverage into energy planning to
N. Espinosa (&)European Commission, Joint Research Centre, Inca Garcilaso s/n,41092 Seville, Spaine-mail: [email protected]
Y. J. SuhSamsung Electronics Co., Ltd., Suwon, Korea
© The Author(s) 2018E. Benetto et al. (eds.), Designing Sustainable Technologies,Products and Policies, https://doi.org/10.1007/978-3-319-66981-6_25
223
prevent or minimise problem shifting and ensure an environmentally-sound energytransition.
Other than environmental factors such as costs, politics, regional interdepen-dencies, risks, or social issues, an energy transition will have to be furthermoreaddressed in true Life Cycle Management (LCM) models of future energy supply.
The topics included in the session were the following:
• How to address emerging energy technologies in LCA, e.g. carbon capture andstorage (CCS), etc.
• Integration of the ecodesign directive in energy-related products andtechnologies
• Inclusion of foresight and dynamic aspects in applications of LCA to energysystems
• Barriers and solutions in application of LCA to energy systems, e.g. modellingchallenges such as temporal and geographical resolution versus data availabilityand level of detail of results needed
• Handling of bioenergy (poses specific methodological challenges, e.g. iLUC)• Relevance of transportation in LCA energy systems
The objective of the session was to discuss and advance the implementation ofLife Cycle approach and Circular Economy along the businesses value chain,supporting environmental, social and economic sustainability related to the devel-opment of industrial technologies, products, services and policies.
The session was proposed in synergy with a parallel session conducted at theLCM 2017 conference on LCM of energy and energy transitions. In this session, wewanted to stimulate inputs on how LCA models can capture the complex man-agement challenges in the whole energy sector. In that sense, the various sectorsrelated to energy (namely heat, power, etc.) have become more interrelated, whichwill be challenging to deal with in LCM. Therefore, the next decades, LCMmodelling of energy systems will have to be quite innovative in order to createrealistic models. Furthermore, if LCA wants to do real LCM, the methodologyshould be widened to e.g. include long-term environmental implications.
2 Summary of the Session Presentations
The session proposed had the aim to highlight the importance of rooting environ-mental sustainability assessments with broad impact coverage into energy planning.
The presentations had in general an outstanding quality. Data availability andlevel of detail of results needed was a topic proposed. Life cycle inventories of goodquality are essential to conduct any study and there were a number of presentationsdealing with that topic.
Oberschelp et al. [1] deal in their work with other case of data availability: theemission of particulate matter from the production of electricity in China. A detailed
224 N. Espinosa and Y. J. Suh
inventory for Chinese power production from fossil fuels was developed andcombined with characterization factors for Chinese particulate matter emissionimpacts.
Moreover, the geographical resolution of the data may indeed reveal big dif-ferences in environmental impacts of energy production, and this is preciselypresented in a contribution targeting the LCI data for electricity production atsmaller geographic regions of both China and India by Levova et al. [2]
The full coverage of impacts and the comprehensiveness of LCA for energysystems were two topics dealt with in the work presented by Chatzsisideris et al. [3]about quantifying the importance of comprehensive life cycle and impact coveragefor photovoltaic systems.
In the same field, the PV systems, Weyand et al. [4] show in their work for aportable solar charger how consequential LCA modelling can extend the boundariesto consider indirect impacts associated with the materials and energy use and thefunction the product delivers, which has so far been neglected in assessment effortsfor an emerging technology such as organic photovoltaics.
The LCA study of a mobile phone charger incorporating 20% recycled plasticmade by Heo et al. from Samsung Electronics [5], covers each life cycle stageincluding pre-manufacturing, manufacturing, use and disposal phase. The studyshows that the use phase is the most significant life cycle stage due to the impact onglobal warming resulting from charging the phone.
For a sustainable production of plastics Himmelreich [6] illustrates the devel-opment of CO2 based plastics and the implementation into consumer products aswell as discuss the influence of different CO2 sources and their impact dependent onthe valuation method for CO2.
Van Nieuwenhuyse et al. [7] propose a work related to resource efficiency andthe development of extended producer responsibility schemes that are fostering thedevelopment of updated and accurate Life Cycle Inventories (LCI) data onend-of-life operations. A consortium of companies have joint efforts to develop aLCI database of Waste Electrical and Electronic Equipment (WEEE).
About the usage of energy consuming product, Heslouin et al. [8] propose toimprove the modelling of the use scenario to improve the environmental footprint.The challenge here is the data availability to model specific scenarios for each usecase.
Improving energy efficiency is one of the main topics of the European 2020strategy [9]. The building sector consumes 40% of the total energy whereby the majorpart is being used for space heating where the energy is quickly lost to the environ-ment. This loss could be significantly counterbalanced in the future by the develop-ment of multi-functional energy-efficient windows or façades, designed to produceenergy from sunlight and to store heating energy. New energy efficient window designaccompanying LCA (and cost considerations) are proposed to be integrated in theoverall development process right from the start by Schmidt et al. [10].
Environmental Assessment of Energy Related Products … 225

3 Analysis and Outcomes of the Session
The problem of particulate matter impacts from energy production in China had notbeen assessed on a high regional resolution due to a lack of a site-specifictechnology-linked inventory for emissions. Oberschelp et al. have developed adetailed inventory for Chinese power production derived from the InternationalEnergy Agency’s coal power atlas and the PLATTS World electric power plant(WEPP) database. Remaining gaps in the inventory were filled with global USGeological Survey (USGS) fossil fuel data. A combustion model was moreoverapplied to quantify outputs of the main pollutants contributing to particulate matterformation (PM 2.5, NOx, SO2). Flue gas cleaning is included by taking into accounttechnology-specific cleaning rates. These emissions were multiplied by regionalcharacterization factors for all global cities with more than 100,000 inhabitants andcharacterization factor recommendations by the UNEP SETAC Life CycleInitiative. Results and conclusions have been drawn from the country-level PMcharacterization factors provided by LC-Impact. Impacts were put into perspectiveby comparing them with other sectors (transport, industry, domestic coal com-bustion) in China [1].
With regard to the comprehensiveness of a LCA study, the ISO 14040 principlesestablish that such a study should consider the entire life cycle of the system andassess all relevant impacts on the natural environment, human health and resources.This is important in order to be able to identify and evaluate potential shifting ofenvironmental burdens or trade-offs between life cycle stages or impact categories.However, according to Chatzsisideris et al. existing review papers of LCA onphotovoltaic systems tend to exclusively focus on greenhouse gas assessmentsdisregarding other impacts on human health and ecosystems and eluding an explicitdescription of which parts of the PV life cycle were considered by the LCA studiesunder review. Hotspots may not be properly identified if there is not a full coverageof impact categories. The analysis of Chatzsisideris showed that only a third of theanalysed contributions were including the balance of system (BOS) components(i.e. power electronics, wiring, mounting structures) in their assessments, which hasbeen proved to contribute significantly to most environmental impact categories [3].
The use of consequential LCA modelling was performed by Weyand et al. [4], toevaluate the environmental response of a phone charger made of an emergingtechnology such as organic photovoltaics. The impacts of an OPV charger asso-ciated with “an additional 10 Wh electricity generation for charging phones” asfunctional unit, were calculated and compared them to possible substituted con-ventional energy generation technologies and country-specific electricity mixes.Based on the assumptions, that charging the mobile phone with an OPV chargerreduces electricity at the grid, substitution scenarios of several European countriesare analysed. The environmental responses of these scenarios are modelled withinthe software OpenLCA and analysed for the impact categories using the ReCiPeMidpoint (H) method. Current substitution scenarios of the electricity mixes ofFrance and Germany assume that the substituted electricity is nuclear power and
226 N. Espinosa and Y. J. Suh
electricity from lignite—mainly due to the high share of these energy sources in theelectricity mixes. The preliminary results indicate considerable environmentalbenefits in the case of the OPV charger in 7 of the 18 ReCiPe impact categories. Inparticular, the reductions take place in categories like toxicity (freshwater, human,and marine) and eutrophication (freshwater, marine). In 8 of the 18 impact cate-gories, the electricity generated by the OPV charger has lower impacts than one ofthe country-specific electricity mixes, mostly than the German scenario. Forexample, the OPV charger mitigates the climate change potential compared toGerman scenario significantly, whereas the French scenario still has the lowestimpacts due to the high share of nuclear energy. Just in three impact categories, theOPV charger seems to have higher impacts than both scenarios.
For a conventional phone charger, however, key components were identified inthe pre-manufacturing stage by Heo et al. [5]. These are the printed circuit boardand the plastic case composed from 20% recycled poly carbonate (PC). The studycompared the global warming potential (GWP) for both recycled PC and virgin PC.The result shows that recycled PC is clearly beneficial: the GWP is 96% less. Theamount of GHG emission of the mobile charger containing 20% recycled plastics is1.9648 kg CO2 which is 0.089 kg CO2 less than a conventional charger containingvirgin plastics. A 10% increase of recycled PC contents in the charger results in0.3% GHG-reduction across the total life cycle.
After launching the first industrial-scale production plant for polyols containingabout 20 percent CO2, possible thanks to the development of a catalyst which wasable to reduce the activation energy of CO2, Himmelreich did an LCA on theprocess. The evaluation the environmental impact of these new polyols showed thatthe result will be dependent on the chosen source of CO2 (e.g. biogenic, naturalsources, power plants or ammonia plants) and the assumed burden of the carbondioxide [6].
Eco-systèmes and other leading companies in take-back schemes approved bythe French authorities are working on collecting and recycling WEEE. They rep-resent several thousand producers. The database on WEEE management by VanNieuwenhuyse et al. may contribute to solve several challenges faced by producersto adopt a circular approach, from an environmental assessment perspective,notably by:
• reducing the dissymmetry between production and end-of-life modelling, interms of reliability and granularity of the data used;
• facilitating the modelling of a life-cycle stage which is generally not managedby material producers nor product manufacturers, and involves multi-step andmulti-actor pathways;
• taking into account, on the basis of field data, the environmental benefits ofmaterial and energy recovery.
A LCI database has been developed to couple material with WEEE categories.Thereby, the database allows to take the complete recycling chain into account and
Environmental Assessment of Energy Related Products … 227
to adapt the assessment specifically to the product design, without requiring anyadditional hypothesis or settings than the product material composition [7].
The usage of products is frequently modelled by average scenarios of use inLCAs. One challenge of the modelling is the data availability to model the specificscenario of each case of use. The modelling needs to collect several data can beexpensive and time consuming to collect a lot of specific data to improve themodelling of the use phase. The case study of the work from Heslouin et al. is atruck refrigeration unit for which the most impactful phase is the use phase. Theenergy consumption depends on good and bad practice of use [8].
In the framework of the European collaborative project LAWIN, a transparentheat transfer fluid is integrated in a newly designed glass module to make use oftemperature differences for energy generation. This energy shall be used directly forheating or cooling processes in the building. Optimization of the overall conceptensures that additional costs in the manufacturing phase and thus, the selling price,are kept in the range of established window or façade elements in order to ensure aquick and broad acceptance of the product building. Selected outcomes of thisanticipatory evaluation comparing, e.g., different positions of the LAWIN modulein windows or facades, its application as collector or as heat exchanger for heatpumps, or its use for heating or cooling show a strong dependence from the regionallocation in the use phase [10].
4 Future Perspectives in Light of the Presentations
The industrialized and densely populated Eastern parts of China around the pro-vinces Hebei and Shandong and the municipalities Beijing, Tianjin, and Shandongheavily suffer from PM emissions. Despite recent efforts in the introduction of strictemission limits, further upgrade of flue gas treatment in power plants is necessary toreduce health issues. The closure of inefficient power plants, fuel replacement andrelocation of emissions are promising options for improvement [1].
The assessment of the results for the different regions in China and India provedthat there are indeed big differences in environmental impacts of energy production.Therefore, further discussion can be thus initiated whether more regions should besub-divided or whether there is a tipping point at which further detail will not bringany additional value [2].
In order to make a comprehensive study and be able to identify hotspots withlower uncertainty, it is recommended that LCA practitioners performing LCA onPV systems consider the entire PV life cycle, including the BOS, and all relevantimpact categories. In that way ecodesign opportunities can be identified withoutrisking potential shifting of environmental burden from one part of the life cycle toanother or from one impact category to another [3].
228 N. Espinosa and Y. J. Suh
There is a significant potential in using OPV chargers to mitigate impacts thatdominate number of impact categories, especially in regions heavily dependent oncoal powered electricity such as Germany. Further analysis needs to be done toinclude also electricity mixes from other European countries and to understand thereasons behind the differences [4].
Whether to include recycled materials in a conventional mobile phone charger ornot has been shown as clearly beneficial according to Heo et al. [5].
More environmentally sustainable plastics could further reduce the results before[5]. Himmelreich presented her work a successful use of CO2 as an alternativebuilding block for various plastics, replacing a proportion of the petrochemicalprecursors otherwise used [6].
The specific data need of the producers, can thus be satisfied with the provisionof a LCI on WEEE; where material efficiency is linked to the different life-cyclestages: raw material extraction, manufacturing, end-of-life [7].
Specific end-user LCAs and well defined average scenarios are recommended byHeslouin et al. [8] to improve the global environmental footprint. The work alsohighlights how far we have to go in the collection of data for users’ behaviour.
Energy savings of the building sector can be enhanced in the future if LCAstudies are accompanying the development of multi-functional energy-efficientwindows or façades, designed to produce energy from sunlight and to store heatingenergy [10].
References
1. Oberschelp C, Pfister S, Hellweg S, Reduction of site-specific electricity generationparticulate matter impacts in China, Life Cycle Management Conference, Luxembourg, 2017.
2. Lévová T, Valsasina L, Geographical resolution of LCI data on electricity production—thelevel of detail needed, Life Cycle Management Conference, Luxembourg, 2017.
3. Chatzisideris M.D, Espinosa N, Laurent A, Krebs F.C, Quantifying the importance ofcomprehensive life cycle and impact coverage for photovoltaic systems, Life CycleManagement Conference, Luxembourg, 2017.
4. Weyand S, Glogic E, Sonnemann G., Schebek L,Young S.B, Consequential life cycleassessment of an organic photovoltaic portable solar charger applied in the context ofEuropean electricity mixes, Life Cycle Management Conference, Luxembourg, 2017.
5. Heo Y, Rana S, Suh Y, Life Cycle Assessment of a Mobile Charger containing RecycledPlastics, Life Cycle Management Conference, Luxembourg, 2017.
6. Himmelreich B, A Dream comes true—Use of CO2 for the production of plastics, Life CycleManagement Conference, Luxembourg, 2017.
7. Van Nieuwenhuyse T, Assimo, P, Morice L, Lesage R, Hugrel C, Palluau M, Osset P, Aninnovative LCI Database on WEEE management, Life Cycle Management Conference,Luxembourg, 2017.
8. Heslouin C, Pourcheresse L, Stumpf A, Bernardet V.P, Cornier A, Perry N, Is it useful toimprove modeling of usage scenario to improve the environmental footprint of energyconsumption product? Life Cycle Management Conference, Luxembourg, 2017.
Environmental Assessment of Energy Related Products … 229
9. A European strategy for smart, sustainable and inclusive growth, 2010, Brussels:EUROPEAN COMMISSION.
10. Schmidt A, Su L, Fraass M, Wondraczek L, Design accompanying Life Cycle Assessment forthe development of new energy-efficient window concepts, Life Cycle ManagementConference, Luxembourg, 2017.
Open Access This chapter is licensed under the terms of the Creative Commons Attribution 4.0International License (http://creativecommons.org/licenses/by/4.0/), which permits use, sharing,adaptation, distribution and reproduction in any medium or format, as long as you give appropriatecredit to the original author(s) and the source, provide a link to the Creative Commons license andindicate if changes were made.The images or other third party material in this chapter are included in the chapter’s Creative
Commons license, unless indicated otherwise in a credit line to the material. If material is notincluded in the chapter’s Creative Commons license and your intended use is not permitted bystatutory regulation or exceeds the permitted use, you will need to obtain permission directly fromthe copyright holder.
230 N. Espinosa and Y. J. Suh

Is It Useful to Improve Modellingof Usage Scenarios to Improvethe Environmental Footprintof Energy-Using Product?
Charlotte Heslouin, Véronique Perrot-Bernardet,Lionel Pourcheresse and Nicolas Perry
Abstract When considering the Life Cycle Assessment of an energy-usingproduct, usage is often modelled by average scenarios of use. One challenge ofmodelling is the availability of data to model the specific scenario in each case. Thistype of modelling requires the collection of data from several inputs. Also, it can beexpensive and time-consuming to collect the specific data to improve the modellingof the use phase. This case study examines a truck refrigeration unit, for which themost environmentally impactful phase is the use phase. The energy consumption ofthe unit depends on usage. We highlight the importance of modelling a detailedusage scenario specific to each user and examine if it is enough to consider anaverage usage scenario. This study shows how a specific end-user Life CycleAssessment and customized recommendation can contribute to improving theglobal environmental footprint. This is demonstrated by using the energy con-sumption life cycle inventory analysis of specific end-user behaviour based onexperimental data and average scenarios. The results show how far we have to go inthe collection of data.
1 Introduction
Energy-using products are commonly known to have their main environmentalimpact in the use phase [1–3], hence the importance of accurately modelling theusage of this kind of products.
C. Heslouin � L. PourcheresseCarrier Transicold Industries, 76520 Franqueville Saint Pierre, France
C. Heslouin � V. Perrot-BernardetArts et Métiers Paristech, Institut de Chambéry, Savoie Technolac,73375 Le Bourget du Lac, Francee-mail: [email protected]
C. Heslouin � N. Perry (&)Arts et Métiers Paristech, I2M, UMR 5295, 33400 Talence, Francee-mail: [email protected]
© The Author(s) 2018E. Benetto et al. (eds.), Designing Sustainable Technologies,Products and Policies, https://doi.org/10.1007/978-3-319-66981-6_26
231

Life Cycle Assessment (LCA) is recognized to be one of the most reliable toolsfor environmental analysis. LCA is ruled by the ISO 14040 [4] and ISO 14044 [5]standards. LCA methods are described in more detail in the ILCD Handbook [6].However, none of these references specifically describe how to model the usephase. In fact, the relationship between the usage of product and its environmentalperformance is rarely considered in LCA. Usually an average usage scenario is usedwhich does not take into account the effects of the usage context on environmentalperformance, which can be positive or negative. The effect of usage context and itsmodelling has been recognized as a priority by LCA researchers and practitioners.Telenko and Seepersad [7] proposed to model usage context by using Bayesiannetwork models. Among the usage context factors considered were human (who?skills or habits?), situational (where? when? for what task?) and product (design andspecification influencing the use of the product) ones. Ma and Kim [8] proposed atime usage model in which the lifespan of the product was proven to have a strongimpact. Egede et al. [9] analyzed the influence of internal and external factors suchas vehicle characteristics, location of use and user influence.
In this paper, we consider the case of a LCA of truck refrigeration units (TRUs).It has been shown that TRUs’ environmental footprint is mainly due to use ofrefrigerant and the energy needed during their lifetime [10–12]. However, the usephase it depends on several factors which are influencing the energy consumption.The latter include: trailer specification, size and packaging of product loaded,outside climate (temperature, hygrometry), operating mode (continuous run vs.start/stop), start/stop parameters, type of product (fresh or frozen), type of transport(urban distribution vs. long haul), speed of engine, coefficient of performance(COP) of the unit and refrigerant efficiency [13–18].
In the ecoinvent database V3.2 [19], the fuel consumption of truck refrigerationsystems is modelled as an average scenario, assuming a 20% increase as comparedto conventional truck transport without refrigeration [20]. In this scenario, none ofthe aforementioned parameters that can influence the energy consumption havebeen taken into consideration.
This paper shows:
• The potential benefits of modelling the usage phase in detail as compared to anaverage scenario and how the results can be used to provide specific recom-mendations to end-users that may significantly improve the environmentalimpact of TRUs.
• The difficulties of collecting reliable and real-time data to perform a LCA of theuse phase.
• The kind of data that can be used and how to collect it.• The potential influence of the use phase life cycle inventory, using an example
of a TRU with an average scenario of energy consumption versus differentspecific scenarios.
• The potential benefits of using specific energy consumption data to improveproduct design in order to promote sustainable behaviour when usingenergy-using products.
232 C. Heslouin et al.

2 Modelling a Product Usage Scenario
2.1 Source of Data Collection
In order to model a usage scenario, it is necessary to gather data from the use phase.Different kinds of data can be collected in order to build usage scenarios. In thispaper, four sources of data are identified: real-time data, experimental data,numerical simulation data and average scenario data. They are analysed based onfour criteria: (i) time needed to collect data, (ii) cost to collect data, (iii) reliability ofdata and (iv) accuracy of real usage data (Table 1).
Real-time data are collected directly with the help on sensors while the product isrunning. It is the most reliable kind of data and allows the analysis of the actualusage specific to each user. However, data collection and analysis can betime-consuming and/or costly, as it is necessary to use multiple sensors and allocateresources to analyse data. In addition, it implies that the environmental footprintmust be evaluated continuously or only at the end of the product life. The envi-ronmental footprint for a specific set of data will be accurate for a specific usage butrather specific to it, i.e. not necessarily pertinent for another. It can be helpful tobuild an average scenario, specific to each type of business (e.g. fresh or frozenproduct, international long haul, national long haul delivery or urban delivery).
Experimental data are collected during punctual measurement on the product inorder to recreate real condition of use. Again, collection can be time-consuming andcostly, depending on the resources used. However, it requires determining preciseparameters to analyze in order to have reliable data. It does allow for analysing theinfluence of single parameters or for mixing the influence of different parameters. Itdoes allow for creating specific scenarios that can be accurate with real usage.
Data from numerical simulations are based on mathematical routines recreatingreal-world use conditions. The approach to data collection requires a thoroughknowledge of the different parameters to set up the simulation and interpret theresults. In some cases, especially with products requiring the integration withanother system, it can be difficult to control all the external parameters influencing
Table 1 Proposal of quotation of four sources of data to evaluate the environmental performanceof the use phasea
# Solution Timeneeded
Cost Reliability ofdata
Accuracy of realusage data
1 Real-time data −− − ++ ++
2 Experimental data − − + +
3 Numericalsimulation data
+ + − +
4 Average scenariodata
++ ++ −− −−
aQuotation ++ very good; + good; −bad; −− very bad
Is It Useful to Improve Modelling of Usage Scenarios … 233

the energy consumption, which can have a detrimental effect on the accuracy of theresults. Numerical simulations have the advantage to not to require resources andmaterials in order to be performed.
Average data are collected from literature reviews, customer statements or expertknowledge. Compared to the previous kinds of data, average data are usually lessreliable and, in particular when only a few data are required to build a scenario, canlead to an usage model very far from the actual one. However, this type of data isvery easy to gather and at low cost. Average scenario can also be built from themeta-analysis of literature sources or from expert opinions.
2.2 Data Collected
In order to identify which data to collect for building usage scenarios for LCA andsensitivity analysis, the important parameters that influence the environmentalfootprint of the use phase must be identified (such as the technology, the accessoriesincluding curtains, partition wall, etc., the setting from the end-user as the setting ofthe temperature, the operating mode, etc.). These parameters can be further char-acterized using expert and/or user feedback and/or literature sources. Based ongraph theory (which is used to model pairwise relations between parameters), adirected acyclic graph (i.e. a directed graph with no loops or cycles, as e.g. ahierarchy) is built in order to model all the parameters that can influence energyconsumption of a TRU (Fig. 1) based on literature review [10–18] and expertknowledges from Carrier Transicold. As explained in the introduction, many
Fig. 1 Directed acyclic graph of energy parameters influencing energy consumption of TRUbased on literature review [10–18] and expert knowledge’s from Carrier Transicold
234 C. Heslouin et al.
internal and external parameters can influence the energy consumption of thesystem. The graph shows the complexity of energy consumption modelling and thenumber of parameters that have to be considered to obtain a realistic usage scenario.As a result, only experimental data with specific parameters were chosen. Manyparameters are directly chosen by the customer or the end-user (in this case thedriver). Consequently, setting these parameters implies a thorough understanding ofend-user behaviours, which can be influenced by different factors (social and per-sonal norms, awareness, habitual processes as routine, intentional processes aswillingness for environmental habits and situational influences as surroundingenvironment) [21]. In this study, we have chosen a few parameters to analyse basedon expert knowledge of end-user behaviour and the most commonly used param-eters in scientific literature.
2.3 Scenario Studied
In order to define the usage scenario, two collection methods were chosen based onthe four kinds in Table 1: average scenario data and experimental data.
First a European usage scenario based on average data was modelled and thennine specific scenarios were modelled from experimental measurements usingdifferent end-user behaviours and usage settings.
Although it is known that refrigerant leakage [12] significantly contribute to thetotal environmental impact of the sue phase of TRUs, in this paper we focus only onthe influence of energy consumption.
2.3.1 Average Usage Scenario
The European average usage scenario was selected. It is a combination of thebusiness activity and one TRU setting:
• Temperature of transportation (0 °C for fresh product or −20 °C for frozenproduct). This parameter is directly linked to the business activity of thecustomer.
• Operating mode (start/stop or continuous run). The parameter is chosen by theend-user. It is selected depending on transported product (sensitive or not) butthere is no obligation from the manufacturer.
This results in an average scenario of use (Table 2) with an average energyconsumption associated of 1 l/h (this value is defined as a normalized value; it isnot the raw value). A weighting factor, obtained from the analysis of 150 TRUusage data sets based on time, has been defined for each combination of parametersand it is indicated here to better illustrate the average European sharing.
Is It Useful to Improve Modelling of Usage Scenarios … 235
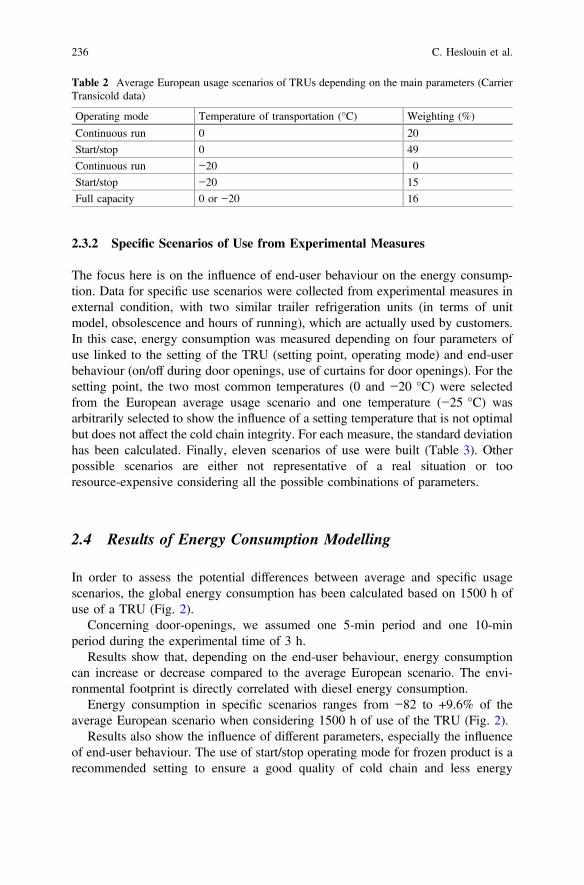
2.3.2 Specific Scenarios of Use from Experimental Measures
The focus here is on the influence of end-user behaviour on the energy consump-tion. Data for specific use scenarios were collected from experimental measures inexternal condition, with two similar trailer refrigeration units (in terms of unitmodel, obsolescence and hours of running), which are actually used by customers.In this case, energy consumption was measured depending on four parameters ofuse linked to the setting of the TRU (setting point, operating mode) and end-userbehaviour (on/off during door openings, use of curtains for door openings). For thesetting point, the two most common temperatures (0 and −20 °C) were selectedfrom the European average usage scenario and one temperature (−25 °C) wasarbitrarily selected to show the influence of a setting temperature that is not optimalbut does not affect the cold chain integrity. For each measure, the standard deviationhas been calculated. Finally, eleven scenarios of use were built (Table 3). Otherpossible scenarios are either not representative of a real situation or tooresource-expensive considering all the possible combinations of parameters.
2.4 Results of Energy Consumption Modelling
In order to assess the potential differences between average and specific usagescenarios, the global energy consumption has been calculated based on 1500 h ofuse of a TRU (Fig. 2).
Concerning door-openings, we assumed one 5-min period and one 10-minperiod during the experimental time of 3 h.
Results show that, depending on the end-user behaviour, energy consumptioncan increase or decrease compared to the average European scenario. The envi-ronmental footprint is directly correlated with diesel energy consumption.
Energy consumption in specific scenarios ranges from −82 to +9.6% of theaverage European scenario when considering 1500 h of use of the TRU (Fig. 2).
Results also show the influence of different parameters, especially the influenceof end-user behaviour. The use of start/stop operating mode for frozen product is arecommended setting to ensure a good quality of cold chain and less energy
Table 2 Average European usage scenarios of TRUs depending on the main parameters (CarrierTransicold data)
Operating mode Temperature of transportation (°C) Weighting (%)
Continuous run 0 20
Start/stop 0 49
Continuous run −20 0
Start/stop −20 15
Full capacity 0 or −20 16
236 C. Heslouin et al.
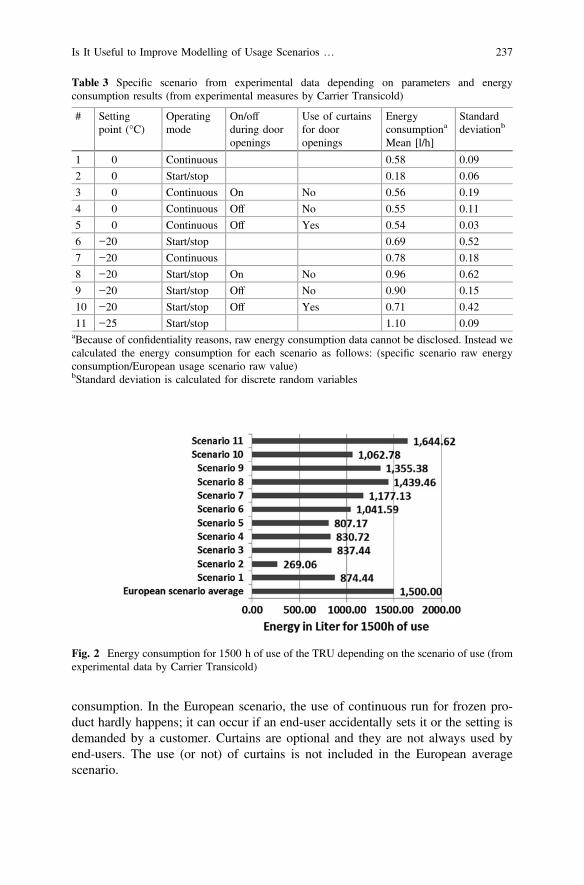
consumption. In the European scenario, the use of continuous run for frozen pro-duct hardly happens; it can occur if an end-user accidentally sets it or the setting isdemanded by a customer. Curtains are optional and they are not always used byend-users. The use (or not) of curtains is not included in the European averagescenario.
Table 3 Specific scenario from experimental data depending on parameters and energyconsumption results (from experimental measures by Carrier Transicold)
# Settingpoint (°C)
Operatingmode
On/offduring dooropenings
Use of curtainsfor dooropenings
Energyconsumptiona
Mean [l/h]
Standarddeviationb
1 0 Continuous 0.58 0.09
2 0 Start/stop 0.18 0.06
3 0 Continuous On No 0.56 0.19
4 0 Continuous Off No 0.55 0.11
5 0 Continuous Off Yes 0.54 0.03
6 −20 Start/stop 0.69 0.52
7 −20 Continuous 0.78 0.18
8 −20 Start/stop On No 0.96 0.62
9 −20 Start/stop Off No 0.90 0.15
10 −20 Start/stop Off Yes 0.71 0.42
11 −25 Start/stop 1.10 0.09aBecause of confidentiality reasons, raw energy consumption data cannot be disclosed. Instead wecalculated the energy consumption for each scenario as follows: (specific scenario raw energyconsumption/European usage scenario raw value)bStandard deviation is calculated for discrete random variables
Fig. 2 Energy consumption for 1500 h of use of the TRU depending on the scenario of use (fromexperimental data by Carrier Transicold)
Is It Useful to Improve Modelling of Usage Scenarios … 237
Results demonstrate that even when the business of the company stronglyinfluences the scenario of use (e.g. it is not possible to compare fresh products withfrozen products), end-users can affect the energy consumption e.g. by setting thetemperature (comparison of scenarios 6 and 11). A variation of 36.7% of energyconsumption for a delta of 5 °C in the setting of the temperature is shown.
When comparing scenario 6 and 7 (influence of operating mode), the energyconsumption varies by 11.5% for 1500 h of use for frozen products.
When comparing scenario 8 and 9 (TRU turns on or off when doors open)energy consumption varies by 6.2%.
The influence of the use of curtains when doors open (scenario 9 and 10)involves a change of energy consumption of approximately 27.5%.
As a result, the environmental footprint of the use phase can be significantlyinfluenced by the end-user behaviours (setting of the temperature, choice of oper-ating mode, the operation of the TRU when doors are opened and use of accessoriessuch as curtains).
Results also show the importance of taking into consideration the businessactivity of the customers. The business activity mainly concerned the type oftransported products and the type of delivery (long haul transportation or urbandelivery with multiple door openings). The business activity will also influenceother parameters linked with end-user behaviours. So, the global energy con-sumption for the whole lifespan of the product and the specific recommendation toend-users will not be the same.
3 Discussion
These results highlight how a specific usage scenario can change the lifecycleinventory when considering energy consumption (from +9.6 to −82%). One diffi-culty in the use of specific energy modelling is to find a good compromise betweenthe need for reliable data and the resources (human, financial, time) that must beallocated to the collection. The difference between the average usage scenario dataand the specific usage data is significant.
The study of experimental data took almost two months to be performed due tothe size of the system (trailer refrigeration box) and the number of parameters totest. Also, refrigeration measure experimentation had to be conducted over a longerperiod of time in order to ensure the thermal stabilization of the system. Thisallowed to check the influence of different parameters on energy consumption inorder to provide specific recommendations to the end-user to the aim to guaranteethe continuity of the cold chain while reducing energy consumption. Experimentalmeasures can provide as well interesting feedback to engineers for the ecodesign ofthe units and recommendations to the end-user to enforce sustainable behaviours. Itcan show the potential benefit of having an innovative design helping to reduceunsustainable end-user behaviours. However, it has to be checked that the
238 C. Heslouin et al.
additional environmental impact generated by the change of design is lower thanthe avoided impacts allowed during the use phase in order to have a net benefit.
This study finally showed that it is possible to make beneficial specific usagerecommendations but the data results are not enough to give specific usage rec-ommendations for each user and their specific usage. In fact, depending on thebusiness of the customer, the recommendations could be adapted. It could be usefulto have a specific tool in order to analyse the behaviour of each end-user and toestimate the potential savings by identifying undesirable usage practices. Thesavings can be estimated based first on experimental data, then on the real datafeedback from the end-user. Based on this tool, an “eco-feedback” design strategyto encourage sustainable behaviour can be used. Eco-feedback involves informingthe end-users of their energy consumption and associated environmental footprint.This requires real-time data processing analysis and environmental footprint cal-culation. However, the potential savings of energy consumption and thus thereduction of the environmental footprint (up to −41.7% between an optimal and asub optimal practice of use) can be worth the effort.
4 Conclusions
In this study, we compared average fuel consumption, based on the use of a TRU totransport goods, to specific energy consumption, depending on different parameters.The study aimed at showing the influence of energy consumption modelling on theassessment of the environmental performance of the product under study. Thehypothesis was that energy consumption modelling based on experimental dataprovides a greater understanding of the influence of the different parameters usefulto model energy consumption.
The results have proven the importance of giving specific usage recommenda-tions to the customer to improve the environmental footprint of TRUs.
It is therefore important to improve the modelling of usage scenarios and of thelifecycle inventory of energy consumption, especially for energy-using products,for which the energy consumption is the major source of environmental impactduring the lifespan of the product. However, the gain in using specific scenariomodelling must be compared to the additional resources needed to collect data.
References
1. Brezet H, Van Hamel C, Ecodesign: A promising approach to sustainable production andconsumption, Paris: UNEP, 1997.
2. Lockton D, Harrison D, Neville S, Making the user more efficient: Design for sustainablebehaviour, International Journal of Sustainable Engineering, Vol. 1, No. 1, 2008, pp. 3–8.
3. Wever R, Van Kujik J, Bock C, User-centred design for sustainable behaviour, ProcediaCIRP, Vol. 40, 2016, pp. 469–474.
Is It Useful to Improve Modelling of Usage Scenarios … 239
4. ISO, Environmental management -Life cycle assessment—Principles and framework, ISO14040, 2006.
5. ISO, Environmental management -Life cycle assessment - Requirements and guidelines, ISO14044, 2006.
6. European Commission - Joint Research Centre—Institute for Environment and Sustainability,International Reference Life Cycle Data System (ILCD) Handbook—General guide for lifecycle assessment—Detailed guidance, 1st Ed., Luxembourg: Publications Office of theEuropean Union, 2010.
7. Telenko C, Seepersad C.C, Probabilistic graphical modeling of use stage energy consumption:a light vehicle example, Journal of Mechanical Design, Vol. 136, 2014, pp. 1–11.
8. Ma J, Kim H.M, Predictive usage mining for life cycle assessment, Transportation ResearchPart D, Vol. 38, 2015, pp. 125–143.
9. Egede P et al, Life cycle assessment of electric vehicles—A framework to considerinfluencing factors, The 22nd CIRP Conference on Life Cycle Engineering, Sydney,Australia, 2015, Vol. 29, pp. 233–238.
10. Barnabe F, Bensafi A, LCA of a transport refrigeration unit and development of an HVAC&Requipment ecodesign tool, International congress of Refrigeration, Washington, D.C, 2009.
11. James S J, James C, The food cold-chain and climate change, Food Research International,Vol. 43, 2010, pp 1944–1956.
12. Heslouin C, et al, Effects of product usage scenarios on environmental performance for roadtransport refrigeration units, 4th International Conference on Sustainability and the ColdChain, Auckland, 2016.
13. Repice C, Stumpf A, Energy efficiency in transport refrigeration, International Congress ofRefrigeration, Beijing, 2007.
14. Tassou S A, De-Lille G, Ge Y.T, Food transport refrigeration—Approaches to reduce energyconsumption and environmental impacts of road transport, Applied Thermal Engineering,Vol. 29, 2009, pp 1467–1477.
15. Barnitt R.A, et al, Emissions of transport refrigeration units with CARB Diesel, Gas-to-liquidDiesel, and Emissions Control Devices, SAE Powertrain, Fuels and Lubricants Meeting, SanAntonio, Texas, 2009.
16. Cavalier G, Stumpf A, Measurement and simulation of energy consumption of transportrefrigerated equipment, 1st Cold Chain Conference, Cambridge, 2010.
17. Fitzgerald W.B et al, Energy use of Integral refrigerated containers in maritime transportation,Energy Policy, Vol. 39, 2011, pp 1885–1896.
18. Wu X, Hu S, Mo S, Carbon footprint model for evaluating the global warming impact of foodtransport refrigeration systems, Journal of Cleaner Production, Vol. 54, 2013, pp 115–124.
19. <http://www.ecoinvent.org/>, (Accessed 01.03.2017).20. Levova T, Freight transport with intermodal shipping containers and transport of goods in
need of atmosphere control, Zürich, Ecoinvent Center, 2015.21. Klöckner A.C, Blöbaum A, A comprehensive action determination model: Toward a broader
understanding of ecological behavior using the example of travel mode choice, Journal ofEnvironmental Psychology, Vol. 30, 2010, pp 574–586.
240 C. Heslouin et al.

Open Access This chapter is licensed under the terms of the Creative Commons Attribution 4.0International License (http://creativecommons.org/licenses/by/4.0/), which permits use, sharing,adaptation, distribution and reproduction in any medium or format, as long as you give appropriatecredit to the original author(s) and the source, provide a link to the Creative Commons license andindicate if changes were made.The images or other third party material in this chapter are included in the chapter’s Creative
Commons license, unless indicated otherwise in a credit line to the material. If material is notincluded in the chapter’s Creative Commons license and your intended use is not permitted bystatutory regulation or exceeds the permitted use, you will need to obtain permission directly fromthe copyright holder.
Is It Useful to Improve Modelling of Usage Scenarios … 241
Life Cycle Management of Energyand Energy Transitions—Managingthe Complexity of Todays and FutureEnergy Systems with a Life Cycle Focus:Challenges and MethodologicalSolutions
Karin Treyer, Roberto Turconi and Alicia Boyano
Abstract To meet climate and sustainability goals a transition of the system ofenergy supply and use is needed. However, energy transitions are complexlong-term processes and require a variety of methodologies to steer their direction.For this purpose, the combination of environmental, social, economic and technicalassessments together with prospective energy scenario modelling is very promisingbut there are several challenges that need to be addressed to fully benefit from thesemethodologies. This paper presents the discussions held during a conference ses-sion on this issue. The solutions proposed facilitate the combination of energysystem modelling frameworks and environmental and social assessments aimed atdeveloping comprehensive prospective studies and feeding information to decisionmaking processes for energy transition toward a low-carbon economy.
1 Introduction
In order to reach the pledges made under the Paris Agreement on climate change itis clear that an ambitious energy transition towards low-carbon solutions involvingevery part of the economy is needed [1]. Energy transitions, defined as structuralchanges in the way energy services are delivered and used, are inherently complex,uncertain and difficult to evaluate. In this context, it is increasingly acknowledged
K. Treyer (&)Paul Scherrer Institute, 5232 Villigen, Switzerlande-mail: [email protected]
R. TurconiArcelorMittal Global R&D Sustainability, 57283 Maizières-lès-Metz, France
A. BoyanoJoint Research Center, Directorate B5 Circular Economy and IndustrialLeadership, 41003 Seville, Spain
© The Author(s) 2018E. Benetto et al. (eds.), Designing Sustainable Technologies,Products and Policies, https://doi.org/10.1007/978-3-319-66981-6_27
243
that mixes of methodologies and modelling frameworks are required to address thevarious market and system challenges associated to such transition [2].
The available literature on the importance of assessing current and future energysystems and the associated transitions ranges from Life Cycle Assessments(LCA) to energy modelling with economic optimization or policy analyses andrecommendations. One focal area has been environmental studies, among whichLCA is one of the most established methods. LCA makes it possible to quantifypotential impacts to the environment and human health of a product or/and systemover the whole life cycle, to identify and discuss areas of improvement, and toconduct fair comparison of selected products or services. Another focal area con-centrates on the economic perspective of energy systems, where energy systemsoptimization models are used to generate future scenarios and evaluate keyparameters such as electricity production, related emissions and/or the system costsin the long-term future.
In recent years authors identified the need of combining the best aspects ofseveral modelling frameworks. In particular, the combination of LCA and energysystems optimization models was studied in depth [3–5]. The motivation behindthis combination is clear: LCA is a detailed and comprehensive, but static andenvironment-focused approach whereas modelling of future scenarios of the energysystem includes multiple factors such as economic situation without consideringenvironmental issues in detail. As most of the authors point out this combination ofmethodologies looks very promising, but challenges to its applications remain.Several (case) studies that address different challenges and propose possible solu-tions are presented and discussed in Sect. 2. The paper closes by providing con-cluding comments in Sect. 3.
2 Challenges Identified and Possible Solutions
A selection of challenges which need to be worked out to realize the full potential ofintegrating LCA and energy systems optimization models is presented in thissection.
2.1 Prospective Background Data
Energy conversion technologies are likely to dramatically change in the comingdecades not only as a consequence of the energy transition but also as a naturalchange due to economic, social and technological reasons. Nearly all prospectiveLCA studies include changes to the energy system when modelling foregroundprocesses. However, in the vast majority of the prospective LCAs the backgroundprocesses are not modified. The work presented by Cox et al. [6] attempted to usethe outputs of the IMAGE model to create future versions of the ecoinvent
244 K. Treyer et al.
database. According to the authors the use of IMAGE results as a source of futureprojections greatly simplifies the data collection stage and allows the systematic andconsistent modification of ecoinvent background processes and market mixes. Theauthors pointed out the importance of a standard format of the results to allow to alarge degree the automatization of future background databases to reflect differenttime horizons or scenarios.
2.2 Lack of Data and Difficulties in the Integrationof the Results
The integration of energy system models and life cycle methods is an approachwidely used to facilitate the modelling of prospective scenarios including envi-ronmental and economic aspects as well as political constraints, enabling sounddecision making and reducing the risk of burden-shifting. Two of the most over-whelming challenges are the lack of data (e.g. power plant operation and emissionfactors) and the coupling of the results of the energy system models with life cycleinventories. Astudillo et al. [7] identified data gaps related to the energy supply anddemand by analysing time-series and literature on emission factors and developed ascreening algorithm enabling database integration.
2.3 Capturing the Interplay of Changes in the Heat Sectorand the Electricity Sector in LCM Models
Bertrand et al. [8] developed a mixed integer linear programming model for theregional valorisation of industrial waste heat from manufacturing, energy produc-tion and waste incineration industries. Using waste heat would save resources andreduce emissions, as highlighted by the European Union in 2012 with the EnergyEfficiency Directive [9]. By applying their modelling to a case study involving steelplants as heat sources and industries/towns as sinks, they demonstrated the eco-nomic profitability of using waste heat for all stakeholders involved.
2.4 Management and Integration of Stochastic Renewablesin LCM Models
A growing share of renewable intermittent electricity such as wind and solar powerleads to a fluctuating feed-in of electricity which might not correspond to electricitydemand in a temporal dimension, leading to regional electricity surpluses. Seieret al. [10] proposed “temporal electricity purchase shifting” (TEPS) as one possible
Life Cycle Management of Energy and Energy Transitions … 245
solution to absorb these electricity surpluses. The authors proposed a wastewatertreatment plant (WWTP) as one actor for applying TEPS and demonstrated thatTEPS led to decreased electricity purchase from fossil fuel fired power plants andreduced CO2 emissions for the WWTP operator.
2.5 Integration of Prospective, Economic, Social and OtherIssues in LCM Models
Løkke et al. [11] carried out a socio-technical investigation of the decision processin a policy discussion, through critical review of the tools used and the scenariosdeveloped. This study identified major barriers for the successful application ofLCA to major infrastructure projects, provided learnings on designing scenarios andconducting LCA of large infrastructures. The authors demonstrated that a criticaldesign of the LCA can help avoid biased decision-making and proposedLCA-based guidance for projects characterized by a highly political context.
3 Concluding Comments
This work has pointed out the importance of the integration of methodologies andmodelling for assessing future energy systems. The necessity of using energysystem models in combination with different environmental or social assessmenttools was highlighted, particularly in prospective assessments. The difficulties in theintegration of the results, the lack of data of the emerging energy technologies, theprospective background databases, the relationships between different energy sec-tors and the stochastic energy production from renewable energies have beenhighlighted as major challenges. The research work being carried out by the pre-senters in the session contributed toward finding possible solutions to these chal-lenges and will be crucial to understand and facilitate a smooth energy transitiontowards a low carbon economy.
References
1. Baron R, Energy Transition after the Paris Agreement: Policy and Corporate Challenges,OECD, 2016.
2. OECD, Aligning Policies for a Low-carbon Economy, OECD, 2015.3. Garcia-Gusano D, Garrain D, Dufour J, Prospective life cycle assessment of the Spanish
electricity production, Renewable and sustainable Energy Reviews. 75 (2017) 21–34.4. Röder A, Integration of life-cycle assessment and energy planning models for the evaluation
of car powertrains and fuels (Thesis Diss ETH no 14291], Zurich (Switzerland), Swiss FederalInstitute of Technology, 2001.
246 K. Treyer et al.
5. Lund H, Mathiesen B.V, Christensen P, Schmidt J.H, Energy system analysis of marginalelectricity supply in consequential LCA,. Int. J. Life Cycle Assess 2010, 15, 260–71.
6. Cox B, Mutel C, Mendoza Beltran A, van Vuuren D. Using integrated assessment modelresults to develop background databases for prospective LCA, LCM 2017.
7. Astudillo M, Vaillancourt K, Pedinotti-Castelle M, Pineau P.O, Ben Amor M, Using energysystem models integrated with life cycle thinking to inform energy transitions in cold regions,LCM 2017.
8. Bertrand A, Mian A, Aggoune R, Maréchal F, Regional waste heat valorisation: a mixedinteger linear programming method for energy service companies, LCM 2017.
9. European Parliament and Council, Energy Efficiency Directive 2012/27/EU.10. Seier M, Schebek L, CO2 effects of temporal electricity purchase shifting on German
wastewater treatment plants, LCM 2017.11. Løkke S, Pizzol M, Distance to change: LCA as conserving/innovative tool—the case of the
green prestigious project “Amager Bakke”. LCM 2017.
Open Access This chapter is licensed under the terms of the Creative Commons Attribution 4.0International License (http://creativecommons.org/licenses/by/4.0/), which permits use, sharing,adaptation, distribution and reproduction in any medium or format, as long as you give appropriatecredit to the original author(s) and the source, provide a link to the Creative Commons license andindicate if changes were made.The images or other third party material in this chapter are included in the chapter’s Creative
Commons license, unless indicated otherwise in a credit line to the material. If material is notincluded in the chapter’s Creative Commons license and your intended use is not permitted bystatutory regulation or exceeds the permitted use, you will need to obtain permission directly fromthe copyright holder.
Life Cycle Management of Energy and Energy Transitions … 247
Integrating Energy System Modelsin Life Cycle Management
Miguel F. Astudillo, Kathleen Vaillancourt, Pierre-Olivier Pineauand Ben Amor
Abstract The energy supply chain is the backbone of industrialised societies, but itis also one of the leading causes of global environmental burden. Life cyclemanagement (LCM) and life cycle assessment (LCA) are increasingly being used incombination with energy system optimisation models (ESOM) to better representthe energy sector and its dynamics, and facilitate better decision-making. Theintegration of ESOM and LCA can enable powerful analyses, but not withoutdifficulties. In this chapter, we review studies linking a well-known bottom-upESOM (TIMES) with LCA databases and identify the principal challenges and howthey have been addressed. One of the main integration challenges is the identifi-cation of equivalent processes between life cycle inventories and ESOM databases:the mapping problem. Other concomitant issues such as double counting andparameter consistency have been identified and are also investigated.
1 Introduction
The economic growth observed in the last century has been heavily correlated witha sharp rise in energy use, improving living conditions for many, but also resultingin large environmental damage [1]. For instance, the energy sector is responsible fornearly two-thirds of global greenhouse gas emissions [2]. Therefore, there is anurgent need to transform the energy supply chain, decarbonising electricity supply
M. F. Astudillo (&) � B. Amor (&)Department of Civil Engineering, Université de Sherbrooke,LIRIDE, Sherbrooke, Canadae-mail: [email protected]
B. Amore-mail: [email protected]
K. VaillancourtEsmia Consultants, Montreal, Canada
P.-O. PineauHEC Montreal, Chair in Energy Sector Management, Montreal, Canada
© The Author(s) 2018E. Benetto et al. (eds.), Designing Sustainable Technologies,Products and Policies, https://doi.org/10.1007/978-3-319-66981-6_28
249
and electrifying services traditionally reliant on fossil fuels [2]. Many stakeholdershave a role in this transition, from businesses to governments and consumers.Stakeholders need tools to understand how the energy system is likely to evolve andhow it may react to various decisions made within the system.
In this journey, Life Cycle Management (LCM) can help to prevent burdenshifting, but using it alone ignores the various energy dynamics. The use of energysystem optimisation models (ESOM) together with life cycle thinking has thepotential to underpin comprehensive understanding of the energy supply chain andits influence on sustainable production. There is a small but increasing number ofstudies combining life cycle assessment (LCA) and ESOM [3–12], ESOM bestpractices start to include LCM practices, such as goal and scope definition or theuse of data quality indicators as a way to quantify epistemic uncertainty (i.e. theuncertainty associated with data quality) [13]. However, combining both models isnot a simple task. In this chapter, we cover the challenges identified in the inte-gration of ESOM and LCA, as well as existing approaches to address them and theirlimitations. For brevity, we focus on inventory level and do not cover impactassessment issues. Details of the criteria used to select articles are detailed inSect. 1.3.
1.1 Energy System Models: Origin and Strengths
Energy infrastructure requires substantial investments and governments have usedmathematical models for a long time to support policy analysis. The use ofmathematical models can help understand the complex interactions that occur in theenergy system, formalising the scattered knowledge about its dynamics [14].Models of the energy sector grew in importance in the aftermath of the oil crisis ofthe 1970s. During that period the International Energy Agency (IEA) was foundedand started developing its ESOM. Broadly speaking, energy models follow twodifferent paradigms, they either provide scenarios of how the system could evolvefrom a normative standpoint (optimisation models), or they attempt to forecast howthe system is likely to change (simulation models) [14]. Optimisation models arebetter suited to analyse long-term scenarios [15] and are therefore consistent withthe common long-term temporal scope of LCA studies. This chapter focuses onbottom-up technology rich models, in particular the MARKAL/TIMES (TheIntegrated Markal Efom System) optimisation model generator developed by theIEA. TIMES is possibly the most widely used general purpose ESM [7, 14].Alternative models following a similar structure such as TEMOA [16] orOSeMOSYS [17] are also considered.
TIMES models are based on cost minimisation and provide consistent possibleevolutions of the energy system under a set of user-defined constraints. Thesemodels provide insights to businesses and policymakers, as they allow exploringpotential interactions which are difficult to foresee without a formal mathematicalframework. TIMES models are “bottom-up” models, with often thousands of
250 M. F. Astudillo et al.
technologies competing to provide a given level of demand for energy services. Thesolution of the optimisation problem provides potentially useful results, such ascapacity additions, activity levels or material and emissions flows for each tech-nology. TIMES models use simplifying assumptions, such as perfect competition.Perfectly competitive markets maximise the total surplus, which is an indicator ofsocial welfare [15]. Thus, although real situations deviate from perfectly compet-itive markets, the solutions can be used as a benchmark. Deviations from perfectcompetition conditions can be studied through specific constraints such aspre-defined market-shares or myopic foresight [13, 15, 18]. In contrast withgeneral-equilibrium models, TIMES models assume partial equilibrium, whichmeans that sectors outside the system’s boundary are assumed not to be affected bychanges in the system. For instance, prices of imports and exports outside theboundaries of the system are exogenously defined and not determined by the model.
1.2 Advantages of Integrating ESOM and LCA
The advantages can be seen as an improvement in data quality aspects [19, 20].TIMES models tend to have a relatively limited scope for assessing environmentalburden, often only tracking primary pollutants from operating energy-relatedinfrastructure [7, 18]. Most of them ignore up-stream emissions associated withimports [8] or consumption of resources linked to energy use, such as freshwater (ofimportance for the growing literature on the so-called water-energy nexus [21, 22]).Moreover, they lack the detailed impact assessment methodologies used in LCM.The absence of a comprehensive environmental assessment can result in burdenshifting and fail to identify potential co-benefits of environmental policies. Lifecycle thinking has been instrumental in addressing burden-shifting in the energysector [23]. For example, it was through LCA studies that the environmental impactof biofuels was better understood [23].
TIMES models are also extremely useful for advanced life cycle studies, both forconsequential and attributional approaches. TIMES explicitly model the futurechanges in the energy system, one of the major limitations of LCA [22]. Theintegration improves the temporal and technological representativeness, complete-ness and precision of inventories. TIMES also integrates economic considerations,which are fundamental in decision-making [19].
1.3 Literature Review
The integration challenges identified in this book chapter stem from our effortslinking the North American TIMES Energy Model (NATEM) with life cycleinventories (LCIs) [24, 25] and reading of associated literature. The existingapproaches to address these challenges are based on a literature review. To identify
Integrating Energy System Models in Life Cycle Management 251
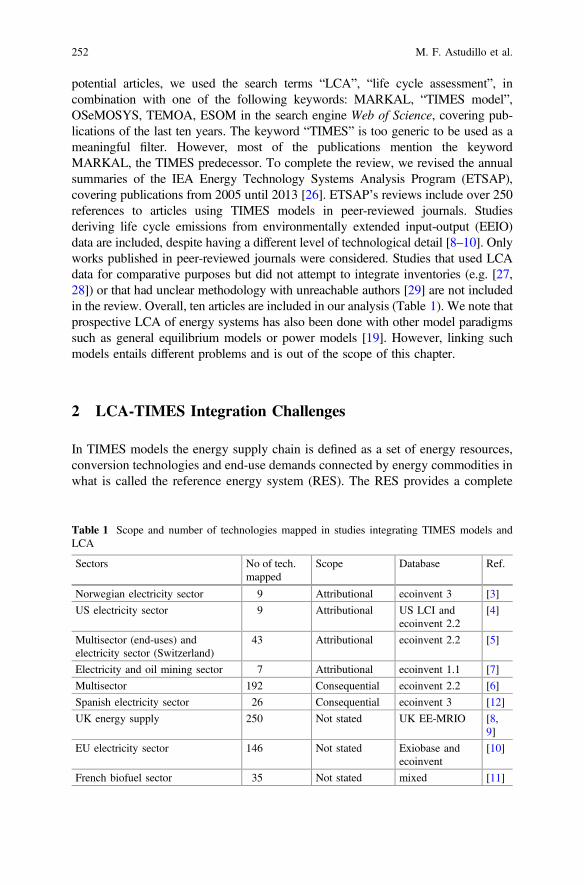
potential articles, we used the search terms “LCA”, “life cycle assessment”, incombination with one of the following keywords: MARKAL, “TIMES model”,OSeMOSYS, TEMOA, ESOM in the search engine Web of Science, covering pub-lications of the last ten years. The keyword “TIMES” is too generic to be used as ameaningful filter. However, most of the publications mention the keywordMARKAL, the TIMES predecessor. To complete the review, we revised the annualsummaries of the IEA Energy Technology Systems Analysis Program (ETSAP),covering publications from 2005 until 2013 [26]. ETSAP’s reviews include over 250references to articles using TIMES models in peer-reviewed journals. Studiesderiving life cycle emissions from environmentally extended input-output (EEIO)data are included, despite having a different level of technological detail [8–10]. Onlyworks published in peer-reviewed journals were considered. Studies that used LCAdata for comparative purposes but did not attempt to integrate inventories (e.g. [27,28]) or that had unclear methodology with unreachable authors [29] are not includedin the review. Overall, ten articles are included in our analysis (Table 1). We note thatprospective LCA of energy systems has also been done with other model paradigmssuch as general equilibrium models or power models [19]. However, linking suchmodels entails different problems and is out of the scope of this chapter.
2 LCA-TIMES Integration Challenges
In TIMES models the energy supply chain is defined as a set of energy resources,conversion technologies and end-use demands connected by energy commodities inwhat is called the reference energy system (RES). The RES provides a complete
Table 1 Scope and number of technologies mapped in studies integrating TIMES models andLCA
Sectors No of tech.mapped
Scope Database Ref.
Norwegian electricity sector 9 Attributional ecoinvent 3 [3]
US electricity sector 9 Attributional US LCI andecoinvent 2.2
[4]
Multisector (end-uses) andelectricity sector (Switzerland)
43 Attributional ecoinvent 2.2 [5]
Electricity and oil mining sector 7 Attributional ecoinvent 1.1 [7]
Multisector 192 Consequential ecoinvent 2.2 [6]
Spanish electricity sector 26 Consequential ecoinvent 3 [12]
UK energy supply 250 Not stated UK EE-MRIO [8,9]
EU electricity sector 146 Not stated Exiobase andecoinvent
[10]
French biofuel sector 35 Not stated mixed [11]
252 M. F. Astudillo et al.

description of the system boundaries and the level of technological detail of a model[30]. The RES is the equivalent to the product system in LCA [20]. The level oftechnological detail can be similar to process-based LCI databases. Thus, similardescriptions of the energy supply chain—from resource extraction to final use—canbe found in both models. Linking ESM and LCI may seem straightforward, as bothmodels share a similar structure, but these models are conceived to be used inde-pendently, and overlapping features can easily result in problems such as doublecounting [5, 6] or incomplete inventories. Faced with redundant information, themodellers need to choose which information prevails. The methodological choicesmay involve a trade-off between data quality aspects [19] which should be con-sidered in the goal and scope definition.
Linking implies associating elements of the two models. We will refer to theproblem of associating elements of two different models as the “mapping problem”.Several issues complicate the mapping problem. First, TIMES models often includethousands of technologies, making a one-to-one linking between LCI and TIMESprocesses almost infeasible. There are no general name conventions or standardcodes that can be used to automate the linking, which still heavily relies on manualidentification. Second, both models can track the same emissions (e.g. greenhousegases (GHG)), and some linkages between processes are not explicitly modelled inTIMES (e.g. cement production and infrastructure development). Adding LCI in themodel can easily result in double counting [5]. Third, consistently introducinglife-cycle emissions in the optimisation problem often requires a one-to-one map-ping of processes in TIMES and LCIs. For example, emissions from end-of-lifetreatment could be included in TIMES, but these are potentially different for eachprocess. In most of the cases, a one-to-one mapping would be excessivelytime-consuming. Fourth, key parameters of processes such as efficiency or emissionfactors may differ between models, which can result in inconsistencies. Finally, ifmultifunctional processes are within the system boundary, the allocation should beavoided using system expansion [20]. However, this is hardly discussed in theliterature.
3 Existing Approaches to Address the IntegrationChallenges
3.1 Mapping TIMES-LCA Processes
The “too many processes” issue preventing a one-to-one mapping is one of the mostcomplicated integration problems. This issue has been addressed using two sim-plifications: limiting the scope of the assessment to specific parts of the energysupply chain and representing sections of the supply chain by their aggregated LCIor LCA indicator.
Integrating Energy System Models in Life Cycle Management 253
The integration efforts reviewed used multisector TIMES models, but most ofthe studies limit their scope to attributional studies of the electricity sector (Table 1)and do a partial integration. Several studies use market mixes from TIMES forprospective assessments, improving temporal representativeness [3, 4, 12], whileothers integrate life cycle emissions in TIMES models [7–11]. Limiting theboundaries to a particular sector reduces the number of technologies that need to bemapped, but it could result in a loss of completeness, questioning the suitability ofthe system boundary. For example, Ref. [4] used multisector MARKAL model toupdate a prospective electricity mix in the US for different scenarios such as capand trade or CO2 taxes. However, such policies affect more than just the electricitysector, and induced changes in other sectors of the model should be considered tomake a fair comparison of different scenarios. Refs. [7–11] added life cycleemissions to several processes of a MARKAL/TIMES model to internalise envi-ronmental emissions. It was a first step towards the integration of externalities, butincomplete mapping may be problematic as it may induce a bias against the mappedtechnologies (see Sect. 3.3). Reference [5] improved completeness, assigninglife-cycle impact scores to all end-uses of all sectors. In this case, there is a widerrange of processes that deliver the energy services (heat, transportation, etc.),raising the number of equivalent processes required (Table 1). The study usedend-use technology mixes and energy demands from TIMES. However, the tech-nology mixes and efficiencies for “non-end-use” processes (such as electricitygeneration) were selectively updated. The authors recommended using a moreconsistent approach in future research [5]. Indeed, upstream processes may alsochange over time or between scenarios (e.g. switch from conventional to uncon-ventional gas or feedstock from biofuels). These changes should be identified in asystematic manner.
The approach of limiting the boundaries to a particular sector is more difficult tojustify in consequential studies since all the processes that are expected to changeshould be included [19, 24]. Changes can be induced by market or policy effects.Our experiments using a TIMES model of a relatively small region (Quebec,Canada) indicate that a large proportion of the processes change their output tosome extent [24]. The best example found of a consequential study using TIMESand LCA was an analysis of the effects of introducing biodiesel from biomass inFrance [6]. In this case, all technologies in the TIMES model were mapped (192).This approach produced a complete mapping, but it may be unfeasible with largerTIMES models, which can easily contain thousands of technologies.
We have recently proposed to use a cut-off criterion, that is, to exclude a per-centage of the material and energy flows based on their contribution to an indicatormeasured in TIMES (e.g. CO2 eq emissions) [24]. The cut-off can help to discernthe most relevant changes, reducing exponentially the number of processes thatneed to be mapped [24]. Nonetheless, it introduces some other problems, such asthe possibility of omitting processes with high impacts in other areas of concern butlow CO2 eq emissions.
254 M. F. Astudillo et al.
3.2 Double Counting
Double counting problem is hardly discussed in the literature of TIMES-LCAlinking [5]. Part of the energy and emissions considered in TIMES models is usedto deliver intermediate products that are already accounted in LCI, resulting indouble counting [5, 6]. For example, the output of the cement sector is typicallyconsidered independent of other demands in TIMES models but will be used tobuild the infrastructure that is already included in LCIs. As pointed by Ref. [6], thiscan be mitigated by presenting relative results between scenarios, where doublecounting effects cancel out, to some extent. This limitation is not exclusive ofTIMES models. A recent review of integrated assessment models stated that mostof them miss linkages related to infrastructure and ignore material cycles, which arethe fundamental characteristics of the life cycle perspective [22]. Constructing more“circular” RES in TIMES models is challenging, as the models need to be calibratedusing national statistics, and these do not necessarily have a high level of detail ofmaterial flows leaving each sector. Studies linking TIMES with EEIO data havemore thoughtfully addressed double counting, erasing manually repeated areas ofthe inventory [8–10]. Reference [10] used fixed input-output coefficients to adjustthe exogenously defined demands (e.g. the steel demand from energy technologiesis used to adjust the energy demand of steel production). Ideally, these demandcorrections would be calculated endogenously by the TIMES model, but that wouldrequire substantial additional linking of processes.
3.3 Integrating Life Cycle Emissions in the OptimisationProblem
Several of the reviewed publications integrated LCA data into the optimisationalgorithm, but only for some parts of the energy system [3, 7–11], with the risk ofintroducing a bias. A consistent integration of life-cycle emissions into the opti-misation problem is challenging, as it will bias the assessment towards sectorswhere accounting of emissions is less complete. Reference [3] noted that imposinglimits on LCA scores for electricity generation greatly affected trade balancesagainst local production, as trade processes did not have emissions associated.Consistently including emissions for all processes in a TIMES model (e.g.end-of-life burdens) would require a one-to-one mapping, which is extremelytime-consuming in large TIMES models. Alternatively, large TIMES models caninclude emissions if it is for a limited number of processes. For example, a modeldealing with operating GHG emissions could include emissions from gas distri-bution or refrigerant leaks or electricity imports (e.g. [25]) without losing consis-tency. Ultimately, TIMES results should be interpreted taking into account potentialinconsistencies and lack of completeness of the inventories. References [8, 10] are
Integrating Energy System Models in Life Cycle Management 255
good examples, as they provide guidance on how to interpret results and what kindof conclusions could not be drawn.
3.4 Technological Representativeness
TIMES inventories represent future supply chains, while most of the LCI data arefrom current supply chains. Parameters such as efficiency, capacity factors oremission factors of the same technology may therefore differ. Unless a harmoni-sation step is introduced, the integration could lead to inconsistencies. The level ofconsistency in the different integration is difficult to evaluate because, with someexceptions (e.g. [5, 8]) it is not well documented and rarely discussed. Studies usingEEIO data acknowledge that sectoral aggregation is an additional problem, assectors with different emission intensities can be grouped together, eroding datarepresentativeness [8]. References [3, 30] suggested learning from the experienceslinking bottom-up and general equilibrium models. Some of the concepts developedduring other integration efforts can be applied to the integration of TIMES modelsand LCA databases. For example, the introduction of common measurement points(i.e. points where both models have the same result) would be useful to formalisethe linking approach.
3.5 Dealing with Multifunctional Processes
Multifunctional processes should be handled in a way that is consistent with thescope of the analysis and if possible, avoiding the allocation using system expan-sion [20]. However, except Ref. [6], studies do not specify how allocation has beenconducted when it could not be avoided (e.g. one of the outputs being outside thesystem boundary).
4 Discussion and Conclusions
The TIMES-LCA integration is clearly in expansion, with several recent publica-tions on the topic. Integration can range from a very simple level (e.g. identificationof future average or marginal technologies in a particular energy market), to moredetailed ones, capturing market and policy interactions and transformations in theentire energy supply chain. More comprehensive approaches also imply a sub-stantial additional effort, particularly solving the mapping of processes between thetwo bottom-up models.
To date, the existing literature has focused on attributional studies of electricitygeneration, although some multisector and consequential studies exist. Limiting the
256 M. F. Astudillo et al.
scope to part of the system may miss important changes outside the chosen systemboundaries. The potential lack of completeness needs to be considered in the def-inition of the goal and scope. The truncation of the system boundary is especiallyunwarranted for consequential studies, where limiting the scope to specific sectorswould result in an incomplete inventory.
TIMES and LCA often have overlapping representations of the supply chain,and modellers have to choose which data prevail, substituting parts of the TIMESrepresentation by LCA counterparts. Direct substitution entails the risk of missingimportant changes across the supply chain. Therefore, the need for systematicapproaches to prioritise which LCI data should be updated. The ordering of pro-cesses and application of a cut-off based on a criterion such as CO2 eq emissionscan help to both identify relevant changes and reduce the number of processes to bemapped.
Consistent linking requires also updating parameters such as efficiency andemission factors. Integration efforts outside the LCA field suggested already in1996 to use common measurement points, unambiguous measurement points wherethe two models should yield identical results [30]. The formalisation of these pointsimplies a harmonisation of parameters, and the assessment of the extent by whichboth models measure the same phenomena and the same future [30]. The authoralso pointed out the need to share a common formalised language between models[30]. The specification of such conceptualisation is called ontology, a field ofgrowing interest in industrial ecology and recently discussed in the LCM confer-ence [31]. The need for more traceable and transparent workflows that go beyondthe common reporting on scientific articles was also stressed [31]. We agree, asarticles often don’t offer sufficient explanation to understand the details of how thelinking was done.
The process of linking models goes beyond solving the implementation problem[30]. It is also an opportunity to learn about the system and the implications ofdifferent perspectives, which are essential to interpret results. LCA modellersshould consequently keep in mind the underlying assumptions and values ofESOM.
References
1. Smil V, World history and energy. Encycl Energy 2004;6:549–61.2. IEA, Energy, climate change and environment, 2016 insights 2016. http://www.iea.org/
publications/freepublications/publication/ECCE2016.pdf (accessed September 23, 2017).3. García-Gusano D, Iribarren D, Martín-Gamboa M, Dufour J, Espegren K, Lind A, Integration
of life-cycle indicators into energy optimisation models: The case study of power generationin Norway. J Clean Prod 2016;112:2693–6.
4. Choi J-K, Friley P, Alfstad T, Implications of energy policy on a product system’s dynamiclife-cycle environmental impact: Survey and model. Renew Sustain Energy Rev 2012;16:4744–52.
Integrating Energy System Models in Life Cycle Management 257

5. Volkart K, Weidmann N, Bauer C, Hirschberg S, Multi-criteria decision analysis of energysystem transformation pathways: A case study for Switzerland. Energy Policy 2017;106:155–68.
6. Menten F.M, Tchung-ming S, Lorne D, Bouvart F, Lessons from the use of a long-termenergy model for consequential life cycle assessment: the BTL case. Renew Sustain EnergyRev 2015;43:942–60.
7. Pietrapertosa F, Cosmi C, Macchiato M, Salvia M, Cuomo V, Life Cycle Assessment,ExternE and Comprehensive Analysis for an integrated evaluation of the environmentalimpact of anthropogenic activities. Renew Sustain Energy Rev 2009;13:1039–48.
8. Daly H.E, Scott K, Strachan N, Barrett J, Indirect CO2 Emission Implications of EnergySystem Pathways: Linking IO and TIMES Models for the UK. Environ Sci Technol2015;49:10701–9.
9. Scott K, Daly H, Barrett J, Strachan N, National climate policy implications of mitigatingembodied energy system emissions. Clim Change 2016;136:325–38.
10. McDowall W, Solano Rodriguez B, Usubiaga A, Acosta Fernández J, Is the optimaldecarbonization pathway influenced by indirect emissions? Incorporating indirect life-cyclecarbon dioxide emissions into a European TIMES model. J Clean Prod 2018;170:260–8.
11. Hugues P, Assoumou E, Maizi N, Assessing GHG mitigation and associated cost of Frenchbiofuel sector: Insights from a TIMES model. Energy 2016;113:288–300.
12. García-Gusano D, Garraín D, Dufour J, Prospective life cycle assessment of the Spanishelectricity production. Renew Sustain Energy Rev 2016;75:21–34.
13. DeCarolis J, Daly H, Dodds P, Keppo I, Li F, McDowall W, et al, Formalizing best practicefor energy system optimization modelling. Appl Energy 2017;194:184–98.
14. Pfenninger S, Hawkes A, Keirstead J, Energy systems modeling for twenty-first centuryenergy challenges. Renew Sustain Energy Rev 2014;33:74–86.
15. Loulou R, Remme U, Kanudia A, Lehtila A, Goldstein G, Documentation for the TIMESModel Part I. IEA Energy Technol Syst Anal Program 2005:1–78. https://iea-etsap.org/docs/Documentation_for_the_TIMES_Model-Part-I_July-2016.pdf (accessed September 23, 2017).
16. Hunter K, Sreepathi S, DeCarolis J.F, Modeling for insight using Tools for Energy ModelOptimization and Analysis (Temoa). Energy Econ 2013;40:339–49.
17. Howells M, Rogner H, Strachan N, Heaps C, Huntington H, Kypreos S, et al, OSeMOSYS:The Open Source Energy Modeling System. Energy Policy 2011;39:5850–70.
18. Glynn J, Fortes P, Krook-Riekkola A, Labriet M, Vielle M, Kypreos S, et al, Informingenergy and climate policies using energy systems models. Springer International Publishing;2015.
19. Astudillo M.F, Treyer K, Bauer C, Pineau P.O, Amor M Ben, Amor B, Life cycle inventoriesof electricity supply through the lens of data quality: exploring challenges and opportunities.Int J Life Cycle Assess 2016;3:374–86.
20. ISO, ISO 14044 Environmental management—Life cycle assessment—Requirements andguidelines. vol. 3. 2006.
21. Kapsarc, Energy Systems Modeling to Support Policy Making 2014. https://www.kapsarc.org/wp-content/uploads/2015/10/KS-1401-WB01B-Energy-Modeling-Workshop-Policy-Brief.pdf (accessed September 19, 2017).
22. Pauliuk S, Arvesen A, Stadler K, Hertwich E.G, Industrial ecology in integrated assessmentmodels. Nat Clim Chang 2017;7:13–20.
23. Hellweg S, Milà i Canals L, Emerging approaches, challenges and opportunities in life cycleassessment. Science 2014;344:1109–13.
24. Astudillo M.F, Vaillancourt K, Pineau P, Amor B, Simplifying the integration of energysystem models and LCA. Setac Brussels 2017, Brussels: 2017, p. 3–4. https://osf.io/cxzra(accessed September 19, 2017).
25. Astudillo M.F, Vaillancourt K, Pineau P.O, Amor B, Can the household sector reduce globalwarming mitigation costs? sensitivity to key parameters in a TIMES techno-economic energymodel. Appl Energy 2017;205:486–98.
258 M. F. Astudillo et al.
26. ETSAP, Other. Annex Final Reports 2013. https://iea-etsap.org/index.php/applications/other(accessed September 19, 2017).
27. Frenette E, Bahn O, Vaillancourt K, Meat, Dairy and Climate Change: Assessing theLong-Term Mitigation Potential of Alternative Agri-Food Consumption Patterns in Canada.Environ Model Assess 2016.
28. Levasseur A, Bahn O, Beloin-Saint-Pierre D, Marinova M, Vaillancourt K, Assessing butanolfrom integrated forest biorefinery: A combined techno-economic and life cycle approach.Appl Energy 2017:1–13.
29. Tokimatsu K, Endo E, Murata A, Okajima K, Nomura N, An Integrated Assessment byModels for Energy Systems Analysis and Life-Cycle Assessment with a Case Study ofAdvanced Fossil-Fired Power Plants in China. Environ Model Assess 2015:291–305.
30. Wene C.O, Energy-economy analysis: Linking the macroeconomic and systems engineeringapproaches. Energy 1996;21:809–24.
31. Vandepaer L, Gibon T, 2018. The integration of energy scenarios into LCA: LCM2017Conference Workshop, Luxembourg, September 5, 2017. Int J Life Cycle Assess23:970–977.
Open Access This chapter is licensed under the terms of the Creative Commons Attribution 4.0International License (http://creativecommons.org/licenses/by/4.0/), which permits use, sharing,adaptation, distribution and reproduction in any medium or format, as long as you give appropriatecredit to the original author(s) and the source, provide a link to the Creative Commons license andindicate if changes were made.The images or other third party material in this chapter are included in the chapter’s Creative
Commons license, unless indicated otherwise in a credit line to the material. If material is notincluded in the chapter’s Creative Commons license and your intended use is not permitted bystatutory regulation or exceeds the permitted use, you will need to obtain permission directly fromthe copyright holder.
Integrating Energy System Models in Life Cycle Management 259
LCM at the Urban Scale: BIMand Nature Based Solutions
Antonino Marvuglia, Benedetto Rugani and Germain Adell
Abstract Access to data on built environment databases makes nowadays possiblegenerating models of the urban spaces to facilitate visualization and analysis ofinformation and synthesize it in sustainability indicators to support urban planningdecisions. Life Cycle Assessment (LCA) can greatly benefit from this wealth ofpotentially available information. The use of LCA data in models developed inBuilding Information Modelling (BIM) platforms is likely to facilitate the imple-mentation of quantitative environmental assessment in the construction field andtheir extension, from the building to the city level. Within sustainable urbanplanning and management, also Nature-Based Solutions (NBS) play a potentiallyimportant role, although benefits, co-benefits and costs associated with NBS pro-jects still remain not sufficiently understood. All those aspects have been discussedvia the presentation of case studies, proofs of concept and experts’ visions withinthis session.
1 Introduction and Scope of the Session
An assessment of energy and environmental performances of building stocks atlarge spatial scales is increasingly needed for decision support in sustainable urbanplanning and policy making. While current bottom-up building stock models havemainly focused on the operational energy use up to the last decade, a more holisticenvironmental assessment of the different stages of buildings life cycle is nowrequired. However, extending a Life Cycle Assessment (LCA) model from the
A. Marvuglia (&) � B. RuganiEnvironmental Research and Innovation (ERIN) Department, Luxembourg Instituteof Science and Technology (LIST), 4422 Belvaux, Luxembourge-mail: [email protected]
G. AdellNobatek/INEF4 Institute for the Energy Transition, 67 rue de Mirambeau,64600 Anglet, France
© The Author(s) 2018E. Benetto et al. (eds.), Designing Sustainable Technologies,Products and Policies, https://doi.org/10.1007/978-3-319-66981-6_29
261
building to the district or city scales entails a number of methodological andoperational challenges.
LCA as inventory and environmental impact assessment tool can largely benefitfrom datasets and knowledge base frameworks based on Building InformationModelling (BIM) and Nature-Based Solutions (NBS). The use of BIM has the aimto help engineers to design digital models and share building information in aninteroperable and reusable way [1]. However, firstly to apply BIM conceptsdesigners create 3D models of buildings hinging upon built-in databases, which arenot interoperable with the analysis tools used in LCAs of buildings. This hampersthe quantification of the potential environmental impacts of buildings using thosematerials databases to support the decision-making process [2, 3]. Secondly, themodelling of a detailed BIM is time-consuming and especially in early designphases detailed information is usually not yet available. To this end, basic 3Dmodels can be used to do simplified LCAs of buildings and neighbourhoods andcompare variants in early design, when the optimization potential is high. Thirdly, anumber of standards and data formats for 3D modelling and visualization ofbuildings and cities have been developed, e.g. CityGML [4, 5]; however, thesemodels are often not used in planning and operation, partly because of problemswith interoperability and partly due to the efforts to keep the models up to date [6].
Finally, BIM-based sustainability in the construction sector relates, at higherscales than single buildings, with the sustainability of urban planning and man-agement, and therefore to the efficient use of resources and impact mitigationmeasures in cities. In this regard, it is worth observing that the improvement ofcities’ sustainability is nowadays supported through the explicit implementation ofNature-based Solutions (NBS) [7, 8] in urban planning. Those represent, amongothers, a means to activate impact mitigation measures in cities [7, 9]. How toharness NBS to promote well-being in urban areas does represent another chal-lenging and timely research theme [10, 11], which is not explored in the LCAcontext. NBS strictly belong to the sustainable management of natural resources,urban spaces and technological know-how. Their introduction in urban contexts (atthe spatial level of building, neighbourhood, or whole city) is recommended forseveral reasons, such as to reinforce the social cohesion and reduce poverty, andenhance the provision of urban ecosystem services and biodiversity. However, theimpact of NBS projects, in terms of benefits, co-benefits and costs is still notsufficiently understood. Hence, the study of NBS related impacts, based on an LCAapproach, could facilitate the interpretation of the sustainability dimensionsunderpinning NBS.
This LCM2017 conference session explored the challenges mentioned above viasome case studies, proofs of concept and a discussion based on different experts’visions. The objective was to offer an overview on some methodological andapplied advances that, from building to city scales, may open up concrete oppor-tunities for: (i) a better exploitation of urban resources, data and know-how (i.e.integration between BIM and LCA), and (ii) a smooth transition towards sustain-able and resilient cities (i.e. assessment/implementation planning of NBS with a lifecycle thinking approach).
262 A. Marvuglia et al.
2 Summary of the Session’s Presentations
2.1 Building Information Modelling Applications
Impacts embodied in the building components (materials, etc.) have a more andmore important role in buildings, considering the transition process from traditionalbuildings to energy-efficient buildings. In order to trace these embodied impactsefficiently, tools like BIM help in keeping track of inventory data for buildingconstruction elements, as well as technical installations, such as ventilation systems.
This was the subject of the first presentation, “Life Cycle Assessment of aVentilation System in and Office Building in Trondheim”, by Alexander Borg.
In this study, a BIM model was used to find inventory data on a ventilationsystem. A supplied dataset was used to create the inventory for the embodiedimpacts in the building components, and energy simulations allowed the calculationof the energy demand throughout the use phase of the building. A dynamicmethodology was applied to better encompass the long lifetime of buildings. Theresults showed that energy use accounts for the majority of the impacts for mostimpact categories, but embodied impacts have a larger share of emissions thanpreviously shown in literature, although total impacts coincide with literature data.
From the presented study emerges how BIM-LCA integration needs a collab-orative process and data sharing. In order to benefit from BIM not only in theadvanced stages of a project, but also in its early stages, there is a need for asimplified, design-integrated method based on early BIM models with limitedinformation. The presentation of Alexander Hollberg (“Design-integrated LCAusing early BIM”) dealt with the potential of BIM technology to facilitate theapplication of LCA in the early design stage of a building. Early design stages are infact very important for building’s environmental impacts mitigation. Building’slife-cycle impact can be significantly reduced by choosing materials with lowembodied impacts at early design stages [12, 13]. However, the number andcomplexity of the decisions to be taken in this phase and typically the lack ofknowledge on which decisions have the highest impacts on a building’s environ-mental performance, often lead designers to postpone decisions to later stages of thedesign process. A high potential to facilitate this early stage decision process is seenin the use of BIM [14–16]. However, while BIM is more and more applied indetailed design stages, simple 3D models are typically used to compare designvariants in early stages. A simplified, design-integrated method based on these earlyBIM models with limited information was thus introduced, which uses simple 3Dgeometry and a parametric LCA model. The method was applied to the conceptiondesign of a residential neighbourhood.
The integration between BIM and LCA should in any case hinge upon a mutualtransfer of information: BIM data in the LCA framework and LCA results back intothe BIM database. However, this full integration poses interoperability issues. Thepresentation by Adélaïde Mailhac (“A proposition to extend CityGML and ADEEnergy standards for exchanging information for LCA simulation at urban
LCM at the Urban Scale: BIM and Nature Based Solutions 263

scale”) addressed the potential of BIM to reduce efforts during the data acquisitionphase in order to facilitate the challenging task of extending LCA studies fromsingle buildings to complex systems as districts, urban facilities and territories. Todate, LCA data requirements have not been fully integrated into the CityGMLformat nor its Application Domain Extensions (ADE). The presenter proposed anextension of CityGML and Energy-ADE standards for exchanging information forLCA simulation at urban scale. The scope of the study was limited to the integrationof information necessary for LCA of buildings’ construction and renovation.
2.2 Nature-Based Solutions
When looking at the whole scale from building to city, the application of an LCAperspective can help disclosing the real benefits of NBS for the renaturing andsustainability of urban systems. The study entitled “Dynamic Assessment ofNature Based Solutions through Urban Level LCA”) and presented by ÖzgeYılmaz anticipated the basis to obtain a comprehensive environmental assessmentof NBS to address urban challenges. The H2020 project Nature4Cities [11] wasintroduced and its overarching approach for modelling urban ecosystems, which inone work package integrates LCA and urban metabolism (UM), was described.Performing a dynamic assessment with time series data was suggested as a way topromote the identification of hotspots within a determined time frame, allowing theassessor to categorise and mitigate extremes and make informed decisions ondesired temporal patterns. In the authors’ view, data needs for the dynamicassessment is supported by two simulation methodologies: BIM for the builtenvironment and Agent Based Modelling (ABM) for social behavioural patterns.
Finally, the last session’s presentation complemented the previous ones byexploring whether or not different spatial distributions of possible NBS imple-mentations in the city (as a function of the topological structure of the urban systemitself) can make a difference in terms of quantification of the desired beneficialeffect (such as carbon uptake). This was the topic of Marlène D.F. Boura(“How does the spatial distribution of green within cities impact carbon flows?A European scale analysis”).
3 Issues Discussed and Future Perspectives Identified
The case study discussed by Alexander Borg has shown how the use of an externaltool, like Excel, as an intermediate step for inventory modelling is very timeconsuming and not optimal to ensure a convenient use of a BIM-LCA model. Thereis potential for automation of this process, but it is important to first being able toensure the reliability and transparency of the data used in an automatic data transfer
264 A. Marvuglia et al.
process. The automation of information transfer from external data sources to BIMis one of the current challenges that BIM-LCA integration has to face.
Ongoing research shows that ventilation systems can contribute significantly toincrease GHGs emissions, especially considering that these systems do not alwayswork properly from the start, and faulty equipment must be replaced, thus gener-ating additional emissions through materials and labour. The presentation showedthat, given the role they play in buildings performances, embodied impacts ofventilation systems should be reduced, via increased recycled and recyclablematerials content, and taking into account also alternative ventilation methods likehybrid natural ventilation.
The “early BIM” approach presented by Alexander Hollberg raised a lot ofinterest in the audience. A question was asked about the comparison between theimpacts of a building where environmentally sound decisions are taken at the earlystage and one where these decisions are taken only at later stages of the design. Thecomparison has not been done so far by the authors, but the same systemsboundaries were used in the early stages as they would apply to later stages. Aspointed out by one of the attendees, the approach presented is similar to the onetaken by other tools used for LCA in building design, especially TallyTM. However,as Alexander Hollberg highlighted, the main difference lays in the full integrationinto the design process. Their approach provides instant feedback while changingparameters, which is a unique feature in the current state of the art. Furthermore,they combine operational energy demand calculation and the embodied impactcalculation in one method. This kind of approach appeared slightly different from a“conventional” BIM approach. The authors call it “early BIM”, because they linkinformation to the geometric 3D model. Conventional BIM, such as Revit models,contain more detailed information stored in the 3D model. This results in a morecomplex model which cannot be adapted as quickly as simple 3D models.Therefore, they use the simple models in early stages, which can then ideally beenriched with detailed information throughout the design process.
The topics discussed by Adélaïde Mailhac gave an interesting overview of thepotential of BIM use in an LCA framework, explaining that BIM can be used inevery phase of the LCA, not just in the early conception stage. However, dataavailability in the right format (e.g. CityGML compliant data) still remains aproblem, since data is not provided easily by every actor, public or private.
Finally, the approach presented by Özge Yılmaz intrigued the audience due to itsmodular structure, which integrates different approaches. It also raised concernsabout the seamless incorporation of ABM, which is a dynamic simulation tool, witha rather static LCA approach. The presenter recognized that LCA provides asnap-shot of environmental impacts over a given period of time and a shift fromstatic LCA to more dynamic LCA is certainly necessary for successful integrationof ABM and LCA. A second observation concerned the suggestion to include notonly the behavioural patterns, but also consumption patterns in the ABM simula-tions. This aspect will be taken into account in conjunction with an urban meta-bolism approach within the Nature4Cities project.
LCM at the Urban Scale: BIM and Nature Based Solutions 265

Another question was asked about the actual sustainability assessment of NBS.In other words, NBS are nowadays often sought because they are capable ofimproving a certain element of an urban system, improve its performances withrespect to a specific aspect (e.g. green facades to improve the thermal comfort inbuildings and reduce heating and cooling loads) or supposedly increase peoplewell-being. But is the lifecycle sustainability of NBS systematically assessed? Arewe ready to provide holistic assessments of NBS, or are we rather running the riskof swooping on NBS without evaluating any possible side effect? The answer tothis question can be found in the consistent application of holistic (lifecycle based)assessment of NBS, as proposed in Nature4Cities.
References
1. Vanlande R, Nicolle C, Cruz C, IFC and building lifecycle management, Automation inConstruction, Vol. 18, 2008, pp. 70–8.
2. Schlueter A, Thesseling F, Building information model based energy/exergy performanceassessment in early design stages. Automation in Construction, Vol. 18, 2009, pp. 153–63.
3. Jrade A, Jalaei F, Integrating building information modelling with sustainability to designbuilding projects at the conceptual stage, Building Simulation; Vol. 6, 2013, pp. 429–44.
4. Stoter J, Beetz J, Ledoux H, Reuvers M, Klooster R, Janssen P, et al., Implementation of aNational 3D Standard: Case of the Netherlands. In: Pouliot et al. (eds). Prog. New Trends 3DGeoinformation Sci., Berlin, Heidelberg: Springer Berlin Heidelberg; 2013, pp. 277–98.
5. van den Brink L, Stoter J, Zlatanova S, Establishing a national standard for 3D topographicdata compliant to CityGML. International Journal of Geographical Information Science, Vol.27, 2013, pp. 92–113.
6. Zlatanova S, Itard L, Kibria MS, van Dorst M. A user requirements study of digital 3Dmodels for urban renewal. Open House International, Vol. 35, 2010, pp. 37–46.
7. Faivre N, Fritz M, Freitas T, de Boissezon B, Vandewoestijne S. Nature-Based Solutions inthe EU: Innovating with nature to address social, economic and environmental challenges.Environmental Research, Vol. 159, 2017, pp. 509–518.
8. European Commission, EC Towards an EU Research and Innovation policy agenda forNature-Based Solutions & Re-Naturing Cities, 2015.
9. Eggermont H, et al., Nature-based Solutions: New Influence for Environmental Managementand Research in Europe. GAIA—Ecological Perspectives for Science and Society, Vol. 24(4),2015, pp. 243–248.
10. Maes J, Jacobs S, Nature-Based Solutions for Europe’s Sustainable Development.Conservation Letters, Vol. 10(1), 2017, pp. 121–124.
11. <https://www.nature4cities.eu/>, (Accessed 24.09.2017).12. Anand C K, Amor B, Recent developments, future challenges and new research directions in
LCA of buildings: A critical review, Renewable and Sustainable Energy Reviews, Vol. 67,2017, pp. 408–416.
13. Zabalza Bribián I, Capilla A V, Aranda Usón A, Life cycle assessment of building materials:Comparative analysis of energy and environmental impacts and evaluation of theeco-efficiency improvement potential, Building and Environment, Vol. 46, 2011,pp. 1133–1140.
14. Eleftheriadis S, Mumovic D, Greening P, Life cycle energy efficiency in building structures:A review of current developments and future outlooks based on BIM capabilities, Renewableand Sustainable Energy Reviews, Vol. 67, 2017, pp. 811–825.
266 A. Marvuglia et al.
15. Shoubi M V, Shoubi M V, Bagchi A, Barough A S, Reducing the operational energy demandin buildings using building information modeling tools and sustainability approaches, AinShams Engineering Journal, Vol. 6, 2015, pp. 41–55.
16. Shadram F, Johansson T D, Lu W, Schade J, Olofsson T, An integrated BIM-basedframework for minimizing embodied energy during building design, Energy and Buildings,Vol. 128, 2016, pp. 592–604.
Open Access This chapter is licensed under the terms of the Creative Commons Attribution 4.0International License (http://creativecommons.org/licenses/by/4.0/), which permits use, sharing,adaptation, distribution and reproduction in any medium or format, as long as you give appropriatecredit to the original author(s) and the source, provide a link to the Creative Commons license andindicate if changes were made.The images or other third party material in this chapter are included in the chapter’s Creative
Commons license, unless indicated otherwise in a credit line to the material. If material is notincluded in the chapter’s Creative Commons license and your intended use is not permitted bystatutory regulation or exceeds the permitted use, you will need to obtain permission directly fromthe copyright holder.
LCM at the Urban Scale: BIM and Nature Based Solutions 267
Design-Integrated LCA Using EarlyBIM
Alexander Hollberg, Julia Tschetwertak, Sven Schneiderand Guillaume Habert
Abstract Life Cycle Assessment (LCA) is increasingly used for buildings, how-ever, mostly for post-design evaluation of the environmental impact. To use theresults for optimization, LCA has to be integrated in the early design stages. WhileBuilding Information Modelling (BIM) is more and more applied in detailed designstages, simple 3D models are typically used to compare design variants in earlystages. The objective of this paper is to introduce a simplified, design-integratedmethod based on these early BIM models with limited information. The earlyBIM-LCA method uses simple 3D geometry and a parametric LCA model.Methodological simplifications are introduced and a single indicator based on thecertification system of the German Sustainable Building Council (DGNB) is used toprovide an intuitive real-time feedback for the designer. The method is applied tothe conceptional design of a residential neighbourhood. The results highlight thegreat potential of using simplified LCA to quantify environmental performance fordecision-making in early design stages.
1 Introduction
Life Cycle Assessment (LCA) is increasingly gaining importance for environmentalevaluation of buildings, mostly in the form of building certification labels. Theapplication of LCA at a late stage of the planning process for post-design evaluationof the environmental impact is not sufficient on its own if the results are not used toimprove the design [1]. The highest optimization potential lies within the earlydesign stages where the decisions made have the biggest influence on energy
A. Hollberg (&) � G. HabertChair of Sustainable Construction, IBI, ETH Zürich, Stefano-Franscini-Platz 5,8093 Zurich, Switzerlande-mail: [email protected]
A. Hollberg � J. Tschetwertak � S. SchneiderBauhaus University Weimar, Geschwister-Scholl-Straße 8,99423 Weimar, Germany
© The Author(s) 2018E. Benetto et al. (eds.), Designing Sustainable Technologies,Products and Policies, https://doi.org/10.1007/978-3-319-66981-6_30
269
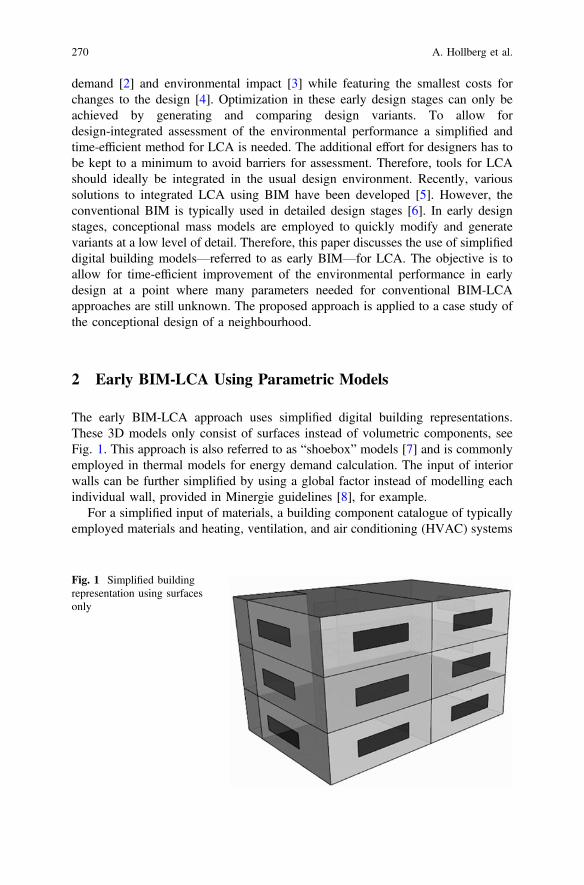
demand [2] and environmental impact [3] while featuring the smallest costs forchanges to the design [4]. Optimization in these early design stages can only beachieved by generating and comparing design variants. To allow fordesign-integrated assessment of the environmental performance a simplified andtime-efficient method for LCA is needed. The additional effort for designers has tobe kept to a minimum to avoid barriers for assessment. Therefore, tools for LCAshould ideally be integrated in the usual design environment. Recently, varioussolutions to integrated LCA using BIM have been developed [5]. However, theconventional BIM is typically used in detailed design stages [6]. In early designstages, conceptional mass models are employed to quickly modify and generatevariants at a low level of detail. Therefore, this paper discusses the use of simplifieddigital building models—referred to as early BIM—for LCA. The objective is toallow for time-efficient improvement of the environmental performance in earlydesign at a point where many parameters needed for conventional BIM-LCAapproaches are still unknown. The proposed approach is applied to a case study ofthe conceptional design of a neighbourhood.
2 Early BIM-LCA Using Parametric Models
The early BIM-LCA approach uses simplified digital building representations.These 3D models only consist of surfaces instead of volumetric components, seeFig. 1. This approach is also referred to as “shoebox” models [7] and is commonlyemployed in thermal models for energy demand calculation. The input of interiorwalls can be further simplified by using a global factor instead of modelling eachindividual wall, provided in Minergie guidelines [8], for example.
For a simplified input of materials, a building component catalogue of typicallyemployed materials and heating, ventilation, and air conditioning (HVAC) systems
Fig. 1 Simplified buildingrepresentation using surfacesonly
270 A. Hollberg et al.
can be used. A variety of typical building components including LCA data can befound in many national catalogues, such as Bauteilkatalog [9] for Switzerland,Milieuprofiel van gebouwelementen [10] for Belgium, or Baubook [11] for Austria.
The calculation of the LCA is carried out using a parametric model [12]. Thedesigner can typically influence three categories of parameters of a building:geometry, materials and HVAC systems [12]. Each category consists of a numberof parameters, such as orientation, dimensions, window area, etc. for the geometry.
The parametric LCA approach combines the calculation of the operational andembodied environmental impact. The operational impact results from the use phaseof the building (life cycle module B6 according to EN 15978 [13]) and is based onan energy demand calculation using monthly energy balancing [14]. The embodiedimpact results from the material production, replacements and the end-of-life (lifecycle modules A1–A3, B4, C3, C4, and D). The implementation of the parametricLCA in a design tool such as Grasshopper [15] allows for a closed workflow ofinput, calculation, output without requiring any importing/exporting [16]. This isnecessary for comparing variants automatically and is the basis for computationaloptimization approaches.
The parametric approach allows an advanced user to define and adjust their ownweighting factors in order to consider the individual goals of the LCA study [16].Furthermore, it allows for employing different predefined weighting factors, such asthose from building certification systems. The DGNB system provided by theGerman Sustainable Building Council employs two criteria based on LCA andawards points for each [17]. These are weighted and combined into one indicatorcalled life cycle performance (LCP) [18]. This single indicator ranges from 0 to 1,with 1 being equal to 100% of the DGNB points related LCA criteria.
3 Case Study
In the following case study, the method is applied to the early design stages of ahypothetical residential neighbourhood providing a total gross floor area (GFA) of2500 m2.Between two and four buildings are located on a rectangular site in Potsdam,Germany. The storey height of all apartments is 3 m, and the buildings do not havebasements. The floor area ratio (FAR) is set to 0.6 and minimum and maximumdimensions are set to ensure reasonable sizing of the building volumes. The buildingscan have two to four floors and the glazing area is constantly 30% of the exterior wallarea. It is assumed that the net floor area (NFA) equals 0.8 � GFA. The functionalunit is 1 m2 NFA for 1 year, and the reference study period is 50 years. Both climateand user data are taken from DIN V 18599-10:2011 [19].
It is assumed that the design process occurs in two stages, first definition ofgeometry, and second choice of materials. The HVAC systems are not modifiedparametrically but fixed. The heating system is set to a gas-condensing boiler withan efficiency of 98%, no cooling is considered and the ventilation occurs naturally.
Design-Integrated LCA Using Early BIM 271
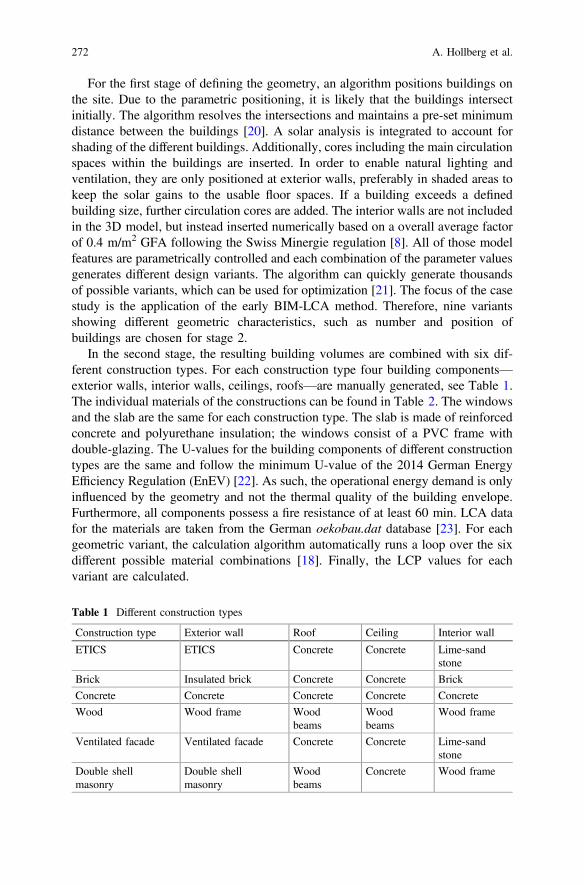
For the first stage of defining the geometry, an algorithm positions buildings onthe site. Due to the parametric positioning, it is likely that the buildings intersectinitially. The algorithm resolves the intersections and maintains a pre-set minimumdistance between the buildings [20]. A solar analysis is integrated to account forshading of the different buildings. Additionally, cores including the main circulationspaces within the buildings are inserted. In order to enable natural lighting andventilation, they are only positioned at exterior walls, preferably in shaded areas tokeep the solar gains to the usable floor spaces. If a building exceeds a definedbuilding size, further circulation cores are added. The interior walls are not includedin the 3D model, but instead inserted numerically based on a overall average factorof 0.4 m/m2 GFA following the Swiss Minergie regulation [8]. All of those modelfeatures are parametrically controlled and each combination of the parameter valuesgenerates different design variants. The algorithm can quickly generate thousandsof possible variants, which can be used for optimization [21]. The focus of the casestudy is the application of the early BIM-LCA method. Therefore, nine variantsshowing different geometric characteristics, such as number and position ofbuildings are chosen for stage 2.
In the second stage, the resulting building volumes are combined with six dif-ferent construction types. For each construction type four building components—exterior walls, interior walls, ceilings, roofs—are manually generated, see Table 1.The individual materials of the constructions can be found in Table 2. The windowsand the slab are the same for each construction type. The slab is made of reinforcedconcrete and polyurethane insulation; the windows consist of a PVC frame withdouble-glazing. The U-values for the building components of different constructiontypes are the same and follow the minimum U-value of the 2014 German EnergyEfficiency Regulation (EnEV) [22]. As such, the operational energy demand is onlyinfluenced by the geometry and not the thermal quality of the building envelope.Furthermore, all components possess a fire resistance of at least 60 min. LCA datafor the materials are taken from the German oekobau.dat database [23]. For eachgeometric variant, the calculation algorithm automatically runs a loop over the sixdifferent possible material combinations [18]. Finally, the LCP values for eachvariant are calculated.
Table 1 Different construction types
Construction type Exterior wall Roof Ceiling Interior wall
ETICS ETICS Concrete Concrete Lime-sandstone
Brick Insulated brick Concrete Concrete Brick
Concrete Concrete Concrete Concrete Concrete
Wood Wood frame Woodbeams
Woodbeams
Wood frame
Ventilated facade Ventilated facade Concrete Concrete Lime-sandstone
Double shellmasonry
Double shellmasonry
Woodbeams
Concrete Wood frame
272 A. Hollberg et al.
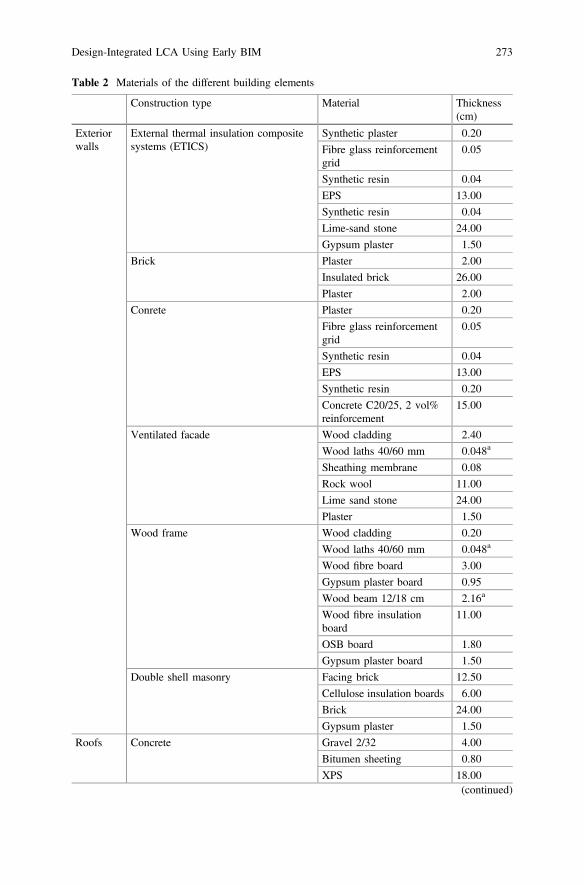
Table 2 Materials of the different building elements
Construction type Material Thickness(cm)
Exteriorwalls
External thermal insulation compositesystems (ETICS)
Synthetic plaster 0.20
Fibre glass reinforcementgrid
0.05
Synthetic resin 0.04
EPS 13.00
Synthetic resin 0.04
Lime-sand stone 24.00
Gypsum plaster 1.50
Brick Plaster 2.00
Insulated brick 26.00
Plaster 2.00
Conrete Plaster 0.20
Fibre glass reinforcementgrid
0.05
Synthetic resin 0.04
EPS 13.00
Synthetic resin 0.20
Concrete C20/25, 2 vol%reinforcement
15.00
Ventilated facade Wood cladding 2.40
Wood laths 40/60 mm 0.048a
Sheathing membrane 0.08
Rock wool 11.00
Lime sand stone 24.00
Plaster 1.50
Wood frame Wood cladding 0.20
Wood laths 40/60 mm 0.048a
Wood fibre board 3.00
Gypsum plaster board 0.95
Wood beam 12/18 cm 2.16a
Wood fibre insulationboard
11.00
OSB board 1.80
Gypsum plaster board 1.50
Double shell masonry Facing brick 12.50
Cellulose insulation boards 6.00
Brick 24.00
Gypsum plaster 1.50
Roofs Concrete Gravel 2/32 4.00
Bitumen sheeting 0.80
XPS 18.00(continued)
Design-Integrated LCA Using Early BIM 273

Table 2 (continued)
Construction type Material Thickness(cm)
Vapor barrier PA 0.30
Concrete C20/25, 4 vol%reinforcement
20.00
Gypsum plaster 1.50
Wood beams Bitumen sheeting 0.80
Wood fibre insulationboard
18.00
Vapor barrier PA 0.30
Wood planking 2.40
Wood beam 12/18 cm 2.16a
Cellings Concrete Tiles 1.00
Tile adhesive 0.80
Cement screed 6.00
Vapor barrier PE 0.02
Concrete C20/25, 4 vol%reinforcement
18.00
Gypsum plaster 1.50
Wood beams Parquet floor 2.00
Dry screed 2.50
Wood fibre footstep soundinsulation
2.00
Chipboard 2.50
Wood beam 12/18 cm 2.16
Vapor barrier PE 0.02
Wood laths 30/60 mm 0.036a
Wood cladding 2.40
Interiorwallls
Concrete Gypsum plaster 1.50
Concrete C20/25, 4 vol%reinforcement
10.00
Gypsum plaster 1.50
Lime-sand stone Gypsum plaster 1.50
Lime sand stone 11.50
Gypsum plaster 1.50
Brick Gypsum plaster 1.50
Brick 11.50
Gypsum plaster 1.50
Wood frame OSB board 1.80
Wood beam 6/8 cm 3.00a
Rock wool 7.50
OSB board 0.90(continued)
274 A. Hollberg et al.

4 Results
Combining nine geometric variants with six construction types results in 54 solu-tions. The results are visualized in a tree with two stages, see Fig. 2. The LCP showa high range of 0.376 between the minimum value of 0.580 (variant 7, concrete)and the maximum value 0.956 (variant 3, wood). The median of the six differentconstruction types is calculated to evaluate the geometry independently from thechoice of material. Variant 3 performs best according to the median LCP. Variant 3also achieves the maximum overall performance in stage 2, when the wood-basedconstruction variant is chosen. Variant 7 achieves least LCP according to themedian and performs worst in both cases, when choosing wood or concrete.
The difference between the median of worst and best geometric variant is 0.17showing that the influence of the geometry is significant. With a range of 0.22 LCP,the average range of the different material combinations is even higher. This clearlyshows the great importance of the choice of material. The best solutions can beachieved with the wooden construction for all geometries in this case study. Eventhe worst geometric variant with wooden construction performs better than the bestgeometric variant built in ETICS, brick, concrete or a ventilated façade, see Fig. 3.
5 Discussion
The results highlight the importance of materials choices. In this case study, themedian proves to be a robust indicator of the environmental performance in stage 2.It can be used to evaluate and rank design solutions in stage 1 without havingdefined the exact material. This is important for application in practice, becauseusually there is no time for elaborate studies, such as presented here. A simplemeasure to indicate the environmentally best performing variants to the design team
Table 2 (continued)
Construction type Material Thickness(cm)
Slabs Concrete Tiles 1.00
Tile adhesive 0.80
Cement screed 6.00
Vapor barrier PE 0.02
XPS 10.00
Bitumen sheeting 0.40
Concrete C20/25, 4 vol%reinforcement
25.00
Lean concrete 8.00aEquivalent thickness
Design-Integrated LCA Using Early BIM 275

Fig. 2 LCP results for design tree
276 A. Hollberg et al.
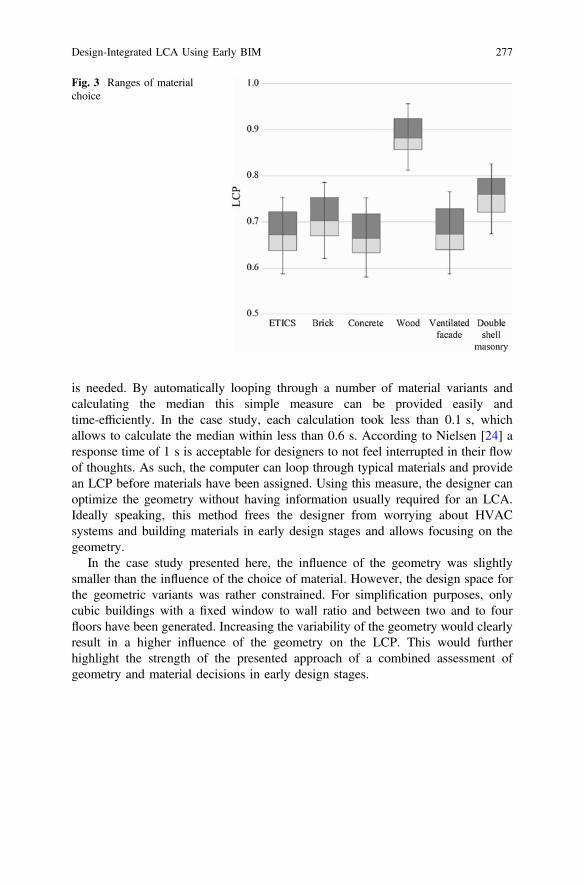
is needed. By automatically looping through a number of material variants andcalculating the median this simple measure can be provided easily andtime-efficiently. In the case study, each calculation took less than 0.1 s, whichallows to calculate the median within less than 0.6 s. According to Nielsen [24] aresponse time of 1 s is acceptable for designers to not feel interrupted in their flowof thoughts. As such, the computer can loop through typical materials and providean LCP before materials have been assigned. Using this measure, the designer canoptimize the geometry without having information usually required for an LCA.Ideally speaking, this method frees the designer from worrying about HVACsystems and building materials in early design stages and allows focusing on thegeometry.
In the case study presented here, the influence of the geometry was slightlysmaller than the influence of the choice of material. However, the design space forthe geometric variants was rather constrained. For simplification purposes, onlycubic buildings with a fixed window to wall ratio and between two and to fourfloors have been generated. Increasing the variability of the geometry would clearlyresult in a higher influence of the geometry on the LCP. This would furtherhighlight the strength of the presented approach of a combined assessment ofgeometry and material decisions in early design stages.
Fig. 3 Ranges of materialchoice
Design-Integrated LCA Using Early BIM 277

6 Conclusion and Outlook
Design-integrated, simplified LCA based on digital building models can help tomake informed environmental decisions during conceptual design. The earlyBIM-LCA approach using a parametric model presented here proves to be valuablefor quick variant comparison of neighbourhoods in early design stages. The sim-plified visualization and the use of a single indicator can help designers to makeinformed decisions based on the LCA results. These simplified approaches arenecessary to move from the current post-design evaluation of buildings to adesign-integrated assessment. This finally allows designers to improve the envi-ronmental performance of their buildings from the very beginning of the planningprocess.
Through the development towards nearly zero energy buildings, buildingsproduce more and more of the energy they need for operation themselves. As such,the integration of local energy production should be integrated in the assessment.This aspect could be easily integrated in the parametric LCA model. Furthermore,the link to further analysis methods, such as daylight availability could provide ameans to extend the early BIM-LCA to a more holistic performance evaluation toolin the future.
References
1. Wittstock B, Albrecht S, Makishi Colodel C, Lindner J. P, Hauser G, Sedlbauer K, Gebäudeaus Lebenszyklusperspektive − Ökobilanzen im Bauwesen, Bauphysik, vol. 31, 2009.
2. Hegger M, Fuchs M, Stark T, Zeumer M, Energie Atlas: Nachhaltige Architektur. Birkhäuser,2007.
3. Schneider C, Steuerung der Nachhaltigkeit im Planungs- und Realisierungsprozess von Büro-und Verwaltungsgebäuden. 2011.
4. Paulson Jr., B.C, Designing to Reduce Construction Costs, J. Constr. Div., vol. 102, no. 4,pp. 587–592, 1976.
5. Soust-Verdaguer B, Llatas C, García-Martínez A, Critical review of bim-based LCA methodto buildings, Energy Build., vol. 136, pp. 110–120, 2017.
6. Köhler M, Rhinos, Hoppers, CAD-Monkeys, Competition online, pp. 85–90, 2016.7. Dogan T, Reinhart C.F, Automated conversion of architectural massing models into thermal
‘shoebox’ models, BS2013 13th Conf. Int. Build. Perform. Simul. Assoc., pp. 3745–3752,2013.
8. Minergie, Berechnung der Grauen Energie bei MINERGIE-A®, MINERGIE-ECO®,MINERGIE-P-ECO® UND MINERGIE-A-ECO® BAUTEN, pp. 1–12, 2016.
9. Holliger Consult, Bauteilkatalog, 2002. [Online]. Available: http://www.bauteilkatalog.ch/ch/de/Bauteilkatalog.asp. [Accessed: 08-Aug-2017].
10. Allacker K, et al., Environmental Profile of Building elements, Towards an integratedenvironmental assessment of the use of materials in buildings, 2013.
11. IBO, “baubook,” 2014. [Online]. Available: www.baubook.at.12. Hollberg A, Ruth J, LCA in architectural design—a parametric approach, Int. J. Life Cycle
Assess., vol. 21, no. 7, pp. 943–960, Jul. 2016.
278 A. Hollberg et al.
13. CEN, EN 15978: Sustainability of construction works - Assessment of environmentalperformance of buildings - Calculation method. 2011.
14. Hollberg A, Lichtenheld T, Klüber N, Ruth J, Parametric real-time energy analysis in earlydesign stages: a method for residential buildings in Germany, Energy, Ecol. Environ., Mar.2017.
15. Rutten D, Grasshopper3D, 2015. [Online]. Available: http://www.grasshopper3d.com/.[Accessed: 08-Aug-2017].
16. Hollberg A, Parametric Life Cycle Assessment - Introducing a time-efficient method forenvironmental building design optimization. Bauhaus-Universitätsverlag, 2016.
17. German Sustainable Building Council, DGNB system, 2015. [Online]. Available: http://www.dgnb-system.de/en/. [Accessed: 08-Aug-2017].
18. Hollberg A, Klüber N, Schneider S, Ruth J, Donath D, A Method for Evaluating theEnvironmental Life Cycle Potential of Building Geometry,” in Systems Thinking in the BuiltEnvironment. Sustainable Built Environment (SBE) Regional Conference Zurich 2016, 2016,pp. 590–595.
19. DIN, DIN V 18599-10:2011 Energetische Bewertung von Gebäuden – Berechnung des Nutz-,End- und Primärenergiebedarfs für Heizung, Kühlung, Lüftung, Trinkwarmwasser undBeleuchtung – Teil 10: Nutzungsrandbedingungen, Klimadaten. DIN Deutsches Institut fürNormung e. V., pp. 1–102, 2011.
20. Tschetwertak J, Schneider S, Hollberg A, Donath D, Ruth J, A Matter of Sequence -Investigating the Impact of the Order of Design Decisions in Multi-Stage Design Processes, inComputer-Aided Architectural Design Future Trajectories 17th International Conference,CAAD Futures 2017 Istanbul, Turkey, July 12–14, 2017 Selected Papers, G. Çağdaş, M.Özkar, G. Ethem, and L. F. Gül, Eds. Springer Nature Singapore Pte Ltd., 2017, pp. 100–120.
21. Tschetwertak J, Schneider D, Hollberg A, Donath D, Ruth J, Does the sequence matter? –
Investigating the impact of the order of design decisions on the Life Cycle Performance, inWorld Sustainable Built Environment Conference 2017 Hong Kong, 2017, no. June,pp. 1933–1938.
22. Bundesregierung, EnEV 2014: Energieeinsparverordnung - Nichtamtliche Lesefassung zurZweiten Verordnung zur Änderung der Energieeinsparverordnung vom 18. November 2013.Germany: Bundesanzeigerverlag, 2013, pp. 1–90.
23. BBSR, ökobau.dat. Bundesministerium für Umwelt, Naturschutz, Bau und Reaktorsicherheit,2015.
24. Nielsen J, Usability Engineering. Academic Press, 1993.
Open Access This chapter is licensed under the terms of the Creative Commons Attribution 4.0International License (http://creativecommons.org/licenses/by/4.0/), which permits use, sharing,adaptation, distribution and reproduction in any medium or format, as long as you give appropriatecredit to the original author(s) and the source, provide a link to the Creative Commons license andindicate if changes were made.The images or other third party material in this chapter are included in the chapter’s Creative
Commons license, unless indicated otherwise in a credit line to the material. If material is notincluded in the chapter’s Creative Commons license and your intended use is not permitted bystatutory regulation or exceeds the permitted use, you will need to obtain permission directly fromthe copyright holder.
Design-Integrated LCA Using Early BIM 279
A Proposition to Extend CityGMLand ADE Energy Standardsfor Exchanging Information for LCASimulation at Urban Scale
Adélaïde Mailhac, Emmanuelle Cor, Marine Vesson, Elisa Rolland,Pascal Schetelat, Nicoleta Schiopu and Alexandra Lebert
Abstract Environmental performances assessment of urban projects is essential tomeet the current challenges of urban sustainable development. In recent years, LifeCycle Assessment (LCA) has been applied to urban scale to assess complex sys-tems such as districts, urban facilities and territories. Yet, application of LCA tolarge scale is challenging in terms of data modelling. To overcome this challenge,integration of Building Information Model (BIM) to LCA could reduce effortsduring the data acquisition, as well as allowing the feedback of LCA results intoBIM. To ensure interoperability e.g. with energy simulation tools, digital mock-upusing an open information standard must be preferred. To answer this need, theOpen Geospatial Consortium (OGC) developed the open standard CityGML whichis an XML-based data model that defines classes and relations for 3D object incities (e.g. buildings, roads, water bodies etc.). This format also provides fordomain-specific extension to other objects or attributes using Application DomainExtensions (ADE). To date, LCA data requirements have not been fully integratedinto the CityGML format nor its ADE. The aim of this paper is to propose extensionof CityGML and Energy-ADE standards for exchanging information for LCAsimulation at urban scale. The scope of the study is limited to the integration ofinformation necessary for LCA of buildings’ construction and renovation. First,data requirements are listed and then compared to CityGML and Energy-ADE
A. Mailhac (&) � E. Cor � M. Vesson � E. Rolland � P. SchetelatN. Schiopu � A. LebertScientific and Technical Center for Buildings (CSTB),University Paris-East, Champs-sur-Marne, Francee-mail: [email protected]
A. MailhacLaboratoire Matériaux et Durabilité Des Constructions (LMDC), INSA/UPSGénie Civil, Federal University of Toulouse Midi-Pyrénées, Toulouse, France
A. Mailhac � E. Cor � P. Schetelat � N. Schiopu � A. LebertITE Efficacity, Champs-Sur-Marne, France
© The Author(s) 2018E. Benetto et al. (eds.), Designing Sustainable Technologies,Products and Policies, https://doi.org/10.1007/978-3-319-66981-6_31
281
structures to identify missing information. Finally, propositions and recommenda-tions are presented to fully integrate information needed for LCA at urban scale intoCityGML and Energy-ADE. This paper paves the way for further integration ofLCA models with CityGML.
1 Introduction
In the construction sector, LCA has been used since the 1990s to evaluate con-struction products and buildings [1]. For few years, LCA has extended to urbanscale, and is more and more used to assess urban precincts and building stocks atlarge scales [2]. Performing LCA at building and urban scale requires to collectlarge amount of information -data- on the foreground system to complete the lifecycle inventory (LCI). This routine of data collection is time and effort consumingif repeated for different simulations (e.g. energy, cost, environment simulations) [3].On the other hand, the integration of Building Information Model or Modelling(BIM) to building and urban LCA can reduce efforts during data acquisition, as wellas allowing feedback of LCA results into BIM for results visualization.
Building Information Modelling (BIM) is a working process where digitalrepresentations of physical and functional characteristics of building and civilengineering objects are processed and managed. Building information models(BIMs) are data stocked in files which can be exchanged or networked to supportexpert analysis and decisions about a building or other built asset. They containinformation regarding objects, geo-localization, geometry and semantic data [4].
In order to ensure interoperability with different software (e.g. with energysimulation tools), digital mock-up using an open information standard must bepreferred.
1.1 Open BIM Standards at Building Scale
BIM is often associated with open data structures for representing information suchas the Industry Foundation Classes (IFC) and Green Building XML (gbXML)formats at building scale and LandXML and CityGML formats at urban scale. Suchdata structures are intended to describe building and civil engineering constructionindustry data in a neutral and open manner i.e. they are open file formats that are notcontrolled by a company or a group [4].
At building scale, IFC format has a wide scope and is compliant with datarequirements of building LCA [5] while gbXML format is specific to export data usedby energy tools [6]. Some building specific LCA tools are already compatible with theIFC and gbXML formats. These international open formats ensure that anyArchitecture/Engineering/Construction (AEC) software understand and operateproperly technical and geometrical information from BIM [3]. They greatly enhanceinteroperability between AEC software.
282 A. Mailhac et al.

1.2 The CityGML Format and Its Application DomainExtensions (ADE)
At urban scale, the international open standard CityGML is an XML-based datamodel that defines classes and relations for 3D object in cities (e.g. buildings, roads,water bodies etc.). This format also provides for domain-specific extension to otherobjects or attributes using Application Domain Extensions (ADE) [4].
The Energy-ADE extends the CityGML Standard by features and propertiesnecessary to perform urban energy simulation and to store the corresponding results[7, 8]. It contains information concerning construction, materials, building occu-pancy, energy and systems. Moreover, developers of this ADE highlight that “theEnergy ADE is structured modularly in order to potentially reuse and extend someof its modules in other domains and applications” [8]. In other words, the datamodel developed in this ADE can be potentially extended to integrate data requiredfor urban scale LCA.
To date, no LCA tools or studies were identified that developed a link withCityGML files to perform urban scale LCI. An important issue related to theintegration of BIM and LCA at urban scale is that LCA data requirements have notbeen fully integrated into the CityGML format nor its ADE.
1.3 Aims and Approach
The aim of this paper is to propose ways for extension of CityGML andEnergy-ADE standards in order to exchange information for LCA simulation aturban scale. The scope of the study is limited to the integration of informationnecessary for LCA of buildings’ construction and renovation. First, data require-ments are listed and then compared to CityGML and Energy-ADE structures toidentify missing information. Finally, propositions and recommendations are pre-sented to fully integrate information needed for LCA at urban scale into CityGMLand Energy-ADE.
2 Identification of Data Needs for LCA at Urban Scale
2.1 LCA Methodology at Urban Scale
To perform LCA at urban scale, the physical boundaries of the urban project understudy have to be defined. All objects and flows located within these physicalboundaries are identified. This includes in particular the following objects:
A Proposition to Extend CityGML … 283
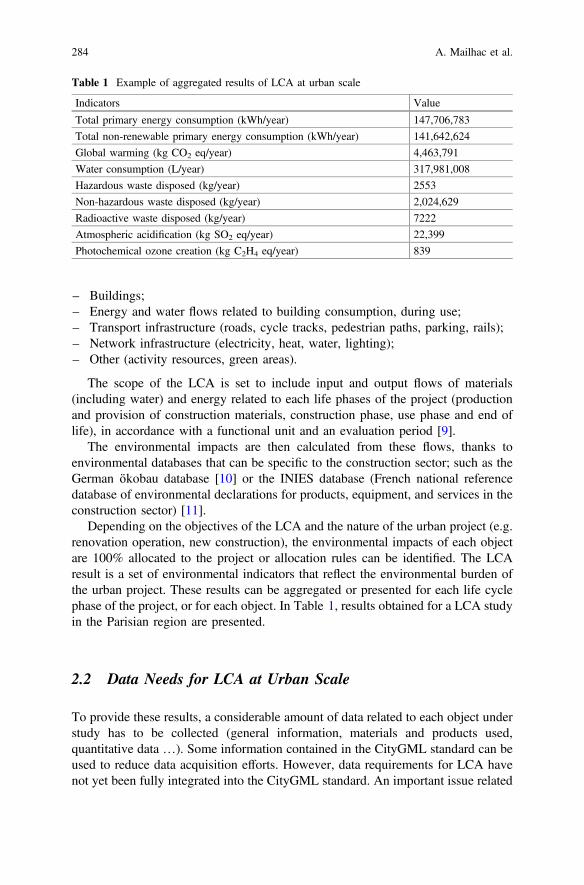
– Buildings;– Energy and water flows related to building consumption, during use;– Transport infrastructure (roads, cycle tracks, pedestrian paths, parking, rails);– Network infrastructure (electricity, heat, water, lighting);– Other (activity resources, green areas).
The scope of the LCA is set to include input and output flows of materials(including water) and energy related to each life phases of the project (productionand provision of construction materials, construction phase, use phase and end oflife), in accordance with a functional unit and an evaluation period [9].
The environmental impacts are then calculated from these flows, thanks toenvironmental databases that can be specific to the construction sector; such as theGerman ökobau database [10] or the INIES database (French national referencedatabase of environmental declarations for products, equipment, and services in theconstruction sector) [11].
Depending on the objectives of the LCA and the nature of the urban project (e.g.renovation operation, new construction), the environmental impacts of each objectare 100% allocated to the project or allocation rules can be identified. The LCAresult is a set of environmental indicators that reflect the environmental burden ofthe urban project. These results can be aggregated or presented for each life cyclephase of the project, or for each object. In Table 1, results obtained for a LCA studyin the Parisian region are presented.
2.2 Data Needs for LCA at Urban Scale
To provide these results, a considerable amount of data related to each object understudy has to be collected (general information, materials and products used,quantitative data …). Some information contained in the CityGML standard can beused to reduce data acquisition efforts. However, data requirements for LCA havenot yet been fully integrated into the CityGML standard. An important issue related
Table 1 Example of aggregated results of LCA at urban scale
Indicators Value
Total primary energy consumption (kWh/year) 147,706,783
Total non-renewable primary energy consumption (kWh/year) 141,642,624
Global warming (kg CO2 eq/year) 4,463,791
Water consumption (L/year) 317,981,008
Hazardous waste disposed (kg/year) 2553
Non-hazardous waste disposed (kg/year) 2,024,629
Radioactive waste disposed (kg/year) 7222
Atmospheric acidification (kg SO2 eq/year) 22,399
Photochemical ozone creation (kg C2H4 eq/year) 839
284 A. Mailhac et al.

to the integration of LCA data into the CityGML is related to the diversity of dataneeded, and to its quality, which can affect the precision of the results.
Data needs have been identified based on our experience from the developmentof the building LCA tool Elodie [12] and based on data requirements of the futureFrench building regulation 2020 initiated by the “Energy- Carbon” labelling pro-cess [13]. Depending on the objective of the LCA study, and the data availability, ascreening, simplified or complete/detailed LCA approach can be applied [14]. Inthis paper, we focus on data structuring for the environmental evaluation ofbuilding objects and energy consumption during use. Data structuring for envi-ronmental evaluation of other objects such as transport or utility infrastructures arenot addressed in this work. Data needs considered in this work for environmentalevaluation at urban scale of building objects can be structured into three categories,which are described below.
2.2.1 Building Object: General Data
General information, related to each building object inside the area under study isincluded into this module of data. The geometry of the building, height, number offloors and floor area are used for the quantification of construction materials whendetailed data is not available. The building typology (e.g. individual house, col-lective dwelling, office building …) is also needed when no detailed data aboutconstruction materials is available. This will mainly help the application of envi-ronmental indicators ratios for the evaluation depending on the typology. Othergeneral data, such as construction year, number of occupants, housing units, type ofoperation (new construction or renovation) has to be collected. Table 2
Table 2 Data needs forbuilding object, general data
Data needs Type (unit if specified)
Building typology CodeList
Floor area Decimal (m2)
Geometry Geometry
Construction year Date
Number of storeys Integer
Height Decimal
Type of operation CodeList
Number of occupants Integer
Housing units Integer
Glazing ratio Decimal
Renovation actions String
Main structure type CodeList
Main structural material CodeList
Main filling material in facade CodeList
Foundation type CodeList
A Proposition to Extend CityGML … 285
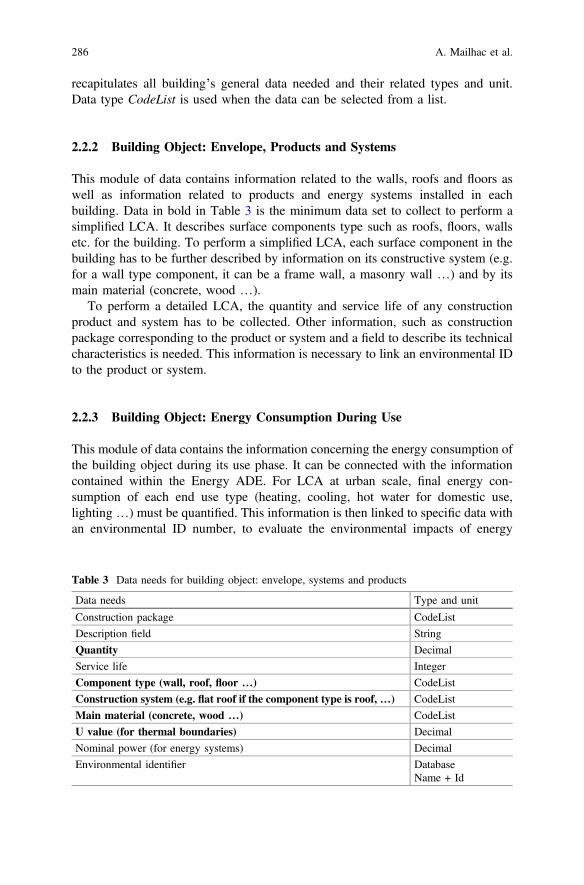
recapitulates all building’s general data needed and their related types and unit.Data type CodeList is used when the data can be selected from a list.
2.2.2 Building Object: Envelope, Products and Systems
This module of data contains information related to the walls, roofs and floors aswell as information related to products and energy systems installed in eachbuilding. Data in bold in Table 3 is the minimum data set to collect to perform asimplified LCA. It describes surface components type such as roofs, floors, wallsetc. for the building. To perform a simplified LCA, each surface component in thebuilding has to be further described by information on its constructive system (e.g.for a wall type component, it can be a frame wall, a masonry wall …) and by itsmain material (concrete, wood …).
To perform a detailed LCA, the quantity and service life of any constructionproduct and system has to be collected. Other information, such as constructionpackage corresponding to the product or system and a field to describe its technicalcharacteristics is needed. This information is necessary to link an environmental IDto the product or system.
2.2.3 Building Object: Energy Consumption During Use
This module of data contains the information concerning the energy consumption ofthe building object during its use phase. It can be connected with the informationcontained within the Energy ADE. For LCA at urban scale, final energy con-sumption of each end use type (heating, cooling, hot water for domestic use,lighting …) must be quantified. This information is then linked to specific data withan environmental ID number, to evaluate the environmental impacts of energy
Table 3 Data needs for building object: envelope, systems and products
Data needs Type and unit
Construction package CodeList
Description field String
Quantity Decimal
Service life Integer
Component type (wall, roof, floor …) CodeList
Construction system (e.g. flat roof if the component type is roof,…) CodeList
Main material (concrete, wood …) CodeList
U value (for thermal boundaries) Decimal
Nominal power (for energy systems) Decimal
Environmental identifier DatabaseName + Id
286 A. Mailhac et al.
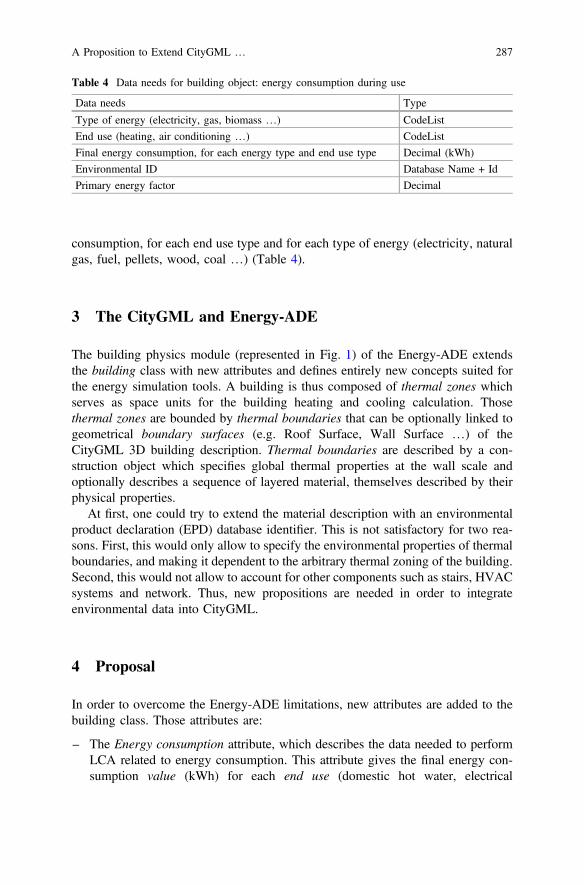
consumption, for each end use type and for each type of energy (electricity, naturalgas, fuel, pellets, wood, coal …) (Table 4).
3 The CityGML and Energy-ADE
The building physics module (represented in Fig. 1) of the Energy-ADE extendsthe building class with new attributes and defines entirely new concepts suited forthe energy simulation tools. A building is thus composed of thermal zones whichserves as space units for the building heating and cooling calculation. Thosethermal zones are bounded by thermal boundaries that can be optionally linked togeometrical boundary surfaces (e.g. Roof Surface, Wall Surface …) of theCityGML 3D building description. Thermal boundaries are described by a con-struction object which specifies global thermal properties at the wall scale andoptionally describes a sequence of layered material, themselves described by theirphysical properties.
At first, one could try to extend the material description with an environmentalproduct declaration (EPD) database identifier. This is not satisfactory for two rea-sons. First, this would only allow to specify the environmental properties of thermalboundaries, and making it dependent to the arbitrary thermal zoning of the building.Second, this would not allow to account for other components such as stairs, HVACsystems and network. Thus, new propositions are needed in order to integrateenvironmental data into CityGML.
4 Proposal
In order to overcome the Energy-ADE limitations, new attributes are added to thebuilding class. Those attributes are:
– The Energy consumption attribute, which describes the data needed to performLCA related to energy consumption. This attribute gives the final energy con-sumption value (kWh) for each end use (domestic hot water, electrical
Table 4 Data needs for building object: energy consumption during use
Data needs Type
Type of energy (electricity, gas, biomass …) CodeList
End use (heating, air conditioning …) CodeList
Final energy consumption, for each energy type and end use type Decimal (kWh)
Environmental ID Database Name + Id
Primary energy factor Decimal
A Proposition to Extend CityGML … 287

Fig.1
Current
structureof
energy
-ADEbu
ildingph
ysicsmod
ule
288 A. Mailhac et al.
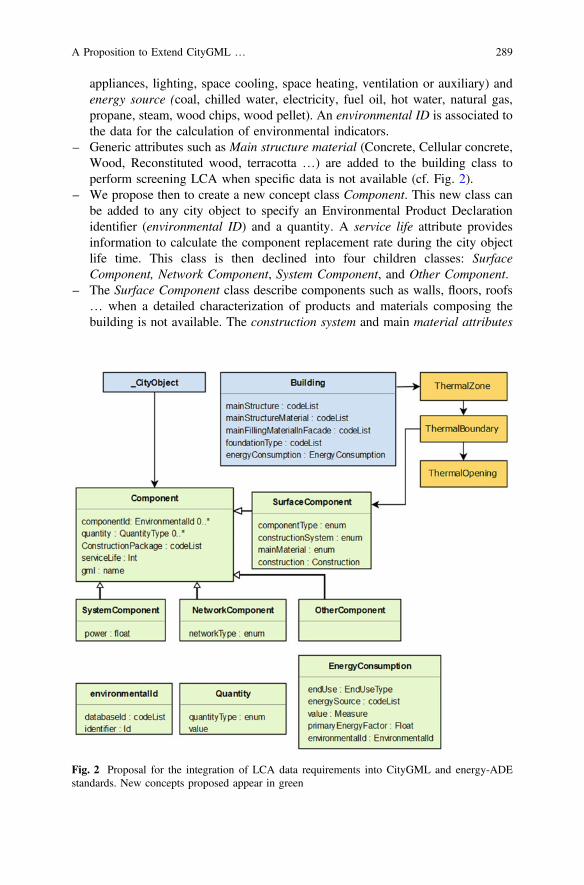
appliances, lighting, space cooling, space heating, ventilation or auxiliary) andenergy source (coal, chilled water, electricity, fuel oil, hot water, natural gas,propane, steam, wood chips, wood pellet). An environmental ID is associated tothe data for the calculation of environmental indicators.
– Generic attributes such as Main structure material (Concrete, Cellular concrete,Wood, Reconstituted wood, terracotta …) are added to the building class toperform screening LCA when specific data is not available (cf. Fig. 2).
– We propose then to create a new concept class Component. This new class canbe added to any city object to specify an Environmental Product Declarationidentifier (environmental ID) and a quantity. A service life attribute providesinformation to calculate the component replacement rate during the city objectlife time. This class is then declined into four children classes: SurfaceComponent, Network Component, System Component, and Other Component.
– The Surface Component class describe components such as walls, floors, roofs… when a detailed characterization of products and materials composing thebuilding is not available. The construction system and main material attributes
Fig. 2 Proposal for the integration of LCA data requirements into CityGML and energy-ADEstandards. New concepts proposed appear in green
A Proposition to Extend CityGML … 289
give a generic description of the surface component, which supports simplifiedLCA. Information contained in the construction attribute can be used to specifymore precisely the surface component.
– The three other children classes (Network Component, System Component, andOther Component) describe individual products, systems and networks in thebuilding when detailed information is available. A gml name is defined tocharacterize the component (e.g. Concrete stairway, Individual boiler etc.).Through this description, the link to an environmental ID related to the product,system or network can be done. Specific information for the systems such asnominal power for system components and network type for network componentshas to be recorded. A Construction Package is allocated to any component. Thisallows the aggregation of LCA results for each construction packages such as:
– Roads and networks,– Foundations and infrastructures,– Superstructure/Masonry,– Roofing/Frame/Waterproofing,– Partitioning/Doubling/Interior carpentry,– Facades/Exterior Carpentry,– Coverings (floor, wall, ceilings)/Decoration products,– HVAC,– Plumbing-sanitary,– Energy networks (high voltage) and communication networks (low voltage)– Equipment for local electricity production.
Figure 2 recapitulates the proposed structure for environmental data.
5 Conclusion and Perspectives
In this paper, propositions and recommendations are presented to integrate infor-mation needed for building LCA at urban scale into CityGML and Energy-ADE.The structure proposed is meant to be suitable for screening, simplified or detailedLCA of the building. Validation of this new developments will be achieved throughan iterative process. During the next months, a test phase will allow confronting theproposed data structure with real projects and software integration issues. Inaddition, the structure and the completeness of the schema should be discussedwithin the LCA practitioners’ and Energy-ADE developers’ communities.
Moreover, this work is limited to the description of building components, sys-tems and energy consumption. To perform full life cycle assessment of building asdefined by the European standard EN 15 978 [15], further work is required tointegrate information on water consumption, waste production, mobility needs andworksite. Finally, to perform urban scale LCA, information required on utilitynetworks, transport infrastructures and public spaces should be listed and integratedinto the CityGML standard.
290 A. Mailhac et al.
References
1. Khasreen M. M, Banfill P. F. G, Menzies G.F, Life-Cycle Assessment and the EnvironmentalImpact of Buildings: A Review, Sustainability, vol. 1, no 3, p. 674–701, 2009.
2. Mastrucci A, Marvuglia A, Leopold U, Benetto E, Life Cycle Assessment of building stocksfrom urban to transnational scales: A review, Renew. Sustain. Energy Rev., vol. 74, p. 316–332, 2017.
3. Jrade A, Abdulla R, Integrating building information modeling and life cycle assessment toolsto design sustainable buildings, in International Conference of CIB W, 2012, vol. 78, p. 29.
4. Lebègue E, Celnik O, BIM & maquette numérique: Pour l’architecture, le bâtiment et laconstruction, Paris; Marne-la-Vallée: Eyrolles, 2014. (in French).
5. Bazjanac V, Crawley D.B, The Implementation of Industry Foundation Classes in SimulationTools for the Building Industry, Lawrence Berkeley Natl. Lab., 1997.
6. <http://www.gbxml.org/>, Accessed 27-06-2017.7. Nouvel R, et al., Genesis of the citygml energy ADE, in Proceedings of International
Conference CISBAT 2015 Future Buildings and Districts Sustainability from Nano to UrbanScale, 2015, p. 931–936.
8. Nouvel R, et al., Development of the citygml application domain extension energy for urbanenergy simulation, in 14th international conference of the international building performancesimulation association (IBPSA). Retrieved from <http://www.bs2015.in/files/BS2015Proceeding.pdf>, 2015.
9. Mailhac A, et al., LCA applicability at district scale demonstrated throughout a case study:shortcomings and perspectives for future improvements, in Sustainable Built EnvironmentConference, Zurich, 2016.
10. «Informationsportal Nachhaltiges Bauen». <http://www.nachhaltigesbauen.de/>, Accessed21-09-2017.
11. INIES, Les données environnementales et sanitaires de référence pour le bâtiment, <http://www.inies.fr/accueil/>, Accessed 27-06-2017.
12. ELODIE, <http://www.elodie-cstb.fr/>, Accessed 21-08-2016.13. Bâtiment à Énergie Positive & Réduction Carbone, <http://www.batiment-energiecarbone.fr/
evaluation/cadre/>, Accessed 25-07-2017.14. Wittstock B, et al., EEBguide Operational Guidance for Life Cycle Assessment Studies of the
Energy Efficient Buildings Initiative, 2012, Available on http://www.eebguide.eu/.15. CEN, European standard EN 15 978 Sustainability of construction works—Assessment of
environmental performance of buildings—Calculation method, 2011.
Open Access This chapter is licensed under the terms of the Creative Commons Attribution 4.0International License (http://creativecommons.org/licenses/by/4.0/), which permits use, sharing,adaptation, distribution and reproduction in any medium or format, as long as you give appropriatecredit to the original author(s) and the source, provide a link to the Creative Commons license andindicate if changes were made.The images or other third party material in this chapter are included in the chapter’s Creative
Commons license, unless indicated otherwise in a credit line to the material. If material is notincluded in the chapter’s Creative Commons license and your intended use is not permitted bystatutory regulation or exceeds the permitted use, you will need to obtain permission directly fromthe copyright holder.
A Proposition to Extend CityGML … 291
Dynamic Assessment of Nature BasedSolutions Through Urban Level LCA
Duygu Başoğlu, Emre Yöntem, Seda Yöntem, Beril Şenyurtand Özge Yılmaz
Abstract Planning Nature Based Solutions (NBS) to address urban challengesrequires an approach that embeds the multiple dimensions of NBS to effectivelyportray their use and impact. Life Cycle Assessment (LCA) provides a compre-hensive assessment methodology in this regard. This paper discusses the environ-mental assessment of NBS via LCA using urban metabolism as an overarchingapproach to model the urban ecosystem. Performing a dynamic assessment withtime series data is suggested as a way of identifying hotspots of the indicatorsstudied within a determined time frame, allowing the assessor to observe andmitigate extremities and make informed decisions on desired temporal patterns.Dynamic assessment is supported by two simulation methodologies: BuildingInformation Modelling for the built environment and Agent Based Modelling forsocial behavioural patterns.
1 Introduction
Cities consume 75% of the world’s resources, generate around 75% of greenhousegas emissions globally, and are responsible for 60–80% of energy consumptionaround the world [5]. Poverty and urban decay are rising problems. Yet urban-ization is also inevitable as a necessity to accommodate the growing world popu-lation in limited land, and as hubs that provide economic, social and environmentalpotential. Over half of the world’s population lives in cities, with more than 20% incities with a population over 1,000,000, while cities occupy less than 2% of thesurface area of the earth. Urban areas generate around 80% of the global economicoutput [1–5]. This is made possible by the critical density provided by cities asarenas of agglomeration economies and sharing [6].
D. Başoğlu (&) � E. Yöntem � S. Yöntem � B. Şenyurt � Ö. YılmazEkodenge Consultancy Engineering Architecture Inc., 06800 Ankara, Turkeye-mail: [email protected]
© The Author(s) 2018E. Benetto et al. (eds.), Designing Sustainable Technologies,Products and Policies, https://doi.org/10.1007/978-3-319-66981-6_32
293
Rapid urbanization following the industrial revolution has shaped cities asconsumers of resources, pictured in a frame of antagonism with nature. However,UN HABITAT points that today cities stand out as land use efficient accommo-dations for large populations: they actually need four times less land and ten timesless local road than rural areas [1]. Yet this also indicates a concentrated demand forvarious resources, which may exceed local supply and require consumption ofcommodities produced all around the world and transported in long distances.Improving the quality, resilience and resource efficiency of urban space is the key tomaintain them as sustainable alternatives to sprawl which consumes agriculturalland and the wilderness.
Many opportunities exist for cities to tackle the challenge of sustainability. Citiesneed to follow the example of natural ecosystems and their metabolisms to bereformulated as balanced, circular, and to whatever possible extent, self-sustainingsystems. Whether man-made or based on natural ecosystems, different alternativesshould be evaluated and prioritized with regards to their potential to achieve sus-tainability goals by means of a sound assessment methodology. A way of designingnatural elements as a tool for sustainability in cities is called Nature Based Solutions(NBS). NBS are means of bringing nature back into cities for the provision ofecosystem services and related environmental, social and economic benefits as atool for achieving urban sustainability.
This paper studies urban scale life cycle assessment (LCA) as a comprehensiveassessment methodology and its application to assessing NBS. Considering thatachieving grounded results through LCA is highly dependent on data, the mainchallenge is modelling urban space efficiently to portray the network of resources,environmental impact, and the behavioural impact on citizens. Opportunitiesbrought by the capability to generate and process more data lead to discussionsregarding adding dynamic elements to LCA, which is inherently static. The urbanmetabolism approach seeks to model the city as a system of flows that creates inputsand outputs, while generating results from the interactions of flows, as in themetabolism analogy. Further discussions focus dynamic modelling to comprehendthe changing trends of flows, and on integrating time series data for this. Theconcept of agent-based modelling (ABM) is discussed for the social layer of theurban area and behavioural changes. The use of building information modelling(BIM) is finally discussed to provide time series data for the built environment,enabling a more precise estimation of flows related to energy, consumption andpollution.
2 Nature Based Solutions
NBS are defined as interventions inspired or supported by nature and suit many ofthe dynamic challenges cities face as they respond to multiple purposes. They areoften resilient, adaptable, resource efficient, locally adjustable and optimized [7–9].The term “Nature Based Solutions” entered scientific literature in the agricultural
294 D. Başoğlu et al.
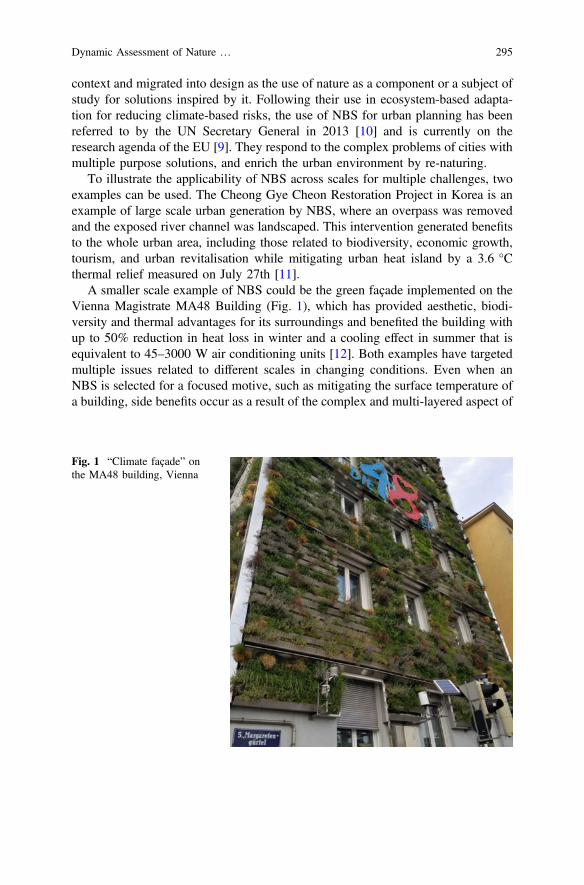
context and migrated into design as the use of nature as a component or a subject ofstudy for solutions inspired by it. Following their use in ecosystem-based adapta-tion for reducing climate-based risks, the use of NBS for urban planning has beenreferred to by the UN Secretary General in 2013 [10] and is currently on theresearch agenda of the EU [9]. They respond to the complex problems of cities withmultiple purpose solutions, and enrich the urban environment by re-naturing.
To illustrate the applicability of NBS across scales for multiple challenges, twoexamples can be used. The Cheong Gye Cheon Restoration Project in Korea is anexample of large scale urban generation by NBS, where an overpass was removedand the exposed river channel was landscaped. This intervention generated benefitsto the whole urban area, including those related to biodiversity, economic growth,tourism, and urban revitalisation while mitigating urban heat island by a 3.6 °Cthermal relief measured on July 27th [11].
A smaller scale example of NBS could be the green façade implemented on theVienna Magistrate MA48 Building (Fig. 1), which has provided aesthetic, biodi-versity and thermal advantages for its surroundings and benefited the building withup to 50% reduction in heat loss in winter and a cooling effect in summer that isequivalent to 45–3000 W air conditioning units [12]. Both examples have targetedmultiple issues related to different scales in changing conditions. Even when anNBS is selected for a focused motive, such as mitigating the surface temperature ofa building, side benefits occur as a result of the complex and multi-layered aspect of
Fig. 1 “Climate façade” onthe MA48 building, Vienna
Dynamic Assessment of Nature … 295
natural elements. This portrays the need for assessment and decision support toolsthat can model complex relations and integrate the multiple benefits of NBS toeffectively support their use in addressing urban challenges.
3 Urban Scale LCA for the Evaluation of NBS
3.1 Life Cycle Assessment (LCA) and UrbanMetabolism (UM)
As stated earlier, urban activities are among the major sources of sustainabilityissues, in particular global climate change; yet, they are also highly vulnerable tothe effects of such issues. Through utilization of various assessment tools rangingfrom indicators to complex models, urban sustainability assessment providesinsight to the current state of the environment, causes of environmental impacts,hotspots among these causes, which ultimately lead to performance evaluation ofinitiatives and policies for sustainable urban development [13]. Consequently, it isimperative to conduct sustainability assessment for monitoring and measuring thepast or current environmental pressures, states, or impacts of urban areas. Urbanassessments help cities to identify main bottlenecks regarding resilience, vulnera-bility to climate change, food, water and energy security issues and develop soundstrategies or policies to tackle them.
LCA is a holistic methodology capable of revealing a broad range of environ-mental impacts in a systematic way and has been widely used for urban sustain-ability assessment [17]. Through LCA, it is possible to go beyond inventoryingdirect consumption and emissions, and consider transboundary or cross mediaeffects embedded in urban flows and stocks. Of course, this is only possible bymeans of reflecting the complexity of urban systems, which are comprised of layersof sub-systems in LCA system models.
NBS are among the strategies that can benefit from such a holistic assessmentdue to their utility under themes including greenhouse gas emissions, biodiversity,water, urban food, air and health [14]. Moreover, LCA is also suitable to addressthe multi layered nature of NBS as it covers various environmental mechanismsrevealing information on different impacts at different scales that apply to mid-pointand end-point results.
To be able to reach the desired level of representation of complex urban systems,the conceptual models developed during system boundary definition stage of LCAcan benefit from the urban metabolism (UM) approach. This is a good foundationfor identifying the relevant urban flows within the system boundary and theirinteractions. The UM approach is based on an analogy for the resource con-sumption and waste generation of cities, resembling the requirement for nutrient
296 D. Başoğlu et al.
intake, energy demand, consequent growth and production of metabolic wastes of aliving organism [17]. It is defined as “a broad range of quantitative methods thatattempt to conceptualize urban areas as organisms, requiring goods and energy tomaintain functionality and support growth, while emitting waste as a by-product”[15]. Due to the complexity of urban systems, they can be considered to be moresimilar to ecosystems encompassing a group of multiple individuals, located withintheir environment, interacting among themselves and in a place [16] rather thansingle organisms. UM supports LCA by allowing the practitioner to analyseinterlinked urban sub-systems from a holistic point of view.
UM of cities can be studied alternatively by different approaches, one of which isOdum’s emergy approach, which describes the accounting of UM flows in terms of(solar) energy equivalents, thus translating city’s flows of material, nutrient, ser-vices and wastes in one common unit of measurement [17]. Beyond conceptualsystem model definition, UM also supports LCA through the identification of urbanmetabolic flows. This identification entails two basic types of cycles within thecities; the operating cycle and investment cycle. Operating cycle is comprised of thecontinuous flows within the system boundary, whereas the investment cycle con-tains the flows that turn into stock, which has a non-continuous and accumulativecharacter [18]. By analysing these different types of urban cycles, UM approachallows us to monitor the temporal changes within cities and supports dynamic urbanLCA studies. This can enable the assessor to identify hotspots of the indicatorstudied within the determined period of time, allowing to identify and mitigateextremities, make decisions based on desired performance patterns over time andoptimize the life span of the study.
Although LCA is a methodologically well-established assessment with applicableISO standards 14040 and 14044, data availability and quality can become importantbottlenecks for an LCA study. This limitation imposed can be more pronounced forcomplex urban systems, where without proper inclusion of all relevant data on flows,benefits of sustainability strategies with multiple target improvements such as NBScannot be revealed. Furthermore, the evaluation of resilience issues and decisions onadaptation and mitigation strategies for cities is highly dependent not only on thecurrent status of the environment but also on future trends. Finally, the environmentalperformance of cities, their vulnerability to extreme events and the availability ofresources to all citizens in fairness has direct implications on social structure.Therefore, sustainability assessment needs to consider problems of urban planninginterlinked to its scope and cover social aspects.
The question here is how to amend and support environmental sustainabilityassessment through LCA with additional tools. Opportunities in achieving datafor such a tool lie in supplementing LCA with BIM and dynamic socialassessment.
Dynamic Assessment of Nature … 297
3.2 A Data Centric Approach for Urban Level ComplexAssessments
Just like the accuracy and precision of an LCA study being highly dependent ondata quality, urban metabolism models also rely on obtaining and generatingrealistic data as pointed earlier. This leads the practitioner to a data centric approachfor urban level complex assessments which can be based on a trend that builds uponbusiness intelligence towards a smart city approach operating via large quantities ofcomplex data.
In their comprehensive literature review study, Beloin-Saint-Pierre et al. havecategorised the urban metabolism modelling strategies into Black Box, GreyBox and Network approaches. Starting from the basic simplified input and outputdata of the Black Box Approach, the Grey-Box Approach studies further level ofinner flows and the Network Approach defines the links on all inner components ofthe studied system. The main drawback of the Network Approach is identified to bethe challenging implementation of analyses due to the big amount of data. This factcan be easily accepted as a reason of complexity yet still being the solution towardsanswering multi-dimensional analyses that can be very beneficial for urban leveldecision making [19].
The handling of such complex data can be studied through the business intel-ligence approach, which has roots in the database management field and benefitsfrom various data collection, extraction, and analysis technologies [20].Development in data analytics technologies has led to the Internet as a platform andeventually cloud-based data hosting and analyses capabilities. Business intelligencehas evolved because the amount of data generated through the internet and smartdevices has grown exponentially altering how organizations and individuals useinformation [21]. Current technological advancements in the data analytics fieldsand accessibility of complex data analytics algorithms within the cloud servicesoffer a promising and reliable platform to realize data centric assessments.
The age of “big data” has also led to the transparency, accessibility and interop-erability of data repositories. EU has initiated and mobilised the INSPIRE directive[22], identifying standards for data sets, and their distributed services. Urban leveldata management and referencing standards have also been emerging. One of thesestandards is the BSI Guide to establishing a model for data interoperability, whichaims to look beyond the current use of data to facilitate city services, and encouragedecision-makers to explore the reuse of data as a resource to innovate the futuredirection of systems and services. This standard identifies four key types of insight tobe required when sharing data in a city; operational insight examining the charac-teristics of urban elements, critical insight for real time monitoring, analytical insightfor exploring the data ecosystem to determine patterns, and strategic insight forexamining outcomes related to strategic objectives [23].
298 D. Başoğlu et al.
Open data and data sharing in cities regarding various urban systems fromtransportation to communication make various multi-dimensional and interrelatedurban level assessments possible. Relying on this background, supported with theenhanced analytical assessment capabilities decision makers can be served withcomplex interdependent analyses such as LCA, social and economic analyses.
This data centric trend in urban analysis makes the generation of data central tofurther studies. Big data capabilities bring forth an opportunity as they can nowintegrate detailed forecasts such as dynamic assessment into assessment proceduresand details down to building level can be considered for urban analyses. This paperwill proceed to explore some of these opportunities.
3.3 Dynamic Social Assessment
As pointed earlier, the significance of cities comes mainly from the fact that theyaccommodate most of the world’s population, and even more, provide a sharing andmeeting ground for their activities. Social wellbeing is thus a major goal of urbanspace. As citizens and related actors which can be studied as agents are continu-ously adapting their behaviours, it is crucial for the decision maker to understandthe interaction of citizens with the studied urban system.
UM provides a detailed view on the physical space of the city, even incorpo-rating inter-boundary relations as flows and allowing temporal results. Yet thesocial layer is different than any other flow: its agents, individual people, are morecomplex. The question is whether it is possible to include them in a model of UM.
A research held by UCL classifies debates on UM and reflects on the socialimplications of urban metabolism by pointing that even though urban space ismodelled in units of spaces, materials and physical systems, social consequencesoccur and this layer is also a part of the metabolism [24]. Studies in terms of classand inequalities in relation to infrastructure networks define the term “socialmetabolism” proposed by Martinez-Alier as “a manner in which human societiesorganize their growing exchanges of energy and materials with the environment”[24, 25]. These studies point at UM as a driver for major social movements andchanges descriptively. However, an approach such as ABM that quantifies changesin behaviour over time and in relation to flows and trends of the UM is needed tocomplement the dynamic assessment approach this paper discusses.
ABM is a computational tool that is capable of examining social systems withthe perspective of a complex adaptive system. It studies how macro effects emergefrom micro scale behavioural patterns among heterogeneous social agents, whichare evolving, autonomous and interacting [26].
Dynamic Assessment of Nature … 299

ABM simulations handle the mathematically abstracted environment and theinteractions with the involved entities in time series iterations, where the frequen-cies and time span can be selected to best represent the studied system. This can becitizens in an urban system, aligned with the time patterns of flows. This approachcan directly benefit from data sources, where the related parameters effecting theagents’ behaviours are made available in the identified resolution in terms of iter-ation frequencies and quality. To provide the required background for the simu-lations at the urban ecosystem, multidimensional data needs to be utilised. Thisincludes the spatial urban data in the form of GIS, BIM and CIM (City InformationModel) models, material and energy flow data in the form of UM approach, weatherand climate related time series data.
3.4 Developing an Integrated Assessment Platform for NBS
The assessment method proposed for Nature4Cities, a flagship HORIZON2020project on NBS, aims to integrate multiple tools that incorporate modelling abilitiesat different scales and techniques such as remote sensing for a platform that coverseconomic, social and environmental aspects of NBS. The environmental assessmentmodule is planned to handle the relation between the UM and social well-beingthrough ABM along with LCA for the assessment of environmental impacts. Theproject aspires for a holistic assessment of NBS, making the discussed data needscritical. This approach shall look into the relations of urban flows’ distribution,intensity, services and impacts with the behaviour of citizens as agents. Dynamicassessment covers the changing nature of this interaction: supply of flows influencesthe decisions and behaviours of the population, resulting in changes in the settle-ment pattern, creating or reducing demand in flows over time.
The EPESUS City platform will be part of the technologies that contribute to theintegrated assessment platform of Nature4Cities along with other novel technolo-gies. It is an ICT tool that performs life cycle assessment at the urban scale in a timeseries approach [30]. This enables the assessor to identify hotspots of the indicatorstudied within the determined period of time, allowing to identify and mitigateextremities, make decisions based on desired performance patterns over time andoptimize the life span of the study.
3.5 Integrating BIM and New Opportunities
Integrating BIM to urban assessment suggests new opportunities in improving theprecision of data sources for LCA and the scalability of assessment at different
300 D. Başoğlu et al.
levels. BIM is basically digitally representing a building or built object, attributingphysical and functional properties gathered from all contributors to the design andimplementation. A major benefit of using BIM is enabling collaboration in-betweendifferent stakeholders through the interoperable, shared representation of the object[27, 28] and this applies to the different tools and approaches proposed forassessment here. For NBS, this perspective of object level modelling is promisingas many solutions offer different impacts at object level, such as regulating func-tions related to thermal comfort, while contributing to the urban environment’scumulative natural assets, such as the carbon storage of a city.
EPESUS software has been using BIM to generate detailed data for SustainableEnergy and Carbon Action Plans (SECAP) for local governments [30].DesignBuilder software is used as a building energy modelling interface forEnergy + to generate time series energy consumption data for the building models.Building types are determined based on available data and surveys held in thesubject area of the SECAP. These types are then attributed to building massesdrawn on a GIS interface of the city and their building energy model data isextrapolated in EPESUS. Results are calibrated to achieve the closest alignmentwith real bill data and spatial distribution based on neighbourhood characteristics.Upon obtaining a baseline, scenarios are studied based on proposed interventionssuch as envelope specifications and heating and cooling systems.
Such use of BIM for allocation to GIS units has been referred to as a CityInformation Model (CIM): incorporating object models that generate data todecision support tools using GIS [29]. What EPESUS does (Fig. 2) is using BIMand generating assumptions, aligning them with real data and achieving scenarioson a GIS in this regard. EPESUS is currently capable of modelling energy con-sumption, carbon emissions and life cycle impact, also delivering hotspots in theimpact area. EPESUS can also visualize impacts like pollution as heat-maps.
These capabilities provide a good base to integrate NBS into an assessmentmethod that imports time series data and delivers a dynamic assessment, with anability to use BIM to consider micro scale impacts. Having detailed information atobject level allows EPESUS to display heat-maps over a GIS interface to visualizelocal conditions. NBS can be part of the BIM stage of this assessment method. Suchan LCA tool with GIS capabilities is functional to see some of the most desiredeffects of NBS including:
– Urban heat island mitigation in areas of reflective surfaces and dense population,– Pollution control based on heat-maps resulting from energy systems and density,– Areas’ desirability for urban agents and behavioural impact,– Other local ecosystem services such as biodiversity support.
Dynamic Assessment of Nature … 301
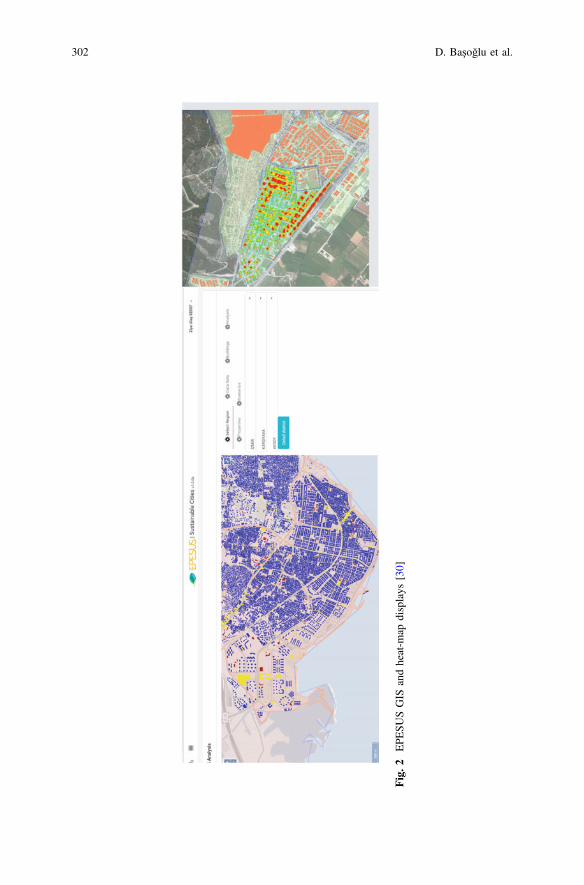
Fig.2
EPE
SUSGIS
andheat-m
apdisplays
[30]
302 D. Başoğlu et al.

4 Conclusions
The Environmental Assessment of NBS Understanding the environmental impactsof NBS requires different levels of results: urban level, object and area level, and theinteractions and temporal patterns for different scales. While LCA is a well-established environmental assessment method guided by ISO standards 14040 and14044, the results it generates are only as good as the data in the hands of thepractitioner. Therefore, a major challenge in rendering the multi benefit andinterlinked nature of NBS is to model the urban system efficiently. This requirescollecting reliable data for this model, and estimating temporal patterns via suitablemodelling approaches.
The UM approach illustrated in Fig. 3 is viable for understanding the linksbetween flows influenced by NBS interventions. However, for a detailed under-standing of these flows, additional parameters of the urban system model arenecessary. Today, ABM provides opportunities in calculating dynamic resultsregarding the impacts of NBS in behavioural patterns to cover social aspects thatare integral to urban assessment. In addition, established BIM tools are capable ofproviding time series data, which is a promising area for enhancing dynamic urbanlevel assessment. Together, these approaches provide a state-of-the-art solution toobtaining detailed dynamic data for an LCA study of NBS in urban assessments.
Fig. 3 Environmental assessment of NBS using the UM approach
Dynamic Assessment of Nature … 303
Acknowledgements Nature4Cities project has received funding from the European Union’sHorizon 2020 research and innovation programme under grant agreement No. 730468.
References
1. UN, World Economic and Social Survey 2013. 2013.2. UN Population Division, The World’s Cities in 2016: Data Booklet., p. 29, 2016.3. EC and UN-Habitat, The State of European Cities 2016. 2016.4. UNDESA, World Urbanization Prospects. 2014.5. BRE, Cities as systems: BRE solutions for urban environments, 2015.6. Keivani R, A review of the main challenges to urban sustainability, Int. J. Urban Sustain.
Dev., vol. 1, no. 1–2, pp. 5–16, 2010.7. De Boissezon B, Smart and sustainable cities with nature-based solutions, no. September,
pp. 1–15, 2015.8. Yeroyanni M, Commission E, Innovation Renaturing cities with nature based solutions
ENERO Workshop: Fostering future integration of Environment in European research &innovation no. October, 2014.
9. European Commission, Towards an EU Research and Innovation policy agenda forNature-Based Solutions & Re-Naturing Cities. 2015.
10. Potschin M, Kretsch C, Haines-Young R, Furman E, Berry P, Baro F, Nature-based solutions,OpenNESS Synth. Pap., no. 18, pp. 1–5, 2014.
11. Lee I.K, Cheong Gye Cheon Restoration Project, in ICLEI, 2006.12. Naumann S, Kaphengst T, McFarland K, Stadler J, Nature-based Approaches to Climate
Change Mitigation and Adaption, pp. 1–27, 2014.13. Yigitcanlar T, Dur F, Dizdaroglu D, Towards prosperous sustainable cities: A multiscalar
urban sustainability assessment approach, Habitat Int., vol. 45, no. P1, pp. 36–46, 2015.14. Xing X, Jones P, Donnison I, Characterisation of Nature-Based Solutions for the Built
Environment, Sustainability, vol. 9, no. 1, Jan. 2017.15. Goldstein G, Birkved M, Quitzau M.B, Hauschild M.Z, Quantification of urban metabolism
through coupling with the life cycle assessment framework: concept development and casestudy, Environ. Res. Lett., vol. 8, p. 35024, 2013.
16. Chrysoulakis N, et al., Sustainable urban metabolism as a link between bio-physical sciencesand urban planning: The BRIDGE project, Landsc. Urban Plan., vol. 112, no. 1, pp. 100–117,2013.
17. Kennedy C, Pincetl S, Bunje P, The study of urban metabolism and its applications to urbanplanning and design, Environ. Pollut., vol. 159, no. 8–9, pp. 1965–1973, 2011.
18. SUME,UrbanMetabolism: SustainableUrbanMetabolism for Europe (SUME) Projectwebsite.[Online]. Available: http://www.sume.at/urban_metabolism. [Accessed: 01-June-2017].
19. Beloin-Saint-Pierre D, et al., A review of urban metabolism studies to identify keymethodological choices for future harmonization and implementation, J. Clean. Prod., 2015.
20. Chaudhuri S, Dayal U, Narasayya V, An overview of business intelligence technology,Commun. ACM, vol. 54, no. 8, p. 88, 2011.
21. Larson D, Chang V, A review and future direction of agile, business intelligence, analyticsand data science, Int. J. Inf. Manage., vol. 36, no. 5, pp. 700–710, 2016.
22. EC, INSPIRE Legislation, 2014. [Online]. Available: http://inspire.ec.europa.eu/index.cfm/pageid/3. [Accessed: 01-Jul-2017].
23. BSI, BSI Standards Publication Smart city concept model—Guide to establishing a model fordata interoperability, pp. 1–56, 2014.
24. Rapoport E, CastánBroto V, Allen A, Interdisciplinary Perspectives on Urban Metabolism,J. Ind. Ecology, 2011.
304 D. Başoğlu et al.

25. Martinez-Alier J, Kallis G, Veuthey S, Walter M, Temper L, Social metabolism, ecologicaldistribution conflicts, and valuation languages, Ecol. Econ., vol. 70, no. 2, pp. 153–158, 2010.
26. Holland J.H, Complex Adaptive Systems, Daedalus, vol. 121, no. 1, A New Era inComputation, pp. 17–30, 1992.
27. National Institute of Building Sciences (NIBS), Frequently Asked Questions About theNational BIM Standard-United States, 2014. [Online]. Available: http://www.nationalbimstandard.org/faq.php#faq1.
28. O’Donnell J.T, et al., Transforming BIM to BEM: Generation of Building Geometry for theNASA Ames Sustainability Base BIM, Bim, no. January, p. 26, 2013.
29. Gil J, Almeida J, Duarte J. P, The backbone of a City Information Model (CIM), 29theCAADe Conf., no. Cim, pp. 143–151, 2011.
30. Ekodenge, EPESUS City. [Online]. Available: http://www.ekodenge.com/epesus/epesus-city/[Accessed: 01-June-2017].
Open Access This chapter is licensed under the terms of the Creative Commons Attribution 4.0International License (http://creativecommons.org/licenses/by/4.0/), which permits use, sharing,adaptation, distribution and reproduction in any medium or format, as long as you give appropriatecredit to the original author(s) and the source, provide a link to the Creative Commons license andindicate if changes were made.The images or other third party material in this chapter are included in the chapter’s Creative
Commons license, unless indicated otherwise in a credit line to the material. If material is notincluded in the chapter’s Creative Commons license and your intended use is not permitted bystatutory regulation or exceeds the permitted use, you will need to obtain permission directly fromthe copyright holder.
Dynamic Assessment of Nature … 305
Role of Carbon Capture and Storage(CCS) or Use (CCU) on ClimateMitigation
Jan Bollen
Abstract ArcelorMittal, world leader in steel production, is working togetherwith industrial partners from the cement and chemical industries, other energyintensive sectors, for potential synergies between the respective manufacturingprocesses and how these could contribute to the reduction of overall CO2 emis-sions. Based on this project, the session aimed at demonstrating the place of LCMmethods and tools in support of regional and/or local policy frameworks. Industrialrepresentatives and policy makers involved in the panel presented and discussed thetechnical and political challenges faced when developing and implementing dis-ruptive technologies and associated business models.
1 Synthesis of Presentations and Discussions
Eric De Conick (ArcelorMittal) presented the reuse of various process gases asfeedstock for producing low carbon fuels and chemical feedstocks are underdevelopment or study at ArcelorMittal. The latter will allow producing plasticswhich can be ground at the end of life, and be re-injected as a C-agent in the blastfurnace. That way a circular economy will emerge from the re-use of thesecond-hand carbon in industrial gasses. Even if, in a first stage of this develop-ment, the gasses would be converted in fuels for transport, and the carbon would beburnt and emitted in the atmosphere, a significant reduction of GHG emissionsworldwide will be realized by the replacement of fossil oil and gas fuels. Thereplacement of the electricity, currently produced from these process gasses, shouldbe done with renewable electricity. Minerals or steel slags can be further carbonated
J. Bollen (&)ArcelorMittal Europe, Brussels, Belgiume-mail: [email protected]
© The Author(s) 2018E. Benetto et al. (eds.), Designing Sustainable Technologies,Products and Policies, https://doi.org/10.1007/978-3-319-66981-6_33
307
and converted into building materials with surplus CO2. A third of overall steelproduction related CO2 emissions of today could potentially be diverted for reuse.For the remaining CO2 volumes, underground permanent storage becomes anoption once such infrastructure is being built.
Scale up of carbon reuse projects without a specific regulatory frame work isunlikely as the cost of products from carbon reuse will be higher than for the fossilequivalent.
Manuela Ojan (HeidelbergCement) introduced an installation thatHeidelbergCement is piloting in Moroccan cement plant that produces micro algaefor fish feed. This application allows this stand-alone plant to capture 10% of itstotal CO2 emissions.
Tom Bradley (Narec Distributed Energy—UK) presented the InteSusAl project inPortugal, which is producing algae for conversion into fuel. To enable comparisonsof different process set-ups, the LCA methodology for assessing the various algaetechnologies were harmonized.
Colin Hills (UK Centre for Environment Research and Innovation) explained thattechnologies are being implemented in 2 UK plants (5 by 2021) to mineralize CO2
with reactive waste (APCr). However, other wastes (e.g. red mud, …) can also beprocessed into aggregates for construction. From mapping EU available wastes, aconservative potential of 6 Mt carbon abatement exists while producing 122 Mt ofaggregate, covering 6% of EU consumption.
Finally, Anders Hammer Strømman (Norwegian University of Science andTechnology) stated that methodologies assessing the abatement potential of CCUtechnologies should consider their beneficial effect on anthropogenic perturbationof global carbon cycle. Attention should be given to whether these are in thedomains of either the slow else the fast carbon cycle.
Some conclusions were drawn from discussion between panel and audience afterthe Q&A session:
– Without a price on carbon, these new technologies cannot economically com-pete with their fossil-based alternatives.
– A regulatory support is required to enable them a market.– To maximize their impact on carbon abatement, the technologies will require
renewable energy as input for operation.– Assessment methodologies shall reflect an evolution to more renewable energy
to enable the initial viability of the new CCU technologies.– Regulation framework has to reward synergies created by combined production
systems rather stimulate the market based on benchmarking of the individualproducts as the latter will raise allocation issues.
308 J. Bollen

Open Access This chapter is licensed under the terms of the Creative Commons Attribution 4.0International License (http://creativecommons.org/licenses/by/4.0/), which permits use, sharing,adaptation, distribution and reproduction in any medium or format, as long as you give appropriatecredit to the original author(s) and the source, provide a link to the Creative Commons license andindicate if changes were made.The images or other third party material in this chapter are included in the chapter’s Creative
Commons license, unless indicated otherwise in a credit line to the material. If material is notincluded in the chapter’s Creative Commons license and your intended use is not permitted bystatutory regulation or exceeds the permitted use, you will need to obtain permission directly fromthe copyright holder.
Role of Carbon Capture and Storage … 309

Part IIIDevelopment of LCM Methods and Tools

Potentials and Limitationsof Combined Life Cycle Approachesand Multi-dimensional Assessment
Johanna Berlin and Diego Iribarren
Abstract The use of life cycle approaches—purely or in combination with non-lifecycle methods—to assess product systems from a multi-dimensional perspectivearises as a current need in the path towards actual sustainability. While pure lifecycle approaches involve mainly life cycle sustainability assessment, a wide rangeof novel approaches are currently under study in order to overcome the limitationstypically linked to multi-dimensional assessment and multi-criteria decision anal-ysis. This is done through the synergistic combination of life cycle (mainly, lifecycle assessment) and non-life cycle (techno-economic assessment, data envelop-ment analysis, energy systems modelling, agent-based modelling, land change andecosystem services modelling, urban metabolism analysis, interdisciplinary policyassessment, material flow analysis, etc.) methods. The main potentials, fields ofapplication and pending issues associated with these tools are summarised herein.
1 Introduction
While life cycle methodologies such as life cycle assessment (LCA), carbonfootprinting (CFP) and emergy analysis focus on the evaluation of the environ-mental realm of systems, other approaches such as life cycle costing (LCC), sociallife cycle assessment (SLCA) and life cycle sustainability assessment (LCSA)attempt to extend life cycle thinking to other spheres of sustainable development[1]. Though valuable and useful, the life cycle-based approaches proposed to datehave not yet succeeded in providing a well-accepted and sound evaluation ofsustainability issues. In this respect, it is acknowledged that the combined use of life
J. Berlin (&)RISE Research Institutes of Sweden, Eklandagatan 86,412 61 Göteborg, Swedene-mail: [email protected]
D. Iribarren (&)Systems Analysis Unit, IMDEA Energy, 28935 Móstoles, Spaine-mail: [email protected]
© The Author(s) 2018E. Benetto et al. (eds.), Designing Sustainable Technologies,Products and Policies, https://doi.org/10.1007/978-3-319-66981-6_34
313
cycle and other system-based or non-life cycle methodologies might offer inter-esting potentials towards a robust and practical assessment with amulti-dimensional perspective [2]. Nevertheless, scarce and scattered information isavailable on this type of integrative approaches.
LCA and other system-based approaches (e.g., technological innovation systemsanalysis, policy and market analysis, and design and analysis of user needs) provideclues about the environmental, economic and social nature of current and futureindustrial systems. Material flow analysis, cost-benefit analysis, energy systemsmodelling and multi-criteria decision analysis (MCDA) tools such as data envel-opment analysis (DEA) are also among the methodologies that have already beenused in combination with life cycle approaches [3]. However, because each of themethods separately is likely to provide different observations and conclusions, thedevelopment of harmonised approaches and guidance for technical innovation isrequired. Within this context, further discussion on both potentials and limitationsconcerning the use of hybrid approaches is needed.
2 Current Activities in Life Cycle-BasedMulti-dimensional Assessment
During the LCM2017 conference held in Luxembourg, a number ofmulti-dimensional approaches including a life cycle perspective were addressed.The main methodological frameworks are summarised below:
– Life cycle sustainability assessment (LCSA) to comprehensively assess therelation and trade-offs between environmental, social and economic impactsunder circular economy and industrial ecology principles. Current advancesinclude the use of open space workshops and the combination with agent-basedmodelling.
– Environmental techno-economic assessment through the integration of LCA andtechno-economic assessment. For instance, this could be applied to thoroughlyassess a technology from the first stages of development until its industrialcommercialisation.
– Development of new LCA tools for environmental optimisation and imple-mentation in biddings, thereby integrating environmental impact budgeting intodecision-making processes.
– Combination of life cycle approaches with DEA for sustainability benchmarkingof multiple similar entities. The so-called LC + DEA concept benefits from theavailability of different life cycle approaches (LCA, CFP, emergy analysis, etc.)and numerous DEA models. In this respect, the novel use of the SBM-Maxmodel combined with LCA has recently been proposed for the gradual opera-tional and environmental benchmarking in terms of continuous improvement.
314 J. Berlin and D. Iribarren
– Highly trans-disciplinary frameworks examining the system from multipleperspectives. For instance, this can involve technical (e.g., laboratory cultivationand mechanical testing), social (e.g., actor analysis, policy analysis, marketanalysis and social acceptance), resource (e.g., material flow analysis) andenvironmental (e.g., LCA) evaluations.
– Other relevant methodological frameworks referred to the integration of landchange modelling and ecosystem services modelling into LCA, the use of urbanmetabolism analysis, interdisciplinary policy assessment, and environmental,health and safety screening.
Finally, regarding the field of application of these hybrid methods, a wide rangeof case studies were presented during the LCM2017 conference. An increasinginterest in bioeconomy-related case studies is observed, involving e.g. algae-basedbiorefineries, bio-based high-density polyethylene, microbial production of succinicacid from mixed food waste, and other biomass value chains. Nevertheless, manyother sectors and topics could be highlighted, such as road planning, food industry,fishing sector, nanomaterials, and residential buildings.
3 Lessons Learned
It is seen that the development and application of methodological frameworksinvolving different approaches, scopes and methods leads to a useful holistic per-spective in the evaluation of product systems. In this sense, this type of nuancedevaluation can offer a more robust foundation for decision-making processes thanone perspective or method in isolation. Nevertheless, with the aim of guaranteeingthe provision of consistent and sound results, a robust methodological harmoni-sation is of paramount importance, but often underdeveloped in many cases, e.g.when defining benchmarks in MCDA studies. This arises as a key issue to beaddressed when developing and applying combined methods for multi-dimensionalassessment.
A key strength of the proposed frameworks is the enriched interpretation andcommunication of the results, often providing easy-to-report results in line with thedemands of the industry and other relevant stakeholders (policy-makers, society,etc.). Trans-disciplinary approaches can inform an arena of research and industrialpartners with different perspectives to facilitate discussion and more well-informeddecisions. Furthermore, combined methodological frameworks can even shorten thetime-to-market for new technologies. However, achieving an extended use ofmulti-dimensional approaches is still a pending issue. In addition to research effortsin the field of systems analysis, a higher level of stakeholder involvement (e.g.,through open space workshops) could help in this direction.
Potentials and Limitations of Combined … 315
4 Conclusions and Perspectives
The combination of life cycle approaches such as LCA with other life cycle (e.g.,LCC and SLCA) or non-life cycle (e.g., techno-economic assessment, DEA,interdisciplinary policy assessment, etc.) approaches offers singular advantages forthe multi-dimensional assessment of product systems. The enrichment ofdecision-making processes and the enhancement of the discussion, interpretationand communication of the results arise as key strengths of these hybrid methods.Nevertheless, further efforts are still required in order to guarantee the consistencyof the results through methodological harmonisation, as well as to involve stake-holders and achieve an extended use of these approaches.
References
1. Guinée J.B, Heijungs R, Huppes G, Zamagni A, Masoni P, Buonamici R, Ekvall T, Rydberg T,Life cycle assessment: past, present, and future, Environmental Science & Technology, Vol. 45,2011, pp. 90–96.
2. Jeswani H.K, Azapagic A, Schepelmann P, Ritthoff M, Options for broadening and deepeningthe LCA approaches, Journal of Cleaner Production, Vol. 18, 2010, pp. 120–127.
3. Martín-Gamboa M, Iribarren D, García-Gusano D, Dufour J, A review of life-cycle approachescoupled with data envelopment analysis within multi-criteria decision analysis for sustain-ability assessment of energy systems, Journal of Cleaner Production, Vol. 150, 2017, 164–174.
Open Access This chapter is licensed under the terms of the Creative Commons Attribution 4.0International License (http://creativecommons.org/licenses/by/4.0/), which permits use, sharing,adaptation, distribution and reproduction in any medium or format, as long as you give appropriatecredit to the original author(s) and the source, provide a link to the Creative Commons license andindicate if changes were made.The images or other third party material in this chapter are included in the chapter’s Creative
Commons license, unless indicated otherwise in a credit line to the material. If material is notincluded in the chapter’s Creative Commons license and your intended use is not permitted bystatutory regulation or exceeds the permitted use, you will need to obtain permission directly fromthe copyright holder.
316 J. Berlin and D. Iribarren
Propagating Uncertaintyin Life Cycle Sustainability Assessmentinto Decision-Making Problems:A Multiple Criteria Decision AidApproach
Breno Barros Telles do Carmo, Manuele Margni and Pierre Baptiste
Abstract Life cycle sustainability assessments (LCSA) are a comprehensivesource of information on product performance to support decision-making pro-cesses toward sustainable production and consumption. Multiple criteria decisionaid (MCDA) approach provides a structured decision modelling that considers thevalue judgments of the decision-makers and it has been proved to be useful tosupport decision-making based on LCSA results. We proposed an approach able totake into account LCSA performances when making decisions. We applied ourapproach through a case study of tire life extension scenarios selection. The sce-nario with retreading is the solution that offer the best compromise between thethree sustainable dimensions with more than 63% probability to rank first forWeighted sum, Topsis and Prométhée II MCDA methods.
1 Introduction
Supporting sustainable decision-making problems involves taking into accountenvironmental, social and economic performance assessments into mathematicaldecision models, in order to communicate results to decision-makers. However,
B. B. T. do Carmo (&) � M. Margni � P. BaptisteCanada Mathematics and Industrial Engineering Department,Polytechnique Montreal, 2900 boul. Édouard-Montpetit, Montreal,QC H3T 1J4, Canadae-mail: [email protected]
B. B. T. do Carmo � M. MargniCiraig, 3333, Chemin Queen Mary, Office 310, Montreal,QC H3C 3A7, Canada
B. B. T. do CarmoEngineering Centre, Federal University of Semi Arid (UFERSA),Avenida Francisco Mota, 572, Mossoró, Rio Grande do Norte59.625-900, Brazil
© The Author(s) 2018E. Benetto et al. (eds.), Designing Sustainable Technologies,Products and Policies, https://doi.org/10.1007/978-3-319-66981-6_35
317
Martín-Gamboa et al. [1] highlights the need to develop frameworks able to inte-grate sustainability indicators and decision-makers preferences.
One of the challenges in assessing these potential impacts is the dispersion ofthem throughout product life cycle, making complex the assessment process. Lifecycle approach is able to deal with it. As such, Life Cycle SustainabilityAssessment (LCSA) analysis takes into account all stages of a product’s lifecycle,when assessing performances, being considered a holistic tool used to measureproduct sustainability. Therefore, LCSA refers to environmental, social and eco-nomic assessments of product systems from a life-cycle perspective in order topromote product sustainability [2, 3].
However, the use of this type of result in organizational decision-making is notobvious. Halog and Manik [4] highlight three characteristics that increase thecomplexity of decision-making through LCSA results: (i) the indicators are mul-tidimensional (each one is expressed in different units), (ii) the objectives arecontradictory for the majority of decision-making problems (it is impossible tomaximize the performance of a product system in all indicators) and (iii) perfor-mance evaluation is uncertain.
In this type of decision-making problem, decision makers must choose accordingto different criteria (LCSA indicators), leading to multiple criteria decision problem.Multiple criteria decision analysis (MCDA) approach aims to recommend an idealsolution, which is not necessarily optimal in all criteria, but a compromise solutionaccording to the value judgment of decision-makers. The main advantage of thisapproach is its ability to consider a relatively large number of criteria when makinga decision [5]. Laurin et al. [6] remark this approach when comparing productsystems through the analysis of compromise recommendations.
LCSA results could be too disaggregated and, as such, too difficult to understandand interpret by decision-makers [7]. The use of these indicators in combination tosupport sustainable decision-making can be done through MCDA methods, asproposed by several authors [8–11].
We found few scientific researches discussing the use of the multiple criteriadecision analysis approach into decision-making comprising LCSA results forsustainable decision-making ([9, 12–15, 7]).
The researches carried out by Vynies et al. [9] and Keller et al. [12] rely onarbitrary and unjustified aggregation procedures and neglect uncertainty whenselecting a product system between a set of alternatives based on LCSA perfor-mances. Myllyvitta et al. [13] used MCDA approach to identify and weight relevantimpact categories when assessing the environmental impacts of biomass produc-tion. Traverso et al. [7] provide a tool for comparing LCSA performance-basedproduct systems. However, it is not clear how they defined the procedure forestablishing the weighting factors and they do not take into account the uncertaintyassociated to LCSA performances. Finally, Hanandeh and El-Zein [14] adaptedElectre III method to account for the uncertainty associated with preference data asweighting factors when choosing between alternatives based on LCA performance.
As such, we did not find many studies carrying out analyses including LCSAuncertainties, or the implications of choosing among the various MCDA methods
318 B. B. T. do Carmo et al.
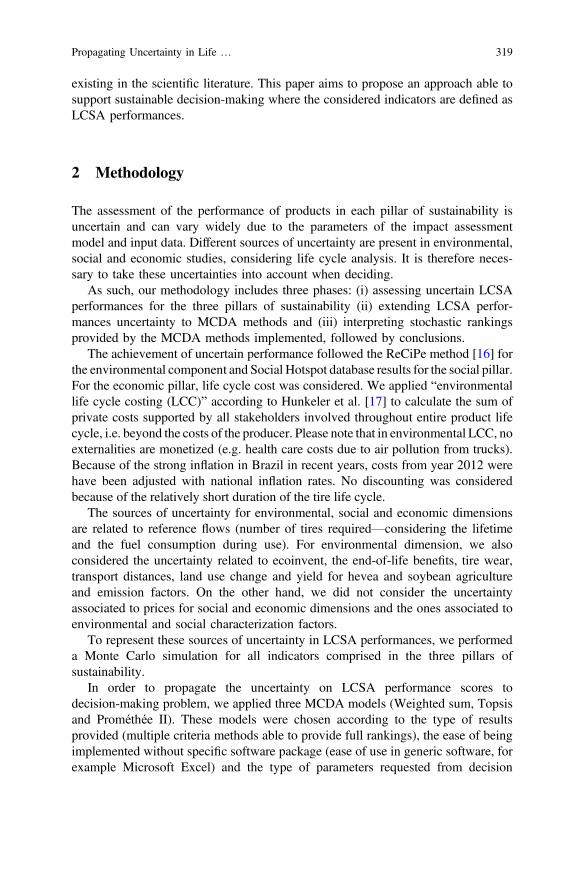
existing in the scientific literature. This paper aims to propose an approach able tosupport sustainable decision-making where the considered indicators are defined asLCSA performances.
2 Methodology
The assessment of the performance of products in each pillar of sustainability isuncertain and can vary widely due to the parameters of the impact assessmentmodel and input data. Different sources of uncertainty are present in environmental,social and economic studies, considering life cycle analysis. It is therefore neces-sary to take these uncertainties into account when deciding.
As such, our methodology includes three phases: (i) assessing uncertain LCSAperformances for the three pillars of sustainability (ii) extending LCSA perfor-mances uncertainty to MCDA methods and (iii) interpreting stochastic rankingsprovided by the MCDA methods implemented, followed by conclusions.
The achievement of uncertain performance followed the ReCiPe method [16] forthe environmental component and Social Hotspot database results for the social pillar.For the economic pillar, life cycle cost was considered. We applied “environmentallife cycle costing (LCC)” according to Hunkeler et al. [17] to calculate the sum ofprivate costs supported by all stakeholders involved throughout entire product lifecycle, i.e. beyond the costs of the producer. Please note that in environmental LCC, noexternalities are monetized (e.g. health care costs due to air pollution from trucks).Because of the strong inflation in Brazil in recent years, costs from year 2012 werehave been adjusted with national inflation rates. No discounting was consideredbecause of the relatively short duration of the tire life cycle.
The sources of uncertainty for environmental, social and economic dimensionsare related to reference flows (number of tires required—considering the lifetimeand the fuel consumption during use). For environmental dimension, we alsoconsidered the uncertainty related to ecoinvent, the end-of-life benefits, tire wear,transport distances, land use change and yield for hevea and soybean agricultureand emission factors. On the other hand, we did not consider the uncertaintyassociated to prices for social and economic dimensions and the ones associated toenvironmental and social characterization factors.
To represent these sources of uncertainty in LCSA performances, we performeda Monte Carlo simulation for all indicators comprised in the three pillars ofsustainability.
In order to propagate the uncertainty on LCSA performance scores todecision-making problem, we applied three MCDA models (Weighted sum, Topsisand Prométhée II). These models were chosen according to the type of resultsprovided (multiple criteria methods able to provide full rankings), the ease of beingimplemented without specific software package (ease of use in generic software, forexample Microsoft Excel) and the type of parameters requested from decision
Propagating Uncertainty in Life … 319
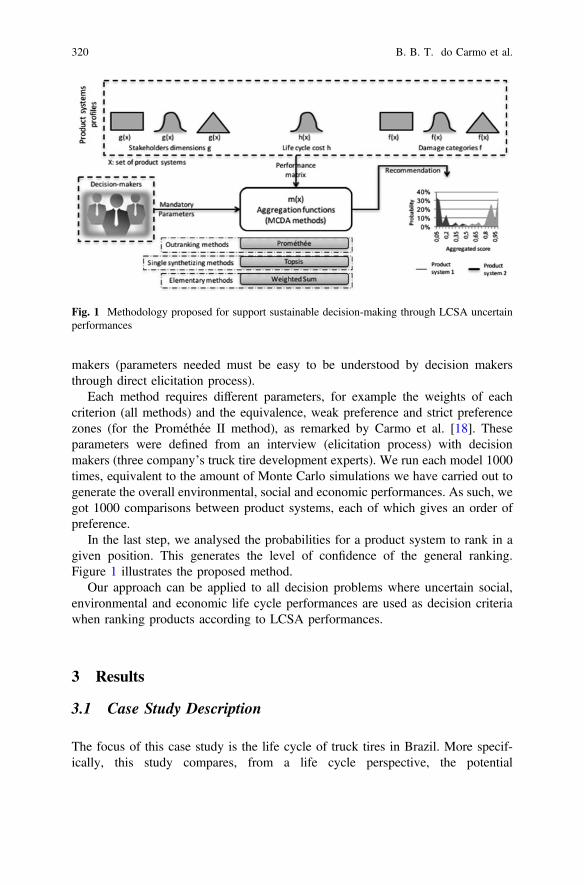
makers (parameters needed must be easy to be understood by decision makersthrough direct elicitation process).
Each method requires different parameters, for example the weights of eachcriterion (all methods) and the equivalence, weak preference and strict preferencezones (for the Prométhée II method), as remarked by Carmo et al. [18]. Theseparameters were defined from an interview (elicitation process) with decisionmakers (three company’s truck tire development experts). We run each model 1000times, equivalent to the amount of Monte Carlo simulations we have carried out togenerate the overall environmental, social and economic performances. As such, wegot 1000 comparisons between product systems, each of which gives an order ofpreference.
In the last step, we analysed the probabilities for a product system to rank in agiven position. This generates the level of confidence of the general ranking.Figure 1 illustrates the proposed method.
Our approach can be applied to all decision problems where uncertain social,environmental and economic life cycle performances are used as decision criteriawhen ranking products according to LCSA performances.
3 Results
3.1 Case Study Description
The focus of this case study is the life cycle of truck tires in Brazil. More specif-ically, this study compares, from a life cycle perspective, the potential
Fig. 1 Methodology proposed for support sustainable decision-making through LCSA uncertainperformances
320 B. B. T. do Carmo et al.

environmental and social impacts; together with life cycle costs of used tire man-agement scenarios associated with different life extension options.
As such, this case study aims to analyse environmental, social and cost per-formances obtained through life cycle assessment approach in order to support thechoice between two scenarios:
Scenario 1, without retreading—the tire reaches its final end-of-life once itsoriginal tread reaches maximum wear.
Scenario 2, with retreading—when the tread reaches maximum wear, the tire isretreaded and reused for the same freight transport.
The functional unit is the same for the three sustainability dimensions: “pro-viding tires for truck transport with a payload of 32 metric tons over 600,000 km inBrazil in 2012 and managing used tires”. It offers an impact evaluation based on thekilometres travelled rather than the number of units sold. Figure 2 illustrates theproduct system considered in our analysis.
3.2 Case Study Results
For the first phase of our methodology, assessing uncertain LCSA performances forthe three pillars of sustainability, the performances were obtained from 2 successivestudies conducted in 2015 and 2016 [19, 20]. Both studies are not publicly dis-closed and include confidential information. The indicators considered in our Casestudy are illustrated in Fig. 3.
Figure 4 presents the performances for each indicator considered for the threepillars of sustainability.
Fig. 2 Life cycle phases included into life cycle sustainability assessment
Propagating Uncertainty in Life … 321
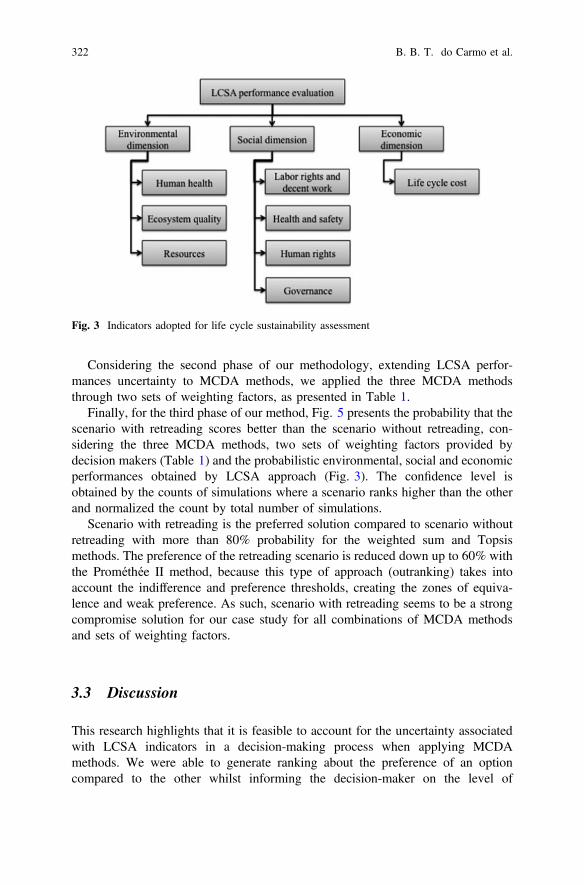
Considering the second phase of our methodology, extending LCSA perfor-mances uncertainty to MCDA methods, we applied the three MCDA methodsthrough two sets of weighting factors, as presented in Table 1.
Finally, for the third phase of our method, Fig. 5 presents the probability that thescenario with retreading scores better than the scenario without retreading, con-sidering the three MCDA methods, two sets of weighting factors provided bydecision makers (Table 1) and the probabilistic environmental, social and economicperformances obtained by LCSA approach (Fig. 3). The confidence level isobtained by the counts of simulations where a scenario ranks higher than the otherand normalized the count by total number of simulations.
Scenario with retreading is the preferred solution compared to scenario withoutretreading with more than 80% probability for the weighted sum and Topsismethods. The preference of the retreading scenario is reduced down up to 60% withthe Prométhée II method, because this type of approach (outranking) takes intoaccount the indifference and preference thresholds, creating the zones of equiva-lence and weak preference. As such, scenario with retreading seems to be a strongcompromise solution for our case study for all combinations of MCDA methodsand sets of weighting factors.
3.3 Discussion
This research highlights that it is feasible to account for the uncertainty associatedwith LCSA indicators in a decision-making process when applying MCDAmethods. We were able to generate ranking about the preference of an optioncompared to the other whilst informing the decision-maker on the level of
Fig. 3 Indicators adopted for life cycle sustainability assessment
322 B. B. T. do Carmo et al.
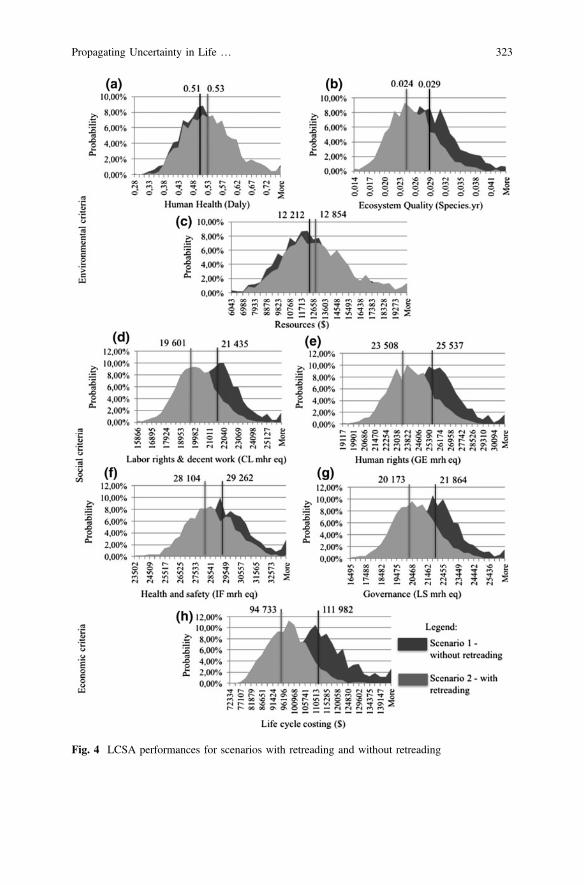
Fig. 4 LCSA performances for scenarios with retreading and without retreading
Propagating Uncertainty in Life … 323
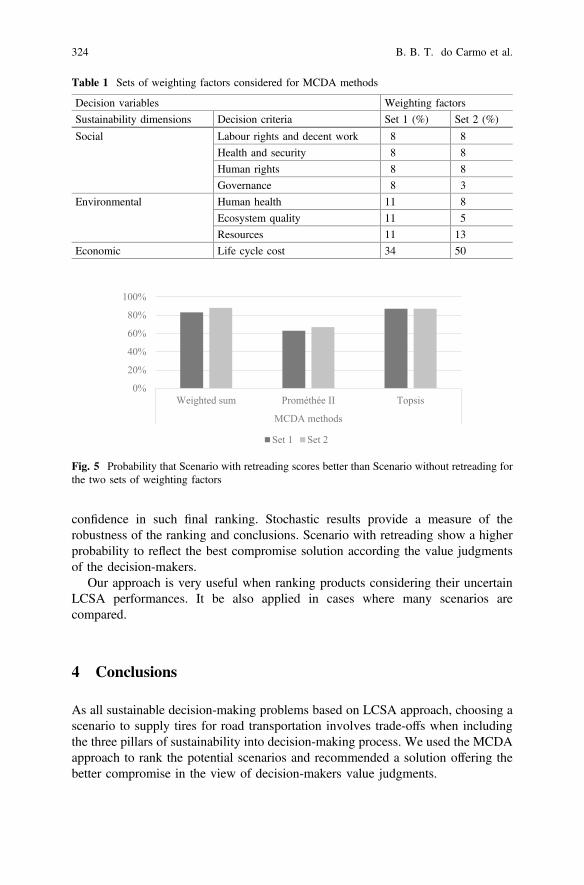
confidence in such final ranking. Stochastic results provide a measure of therobustness of the ranking and conclusions. Scenario with retreading show a higherprobability to reflect the best compromise solution according the value judgmentsof the decision-makers.
Our approach is very useful when ranking products considering their uncertainLCSA performances. It be also applied in cases where many scenarios arecompared.
4 Conclusions
As all sustainable decision-making problems based on LCSA approach, choosing ascenario to supply tires for road transportation involves trade-offs when includingthe three pillars of sustainability into decision-making process. We used the MCDAapproach to rank the potential scenarios and recommended a solution offering thebetter compromise in the view of decision-makers value judgments.
Table 1 Sets of weighting factors considered for MCDA methods
Decision variables Weighting factors
Sustainability dimensions Decision criteria Set 1 (%) Set 2 (%)
Social Labour rights and decent work 8 8
Health and security 8 8
Human rights 8 8
Governance 8 3
Environmental Human health 11 8
Ecosystem quality 11 5
Resources 11 13
Economic Life cycle cost 34 50
0%
20%
40%
60%
80%
100%
Weighted sum Prométhée II Topsis
MCDA methods
Set 1 Set 2
Fig. 5 Probability that Scenario with retreading scores better than Scenario without retreading forthe two sets of weighting factors
324 B. B. T. do Carmo et al.
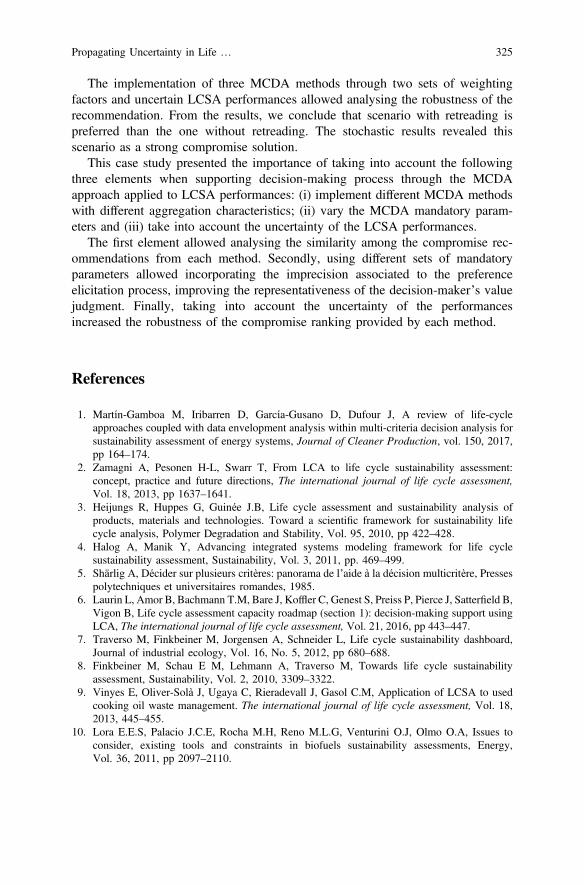
The implementation of three MCDA methods through two sets of weightingfactors and uncertain LCSA performances allowed analysing the robustness of therecommendation. From the results, we conclude that scenario with retreading ispreferred than the one without retreading. The stochastic results revealed thisscenario as a strong compromise solution.
This case study presented the importance of taking into account the followingthree elements when supporting decision-making process through the MCDAapproach applied to LCSA performances: (i) implement different MCDA methodswith different aggregation characteristics; (ii) vary the MCDA mandatory param-eters and (iii) take into account the uncertainty of the LCSA performances.
The first element allowed analysing the similarity among the compromise rec-ommendations from each method. Secondly, using different sets of mandatoryparameters allowed incorporating the imprecision associated to the preferenceelicitation process, improving the representativeness of the decision-maker’s valuejudgment. Finally, taking into account the uncertainty of the performancesincreased the robustness of the compromise ranking provided by each method.
References
1. Martín-Gamboa M, Iribarren D, García-Gusano D, Dufour J, A review of life-cycleapproaches coupled with data envelopment analysis within multi-criteria decision analysis forsustainability assessment of energy systems, Journal of Cleaner Production, vol. 150, 2017,pp 164–174.
2. Zamagni A, Pesonen H-L, Swarr T, From LCA to life cycle sustainability assessment:concept, practice and future directions, The international journal of life cycle assessment,Vol. 18, 2013, pp 1637–1641.
3. Heijungs R, Huppes G, Guinée J.B, Life cycle assessment and sustainability analysis ofproducts, materials and technologies. Toward a scientific framework for sustainability lifecycle analysis, Polymer Degradation and Stability, Vol. 95, 2010, pp 422–428.
4. Halog A, Manik Y, Advancing integrated systems modeling framework for life cyclesustainability assessment, Sustainability, Vol. 3, 2011, pp. 469–499.
5. Shärlig A, Décider sur plusieurs critères: panorama de l’aide à la décision multicritère, Pressespolytechniques et universitaires romandes, 1985.
6. Laurin L, Amor B, Bachmann T.M, Bare J, Koffler C, Genest S, Preiss P, Pierce J, Satterfield B,Vigon B, Life cycle assessment capacity roadmap (section 1): decision-making support usingLCA, The international journal of life cycle assessment, Vol. 21, 2016, pp 443–447.
7. Traverso M, Finkbeiner M, Jorgensen A, Schneider L, Life cycle sustainability dashboard,Journal of industrial ecology, Vol. 16, No. 5, 2012, pp 680–688.
8. Finkbeiner M, Schau E M, Lehmann A, Traverso M, Towards life cycle sustainabilityassessment, Sustainability, Vol. 2, 2010, 3309–3322.
9. Vinyes E, Oliver-Solà J, Ugaya C, Rieradevall J, Gasol C.M, Application of LCSA to usedcooking oil waste management. The international journal of life cycle assessment, Vol. 18,2013, 445–455.
10. Lora E.E.S, Palacio J.C.E, Rocha M.H, Reno M.L.G, Venturini O.J, Olmo O.A, Issues toconsider, existing tools and constraints in biofuels sustainability assessments, Energy,Vol. 36, 2011, pp 2097–2110.
Propagating Uncertainty in Life … 325
11. Bachmann T.M, Towards life cycle sustainability assessment: drawing on NEEDS project’stotal cost and multi-criteria decision analysis ranking methods, The international journal oflife cycle assessment, Vol. 18, 2013, pp 1698–1709.
12. Keller H, Rettenmaier N, Reinhardt G.A, Integrated life cycle sustainability assessment—apractical approach, Applied Energy, Vol. 154, 2015, pp 1072–1081.
13. Myllyviita T, Holma A, Antikainen R, Lähtinen K, Leskinen P, Assessing environmentalimpacts of biomass production chains—application of life cycle assessment (LCA) andmulti-criteria decision analysis (MCDA), Journal of Cleaner Production, Vol. 29, 2012,pp 238–245.
14. Hanandeh A.E, El-Zein, The development and application of multi-criteria decision-makingtool with consideration of uncertainty: The selection of a management strategy for thebio-degradable fraction in the municipal solid waste, Bio resources Technology, Vol. 101,2010, pp 555–561.
15. Benetto E, Dujet C, Rousseaux P, Fuzzy multicriteria approach with uncertainty analysis forLife Cycle Assessment. Environmental Software and Modelling, Vol. 23, Issue 12, 2008,pp 1461–1467.
16. Goedkoop M.J, Heijungs R, Huijbregts M, De Schryver A, Struijs J, Van Zelm R, ReCiPe—A life cycle impact assessment method which comprises harmonised category indicators at themidpoint and the endpoint level; First edition Report I: Characterisation; 6 January 2009,http://www.lcia-recipe.net.
17. Hunkeler D, Lichtenvort K, Rebitzer G (eds.) Environmental life cycle costing. SETAC,Pensacola, FL (US) in collaboration with CRC Press, Boca Raton, FL, USA, 2008.
18. Carmo B.B.T, Margni M, Baptiste P, Ranking product systems based on uncertain life cyclesustainability assessment: A stochastic multiple criteria decision analysis approach, Journal ofCleaner Production, submitted.
19. Imbeault-Tétreault H, Carmo B.B.T, Life cycle sustainability assessment of tires retreading.Montréal, 51 p, 2017.
20. Imbeault-Tétreault H, Beaulieu L, Fallaha S, Russo Garrido S, Samson R., Revéret J-P, ACVenvironnementale et sociale d’options de prolongation de la vie utile de pneus de poids lourdsau Brésil. Montreal, 294 p, 2015.
Open Access This chapter is licensed under the terms of the Creative Commons Attribution 4.0International License (http://creativecommons.org/licenses/by/4.0/), which permits use, sharing,adaptation, distribution and reproduction in any medium or format, as long as you give appropriatecredit to the original author(s) and the source, provide a link to the Creative Commons license andindicate if changes were made.The images or other third party material in this chapter are included in the chapter’s Creative
Commons license, unless indicated otherwise in a credit line to the material. If material is notincluded in the chapter’s Creative Commons license and your intended use is not permitted bystatutory regulation or exceeds the permitted use, you will need to obtain permission directly fromthe copyright holder.
326 B. B. T. do Carmo et al.

The Value of TransdisciplinaryPerspectives During Transitionto a Bio-based Economy: The Prospectfor Converting Mixed Food Wasteinto Bio-based Chemicals
Birgit Brunklaus, Emma Rex, Johanna Berlin, Frida Røyne,Johanna Ulmanen and Graham Aid
Abstract Within the current political and industrial transition to a bio-basedeconomy, food waste can be an alternative resource for biobased chemicals. Thischapter describes a case study that evaluates the prospect for Swedish production ofbiobased chemicals such as succinic acid from food waste. The evaluation isaddressed from multiple systems perspectives. From a technical and resourcesystem perspective, the results of the case study show that production seems pos-sible. However, from a social system perspective succinic acid production currentlylacks institutional support and actor commitment and alignment for realizingdevelopment in Sweden. From an environmental and life cycle perspective, thescoping of the analysis is decisive for the results. The study shows that multipleperspectives complement each other when seeking a nuanced evaluation of tech-nical innovation and give insights for the intended value chain.
1 Introduction
In line with current political and industrial ambitions for a transition into abio-based economy, food waste can be an alternative to agro- and forest-basedresources. The amount of food waste generated every year is about 1.3 billion tonsglobally [1]. This wasted food has caused problems related to climate change andresource depletion throughout their value chains, as well as increasing economicchallenges related to waste disposal.
B. Brunklaus (&) � E. Rex � J. Berlin � F. Røyne � J. UlmanenEnergy and Circular Economy, RISE Research Institutes of Sweden,41261 Gothenburg, Swedene-mail: [email protected]
G. AidR&D Engineer and Group Strategy, Ragn Sells AB, Stockholm, Sweden
© The Author(s) 2018E. Benetto et al. (eds.), Designing Sustainable Technologies,Products and Policies, https://doi.org/10.1007/978-3-319-66981-6_36
327

Some of these problems could be eased by converting food waste into valuableproducts like bio-based chemicals. Succinic acid (SA) is one such chemical with highmarket potential [2]. Today, it is produced from fossil sources but also partly fromcultivated biomass on a commercial basis [3]. Several initiatives are now underway toexamine the use offoodwaste as feedstock for SAproduction.Most of these initiativesare limited to homogenous industrial waste streams, but a research project in Swedenis looking at a more novel and complex feedstock—mixed food waste (MFW) [4].
The purpose of this project is to evaluate the prospect for realizing Swedishproduction of bio-based chemicals from MFW. In this chapter, we present theevaluation results of one possible production route, where microbial production ofSA from MFW in Sweden is used as a case study.
The evaluation of SA from MFW is addressed from multiple perspectives:technical and social system structures are explored, in addition to resource andenvironmental implications. Several perspectives and methods are thus involved inthe evaluations, such as the technical (laboratory cultivation and mechanical test-ing), the social (actor analysis, policy analysis, market analysis, and societalacceptance), the resource based (waste flow analysis and scenario analysis), and theenvironmental (life cycle assessment of current and future valorization techniquesfor MFW). The project thus uses a transdisciplinary approach and offers an arenawhere both research partners and industrial partners meet and discuss possibleoptions for MFW-based SA production in Sweden.
2 Multiple Perspectives and Evaluation Methodsfor Converting Mixed Food Waste into Bio-basedChemicals
The case study chosen here involves microbal growth on mixed food waste derivedfrom municipal solid waste to produce bio-based SA in Sweden. The mixed foodwaste was sourced from Ragn Sells AB’s full-scale waste management facility in thearea of Stockholm, Sweden. In Sweden, the current value pathway forMFW involvesanaerobic digestion to produce biogas [5]. The future production could involve thecultivation of Escherichia coli bacteria to produce succinic acid as a raw material forfurther polymerisation. The case study was chosen together with academic andindustrial partners in a multidisciplinary research project on how mixed food wastecan be used as a resource for the production of bio-based chemicals and higher valueproducts than current biogas (FORMAS 211-2012-70). Research questions derivedfrom different partners included different disciplines, such as molecular biology(natural science), biotechnology (bio-based engineering), as well as social systemsperspectives (social science) and environmental systems science (resource and lifecycle perspective). Multiple perspectives, scales and methods were thus involved inthe different evaluations presented in Table 1,which lead to different results presentedin the following sections.
328 B. Brunklaus et al.

2.1 Technical Evaluation Performed on Lab Scale
Several research questions and methods are involved in the technical evaluation e.g.laboratory cultivation and mechanical testing. By the use of elementary analysis,the composition of substances/molecules in mixed food waste was identified. Theresults show that mixed food waste contains required N and C for E.coli growth,although additional N would increase C use. Enzymatic hydrolysis and carbohy-drate analysis was then used to show how the carbon sources included could bemade more accessible for E.coli uptake [6]. Through laboratory cultivating tests itwas assessed if E.coli could grow on mixed food waste. The results show that theliquid fraction of the waste supports growth and the solids can be used as carbonsource. To determin if the water content of MFW was optimal for E.coli growth,mechanical property tests were made. The results show that the water content wastoo high for industrial production, described in Rex et al. [7].
2.2 Social Evaluation Based on Innovation Systems
Several research questions and methods were also involved in the social systemevaluation, e.g. policy analysis, analysis of societal acceptance, actor and marketanalyses. A policy analysis was performed to assess how existing rules and regu-lations influence the possibility to realize SA production from mixed food waste inSweden. The main source of data for the analysis were documents on policydirectives and instruments complemented with workshops and interviews withfocus groups. A key result is that there are hardly any policy instruments supportingbio-based chemical development on national and EU level. So far there exists onlydeclarations of intent in various policy documents and reports and limited R&Dsubsidies. Another key result is that subsidies and investments in the developmentof biofuels, in particular biogas, for the transport sector influence the access of
Table 1 Multiple perspectives, scale and methods involved in the evaluation
Multiple perspectives Scale of analysis Multiple methods
Technical evaluation Lab scale Elementary analysisLaboratory cultivationMechanical property
Social evaluation Innovation systemsNational and EU scale
Policy analysisSocietal acceptanceScreening of market
Resource evaluation Plant and national scale Material flow analysisScenario analysis
Environmental evaluation Plant and life cycle scale Life cycle assessmentCurrent and future system
The Value of Transdisciplinary … 329
feedstock for the production of bio-based chemicals and might contribute toincreased competition in the future.
Societal acceptance is essential for the legitimacy of an innovation and to assesshow norms and values in society influence the prospects of producing SA frommixed food waste. The main source of data for the analysis were interviews andworkshops complemented with analysis of discussions in related areas, such asGMO and food versus fuel (e.g. through newspaper articles, NGO webpages, andresearch reports). The results show that the perceptions of circularity of biomassand bio-based chemicals and related products are positive. However, public resis-tance towards genetically modified organisms has previously hampered the real-ization of a bio process production facility and may do so in the case of SA as well.
A screening of market data and scenarios was carried out to judge the futuredemand of increased SA production. The main source of data for the analysis weredocuments and literature on future market. The results indicate that there is ademand for bio-based SA and that it is expected to grow in the future consideringbio-based SA can substitute a range of fossil chemical components, not only fossilSA. Also, there is an interest of producing and buying bio-based chemicals andrelated products in a more resource efficient manner, e.g. using waste instead of thecurrently used food crops.
Finally, a mapping of current and future actors was made to determine if theright type of actors can be mobilized to realize a SA value chain to enable theproduction facility. The results show that although technical competences exist andmarket demand is expected in the future, actors are not yet fully committed oraligned to develop bio-based chemicals production such as SA from food waste.Further details can be found in related work of Ulmanen et al. [8].
2.3 Resource Evaluation Based on Waste Flows
Several research questions and methods were involved in the resource evaluatione.g. material flow analysis and scenario analysis. The question of which capacity isneeded for production of bio-based SA was approached using benchmark ofexisting and planned production sites for bio-based SA production. The resultsshow that a capacity of at least 10,000 tons bio-based SA/year is likely to be neededfor a commercial plant. Material flow analyses were used to determine if there issufficient mixed food waste in Sweden for that production capacity. The resultsshow that there is sufficient mixed food waste in Sweden as a whole, but not inindividual facilities. Further, scenario analysis (including material flow analysisand policy analysis) was used to assess if there is sufficient mixed food waste inSweden for the production capacity, also given political goals to minimize avoid-able food waste. The results show that there are sufficient flows in Sweden,although distributed among sites in a large geographical area. Further details can befound in related work of Rex et al. [7].
330 B. Brunklaus et al.
2.4 Environmental Evaluation Based on the Life Cycle
In the environmental evaluation, a life cycle assessment of current and futuresystems was performed. Life cycle assessment with focus on valorisation optionswas used to analyse if the current biogas production or the future production of SAhad the lowest environmental impacts as valorisation option for mixed food waste.The process description of biogas is based on an existing biogas facility inHeljestorp [9]. The process description used of food waste to succinic acid is basedon lab-scale data with mixed food waste [10]. The results show that current biogasproduction has a better environmental performance on all main impacts categoriesused (global warming potential, energy use, acidification potential, eutrophicationpotential) than future production of SA with mixed food waste. In parallell, a lifecycle assessment with focus on feedstocks was performed to adress the question:Do mixed food waste have a better environmental performance than current feed-stocks for SA production? The process description of Corn to succinic acid hasbeen chosen based on Reverdia Direct Crystallization process described in Coket al. [11] and Smidt et al. [12]. The results show that a future use of mixed foodwaste likely would have a better environmental performance than currentcorn-based feedstocks. Further details on the comparison and evaluation can befound in related work of Carlson [13] and Brunklaus et al. [14].
2.5 Multiple Evaluations Show Complementing Results
As seen from above, multiple perspectives and methods are involved in the differentevaluations and show complementing results. The results of the case study showthat, even though from a technical and resource system perspective, productionseems possible, from a social system perspective SA production currently lacksinstitutional support and actor commitment and alignment for realizing develop-ment in Sweden. From an environmental and life cycle perspective, the scoping ofthe analysis is decisive for the results: SA production from mixed food waste isenvironmentally beneficial if compared with the SA production from corn, but froma pure waste handling perspective, it is environmentally better to produce biogasthan SA from mixed food waste.
3 Potentials and Limitations of Combined SystemsApproaches
Different systems approaches provide guidance about current and future industrialsystems. Each of the method approaches are based on different questions andprovide different answers. To take this further, one has to understand some general
The Value of Transdisciplinary … 331

approaches in systems science: What are the differences in goal and scope? Whatare the potentials and limitations of combined systems approaches?
3.1 Differences in Goal and Scope
Systems approaches are based on the goals and the scope of the study. To saysomething about how valid the different results of the multiple perspectives are inrelation to each other, it is important to understand the object and the scope ofanalysis of each assessment, presented in Table 2.
In the technical evaluation, the object of analysis is the biotechnological pos-sibilities and the scope of the study lies on the molecular scale and the laboratoryscale. Results have to be seen per scale and technical indications can be madelimited to the scale. The social evaluation was made as part of of a technologicalinnovation systems analysis on national and EU scale. Here the scope andboundaries of the study is based on so called structural components, that includestechnology, actors, networks and institutions. Institutions refers to formal policyrules and regulations as well as informal norms and values related to societalacceptance. In the resource evaluation, material flows are in focus and the scope andboundaries the study is based on the production scale and geographical scale. In theenvironmental evaluation, the object of analysis is physical flows of material,resources, waste and energy, and the scope and boundaries of the study is based onprocesses that are part of the life cycle of handling food waste and producing SA,respectively. Results for resource and environmental evaluations have to be seenper scale and indication have to be seen as well in temporal scale of current andfuture value chains.
Systems approaches as used in the example above require significant time andefforts, as well as expertise in different scientific areas. These are essential forcomplex problem solving, and are thus system dependent as described in Flood andCalsson [15]. The potential in relation to systems perspectives lies in knowledgecreation. Knowledge is built on like building blocks, which together forms the basisfor decision-making and the next step in the innovation process.
Table 2 Multiple perspectives, object and scope of the analysis involved
Multiple perspectives Object of the anlaysis Scope of the analysis
Technical evaluation Biotech possibilities Molecular scale, lab scale
Social evaluation Innovation systems National and EU scale
Resource evaluation Material and waste flows Production scale
Environmental evaluation Current and future process Life cycle, temporal scale
332 B. Brunklaus et al.
3.2 Potentials in Relation to Life Cycle Management
Taken together, the studies differ in both the objects of analysis and the scope andboundaries in which the results are valid. Moreover, methods used derive fromdifferent research traditions and method approaches such as the analytical, thesystem and the social approaches described in Arbor and Bjerke [16] and Wolf [17].Due to different research traditions and method approaches and their fundamentaldiscrepancies, and the related amount of work and efforts made, it might bequestionable to relate answers from these perspectives in the same assessment, as isthe case in the example above. Yet we argue that for Life Cycle Management,assessing multiple perspectives and transdiciplinary approaches is a valuable way ofworking. Life Cycle Management is about decreasing the negative impact ofphysical flows in society, by approaching the acts and practices of actors in thesystem. In this respect, there is a need to understand the premises for success ineverything from technological possibilities in lab scale to the amount of materialsavailable in a region, and the norms, values and intentions of actors needed todevelop the system. Thus, combined systems studies should, with careful respect tothe differences in goal and scope, be seen as complementary studies to guidetechnology innovation. Insights form these multiple perspectives can be of value forany actor aiming to manage these systems for the advances of less environmentalimpact from a life cycle perspective. Further research on evaluating various actorsmight give some insights on of how useful the various systems studies were in thecollaboration, and toward decision making. To this end, the above perspectives areseen as complementary, yet not exhaustive. An important perspective not includedin the above is an assessment of the economic feasibility of SA from MFW. Alsocombining SA with other products in a bio-refinery has not been evalutated, to givesome examples.
4 Conclusion
Combined-systems approaches and multiple methods contribute with a usefulholistic perspective to evaluate and guide technology innovation from a life cycleperspective. Results from a case study on bio-based SA does not provide a unan-imous answer on whether the prospects for transforming MFW into bio-basedchemicals are favorable or not, but gives a nuanced evaluation that offers a morefirm foundation for decision and further development than one perspective ormethod in isolation. The transdisciplinary approach can inform an arena of researchand industrial partners with different perspectives to facilitate discussion and morewell-informed decisions. Despite time and efforts, the case thus illustrates thebenefits of applying a transdisciplinary approach with multiple perspectives whenassessing and evaluating potential routes to a more bio-based economy, and whenseeking to manage the progress of sustainable value chains.
The Value of Transdisciplinary … 333
Achnowledgements This research is financed by FORMAS and this paper builts on earlierstudies including different perspectives: “systems perspective” [7], “technological innovationsystem” [8] and “life cycle assessment” [13, 14]. The authors greatfully acknowledge the SwedishResearch Council Formas for financing this research (FORMAS project no 211-2013-70), as wellas Ragn Sells AB for kindly providing the mixed food waste and production facility data.
References
1. FAO, Global food losses—Extent, causes and prevention. Food and Agriculture Organizationof the United Nations FAO, ISBN 978-92-5-107205-9, Rome, 2011.
2. US Department of Energy, Top value assed chemicals from biomass. Energy Efficiency andRenewable Energy, US Department of Energy, 2004.
3. Choi S, Song C.W, Shin J.H, Lee S.Y, Biorefineries for the production of top buildingblock chemicals and their derivatives. Journal of Metabolic Engineering, Vol. 28, 2015,pp. 223–239.
4. FORMAS, Swedish Research and Innovation Strategy for a Bio-based Economy. Report No3, Swedish Research Council Formas, 2012.
5. Avfall Sverige, Hushållsavfall i siffor—Kommun- och länsstatistik. Rapport no 33. AvfallSverige, 2016.
6. Rosander E, Svedendahl Humble M, Veide A, Municipal solid waste as carbon and energysource for Escherichia coli. Journal of Advances in Waste Management and Recycling, Vol.1, Issue 2, 2016, pp. 2–8.
7. Rex E, Rosander E, Royne F, Veide A, Ulmanen J, A systems perspective on chemicalproduction from mixed food waste: The case of bio-succinate in Sweden. Journal of Resource,Conservation and Recycling, Vol. 125, 2017, pp 86–97.
8. Ulmanen J, Rex E, Torén J, Prospecting development of sustainable innovation in a context ofmultiple technology systems: The case of high platform chemicals from food waste. ISTConference at SPRU, Brighton, 2015.
9. RagnSells, Technical information and data on the Heljestorp biogas facility. Internaldocument. Ragnsells AB, 2016.
10. Sun Z, Li M, Qi Q, Gao C, Lin C.S.K, Mixed food waste as renewable feedstock in succinicacid fermentation. Journal of Applied Biochemistry and Biotechnology, Vol. 174, Issue 5,2014, pp. 1822–1833.
11. Cok B, Tsiropoulos I, Roes A.L., Patel M.K., Succinic acid production derived fromcarbohydrates: An energy and greenhouse gas assesment of a platform chemcial towardsa bio-based economy. Journal of Biofuels, Bioproducts and Biorefining, Vol. 8, 2014,pp. 16–29.
12. Smidt M, Den Hollander J, Bosch H, Xiang Y, Van Der Graaf M, Lambin A, Duda, J-P, LifeCycle Assessment of Bio-based and Fossil Based Succinic Acis. In: Sustainability Assessmentof Renewables-Based Products: Methods and Case Studies. Chichester, UK: John Wiley &Sons, Ltd., 2015.
13. Carlsson E., The future of food waste—LCA of existing and emerging routes to bio-basedchemicals. Master thesis at Energy and Environment, Report nr 2016:8, Chalmers Universityof Technology, 2016.
14. Brunklaus B, Rex E, Berlin J, The future of Swedish food waste: An environmentalassessment of existing and prospective valorization techniques. Accepted in Special Issue:Food waste—Challenges and Opportunities for the emerging Bio-Economy, Journal ofCleaner Production, 2017.
334 B. Brunklaus et al.

15. Flood R.L, Carson E, Dealing with complexity: An introduction to the theory and applicationof systems science. Springer Science & Business Media, 2013.
16. Arbnor I, Bjerke B, Företagsekonomisk metodlära. Electronic Eition. Studentliteratur, 2008.17. Wolff R, Beyond environmental managemnet—perspectives on environmental and manage-
ment research. Journal of Business Strategy and the Environment, Vol. 7, Issue 5, 1998,pp. 297—308.
Open Access This chapter is licensed under the terms of the Creative Commons Attribution 4.0International License (http://creativecommons.org/licenses/by/4.0/), which permits use, sharing,adaptation, distribution and reproduction in any medium or format, as long as you give appropriatecredit to the original author(s) and the source, provide a link to the Creative Commons license andindicate if changes were made.The images or other third party material in this chapter are included in the chapter’s Creative
Commons license, unless indicated otherwise in a credit line to the material. If material is notincluded in the chapter’s Creative Commons license and your intended use is not permitted bystatutory regulation or exceeds the permitted use, you will need to obtain permission directly fromthe copyright holder.
The Value of Transdisciplinary … 335

Improving Interpretation, Presentationand Visualisation of LCA Studiesfor Decision Making Support
Serenella Sala and Jessica Andreasson
Abstract Interpretation, presentation, and visualization of life cycle assessment(LCA) results are key steps for ensuring proper decision support. Despite the inter-pretation being a crucial step, it is often not performed in a systematic way. Forexample, sensitivity analysis, variability and uncertainties analyses, comparison withresults coming from different disciplines and domains are not properly done. So far,numerous LCA studies have been published and are often used by decision makers(both in business and policy contexts) to support the identification of hotspots or fordrawing conclusions from meta-reviews while missing a good interpretation.Moreover, improving current practices in the visualisation of the results may helpboth the interpretation and the communication of LCA by a broader audience.
1 Introduction
According to ISO 14040, interpretation is the phase of LCA in which the findingsfrom the inventory analysis and the impact assessment are considered together. Itshould deliver results that are consistent with the defined goal and scope of thestudy and which reach conclusions, explain limitations and provide recommenda-tions. ISO 14044 further specifies that interpretation comprises the following ele-ments: (i) identification of the significant issues based on the results of the life cycleinventory (LCI) and life cycle impact assessment (LCIA) phases of LCA;(ii) completeness, sensitivity and consistency checks; (iii) conclusions, limitations,and recommendations.
Despite the interpretation is a crucial step for supporting decision making, this stepis often not performed in a systematic way. For example, sensitivity analysis from the
S. Sala (&)European Commission, Joint Research Centre, Directorate D-Sustainable Resources,Bio-Economy Unit, via Enrico Fermi 2749, 21027 Ispra, VA, Italye-mail: [email protected]
J. AndreassonVolvo Car Corporation, Gothenburg, Sweden
© The Author(s) 2018E. Benetto et al. (eds.), Designing Sustainable Technologies,Products and Policies, https://doi.org/10.1007/978-3-319-66981-6_37
337
inventory step (e.g. between different source of secondary data) [1] up to the impactassessment (e.g. between different methods for impact assessment [2, 3] and nor-malisation references [4]), variability and uncertainties analyses, comparison withresults coming from different disciplines and domains are not properly done. So far,numerous LCA studies have been published and are often used by decision makers(both in business and policy contexts) to support the identification of hotspots or fordrawing conclusions from meta-reviews while missing a good interpretation. In 2016,a guidance on interpretation has been published by the European Commission, JointResearch Centre [5], aiming at fostering a discussion on the critical role of inter-pretation and visualization of results. Besides, very different audiences, having dif-ferent backgrounds and expectations, may use LCA results: decision-makers,scientists, public authorities, consumers, etc. The way LCA results are presented istoo often generic instead of being tailored to their needs. Moreover, LCA deals withnumerous environmental impact indicators, large amount of data, uncertainties,spatial differentiation etc. LCA has evolved from a simple carbon and energyaccounting to the assessment of large and complex consequential systems. Still, theway the results are presented has not changed a lot, i.e. mainly bar-charts, pie-charts,simple tables and Sankey diagrams. In the meantime, data visualization and analysishas evolved, with new interactive ways of displaying results, which may both helpinterpretation and communication of the results.
2 Interpretation, Presentation and Visualisation
The session on “Improving interpretation, presentation and visualisation of LCAstudies for decision making support” at LCM 2017 aimed at discussing how topromote a transition toward more robust interpretation, presentation, and visual-ization of the LCA results. This includes the identification of key elements andcriteria for knowledge capitalization, with regard to existing studies.
Life cycle-based methodologies as LCA but also other integrated assess-ment approaches are used in decision-making processes, product development andmarketing activities. LCA methodology may be used as a methodology for sup-porting the identification of ‘hot spots’ in the value chain and measuring progresstowards sustainability targets. It is important for companies to find common groundon how to implement these approaches, which data assessments and impactassessments to be used and how results should be interpreted. ISO rules give a goodbasis for that work, though is not sufficient.
2.1 Identifying Target Audience for LCA Results
Within a company or an institution, before any successful adaptation and visual-ization of life cycle information, it is important for internal life cycle experts to
338 S. Sala and J. Andreasson
identify and understand how other functions of the company or institution perceiveand value life cycle information in their specific working situations and decisioncontexts. To get a better understanding of these internal users of life cycle infor-mation, life cycle experts in four multinational companies (Akzo Nobel, Vattenfall,Volvo Cars, Volvo Group) have joined forces with researchers in Life CycleManagement and behavioural science to create a graphical map of how life cycleinformation is spread and used in different parts of an organization. The map isconstructed by combining (a) inventories on how quantitative data seeks its way tointernal users through databases, reports and Key Performance Indicators (KPIs),with (b) qualitative interviews on goal framing and decision weights of e.g. envi-ronmental and economic information. As a result, the map illustrates both the“physical” flows of life cycle information and the “cognitive logics” of thisinformation for different users (e.g. how values, attitudes and norms influence thetarget groups’ likelihood of including life cycle information in their decision pro-cesses). Based on the map, each company can identify and discuss who the mainusers of life cycle information are and what premises for life cycle thinking theseusers have. In what decision-making situation is, or can, life cycle information beused? How is the information understood? What other sources of information andrationales for decisions are used in parallel to, or in conflict with, LCA results?Initial analyses on the usefulness of the map point to a better understanding of howlife cycle experts can tailor information for decisions in different parts of thecompany, as well as on its usefulness in illustrating to people outside of theenvironmental departments the widespread use of life cycle information that alreadyexist in the company.
Moreover, LCA results may be used to influence design solution for products,needing an interaction between LCA experts, products designer and consumers.This often happens is a context with certain legislative constraints or requirement.A model for supporting life cycle design of food and packaging has been pre-sented at the LMC conference. Packaging designer cannot give packaging allfunctions, because it is impossible to grasp all relations among demands andfunctions, and there are trade-off relations among them. An activity model visu-alizing information flows among stakeholders was constructed to design an envi-ronmentally conscious product, having a broad life cycle perspective. This allowedto optimise design parameters (e.g., packaging material and weight, filling rate) andfunctions (e.g., permeability, usability) along the life cycle of food products.
2.2 Tailoring the Presentation of LCA Resultsand Promoting Best Practices
Several challenges are faced by industrial sustainability experts and practitionerswhen communicating and visualising LCA results in different decision-makingcontexts. The project SAMT (Sustainability assessment methods and tools tosupport decision-making in the process industries) [6], was focusing on
Improving Interpretation, Presentation and Visualisation of LCA … 339
communication of LCA results in different decision-making contexts addressing allthose challenges. Experiences and good practices from the cement, oil, metal,water, waste and chemical industry were collected using interviews, workshops andpractical case studies. Crucial aspects identified during the project were, amongothers: (i) communicating uncertainty; (ii) explaining the proximate and underlyingcauses of variability in results; (iii) integrating results representing different impactcategories and defining proper benchmarks for comparison. Challenges related tointerpretation and communication are faced especially in situations in which adecrease in one indicator or impact category is offset with an increase in anothercategory. The findings of the project indicate that many of the challenges related tocommunication are similar despite of the sector in question. There is also a need toharmonise the way results are presented, in order to increase transparency andimprove comparability of the studies.
For exchanging experiences, updating or adopting methods, the “InternationalSustainability Practitioners Network” (ISPN) was created since 2012. The ISPN isan exchange forum for LCA methodology in the context of industry and comprisessustainability experts from a range of different industry sectors. Examples of goodpractices of this cross-sectoral initiative and opportunities for improving sustain-ability assessments within of companies are the focus of the exchange betweenexperts. The ISPN members address challenges and solutions in terms of dataavailability and uncertainty, streamlining and using standardization processes aswell as communication of results with non-LCA-experts.
2.3 Improving Visualisation of LCA Results
Given the perceived complexity of LCA, improving the presentation and visuali-sation of results and the uncertainties thereof is crucial for decision support. Newfeatures have been presented for two softwares, namely Open LCA [7] andRangeLCA [8].
OpenLCA has expanded its interpretation component in order to better presentthe hotspots analysis using new visualisation features from the open source: radarcharts, sun burst graphs, contribution trees, geographical display of regionalizedresults, and tables with the values of inventory, impact results and impact factor perelementary flow contributing to the hotspot towards a structured interpretation ofthe results. Moreover, an assessment and effective handling of the data quality isalso key for the interpretation especially if the study is used for decision support.OpenLCA proposes an innovative way to calculate, aggregate and display dataquality information along the life cycle, to make the detection of data qualityhotspots easier, i.e. to detect e.g. whether hotspots appear in the case study to someextent because of weak data quality, or whether hotspots call for immediate actionbecause they are based on reliable information. The calculated data quality is shownalong with the LCI and LCIA results in the different visualisations of openLCA,including impact analysis tables and Sankey diagram.
340 S. Sala and J. Andreasson
Besides, the LCA software RangeLCA is proposing new ways of visualizingcomparative LCA results for representing the diversity of individual cases and theuncertainty. RangeLCA, automatically integrates a full sensitivity analysis byassociating probability distributions or discrete ranges of values to each variableparameter. LCIA results are calculated for a large number of cases, each corre-sponding to a possible combination of variable parameters. For each impact cate-gory, results of all cases are plotted as a “cloud of points” in function of the mostinfluential parameters. When comparing two systems, common variable parameterstake common values for a same case. Results can hence be compared two by twoand a delta between systems can be calculated for each case. Plotting these deltavalues in “delta graphs” allows the common variability to be eliminated and theinterpretation to concentrate on the remaining variability. A colour code distin-guishes positive and negative deltas. These graphs allow identifying areas of rel-evance where conclusions can be drawn for certain ranges of values of two mainparameters. This type of graphs allows acquiring a more complete vision of acomplex system, reliability of conclusions in comparative LCA by showing whe-ther differences are significant or not in terms of sign and amplitude. Delta graphsand areas of relevance help LCA studies to answer much broader questions, suchas: “In which range of situations is a system rather better than another one? “
3 Conclusion and Outlook
The last phase of a LCA, namely the interpretation of the life cycle inventory andimpact assessment results, is especially important in LCM as it is key fordecision-making and communication of results. Ability to create meaningful andeasily understandable results would be essential in order to increase the accept-ability and applicability of the methods, and to mainstream their use in differentdecision-making situations, that may include for example product and processdevelopment, supply chain management, investment decisions, marketing andresponding to stakeholder requests. Future effort should be both on the side ofimproving the analytical power of LCA tools adopted by practitioners and in theunderstanding of the diversified communication needs of a wide range of stake-holders both in business and institutional context. From the analytical aspects pointof view, a systematic approach in the interpretation and hotspots analyses, includingmethods for sensitivity analysis, variability and uncertainty analysis, is needed.From the communication point of view, there is the need of improving the iden-tification of the target audience of the results, for tailoring the communication,including the rationale on how to choose visualization and graphical toolsdepending on the key messages to show and on the audience. This could befacilitated by the adoption of new ways of visualizing LCA results, using interactiveand advanced visualization tools for both external and internal stakeholders.
Improving Interpretation, Presentation and Visualisation of LCA … 341

References
1. Corrado S, Zampori L, Castellani V, Sala S, Systematic analysis of secondary Life CycleInventories when modelling agricultural production: a case study for arable crops, Journal ofCleaner Production, Vol. 172, 2018, pp. 3990–4000.
2. Rigamonti L, Falbo A, Zampori L, Sala S, Supporting a transition towards sustainable circulareconomy: sensitivity analysis for the interpretation of LCA for the recovery of electric andelectronic waste, International Journal of Life Cycle Assessment, Vol. 22, No. 8, 2017,pp. 1278–1287.
3. Castellani V, Lorenzo B, Sala S, Hotspots analysis and critical interpretation of food life cycleassessment studies for selecting eco-innovation options and for policy support, Journal ofCleaner Production, Vol. 140, No. 2, 2017, pp. 556–568.
4. Benini L, Sala S, Integrated assessment of environmental impact of Europe in 2010:uncertainty and sensitivity of the normalisation factors to methodological assumptions,International Journal of Life Cycle Assessment, Vol. 21, No. 2, 2016, pp. 224–236.
5. Zampori L, Saouter E, Schau E, Cristobal Garcia J, Castellani V, Sala S, Guide for interpretinglife cycle assessment result, JRC technical report, Publications Office of the European Union;2016.
6. https://www.spire2030.eu/samt, (Accessed 05.09.2017).7. http://www.openlca.org/, (Accessed 05.09.2017).8. http://www.rdcenvironment.be, (Accessed 05.09.2017).
Open Access This chapter is licensed under the terms of the Creative Commons Attribution 4.0International License (http://creativecommons.org/licenses/by/4.0/), which permits use, sharing,adaptation, distribution and reproduction in any medium or format, as long as you give appropriatecredit to the original author(s) and the source, provide a link to the Creative Commons license andindicate if changes were made.The images or other third party material in this chapter are included in the chapter’s Creative
Commons license, unless indicated otherwise in a credit line to the material. If material is notincluded in the chapter’s Creative Commons license and your intended use is not permitted bystatutory regulation or exceeds the permitted use, you will need to obtain permission directly fromthe copyright holder.
342 S. Sala and J. Andreasson
Visualizing the Effects of ParameterVariability on Comparative LCAResults
Céline Alexandre, Elisabeth van Overbeke, Maxime Dupriez,Johan Lhotellier and Bernard De Caevel
Abstract Bar charts and other usual ways of presenting LCA results depict oneaverage or typical situation, lacking to represent the diversity of individual casesand the uncertainties associated to input data or modelling assumptions. This paperpresents ways of visualizing variable results in comparative LCA. The main con-cept is to perform at once calculations representing this variability. Based on MonteCarlo analysis, the approach is enabled by the LCA software RangeLCA, devel-oped by RDC Environment. Results of all simulations can be plotted in function ofone or two influential parameters. A clear and complete view can hence be obtainedas well as more reliable conclusions. Instead of answering the question “Is a systembetter than another one in specific cases?”, the presented graphs help LCA studiesto answer a much broader question: “In which range of situations is a system betterthan another?”.
1 Introduction
In most LCAs, some parameters are better characterized by variable values than byfixed “typical” values. The reasons for the variability can be of two types: uncer-tainty and diversity of situations. The uncertainty can be either systematic (e.g.linked to imprecision of the measuring instrument), stochastic (e.g. fluctuation of aparameter with time) or epistemic (e.g. modelling required in the absence ofmeasurement) [1]. The diversity of potential situations within the studied systemalso leads to parameter variability, e.g. the transport to various customers is bestmodelled by a range of distances or a waste can be either incinerated or landfilled.
The way the input data variability influences the results can be analysed. Theuncertainty analysis is the “systematic procedure to quantify the uncertaintyintroduced in the results of a life cycle inventory analysis due to the cumulativeeffects of model imprecision, input uncertainty and data variability” [2]. It is
C. Alexandre � E. van Overbeke (&) � M. Dupriez � J. Lhotellier � B. De CaevelRDC Environment, 1160 Brussels, Belgiume-mail: [email protected]
© The Author(s) 2018E. Benetto et al. (eds.), Designing Sustainable Technologies,Products and Policies, https://doi.org/10.1007/978-3-319-66981-6_38
343

currently mostly performed by Monte Carlo analysis, which is available in severalcommercial LCA software tools [1].
Sensitivity analysis is defined as a “systematic procedure for estimating the effectsof the choices made regarding methods and data on the outcome of a study” [2]. Ithelps identifying the most influential parameters, for prioritizing data refining andreinforcing conclusions. Sensitivity analyses are in current practice mainly carried outby varying one parameter at a time or by studying alternative scenarios [1].
Wei et al. [3] propose some guidelines on how to perform sensitivity analysiswhen some data and modelling parts are correlated. Groen et al. [4] discuss severalapproaches to conduct a sensitivity analysis. They analyse their capacities anddrawbacks. They determined that the disadvantage of the method of elementaryeffects (MEE), using ranges of values from upper to lower boundary of an inputparameter, is that “the results are not an estimation of the actual variance decom-position” but MEE can be used as a precursor to the more computationallydemanding sampling methods as regression. They see as a main drawback of thestandardized regression coefficients (using Monte Carlo sampling) that many runsare needed to calculate the variance decomposition.
In fact, the advantages of using ranges of values for input parameter and MonteCarlo sampling can be combined and the analysis is made easier to interpret byusing some fast calculation methods and visual interpretation.
This paper describes the use of Monte Carlo analysis for depicting a large rangeof possible situations. Emphasis is put on presenting innovative ways of visualizingresult variability, which helps interpretation and decision making. The discussion isbased on a real case study.
2 Description of the Case Study
The selected case study aims at comparing two systems of packaging: a corrugatedbox versus a reusable folding plastic crate. The functional unit is defined as: thepackaging, transport and delivery of goods in one case from the good manufacturerto the distributor or repacker. It is assumed that the cases have similar dimensions inboth systems and contain the same number of goods.
For the purpose of this paper, results are only presented for the impact categoryglobal warming potential (GWP, with biogenic carbon taken into account). Thestudy is divided into two parts: (i) the “average comparison” scenario, i.e. inves-tigation of the impacts of two average cases, each representative of one system;(ii) the sensitive analysis, i.e. calculation and interpretation of results covering alarge range of situations defined as possible for each system.
344 C. Alexandre et al.
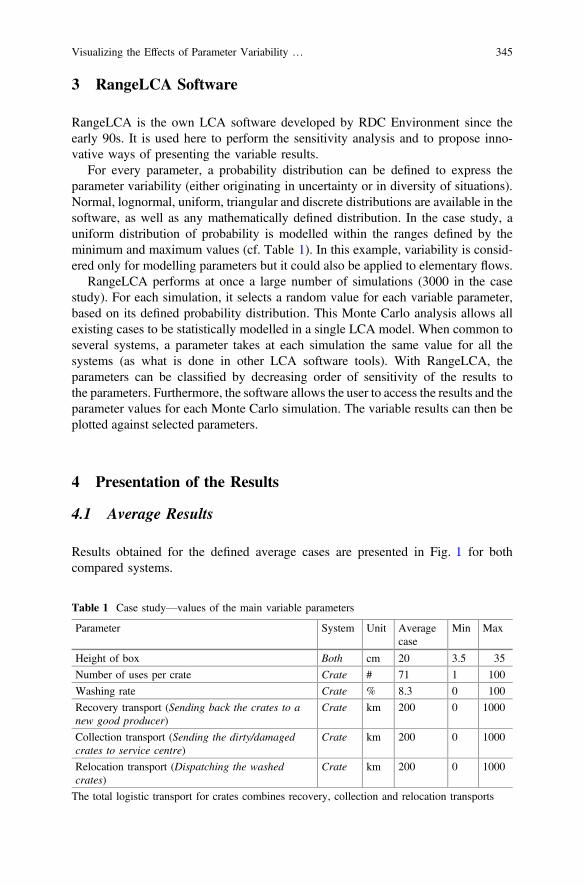
3 RangeLCA Software
RangeLCA is the own LCA software developed by RDC Environment since theearly 90s. It is used here to perform the sensitivity analysis and to propose inno-vative ways of presenting the variable results.
For every parameter, a probability distribution can be defined to express theparameter variability (either originating in uncertainty or in diversity of situations).Normal, lognormal, uniform, triangular and discrete distributions are available in thesoftware, as well as any mathematically defined distribution. In the case study, auniform distribution of probability is modelled within the ranges defined by theminimum and maximum values (cf. Table 1). In this example, variability is consid-ered only for modelling parameters but it could also be applied to elementary flows.
RangeLCA performs at once a large number of simulations (3000 in the casestudy). For each simulation, it selects a random value for each variable parameter,based on its defined probability distribution. This Monte Carlo analysis allows allexisting cases to be statistically modelled in a single LCA model. When common toseveral systems, a parameter takes at each simulation the same value for all thesystems (as what is done in other LCA software tools). With RangeLCA, theparameters can be classified by decreasing order of sensitivity of the results tothe parameters. Furthermore, the software allows the user to access the results and theparameter values for each Monte Carlo simulation. The variable results can then beplotted against selected parameters.
4 Presentation of the Results
4.1 Average Results
Results obtained for the defined average cases are presented in Fig. 1 for bothcompared systems.
Table 1 Case study—values of the main variable parameters
Parameter System Unit Averagecase
Min Max
Height of box Both cm 20 3.5 35
Number of uses per crate Crate # 71 1 100
Washing rate Crate % 8.3 0 100
Recovery transport (Sending back the crates to anew good producer)
Crate km 200 0 1000
Collection transport (Sending the dirty/damagedcrates to service centre)
Crate km 200 0 1000
Relocation transport (Dispatching the washedcrates)
Crate km 200 0 1000
The total logistic transport for crates combines recovery, collection and relocation transports
Visualizing the Effects of Parameter Variability … 345

This graph allows concluding on the lower impacts of the plastic crate versus thecorrugated box for the average scenario. It also highlights the most contributingphases. However, such result presentation does not reflect the uncertainty norprovides indication on how would the results evolve in case of a modification of amain parameter value.
4.2 Results with Variability
4.2.1 Range and Delta Graphs
In Fig. 2, the GWP results of the 3000 simulations are plotted for the comparedsystems against the total logistic distance, i.e. the most influencing parameter for thecrate system. In this “Range graph”, a cloud of points is represented for eachsystem. The slope of the trendline indicates how much the results depend on theparameter taken as x-as. The height of the cloud of points reflects the remainingvariability, i.e. the variability that is not explained by this main parameter.
For comparing two systems, the relative positions of both clouds of points isanalysed. In Fig. 2, the clouds overlap partially. Hence, it is difficult to determine inwhich situations the corrugated boxes have higher impacts than the crates.
In order to eliminate the common variability of the compared systems, the resultsof each simulation can be compared two by two. The differences between bothsystems calculated for all simulations can be plotted in a “Delta graph”, representedin Fig. 3. The analysis of delta results indicates that corrugated boxes are better in
Fig. 1 GWP results for the comparison of average cases—detail per life cycle steps
346 C. Alexandre et al.
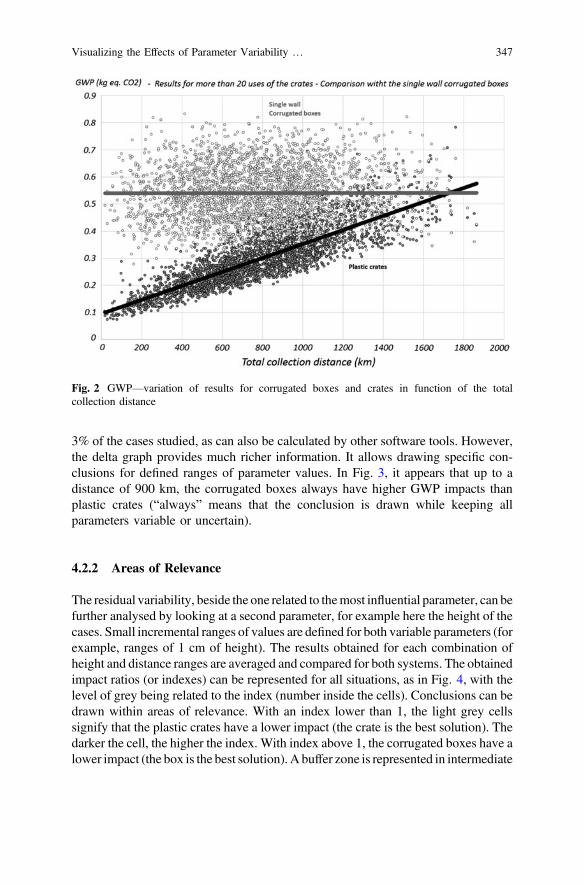
3% of the cases studied, as can also be calculated by other software tools. However,the delta graph provides much richer information. It allows drawing specific con-clusions for defined ranges of parameter values. In Fig. 3, it appears that up to adistance of 900 km, the corrugated boxes always have higher GWP impacts thanplastic crates (“always” means that the conclusion is drawn while keeping allparameters variable or uncertain).
4.2.2 Areas of Relevance
The residual variability, beside the one related to themost influential parameter, can befurther analysed by looking at a second parameter, for example here the height of thecases. Small incremental ranges of values are defined for both variable parameters (forexample, ranges of 1 cm of height). The results obtained for each combination ofheight and distance ranges are averaged and compared for both systems. The obtainedimpact ratios (or indexes) can be represented for all situations, as in Fig. 4, with thelevel of grey being related to the index (number inside the cells). Conclusions can bedrawn within areas of relevance. With an index lower than 1, the light grey cellssignify that the plastic crates have a lower impact (the crate is the best solution). Thedarker the cell, the higher the index. With index above 1, the corrugated boxes have alower impact (the box is the best solution). A buffer zone is represented in intermediate
Fig. 2 GWP—variation of results for corrugated boxes and crates in function of the totalcollection distance
Visualizing the Effects of Parameter Variability … 347

grey level when the index is around 1. For those cells, it is no clear whether it is thecrate or the box that provides the best solution.
4.3 Discussion
The GWP results presented for the average cases reveal only that, in the definedspecific scenario, crates provide a better solution than boxes, regarding this indi-cator. Instead, considering the variability of parameters like logistic distance andcase height allows identification of the range of situations where this conclusionapplies.
Fig. 3 GWP—variation of the differences between results for corrugated boxes and crates infunction of the total collection distance
348 C. Alexandre et al.
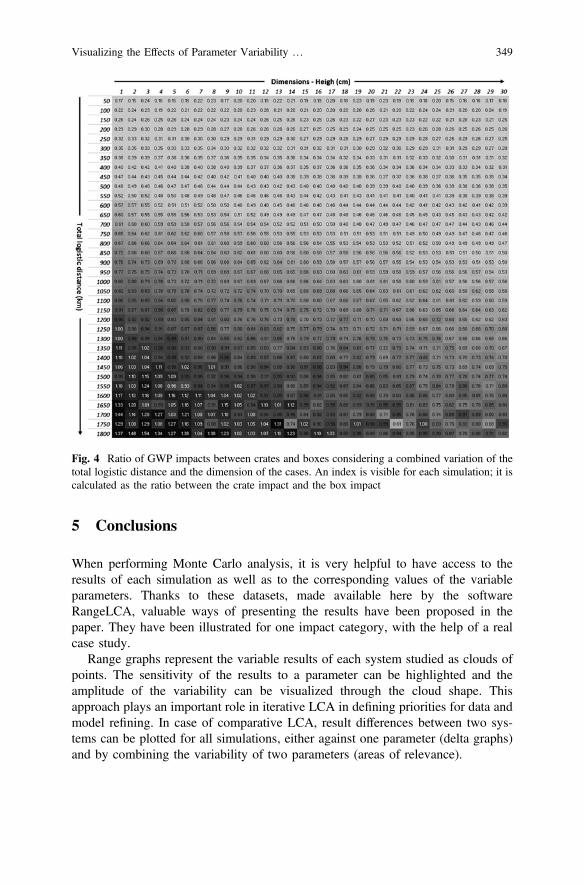
5 Conclusions
When performing Monte Carlo analysis, it is very helpful to have access to theresults of each simulation as well as to the corresponding values of the variableparameters. Thanks to these datasets, made available here by the softwareRangeLCA, valuable ways of presenting the results have been proposed in thepaper. They have been illustrated for one impact category, with the help of a realcase study.
Range graphs represent the variable results of each system studied as clouds ofpoints. The sensitivity of the results to a parameter can be highlighted and theamplitude of the variability can be visualized through the cloud shape. Thisapproach plays an important role in iterative LCA in defining priorities for data andmodel refining. In case of comparative LCA, result differences between two sys-tems can be plotted for all simulations, either against one parameter (delta graphs)and by combining the variability of two parameters (areas of relevance).
Fig. 4 Ratio of GWP impacts between crates and boxes considering a combined variation of thetotal logistic distance and the dimension of the cases. An index is visible for each simulation; it iscalculated as the ratio between the crate impact and the box impact
Visualizing the Effects of Parameter Variability … 349
These types of graphs allow acquiring a more complete vision of a complexsystem. They enhance reliability of conclusions in comparative LCA by showingwhether differences are significant or not in terms of sign and amplitude. Instead ofanswering the question “Is a system better than another one in defined specificcases?”, delta graphs and areas of relevance help LCA studies to answer a muchbroader question: “In which range of situations is a system better than anotherone?”. This is of great help to decision makers.
References
1. ScoreLCA 2014-03, Igos E, Benetto E, Les différentes sources d’incertitudes en ACV, leursmodes de calcul et impacts sur l’interprétation. June 2015.
2. ISO 14044:2006.3. Wei W, Larrey-Lassalle P, Faure F, Dumoulin N, Roux P, Mathias J.D, How to conduct a
proper sensitivity analysis in life cycle assessment: taking into account correlations within LCIdata and interactions within the LCA calculation model, Environ Sci Technol., Vol. 49(1),2015, pp. 377–85.
4. Groen E.A, Heijungs R, Bokkers E.A.M, de Boer I.J.M, Sensitivity analysis in life cycleassessment, Proceedings of the 9th International Conference on Life Cycle Assessment inthe Agri-Food Sector, San Francisco, 2014, http://lcafood2014.org/papers/196.pdf (Accessed12.06.2017).
Open Access This chapter is licensed under the terms of the Creative Commons Attribution 4.0International License (http://creativecommons.org/licenses/by/4.0/), which permits use, sharing,adaptation, distribution and reproduction in any medium or format, as long as you give appropriatecredit to the original author(s) and the source, provide a link to the Creative Commons license andindicate if changes were made.The images or other third party material in this chapter are included in the chapter’s Creative
Commons license, unless indicated otherwise in a credit line to the material. If material is notincluded in the chapter’s Creative Commons license and your intended use is not permitted bystatutory regulation or exceeds the permitted use, you will need to obtain permission directly fromthe copyright holder.
350 C. Alexandre et al.
Life Cycle Management in Industry—Supporting Business with Life CycleBased Assessments
Andreas Bednarz, Julia Beier, Thomas Grünenwald,Birgit Himmelreich, Bärbel Hundt, Florian A. Jaeger,Martin Kirchner, Stephan Krinke, Ulla Létinois, Christina Merz,Lisa Mohr, David Morris, Nikolaj Otte, Gerald Rebitzer, Peter Saling,Urs W. Schenker, Diederik Schowanek, Gerd Vollmer, Niklas von derAssen and Alain Wathelet
Abstract Sustainability is becoming more and more a strategic growth driver fornumerous companies. In this context transparency on the environmental strengthsand weaknesses of products and processes and related opportunities and risks iscrucial. Accordingly, the assessment of sustainability aspects is gaining importancefor companies and their customers along the value chain. Life cycle-basedmethodologies as Life Cycle Assessment (LCA) but also other assessment systems
A. Bednarz � B. HimmelreichCovestro AG, 51373 Leverkusen, Germany
J. BeierBeiersdorf AG, Unnastraße 48, 20245 Hamburg, Germany
T. Grünenwald � P. Saling (&)BASF SE, 67056 Ludwigshafen, Germanye-mail: [email protected]
B. Hundt � N. von der AssenBayer AG, 51368 Leverkusen, Germany
F. A. JaegerSiemens AG, 80333 Munich, Germany
M. Kirchner � C. MerzEvonik Technology & Infrastructure GmbH,Rellinghauser Straße 1-11, 45128 Essen, Germany
S. KrinkeVolkswagen AG Group Research Environmental Affairs,38440 Wolfsburg, Germany
U. LétinoisDSM Nutritional Products, Process Research, Wurmisweg 576,4303 Kaiseraugst, Switzerland
L. MohrThyssenkrupp Steel Europe AG, 47166 Duisburg, Germany
© The Author(s) 2018E. Benetto et al. (eds.), Designing Sustainable Technologies,Products and Policies, https://doi.org/10.1007/978-3-319-66981-6_39
351
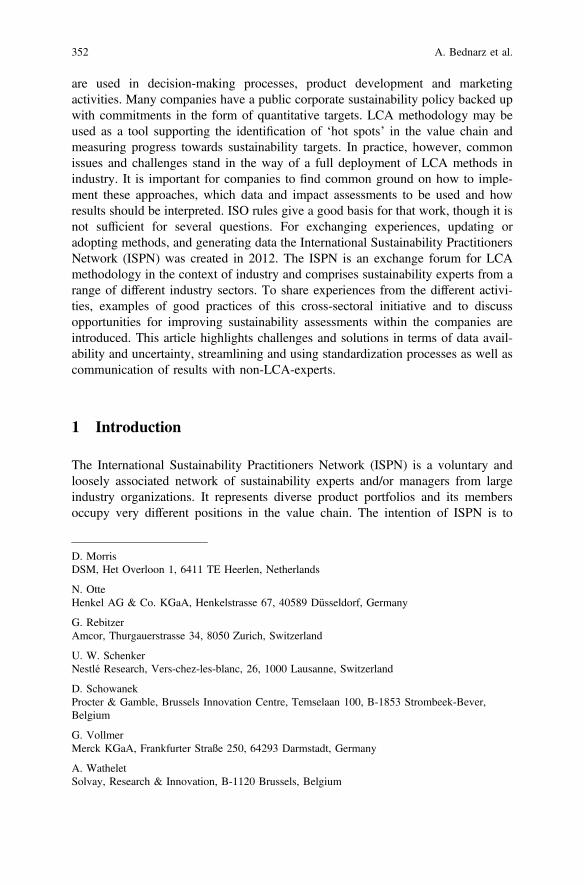
are used in decision-making processes, product development and marketingactivities. Many companies have a public corporate sustainability policy backed upwith commitments in the form of quantitative targets. LCA methodology may beused as a tool supporting the identification of ‘hot spots’ in the value chain andmeasuring progress towards sustainability targets. In practice, however, commonissues and challenges stand in the way of a full deployment of LCA methods inindustry. It is important for companies to find common ground on how to imple-ment these approaches, which data and impact assessments to be used and howresults should be interpreted. ISO rules give a good basis for that work, though it isnot sufficient for several questions. For exchanging experiences, updating oradopting methods, and generating data the International Sustainability PractitionersNetwork (ISPN) was created in 2012. The ISPN is an exchange forum for LCAmethodology in the context of industry and comprises sustainability experts from arange of different industry sectors. To share experiences from the different activi-ties, examples of good practices of this cross-sectoral initiative and to discussopportunities for improving sustainability assessments within the companies areintroduced. This article highlights challenges and solutions in terms of data avail-ability and uncertainty, streamlining and using standardization processes as well ascommunication of results with non-LCA-experts.
1 Introduction
The International Sustainability Practitioners Network (ISPN) is a voluntary andloosely associated network of sustainability experts and/or managers from largeindustry organizations. It represents diverse product portfolios and its membersoccupy very different positions in the value chain. The intention of ISPN is to
D. MorrisDSM, Het Overloon 1, 6411 TE Heerlen, Netherlands
N. OtteHenkel AG & Co. KGaA, Henkelstrasse 67, 40589 Düsseldorf, Germany
G. RebitzerAmcor, Thurgauerstrasse 34, 8050 Zurich, Switzerland
U. W. SchenkerNestlé Research, Vers-chez-les-blanc, 26, 1000 Lausanne, Switzerland
D. SchowanekProcter & Gamble, Brussels Innovation Centre, Temselaan 100, B-1853 Strombeek-Bever,Belgium
G. VollmerMerck KGaA, Frankfurter Straße 250, 64293 Darmstadt, Germany
A. WatheletSolvay, Research & Innovation, B-1120 Brussels, Belgium
352 A. Bednarz et al.
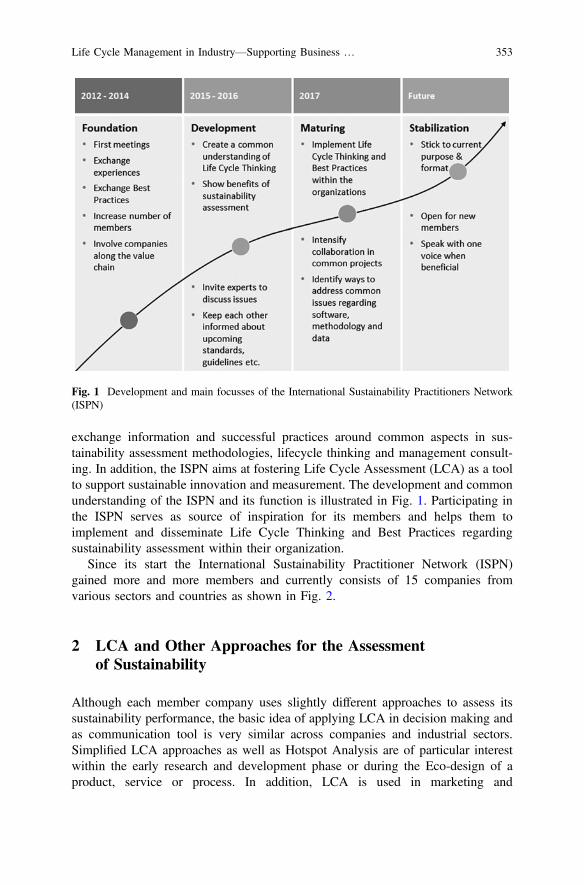
exchange information and successful practices around common aspects in sus-tainability assessment methodologies, lifecycle thinking and management consult-ing. In addition, the ISPN aims at fostering Life Cycle Assessment (LCA) as a toolto support sustainable innovation and measurement. The development and commonunderstanding of the ISPN and its function is illustrated in Fig. 1. Participating inthe ISPN serves as source of inspiration for its members and helps them toimplement and disseminate Life Cycle Thinking and Best Practices regardingsustainability assessment within their organization.
Since its start the International Sustainability Practitioner Network (ISPN)gained more and more members and currently consists of 15 companies fromvarious sectors and countries as shown in Fig. 2.
2 LCA and Other Approaches for the Assessmentof Sustainability
Although each member company uses slightly different approaches to assess itssustainability performance, the basic idea of applying LCA in decision making andas communication tool is very similar across companies and industrial sectors.Simplified LCA approaches as well as Hotspot Analysis are of particular interestwithin the early research and development phase or during the Eco-design of aproduct, service or process. In addition, LCA is used in marketing and
Fig. 1 Development and main focusses of the International Sustainability Practitioners Network(ISPN)
Life Cycle Management in Industry—Supporting Business … 353
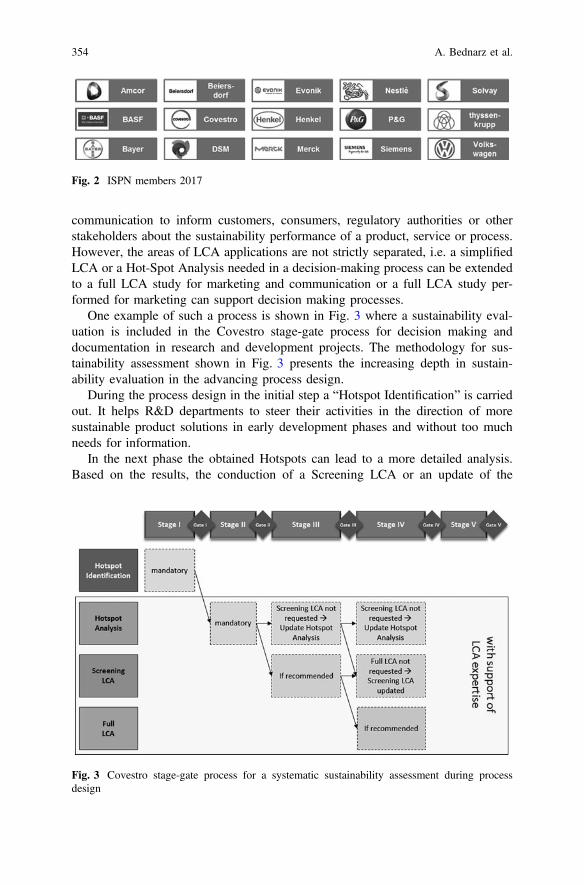
communication to inform customers, consumers, regulatory authorities or otherstakeholders about the sustainability performance of a product, service or process.However, the areas of LCA applications are not strictly separated, i.e. a simplifiedLCA or a Hot-Spot Analysis needed in a decision-making process can be extendedto a full LCA study for marketing and communication or a full LCA study per-formed for marketing can support decision making processes.
One example of such a process is shown in Fig. 3 where a sustainability eval-uation is included in the Covestro stage-gate process for decision making anddocumentation in research and development projects. The methodology for sus-tainability assessment shown in Fig. 3 presents the increasing depth in sustain-ability evaluation in the advancing process design.
During the process design in the initial step a “Hotspot Identification” is carriedout. It helps R&D departments to steer their activities in the direction of moresustainable product solutions in early development phases and without too muchneeds for information.
In the next phase the obtained Hotspots can lead to a more detailed analysis.Based on the results, the conduction of a Screening LCA or an update of the
Fig. 2 ISPN members 2017
Fig. 3 Covestro stage-gate process for a systematic sustainability assessment during processdesign
354 A. Bednarz et al.
“Hotspot Analysis” is recommended for the next stage. A reason for such a rec-ommendation can be unclear or probably negative results during the HotspotAnalysis to enhance the decision making. This might lead to the cancellation ofsuch projects if they are not sustainable. On the other hand, a hotspot analysis mayalso reveal a potential unique selling point, which must be confirmed by a full LCAprior to market launch.
Successfully applied to the innovation process, LCA approaches help to steertowards given sustainability targets and can form a valuable basis for the compa-nies’ sustainability strategy. Such methods enable an overall assessment and thedetermination of the most significant processes and products for a successfuldevelopment. Examples for a successful implementation of such methodologies inindustry are the Sustainable Solution Steering® by BASF [1, 2], the SustainablePortfolio Management by Solvay [3], the Company Footprint by P&G and I2P3®
(Idea-to-People-Planet-Profit) by Evonik [4]. BASF assessed more than 65,000product solutions to identify the most sustainable solutions and to promote those“Accelerators” in the business. Evonik’s innovation unit, Creavis, manages itsportfolio using the Idea-to-People-Planet-Profit (I2P3) process. Each strategicresearch project is assessed on the basis of environmental influences (planet) andsocietal aspects (people) as well as economic criteria (profit).
Solvay Sustainable Portfolio Management (SPM) tool enables a global andsystematic assessment of more than 80% of the business portfolio revenue everyyear, a fact based and robust compass to steer Solvay’s portfolio toward betterbusiness because it is more sustainable with 9% growth, year-to-year, forSustainable Solutions. Similar to the Solvay approach, P&G’s Company Footprintidentifies ‘Hotspots’ for the whole company by multiplying the life cycle impacts(such as energy demand, CO2-emissions, water use or eutrophication) for a givenproduct category and a life cycle stage with the sales. The results are then used todecide about the biggest opportunities for environmental improvement, and aboutthe key actors along the value chain who have the biggest impact on theimprovement, e.g. suppliers, production plants, transportation or consumers. Thisknowledge can be used in general to steer the product portfolio of the entirecompany. Since P&G found out that the biggest footprint is the energy used whenconsumers heat the water for their laundry, they expanded and improved their coldwashing products. In the logic of this portfolio steering approach, a small change ona mega brand or category can be overall more effective for the environment thanmajor design changes in small brands.
3 Challenges of Data Exchange in the Value Chain
To improve the quality of sustainability assessments and to close data gaps alongthe value chain in situations where no industry averages from associations areavailable an inter-company data exchange is needed. Thus, member companiesalready started to collaborate on common LCA projects which involve exchange of
Life Cycle Management in Industry—Supporting Business … 355
data and information along the value chain. Several formats for data exchange thatallow for the protection of Intellectual Property (IP) already exist, but still the dataexchange across different software tools and the harmonization of methodologiesremain issues which will be further outlined here.
Each company in a value chain generally owns accurate information aboutprocesses bound to its own operations, but faces a lack of information when itcomes to manufacturing steps or application of products outside of its operations.Commercial or public LCA databases, providing generic information are onevaluable source to overcome data gaps for the coverage of all relevant life cyclestages. Depending on the requirements for data quality this source of genericinformation may not be sufficient as the sheer number of existing raw materials,intermediates, processes and applications in reality makes it unlikely that goodquality data will be available for most specific product systems. This challengegrows when proceeding in the value chain.
Thus, an exchange of data among partners in a value chain seems a viablesolution in terms of data coverage and quality. Two specific problem areas wereidentified for a successful data exchange, both discussed in the following sections.
One issue relates to data format to be used for exchanges, another one to theexchange process and harmonization in the data exchange itself.
3.1 Data Formats
The application of LCA depends on the availability of data to build reliable inven-tories. Data- demand and dependency are determined by the position of a company inthe value chain as discussed above. For cradle-to-gate assessments, early value chainusers are less dependent on external data and can invest their time into the analysis ofinternal processes, while late value chain users have to complement their own datawith pre-catalogued values from databases or from their suppliers to cover the pur-chased raw material and utility inputs. To avoid using generalized datasets (proxies)from commercial databases, exchange of LCA information between companies isconsidered as an added value for the improvement of data quality in LCA.Nevertheless, this exchange is not a standard process by now.
As an important obstacle in exchanging LCA data the need for protection of IPhas been identified. LCA data has sometimes been suspected to enableretro-analysis of the underlying processes, thus violating the requirements of IPprotection.
Depending on how data is to be exchanged this problem might be alleviated.LCA data could be exchanged in three different formats:
• Unit process data• Aggregated process data• Impact indicator results
356 A. Bednarz et al.

Unit process data make the production processes of an enterprise completelytransparent. To that end there will be confidentiality issues for companies whoemploy (A) sensitive processes or (B) wish to keep their supply chain confidential.Traceability will play a role in the future for some sectors such as the energy sector.Unit process data are one way of transferring such information, while keepingflexibility.
Aggregated process data provides a reasonable level of confidentiality, as itconverts the mass and energy balance for the production of the evaluated product toelementary flows which don’t allow any back tracking to company specific data.The aggregated data may be used by other LCA practitioners to calculate any givenimpact indicator in the scope of the dataset. To that end aggregated process dataprovide flexibility in the assessment and protect IPs. As additional information, thisaggregated dataset could be completed (or not) with metadata describing some partsof the process or modelling hypothesis like allocation rules, etc.
Impact indicator results contain the least detailed information about any processwhen exchanged between value chain partners. If a “fingerprint” set of indicatorswas defined, this set of indicators would enable calculation of all relevant envi-ronmental impacts of derived products, but mainly outside of commercial LCAtools. Since the indicators are not so transparent, a detailed guideline in the cal-culation of such indicators is required. The advantage of impact indicators is theapplication of unambiguous assessment once rules for scope have been defined.Their easy tabulation enables rapid transfer and data warehousing. The ideal formatfor data exchange does not exist and depends on the demands of the involvedparties. If a standardized set of indicators is used such as those recommended by theProduct Environmental Footprint (PEF), then exchanging these indicator resultsmay provide sufficient information. Such exchange would not allow furtherinvestigation of environmental flows or calculation of customized impact indica-tors. Also, current software tools typically run on aggregated process data for unitprocess data. Implementing a combination of impact indicators in conjunction withprocess data in LCA software is not easy to handle and would not work to be acurrently viable solution.
Difficulties occurring during the exchange process are often caused by differentLCA software used and are therefore somehow out of the direct influence of suchcompanies.
3.2 Data Exchange
Companies that want to exchange LCI or LCA data often do not run the same LCAsoftware or data storage platform. Several examples were experienced where suchan exchange failed or led to imprecise results due to inconsistency in environmentalflow definitions or different implementation of LCIA methods.
Life Cycle Management in Industry—Supporting Business … 357
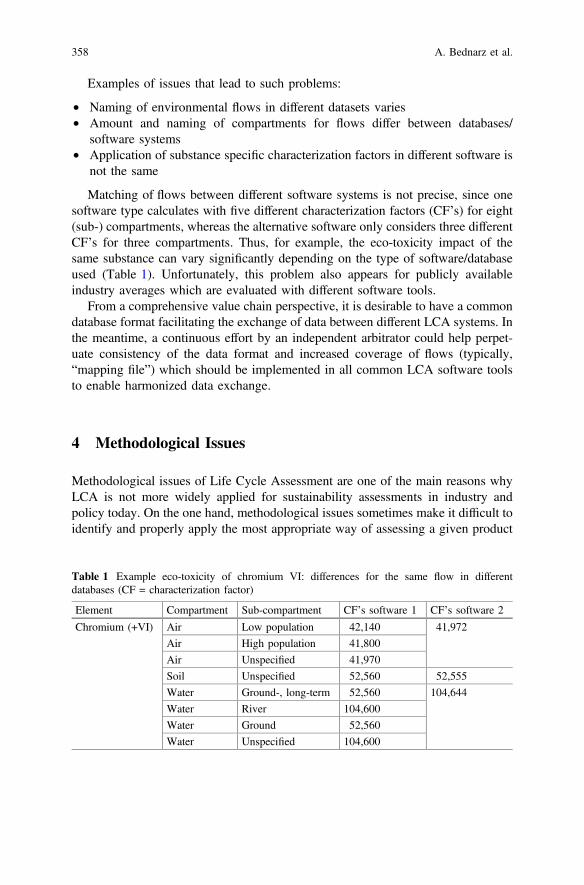
Examples of issues that lead to such problems:
• Naming of environmental flows in different datasets varies• Amount and naming of compartments for flows differ between databases/
software systems• Application of substance specific characterization factors in different software is
not the same
Matching of flows between different software systems is not precise, since onesoftware type calculates with five different characterization factors (CF’s) for eight(sub-) compartments, whereas the alternative software only considers three differentCF’s for three compartments. Thus, for example, the eco-toxicity impact of thesame substance can vary significantly depending on the type of software/databaseused (Table 1). Unfortunately, this problem also appears for publicly availableindustry averages which are evaluated with different software tools.
From a comprehensive value chain perspective, it is desirable to have a commondatabase format facilitating the exchange of data between different LCA systems. Inthe meantime, a continuous effort by an independent arbitrator could help perpet-uate consistency of the data format and increased coverage of flows (typically,“mapping file”) which should be implemented in all common LCA software toolsto enable harmonized data exchange.
4 Methodological Issues
Methodological issues of Life Cycle Assessment are one of the main reasons whyLCA is not more widely applied for sustainability assessments in industry andpolicy today. On the one hand, methodological issues sometimes make it difficult toidentify and properly apply the most appropriate way of assessing a given product
Table 1 Example eco-toxicity of chromium VI: differences for the same flow in differentdatabases (CF = characterization factor)
Element Compartment Sub-compartment CF’s software 1 CF’s software 2
Chromium (+VI) Air Low population 42,140 41,972
Air High population 41,800
Air Unspecified 41,970
Soil Unspecified 52,560 52,555
Water Ground-, long-term 52,560 104,644
Water River 104,600
Water Ground 52,560
Water Unspecified 104,600
358 A. Bednarz et al.

or system. On the other hand, different methodological choices between actors (orstakeholders) in a supply chain or product system make it difficult to find consensusand agree on common metrics, which decreases the confidence level of the end userand decision maker in LCA as a tool.
Many review studies have compiled themost important methodological issues thatremain open in LCA today. That was done e.g. in the program Sustainable ProcessIndustry through Resource and Energy Efficiency “SPIRE” with the specific projectsSustainability assessment methods and tools project “SAMT” and Metrics forSustainability Assessment in European Process Industries “MEASURE” in 2016,with ISPN members contribution [5]. For every industry sector, the key method-ological issues are different: for example, while allocation between co-products is akey issue in the food industry and the waste sector, methods to assess (eco-) toxicityare of paramount importance for the chemicals or pharmaceuticals sector. Themethodological issues of high relevance for industry can be positioned in the fourphases of LCA (as defined by the ISO standards 14040 and 14044—Table 2).
The development of novel or improved guidance or standards on methodologicalissues needs a proper governance model; including stakeholder outreach and con-sultation (cf. the process applied to the development of new ISO standards). Thiscannot be done in the context of an informal network such as the ISPN, and alsoneeds a proper process by which stakeholders outside the industry can be reached.Therefore, ISPN has not attempted to provide guidance or develop standards onmethodological issues of LCA. Instead, a selection of key external initiatives wasidentified which published suggestions for it (see Fig. 4), and have decided tofollow and engage in those processes. Standards and guidance processes are oftenindustry-specific, the ISPN offers an opportunity for a given industry sector to betterunderstand the working of other industry sectors.
While ISPN as an organization cannot take credit for the methodologicaladvancements that have been achieved over the past years in LCA, most of themembers have been involved in the development and consultation processes ofinfluential guidance documents and standards. In ISPN, those experts have pre-sented the most relevant methodological advancements, and ISPN has discussed theimplications of these for the respective companies and industry sectors that we
Table 2 Examples of key environmental issues in LCA, currently being worked by industry,classified as per the ISO 14040 & 14044 standards
Goal and scope LCI LCIA Interpretation(communication)
• EU PEF [6]horizontalmethodologicalissues (e.g.granularity)
• Dataavailability/access
• Data quality• EU PEF
horizontalissues
• Consensus on impactmethods e.g. (Eco-)Toxicity, near-farfield impacts/nutritional benefits,Land-use/biodiversityaspects, Waterconsumption)
• Normalization andweighting
• Hot spot analysisrecommendation
• Suitable B2B/B2Capproaches
Life Cycle Management in Industry—Supporting Business … 359
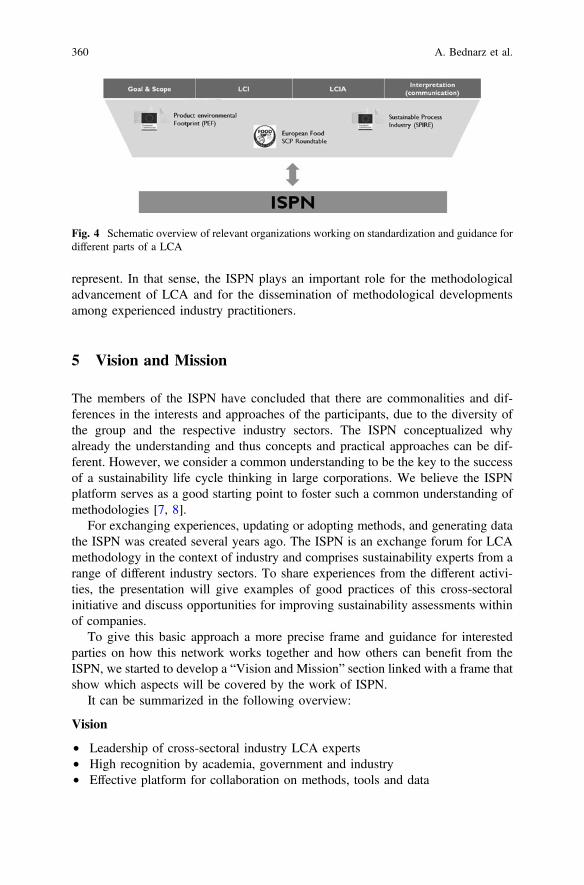
represent. In that sense, the ISPN plays an important role for the methodologicaladvancement of LCA and for the dissemination of methodological developmentsamong experienced industry practitioners.
5 Vision and Mission
The members of the ISPN have concluded that there are commonalities and dif-ferences in the interests and approaches of the participants, due to the diversity ofthe group and the respective industry sectors. The ISPN conceptualized whyalready the understanding and thus concepts and practical approaches can be dif-ferent. However, we consider a common understanding to be the key to the successof a sustainability life cycle thinking in large corporations. We believe the ISPNplatform serves as a good starting point to foster such a common understanding ofmethodologies [7, 8].
For exchanging experiences, updating or adopting methods, and generating datathe ISPN was created several years ago. The ISPN is an exchange forum for LCAmethodology in the context of industry and comprises sustainability experts from arange of different industry sectors. To share experiences from the different activi-ties, the presentation will give examples of good practices of this cross-sectoralinitiative and discuss opportunities for improving sustainability assessments withinof companies.
To give this basic approach a more precise frame and guidance for interestedparties on how this network works together and how others can benefit from theISPN, we started to develop a “Vision and Mission” section linked with a frame thatshow which aspects will be covered by the work of ISPN.
It can be summarized in the following overview:
Vision
• Leadership of cross-sectoral industry LCA experts• High recognition by academia, government and industry• Effective platform for collaboration on methods, tools and data
Fig. 4 Schematic overview of relevant organizations working on standardization and guidance fordifferent parts of a LCA
360 A. Bednarz et al.
Mission
• We facilitate exchange platforms of LCA experts discussing aspects of methods,tools and data
• We identify and prioritize relevant topics of cross-sectoral challenges in the fieldof sustainability assessments
• We collaborate on projects or method developments with academia, authorities,NGOs and other industry partners
• We extend the collaboration platform to new sectors taking their experiencesand needs into account
• We recommend and suggest changes in methodologies, data management andtools
• We discuss and communicate our experiences with other practitioners’ groups• We work together effectively and with smart solutions• We intensify networking activities and offer a broad cross-sectoral expertise
To cluster different work packages and to find out, which opportunities can beachieved by the ISPN, different topics and activities were identified. Thecross-sectoral approach of ISPN allows the link of different experiences in the fieldof the assessment of sustainability as a starting point. The single companies worktogether and act as one organization defining needs and opportunities for a suc-cessful sustainability measurement. It gives guidance and defines good practices forthe integration of the findings into the business and into business decision-making[9, 10].
Four activities were identified as a basis for suggesting changes and improve-ments of tools, methods and data systems. These four activities are using theextended expertise of the members, the exchange of experiences over the lastdecade, modes of collaboration in defining needs, requirements, pathways forimprovement etc. The recognition by other practitioners, academia or NGOs for theISPN will support the transportation and communication of important needs ofdifferent fields for further improvements. It shows that leading companies in thefield of sustainability assessment can initiate and foster the development of new,modern, easy to use, applicable tools, methods and data sets [11, 12].
With this approach, the ISPN can support funded projects, standard generation,definition of basic requirements for sustainability assessments and of commonpractices. These findings will be publicly available and can be used for furtherimprovement. Based on these findings, the ISPN can improve its way of collabo-ration, the definition of further topics and areas of improvements. In collaborationwith other groups, new developments can be assessed, checked and be proven forapplicability in different sectors (Fig. 5).
Life Cycle Management in Industry—Supporting Business … 361
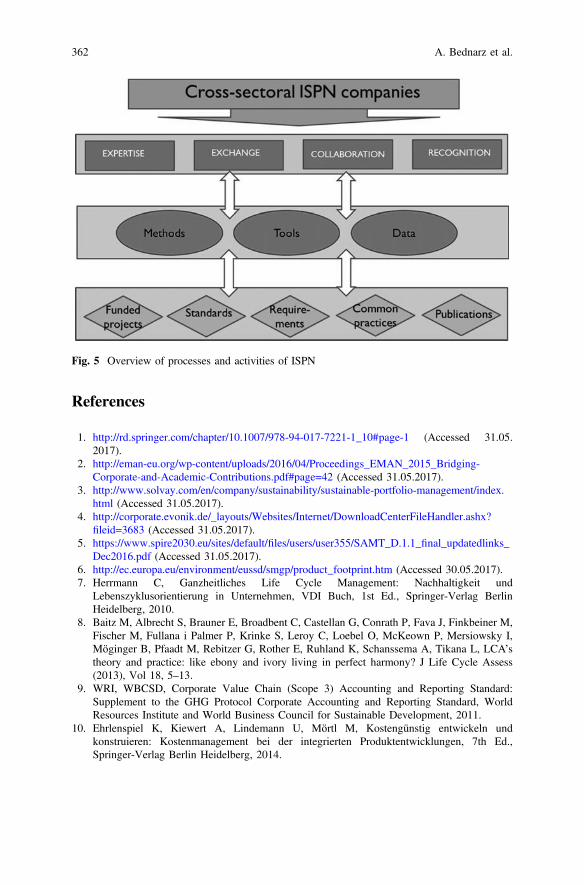
References
1. http://rd.springer.com/chapter/10.1007/978-94-017-7221-1_10#page-1 (Accessed 31.05.2017).
2. http://eman-eu.org/wp-content/uploads/2016/04/Proceedings_EMAN_2015_Bridging-Corporate-and-Academic-Contributions.pdf#page=42 (Accessed 31.05.2017).
3. http://www.solvay.com/en/company/sustainability/sustainable-portfolio-management/index.html (Accessed 31.05.2017).
4. http://corporate.evonik.de/_layouts/Websites/Internet/DownloadCenterFileHandler.ashx?fileid=3683 (Accessed 31.05.2017).
5. https://www.spire2030.eu/sites/default/files/users/user355/SAMT_D.1.1_final_updatedlinks_Dec2016.pdf (Accessed 31.05.2017).
6. http://ec.europa.eu/environment/eussd/smgp/product_footprint.htm (Accessed 30.05.2017).7. Herrmann C, Ganzheitliches Life Cycle Management: Nachhaltigkeit und
Lebenszyklusorientierung in Unternehmen, VDI Buch, 1st Ed., Springer-Verlag BerlinHeidelberg, 2010.
8. Baitz M, Albrecht S, Brauner E, Broadbent C, Castellan G, Conrath P, Fava J, Finkbeiner M,Fischer M, Fullana i Palmer P, Krinke S, Leroy C, Loebel O, McKeown P, Mersiowsky I,Möginger B, Pfaadt M, Rebitzer G, Rother E, Ruhland K, Schanssema A, Tikana L, LCA’stheory and practice: like ebony and ivory living in perfect harmony? J Life Cycle Assess(2013), Vol 18, 5–13.
9. WRI, WBCSD, Corporate Value Chain (Scope 3) Accounting and Reporting Standard:Supplement to the GHG Protocol Corporate Accounting and Reporting Standard, WorldResources Institute and World Business Council for Sustainable Development, 2011.
10. Ehrlenspiel K, Kiewert A, Lindemann U, Mörtl M, Kostengünstig entwickeln undkonstruieren: Kostenmanagement bei der integrierten Produktentwicklungen, 7th Ed.,Springer-Verlag Berlin Heidelberg, 2014.
Fig. 5 Overview of processes and activities of ISPN
362 A. Bednarz et al.
11. Russo M.V, Fouts P.A, A Resource-Based Perspective On Corporate EnvironmentalPerformance And Profitability, Academy of Management Journal, Vol. 40, No. 3, 1997, 534–559.
12. Hart S.L, Ahuja G, Does it pay to be green? An empirical examination of the relationshipbetween emission reduction and firm performance, Business Strategy and the Environment,Vol. 5, 1996, 30–37.
Open Access This chapter is licensed under the terms of the Creative Commons Attribution 4.0International License (http://creativecommons.org/licenses/by/4.0/), which permits use, sharing,adaptation, distribution and reproduction in any medium or format, as long as you give appropriatecredit to the original author(s) and the source, provide a link to the Creative Commons license andindicate if changes were made.The images or other third party material in this chapter are included in the chapter’s Creative
Commons license, unless indicated otherwise in a credit line to the material. If material is notincluded in the chapter’s Creative Commons license and your intended use is not permitted bystatutory regulation or exceeds the permitted use, you will need to obtain permission directly fromthe copyright holder.
Life Cycle Management in Industry—Supporting Business … 363
Sustainable Design of Complex Systems,Products and Services with UserIntegration into Design
Nicolas Perry and Julien Garcia
Abstract This is the synthesis of the presentation of the session entitled“Sustainable design of complex systems, products and services with user integra-tion into design” of the LCM-2017 conference. This session was interested insustainable design which is of high interest for a large range of stakeholders.Indeed, customer’s expectations, regulations and market pressure are some driversthat moves design teams towards the consideration of sustainable dimensions overthe life cycle of an industrial system. Integration of users into the product designdevelopment becomes more and more crucial, for example, through service orientedoffers, involving the users as effective actors of the product design. One of the weakpoint associated being that users may have bad or unexpected behaviour during usephase, inducing then increased impacts and placing the use phase as the maincontributor. New approaches, methods, and tools used by or for industrial stake-holders in order to face such challenges were presented and discussed. The sessionstarted with product oriented presentations and proposals, and slightly moved to theconcepts of service oriented design and integration of human into the loop.
1 Product and Process
Martin Kirchner (Evonik Technology & Infrastructure), presented the PODeST(Process Optimization and Development through Sustainability) project in whichsustainability becomes a parameter for process development and optimisation. Earlyidentification of the potential opportunities and risks associated with new productsand processes becomes of high importance, and Evonik’s Life Cycle Management
N. Perry (&)Arts et Métiers, I2M, CNRS, Bordeaux, Francee-mail: [email protected]
J. GarciaGroupe PSA, Vélizy-Villacoublay, France
© The Author(s) 2018E. Benetto et al. (eds.), Designing Sustainable Technologies,Products and Policies, https://doi.org/10.1007/978-3-319-66981-6_40
365
group implements the standardized process called “PODeST”. It aims at compre-hensively optimising processes from a technical, economic as well as environ-mental perspective while exploiting the high flexibility regarding process design inearly process development phases concerning all aspects of process relevance.PODeST is not striving for the highest level of accuracy but rather robustness ofresults (e.g. right order of magnitude). PODeST is benefiting from synergy effectsby making use of mass and energy balance data already acquired during thedevelopment and planning phase.
This presentation highlighted the link between environmental evaluation ofprocesses and product design cycle. It also opened the discussion on theEnvironmental Technology Verification. One key message to succeed in the inte-gration of sustainability in design relied on the usability of tools and methods byengineers and designers, with support of LCA expert if needed.
The presentation of Julien Garcia (Groupe PSA), described the implementationof environmental requirements in the innovation process of complex systemsapplied to the automotive. The automotive design is restricted by environmentalregulations, mainly focusing on reducing emissions of CO2 and other pollutantsemitted by vehicle exhaust pipes. The eco-design strategy of Groupe PSA movestoward a more holistic point of view and experiences life cycle methodology tomake environmentally virtuous design choices since seven years. A methodologyand a tool have been developed for integrating the Evaluation of the EnvironmentalPerformance of Innovative Complex Sub-systems (EEPICS). It allows to integratethe requirements of Groupe PSA’s environment department into the innovationprocedures, to extend the environment dimension to the notions “life cycle” and“multi-criteria”, and to generate an organizational learning for both innovationteams and environment/eco-design team. The eco-design framework is the centraland structuring framework of environmental requirements integration, allowing thecoordination of the development of a set of tools. Indeed, specific evaluation toolsare customised and used, including one for evaluating the influence of innovationon vehicle recyclability, and another one for the evaluation of innovation envi-ronmental impacts. The outcomes of such analyses support the global learning. Anapplication on the “Stop & Start” technology was carried on, leading to threesignificant key results involving the innovation teams from the beginning of theeco-design based innovation process facilitates the learning phases, its validationthrough the quality procedure is essential for the approach to be sustainable; usinggeneric models of vehicle is sufficient to evaluate quantitatively innovative auto-motive sub-systems.
The discussion, based on questions from the audience focused on the involve-ment of suppliers and subcontractors in the approach, since innovation process,focusing at products and suppliers, manufacturing systems or end of life solutionshighlighted the need of a tool like eco-design at the early stage productdevelopment.
366 N. Perry and J. Garcia
2 From Eco-design to Circular Economy
Emma Rex, (RISE), addressed in her presentation the Sustainability of design forcircularity, with integration of user and its behaviour into the design choices thatcan be made to shift from linear to circular business models in the Swedish furnitureindustry. Circular business models, promoting resource productivity and pollutionprevention, are currently supported and encouraged by various policy agendas,resulting in an increased interest in design for modularity, adaptability andremanufacturing. The expected environmental benefits such circular businessmodels offer are usually perceived as obvious, and seldom evaluated. Nevertheless,different design choices will have different impacts on the amount of material used,expected lifetime of products and possibilities for recycling. User behaviour pat-terns are neither commonly examined, even though user acceptance has beenidentified as a key enabler for the transition to a circular economy. The studycombines interviews with potential users of pre-owned furniture, and customerexperiences from furniture producing companies. Five pieces of furniture from threedifferent producing companies are analysed. For each type of application, theenvironmental impacts of linear versus circular business models are comparedthrough the use of LCA, and different user behaviour patterns are included asscenario analyses. User interviews pointed to the importance of functionality overnovelty, and indicated a potential to increase the service content in existing businessoffers. LCA results further show that the environmental impacts of a shift fromlinear to circular business models both can decrease and increase, from −30 to+50%, depending on scenario settings, type of impact categories assessed, andassumptions made. Notably, results depend on expected user behaviour followingdecisions taken in business development and product design. The study demon-strated the importance of including user perspectives when designing for circularity,as well as when evaluating the effects of circular design offers. Also, whilst thecalculations in this study revealed the potential direct environmental effects of acircular economy shift in existing industry, they also open up for discussions onindirect and broader sustainability effects following circular design attempts.
The question of multiple cycles arisen in the discussion, as well as how to buildscenarios representative of the users’ behaviour, and include them to the environ-mental impacts. Emma Rex explained that user behaviours have been decomposedinto several typologies, allowing a scenario-based analysis. The discussion alsotouched on the service oriented solutions.
Venkata Krishna Kumar Upadhyayula (Umeå University) presented a conceptwhere Life Cycle Assessment is used as a Decision Making Tool for DesigningProducts and Engineering Systems contributing to Circular Economy.Implementation of circular economy largely depends on three factors: (a) develop-ment of industrial infrastructure capable of enhancing the resource productivities onone hand and minimizing environmental externalities on the other, (b) understandthe market dynamics & consumer behaviour to promote sustainable consumptionpractices, (c) building sustainable cities and communities with smaller ecological
Sustainable Design of Complex Systems, Products and Services … 367
footprints. However, in reality transformation leading from liner to circular econ-omy faces multiple challenges. For example, (a) limitations of existing engineeringpractices which results in leakage of hazardous pollutants into biosphere, (b) in-troduction of new materials into economy with uncertain life cycle implications, or(c) effect of unsustainable consumer behaviours etc., are some factors that hamperimplementation of circular economy. To overcome these, the future products andengineering systems must be designed for “circular economy” so to ensure circu-lation of technical nutrients within technosphere, return of biological nutrientssafely to biosphere and decoupling economic growth from social and environmentalexternalities can be easily facilitated. The presentation detailed a structuredframework for using Life Cycle Assessment as a tool to design new products orengineering systems for circular economy and supporting case studies were alsoshown.
The presenter opened on social issues to be addressed to ensure sustainabilityand was questioned about the reduction of the environmental footprint withoutreducing social and economic values.
3 User Integration
Birgit Brunklaus (RISE) discussed on LCA learnings from service design, thereforefocusing on the influence of user behaviour in the design of sustainable systems,with the case-study of the leisure sector. The development of services in replace-ment of the traditional product selling model seems to be one solution for reducingresources consumption and emissions of pollutants. Similarly to products, servicesare designed to fulfil customers’ needs, despite they are seldom involved in thedesign of products and they usually are in the design process of services.
A literature review of service design and LCA studies of leisure services like theopera and theatre, tourism related services, and movies, have been performed fromthe supplier and consumer perspectives respectively, in order to (a) identify simi-larities and differences between service design and Life cycle based approaches,and (b) to derive some propositions to further develop the Life Cycle basedapproaches (LCA, S-LCA, LCC) in order to integrate user into the design process.
The discussion referred to the integration of users into the LCA methodology,especially on the translation of users’ behaviours characteristics into quantifieditems.
Finally, Gregor Waltersdorfer (University of Luxembourg) discussed in hispresentation a meaning-based perspective of potential users on the implications ofproducts and services for sustainability. He proposed a design method called“MeaningMap” and a sequence for meaning-based reasoning in design, which cansupport designers in considering meanings by potential users. He illustrated theintegration of the user perspective into design of service systems, involving sharingbikes or washing machines. Integrating the perspective of potential users intodesign allow to take into account their limits in the perception of the economic,
368 N. Perry and J. Garcia
social and environmental impacts induced by products and services, due to theirdifferent personal values. More precisely, capturing users’ meanings enablesdesigners to analyse different aspects: (a) what is perceived by individual potentialusers, (b) how do potential users conceptualize their evaluations, and(c) whichevaluations show low or high levels of agreement. The presenter argued that thisknowledge can inform designers on which aspects of products and services theyneed to prioritise in order to improve its perceived implications for sustainability,and which aspects they need to further clarify in order to improve their commu-nicative potential. Considering the meaning-based perspective of potential users cancomplement more traditional product-centred approaches such as LCA in earlyphases of the design process.
This proposal questions the robustness of the users feedback quantification, andhow to turn these information into designers choices and contribute to productevolution.
4 Conclusion
The topics addressed in this session were also completed with nearly twenty pos-ters, addressing and illustrating the will to integrate environmental considerationsearly in the product design phase fitting the circular economy paradigm.
Considering user centred design within a life cycle thinking approach in order toensure the development of sustainable systems open numerous questions andrequires new conceptual and methodological developments, consensus based andscientifically consistent in order to assess quantitatively users’ behaviours. Useroriented sustainable design intuitively leads to develop service-based modelsinstead of product-based solutions. Then sustainable design methods and toolsshould be integrated with the Product Service Systems design method, whichremains challenging.
Open Access This chapter is licensed under the terms of the Creative Commons Attribution 4.0International License (http://creativecommons.org/licenses/by/4.0/), which permits use, sharing,adaptation, distribution and reproduction in any medium or format, as long as you give appropriatecredit to the original author(s) and the source, provide a link to the Creative Commons license andindicate if changes were made.The images or other third party material in this chapter are included in the chapter’s Creative
Commons license, unless indicated otherwise in a credit line to the material. If material is notincluded in the chapter’s Creative Commons license and your intended use is not permitted bystatutory regulation or exceeds the permitted use, you will need to obtain permission directly fromthe copyright holder.
Sustainable Design of Complex Systems, Products and Services … 369
Implementation of EnvironmentalConsiderations in the InnovationProcess of Complex Systems:Groupe PSA Case Study
Julien Garcia, Pierre Tonnelier and Sophie Richet
Abstract Car manufacturer’s innovation teams are mainly focusing on decreasingautomotive consumption and may lead to risks of transfers of environmentalimpacts. So, engineers in innovation should be able to evaluate their innovations ina life cycle and multi-criteria perspective. In this paper, Groupe PSA’s approach forintegrating the environmental dimension during the innovation phase is presented.An eco-design framework of reference has been developed in a collaborativemanner by the environment team together with innovation leaders. It tackles boththe issues of how to deploy environmental requirements in the innovation process,and how to generate an organizational learning. This methodology is explainedthrough the example of the Stop and Start technology. The validation in the qualityprocedure is essential to make the approach sustainable.
1 Introduction
Climate change is the result of an increase in man-made greenhouse gas(GHG) emissions. The main GHG is carbon dioxide (CO2). CO2 is mainly emittedfrom fossil combustion. The transport sector is highly dependent on fossil fuels:93% of the 2013 world transport sector energy supply came from oil products [1].European Union has tightened European rules on CO2’s emission of vehicles. By2020, car manufacturer’s fleet will have to emit less than 95 g CO2/km [2].
To reach this goal, car manufacturer’s innovation teams are mainly focusing ondecreasing automotive consumption. Four strategies can be highlighted:light-weighting, hybridization or electrification of the powertrain, improvements inaerodynamics and rolling resistance, and improvements in energy consumption ofthe vehicle (air conditioning, radio…). While innovations may contribute to reducefuel consumption, they also may change the material composition of vehicles and
J. Garcia (&) � P. Tonnelier � S. RichetGroupe PSA, Vélizy-Villacoublay, Francee-mail: [email protected]
© The Author(s) 2018E. Benetto et al. (eds.), Designing Sustainable Technologies,Products and Policies, https://doi.org/10.1007/978-3-319-66981-6_41
371
lead to risks of transfers of environmental impacts: as the contribution of the usestage to the impacts is decreasing, the contribution from the manufacturing stagecould relatively increase.
In order to prevent transfer of pollution, engineers in innovation should be ableto evaluate their innovations in a life cycle and multi-criteria perspective.Environmental evaluation is generally carried out at the end of the product devel-opment process and results cannot be used during the design process itself. On thecontrary, during innovation, less data on the future vehicle are available, but thereare more time and more levers for making changes.
In order to integrate an eco-design approach within a company, tools must besuited to the company, its products, and the corresponding design phase andinnovation process. Indeed, both the technical and organizational aspects need to betaken into account simultaneously [3] to ensure (1) the progressive expansion of theenvironmental field from a technical point of view, and (2) from an organizationalpoint of view, a step by step integration of the environment in all organizationaldepartments to ensure that users are more fully acquainted with the tools and toformalize environmental recommendations that are more accessible.
This article presents Groupe PSA’s approach for integrating eco-design methodin the innovation process, known as E3PICS (Methodology of an Evolutive inte-gration of the Evaluation of the Environmental Performances of InnovativeComplex Sub-systems). E3PICS is based on an eco-design framework of referencethat incudes, in particular, a checklist for innovation leaders, and quantitative toolsfor simulating the effects of the innovations on the future vehicles.
2 Eco-designing in the Automotive Sector’sInnovation Process
Groupe PSA’s desire was to initiate an eco-design method during the innovationphase. For car manufacturers, most of the time, innovations have little impact on thevehicle architecture because of their incremental nature and the fact that suchinnovations often concern subsystems or components [4]. A set of innovations isgenerally proposed by the innovation team to the team in charge of the routinedesign of the vehicle, which Beaume represents as an “innovative feature” flowfrom the innovation department to the vehicle program department, during the“contextualization phase” [5]. Both structures are completely separated (see Fig. 1).
This study focuses on evaluating innovations during the “contextualizationphase”, i.e. between Technology Readiness Level (TRL) 5 and TRL 6. This phaseaims to validate the connection of an innovation to the vehicle program and con-tains three milestones: TRL 5: innovation project’s commitment; TRL 6: innovationproject’s connection to a vehicle program; and TRL 51/2: innovation project’smid-term review.
372 J. Garcia et al.

The automotive industry has developed several eco-design methods, e.g. Ford’sProduct Sustainability Index [6], Volvo’s Environmental Priority Strategies [7] andEnvironmental Effect Analysis [8] methods, or Toyota’s Eco-Vehicle AssessmentSystem [9]. With the study on the life cycle design of an air intake collector,Keoleian and Kar [10] conclude that evaluating the results of integrating theinnovative sub system should be carried out at the future complex system level. Butin order to do this, environmental profiles of that complex system are needed. Asthere is very few data available during the innovation phase, complex systems mustbe represented by models. Neither the majority of tools developed by car manu-facturers, nor the majority of tools available for eco-designing subsystems in theinnovation phase [11–13] make it possible to use models to simplify the evaluationof innovative subsystems.
3 Groupe PSA’s Method for Integratingthe Environmental Dimension into the Innovation Phase
The role of Groupe PSA’s “Environment” service within the “Materials” depart-ment is related to the material composition of the vehicles, and is to control a set ofenvironmental requirements, mostly from regulations. The “Environment” servicedoes not deal with reducing CO2 and pollutants emissions in use. It also hosts an“Eco-design” team dedicated to eco-design process and Life Cycle Assessment(LCA). The requirements driven by this service are already well integrated inthe vehicle development programs, but not formalized in the innovation phase. Theobjective of the “Environment” service is to integrate these requirements during theinnovation phase.
E3PICS methodology is based on the definition of an evolving eco-designframework of reference and its use during the innovation phase. It contains all theenvironmental requirements driven by the car manufacturer’s “Environment”
Fig. 1 Groupe PSA’s innovation process
Implementation of Environmental Considerations … 373
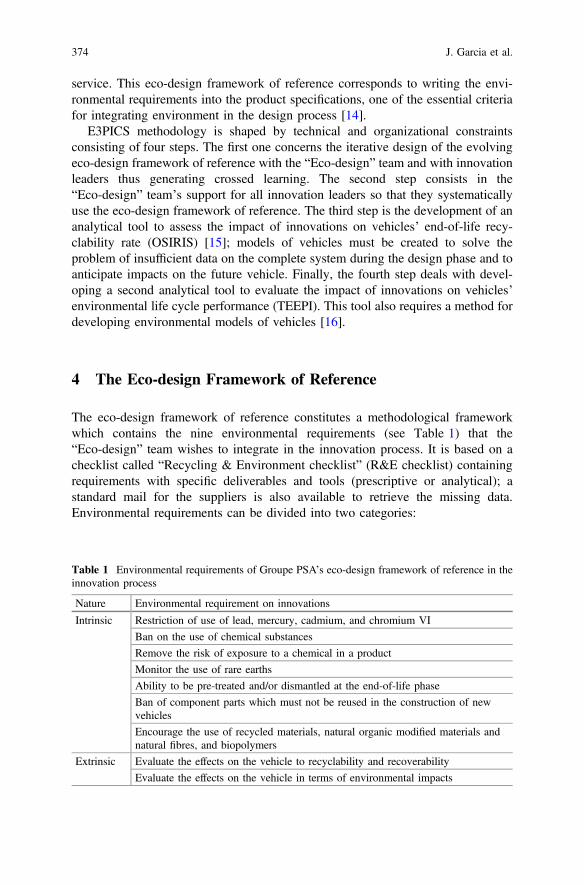
service. This eco-design framework of reference corresponds to writing the envi-ronmental requirements into the product specifications, one of the essential criteriafor integrating environment in the design process [14].
E3PICS methodology is shaped by technical and organizational constraintsconsisting of four steps. The first one concerns the iterative design of the evolvingeco-design framework of reference with the “Eco-design” team and with innovationleaders thus generating crossed learning. The second step consists in the“Eco-design” team’s support for all innovation leaders so that they systematicallyuse the eco-design framework of reference. The third step is the development of ananalytical tool to assess the impact of innovations on vehicles’ end-of-life recy-clability rate (OSIRIS) [15]; models of vehicles must be created to solve theproblem of insufficient data on the complete system during the design phase and toanticipate impacts on the future vehicle. Finally, the fourth step deals with devel-oping a second analytical tool to evaluate the impact of innovations on vehicles’environmental life cycle performance (TEEPI). This tool also requires a method fordeveloping environmental models of vehicles [16].
4 The Eco-design Framework of Reference
The eco-design framework of reference constitutes a methodological frameworkwhich contains the nine environmental requirements (see Table 1) that the“Eco-design” team wishes to integrate in the innovation process. It is based on achecklist called “Recycling & Environment checklist” (R&E checklist) containingrequirements with specific deliverables and tools (prescriptive or analytical); astandard mail for the suppliers is also available to retrieve the missing data.Environmental requirements can be divided into two categories:
Table 1 Environmental requirements of Groupe PSA’s eco-design framework of reference in theinnovation process
Nature Environmental requirement on innovations
Intrinsic Restriction of use of lead, mercury, cadmium, and chromium VI
Ban on the use of chemical substances
Remove the risk of exposure to a chemical in a product
Monitor the use of rare earths
Ability to be pre-treated and/or dismantled at the end-of-life phase
Ban of component parts which must not be reused in the construction of newvehicles
Encourage the use of recycled materials, natural organic modified materials andnatural fibres, and biopolymers
Extrinsic Evaluate the effects on the vehicle to recyclability and recoverability
Evaluate the effects on the vehicle in terms of environmental impacts
374 J. Garcia et al.

(1) The “intrinsic” requirements: An environmental requirement for an innovationis “intrinsic” if it is linked to the function and elements that constitute theinnovation; e.g. heavy metal ban, chemical risk elimination, or end-of-lifetreatment obligations are requirements that are directly related to the innovativeelement and do not require information on the system that will welcome it.
(2) The “extrinsic” requirements: An environmental requirement for an innovationis called “extrinsic” if it applies to the entire vehicle system; e.g. the ELVDirective requires approval for the recyclability of the vehicle system as awhole and not for the component parts of the vehicle taken separately.
The R&E checklist aims to evaluate both intrinsic and extrinsic requirements in a“Go/No go” way. It has been co-developed by the eco-design leader and a sampleof 11 voluntary innovation leaders. Moreover, for an evolutionary integration of theenvironmental requirements, the R&E checklist has been integrated in three steps:first, only intrinsic requirements; second, addition of the recyclability effect eval-uation; and third, addition of the environmental impact evaluation. Theco-development and the evolutionary integration have led to two major results:
(1) Beginning of a cross learning process: the “Eco-design” team has learned oninnovation process, and innovation leaders have learned on environmentalrequirements.
(2) Systematic use of the R&E checklist in the innovation process: The R&Echecklist was submitted to the department in charge of the quality in innovation; ithas validated the inclusion in the milestone reviews of a paragraph relating to theenvironmental requirements requiring an approval from the “Eco-design” team.To obtain this approval and to validate the TRL 5, TRL 51/2, and TRL 6 mile-stones, the paragraph prescribes the completion of the R&E checklist by theinnovation pilots.
5 Focus on the Environmental Impact EvaluationRequirement
Both extrinsic requirements need an analytic evaluation tool to propagate the effectsof the innovation to the complete future vehicle. Here is presented TEEPI, a tool forevaluating the environmental performance of innovations.
5.1 TEEPI Operation
TEEPI has been developed to evaluate the impact of innovations on vehicles’environmental life cycle performance. This tool also requires a method for devel-oping environmental models of vehicles. Indeed, in a previous paper [16] we
Implementation of Environmental Considerations … 375
developed a method to create Evolving Models for the Environmental Evaluation ofComplex Systems (EMEECS). EMEECS are supported by HierarchicalAgglomerative Clustering (HAC) [17] for processing vehicles’ available LCAresults followed by an algorithm for creating optimal clusters relative to a fixeduncertainty threshold.
For building EMEECS, available results of previous LCA are collected over afixed number of life cycle stages and of environmental indicators. The life cyclestages are:
• Manufacturing: including raw materials extraction, manufacturing processes;excluding upstream and downstream logistics; the assembly plants are consid-ered separately;
• Use: including well-to-wheels fuel consumption, tank-to-wheels emissions ofCO2 and pollutants (CO, NOx, HC), maintenance;
• End of life: no credit has been taken into account because of recycled materialprovision.
Four environmental indicators are included in the study. These indicators aregenerally used by car manufacturers to communicate, or by scientific papers in theautomotive sector. They are calculated using the CML 2001 method:
• Global warming potential, GWP, [kg CO2-Equivalent];• Eutrophication potential, EP, [kg Phosphate-Equivalent];• Photochemical ozone creation potential, POCP, [kg Ethen-Equivalent];• Abiotic depletion potential, ADP, [kg Sb-Equivalent].
LCAs are processed with a HAC in order to classify the vehicles’ environmentalindicators values in dendrograms per life cycle stage and per environmental impactcategory. HAC is chosen because it is one of the most common methods to makeclusters from a statistical population. As a result, each dendrogram is processed forextracting the “optimal” clusters, i.e. clusters whose error relative to real values ofvehicles within the cluster is inferior to a fixed threshold. Each cluster has a value(the average value of vehicles’ environmental indicators that form the cluster) andan uncertainty (the standard deviation of those same values). The EMEECS areenvironmental impact archetypes, calculated on several life cycle stages, of com-plex system clusters, i.e. the user of the proposed method would directly use theenvironmental impacts values of the initial and innovative solutions, and of theglobal system.
5.2 Case Studies: Micro-Hybridization Systems
TEEPI was tested on two micro-hybridization systems: fuel-electricity (Inno_1) andfuel-compressed air (Inno_2). The reduction in fuel consumption is achievedthrough supplying energy, complementary to traditional fossil energy to move the
376 J. Garcia et al.

car. Both micro-hybrid systems require extra parts to be added to the vehicle. Forinnovative solution Inno_1, the hybridization requires a lead battery heavier thanthe normal one, an electronically-controlled gearbox instead of the manual gearbox,a reversible starter-alternator ensuring the Stop and Start function, and an ultraca-pacitor to supply the required power. The innovative solution is 42% heavier thanthe initial solution; nevertheless, a diesel consumption reduction of 11% wasmeasured on the NEDC homologation test. Concerning innovative solution Inno_2,the gearbox and the powertrain adaptation are largely affected, an ultracapacitor isalso added, while the lead battery mass is reduced. The innovation solution is 151%heavier than the initial solution; nevertheless, a 35% reduction in gasoline con-sumption was measured on the NEDC homologation test. Table 2 is a synthesis ofthe vehicle characteristics for selecting the EMEECS, which are available to the“Eco-design” team during the innovation phase. On Fig. 2, TEEPI results arecompared to the reference LCAs of Inno_1 and Inno_2.
We observe that the signs of the growth rates given by TEEPI are the same asthose of the reference LCAs. Concerning the values of growth rates, the maximum
Table 2 EMEECScharacteristics of Inno_1 andInno_2
EMEECS Inno_1 Inno_2
Type B B
Shape Sedan Sedan
Finish Average Average
Gearbox Manual Manual
Fuel Diesel Gasoline
Consumption [L/100 km] 3,8 4,5
Assembly plant AP_A AP_A
Fig. 2 Comparison between the results from TEEPI and the results from reference LCA formicro-hybrid systems Inno_1 and Inno_2
Implementation of Environmental Considerations … 377
error of TEEPI on the five innovations compared to reference LCAs is 2.1%; this isobtained for the ADP indicator of Inno_2. We can also notice that the uncertaintiesof POCP are significantly higher than those of the other indicators. The length ofuncertainty interval of the POCP indicator is directly linked to the use phase, forwhich the POCP depends on the emissions of three pollutants (carbon monoxide,nitrogen oxides, and hydrocarbons). These emissions vary randomly from onevehicle to another and from one powertrain to another.
6 Conclusion
E3PICS methodology has led to a successful integration of the “Environment”service’s requirements in the innovation phase. Through the validation of theeco-design framework of reference in the quality procedures, the R&E checklist issystematically used for all innovations from TRL 5 to TRL 6.
TEEPI was developed to take into account one of the “Environment” service’srequirements of the eco-design framework of reference. Validating the eco-designframework of reference within the innovation process implies systematic use ofTEEPI for the environmental evaluation of innovations that are selected accordingto three criteria defined by the eco-design leader: mass of the innovative solution,material change between initial and innovative solution and impact on vehicle fuelconsumption.
TEEPI was not designed for generating eco-designed innovative concepts;therefore, it would be relevant to link this tool to a decision-making design toolsuch as those using the problem resolution by constraint satisfaction algorithm [18].
From an organizational point of view, TEEPI has been approved for being usedduring the innovation process; it is currently used by the LCA expert. Each inno-vation is saved in a database that could be used as a case-base in order to useknowledge management systems and generate good practices in eco-designingproducts. Lastly, to make it easier for innovation leaders to take the environmentaldimension into account, they could use a version of TEEPI integrated into acompany’s intranet platform administrated by the LCA expert. This would helpinnovation leaders to simulate several innovation options directly. However, anecessary condition would be that innovation leaders have a good knowledge of lifecycle issues. The current version of TEEPI is the learning vector of this knowledge.
References
1. International Energy Agency, Key World Energy Statistics 2015, 2015.2. European Parliament Council, Regulation No. 443/2009 of the European Parliament and of
the Council of 23 April 2009 setting emission performance standards for new passenger cars
378 J. Garcia et al.
as part of the Community’s integrated approach to reduce CO2 emissions from light-dutyvehicles, 2009.
3. Johansson G, Greif A, Fleischer G, Managing the design/environment interface: studies ofintegration mechanisms, International Journal of Production Research, Vol. 45, No. 18–19,2007, pp. 4041–4055.
4. Oltra V, Saint Jean M, Sectoral systems of environmental innovation: An application to theFrench automotive industry, Technological Forecasting and Social Change, Vol. 76, No. 4,2009, pp. 567–583.
5. Beaume R, Maniak R, Midler C, Crossing innovation and product projects management: Acomparative analysis in the automotive industry, International Journal of ProjectManagement, Vol. 27, No. 2, 2009, pp. 166–174.
6. Schmidt W-P, Life Cycle Tools within Ford of Europe’s Product Sustainability Index. CaseStudy Ford S-MAX & Ford Galaxy (8 pp), The International Journal of Life CycleAssessment, Vol. 11, No. 5, 2006, pp. 315–322.
7. Karlsson R, Steen B, Wendel A, EPS as a Life Cycle oriented System Assessment Tool toFacilitate Industrial Learning about Relations to the Environment, The 15th InternationalConference of the System Dynamics Society, Istanbul, Turkey, 1997, pp. 61–68.
8. Tingström J, Karlsson R, The relationship between environmental analyses and the dialogueprocess in product development, Journal of Cleaner Production, Vol. 14, No. 15–16, 2006,pp. 1409–1419.
9. Nakano K, Hirao M, Collaborative activity with business partners for improvement of productenvironmental performance using LCA, Journal of Cleaner Production, Vol. 19, No. 11, 2011,pp. 1189–1197.
10. Keoleian G.A, Kar K, Elucidating complex design and management trade-offs through lifecycle design: air intake manifold demonstration project, Journal of Cleaner Production, Vol.11, No. 1, 2003, pp. 61–77.
11. Bocken N.M.P, Allwood J.M, Willey A.R, King J.M.H, Development of an eco-ideation toolto identify stepwise greenhouse gas emissions reduction options for consumer goods, Journalof Cleaner Production, Vol. 19, No. 12, 2011, pp. 1279–1287.
12. Gasafi E, Weil M, Approach and application of life cycle screening in early phases of processdesign: case study of supercritical water gasification, Journal of Cleaner Production, Vol. 19,No. 14, 2011, pp. 1590–1600.
13. Poudelet V, Chayer J-A, Margni M, Pellerin R, Samson R, A process-based approach tooperationalize life cycle assessment through the development of an eco-designdecision-support system, Journal of Cleaner Production, Vol. 33, 2012, pp. 192–201.
14. Hatcher G.D, Ijomah W.L, Windmill J.F.C, Integrating design for remanufacture into thedesign process: the operational factors, Journal of Cleaner Production, Vol. 39, 2013,pp. 200–208.
15. Garcia J, Millet D, Tonnelier P, A tool to evaluate the impacts of an innovation on a product’srecyclability rate by adopting a modular approach: automotive sector application,International Journal of Vehicle Design, Vol. 67, No. 2, 2015, pp. 178–204.
16. Garcia J, Millet D, Tonnelier P, Construction of evolving models for the environmentalevaluation of innovative sub-systems based on a hierarchical agglomerative clustering,International Journal of Sustainable Engineering, Vol. 8, No. 6, 2015, pp. 386–404.
17. Hastie T, Tibshirani R, Friedman J.J.H, The elements of statistical learning, Springer NewYork, 2001.
18. Tchertchian N, Yvars P-A, Millet D, Benefits and limits of a Constraint Satisfaction Problem/Life Cycle Assessment approach for the ecodesign of complex systems: a case applied to ahybrid passenger ferry, Journal of Cleaner Production, Vol. 42, 2013, pp. 1–18.
Implementation of Environmental Considerations … 379

Open Access This chapter is licensed under the terms of the Creative Commons Attribution 4.0International License (http://creativecommons.org/licenses/by/4.0/), which permits use, sharing,adaptation, distribution and reproduction in any medium or format, as long as you give appropriatecredit to the original author(s) and the source, provide a link to the Creative Commons license andindicate if changes were made.The images or other third party material in this chapter are included in the chapter’s Creative
Commons license, unless indicated otherwise in a credit line to the material. If material is notincluded in the chapter’s Creative Commons license and your intended use is not permitted bystatutory regulation or exceeds the permitted use, you will need to obtain permission directly fromthe copyright holder.
380 J. Garcia et al.
Development of an EnvironmentalEvaluation Tool in the Transport Sectorand Its Impact on Decision-Makingin the Early Stages of Design
Sergio A. Brambila-Macias, Lisbeth Dahllöf, Karin Erikssonand Tomohiko Sakao
Abstract Due to government policies and regulations as well as customer andsocietal demands, organizations around the world are looking for ways to managetheir economic, environmental and social sustainability. One of the most frequentlyused standards for organizations seeking to manage their environmental responsi-bilities is ISO 14001. This framework, however, is generic because it can be usedby any organization irrespective of sector, activity or core values. Therefore,implementation of generic guidelines might result in the use of alternative tools thatrespond better to specific organizational needs and that provide outcomes that canbe useful for decision-making. Through case study methodology, this paper showshow Volvo Group, a world-leading producer of transport solutions, developed aninternal environmental evaluation tool called Environmental Screening (EnvS) toimprove the environmental performance of its solutions.
1 Introduction
The degradation of the environment through resource extraction, manufacturing,use and disposal of products, as well as the provision of services has been one of themain drivers for societies and governments to look for more sustainable alterna-tives. The United Nations Conference on the Human Environment in 1972 inStockholm was a milestone for raising awareness of the actions needed to tackleenvironmental deterioration. Currently, sustainable initiatives can range from globalefforts, such as the UN Sustainable Development Goals [1], to regional directives
S. A. Brambila-Macias (&) � T. SakaoDepartment of Management and Engineering, Division of EnvironmentalTechnology and Management, Linköping University, 58183 Linköping, Swedene-mail: [email protected]
L. DahllöfSwedish Environmental Institute, 41133 Gothenburg, Sweden
K. ErikssonVolvo Group Trucks Technology, 41715 Gothenburg, Sweden
© The Author(s) 2018E. Benetto et al. (eds.), Designing Sustainable Technologies,Products and Policies, https://doi.org/10.1007/978-3-319-66981-6_42
381
like the WEEE directive for electronic waste [2] and EVL for the end-of-life ofvehicles in Europe [3] to local environmental objectives (e.g. Sweden’s 16 envi-ronmental quality objectives) [4]. Furthermore, participatory initiatives and stan-dards for companies and organizations such as the Global Reporting Initiative(GRI) and ISO standards demonstrate efforts undertaken towards sustainability.With regard to the environment, ISO 14001 exemplifies the participatory action thatcompanies may take to reduce their impact on the environment. However, thisstandard is general and differences still remain, for example, organizations differ inhow they are organized, what they offer, their business model and their core values.These differences may lead to the adoption and adaptation of tools that supportdecision-making in contexts suitable to the organizations and their specific cir-cumstances [5, 6]. A problem area that is frequent in product development orga-nizations is that environmental awareness initiatives are based at the manufacturinglevel and not at the product level [7], resulting in narrow coverage by an envi-ronmental program. Through case study methodology, this paper offers a uniqueview on how Volvo Group developed Environmental Screening (EnvS), a toolaimed at improving the environmental performance of its products and solutions. Inthis regard, three research questions are postulated.
• How can an environmental evaluation tool towards sustainability be used morein practice at a large company?
• How can internal organizational needs be identified and addressed in order todevelop an environmental evaluation tool towards sustainability?
• How could an environmental evaluation tool support decision-making in theearly stages of design towards sustainability?
2 Background Research
The scientific literature provides several examples of how organizations can adoptand adapt tools to reduce the environmental impact of their operations. This isespecially important in the early stages of design, given the greater potential there toreduce the environmental impact of products and services [8]. The early stages ofdesign seem to benefit most from qualitative and easy-to-use tools. This could bepartially explained by the lack of information, risk, uncertainty and subjectivityfound during the early stages [7]. Schöggl et al. [9] suggest that qualitative tools arepreferred at this stage, due to the lack of information and difficulty in quantifyingenvironmental impacts. Tools and methods that address environmental impactsusually fall under the umbrella of Design for the Environment or Ecodesign [7],which can be described as an approach that addresses the environmental impact ofthe entire life of a product or service, from the early stages of design [6]. Toolsfollowing this approach are plentiful. Pigosso et al. [10] identified 350 publicationsbetween 1993 and 2015 dealing with tools and methods related to Ecodesign.However, Rousseaux et al. [11] suggest that there is still low uptake of such tools.
382 S. A. Brambila-Macias et al.

Reasons for this can be due to lack of knowledge about the tools, lack of specializedstaff that can use such tools, company size and low cooperation between depart-ments. Poulikodou et al. [12] further identify obstacles to the use of environmentaltools; for instance, tools may be too vague, many checklists are already available,tools need detailed information, the competence of users is low and there are delaysfrom suppliers. Bovea and Elis [13] identified checklists, matrices and rules orguidelines (e.g. 10 golden rules of ecodesign) among the most often used quali-tative and semi-quantitative tools. Knight and Jenkins [14] also suggest that someof the most common or preferred ecodesign tools are in the form of guidelines andchecklists. An example of this can be seen in the work by Lindahl and Tingström[15], who adapted Failure Mode and Effect Analysis (FMEA) to develop a checklistfor environmental considerations called Environmental Effect Analysis (EEA).EEA requires qualitative information as opposed to Life Cycle Assessment (LCA),which requires quantitative data and which users may find lengthy and difficult touse [13].
More recent tools not only addressing environmental aspects but also social andeconomic ones have also been proposed in the literature. For instance, Hallstedt[16] proposes a sustainability criteria matrix targeting the early stages of productdevelopment and a qualitative measure called sustainability index for decisionsupport. Schöggl et al. [9, 17] propose the Checklist for Sustainable ProductDevelopment (CSPD) based on questions divided into four sustainability principlesand 9 categories where a sustainability expert is crucial for the use of the tool.
Furthermore, Fitzgerald et al. [9] suggest that guidelines and checklists need tobe company-specific and integrated systematically in the product developmentprocess, and that using standalone and generic tools may not be effective. Hence,specific procedures should be determined to avoid confusion on when and how touse such tools. Fitzgerald et al. [9] divide decision-making in new product devel-opment into two broad types: design decisions and management decisions. Designdecisions address questions like what should be designed and determine shape, size,materials, processes and components. Management decisions address questions thatattempt to ensure the design will result in a successful product. What will be done—and when and who will do it—are some management questions. It is thereforeimportant to be clear about the purpose of the tool as well as who is going to use it,the necessary inputs and the beneficial outputs. The following case study furthersupports the use of an environmental checklist.
3 Case Study
Since 1989, Volvo Group has pledged to minimize the environmental impact of itsoperations through adopting a life cycle approach in its operations [18]. Today,Volvo’s White, Grey and Black Lists for materials selection to substitute, caution oravoid materials, respectively [19–21], are an example of its commitment to reduceenvironmental impacts. With regard to environmental standards, Volvo Group
Development of an Environmental Evaluation Tool … 383
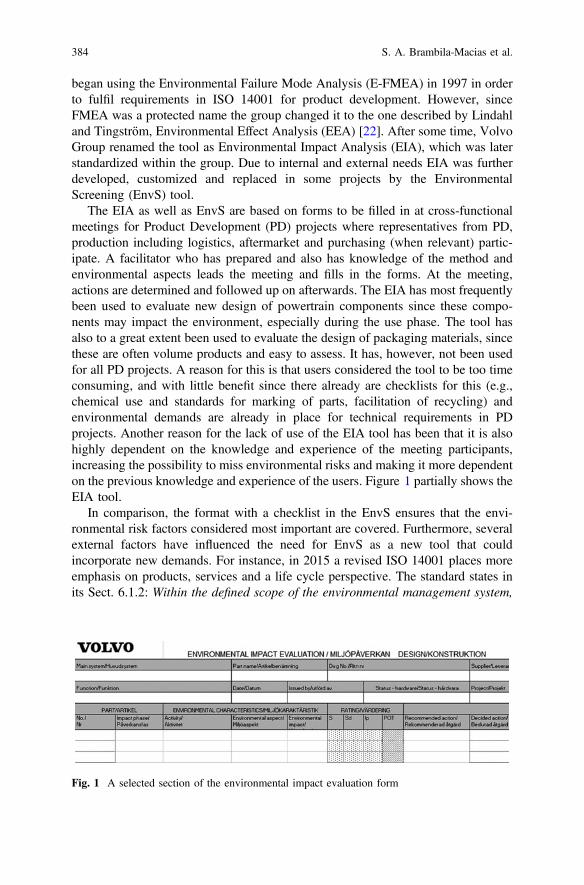
began using the Environmental Failure Mode Analysis (E-FMEA) in 1997 in orderto fulfil requirements in ISO 14001 for product development. However, sinceFMEA was a protected name the group changed it to the one described by Lindahland Tingström, Environmental Effect Analysis (EEA) [22]. After some time, VolvoGroup renamed the tool as Environmental Impact Analysis (EIA), which was laterstandardized within the group. Due to internal and external needs EIA was furtherdeveloped, customized and replaced in some projects by the EnvironmentalScreening (EnvS) tool.
The EIA as well as EnvS are based on forms to be filled in at cross-functionalmeetings for Product Development (PD) projects where representatives from PD,production including logistics, aftermarket and purchasing (when relevant) partic-ipate. A facilitator who has prepared and also has knowledge of the method andenvironmental aspects leads the meeting and fills in the forms. At the meeting,actions are determined and followed up on afterwards. The EIA has most frequentlybeen used to evaluate new design of powertrain components since these compo-nents may impact the environment, especially during the use phase. The tool hasalso to a great extent been used to evaluate the design of packaging materials, sincethese are often volume products and easy to assess. It has, however, not been usedfor all PD projects. A reason for this is that users considered the tool to be too timeconsuming, and with little benefit since there already are checklists for this (e.g.,chemical use and standards for marking of parts, facilitation of recycling) andenvironmental demands are already in place for technical requirements in PDprojects. Another reason for the lack of use of the EIA tool has been that it is alsohighly dependent on the knowledge and experience of the meeting participants,increasing the possibility to miss environmental risks and making it more dependenton the previous knowledge and experience of the users. Figure 1 partially shows theEIA tool.
In comparison, the format with a checklist in the EnvS ensures that the envi-ronmental risk factors considered most important are covered. Furthermore, severalexternal factors have influenced the need for EnvS as a new tool that couldincorporate new demands. For instance, in 2015 a revised ISO 14001 places moreemphasis on products, services and a life cycle perspective. The standard states inits Sect. 6.1.2: Within the defined scope of the environmental management system,
Fig. 1 A selected section of the environmental impact evaluation form
384 S. A. Brambila-Macias et al.
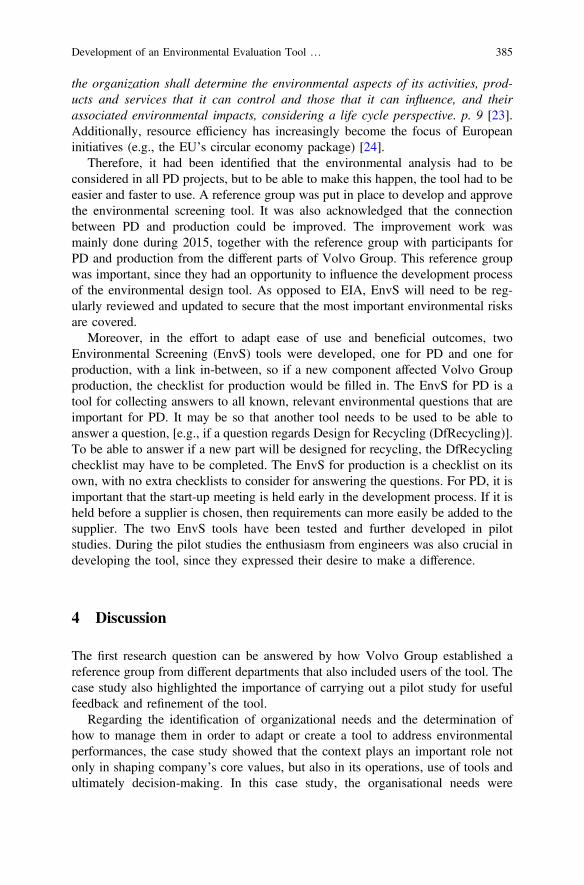
the organization shall determine the environmental aspects of its activities, prod-ucts and services that it can control and those that it can influence, and theirassociated environmental impacts, considering a life cycle perspective. p. 9 [23].Additionally, resource efficiency has increasingly become the focus of Europeaninitiatives (e.g., the EU’s circular economy package) [24].
Therefore, it had been identified that the environmental analysis had to beconsidered in all PD projects, but to be able to make this happen, the tool had to beeasier and faster to use. A reference group was put in place to develop and approvethe environmental screening tool. It was also acknowledged that the connectionbetween PD and production could be improved. The improvement work wasmainly done during 2015, together with the reference group with participants forPD and production from the different parts of Volvo Group. This reference groupwas important, since they had an opportunity to influence the development processof the environmental design tool. As opposed to EIA, EnvS will need to be reg-ularly reviewed and updated to secure that the most important environmental risksare covered.
Moreover, in the effort to adapt ease of use and beneficial outcomes, twoEnvironmental Screening (EnvS) tools were developed, one for PD and one forproduction, with a link in-between, so if a new component affected Volvo Groupproduction, the checklist for production would be filled in. The EnvS for PD is atool for collecting answers to all known, relevant environmental questions that areimportant for PD. It may be so that another tool needs to be used to be able toanswer a question, [e.g., if a question regards Design for Recycling (DfRecycling)].To be able to answer if a new part will be designed for recycling, the DfRecyclingchecklist may have to be completed. The EnvS for production is a checklist on itsown, with no extra checklists to consider for answering the questions. For PD, it isimportant that the start-up meeting is held early in the development process. If it isheld before a supplier is chosen, then requirements can more easily be added to thesupplier. The two EnvS tools have been tested and further developed in pilotstudies. During the pilot studies the enthusiasm from engineers was also crucial indeveloping the tool, since they expressed their desire to make a difference.
4 Discussion
The first research question can be answered by how Volvo Group established areference group from different departments that also included users of the tool. Thecase study also highlighted the importance of carrying out a pilot study for usefulfeedback and refinement of the tool.
Regarding the identification of organizational needs and the determination ofhow to manage them in order to adapt or create a tool to address environmentalperformances, the case study showed that the context plays an important role notonly in shaping company’s core values, but also in its operations, use of tools andultimately decision-making. In this case study, the organisational needs were
Development of an Environmental Evaluation Tool … 385
identified by the manufacturing department as well as the engineers wanting tomake a difference. It also became clear that communication between design andmanufacturing had to be enhanced, and that a tool in the form of a checklist couldhelp in strengthening that communication.
Finally regarding the identification of users, involved actors, inputs and usefuloutputs that tools need to consider and/or provide in order to support decision-makingin the early stages of design, the EnvS tool(s) at VolvoGroup identified the users of thetool as personnel from the manufacturing, engineering, purchasing, aftermarket andstyling departments. The inputs for the tool came from external and internal sources,an example being the increasing awareness of environmental impact and enthusiasmfrom the engineering department to change the status quo.
The outputs are then useful for analysing decisions and acting on them.Information from a Design for Remanufacturing (DfReman), Design for Recycling(DfRecycling) or LCA study are some of the inputs to the EnvS checklist thenproviding outputs for actions such as choice of concept improvement of supplierdemands and compliance with ISO 14001. It also illustrates that a checklist canserve the purpose of addressing both design and management decisions.
In order to illustrate how the checklist supports decision-making, the followingdiagram shows the different inputs, outputs, purpose and decision-making (actions)of the checklist. This is depicted by using the PDCA quality cycle, which stands forPlan-Do-Check-Act [25] (Fig. 2).
Fig. 2 The impact of environmental screening on decision-making
386 S. A. Brambila-Macias et al.

5 Conclusion
This methodology development, presented through a case study, showed how anorganisation in the transport sector has developed a checklist named EnvironmentalScreening (EnvS) in production and product development. From the analysis of thecase study, important conclusions can be drawn.
These can potentially help interested readers in their own design and imple-mentation of environmental tools, and can be summarised as follows (in no specificorder):
• Carrying out a pilot project in order to get feedback and refine the usefulness ofthe tool is advisable.
• Enthusiasm from workforce for buy-in and feedback can help in developing thetool.
• A facilitator with deeper knowledge can operate the tool and simplify com-plexity arising from multiple stakeholders and levels of knowledge.
• A reference group consisting of relevant people from different departments andpotential users of the tool are important to consider.
• A tool should match and reflect company values for easier incorporation intoevery day operations.
It is also important to mention that this research has some limitations. The use ofa single case study presents a particular example in industry. However, this researchcan stimulate discussion and an exchange of experiences from organizations facingsimilar challenges towards sustainability.
The results of this research can be insightful for companies that want to incor-porate environmental tools into their design, operations and product development.They could potentially use this research when developing tools of their own.Academics that do research on design and implementation of methods can alsobenefit from this study. They can find and compare similar needs in other orga-nizations and identify factors to be considered when developing tools and validatingthem. Finally, future work could address tools for earlier stages in design (fuzzyfront end) and other sustainability aspects that can provide an insight into howneeds are identified and addressed.
Acknowledgements This research was supported by the Mistra REES (Resource Efficient andEffective Solutions) program, funded by Mistra (The Swedish Foundation for StrategicEnvironmental Research).
Development of an Environmental Evaluation Tool … 387
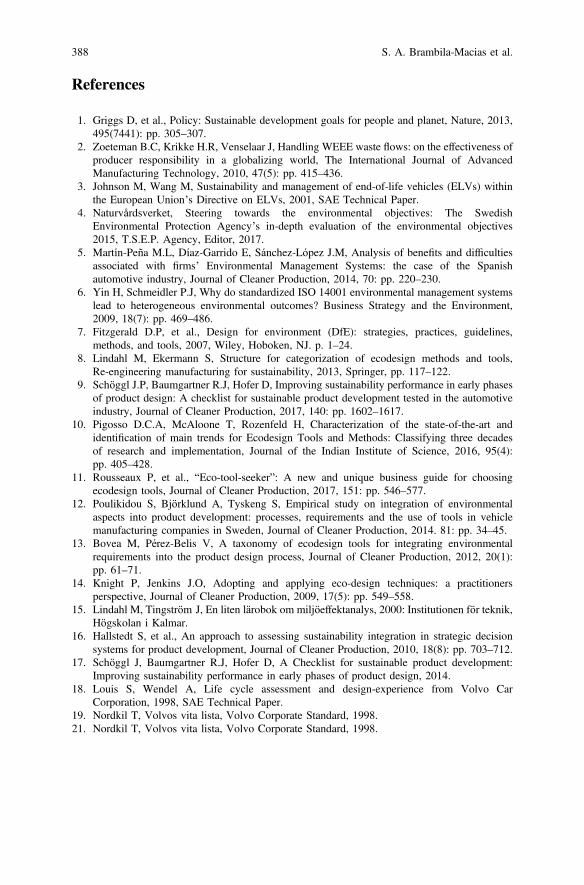
References
1. Griggs D, et al., Policy: Sustainable development goals for people and planet, Nature, 2013,495(7441): pp. 305–307.
2. Zoeteman B.C, Krikke H.R, Venselaar J, Handling WEEE waste flows: on the effectiveness ofproducer responsibility in a globalizing world, The International Journal of AdvancedManufacturing Technology, 2010, 47(5): pp. 415–436.
3. Johnson M, Wang M, Sustainability and management of end-of-life vehicles (ELVs) withinthe European Union’s Directive on ELVs, 2001, SAE Technical Paper.
4. Naturvårdsverket, Steering towards the environmental objectives: The SwedishEnvironmental Protection Agency’s in-depth evaluation of the environmental objectives2015, T.S.E.P. Agency, Editor, 2017.
5. Martín-Peña M.L, Díaz-Garrido E, Sánchez-López J.M, Analysis of benefits and difficultiesassociated with firms’ Environmental Management Systems: the case of the Spanishautomotive industry, Journal of Cleaner Production, 2014, 70: pp. 220–230.
6. Yin H, Schmeidler P.J, Why do standardized ISO 14001 environmental management systemslead to heterogeneous environmental outcomes? Business Strategy and the Environment,2009, 18(7): pp. 469–486.
7. Fitzgerald D.P, et al., Design for environment (DfE): strategies, practices, guidelines,methods, and tools, 2007, Wiley, Hoboken, NJ. p. 1–24.
8. Lindahl M, Ekermann S, Structure for categorization of ecodesign methods and tools,Re-engineering manufacturing for sustainability, 2013, Springer, pp. 117–122.
9. Schöggl J.P, Baumgartner R.J, Hofer D, Improving sustainability performance in early phasesof product design: A checklist for sustainable product development tested in the automotiveindustry, Journal of Cleaner Production, 2017, 140: pp. 1602–1617.
10. Pigosso D.C.A, McAloone T, Rozenfeld H, Characterization of the state-of-the-art andidentification of main trends for Ecodesign Tools and Methods: Classifying three decadesof research and implementation, Journal of the Indian Institute of Science, 2016, 95(4):pp. 405–428.
11. Rousseaux P, et al., “Eco-tool-seeker”: A new and unique business guide for choosingecodesign tools, Journal of Cleaner Production, 2017, 151: pp. 546–577.
12. Poulikidou S, Björklund A, Tyskeng S, Empirical study on integration of environmentalaspects into product development: processes, requirements and the use of tools in vehiclemanufacturing companies in Sweden, Journal of Cleaner Production, 2014. 81: pp. 34–45.
13. Bovea M, Pérez-Belis V, A taxonomy of ecodesign tools for integrating environmentalrequirements into the product design process, Journal of Cleaner Production, 2012, 20(1):pp. 61–71.
14. Knight P, Jenkins J.O, Adopting and applying eco-design techniques: a practitionersperspective, Journal of Cleaner Production, 2009, 17(5): pp. 549–558.
15. Lindahl M, Tingström J, En liten lärobok om miljöeffektanalys, 2000: Institutionen för teknik,Högskolan i Kalmar.
16. Hallstedt S, et al., An approach to assessing sustainability integration in strategic decisionsystems for product development, Journal of Cleaner Production, 2010, 18(8): pp. 703–712.
17. Schöggl J, Baumgartner R.J, Hofer D, A Checklist for sustainable product development:Improving sustainability performance in early phases of product design, 2014.
18. Louis S, Wendel A, Life cycle assessment and design-experience from Volvo CarCorporation, 1998, SAE Technical Paper.
19. Nordkil T, Volvos vita lista, Volvo Corporate Standard, 1998.21. Nordkil T, Volvos vita lista, Volvo Corporate Standard, 1998.
388 S. A. Brambila-Macias et al.
22. Tingström J, Karlsson R, The relationship between environmental analyses and thedialogue process in product development, Journal of Cleaner Production, 2006, 14(15):pp. 1409–1419.
23. ISO, ISO 14001: 2015 Environmental Management Systems-Requirements with Guidance forUse. 2015. Retrieved from https://www.iso.org/iso-14001-environmental-management.html.
24. European Commission Press release, Closing the loop: Commission adopts ambitious newCircular Economy Package to boost competitiveness, create jobs and generate sustainablegrowth, 2015.
25. International Organization for Standardization, ISO 14001: 2015. Quality managementsystems—Requirements.Geneva: International Organization for Standardization, 2015, p.viii.
Open Access This chapter is licensed under the terms of the Creative Commons Attribution 4.0International License (http://creativecommons.org/licenses/by/4.0/), which permits use, sharing,adaptation, distribution and reproduction in any medium or format, as long as you give appropriatecredit to the original author(s) and the source, provide a link to the Creative Commons license andindicate if changes were made.The images or other third party material in this chapter are included in the chapter’s Creative
Commons license, unless indicated otherwise in a credit line to the material. If material is notincluded in the chapter’s Creative Commons license and your intended use is not permitted bystatutory regulation or exceeds the permitted use, you will need to obtain permission directly fromthe copyright holder.
Development of an Environmental Evaluation Tool … 389
Discussion Panel—Assessmentof Externalities: Monetisationand Social LCA
Stéphane Morel, Marzia Traverso and Philipp Preiss
Abstract This paper aims to explore the topic of monetisation of environmentaland social aspects. The content is issued from a discussion panel held inLuxembourg during the LCM2017 conference. It first explores historical andmethodological aspects. The recommendations are made for companies who intendto monetise their impacts. Three industrial companies presented their contributionon their day to day use of monetisation. The key conclusions are twofold. In onehand, many challenges remain. The implementation is still not always feasible forall issues and an iterative approach is highly recommended. New methods on socialLCA show a growing interest on this topic from various parties. ISO standardswork is progressing and will support companies and government in their use ofmonetisation. From the company point of view, monetisation is a bridge betweenenvironmental and social assessment, and economic evaluation, while it provides acommon unified unit (money). By using a common unit for financial andnon-financial aspects, monetization allows the direct comparison of differentaspects and therewith a more informed materiality assessment. By looking atimpacts, a new perspective on current and future business risks and opportunities isprovided. A better understanding of interdependencies enables more informeddecision making. The monetary language is a door opener to access new stake-holder groups such as finance and accounting to raise awareness for sustainability.
S. Morel (&)Renault, Alliance Technology Development, Guyancourt, Francee-mail: [email protected]
M. Traverso (&)RWTH Aachen University, Aachen, Germanye-mail: [email protected]
P. PreissBusiness School, Institute for Industrial Ecology, Sustainable Technologyand Innovation Management, Pforzheim University, Pforzheim, Germany
© The Author(s) 2018E. Benetto et al. (eds.), Designing Sustainable Technologies,Products and Policies, https://doi.org/10.1007/978-3-319-66981-6_43
391
1 Introduction
Social and environmental impacts occur along the product life cycle and aremeasured by different indicators. To assess the sustainability performance of aproduct life cycle, a social, economic and environmental impact assessment isneeded.
Despite the absence of scientific agreement on a set of indicators to be con-sidered in the framework of Life Cycle Sustainability Assessment (LCSA), severalimplementations have been already realised at companies and product levels.
However, the results of a sustainability assessment are often expressed throughout several indicators, making their interpretation and the identification of the rel-ative trade-offs challenging. A possibility to facilitate the interpretation is mone-tizing all impacts indicators. However, monetisation induced a set ofmethodological issues and choices that are debatable and that must be known beforeimplementation. The aim of the session was to clarify the state of the art of relatedmethodological approaches, towards a guidance for businesses and governments inorder to correctly use monetisation in portfolio assessment and decision making.
Based on the outcomes of the session held at LCM 2017 conference, this paperfirst presents the most important elements from the methodological state of the art,and then some general guidance as well as concrete feedback from industries.
2 State of the Art of the Methodology
Monetisation is nowadays growing from research to standardisation. Monetaryvaluation has been used in policy making for decades mostly in cost-benefitanalyses, since the early 30s in the United States. More recently in the EuropeanUnion where this approach is observed since the 90s, in directives such as theNational Emission Ceilings Directive (NEC directive (2001/81/EC), EU researchprojects such as the National Energy Education Development project (NEED(2007)), and many others. By the way, an umbrella of different concepts stays underthe monetization term such as: market price, abatement costs, societal costs &benefits etc.
Mr. Philipp Preiss clarify the definition as follow, based on ExternE (2005) [1, 2]researches:
• Externalities arise, when the social or economic activities of a participant havenegative or positive impacts on another participant and these impacts are notfully accounted for or compensated by the first participant.
• External costs are externalities that are transformed into monetary values. Theyare the share of damage costs which is not internalised.
Monetisation is promoted for several reasons. In the first hand, with monetisa-tion of externalities the monetary values are shown explicitly. However, without
392 S. Morel et al.
monetisation the impacts are implicitly monetised by the difference of the internalcosts of corresponding alternatives (i.e. a decision between alternative technologiesor policies). Or in other words, if impacts are not monetised the external costs aretaken into account as if they were zero.
On the other hand, monetisation offers an additional indicator but must not bethe only basis for decision-making. At member state level, environmental agenciesare involved, such as the German Federal Environmental Agency (UBA): [3] or theFrench ministry of environment (MEEM) who held a specific workshop on mon-etisation of goods and environmental services through life cycle assessment in2017.
Currently two ISO documents (ISO 14007 and ISO 14008) are under con-struction in order to provide guidance and allow a wider use of monetisation.
Mr. Preiss points out some limits regarding the comparability of results ofvarious studies. Studies are different regarding their comprehensiveness. There is alack of transparency if the underlying assumptions and models are not displayed.And generally, there is the lack of a widespread state of the art approach.
Mr. Chanoine (Deloitte) proposed a practical guidance issued from a studycarried out with the industrial consortium SCORELCA in 2012 [4] and followed bya second study also driven by SCORELCA in 2016 of which the results are notpublished yet. It is based on operational recommendations on how to use monetaryvaluation to monetize LCA results. The proposal is an iterative approach with a go/no go process in two steps. First, a set of questions allows to determine thenecessity to carry out monetisation, and how it should be done. Then nine infor-mation sheets provide explicit implementation guidance.
As a first conclusion, monetary valuation in LCA should be used when identifiedas necessary, depending on the objectives of the study. It has been presented as anapproach to solve trade-offs. As a counterpart monetisation remains an approachpotentially complex to implement due to the set of parameters to be considered incorrelation to set monetary values, moreover considering the potential subjectivityof those parameters. Also, it remains especially complex when it is required todevelop specific monetarisation factors, which may request time, funding, somespecific competences investments and political decisions.
3 Feedback from the Industry on the Applicationof Monetisation
This section provides feedback from three chemical companies.Mr. Sonnen (Ecomatters), in collaboration with AkzoNobel, provided insights
on how a company can monitor its global activity (downstream, upstream andthemselves) on economic [5], environmental costs [6, 7] and social capitals [5]. Itallows the company to identify business risks, opportunities, stimulate innovation
Discussion Panel—Assessment of Externalities … 393
and cooperation with value chain partners. This also permits to reduce the negativeand strengthen existing positive externalities.
Since 2013, BASF calculates it ‘real’ contribution to a sustainable future. Withthe Value-to-Society approach, BASF assesses its positive and negative economic,social and environmental impacts on society along the value chain in €. The resultsare used in positioning and communication as well as progress monitoring.Application in decision making and goal setting is piloted. However, due to dataaccuracy, maturity level of methods as well as conceptual challenges, for a sys-tematic embedment further research and standardization is required. These areunder construction. Mr. van Gelder stated for BASF “With Value-to-Society wehave a new macro perspective on benefits and costs of our economic, environmentaland social impacts along the value chain”.
Mr. Wathelet (SOLVAY) introduced the Sustainable Portfolio Management(SPM) map [7, 8]. There, the products are presented on a map according to twocriteria: Operations Vulnerability (monetized environmental impact of production/sales price) and Market Alignment (analyse of a product in an application throughthe lens of sustainability—benefits or roadblocks). This allows to categorized theproducts under three categories: Solutions (outstanding sustainability contributionfor the society), neutral, and challenges (Strong negative signals in sustainability, tobe improved or abandoned).
Those three companies are using monetarisation of LCA results to express theenvironmental impacts in terms of costs. Methods to evaluate social benefits remainvery diverse. They all three agree that monetarisation of social and environmentalaspects is very intuitive, allowing to gather positive and negative aspects of asystem on a unique scheme, and can be useful to engage with top management.They also acknowledge the needs for further research.
4 Discussion and Conclusion
External cost calculation constitutes a bridge between economic decisions andenvironmental and social assessment while it can provide both types of results in acommon unit, and is relevant to support three levels of decision: technical solution,product portfolio and the company strategy.
It can also be a support to engage with top management, allowing to align withmateriality assessment and stakeholder’s expectations.
Nevertheless, many challenges remain to improve the applicability of moneti-sation methodologies, and company acceptance. To be implemented, it is requiredto collect raw information from the supply chain and consumers. This starts with thelife cycle inventory collection from the direct supplier to the very first one. Then thedefinition of monetization factor for each impact is necessary and crucial, for thislast task a customer´ survey can held in order to define the wiliness to pay. Inalternative, monetization factors presented in literature can be used for the firstimplementations.
394 S. Morel et al.
The panel recommendations were to adapt the effort according to the pursuedgoal of the study. An iterative approach is highly recommended in order to firstconduct a streamlined assessment, and then implement more complex methodswhen necessary.
The company acceptance relies on the communication of monetized results sincemonetization could be used at various level in companies, the targeted audience isdiverse and the media shall be adapted in consequence. An exhaustive state of theart on methodological issues related to monetary valuation and on the way tointerpret the monetised indicators would be valuable to the practitioners.
One remaining challenge also stands on the capability to introduce these cost andsocial information in decision making and performance monitoring. This raises herea new question grounded in the financial accounting. How to integrate costs andrevenues which are not paid or perceived directly? Shall external cost performancebe a key indicator and for whom? How to transfer the benefits and positive impactto the contributors?
As a final conclusion, despite these raising questions the panel underlined theremaining researches to be carried on, and agreed that environmental and social costassessment, already today, have a major ability to reinforce decision making.
Acknowledgements We would like to thank the panel for their contribution: Mr. Chanoine(Deloitte), Mr. Sonnen (Ecomatters), Mr. Van Gelder (BASF) and Mr. Wathelet (SOLVAY).
References
1. ExternE is the acronym for “External Costs of Energy” and a synonym for a series of projectsstarting from early 90s till 2005, http://www.externe.info/externe_d7.
2. De Nocker L, Panis L, Torfs R, ExternE: A European accounting framework for Life CycleImpact Assessment and external costs of transport, SAE Technical Paper, No. 2000-01-1480,2000.
3. German Federal Environmental Agency (UBA), 2007: “Economic Valuation of EnvironmentalDamage—Methodological Convention for Estimates of Environmental Externalities”, 2013:update. http://www.umweltbundesamt.de/publikationen/economic-valuation-of-environmental-damage-02018/19:%202nd%20update.
4. Ministère de l’Environnement, de l’énergie et de la mer, Monétarisation des biens et servicesenvironnementaux: L’analyse de cycle de vie, questions et enjeux autour de sa monétarisation,2017.
5. Ecomatters, 2016. Ecomatters, Human capital creation along the value chain, 2016), www.ecomatters.nl/human-capital.
6. Weidema B-P, Pizzol M, Brandão M, The Use of Monetary Valuation of EnvironmentalImpacts in Life Cycle Assessment: State of the art, strengths and weaknesses, SCORE-LCAreport Nb 2012-03, 2013.
7. Steen B, 2015. Environmental Priority Strategy (EPS) system, Chalmers University, 2015),http://www.ivl.se/english/startpage/pages/focus-areas/environmental-engineering-and-sustainable-production/lca/eps.html.
8. SOLVAY 2017 http://www.solvay.com/en/binaries/Solvay-SPM-Guide-154709.pdf.
Discussion Panel—Assessment of Externalities … 395

Open Access This chapter is licensed under the terms of the Creative Commons Attribution 4.0International License (http://creativecommons.org/licenses/by/4.0/), which permits use, sharing,adaptation, distribution and reproduction in any medium or format, as long as you give appropriatecredit to the original author(s) and the source, provide a link to the Creative Commons license andindicate if changes were made.The images or other third party material in this chapter are included in the chapter’s Creative
Commons license, unless indicated otherwise in a credit line to the material. If material is notincluded in the chapter’s Creative Commons license and your intended use is not permitted bystatutory regulation or exceeds the permitted use, you will need to obtain permission directly fromthe copyright holder.
396 S. Morel et al.
Applying LCA to Estimate DevelopmentEnergy Needs: The Cases of Indiaand Brazil
Narasimha D. Rao, Alessio Mastrucci and Jihoon Min
Abstract This paper illustrates the use of life cycle assessment (LCA) methods tolink human wellbeing to resource consumption. Based on a previously developedframework of the material requirements for human well-being, we use LCA andInput-Output (I/O) analysis, as appropriate, to estimate the life-cycle energy neededto meet the gap in living standards in two emerging economies, India and Brazil.We illustrate the relative contribution of different living standards components toenergy requirements, as well as the uncertainty and trade-offs between upfront andlong-term operating energy costs, and how these factors differ in the two countries.This analysis provides insights on how LCA analysis can be used to inform energyplanning and its links to development goals.
1 Introduction
There is much potential for life cycle assessment (LCA) to inform public policybeyond its traditional use to address environmental objectives [1]. This paperillustrates how LCA can be used to inform development and energy policies relatedto improving living standards in emerging economies. Our motivation is thattechnology, material and design choices in the build-up of infrastructure can presentimportant trade-offs between short-term (construction) and long-term (operating)energy needs, as well as different net energy requirements. These differences matterin emerging economies such as India and Brazil that expect high future economicgrowth and significant infrastructure investments. The Indian government antici-pates 1.5 trillion dollars of infrastructure investments over the next decade [2].Furthermore, almost a quarter of the building stock (*50 million units), requiresupgrading [3], not counting population growth and future migration to urban areas.
N. D. Rao (&) � A. Mastrucci � J. MinInternational Institute for Applied Systems Analysis (IIASA),Energy (ENE) Program, 2361 Laxenburg, Austriae-mail: [email protected]
© The Author(s) 2018E. Benetto et al. (eds.), Designing Sustainable Technologies,Products and Policies, https://doi.org/10.1007/978-3-319-66981-6_44
397
Brazil is a useful contrast, as it faces similar social challenges, such as highinequality, but a very different scale and with different resource endowments.
Based on a previously developed account of decent living standards (“DLS”),which define the material requirements for human wellbeing [4], we use LCA andInput-Output (I/O) analysis, as appropriate, to estimate the life-cycle energyrequired to meet the gap in, and sustain, DLS for all. We consider the energyassociated with delivering DLS goods and services, including food production andpreparation, clothing, housing, the extension of networks for water and sanitation,electricity, social infrastructure (health and education), communications, roads andtransport systems. Our emphasis in this study is on methodology, not on empiricalfindings. That is, rather than supplying comprehensive estimates on the energyrequirements for providing DLS, we aim to illustrate how LCA methods can beused to provide insights into such a quantification exercise. We make three con-tributions in this regard: (a) we illustrate the relative contributions of living standardcomponents to the estimation of energy requirements for a DLS; (b) we show howuncertainty can be systematically quantified and attributed to these choices; and(c) we show the trade-offs in construction and operating energy inherent in thesechoices.
2 Methods
The methodology includes three steps: estimation of the gaps in DLS; calculation oflife-cycle material and energy requirements; uncertainty analysis.
First, we estimate the gaps in DLS (Sect. 3) in material terms, such as thenumber of housing units for shelter, toilets for sanitation, minimum water con-sumption for water supply, basic appliances, etc. based on national and interna-tional sources. The key components of the DLS can be inferred from the normativestandards in Table 1. A more comprehensive description can be found in Rao andMin [4].
These normative standards are converted into material requirements, the processof which is straightforward except for social dimensions of wellbeing (health andeducation), whose material needs are not easily determined. For these, we rely onprevious empirical analysis [4] to determine the national expenditure levels requiredat a minimum to achieve standards of primary education and life expectancyrespectively. We use a multi-region input-output (MRIO) to estimate the energyrequirements associated with this expenditure. We also use MRIO for food pro-duction, whose heterogeneity across the economy is best aggregated through anMRIO.
For material items in the DLS, such as housing, appliances and related infras-tructure, we use traditional LCA calculations [5]. For housing, we identify buildingarchetypes representative of different climatic conditions, regions (e.g. dependingon material availability) and urban/rural areas and we calculate construction andoperational energy using a material inventory and a dynamic energy model. Using
398 N. D. Rao et al.
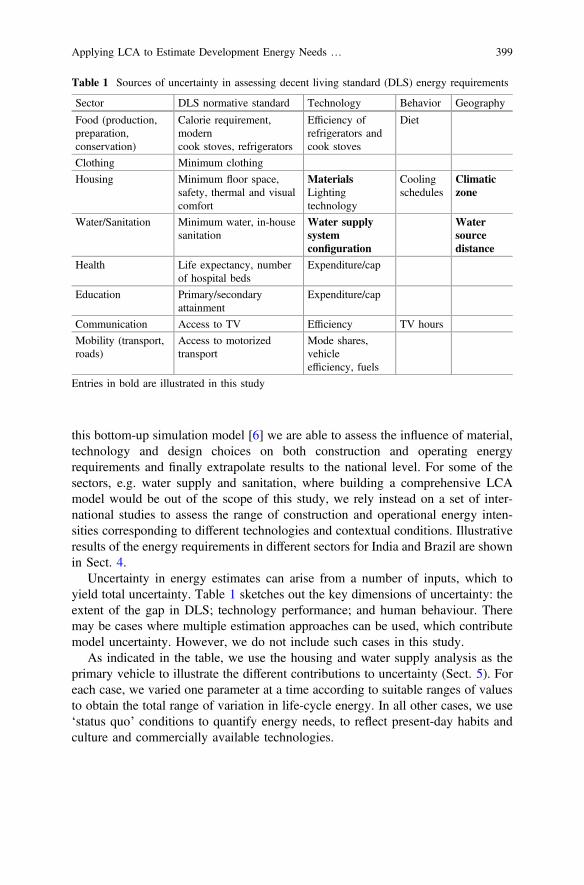
this bottom-up simulation model [6] we are able to assess the influence of material,technology and design choices on both construction and operating energyrequirements and finally extrapolate results to the national level. For some of thesectors, e.g. water supply and sanitation, where building a comprehensive LCAmodel would be out of the scope of this study, we rely instead on a set of inter-national studies to assess the range of construction and operational energy inten-sities corresponding to different technologies and contextual conditions. Illustrativeresults of the energy requirements in different sectors for India and Brazil are shownin Sect. 4.
Uncertainty in energy estimates can arise from a number of inputs, which toyield total uncertainty. Table 1 sketches out the key dimensions of uncertainty: theextent of the gap in DLS; technology performance; and human behaviour. Theremay be cases where multiple estimation approaches can be used, which contributemodel uncertainty. However, we do not include such cases in this study.
As indicated in the table, we use the housing and water supply analysis as theprimary vehicle to illustrate the different contributions to uncertainty (Sect. 5). Foreach case, we varied one parameter at a time according to suitable ranges of valuesto obtain the total range of variation in life-cycle energy. In all other cases, we use‘status quo’ conditions to quantify energy needs, to reflect present-day habits andculture and commercially available technologies.
Table 1 Sources of uncertainty in assessing decent living standard (DLS) energy requirements
Sector DLS normative standard Technology Behavior Geography
Food (production,preparation,conservation)
Calorie requirement,moderncook stoves, refrigerators
Efficiency ofrefrigerators andcook stoves
Diet
Clothing Minimum clothing
Housing Minimum floor space,safety, thermal and visualcomfort
MaterialsLightingtechnology
Coolingschedules
Climaticzone
Water/Sanitation Minimum water, in-housesanitation
Water supplysystemconfiguration
Watersourcedistance
Health Life expectancy, numberof hospital beds
Expenditure/cap
Education Primary/secondaryattainment
Expenditure/cap
Communication Access to TV Efficiency TV hours
Mobility (transport,roads)
Access to motorizedtransport
Mode shares,vehicleefficiency, fuels
Entries in bold are illustrated in this study
Applying LCA to Estimate Development Energy Needs … 399
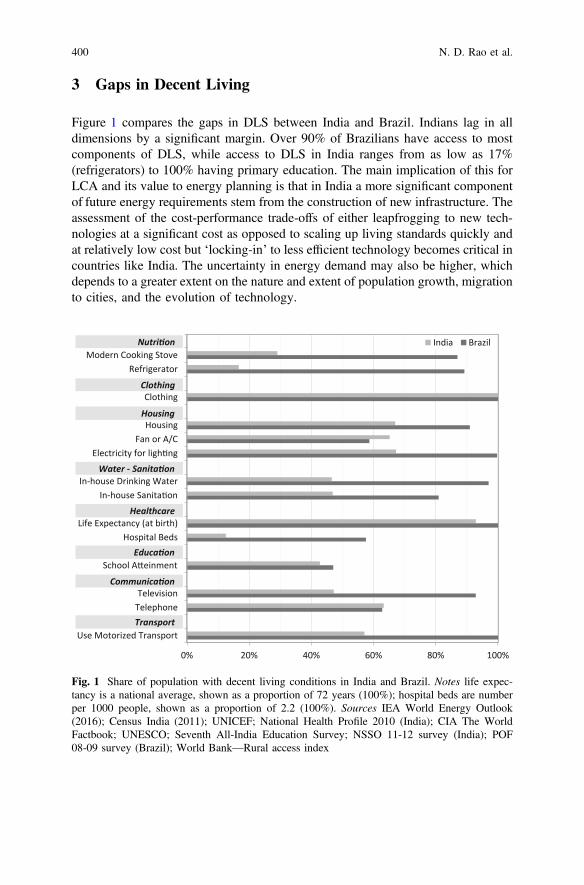
3 Gaps in Decent Living
Figure 1 compares the gaps in DLS between India and Brazil. Indians lag in alldimensions by a significant margin. Over 90% of Brazilians have access to mostcomponents of DLS, while access to DLS in India ranges from as low as 17%(refrigerators) to 100% having primary education. The main implication of this forLCA and its value to energy planning is that in India a more significant componentof future energy requirements stem from the construction of new infrastructure. Theassessment of the cost-performance trade-offs of either leapfrogging to new tech-nologies at a significant cost as opposed to scaling up living standards quickly andat relatively low cost but ‘locking-in’ to less efficient technology becomes critical incountries like India. The uncertainty in energy demand may also be higher, whichdepends to a greater extent on the nature and extent of population growth, migrationto cities, and the evolution of technology.
0% 20% 40% 60% 80% 100%
Modern Cooking StoveRefrigerator
Clothing
HousingFan or A/C
Electricity for ligh ng
In-house Drinking WaterIn-house Sanita on
Life Expectancy (at birth)Hospital Beds
School A einment
TelevisionTelephone
Use Motorized Transport
India BrazilNutri on
Clothing
Housing
Water - Sanita on
Healthcare
Educa on
Communica on
Transport
Fig. 1 Share of population with decent living conditions in India and Brazil. Notes life expec-tancy is a national average, shown as a proportion of 72 years (100%); hospital beds are numberper 1000 people, shown as a proportion of 2.2 (100%). Sources IEA World Energy Outlook(2016); Census India (2011); UNICEF; National Health Profile 2010 (India); CIA The WorldFactbook; UNESCO; Seventh All-India Education Survey; NSSO 11-12 survey (India); POF08-09 survey (Brazil); World Bank—Rural access index
400 N. D. Rao et al.
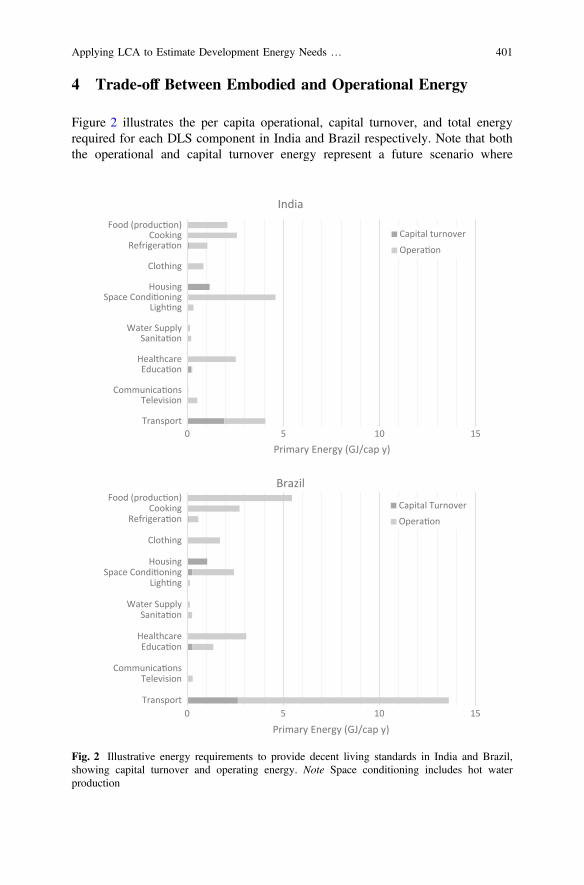
4 Trade-off Between Embodied and Operational Energy
Figure 2 illustrates the per capita operational, capital turnover, and total energyrequired for each DLS component in India and Brazil respectively. Note that boththe operational and capital turnover energy represent a future scenario where
0 5 10 15
Food (produc on)Cooking
Refrigera on
Clothing
HousingSpace Condi oning
Ligh ng
Water SupplySanita on
HealthcareEduca on
Communica onsTelevision
Transport
Primary Energy (GJ/cap y)
Brazil
Capital Turnover
Opera on
0 5 10 15
Food (produc on)Cooking
Refrigera on
Clothing
HousingSpace Condi oning
Ligh ng
Water SupplySanita on
HealthcareEduca on
Communica onsTelevision
Transport
Primary Energy (GJ/cap y)
India
Capital turnover
Opera on
Fig. 2 Illustrative energy requirements to provide decent living standards in India and Brazil,showing capital turnover and operating energy. Note Space conditioning includes hot waterproduction
Applying LCA to Estimate Development Energy Needs … 401
infrastructure gaps to manufacture and deliver the DLS products/services have beenfilled. Many of these results are still preliminary, and not meant to convey anempirical finding. Rather, they illustrate the kinds of insights such analysis enables.For instance, the relative energy requirements for different DLS components differwidely. Food in Brazil is far more energy intensive than in India, most likely due tothe preponderance of meat consumption in Brazil compared to India. The housingenergy requirement in India has a moderately higher share of capital turnover fromthe expansion of the existing stock. However, the energy required to heat and cool(largely cool) buildings is far greater in India due to, among other things, severeclimatic conditions (high temperatures and humidity). In both countries, energy foroverall capital expansion is dominated by housing and transportation.
Some caveats are in order. In general, in using existing country-specific data onmaterial and energy intensities to meet a single standard, we can’t discern whetherdifferences arise from different levels of service quality, differences in energy needs,or differences in efficiency. For instance, health and education energy requirementsin Brazil are higher than in India, because energy intensity levels in Brazil aresignificantly higher. This may imply that quality is higher, or that existing condi-tions (e.g., population density) may necessitate higher energy intensities in Brazil,or that energy use is less efficient in Brazil. In subsequent work, some discernmentwill be possible, based on deeper analysis of the health and education sectors.
Another caveat is that the electricity demand growth assumes power plantsalready exist (that is, the embedded energy associated with building new electricpower plants to meet incremental electricity demand has not as yet been included).This is, however, typically very small in comparison to operating energy.
5 Uncertainty Analysis
An important aspect of energy demand estimation is uncertainty and its attributionto policymakers’ decision variables. We illustrate this for the case of housing andwater, which differ in the extent of influence of geography.
5.1 Housing Supply Energy Requirements
For housing, climatic conditions and building materials (accounting for localavailability) are key sources of uncertainty and are analysed in this section (seeTable 1 for all sources of uncertainty). We include country-specific options oftraditional mud-based construction in India, and wooden homes in Brazil. For thispaper, we use a single-storey building archetype for an average family in eachcountry. Due to different average household sizes, the sample house is 30 m2 inBrazil and 40 m2 in India. Figure 3 shows the results, where the bars in the
402 N. D. Rao et al.
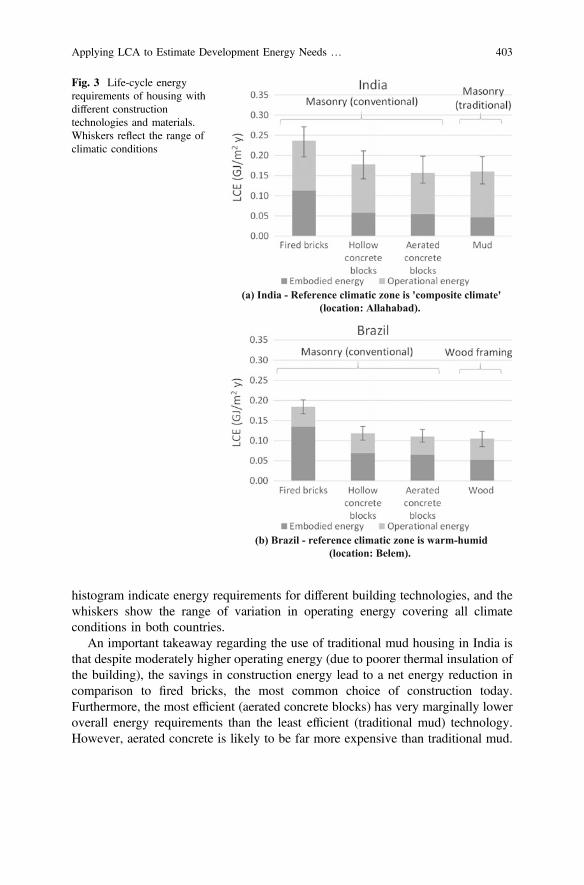
histogram indicate energy requirements for different building technologies, and thewhiskers show the range of variation in operating energy covering all climateconditions in both countries.
An important takeaway regarding the use of traditional mud housing in India isthat despite moderately higher operating energy (due to poorer thermal insulation ofthe building), the savings in construction energy lead to a net energy reduction incomparison to fired bricks, the most common choice of construction today.Furthermore, the most efficient (aerated concrete blocks) has very marginally loweroverall energy requirements than the least efficient (traditional mud) technology.However, aerated concrete is likely to be far more expensive than traditional mud.
(a) India - Reference climatic zone is 'composite climate'(location: Allahabad).
(b) Brazil - reference climatic zone is warm-humid(location: Belem).
Fig. 3 Life-cycle energyrequirements of housing withdifferent constructiontechnologies and materials.Whiskers reflect the range ofclimatic conditions
Applying LCA to Estimate Development Energy Needs … 403

On an energy cost basis, therefore, this preliminary analysis would suggest that thetraditional mud option may be the most favourable option compared to the presenttechnology of choice, fired bricks. Other inconveniences, such as water penetrationand termite attack, may, however, limit its application. Another insight is that thedifference in total energy requirements is driven almost entirely by constructionenergy differences. The variation in operating energy is much smaller. Oneimplication of this finding is that the favourable choice of construction materials isunlikely to vary much across India due to varying climate conditions. However, ifone were to consider a broader range of energy savings measures (e.g. thermalinsulation, high-performance glazing, shading devices, etc.) operational energyreductions may have a more influential role.
In Brazil, building operating energy is even less important than in India, due tomore moderate climatic conditions. The variation in energy from the heterogeneityof climatic conditions in the country is correspondingly lower as well. Notably, thebuilding materials show similar relative merits with respect to total energyrequirements, with the exception that the traditional (in this case, wood) housing iseven more favourable, having the least total energy requirement.
5.2 Water Supply Energy Requirements
Key sources of uncertainty for water supply include the geography and normativestandard for water demand. We compare two different systems with differentgeographies—one with low water conveyance (in South Africa [7]), and anotherwith high conveyance requirements (in Florida [8]). We also vary the normativestandard for water demand, between a normative minimum of 50 l per cap per day[9], and a reference of 100 l/cap/day (representing approximately the averagedemand in India). Notably, nothing in this analysis is actually dependent on localconditions in India or Brazil, so we show only one set of results.
In contrast to housing, water energy requirements are almost entirely composedof operating energy, which comprises pumping water through the distributionsystem and treating water. In this sector, construction materials matter far less thanpumping technology and location. The range of variation for the two systems ishigher than the mean. There may well be other locations in these countries thatentail even higher conveyance costs (Fig. 4).
404 N. D. Rao et al.
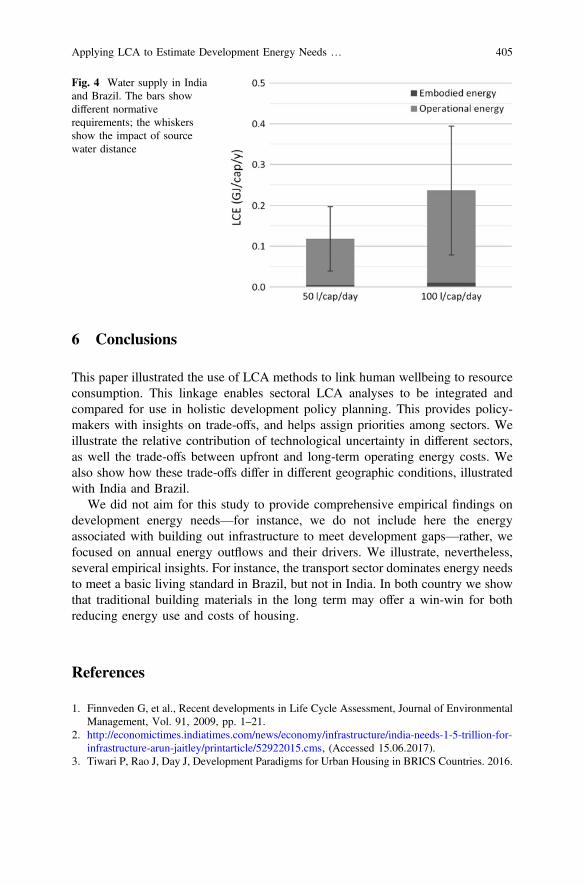
6 Conclusions
This paper illustrated the use of LCA methods to link human wellbeing to resourceconsumption. This linkage enables sectoral LCA analyses to be integrated andcompared for use in holistic development policy planning. This provides policy-makers with insights on trade-offs, and helps assign priorities among sectors. Weillustrate the relative contribution of technological uncertainty in different sectors,as well the trade-offs between upfront and long-term operating energy costs. Wealso show how these trade-offs differ in different geographic conditions, illustratedwith India and Brazil.
We did not aim for this study to provide comprehensive empirical findings ondevelopment energy needs—for instance, we do not include here the energyassociated with building out infrastructure to meet development gaps—rather, wefocused on annual energy outflows and their drivers. We illustrate, nevertheless,several empirical insights. For instance, the transport sector dominates energy needsto meet a basic living standard in Brazil, but not in India. In both country we showthat traditional building materials in the long term may offer a win-win for bothreducing energy use and costs of housing.
References
1. Finnveden G, et al., Recent developments in Life Cycle Assessment, Journal of EnvironmentalManagement, Vol. 91, 2009, pp. 1–21.
2. http://economictimes.indiatimes.com/news/economy/infrastructure/india-needs-1-5-trillion-for-infrastructure-arun-jaitley/printarticle/52922015.cms, (Accessed 15.06.2017).
3. Tiwari P, Rao J, Day J, Development Paradigms for Urban Housing in BRICS Countries. 2016.
Fig. 4 Water supply in Indiaand Brazil. The bars showdifferent normativerequirements; the whiskersshow the impact of sourcewater distance
Applying LCA to Estimate Development Energy Needs … 405
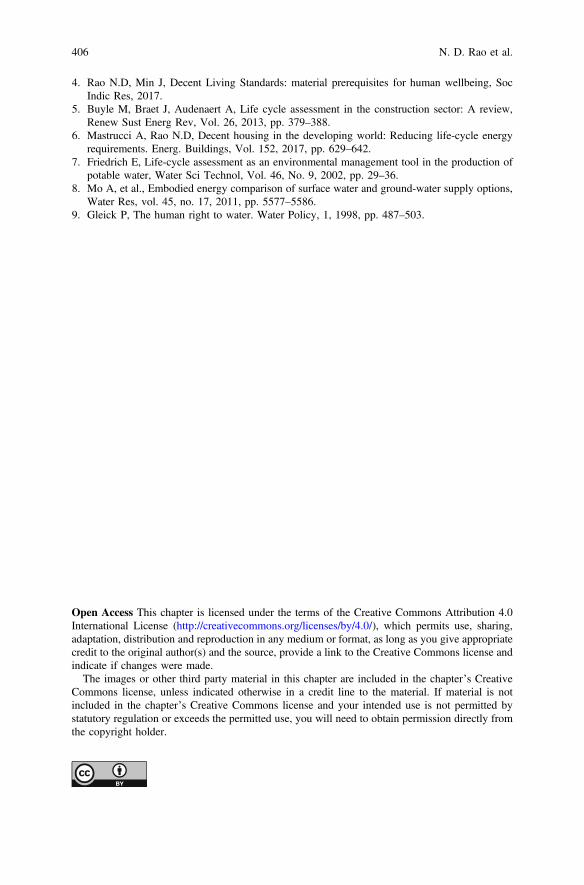
4. Rao N.D, Min J, Decent Living Standards: material prerequisites for human wellbeing, SocIndic Res, 2017.
5. Buyle M, Braet J, Audenaert A, Life cycle assessment in the construction sector: A review,Renew Sust Energ Rev, Vol. 26, 2013, pp. 379–388.
6. Mastrucci A, Rao N.D, Decent housing in the developing world: Reducing life-cycle energyrequirements. Energ. Buildings, Vol. 152, 2017, pp. 629–642.
7. Friedrich E, Life-cycle assessment as an environmental management tool in the production ofpotable water, Water Sci Technol, Vol. 46, No. 9, 2002, pp. 29–36.
8. Mo A, et al., Embodied energy comparison of surface water and ground-water supply options,Water Res, vol. 45, no. 17, 2011, pp. 5577–5586.
9. Gleick P, The human right to water. Water Policy, 1, 1998, pp. 487–503.
Open Access This chapter is licensed under the terms of the Creative Commons Attribution 4.0International License (http://creativecommons.org/licenses/by/4.0/), which permits use, sharing,adaptation, distribution and reproduction in any medium or format, as long as you give appropriatecredit to the original author(s) and the source, provide a link to the Creative Commons license andindicate if changes were made.The images or other third party material in this chapter are included in the chapter’s Creative
Commons license, unless indicated otherwise in a credit line to the material. If material is notincluded in the chapter’s Creative Commons license and your intended use is not permitted bystatutory regulation or exceeds the permitted use, you will need to obtain permission directly fromthe copyright holder.
406 N. D. Rao et al.
Integrating the Concept of PlanetaryBoundaries into Decision MakingProcesses
Marcial Vargas-Gonzalez
Abstract What is absolute sustainability? This question has been the centre ofdiscussion for many years now. During this session, several stakeholders tried tobring their own answer to the question, discussing issues like the currentScience-Based Targets approach, SDGs, resource criticality and the development oftargets based on the earth’s regenerative capacity. And while different topics wereaddressed and the need to develop more robust approaches was apparent, all pre-senters were aligned on the need to help companies incorporate the notion ofplanetary boundaries in their business practices in order to address as quickly aspossible the environmental issues of the 21st century.
1 Introduction
What is sustainability? This question has been the centre of discussion for manyyears now. From the environmental point of view, sustainability was considered upuntil now as improving the environmental performance of your company orproduct. This was therefore about being more sustainable than someone else’scompany or product but not about becoming sustainable in absolute terms.
The Planetary Boundaries concept provides insights on what environmentalsustainability means at the global level, i.e. what is the planet’s resilience thresholdwithin which we can keep developing. This being said, a major question arises: howcan we translate such concepts at a corporate level to enable better decision-makingprocesses?
Two levers are being currently investigated:
– Using Planetary Boundaries as a new normalization system in LCA approachesto assess the product’s sustainability and the material challenges it faces [1, 2].
M. Vargas-Gonzalez (&)Quantis International, Paris, Francee-mail: [email protected]
© The Author(s) 2018E. Benetto et al. (eds.), Designing Sustainable Technologies,Products and Policies, https://doi.org/10.1007/978-3-319-66981-6_45
407
– Using Planetary Boundaries to define science-based corporate targets to providea way to define environmental strategies strengthened by a recognized scientificapproach. A method that has gained considerable momentum thanks to theScience-Based Targets Initiative, which focuses on the climate change issue [3].
This session was the opportunity for companies and academia to discuss theconcept of Planetary Boundaries, its integration at the corporate level (theapproaches and methods being developed), its operationalization but also the limitsof such an approach.
2 Presentation Summary
Trough 5 presentations, this session helped understand how the planetary bound-aries concept was first applied to carbon emissions by the existing sectorialdecarbonisation approach, paving the way for new methodologies and the assess-ment of different aspects and sectors including: the carbon emissions of theagri-food sector, the development of targets beyond carbon, resource criticality andthe alignment of SDGs and Planetary Boundaries.
2.1 Sectoral Pathways to Low Carbon Economy Shall DriveTransition Planning and Companies’ DecisionProcesses: The Key Learning’s from AssessingLow Carbon Transition Initiative’s Pilot Phase
Recently, the main environmental concern for companies and states alike has beento drastically reduce carbon emissions in order to remain below the 2 °C target setduring COP21. And while climate leaders have assimilated existing tools likecarbon reporting and the Sectoral Decarbonisation Approach (SDA), carbonemissions continue to rise.
During this presentation, it was discussed how the ACT approach developed byCDP and ADEME can help companies ensure that their approach is aligned withthe level of decarbonisation needed. It provides sectorial assessment methods with aholistic view helping companies in the electric utilities, automobile and retailsectors improve their climate strategy, business mode, investments, operations andGHG emissions and GHG emission management.
While ADEME’s work shows that companies are ready for the transition, severalhurdles remain like the inclusion of new sectors in the existing methodologies, theinclusion of SMEs in the carbon discussions and the extension of the approach toinclude other environmental indicators.
408 M. Vargas-Gonzalez
2.2 Defining Science-Based Targets for an Agri-foodCompany: A Case Study
In line with the observation made by ADEME, today, more than 300 companieshave committed to the Science Based Targets initiative showing the way to a 2 °Ctemperature rise scenario. However, as previously mentioned, in order to make surethose targets are reached, it is key to define manageable targets in line with thecompany’s structure which can be difficult when considering that several sectors arenot described in the SDA approach.
This is the main purpose of Quantis & Ecofys’ work, defining science-basedtargets for a couple of agri-food companies using the SDA approach. This show-cases not only the needed methodological developments, including the develop-ment of reduction pathways for several crops, but also the need to have a commonstructure when building a “SBT strategy”. In order to meet their goals, companiesneed to understand the calculations and commitments that have been validatedbefore companies starts strategizing and acting.
The key message is that even though developments are still ongoing, it ispossible for companies to start acting immediately with a pragmatic framework andapproach.
2.3 One Planet Thinking: Towards Companies ThatPerform Within the Earth’s Regenerative Capacity
While the main focus has been carbon issues, the fact that we used the regenerativecapacity of 1.6 planets in 2012 at present consumption levels demonstrates theurgent need to act within the earth’s regenerative capacity beyond carbon and tostart addressing all environmental issues. As previously proved, this can be man-aged with a pragmatic and operational approach in line with industrial needs.
Inspired by the concept of planetary boundaries, which was introduced byRockström et al. in 2009 [4], Ecofys developed One Planet Thinking(OPT) together with Eneco, an energy utilities company in the Netherlands, withthe aim to link corporate activities to global, regional and local boundaries to settargets for climate change, particulate matter, fossil and mineral resources.
The approach has its limitations but the overall framework shows that the use ofpragmatic approach can ensure the development of sustainable business practices ina company. Moreover, this presentation shows that including other environmentalissues in the “science-based targets” approach is possible, even though differentissues (spatial focus, time variability) must be understood and included before weconsider the methodology robust and streamlined. The issue of criticality exem-plifies this issue.
Integrating the Concept of Planetary Boundaries … 409
2.4 Criticality Methodology for Resources: How to Applyto Construction in the Future?
Criticality as a concept refers both to the potential impact of shortage of a resourceand to the probability of such a shortage, as such it is an essential issue whendiscussing the absolute sustainability of resource use.
Understanding criticality is therefore a first step in the understanding of resourceuse mechanisms and how setting a target for resource use might be attained in thefuture. And even though the presented approach did not focus on the target settingaspect of criticality, it detailed what should be assessed when evaluating the sus-tainability of resource use including rarity and spatial level of focus. This last aspectitself is quite innovative, as resource scarcity has been classically considered as aglobal issue while this methodology suggests it might not be the case for allresources.
Overall, this work seems necessary in order to better understand the implicationsof resource scarcity and the elements to be considered before defining reductiontargets for resource use.
2.5 Operationalization of Sustainable Development GoalsUsing a Planetary Boundaries-Based Life-CycleAssessment Framework
In 2015, the international community formulated the Sustainable DevelopmentGoals (SDGs) [5], this set of goals is supposed to help achieve sustainable devel-opment. This implies that existing SDGs should lead companies and countries todevelop within the earth’s regenerative capacity.
However, until recently, no framework had been developed on how to integratethe idea of Planetary Boundaries with the SDGs. The work presented showed howplanetary boundaries could be used to compare countries’ current activities withoverall SDGs, assessing if economic sectors are aligned with the internationaltargets.
This offers a new vision of how companies and countries can simplify theirapproaches and use the Planetary Boundaries approach as a key to identify materialissues and be aligned with SDGs, the overall goal being to reduce the number ofKPIs needed to assess their activities. This underlines once more how sustainabilitymust be operationalized if we want international targets to be met by the industrialsectors.
410 M. Vargas-Gonzalez
3 Discussion
Through these five presentations several common issues transpired, showing thatcompanies and governmental are both struggling with absolute sustainability and itsimplications. Most issues arise from the lack of robust methodologies and data thatcould be applied for different environmental aspects and for varied economicsectors. Leading to the question: are science-based and context-based approachesscientific enough?
Presenters emphasized on the need to further detail, improve and completeexisting methodologies in order to consolidate the efforts and build an approach thatis both scientific and operational. However, it seems unreasonable to expectstakeholders to wait before they start acting and setting targets, as environmentalissues must be addressed with urgency. It therefore seems that while currentapproaches are only the first building blocks in the development of absolute sus-tainability targets, they should be integrated into decision-making quickly andimproved on a regular basis.
Moreover, the work presented during these presentations showed that there is areal academic and industrial demand for science-based and context-based approa-ches. This leads presenters to believe that these new methodologies will developquickly and will be aligned with current scientific practices and evolutions in thenear future, with developments focusing on: the inclusion of new sectors in existingmethodologies, the development of a general framework for planetaryboundaries-based targets and the operationalization of existing approaches at thecorporate and national level.
The main hurdle remaining is the definition of an approach that is scientific androbust but that can also be easily implemented at the corporate level and included inthe decision-making process.
4 Conclusions
With the definition of an international target during COP21, the attention turnedaway from conventional target-setting ways and companies stated their need todefine their own science-based targets. The approach has quickly caught on despitethe different difficulties companies have identified. It seems however necessary toaddress these issues in order to develop more robust approaches, including thedevelopment of approaches for issues beyond carbon, that remain operational andeasy to implement and track.
And while most of the presentations focused on the methodological evolutionsthat will lead to a more transparent approach to target setting, all presenters werealigned on the need to help companies incorporate the notion of planetaryboundaries in their business practices in order to address as quickly as possible theenvironmental issues of the 21st century.
Integrating the Concept of Planetary Boundaries … 411
References
1. Bjørn A, Hauschild M.Z, Introducing carrying capacity-based normalisation in LCA:framework and development of references at midpoint level, The International Journal ofLife Cycle Assessment, 20(7), 1005–1018, 2015, http://doi.org/10.1007/s11367-015-0899-2.
2. Bjørn A, Margni M, Roy P.O, Bulle C, Hauschild, M.Z, A proposal to measure absoluteenvironmental sustainability in life cycle assessment. Ecological Indicators, 63, 1–13, 2016.http://doi.org/10.1016/j.ecolind.2015.11.046.
3. Sandin G, Peters G.M, Svanström M, Using the planetary boundaries framework for settingimpact-reduction targets in LCA contexts. The International Journal of Life Cycle Assessment,20(12), 1684–1700, 2015, http://doi.org/10.1007/s11367-015-0984-6.
4. Rockström J, Steffen W, Noone K, Persson Å, Chapin III F. S, Lambin E, Lenton T.M,Scheffer M, Folke C, Schellnhuber H, Nykvist B, De Wit C.A, Hughes T, van der Leeuw S,Rodhe H, Sörlin S, Snyder P.K, Costanza R, Svedin U, Falkenmark M, Karlberg L, Corell R.W, Fabry V.J, Hansen J, Walker B, Liverman D, Richardson K, Crutzen P, Foley J, Planetaryboundaries: exploring the safe operating space for humanity. Ecology and Society 14(2): 32,2009, [online] URL: http://www.ecologyandsociety.org/vol14/iss2/art32/.
5. World leaders adopt Sustainable Development Goals. United Nations DevelopmentProgramme. Retrieved 25 September 2015.
Open Access This chapter is licensed under the terms of the Creative Commons Attribution 4.0International License (http://creativecommons.org/licenses/by/4.0/), which permits use, sharing,adaptation, distribution and reproduction in any medium or format, as long as you give appropriatecredit to the original author(s) and the source, provide a link to the Creative Commons license andindicate if changes were made.The images or other third party material in this chapter are included in the chapter’s Creative
Commons license, unless indicated otherwise in a credit line to the material. If material is notincluded in the chapter’s Creative Commons license and your intended use is not permitted bystatutory regulation or exceeds the permitted use, you will need to obtain permission directly fromthe copyright holder.
412 M. Vargas-Gonzalez

Exploring the Linkages Betweenthe Environmental SustainableDevelopment Goals and PlanetaryBoundaries Using the DPSIR ImpactPathway Framework
Chanjief Chandrakumar and Sarah J. McLaren
Abstract Most of the conventional environmental sustainability assessmentmethods, such as Life Cycle Assessment and environmental footprints, evaluateeconomic goods and services in terms of the nature or the function of the studiedsystems. As such, these methods overlook the variations in the overall magnitude ofproduction and consumption patterns for the examined systems. As a result, theprogress achieved in mitigating global environmental problems is likely to be slowand may be insignificant. Hence this study explores the interlinkages between theSustainable Development Goals (SDGs) and Planetary Boundaries (PBs) using anDPSIR (Drivers-Pressures-State of the Environment-Impacts-Responses) impactpathway framework—in support of developing an absolute sustainability assess-ment method (ASAM). The study demonstrates that there is a substantial overlapbetween the SDGs and PBs. The science-based thresholds listed in the PBs cantherefore be adopted as a complementary set of environmental boundaries for theSDG indicators. Overall, the study lays the foundation for advancing an ASAM thatcan guide policy- and decision-makers to operationalize the SDGs effectively.
1 Introduction
The Planetary Boundaries (PBs) concept was introduced by Rockström and hisassociates [1], and was updated by Steffen et al. [2]. Rockström et al. proposed ninecritical Earth system processes and associated control variables and thresholds,claiming that transgressing any of the thresholds would potentially be devastating
C. Chandrakumar (&)New Zealand Life Cycle Management Centre, School of Agricultureand Environment, Massey University, Palmerston North 4442, New Zealande-mail: [email protected]
S. J. McLarenSchool of Engineering and Advanced Technology, Massey University,Palmerston North 4442, New Zealand
© The Author(s) 2018E. Benetto et al. (eds.), Designing Sustainable Technologies,Products and Policies, https://doi.org/10.1007/978-3-319-66981-6_46
413
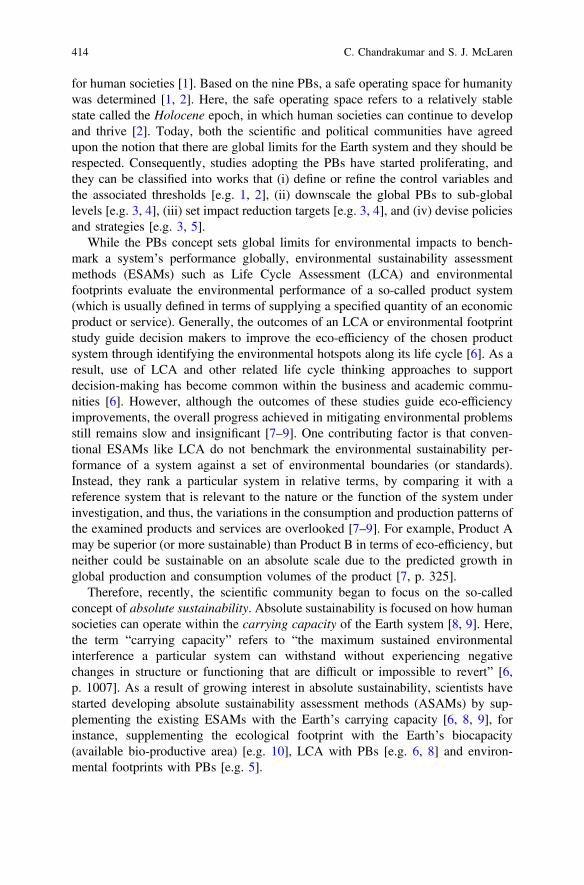
for human societies [1]. Based on the nine PBs, a safe operating space for humanitywas determined [1, 2]. Here, the safe operating space refers to a relatively stablestate called the Holocene epoch, in which human societies can continue to developand thrive [2]. Today, both the scientific and political communities have agreedupon the notion that there are global limits for the Earth system and they should berespected. Consequently, studies adopting the PBs have started proliferating, andthey can be classified into works that (i) define or refine the control variables andthe associated thresholds [e.g. 1, 2], (ii) downscale the global PBs to sub-globallevels [e.g. 3, 4], (iii) set impact reduction targets [e.g. 3, 4], and (iv) devise policiesand strategies [e.g. 3, 5].
While the PBs concept sets global limits for environmental impacts to bench-mark a system’s performance globally, environmental sustainability assessmentmethods (ESAMs) such as Life Cycle Assessment (LCA) and environmentalfootprints evaluate the environmental performance of a so-called product system(which is usually defined in terms of supplying a specified quantity of an economicproduct or service). Generally, the outcomes of an LCA or environmental footprintstudy guide decision makers to improve the eco-efficiency of the chosen productsystem through identifying the environmental hotspots along its life cycle [6]. As aresult, use of LCA and other related life cycle thinking approaches to supportdecision-making has become common within the business and academic commu-nities [6]. However, although the outcomes of these studies guide eco-efficiencyimprovements, the overall progress achieved in mitigating environmental problemsstill remains slow and insignificant [7–9]. One contributing factor is that conven-tional ESAMs like LCA do not benchmark the environmental sustainability per-formance of a system against a set of environmental boundaries (or standards).Instead, they rank a particular system in relative terms, by comparing it with areference system that is relevant to the nature or the function of the system underinvestigation, and thus, the variations in the consumption and production patterns ofthe examined products and services are overlooked [7–9]. For example, Product Amay be superior (or more sustainable) than Product B in terms of eco-efficiency, butneither could be sustainable on an absolute scale due to the predicted growth inglobal production and consumption volumes of the product [7, p. 325].
Therefore, recently, the scientific community began to focus on the so-calledconcept of absolute sustainability. Absolute sustainability is focused on how humansocieties can operate within the carrying capacity of the Earth system [8, 9]. Here,the term “carrying capacity” refers to “the maximum sustained environmentalinterference a particular system can withstand without experiencing negativechanges in structure or functioning that are difficult or impossible to revert” [6,p. 1007]. As a result of growing interest in absolute sustainability, scientists havestarted developing absolute sustainability assessment methods (ASAMs) by sup-plementing the existing ESAMs with the Earth’s carrying capacity [6, 8, 9], forinstance, supplementing the ecological footprint with the Earth’s biocapacity(available bio-productive area) [e.g. 10], LCA with PBs [e.g. 6, 8] and environ-mental footprints with PBs [e.g. 5].
414 C. Chandrakumar and S. J. McLaren
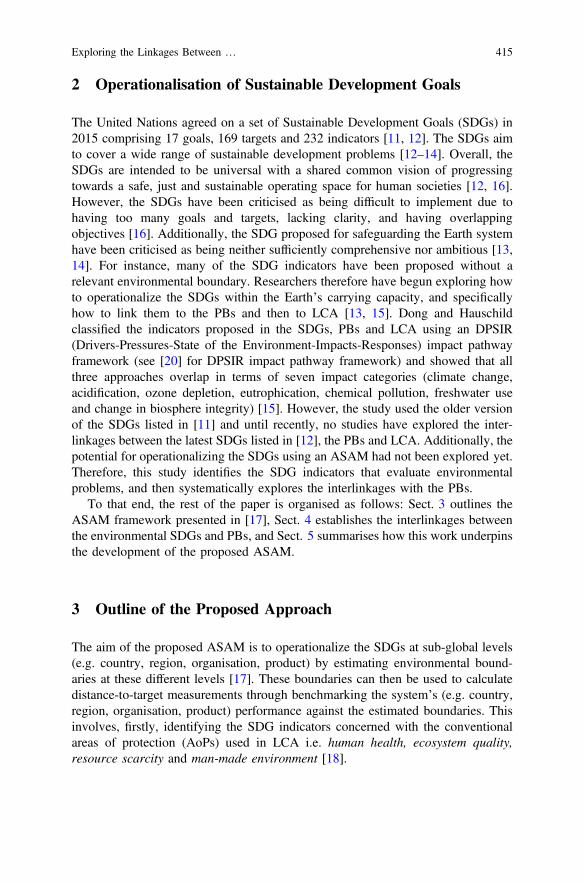
2 Operationalisation of Sustainable Development Goals
The United Nations agreed on a set of Sustainable Development Goals (SDGs) in2015 comprising 17 goals, 169 targets and 232 indicators [11, 12]. The SDGs aimto cover a wide range of sustainable development problems [12–14]. Overall, theSDGs are intended to be universal with a shared common vision of progressingtowards a safe, just and sustainable operating space for human societies [12, 16].However, the SDGs have been criticised as being difficult to implement due tohaving too many goals and targets, lacking clarity, and having overlappingobjectives [16]. Additionally, the SDG proposed for safeguarding the Earth systemhave been criticised as being neither sufficiently comprehensive nor ambitious [13,14]. For instance, many of the SDG indicators have been proposed without arelevant environmental boundary. Researchers therefore have begun exploring howto operationalize the SDGs within the Earth’s carrying capacity, and specificallyhow to link them to the PBs and then to LCA [13, 15]. Dong and Hauschildclassified the indicators proposed in the SDGs, PBs and LCA using an DPSIR(Drivers-Pressures-State of the Environment-Impacts-Responses) impact pathwayframework (see [20] for DPSIR impact pathway framework) and showed that allthree approaches overlap in terms of seven impact categories (climate change,acidification, ozone depletion, eutrophication, chemical pollution, freshwater useand change in biosphere integrity) [15]. However, the study used the older versionof the SDGs listed in [11] and until recently, no studies have explored the inter-linkages between the latest SDGs listed in [12], the PBs and LCA. Additionally, thepotential for operationalizing the SDGs using an ASAM had not been explored yet.Therefore, this study identifies the SDG indicators that evaluate environmentalproblems, and then systematically explores the interlinkages with the PBs.
To that end, the rest of the paper is organised as follows: Sect. 3 outlines theASAM framework presented in [17], Sect. 4 establishes the interlinkages betweenthe environmental SDGs and PBs, and Sect. 5 summarises how this work underpinsthe development of the proposed ASAM.
3 Outline of the Proposed Approach
The aim of the proposed ASAM is to operationalize the SDGs at sub-global levels(e.g. country, region, organisation, product) by estimating environmental bound-aries at these different levels [17]. These boundaries can then be used to calculatedistance-to-target measurements through benchmarking the system’s (e.g. country,region, organisation, product) performance against the estimated boundaries. Thisinvolves, firstly, identifying the SDG indicators concerned with the conventionalareas of protection (AoPs) used in LCA i.e. human health, ecosystem quality,resource scarcity and man-made environment [18].
Exploring the Linkages Between … 415

According to [6, 19], many of the PB control variables differ from the indicatorsof the conventional ESAMs (including LCA), particularly with respect to the pointof impact assessment although these indicators evaluate similar kinds of environ-mental impacts to those reported in the PBs. Hence, the chosen SDG indicators andthe PB control variables are further classified into driver, pressure, state, impact andresponse indicators using an DPSIR impact pathway framework. Having classifiedthem, the interlinkages between the SDGs and PBs are explored. This enablessubsequent development of a complementary set of global boundaries for the SDGindicators using, where appropriate, the thresholds proposed for the control vari-ables in the PBs. Afterwards, the global boundaries can be allocated to lowereconomic levels using a top-down approach. The method is operationalised bydeveloping distance-to-target measurements based on the calculated environmentalboundaries compared with the current environmental performance of the systemsunder analysis (calculated using conventional ESAMs like LCA and environmentalfootprint studies). These distance-to-target measurements could be positive ornegative depending on whether the system is performing in line with the goals andtargets reported under the SDGs.
4 Linkages Between the SDGs and PBs
This section details how the PBs can be employed as a complementary set of globalboundaries for the SDGs by providing a systematic comparison between the SDGindicators and the PB control variables. Firstly, the SDG indicators concerned withthe AoPs of human health, ecosystem quality, resource scarcity and man-madeenvironment were chosen (a total of 73 indicators). This set of SDG indicatorscomprised all the SDG indicators under the SDGs for clean water and sanitation(SDG 6), responsible consumption and production (SDG 12), climate action (SDG13), life below water (SDG 14) and life on land (SDG 15), plus CO2 emission perunit of value added (SDG Indicator 9.4.1), economic loss due to natural disasters(SDG Indicator 1.5.2), levels of fine particulate matter in cities (SDG Indicator11.6.2), and proportion of land for sustainable agriculture (SDG Indicator 2.4.1).Then, as outlined in Sect. 3, the chosen SDG indicators were mapped onto anetwork of cause-effect chains (developed based on the environmental problemsaddressed in the SDGs and PBs) along with the PB control variables and linkedtogether wherever relevant (see Fig. 1). This mapping step further classified theSDG indicators into driver (0 SDG indicators), pressure (2 SDG indicators), state(19 SDG indicators), impact (14 SDG indicators) and response (38 SDG indicators)indicator categories.
As emphasised in [1, 2], human societies should be operating within thethresholds reported in the PBs. Therefore, this section focuses on the PBs anddiscusses how each PB (shown in bold text) is related to different SDGs. Steffenet al. introduced a PB called “freshwater use” and two control variables to evaluatethe challenges resulting from absolute water withdrawals [2]. The proposed control
416 C. Chandrakumar and S. J. McLaren
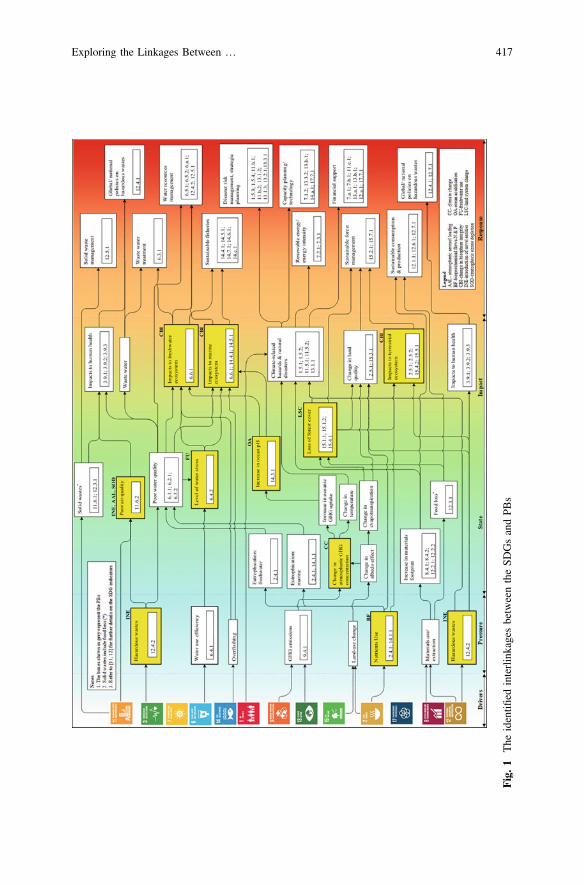
Fig.1
The
identifi
edinterlinkagesbetweentheSD
GsandPB
s
Exploring the Linkages Between … 417
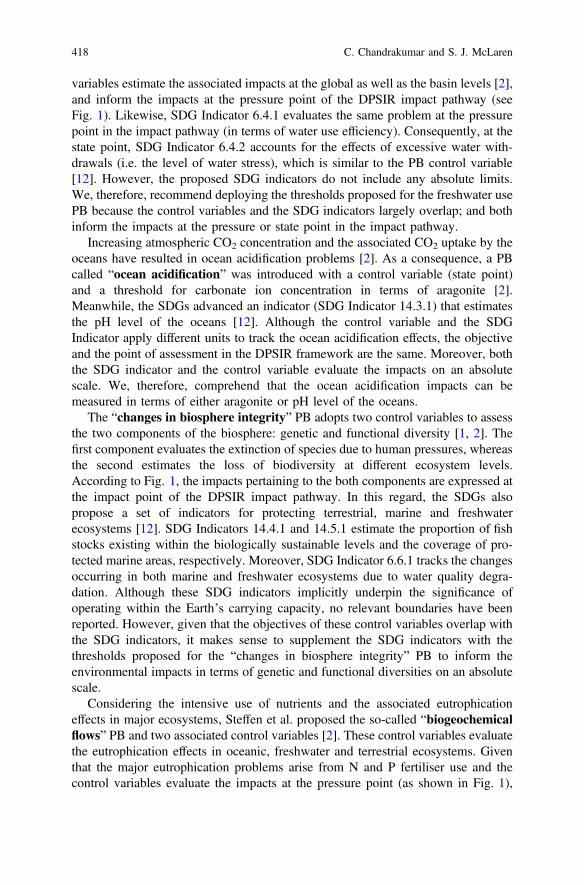
variables estimate the associated impacts at the global as well as the basin levels [2],and inform the impacts at the pressure point of the DPSIR impact pathway (seeFig. 1). Likewise, SDG Indicator 6.4.1 evaluates the same problem at the pressurepoint in the impact pathway (in terms of water use efficiency). Consequently, at thestate point, SDG Indicator 6.4.2 accounts for the effects of excessive water with-drawals (i.e. the level of water stress), which is similar to the PB control variable[12]. However, the proposed SDG indicators do not include any absolute limits.We, therefore, recommend deploying the thresholds proposed for the freshwater usePB because the control variables and the SDG indicators largely overlap; and bothinform the impacts at the pressure or state point in the impact pathway.
Increasing atmospheric CO2 concentration and the associated CO2 uptake by theoceans have resulted in ocean acidification problems [2]. As a consequence, a PBcalled “ocean acidification” was introduced with a control variable (state point)and a threshold for carbonate ion concentration in terms of aragonite [2].Meanwhile, the SDGs advanced an indicator (SDG Indicator 14.3.1) that estimatesthe pH level of the oceans [12]. Although the control variable and the SDGIndicator apply different units to track the ocean acidification effects, the objectiveand the point of assessment in the DPSIR framework are the same. Moreover, boththe SDG indicator and the control variable evaluate the impacts on an absolutescale. We, therefore, comprehend that the ocean acidification impacts can bemeasured in terms of either aragonite or pH level of the oceans.
The “changes in biosphere integrity” PB adopts two control variables to assessthe two components of the biosphere: genetic and functional diversity [1, 2]. Thefirst component evaluates the extinction of species due to human pressures, whereasthe second estimates the loss of biodiversity at different ecosystem levels.According to Fig. 1, the impacts pertaining to the both components are expressed atthe impact point of the DPSIR impact pathway. In this regard, the SDGs alsopropose a set of indicators for protecting terrestrial, marine and freshwaterecosystems [12]. SDG Indicators 14.4.1 and 14.5.1 estimate the proportion of fishstocks existing within the biologically sustainable levels and the coverage of pro-tected marine areas, respectively. Moreover, SDG Indicator 6.6.1 tracks the changesoccurring in both marine and freshwater ecosystems due to water quality degra-dation. Although these SDG indicators implicitly underpin the significance ofoperating within the Earth’s carrying capacity, no relevant boundaries have beenreported. However, given that the objectives of these control variables overlap withthe SDG indicators, it makes sense to supplement the SDG indicators with thethresholds proposed for the “changes in biosphere integrity” PB to inform theenvironmental impacts in terms of genetic and functional diversities on an absolutescale.
Considering the intensive use of nutrients and the associated eutrophicationeffects in major ecosystems, Steffen et al. proposed the so-called “biogeochemicalflows” PB and two associated control variables [2]. These control variables evaluatethe eutrophication effects in oceanic, freshwater and terrestrial ecosystems. Giventhat the major eutrophication problems arise from N and P fertiliser use and thecontrol variables evaluate the impacts at the pressure point (as shown in Fig. 1),
418 C. Chandrakumar and S. J. McLaren
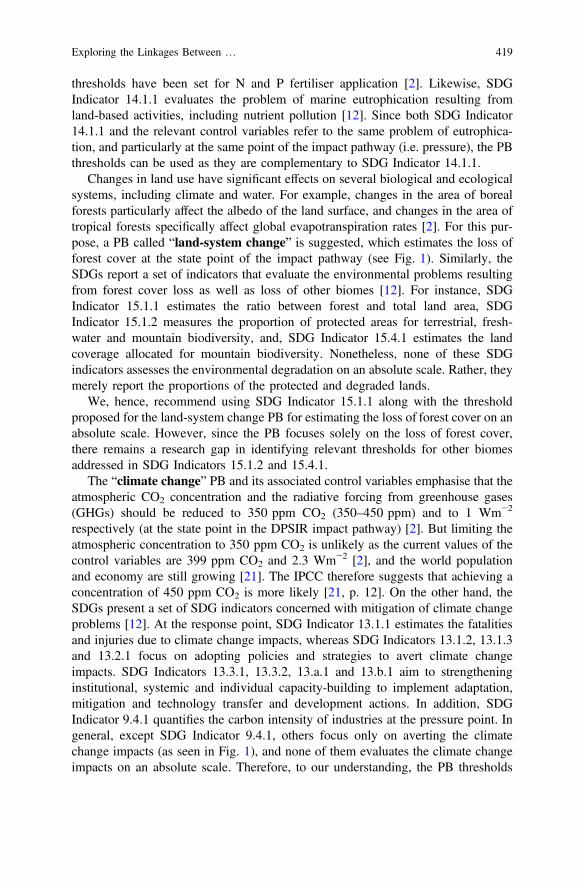
thresholds have been set for N and P fertiliser application [2]. Likewise, SDGIndicator 14.1.1 evaluates the problem of marine eutrophication resulting fromland-based activities, including nutrient pollution [12]. Since both SDG Indicator14.1.1 and the relevant control variables refer to the same problem of eutrophica-tion, and particularly at the same point of the impact pathway (i.e. pressure), the PBthresholds can be used as they are complementary to SDG Indicator 14.1.1.
Changes in land use have significant effects on several biological and ecologicalsystems, including climate and water. For example, changes in the area of borealforests particularly affect the albedo of the land surface, and changes in the area oftropical forests specifically affect global evapotranspiration rates [2]. For this pur-pose, a PB called “land-system change” is suggested, which estimates the loss offorest cover at the state point of the impact pathway (see Fig. 1). Similarly, theSDGs report a set of indicators that evaluate the environmental problems resultingfrom forest cover loss as well as loss of other biomes [12]. For instance, SDGIndicator 15.1.1 estimates the ratio between forest and total land area, SDGIndicator 15.1.2 measures the proportion of protected areas for terrestrial, fresh-water and mountain biodiversity, and, SDG Indicator 15.4.1 estimates the landcoverage allocated for mountain biodiversity. Nonetheless, none of these SDGindicators assesses the environmental degradation on an absolute scale. Rather, theymerely report the proportions of the protected and degraded lands.
We, hence, recommend using SDG Indicator 15.1.1 along with the thresholdproposed for the land-system change PB for estimating the loss of forest cover on anabsolute scale. However, since the PB focuses solely on the loss of forest cover,there remains a research gap in identifying relevant thresholds for other biomesaddressed in SDG Indicators 15.1.2 and 15.4.1.
The “climate change” PB and its associated control variables emphasise that theatmospheric CO2 concentration and the radiative forcing from greenhouse gases(GHGs) should be reduced to 350 ppm CO2 (350–450 ppm) and to 1 Wm−2
respectively (at the state point in the DPSIR impact pathway) [2]. But limiting theatmospheric concentration to 350 ppm CO2 is unlikely as the current values of thecontrol variables are 399 ppm CO2 and 2.3 Wm−2 [2], and the world populationand economy are still growing [21]. The IPCC therefore suggests that achieving aconcentration of 450 ppm CO2 is more likely [21, p. 12]. On the other hand, theSDGs present a set of SDG indicators concerned with mitigation of climate changeproblems [12]. At the response point, SDG Indicator 13.1.1 estimates the fatalitiesand injuries due to climate change impacts, whereas SDG Indicators 13.1.2, 13.1.3and 13.2.1 focus on adopting policies and strategies to avert climate changeimpacts. SDG Indicators 13.3.1, 13.3.2, 13.a.1 and 13.b.1 aim to strengtheninginstitutional, systemic and individual capacity-building to implement adaptation,mitigation and technology transfer and development actions. In addition, SDGIndicator 9.4.1 quantifies the carbon intensity of industries at the pressure point. Ingeneral, except SDG Indicator 9.4.1, others focus only on averting the climatechange impacts (as seen in Fig. 1), and none of them evaluates the climate changeimpacts on an absolute scale. Therefore, to our understanding, the PB thresholds
Exploring the Linkages Between … 419

(and the corresponding global carbon budget) can be used as a set of globalboundaries for SDG Indicator 9.4.1.
The “atmospheric aerosol loading” PB evaluates the impact resulting from theemissions of black and organic carbon from sources like cooking and heating withbiofuels and diesel transportation, whereas the “introduction of novel entities” PBrefers to the persistence, mobility and impacts of chemicals and other types ofengineered materials or organisms produced by human activities [2]. Similarly, the“stratospheric ozone depletion” PB concentrates on the ozone concentrationvariations resulting due to synthetic chemicals release [2]. Interestingly, the asso-ciated control variables of these three PBs express the impacts at the state point ofthe DPSIR impact pathway. As far as we understand, some of the SDG indicatorsevaluate similar environmental impacts, but not explicitly. SDG Indicator 11.6.2monitors the levels of fine particulate matter in cities at the state point (with a focuson human health), whereas SDG Indicators 11.6.1 and 12.4.2 quantify the solid andhazardous waste generated (pressure point). SDG Indicator 12.4.2 also quantifiesthe amount of hazardous waste treated (response point) and SDG Indicators 12.4.1and 12.7.1 focus on the global initiatives taken to develop multinational agreementsand policies on hazardous waste and other chemicals (response point). Althoughthere are some overlaps between the above-listed three PBs and the SDG indicators,it would not be advisable to use them in a complementary way for the followingreasons: (i) existence of an enormous number of hazardous substances (includingchemicals); (ii) no SDG indicators directly assess the effects of ozone depletion;(iii) no control variables and thresholds have been proposed for the “introduction ofnovel entities” PB; (iv) the effects of some substances are still unknown, and someeffects are not readily reversible; and (v) the PBs are located closer to the originalactivities that cause the environmental impacts, whereas the SDGs focus on wastemanagement, and are generally located at the response point [2]. Further research istherefore needed to understand better the complementarities between these PBs andthe SDGs.
In sum, the environmental SDG indicators mostly address the environmentalproblems reported in the PBs, which are primarily associated with the ecosystemquality AoP. However, in contrast to the PBs, the SDGs additionally concentrate onthe AoPs human health, resource scarcity and man-made environment throughaddressing the global challenges of unsustainable food and agriculture, soil qualitydegradation, impacts of ecosystem degradation on human health, direct humanimpacts on ecosystem (wildlife trafficking and poaching, and overfishing) and lackof infrastructure for water quality and resources management by communities [12].Regarding unsustainable food and agriculture, SDG Indicator 2.5.1 estimates thenumber of plant and genetic resources secured for sustainable food and agriculture,whereas SDG Indicator 2.5.2 estimates the local breeds under risk of extinction.Likewise, SDG Indicator 2.4.1 evaluates the soil quality degradation. Nevertheless,these SDG indicators are suboptimal because they use a relative scale, and lackclarity; for instance, SDG Target 2.4 (which includes SDG Indicator 2.4.1) focuseson multiple environmental problems, including climate change and soil qualitydegradation [12, 14].
420 C. Chandrakumar and S. J. McLaren

On the other hand, a set of SDG indicators has been reported to evaluate theimpacts of degradation of ecosystems on human health. SDG Indicators 3.9.1,3.9.2, 6.3.1 and 6.3.2 evaluate the human health problems resulting due to ambientair pollution, unsafe water, sanitation and hygiene, whereas SDG Indicator 3.9.3assesses the health problems resulting from unintentional poisoning [12].Additionally, SDG Indicators 2.4.1, 2.5.1 and 2.5.2 explicitly refer to the impactson human health as a consequence of unsustainable food production and agricul-tural practices. Likewise, SDG Indicators 15.7.1 and 15.c.1 estimate the impacts ofwildlife trafficking and poaching, whereas SDG Indicators 14.4.1 and 14.5.1addresses the impacts associated with overfishing. Regarding lack of infrastructurefor water quality and resources management by communities, SDG Indicators 6.1.1,6.2.1 and 6.a.1 concentrate on developing infrastructure for effective waterresources management [e.g. 12, 16].
5 Conclusions
The study underpins the development of an ASAM framework by systematicallyexploring the interlinkages between the SDGs and PBs using an DPSIR impactpathway framework. With to the analysis presented in Sect. 4, the two approachesdemonstrate notable overlaps with regard to their indicators and control variables.Each of the PBs is linked to one (or more) SDG indicator(s), as shown in Fig. 1. Inparticular, the “freshwater use”, “ocean acidification”, “biogeochemical flows”,“land system change” and “change in biosphere integrity” PBs exhibit soundlinkages with the SDG indicators. Interestingly, some of the control variables ofthese five PBs are located at the same point of the DPSIR impact pathway as theSDG indicators. But, in contrast, the “climate change” PB control variable islocated at the state point of the impact pathway, whereas the SDG indicatorsassociated with climate change are mostly located at the response point, exceptSDG Indicator 9.4.1, which estimates the carbon intensity of industries at thepressure point. Moreover, no SDG indicators report an absolute limit for GHGemissions. The “introduction of novel entities” and “atmospheric aerosol load-ing” PBs show some overlaps with SDG Indicators 11.6.1, 11.6.2 and 12.4.2,whereas no explicit linkages are found between the “stratospheric ozone deple-tion” PB and the SDG Indicators. Furthermore, as discussed in Sect. 4, the SDGsadditionally shed light on some other global challenges not explicitly addressed inthe PBs such as unsustainable food and agriculture, soil quality degradation,impacts of ecosystem degradation on human health, direct human impacts onecosystem (wildlife trafficking and poaching, and overfishing), and lack of infras-tructure for water quality and resources management by communities.
Overall, according to this study, it seems potentially feasible to adopt thescience-based thresholds reported in the PBs as a complementary set of globalboundaries for the SDG indicators. Moreover, advancing appropriate environmentalboundaries for the additional challenges addressed in the SDGs, and using them
Exploring the Linkages Between … 421
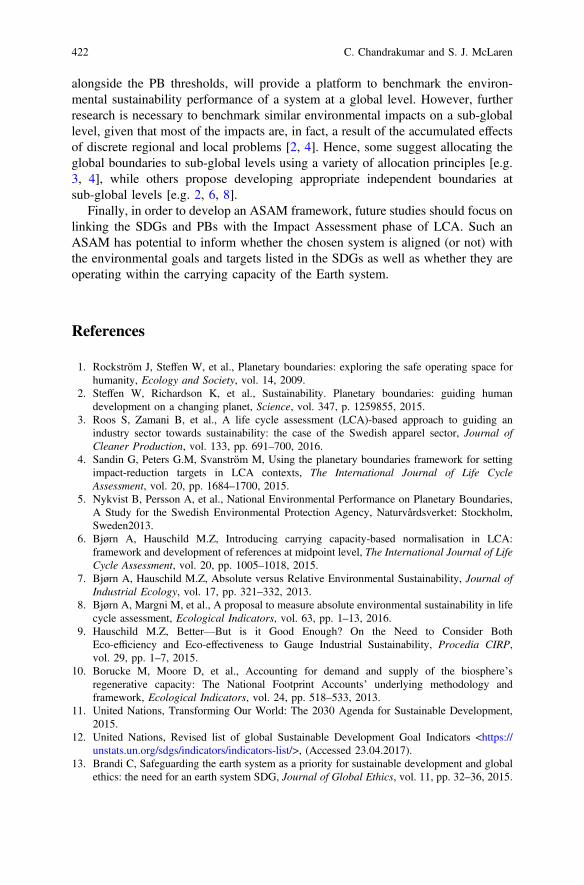
alongside the PB thresholds, will provide a platform to benchmark the environ-mental sustainability performance of a system at a global level. However, furtherresearch is necessary to benchmark similar environmental impacts on a sub-globallevel, given that most of the impacts are, in fact, a result of the accumulated effectsof discrete regional and local problems [2, 4]. Hence, some suggest allocating theglobal boundaries to sub-global levels using a variety of allocation principles [e.g.3, 4], while others propose developing appropriate independent boundaries atsub-global levels [e.g. 2, 6, 8].
Finally, in order to develop an ASAM framework, future studies should focus onlinking the SDGs and PBs with the Impact Assessment phase of LCA. Such anASAM has potential to inform whether the chosen system is aligned (or not) withthe environmental goals and targets listed in the SDGs as well as whether they areoperating within the carrying capacity of the Earth system.
References
1. Rockström J, Steffen W, et al., Planetary boundaries: exploring the safe operating space forhumanity, Ecology and Society, vol. 14, 2009.
2. Steffen W, Richardson K, et al., Sustainability. Planetary boundaries: guiding humandevelopment on a changing planet, Science, vol. 347, p. 1259855, 2015.
3. Roos S, Zamani B, et al., A life cycle assessment (LCA)-based approach to guiding anindustry sector towards sustainability: the case of the Swedish apparel sector, Journal ofCleaner Production, vol. 133, pp. 691–700, 2016.
4. Sandin G, Peters G.M, Svanström M, Using the planetary boundaries framework for settingimpact-reduction targets in LCA contexts, The International Journal of Life CycleAssessment, vol. 20, pp. 1684–1700, 2015.
5. Nykvist B, Persson A, et al., National Environmental Performance on Planetary Boundaries,A Study for the Swedish Environmental Protection Agency, Naturvårdsverket: Stockholm,Sweden2013.
6. Bjørn A, Hauschild M.Z, Introducing carrying capacity-based normalisation in LCA:framework and development of references at midpoint level, The International Journal of LifeCycle Assessment, vol. 20, pp. 1005–1018, 2015.
7. Bjørn A, Hauschild M.Z, Absolute versus Relative Environmental Sustainability, Journal ofIndustrial Ecology, vol. 17, pp. 321–332, 2013.
8. Bjørn A, Margni M, et al., A proposal to measure absolute environmental sustainability in lifecycle assessment, Ecological Indicators, vol. 63, pp. 1–13, 2016.
9. Hauschild M.Z, Better—But is it Good Enough? On the Need to Consider BothEco-efficiency and Eco-effectiveness to Gauge Industrial Sustainability, Procedia CIRP,vol. 29, pp. 1–7, 2015.
10. Borucke M, Moore D, et al., Accounting for demand and supply of the biosphere’sregenerative capacity: The National Footprint Accounts’ underlying methodology andframework, Ecological Indicators, vol. 24, pp. 518–533, 2013.
11. United Nations, Transforming Our World: The 2030 Agenda for Sustainable Development,2015.
12. United Nations, Revised list of global Sustainable Development Goal Indicators <https://unstats.un.org/sdgs/indicators/indicators-list/>, (Accessed 23.04.2017).
13. Brandi C, Safeguarding the earth system as a priority for sustainable development and globalethics: the need for an earth system SDG, Journal of Global Ethics, vol. 11, pp. 32–36, 2015.
422 C. Chandrakumar and S. J. McLaren
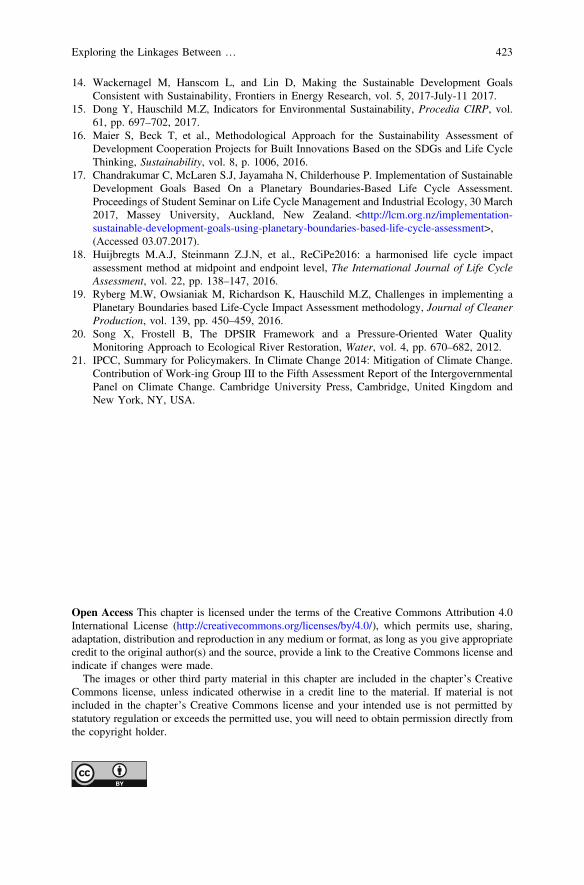
14. Wackernagel M, Hanscom L, and Lin D, Making the Sustainable Development GoalsConsistent with Sustainability, Frontiers in Energy Research, vol. 5, 2017-July-11 2017.
15. Dong Y, Hauschild M.Z, Indicators for Environmental Sustainability, Procedia CIRP, vol.61, pp. 697–702, 2017.
16. Maier S, Beck T, et al., Methodological Approach for the Sustainability Assessment ofDevelopment Cooperation Projects for Built Innovations Based on the SDGs and Life CycleThinking, Sustainability, vol. 8, p. 1006, 2016.
17. Chandrakumar C, McLaren S.J, Jayamaha N, Childerhouse P. Implementation of SustainableDevelopment Goals Based On a Planetary Boundaries-Based Life Cycle Assessment.Proceedings of Student Seminar on Life Cycle Management and Industrial Ecology, 30 March2017, Massey University, Auckland, New Zealand. <http://lcm.org.nz/implementation-sustainable-development-goals-using-planetary-boundaries-based-life-cycle-assessment>,(Accessed 03.07.2017).
18. Huijbregts M.A.J, Steinmann Z.J.N, et al., ReCiPe2016: a harmonised life cycle impactassessment method at midpoint and endpoint level, The International Journal of Life CycleAssessment, vol. 22, pp. 138–147, 2016.
19. Ryberg M.W, Owsianiak M, Richardson K, Hauschild M.Z, Challenges in implementing aPlanetary Boundaries based Life-Cycle Impact Assessment methodology, Journal of CleanerProduction, vol. 139, pp. 450–459, 2016.
20. Song X, Frostell B, The DPSIR Framework and a Pressure-Oriented Water QualityMonitoring Approach to Ecological River Restoration, Water, vol. 4, pp. 670–682, 2012.
21. IPCC, Summary for Policymakers. In Climate Change 2014: Mitigation of Climate Change.Contribution of Work-ing Group III to the Fifth Assessment Report of the IntergovernmentalPanel on Climate Change. Cambridge University Press, Cambridge, United Kingdom andNew York, NY, USA.
Open Access This chapter is licensed under the terms of the Creative Commons Attribution 4.0International License (http://creativecommons.org/licenses/by/4.0/), which permits use, sharing,adaptation, distribution and reproduction in any medium or format, as long as you give appropriatecredit to the original author(s) and the source, provide a link to the Creative Commons license andindicate if changes were made.The images or other third party material in this chapter are included in the chapter’s Creative
Commons license, unless indicated otherwise in a credit line to the material. If material is notincluded in the chapter’s Creative Commons license and your intended use is not permitted bystatutory regulation or exceeds the permitted use, you will need to obtain permission directly fromthe copyright holder.
Exploring the Linkages Between … 423

Part IVHow to Develop and Sustain LCM-Based
Innovations

Financing Innovation and CircularEconomy
L. Goovaerts, C. Schempp, L. Busato, A. Smits, L. Žutelijaand R. Piechocki
Abstract In the seminar on “Financing Innovation and the Circular Economy(CE)”, organized by the European Investment Bank (EIB) in the context of the LifeCycle Management Conference 2017, experts of the EIB and EIB partner institu-tions (European Commission, Rabobank) spoke about the specific challengesinvolved in the transition to a CE and the role played by their institutions inaccelerating this transition by means of appropriate funding, financing and advisoryinstruments. In short presentations, the speakers first explained the broader role ofthe EIB and the European Commission (EC) in supporting the transition to CE, aswell as the general types of CE projects and the specific questions that projectpromoters can expect in project appraisal. EC, EIB and Rabobank representativesalso presented the concrete support and products offered to innovative circulareconomy project promoters.
1 Introduction
In view of the world’s limited resources and the predicted demographic develop-ments, the currently prevailing linear economic model appears to be unsustainablefrom both economic and environmental points of view. The answer lies in transitionto the CE business model, which requires nothing less than an economic paradigmshift and a radical change in the mind-set of policy-makers, businesses, consumersand financiers towards more life-cycle thinking. CE, as defined by the EIB and theEC, “attempts to encompass all economic systems where the resources used for aproduct or a service are maximally reduced and/or recycled, while either main-
L. Goovaerts � C. Schempp (&) � L. Busato � A. SmitsEuropean Investment Bank, Luxembourg City, Luxembourge-mail: [email protected]
L. ŽutelijaEuropean Commission, Brussels, Belgium
R. PiechockiRabobank, Utrecht, The Netherlands
© The Author(s) 2018E. Benetto et al. (eds.), Designing Sustainable Technologies,Products and Policies, https://doi.org/10.1007/978-3-319-66981-6_47
427
taining to the best extent possible their economic value at all times and/or ensuringthat they are biologically degraded. CE-related projects focus on re-thinking andredesigning products, processes, value chains, business and service models in orderto achieve the above-specified purpose” [1].
The circular economy can be seen as a green giant on the rise, on account of itsenormous potential to unleash sustainable growth and job creation as well as theincreasing traction it is gaining in the business world. Many businesses in differentsectors have already started to tap into this potential, displaying a large variety ofinnovative technologies and business models. However, the transition to a CE is nocertain success and needs to tackle a number of hurdles. Ensuring access to financefor innovative circular businesses, throughout their different growth phases, is oneof them.
2 Challenges and Opportunities in Financing CE Projects
Besides its environmental benefits, the circular economy offers tremendous eco-nomic potential, which businesses in different sectors have started tapping into,displaying a large variety of innovative technologies and business models.However, CE projects present a number of different challenges to accessreturn-based finance. On the one hand, the new technologies and business modelsproposed are often unproven and complex, rely on uncertain supply chains andoperate in uncertain markets. Furthermore, CE projects usually involve smallsub-investment grade promoters, with limited collateral or few physical assets.Because of the increased market and credit risks involved, the CE promoters oftenhave limited access-to-finance or face increased cost of capital. A study publishedin 2015 by the Innovation Finance Advisory unit of the EIB on access-to-financeconditions of projects supporting CE concluded that while market forces (com-modity price fluctuations) alone could create a circular economy there is a risk of aslow transition and high opportunity costs [1]. Hence, there is space (and need) forpolicy intervention and support in form of innovative funding and financinginstruments.
3 Financing of Innovation and Circular Economyin Practice
3.1 The EIB in the Circular Economy
Mr. Schempp explained the crucial role of the EIB, as the EU Bank, in bridgingfinancing gaps and catalysing strategic investments in key EU policy areas such asCE, not only through tailored financial instruments but also through specialized
428 L. Goovaerts et al.

advisory services. With the EC’s support, the EIB has reinforced the technical andfinancial advisory services available to projects through the European InvestmentAdvisory Hub (EIAH) and the Innovation Finance Advisory unit. As furtherexplained by Ms. Busato, given the unique combination of risk features, the EIBprovides advice to CE project promoters on structuring and financing to improvethe bankability of their projects.
CE projects are generally eligible for EIB financing as these are well alignedwith one or more of the bank’s central policy objectives including the support ofenvironmental protection and resource efficiency, research and innovation and SMEfinancing. In the last 5 years, the EIB lent around 2.4 billion to CE projects indiverse sectors including typical infrastructure sectors such as water and wastemanagement, as well as in the agribusiness and bio-economy and industry andservices sectors.
3.2 The European Commission’s Perspective: FromFunding to Financing
The representative of the European Commission provided an overview of EU’sgeneral policy and available funding sources from the Horizon 2020 and LIFEprogrammes as well as from the European Structural and Investment Funds (ESIF).These programmes are designed to attract funding from other public or privateinvestors in key EU priority areas including CE. Non-reimbursable EU funding inthe form of grants will continue to play a role in reducing the overall cost and risk,and help boost the credit rating of innovative projects that otherwise would not haveseen the light of day. Simultaneously, the EC is increasingly promoting the inte-gration of available EU funds with financial instruments and products such as loans,guarantees, equity and other risk-bearing mechanisms, as a means of enhancing thescope and leveraging the impact of the EU budget.
In this regard the EC representative mentioned the combined efforts of the ECand the EIB Group in setting up such financial instruments and risk-bearingmechanisms.
3.3 Joint Initiatives of the EIB and the EuropeanCommission in Support of CE
With the backing of EU guarantees granted to the European Fund for StrategicInvestment (EFSI) and the “EU Finance for Innovators” (InnovFin) Programme, theEIB is being enabled to take on more risk and help more CE projects with mediumto high risk profiles get off the ground.
Financing Innovation and Circular … 429
EFSI is one of the three pillars of the Investment Plan for Europe introduced in2015 and aims to help to finance strategic investments in key areas with relevancefor the CE such as infrastructure, research and innovation, renewable energy andenergy efficiency as well as risk finance for small and medium-sized enterprises(SMEs) [2].
InnovFin is available since 2014 and consists of a range of tailored products—from guarantees for intermediaries that lend to SMEs to direct loans to enterprises—helping support the smallest to the largest R&I projects in the EU and countriesassociated to Horizon 2020 [3]. Following the recommendation of the EIB study onaccess-to-finance conditions for projects in CE, the EC and EIB amended theInnovFin Programme to include business model innovation (not only technologyinnovation) as an eligibility criterion [4]. Further, InnovFin also has dedicatedfinancing instruments in key areas relevant to CE. This is the case of the EnergyDemonstration Projects facility and the Circular Bio-economy investment platform.
A third example of a successful EIB—EC collaboration with relevance for theCE is the programme for the Competitiveness of Enterprises and Small andMedium-sized Enterprises (COSME), managed by the European Investment Fund(EIF). The programme aims to improve access to finance for SMEs through twofinancial instruments that have been available since August 2014: Loan GuaranteeFacility and Equity Facility for Growth [5].
Finally, the European Commission has partnered with the EIB to launch theCircular Economy Finance Support Platform. The platform aims to “enhance thelink between existing instruments, such as the European Fund for StrategicInvestments and the InnovFin—EU Finance for Innovators initiative backed byHorizon 2020, and potentially develop new financial instruments for circulareconomy projects.” The platform is based on three pillars: the first pillar will ensurecoordination and awareness raising by providing support to the Circular EconomyFinancing Expert Group. The second pillar will focus on advisory services. Thethird pillar will assess the possibility and the need for new dedicated financialinstruments for circular economy projects [6].
3.4 Practical Issues for Financing CE Projects
As explained by Mrs. Goovaerts and Mr. Piechocki, CE specialists of EIB andRabobank, their institutions only finance sound and sustainable CE projects.A sound circular project optimises the use and life of assets and products, closesmaterial loops to maintain or recover their economic value at end-of-life, and usessustainably sourced secondary raw materials, renewable or regenerative resources.Secondly, a sound circular project is expected to be a part of the long term strategyof the company and integrated in the business operation and its environment,including a well-established cooperation with reliable partners within the valuechain. Moreover, a sound circular business model shows clearly identifiabledemand for circular products, materials or services resulting in reliable and
430 L. Goovaerts et al.
sufficient cash-flows to support the repayment of the loan. At last, a sound circularproject is run by a competent, experienced promoter able to successfully implementa challenging CE project.
As explained by Mr. Smits, EIB loan officer, the EIB can either lend directly toindividual borrowers/projects or, in the case of smaller borrowers/projects, throughfinancial intermediaries. Direct financing is typically made available in the form ofsenior or subordinated loans for larger projects. The EIB can provide directfinancing where the project investment cost is of a minimum of EUR 15 m. In suchcases, the EIB carries its own due diligence of the borrower and the project. In allcases the EIB finances a maximum 50% of the project investment cost.
In the case of smaller projects or promoters (SMEs and MidCaps), the EIBprovides intermediated financing via local banks, investment platforms and funds inthe form of loans or guarantees. For instance, the EIB has provided several creditlines to its Dutch partner bank Rabobank, which the bank on-lends to ‘eligible’SMEs and Mid-Caps at a reduced interest rate. A recent example is the RabobankImpact Loan for SMEs and MidCaps III with a total credit line of EUR 200 m. Theimpact loan includes circular businesses as ‘eligible’ borrowers. In case of inter-mediated financing, the EIB establishes the eligibility criteria for projects andpromoters to be financed, while the due diligence of the final borrower/project is theresponsibility of the intermediary financing institution.
4 Q&A and Future Perspectives
The workshop concluded with a Q&A session. The opening question enquired towhat extent the banking sector considers companies’ environmental risk profile. Asexplained by Ms. Goovaerts, EIB specialist on innovative industries, environmentaland social impact is always taken into consideration, and compliance with relevantEU legislation is verified. An adjustment of risk assessment methodologies toreflect the unique character of CE projects is something the EIB is currently lookinginto. In a similar vein, Mr. Piechocki, sustainable business specialist at Rabobank,confirmed that supply chain policies and sustainability risk are always assessed. Thebank also assists the clients in finding solutions, in case a risk has been identified.
The next question was directed towards the European Commission representa-tive. Ms. Žutelija, CE policy officer, was asked about the future perspective todevelop a set of environmental indicators harmonised at EU level to provideenvironmental profile of a company including its supply chain. Ms. Žutelijareconfirmed that a harmonised approach at EU level is needed and pointed out thatthe EC continues working to set up a harmonised system. In this context, the EC iscurrently finalising the pilot phase of the Product and Organisation EnvironmentalFootprint life-cycle based methodology (PEF and OEF), and is considering futurepolicy options related to measuring the environmental performance of products andorganisations throughout their lifecycle.
Financing Innovation and Circular … 431
Another participant enquired which gaps in CE financing should be addressed inthe future. Mr. Schempp, EIB specialist on CE, replied that in the past the EIB hasbuilt up a long track record in financing traditional recycling and resource efficiencyprojects. In the last few years, the bank has increased its risk taking capacitythrough the establishment of the EFSI and InnovFin programmes and is thus in abetter position to provide financing to more innovative circular economy projectsand business models. While the financing risk may be increased, such projects areexpected to deliver higher economic and environmental benefits. Ms. Busato, EIBInnovation Finance Advisor, pointed out that as long as providers of return basedfinance and credit rating assessment institutions fail to account for the additionalrisk associated with the linear economy projects, there will be a gap in method-ologies for assessment. The next step is establishing standard methodologies cal-culating economic return based on a balanced approach to linear and circular risks.
References
1. European Investment Bank Advisory Services, Access-to-finance conditions for Projectssupporting Circular Economy, Report, Luxembourg 2015
2. <http://ec.europa.eu/growth/industry/innovation/funding/efsi_en> (Accessed 12.10.2017)3. <https://ec.europa.eu/programmes/horizon2020/en/news/innovfin-%E2%80%93-eu-finance-
innovators-new-financial-instruments-help-innovative-firms-access-finance> (Accessed 12.10.2017)
4. <http://www.eib.org/infocentre/press/releases/all/2015/2015-299-eu-opens-up-eur24bn-of-existing-finance-to-circular-economy-businesses-in-support-of-eu-climate-goals.htm>(Accessed 12.10.2017)
5. <http://ec.europa.eu/growth/access-to-finance/cosme-financial-instruments_en> (Accessed 12.10.2017)
6. <http://europa.eu/rapid/press-release_IP-17-104_en.htm> (Accessed 12.10.2017)
Open Access This chapter is licensed under the terms of the Creative Commons Attribution 4.0International License (http://creativecommons.org/licenses/by/4.0/), which permits use, sharing,adaptation, distribution and reproduction in any medium or format, as long as you give appropriatecredit to the original author(s) and the source, provide a link to the Creative Commons license andindicate if changes were made.The images or other third party material in this chapter are included in the chapter’s Creative
Commons license, unless indicated otherwise in a credit line to the material. If material is notincluded in the chapter’s Creative Commons license and your intended use is not permitted bystatutory regulation or exceeds the permitted use, you will need to obtain permission directly fromthe copyright holder.
432 L. Goovaerts et al.
Life Cycle Approaches to SustainableRegional Development
Fritz Balkau and Timothy Grant
Abstract Regional development that is truly sustainable depends on the adoptionof systematic and long-term criteria for decision-making at different levels, takinginto account the full life cycle of raw materials and products, as well as ofinfrastructure projects. This session invited the presentation of life cycle manage-ment applications from both a scientific and a practitioner point of view, high-lighting examples and case studies at regional level. The applications are relevant toprivate actors from different economic sectors as well as for public representativesresponsible for regional planning and administrative procedures.
1 Introduction and Session Content
Regional development that is truly sustainable depends on the adoption of sys-tematic and long-term criteria for decision-making at different levels, taking intoaccount the full life cycle of raw materials and products, as well as of infrastructureprojects. This session invited the presentation of life cycle management applicationsfrom both a scientific and a practitioner point of view, highlighting examples andcase studies at regional level. The applications are relevant to private actors fromdifferent economic sectors as well as for public representatives responsible forregional planning and administrative procedures.
Life cycle tools presented in this session included LCA, Materials Flow Analysis(MFA), supply-chain management, eco-design, environmental product declarations(EPD), and sustainable public purchasing (SPP). These were applied to a variety ofindustry sectors such as building and construction, chemicals production, agricul-ture and food, wood production. All the above life cycle tools are applicable at
F. Balkau (&)Sustainable Solutions, Paris, Francee-mail: [email protected]
T. GrantLifecycles Australia, Melbourne, Australia
© The Author(s) 2018E. Benetto et al. (eds.), Designing Sustainable Technologies,Products and Policies, https://doi.org/10.1007/978-3-319-66981-6_48
433

regional level, with broad-scale applications into initiatives aimed at circulareconomy, bio-economy and fostering local industries.
The presenters reiterated that the systematic use of the above tools depends on anextensive programme of awareness-raising, education and training of both privateand public sector actors, as well as the creation of collaborative partnerships thatreach along the life chain of materials and programmes. All these need to beunderpinned by adequate life cycle based databases and suitable metrics that allowassessments to be reliably performed. It is also useful to undertake pilot studies andcompile case studies of successful initiatives.
2 Appreciation of the Presentations
The five presentations in this session described a variety of life cycle tools andmethodologies. While each presentation was on a different subject, they never-theless formed a complementary set of approaches that can be of use to regions intheir pursuit of more sustainable forms of development. The case studies weredrawn from five different regions around the world—France (2), Germany,Australia, South America (Peru), indicating that the use of life cycle tools forregional development has universal relevance.
Benoit Ribon gave an interesting presentation of territorial metabolism (ormaterials flows) in a north-eastern region in France (Alsace). Flows are calculatedaccording to a set of internal nodes that are connected by materials and energymovements. This allows an estimation of internal consumption as well as of importand export volumes. Such an analysis provides information towards the design of acircular economy, and at a different level, the needs and options for local wastemanagement.
The presentation described a model to calculate regional MFA, revealing thedynamics of resources in transit, waste management and internal (regional) pro-duction and consumption. All these have important sustainability implications.Concerning the management considerations, through an MFA both the energysources as well as points of wastage can be more clearly identified, potentiallyallowing efficient intervention to improve the path towards regional sustainability.
The study also highlighted some constraints, in particular that imposed by thenomenclature of freight statistics. Freight is one of the few data sources at regionallevel relating to materials importation and exportation, however the structure of thedata does not reflect well the life cycle of products. This inevitably leads to manyassumptions in data processing and modelling. A direct conclusion is thus thatregions themselves may need to ensure sufficient statistical data if they are to betterunderstand their circular economy dynamics.
Timothy Grant described a recent study in the State of South Australia aimed atenhancing the circularity of materials flows to increase local employment, reduceenergy use and improve materials efficiency while diminishing waste generation.The ensuing scenario development looked also at other benefits such as energy
434 F. Balkau and T. Grant
independence, entrepreneurship, and generally encouraging the evolution to moresustainable forms of business that favour use of local materials and labour. Greaterreliance on renewable energy is an important centrepiece of the South Australianscenarios, compensating for the closure of fossil fuelled power stations there, andpresent use of fossil fuel for heating.
The use of MFA as illustrated in this presentation covered not only energy butalso various materials flows that have implications for sustainability. The use ofMFA gives greater reliability and certainty to scenario development, giving publicpolicy makers more confidence in the various future visions that circular economyscenarios attempt to provide.
The implications of the materials flow calculations of the scenarios are nowbeing evaluated by the Government with an expectation of early adoption andapplication.
Vanessa Pasquet described the life cycle management framework put in place bythe French region ‘Hauts de France’ where various industry sectors become moredeeply linked with their supply chains by using life cycle management procedures.These include methods such as environmental design, eco-labels, environmentalproduct declarations (EPD) and advanced building standards. Similar tools can alsobe applied to other industry sectors such fisheries, agriculture, textiles among others.
Life cycle assessment provides much of the essential information on which themanagement tools are based. In view of the breadth of the sustainability agenda, avariety of LCA procedures may be necessary to capture all the key issues of regionalconcern. It is also important that all stakeholders along the value chains are identifiedduring the LCA process to ensure adequate co-operation in implementation.
The life cycle management framework described by Pasquet is strongly orientedtowards collective action rather than authoritarian regulation, although the latter iseventually needed to ensure that all players have the same targets. The building ofstakeholder alliances depends on credible information (from the LCA process),identification of common objectives for all the stakeholders, effective metrics tomeasure progress and of remaining hotspots, communication procedures adapted tothe needs of supply-chain stakeholders, and transparency in monitoring andreporting the outcomes. In many cases further education and training ofsupply-chain partners may be needed.
Sinéad O’Keefe described an initiative by the by the Helmholtz-Centre forEnvironmental Research GmbH—UFZ to model the industrial infrastructure andstakeholder collaborations necessary for greater use of locally sourced organicmaterial (mainly wood products) in the eastern regions of Germany. The regionalready has an extensive chemicals industry based on imported rawmaterials (mainlygas) but also has extensive forest lands and agricultural outputs. The perspective ofestablishing a regional bio-economy as part of an industrial transformation processwould have many advantages.
The study considers the sustainability and social impacts of a number of productmixes that could be based on a regional bio-economy rather than on importedmaterials as at present. Various life cycle assessment tools underpin this initiative;materials flow analysis, life cycle assessment, social impact assessment, and
Life Cycle Approaches to Sustainable Regional Development 435

eco-footprint being the principal ones. Climate footprint was the main sustainabilityfactor considered, however a full impact suite was taken into account to avoidpossible burden shifting and spill-over effects.
It is likely that a fully-fledged move to transform the resource base of a regionaleconomy will eventually require further tools as a supplement. Monitoring andevaluating the development of a regional bio-economy needs to take into accounttechnical, social and environmental factors, as well as paying regard to employmentconditions and local amenity objectives. Tools for some of these were developed aspart of the initiative, and were applied to several scenarios of biomass sources,product mixes and social structures.
O’Keefe describes an integrated approach—the SUMINISTRO framework—that considers the above factors using methodologies based on both traditional andsocial LCA, evaluating the environmental and socio-economic impacts from dif-ferent product mixes of the bio-economy(s) being modelled. The study concludesthat an integrative assessment framework and knowledge base can indeed facilitateindustrial transformation towards regional bio-economies based on local resources.The establishment of participative stakeholder networks helps to identify keyopportunities and risk in such a transformation. A number of actual local casestudies of biomass-derived products confirms the feasibility of this approach.
Ian Vázquez-Rowe. Consequential life cycle assessment methods can be used toevaluate the various environmental, social and economic consequences of publicpolicy decisions for further development of regional agriculture. A particular pre-occupation for agriculture these days is water use and climate change, not only interms of adaptation but also for GHG generation from agriculture itself.Vázquez-Rowe presented an evaluation of potential agricultural developments inPeru, in particular for the growing of grapes for production of pisco (an alcoholicbeverage made from grapes) for export. The market for this is expected to increase,making a sustainability (GHG and water) assessment very pertinent. Potentialimpacts have to be seen in the light of crop replacement and possible use of fallowland that do not require additional new lands to be brought into production. Thestudy had to take into account questions of land-use, property markets, and theoptimum way to allocate production under different economic and market scenarios.Nevertheless, not all parameters influencing farmers’ decision could be included inthe model. In the end it was found that there need not be an increase in net GHGemissions if appropriate farming practices were employed, but water use wasdependent on the area farmed.
3 Overview
Individually, the presentations describe some interesting research and regional casestudies. Several broke new ground in the application of life cycle tools at regionallevel, both in assessment and in LCM, as for example in social LCA related tobio-economy transformation in Germany. Several others described the relevance of
436 F. Balkau and T. Grant
standard LC tools to other regions that had not so far been highlighted in regionalLCM work (e.g. MFA in Alsace, and LCA in Peru, respectively). Two presenta-tions relating to South Australia and Hauts de France respectively, describe theapplication of life cycle management and circular economy principles by regionalauthorities to move their development policies forward.
This Session discussed extended LCA for new industrial situations, as well asthe application of standard LCA and MFA to additional regions. Both are valuablein promoting the further use of life cycle methodologies in regions, echoing theconclusion of a recent book [1] that what is needed is both a further evolution of LCtools, and raising the profile of LCM among regional managers and policy makers.The utility of life cycle approaches to regional development is relevant to allcontinents as we saw, and it is encouraging that LCA societies are nowadays foundin many countries. It remains to encourage these societies to take a broader viewthan simply refining the present assessment methodologies—they also need an eyeon new client groups who have different needs.
4 Future Perspectives
Neither the development agenda nor the LCA environment is standing still. Regionsand local governments are under increasing stakeholder and trade pressure, and arelooking for ways to meet upcoming challenges, whether climate change, biodi-versity loss, land preservation or social and employment issues. While certain lifecycle techniques are occasionally used by regions, few base their future develop-ment on a systematic life cycle approach. This is particularly unfortunate at a timewhen many are experimenting with, for example, circular economy, industrialecology, long-term infrastructure planning or ‘sustainable’ forms of manufactureand business. Now is the right formative moment for the life cycle community toopen its doors to regional government as an important stakeholder and client group,to speak to them in their language, and to discuss their needs. The incorporation of amunicipality in the recent road test of Organisational Life Cycle Assessment(O-LCA) [2] is a step (but only a small one) in the right direction. To borrow aphrase from other area, a dose of positive discrimination in the direction of thepublic sector would be a helpful move in enlarging the scope of LCA/LCMapplication.
At the same time the life cycle community could usefully accelerate the effort tofurther evolve life cycle methodologies that are of interest to regions, such aslandscape and land-use assessment techniques, biodiversity assessment, naturalresource accounting, eco-footprints and so on. There are embryonic moves in theseareas—they could usefully be moved further along to mainstream level in confer-ences, teaching and research.
Life Cycle Approaches to Sustainable Regional Development 437
References
1. Life cycle approaches to sustainable regional development, Balkau F, Massari S,Sonnemann G, eds., Taylor and Francis 2017.
2. Road testing Organizational Life Cycle Assessment around the world: Applications,experiences and lessons learned”, http://www.lifecycleinitiative.org/download/6060.
Open Access This chapter is licensed under the terms of the Creative Commons Attribution 4.0International License (http://creativecommons.org/licenses/by/4.0/), which permits use, sharing,adaptation, distribution and reproduction in any medium or format, as long as you give appropriatecredit to the original author(s) and the source, provide a link to the Creative Commons license andindicate if changes were made.The images or other third party material in this chapter are included in the chapter’s Creative
Commons license, unless indicated otherwise in a credit line to the material. If material is notincluded in the chapter’s Creative Commons license and your intended use is not permitted bystatutory regulation or exceeds the permitted use, you will need to obtain permission directly fromthe copyright holder.
438 F. Balkau and T. Grant
Turning the Lens Around: LCA SuccessStories Outside-In
Eric Mieras and Alain Wathelet
Abstract Life Cycle Assessment experts are working on environmental assess-ments with both feet on the ground and faced every day with challenges around dataquality, allocation and other challenging topics. But what’s the perspective of thepeople that are the audience of the results: “How do they look at LCA?” Theobjective of this session was to show the value LCA has for people outside the LCACommunity that are not as familiar with the topic as the Experts. Sanjeevan Bajaj(FICCI), Namy Espinoza-Orias (Nestlé), Pawin Boonyaporn (AdvancedBiochemical), Jens-Christian Holst (Siemens) and Aubin Roy (AvniR) shared theirexperiences.
1 Introduction
Life Cycle Assessment (LCA) studies are often prepared by high level scientistsand are focused on specific subjects for the interest of a small community.Nevertheless, the development of Life Cycle Thinking in a business organizationleads to the use of a large panel of tools to demonstrate the sustainability of theirbusiness solutions (products and/or services), and an LCA approach perfectly fitsthis goal. During LCM, the benefits of this LCA approach are presented not only byLCA practitioners but also from the different users of Life Cycle approaches.
The “outside-in” session is conducted from the LCA perspective with a lookfrom the perspective of users outside of the LCA community, including strategicdecision making, marketing team, R&I team and product development team.
E. Mieras (&)PRé Sustainability, Stationsplein 121, 3818LE Amersfoort, The Netherlandse-mail: [email protected]
A. WatheletSolvay SA, 1120 Brussels, Belgium
© The Author(s) 2018E. Benetto et al. (eds.), Designing Sustainable Technologies,Products and Policies, https://doi.org/10.1007/978-3-319-66981-6_49
439
2 Internalizing Life Cycle Thinking in Business StrategyThrough Amalgamation of Life Cycle Knowledgewith Strategy Development Tools [1]
Human societies today need business models that allow wealth generation alongwith regeneration of natural and social capital, which means going beyond the usualfinancial performance focus to manage environmental, social, developmentalimpacts of doing business. On top of this, Life Cycle approaches call for anassessment of these impacts not just from production and delivery, but acrossproduct/service life cycles from material extraction to end-of-life disposal. Giventhe dominant business paradigm of profit-maximization, why would businessleaders succumb to hard sell by LCA practitioners and make life more complex forthemselves?
To be fair, Life Cycle Thinking is not new to business management. The ValueChain concept is integral to business strategy. Based on a process view of orga-nizations, the idea of seeing a business as a system, made up of subsystems withinputs, transformation processes and outputs is already internalized in strategyliterature. How value chain activities are carried out determines costs and impactsprofits. While converting inputs to outputs, business organizations engage inhundreds of activities which can be categorized as primary or support activities, andtheir depiction through the Value Chain diagram is pervasive in business man-agement literature. Thus product development requires businesses to research wherethe raw materials might come from, which manufacturing processes may be needed,who will use the product, what additional costs will be incurred during use, whatmaintenance support will be needed, what types of waste will be created before/during/after use, and where the product remnants will go when discarded. In theLCA practitioner’s lingo, this translates to ‘designers conduct life cycle studies andmeasure the potential impacts of various options, requesting information fromsuppliers, calculating full life cycle cost of goods consumers purchase includingpoint-of-purchase price as well as costs of transporting, storing, installing, cleaning,operating, repairing, and eventually discarding those goods’.
Despite common ground across strategy development and Life Cycle approa-ches, there is little uptake of Life Cycle approaches at a truly strategic level. Mostsuccess stories about business value from Life Cycle studies talk about costreductions through materials/energy saving, or customer loyalty through sustain-ability posturing. Cost reductions accompany operational improvements, whilesustainability posturing builds image. Business leaders aren’t fundamentallyrethinking their business to increase aggregated well-being of the planet and humansociety. At best, they are trying to do less harm while going about their business.
For Life Cycle approaches to qualify as tools enabling paradigm shift, likeStrategy tools, they must provide a structure to generate and evaluate strategicoptions of domain selection (what business to be in) and domain navigation (how tocompete in this business). Business strategy deals with competition, business
440 E. Mieras and A. Wathelet
leaders choose the most attractive industries and/or influence industry structures tomake them attractive for themselves.
The field of strategy is constantly evolving at a fast pace. LCA can be used tosupport strategic decision making for instance on which technology to invest in.However, most companies (95%) do not include sustainability yet, so there’s still alot of companies to win.
3 Integrated Product Development at Nestlé [2]
At Nestlé, the world’s largest nutrition, health and wellness company, the life cycleapproach is applied to multi-criteria product innovation and renovation, whichinvolves Nestlé's partners and stakeholders from farm to consumer and beyond.
In order to embed environmental sustainability into their products, theSustainability by Design program led by the Research & Development unit assessesand optimizes the environmental performance across the entire value chain at theearliest stages of product development. The identification of environmental hotspotswhere relevant, and the definition of actions to address them is carried out using theinternal eco-design tool EcodEX. Furthermore, a new tool aimed at identifyingopportunities for projects to deliver on Nestlé in Society commitments is beinglaunched in 2017 across the R&D organization.
On the other hand, successful product renovation and innovation requiresbuilding sufficient and necessary consumer, technical and product mastershipknowledge. This consumer-centric approach entails the close cooperation of mar-keting, operations and R&D units and also spans over the entire product life cycle.
This holistic and comprehensive methodology, as applied by Nestlé, deliverscompetitive advantage, leads to the fulfillment of public commitments at companylevel and drives the company contribution as member of the food industry to theachievement of the Sustainable Development Goals. Informed decision makingtakes place at the various steps of project execution, risks and opportunities areidentified, and early warning is brought up at the appropriate time.
However, given the breadth of technical areas concerned and what is at stake, theinterpretation of data and insights resulting from this way of working can becomplex and raise some challenges. The deployment of support tools can only bejustified as long as they are properly and widely used. Deciding which function willtake up the identified actions for improvement, either R&D, operations or both in aconcerted way, requires alignment of objectives and priorities as well as clearallocation of resources. For a company as large as Nestlé, it is fundamental toprogress from starting the conversation and raising awareness on multiple criteriafor product development to consistently accomplishing it.
Being proactive and understanding that what matters to consumers entailsall aspects of the product—going beyond quality and including sustainability—enriches the product development process and provides consumers with a productthey prefer, knowing that Nestlé has taken care of what matters to them.
Turning the Lens Around: LCA Success Stories Outside-In 441
At Nestlé, LCA is one of the assessments used in a customer focused innovationapproach. Nestlé created an overall dashboard for innovation decisions that isavailable for everyone involved. Within this multi-criteria assessment there’s a clearrole for LCA in combination with other impacts.
4 Innovative Partnership to Promote Credibleand Sustainable Bio-based Materials Throughthe Value Chain [3]
Bio-based materials derived from plant residues open up exciting opportunities forenvironmentally-responsible products. Trendsetters such as bio-based epichloro-hydrin (ECH) can provide more sustainable alternatives for traditional raw mate-rials. To this end, AkzoNobel, Advanced Biochemical (Thailand) Co., Ltd.(ABT) and EY (Ernst & Young) have joined forces to develop a monitoring systemwhich could track and quantify the use of renewable raw materials in paints,coatings and further applications. The partnership built on a previous agreement,whereby AkzoNobel would progressively increase the use of epoxy resins derivedfrom Epicerol®, a bio-based ECH, in its coatings products.
Throughout 2017, the partnership will roll out an online system which willsupport a comprehensive bio-based certification. ABT, AkzoNobel and EY havedeveloped a ‘chain of custody’ methodology to ensure that even in situations whereno physical segregation of petro and bio-based materials is practiced, volumes maystill be assigned and reported.
Rather than buying ECH directly, AkzoNobel is sourcing epoxy resins from anumber of intermediate producers. The company then uses epoxy resins as ingre-dients in various coatings. By creating market pull through e-certification, thepartnership promotes bio-based materials through the value chain.
Epicerol® is an ECH based on 100% renewable glycerine, a by-product from thetransformation of vegetable oils. Manufactured by ABT using an innovative andpatented process, the drop-in was developed and commercialised because ofdemand for a truly sustainable ECH.
A comparative Life Cycle Assessment (LCA) benchmarked Epicerol® againststate-of-the-art propylene-based processes. It showed that incorporating 1 MT ofEpicerol® can reduce a product’s carbon footprint (defined as the global warmingpotential (GWP) from cradle-to-gate, including biogenic CO2) by 2.56 MT CO2
equivalent.The technology also reduces the volume of chlorinated by-products from the
process by over 80%, while another distinctive technology enables brine recyclingand drastically reduces liquid effluents.
A wider rollout is targeted before end-2017. By promoting sustainable alterna-tives through pro-active procurement of bio-based feedstock and a transparenttransfer of e-certificates across the value chain, this innovative project willdemonstrate a credible approach to sourcing better materials.
442 E. Mieras and A. Wathelet
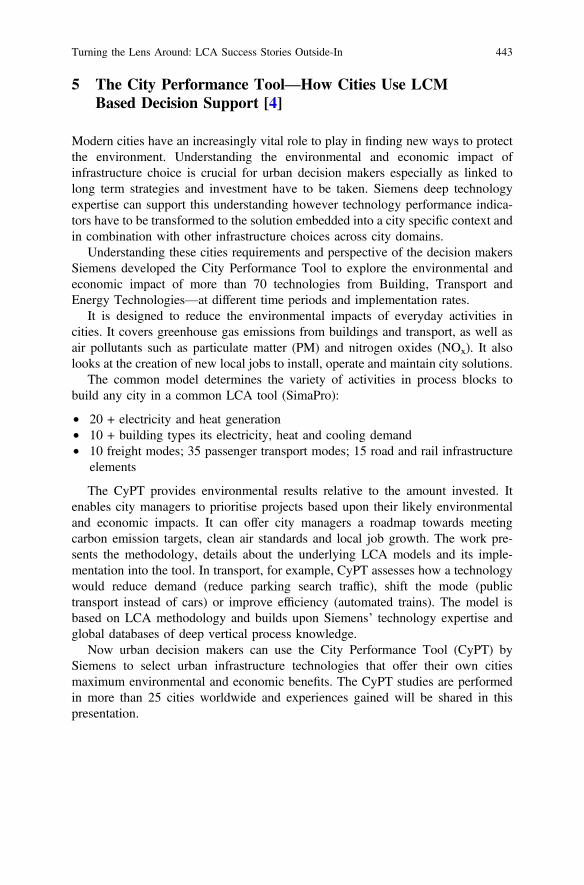
5 The City Performance Tool—How Cities Use LCMBased Decision Support [4]
Modern cities have an increasingly vital role to play in finding new ways to protectthe environment. Understanding the environmental and economic impact ofinfrastructure choice is crucial for urban decision makers especially as linked tolong term strategies and investment have to be taken. Siemens deep technologyexpertise can support this understanding however technology performance indica-tors have to be transformed to the solution embedded into a city specific context andin combination with other infrastructure choices across city domains.
Understanding these cities requirements and perspective of the decision makersSiemens developed the City Performance Tool to explore the environmental andeconomic impact of more than 70 technologies from Building, Transport andEnergy Technologies—at different time periods and implementation rates.
It is designed to reduce the environmental impacts of everyday activities incities. It covers greenhouse gas emissions from buildings and transport, as well asair pollutants such as particulate matter (PM) and nitrogen oxides (NOx). It alsolooks at the creation of new local jobs to install, operate and maintain city solutions.
The common model determines the variety of activities in process blocks tobuild any city in a common LCA tool (SimaPro):
• 20 + electricity and heat generation• 10 + building types its electricity, heat and cooling demand• 10 freight modes; 35 passenger transport modes; 15 road and rail infrastructure
elements
The CyPT provides environmental results relative to the amount invested. Itenables city managers to prioritise projects based upon their likely environmentaland economic impacts. It can offer city managers a roadmap towards meetingcarbon emission targets, clean air standards and local job growth. The work pre-sents the methodology, details about the underlying LCA models and its imple-mentation into the tool. In transport, for example, CyPT assesses how a technologywould reduce demand (reduce parking search traffic), shift the mode (publictransport instead of cars) or improve efficiency (automated trains). The model isbased on LCA methodology and builds upon Siemens’ technology expertise andglobal databases of deep vertical process knowledge.
Now urban decision makers can use the City Performance Tool (CyPT) bySiemens to select urban infrastructure technologies that offer their own citiesmaximum environmental and economic benefits. The CyPT studies are performedin more than 25 cities worldwide and experiences gained will be shared in thispresentation.
Turning the Lens Around: LCA Success Stories Outside-In 443
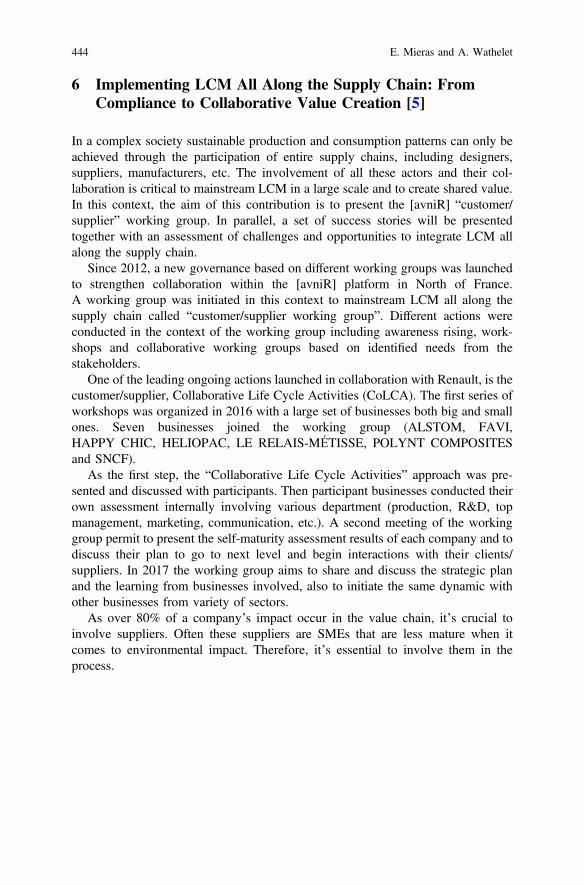
6 Implementing LCM All Along the Supply Chain: FromCompliance to Collaborative Value Creation [5]
In a complex society sustainable production and consumption patterns can only beachieved through the participation of entire supply chains, including designers,suppliers, manufacturers, etc. The involvement of all these actors and their col-laboration is critical to mainstream LCM in a large scale and to create shared value.In this context, the aim of this contribution is to present the [avniR] “customer/supplier” working group. In parallel, a set of success stories will be presentedtogether with an assessment of challenges and opportunities to integrate LCM allalong the supply chain.
Since 2012, a new governance based on different working groups was launchedto strengthen collaboration within the [avniR] platform in North of France.A working group was initiated in this context to mainstream LCM all along thesupply chain called “customer/supplier working group”. Different actions wereconducted in the context of the working group including awareness rising, work-shops and collaborative working groups based on identified needs from thestakeholders.
One of the leading ongoing actions launched in collaboration with Renault, is thecustomer/supplier, Collaborative Life Cycle Activities (CoLCA). The first series ofworkshops was organized in 2016 with a large set of businesses both big and smallones. Seven businesses joined the working group (ALSTOM, FAVI,HAPPY CHIC, HELIOPAC, LE RELAIS-MÉTISSE, POLYNT COMPOSITESand SNCF).
As the first step, the “Collaborative Life Cycle Activities” approach was pre-sented and discussed with participants. Then participant businesses conducted theirown assessment internally involving various department (production, R&D, topmanagement, marketing, communication, etc.). A second meeting of the workinggroup permit to present the self-maturity assessment results of each company and todiscuss their plan to go to next level and begin interactions with their clients/suppliers. In 2017 the working group aims to share and discuss the strategic planand the learning from businesses involved, also to initiate the same dynamic withother businesses from variety of sectors.
As over 80% of a company’s impact occur in the value chain, it’s crucial toinvolve suppliers. Often these suppliers are SMEs that are less mature when itcomes to environmental impact. Therefore, it’s essential to involve them in theprocess.
444 E. Mieras and A. Wathelet

References
1. Bajaj S, Internalizing Life Cycle Thinking in Business Strategy through Amalgamation of LifeCycle Knowledge with Strategy Development Tools, LCM 2017 conference, Luxembourg,2017.
2. Espinoza-Orias N, Cooper K, Integrated product development at Nestlé, LCM 2017conference, Luxembourg, 2017.
3. Holst J.C, Heidinger K, Müller K, Jaeger F, The City Performance Tool- How cities use LCMbased decision support, LCM 2017 conference, Luxembourg, 2017.
4. Boonyaporn P, Innovative Partnership to Promote Credible and Sustainable Bio-basedMaterials Through the Value Chain, LCM 2017 conference, Luxembourg, 2017.
5. Roy A, Adibi N, Pasquet V, Morel S, Implementing LCM all along the supply chain: fromcompliance to collaborative value creation, LCM 2017 conference, Luxembourg, 2017.
Open Access This chapter is licensed under the terms of the Creative Commons Attribution 4.0International License (http://creativecommons.org/licenses/by/4.0/), which permits use, sharing,adaptation, distribution and reproduction in any medium or format, as long as you give appropriatecredit to the original author(s) and the source, provide a link to the Creative Commons license andindicate if changes were made.The images or other third party material in this chapter are included in the chapter’s Creative
Commons license, unless indicated otherwise in a credit line to the material. If material is notincluded in the chapter’s Creative Commons license and your intended use is not permitted bystatutory regulation or exceeds the permitted use, you will need to obtain permission directly fromthe copyright holder.
Turning the Lens Around: LCA Success Stories Outside-In 445

Integrated Product Developmentat Nestlé
Namy Espinoza-Orias, Karen Cooper and Sofiane Lariani
Abstract Nestlé’s purpose is to enhance the quality of life and contribute to ahealthier future. In practice, it is translated into product development through a lifecycle, multi-criteria, and integrated approach engaging internal and externalstakeholders. An overview of the company’s values is presented as well as itscreating shared value business principles, followed by an explanation of theSustainability by Design program and how it is embedded into product innovationand renovation. The integrated development of a breakfast solution for childrenwho skip breakfast exemplifies this approach. Being proactive and understandingthat what matters to consumers entails all aspects of the product—going beyondquality and including sustainability—enriches the product development process,informs decision-making timely, provides consumers with a product they prefer,delivers competitive advantage, and supports the fulfilment of Nestlé’s publiccommitments.
1 Introduction
In 2016, Nestlé celebrated its 150th anniversary and is currently the largest foodand beverage company worldwide. From the beginning, when Henri Nestléinvented the Farine Lactée to save the life of an infant, Nestlé’s purpose has been toenhance the quality of life and contribute to a healthier future. What drives ourvalue creation, both for business and society, is a nutrition, health and wellnessstrategy. With more than 2000 brands, whose products are sold across seven pro-duct categories in 191 countries, understanding and anticipating consumer needs inan ever evolving and competitive environment is imperative for Nestlé’s long-termbusiness success. This is precisely the starting point of our integrated productdevelopment. It follows a life cycle, multi-criteria process, with the engagement of
N. Espinoza-Orias (&) � K. Cooper � S. LarianiNestlé Research Center, Rue Du Jorat 57, 1000 Lausanne, Switzerlande-mail: [email protected]
© The Author(s) 2018E. Benetto et al. (eds.), Designing Sustainable Technologies,Products and Policies, https://doi.org/10.1007/978-3-319-66981-6_50
447
internal and external stakeholders and the firm inclusion of Nestlé’s values, busi-ness principles and public commitments against which our company and productsare held accountable.
The purpose of this paper is to explain how key elements bring in practiceproduct innovation and renovation with a competitive advantage. Our valuesframework, business model, Sustainability by Design program and integratedproduct development approach are reviewed. A breakfast solution for schoolchil-dren who skip breakfast is presented as an example of consumer-centric productdevelopment.
2 Creating Shared Value, the Nestlé Way
Guided by values rooted in respect, Nestlé works alongside partners and stake-holders to create shared value (CSV) across all the activities of the company, whichcontribute to society while ensuring the long-term success of our business.
Three interconnected focus areas are identified wherein our purpose is realized:
(1) Individuals and families: to whom Nestlé offers products and services thatenable them to lead healthier and happier lives.
(2) Our communities: helping those we live and work with in developing intothriving and resilient communities, enhancing rural livelihoods, and respectingand promoting human rights.
(3) Our planet: stewarding resources for the future, caring for water, acting onclimate change and shaping sustainable consumption.
Our CSV priorities and efforts are supported by 42 specific, public commitmentswith clear short-term timelines (2020) as well as three overarching medium term(2030) ambitions for our focus areas. In particular, Nestlé aims to help 50 millionchildren lead healthier and happier lives, help improve the livelihoods of 30 millionin communities directly connected to our business activities and strive for zeroenvironmental impact in our business operations [1].
The recently updated and reframed commitments as well as newly introducedones [1] go further and deeper than the first set of them launched back in 2012. Thecommitments were defined taking into account stakeholder recommendations andissues material to our consumers, stakeholders and the company. The materialityassessment is carried out every two years in collaboration with SustainAbility—anindependent consultancy specialized in corporate sustainability—using a formalprocess entailing extensive consultations of stakeholders, investors and key opinionleaders. Issues of concern in the environmental, social and governance areas areidentified and assessed in order to determine their business impact in terms of risksand opportunities along with the level of interest stated by stakeholders. Thecommitments were also aligned in scope and timeline with the SustainableDevelopment Goals (SDGs) [2].
448 N. Espinoza-Orias et al.

In particular, those SDGs where Nestlé has specific responsibilities as a memberof the private sector and can have the most positive and meaningful impact areemphasized. This is achieved by mapping our material issues to the SDGs; as aresult, it is possible to find where our activities contribute, directly or indirectly, tothe realization of the SDGs.
3 Sustainability by Design
In order to embed sustainability into our products, the Sustainability by Designprogram led by the Nestlé Research organization assesses the sustainability aspectsat the earliest phase of the product development cycle. The aim is to optimize theimpacts across the entire value chain through an iterative approach that spans theproduct development process. The various elements taken into account areschematised in Fig. 1.
From the early stages of a product development, projects are systematicallyevaluated with the following steps:
(1) Identification—as early as possible—of the opportunities or hotspots, eitherenvironmental or social. A tool has been developed that guides projects throughthe process of discussing its potential impact on individuals and families, ourcommunities and the planet. Project managers collaborate with sustainability
Fig. 1 Elements considered in the sustainability assessment of products at Nestlé
Integrated Product Development at Nestlé 449
champions to identify which societal commitments their project may affect,positively or negatively. This is revisited at key moments in the project, i.e.when passing a stage gate or a major change occurs.
(2) Comparison to the Nestlé materiality matrix (Fig. 2), which summarizes theissues of concern to the company and its stakeholders. As the 42 commitmentsare not exhaustive to all potential issues, this enables project managers tounderstand if their project may assist in other areas of concern.
(3) An action plan is developed to either mitigate or leverage the potential impactsand is then recorded as part of the project process. The actions can consist ofcarrying out further in-depth assessments as the project progresses and moreinformation becomes available.
(4) The tool covers every step in the value chain from ingredients, processing inour factories, packaging, consumer use right through to end of life. It allows adeep dive into specific aspects; for example, into ingredients and responsiblesourcing, linking into the Procurement side of the company.
(5) At this point, a project is also assigned a specific rating for potential envi-ronmental sustainability impact, which is a key KPI tracked at a strategic levelacross the project portfolio. This tracking allows the calculation of time spenton projects of different ratings, an important indicator as to whether the port-folio will deliver against our environmental commitments. This rating can bereviewed or ratified at various points in the project process.
(6) The assessment itself ends at this point, having taken approximately an hour butdelivering key information on how the project will deliver against sustainabilityand an action plan for improvement.
Following up on the agreed actions usually involves the use of EcodEX, asimplified environmental life cycle assessment tool developed with an outside ITcompany, Selerant [3]. This tool allows the comparison of multiple scenarios, forinstance a current product in the market versus an innovation. Early use allowsdetailed quantitative information on potential environmental issues and benefits tobe available for decision making at a point where there is more design freedom andless cost to make changes.
Future potential work to develop this tool may include a stronger social focusand Nestlé is evaluating the latest methodologies in this area.
4 Integrated Product Development
4.1 PrIME
Consumer centric product development, renovation or innovation must also take intoaccount the different elements influencing the decision to buy food and beverageproducts. These are taste, price, healthiness, convenience and sustainability [4].
450 N. Espinoza-Orias et al.

Fig.2
2016
Nestlé
materialitymatrix(N
estlé,20
17)
Integrated Product Development at Nestlé 451
The incremental approaches optimizing one element at the time in a complexenvironment where Nestlé has to come up with heathy, sustainable products that theconsumer wants and can afford, have quickly shown their limitations.
Therefore, Nestlé Research put in place a holistic approach, called PrIME,optimizing at the same time consumer healthiness, preference, sustainability andaffordability. Integrating these four elements into product development throughdeep understanding of consumer needs and preferences has helped identifyingoptimal recipes by maximizing these different elements simultaneously.
Nestlé is applying the PrIME approach to product design and packaging tooptimize the whole product experience by:
(1) Mastering healthiness and sensorial product features. For example, deliveringproduct sweetness with less sugar through optimal product design.
(2) Improving the packaging functionality to ensure:
1. Inclusions of all individuals (for instance the elderly), and2. Frustration free packaging experience.
Nestlé Research has developed this consumer centric product developmentapproach in all key global brands for the past years and we are now deploying it inthe main markets to support our local brands.
This consumer-centric approach is built around a process that uses a collection ofstandardized methodologies and tools to connect people understanding and productknowledge. The management of our knowledge and data is the foundation of thisprocess and the way to accelerate it, iteration after iteration. Therefore, severalactivities are in place to optimize the management and sharing of consumer andproduct knowledge and data. PrIME is using data from different sources and bigdata techniques to ensure we constantly satisfy the evolution of needs of individualsand families.
PrIME consists of the following steps:
(1) Identification of consumer value drivers: what is important for the individualsand families? How do they like consuming their products? What are theirneeds? What are their dissatisfactions? This first step is important to dive intothe heart of the consumer preferences but not sufficient to decode individualsand family’s needs.
(2) Understanding people needs and behaviours is at the heart of this approach. Weuse state of the art consumer research to translate multi-dimensional needs intoobjective product features and attributes.
(3) Consumer centric product and technological mastership is ultimately the wayto:
a. Fast track product development. b. Identify our product knowledge gaps anddevelop innovative, differentiating and sustainable technologies to better satisfy theconsumer on the elements cited above: healthiness, preference, sustainability andaffordability. c. Control our manufacturing settings and provide day after day highand sustainable product quality to individuals and families.
452 N. Espinoza-Orias et al.

The PrIME approach has shown its success developing efficiently and effectivelythe products the consumer wants first time right and contributes to push us toconstantly innovate in technologies relevant for consumers, communities and theplanet.
4.2 Nutritional Considerations for Product Developmentat Nestlé
Nestlé Research developed in 2004 the Nestlé Nutritional Profiling System (NNPS)that guides the nutritional dimension of formulation and reformulation of Nestléproducts nutritional product development [5]. The NNPS translates nutritionalrecommendations from the World Health Organization and other international andnational organizations—taking also technical feasibility into account—into tangibleproduct targets, e.g. the amounts of nutrients to limit and nutrients to encourage in aproduct. If all targets defined by the NNPS are met, then the product achieves theNutritional Foundation (NF). The nutritional assessment is facilitated through atool, globally rolled out in Nestlé and used by more than 1000 product developersand nutritionists. This assessment is a fundamental step within the developmentprocess and guides further improvements in the products.
5 Case Study: Nestlé Nido GoldenStart©
Although breakfast is considered the most important meal of the day, it is commonthat children skip breakfast frequently, thus missing the opportunity to consume ameal rich in nutrients recommended for a wholesome diet. Existing studies andreviews on breakfast consumption habits in different regions and countries [6–8]report that between 10 and 30% of schoolchildren skip breakfast.
The reasons leading to skipping breakfast are varied, and includesocio-demographic factors, limited nutritional knowledge, lack of time and plan-ning for breakfast (preparation and/or consumption), absence of hunger in themorning, limited or no availability of breakfast foods that are affordable and con-venient, as well as concerns about body weight [9–11].
A review was made to summarize recommendations for a complete, healthfulbreakfast in order to offer guidance on its ideal composition and energy intake [12,13]. A breakfast should provide between 20 and 25% of the overall daily energyintake, a range that already takes into account the number of eating occasions in aday (breakfast, lunch, dinner and snacks). A complete breakfast meal should consistof solid and liquid foods, with the purpose of maximizing nutrient intake andreducing or closing nutrient gaps. Foods containing protein, whole grains, fruits andvegetables are specifically recommended.
Integrated Product Development at Nestlé 453
Following the holistic approaches described earlier (Sustainability by Design,PrIME and nutritional assessment through the NNPS), Nestlé developed a breakfastsolution targeting the segment of schoolchildren aged 4–8who are breakfast skippers.This product, marketed under the brand Nido GoldenStart©, provides the rightcombination of essential nutrients required for breakfast and 12% of the daily energyintake for this age group. Its ingredients are milk, cereals and fruits, delivered in aconvenient ready to drink format (beverage carton, 200 ml). A first generation of theproduct (powder beverage) was launched in Central America in 2015; a secondgeneration ready to drink version was launched in Ecuador in September 2017.
The various steps followed in the integrated product development process can berecapped as follows:
(1) Consolidation of consumer data: The drivers of preference, expressed in termsof sensory attributes (taste, texture, aroma, colour, etc.) were identified bymining internal consumer insight data.
(2) Definition of the right nutritional targets through the NNPS and a project to definespecific nutritional targets for complete breakfasts and “breakfast-on-the-go”.
(3) Product and process mastership: Product experts at Research and Developmentunits as well as factories represented the key unit operations required to screenthe potential ingredients, design the recipe, define the process parameters andfinally manufacture the product.
(4) A large number of possible recipes was reduced to an optimal number. Theserecipes were produced for consumer trials considering factors such as consumerand sensory data, recipe cost and technical constraints.
(5) Preference mapping: The recipes most liked by parents and children wereselected and the reasons for liking or disliking them were explored. In parallel,a monadic sensory profiling was performed with an expert panel to understandthe consumers’ feedback. A satiation test was also conducted to assess theeffect of the product texture on satiation and thus validate the portion size.
(6) Validation test: The superiority of the final recipe was validated using a numberof internal methods, among which the Nutritional Foundation (NF) and 60/40+taste preference criteria can be highlighted. 60/40 is a Nestlé method wherebyconsumers are asked to state their preference in a blind test between an ownproduct and a competitor or benchmark. A Nestlé product passes the test whenmore than 60% of the consumers would prefer it to the competitor product orbenchmark. The “+” equals achieving the Nutritional Foundation, meaning allnutritional targets defined by the NNPS are met.
(7) Environmental sustainability evaluation: The eco-design of the product wascarried out using the EcodEX tool. On a basis of 100 kilocalories delivered,Nido GoldenStart© showed improved environmental performance on all fiveenvironmental indicators assessed (climate change, freshwater consumptionscarcity, abiotic depletion, ecosystems quality and land use impact on biodi-versity) when compared to a reference product.
454 N. Espinoza-Orias et al.

Moreover, the integrated development of Nido GoldenStart© satisfies a clearconsumer need while contributing to the achievement of Nestlé commitments on:
(1) Inspiring people to lead healthier lives: Empower parents to foster healthybehaviours in children (not skipping breakfast).
(2) Offering tastier and healthier choices: Launching more nutritious foods andbeverages especially for children. Increase the fibre and grains content in ourfoods and beverages.
(3) Safeguarding the environment: Assess and optimize the environmental impactof our products.
6 Conclusions
This holistic and comprehensive approach, as applied by Nestlé, delivers compet-itive advantage, leads to the fulfilment of public commitments at company level anddrives our contribution as member of the food industry to the attainment of theSustainable Development Goals. Informed decision-making takes place at thevarious steps of project execution, risks and opportunities are identified, with earlywarning brought up in a timely manner.
However, given the breadth of technical areas concerned and what is at stake, theinterpretation of data and insights resulting from this way of working can becomplex and raise some challenges. The deployment of support tools can only bejustified as long as they are used properly and extensively. Deciding which businessfunction will take up the identified actions for improvement, either Research andDevelopment, Operations, Markets or a combination requires alignment of objec-tives and priorities as well as clear allocation of resources. For a company as largeas Nestlé, it is fundamental to progress from starting the conversation and raisingawareness on integrated product development, to consistently accomplishing it.
Being proactive and understanding that what matters to consumers entails allaspects of the product—going beyond quality and including sustainability—en-riches the product development process and provides consumers with a productthey prefer.
References
1. https://www.nestle.com/asset-library/documents/library/documents/corporate_social_responsibility/nestle-csv-full-report-2017-en.pdf. (Accessed 04.04.2018).
2. http://www.un.org/ga/search/view_doc.asp?symbol=A/RES/70/1&Lang=E. (Accessed 30.05.2017).
3. http://www.selerant.com/eco-design/. (Accessed 30.05.2017).4. http://www.foodinsight.org/sites/default/files/2016-Food-and-Health-Survey-Report_FINAL1.
pdf. (Accessed 30.05.2017).
Integrated Product Development at Nestlé 455
5. Vlassopoulos A, Masset G, Rheiner Charles V, Hoover C, Chesneau-Guillemont C, Leroy F,Lehmann U, Spieldenner J, Tee E-S, Gibney M, Drewnowski A, A nutrient profiling systemfor the (re)formulation of a global food and beverage portfolio, European Journal ofNutrition, Vol. 56, 2016, pp. 1–18.
6. Rampersaud G, Pereira M, Girard B, Adams J, Metzl J, Breakfast habits, nutritional status,body weight, and academic performance in children and adolescents, Journal of the AmericanDietetic Association, Vol. 105, No. 5, 2005, pp. 743–760.
7. Deshmukh-Taskar P, Nicklas T, O’Neil C, Keast D, Radcliffe J, Cho S, The relationship ofbreakfast skipping and type of breakfast consumption with nutrient intake and weight status inchildren and adolescents: The National Health and Nutrition Examination Survey 1999–2006,Journal of the American Dietetic Association, Vol. 110, No. 6, 2010, pp. 869–878.
8. Utter J, Scragg R, Mhurchu C.N, Schaaf D, At-home breakfast consumption among NewZealand children: Associations with body mass index and related nutrition behaviors, Journalof the American Dietetic Association, Vol. 107, No. 4, 2007, pp. 570–576.
9. Sweeney N, Horishita N, The breakfast-eating habits of inner city high school students,Journal of School Nursing, Vol. 21, No. 2, 2005, pp. 100–105.
10. Malinauskas B, Raedeke T, Aeby V, Smith J, Dallas M, Dieting practices, weight perceptions,and body composition: a comparison of normal weight, overweight, and obese collegefemales, Nutrition Journal, Vol. 5, 2006, p. 11.
11. Reddan J, Wahlstrom K, Reicks M, Children’s perceived benefits and barriers in relation toeating breakfast in schools with or without Universal School Breakfast, Journal of NutritionEducation and Behaviour, Vol. 34, No. 1, 2002, pp. 47–52.
12. O’Neil C, Byrd-Bredbenner C, Hayes D, Jana L, Klinger S, Stephenson-Martin S, The role ofbreakfast in health: Definition and criteria for a quality breakfast, Journal of the Academy ofNutrition and Dietetics, Vol. 114, No. 12, Suppl. 3, 2014, pp. S8–S26.
13. Vlassopoulos A, Nutrition criteria to be considered for breakfast drink innovation, NestléResearch Center, 2017 (Internal note).
Open Access This chapter is licensed under the terms of the Creative Commons Attribution 4.0International License (http://creativecommons.org/licenses/by/4.0/), which permits use, sharing,adaptation, distribution and reproduction in any medium or format, as long as you give appropriatecredit to the original author(s) and the source, provide a link to the Creative Commons license andindicate if changes were made.The images or other third party material in this chapter are included in the chapter’s Creative
Commons license, unless indicated otherwise in a credit line to the material. If material is notincluded in the chapter’s Creative Commons license and your intended use is not permitted bystatutory regulation or exceeds the permitted use, you will need to obtain permission directly fromthe copyright holder.
456 N. Espinoza-Orias et al.

The City Performance Tool-How CitiesUse LCM Based Decision Support
Jens-Christian Holst, Katrin Müller, Florian-Ansgar Jägerand Klaus Heidinger
Abstract This paper presents the City Performance Tool (CyPT) approach, aLCA-based methodology for sustainable infrastructure decision support. The workpresents an outside-in view about the methodology, details about the underlyingLCA models and its implementation into a tool. The results for three different citieswill be presented and a general conclusion for the use of LCM-based decisionsupport from a business perspective will be given.
1 Introduction
All over the world, cities are shaped by profound forces: their population, theirtechnologies and their infrastructures. Even today, these forces collide and urban-ization and climate change will spur dramatic changes in metropolitan areas. Citiesneed to pave the way for constant evolution: digital technologies are becomingincreasingly important and urban infrastructures and buildings require a moreefficient and sustainable setup.
These changing environments set free a swarm of urban challenges. Developedcities for instance need to focus on cutting carbon emissions, improving efficiencyin infrastructure and buildings, stimulating a market shift towards cleaner vehiclesand more efficient and environmentally friendly public transportation. At the sametime, infrastructure quality in many advanced economies is deteriorating. Lookingforward to 2030, more than $50 trillion will need to be invested in infrastructureglobally to keep up with GDP and population growth [1].
Cities in emerging markets on the other hand face issues such as power outagesand inadequate public transport and roads, which brake on growth and develop-ment. Infrastructures cannot be built fast enough to keep pace with economic and
J.-C. Holst (&) � K. Müller � F.-A. JägerSiemens AG, Corporate Technology, 13629 Berlin, Germanye-mail: [email protected]
K. HeidingerSiemens AG Austria, Siemensstrasse 90, 1210 Vienna, Austria
© The Author(s) 2018E. Benetto et al. (eds.), Designing Sustainable Technologies,Products and Policies, https://doi.org/10.1007/978-3-319-66981-6_51
457
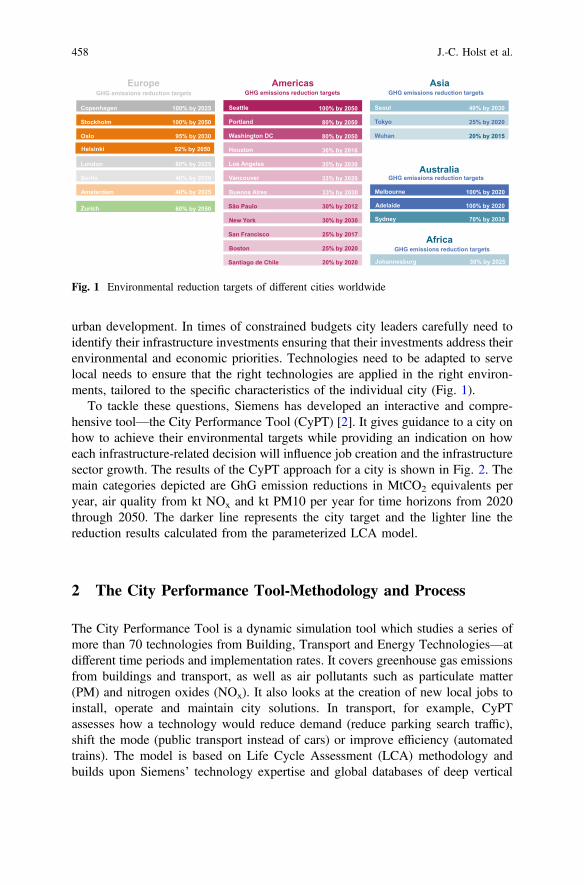
urban development. In times of constrained budgets city leaders carefully need toidentify their infrastructure investments ensuring that their investments address theirenvironmental and economic priorities. Technologies need to be adapted to servelocal needs to ensure that the right technologies are applied in the right environ-ments, tailored to the specific characteristics of the individual city (Fig. 1).
To tackle these questions, Siemens has developed an interactive and compre-hensive tool—the City Performance Tool (CyPT) [2]. It gives guidance to a city onhow to achieve their environmental targets while providing an indication on howeach infrastructure-related decision will influence job creation and the infrastructuresector growth. The results of the CyPT approach for a city is shown in Fig. 2. Themain categories depicted are GhG emission reductions in MtCO2 equivalents peryear, air quality from kt NOx and kt PM10 per year for time horizons from 2020through 2050. The darker line represents the city target and the lighter line thereduction results calculated from the parameterized LCA model.
2 The City Performance Tool-Methodology and Process
The City Performance Tool is a dynamic simulation tool which studies a series ofmore than 70 technologies from Building, Transport and Energy Technologies—atdifferent time periods and implementation rates. It covers greenhouse gas emissionsfrom buildings and transport, as well as air pollutants such as particulate matter(PM) and nitrogen oxides (NOx). It also looks at the creation of new local jobs toinstall, operate and maintain city solutions. In transport, for example, CyPTassesses how a technology would reduce demand (reduce parking search traffic),shift the mode (public transport instead of cars) or improve efficiency (automatedtrains). The model is based on Life Cycle Assessment (LCA) methodology andbuilds upon Siemens’ technology expertise and global databases of deep vertical
Copenhagen
Stockholm
Amsterdam
Oslo
Berlin
London
Seattle
Portland
Vancouver
Washington DC
Los Angeles
Houston
Buenos Aires
São Paulo
Santiago de Chile
New York
Boston
San Francisco
Seoul
Tokyo
Wuhan
Melbourne
Sydney
Johannesburg
100% by 2025
40% by 2025
100% by 2050
40% by 2020
60% by 2025
95% by 2030
100% by 2050
33% by 2020
80% by 2050
35% by 2030
36% by 2016
80% by 2050
33% by 2030
20% by 2020
30% by 2012
25% by 2020
25% by 2017
30% by 2030
40% by 2030
25% by 2020
20% by 2015
100% by 2020
70% by 2030
30% by 2025
Europe Americas Asia
Australia
Africa
GHG emissions reduction targets GHG emissions reduction targets GHG emissions reduction targets
GHG emissions reduction targets
GHG emissions reduction targets
Adelaide 100% by 2020
Helsinki 92% by 2050
Zurich 60% by 2050
Fig. 1 Environmental reduction targets of different cities worldwide
458 J.-C. Holst et al.
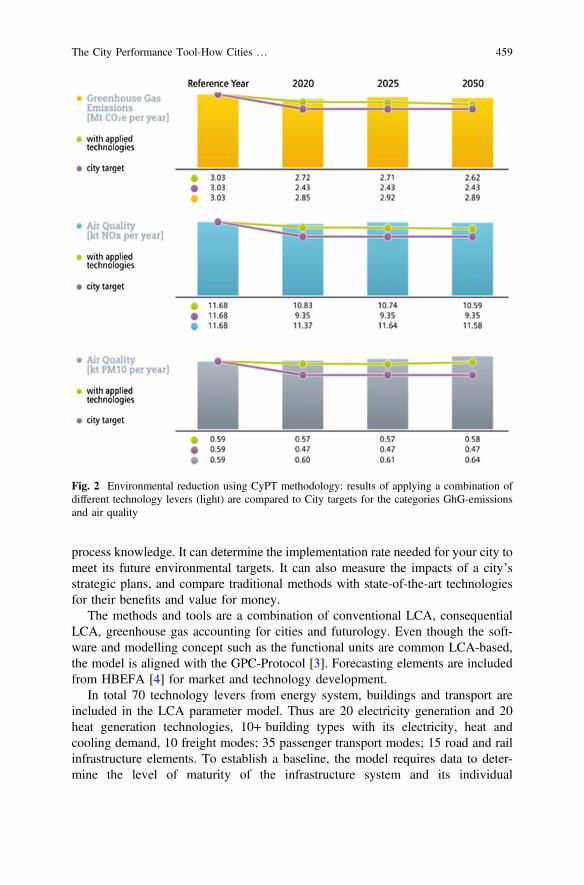
process knowledge. It can determine the implementation rate needed for your city tomeet its future environmental targets. It can also measure the impacts of a city’sstrategic plans, and compare traditional methods with state-of-the-art technologiesfor their benefits and value for money.
The methods and tools are a combination of conventional LCA, consequentialLCA, greenhouse gas accounting for cities and futurology. Even though the soft-ware and modelling concept such as the functional units are common LCA-based,the model is aligned with the GPC-Protocol [3]. Forecasting elements are includedfrom HBEFA [4] for market and technology development.
In total 70 technology levers from energy system, buildings and transport areincluded in the LCA parameter model. Thus are 20 electricity generation and 20heat generation technologies, 10+ building types with its electricity, heat andcooling demand, 10 freight modes; 35 passenger transport modes; 15 road and railinfrastructure elements. To establish a baseline, the model requires data to deter-mine the level of maturity of the infrastructure system and its individual
Fig. 2 Environmental reduction using CyPT methodology: results of applying a combination ofdifferent technology levers (light) are compared to City targets for the categories GhG-emissionsand air quality
The City Performance Tool-How Cities … 459
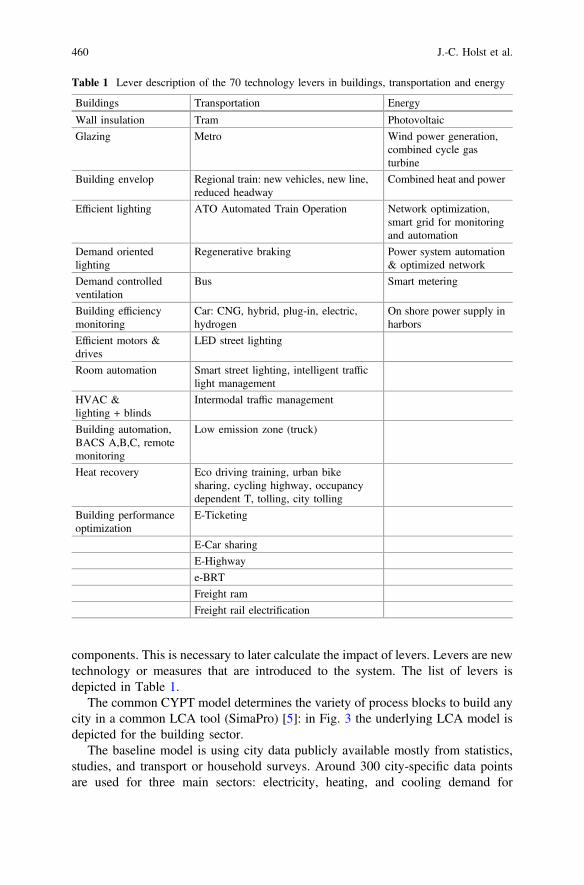
components. This is necessary to later calculate the impact of levers. Levers are newtechnology or measures that are introduced to the system. The list of levers isdepicted in Table 1.
The common CYPT model determines the variety of process blocks to build anycity in a common LCA tool (SimaPro) [5]: in Fig. 3 the underlying LCA model isdepicted for the building sector.
The baseline model is using city data publicly available mostly from statistics,studies, and transport or household surveys. Around 300 city-specific data pointsare used for three main sectors: electricity, heating, and cooling demand for
Table 1 Lever description of the 70 technology levers in buildings, transportation and energy
Buildings Transportation Energy
Wall insulation Tram Photovoltaic
Glazing Metro Wind power generation,combined cycle gasturbine
Building envelop Regional train: new vehicles, new line,reduced headway
Combined heat and power
Efficient lighting ATO Automated Train Operation Network optimization,smart grid for monitoringand automation
Demand orientedlighting
Regenerative braking Power system automation& optimized network
Demand controlledventilation
Bus Smart metering
Building efficiencymonitoring
Car: CNG, hybrid, plug-in, electric,hydrogen
On shore power supply inharbors
Efficient motors &drives
LED street lighting
Room automation Smart street lighting, intelligent trafficlight management
HVAC &lighting + blinds
Intermodal traffic management
Building automation,BACS A,B,C, remotemonitoring
Low emission zone (truck)
Heat recovery Eco driving training, urban bikesharing, cycling highway, occupancydependent T, tolling, city tolling
Building performanceoptimization
E-Ticketing
E-Car sharing
E-Highway
e-BRT
Freight ram
Freight rail electrification
460 J.-C. Holst et al.
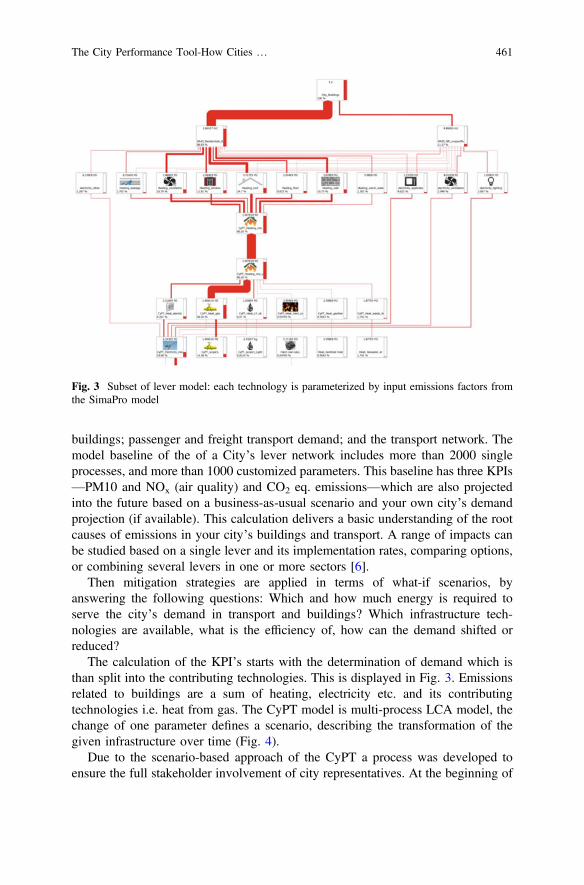
buildings; passenger and freight transport demand; and the transport network. Themodel baseline of the of a City’s lever network includes more than 2000 singleprocesses, and more than 1000 customized parameters. This baseline has three KPIs—PM10 and NOx (air quality) and CO2 eq. emissions—which are also projectedinto the future based on a business-as-usual scenario and your own city’s demandprojection (if available). This calculation delivers a basic understanding of the rootcauses of emissions in your city’s buildings and transport. A range of impacts canbe studied based on a single lever and its implementation rates, comparing options,or combining several levers in one or more sectors [6].
Then mitigation strategies are applied in terms of what-if scenarios, byanswering the following questions: Which and how much energy is required toserve the city’s demand in transport and buildings? Which infrastructure tech-nologies are available, what is the efficiency of, how can the demand shifted orreduced?
The calculation of the KPI’s starts with the determination of demand which isthan split into the contributing technologies. This is displayed in Fig. 3. Emissionsrelated to buildings are a sum of heating, electricity etc. and its contributingtechnologies i.e. heat from gas. The CyPT model is multi-process LCA model, thechange of one parameter defines a scenario, describing the transformation of thegiven infrastructure over time (Fig. 4).
Due to the scenario-based approach of the CyPT a process was developed toensure the full stakeholder involvement of city representatives. At the beginning of
Fig. 3 Subset of lever model: each technology is parameterized by input emissions factors fromthe SimaPro model
The City Performance Tool-How Cities … 461

the process, data is collected on your city’s energy, buildings and transportinfrastructure to customize the CyPT model. Once all the data is collected, theCyPT Manager calculates the environmental baseline for your city based onactivities in the three sectors. Comparing the results with your own targets itidentifies future needs and improvement areas. The CyPT Manager also calculatesthe city-specific impacts of individual technologies. Levers can be pre-selectedbased on results, and city specific plans and policy can also be considered valuablemix of solutions.
A specially developed CyPT app visualizes the effects of individual levers on acity, its buildings and its transport system [7].
3 Inside-Out View—Results from Vienna, Copenhagenand Minneapolis
To understand the outside-in view we will present and discuss results of the CyPTprojects and the resulting infrastructure reports from three different cities: Vienna[8], Copenhagen [9] and Minneapolis [10].
Vienna has set 2025 as the ambitious target year for the city to implement majorinfrastructure technologies in order to meet its environmental and economic targets.This study quantifies the benefits of over thirty building, energy and transporttechnologies and makes recommendations of which infrastructure solutions the cityshould be prioritizing in the run up to 2025, see Fig. 5. This study tested some ofthe technologies in Vienna’s climate action programs named KLiP I and II. It was
Fig. 4 Process of CyPT application in cities: collaboration starts in data collection using the LCA-model and the impacts of technologies for KPI’s like CO2 emission or air quality reduction
462 J.-C. Holst et al.

found that solutions are cost effective in reducing CO2 eq. levels and improving airquality, the city will need to implement more of these intensive carbon reductiontechnologies if it is to meet its 2030 targets.
An investment of €8 bn over the next decade is needed to implement a set oftechnologies that can reduce CO2 eq. emissions in Vienna by 9 Mt and add 85,000full time equivalent jobs to the local economy. In this model, the city is currentlyachieving its reductions predominantly through building and energy technologiesthat are more expensive and do not improve air quality as effectively. Vienna hassome untapped cost-effective technology opportunities to meet its CO2 mitigationtargets. In the energy sector, the city should continue its implementation of com-bined heat and power (Fig. 6).
In the transport sector, the city should invest in new cutting-edge technologiessuch as intermodal traffic management applications, electric car and electric taxisolutions. These are win-win cost effective solutions that tackle CO2 emissions,improve air quality and increase local jobs.
Minneapolis and its development organization Xcel has set a “80 by 50” target,meaning 80% reduction of GhG emissions by 2050 [8]. The outcome of CyPTstudy shows that its utilities need to use 65% clean energy sources as a base of theirenergy mix (Fig. 7).
But even with this step, Xcel will have to continue greening its electricity byimplementing 40 buildings and transportation technologies and adopted at theirhighest implementation rates by 2050 to ensure that targets are met. Our resultsshow that, if the electricity mix gets significantly cleaner, the top performingtechnologies for reducing carbon emissions include (1) electrifying both passengerand freight road transport and (2) improving energy efficiency in buildings, par-ticularly in commercial and government buildings. The technology mix and itsresulting improvements in air quality are depicted in Fig. 8. Additional benefitscould be realized from public transit, if more people could be attracted to use it.
Fig. 5 Lever mix used in the Vienna CyPT project from already implemented to experimentaltechnologies
The City Performance Tool-How Cities … 463

Copenhagen has been and continues to lead cities on climate policy globally. Itranked top of Siemens’ European Green City Index in 2009 [11], and it is makinggreat strides meeting its 2025 target for carbon neutrality. Siemens has used theCyPT and found that the City of Copenhagen is reducing emissions from nearly allof the sources where it has significant control in energy and transport.
Copenhagen is decoupling its CO2 eq. emissions so that despite a growingpopulation and increasing building floor-space, carbon emissions are expected todecrease over the next 10 years. This is predominantly derived from greenernational electricity and local heating mixes. Using our accounting standard thatcaptures direct and indirect emissions, our model quantifies these savings as high as
Fig. 6 Cost effectiveness comparison: the larger the bubble the more jobs the technology willinduce. Bubbles on the top right of the chart, reduce the larger amount of greenhouse gases andPM10 levels per unit of investment Technologies such as plug-in hybrid electric cars that improveair quality and reduce CO2 most effectively
Fig. 7 Resulting emission reduction (CO2 eq.) applying a 65% clean energy mix
464 J.-C. Holst et al.

12% of current annual emissions. These are savings achieved from the expansion ofwind power and biomass for combined heat and power in the 2025 Climate Plan.Maintaining its global leadership position will require delivering further buildingupgrades within its own public stock and incentivizing private building owners totake action to improve the efficiency of their buildings. The city will also have tostimulate a market shift towards cleaner vehicles and a modal shift towards lowcarbon public transportation. The report indicates that intelligent administrativeinner-city infrastructure investments in energy or mass transit must be accompaniedby effective incentives for the private sector, as well as a good national frameworkto promote alternative mobility and cost-effective renewable energy (Fig. 9).
PM10 Annual Emissions Reductions, by Technology(kg PM10)
61% Reduction in PM10 Annual
Emissions between 2006
and 2050
Fig. 8 The CyPT for Minneapolis shows which technology has the greatest air qualityimprovement potential and its reduction values
40 building owners own
20%
6 technologies, 10% reductions
5 mill. EUR investment per
year
18.000+ jobs to the local economy
Fig. 9 Major CyPT results for Copenhagen
The City Performance Tool-How Cities … 465
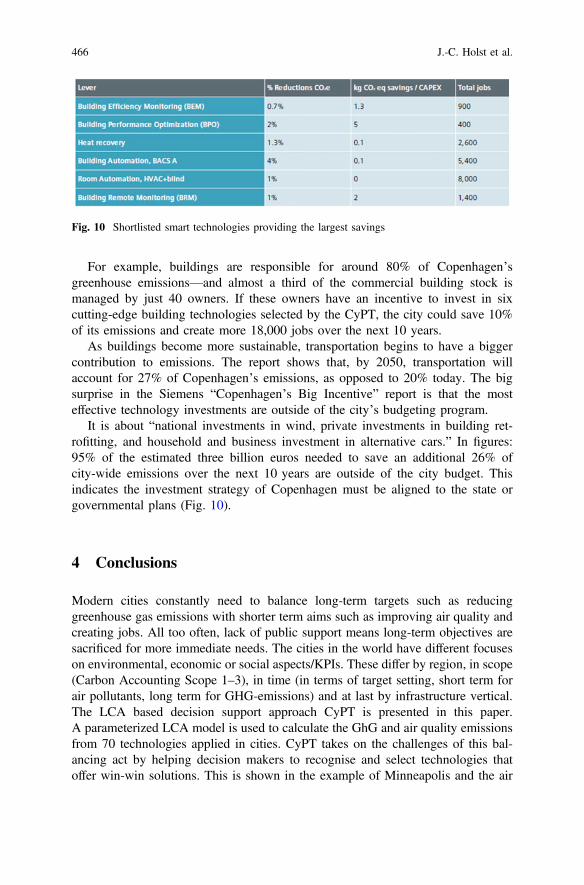
For example, buildings are responsible for around 80% of Copenhagen’sgreenhouse emissions—and almost a third of the commercial building stock ismanaged by just 40 owners. If these owners have an incentive to invest in sixcutting-edge building technologies selected by the CyPT, the city could save 10%of its emissions and create more 18,000 jobs over the next 10 years.
As buildings become more sustainable, transportation begins to have a biggercontribution to emissions. The report shows that, by 2050, transportation willaccount for 27% of Copenhagen’s emissions, as opposed to 20% today. The bigsurprise in the Siemens “Copenhagen’s Big Incentive” report is that the mosteffective technology investments are outside of the city’s budgeting program.
It is about “national investments in wind, private investments in building ret-rofitting, and household and business investment in alternative cars.” In figures:95% of the estimated three billion euros needed to save an additional 26% ofcity-wide emissions over the next 10 years are outside of the city budget. Thisindicates the investment strategy of Copenhagen must be aligned to the state orgovernmental plans (Fig. 10).
4 Conclusions
Modern cities constantly need to balance long-term targets such as reducinggreenhouse gas emissions with shorter term aims such as improving air quality andcreating jobs. All too often, lack of public support means long-term objectives aresacrificed for more immediate needs. The cities in the world have different focuseson environmental, economic or social aspects/KPIs. These differ by region, in scope(Carbon Accounting Scope 1–3), in time (in terms of target setting, short term forair pollutants, long term for GHG-emissions) and at last by infrastructure vertical.The LCA based decision support approach CyPT is presented in this paper.A parameterized LCA model is used to calculate the GhG and air quality emissionsfrom 70 technologies applied in cities. CyPT takes on the challenges of this bal-ancing act by helping decision makers to recognise and select technologies thatoffer win-win solutions. This is shown in the example of Minneapolis and the air
Fig. 10 Shortlisted smart technologies providing the largest savings
466 J.-C. Holst et al.
quality improvement potentials and the underlying technology mix. CyPT high-lights the benefits from key performance indicators to enable city leaders to deliverlong-term advantages strongly linked to short-term gains. Cities can maximiseCyPT results by identifying the most cost-effective solutions for improving airquality and reducing greenhouse gas emissions. By studying capital and operationalinvestments across the lifespan of each technology, CyPT can report on kilogramsof CO2 eq. as well as PM10 and NOx levels for every euro spent. This was shown inthe example of Vienna, where untapped cost-effective technology opportunitiesshow how to meet its CO2 mitigation targets. The CyPT helps to optimizeinvestment strategies for your city’s long-term needs. This was shown at theexample of Copenhagen, where almost all of the technology investments mustcome from sources outside of the city budget.
References
1. Economist.com (2014),. Investing in infrastructure: The trillion dollar ga. Available at: http://www.economist.com/news/leaders/21599358-how-get-more-wolrds-savings-pay-new-roads-airports-and-electricity.
2. https://www.siemens.com/global/en/home/company/topic-areas/intelligent-infrastructure/cities-on-the-move.html??stc=wwcg106121.
3. Fong W, Sotos M, Doust M, et al., The Global Protocol for Community-Scale GreenhouseGas Emission Inventories (GPC), 1st Ed., Greensouse Gas Protocol, 2014. http://ghgprotocol.org/greenhouse-gas-protocol-accounting-reporting-standard-cities, (Accessed 18.04.2017).
4. Keller M, Wuethrich P, Ickert L, Schmied M, Stutzer B, et al., Handbook Emission Factorsfor Road Transport, 3.2 Ed., INFRAS AG, 25.7.2014.
5. https://simapro.com/licences/#/business.6. https://www.siemens.com/de/de/home/unternehmen/themenfelder/intelligente-infrastruktur/
city-performance-tool.html.7. http://www.dgterritorio.pt/2015-4-23-10-20-42-78__SavvasVerdisUrbanAnalyticsLisbon 2015.
pdf.8. https://www.siemens.com/content/dam/internet/siemens-com/global/company/topic-areas/
intelligent-infrastructuree/resilience/report/summary-vienna-report-oct-2014.pdf.9. https://www.siemens.com/content/dam/internet/siemens-com/global/company/topic-areas/
intelligent-infrastructuree/resilience/report/summary-copenhagen-cypt-report-oct-2015.pdf.10. https://www.siemens.com/content/dam/internet/siemens-com/global/company/topic-areas/
intelligent-infrastructuree/resilience/report/summary-minneapolis-cypt-report-dec-2015.pdf.11. http://www.siemens.com/entry/cc/features/greencityindex_international/all/de/pdf/gci_report_
summary.pdf.
The City Performance Tool-How Cities … 467

Open Access This chapter is licensed under the terms of the Creative Commons Attribution 4.0International License (http://creativecommons.org/licenses/by/4.0/), which permits use, sharing,adaptation, distribution and reproduction in any medium or format, as long as you give appropriatecredit to the original author(s) and the source, provide a link to the Creative Commons license andindicate if changes were made.The images or other third party material in this chapter are included in the chapter’s Creative
Commons license, unless indicated otherwise in a credit line to the material. If material is notincluded in the chapter’s Creative Commons license and your intended use is not permitted bystatutory regulation or exceeds the permitted use, you will need to obtain permission directly fromthe copyright holder.
468 J.-C. Holst et al.
Sustainability of Bio-based Products:Linking Life Cycle Thinkingwith Standards, Certificationand Labelling Schemes
Mauro Cordella and Renata Kaps
Abstract This session gathered contributions showing how Life Cycle Thinkingcan feed in the development of sustainability criteria, the certification and, ulti-mately, the policy making for bio-based products and processes. The session wascomposed of five presentations related to methodological approaches, case studiesand real life examples, which were followed by a panel discussion. The addressedsubjects covered the sustainability assessment of bio-based plastics, marinebiotechnology processes, bio-based lubricants and forestry sector, and the assess-ment of the water scarcity. Key issues which emerged from the discussion include:the methodological difficulties in comparing bio-based and conventional products;the availability of data; the need to keep research focused on practical applicationsand increase the interest of industry.
1 Introduction
During the LCM 2017 conference, the Circular Economy & Industrial Leadershipunit of the Joint Research Centre chaired a session on ‘Sustainability of bio-basedproducts: linking life cycle thinking with standards, certification and labellingschemes’.
This session aimed at gathering contributions showing how Life Cycle Thinkingcan be used to feed into the development of sustainability criteria, the certificationand ultimately the policy making for bio-based products and processes, as forinstance lubricants, cosmetics, plastics, construction materials.
Products and processes using bio-based materials play an important role in theeconomy and, consequently, in the European policy. Bio-based materials may offerpotential benefits in terms of reducing fossil fuel depletion and emission of green-house gases and creating employment opportunities in rural areas, among others.
M. Cordella (&) � R. KapsCircular Economy and Industrial Leadership Unit, European Commission,Joint Research Centre, Seville, Spaine-mail: [email protected]
© The Author(s) 2018E. Benetto et al. (eds.), Designing Sustainable Technologies,Products and Policies, https://doi.org/10.1007/978-3-319-66981-6_52
469
However, their sustainability depends on the geographical and technical charac-teristics of each biomass-to-product value chain, which may result in trade-offsbetween different aspects (e.g. land use, water consumption, deforestation).
Efforts to develop multi-disciplinary approaches to assess the sustainability ofbio-based products have yielded a broad range of case studies. Nevertheless, nocommonly agreed approaches exist and the information available in the literatureseems to have only limited practical application.
2 Session Wrap-up
The session was composed of five contributions and a closing panel discussionconcerning the session’s theme. Above 70 participants attended this session.Results and discussion are summarised below.
2.1 Integrating Life Cycle Assessment(LCA) and Eco-design Strategies for a SustainableProduction of Bio-based Plastics
This presentation was given by Mr. Venkateshwaran Venkatachalam from theInstitute for Bioplastics and Biocomposites of University of Applied Sciences andArts of Hannover (Germany).
The authors described an approach for addressing the development of sustain-able bio-plastic products since their early design phase [1]. The approach aims tointegrate LCA considerations in the definition of eco-design strategies of a product,with the ambition to cover technical, economic, ergonomic, market, and environ-mental aspects along the entire production chain of a product system.
A personal computer’s mouse was taken as a case study to show how theapproach could work in practice. Production and supply of materials were identifiedas the life cycle hot spots. Criteria required for the selection of bio-polymers wereproposed based on technical and environmental aspects. Finally, further develop-ment needs and challenges of this approach were presented. These in particularrefer to the comparison of bio- versus conventional plastic products and the inte-gration of consequential LCA to better understand market mechanisms.
The presenter was asked about the future perspectives of their research andwhich eco-design requirements should be set to ensure the production and supply ofsustainable materials, being these the main hot-spots from a life cycle point of view.It was answered that future perspectives may embrace biodegradability and com-posting of bio-plastics and that the identification of eco-design strategies has so farfocused on processes and not on the applications.
470 M. Cordella and R. Kaps
2.2 Sustainability Assessment of Blue BiotechnologyProcesses: Addressing Environmental, Socialand Economic Dimensions
This presentation was given by Ms. Maria Teresa Moreira from the Department ofChemical Engineering of the University of Santiago de Compostela (Spain).
The authors showed the results of their research on environmental, social andeconomic assessment of a marine biotechnology process for the production of thered carotenoid astaxanthin by the green microalga Haematococcus pluvialis [2].
This is an interesting and novel case study, since only few research projects havedealt so far with the assessment of bioactive compounds and pharmaceuticalingredients, mainly due to the lack of information from commercial-scale facilities.In this study, process data for the compilation of the life cycle inventory wascollected from real facilities at lab, semi-pilot and pilot scale.
Consumption of electricity during the algal cultivation was spotted as the largestcontribution to the environmental impacts. However, a significant improvementwas observed in the scale-up of the process. A socio-economic evaluation com-pleted the environmental assessment, identifying the main strengths of the processfrom a holistic perspective.
The presenter was asked how the social assessment was carried-out and also if acomparison with the conventional chemical process was conducted. It wasexplained that the social assessment was based on the reply of two SMEs to asurvey sent in the course of the study. The assessed biotechnology process wascompared with a conventional one and was found to have lower environmentalimpacts.
2.3 Addressing the Sustainability of Lubricantsfrom an LCA Perspective
This presentation was given by Ms. Candela Vidal-Abarca Garrido from theCircular Economy and Industrial Leadership Unit of the Joint Research Centre.
The authors described their work about the revision of the EU Ecolabel forlubricants, a voluntary label targeting the best lubricants available on the market interms of their environmental performance throughout the life cycle [3].
The existing award criteria focus on renewability of raw materials, aquatictoxicity, biodegradability and bio-accumulation of the ingredients. The label iscurrently suitable only for bio-based lubricants and considered the main reference toassess their sustainability.
A review of twelve LCA studies on lubricants was carried-out to identifyhot-spots and improvement areas. Although impacts during use and disposal stageswere found critical, most of the reviewed LCAs are cradle-to-gate studies, whichcalls for a more comprehensive assessment of the full life cycle. Outcomes of the
Sustainability of Bio-based Products … 471
LCA review did not support the environmental preference of bio-based lubricants.Based on this, the approach suggested for this EU Ecolabel revision is to focus on‘loss lubricants’ (i.e. released during use phase) independently from their sourcing.Toxicity and biodegradability are considered the main aspects to be addressed.
Some clarifications were asked about how the LCA review was conducted andwhich differences were found between various types of lubricants. Trade-offs wereidentified between conventional and bio-based lubricants. For the latter ones,environmental concerns are significantly associated with the agricultural stage,impacts of which could be mitigated through third-party certified sourcing ofsustainable bio-based materials. Additionally, the life cycle performance was foundto depend on the application. For instance, conventional and/or synthetic lubricantstend to have longer lifetime, which can be advantageous in some cases. However,some synthetic (e.g. PAGs, PAOs, esters) and bio-based lubricants could havebetter performance with respect to toxicity and biodegradability than the conven-tional mineral ones.
2.4 Recommended Water Scarcity Footprint MethodAWARE: Learning from 11 Case Studies
This presentation was given by Ms. Anne-Marie Boulay representing LIRIDE(University of Sherbrooke, Canada) and CIRAIG (Polytechnique of Montreal,Canada).
The authors described the testing phase of AWARE, a consensus-based indicatordeveloped by the WULCA working group of the UNEP-SETAC Life CycleInitiative in order to assess impacts from water consumption at the midpoint level.This method can be an important milestone for harmonising the assessment ofproducts with respect to water scarcity [4].
The methodology, candidate for inclusion in the European Commission’sEnvironmental Footprint (EF) guide, has been applied to eleven case studies to gaininsights on method, associated results and reference values. The selected casestudies were: an Italian beer, a biofuel, a bio-based plastic, cement, sweet bever-ages, a flow-regulator, an average basket of food products, a burger, a Volkswagencar, a bowl of rice, the EU total consumption.
No major problems were found although some challenges were encountered forinterpreting country level data and testing the sensitivity of modelling choices (e.g.cut-offs and water demand for ecosystems). All in all, the results are considered tobuild trust in this and contributing to its wider acceptance.
The presenter was asked to provide further arguments supporting the choice ofAWARE since other methods can also be used to yield similar outcomes. It wasclarified that AWARE is the result of a consensus process aiming to develop awidely agreed method.
472 M. Cordella and R. Kaps

2.5 Sustainability Assessment of the PortugueseForest Sector
This poster spotlight was provided by Ms. Ana Dias from the Centre forEnvironmental and Marine Studies (CESAM) and the Department of Environmentand Planning of University of Aveiro (Portugal).
Authors of this contribution introduced the audience to Sustain For, a projectaiming at assessing the possible effects of a transition to a bio-economy in Portugal[5].
The project will select environmental, economic and social indicators to evaluatethe sustainability of the forest sector and apply them to evaluate current impacts oftwo Portuguese forest sectors (eucalypt and maritime pine); and will also identifyopportunities for improving the sustainability of these sectors.
The full value chain of a representative basket of products (paper, solid woodproducts, fuels and bio-based chemical products) will be assessed. Trade-offsbetween sustainability pillars, sectors, subsectors and impacts will be identified.
The authors wisely point out that a transition to a bio-economy, despite itsopportunities and advantages, could reduce the availability of wood resources forother applications. This is already a reality in some countries as Portugal. Differentmanagement and policy strategies for using wood resources more efficiently shouldbe adopted.
2.6 Panel Discussion
A panel discussion was opened after the five presentations. The first aspects dis-cussed related to the comparison of bio-based and conventional products. It is clearthat trade-offs exist. Raw materials and land use were pointed out by several pre-senters as hot-spots, which need to be carefully evaluated in the case of bio-basedproducts. A consistent assessment should moreover include the end of life stage,which is quite often neglected.
A second point of discussion was related to the decision making process andwhat should be done to achieve practical effects. The main barrier seems to be thelack of LCA data. Improving data sharing could have positive effects. Anotherdriver could be increasing the interest of industry. A presenter reported that envi-ronmental assessments conducted by industry are often driven by external factorsrather than by real company interests. This calls for enhancing the interactionbetween research and industrial sectors, also to make clearer which are the dataneeds and the added value of outcomes. Another presenter raised the attention alsoto the importance of consumer behaviour and perception.
Sustainability of Bio-based Products … 473
3 Conclusions
The session confirmed that there are still data and methodological gaps which needto be filled to get a comprehensive understanding of the life cycle impacts ofbio-based materials. Challenging aspects include in particular the multiple assess-ment of alternative sources and uses of biomass feedstock, also in comparison withconventional materials, and the comprehensive understanding of the consequencesat macro-level. Moreover, it seems necessary to incentivise the transition fromtheoretical assessments to more practical applications.
Although further developments are still needed, the contributions presented,which ranged from methodological approaches to case studies and real life exam-ples, can hopefully contribute to make progresses in the assessment of bio-basedproducts and to support the related decision making processes.
References
1. Venkatachala V, Spierling S, Endres H-J, Integrating Life Cycle Assessment (LCA) andEco-design strategies for a sustainable production of bio-based plastics, Proceedings of theLCM 2017 conference, Luxembourg, 2017.
2. Pérez-López P, Feijoo G, Moreira M-T, Sustainability assessment of blue biotechnologyprocesses: addressing environmental, social and economic dimensions, Proceedings of theLCM 2017 conference, Luxembourg, 2017.
3. Vidal-Abarca Garrido C, Kaps R, Cordella M, Wolf O, Addressing the sustainability of lubricantsfrom an LCA perspective, Proceedings of the LCM 2017 conference, Luxembourg, 2017.
4. Boulay A-M, Bayart J-B, Beley J-J, Berger M, Caldeira C, Frischknecht R, Kabe Y-H,Manzardo A, Tirado P, Pfister S, Puerto M, Sala S, Schenker U, Recommended water scarcityfootprint method AWARE: learning from 11 case studies, Proceedings of the LCM 2017conference, Luxembourg, 2017.
5. Dias A, Quinteiro P, Costa T, Arroja L, Castanheira E, Garcia R, Marques P, Malça J, Freire F,Sustainability assessment of the Portuguese forest sector, Proceedings of the LCM 2017conference, Luxembourg, 2017.
Open Access This chapter is licensed under the terms of the Creative Commons Attribution 4.0International License (http://creativecommons.org/licenses/by/4.0/), which permits use, sharing,adaptation, distribution and reproduction in any medium or format, as long as you give appropriatecredit to the original author(s) and the source, provide a link to the Creative Commons license andindicate if changes were made.The images or other third party material in this chapter are included in the chapter’s Creative
Commons license, unless indicated otherwise in a credit line to the material. If material is notincluded in the chapter’s Creative Commons license and your intended use is not permitted bystatutory regulation or exceeds the permitted use, you will need to obtain permission directly fromthe copyright holder.
474 M. Cordella and R. Kaps
Sustainability Assessment of BlueBiotechnology Processes: AddressingEnvironmental, Social and EconomicDimensions
Paula Pérez-López, Gumersindo Feijoo and María Teresa Moreira
Abstract The biotechnological development has traditionally focused on thecompliance with regulatory demands rather than optimising the processes or ana-lysing their sustainability. This work proposes the combination of available toolsfor the comprehensive sustainability assessment of a blue biotechnology processbased on the cultivation of the microalgae Haematococcus pluvialis. The work aimsto include environmental, economic and social dimensions to measure the sus-tainability of the production of a carotenoid with potential applications in food,nutraceutical, cosmetics and eventually pharmaceutical industries. Electricity forcultivation was identified as the major contributor to the environmental impacts,which depended significantly on the production scale. Social benefits were mainlyrelated to workers and consumers, while the economic assessment suggested aprofitable process with a relatively short period to recover the initial investment.
1 Introduction
Biotechnology is a wide industrial sector that ranges from high value, low volumeproducts such as pharmaceuticals to low value commodities such as biofuels. Themain effort to date has focused on implementing processes effectively to meetthe regulatory demands more than optimising the operations or analysing thesustainability, especially in the case of fine chemicals [1]. Nevertheless, there havebeen several attempts to develop methodologies for the measurement of bioprocesssustainability in the last decade [2, 3].
P. Pérez-López (&) � G. Feijoo � M. T. MoreiraDepartment of Chemical Engineering, Institute of Technology,University of Santiago de Compostela, 15782 Santiago de Compostela, Spaine-mail: [email protected]
P. Pérez-LópezCentre Observation, Impacts, Energie (O.I.E.), MINES ParisTech,PSL Research University, 1 Rue Claude Daunesse CS 10207, 06904Sophia Antipolis Cedex, France
© The Author(s) 2018E. Benetto et al. (eds.), Designing Sustainable Technologies,Products and Policies, https://doi.org/10.1007/978-3-319-66981-6_53
475
Life Cycle Assessment (LCA) is one of the available methodologies to measurethis sustainability holistically, although few LCAs applied to bioactive compoundsand pharmaceutical ingredients are found in literature [2–4]. In the case of blue (i.e.marine) biotechnology, which involves the exploration and exploitation of newproducts from marine organisms, the LCA studies conducted to date mainly anal-ysed the cultivation and extraction of fractions from microalgae and seaweed. Theyfocus on relatively low value commodities, namely biofuels [5]. Most of the workdealt with the production of biodiesel by transesterification, although other bioen-ergy sources (bioethanol, biogas …) have also been evaluated. Few examples ofLCA studies addressing the production of high-value chemicals and bioactivecompounds from marine sources are available, due to the lack of information fromcommercial-scale facilities [4, 5]. The studies generally rely on extrapolations andsimulation models rather than field data from operating systems [5].
According to the principles of sustainable development, measuring sustainabilityfor supply chain decision-making requires the integration of social and economicdimensions together with environmental aspects [6]. To this end, an integratedframework for Life Cycle Sustainability Assessment (LCSA) is proposed. Itcombines conventional LCA with social LCA (SLCA) and Life Cycle Costing(LCC) [7], based on UNEP/SETAC guidelines [8] for SLCA and [9, 10] for LCC.
In this work, the sustainability of a blue biotechnology process, namely theproduction of the red carotenoid astaxanthin by the green microalgaHaematococcus pluvialis, is evaluated. Astaxanthin is a high-value red carotenoidwith numerous applications in food and feed industries, nutraceuticals and cos-metics [11]. Given its antioxidant and anti-inflammatory properties, astaxanthin issuggested to play a beneficial role in human health for the protection of skin cellsagainst UV-light photo-oxidation, slowing of age-related diseases and even controlof carcinogenic processes [11, 12]. Astaxanthin can be obtained from microalgae ina two-stage process: in the first stage the biomass is cultivated in a photo-bioreactor(PBR) under favourable growth conditions whereas in the second stage, adverseconditions are promoted to induce the accumulation of astaxanthin within thebiomass [13].
A comprehensive sustainability assessment is here presented, based on processdata from real facilities for algae cultivation and astaxanthin extraction at lab,semi-pilot and pilot scale. An environmental LCA jointly with a socio-economicassessment was conducted following SLCA existing guidelines and a Cost-BenefitAnalysis (CBA) approach to complete the evaluation by taking the three dimen-sions of sustainability into account.
2 Methodology
The three dimensions of sustainability (environmental, social and economic) areevaluated in this work according to a cradle-to-gate perspective based on theLife Cycle Thinking principles. The environmental LCA followed ISO14040
476 P. Pérez-López et al.
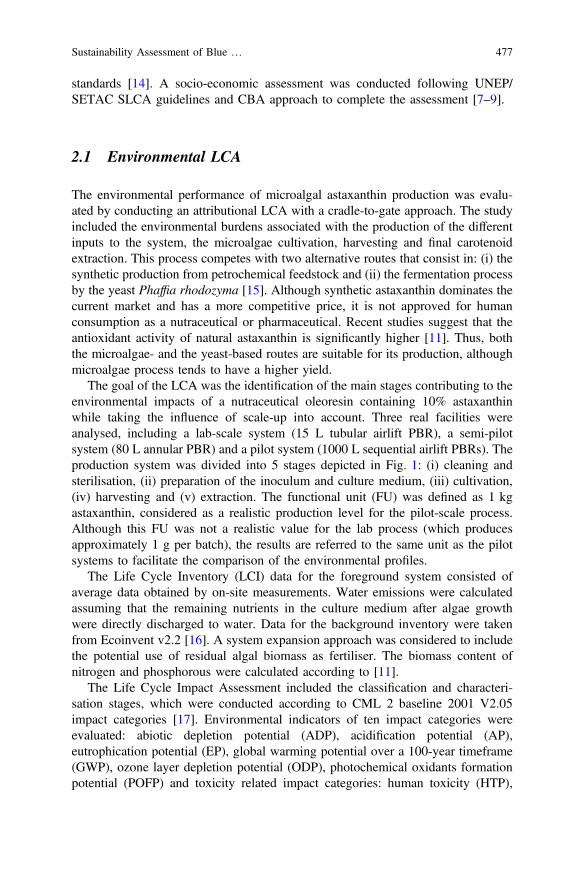
standards [14]. A socio-economic assessment was conducted following UNEP/SETAC SLCA guidelines and CBA approach to complete the assessment [7–9].
2.1 Environmental LCA
The environmental performance of microalgal astaxanthin production was evalu-ated by conducting an attributional LCA with a cradle-to-gate approach. The studyincluded the environmental burdens associated with the production of the differentinputs to the system, the microalgae cultivation, harvesting and final carotenoidextraction. This process competes with two alternative routes that consist in: (i) thesynthetic production from petrochemical feedstock and (ii) the fermentation processby the yeast Phaffia rhodozyma [15]. Although synthetic astaxanthin dominates thecurrent market and has a more competitive price, it is not approved for humanconsumption as a nutraceutical or pharmaceutical. Recent studies suggest that theantioxidant activity of natural astaxanthin is significantly higher [11]. Thus, boththe microalgae- and the yeast-based routes are suitable for its production, althoughmicroalgae process tends to have a higher yield.
The goal of the LCA was the identification of the main stages contributing to theenvironmental impacts of a nutraceutical oleoresin containing 10% astaxanthinwhile taking the influence of scale-up into account. Three real facilities wereanalysed, including a lab-scale system (15 L tubular airlift PBR), a semi-pilotsystem (80 L annular PBR) and a pilot system (1000 L sequential airlift PBRs). Theproduction system was divided into 5 stages depicted in Fig. 1: (i) cleaning andsterilisation, (ii) preparation of the inoculum and culture medium, (iii) cultivation,(iv) harvesting and (v) extraction. The functional unit (FU) was defined as 1 kgastaxanthin, considered as a realistic production level for the pilot-scale process.Although this FU was not a realistic value for the lab process (which producesapproximately 1 g per batch), the results are referred to the same unit as the pilotsystems to facilitate the comparison of the environmental profiles.
The Life Cycle Inventory (LCI) data for the foreground system consisted ofaverage data obtained by on-site measurements. Water emissions were calculatedassuming that the remaining nutrients in the culture medium after algae growthwere directly discharged to water. Data for the background inventory were takenfrom Ecoinvent v2.2 [16]. A system expansion approach was considered to includethe potential use of residual algal biomass as fertiliser. The biomass content ofnitrogen and phosphorous were calculated according to [11].
The Life Cycle Impact Assessment included the classification and characteri-sation stages, which were conducted according to CML 2 baseline 2001 V2.05impact categories [17]. Environmental indicators of ten impact categories wereevaluated: abiotic depletion potential (ADP), acidification potential (AP),eutrophication potential (EP), global warming potential over a 100-year timeframe(GWP), ozone layer depletion potential (ODP), photochemical oxidants formationpotential (POFP) and toxicity related impact categories: human toxicity (HTP),
Sustainability Assessment of Blue … 477
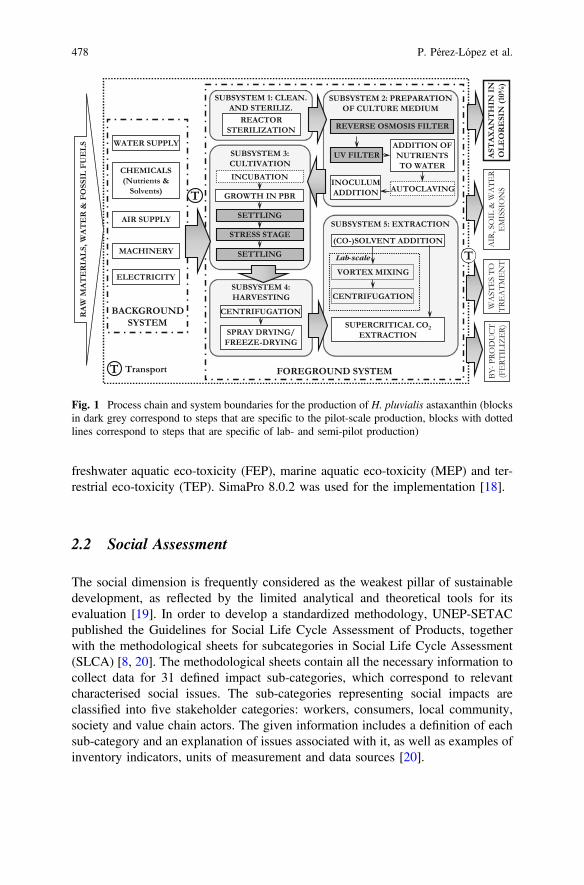
freshwater aquatic eco-toxicity (FEP), marine aquatic eco-toxicity (MEP) and ter-restrial eco-toxicity (TEP). SimaPro 8.0.2 was used for the implementation [18].
2.2 Social Assessment
The social dimension is frequently considered as the weakest pillar of sustainabledevelopment, as reflected by the limited analytical and theoretical tools for itsevaluation [19]. In order to develop a standardized methodology, UNEP-SETACpublished the Guidelines for Social Life Cycle Assessment of Products, togetherwith the methodological sheets for subcategories in Social Life Cycle Assessment(SLCA) [8, 20]. The methodological sheets contain all the necessary information tocollect data for 31 defined impact sub-categories, which correspond to relevantcharacterised social issues. The sub-categories representing social impacts areclassified into five stakeholder categories: workers, consumers, local community,society and value chain actors. The given information includes a definition of eachsub-category and an explanation of issues associated with it, as well as examples ofinventory indicators, units of measurement and data sources [20].
AST
AX
AN
TH
IN I
N
OL
EO
RE
SIN
(10
%)
AIR
, SO
IL &
WA
TER
EM
ISSI
ON
S
FOREGROUND SYSTEM
BACKGROUND SYSTEM
RA
W M
AT
ER
IAL
S, W
AT
ER
& F
OSS
IL F
UE
LS
CHEMICALS (Nutrients &
Solvents)
MACHINERY
ELECTRICITY
AIR SUPPLY
WA
STE
S TO
TR
EA
TME
NT
BY-P
ROD
UCT
(F
ERT
ILIZ
ER)
WATER SUPPLY
SUBSYSTEM 1: CLEAN. AND STERILIZ.
SUBSYSTEM 2: PREPARATION OF CULTURE MEDIUM
SUBSYSTEM 3: CULTIVATION
SUBSYSTEM 4: HARVESTING
SUBSYSTEM 5: EXTRACTION
REACTOR STERILIZATION
GROWTH IN PBR
CENTRIFUGATION
SPRAY DRYING/ FREEZE-DRYING
ADDITION OF NUTRIENTS TO WATER
AUTOCLAVINGINOCULUM ADDITION
(CO-)SOLVENT ADDITION
VORTEX MIXING
CENTRIFUGATION
T
T Transport
T
INCUBATION
REVERSE OSMOSIS FILTER
UV FILTER
SETTLING
STRESS STAGE
SETTLING
SUPERCRITICAL CO2
EXTRACTION
Lab-scale
Fig. 1 Process chain and system boundaries for the production of H. pluvialis astaxanthin (blocksin dark grey correspond to steps that are specific to the pilot-scale production, blocks with dottedlines correspond to steps that are specific of lab- and semi-pilot production)
478 P. Pérez-López et al.
In this case, the methodological sheets were taken as a basis to perform the socialassessment of the H. pluvialis astaxanthin production. Thus, a specific questionnairewas developed, dealing with key issues and possible indicators related to thesub-categories that were relevant for the scope of the assessment. The questionnairewas fulfilled by two small and medium enterprises (SMEs) located in France andIreland. For confidentiality reasons, the companies are referred to as SME 1 andSME 2 in the results section.
Three stakeholder groups were considered as the most representative in thespecific context of the study: workers, consumers and society. For each of them, theselected indicators were grouped into sub-categories and measured in quantitativeor semi-quantitative terms. Indicators for workers included annual salary,women-to-man ratio considering the total number of employees of each SME,women-to-man salary difference for the country and working hours per week. Forconsumers, impacts and benefits of the product were measured in terms of tests andsafety information provided, customer service and information on formulation anduse, value added of the product, natural origin, etc. Indicators for the societyincluded the relative importance of blue biotechnology in the country, potentialmarket share for the studied companies, compliance with certifications, existence ofsigned codes of conduct on sustainability, etc.
Following the approach of previous social LCA works [21], each indicator wasexpressed according to a numeric index based on the risk level in order to betterunderstand the social impact information. As shown in Fig. 2, the index for eachindicator ranged from 1 to 4, being 1 the corresponding value for the worst scenario(highest risk) and 4 the index for the ideal scenario (no risk at all). In the case ofstakeholder “workers”, all the selected indicators were quantitative. The index foreach indicator was calculated with respect to minimum and maximum risk levels inthe world according to the values reported by OECD [22], Statista [23] and theWorld Economic Forum [24]. For each subcategory, the index was then obtained asthe average index of the set of indicators assigned to this subcategory. For thestakeholders “consumers” and “society”, most indicators had a Yes/No format;therefore, all the impacts related to these subcategories were converted intosemi-quantitative terms through a scoring system. For Yes/No indicators, a value of1 was assigned to negative response and a value of 4 was considered for affirmativeresponse. In the case of some specific indicators, intermediate values were assignedaccording to expertise knowledge.
Soci
al
indi
cato
rs Quantitative (real valueof the company)
SOCIETYContribution to econ.
development
WORKERS Genderequality
Quantification of indicators
Normalization(index between 1-4)
Classification intostakeholders and subcat.
Semi-quantitative(Yes/No or Low/
Intermediate/High)
Minimum and maximum in theworld represent extreme values
Yes/No => extreme values
Low/High => rated by expert
Fig. 2 Scheme of the method applied for the social impact assessment
Sustainability Assessment of Blue … 479
2.3 Economic Analysis
As economic aspects cannot be neglected in life cycle based sustainabilityassessment, a CBA approach is here proposed to evaluate this dimension. CBA is abasic decision-making tool included by Huppes et al. [9] among the methods toaddress the economic dimension of sustainability. It allows the comparison betweendifferent proposals according to the net profit of each option. As the integration ofboth CBA and LCA is now being widespread for the combined assessment ofeconomic and environmental aspects [10, 25], this methodology has been selectedfor the evaluation of astaxanthin production.
CBA aims to compare the economic feasibility of a project or process by takinginto account the costs and benefits over its life time [10, 25]. The starting point ofthe tool is the premise that a project should only be developed if all the benefitsexceed the aggregated costs. This premise is checked out by considering the netprofit of a process as the difference between benefits and costs:
NP ¼X
Bi þX
Ci ð1Þ
Where NP is the net profit, Bi > 0 is the value of the benefit item i and Ci < 0 isthe value of the cost item i. Thus, if the result of the calculation is NP > 0, then theproject is economically viable, whereas if NP < 0 the project is not viable ineconomic terms. The implementation of CBA requires that all benefits and costs areexpressed in the same units. In projects related to environmental issues (e.g.operation of wastewater treatment plants), this restriction may require a complexhomogenisation method for the quantification in monetary terms. However, in thecase of the addressed process, the only benefit corresponded to the production of ahigh value molecule with biological properties, so the benefits could be measured inthe same units as for costs (monetary units) and no method of homogenisation wasneeded.
Firstly, the assessment followed the CBA approach proposed by [10] to deter-mine the NP by only considering the benefit of astaxanthin production and thevariable operating costs in terms of energy consumption, chemicals, staff and otherraw materials. In a second stage, the economic feasibility of the process wasevaluated by considering two additional parameters: the net present value(NPV) and the pay-back period. Four different types of internal costs were includedfor the study of economic feasibility throughout the whole life time of the project,whereas externalities were excluded to avoid double counting of issues alreadycovered by the environmental LCA:
– Investment costs, including the equipment required for the operation of theplant.
– Overhead costs, related to renting, insurances, travel costs, taxes and interests.– Variable operating costs (already considered in the first stage, in which NP was
determined according to the approach of [10]) associated with the consumption
480 P. Pérez-López et al.

of water, chemicals and other raw materials (material costs), as well as energy,operating labor costs, and also disposal costs.
– Research and development costs (calculated in relation to revenue).
With this information, the NPV was calculated according to Eq. 2:
Total NPV of the project ¼Xn¼t
n¼1
Cash flow in year t � 1þ ið Þn1þ rð Þn ð2Þ
Where “n” is the number of years of analysis, “i” is the inflation rate and “r” thenominal discount rate. The determination of cash flows was carried out according tothe algorithm shown in Fig. 3.
The pay-back period of a project is defined as the period of time during which afacility must operate to recover the initial investment, according to the total capitalcosts and the estimated annual profits. It was determined by accumulating theannual profits until an equal value to the capital sum invested was obtained.
3 Results and Discussion
3.1 Environmental Performance of H. pluvialis Astaxanthin
The results of the environmental LCA for the astaxanthin production process aredepicted in Fig. 4. According to the results, there is a strong dependence of theenvironmental impacts with respect to the production scale. Thus, the total con-tributions were found to be from 10% up to four times higher for the lab-scaleprocess than for the semi-pilot system. Regarding the pilot two-stage process, thesemi-pilot system was found to have impacts between 10 and 100 times higher,whereas the lab process showed contributions between 25 and 122 times abovethose of the pilot process. Differences between production scales are mainly linkedto low yields and oversized equipment in the smaller-scale processes. These dif-ferences are expected to decrease as the production scale increases, until an
(+) Revenue(-) Variable operating costs(-) Overhead costs(-) Amortization
BENEFITS BEFORE TAXES(-) Taxes
BENEFITS BEFORE INTERESTS(-) Interests
NET BENEFIT(+) Amortization(-) Investment
NET CASH FLOW RATE
Fig. 3 Algorithm for thecalculation of cash flows inthe determination of the netpresent value of a project
Sustainability Assessment of Blue … 481
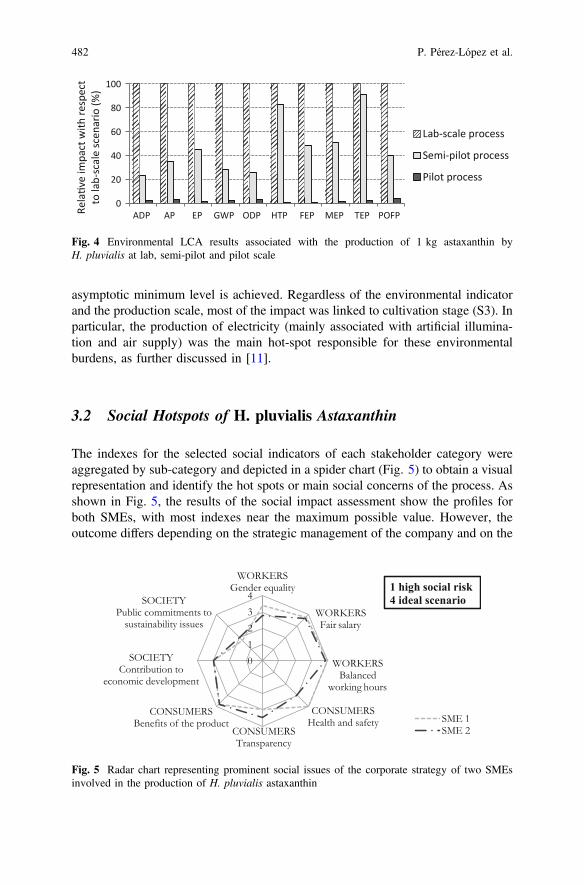
asymptotic minimum level is achieved. Regardless of the environmental indicatorand the production scale, most of the impact was linked to cultivation stage (S3). Inparticular, the production of electricity (mainly associated with artificial illumina-tion and air supply) was the main hot-spot responsible for these environmentalburdens, as further discussed in [11].
3.2 Social Hotspots of H. pluvialis Astaxanthin
The indexes for the selected social indicators of each stakeholder category wereaggregated by sub-category and depicted in a spider chart (Fig. 5) to obtain a visualrepresentation and identify the hot spots or main social concerns of the process. Asshown in Fig. 5, the results of the social impact assessment show the profiles forboth SMEs, with most indexes near the maximum possible value. However, theoutcome differs depending on the strategic management of the company and on the
0
20
40
60
80
100
ADP AP EP GWP ODP HTP FEP MEP TEP POFPRela
ve im
pact
with
resp
ect
to la
b-sc
ale
scen
ario
(%)
Lab-scale process
Semi-pilot process
Pilot process
Fig. 4 Environmental LCA results associated with the production of 1 kg astaxanthin byH. pluvialis at lab, semi-pilot and pilot scale
01234
SME 1SME 2
WORKERSGender equality
WORKERSFair salary
WORKERSBalanced
working hours
CONSUMERSHealth and safety
CONSUMERSTransparency
CONSUMERSBenefits of the product
SOCIETY Contribution to
economic development
SOCIETY Public commitments to
sustainability issues
1 high social risk4 ideal scenario
Fig. 5 Radar chart representing prominent social issues of the corporate strategy of two SMEsinvolved in the production of H. pluvialis astaxanthin
482 P. Pérez-López et al.
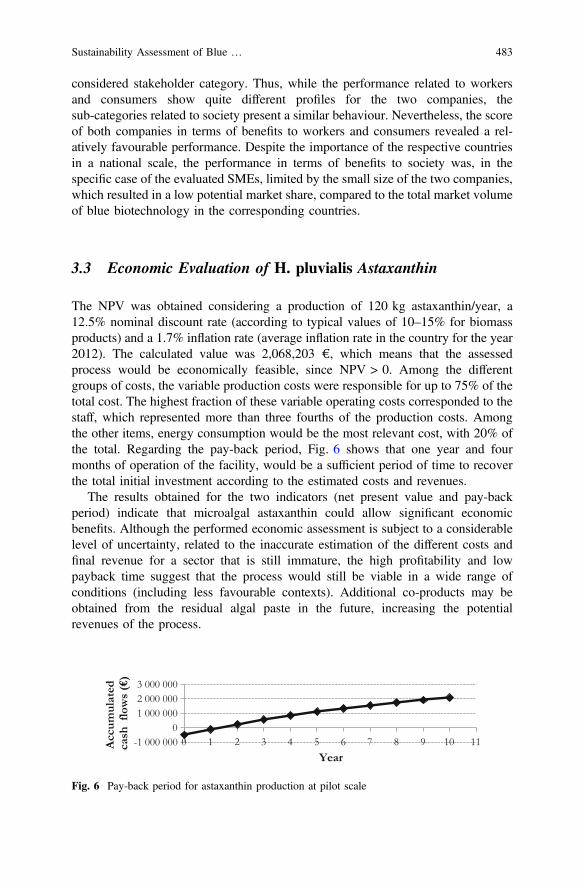
considered stakeholder category. Thus, while the performance related to workersand consumers show quite different profiles for the two companies, thesub-categories related to society present a similar behaviour. Nevertheless, the scoreof both companies in terms of benefits to workers and consumers revealed a rel-atively favourable performance. Despite the importance of the respective countriesin a national scale, the performance in terms of benefits to society was, in thespecific case of the evaluated SMEs, limited by the small size of the two companies,which resulted in a low potential market share, compared to the total market volumeof blue biotechnology in the corresponding countries.
3.3 Economic Evaluation of H. pluvialis Astaxanthin
The NPV was obtained considering a production of 120 kg astaxanthin/year, a12.5% nominal discount rate (according to typical values of 10–15% for biomassproducts) and a 1.7% inflation rate (average inflation rate in the country for the year2012). The calculated value was 2,068,203 €, which means that the assessedprocess would be economically feasible, since NPV > 0. Among the differentgroups of costs, the variable production costs were responsible for up to 75% of thetotal cost. The highest fraction of these variable operating costs corresponded to thestaff, which represented more than three fourths of the production costs. Amongthe other items, energy consumption would be the most relevant cost, with 20% ofthe total. Regarding the pay-back period, Fig. 6 shows that one year and fourmonths of operation of the facility, would be a sufficient period of time to recoverthe total initial investment according to the estimated costs and revenues.
The results obtained for the two indicators (net present value and pay-backperiod) indicate that microalgal astaxanthin could allow significant economicbenefits. Although the performed economic assessment is subject to a considerablelevel of uncertainty, related to the inaccurate estimation of the different costs andfinal revenue for a sector that is still immature, the high profitability and lowpayback time suggest that the process would still be viable in a wide range ofconditions (including less favourable contexts). Additional co-products may beobtained from the residual algal paste in the future, increasing the potentialrevenues of the process.
-1 000 000 0
1 000 0002 000 0003 000 000
0 1 2 3 4 5 6 7 8 9 10 11Acc
um
ula
ted
cash
flo
ws
(€)
Year
Fig. 6 Pay-back period for astaxanthin production at pilot scale
Sustainability Assessment of Blue … 483
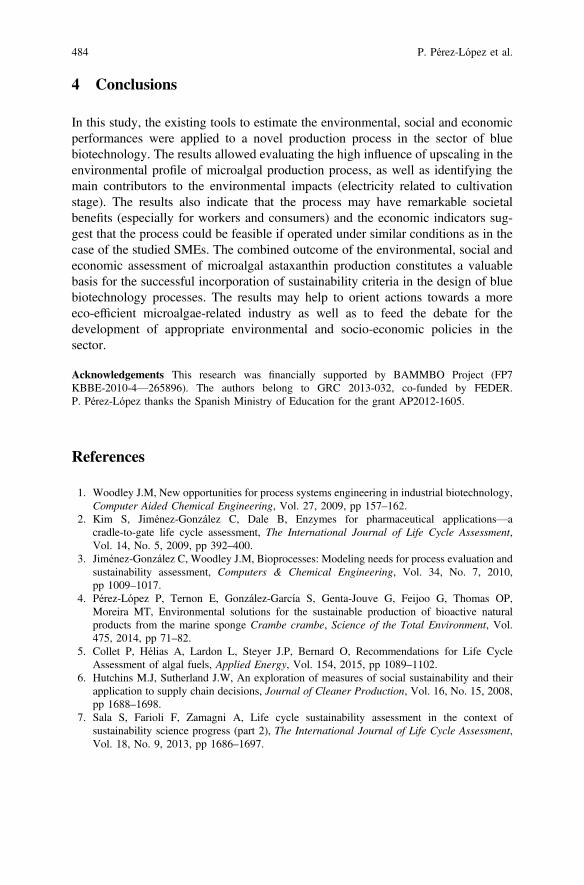
4 Conclusions
In this study, the existing tools to estimate the environmental, social and economicperformances were applied to a novel production process in the sector of bluebiotechnology. The results allowed evaluating the high influence of upscaling in theenvironmental profile of microalgal production process, as well as identifying themain contributors to the environmental impacts (electricity related to cultivationstage). The results also indicate that the process may have remarkable societalbenefits (especially for workers and consumers) and the economic indicators sug-gest that the process could be feasible if operated under similar conditions as in thecase of the studied SMEs. The combined outcome of the environmental, social andeconomic assessment of microalgal astaxanthin production constitutes a valuablebasis for the successful incorporation of sustainability criteria in the design of bluebiotechnology processes. The results may help to orient actions towards a moreeco-efficient microalgae-related industry as well as to feed the debate for thedevelopment of appropriate environmental and socio-economic policies in thesector.
Acknowledgements This research was financially supported by BAMMBO Project (FP7KBBE-2010-4—265896). The authors belong to GRC 2013-032, co-funded by FEDER.P. Pérez-López thanks the Spanish Ministry of Education for the grant AP2012-1605.
References
1. Woodley J.M, New opportunities for process systems engineering in industrial biotechnology,Computer Aided Chemical Engineering, Vol. 27, 2009, pp 157–162.
2. Kim S, Jiménez-González C, Dale B, Enzymes for pharmaceutical applications—acradle-to-gate life cycle assessment, The International Journal of Life Cycle Assessment,Vol. 14, No. 5, 2009, pp 392–400.
3. Jiménez-González C, Woodley J.M, Bioprocesses: Modeling needs for process evaluation andsustainability assessment, Computers & Chemical Engineering, Vol. 34, No. 7, 2010,pp 1009–1017.
4. Pérez-López P, Ternon E, González-García S, Genta-Jouve G, Feijoo G, Thomas OP,Moreira MT, Environmental solutions for the sustainable production of bioactive naturalproducts from the marine sponge Crambe crambe, Science of the Total Environment, Vol.475, 2014, pp 71–82.
5. Collet P, Hélias A, Lardon L, Steyer J.P, Bernard O, Recommendations for Life CycleAssessment of algal fuels, Applied Energy, Vol. 154, 2015, pp 1089–1102.
6. Hutchins M.J, Sutherland J.W, An exploration of measures of social sustainability and theirapplication to supply chain decisions, Journal of Cleaner Production, Vol. 16, No. 15, 2008,pp 1688–1698.
7. Sala S, Farioli F, Zamagni A, Life cycle sustainability assessment in the context ofsustainability science progress (part 2), The International Journal of Life Cycle Assessment,Vol. 18, No. 9, 2013, pp 1686–1697.
484 P. Pérez-López et al.

8. UNEP-SETAC, Guidelines for social life cycle assessment of products, United NationsEnvironment Programme (UNEP), Paris, France, 2009, <http://www.unep.org/publications/>,(Accessed 31.05.2017).
9. Huppes G, van Rooijen M, Kleijn R, Heijungs R, de Koning A, van Oers L, Life cycle costingand the environment, National Institute for Public Health and the Environment, Bilthoven,The Netherlands, 2004.
10. Molinos-Senante M, Hernández-Sancho F, Sala-Garrido R, Cost-benefit analysis ofwater-reuse projects for environmental purposes: A case study for Spanish wastewatertreatment plants, Journal of Environmental Management, Vol. 92, No. 12, 2011, pp 3091–3097.
11. Pérez-López P, González-García S, Jeffryes C, Agathos S.N, McHugh E, Walsh D, Murray P,Moane S, Feijoo G, Moreira M.T, Life cycle assessment of the production of the redanti-oxidant carotenoid astaxanthin by microalgae: From lab to pilot scale, Journal of CleanerProduction, Vol. 64, 2014, pp 332–344.
12. Barros M.P, Poppe S.C, Bondan E.F, Neuroprotective properties of the marine carotenoidastaxanthin and omega-3 fatty acids, and perspectives for the natural combination of both inkrill oil, Nutrients, Vol. 6, No. 3 2014, pp 1293–1317.
13. Aflalo C, Meshulam Y, Zarka A, Boussiba S, On the relative efficiency of two- vs. one-stageproduction of astaxanthin by the green alga Haematococcus pluvialis, Biotechnology andBioengineering, Vol. 98, No. 1, 2007, pp 300–305.
14. ISO 14040, Environmental management—Life Cycle Assessment—Principles and frame-work, Geneva, Switzerland, 2006.
15. Baker R, Saling P, Comparing natural with chemical additive production, Feed mix 2003; 11(1):12–14.
16. Frischknecht R, Jungbluth N, Althaus H.J, Doka G, Heck T, Hellweg S, Hischier R,Nemecek T, Rebitzer G, Spielmann M, Wernet G, Overview and methodology, Ecoinventreport No. 1 v2.0. Swiss Center for Life Cycle Inventories, Dübendorf, Switzerland, 2007.
17. Guinée J.B, Gorrée M, Heijungs R, et al., Handbook on life cycle assessment: Operationalguide to the ISO standards, Kluwer Academic Publishers, Dordrecht, the Netherlands, 2002.
18. Goedkoop M, Oele M, Leijting J, Ponsioen T, Meijer E, SimaPro 8. Introduction to LCA withSimaPro, Pré Consultants, 2013.
19. Lehtonen M, The environmental-social interface of sustainable development capabilities,social capital, institutions, Ecological Economics, Vol. 49, No. 2, 2004, pp 199–214.
20. UNEP-SETAC, The methodological sheets for subcategories in Social Life Cycle Assessment(S-LCA), United Nations Environment Programme (UNEP), Paris, France, 2013, <http://www.lifecycleinitiative.org/>, (Accessed 31.05.2017).
21. Benoît Norris C, Cavan D.A, Norris G, Identifying social impacts in product supply chains:overview and application of the Social Hotspot Database, Sustainability, Vol. 4, No. 9, 2012,pp 1946–1965.
22. <http://stats.oecd.org/>, (Accessed 31.05.2017).23. <https://www.statista.com/statistics/226956/average-world-wages-in-purchasing-power-
parity-dollars/>, (Accessed 31.05.2017).24. World Economic Forum, The Global Gender Gap Report 2013, Colgny/Geneva, Switzerland,
2013, <http://www.weforum.org/reports/global-gender-gap-report-2013>, (Accessed 31.05.2017).
25. Birol E, Koundouri P, Kountouris Y, Assessing the economic viability of alternative waterresources in water-scarce regions: Combining economic valuation, cost-benefit analysis anddiscounting, Ecological Economics, Vol. 69, No. 4, 2010, pp 839–847.
Sustainability Assessment of Blue … 485

Open Access This chapter is licensed under the terms of the Creative Commons Attribution 4.0International License (http://creativecommons.org/licenses/by/4.0/), which permits use, sharing,adaptation, distribution and reproduction in any medium or format, as long as you give appropriatecredit to the original author(s) and the source, provide a link to the Creative Commons license andindicate if changes were made.The images or other third party material in this chapter are included in the chapter’s Creative
Commons license, unless indicated otherwise in a credit line to the material. If material is notincluded in the chapter’s Creative Commons license and your intended use is not permitted bystatutory regulation or exceeds the permitted use, you will need to obtain permission directly fromthe copyright holder.
486 P. Pérez-López et al.
Integrating Life Cycle Assessmentand Eco-design Strategiesfor a Sustainable Productionof Bio-based Plastics
Venkateshwaran Venkatachalam, Sebastian Spierling,Hans-Josef Endres and Andrea Siebert-Raths
Abstract In order to design and develop a sustainable bio-based plastic productright from its development phase, it is necessary to analyse and interpret the directand indirect environmental impacts along the life cycle of the product systemthrough life cycle thinking. Eco-design is a well-established approach in designingproducts with the consideration and integration of the environmental impacts of theproduct system, and Life Cycle Assessment (LCA) is a standardized methodologyto quantify and analyse the environmental impacts of the product system along theproduction chain. This paper identifies the practical needs for integrating LCA andeco-design strategies into the production of bio-based plastic products, taking abio-based computer mouse body made of Poly Lactic Acid (PLA) as a case study.
1 Introduction
Plastics have an important role in our daily life. From packaging to automotiveareas, the use of plastics has steadily increased during the last 100 years and ispredicted to keep growing in the future [1]. The major part of the current plastics isbased on fossil resources like crude oil. However, in the past few decades,bio-based plastics have become a focus in plastic research [2], due to the finitenessof fossil-based raw materials, renewability of the feedstock used in the bio-basedplastics and the current challenges of climate change. Bio-based plastics are definedas ready to use blends, which consist of biopolymers and additives [2]. Withincreasing bio-based plastic production, the question of whether the bio-basedplastics a sustainable alternative to conventional plastics, have been raised repeat-edly. Many LCA studies have been conducted for biopolymers [3] but most of theseLCA studies are used as a communication tool to show its environmental perfor-mance rather than integrated to the design of products manufactured from these
V. Venkatachalam (&) � S. Spierling � H.-J. Endres � A. Siebert-RathsFaculty II—Mechanical Engineering and Bio Process Engineering, Institute for Bioplasticsand Biocomposites, University of Applied Sciences and Arts, Hannover, Germanye-mail: [email protected]
© The Author(s) 2018E. Benetto et al. (eds.), Designing Sustainable Technologies,Products and Policies, https://doi.org/10.1007/978-3-319-66981-6_54
487
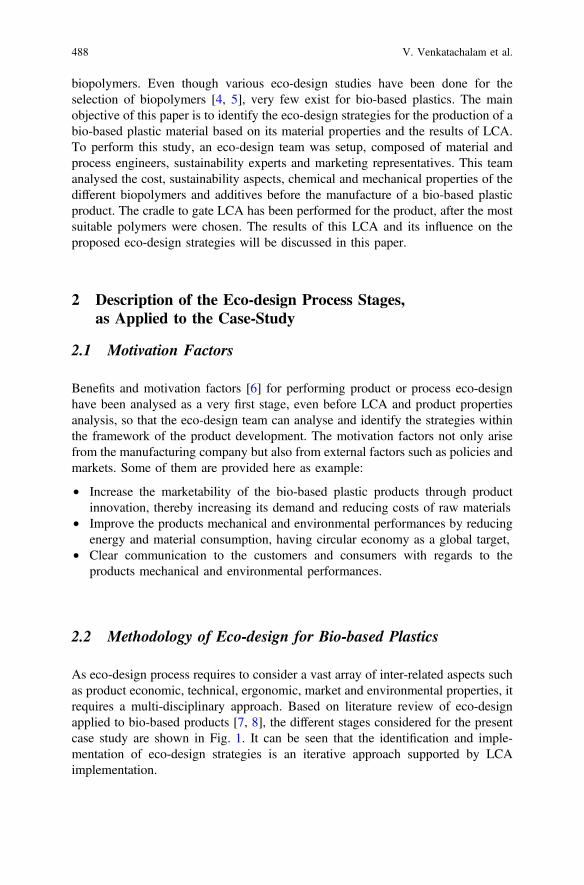
biopolymers. Even though various eco-design studies have been done for theselection of biopolymers [4, 5], very few exist for bio-based plastics. The mainobjective of this paper is to identify the eco-design strategies for the production of abio-based plastic material based on its material properties and the results of LCA.To perform this study, an eco-design team was setup, composed of material andprocess engineers, sustainability experts and marketing representatives. This teamanalysed the cost, sustainability aspects, chemical and mechanical properties of thedifferent biopolymers and additives before the manufacture of a bio-based plasticproduct. The cradle to gate LCA has been performed for the product, after the mostsuitable polymers were chosen. The results of this LCA and its influence on theproposed eco-design strategies will be discussed in this paper.
2 Description of the Eco-design Process Stages,as Applied to the Case-Study
2.1 Motivation Factors
Benefits and motivation factors [6] for performing product or process eco-designhave been analysed as a very first stage, even before LCA and product propertiesanalysis, so that the eco-design team can analyse and identify the strategies withinthe framework of the product development. The motivation factors not only arisefrom the manufacturing company but also from external factors such as policies andmarkets. Some of them are provided here as example:
• Increase the marketability of the bio-based plastic products through productinnovation, thereby increasing its demand and reducing costs of raw materials
• Improve the products mechanical and environmental performances by reducingenergy and material consumption, having circular economy as a global target,
• Clear communication to the customers and consumers with regards to theproducts mechanical and environmental performances.
2.2 Methodology of Eco-design for Bio-based Plastics
As eco-design process requires to consider a vast array of inter-related aspects suchas product economic, technical, ergonomic, market and environmental properties, itrequires a multi-disciplinary approach. Based on literature review of eco-designapplied to bio-based products [7, 8], the different stages considered for the presentcase study are shown in Fig. 1. It can be seen that the identification and imple-mentation of eco-design strategies is an iterative approach supported by LCAimplementation.
488 V. Venkatachalam et al.
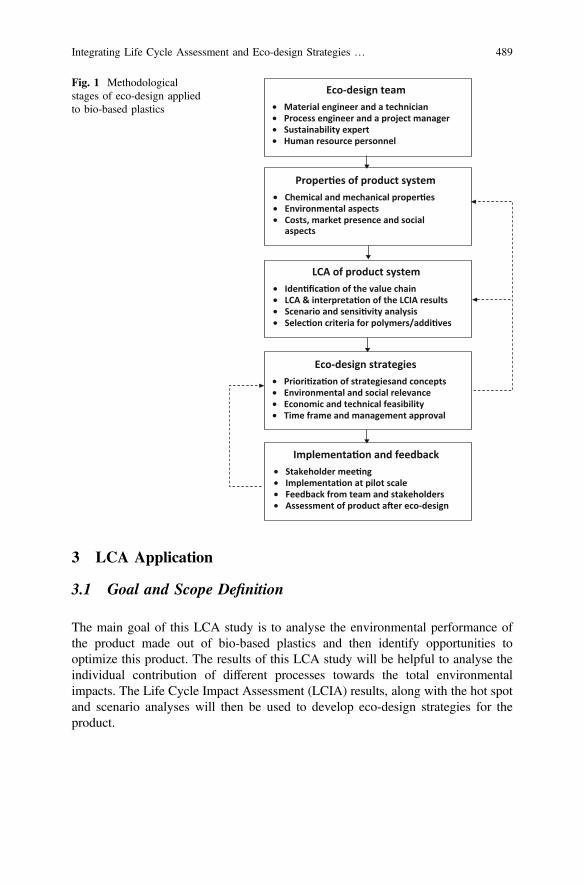
3 LCA Application
3.1 Goal and Scope Definition
The main goal of this LCA study is to analyse the environmental performance ofthe product made out of bio-based plastics and then identify opportunities tooptimize this product. The results of this LCA study will be helpful to analyse theindividual contribution of different processes towards the total environmentalimpacts. The Life Cycle Impact Assessment (LCIA) results, along with the hot spotand scenario analyses will then be used to develop eco-design strategies for theproduct.
Eco-design team• Material engineer and a technician• Process engineer and a project manager• Sustainability expert• Human resource personnel
Proper es of product system• Chemical and mechanical proper es• Environmental aspects• Costs, market presence and social
aspects
LCA of product system• Iden fica on of the value chain• LCA & interpreta on of the LCIA results• Scenario and sensi vity analysis• Selec on criteria for polymers/addi ves
Eco-design strategies• Priori za on of strategiesand concepts• Environmental and social relevance• Economic and technical feasibility• Time frame and management approval
Implementa on and feedback• Stakeholder mee ng• Implementa on at pilot scale• Feedback from team and stakeholders• Assessment of product a er eco-design
Fig. 1 Methodologicalstages of eco-design appliedto bio-based plastics
Integrating Life Cycle Assessment and Eco-design Strategies … 489
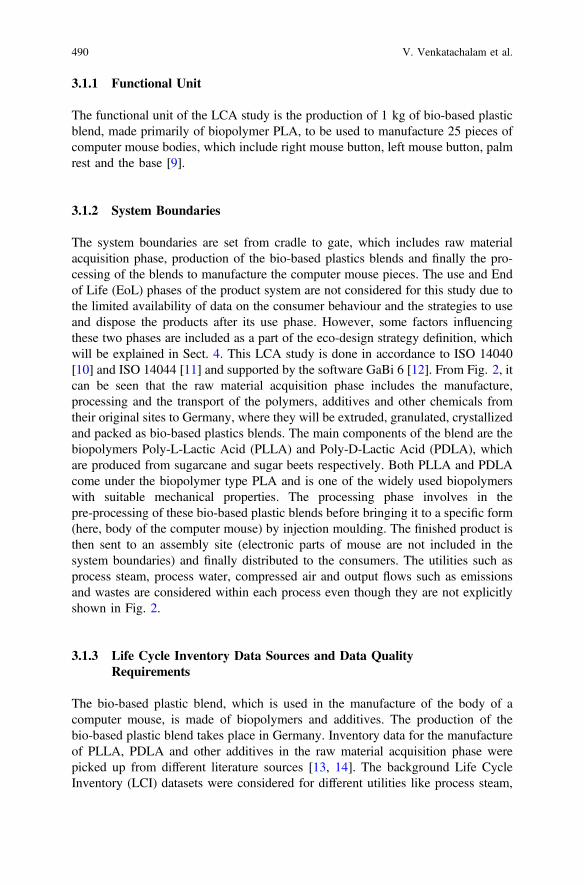
3.1.1 Functional Unit
The functional unit of the LCA study is the production of 1 kg of bio-based plasticblend, made primarily of biopolymer PLA, to be used to manufacture 25 pieces ofcomputer mouse bodies, which include right mouse button, left mouse button, palmrest and the base [9].
3.1.2 System Boundaries
The system boundaries are set from cradle to gate, which includes raw materialacquisition phase, production of the bio-based plastics blends and finally the pro-cessing of the blends to manufacture the computer mouse pieces. The use and Endof Life (EoL) phases of the product system are not considered for this study due tothe limited availability of data on the consumer behaviour and the strategies to useand dispose the products after its use phase. However, some factors influencingthese two phases are included as a part of the eco-design strategy definition, whichwill be explained in Sect. 4. This LCA study is done in accordance to ISO 14040[10] and ISO 14044 [11] and supported by the software GaBi 6 [12]. From Fig. 2, itcan be seen that the raw material acquisition phase includes the manufacture,processing and the transport of the polymers, additives and other chemicals fromtheir original sites to Germany, where they will be extruded, granulated, crystallizedand packed as bio-based plastics blends. The main components of the blend are thebiopolymers Poly-L-Lactic Acid (PLLA) and Poly-D-Lactic Acid (PDLA), whichare produced from sugarcane and sugar beets respectively. Both PLLA and PDLAcome under the biopolymer type PLA and is one of the widely used biopolymerswith suitable mechanical properties. The processing phase involves in thepre-processing of these bio-based plastic blends before bringing it to a specific form(here, body of the computer mouse) by injection moulding. The finished product isthen sent to an assembly site (electronic parts of mouse are not included in thesystem boundaries) and finally distributed to the consumers. The utilities such asprocess steam, process water, compressed air and output flows such as emissionsand wastes are considered within each process even though they are not explicitlyshown in Fig. 2.
3.1.3 Life Cycle Inventory Data Sources and Data QualityRequirements
The bio-based plastic blend, which is used in the manufacture of the body of acomputer mouse, is made of biopolymers and additives. The production of thebio-based plastic blend takes place in Germany. Inventory data for the manufactureof PLLA, PDLA and other additives in the raw material acquisition phase werepicked up from different literature sources [13, 14]. The background Life CycleInventory (LCI) datasets were considered for different utilities like process steam,
490 V. Venkatachalam et al.
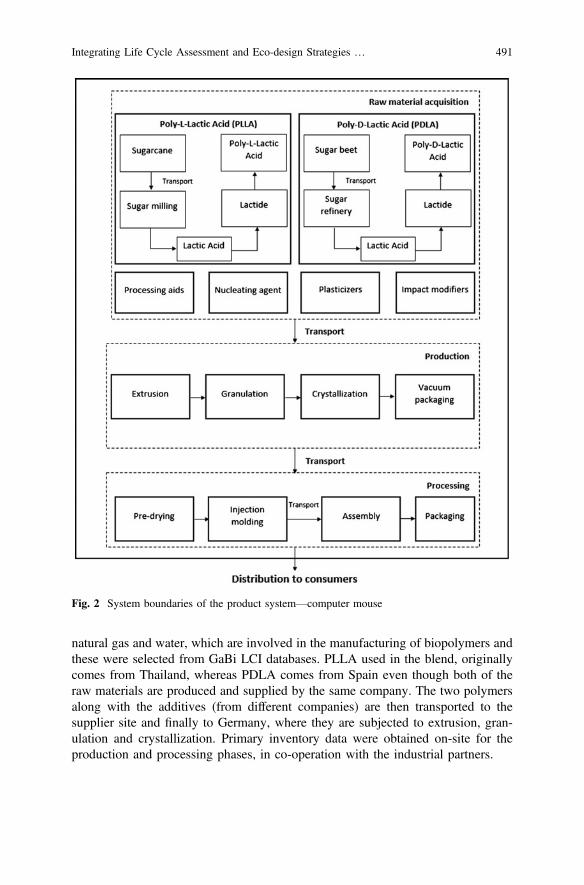
natural gas and water, which are involved in the manufacturing of biopolymers andthese were selected from GaBi LCI databases. PLLA used in the blend, originallycomes from Thailand, whereas PDLA comes from Spain even though both of theraw materials are produced and supplied by the same company. The two polymersalong with the additives (from different companies) are then transported to thesupplier site and finally to Germany, where they are subjected to extrusion, gran-ulation and crystallization. Primary inventory data were obtained on-site for theproduction and processing phases, in co-operation with the industrial partners.
Fig. 2 System boundaries of the product system—computer mouse
Integrating Life Cycle Assessment and Eco-design Strategies … 491
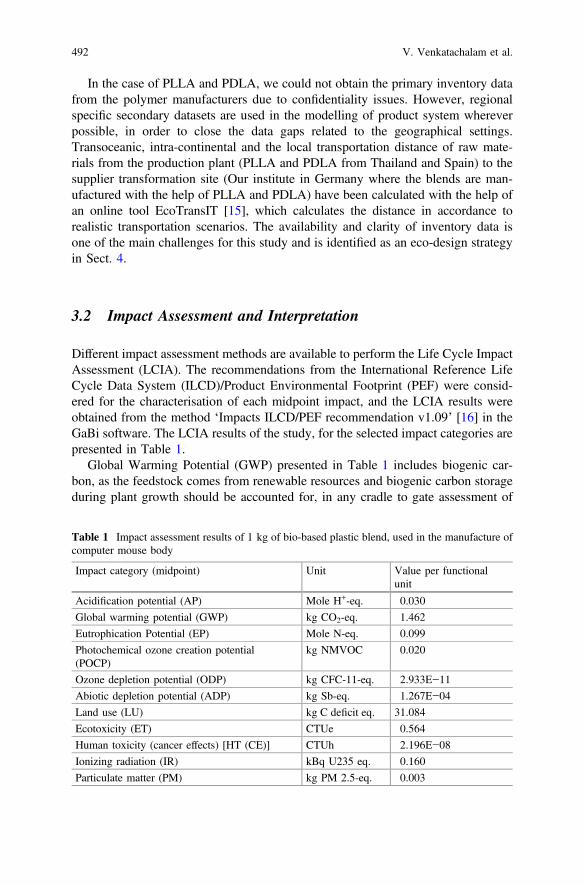
In the case of PLLA and PDLA, we could not obtain the primary inventory datafrom the polymer manufacturers due to confidentiality issues. However, regionalspecific secondary datasets are used in the modelling of product system whereverpossible, in order to close the data gaps related to the geographical settings.Transoceanic, intra-continental and the local transportation distance of raw mate-rials from the production plant (PLLA and PDLA from Thailand and Spain) to thesupplier transformation site (Our institute in Germany where the blends are man-ufactured with the help of PLLA and PDLA) have been calculated with the help ofan online tool EcoTransIT [15], which calculates the distance in accordance torealistic transportation scenarios. The availability and clarity of inventory data isone of the main challenges for this study and is identified as an eco-design strategyin Sect. 4.
3.2 Impact Assessment and Interpretation
Different impact assessment methods are available to perform the Life Cycle ImpactAssessment (LCIA). The recommendations from the International Reference LifeCycle Data System (ILCD)/Product Environmental Footprint (PEF) were consid-ered for the characterisation of each midpoint impact, and the LCIA results wereobtained from the method ‘Impacts ILCD/PEF recommendation v1.09’ [16] in theGaBi software. The LCIA results of the study, for the selected impact categories arepresented in Table 1.
Global Warming Potential (GWP) presented in Table 1 includes biogenic car-bon, as the feedstock comes from renewable resources and biogenic carbon storageduring plant growth should be accounted for, in any cradle to gate assessment of
Table 1 Impact assessment results of 1 kg of bio-based plastic blend, used in the manufacture ofcomputer mouse body
Impact category (midpoint) Unit Value per functionalunit
Acidification potential (AP) Mole H+-eq. 0.030
Global warming potential (GWP) kg CO2-eq. 1.462
Eutrophication Potential (EP) Mole N-eq. 0.099
Photochemical ozone creation potential(POCP)
kg NMVOC 0.020
Ozone depletion potential (ODP) kg CFC-11-eq. 2.933E−11
Abiotic depletion potential (ADP) kg Sb-eq. 1.267E−04
Land use (LU) kg C deficit eq. 31.084
Ecotoxicity (ET) CTUe 0.564
Human toxicity (cancer effects) [HT (CE)] CTUh 2.196E−08
Ionizing radiation (IR) kBq U235 eq. 0.160
Particulate matter (PM) kg PM 2.5-eq. 0.003
492 V. Venkatachalam et al.
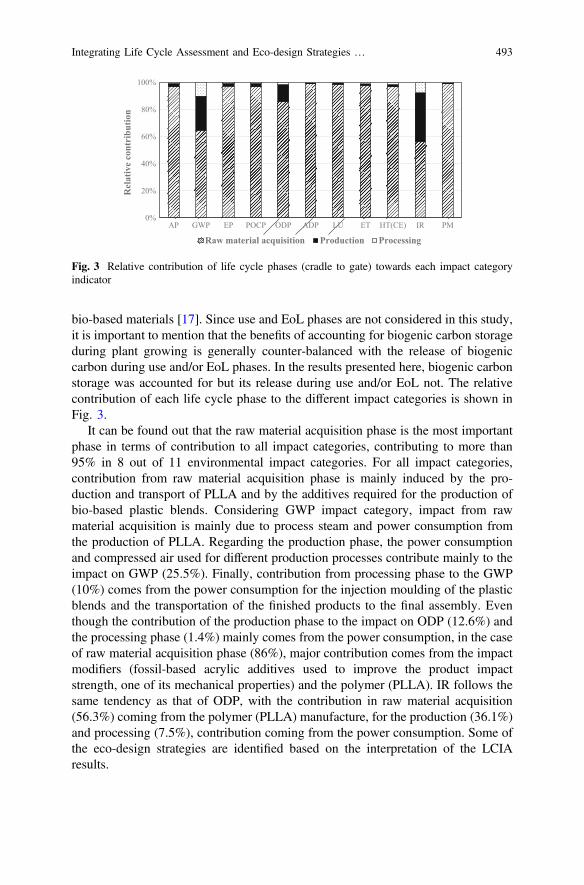
bio-based materials [17]. Since use and EoL phases are not considered in this study,it is important to mention that the benefits of accounting for biogenic carbon storageduring plant growing is generally counter-balanced with the release of biogeniccarbon during use and/or EoL phases. In the results presented here, biogenic carbonstorage was accounted for but its release during use and/or EoL not. The relativecontribution of each life cycle phase to the different impact categories is shown inFig. 3.
It can be found out that the raw material acquisition phase is the most importantphase in terms of contribution to all impact categories, contributing to more than95% in 8 out of 11 environmental impact categories. For all impact categories,contribution from raw material acquisition phase is mainly induced by the pro-duction and transport of PLLA and by the additives required for the production ofbio-based plastic blends. Considering GWP impact category, impact from rawmaterial acquisition is mainly due to process steam and power consumption fromthe production of PLLA. Regarding the production phase, the power consumptionand compressed air used for different production processes contribute mainly to theimpact on GWP (25.5%). Finally, contribution from processing phase to the GWP(10%) comes from the power consumption for the injection moulding of the plasticblends and the transportation of the finished products to the final assembly. Eventhough the contribution of the production phase to the impact on ODP (12.6%) andthe processing phase (1.4%) mainly comes from the power consumption, in the caseof raw material acquisition phase (86%), major contribution comes from the impactmodifiers (fossil-based acrylic additives used to improve the product impactstrength, one of its mechanical properties) and the polymer (PLLA). IR follows thesame tendency as that of ODP, with the contribution in raw material acquisition(56.3%) coming from the polymer (PLLA) manufacture, for the production (36.1%)and processing (7.5%), contribution coming from the power consumption. Some ofthe eco-design strategies are identified based on the interpretation of the LCIAresults.
0%
20%
40%
60%
80%
100%
AP GWP EP POCP ODP ADP LU ET HT(CE) IR PM
Rel
ativ
e co
ntri
butio
n
Raw material acquisition Production Processing
Fig. 3 Relative contribution of life cycle phases (cradle to gate) towards each impact categoryindicator
Integrating Life Cycle Assessment and Eco-design Strategies … 493

3.3 Scenario Analysis
Scenario analysis is a method, where boundary conditions (i.e. type of process andassociated quantity) of some of the key process parameters are modified in theinventory, in order to analyse the variation induced on LCIA results. Scenarioanalysis can be a powerful method to identify different potential strategies sup-porting the optimisation of product’s environmental performance.
The LCIA results highlighted that a significant amount of environmental impactscomes from the transoceanic transportation of the polymer PLLA i.e. the trans-portation of polymer from Thailand, where it was originally manufactured, toGermany, where it will be used in the manufacture of bio-based plastic product. Inthe scenario analysis, the trans-oceanic cargo transportation of PLLA is kept as abase scenario, compared to a scenario of cargo transportation of PLLA from Spain,and another scenario of truck transportation of PLLA from Spain. These scenariosappeared as feasible since the same company supply PLLA from Thailand andPDLA from Spain. Although there was no significant change in most of the impactcategories, the change in the most significant impact categories AP, GWP, EP andPOCP for the two scenarios is shown alongside the base scenario in Fig. 4. At least21% reduction is observed in the total impact on AP when the PLLA is producedand transported by truck from Spain to Netherlands when compared to the basescenario.
Additives are also used in the manufacture of bio-based plastic product in orderto increase and optimize the mechanical properties of the product. One suchadditive is the impact modifiers, which are used for increasing flexibility and impactstrength to meet physical property requirements of rigid parts [18]. These modifiersare mostly fossil-based acrylic compounds and production of these modifierscontributes to a significant amount of environmental impacts. A new variant ofbio-based impact modifiers has been developed and is already available on themarket [19]; however, the scale of its production is much smaller compared to thealready established conventional impact modifiers. These bio-based impact modi-fiers are Polyhydroxyalkanoate (PHA) based, used in the polymer blends toimprove the mechanical properties of PLA [19]. A scenario analysis was performed
0%
20%
40%
60%
80%
100%
AP GWP EP POCP
Rel
ativ
e co
ntri
butio
n
Base scenario Cargo - Spain Truck - Spain
Fig. 4 Scenario analysis forthe transportation of PLLAfrom Thailand to Europe
494 V. Venkatachalam et al.

with the replacement of the fossil-based impact modifiers by PHA based additives.Eco-design strategies were identified based on these scenario analyses.
4 Identification of Eco-design Strategies
From the LCIA results and scenario analysis, considered together with costs andmaterials properties, eco-design strategies have been proposed and some of theimportant strategies are listed in Table 2, taking into account the different aspectsinvolved in the product development. Environmental impacts, economic and technicalfeasibility are scored arbitrarily on a scale going from 1 to 5 defined by the eco-designteam and stakeholders, with 1 being least feasible (for economic and technical feasi-bility) or least relevant (for environmental improvement) and 5 being highly feasibleand highly relevant. A ‘Time frame’, ranging from Short Term (ST), Medium Term(MT) and Long Term (LT) is also set, for the likelihood of implementing thesestrategies, based on the previously existing manuals on eco-design such as ‘PracticalManual of Ecodesign. Implementation in 7 steps’ [6], ‘Design for Sustainability—Apractical approach for developing economies’ [20] and ‘Product Design and Life CycleAssessment’ [21]. The first two strategies presented in Table 2 are based on the resultsof scenario analysis and the related environmental performances. Therefore, it isrequired that inventory data considered for polymers and additives must be transparentand representative, allowing to perform a comprehensive LCA and to communicate theLCIA results based on a consistent model, which will also affect the material devel-opment. Improving themechanical, ergonomic, recycling and biodegradable propertiesof the product not only have a high environmental relevance but also helpful to positionbio-based plastic products as a sustainable option in a long term. The implementedstrategies must be reviewed among the team and stakeholders continuously, as there isalways a potential for improvement.
Table 2 Proposed eco-design strategies after analysing different aspects of the bio-basedcomputer mouse body
Strategies Environmentalimprovement
Economicfeasibility
Technicalfeasibility
Timeframe
Sourcing of polymersfrom Europe
4 2 5 LT
Bio-based additives 3 2 3 MT
Clarity in inventory data 2 5 4 ST
Mechanical properties ofthe polymers
3 2 2 MT
Ergonomics of theproduct
4 2 2 MT
Recyclability 5 1 4 MT
Biodegradability 3 3 2 MT
Integrating Life Cycle Assessment and Eco-design Strategies … 495

5 Conclusion
LCA of a bio-based computer mouse body was conducted on a cradle to gate basis.It was found out that the raw material acquisition phase constitutes the major sharein all of the environmental impacts. Several strategies for an eco-design of abio-based product were identified based on the LCIA results, scenario analyses andconsideration of some alternative aspects of the product. Some of the method-ological and practical requirements for implementing eco-design strategies at thelevel of bio-based plastics manufacturing were also shown. Once implementedthese strategies should pave the way for a sustainable production of bio-basedplastics.
Acknowledgements The authors would like to thank the German Federal Ministry of Educationand Research as well as the German Federal Ministry of Food and Agriculture for the funding andsupport to the research project in which this study has been conducted.
References
1. http://www.plasticseurope.org/documents/document/20161014113313-plastics_the_facts_2016_final_version.pdf, (Accessed 10.06.2017).
2. Endres H-J, Siebert-Raths A, Engineering Biopolymers Markets, Manufacturing, Propertiesand Applications, Carl Hanser Verlag GmbH & Co. KG, 2011.
3. Yates M, Barlow C.Y, Life Cycle Assessments of biodegradable, commercial biopolymers -A critical review, Resources Conservation and Recycling, Vol. 78, 2013, pp. 54–66.
4. Olwill J.A., Wright E.I, Rahimifard S, A holistic approach to design support for bio-polymerbased packaging. Journal of Polymers and the Environment, 20, 2012, pp. 1112–1123.
5. Ribeiro I, Peças P, Henriques E, A life cycle framework to support materials selection forEcodesign: A case study on biodegradable polymers, Materials & Design, Vol. 51, 2013,pp. 300–308.
6. IHOBE S.A, Manual Práctico de Ecodiseño—Operativa de implantación en 7 pasos, Sociedadpública de gestión ambiental, 2001.
7. González-García S, Silva F.J, Moreira M.T, Castilla Pascual R, García Lozano R,Gabarrell X, Rieradevall Pons J, Feijoo G, Combined application of LCA and eco-designfor the sustainable production of wood boxes for wine bottles storage, International Journal ofLife Cycle Assessment, Vol. 16, 2011, pp. 224–237.
8. Muñoz I, Gazulla C, Bala A, Puig R, Fullana P, LCA and ecodesign in the toy industry: casestudy of a teddy bear incorporating electric and electronic components, International Journalof Life Cycle Assessment, Vol. 14, 2009, pp. 64–72.
9. https://www.nager-it.de/maus, (Accessed 05.03.2017).10. ISO 14040:2006 Environmental management—life cycle assessment—principles and
framework.11. ISO 14044:2006 Environmental management—life cycle assessment—requirements and
guidelines.12. GaBi, Thinkstep AG; LBP-GaBi, University of Stuttgart: GaBi Software System,
Leinfelden-Echterdingen/Germany, 2013.13. Groot W.J, Borén T, Life cycle assessment of the manufacture of lactide and PLA
biopolymers from sugarcane in Thailand, International Journal of Life Cycle Assessment,Vol. 15, No. 9, 2010, pp. 970–984.
496 V. Venkatachalam et al.
14. Harbec A, Lactic acid production from agribusiness waste starch fermentation withLactobacillus Amylophilus and its cradle-to-gate life cycle assessment as a precursor toPoly-L-Lactide, 2010.
15. http://www.ecotransit.org/index.de.html, (Accessed 12.03.2017).16. http://eplca.jrc.ec.europa.eu/uploads/ILCD-Recommendation-of-methods-for-LCIA-def.pdf,
(Accessed 15.04.2017).17. Pawelzik P, Carus M, Hotchkiss J, Narayan R, Selke S, Wellisch M, Weiss M, Wicke B,
Patel M, Critical aspects in the LCA of bio-based materials—Reviewing methodologiesand deriving recommendations, Resources, Conservation and Recycling, Vol. 73, 2013,pp. 211–228.
18. Impact modifiers: How to make your compound tougher https://www.pharosproject.net/uploads/files/sources/1828/1359960957.pdf, (Accessed 09.01.2018).
19. http://www.yield10bio.com/sites/default/files/ANTEC-PLA_PVC.pdf, (Accessed 16.05.2017).20. Design for Sustainability—A practical approach for developing economies http://www.d4s-
de.org/manual/d4stotalmanual.pdf, (Accessed 12.05.2017).21. Zbicinski I, Stavenuiter J, Kozlowska B, van de Coevering H.P.M., Product Design and Life
Cycle Assessment, The Baltic University Press, 2006.
Open Access This chapter is licensed under the terms of the Creative Commons Attribution 4.0International License (http://creativecommons.org/licenses/by/4.0/), which permits use, sharing,adaptation, distribution and reproduction in any medium or format, as long as you give appropriatecredit to the original author(s) and the source, provide a link to the Creative Commons license andindicate if changes were made.The images or other third party material in this chapter are included in the chapter’s Creative
Commons license, unless indicated otherwise in a credit line to the material. If material is notincluded in the chapter’s Creative Commons license and your intended use is not permitted bystatutory regulation or exceeds the permitted use, you will need to obtain permission directly fromthe copyright holder.
Integrating Life Cycle Assessment and Eco-design Strategies … 497

Using LCA and EPD in PublicProcurement Within the ConstructionSector
Kristian Jelse and Kristof Peerens
Abstract Life cycle assessments (LCAs) and Environmental Product Declarations(EPDs) have long been pointed to as tools to be used in green public procurement(GPP), but doing so in practice is challenging. How can such information berequested without breaking some of the general principles for public procurement,for example non-discrimination and transparency? This session was meant to giveinsights from different stakeholders through five presentations providing differentperspectives on this issue. The individual presentations were followed up on by apanel discussion.
1 Introduction
With the European Union being responsible for more than a third of global resourceconsumption, 40% of global energy consumption, 36% of global carbon dioxideemissions, and one third of global waste streams [1], there is an increasing need forthis region to take a leading position when it comes to reducing the overall envi-ronmental impact.
Specifically for the construction sector, energy efficient housing is one of the keyelements in being able to reduce Europe’s overall environmental impact, with studiesshowing that the embodied energy in construction represents the amount of energyequivalent tomore than 75 years of heating [1]. The construction sector overall is morethan just housing, and each of the different components have a significant impact on theenvironment. A rough estimate by the Norwegian authorities has shown that the yearlycarbon footprint of the public road system (including construction and maintenance)
K. Jelse (&)EPD International AB, Stockholm, Swedene-mail: [email protected]
K. Peerens3 M Belgium bvba/sprl, Diegem, Belgium
© The Author(s) 2018E. Benetto et al. (eds.), Designing Sustainable Technologies,Products and Policies, https://doi.org/10.1007/978-3-319-66981-6_55
499

equates to *2.3 million tons of carbon dioxide equivalents, excluding direct trafficemissions (which add 20–25%) [2].
2 Challenges in Using LCAs and EPDs as a StandardAssessment Method in Green Public Procurement
Even though LCA and EPD data is commonly used to quantify the potentialenvironmental impact of construction elements or construction works, reality showsthat in GPP, despite environmental considerations being implemented in a varietyof European Member States, this data is not used in order to come to conclusionsand make decisions related to product or supplier selection [3]. The presentations atthe session showed different challenges to different types of stakeholder groups.
2.1 Challenges for Industry
LCA is a time and resource intensive undertaking for industry, which requiressignificant effort in gathering data, creating life cycle models in dedicated softwarepackages, appropriately interpreting the results, and reporting the information in anunderstandable format. This means that for small and medium sized enterprises,cost is often seen as a barrier to starting such studies [1]. As a result, those com-panies that have limited resources available cannot always justify the cost, and as aresult will not have LCA or EPD data available.
In addition, there are a number of challenges related to communicating LCA andEPD information: some of the information must be specific to the product appli-cation and use, other data is relevant for different types of audiences (general publicversus architects or project developers). Unfortunately, even when only consideringthe European Union, means of communication, as well as the different LCA andEPD elements differ [1]. When publishing LCA and EPD data for a number ofdifferent countries, there may be a need to generate multiple LCA reports or EPDs,have them verified multiple times (in line with the countries’ requirements), andoften have them registered locally, each of which comes at a cost. Harmonisation ofresults can therefore be seen as an absolute must when it comes to promoting theconsistent use of LCAs and EPDs [1].
2.2 Challenges for the Public Sector
No matter how it is approached, LCA is a complex topic that requires a certain skillset to be able to interpret information generated by the study. So even if LCA andEPD data was to be available for all products participating in a public tender, there
500 K. Jelse and K. Peerens
would need to be quite some knowledge required from the procurement depart-ments in order to identify the best possible product for a certain application [3].
Environmental benchmark data is not readily available, which means that thisadds a layer of complexity for public authorities for product differentiation andselection. With the risk of duplicating efforts and lack of consistency, publicauthorities often use national/regional expertise in order to determine GPP criteria,which can result in different regulatory frameworks, and a lack of harmonisation.
For public authorities, sustainability criteria must go beyond environmentalimpacts, and must include social, humanitarian and economic aspects as well.Weighting and characterisation of environmental criteria based on the significanceof the differences in environmental impacts are therefore a must [4].
3 Tool and Platform Development to Assistin Interpretation of LCA and EPD Data
Anumber of industry sectors, depending on their maturity in the area of sustainability,have built tool sets that help in assessing the overall sustainability impact of theirsector’s products, technologies and solutions. As a sector, it has therefore been pos-sible to meet the growing demands related to the availability of data. The schemes asdeveloped and deployed in e.g. the steel industry have therefore resulted in collabo-ration and engagement, increasing transparency and improvements in environmentalperformance, thus triggering innovation and continuous improvement [4].
Similarly, regional and federal governments (e.g. Germany) as well as buildingcertification schemes are developing databases and software packages that allow forgeneric and product-specific data to be made available to different stakeholders toallow them to assess the impact of new construction developments or maintenance[5]. Not only have these tools reduced the cost of an LCA, but it ensures that LCAis considered during the construction design and planning [5].
4 Discussion on Further Efforts to Integrate Datafrom LCAs and EPDs in GPP
When considering the different options for integrating LCA and EPD in GPPcriteria setting and purchasing decision consistently within any given sector onEuropean level, the key element that must be considered is harmonisation:
• It is a must that schemes operated in different European countries work in thesame way and avoid setting national special features in addition to the standardsto allow companies to consistently report LCA and EPD data;
Using LCA and EPD in Public Procurement Within the Construction Sector 501

• Benchmarks must be made available in order to ensure that products that areregarded as true differentiators are considered as such regardless of the countrythey are sold into;
• GPP award criteria must be harmonised, in order to ensure there is a consistentmessage from the public sector on what the focus areas are supposed to be, andthese should be driven by the European Commission;
• For those organisations that are not in a position to generate LCA data them-selves, financial support or publicly available data repositories should be madeavailable, driven by the public sector.
Truly implementing science-based product or service selection criteria for pur-chasing materials or services is the single most important element that will drive atrue reduction of the environmental impact of the European construction sector.Based on today’s assessment methodologies and data availability, LCAs and EPDsare a critical element in this approach, and should therefore be much more visible inpublic and private efforts to drive down the environmental impact.
References
1. Adibi N, Pasquet V, Darul M, Roy A, Salamon A, Challenges to mainstream the use of EPDs inconstruction Public Procurement in European context, LCM2017 conference, Luxembourg, 2017.
2. Fredriksen K-S, O’Born R, Implementing climate emission demands in road constructioncontracts: Insights from the KRAKK project and the Norwegian Public Roads Administration,LCM 2017 conference, Luxembourg, 2017.
3. Ganassali S, Lavagna M, Campioli A, Saporetti S, Green Public Procurement and ConstructionSector: EPD and LCA based benchmarks of the whole-building, LCM 2017 conference,Luxembourg, 2017.
4. Brankley L, Tugrul A, Anderson J, Knight D, A Manufacturing Sector’s Experience ofintegrating EPD alongside product, management system and responsible sourcing certificationfor public procurement, LCM 2017 conference, Luxembourg, 2017.
5. Kusche O, Brockmann T, Figl H, How LCA and EPD are used for implementing Green PublicProcurement in the construction sector in Germany, LCM 2017 conference, Luxembourg, 2017.
Open Access This chapter is licensed under the terms of the Creative Commons Attribution 4.0International License (http://creativecommons.org/licenses/by/4.0/), which permits use, sharing,adaptation, distribution and reproduction in any medium or format, as long as you give appropriatecredit to the original author(s) and the source, provide a link to the Creative Commons license andindicate if changes were made.The images or other third party material in this chapter are included in the chapter’s Creative
Commons license, unless indicated otherwise in a credit line to the material. If material is notincluded in the chapter’s Creative Commons license and your intended use is not permitted bystatutory regulation or exceeds the permitted use, you will need to obtain permission directly fromthe copyright holder.
502 K. Jelse and K. Peerens
Green Public Procurementand Construction Sector:EPD and LCA Based Benchmarksof the Whole-Building
Sara Ganassali, Monica Lavagna, Andrea Campioliand Sergio Saporetti
Abstract The paper discusses the possible use of Life Cycle Assessment(LCA) and Environmental Product Declarations (EPDs) in European and ItalianGreen Public Procurement (GPP) for the building sector, in order to define targetsbased on objective and reliable building environmental impacts information. Theresearch objective is to define how to set LCA benchmarks towards the improve-ment of GPP requirements. The study analyses the GPP criteria based on LCA inEurope with a focus on Italy; it proposes LCA benchmarks for selected groups ofconstruction materials and scenarios for the implementation of LCA benchmarksrelated to buildings elements and whole-buildings. It also illustrates how publicadministrations can verify the GPP criteria achievement using EPDs.
1 Introduction
Life Cycle Assessment (LCA) practice is increasing in the construction sector toevaluate the environmental sustainability of buildings. Generally, the definition ofthe better environmental profile between buildings providing a similar function isperformed through the simple comparison of the LCA impacts results. Thisapproach should be completed by objective LCA-based environmental benchmarks(reference values) to be set, which can be used for setting sustainable constructionand production targets. Environmental LCA-based benchmark values are used inseveral Green Building Rating Systems (GBRSs) and in buildings energy certifi-cations. In these certifications (such as LEED, BREEAM, Verde, Green Star,
S. Ganassali (&) � M. Lavagna � A. CampioliDepartment of Architecture, Built Environment and ConstructionEngineering, Politecnico di Milano, 20133 Milan, Italye-mail: [email protected]
S. SaporettiMinistero dell’ambiente e della tutela del territorio e del mare,Direzione clima ed energia, Divisione II certificazione ambientaleed acquisti pubblici verdi, 00147 Rome, Italy
© The Author(s) 2018E. Benetto et al. (eds.), Designing Sustainable Technologies,Products and Policies, https://doi.org/10.1007/978-3-319-66981-6_56
503

Minergie, etc.) the LCA benchmarks are not performed on a common basis,inducing the consideration of different repositories for each, making the comparisonof different LCA-based benchmarks impossible for the building sector. Thebenchmarks used in these certifications are often established from the statisticalanalysis of LCA data obtained from a reference buildings sample with specificenvironmental performances [1, 2], or from a reference building modelledaccording to national standards and prescriptions [3–5].
Considering the lack of a common framework for setting environmental sus-tainable targets for the construction sector, the present study aims at presenting anew benchmarking approach, fixing LCA-based benchmark “code of practice” forconstruction materials, building elements and whole-building. LCA benchmarkvalues can improve European and Italian Green Public Procurement (GPP) criteriarequired for the construction sector, and it can also support stakeholders withsustainable construction strategies and improvement of buildings environmentalperformances. It could also support the GPP verification process made by publicadministrations.
The study is divided into four sections. First, the use of LCA in the GPP forbuildings is examined, illustrating which EU Members have already included LCAapproach and consideration of Environmental Product Declarations (EPDs) in thenational GPP. Second, the benchmarking methodology and the environmentalbenchmarks related to building materials are illustrated, as well as the proposedEPD-based verification process for the contracting authorities. Finally, the approachused to set LCA-based environmental benchmarks for building elements andwhole-buildings is explained.
2 LCA Data, EPDs and GPP in Europe
This section investigate the possibility to introduce LCA in GPP criteria for theconstruction sector, through the analysis of GPP requirements from the EUCommission. The EU Nations are encouraged to draw up National Action Plans(NAPs) for reducing environmental impacts from public tenders managed bycontracting authorities and the associated procurements of goods, services andworks. GPP criteria for buildings are often developed in NAPs, including envi-ronmental design and planning strategies in the national political framework. GPPis a voluntary instrument, aiming at stimulate the market demand for more sus-tainable goods and services. LCA-based criteria are required in the optionalEU-GPP for “Office Building Design, Construction and Management” [6],including the environmental evaluation of impacts during all the stages of thebuildings life cycle (production of materials and elements, construction, use stageand end of life), promoting the application of a cradle-to-grave LCA. In GPPrequirements for buildings, the promotion of energy efficiency and the use ofproducts with a specific percentage of recycled content material are also integrated.There is only one LCA-based indicator required in GPP for new office buildings
504 S. Ganassali et al.
which is the total amount of Global Warming Potential (GWP) for the buildingwhole-life. It can be partly calculated by practitioners through the aggregation ofEPDs results for the main building elements (foundations and substructures,structural frame, external walls, floors and ceilings, internal walls, windows androofs), and/or based on a complete cradle-to-grave LCA. The LCA and use of EPDsprovide a quantitative assessment of the building environmental performances,however, the comparability between two options remains sensitive even if the EPDsare compliant with the related existing standards and Product Category Rule (PCR).
The use of GPP for buildings in European Nations has been investigated(Table 1), analysing the use of the LCA approach in GPP criteria and the relateduse of EPDs for the LCA in order to understand how the environmental productslabels are used by contracting authorities to verify the GPP criteria achievement.
For each EU member State, Table 1 shows the presence of National ActionPlans (NAP), the adoption of GPP for buildings, the use of the Life CycleAssessment (LCA) and the use of Environmental Product Declarations (EPDs).
Table 1 shows a restricted view of the use of LCA and EPDs in GPP forbuildings, however the information found is useful in order to understand how someEU Nations insert environmental criteria in public procurement. Belgium insertsLCA in GPP-Office Buildings criteria using the GBRSs (i.e. LEED and BREEAM)which just involve the life cycle approach in their criteria; Denmark suggests theuse of LCA and EPDs for an environmental products comparison; Lithuaniaintroduces the LCA and the Life Cycle Costing as mandatory analysis;Luxembourg introduces voluntary LCA criteria; The Netherlands requires manda-tory LCA analysis for groundworks, roads and hydraulic engineering constructions.
The study focused on the Italian GPP requirements for building products, inorder to develop propositions for improving environmental sustainability criteria.The new Italian procurement code (Codice degli Appalti) requires compulsoryenvironmental criteria (Criteri Ambientali Minimi–CAMs) to enhance the sus-tainability process of construction products, of new public and refurbished build-ings and of public construction sites management [7]. CAMs criteria are set on threedesign reference steps: the sustainable site analysis, in which the consideredbuilding is located; the buildings technical specifications, which include dynamicenergetic simulations, the use of new energy supplies, indoor air quality andcomfort and the materials technical specifications, which set the recycled contentvalue for specific material categories.
The CAMs criteria related to the environmental sustainability of buildingproducts, do not include LCA. CAMs set mandatory recycled content percentagevalue for different material categories (i.e. the concrete must contain at least 5% ofrecycled content on the product’s weight, as well as bricks and gypsum plaster-boards). The contracting authorities can check the latter criteria achievement withthe use of materials environmental performances issued from environmental/energybuilding certifications (i.e. LEED, BREEAM, etc.) and/or construction productsenvironmental labels (labels type I, II and III). However, the use of EPDs in CAMsis underestimated, despite for the first time the use of EPDs is incentivised.
Green Public Procurement and Construction Sector: EPD and LCA … 505

Table 1 Analysis of GPP-LCA criteria application for buildings in European Nations
Nations NationalAction PlansProvided by “National GPPAction Plans (policies andguidelines)”, EU Commission,DG Environment (updated toMay 2017)
GPPBuildingsCollectedthrough thenational GPPwebsite
Life CycleAssessmentCollectedthrough thenational GPPwebsite
EPDs
Austria � � � �Belgium � � � �Bulgaria � � n.a. n.a.
Croatia � � � �Cyprus � n.a. n.a. n.a.
CzechRepublic
� n.a. n.a. n.a.
Denmark � � � �Estonia � � n.a. n.a.
Finland � � � �France � � n.a. n.a.
Germany � � � �Greece � � n.a. n.a.
Hungary � � n.a. n.a.
Ireland � u.d. n.a. n.a.
Italy � � � �Latvia � n.a. n.a. n.a.
Lithuania � � � �Luxembourg � � � �Malta � � n.a. n.a.
TheNetherlands
� � � �
Poland � � n.a. n.a.
Portugal � u.d. n.a. n.a.
Romania � � n.a. n.a.
Slovakia � u.d. n.a. n.a.
Slovenia � � n.a. n.a.
Spain � � n.a. n.a.
Sweden � � n.a. n.a.
Norway � � � �Swiss � n.a. n.a. n.a.
UK � � n.a. n.a.
LegendBlack circle: present topicWhite circle: not present topicn.a. information not availableu.d. topic under development
506 S. Ganassali et al.
Therefore it induced the promotion of EPDs on the market: the manufacturersare encouraged to certify their products in order to compete in public tenders, whilethe practitioners are stimulated toward environmental strategies choosing certifiedproducts. Increasing the use of EPDs in the construction sector could lead to agrowth of available transparent LCA data on market and to a possible introductionof LCA benchmarks in CAMs criteria. Moreover, with the LCA benchmarksinsertion in CAMs, the EPDs could become simple verification instruments forpublic administrations.
3 LCA Benchmarks for Construction Products
This section aims at demonstrating how LCA-based benchmark values for con-struction products can be defined, and how could EPDs be integrated into CAMscriteria in order to facilitate the verification process by the public administrations incharge of analysing different options.
The benchmark values for construction materials developed in this study arefixed for different LCA impact categories and they could be integrated in GPPcriteria, in order to set environmental sustainable levels for building products. Thebenchmarking methodology has been developed after a detailed literature review offive recent studies in which existing environmental benchmarks practices in theconstruction sector have been applied. The benchmarking methods were all basedon the statistical analysis and interpretation of LCA data. In the analysedcase-studies, LCA-based benchmarks were related to healthcare buildings inPortugal [8], for school buildings in South Korea [9] and for residential buildings inItaly [12], France [11] and Germany. In order to set LCA-based benchmarks forconstruction products, a reference sample composed by eight construction productcategories was processed, categories are also contained in CAMs criteria (cement,bricks, wood-based materials, steel, gypsum plasterboards, glass wool panels, stonewool panels and ceramic tiles). The sample was made by building materialsmanufactured and sold in Europe in recent times (after the year of 2010) and it wasconsidered representative of the European production/construction practices. Therelated LCA data were collected through EPDs, reporting transparent environmentalimpacts results for each product life cycle phase. The LCA system boundariesconsidered in this study are the one related to the product stage (LCA modules A1,A2 A3). Thirty-two EPDs were analysed for cement, eight for bricks, eleven forwooden-based materials, forty-five for steel, thirty-one for gypsum plasterboard,fifty for glass-wool panels, fifteen for stone-wool panels and twenty-five for cera-mic tiles.
The EPDs collected were taken from European EPD Program Operators:BAU EPD (Austria), IBU (Germany), International EPD® System (Sweden),GlobalEPD (Spain), EPD Denmark (Denmark), DAPHabitat System (Portugal),FDES INIES (France), EPD Italy (Italy) and EPDNorge (Norway). In order toguarantee the comparability and the homogeneity between LCA data from different
Green Public Procurement and Construction Sector: EPD and LCA … 507

national repositories, it was checked that the EPDs were compliant with theEuropean standard EN 15804:2012 “Sustainability of construction works”, and thatthey have mutual recognition between the Product Category Rules (PCRs).
Ten environmental impacts categories were considered: GWP, Ozone DepletionPotential (ODP), Acidification Potential (AP), Eutrophication Potential (EP),Photochemical Ozone Creation (POCP), Abiotic Depletion Potential for Non-fossilresources (ADNP), Abiotic Depletion Potential for fossil resources (ADP0), Totaluse of Renewable Primary Energy resources (PERT), Total use of Non-RenewablePrimary Energy resources (PENRT), and the consumption of Fresh Water (FW).The method applied to set LCA-based benchmarks was a statistical analysis andinterpretation of LCA data collected. It allows verification of wrong data (theoutliers) and the assessment of the reliability of final results. For each materialcategory and for each environmental impact category, three benchmark values havebeen set up: the limit value, the reference value and target value. The referencevalue represents the median value, which is not sensitive to the outliers in a samplecomposed of a small number of data. The target and the limit value are set using thequartile division of LCA data: the target value is fixed by the 1° quartile, whichindicates a value of 25% lower than the median value (it represents the bestmanufacturing practice); the limit value is fixed by the 3° quartile, which representsa value of 25% higher than the median value (the lowest acceptable value in theevaluation scale).
In Table 2, the benchmarks fix the limit, the reference and the target values ofGWP, AP, PENRT and FW.
In Table 2, the negative GWP value observed for wooden products is due to theCO2 stored in the products, which is released into the atmosphere at the end of usestage. The LCA benchmarks presented in the study are European benchmark val-ues, the LCA benchmarks could be divided and analysed per country, extrapolatingsingle threshold values for each Nation (Fig. 1).
The three LCA-based benchmarks (limit, reference and target values) fix asustainable range of values for each material group, so the public administrationcould decide which is the better sustainable level to apply in the public tenderrequirements. They can then check the GPP criteria achievement, verifying if theLCA data of specific building products (certified with EPD labels) fall into theLCA-based benchmark range.
The LCA benchmarks are based on a limited number of data due to the lack ofEPDs and LCA-based data available on the market, despite the number of infor-mation published is increasing.
508 S. Ganassali et al.
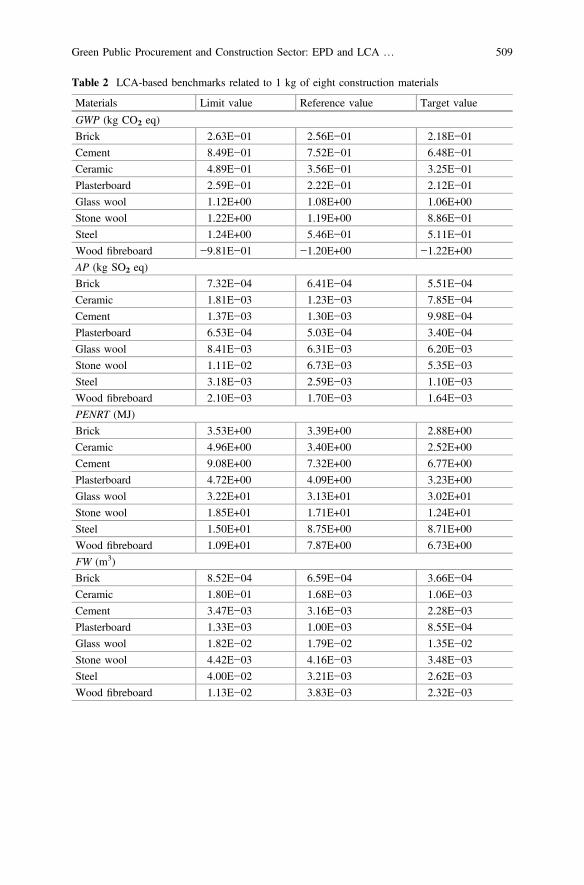
Table 2 LCA-based benchmarks related to 1 kg of eight construction materials
Materials Limit value Reference value Target value
GWP (kg CO2 eq)
Brick 2.63E−01 2.56E−01 2.18E−01
Cement 8.49E−01 7.52E−01 6.48E−01
Ceramic 4.89E−01 3.56E−01 3.25E−01
Plasterboard 2.59E−01 2.22E−01 2.12E−01
Glass wool 1.12E+00 1.08E+00 1.06E+00
Stone wool 1.22E+00 1.19E+00 8.86E−01
Steel 1.24E+00 5.46E−01 5.11E−01
Wood fibreboard −9.81E−01 −1.20E+00 −1.22E+00
AP (kg SO2 eq)
Brick 7.32E−04 6.41E−04 5.51E−04
Ceramic 1.81E−03 1.23E−03 7.85E−04
Cement 1.37E−03 1.30E−03 9.98E−04
Plasterboard 6.53E−04 5.03E−04 3.40E−04
Glass wool 8.41E−03 6.31E−03 6.20E−03
Stone wool 1.11E−02 6.73E−03 5.35E−03
Steel 3.18E−03 2.59E−03 1.10E−03
Wood fibreboard 2.10E−03 1.70E−03 1.64E−03
PENRT (MJ)
Brick 3.53E+00 3.39E+00 2.88E+00
Ceramic 4.96E+00 3.40E+00 2.52E+00
Cement 9.08E+00 7.32E+00 6.77E+00
Plasterboard 4.72E+00 4.09E+00 3.23E+00
Glass wool 3.22E+01 3.13E+01 3.02E+01
Stone wool 1.85E+01 1.71E+01 1.24E+01
Steel 1.50E+01 8.75E+00 8.71E+00
Wood fibreboard 1.09E+01 7.87E+00 6.73E+00
FW (m3)
Brick 8.52E−04 6.59E−04 3.66E−04
Ceramic 1.80E−01 1.68E−03 1.06E−03
Cement 3.47E−03 3.16E−03 2.28E−03
Plasterboard 1.33E−03 1.00E−03 8.55E−04
Glass wool 1.82E−02 1.79E−02 1.35E−02
Stone wool 4.42E−03 4.16E−03 3.48E−03
Steel 4.00E−02 3.21E−03 2.62E−03
Wood fibreboard 1.13E−02 3.83E−03 2.32E−03
Green Public Procurement and Construction Sector: EPD and LCA … 509
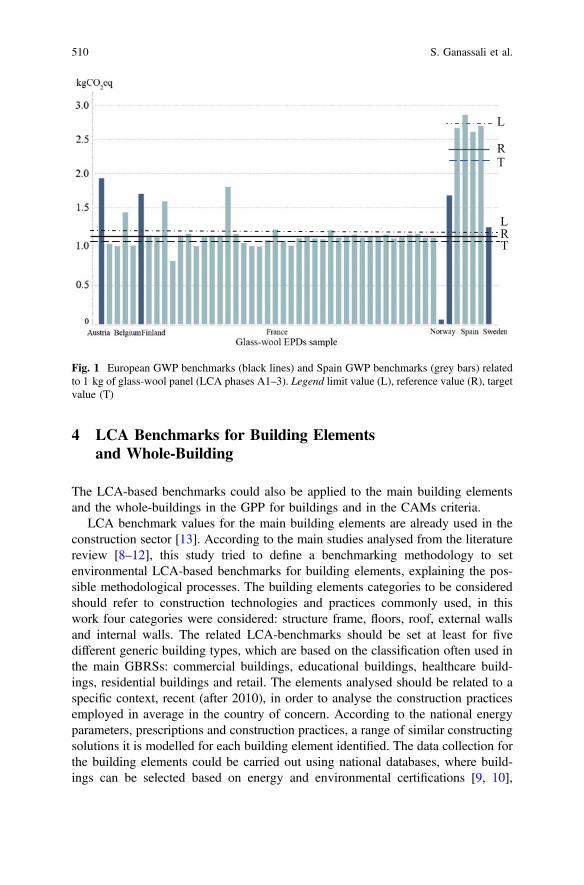
4 LCA Benchmarks for Building Elementsand Whole-Building
The LCA-based benchmarks could also be applied to the main building elementsand the whole-buildings in the GPP for buildings and in the CAMs criteria.
LCA benchmark values for the main building elements are already used in theconstruction sector [13]. According to the main studies analysed from the literaturereview [8–12], this study tried to define a benchmarking methodology to setenvironmental LCA-based benchmarks for building elements, explaining the pos-sible methodological processes. The building elements categories to be consideredshould refer to construction technologies and practices commonly used, in thiswork four categories were considered: structure frame, floors, roof, external wallsand internal walls. The related LCA-benchmarks should be set at least for fivedifferent generic building types, which are based on the classification often used inthe main GBRSs: commercial buildings, educational buildings, healthcare build-ings, residential buildings and retail. The elements analysed should be related to aspecific context, recent (after 2010), in order to analyse the construction practicesemployed in average in the country of concern. According to the national energyparameters, prescriptions and construction practices, a range of similar constructingsolutions it is modelled for each building element identified. The data collection forthe building elements could be carried out using national databases, where build-ings can be selected based on energy and environmental certifications [9, 10],
RT
L
L
RT
Fig. 1 European GWP benchmarks (black lines) and Spain GWP benchmarks (grey bars) relatedto 1 kg of glass-wool panel (LCA phases A1–3). Legend limit value (L), reference value (R), targetvalue (T)
510 S. Ganassali et al.

or through the screening of the calls for tenders [11]. As for materials the LCA datarelated to each building element should be processed through statistical analysis andinterpretation, in order to establish the reference value [10]. The reference studyperiod should be based on 100 years and the LCA system boundaries should becradle-to-grave. The environmental impacts should be normalised to 1 m2 of thebuilding element, in order to allow comparison of building elements.
The benchmarking methods could be applied to set LCA benchmarks forwhole-buildings. LCA-based benchmarks for the whole-buildings could be fixedthrough the statistical analysis of the LCA data related to a specific built envi-ronment [1, 2, 5] or modelling a reference building starting from national con-struction standards and prescriptions. The buildings sample should be composed bybuildings realised after the year of 2010 and they should belong to a specificconstruction context, according to the national energy standards and the currentconstruction practices. The buildings analysed should refer to the main five differentgeneric buildings types: commercial buildings, educational buildings, healthcarebuildings, residential buildings and retail. The LCA benchmarks should refer to thesingle building function, avoiding issues linked to building operational energy useand occupations (i.e. the educational buildings have different energy consumptionthan an office building related to the worktime and equipment use) [14]. Thebuilding typologies related to the functions can be divided into building archetypes,according to the specific built environment characteristics (i.e. the residentialbuilding could be divided into single-family house, terraced house, multi-familyhouse and apartment block). A reference building should be modelled for eachbuilding archetype and each building function, fixing the reference service life(equal to 100 years) and the functional unit (1 m2 of gross floor area), in order tocompare the building environmental performances. The LCA system boundaries forthe whole-building benchmark should be cradle-to-grave. Based on a statisticalanalysis, the median value should be set as the reference LCA benchmark for thewhole-buildings [8–12]. As an example the Swedish developer and constructioncompany Folkhem have certified a wooden residential house with the SwedishProgram Operator “The International EPD® System”: the EPD assesses the lifecycle of a Folkhem’s concept building, providing objective and reliable informationon the environmental impacts of the whole-building. The use of EPDs, as well asthe Folkhem’s EPD, could be an easy tool for contracting authorities, in order toverify the GPP criteria achievement and to permit an appropriate check of theprocurement contract executions.
5 Conclusions
The study proposes a simple benchmarking to set LCA-based benchmarks,incentivising the use of environmental performances values in GPP criteria, in orderto facilitate the verification activities of public administrations. In this study, LCAbenchmarks for construction products were fixed and an approach to fix building
Green Public Procurement and Construction Sector: EPD and LCA … 511
elements and whole-building benchmarks is articulated. The inclusion of LCAbenchmark values in GPP criteria for buildings can stimulate the use and theproduction of EPDs for the construction market, making available transparent LCAdata and facilitating the integration of LCA in the GPP criteria. The EPDs couldalso be an instrument to verify the GPP criteria achievement by contractingauthorities.
The use of LCA-based benchmarks could also be a way to stimulate the buildingmarket to reach new environmental sustainability targets.
References
1. Garnett N, Pickrell S, Benchmarking for construction: theory and practice, ConstructionManagement and Economics, 2000, Vol 18, pp. 55–63.
2. Haapio A, Viitaniemi P, A critical review of building environmental assessment tools,Environmental Impact Assessment Review, Vol. 28, 2008, pp. 469–482.
3. Eberl S, DGNB vs. LEED: A comparative analysis, Conference on Central Europe towardsSustainable Building, 2010.
4. Collinge W.O, Thiel C.L, Campion N.A, Al-Ghamdi S.G, Woloschin C.L, Soratana K,Bilec M.M, Integrating Life Cycle Assessment with Green Building and Product RatingSystems: North American Perspective, Procedia Engineering, Vol. 118, 2015, pp. 662–669.
5. Ganassali S, Lavagna M, Campioli A, LCA benchmarks in buildings environmentalcertification systems, 41st IAHS World Congress “Sustainability and Innovation for theFuture”, Portugal, 2016.
6. Dodd N, Garbarino E, Gama Caldas M, Green Public Procurement Criteria for OfficeBuilding Design, Construction and Management. Procurement practice guidance document,EUR 28006 EN, 2016.
7. Allegato 1 del G.U. n.16 del 21 Gennaio 2016, Criteri ambientali minimi per l’affidamento diservizi di progettazione e lavori per la nuova costruzione, ristrutturazione e manutenzione diedifici pubblici, Ministero dell’Ambiente, del Territorio e del Mare, 2016.
8. Castro M.d.F, Mateus R, Serodio F, Braganca L, Development of benchmarks for operatingad resources consumption to be used in healthcare building sustainability assessmentmethods, Sustainability, Vol. 7, 2015, pp. 13222–13248.
9. Ji C, Hong T, Jeong J, Kim J, Lee M, Jeong K., Establishing environmental benchmarks todetermine the environmental performance of elementary school buildings using LCA. Energyand Buildings, Vol. 127, 2016, pp. 818–829.
10. Köning H, De Cristofaro M.L, Benchmarks for Life Cycle Costs and Life Cycle Assessmentbenchmarks of residential buildings. Building Research & Information, Vol. 40, No. 5, 2012,pp. 558–580.
11. Lasvaux S, Lebert A, Achim F, Grannec F, Hoxha E, Nibel S, Chevalier J, Towards guidancevalues for the environmental performance of buildings: application to the statistical analysis of40 low-energy single family houses’ LCA in France, The International Journal of Life CycleAssessment, Vol. 22, No. 5, 2016, pp. 657–674.
12. Moschetti R, Mazzarella L, Nord N, An overall methodology to define reference values forbuilding sustainability parameters, Energy and Buildings, Vol. 88, 2015, pp. 413–427.
13. Anderson J, Shiers D, Green guide to specification, John Wiley & Sons, 2016.14. Hong S, Paterson G, Burman E, Steadman P, Mumovic D, A comparative study of
benchmarking approaches for non-domestic buildings: Part 1—top-down approach,International Journal of Sustainable Built Environment, Vol. 2, 2013, pp. 119–130.
512 S. Ganassali et al.

Open Access This chapter is licensed under the terms of the Creative Commons Attribution 4.0International License (http://creativecommons.org/licenses/by/4.0/), which permits use, sharing,adaptation, distribution and reproduction in any medium or format, as long as you give appropriatecredit to the original author(s) and the source, provide a link to the Creative Commons license andindicate if changes were made.The images or other third party material in this chapter are included in the chapter’s Creative
Commons license, unless indicated otherwise in a credit line to the material. If material is notincluded in the chapter’s Creative Commons license and your intended use is not permitted bystatutory regulation or exceeds the permitted use, you will need to obtain permission directly fromthe copyright holder.
Green Public Procurement and Construction Sector: EPD and LCA … 513

Special Session on ProductEnvironmental Footprint
Mélanie Guiton and Enrico Benetto
Abstract The Product Environmental Footprint (PEF) Life Cycle Assessment(LCA) method has been adopted by the European Commission in 2013 as part ofthe Communication “Building the Single Market for Green Products” [1]. Sincethen a pilot phase involving about 300 companies, industry associations, NGOs andgovernments has been launched to develop product category rules for more than 20different product groups. In this session it was discussed the status of play of thework done till now and its future perspective.
1 Introduction
In 2010 a coalition of big companies from different sectors asked to the at the timeEuropean Commissioner for Environment Janez Potočnik to intervene to solve aproblem that was undermining their competitiveness in the European market. Theproblem was the proliferation of environmental labels and certification schemes thatwas taking place in different European Member States. From the industry viewpointthis situation constrained them in particular to produce different studies and calculationsreporting the environmental performance of the same product in case that product wasgoing to be sold in different countries. This situation was created by the fact thatdifferent countries (e.g. France, Italy, United Kingdom, Switzerland) were developingproduct-related environmental information policies based on similar-but-differentmethodological approaches (being them ISO 14040-44, ISO 14025, WRI GHG pro-tocol, PAS 2050, BP X30, and many more). The same year the European Council putforward the same request to the Commission, that is to develop a harmonised method tocalculate the environmental performance of products along their entire supply chain.Based on this double request the Commission developed the Product Environmental
M. Guiton (&) � E. BenettoDepartment ERIN—Environmental Research and Innovation,Luxembourg Institute of Science and Technology (LIST),Life Cycle Sustainability and Risk Assessment, 4422 Belvaux, Luxembourge-mail: [email protected]
© The Author(s) 2018E. Benetto et al. (eds.), Designing Sustainable Technologies,Products and Policies, https://doi.org/10.1007/978-3-319-66981-6_57
515
Footprint (PEF) and Organisation Environmental Footprint (OEF) methods. They wereadopted by the Commission in April 2013 [2] and published in May 2013 on theOfficial Journal of the European Union.
The intention was to provide industry, member states and NGOs with a solidscience-based LCA calculation tool that would lead to results more reproducible,reliable and verifiable. The achievement of these ambitious objectives, however,requires the development of product category rules (organisation sectoral rules forthe implementation of OEF) and a number of additional features like clear rules onverification, communication, data quality, etc. In order to develop and test all thesenew features the Commission decided to launch, in tight collaboration with allstakeholders, a pilot phase (2013–2017).
During the special session on PEF at LCM 2017 conference the work doneduring the pilot phase has been analysed from different viewpoints and somepreliminary insight about possible future application of PEF/OEF has been drawn.
2 Summary of the Presentations Delivered
The first presentation was delivered by An De Schryver from the EuropeanCommission. Ms. De Schryver presented the main outcomes of the EnvironmentalFootprint (EF) pilot phase. The EF pilot phase has gathered about 300 stakeholdersfrom worldwide, actively developing Product Environmental Footprint CategoryRules (PEFCRs) and Organisation Environmental Footprint Sectoral Rules(OEFSRs). These organisations (companies, industry associations, governments,NGOs) have invested important resources to develop a work that they consider keyfor their future respective interests. On top of the 300 stakeholders “doing” thework, there have been more than 2000 stakeholders who have been monitoring thedevelopments and participating to the several online consultations run during theseyears. This has been the first case of such a wide exercise run by the EuropeanCommission and surely shows the high political and technical relevance of thedossier.
Ms. De Schryver highlighted the main results achieved during the pilot phase. Inparticular she stressed the following ones:
• Implementation of the materiality principle. It is well known to LCA prac-titioners that even for the most complicated products there are a limited numberof processes that drives the majority of the impacts. The hotspot analysis pro-cedure developed for PEF allows to identify the most relevant impact categories,life cycle stages, processes, and direct elementary flows, i.e. those contributingto at least 80% of the environmental impacts. The driving processes will bethose for which company and/or site specific data will be requested.
• Implementation of the Data Needs Matrix (DNM). Once the most relevantprocesses are identified, clear instruction on which data shall be collected and
516 M. Guiton and E. Benetto
what kind of secondary datasets can be used are listed in the DNM, based on thelevel of operational control the company performing the study has.
• Reduction of costs. One of the barriers towards a wider implementation ofLCA, especially in Small and Medium Enterprises (SMEs) has been the cost ofimplementing such studies, due to a number of factors, including the amountof data to be collected/found, the time requested to do calculations, the costs ofverification, the cost to access to secondary LCI database. The implementationof PEF will bring down many of the costs of performing a PEF/LCA study, upto 80%, depending on the specific situations. This result will be achieved thankto the availability of common rules (PEFCRs/OEFSRs), high quality secondaryLCI datasets available for free to any user around the world, free availability ofthe models used, the availability of user-friendly software, of e-learning pack-ages developed in several languages, and clear verification rules.
• Harmonisation of secondary data sources. By having clear modellingrequirements for secondary dataset tendered, the PEF initiative is steering theharmonisation of existing LCI commercial databases. The Commission willmake available more than 8000 secondary LCI datasets coming from 6 differentdata providers. They will all have the same modelling requirements for theforeground data, the same energy and transport datasets for the background.Moreover, they will all use the same format and nomenclature, therefore makingthem directly usable in most of the LCA software available on the market.
The second presentation was delivered by Mr Erwin M. Schau from theEuropean Commission Joint Research Centre. He focused his presentation on theconcept of classes of performance, based on the example of the PEFCR on olive oil.One of the novelty introduced by the PEF method is the concept of benchmark,corresponding to the PEF profile of the average product sold in Europe.Each PEFCR includes one or more representative products. Each of them ismodelled based on the different production techniques and their respective “weight”in terms of consumption based European market. The representative producttherefore represents the weighted average for that group and its PEF profile, cal-culated and reported in the PEFCR, it is the benchmark for that productgroup. Therefore, by having this reference publicly available, each producer will beable to know if their own product score better or worse than the benchmark. Oncethe benchmark is available, the next logical step is to consider the possibility ofdeveloping classes of environmental performance. During the pilot phase thestakeholders leading the development of PEFCRs were invited to test this concept,in particular trying to develop 5 classes of performance, where the benchmark isalways class C. This is an optional requirement. The approach taken to define theclasses of performance was to identify the most relevant parameters (in terms ofactivity data and emissions) and then identify the theoretical minimum and maxi-mum values possible for such parameters. Once these were identified the calcula-tions were run to identify the range of performance that could be achieved withdifferent combinations of the various parameters. Mr. Schau highlighted the prosand cons of this approach, clearly stating that the ideal solution would be to base the
Special Session on Product Environmental Footprint 517
definition of the classes of performance on a statistically representative sample ofPEF profiles calculated for real products.
The third presentation was delivered by Mr. Quentin De Hults, speaking onbehalf of PlasticsEurope. PlasticsEurope has been committed in LCA for decadesby managing a dataset program for plastics, and by contributing to LCA devel-opments e.g. through the UNEP SETAC Life Cycle Initiative. PlasticsEurope alsobelieves in LCA to be completed by other tools like risk assessment. With thisconstructive state of mind, PlasticsEurope is participating to the European ProductEnvironmental Footprint, officially in 3 pilots and in many other working groupsand workshops. According to Mr. De Hults the EF pilot phase contributed toimprove the best practice in the LCA domain thanks to the transparency of theapproach and the high quality of the technical discussions that take place at theTechnical Advisory Board. He also mentioned a number of issues to be furtherimproved, referring e.g. to the improvement of the toxicity impact categories, withthe development of more reliable characterisation factors. He mentioned that theapproach taken in PEF should be complemented with other approaches likeProscale (a specific presentation of Proscale took place during the same confer-ence). Another area of improvement referred to the development of secondarydatasets when there are only few companies running certain processes, taking intoaccount the associated industrial confidentiality issues to be addressed. Accordingto PlasticsEurope, there is room for the use of PEF into existing or new productpolicies provided that it remains a voluntary approach.
The fourth presentation was delivered by Mr. Pau Huguet Ferran fromEcomatters. Mr. Ferran spoke on behalf also of PRé Consultants. The two com-panies supported the European Commission during the EF pilot phase by reviewinga number of PEF studies carried out by companies on real products to test thefeasibility of implementation of the draft PEFCR developed. The shortcomingsidentified when reviewing these studies have been very important to improve thequality of the PEFCRs and to correct some flaws in the methodological require-ments developed during the pilot phase. Some of the most relevant problemshighlighted by the reviewers were that (i) the PEFCRs were not strict enough interms of modelling requirements, (ii) the DNM was not systematically imple-mented, (iii) the Circular Footprint Formula, that is the single formula to calculatecredits and burden related to the end of use of a product, was too complicated andwrongly implemented by some companies, (iv) the way how the representativeproduct has been modelled by the stakeholders leading the PEFCR development isnot necessarily supported the companies implementing it.
Based on the outcome of these reviews a number of changes have beenimplemented in the Guidance documents supporting the pilot phase.
The fifth and last presentation was delivered by Ms. Mihaela Thuring fromVITO, institute actively involved in two pilots and some supporting contracts.According to Ms. Thuring environmental information on organisations and prod-ucts are important tools that companies can use for achieving environmental goalstowards a sustainable society. Both ISO 14001 (Environmental managementsystems) and PEF are aimed at providing such information to market players.
518 M. Guiton and E. Benetto

The PEF method explores a new way of communicating the environmental impactsof products through the application of the PEF formula(s), as part of the effortstowards a Circular Economy. This new way expresses no longer the actual potentialenvironmental impact, but includes also the potential benefits of the recycling/recoverability process, as well as the energy recovery potential of the materials.While understandable for professionals in the field, this new approach poses mul-tiple questions in determining how this complex message gets across to consumersand how it will contribute to fulfilling the original goal of streamlining the com-munication of environmental information. The wide participation in the PEF/OEFpilot of actors across most industries and beyond European borders showed that therelevance of LCA methods in taking decisions and communicating on environ-mental related aspects is more actual than ever, as well as the interest in the unifyingapproach which the PEF/OEF method is bringing.
VITO stated that the identification of information flows between PEF and ISO14001 determines how an organisation can integrate both the PEF and ISO 14001 ina coherent and efficient manner.
3 Conclusions
The discussion during this special session highlighted the great amount of workdone by the European Commission and all stakeholders in the context of theEnvironmental Footprint pilot phase. It is widely acknowledged that majorimprovements from the methodological point of view have been achieved, leadingto a new generation of LCA/PEF studies that should deliver results that are morereliable, more reproducible and more verifiable. The pilot phase highlighted issuesto be solved in the area of characterisation factors in existing impact assessmentmethods, the need to develop more and better defined impact categories (e.g. in thearea of biotic and abiotic resources). There are important quality issues found in allcommercial databases that would require paying more attention and, in particular, tothe review process of these databases. There is work to be done to better identify thebenchmarks, and to develop classes of performance. There is an important “edu-cational” work to be done within practitioners, policy makers, and NGOs when itcomes to the development and use of weighting factors. However, notwithstandingall these possible improvements, the LCA community is aware that their credibilitydepends highly on the success of PEF. There are market needs to be addressed,there are policies that could highly benefit from a consistent use of LCA principle.There are problems related to misleading green claims and the way we implementgreen public procurement that could be addressed and maybe solved by embeddingPEF into a number of existing or new policies. After the pilot phase the EuropeanCommission will engage with all interested stakeholders in an open conversationabout the future role of PEF/OEF and LCA into European policies.
Special Session on Product Environmental Footprint 519

Acknowledgements The session on Product Environmental Footprint has been chaired by Mr.Michele Galatola, Product Team Leader at European Commission—DG ENV, and Mr. AlbertoFrausin, CEO at Carlsberg Italy. The authors would like to greatly acknowledge Mr. MicheleGalatola for having provided the complete content of this paper. As agreed between thedeclared authors of the paper and Mr. Galatola, he remains the corresponding [email protected].
References
1. European Commission, Communication from the Commission to the European Parliament andthe Council: Building the Single Market for Green Products—Facilitating better information onthe environmental performance of products and organisations, April 2013, COM/2013/0196final.
2. European Commission, Recommendation of 9 April 2013 on the use of common methods tomeasure and communicate the life cycle environmental performance of products andorganisations, 2013/179/EU.
Open Access This chapter is licensed under the terms of the Creative Commons Attribution 4.0International License (http://creativecommons.org/licenses/by/4.0/), which permits use, sharing,adaptation, distribution and reproduction in any medium or format, as long as you give appropriatecredit to the original author(s) and the source, provide a link to the Creative Commons license andindicate if changes were made.The images or other third party material in this chapter are included in the chapter’s Creative
Commons license, unless indicated otherwise in a credit line to the material. If material is notincluded in the chapter’s Creative Commons license and your intended use is not permitted bystatutory regulation or exceeds the permitted use, you will need to obtain permission directly fromthe copyright holder.
520 M. Guiton and E. Benetto