designing a conservation landscape for tigers in human-dominated environments
TRANSCRIPT
Research Note
Designing a Conservation Landscape for Tigersin Human-Dominated EnvironmentsERIC WIKRAMANAYAKE,∗ MEGHAN MCKNIGHT,∗§ ERIC DINERSTEIN,∗ ANUP JOSHI,†BHIM GURUNG,† AND DAVID SMITH†∗Conservation Science Program, World Wildlife Fund–U.S., 1250 Twenty-Fourth Street NW, Washington, D.C. 20037, U.S.A.†Department of Fisheries & Wildlife, University of Minnesota, 1980 Folwell Avenue, St. Paul, MN 55108, U.S.A.
Abstract: Wildlife populations in small, isolated reserves face genetic and demographic threats to theirsurvival. To increase the probability of long-term persistence, biologists promote metapopulation management,in which breeding subpopulations are protected as source pools. Animals that disperse from the source poolsincrease the probability of persistence of the metapopulation across the greater landscape. We used a geographicinformation system (GIS)–based, cost-distance model to design a conservation landscape along the Himalayanfoothills for managing a metapopulation of Asia’s largest predator, the tiger (Panthera tigris). The model isbased on data from 30 years of field research on tigers, recent satellite imagery, and a decade of buffer-zonerestoration in this region. We used the model to (1) identify potential dispersal corridors for tigers; (2) identifystrategic transit refuges; and (3) make recommendations for off-reserve land management and restoration toenhance the potential of corridors for tigers. This tool can aid the design of conservation landscapes for otherendangered, wide-ranging species in human-dominated environments.
Key Words: conservation landscapes, dispersal, metapopulation management, Terai, tigers
Diseno de un Paisaje de Conservacion para Tigres en Ambientes Dominados por Humanos
Resumen: La supervivencia de poblaciones de vida silvestre en reservas pequenas y aisladas enfrenta amenazasgeneticas y demograficas. Para incrementar la probabilidad de persistencia a largo plazo, los biologos pro-mueven el manejo metapoblacional, en el que las subpoblaciones reproductivas son protegidas como fuentes.Los animales que se dispersan desde la fuente incrementan la probabilidad de persistencia de la metapoblacionen el paisaje extendido. Utilizamos un modelo de costo-distancia, basado en SIG, para disenar un paisaje deconservacion en las estribaciones de los Himalaya para manejar una metapoblacion del mayor depredador deAsia, el tigre (Panthera tigris). El modelo se basa en datos de 30 anos de investigaciones de campo, imagenesde satelite recientes y una decada de restauracion de la zona de amortiguamiento en esta region. Utilizamos elmodelo para (1) identificar potenciales corredores de dispersion para tigres; (2) identificar refugios de transitoestrategicos y (3) hacer recomendaciones para el manejo y la restauracion de tierras afuera de la reserva parapromover el potencial de los corredores para tigres. Esta herramienta puede auxiliar en el diseno de paisajes deconservacion para otras especies en peligro y de amplio rango de distribucion en ambientes dominados por humanos.
Palabras Clave: dispersion, manejo de metapoblaciones, paisajes de conservacion, Terai, tigres
Introduction
Conservation of endangered large vertebrates in frag-mented landscapes has become a central issue for conser-
§Current address: Curriculum in Ecology, University of North Carolina–Chapel Hill, CB# 3275, Chapel Hill, NC 27599, U.S.A., email [email protected] submitted April 1, 2003; revised manuscript accepted October 22, 2003.
vation biologists. As conversion of natural habitat contin-ues, the protected areas established to conserve thesespecies become insular and interspersed within matricesof human land uses. In Asia, as elsewhere on Earth, many
839
Conservation Biology, Pages 839–844Volume 18, No. 3, June 2004
840 Tiger Conservation in Human-Dominated Landscapes Wikramanayake et al.
of these protected areas are too small to support viablepopulations of large mammals over the long term, andisolated populations of large vertebrates in such refugeshave a high probability of local extinction (Hanski 1994;Noss et al. 1996; Wikramanayake et al. 1998). In re-sponse, conservation biologists are promoting the con-cept of metapopulation management to conserve large,wide-ranging species (McCullough 1996; Noss et al. 1996;Margules & Pressey 2000; Mech & Hallett 2001). The ob-jective is to protect breeding populations as source poolsand provide dispersal opportunities by linking habitatpatches across the landscape mosaic to maintain a largerpopulation.
The Terai Arc Landscape, located along the Himalayanfoothills, attempts to implement this new paradigm inconservation. Here we present a least-cost pathway modeland use it to identify a system of potential dispersal corri-dors for managing a metapopulation of tigers (Pantheratigris) in the landscape. The model is based on ecologicaland behavioral parameters of tigers collected during 30years of field research (Sunquist 1981; Smith & McDougal1991; Smith 1993), recent satellite imagery, and experi-ence in buffer-zone restoration during the past decade(Dinerstein 2003).
The probability of successful dispersal decreases withcorridor length (Gustafson & Gardner 1996), but strate-gically located stepping stones can provide temporaryrefuge and increase dispersal success (Newmark 1993;Sweanor et al. 2000; Kautz & Cox 2001). Nepal hasan effective community forestry program in which de-graded forestlands are leased to local community-baseduser groups. If these are managed to allow natural re-generation—an accepted management practice—theyhave the potential to become refuges for dispersing tigers.Therefore, we also used the model to identify strategicstepping-stone refuges that can improve the dispersal po-tential of corridors and to make recommendations for off-reserve land management and corridor restoration. Theseland-management strategies are important because corri-dors span and include areas of human land use and helpmanage and restore of habitat used for dispersal whereconnectivity has been lost or severely degraded.
This model is already helping advance tiger conserva-tion in lowland Nepal and northwestern India, movingrapidly from a theoretical construct of metapopulationmanagement to landscape planning and implementationin the Terai Arc. The lessons learned in designing and im-plementing this conservation landscape can be appliedacross the subcontinent and beyond for large-mammalconservation.
Methods
Remote Sensing and GIS
We first performed an unsupervised classification in Er-das Imagine of the five Landsat 7 ETM satellite images
that spanned the Terai Arc Landscape. The images (Im-age 141–41, acquisition date 4 November 1999; 142–41, 13 December 1999; 143–41, 25 March 2000; 144–40, 9 November 1999; 145–40, 15 October 1999) wereobtained from the Global Land Cover Facility at the Uni-versity of Maryland, College Park, http://glcf.umiacs.umd.edu. We ran 15 iterations of 30 classes grouped into eighthabitat categories: 1, good forest; 2, degraded forest; 3,grassland; 4, water; 5, sand/dry riverbed; 6, bareground;7, agriculture type A (sugar cane fields); 8, agriculturetype B. Tigers are known to disperse through sugar canefields (a tall grassland analog) in northern India, so wedistinguished between sugar cane and other agriculture.Using the eliminate function, stratified by the eight habitattypes, we removed clusters of <11 pixels (i.e., approxi-mately 1 ha).
We used our knowledge of the area to reclassify ambigu-ous grid cells in ArcView 3.2/Spatial Analyst. We drewpolygons around known forest, grassland, agriculture,and riverbeds and reclassified aberrant grid cells withinlarge polygons. For example, grid cells classified as “agri-culture” within large polygons of “good forest” were re-classified as bare ground because they are likely not agri-culture. The five reclassified images were then merged tocreate an image of the entire Terai Arc Landscape.
To identify large, intact blocks of “good habitat,”we buffered 1 km—considered an area of high humaninfluence—around clusters of agriculture and populationcenters. We used the best available settlement data (ESRI1993) for India and Village Development Committee maps(VDC) for Nepal (HMG 1996) to identify population cen-ters. Land use in India is clearly divided between agricul-ture and associated villages and protected areas (includingforest reserves). Thus, finer-scale settlement data, even ifavailable, would likely not affect the size of the intact habi-tat blocks. We grouped the resulting grid by habitat typeto reflect suitability for dispersal. Blocks of <11 pixelswere merged with surrounding habitats.
Creating the Cost Grid
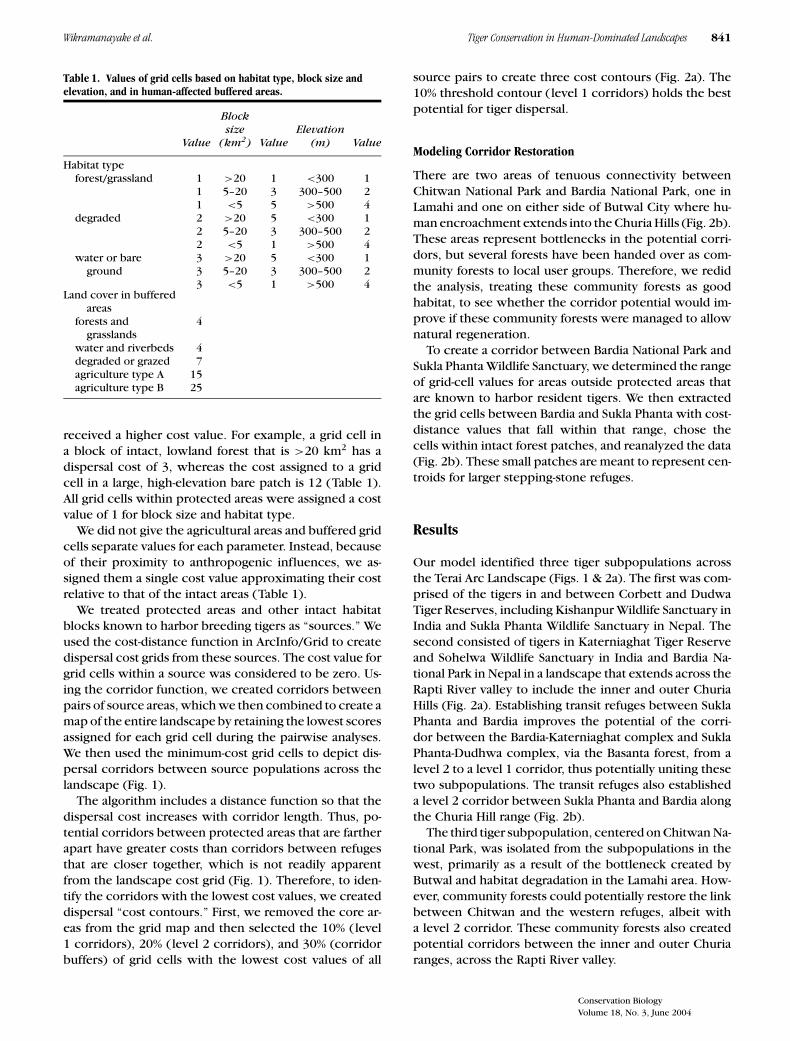
We assigned each cell in the classified grid a value rang-ing from 1, good, to 5, poor, for each of three parameters:block size, habitat type, and elevation (Table 1). These val-ues reflect a judgment of the biological cost of dispersaland likelihood of use by tigers. The three values for eachgrid cell were then combined to form a single metric torank grid cells relative to one another.
We assumed that large blocks of good forest in lowlandhabitats are more likely to be used during dispersal thansmall blocks of good habitat in high elevations becauseof lower disturbance levels associated with large blocksand the higher densities of the prey base in low-elevationforests. Tigers face a higher biological cost when travers-ing large areas of poor habitat than when traversing smallareas; thus, a grid cell in a large block of poor habitat
Conservation BiologyVolume 18, No. 3, June 2004
Wikramanayake et al. Tiger Conservation in Human-Dominated Landscapes 841
Table 1. Values of grid cells based on habitat type, block size andelevation, and in human-affected buffered areas.
Blocksize Elevation
Value (km2) Value (m) Value
Habitat typeforest/grassland 1 >20 1 <300 1
1 5–20 3 300–500 21 <5 5 >500 4
degraded 2 >20 5 <300 12 5–20 3 300–500 22 <5 1 >500 4
water or bare 3 >20 5 <300 1ground 3 5–20 3 300–500 2
3 <5 1 >500 4Land cover in buffered
areasforests and 4
grasslandswater and riverbeds 4degraded or grazed 7agriculture type A 15agriculture type B 25
received a higher cost value. For example, a grid cell ina block of intact, lowland forest that is >20 km2 has adispersal cost of 3, whereas the cost assigned to a gridcell in a large, high-elevation bare patch is 12 (Table 1).All grid cells within protected areas were assigned a costvalue of 1 for block size and habitat type.
We did not give the agricultural areas and buffered gridcells separate values for each parameter. Instead, becauseof their proximity to anthropogenic influences, we as-signed them a single cost value approximating their costrelative to that of the intact areas (Table 1).
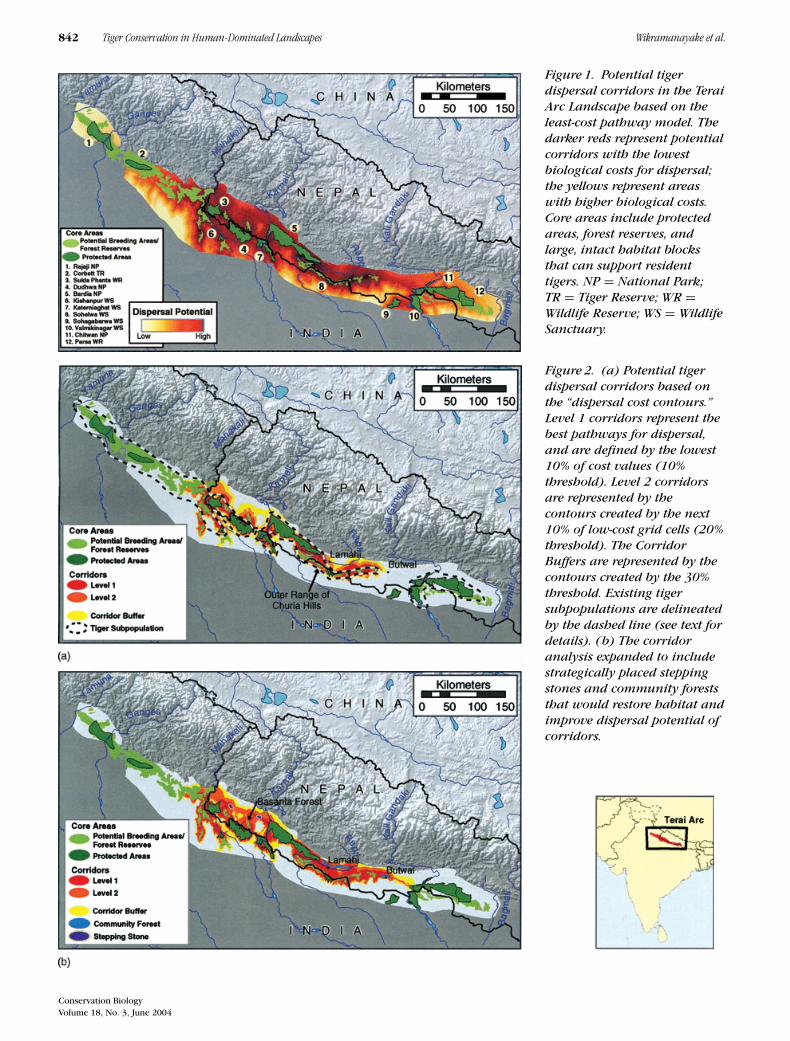
We treated protected areas and other intact habitatblocks known to harbor breeding tigers as “sources.” Weused the cost-distance function in ArcInfo/Grid to createdispersal cost grids from these sources. The cost value forgrid cells within a source was considered to be zero. Us-ing the corridor function, we created corridors betweenpairs of source areas, which we then combined to create amap of the entire landscape by retaining the lowest scoresassigned for each grid cell during the pairwise analyses.We then used the minimum-cost grid cells to depict dis-persal corridors between source populations across thelandscape (Fig. 1).
The algorithm includes a distance function so that thedispersal cost increases with corridor length. Thus, po-tential corridors between protected areas that are fartherapart have greater costs than corridors between refugesthat are closer together, which is not readily apparentfrom the landscape cost grid (Fig. 1). Therefore, to iden-tify the corridors with the lowest cost values, we createddispersal “cost contours.” First, we removed the core ar-eas from the grid map and then selected the 10% (level1 corridors), 20% (level 2 corridors), and 30% (corridorbuffers) of grid cells with the lowest cost values of all
source pairs to create three cost contours (Fig. 2a). The10% threshold contour (level 1 corridors) holds the bestpotential for tiger dispersal.
Modeling Corridor Restoration
There are two areas of tenuous connectivity betweenChitwan National Park and Bardia National Park, one inLamahi and one on either side of Butwal City where hu-man encroachment extends into the Churia Hills (Fig. 2b).These areas represent bottlenecks in the potential corri-dors, but several forests have been handed over as com-munity forests to local user groups. Therefore, we redidthe analysis, treating these community forests as goodhabitat, to see whether the corridor potential would im-prove if these community forests were managed to allownatural regeneration.
To create a corridor between Bardia National Park andSukla Phanta Wildlife Sanctuary, we determined the rangeof grid-cell values for areas outside protected areas thatare known to harbor resident tigers. We then extractedthe grid cells between Bardia and Sukla Phanta with cost-distance values that fall within that range, chose thecells within intact forest patches, and reanalyzed the data(Fig. 2b). These small patches are meant to represent cen-troids for larger stepping-stone refuges.
Results
Our model identified three tiger subpopulations acrossthe Terai Arc Landscape (Figs. 1 & 2a). The first was com-prised of the tigers in and between Corbett and DudwaTiger Reserves, including Kishanpur Wildlife Sanctuary inIndia and Sukla Phanta Wildlife Sanctuary in Nepal. Thesecond consisted of tigers in Katerniaghat Tiger Reserveand Sohelwa Wildlife Sanctuary in India and Bardia Na-tional Park in Nepal in a landscape that extends across theRapti River valley to include the inner and outer ChuriaHills (Fig. 2a). Establishing transit refuges between SuklaPhanta and Bardia improves the potential of the corri-dor between the Bardia-Katerniaghat complex and SuklaPhanta-Dudhwa complex, via the Basanta forest, from alevel 2 to a level 1 corridor, thus potentially uniting thesetwo subpopulations. The transit refuges also establisheda level 2 corridor between Sukla Phanta and Bardia alongthe Churia Hill range (Fig. 2b).
The third tiger subpopulation, centered on Chitwan Na-tional Park, was isolated from the subpopulations in thewest, primarily as a result of the bottleneck created byButwal and habitat degradation in the Lamahi area. How-ever, community forests could potentially restore the linkbetween Chitwan and the western refuges, albeit witha level 2 corridor. These community forests also createdpotential corridors between the inner and outer Churiaranges, across the Rapti River valley.
Conservation BiologyVolume 18, No. 3, June 2004
842 Tiger Conservation in Human-Dominated Landscapes Wikramanayake et al.
Figure 1. Potential tigerdispersal corridors in the TeraiArc Landscape based on theleast-cost pathway model. Thedarker reds represent potentialcorridors with the lowestbiological costs for dispersal;the yellows represent areaswith higher biological costs.Core areas include protectedareas, forest reserves, andlarge, intact habitat blocksthat can support residenttigers. NP = National Park;TR = Tiger Reserve; WR =Wildlife Reserve; WS = WildlifeSanctuary.
Figure 2. (a) Potential tigerdispersal corridors based onthe “dispersal cost contours.”Level 1 corridors represent tbebest pathways for dispersal,and are defined by the lowest10% of cost values (10%threshold). Level 2 corridorsare represented by thecontours created by the next10% of low-cost grid cells (20%threshold). The CorridorBuffers are represented by thecontours created by the 30%threshold. Existing tigersubpopulations are delineatedby the dashed line (see text fordetails). (b) The corridoranalysis expanded to includestrategically placed steppingstones and community foreststhat would restore habitat andimprove dispersal potential ofcorridors.
Conservation BiologyVolume 18, No. 3, June 2004
Wikramanayake et al. Tiger Conservation in Human-Dominated Landscapes 843
Discussion
Corridors in the Terai Arc
The continuous belt of grassland and subtropical forestthat once extended across the Himalayan foothills is nowhighly fragmented, and, along with it, the resident tigerpopulation. Smith et al. (1998) identified four populationsacross the Terai that are hypothesized to be separated bydispersal barriers, identified on the basis of visual inter-pretation of satellite images and short field surveys toconfirm tiger presence. However, potential corridors forfocal species can often be difficult to detect through visualassessments of structural landscape features and habitatconfigurations and are better revealed by simulation mod-els (Gustafson & Gardner 1996).
The results of our initial analysis show that two of thefour populations identified by Smith et al. (1998) are cur-rently linked and that potential dispersal corridors fortigers exist or can be restored between all protected ar-eas and other core habitat. Establishing transit refugesor restoring degraded habitat through strategic land-useplanning can potentially link the other populations.
Wildlife populations that are isolated or have a proba-bility of exchanging fewer than one individual per gen-eration are vulnerable to inbreeding depression (Mills &Allendorf 1996), calling into question conservation strate-gies that manage populations as isolated units. Althoughtigers occur at high densities in prime habitat withinthe protected areas of the Terai Arc Landscape, theserefuges are fast becoming insular, and there are indica-tions of inbreeding depression in populations isolatedwithin reserves (Smith & McDougal 1991). In a simula-tion of cougar populations, Beier (1993) showed that theaddition of one to four immigrants over a decade into asmall population can significantly increase its persistence.Similarly, the persistence of tiger populations within pro-tected areas can be enhanced if these populations can bemanaged as a metapopulation.
Most of the remaining large, intact habitats in theTerai are now within protected areas. Although it is es-sential that these refuges are given effective protection,off-reserve land-use and management strategies such ascommunity forestry can be used to restore and main-tain corridors to facilitate dispersal and genetic exchangebetween tiger populations in the core areas. Tigers arehabitat generalists and disperse through secondary habi-tat (Smith 1993), so the corridors we identified are likelyto be effective. This assumption is supported by field stud-ies of radio-collared cougars (Beier 1995; Sweanor et al.2000) and lynx (Palomares et al. 2000), both of whichwill disperse through low-quality corridors. Corridors ofsecondary habitats will not be effective for habitat spe-cialists or poor dispersers, however, because these cor-ridors will become population sinks. Thus, conservationof habitat specialists requires managing corridors with
land-use strategies that create and maintain good-qualityhabitat.
We note that the model does not provide absolutecost thresholds for dispersal, but only an indication ofpathways with the lowest relative costs and those thatinclude the most suitable ecological conditions for dis-persing tigers. In our application of the least-cost path-way model, we tried to identify broad corridors with thehighest potential for allowing dispersal between core ar-eas that contained the grid cells with the lowest costs—within the 30% threshold—by assessing each grid cell inthe landscape relative to the others. These corridors arewell suited for conservation landscape planning becausethey are not demarcated as narrow, continuous conduitsconnecting two points, but as landscape features withvarious land-use and land-cover conditions that can sup-port and facilitate dispersal. We also note, however, thatdispersing tigers could potentially use other pathways.
Beyond Tigers and the Terai Arc
Habitat fragmentation and conversion are rapid through-out the ranges of large carnivores and have been widelyacknowledged as a significant cause of their populationdeclines (Terborgh 1999). Thus, conservation landscapedesign must include pathways for these wide-ranging en-dangered species to thread their way through human-dominated matrices (Dinerstein 2003). Our geographicinformation system (GIS)–based model for the Terai Arcshows how the ecological and habitat parameters of thetiger were used to design such a conservation landscape.We present this model as a tool for designing conserva-tion landscapes to manage metapopulations of large car-nivores beyond the shadow of the Himalayas.
Acknowledgments
We thank J. Seidensticker, U. Karanth, R. Abell, and H.Strand for reviewing the manuscript, M. Taye for helpingto finalize it, and W. Wettengel and C. Loucks for theirassistance with the figures.
Literature Cited
Beier, P. 1993. Determining minimum habitat areas and habitat corridorsfor cougars. Conservation Biology 7:94–108.
Beier, P. 1995. Dispersal of juvenile cougars in fragmented habitat. Jour-nal of Wildlife Management 59:228–237.
Dinerstein, E. 2003. The return of the unicorns: the natural historyand conservation of the greater one horned rhinoceros. ColumbiaUniversity Press, New York.
Environmental Systems Research Institute (ESRI). 1993. Digital chart ofthe world. CD-ROM. Redlands, California.
Gustafson, E. J., and R. H. Gardner. 1996. The effect of landscape hetero-geneity on the probability of patch colonization. Ecology 77:94–107.
Hanski, I. 1994. Patch-occupancy dynamics in fragmented landscapes.Trends in Ecology & Evolution 9:131–135.
His Majesty’s Government (HMG). 1996. Topographic maps. Survey De-partment, His Majesty’s Government, Kathmandu, Nepal.
Conservation BiologyVolume 18, No. 3, June 2004
844 Tiger Conservation in Human-Dominated Landscapes Wikramanayake et al.
Kautz, R. S., and J. A. Cox. 2001. Strategic habitats for biodiversity con-servation in Florida. Conservation Biology 15:55–77.
Margules, C. R., and R. L. Pressey. 2000. Systematic conservation plan-ning. Nature 405:243–253.
McCullough, D. R. 1996. Metapopulations and wildlife conservation.Island Press, Washington, D.C.
Mech, S. G., and J. G. Hallett. 2001. Evaluating the effectiveness of cor-ridors: a genetic approach. Conservation Biology 15:467–474.
Mills, L. S., and F. W. Allendorf. 1996. The one-migrant-per-generationrule in conservation and management. Conservation Biology10:1509–1518.
Newmark, W. D. 1993. The role and design of wildlife corridors withexamples from Tanzania. Ambio 22:500–504.
Noss, R. F., H. B. Quigley, M. G. Hornocker, T. Merrill, and P. C. Paquet.1996. Conservation biology and carnivore conservation in the RockyMountains. Conservation Biology 10:949–963.
Palomares, F., M. Delibes, P. Ferreras, J. M. Fedriani, J. Calzada, andE. Revilla. 2000. Iberian lynx in a fragmented landscape: predis-persal, dispersal, and postdispersal habitats. Conservation Biology14:809–818.
Smith, J. L. D. 1993. The role of dispersal in structuring the Chitwantiger population. Behaviour 124:165–195.
Smith, J. L. D., and C. McDougal. 1991. The contribution of variance inlifetime reproduction to effective population size in tigers. Conser-vation Biology 5:484–490.
Smith, J. L. D., S. C. Ahearn, and C. McDougal. 1998. Landscape anal-ysis of tiger distribution and habitat quality in Nepal. ConservationBiology 12:1338–1346.
Sunquist, M. E. 1981. The social organization of tigers in Royal ChitwanNational Park, Nepal. Contribution to zoology no. 336. SmithsonianInstitution, Washington, D.C.
Sweanor, L. L., K. A. Logan, and M. G. Hornocker. 2000. Cougar disper-sal patterns, metapopulation dynamics, and conservation. Conser-vation Biology 14:798–808.
Terborgh, J. 1999. Requiem for nature. Island Press, Washington, D.C.Wikramanayake, E. D., E. Dinerstein, J. G. Robinson, U. Karanth, A.
Rabinowitz, D. Olson, T. Mathew, P. Hedao, M. Conner, G. Hemley,and D. Bolze. 1998. An ecology-based method for defining prioritiesfor large mammal conservation: the tiger as case study. ConservationBiology 12:865–878.
Conservation BiologyVolume 18, No. 3, June 2004