design of power line communication system by
TRANSCRIPT
DESIGN OF POWER LINE COMMUNICATION
SYSTEM
By
ALAA ABDEL MONEIM SID AHMED
INDEX NO. 124022
SUPERVISOR
PROF. SHARIEF BABIKER
A thesis submitted in partial fulfillment for the degree of
B.Sc (HONS) in Electrical and Electronic Engineering
(ELECTRONICS AND COMPUTER SYSTEMS ENGINEERING)
University of Khartoum
Faculty of Engineering
OCTOPER 2017

ii
DECLARATION OF ORIGINALITY
I declare this report entitled “Design of Power Line Communication System” is my own work
except as cited in references. The report has been not accepted for any degree and it is not being
submitted currently in candidature for any degree or other reward.
Signature: ____________________
Name: _______________________
Date: ________________________

iii
ACKNOWLEDGMENT
I would like to express my deepest sense of gratitude to my supervisor Prof. Sharief Babiker
for both of his continuous advice, systematic guidance, encouragement and great efforts through
the course of this project.
I am deeply grateful to my project partner, Nuha Ahmed for her hard work, real team spirit,
continuous support, the unforgettable times we have spent and all good things we have learned
from each other.
I would like to thank Eng. Mahmoud Ibrahim for his grate helps, advices and
encouragements that support me.
One more personal note, I would like to express my love and gratitude from my deep heart
to my parents, my brother for teaching me values that are precious, irrespective of time and place
for their endless love, support and constant encouragement in all my endeavors.
iv
اهداء
..اميالى من جعلت للحياة معنى ولون.. من دونها ما كنت الكون هنا.. سيدة القلب والعقل.. وسيدة حياتي..
..ابي سندي..الى من اسقاني من حكمته حتى ما عدت ارى حياة ليس فيها.. علمني كيف تكون االمور..
وت احيانا.... صغيري وان قساخيالى
..ربىالى رفيقة الخمسة اعوام جليسة الوحشة والفرحة.. اختي التي لم تنجبها امي..
..نهىالى اعظم ما خرجت به من هذا المشروع..
..محمودعوني حين احتجته.. من كانالى
..سجى وتسنيمالى من تعانقت ارواحنا.. وان عز اللقاء.. اخواتي ورفيقات الدرب..
المقربين.. نكهة ايامي.. اجمل ما جادت لي به الدنيا.. ي واصدقائيصديقاتالى
..0124دفعتي الى من ما عدت اطيق تفرقهم..
v
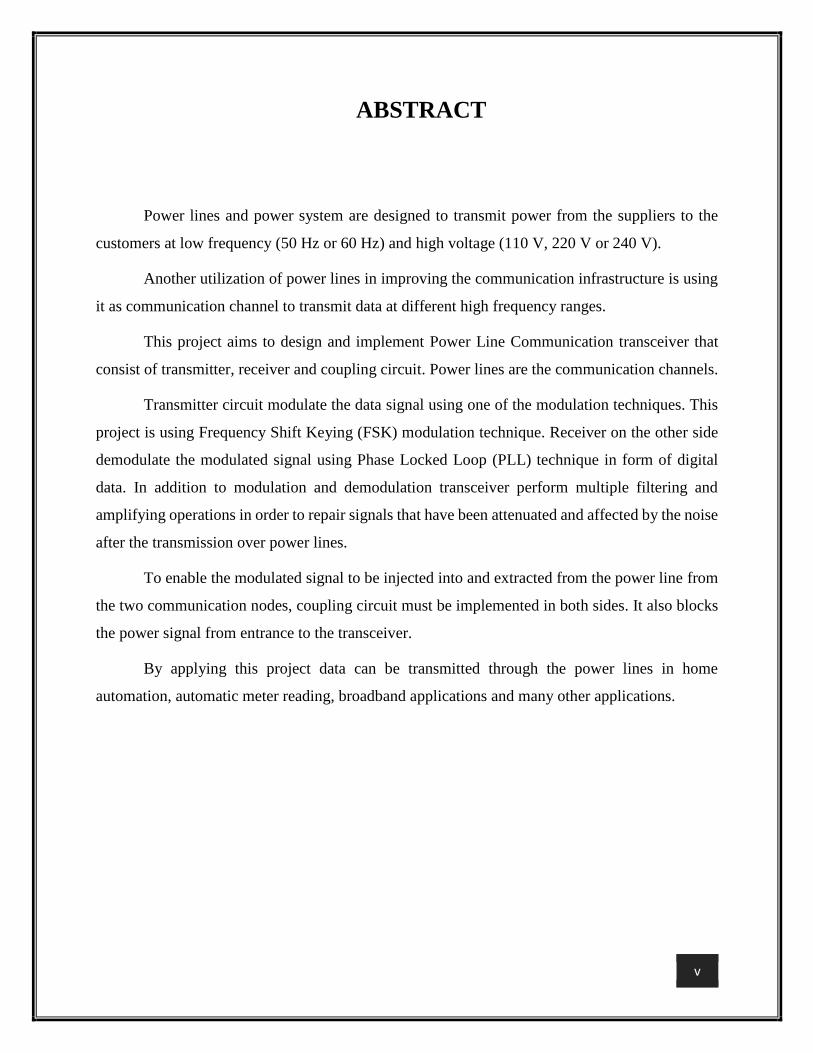
ABSTRACT
Power lines and power system are designed to transmit power from the suppliers to the
customers at low frequency (50 Hz or 60 Hz) and high voltage (110 V, 220 V or 240 V).
Another utilization of power lines in improving the communication infrastructure is using
it as communication channel to transmit data at different high frequency ranges.
This project aims to design and implement Power Line Communication transceiver that
consist of transmitter, receiver and coupling circuit. Power lines are the communication channels.
Transmitter circuit modulate the data signal using one of the modulation techniques. This
project is using Frequency Shift Keying (FSK) modulation technique. Receiver on the other side
demodulate the modulated signal using Phase Locked Loop (PLL) technique in form of digital
data. In addition to modulation and demodulation transceiver perform multiple filtering and
amplifying operations in order to repair signals that have been attenuated and affected by the noise
after the transmission over power lines.
To enable the modulated signal to be injected into and extracted from the power line from
the two communication nodes, coupling circuit must be implemented in both sides. It also blocks
the power signal from entrance to the transceiver.
By applying this project data can be transmitted through the power lines in home
automation, automatic meter reading, broadband applications and many other applications.

vi
المستخلص
تستخدم منظومة الطاقة الكهربائية لنقل الطاقة الكهربائية من المنتجين )المولدات( الى المستهلكين عبر خطوط نقل
هيرتز. 60و 50الطاقة بترددات منخفضة تتراوح مابين
اتصال لنقل البيانات يمكن استخدام خطوط واسالك نقل الطاقة لتحسين جودة البنية التحتية لالتصاالت باستخدامها كقناة
بين اطراف االتصال المختلفة عبر نطاقات مختلفة من الترددات العالية.
يهدف هذا المشروع الى تصميم جهاز ارسال واستقبال باالضافة لدائرة االقتران. في هذه المنظومة تستخدم خطوط
قائمة بذاتها. نقل الطاقة كقناة اتصال. مما يقلل من التكلفة العالية النشاء شبكة اتصال
يستخدم هذا المشروع تقوم دائرة االرسال عن طريق استخدام احد تقنيات التشكيل بتعديل اشارة البيانات المراد ارسالها.
تقنية االرسال بازاحة الذبذبة لتعديل اشارة البيانات بما يسمح نقلها عبر خطوط الطاقة. وعلى الطرف االخر يقوم المستقبل بازلة
باالضافة لما سبق فان ( واعادتها الى بيانات رقمية.او دارة تثبيت الطورارة المرسلة باستخدام تقنية الطور المقفل )تشكيل االش
النظام يحتوي على دوائر تنقية وتضخيم متعددة العادة اصالح االشارات المرسلة والتي تأثرت بالضوضاء و تعرضت للتوهن
تصميم دائرة االقتران بقيم مكونات تسمح بحقن االشارة المشكلة واستخراجها من خطوط بعد انتقالها عبر خطوط نقل الطاقة. تم
الطاقة. كما ان هذه الدائرة تمنع وصول الفولتية المرتفعة المحمولة في خطوط نقل الطاقة الكهربائية ذات التردد المنخفض الى
نظام االرسال واالستقبال.
تفادة من شبكة خطوط نقل الطاقة الكهربائية الموجودة مسبقا في انشاء شبكة االسمن خالل تطبيق هذا المشروع يمكن
لنقل البيانات بترددات مختلفة مما يسمح باستخدامها في العديد من التطبيقات كأتمتتة المنازل، والقراءة التلقائية للعدادات، ونقل
بيانات االنترنت.
vii
TABLE OF CONTENTS
Declaration of originality .............................................................................................................................. ii
Acknowledgment ......................................................................................................................................... iii
iv ............................................................................................................................................................... اهداء
Abstract ......................................................................................................................................................... v
vi ........................................................................................................................................................ المستخلص
Table of contents ........................................................................................................................................ vii
List of Figures ............................................................................................................................................... xi
List of Tables ............................................................................................................................................... xii
List of abbreviation .....................................................................................................................................xiii
1 CHAPTER ONE: INTRODUCTION ........................................................................................................... 1
1.1 overview ........................................................................................................................................ 1
1.2 Problem statement ....................................................................................................................... 1
1.3 Project objectives .......................................................................................................................... 1
1.4 Thesis layout ................................................................................................................................. 1
2 CHAPTER TWO: LITRETURE REVIEW ..................................................................................................... 3
2.1 PLC history..................................................................................................................................... 3
2.2 PLC applications: ......................................................................................................................... 10
2.2.1 according to the frequency: ................................................................................................ 10
2.2.2 According to the voltage: .................................................................................................... 12
2.2.2.1 Low voltage or in-house: ................................................................................................. 13
2.2.2.1.1 Home automation: .................................................................................................... 13
2.2.2.1.2 Street lightening monitoring: .................................................................................... 13
2.2.2.1.3 Low cost inter-device peer-to-peer networking: ...................................................... 13
2.2.2.2 Medium Voltage and Low Voltage: ................................................................................. 13
2.2.2.2.1 Utility: ........................................................................................................................ 13
2.2.2.2.2 Broadband data transmission: .................................................................................. 14
2.3 PLC Types .................................................................................................................................... 14
2.3.1 Ultra-narrow band plc ......................................................................................................... 15
2.3.2 Narrowband plc................................................................................................................... 16
viii
2.3.3 Broadband plc ..................................................................................................................... 18
2.4 Plc standards ............................................................................................................................... 19
2.4.1 CENELEC .............................................................................................................................. 20
2.4.2 FCC ...................................................................................................................................... 21
2.4.3 IEEE ...................................................................................................................................... 21
2.4.4 IEC ....................................................................................................................................... 22
2.5 PLC protocols and Technologies ................................................................................................. 23
2.5.1 X-10 ..................................................................................................................................... 23
2.5.1.1 Protocol description ........................................................................................................ 23
2.5.1.2 Disadvantages ................................................................................................................. 25
2.5.2 CsBus technology ................................................................................................................ 25
2.5.3 LonWorks technology ......................................................................................................... 25
2.6 PLC system components ............................................................................................................. 26
2.6.1 Modem ................................................................................................................................ 26
2.6.1.1 Amplitude shift keying ASK ............................................................................................. 26
2.6.1.2 Phase Shift Keying ........................................................................................................... 27
2.6.1.3 Orthogonal Frequency Division Multiplexing (OFDM) .................................................... 28
2.6.1.4 Frequency Shift Keying .................................................................................................... 28
2.6.2 Coupling circuit ................................................................................................................... 29
Capacitive Coupling: ........................................................................................................................ 29
Inductive Coupling .......................................................................................................................... 29
3 CHAPTER THREE: METHODOLOGY AND DESIGN ................................................................................ 30
3.1 Design goals ................................................................................................................................ 30
3.2 System components .................................................................................................................... 30
3.2.1 PLC Transmitter ................................................................................................................... 30
3.2.2 PLC receiver ......................................................................................................................... 31
3.2.3 Coupling circuit ................................................................................................................... 31
3.2.4 Decoupling circuit ............................................................................................................... 31
3.2.5 Power lines .......................................................................................................................... 31
3.3 Tools and instruments ................................................................................................................ 32
3.3.1 Software tools ..................................................................................................................... 32
ix
3.3.1.1 Proteus 8.6 ...................................................................................................................... 32
3.3.2 Hardware............................................................................................................................. 32
3.3.2.1 Oscilloscope .................................................................................................................... 32
3.3.2.2 Function generator ......................................................................................................... 33
3.3.2.3 Breadboard ..................................................................................................................... 34
3.3.2.4 Cpacitors and resistors .................................................................................................... 34
3.3.2.5 NPN transistors ............................................................................................................... 34
3.3.2.6 Opamps ........................................................................................................................... 35
3.3.2.7 VCO (lm566) .................................................................................................................... 35
3.3.2.8 PLL ................................................................................................................................... 35
3.3.2.9 Timer 555 ........................................................................................................................ 35
3.4 System design steps .................................................................................................................... 35
3.4.1 Step one: Generation of FSK signal ..................................................................................... 35
3.4.1.1 Design 1: Using Multiplexer ............................................................................................ 36
3.4.1.2 Design 2: Using 555 timer ............................................................................................... 37
3.4.1.3 Design three: using Voltage Controlled oscillator (VCO) LM566 .................................... 39
3.4.2 Step two: Demodulation ..................................................................................................... 42
3.4.2.1 Using Phase Locked Loop ................................................................................................ 42
3.4.3 Step three: coupling circuit ................................................................................................. 45
4 CHAPTER FOUR: RESULT AND DISCUSSION ....................................................................................... 48
4.1 Overview ..................................................................................................................................... 48
4.2 Calculations ................................................................................................................................. 48
4.2.1 FSK modulation ................................................................................................................... 48
4.2.1.1 For timer circuit ............................................................................................................... 48
4.2.1.2 For VCO circuit ................................................................................................................ 50
4.2.2 Demodulation using PLL:..................................................................................................... 52
4.2.3 Coupling circuit ................................................................................................................... 53
4.3 Discussion .................................................................................................................................... 54
4.3.1 Modulation .......................................................................................................................... 54
4.3.2 Demodulation ..................................................................................................................... 56
4.3.3 Coupling .............................................................................................................................. 56

x
5 CHAPTER FIVE: CONCLUSION AND RECOMINDATIONS ...................................................................... 58
5.1 Conclusion ................................................................................................................................... 58
5.2 Problems and solutions ............................................................................................................... 58
5.3 Future works ............................................................................................................................... 59
References .................................................................................................................................................. 60
xi
LIST OF FIGURES
Figure 2.1: PLC system layers ...................................................................................................................... 20
Figure 2.2: Representation of the X-10 signal ............................................................................................. 24
Figure 2.3: tow packet of the X-10 protocol. .............................................................................................. 24
Figure 2.4: Amplitude Shift Keying .............................................................................................................. 27
Figure 2.5: Phase Shift Keying ..................................................................................................................... 27
Figure 3.1: Blocks of system components................................................................................................... 31
Figure 3.2: proteus 8.6 ................................................................................................................................ 32
Figure 3.3: oscilloscope ............................................................................................................................... 33
Figure 3.4: Function generator ................................................................................................................... 33
Figure 3.5: Breadboard ............................................................................................................................... 34
Figure 3.6: capacitors .................................................................................................................................. 34
Figure 3.7: Resistors .................................................................................................................................... 34
Figure 3.8: NPN transistor ........................................................................................................................... 34
Figure 3.9: VCO LM566 ............................................................................................................................... 35
Figure 3.10: FSK signal and data signal ....................................................................................................... 36
Figure 3.11: Multiplexor circuit ................................................................................................................... 37
Figure 3.12: 555 timer simulation ............................................................................................................... 38
Figure 3.13: Real Circuit .............................................................................................................................. 39
Figure 3.14: LM566 circuit simulation. ....................................................................................................... 41
Figure 3.15: LM566 circuit implementation ............................................................................................... 42
Figure 3.16: Block diagram of PLL. .............................................................................................................. 42
Figure 3.17: Phase Locked Loop components............................................................................................. 43
Figure 3.18: 4046 PLL simulation ................................................................................................................ 43
Figure 3.19: coupling circuit simulation. ..................................................................................................... 45
Figure 3.20: modulation circuit connected to coupling circuit. .................................................................. 47
Figure 3.21: demodulation circuit connected to coupling circuit. .............................................................. 47
Figure 4.1: timer circuit output ................................................................................................................... 49
Figure 4.2: timer circuit with prober values ............................................................................................... 49
Figure 4.3: real circuit result ....................................................................................................................... 50
Figure 4.4: FSK modulation output ............................................................................................................. 51
Figure 4.5: VCO final circuit simulation ....................................................................................................... 51
Figure 4.6: transceiver circuit ..................................................................................................................... 52
Figure 4.7: overall transceiver circuit results .............................................................................................. 53
Figure 4.8: coupling circuit result ................................................................................................................ 54
Figure 4.10: Mux good result ...................................................................................................................... 55
Figure 4.9: Mux bad result .......................................................................................................................... 55
xii
LIST OF TABLES
Table 2-1: Applications of PLC ..................................................................................................................... 12
Table 2-2: PLC Classifications ...................................................................................................................... 15
Table 2-3: Frequency band for NB-PLC ....................................................................................................... 17
Table 2-4: Industrial specification of BB-PLC .............................................................................................. 19
Table 2-5: CENELEC categories ................................................................................................................... 21
Table 4-1: coupling circuit parameters ....................................................................................................... 54
xiii
LIST OF ABBREVIATION
AC Alternating current
AM Amplitude Modulation
AMI Advanced Metering Infrastructure
AMR Automatic Meter Reading
AMRA Automatic Meter Reading Association
ANSI American National Standards Institute
ASK Amplitude Shift Keying
AT&T American Telephone and Telegraph
BBPLC Broad Band Power Line Communication
BPL Broad Band over Power Lies
BPSK Binary Phase Shift Keying
CSMA/CA Carrier sense multiple access with collision
avoidance
CTP Carrier Transmission over Power Line
DCSK Differential Chaos Shift Keying
DPSK Differential Phase Shift Keying
DQPSK Differential Quadrature Phase Shift Keying
DTOPL Data Transmission Over Power Lines
FCC Federal Communication Commission
FEC Forward Error Correction
FFH Fast Frequency Hopping
FSK Frequency Shift Keying
GE General Electric
HD High Definition
HV High Voltage
HVAC Heat Ventilation and Air Conditioning
IEC International Electrotechnical Commission
xiv
IEEE Institute of Electrical and Electronics
Engineers
ITU International Telecommunication Union
LAN Local Area Network
LMT Last Mile Telecommunication
LV Low Voltage
MAC Medium Access Control
MCM Multiple Carrier Modulation
MV Medium Voltage
NARUC National Association of Regulatory Utility
Commissioners
NBPLC Narrow Band Power Line Communication
OFDM Orthogonal Frequency Division Multiplexing
PLCC Power Line Communication Carrier
PLL Phase Locked Loop
PRIME Power Line Related Intelligent Metering
Evolution
PSK Phase Shift Keying
RCS Ripple Carrier Signaling
SDO Standards Developing Organization
SFSK Spread Frequency Shift Keying
TDMA Time Division Multiple Access
UNBPLC Ultra-Narrow Band Power Line
Communication
UPA Universal Power Line Association
VCO Voltage Controlled Oscillator

xv

CHAPTER ONE INTRODUCTION
1
1 CHAPTER ONE:
INTRODUCTION
1.1 overview
the power line carrier communication system uses the existing AC electrical wiring as the
network medium to provide high speed network access points almost anywhere there is an AC
outlet.
1.2 Problem statement
Power lines were originally devised to transmit electric power from a small number of
sources (generators) to a large number pf sinks (consumers) in the frequency range of 50-60 Hz.
Nowadays with the emergence of modem networking technologies and the need for information
spreading, data transmission over power lines has seen a really big growth. The technologies
already used for spreading information such as telephone wiring, Ethernet cabling, fiber optic and
wireless have each its limitations in costs and reliability.
The advantage of using power lines for data transmission is that every building and home
is already equipped with the power line and connected to the power grid.
1.3 Project objectives
Study of the possibility and visibility of using power lines as a solution for sending
and receiving data.
Design power line communication system.
1.4 Thesis layout
This thesis is organized into 5 chapters:
Chapter 2 (Literature review): This chapter introduce the history of Power Line
Communication and its applications and types. Also it reviews the protocols and technologies used
in PLC.

CHAPTER ONE INTRODUCTION
2
Chapter 3 (Methodology and Design): This chapter describes the goals of designing such
a system, the system components, tools and instruments used and the steps of designing the PLC
system.
Chapter 4 (results and discussion): This chapter shows the results of the simulation
circuit design and the actual results of the real circuits. Also it discusses the results.
Chapter 5 (Conclusion): This chapter contains the thesis conclusion and expected future
works.
CHAPTER TWO LITRETURE REVIEW
3
2 CHAPTER TWO:
LITRETURE REVIEW
2.1 PLC history
The idea of utilizing power lines to carry signals is a very old invention. In 1838, the first
remote electricity supply metering was proposed to check the voltage levels of batteries in an
unmanned site of the London-Liverpool telegraph system. In 1897, the first PLC patent on power
line signaling electricity meter was proposed in Great Britain [1]. In 1905, the remote reading of
electricity meters using an additional signaling wire was patented in the USA. In 1913, the first
products of electromechanical meter repeaters were launched commercially.
In 1920, the carrier frequency transmission of voice signal over high voltage (HV) power
lines was deployed. The carrier transmission over power lines (CTP) was important for the
management and monitoring tasks and also at the beginning of electrification the full-coverage of
telephone network was not available. The frequencies used for CTP were between 15−500 kHz.
Under favorable circumstances, it was possible to bridge the distance of 900 k.m between
transmitter and receiver with the transmission power of 10 W (40 dBm). Firstly, only Amplitude
Modulation (AM) was applied as it was simple and optimal for voice transmission [1]. Later, the
telemetering and the telecontrolling systems were also implemented.
In 1927, the use of thermionic valves for metering was patented. From 1930 onwards, the
ripple carrier signaling (RCS) system was applied in the Medium Voltage (MV) and Low Voltage
(LV) networks where its main functions were the load distribution. It also made possible the
avoidance of extreme load peaks and made the load curve smooth. MV and LV networks have
large number of branches, so these were poor medium compared to the HV overhead lines. As
RCS worked in the low frequency range (approximately 125−3000 Hz), the transmission power
had to be according to the peak load of the network. Hence, the transmission power was large, in
practice it is around 0.1−0.5 % of the maximum apparent power. Here, the applied carrier
frequencies enabled the information to flow over transformers between MV and LV networks with
less attenuation. Also, the data rates were low and the data transmission was unidirectional as it is
from the power supply company to the consumers end. To transmit information through electrical
CHAPTER TWO LITRETURE REVIEW
4
networks, RCS was used with the Amplitude Shift Keying (ASK- a type of amplitude modulation
that assigns bit values to discrete amplitude levels) as well as the Frequency Shift Keying (FSK- a
type of frequency modulation that assigns bit values to discrete frequency levels) methods [1].
In 1936, the indirectly heated cathode valve was introduced. In 1947, theinvention of
transistor reduced the size of all electrical and electronic devices. The invention of integrated
circuits in 1958-59 by Robert Noyce from Fairchild Semiconductor and Jack Kilby from Texas
Instruments and later the invention of microprocessor in 1971 by Ted Hoff at Intel launched the
development of low cost integrated circuits for power line carrier communications. Also by the
late 1980s and the early 1990s, sophisticated error control coding techniques and their
implementation into low cost microcontrollers within the hardware of PLC modems were
proposed.
The development of modulation methods and the use of higher frequencies in the carrier
signal enabled higher data transmission rates and decreased the required transmission power. Also
bidirectional data transmission was introduced and the benefits of using power lines for data
transmission indoors were implemented along with the introduction of Internet. Several
technologies concerned with PLC such as X10, MELKO™, LonWorks, CEBus, INSTEON and
HomePlug® were used during the last few decades.
The X10 standard was developed by Pico Electronics in 1975. X10 is an international and
open industry standard for communication of electronic devices used for home automation. It
mainly uses LV power lines for signaling and control. In this system, the digital data is encoded to
a 120 kHz carrier and is transmitted as bursts during zero crossings of AC voltage network. Here,
every single bit is transmitted at each zero crossing. Hence, data rates of 100 bps and 120 bps can
be obtained in 50 Hz and 60 Hz electric networks respectively.
The next generation devices were based on more effective modulation methods and those
provided higher data transfer rates and these were designed for load management in medium and
low voltage distribution networks. Here, the transmit power was decreased and it supported bi-
directional data transfer. The decrease in transmit power was achieved by increasing the carrier
signal’s frequency and using more sophisticated electronic devices. In 1984 the Enermet
MELKO™ system was published which utilized the Phase Shift Keying (PSK- a type of angle
modulation in which the phase of the carrier is discretely varied) modulation technique and
CHAPTER TWO LITRETURE REVIEW
5
frequency band between 3025−4825 Hz for data transmission. Here, in MV and LV distribution
networks the data transmission rate of 50 bps was possible which were between a substation and
measurement or control units. As the frequency band was low and the carrier signal could pass 4
through the distribution transformers, bidirectional data transmission was possible by
MELKO™. However, its main applications were remote meter reading and load management.
The members of the Electronic Industries Alliance (EIA) realized the necessity of standards
that provides more capability than the X10. Hence, in 1992, they released the consumer electronic
bus (CEBus) standard which was also known as EIA-600. CEBus provides protocols to
communicate through power lines, twisted pairs, coaxial cables, infrared, RF, and fibre optics. It
used spread spectrum modulation technique on power lines within the frequency band of 100−400
kHz. CEBus was a packet-oriented, connectionless and peer-to-peer network which was intended
to transmit commands and data. It was mainly suitable for indoor applications.
In 1990, the Local Operation Networks (LonWorks) platform was created by Echelon. It
is a flexible, robust and expandable standard based on control networking platform. Here, the
physical layer (PHY) signaling can be implemented over twisted pair, power line, fibre optics and
radio frequency (RF). The LonWorks provides information based control systems in contrast to
the previous command based control systems. The LonWorks PLC technology have data
transmission rate of either 3.6 or 5.4 kbps depending on the frequency. Some applications of
LonWorks technology are lighting control, energy management, security and home automation
systems. The Universal Powerline Bus was introduced in 1999 by PCS Powerline Systems. It is a
protocol for communication among the devices used for home automation which uses power line
wiring for signaling and control.
In 2001, SmartLabs Inc. introduced a home automation networking technology called
INSTEON. It was developed for domestic control and sensing applications and was based on the
X10 standard. INSTEON technology is a dual band mesh topology which enables devices to be
networked together using power lines or radio frequency. Thereby it is less susceptible to the noise
interferences compared other single band networks. Here, PLC uses the frequency of 131.65 kHz
and binary phase shift keying (BPSK) modulationG.hn/G.9960 which is a home network
technology standard for high-speed networking over power lines, phone lines and coaxial cables
with data rates up to 1 Gbit/s.
CHAPTER TWO LITRETURE REVIEW
6
Further, in 2008, a standard named IEEE 1675 was developed by Institute of Electrical and
Electronics Engineers (IEEE) standards association for broadband over power lines. It provided
electric utility authorities or companies a standard for safely installing the required hardware for
internet access capabilities over power lines. Subsequently, in 2009, the IEEE P1775 standard
concerned with electromagnetic compatibility requirements, testing and measurement methods for
powerline communication equipment is being completed by IEEE. Afterward, in 2011, the IEEE
1901 standard is published for high speed (up to 500 Mbit/s) communication devices via electric
power lines, hence called broadband over power lines (BPL). The standard uses transmission
frequencies below 100 MHz and it is usable by all classes of communication devices including
internet access services within a building for local area networks, smart energy applications,
transportation platforms (vehicle) and other data distribution applications less than 100m between
devices. It includes a mandatory coexistence inter system protocol which prevents interference
between different BPL implementations operated within close proximity. Moreover, in September
2011, the standards association of the IEEE published a standard named IEEE 2030 which
recognizes the interactive nature of the interconnection with the grid and all of its parts and realizes
the significance of the integration of power, communications and information technologies into
the smart grid (a modernized electrical grid that uses analogue or digital information and
communications technology) with interoperability of energy technology and information
technology operation with the electric power system, end-use applications and loads [2].Then, in
2013, IEEE standard association published a standard called IEEE 1905 which defines a network
enabler for home networking with support of both wireless and wire-line technologies. For IEEE
1905, the consumer certification program named nVoy was announced in June 2013 and consumer
level products were expected by year end 2013 but are delayed till 2014. On the other hand, the
Automated Meter Reading (AMR) system was firstly tested by AT&T Corporation (American
Telephone and Telegraph Corporation) in cooperation with a group of electric utilities in the USA
in 1968. It was a successful experiment and after this AT&T offered to provide AMR service
which was based on telephone communication link. However, from economical point of view, this
project was non profitable. In 1972, the General Electric (GE)’s corporate research center in
association with its meter department started a research and development attempt for a remote
meter reading system. Meanwhile, in 1977, at Rockwell International a utility communication
division had been introduced to develop distribution carrier communication systems. Later in
CHAPTER TWO LITRETURE REVIEW
7
1984, General Electric achieved a license from Rockwell International to commercialize their
project of distribution line carrier product designs and technology for AMR.
From 1985, the modern era of AMR started as several full-scale projects of AMR were
implemented. Very firstly, the introduction of AMR technology was made by Hackensack Water
Corporation and Equitable Gas Corporation into their water and gas measurements systems
respectively. Following that, in 1986, the radio based AMR system was installed by Minnegasco
for 450,000 customers. Further, in 1987, Philadelphia Electric Co. had installed thousands of
distribution line carrier AMR units with the meters which were previously not accessible.
The primary implementation of the automation of meter reading was for reducing labor
costs and obtaining data that was difficult to obtain. Because of technical advance in solid-state
electronics, microprocessor components and communication sphere, a modern AMR system can
provide more useful information which are beneficial for distribution authorities and also enables
others additional services which is known as Smart Integrated Metering System. However, the
basic idea of remote electricity measurement is common for both AMR and Smart Integrated
Metering Systems. Originally AMR devices just collected meter readings electronically and
matched them with accounts. As technology has advanced, additional data could then be captured,
stored and transmitted to the main computer and often the metering devices could be controlled
remotely. This can include events alarms such as tamper, leak detection, low battery or reverse
flow. Many AMR devices can also capture interval data and log meter events. The logged data can
be used to collect or control the time of use or rate of use and that data can be used for energy or
water usage profiling, time of use billing, demand forecasting, demand response, rate of flow
recording, leak detection, flow monitoring, water and energy conservation enforcement, remote
shutoff, etc. Advanced Metering Infrastructure (AMI) represents the networking technology of
fixed network meter systems that go beyond AMR into remote utility management. The meters in
an AMI system are often referred to as Smart Meters, since they often can use the collected data
based on programmed logic.
In 2003, in Europe, the Northern Europe became the hotspot of Advanced Metering when
Sweden announced the decision to acquire monthly readings of all electricity meters by 2009. Soon
activities spread to the other Nordic countries like Finland, Denmark and Norway. In 2004, the
Essential Service Commission of Victoria, Australia has brought corrections to the electricity
CHAPTER TWO LITRETURE REVIEW
8
customer metering code to implement an order in the installation of interval electronic meters for
Victorian electricity customers. According to the paper entitled "Mandatory Rollout of Interval
Meters for Electricity Customers" for all small businesses and residences, the meters have to be
installed by 2013, starting from the year 2006. It forecasts that, within seven years from the
beginning of the replacing, up to one million large and other customers will have upgraded meters.
However, by mid July 2013, the first Smart Meter in home displays was being made available to
Victorian consumers. At the beginning of 2014, over 2.5 million meters installed at homes and
small businesses across the state.
The United States (US) energy policy act of 2005 asked the electric utility regulators to
consider time-based rate schedule and enable the electric consumer to manage the energy use and
cost through advance metering and communication technology. Besides, in November 2005, the
Meridian Energy in New Zealand introduced the usage of smart meters in the Central Hawkes Bay
area for over 1000 households. The communication link was based on radio andmobile
technologies. It was expected to install over 6,300 smart meters by late 2006 as part of the initiated
experiment. In Italy, the world's largest smart meter deployment was undertaken by Enel SpA for
more than 30 million customers. Between 2000 and 2005, Enel SpA deployed smart meters to its
entire customer base. These meters are fully electronic and smart, with integrated bi-directional
communications, advanced power measurement and management capabilities with solid-state
design.
The Commonwealth issued a joint communiqué at the council of Australian Governments
meeting in Canberra in February 2006, committing all governments to the progressive rollout of
smart metering technology from 2007. In September 2006, the Netherlands government conducted
a cost benefit analysis of AMR for their country and proposed that all residential customers will
get a smart meter by the year 2013, starting from 2008. Since then, two utilities named Continuon
and Oxxio have been undertaking some pilot projects for the implementation of AMR. The smart
meter’s register electricity and communicate through PLC.
In February 2007, the Automatic Meter Reading Association (AMRA) endorses the
National Association of Regulatory Utility Commissioners (NARUC) resolution to eliminate
regulatory barriers to the broad implementation of Advanced Metering Infrastructure (AMI). The
resolution passed acknowledged the role of AMI in dynamic cost savings in revenue protection,
CHAPTER TWO LITRETURE REVIEW
9
outage management and its benefits to the consumers. In June 2007, the Norwegian energy
authority declared that it would recommend new legislation for requiring smart meters to take
effect in 2013. Also in 2007, the Republic of Ireland pledged to introduce smart meters in every
home within a five-year period. In December 2007, the smart metering was included in the national
meter substitution plan of Spain for end users with an aim of remote energy management with a
deadline for the completion of the plan by 31st December, 2018. The Ontario Energy Board in
Ontario, Canada set a target of deploying smart meters to 800,000 homes and small businesses by
the end of 2007, which was surpassed, and throughout the province by the end of 2010In July
2008, from government of Australia the Advanced Metering Infrastructure was mandated and
being planned in Victoria for deployment of 2.6 million meters over a four-year period. Also in
2008, Austin Energy of Texas, United States began deploying approximately 260,000 residential
smart meters. According to the report from VaasaETT of October 2008, an energy think tank in
Helsinki, Finland found that smart meters are saving energy by around 10%. At the end of 2008,
the installed base of smart meters in Europe was about 39 million units, according to the analyst
firm Berg Insight.
In 2009, Florida Power and Light in United States began installing smart meters in the
Miami-Dade area for residential customers and it’s expected to be completed by 2013. In October
2009, the U.S. Department of Energy awarded $200 million grant for the deployment of
CenterPoint Energy's smart meter network in Texas. In December 2009, the United Kingdom's
Department of Energy announced its intention to have smart meters in all homes by 2020. Here,
the principal media of communication in the Home Area Network is ZigBee Smart Energy. ZigBee
is a specification for a suite of high level communication protocols used to create personal area
networks built from small, low power digital radios.
In January 2010, it was estimated to install 170,000 domestic smart meters in United
Kingdom and in October 2010, First Utility became the first energy supplier to offer smart meters
to all new and existing customers across the U.K. A smart metering pilot project named Linky was
conducted by Electricité Réseau Distribution, France involving 300,000 clients supplied by 7,000
low-voltage transformers. The experimentation phase started in March 2010. A key determining
factor will be the interoperability of the equipment of various suppliers. The general deployment
phase will start in 2016 and continue through 2020.
CHAPTER TWO LITRETURE REVIEW
10
In January 2011, the American Council for an Energy-Efficient Economy reviewed more
than 36 different residential smart metering and feedback systems internationally. Their conclusion
was “To realize potential feedback induced savings, advanced meters must be used in conjunction
with in home displays and well-designed programs that successfully inform, engage, empower and
motivate people." In United States, Texas based CPS Energy has launched a pilot program with
40,000 smart meters deployed in the summer of 2011. CPS plans to complete the installation of
smart meters (electricity and gas) for all customers by the end of 2016.
The United Kingdom rollout is considered to be the largest program involving more than
27 million homes to replace meters for both gas and electricity. The rollout officially started in
2012 but some energy suppliers started installing smart meters in people's homes before this.
Besides, in spring 2012, Baltimore Gas and Electric of Maryland, United States began installing
or upgrading approximately two million electric and gas meters in every home and small business
in their service area. This process will take about three years to complete. These smart meters help
customers to manage their energy budgeting, tracking and save money. By July 2013, the first
Smart Meter in home displays was made available to Victorian consumers of Australia. At the
beginning of 2014 Smart Meter in home displays were spreading rapidly. By the end of 2014, in
United Kingdom the full rollout with the data communications for domestic customers are almost
completed. Most households will have smart meters installed by their energy providing
company/authority between 2015 and 2020, although some energy companies are starting to install
smart meters already.
2.2 PLC applications:
2.2.1 according to the frequency:
In accordance with the application, the axis is divided into three portions. Any portion is
suitable for some specific applications. The broadband PLC uses the frequency band between
1MHz and 300MHz. It is suitable for high data rate transmission, more than 10Mbps. The
NBPLC’s portion uses the CENELEC bands for low data rate transmission, less than 50kbps. Over
the frequencies from 145.3kHz to 500kHz, the NBPLC’s technologies are used to perform high
data rate transmission between 50 kbps and 1 Mbps. Thereby, the applications of the power line
communications technology are related to the frequency band used. The applications of BBPLC
CHAPTER TWO LITRETURE REVIEW
11
cannot be deployed over NBPLC frequencies. The deployment of the technology over each range
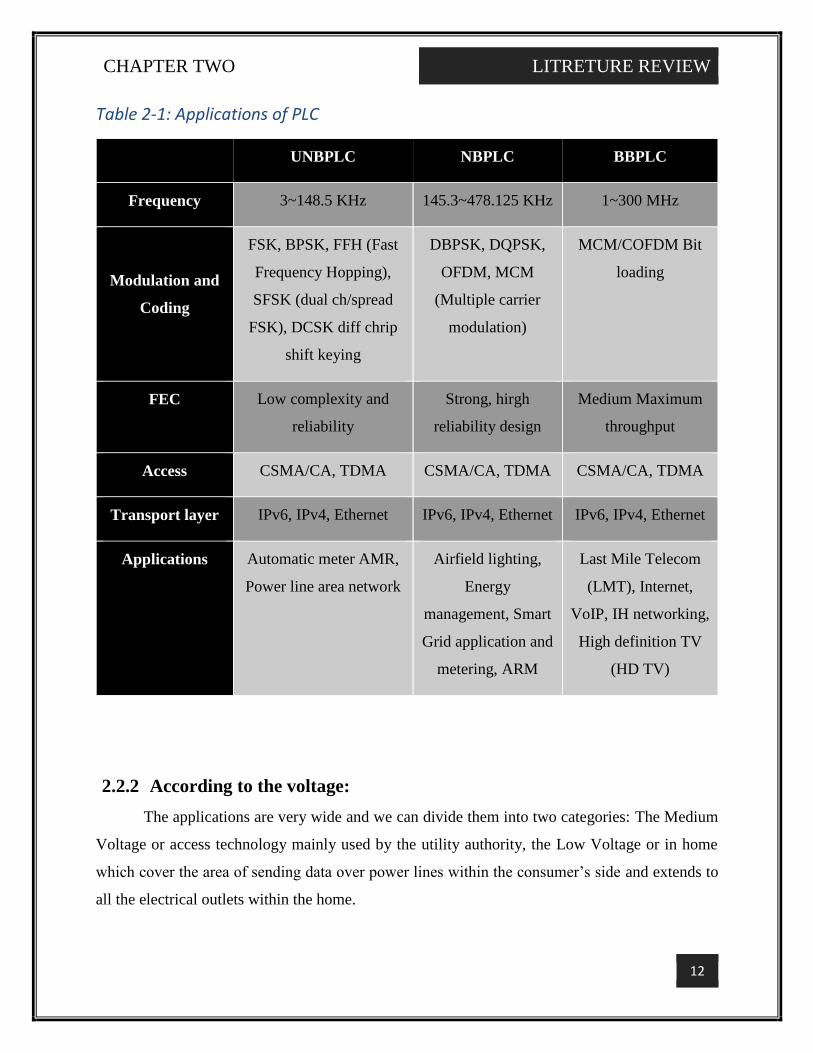
of frequencies is supported by many companies and organizations. Table (2-1) gives some
specifications on the application of the power line communications technology. It shows the
frequency band, some modulation schemes proposed by the SDOs for both NBPLC and BBPLC.
The complexity of the forward error correction (FEC), the access method and some companies and
organizations supporting the standards are also mentioned. The NBPLC frequency bands are used
for metering, lighting, energy and grid management.
The BBPLC frequency band is used for applications such as last mile telecom, voice over
IP and high definition television. Companies such as Gorlitz and alliances such as G3-PLC,
PRIME are specialized in meter manufacturing. The KNX organization is the standard for home
and building control.
CHAPTER TWO LITRETURE REVIEW
12
Table 2-1: Applications of PLC
UNBPLC NBPLC BBPLC
Frequency 3~148.5 KHz 145.3~478.125 KHz 1~300 MHz
Modulation and
Coding
FSK, BPSK, FFH (Fast
Frequency Hopping),
SFSK (dual ch/spread
FSK), DCSK diff chrip
shift keying
DBPSK, DQPSK,
OFDM, MCM
(Multiple carrier
modulation)
MCM/COFDM Bit
loading
FEC Low complexity and
reliability
Strong, hirgh
reliability design
Medium Maximum
throughput
Access CSMA/CA, TDMA CSMA/CA, TDMA CSMA/CA, TDMA
Transport layer IPv6, IPv4, Ethernet IPv6, IPv4, Ethernet IPv6, IPv4, Ethernet
Applications Automatic meter AMR,
Power line area network
Airfield lighting,
Energy
management, Smart
Grid application and
metering, ARM
Last Mile Telecom
(LMT), Internet,
VoIP, IH networking,
High definition TV
(HD TV)
2.2.2 According to the voltage:
The applications are very wide and we can divide them into two categories: The Medium
Voltage or access technology mainly used by the utility authority, the Low Voltage or in home
which cover the area of sending data over power lines within the consumer’s side and extends to
all the electrical outlets within the home.
CHAPTER TWO LITRETURE REVIEW
13
2.2.2.1 Low voltage or in-house:
2.2.2.1.1 Home automation:
Many years ago control of appliances in the home used to call for the establishment of new
cable wiring in the home. With the DTOPL technology automation of a building can be done using
power lines only. Hence we can control home appliances, light switches, wall outlets, thermostats,
Heat Ventilation and Air Conditioning systems (HVAC), sensors, alarm and security. One of our
project goals is to implement the home automation.
2.2.2.1.2 Street lightening monitoring:
The use of DTOPL to monitor street lights leads to big savings in the electricity bill of the
government by introducing selective dimming or selective turn-off features. This application can
increase energy savings by 25%.
2.2.2.1.3 Low cost inter-device peer-to-peer networking:
Power lines may be used to create a network that links devices together on the power grid.
Since such a network makes use of the existing infrastructure, installation time and cost are
virtually non-existent. Also since every outlet or junction box becomes a point where a device may
be connected, the device can be moved around numerous times. An example of such a network
can be to replace the RS232 wiring required to set audio and video inputs on various systems in a
house or a building.
2.2.2.2 Medium Voltage and Low Voltage:
2.2.2.2.1 Utility:
Automatic Meter Reading is a technology that uses the power line to send
information to the utility directly. Meters can be linked to concentrators to allow
suppliers to have remote access to each individual meter, to read or write
information such as rates, pre-paid amounts, current and cumulative counts,
tampering detection, etc. Meters and/or concentrators can also be used along
with AC Remote LCD devices to replicate and distribute their information to
one or more points located anywhere on the electrical network.
Load shedding: this is done when we need to reduce power given to loads when
we have peak demands hours. As an example incandescent lights, with the help
CHAPTER TWO LITRETURE REVIEW
14
of a load control circuit will receive less power when the utility notices that the
demand for electricity is at its peak in certain periods.
2.2.2.2.2 Broadband data transmission:
This developing technology which is at its testing level (Italy, USA) nowadays enables
broadband internet to be provided to your home using the electrical grid. This feature is behind the
scope of our project however we will give a brief overview of what this technology is about:
An example of a company developing this technology is ABB Medium Voltage Power
Solution. This system certified for use up to 24 KV provides data transfer rates of up to 10 Mbps
and hence challenging the xDSL and the broadband cable technology. The main problem in this
technology is the connection between the MV and the LV grid which is done using optical fibers,
copper pairs or wireless[3].[4].
2.3 PLC Types
Power Line Communication (PLC) which uses power cable as communication media has
received attention as a candidate communication technology for smart power system. PLC is not
a new technology. Utility companies have used PLC for metering and control of applications for
several decades. PLC which has been used for this purpose has few bps of data rate and used a
narrow band frequency. PLC is only a wire technology which can compete with wireless
technologies economically because cost for cable deployment is not necessary. Also PLC can
support ubiquitous solution with distributed power grid. PLC can be classified in three types
through the use of frequency band. Table 2.1 shows summary of these three types of PLC.
CHAPTER TWO LITRETURE REVIEW
15
Table 2-2: PLC Classifications
Classification Frequency band Data rate Applications
Ultra-Narrowband
PLC
(UNB-PLC)
~3 KHz Hundreds bps Control, AMR
Narrowband PLC
(NB-PLC)
3~500 KHz 10s ~ 500 kbps Control, Smart
metering
Broadband PLC 1.8~250 MHz Over 1 Mbps Data, Multimedia
Communication.
2.3.1 Ultra-narrow band plc
Ultra-Narrowband Power Line Communication (UNB-PLC) is operated at a frequency
band of below 3kHz. The data rate of UNB-PLC is very low (hundreds bps), however, the
communication range is over 150 km. UNB-PLC has been used for automation for distributed
facilities and Automatic Meter Reading (AMR) solution for several decades. Though it has many
advantages such as maturity of technology, cost and communication range, the usage of UNB-
PLC has been restricted field due to a low data rate. UNB-PLC can be a good candidate technology
for WAN just considering its operating range. UNBPLC may not be considered for communication
Infrastructure of Micro Grid because Micro Grid covers only a small area.
The earliest PLC systems are ripple control systems, first introduced in the 1930s, and still
used in parts of Europe and New Zealand to provide basic low bandwidth direct load control and
other telemetry. These use basic modulation schemes on a lower frequency carrier to convey
information.
Another approach used since the 1970s leverages the fundamental alternating current (AC)
frequency (50-60 Hz) as a carrier to transmit information on the power line. As a result, these
systems avoid many of the noise and attenuation issues of other PLC technologies (which impose
CHAPTER TWO LITRETURE REVIEW
16
other carrier frequencies) and can be transmitted across long distances and through transformers
without repeaters. The leading example of this is Two-Way Automatic Communications System
(TWACS – today known as Aclara PLC). These systems also deliver 10 to 100 bits per second
data rates.
Low-speed PLC systems have been widely deployed for remote meter reading and direct
load control applications.
2.3.2 Narrowband plc
Narrowband Power Line Communication (NB-PLC) uses 3 ~ 500Khz frequency band and
supports several hundred bps of data rate. Industry and academia have paid attention to the
technology of NB-PLC recently. PLC has a harsh channel circumstance like that of a wireless
communication and it also has a problem of electromagnetic compatibility (EMC). Using a wide
frequency band can increase the data rate of PLC which is called Broadband PLC but many
concerns like interference, attenuation and frequency regulation should be considered to support a
robust communication services. Using narrow frequency band can release the mentioned problems
although NB-PLC has a low data rate. For this reason, NB-PLC has got more attention comparing
with PLC using wide frequency band nowadays. The frequency band for NB-PLC is shown in
Table 2-2. These rates are appropriate for telemetry and control applications. In North America,
Japan and China, the frequency range of up to 500 kHz are viable under local regulations for N-
PLC and offers a reasonably wide communications bandwidth (up to above 300Kbps) and a
broader range of applications can be considered. There are many different implementations, with
varying data rates, modulation schemes, and degrees of adherence.
CHAPTER TWO LITRETURE REVIEW
17
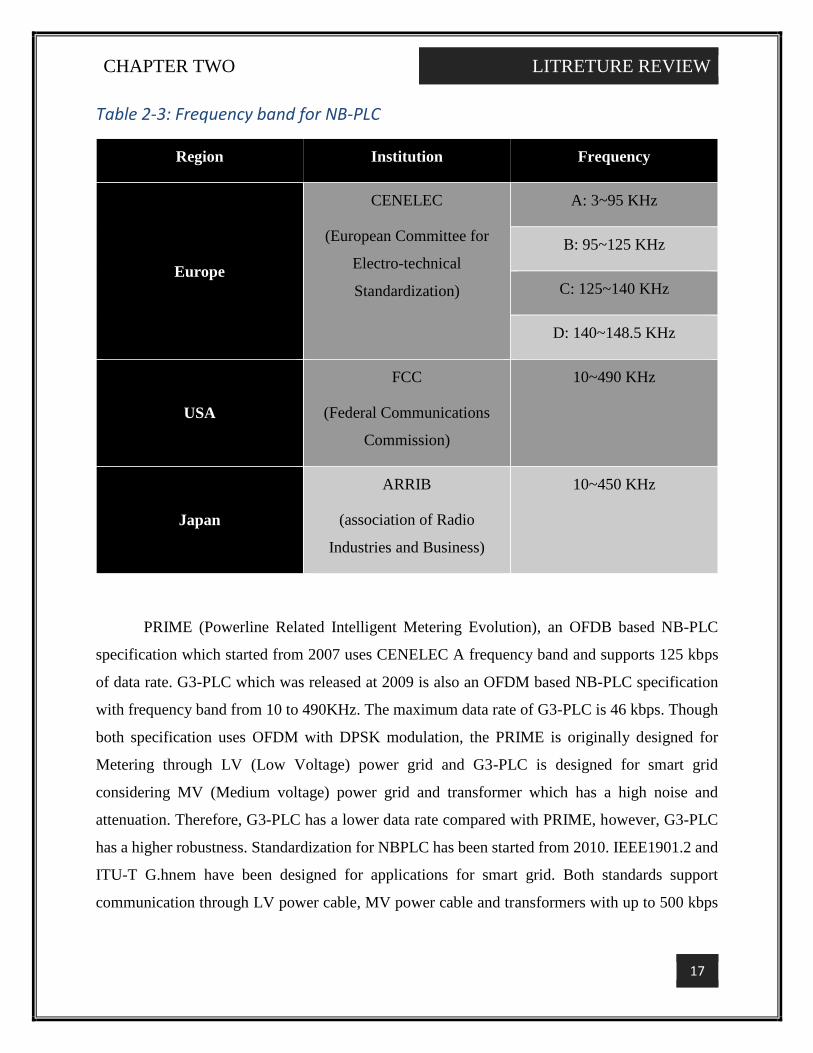
Table 2-3: Frequency band for NB-PLC
Region Institution Frequency
Europe
CENELEC
(European Committee for
Electro-technical
Standardization)
A: 3~95 KHz
B: 95~125 KHz
C: 125~140 KHz
D: 140~148.5 KHz
USA
FCC
(Federal Communications
Commission)
10~490 KHz
Japan
ARRIB
(association of Radio
Industries and Business)
10~450 KHz
PRIME (Powerline Related Intelligent Metering Evolution), an OFDB based NB-PLC
specification which started from 2007 uses CENELEC A frequency band and supports 125 kbps
of data rate. G3-PLC which was released at 2009 is also an OFDM based NB-PLC specification
with frequency band from 10 to 490KHz. The maximum data rate of G3-PLC is 46 kbps. Though
both specification uses OFDM with DPSK modulation, the PRIME is originally designed for
Metering through LV (Low Voltage) power grid and G3-PLC is designed for smart grid
considering MV (Medium voltage) power grid and transformer which has a high noise and
attenuation. Therefore, G3-PLC has a lower data rate compared with PRIME, however, G3-PLC
has a higher robustness. Standardization for NBPLC has been started from 2010. IEEE1901.2 and
ITU-T G.hnem have been designed for applications for smart grid. Both standards support
communication through LV power cable, MV power cable and transformers with up to 500 kbps
CHAPTER TWO LITRETURE REVIEW
18
data rate. NB-PLC with LV and MV power cable may be great candidates for communication
technology for the NAN in Micro Grid.
2.3.3 Broadband plc
Broadband Power Line Communication (BB-PLC) is a technology for high speed data
communication with a frequency range of 1.8 MHz ~ 250 MHz. In the early 2000, several
industrial specifications of BB-PLC especially for home network & video transmission have been
released. These industrial specifications are explained at Table 2-3.
BPL technologies generally operate at carrier frequencies well above the CENELEC bands
and therefore experience inconsistent and extremely challenging spectrum characteristics. Not
only has reliable communications been hard to achieve, but these systems have also caused
significant electromagnetic interference problems.
All three BB-PLC specifications use CSMA/CA MAC (Medium Access Control) scheme
and support around 200Mbps physical throughput. All these specifications have been designed for
HAN. These three industrial specifications have many similar aspects, however, they do not
support interoperability. Recently released BB-PLC specification HomePlug AV2 supports up to
1Gbps transmission rate with MIMO. In 2010 IEEE1901 standard for BB-PLC has been released.
IEEE1901 supports two modes of BB-PLC. One is OFDM based PHY/MAC scheme which is
compatible with HomePlug AV specification and the other is wavelet OFDM based PHY/MAC
scheme compatible with HD-PLC specification. IEEE1901 standard also can get up to 200 Mbps
physical throughput. ITU-T also released ITU-T G.hn standard for home networking. ITU-T G.hn
is standard for all wired communication technologies for homes such as Power line (PLC), Phone
line and coaxial cable with up to 1 Gbps bit rate. BB-PLC can support high data rate for data
communication but transmission range is limited (around 100m). Therefore, BB-PLC can be a
great technology for HAN however to use for NAN, the help of other facilities like a repeater may
be necessary.[5]
CHAPTER TWO LITRETURE REVIEW
19
Table 2-4: Industrial specification of BB-PLC
Alliance Frequency
Band
Throughput Modulation Chip set
Maker
HomePlug
(Homeplug Power Line Alliance)
1.8 ~ 30
MHz
200 Mbps OFDM Intellon
(Qualcomm)
UPA
(Universal Powerline
Association)
3~33 MHz 200 Mbps OFDM DS2
(Marvell)
HD-PLC
(High Definition Powerline
Communication)
2~28 MHz 210 Mbps Wavelet
OFDM
Panasonic
2.4 Plc standards
When using the powerline as a channel certain standards and regulations must be followed
in order to avoid interference between the frequencies transmitted with any other frequencies
already existing. Hence the bandwidth in the DTOPL environment is not limited by physical
capabilities of the line. Rather, regulatory authorities in the developed countries limit the available
bandwidth in order to prevent radio interference, other devices interference or military bandwidth
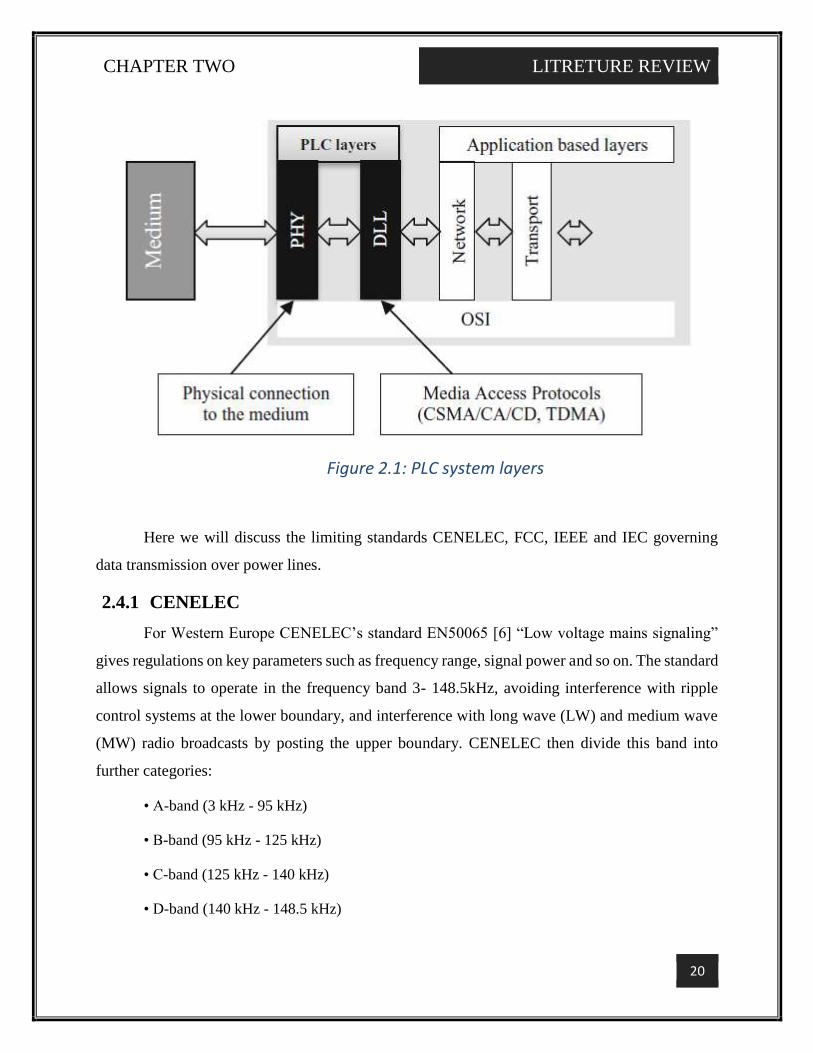
interference. The standards in power line communications (PLC) calibrate
parameters such as frequencies allocation, signal level, security, topology of the
network and many others parameters. In power line communications
(PLC), the SDOs focus on the physical (PHY) and on the data link (DLL) layers as shown
on Fig (2.1). The other layers are reserved for the application.
CHAPTER TWO LITRETURE REVIEW
20
Here we will discuss the limiting standards CENELEC, FCC, IEEE and IEC governing
data transmission over power lines.
2.4.1 CENELEC
For Western Europe CENELEC’s standard EN50065 [6] “Low voltage mains signaling”
gives regulations on key parameters such as frequency range, signal power and so on. The standard
allows signals to operate in the frequency band 3- 148.5kHz, avoiding interference with ripple
control systems at the lower boundary, and interference with long wave (LW) and medium wave
(MW) radio broadcasts by posting the upper boundary. CENELEC then divide this band into
further categories:
• A-band (3 kHz - 95 kHz)
• B-band (95 kHz - 125 kHz)
• C-band (125 kHz - 140 kHz)
• D-band (140 kHz - 148.5 kHz)
Figure 2.1: PLC system layers
CHAPTER TWO LITRETURE REVIEW
21
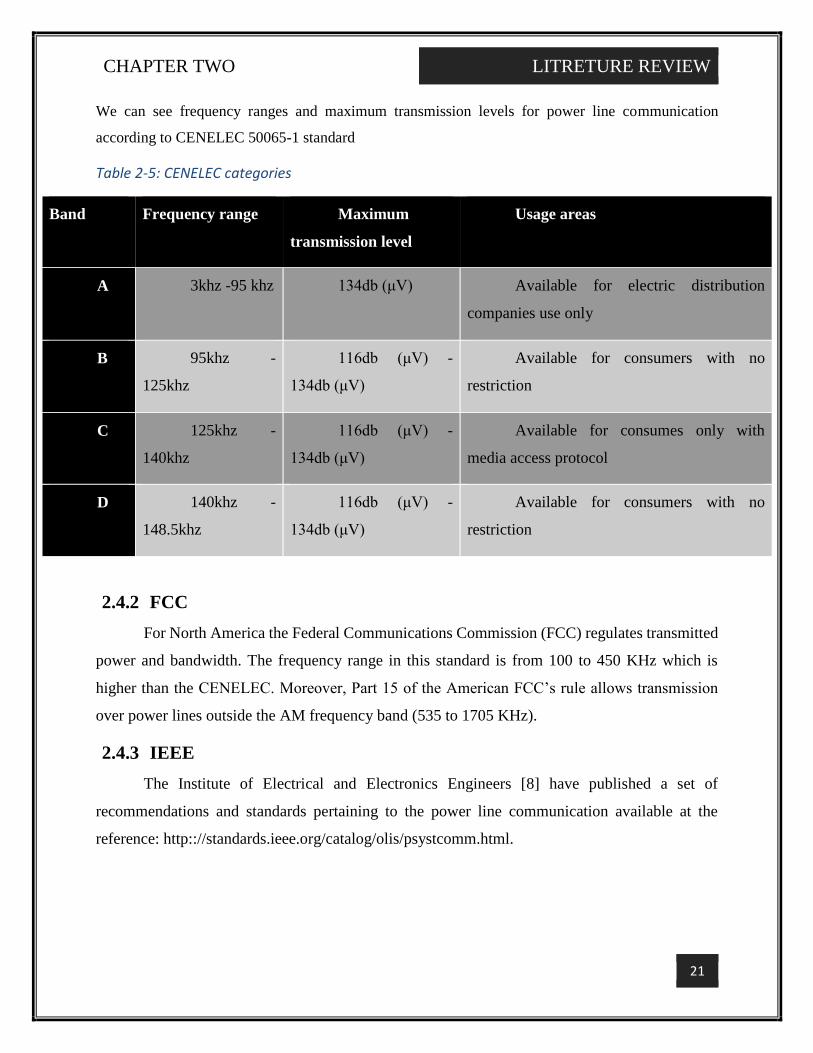
We can see frequency ranges and maximum transmission levels for power line communication
according to CENELEC 50065-1 standard
Table 2-5: CENELEC categories
Band Frequency range Maximum
transmission level
Usage areas
A 3khz -95 khz 134db (μV) Available for electric distribution
companies use only
B 95khz -
125khz
116db (μV) -
134db (μV)
Available for consumers with no
restriction
C 125khz -
140khz
116db (μV) -
134db (μV)
Available for consumes only with
media access protocol
D 140khz -
148.5khz
116db (μV) -
134db (μV)
Available for consumers with no
restriction
2.4.2 FCC
For North America the Federal Communications Commission (FCC) regulates transmitted
power and bandwidth. The frequency range in this standard is from 100 to 450 KHz which is
higher than the CENELEC. Moreover, Part 15 of the American FCC’s rule allows transmission
over power lines outside the AM frequency band (535 to 1705 KHz).
2.4.3 IEEE
The Institute of Electrical and Electronics Engineers [8] have published a set of
recommendations and standards pertaining to the power line communication available at the
reference: http:://standards.ieee.org/catalog/olis/psystcomm.html.
CHAPTER TWO LITRETURE REVIEW
22
2.4.4 IEC
The International Electrotechnical Commission (IEC) [9] has standardized the distribution
line communications through technical committee #57 working group 9. In this standard, IEC
TC57/WG9 uses frequencies below 150 KHz.
IEC 61334, known as Distribution automation using distribution line carrier systems,
is a standard for low-speed reliable power line communications by electricity meters, water meters
and SCADA. It is actually a series of standards describing the researched physical environment of
power lines, a well-adapted physical layer, a workable low-power media access layer, and a
management interface.
G3-PLC, Powerline, intelligent metering evolution (PRIME), the American national
standards institute (ANSI), KNX and HOMEPLUG are some groups and alliances that develop
and deploy standards and technologies in power line communications sector.
The HomePlug Alliance is an association of companies within the electric utility industry
in the United States. The companies include Cogency, Panasonic, Radio Shack Corp. and Sharp.
Twenty participating member companies accompany this group and some of the big players
include Motorola, Philips Electronics, Sony Corp. and France Telecom. The HomePlug Alliance
developed the HomePlug standard and they meet the current FCC Part 15 requirements for current
carrier systems. The aim of the HomePlug standard is to provide interoperability between
consumer devices by setting a MAC protocol as well as the physical signaling techniques to be
used a form of orthogonal frequency division multiplexing (OFDM) modulation using up to 76
carriers in the band 4.5 MHz to 21 MHz. The throughput rate of a typical HomePlug standard is
14 Mbps with extrapolated rates going up to 20 Mbps. G3-PLC, PRIME, ANSI and KNX propose
technologies using the CENELEC’s frequency bands. G3-PLC works on the range between
35kHz–90 kHz while PRIME alliance uses the frequency band 42 kHz–90 kHz. ANSI proposes
technologies for the frequencies from 86 kHz–131 kHz and KNX works with the band of
frequencies between 125 kHz to 140 kHz. HomePlug is present over the whole PLC’s frequency
band.[3][6]
CHAPTER TWO LITRETURE REVIEW
23
2.5 PLC protocols and Technologies
The technologies and standards used presently in the Power Line Communications are
investigated in depth. These include LonWorks, X-10, OFDM, Passport CEBus and the HomePlug
standard. Then focus was on the technologies that are being deployed based on the standards. The
advantages and benefits of using Power Line as the medium of data transmission at homes was
also considered. The quality of service, data transmission rates, the limitations, the drawbacks and
other important factors were taken into account. The description of technologies follows.
2.5.1 X-10
It is the most ancient communication protocol used in home networking since 1978
developed by X-10 US Corporation. It is used to allow compatible devices to communicate with
each other over 110V AC wiring.
2.5.1.1 Protocol description
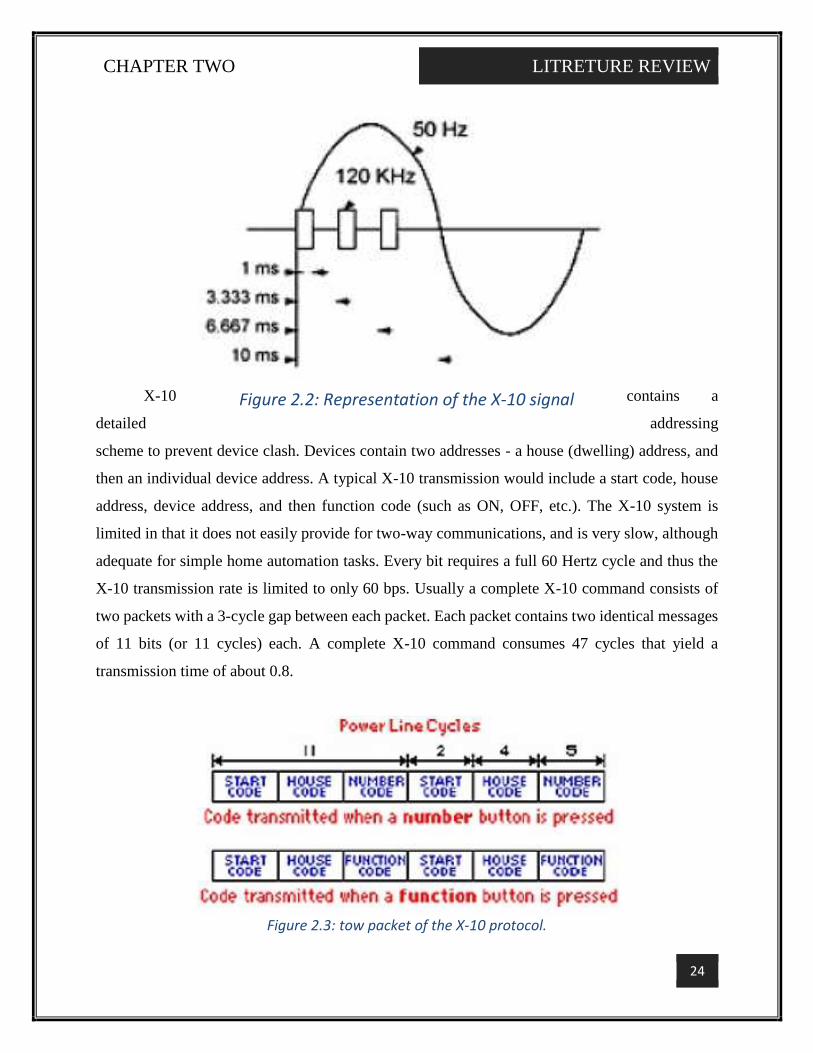
X-10 simply provides the technical specifications of how a device should place a signal onto the
power line. The X-10 technology transmits binary data using the amplitude modulation technique.
In order to differentiate the data symbols the carrier uses the zero voltage crossing point of the 60
Hz on the negative or positive cycle.
Hence for synchronization, the presence of a 120 kHz signal burst at the zero crossing indicates
the transmission of a binary one, whilst the absence of the 120 kHz signal indicates a binary zero.
CHAPTER TWO LITRETURE REVIEW
24
X-10 contains a
detailed addressing
scheme to prevent device clash. Devices contain two addresses - a house (dwelling) address, and
then an individual device address. A typical X-10 transmission would include a start code, house
address, device address, and then function code (such as ON, OFF, etc.). The X-10 system is
limited in that it does not easily provide for two-way communications, and is very slow, although
adequate for simple home automation tasks. Every bit requires a full 60 Hertz cycle and thus the
X-10 transmission rate is limited to only 60 bps. Usually a complete X-10 command consists of
two packets with a 3-cycle gap between each packet. Each packet contains two identical messages
of 11 bits (or 11 cycles) each. A complete X-10 command consumes 47 cycles that yield a
transmission time of about 0.8.
Figure 2.2: Representation of the X-10 signal
Figure 2.3: tow packet of the X-10 protocol.
CHAPTER TWO LITRETURE REVIEW
25
2.5.1.2 Disadvantages
The X-10 technology would not fit our project design for the main fact that it has limited
potential in speed and intelligence terms. Its low data rate and undeveloped functionality permit to
use the X-10 technology in limited applications. In addition to its unreliability of amplitude
modulation and error correction, X-10 operates on 110V AC, which is a major drawback for its
use.
2.5.2 CsBus technology
CEBus, or Consumer Electronics Bus, a standard proposed by the Electronic Industries
Association, is based on the concept of Local Area Networks (LAN’s), for the home. CEBus based
products consist mainly of two components: a transceiver which implements spread spectrum
technology along with a controller to run the protocol. The given protocol standards are for radio
frequency, twisted pair, power line communication and a number of other home networking
methods. The CEBus DTOPL standard specifies that a binary digit is represented by how long a
frequency burst is applied to the channel. For example, a binary ‘1’ is represented by a 100
microsecond burst, whilst a binary ‘0’ is represented by a 200 microsecond burst. Consequently,
the CEBus transmission rate varies with how many ‘0’ characters, and how many ‘1’ characters
are transmitted. The CEBus standard specifies a language of object oriented controls including
commands for volume up/down, temperature up one degree, etc. Due to the high noise level of
power line channels, data should be transmitted via short frames, which is assured by the use of
the spread spectrum technology. CEBus protocol uses a Carrier Sense Multiple Access/Collision
Detection and Resolution (CSMA/CDCR) protocol to avoid data collisions. CEBus is a
commercially owned protocol, and thus attracts registration fees.
2.5.3 LonWorks technology
This technology has been developed by Echelon Corporation [4]. It is essentially structured
as an automatic control system that consists of sensors, actuators, application programs,
communication networks, human-machine interface and network management tools. LonWorks
(Local Operation Networks) technology is an important new solution for control networks
CHAPTER TWO LITRETURE REVIEW
26
developed by Echelon ® Corporation. A control network is any group of devices working in a
peer-to-peer fashion to monitor the different components cited above. In some ways, a
LONWORKS control network resembles LAN. It can control and link factory conveyor belts,
product inventory, and distribution systems for optimum efficiency and flexibility. Smart office
buildings can turn lights on and off, open and lock doors, start and stop elevators, and connect all
functions to a central security system. In the same manner, homeowners can program a vast array
of products and conveniences, from sprinkler systems to VCRs, with a touch tone phone from any
remote location. The LonTalk communications protocol is a layered, packet-based, serial peer-to-
peer communications protocol. This protocol is designed for the requirements of control systems,
rather than data processing systems. Also, this protocol is media-independent, which allows the
system to communicate over any physical transport media. LonTalk has been approved as an open
industry standard by the American National Standards Institute (ANSI)-EIA 709.1.[7][6]
2.6 PLC system components
Plc system main components can be classified as:
Plc modem
Coupling circuit
Power supply
Controller
2.6.1 Modem
Modulation is process for moving a signal in a transmission medium via a high frequency
periodic signal. High frequency signal called carrier frequency [1]. Data signal can change of
carrier frequency’s amplitude, frequency or phase values. Here we are going to discuss only digital
modulation techniques:
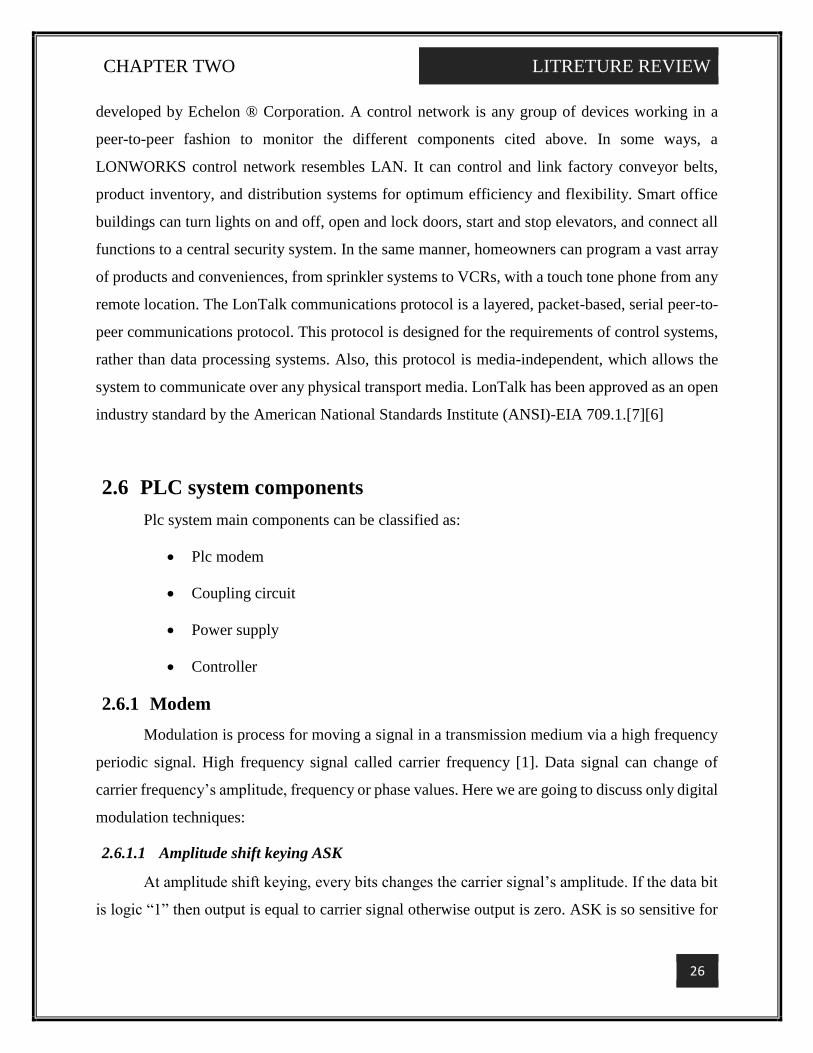
2.6.1.1 Amplitude shift keying ASK
At amplitude shift keying, every bits changes the carrier signal’s amplitude. If the data bit
is logic “1” then output is equal to carrier signal otherwise output is zero. ASK is so sensitive for
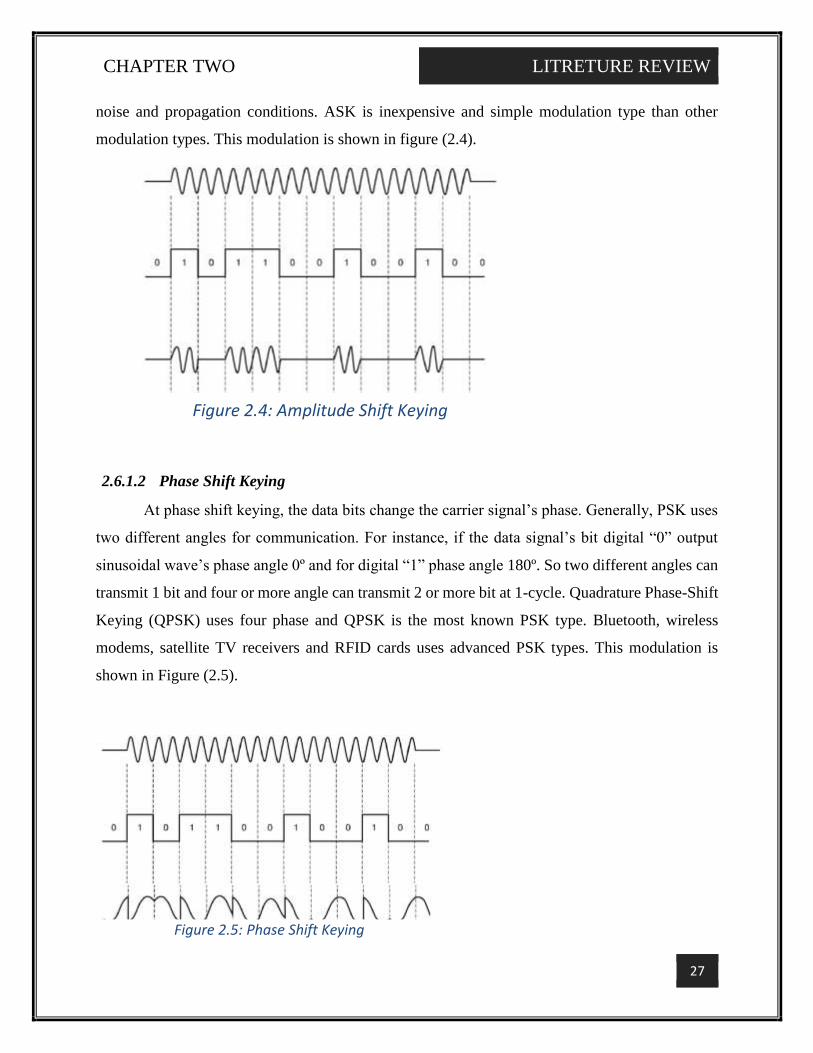
CHAPTER TWO LITRETURE REVIEW
27
noise and propagation conditions. ASK is inexpensive and simple modulation type than other
modulation types. This modulation is shown in figure (2.4).
2.6.1.2 Phase Shift Keying
At phase shift keying, the data bits change the carrier signal’s phase. Generally, PSK uses
two different angles for communication. For instance, if the data signal’s bit digital “0” output
sinusoidal wave’s phase angle 0º and for digital “1” phase angle 180º. So two different angles can
transmit 1 bit and four or more angle can transmit 2 or more bit at 1-cycle. Quadrature Phase-Shift
Keying (QPSK) uses four phase and QPSK is the most known PSK type. Bluetooth, wireless
modems, satellite TV receivers and RFID cards uses advanced PSK types. This modulation is
shown in Figure (2.5).
Figure 2.4: Amplitude Shift Keying
Figure 2.5: Phase Shift Keying
CHAPTER TWO LITRETURE REVIEW
28
2.6.1.3 Orthogonal Frequency Division Multiplexing (OFDM)
modulation techniques transmit data via a series of parallel subcarriers set at different
frequencies. In theory they allow high-bandwidth levels, but in practice a great deal of bandwidth
is lost under noisy conditions over low-voltage networks. On top of that, OFDM can prove costly
to implement and draws significant power to operate.
2.6.1.4 Frequency Shift Keying
At frequency shift keying, the data signal’s every bit changes the carrier signal’s frequency.
FSK has many application areas in our daily-life (e.g. radio, modem, fax). FSK is very immune to
noise. Because noise can change the signals amplitude but it can’t change the signals frequency
easily. Particularly resilient to narrowband interference, Spread-Frequency Shift Keying (S-FSK)
modulation as described by IEC 61334 transmits data through discrete frequency changes in the
carrier wave. Though it supports lower data rates than OFDM, these rates are still more than
sufficient for smart metering applications. This modulation technique is capable of robust
communication, as well as being cheaper to implement and drawing limited power.
On this basis it seems that S-FSK, with its lack of complexity, greater commercial viability,
and reliable track record in the field, is destined to see greater first-phase PLC deployment than
the alternative modulation options. In this project FSK is used in transmitter side.
Therefore, at the receiver, we have to recover the FSK signal to digital signal, that means the
frequency should be converted back to voltage. We use phase locked loop (PLL) as FSK demodulator.
PLL is a kind of automatic tracking system, which is able to detect the input signal frequency and
phase. PLL is widely used in wireless applications, such as AM demodulator, FM demodulator,
frequency selector and so on. In the digital communications, various types of digital PLLs are
developed. Digital PLL is very useful in carrier synchronization, bit synchronization and digital
demodulation. In figure, when the input signal frequency changes, the output signal of the phase
detector will change and so as well as the output voltage. We can use this characteristic to design the
FSK demodulator. Let the FSK signal frequencies as f1 and f2, then these signals are inputted to the
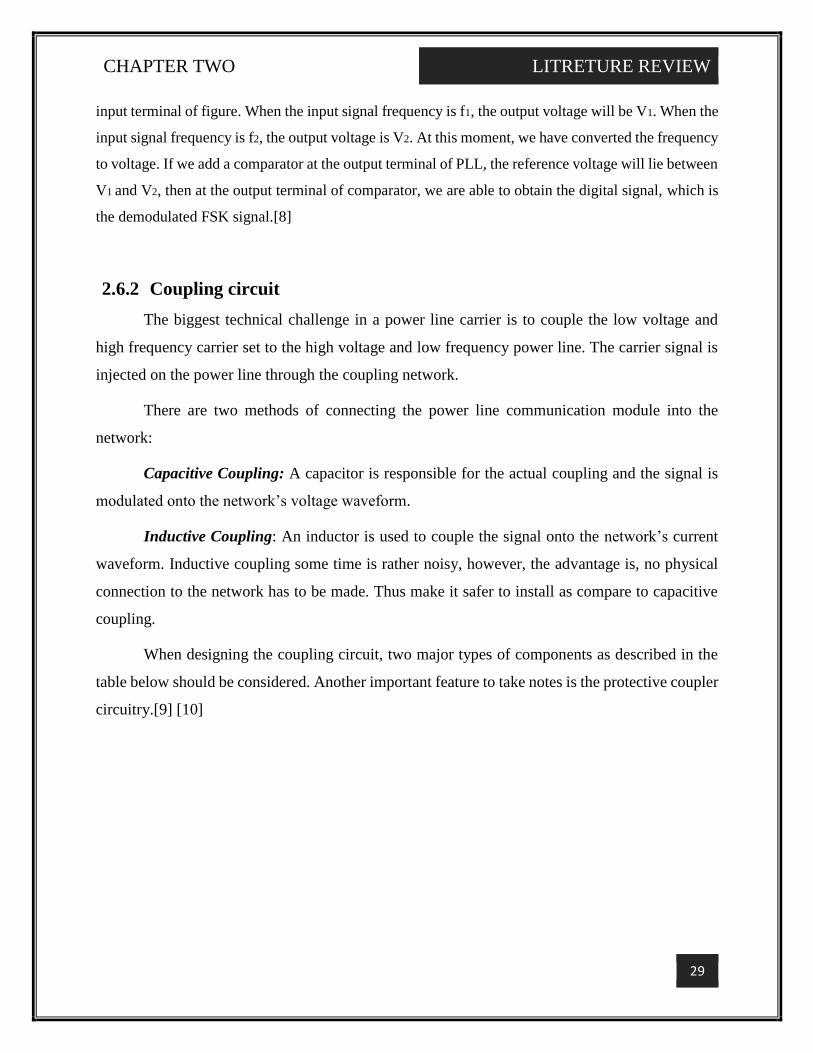
CHAPTER TWO LITRETURE REVIEW
29
input terminal of figure. When the input signal frequency is f1, the output voltage will be V1. When the
input signal frequency is f2, the output voltage is V2. At this moment, we have converted the frequency
to voltage. If we add a comparator at the output terminal of PLL, the reference voltage will lie between
V1 and V2, then at the output terminal of comparator, we are able to obtain the digital signal, which is
the demodulated FSK signal.[8]
2.6.2 Coupling circuit
The biggest technical challenge in a power line carrier is to couple the low voltage and
high frequency carrier set to the high voltage and low frequency power line. The carrier signal is
injected on the power line through the coupling network.
There are two methods of connecting the power line communication module into the
network:
Capacitive Coupling: A capacitor is responsible for the actual coupling and the signal is
modulated onto the network’s voltage waveform.
Inductive Coupling: An inductor is used to couple the signal onto the network’s current
waveform. Inductive coupling some time is rather noisy, however, the advantage is, no physical
connection to the network has to be made. Thus make it safer to install as compare to capacitive
coupling.
When designing the coupling circuit, two major types of components as described in the
table below should be considered. Another important feature to take notes is the protective coupler
circuitry.[9] [10]
CHAPTER THREE METHODOLOGY AND DESIGN
30
3 CHAPTER THREE:
METHODOLOGY AND DESIGN
This chapter present design and development process to come up with our plc final system.
3.1 Design goals
We aimed to design a system that transmit digital data from the sender to the receiver using
power lines as communication channel. The transmission system has to convert the information data
in a suitable form before it is injected in the communication channel. There are several multiplex and
modulation schemes which are investigated to be applied in the PLC transmission systems. The
frequency of the carrier signal should be much higher than the frequency of the 220 V signal
(50Hz) to avoid the interference between these two signals. PLC circuit must be insulated from
power line, which is very important for human health and for the operation of the circuit. For this
purpose, a coupling circuit must be designed to inject the modulated signal into the power line and
block the AC mains signal preventing it from reaching the input of modem communication system.
On the other side, the modulated signal must be extracted from the power line using the
coupling circuit. The receiver must recover the digital data from the modulated signal through
applying one of the demodulation techniques.
Transceiver system must include filters to avoid the noise and attenuation caused by using
power lines as communication channel.
3.2 System components
3.2.1 PLC Transmitter
Our transmitter consists of a chip that modulate the digital signal using FSK modulation
technique. Generating FSK signal can be done by different types of chips after investigation and
number of experiments (555 timer, multiplexer, XR-2200, LM566) LM566 VCO was used .
transmitter. Also contains filters and amplifiers to amplify the small modulated signal that
produced by the chip.
CHAPTER THREE METHODOLOGY AND DESIGN
31
3.2.2 PLC receiver
The circuit consist of many filters to block the noise and amplifiers to amplify the
modulated signal after propagating through the power line.
3.2.3 Coupling circuit
We use a simple coupling circuit. That consist of a coupling capacitor and transformer.
3.2.4 Decoupling circuit
It is the same as the coupling circuit but at the receiver.
3.2.5 Power lines
The communication channel that we used to transmit the data.
Figure 3.1: Blocks of system components
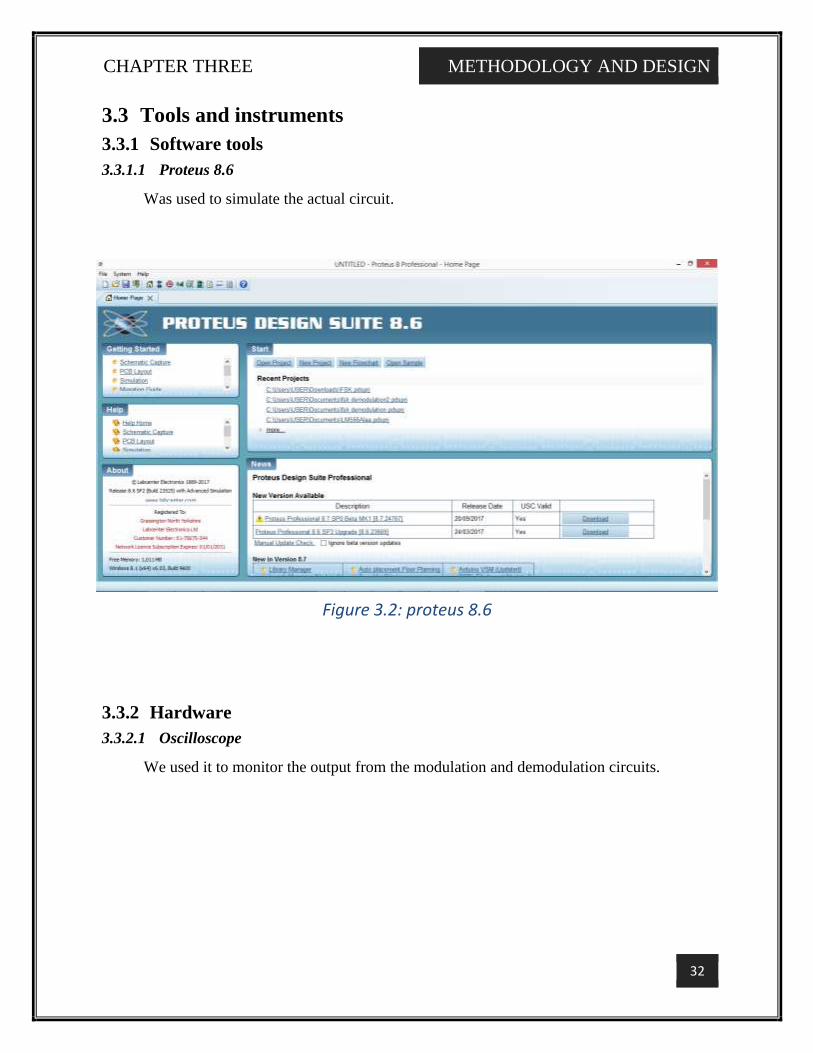
CHAPTER THREE METHODOLOGY AND DESIGN
32
3.3 Tools and instruments
3.3.1 Software tools
3.3.1.1 Proteus 8.6
Was used to simulate the actual circuit.
3.3.2 Hardware
3.3.2.1 Oscilloscope
We used it to monitor the output from the modulation and demodulation circuits.
Figure 3.2: proteus 8.6
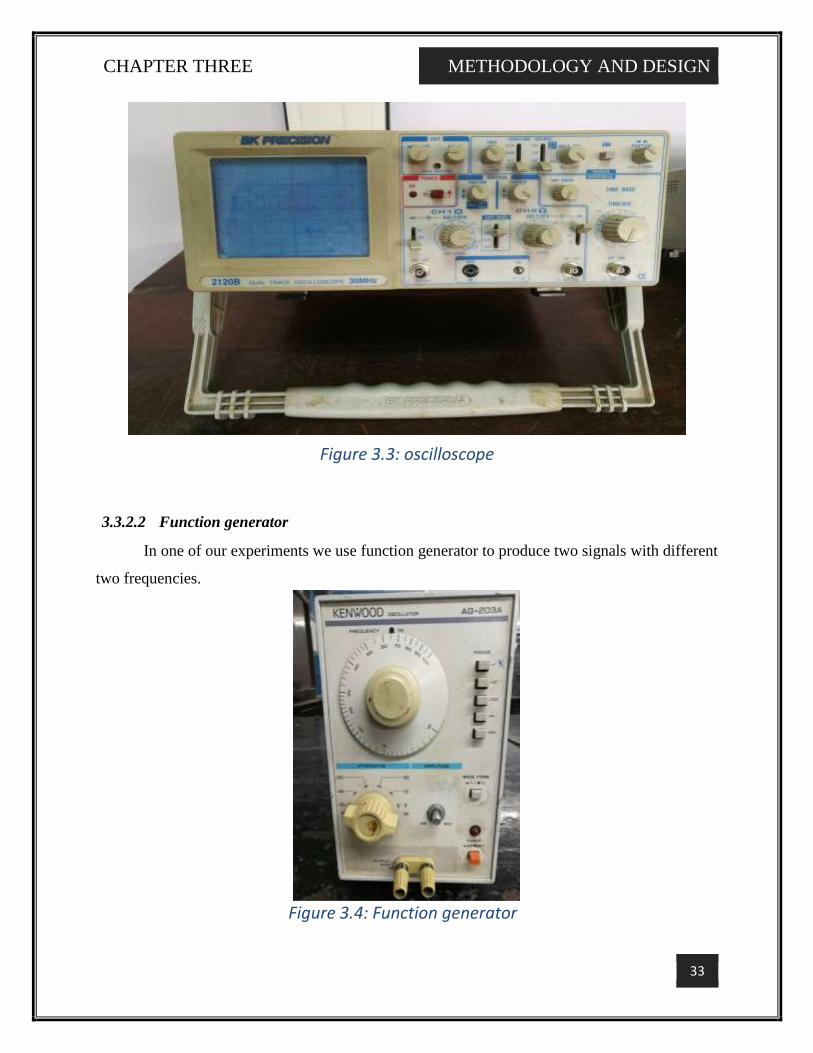
CHAPTER THREE METHODOLOGY AND DESIGN
33
3.3.2.2 Function generator
In one of our experiments we use function generator to produce two signals with different
two frequencies.
Figure 3.3: oscilloscope
Figure 3.4: Function generator
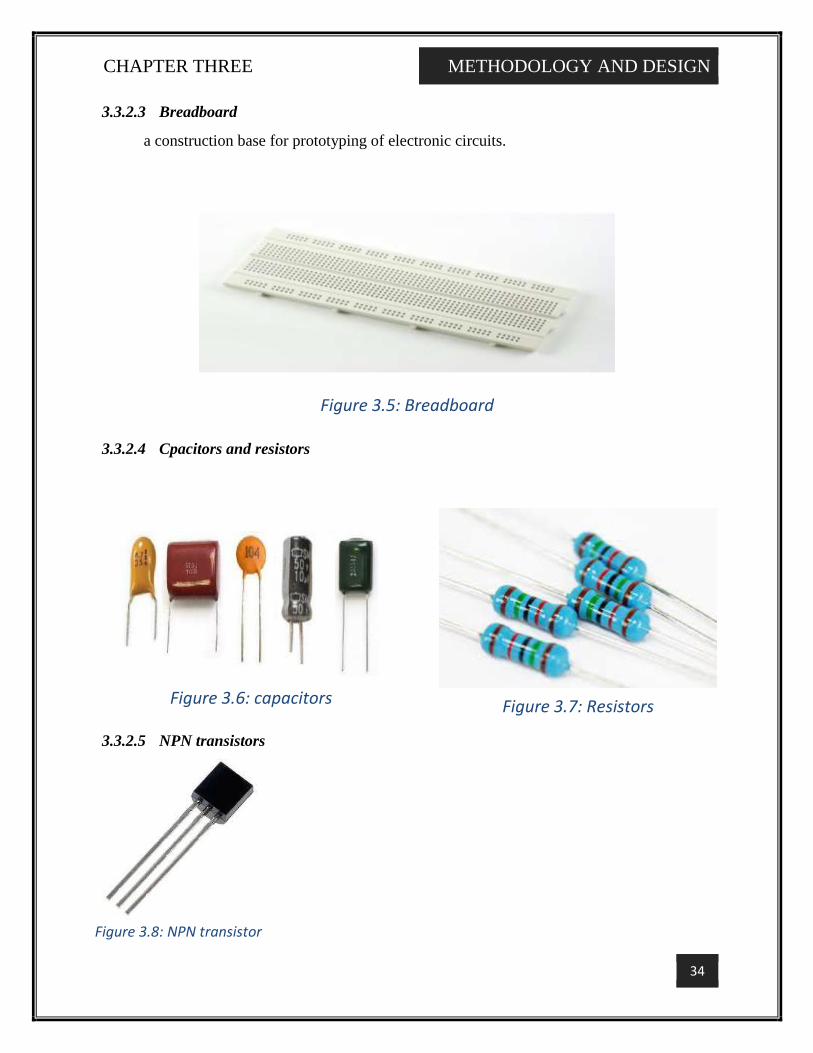
CHAPTER THREE METHODOLOGY AND DESIGN
34
3.3.2.3 Breadboard
a construction base for prototyping of electronic circuits.
3.3.2.4 Cpacitors and resistors
3.3.2.5 NPN transistors
Figure 3.5: Breadboard
Figure 3.6: capacitors Figure 3.7: Resistors
Figure 3.8: NPN transistor
CHAPTER THREE METHODOLOGY AND DESIGN
35
3.3.2.6 Opamps
3.3.2.7 VCO (lm566)
Voltage controlled oscillator used to modulate the digital data using FSK modulation technique.
3.3.2.8 PLL
3.3.2.9 Timer 555
3.4 System design steps
3.4.1 Step one: Generation of FSK signal
Signal has to be modulated before transmission, and one of the methods is the frequency-
shift keying (FSK) modulation. FSK technique is to modulate the data signal to two different
frequencies to achieve effective transmission. At the receiver, the data signal will be recovered
based on the two different frequencies of the received signal.
Figure 3.10 shows the relationship between the FSK signal and the data signal.
Figure 3.9: VCO LM566
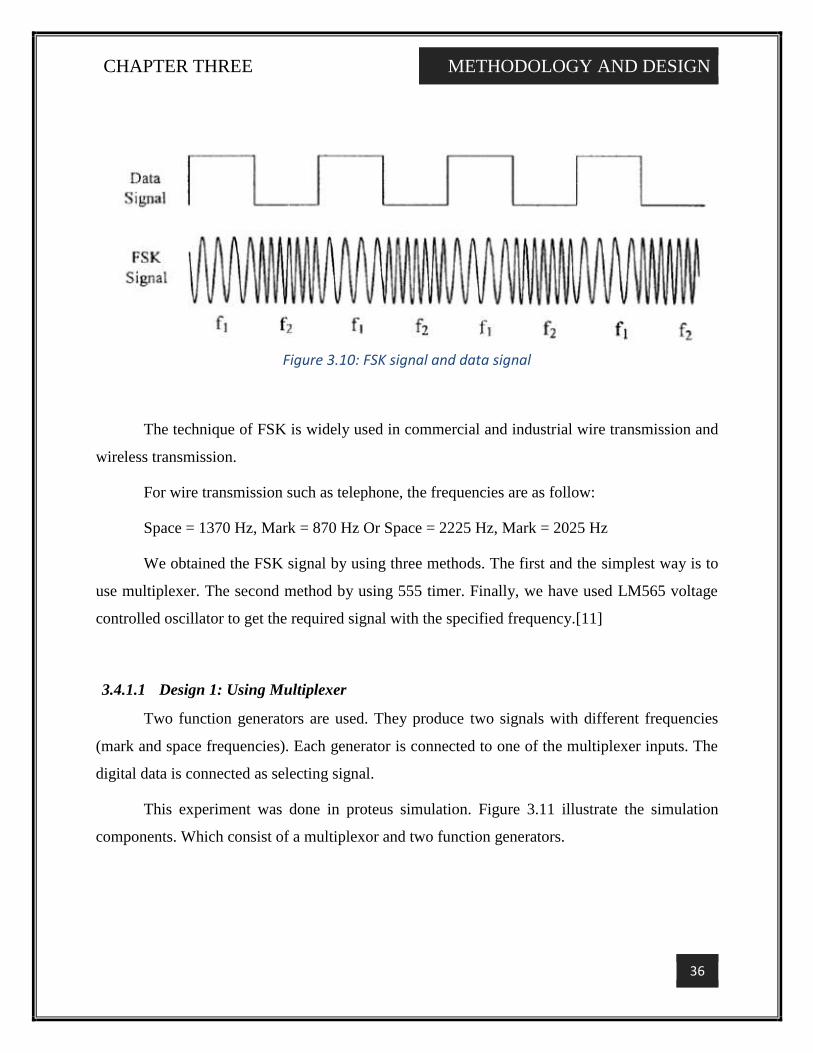
CHAPTER THREE METHODOLOGY AND DESIGN
36
The technique of FSK is widely used in commercial and industrial wire transmission and
wireless transmission.
For wire transmission such as telephone, the frequencies are as follow:
Space = 1370 Hz, Mark = 870 Hz Or Space = 2225 Hz, Mark = 2025 Hz
We obtained the FSK signal by using three methods. The first and the simplest way is to
use multiplexer. The second method by using 555 timer. Finally, we have used LM565 voltage
controlled oscillator to get the required signal with the specified frequency.[11]
3.4.1.1 Design 1: Using Multiplexer
Two function generators are used. They produce two signals with different frequencies
(mark and space frequencies). Each generator is connected to one of the multiplexer inputs. The
digital data is connected as selecting signal.
This experiment was done in proteus simulation. Figure 3.11 illustrate the simulation
components. Which consist of a multiplexor and two function generators.
Figure 3.10: FSK signal and data signal
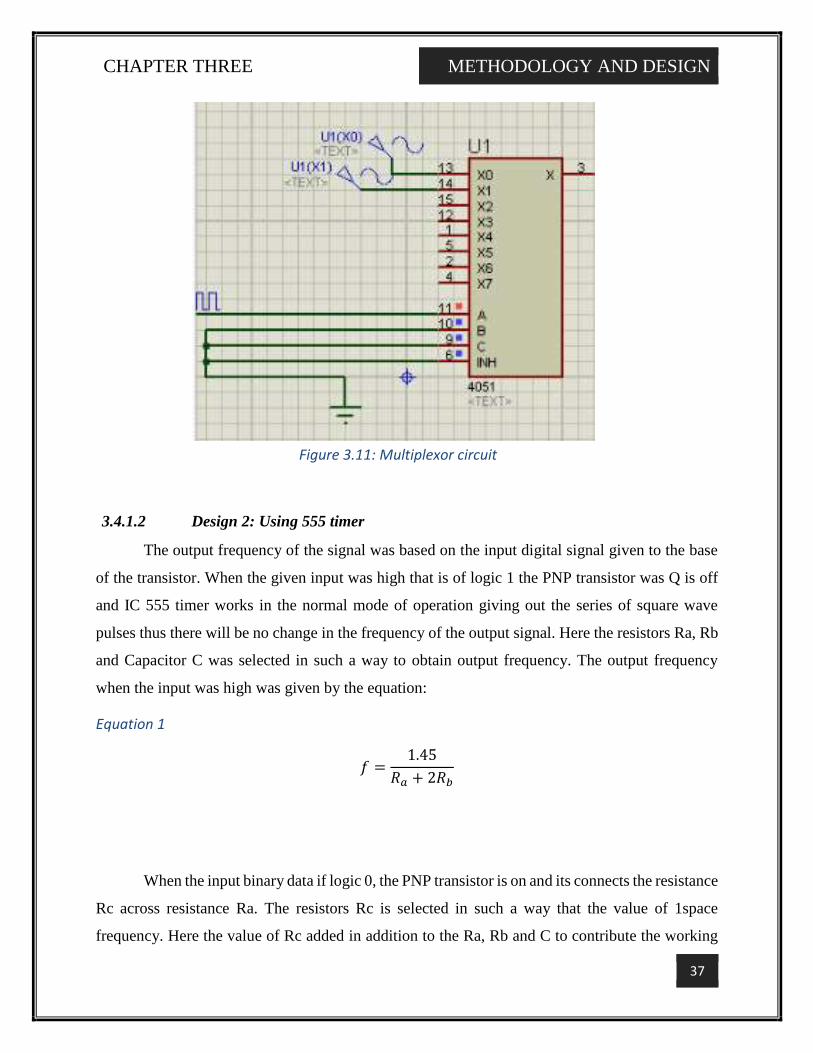
CHAPTER THREE METHODOLOGY AND DESIGN
37
3.4.1.2 Design 2: Using 555 timer
The output frequency of the signal was based on the input digital signal given to the base
of the transistor. When the given input was high that is of logic 1 the PNP transistor was Q is off
and IC 555 timer works in the normal mode of operation giving out the series of square wave
pulses thus there will be no change in the frequency of the output signal. Here the resistors Ra, Rb
and Capacitor C was selected in such a way to obtain output frequency. The output frequency
when the input was high was given by the equation:
Equation 1
𝑓 =1.45
𝑅𝑎 + 2𝑅𝑏
When the input binary data if logic 0, the PNP transistor is on and its connects the resistance
Rc across resistance Ra. The resistors Rc is selected in such a way that the value of 1space
frequency. Here the value of Rc added in addition to the Ra, Rb and C to contribute the working
Figure 3.11: Multiplexor circuit
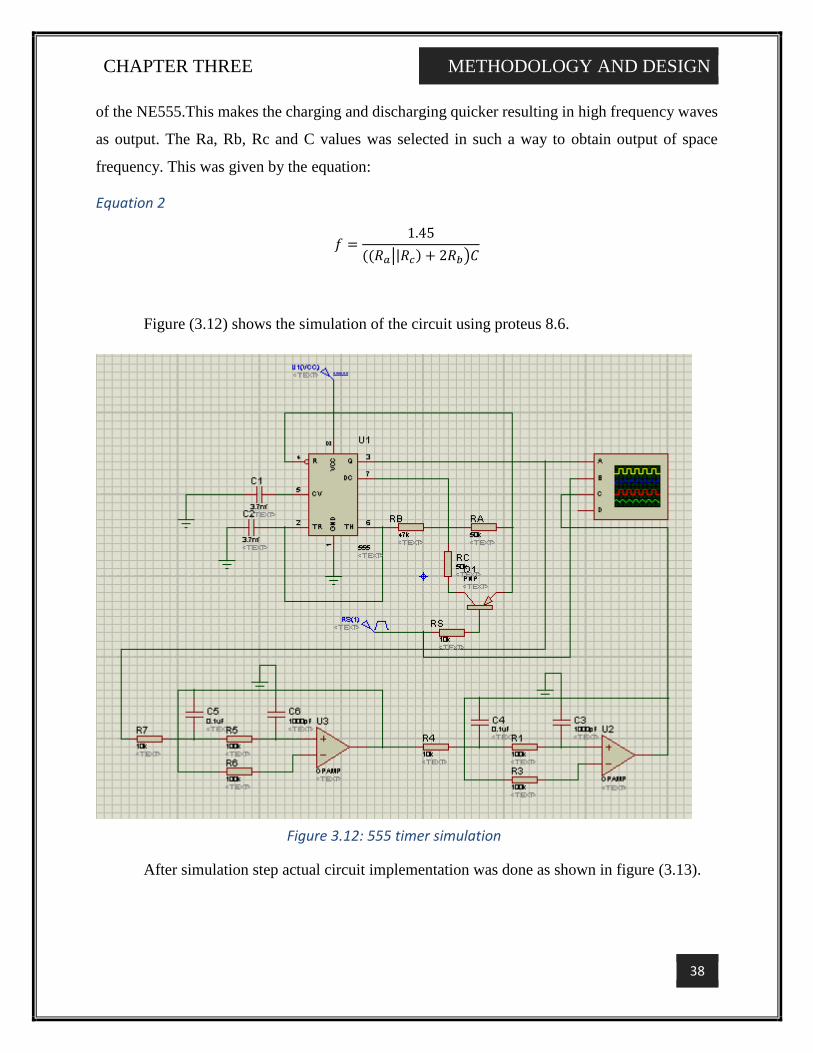
CHAPTER THREE METHODOLOGY AND DESIGN
38
of the NE555.This makes the charging and discharging quicker resulting in high frequency waves
as output. The Ra, Rb, Rc and C values was selected in such a way to obtain output of space
frequency. This was given by the equation:
Equation 2
𝑓 =1.45
((𝑅𝑎||𝑅𝑐) + 2𝑅𝑏)𝐶
Figure (3.12) shows the simulation of the circuit using proteus 8.6.
After simulation step actual circuit implementation was done as shown in figure (3.13).
Figure 3.12: 555 timer simulation
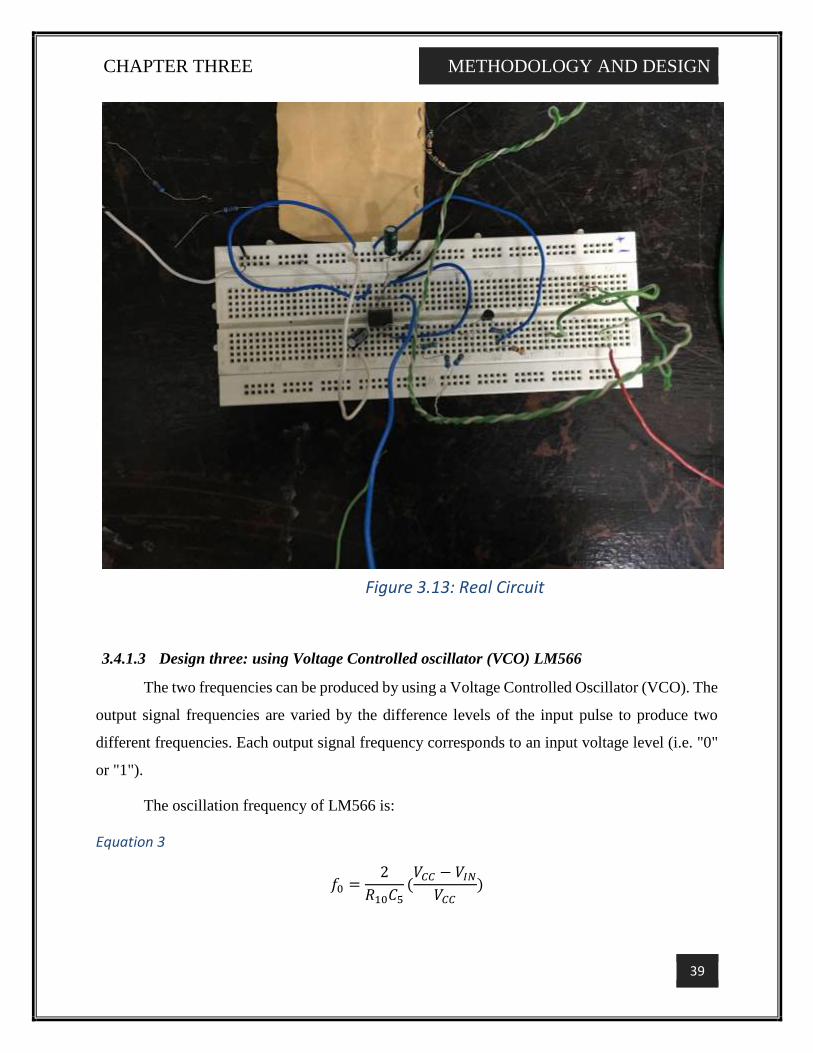
CHAPTER THREE METHODOLOGY AND DESIGN
39
3.4.1.3 Design three: using Voltage Controlled oscillator (VCO) LM566
The two frequencies can be produced by using a Voltage Controlled Oscillator (VCO). The
output signal frequencies are varied by the difference levels of the input pulse to produce two
different frequencies. Each output signal frequency corresponds to an input voltage level (i.e. "0"
or "1").
The oscillation frequency of LM566 is:
Equation 3
𝑓0 =2
𝑅10𝐶5(𝑉𝐶𝐶 − 𝑉𝐼𝑁
𝑉𝐶𝐶)
Figure 3.13: Real Circuit
CHAPTER THREE METHODOLOGY AND DESIGN
40
Where Vcc is the power supply voltage input at pin 8 of LM566. Vin is the input voltage
of LM566 at pin 5.
The simulation for our circuit is illustrated at figure (3.14). First we have to convert the
voltage level of data signal to appropriate voltage level that will be the LM566 input. According
to the input voltage level the VCO will produce the frequency.
In this circuit, Q2 will operate as NOT gate. When the input signal of the base of Q2 is
high, then Q2 will switch on. At this moment, the output signal of the collector will be low (around
0.2 V), so Q1 will switch off. When input signal of the base of Q2 is low (0 V), Q2 will switch
off. At this moment, the output signal of the collector of Q2 is high (5 V), so, Q1 will switch on.
When Q1 switch off, the input voltage of VCO is:
Equation 4
𝑉1 = (𝑅2
𝑅2 − 𝑅3)𝑉𝐶𝐶
The VCO output signal frequency is f1. When Q1 switch on, the input voltage of VCO is
(Assume the resistance of Q1 is only a few ohm)
Equation 5
𝑉2 = (𝑅1//𝑅2
(𝑅1//𝑅2) + 𝑅3)𝑉𝐶𝐶
At this moment, the output signal frequency of VCO is f2. So, we just need to adjust R1
and R2, then the output signal frequencies of VCO will become f1 and f2 which are 1370 Hz and
870 Hz, respectively. In figure (3.14), the two amplifier, R1, R4, R5, R6, R8, R10, C1, C3, C5 and
C6 comprise a 4th order low-pass filter. The objective is to remove the unwanted signal from the
LM566 VCO output (TP2), so that we can obtain the sinusoidal waveform signal.[11]
Figure (3.14) shows the simulation of the modulation circuit using LM566 FSK generator.
Figure (3.15) shows the actual circuit implementation.
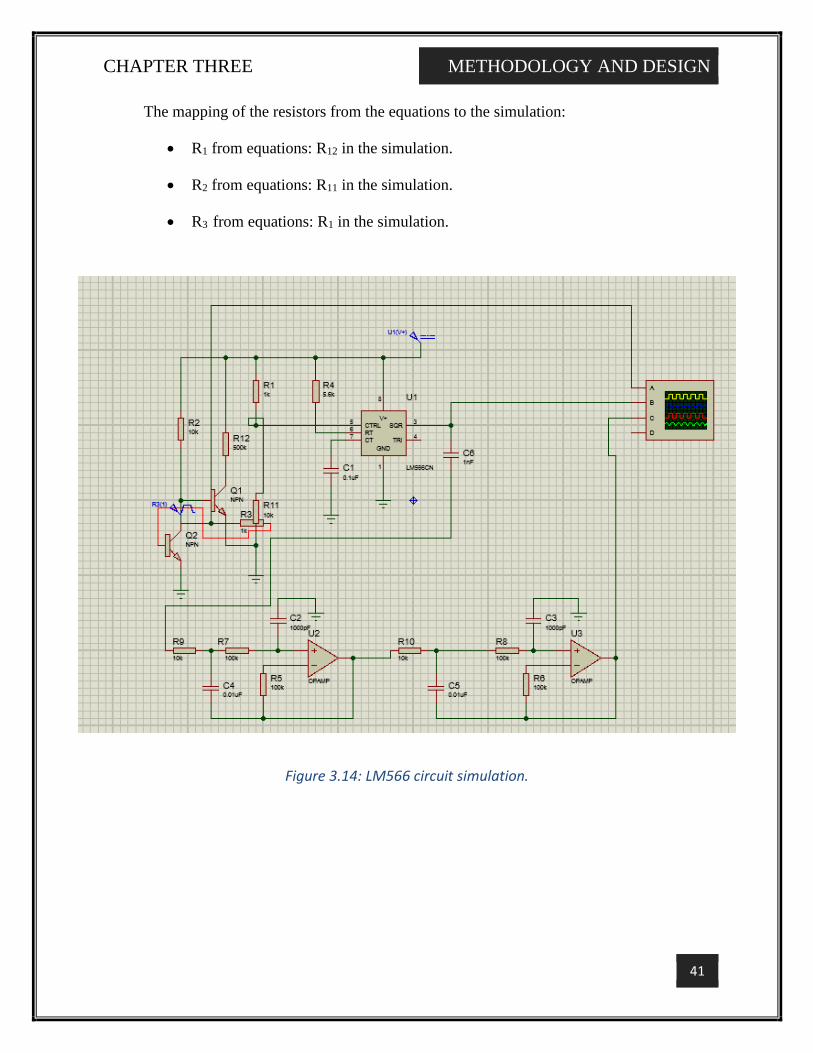
CHAPTER THREE METHODOLOGY AND DESIGN
41
The mapping of the resistors from the equations to the simulation:
R1 from equations: R12 in the simulation.
R2 from equations: R11 in the simulation.
R3 from equations: R1 in the simulation.
Figure 3.14: LM566 circuit simulation.
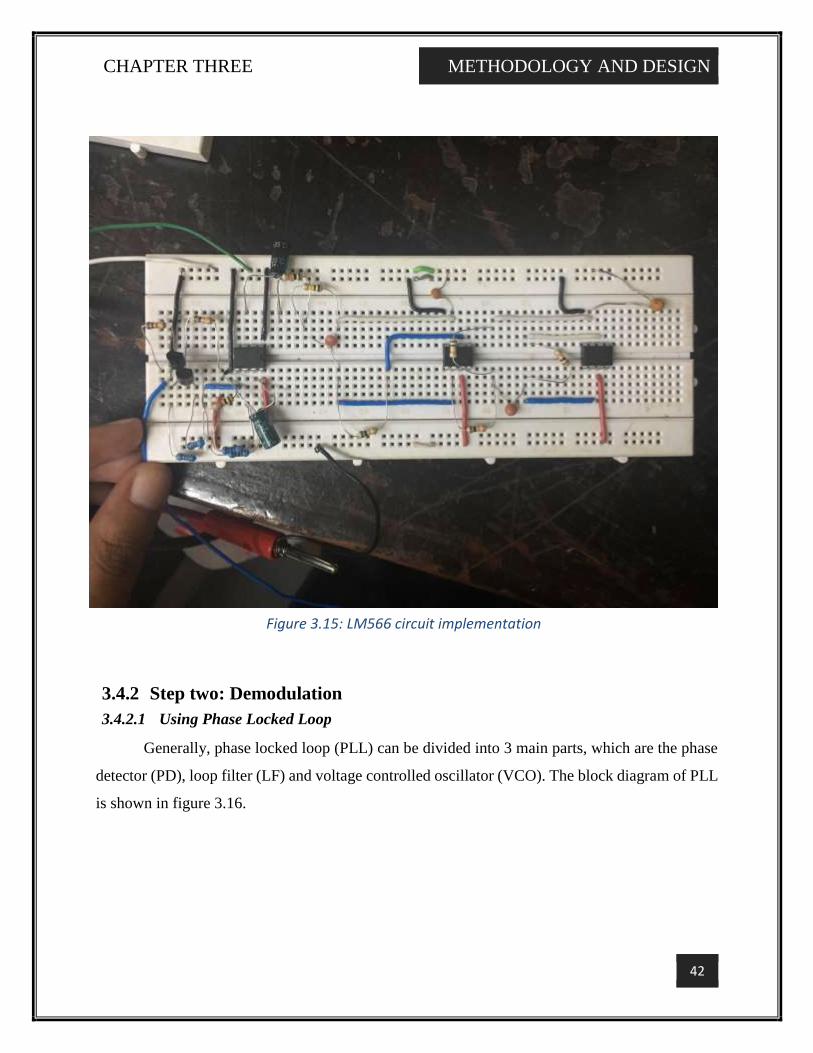
CHAPTER THREE METHODOLOGY AND DESIGN
42
3.4.2 Step two: Demodulation
3.4.2.1 Using Phase Locked Loop
Generally, phase locked loop (PLL) can be divided into 3 main parts, which are the phase
detector (PD), loop filter (LF) and voltage controlled oscillator (VCO). The block diagram of PLL
is shown in figure 3.16.
Figure 3.15: LM566 circuit implementation
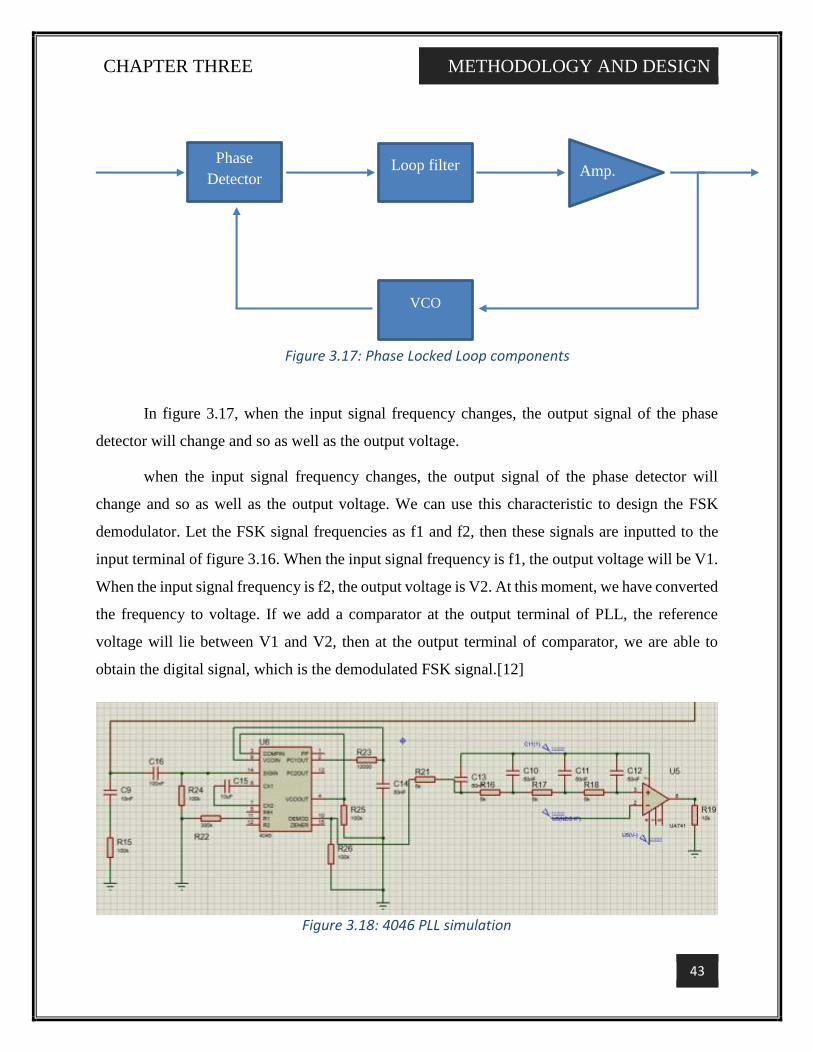
CHAPTER THREE METHODOLOGY AND DESIGN
43
In figure 3.17, when the input signal frequency changes, the output signal of the phase
detector will change and so as well as the output voltage.
when the input signal frequency changes, the output signal of the phase detector will
change and so as well as the output voltage. We can use this characteristic to design the FSK
demodulator. Let the FSK signal frequencies as f1 and f2, then these signals are inputted to the
input terminal of figure 3.16. When the input signal frequency is f1, the output voltage will be V1.
When the input signal frequency is f2, the output voltage is V2. At this moment, we have converted
the frequency to voltage. If we add a comparator at the output terminal of PLL, the reference
voltage will lie between V1 and V2, then at the output terminal of comparator, we are able to
obtain the digital signal, which is the demodulated FSK signal.[12]
Phase
Detector
VCO
Loop filter Amp.
Figure 3.17: Phase Locked Loop components
Figure 3.18: 4046 PLL simulation
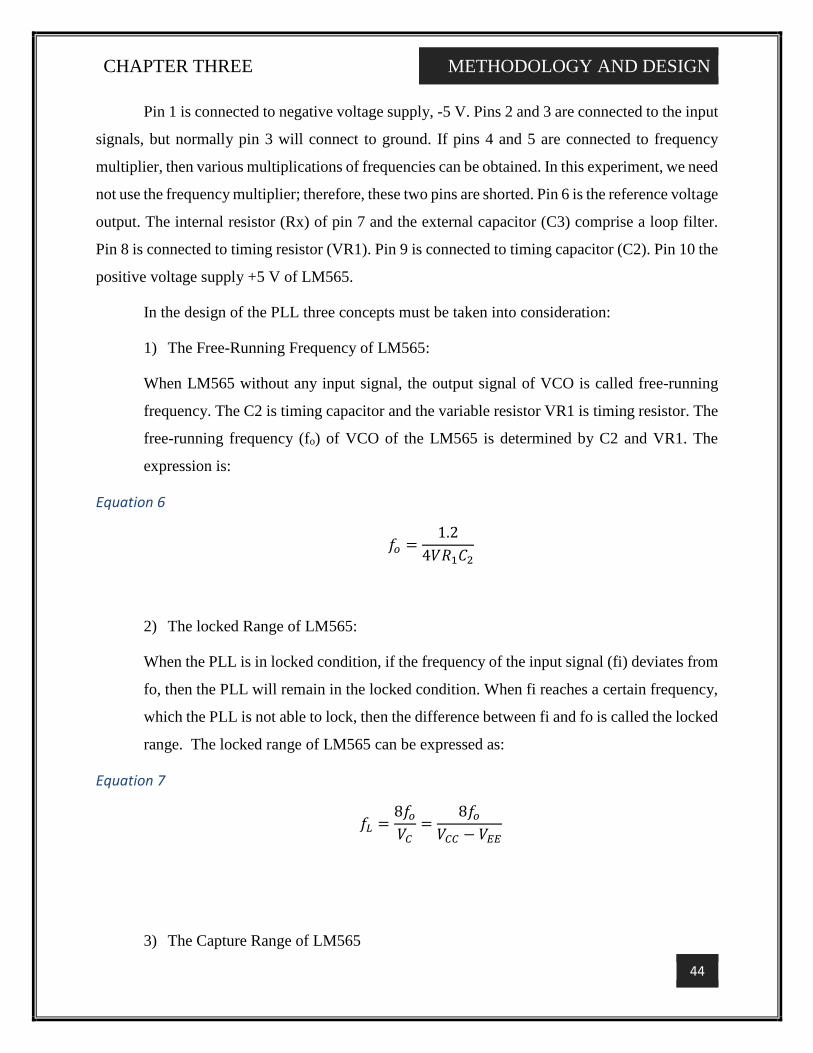
CHAPTER THREE METHODOLOGY AND DESIGN
44
Pin 1 is connected to negative voltage supply, -5 V. Pins 2 and 3 are connected to the input
signals, but normally pin 3 will connect to ground. If pins 4 and 5 are connected to frequency
multiplier, then various multiplications of frequencies can be obtained. In this experiment, we need
not use the frequency multiplier; therefore, these two pins are shorted. Pin 6 is the reference voltage
output. The internal resistor (Rx) of pin 7 and the external capacitor (C3) comprise a loop filter.
Pin 8 is connected to timing resistor (VR1). Pin 9 is connected to timing capacitor (C2). Pin 10 the
positive voltage supply +5 V of LM565.
In the design of the PLL three concepts must be taken into consideration:
1) The Free-Running Frequency of LM565:
When LM565 without any input signal, the output signal of VCO is called free-running
frequency. The C2 is timing capacitor and the variable resistor VR1 is timing resistor. The
free-running frequency (fo) of VCO of the LM565 is determined by C2 and VR1. The
expression is:
Equation 6
𝑓𝑜 =1.2
4𝑉𝑅1𝐶2
2) The locked Range of LM565:
When the PLL is in locked condition, if the frequency of the input signal (fi) deviates from
fo, then the PLL will remain in the locked condition. When fi reaches a certain frequency,
which the PLL is not able to lock, then the difference between fi and fo is called the locked
range. The locked range of LM565 can be expressed as:
Equation 7
𝑓𝐿 =8𝑓𝑜
𝑉𝐶=
8𝑓𝑜
𝑉𝐶𝐶 − 𝑉𝐸𝐸
3) The Capture Range of LM565
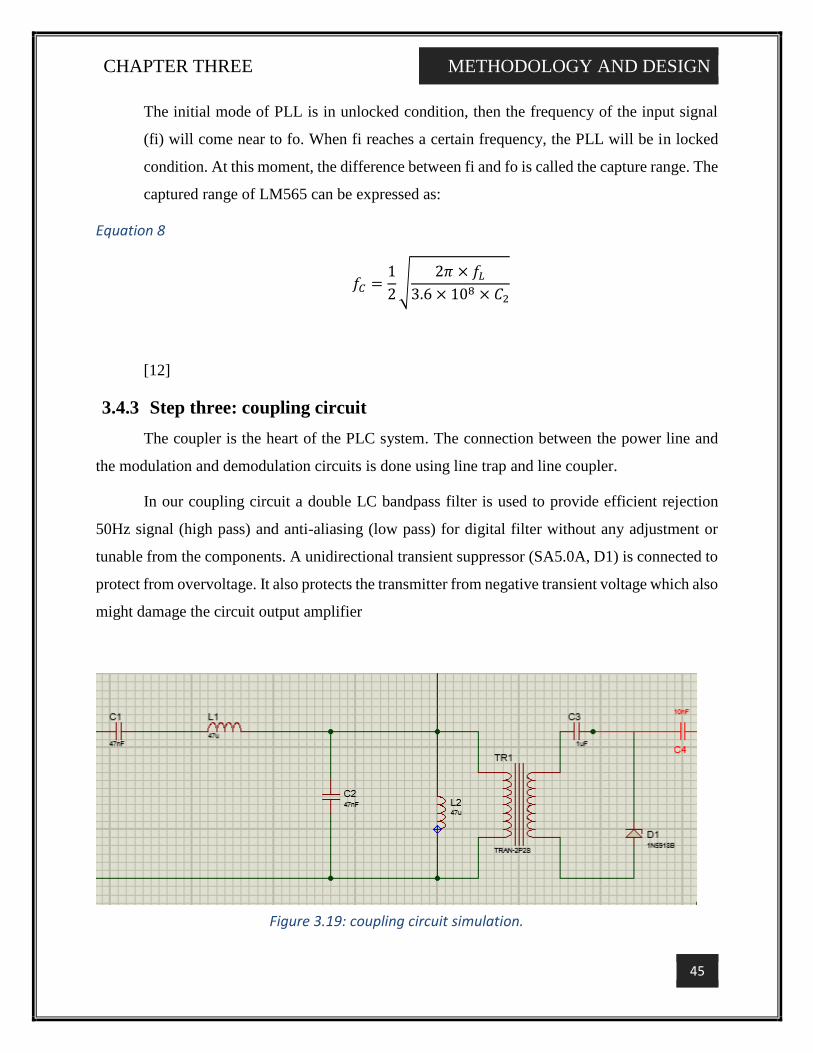
CHAPTER THREE METHODOLOGY AND DESIGN
45
The initial mode of PLL is in unlocked condition, then the frequency of the input signal
(fi) will come near to fo. When fi reaches a certain frequency, the PLL will be in locked
condition. At this moment, the difference between fi and fo is called the capture range. The
captured range of LM565 can be expressed as:
Equation 8
𝑓𝐶 =1
2√
2𝜋 × 𝑓𝐿
3.6 × 10⁸ × 𝐶2
[12]
3.4.3 Step three: coupling circuit
The coupler is the heart of the PLC system. The connection between the power line and
the modulation and demodulation circuits is done using line trap and line coupler.
In our coupling circuit a double LC bandpass filter is used to provide efficient rejection
50Hz signal (high pass) and anti-aliasing (low pass) for digital filter without any adjustment or
tunable from the components. A unidirectional transient suppressor (SA5.0A, D1) is connected to
protect from overvoltage. It also protects the transmitter from negative transient voltage which also
might damage the circuit output amplifier
Figure 3.19: coupling circuit simulation.
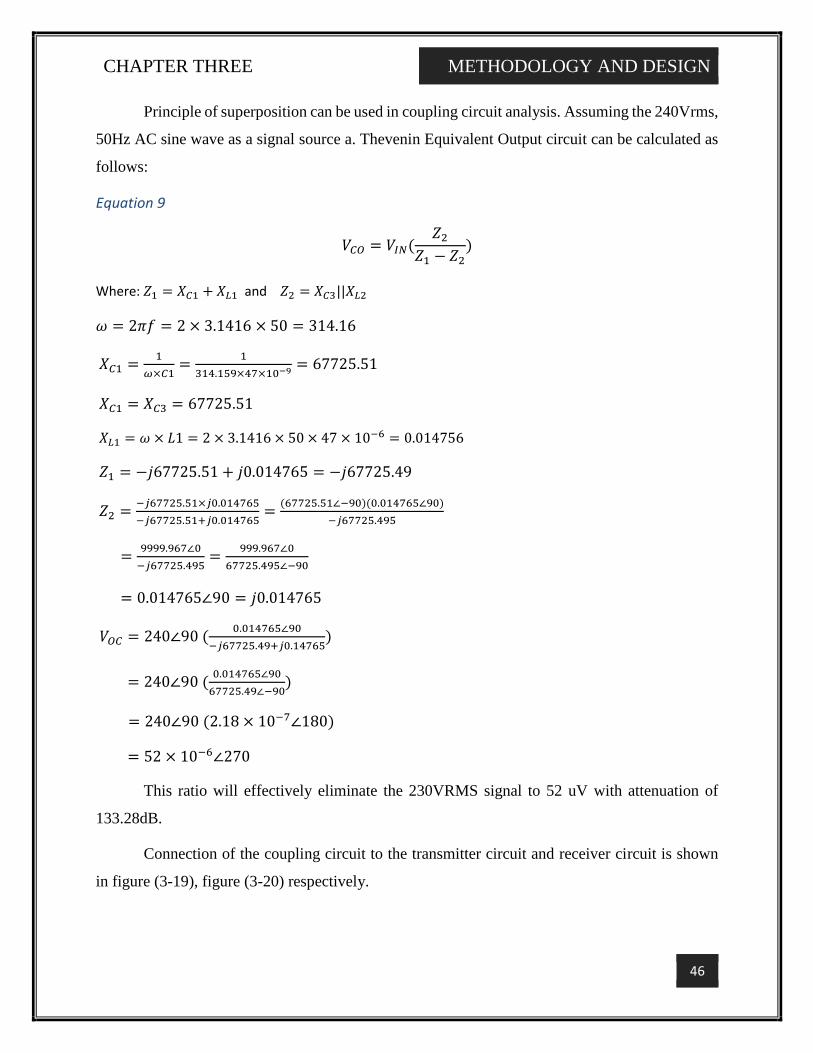
CHAPTER THREE METHODOLOGY AND DESIGN
46
Principle of superposition can be used in coupling circuit analysis. Assuming the 240Vrms,
50Hz AC sine wave as a signal source a. Thevenin Equivalent Output circuit can be calculated as
follows:
Equation 9
𝑉𝐶𝑂 = 𝑉𝐼𝑁(𝑍2
𝑍1 − 𝑍2)
Where: 𝑍1 = 𝑋𝐶1 + 𝑋𝐿1 and 𝑍2 = 𝑋𝐶3||𝑋𝐿2
𝜔 = 2𝜋𝑓 = 2 × 3.1416 × 50 = 314.16
𝑋𝐶1 =1
𝜔×𝐶1=
1
314.159×47×10−9 = 67725.51
𝑋𝐶1 = 𝑋𝐶3 = 67725.51
𝑋𝐿1 = 𝜔 × 𝐿1 = 2 × 3.1416 × 50 × 47 × 10−6 = 0.014756
𝑍1 = −𝑗67725.51 + 𝑗0.014765 = −𝑗67725.49
𝑍2 =−𝑗67725.51×𝑗0.014765
−𝑗67725.51+𝑗0.014765=
(67725.51∠−90)(0.014765∠90)
−𝑗67725.495
=9999.967∠0
−𝑗67725.495=
999.967∠0
67725.495∠−90
= 0.014765∠90 = 𝑗0.014765
𝑉𝑂𝐶 = 240∠90 (0.014765∠90
−𝑗67725.49+𝑗0.14765)
= 240∠90 (0.014765∠90
67725.49∠−90)
= 240∠90 (2.18 × 10⁻⁷∠180)
= 52 × 10−6∠270
This ratio will effectively eliminate the 230VRMS signal to 52 uV with attenuation of
133.28dB.
Connection of the coupling circuit to the transmitter circuit and receiver circuit is shown
in figure (3-19), figure (3-20) respectively.
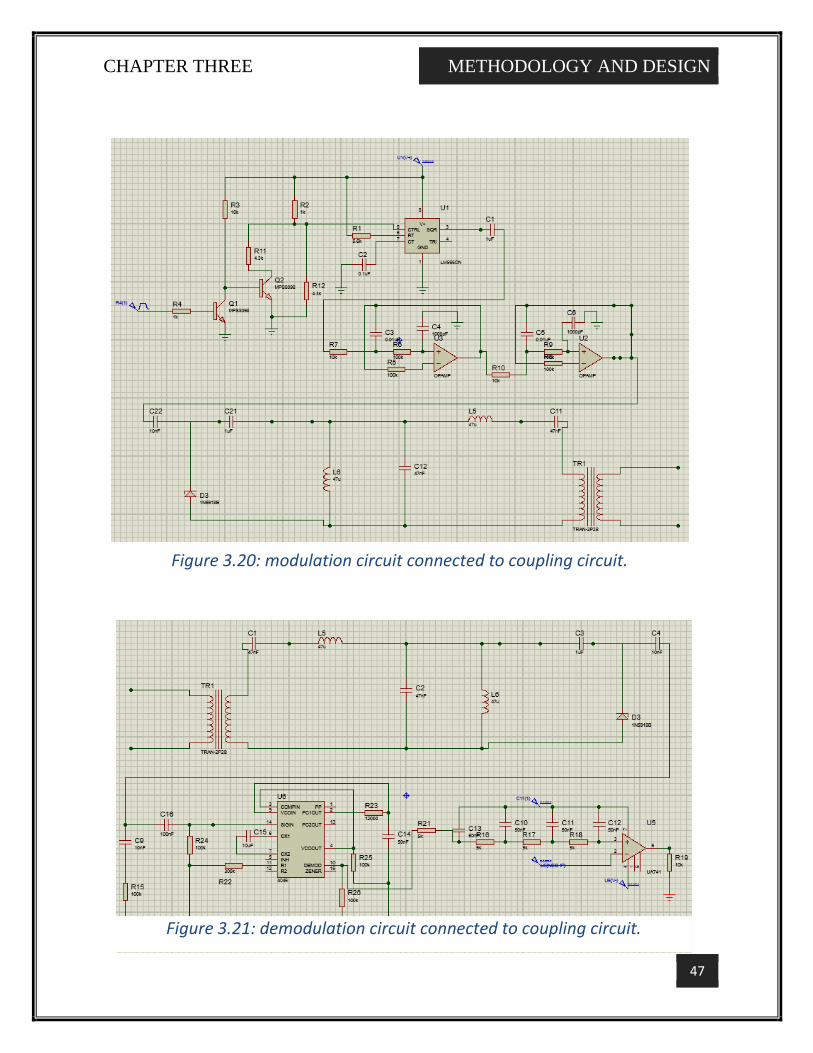
CHAPTER THREE METHODOLOGY AND DESIGN
47
Figure 3.20: modulation circuit connected to coupling circuit.
Figure 3.21: demodulation circuit connected to coupling circuit.
CHAPTER FOUR RESULT AND DISCUSSION
48
4 CHAPTER FOUR:
RESULT AND DISCUSSION
4.1 Overview
This chapter is continuity to the methodology and design chapter, which describes the
implementation steps, testing, measuring and results.
Some calculations are made to obtain the required values of the components in the
modulation, demodulation, filters and coupling circuits.
Results are displayed in form of tables and figures.
4.2 Calculations
4.2.1 FSK modulation
4.2.1.1 For timer circuit
Using equations (1) and (2) to obtain the required frequencies:
Mark frequency=870
𝑓 =1.45
𝑅𝑎 + 2𝑅𝑏
𝑅𝑎 = 52𝑘
𝑅𝑏 = 58𝑘
Space frequency=1370
𝑓 =1.45
((𝑅𝑎||𝑅𝑐) + 2𝑅𝑏)𝐶
𝑅𝑐 = 50𝑘
𝐶 = 10𝑛𝑓
Figures (4.1) and figure (4.2) show the last 555 circuit components values and the
simulation result.
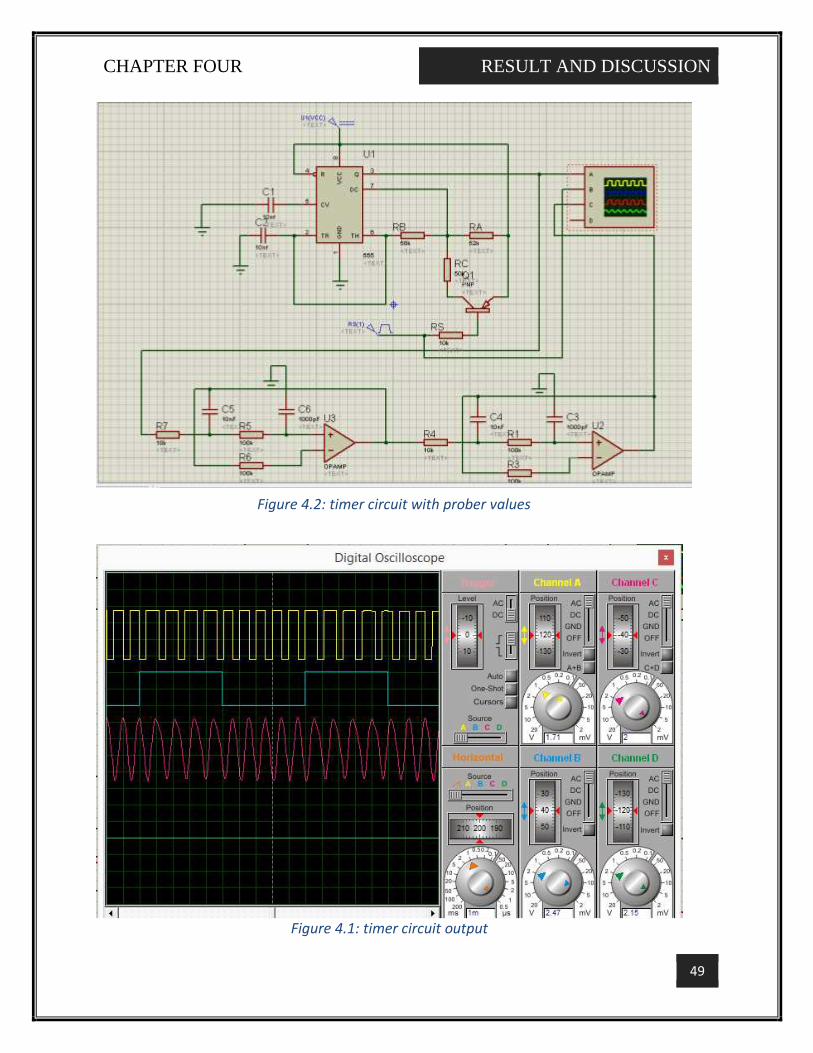
CHAPTER FOUR RESULT AND DISCUSSION
49
Figure 4.2: timer circuit with prober values
Figure 4.1: timer circuit output
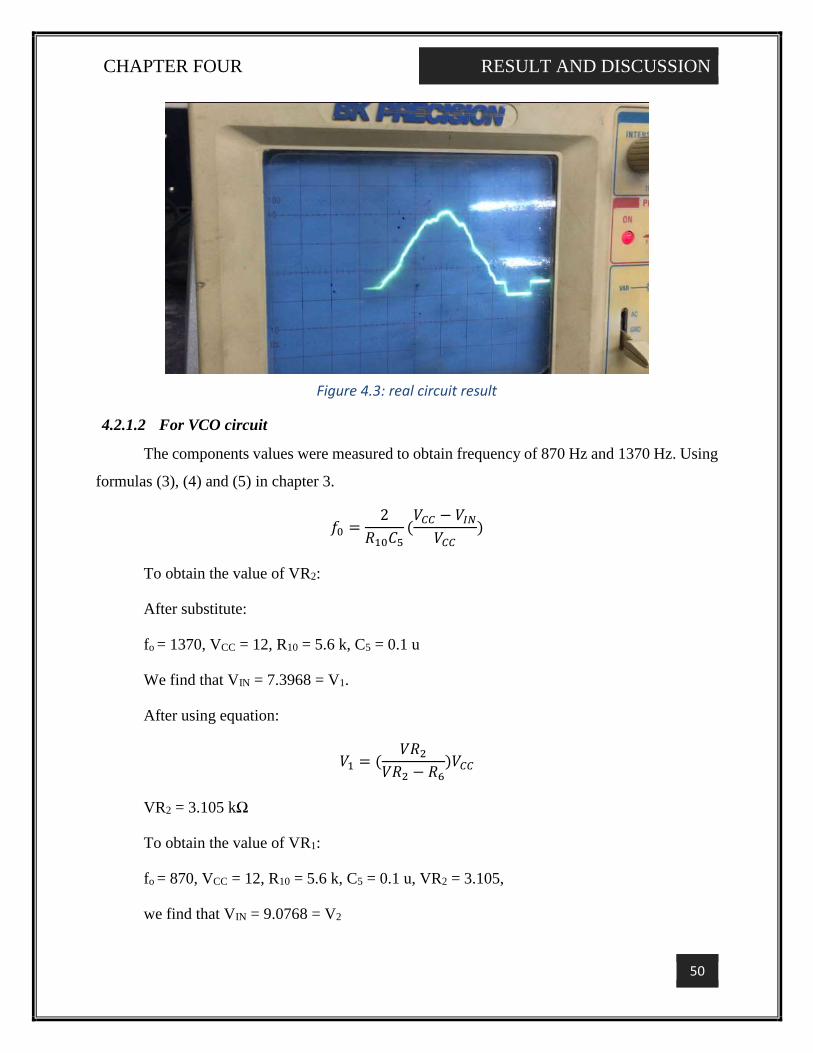
CHAPTER FOUR RESULT AND DISCUSSION
50
4.2.1.2 For VCO circuit
The components values were measured to obtain frequency of 870 Hz and 1370 Hz. Using
formulas (3), (4) and (5) in chapter 3.
𝑓0 =2
𝑅10𝐶5(𝑉𝐶𝐶 − 𝑉𝐼𝑁
𝑉𝐶𝐶)
To obtain the value of VR2:
After substitute:
fo = 1370, VCC = 12, R10 = 5.6 k, C5 = 0.1 u
We find that VIN = 7.3968 = V1.
After using equation:
𝑉1 = (𝑉𝑅2
𝑉𝑅2 − 𝑅6)𝑉𝐶𝐶
VR2 = 3.105 kΩ
To obtain the value of VR1:
fo = 870, VCC = 12, R10 = 5.6 k, C5 = 0.1 u, VR2 = 3.105,
we find that VIN = 9.0768 = V2
Figure 4.3: real circuit result
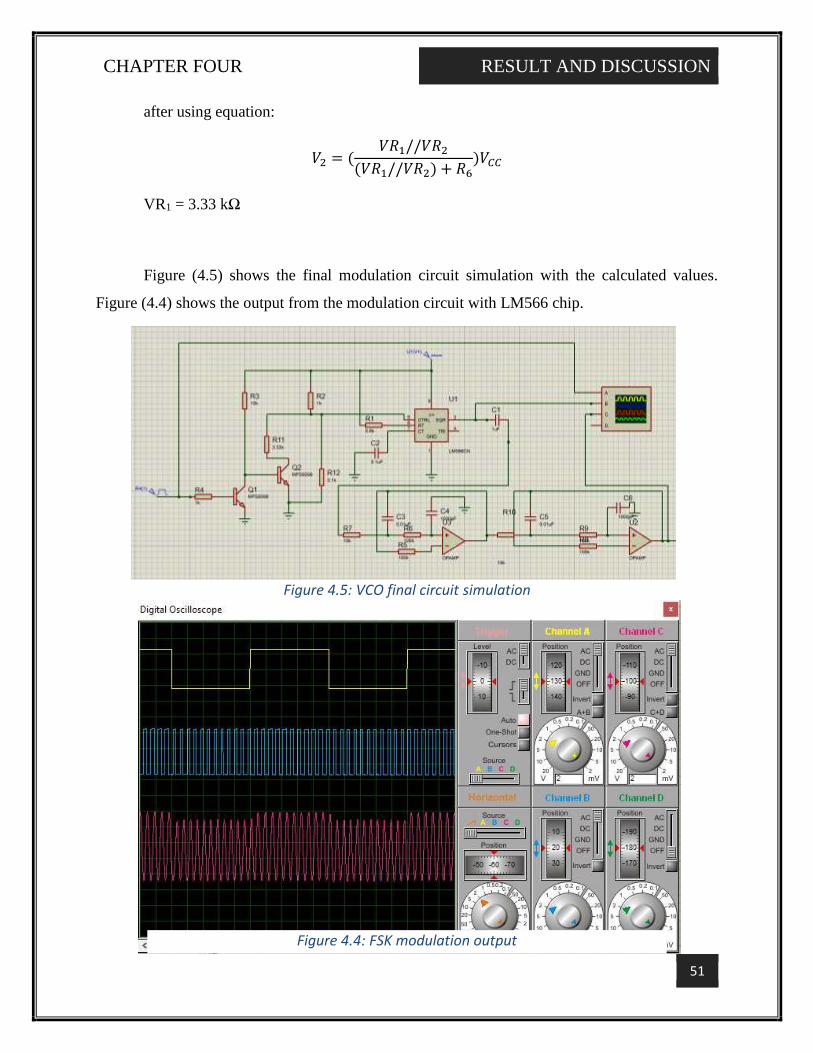
CHAPTER FOUR RESULT AND DISCUSSION
51
after using equation:
𝑉2 = (𝑉𝑅1//𝑉𝑅2
(𝑉𝑅1//𝑉𝑅2) + 𝑅6)𝑉𝐶𝐶
VR1 = 3.33 kΩ
Figure (4.5) shows the final modulation circuit simulation with the calculated values.
Figure (4.4) shows the output from the modulation circuit with LM566 chip.
Figure 4.5: VCO final circuit simulation
Figure 4.4: FSK modulation output
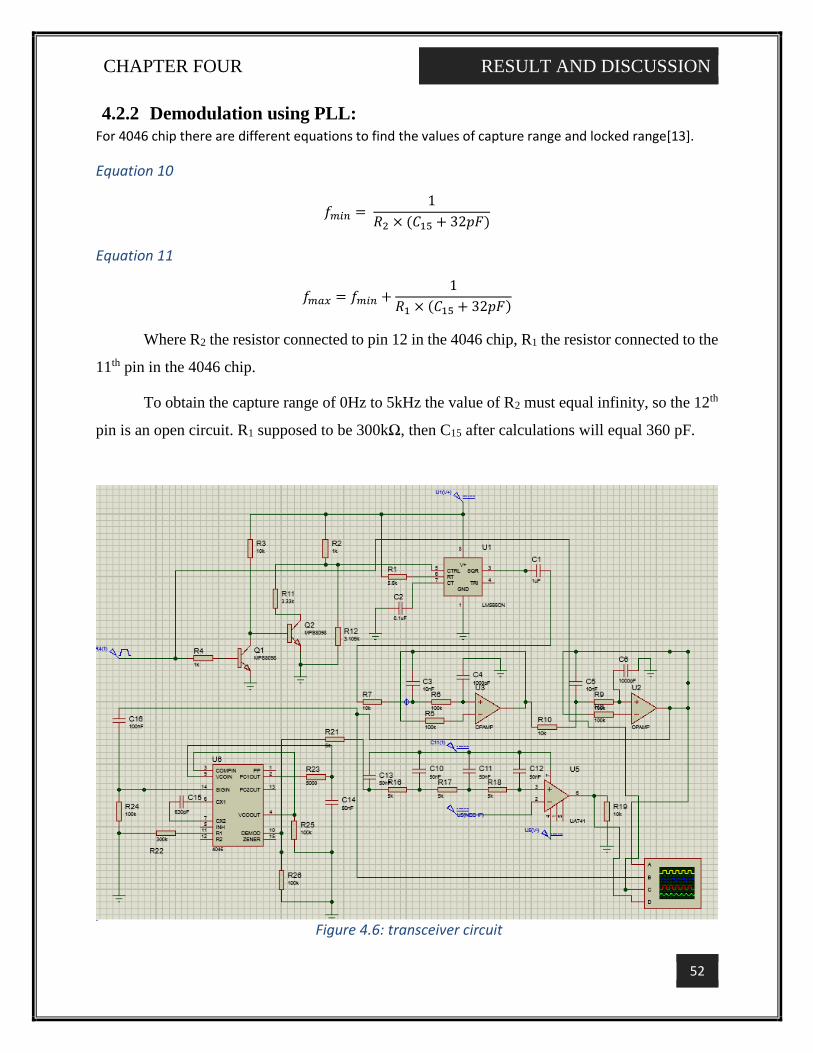
CHAPTER FOUR RESULT AND DISCUSSION
52
4.2.2 Demodulation using PLL:
For 4046 chip there are different equations to find the values of capture range and locked range[13].
Equation 10
𝑓𝑚𝑖𝑛 = 1
𝑅2 × (𝐶15 + 32𝑝𝐹)
Equation 11
𝑓𝑚𝑎𝑥 = 𝑓𝑚𝑖𝑛 +1
𝑅1 × (𝐶15 + 32𝑝𝐹)
Where R2 the resistor connected to pin 12 in the 4046 chip, R1 the resistor connected to the
11th pin in the 4046 chip.
To obtain the capture range of 0Hz to 5kHz the value of R2 must equal infinity, so the 12th
pin is an open circuit. R1 supposed to be 300kΩ, then C15 after calculations will equal 360 pF.
Figure 4.6: transceiver circuit
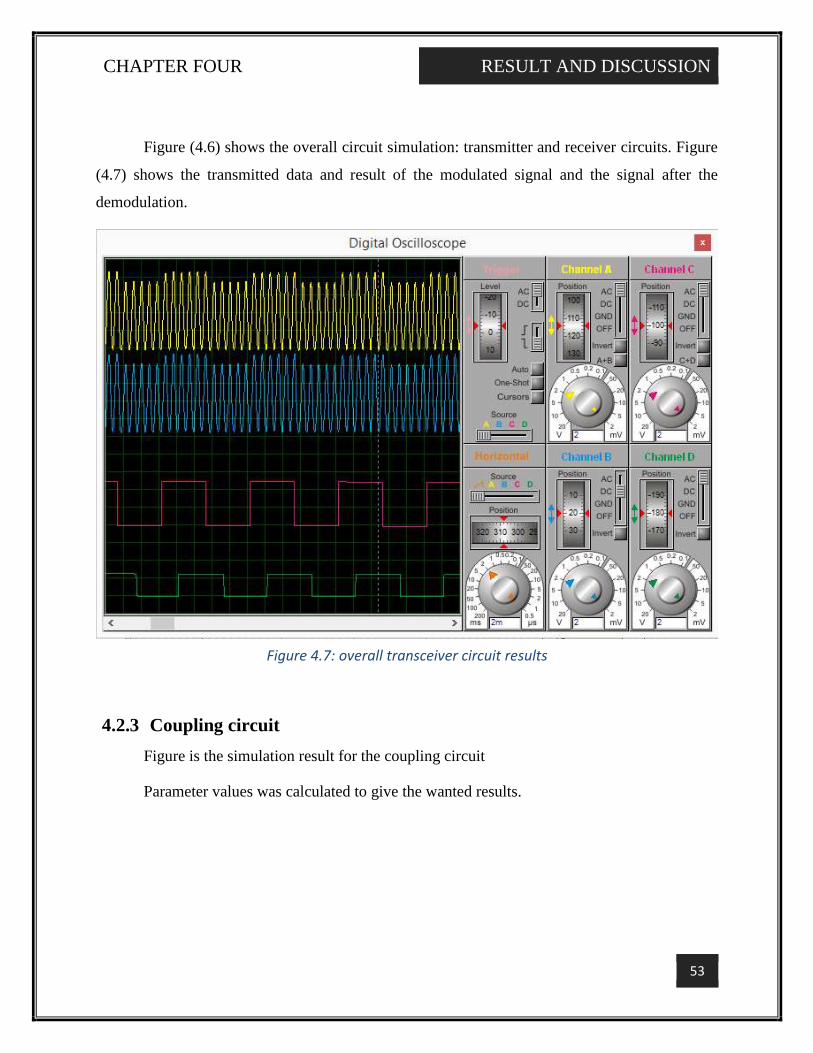
CHAPTER FOUR RESULT AND DISCUSSION
53
Figure (4.6) shows the overall circuit simulation: transmitter and receiver circuits. Figure
(4.7) shows the transmitted data and result of the modulated signal and the signal after the
demodulation.
4.2.3 Coupling circuit
Figure is the simulation result for the coupling circuit
Parameter values was calculated to give the wanted results.
Figure 4.7: overall transceiver circuit results
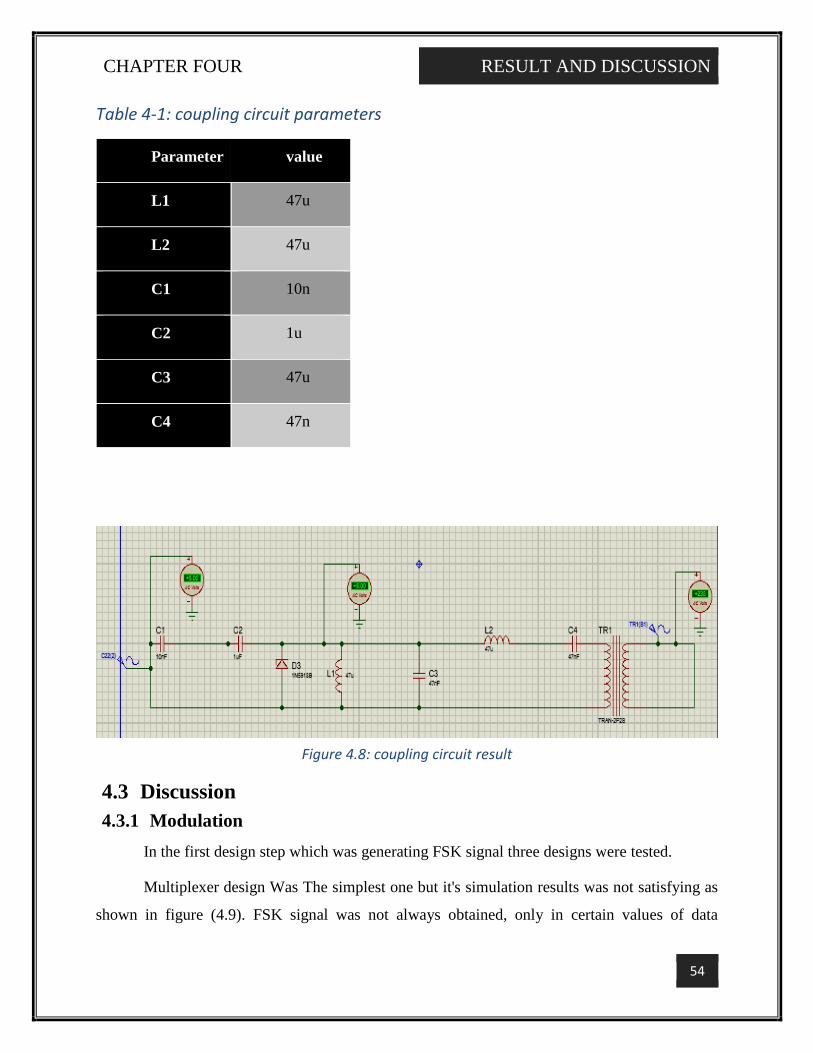
CHAPTER FOUR RESULT AND DISCUSSION
54
Table 4-1: coupling circuit parameters
Parameter value
L1 47u
L2 47u
C1 10n
C2 1u
C3 47u
C4 47n
4.3 Discussion
4.3.1 Modulation
In the first design step which was generating FSK signal three designs were tested.
Multiplexer design Was The simplest one but it's simulation results was not satisfying as
shown in figure (4.9). FSK signal was not always obtained, only in certain values of data
Figure 4.8: coupling circuit result
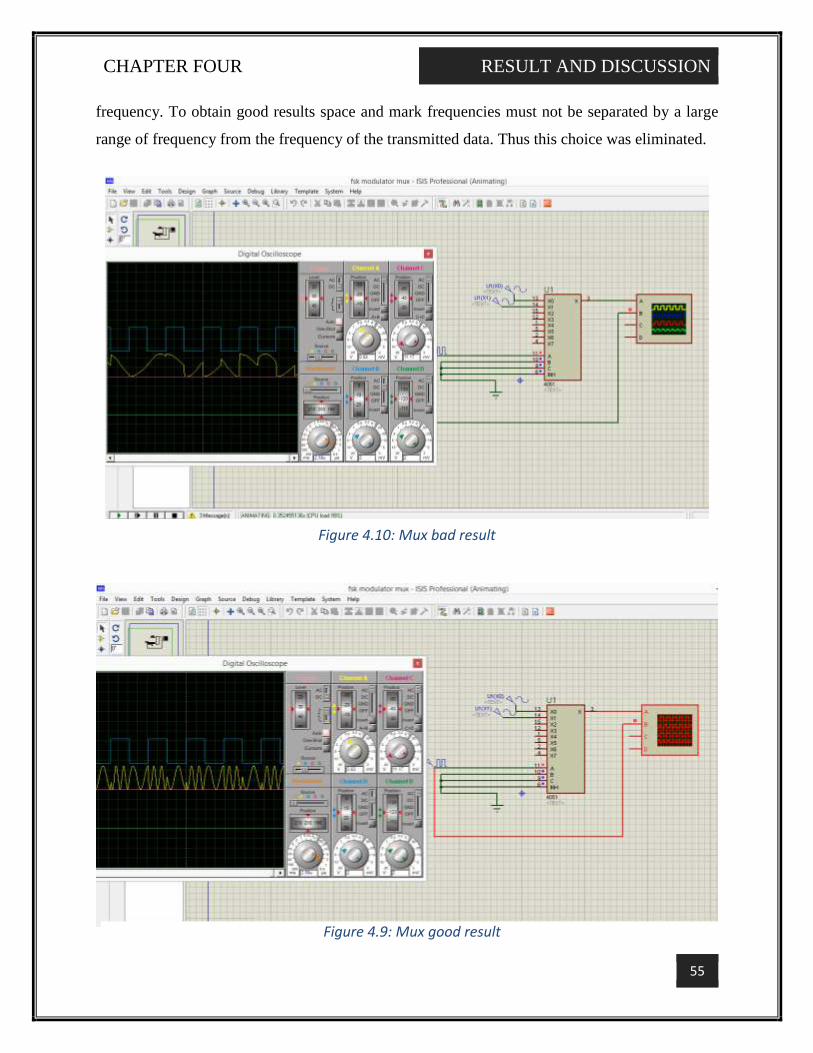
CHAPTER FOUR RESULT AND DISCUSSION
55
frequency. To obtain good results space and mark frequencies must not be separated by a large
range of frequency from the frequency of the transmitted data. Thus this choice was eliminated.
Figure 4.10: Mux bad result
Figure 4.9: Mux good result
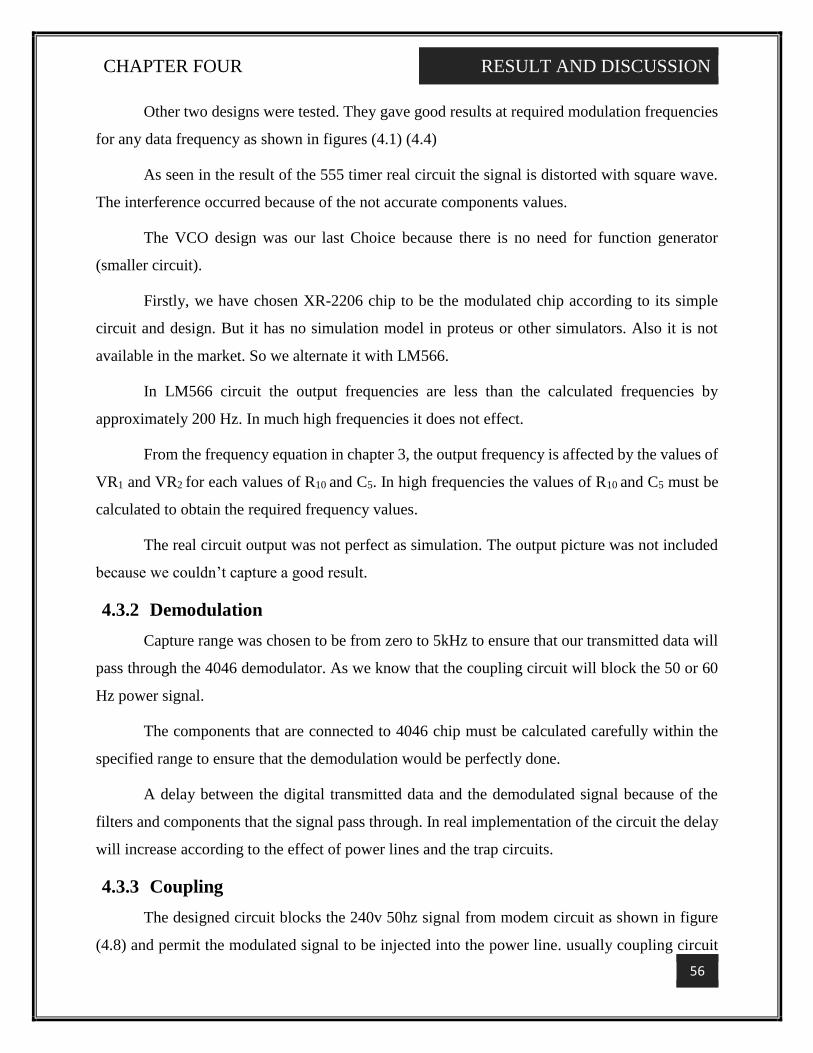
CHAPTER FOUR RESULT AND DISCUSSION
56
Other two designs were tested. They gave good results at required modulation frequencies
for any data frequency as shown in figures (4.1) (4.4)
As seen in the result of the 555 timer real circuit the signal is distorted with square wave.
The interference occurred because of the not accurate components values.
The VCO design was our last Choice because there is no need for function generator
(smaller circuit).
Firstly, we have chosen XR-2206 chip to be the modulated chip according to its simple
circuit and design. But it has no simulation model in proteus or other simulators. Also it is not
available in the market. So we alternate it with LM566.
In LM566 circuit the output frequencies are less than the calculated frequencies by
approximately 200 Hz. In much high frequencies it does not effect.
From the frequency equation in chapter 3, the output frequency is affected by the values of
VR1 and VR2 for each values of R10 and C5. In high frequencies the values of R10 and C5 must be
calculated to obtain the required frequency values.
The real circuit output was not perfect as simulation. The output picture was not included
because we couldn’t capture a good result.
4.3.2 Demodulation
Capture range was chosen to be from zero to 5kHz to ensure that our transmitted data will
pass through the 4046 demodulator. As we know that the coupling circuit will block the 50 or 60
Hz power signal.
The components that are connected to 4046 chip must be calculated carefully within the
specified range to ensure that the demodulation would be perfectly done.
A delay between the digital transmitted data and the demodulated signal because of the
filters and components that the signal pass through. In real implementation of the circuit the delay
will increase according to the effect of power lines and the trap circuits.
4.3.3 Coupling
The designed circuit blocks the 240v 50hz signal from modem circuit as shown in figure
(4.8) and permit the modulated signal to be injected into the power line. usually coupling circuit

CHAPTER FOUR RESULT AND DISCUSSION
57
is more complicated here we used the simplest circuit that can protect our circuit and make the
propagation of the signal through power line possible.
CHAPTER FIVE CONCLUSION AND RECOMMINDATIONS
58
5 CHAPTER FIVE:
CONCLUSION AND RECOMINDATIONS
5.1 Conclusion
According to the high noise in the power lines, recovery of a transmitted data is difficult.
So many circuits should be designed to ensure successful data transmission and reception between
two nodes. In this project the transmitter and receiver circuits were successfully designed. The
implementation of the transmitter was done by using three testes in different three circuits using
different three chips. Lastly the perfect transmitter and receiver circuits design are implemented
by using LM566 chip and 4046 chip respectively.
In this project FSK modulation technique was used because it’s simple and easy to
implement. The representation of logic 0 and logic 1 with two different frequencies makes the
recovery of the digital data even if one of the frequencies have been attenuated.
A coupling circuit with filters and isolation transformer was designed and tested in the
simulator to ensure full protection to the transceiver circuit from the high voltage by blocking the
50Hz electricity signal.
This project cost less because of the availability of equipments and there is no need to
establish a new network since it is already existing for electrical power distribution purpose. This
makes the electrical network has the ability of data transmission and receiving in addition to the
main distribution function.
5.2 Problems and solutions
For modulation circuit, XR-2206 chip has been chosen to be the FSK modulation
chip. But I didn’t found it so another circuit with LM566 chip was designed.
The first demodulation design was by using NE565 chip. I found that there is no
model for it in the simulator, so I substitute it with 4046 chip.
Power line communication has no universal standards or technology.

CHAPTER FIVE CONCLUSION AND RECOMMINDATIONS
59
The full system that consist of the transceiver, coupling circuits and the power lines
could not be simulated. There is no one simulation can manipulate all these
components.
5.3 Future works
Full PLC system design would be implemented so it could be used in reality to transmit
data in many applications such as home automation, automatic meter reading and broadband over
power lines.
60
REFERENCES
[1] T. M. Haq, “Application of Power Line Carrier (PLC) in Automated Meter Reading
(AMR) and Evaluating Non-Technical Loss (NTL),” Int. J. Eng. Res. Technol., vol. 2, no. 8, pp.
766–774, 2013.
[2] K. Achievements, “Energy Integration in South Asia Region Progress , Key
Achievements and Way forward,” 2017.
[3] A. A. Aderemi, A. A. Adeyemi, and A. I. Yury, “Power Line Communication
Technologies: Modeling and Simulation of PRIME Physical Layer,” World Congr. Eng. Comput.
Sci., vol. II, 2012.
[4] T. F. Bissyandé and G. van Stam, “e-Infrastructure and e-Services for Developing
Countries: 5th International Conference, AFRICOMM 2013, Blantyre, Malawi, November 25-27,
2013, Revised Selected Papers,” Lect. Notes Inst. Comput. Sci. Soc. Telecommun. Eng. LNICST,
vol. 135 LNICST, pp. 12–21, 2014.
[5] R. D. Caytiles and S. Lee, “A survey of recent power line communication
technologies for smart micro grid,” Int. J. Softw. Eng. its Appl., vol. 9, no. 12, pp. 251–258, 2015.
[6] F. Report, “EECE 501 Final Year Project,” pp. 1–97.
[7] K. H. Zuberi, “Powerline Carrier (PLC) Communication Systems,” Stock. IMIT,
no. September, pp. 4565–4570, 2003.
[8] M. Control, “Research and Implementation of the Low Voltage Power Line
Communication System Based on OFDM Rong Hua , Fuxiang Yi,” no. Amcce, pp. 445–450, 2015.
[9] T. M. Haq, “Study of Application of Power Line Carrier ( PLC ) in Automated
Meter Reading ( AMR ) and Evaluating Non-Technical Loss,” 2015.
[10] K. Dostert, “Powerline Communications,” Dep. Inf. Technol. Lund Univ., pp. 1–
103, 2001.
[11] G. Faculty, M. K. A. Foul, and E. Objectives, “FSK Modulator,” pp. 1–10.
61
[12] G. Faculty, M. K. A. Foul, and E. Objectives, “FSK Demodulator,” pp. 1–10.
[13] D. Maksimovic, “1 Phase-Locked Loop Concepts,” Lect. Notes, pp. 1–10, 1997.