desarrollo de herramientas metrologicas avanzadas para la
TRANSCRIPT
1
INSTITUTO TECNOLÓGICO DE COSTA RICA
UNIVERSIDAD NACIONAL DE COSTA RICA
UNIVERSIDAD ESTATAL A DISTANCIA
DOCTORADO EN CIENCIAS NATURALES PARA EL DESARROLLO
CON ÉNFASIS EN TECNOLOGÍAS ELECTRÓNICAS APLICADAS
(TEA)
TESIS DOCTORAL
Desarrollo de herramientas metrologicas avanzadas para
la caracterización de nanomateriales: aplicación a la
síntesis sonoquímica de nanopartículas de plata
Bryan Calderón Jiménez
Agosto, 2021
2
INSTITUTO TECNOLÓGICO DE COSTA RICA
UNIVERSIDAD NACIONAL DE COSTA RICA
UNIVERSIDAD ESTATAL A DISTANCIA
“Desarrollo de herramientas metrologicas avanzadas para la caracterización de
nanomateriales: aplicación a la síntesis sonoquímica de nanopartículas de plata”
Trabajo sometido a consideración del Tribunal Evaluador como requisito para optar por el grado
de DOCTOR EN CIENCIAS NATURALES PARA EL DESARROLLO CON ÉNFASIS EN
TECNOLOGÍAS ELECTRONICAS APLICADAS.
Bryan Calderón Jiménez
Sustentante
Aprobado por los miembros del tribunal examinador
Teodolito Guillén Girón, Ph. D.
Director del Sistema de la Unidad de Posgrado
[Firma]
Giovanni Sáez Arce, Ph.D.
Coordinador General del DOCINADE
[Firma]
José Roberto Vega Baudrit, Ph. D.
Director de Tesis
[Firma]
Antonio R. Montoro Bustos, Ph. D.
Asesor de Tesis
[Firma]
Sergio Paniagua Barrantes, Ph. D.
Asesor de Tesis
[Firma]
3
Tabla de Contenidos
TABLA DE CONTENIDOS .............................................................................................................3
DECLARATORIO DE AUTENTICIDAD........................................................................................5
AGRADECIMIENTOS ....................................................................................................................6
DEDICATORIA ...............................................................................................................................8
RESUMEN .......................................................................................................................................9
ABSTRACT .................................................................................................................................... 12
CAPÍTULO 1: OBJETIVOS DE INVESTIGACIÓN ..................................................................... 14
1.1. MOTIVACIÓN..................................................................................................................................... 14
1.2. OBJETIVO GENERAL.......................................................................................................................... 15
1.3. OBJETIVOS ESPECÍFICOS ................................................................................................................... 15
CAPÍTULO 2: SÍNTESIS DEL ESTUDIO ..................................................................................... 16
CAPÍTULO 3: REVISIÓN DE LITERATURA Y ESTADO DEL ARTE ....................................... 22
3.1. SILVER NANOPARTICLES: TECHNOLOGICAL ADVANCES, SOCIETAL IMPACTS, AND METROLOGICAL
CHALLENGES ........................................................................................................................................... 22
CAPÍTULO 4: SOFTWARE ESTADÍSTICO E INTERACTIVO PARA EL PROCESAMIENTO,
VISUALIZACIÓN Y ANÁLISIS DE LOS DATOS POR SPICP-MS. ............................................ 69
4.1. INTRODUCCIÓN ................................................................................................................................. 69
4.2. NANOICP-MS: A NEW STATISTICAL AND INTERACTIVE WEB APPLICATION FOR THE PROCESSING,
VISUALIZATION AND ANALYSIS OF NANOPARTICLES SUSPENSIONS USING SINGLE PARTICLE ICP-MS
MEASUREMENTS ...................................................................................................................................... 75
4.3 SUPPORTING INFORMATION ............................................................................................................ 117
CAPÍTULO 5: HERRAMIENTA TECNOLÓGICA PARA EL ESTUDIO Y MONITOREO DE LA
EVOLUCIÓN DE LAS PROPIEDADES ÓPTICAS DE LAS NANOPARTÍCULAS A LO LARGO
DE LAS REACCIONES DE SÍNTESIS ........................................................................................ 123
5.1. INTRODUCCIÓN ............................................................................................................................... 123
4
5.2. NANOUV-VIS: AN INTERACTIVE VISUALIZATION TOOL FOR MONITORING THE EVOLUTION OF
OPTICAL PROPERTIES OF NANOPARTICLES THROUGHOUT SYNTHESIS REACTIONS ............................... 129
CAPÍTULO 6: SÍNTESIS SONOQUÍMICA DE NANOPARTÍCULAS DE PLATA CON ALTA
ESTABILIDAD EN MEDIOS ACUOSO ...................................................................................... 143
6.1. INTRODUCCIÓN ............................................................................................................................... 143
6.2 SONOCHEMICAL PATHWAY FOR THE SYNTHESIS OF SILVER NANOPARTICLES WITH NEAR-SPHERICAL
SHAPE AND HIGH STABILITY IN AQUEOUS MEDIA ................................................................................. 146
6.3 SUPPORTING INFORMATION ............................................................................................................ 179
CAPÍTULO 7: CONCLUSIONES GLOBALES ........................................................................... 186
CAPÍTULO 8: RECOMENDACIONES Y TRABAJOS FUTUROS ............................................ 188
CAPÍTULO 9: ANEXOS .............................................................................................................. 190
9.1. CONTRIBUCIÓN EN CONFERENCIAS, TALLERES, SEMINARIOS Y OTRAS ACTIVIDADES AFINES ..... 190
9.1.1. NIST Sigma Xi .......................................................................................................................... 190
9.1.2. SCIX 2017 ................................................................................................................................. 191
9.1.3. Metrology Discussion Seminar ................................................................................................ 192
REFERENCIAS ........................................................................................................................... 193
5
Declaratorio de autenticidad
Esta tesis es el resultado del trabajo realizado en el marco del programa interuniversitario (TEC-
UNA-UNED) del Doctorado en Ciencias Naturales para el Desarrollo (DOCINADE) con énfasis en
Tecnologías Electrónicas Aplicadas (TEA), Costa Rica. La mayor parte del presente trabajo se realizó en
colaboración con el Grupo de Metrología Química Inorgánica (ICMG), del Instituto Nacional de Estándares
y Tecnología (NIST) de los Estados Unidos. El desarrollo del método sonoquímico para la síntesis de
nanopartículas de plata se inició en el NIST y fue culminado en las instalaciones del Laboratorio Nacional
de Nanotecnología (LANOTEC), Costa Rica. Excepto cuando se hace referencia específica al trabajo de
otros, este trabajo es original y no se ha presentado ya sea en su totalidad o en forma parcial para satisfacer
cualquier requisito de grado en este o cualquier otro programa de doctorado y/o universidad.
6
Agradecimientos
Quiero agradecer a los diferentes investigadores, colegas y personas que contribuyeron durante el
desarrollo de esta investigación doctoral. Quisiera agradecer en primer lugar al Dr. Antonio R. Montoro
Bustos del NIST por asesorarme, guiarme y colaborarme en todos los aspectos de esta investigación
doctoral, sus consejos y amistad fueron cruciales para desarrollar con éxito este proyecto, siempre estaré en
deuda con tu ayuda desprendida. Además, quiero agradecer a M.Sc Gabriel Sarmanho por su contribución
en los temas relacionados con las estadísticas y la programación en lenguaje R. De la misma, manera deseo
agradecer al Dr. Shu Wei Chou de la Escuela de Estadística de la UCR por colaborar en aspectos de
programación en R que fueron necesarios para culminar el software NanoICP-MS, estaré siempre muy
agradecido con tu colaboración.
A la Dra. Monique E. Johnson del NIST, quiero agradecerle por sus valiosas contribuciones y
discusiones técnicas durante la preparación del documento titulado "Silver Nanoparticles: Technological
Advances, Societal, and Metrological Challenges", además por su gran colaboración en la revisión de todos
los documentos generados durante mi pasantía doctoral en el Instituto Nacional de Estándares y Tecnología
(NIST), y por la revisión de diversos artículos desarrollados en este documento de tesis. Al investigador
invitado Dr. Ingo Strenge por sus valiosos comentarios, sugerencias y contribuciones para mejorar el
desarrollo de las aplicaciones web interactivas desarrolladas durante esta investigación de doctorado.
Específicamente, me gustaría agradecerle la exhaustiva revisión del software web interactivo desarrollado
para el análisis de nanopartículas individuales mediante la espectrometría de masas de plasma acoplado
inductivamente (spICP-MS).
Al líder del Grupo de Metrología en Quimica en Inorgánica (ICMG) del NIST, el Dr. Michael
Winchester, por abrir las puertas de su grupo de investigación y darme la oportunidad de liderar varios
proyectos durante mi pasantía de doctorado, la cual está directamente asociada a esta disertación doctoral.
A la investigadora del ICMG del NIST, Karen Murphy, por su constante supervisión, revisiones y valiosas
discusiones técnicas durante mi pasantía de doctorado en el NIST. Al personal de la oficina de Asuntos
Internacionales y Académicos del NIST (IAAO), quisiera agradecerles por apoyar el desarrollo de la
pasantía doctoral en el NIST, específicamente quiero agradecer a la M.Sc. Magdalena Navarro y la Dra.
Claire M. Saundry por su gran apoyo durante esta investigación doctoral.
A los investigadores del Laboratorio Nacional de Nanotecnología (LANOTEC). Específicamente,
me gustaría agradecer a Reinaldo Pereira Reyes, por su colaboración en las mediciones de TEM, su
7
experiencia y colaboración fueron clave para el desarrollo de esta investigación. Además, me gustaría
agradecerles al M.Sc. Javier Villalobos y el Dr. Sergio Paniagua por la colaboración en las mediciones de
AFM, específicamente a al Dr. Paniagua le agradezco por su apoyo como asesor durante esta investigación
doctoral, siempre estaré agradecido por su ayuda, apertura y apoyo. Al químico Jorge Salazar por su
colaboración y mediciones exploratorias realizadas en AFM, estas mediciones colaboraron a optimizar el
proceso de medición y cuantificación de AgNPs por AFM. Quiero agradecer a mi tutor de tesis, el Dr. José
Vega Baudrit, director de LANOTEC por su valioso apoyo, orientación y colaboración durante el desarrollo
de esta investigación doctoral. Muchas gracias por dar la oportunidad de realizar esta investigación en las
instalaciones de LANOTEC.
Al personal del Departamento de Metrología en Química (DMQ) del Laboratorio Costarricense de
Metrología (LCM) por su apoyo durante mis estudios doctorales. Específicamente, deseo agradecer al
investigador Eric Ortiz Apuy por colaborar en las mediciones espectrométricas realizadas a las AgNPs. Al
personal, colegas y amigos del DMQ (Jimmy, Gabriel, Eric, Katia, Jennifer) quiero agradecerles por
apoyarme durante todo el proceso de doctorado. A los directores del LCM (antiguo LACOMET) que
estuvieron durante el desarrollo de esta investigación, quiero agradecerles por su apoyo. A Carlos R. Mora
Gómez, viceministro del Ministerio de Economía, Industria y Comercio, quiero agradecerles por su apoyo.
A los miembros del Énfasis de Tecnologías Electrónicas Aplicadas (TEA) del programa de doctorado en
Ciencias Naturales para el Desarrollo por su colaboración constante en los asuntos académicos y
administrativos asociados con esta investigación doctoral. Quisiera agradecer a los fondos de la beca del
Centro Nacional de Alta Tecnología (CeNAT) por dotar y apoyar con fondos de investigación de algunas
de las secciones experimentales de esta investigación. Finalmente quisiera agradecer a cualquier otra
persona que de manera directa o indirecta colaboró en el desarrollo de esta investigación doctoral.
8
Dedicatoria
Empecé mi camino por el doctorado con la finalidad de nutrirme en diversas áreas del
conocimiento, específicamente en el campo de las ciencias naturales y nanometrología. Durante este andar
de conocimiento, Dios me bendijo con el incondicional apoyo de mi esposa y me brindó el mejor regalo de
mi vida al darme la oportunidad de ser padre de mis dos hijas.
Ana Paula, Lucia y Elena, ustedes son lo más preciado que me ha brindado Dios, por ende, muy
humildemente les dedico este proyecto en agradecimiento a ese amor incondicional que siempre me han
brindado. Gracias por la luz que irradian en mi corazón e ilumina mi camino.
“El grado de nuestro avance en la ciencia debe
corresponder al grado de nuestra profundización
interior, de nuestro espíritu”
P.J.K
9
Resumen
En la última década, el crecimiento de la innovación en el campo de la nanociencia y la
nanotecnología ha sido exponencial. Específicamente, se han logrado avances notables en el desarrollo de
nanomateriales de ingeniería. (Logothetidis, 2012). Muchas aplicaciones desarrolladas en la actualidad se
han centrado en el desarrollo de nuevas tecnologías en los campos de la medicina, biotecnología,
biomateriales, materiales compuestos, cerámicas, polímeros, alimentos, agricultura, energía, tecnología de
la información, entre otros (Arruda et al., 2015, Hofmann-Amtenbrink, et al., 2015; Huang et al., 2015;
Palmero, 2015; Berekaa, 2015).
El desarrollo de la nanotecnología ha traído un crecimiento increíble en diferentes sectores
económicos dedicados a la generación de nuevos productos que contienen nanomateriales para mejorar o
proporcionar una mayor versatilidad y rendimiento de los productos comerciales (Logothetidis, 2012). Sin
embargo, este crecimiento económico y tecnológico de la nanotecnología y nanociencia ha generado
algunas preocupaciones sobre los posibles efectos adversos que podría generar el uso indiscriminado e
incontrolado de los nanomateriales (Köhler & Som, et al., 2014; Hyeon, 2015) en el medio ambiente, la
salud y seguridad (conocido como NanoEHS por sus siglas en inglés). Debido a lo anterior, esfuerzos en
ciencia y tecnología en el campo de la nanociencia, la nanotecnología y la nanometrología pueden ayudar
a aclarar y comprender con precisión los posibles efectos que estos materiales podrían tener en nuestro
entorno (McShan et al., 2014; Ivask et al., 2014; Krishnaraja et al., 2015). En este contexto, en 2007, más
de 400 publicaciones en el área de nanotoxicología presentaron una descripción deficiente de las
propiedades físicas y químicas de los nanomateriales utilizados en estos estudios (Stefaniak et al., 2014).
Asimismo, el 50% de las publicaciones sobre estudios genotóxicos proporcionan información insuficiente
o nula sobre la nanocaracterización de los nanomateriales (Mody et al., 2009).
Esta falta de nano-caracterización (Tiede et al., 2008) junto con otras necesidades metrológicas
(validación de métodos, estimación de la incertidumbre, comparaciones interlaboratorio, entre otras) (Jorio
y Dresselhous, 2014, Babick et al., 2016) impulsan la necesidad de contar con desarrollos científico-
tecnológicos en este campo que puedan mejorar y proporcionar precisión en las mediciones realizadas en
la nanoescala. En este contexto, existe una gran necesidad de contar con herramientas tecnológicas que
aumenten las capacidad de diversas técnicas analíticas para poder mejorar el procesamiento, visualización
e inferencia de los resultados obtenidos en procesos de nano-caracterización de este tipo de materiales,
dichas herramientas son necesarias para impulsar una mejor comprensión de los mecanismos de reacción y

10
evolución asociados a la síntesis de nanopartículas (NPs) de alta relevancia y aplicabilidad como lo son las
nanopartículas de plata (AgNPs).
Específicamente, es importante desarrollar herramientas avanzadas que brinden y amplíen el cómo
se interpretan, exploran, visualizan, procesan y analizan estadísticamente las mediciones realizadas en la
nanoescala. Proporcionando con dichas herramientas una mejor comprensión de los proceso químicos y
físicos envueltos en la nanoescala y a su vez ampliando sus capacidades analíticas asociadas con la medición
a nanoescala. Todo lo anterior, destaca la necesidad imperativa de investigar y desarrollar herramientas
metrológicas avanzadas que permitan una asignación confiable de las propiedades de los nanoobjetos que
se utilizarán más adelante en una variedad de campos de investigación y productos comerciales (Stefaniak
et al. , 2014; Roebben et al., 2013). Específicamente, dichos avances deben ir enfocados a técnicas analíticas
relevantes por su aplicabilidad y versatilidad, como lo son la espectrometría ultravioleta-visible (UV-Vis)
y la espectrometría de plasma de acoplamiento inductivo de partícula única (spICP-MS). Estas técnicas aún
presentan desafíos científicos, tecnológicos y metrológicos para el cálculo, procesamiento de datos y
visualización de las mediciones realizadas para la caracterización de nanomateriales.
En el mismo contexto, pese a los avances existentes en el área de síntesis química de AgNPs,
todavía es necesario desarrollar nuevas rutas de síntesis que permitan conferir propiedades físicas, químicas
y metrológicas necesarias para que este tipo de NPs puedan usarse como materiales de referencia en las
mediciones realizadas en la nanoescala. La falta de materiales de referencia en la nanoescala limita la
veracidad de las conclusiones en el campo de la nanotecnología y la nanociencia. (Nano Risk Framework,
2007). Actualmente, solo unos pocos materiales de referencia están disponibles comercialmente en la
nanoescala, lo que indica la necesidad de investigar en esta dirección. Específicamente, en el caso de los
AgNPs, que son las NPs más utilizadas en la formulación de productos comerciales (Vance, 2015), solo se
han desarrollado 3 materiales de referencia (Menzel, 2013; Klein, 2013; NIST, 2015) en todo el mundo,
que presentan diferencias en su caracterización, estabilización y ámbito de aplicación. Sin embargo, en la
actualidad se ha investigado poco sobre nuevas rutas de síntesis de AgNPs que permitan desarrollar
aplicaciones metrológicas. Pese a lo anterior, la síntesis sonoquímica de AgNPs podría ofrecer ciertas
ventajas para desarrollar dichas aplicaciones, ya que este tipo de procesos sonoquímicos presenta ciertas
ventajas en comparación con los métodos químicos convencionales debido a que proveen: rápida velocidad
de reacción, condiciones controlables de reacción, simplicidad y seguridad de la técnica, obtención de
formas esféricas y uniformes, distribuciones monomodales, además de conferir alta pureza a los
nanomateriales (Mousavi & Ghasemi, 2010). Por otra parte, algunos estudios sugieren la posibilidad de
generar NPs con pequeño diámetro y alta área superficial (Vasileva et al., 2011; Darroudi et al., 2011; Gupta
11
et al., 2013). Todas estas características confieren a esta técnica el suficiente potencial para obtener AgNPs
con las suficientes propiedades químicas y físicas para ser empleadas como material de referencia. De lo
anterior, uno de los aspectos más relevantes es el cómo poder brindar una alta estabilización de los núcleos
metálicos cuando estos se encuentran dispersos en un medio líquido altamente polar como lo es el agua.
Por lo tanto, todo lo anterior deja patente la necesidad de continuar desarrollando herramientas
tecnológicas avanzadas para comprender, procesar y estudiar las propiedades de los nanomateriales,
específicamente las propiedades asociadas con los AgNP en la nanoescala, así como la imperativa necesidad
de explorar una nueva ruta de síntesis sonoquímica de AgNPs para generar NPs con mayor estabilidad en
medio acuoso.
12
Abstract
In the last decade, the growth of innovation in the field of nanoscience and nanotechnology has
been exponential. Specifically, notable progress has been made in the development of engineered
nanomaterials. (Logothetidis, 2012). Many current applications have focused on the development of new
technologies in the fields of medicine, biotechnology, biomaterials, composite materials, ceramics,
polymers, food, agriculture, energy, and information technology, among others (Arruda et al., 2015,
Hofmann-Amtenbrink, et al., 2015; Huang et al., 2015; Palmero, 2015; Berekaa, 2015).
The development of nanotechnology has brought incredible growth in different economic sectors
dedicated to the generation of new technologies and products containing nanomaterials to improve or
provide greater versatility and performance of commercial products (Logothetidis, 2012). However, this
economic and technological growth of nanotechnology and nanoscience has raised some concerns about
the possible adverse effects of the indiscriminate and uncontrolled use of nanomaterials (Köhler & Som, et
al., 2014; Hyeon, 2015) on the environment, health, and safety (known as NanoEHS). As a result, efforts
in science and technology in the field of nanoscience, nanotechnology and nanometrology can help to
clarify and accurately understand the possible effects these materials could have on our environment
(McShan et al., 2014; Ivask et al., 2014; Krishnaraja et al., 2015). In this context, in 2007, more than 400
publications in the area of nanotoxicology presented a poor description of the physical and chemical
properties of the nanomaterials used in these studies (Stefaniak et al., 2014). In addition, 50% of
publications on genotoxic studies provide insufficient or no information on nanomaterials characterization
(Mody et al., 2009).
This lack of nano-characterization (Tiede et al., 2008) together with other metrological needs
(validation of methods, estimation of uncertainty, interlaboratory comparisons, among others) (Jorio y
Dresselhous, 2014) promote the need to have scientific-technological developments in this field that can
improve and provide precision in the measurements made at the nanoscale. In this context, there is a great
need for technological tools that increase the capacity of various analytical techniques to improve the
processing, visualization and inference of the results obtained in nano-characterization processes of this
type of materials, such tools are necessary to provide a better understanding of chemical and physical
processes associated with the synthesis of nanoparticles (NPs) of high relevance and applicability such as
silver nanoparticles (AgNPs). Specifically, it is important to develop advanced tools that provide and
expand how measurements made at the nanoscale are interpreted, explored, visualized, processed, and
statistically analyzed. These tools provide a better understanding of the chemical and physical processes
13
involved at the nanoscale and in turn expand their analytical capabilities associated with measurement at
the nanoscale. All of the above underscores the imperative need to research in this direction and to develop
advanced metrological tools that enable reliable assignment of the properties of nano-objects to be used
later in a variety of research fields and commercial products (Stefaniak et al., 2014; Robben et al., 2013).
Specifically, these advances must be focused on analytical techniques relevant for their applicability and
versatility, such as ultraviolet-visible spectrophotometry (UV-Vis) and single-particle inductive coupling
plasma spectrometry (spICP-MS). These techniques still present scientific, technological and metrological
challenges for the calculation, data processing and visualization of measurements made for the
characterization of nanomaterials.
In the same context, despite the existing advances in the field of chemical synthesis of AgNPs, it is
still necessary to investigate new synthesis routes that allow conferring physical, chemical, and metrological
properties necessary for this type of NPs to be used as reference materials in measurements made at the
nanoscale. The lack of reference materials at the nanoscale limits the veracity of the conclusions in the field
of nanotechnology and nanoscience. (Nano Risk Framework, 2007). Currently, only a few reference
materials are commercially available at the nanoscale, indicating the need for research in this direction.
Specifically, in the case of AgNPs, which are the most widely used in the formulation of commercial
products (Vance, 2015), only a few reference materials (Menzel, 2013; Klein, 2013; NIST, 2015) have been
developed worldwide, with differences in their characterization, stabilization, and scope. However, a few
research has been done on the exploration of new synthesis pathways to generate AgNPs for metrological
applications. Despite the above, sonochemical synthesis of AgNPs could offer certain advantages to
develop metrological applications since this type of sonochemical processes presents certain advantages in
comparison with conventional chemical methods already provide fast reaction speed, controllable reaction
conditions, simplicity, and safety of the technique, obtaining spherical and uniform forms, symmetrical
distributions, besides conferring high purity to nanomaterials (Mousavi & Ghasemi, 2010). On the other
hand, it presents the possibility of generating NPs with small diameter and high surface area (Vasileva et
al., 2011; Darroudi et al., 2011; Gupta et al., 2013). All these characteristics give this technique sufficient
potential to obtain AgNPs with enough chemical and physical properties to be used as reference material.
From the abovementioned, one of the most relevant aspects are how to provide a high stabilization of
metallic nuclei when they are dispersed in a highly polar liquid medium such as an aqueous medium. All
of the above makes clear the need to continue developing advanced technological tools to understand,
process, and study the properties of nanomaterials, specifically the properties associated with AgNPs at the
nanoscale. It is also indispensable to explore the sonochemical synthesis of AgNPs and their stability in an
aqueous medium.
14
Capítulo 1: Objetivos de investigación
1.1.Motivación
La presente investigación tuvo como objetivo primordial el desarrollo de nuevas herramientas
metrológicas que permitan avanzar en la caracterización y en la síntesis de AgNPs obtenidas mediante el
método sonoquímico. La estrategia seguida para alcanzar este objetivo fue desarrollar una herramienta
tecnológica que permitiese utilizar, analizar y procesar de manera fácil e intuitiva los datos provenientes de
una de las técnicas analíticas más versátil e innovadora para la caracterización de NPs. Específicamente,
era vital dotar al Análisis Individual de Nanopartículas por Espectrometría de Masas por Plasma Acoplado
Inductivamente (spICP-MS) con una aplicación web interactiva tipo software, denominada “NanoICP-
MS”, capaz de procesar los datos de una manera estadísticas, y que a la vez permitiera poder visualizar y
explorar los resultados de la caracterización de NPs en suspensiones líquidas. Por lo tanto, dicho avance
científico y tecnológico permitiría avanzar en la caracterización de las propiedades fisicoquímicas de las
NPs, y además potenciar el uso de spICP-MS en los estudios de síntesis química de AgNPs. Lo anterior
abriría un abanico de posibilidades en las áreas de caracterización, estudios e investigación de nuevos
procesos de síntesis y nanofabricación de AgNPs. De igual manera, siempre vinculado con el objetivo
general de este estudio, había la motivación de desarrollar una nueva herramienta tecnológica, denominada
“NanoUV-VIS”, la cual pudiese analizar múltiples mediciones realizadas por UV-Vis en función del tiempo
de reacción o síntesis. Para esto se propuso que esta herramienta tuviese la capacidad de generar diversos
análisis grafico interactivos en 2 y 3 dimensiones que facilitaran el estudio, comprensión y monitoreo de la
evolución de las reacciones de síntesis de NPs. Por lo tanto, la herramienta no solo brinda la posibilidad de
monitorear la síntesis de NPs, sino que también puede ser utilizada para comprender otros tipos de procesos
que modifiquen o varíen las propiedades ópticas de este tipo de nanomateriales. Finalmente, como último
aporte de la presente investigación doctoral, se detectó la necesidad de desarrollar un método de síntesis
sonoquímica de AgNPs, capaz de generar NPs esféricas, con distribución monodispersa y con una gran
estabilidad en suspensión acuosa. La motivación detrás de esta investigación fue poder contribuir a nivel
científico con el desarrollo de una metodología práctica y accesible de síntesis que permitiese desarrollar
nuevas aplicaciones en el área de la nanociencia y nanotecnología en donde la estabilidad de este tipo de
NPs en suspensión acuosa, juega un papel preponderante, como por ejemplo el desarrollo de materiales de
referencia (MR) en la nanoescala, en el diagnóstico y biodetección basados en Dispersión Raman Mejorada
en la Superficie (SERS), procesos de catálisis en fase sólido-líquido y líquido-líquido, entre otra gran
variedad de aplicaciones.
15
1.2. Objetivo general
Desarrollar herramientas metrológicas avanzadas para la caracterización y la síntesis de
nanopartículas de plata obtenidas mediante el método sonoquímico.
1.3. Objetivos específicos
1. Desarrollar un software capaz de visualizar, explorar y procesar estadísticamente los datos
obtenidos en los análisis de spICP-MS para la caracterización de suspensiones de nanopartículas.
2. Desarrollar un software interactivo que visualice y determine las propiedades ópticas de las
nanopartículas a lo largo de las reacciones de síntesis.
3. Desarrollar un método sonoquímico para sintetizar nanopartículas de plata esféricas con alta
estabilidad en medio acuoso.
16
Capítulo 2: Síntesis del estudio
Los avances en la síntesis, estabilización y producción de NPs han fomentado una nueva generación
de productos comerciales e intensificado la investigación científica de estos materiales. Recientemente, el
análisis individual de partículas por espectrometría de masa acoplada inductivamente con plasma (spICP-
MS) se ha convertido en una de las técnicas analíticas más valiosas para la caracterización de suspensiones
de NP acuosas. La capacidad de spICP-MS para medir simultáneamente el tamaño de la NP, la distribución
del tamaño y la concentración del número de NP a concentraciones muy bajas de NP (~ng/L), hace que
esta técnica de medición y caracterización sea extremadamente útil desde el punto de vista metrológico,
analítico y científico. Sin embargo, pese a las prometedoras capacidades analíticas de esta técnica analítica,
el procesamiento de los datos y cálculos matemáticos y estadísticos que la engloban son actualmente una
de las principales brechas para promover una mayor implementación. Lo anterior se debe a que los
conjuntos de datos prevenientes del detector de masas del ICP en este tipo de determinaciones son
relativamente grandes. Para mediciones en la escala de milisegundos (ms), una medición de una sola
muestra típica contiene decenas de miles de datos. Además, para mediciones en la escala de microsegundos,
se adquieren millones de datos, lo que hace que el procesamiento de datos sea complejo y laborioso. En los
últimos años, se han desarrollado algunas herramientas de análisis de datos como hojas de cálculo (Peters
et al., 2015), programas personalizados (Strenge et al., 2016) y programas de software para proveedores de
ICP-MS. Sin embargo, la gran sofisticación y falta de transparencia en los algoritmos utilizados, además
de limitaciones en sus capacidades de procesar datos y restricciones debido a licencias de software han
limitado la aplicabilidad de spICP-MS a ciertos laboratorios expertos en el uso de esta técnica.
Debido a lo anterior, y al potencial uso que puede tener esta técnica analítica para caracterizar las
propiedades fisicoquímicas de NPs (Laborda et al., 2011, Laborda et al., 2013, Montaño et al., 2016,
Montoro, et al., 2018), específicamente poder brindar una nueva alternativa para explorar, comprender y
estudiar los diversos procesos síntesis de AgNPs por medio de spICP-MS (Zhang et al., 2019) hizo que la
presente investigación tuviese como uno de sus objetivos primordiales desarrollar una herramienta
metrológica avanzada denominada “NanoICP-MS”, capaz de procesar y calcular los principales
mensurandos involucrados en el análisis de spICP-MS (tamaño, distribución de tamaño y concentración de
número de partículas), además de proporcionar la capacidad de visualizar interactivamente los resultados,
y desarrollar el análisis estadístico de los datos, con un tiempo de procesamiento significativamente
reducido. Para lograr tal desafío tecnológico y científico, la herramienta “NanoICP-MS” se desarrolló
utilizando el entorno R, haciendo uso del paquete de desarrollo de aplicaciones web Shiny para desarrollar
17
una interfaz intuitiva y fácil de usar para el procesamiento de datos spICP-MS. De esta manera, “NanoICP-
MS” utiliza los archivos de datos en formato csv. de cualquier proveedor de instrumentos de ICP-MS para
ser procesados sin requerir un conocimiento sofisticado de programación.
El presente estudio, propuso además grandes avances en el establecimiento de diferentes criterios
estadísticos para discriminar la señal de fondo del instrumento y las señales de las partículas (es decir,
determinar el umbral de intensidad de la señal entre las partículas y las señales continuas del ruido
instrumental de fondo). Para tal propósito se desarrolló una función capaz de detectar y sugerir dentro de la
herramienta valores extremos presentes en los datos debido a errores sistemáticos generados por procesos
de desestabilización de las NPs (aglomeración/agregaciones). Esto brindó la posibilidad de eliminar
interferentes que distorsionan la interpretación y visualización de los resultados del análisis por spICP-MS.
Subsecuentemente, se propusieron diferentes enfoques estadísticos basados en el Límite de detección (LD),
la Función de Distribución Acumulada (CDF) y la Estimación de Densidad de Kernel (KDE) para brindar
diferentes opciones estadísticas para la separación este tipo de señales. Una vez separados los eventos
considerados como NPs, se incluyeron en el software diferentes algoritmos paramétricos y no paramétricos
para estimar la tendencia central de las distribuciones de tamaños de partículas de las muestras analizadas,
dentro de los que destacan nueve diferentes distribuiones paramétricas que se pueden modelar en los datos
(Montoro-Bustos, et al., 2015) y las cuales por medio del Criterio de Información Bayesiano (BIC) (Fabozzi
et al., 2014) el software selecciona las tres distribuciones paramétricas que se ajustan mejor a los datos.
Además, otros algoritmos como el algoritmo de Hubers (AMC, 1989) y la Estimación de Kernel
(Bhattacharya, 1967) fueron utilizados como enfoques no paramétricos. En la actualidad el software tiene
la capacidad de brindar gran cantidad de información de diferentes cálculos inmersos en este tipo análisis,
como lo son los modelos de regresión lineal por mínimos cuadrados ordinarios (OLS) y regresión lineal
por mínimos cuadrados pesados (WLS), el factor de respuesta iónica y de partículas (RF), el número de
eventos de partículas, la concentración de masa de partículas, la concentración de especies iónicas, el error
estándar de la población de partículas (crucial para cálculos de incertidumbre), el rango intercuartil de la
distribución del tamaño de partículas (IQR), el límite de detección (LD) y la eficiencia del transporte (TE).
Además, el software desarrollado en la presente investigación doctoral tiene la capacidad de ser utilizado
para aplicaciones que involucran la caracterización de NP metálicas, específicamente nanopartículas de oro
(AuNPs) y AgNPs en suspensiones acuosas mediante spICP-MS en escala de milisegundos (TRA).
Específicamente, se demostró la aplicabilidad y las capacidades de “NanoICP-MS” para analizar y
caracterizar el tamaño de partícula, la distribución del tamaño de partícula y la concentración del número
de partícula de AuNPs (esféricas) dispersas en medios líquidos y estabilizadas con diferentes agentes de
recubrimiento como polivinilpirrolidona (PVP), polietilenimina ramificada (bPEI) y citrato (Cit). Además,
18
también se caracterizaron AgNP esféricas recubiertas con PVP utilizando spICP-MS en una escala de
microsegundos y posteriormente, por medio de una recombinación de los datos para crear una señal de
adquisición de captura de datos con tiempo de permanencia de 3 ms, 10 ms y 20 ms. Finalmente, la
aplicación desarrollada fue capaz de ser utilizada para procesar datos de un estudio in vivo de la absorción
de AuNPs ingeridas por el nematodo Caenorhabditis elegans, demostrando la capacidad de este software
al ser utilizado inclusive en la caracterización de nanomateriales en matrices y diseños experimentales de
alta complejidad.
Abonado a lo anterior, las AgNPs se están utilizando para una amplia gama de aplicaciones de alta
tecnología que incluyen detección, imágenes, administración dirigida de medicamentos, biodiagnóstico,
catálisis, optoelectrónica, siembra de crecimiento de película entre otros fines (Calderón-Jiménez et al.,
2017, Attia et al., 2015). Las propiedades ópticas, eléctricas y catalíticas mejoradas de este tipo de NPs
metálicas están fuertemente correlacionadas con el control de su tamaño, forma y estructura (Sun & Xia,
2002). Por tanto, la caracterización fisicoquímica de los NP es crítica para garantizar su uso y aplicabilidad.
Debido a lo anterior, y siempre manteniendo un vinculo directo con el objetivo general de este estudio
doctoral, se estableció la necesidad de desarrollar una segunda aplicación web interactiva tipo software,
denominada “NanoUV-VIS”, capaz de analizar múltiples mediciones realizadas por espectroscopía de
absorción UV-Vis (UV-Vis) en función del tiempo de reacción o síntesis. La herramienta tiene la capacidad
de analizar múltiples mediciones del espectro UV-Vis en función del tiempo, creando diferentes
visualizaciones gráficas en 2 y 3 dimensiones, tales como diagramas de espectro, diagramas de superficie
y diagramas de contorno, permitiendo explorar el comportamiento óptico de NPs en procesos que
evolucionan en función del tiempo (ej: procesos de síntesis, estudios de estabilidad, monitoreo y evolución
de propiedades ópticas entre otras). Además, evalúa parámetros espectroquímicos relevantes de las bandas
de absorción de NPs. Específicamente, proporciona la máxima absorbancia óptica, el máximo pico de
resonancia de plasmón superficial (SPR) y ancho de banda espectral comúnmente denominado FWHM, por
sus siglas en inglés. Estos parámetros están estrechamente relacionados con el diámetro, la forma y la
polidispersidad de NPs metalicas y semiconductoras. Además como se verá más adelante, diversas
investigaciones y métodologías se han desarrollado para utilizar las propiedades ópticas de NPs para
determinar de manera semi-cuantitativa propiedades fundamentales de este tipo de nanoobjetos, como lo
son el tamaño, la concentración y el nivel de agregación de diferentes NPs metálicas (Haiss et al., 2007;
Liu, et al., 2007; Amendola & Meneghetti, 2009; Paramelle et al., 2014). Con todo lo anterior, la presente
herramienta “NanoUV-Vis” brinda una nueva posibilidad para utilizar la técnica analítica UV-Vis en el
estudio, monitoreo y fabricación de NPs, en los cuales es indispensable estudiar sus propiedades ópticas,
así como comprender por medio de su monitoreo espectroquímico la forma en como evolucionan las
19
reacciones de síntesis y la estabilidad que tienen este tipo de nanoobjetos cuando se encuentran expuesta
ante diferentes condiciones y/o medios de dispersion.
Como último aporte de la presente investigación doctoral, se desarrolló un método de síntesis
sonoquímica de AgNPs con un tamaño menor de 15 nm (sub-15 nm) capaz de generar NPs esféricas, con
distribución monodispersa y con una gran estabilidad en suspensión acuosa. Para alcanzar este objetivo,
diversas tecnicas analíticas como lo son la espectroscopia UV-Vis en línea (on-line, por sus siglas en inglés),
la microscopía de fuerza atómica (AFM) y la microscopia electrónica de transmisión (TEM) fueron
utilizadas para comprender de una manera más profunda como se desarrollaba la evolución de la síntesis
sonoquímica de este tipo de nanomaterial. Posteriormente, al evaluar el “material crudo” de AgNPs
obtenido por esta nueva ruta de síntesis y al observar la formación y presencia de ciertas agregaciones en
dicho material, se propuso una forma simple, rápida y directa de purificación por medio de una de las
técnicas separativas más sencillas y accesibles como la centrifugación. El resultado obtenido fue un
“material purificado” con un tamaño de partícula de 8,1 nm ± 2,4 nm determinado por TEM usando dos
métodos diferentes de deposición de NPs, y con una estrecha dispersión de la distribución de tamaños cuyo
intervalo de cobertura al 95% se encuentra entre los 3 nm hasta los 13 nm, demostrando la obtención de
sub-15 nm AgNPs por el método sonoquímico. La posterior, caracterización del “material purificado”
mediante TEM permitió identificar que el material posee una alta esfericidad (circularidad y redondez) que
en conjunto con los análisis de TEM de alta resolución (HR-TEM) confirmaron que AgNPs posee una
forma quasi-esferica. Los estudios de estabilidad a corto plazo (600 min) irradiando AgNPs con radiación
ultravioleta de onda corta (UVC: 254 nm) demostraron que sub-15 nm AgNPs son suceptibles a la radiación
UVC. Sin embargo, cuando AgNPs fueron sometidas a radiaciones de onda larga en el espectro UV (UVA:
365 nm) se demostró que éstas poseen una alta estabilidad de las propiedades ópticas y por consiguiente de
sus propiedades dimensionales ante su exposición radiación UVA. Situación similar fueron determinadas
bajo diferentes condiciones de almacenamiento (4 ºC y 20 ºC), en donde los estudios de estabilidad a largo
plazo (24 semanas) de sub-15 nm AgNPs demostraron poseer una alta estabilidad de sus propiedades
ópticas, y por consiguiente, alta estabilidad de sus propiedades dimensionales. Todo lo anterior pretende
abrir un abanico de nuevas aplicaciones en el área de la nanociencia y nanotecnología en donde la
estabilidad de este tipo de NPs en suspensión acuosa juege un papel preponderante, en diversos campos de
aplicación como por ejemplo el desarrollo de materiales de referencia (MR) en la nanoescala, en el
diagnóstico y biodetección basados en Dispersión Raman Mejorada en la Superficie (SERS), en catalisis
en fase líquida, dispositivos a base de nano-fluidos entre otra gran variedad de aplicaciones.
20
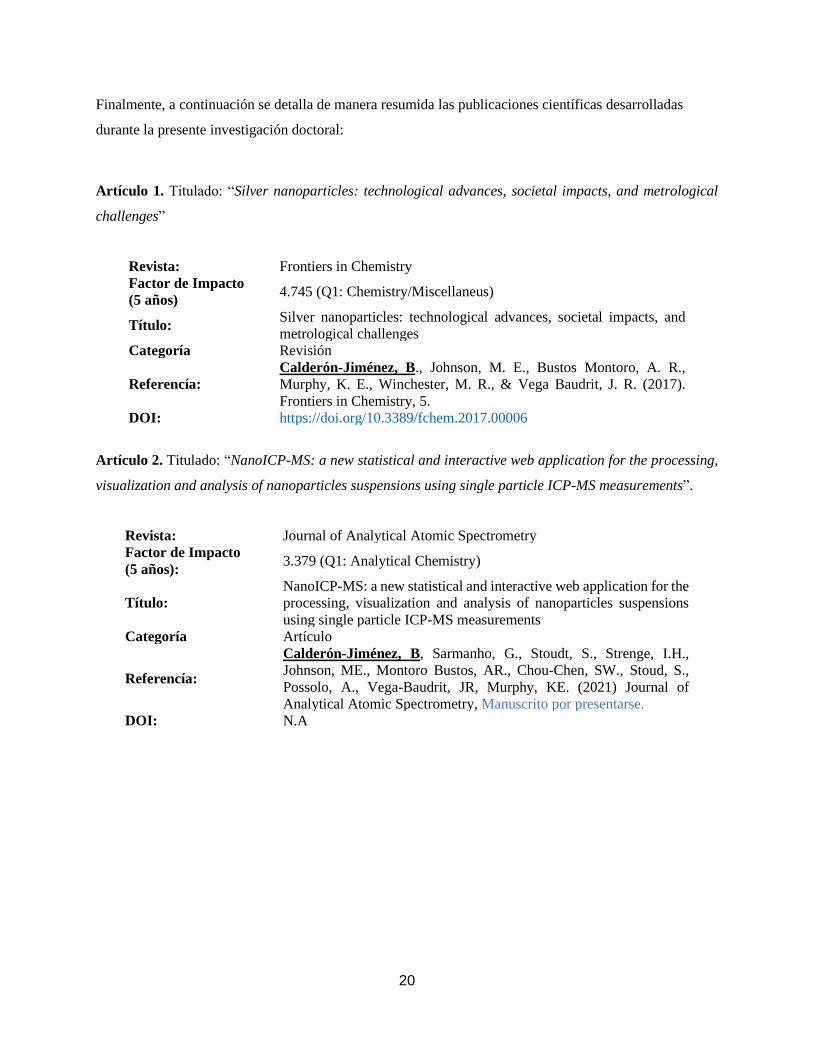
Finalmente, a continuación se detalla de manera resumida las publicaciones científicas desarrolladas
durante la presente investigación doctoral:
Artículo 1. Titulado: “Silver nanoparticles: technological advances, societal impacts, and metrological
challenges”
Revista: Frontiers in Chemistry
Factor de Impacto
(5 años) 4.745 (Q1: Chemistry/Miscellaneus)
Título: Silver nanoparticles: technological advances, societal impacts, and
metrological challenges
Categoría Revisión
Referencía:
Calderón-Jiménez, B., Johnson, M. E., Bustos Montoro, A. R.,
Murphy, K. E., Winchester, M. R., & Vega Baudrit, J. R. (2017).
Frontiers in Chemistry, 5.
DOI: https://doi.org/10.3389/fchem.2017.00006
Artículo 2. Titulado: “NanoICP-MS: a new statistical and interactive web application for the processing,
visualization and analysis of nanoparticles suspensions using single particle ICP-MS measurements”.
Revista: Journal of Analytical Atomic Spectrometry
Factor de Impacto
(5 años): 3.379 (Q1: Analytical Chemistry)
Título:
NanoICP-MS: a new statistical and interactive web application for the
processing, visualization and analysis of nanoparticles suspensions
using single particle ICP-MS measurements
Categoría Artículo
Referencía:
Calderón-Jiménez, B, Sarmanho, G., Stoudt, S., Strenge, I.H.,
Johnson, ME., Montoro Bustos, AR., Chou-Chen, SW., Stoud, S.,
Possolo, A., Vega-Baudrit, JR, Murphy, KE. (2021) Journal of
Analytical Atomic Spectrometry, Manuscrito por presentarse.
DOI: N.A
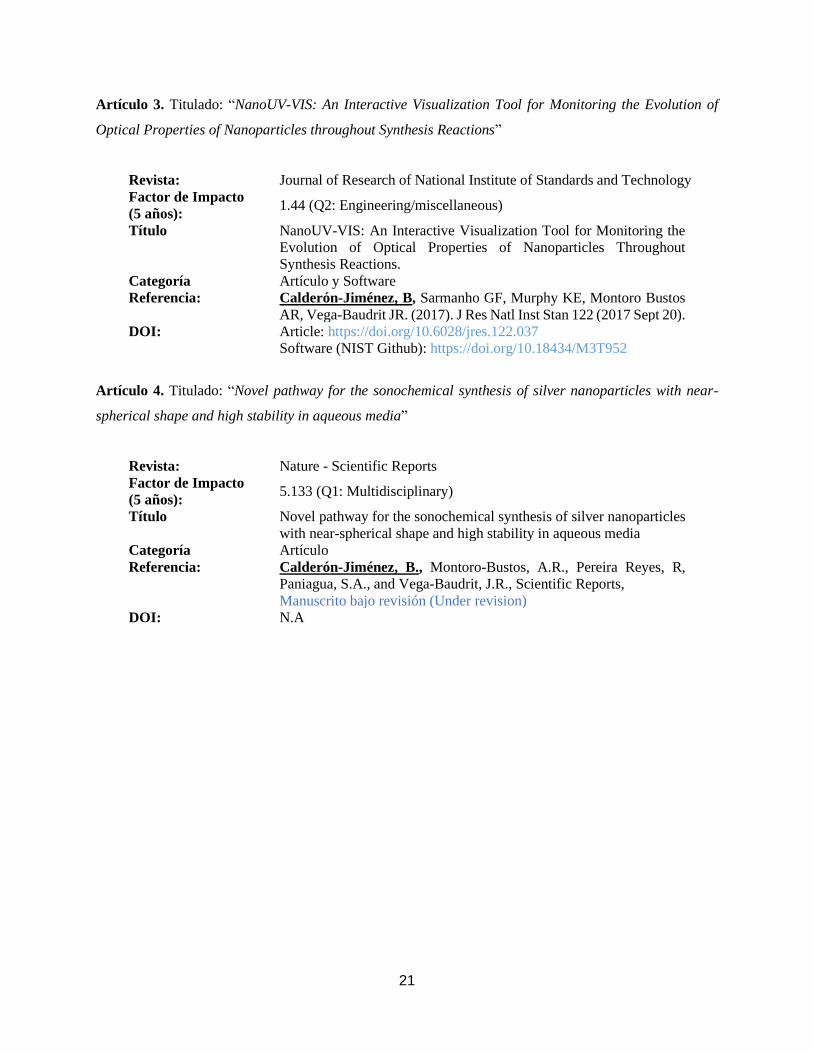
21
Artículo 3. Titulado: “NanoUV-VIS: An Interactive Visualization Tool for Monitoring the Evolution of
Optical Properties of Nanoparticles throughout Synthesis Reactions”
Revista: Journal of Research of National Institute of Standards and Technology
Factor de Impacto
(5 años): 1.44 (Q2: Engineering/miscellaneous)
Título NanoUV-VIS: An Interactive Visualization Tool for Monitoring the
Evolution of Optical Properties of Nanoparticles Throughout
Synthesis Reactions.
Categoría Artículo y Software
Referencia: Calderón-Jiménez, B, Sarmanho GF, Murphy KE, Montoro Bustos
AR, Vega-Baudrit JR. (2017). J Res Natl Inst Stan 122 (2017 Sept 20).
DOI: Article: https://doi.org/10.6028/jres.122.037
Software (NIST Github): https://doi.org/10.18434/M3T952
Artículo 4. Titulado: “Novel pathway for the sonochemical synthesis of silver nanoparticles with near-
spherical shape and high stability in aqueous media”
Revista: Nature - Scientific Reports
Factor de Impacto
(5 años): 5.133 (Q1: Multidisciplinary)
Título Novel pathway for the sonochemical synthesis of silver nanoparticles
with near-spherical shape and high stability in aqueous media
Categoría Artículo
Referencia: Calderón-Jiménez, B., Montoro-Bustos, A.R., Pereira Reyes, R,
Paniagua, S.A., and Vega-Baudrit, J.R., Scientific Reports,
Manuscrito bajo revisión (Under revision)
DOI: N.A
22
Capítulo 3: Revisión de literatura y estado del arte
3.1. Silver Nanoparticles: Technological Advances, Societal Impacts, and Metrological
Challenges
Artículo 1. Basado en el Artículo de Revisión publicado en Frontiers in Chemistry, 5,
Doi: https://doi.org/10.3389/fchem.2017.00006
Bryan Calderón-Jiménez*, Monique E. Johnson, Antonio R. Montoro Bustos,
Karen E. Murphy, Michael R. Winchester and José R. Vega Baudrit
23
Silver Nanoparticles: Technological Advances,
Societal Impacts, and Metrological Challenges
Bryan Calderón-Jiménez 1, 2*, Monique E. Johnson 1, Antonio R. Montoro Bustos 1,
Karen E. Murphy 1, Michael R. Winchester 1 and José R. Vega Baudrit 3*
1 Material Measurement Laboratory, Chemical Sciences Division, National Institute of Standards and
Technology, Gaithersburg, MD, USA, 2 Chemical Metrology Division, National Laboratory of Metrology, San Jose, Costa Rica,
3 National Laboratory of Nanotechnology, National Center of High Technology, San Jose, Costa Rica
ABSTRACT:
Silver nanoparticles (AgNPs) show different physical and chemical properties compared to their macroscale
analogs. This is primarily due to their small size and, consequently, the exceptional surface area of these
materials. Presently, advances in the synthesis, stabilization, and production of AgNPs have fostered a new
generation of commercial products and intensified scientific investigation within the nanotechnology field.
The use of AgNPs in commercial products is increasing and impacts on the environment and human health
are largely unknown. This article discusses advances in AgNP production and presents an overview of the
commercial, societal, and environmental impacts of this emerging nanoparticle (NP), and nanomaterials in
general. Finally, we examine the challenges associated with AgNP characterization, discuss the importance
of the development of NP reference materials (RMs) and explore their role as a metrological mechanism to
improve the quality and comparability of NP measurements.
Keywords: silver nanoparticles, synthesis, characterization, environment health and
safety, metrology, reference materials
*Correspondence:
Bryan Calderón Jiménez [email protected]
José R. Vega Baudrit [email protected]
24
DEFINING NANOMATERIALS AND NANOPARTICLES: THEIR IMPORTANCE IN
NANOSCIENCE, AND NANOTECHNOLOGY
Standardization of vocabulary and nomenclature used in nanotechnology and nanoscience creates
a common language through which research and industrial activities can be defined. Moreover, robust and
well-founded definitions of the terms in these fields are essential to the formation of legally defensible and
beneficial regulations to protect the environment and human health (ISO/TS 80004-1, 2015). Currently, an
internationally harmonized definition for the term “nanomaterial” has not been established (Lövestam et
al., 2010). Rather, a wide range of definitions are being used by different national authorities, scientific
committees, and international organizations (Lidén, 2011; Boverhof et al., 2015; Contado, 2015), a few of
which are discussed in this manuscript. The International Organization for Standardization (ISO) develops
voluntary, consensus-based standards through the participation of over 160 national standards bodies and
has been active in the promotion of uniform terminology in the field of nanotechnology. ISO defines a
nanomaterial “as a material having any external dimension in the nanoscale or having internal structure or
surface structure in the nanoscale” (ISO/TS 80004-1, 2015). The term “nanoscale” is further defined by
ISO as the “length range approximately from 1 to 100 nm” (ISO/TS 80004-1, 2015). ISO classifies
nanomaterials in two main categories: Nano-objects and nanostructured materials. A nano-object is
described as a “discrete piece of material with one, two or three external dimensions in the nanoscale”
(ISO/TS 80004-1, 2015) and a nanostructured material is a “material having internal structure or surface
structure in the nanoscale” (ISO/TS 80004- 4, 2011). Nano-objects, can be classified into three categories
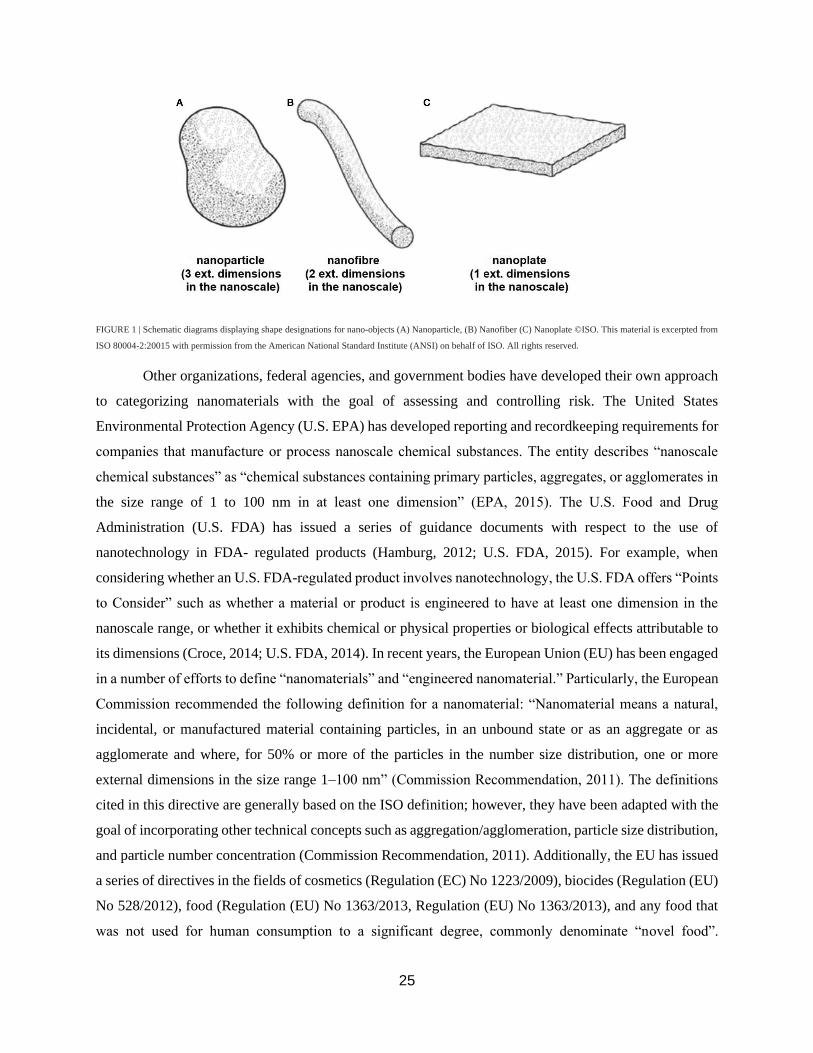
(see Figure 1) depending on their size and shape characteristics (ISO/TS 80004-1, 2015):
1. Nanoparticle (NP): “Nano-object with all external dimensions at the nanoscale where the lengths
of the longest and shortest axes of the nano-object do not differ significantly”,
2. Nanofiber: “Nano-objects with two external dimensions at the nanoscale and the third dimension
significantly larger”,
3. Nanoplate: “Nano-objects with one external dimension in the nanoscale and the other two
dimensions significantly larger”,
ISO also provides a simple and general definition for engineered nanomaterials indicating that they
are “nanomaterials designed for specific purposes or functions” (ISO/TS 80004-1, 2015).
25
FIGURE 1 | Schematic diagrams displaying shape designations for nano-objects (A) Nanoparticle, (B) Nanofiber (C) Nanoplate ©ISO. This material is excerpted from
ISO 80004-2:20015 with permission from the American National Standard Institute (ANSI) on behalf of ISO. All rights reserved.
Other organizations, federal agencies, and government bodies have developed their own approach
to categorizing nanomaterials with the goal of assessing and controlling risk. The United States
Environmental Protection Agency (U.S. EPA) has developed reporting and recordkeeping requirements for
companies that manufacture or process nanoscale chemical substances. The entity describes “nanoscale
chemical substances” as “chemical substances containing primary particles, aggregates, or agglomerates in
the size range of 1 to 100 nm in at least one dimension” (EPA, 2015). The U.S. Food and Drug
Administration (U.S. FDA) has issued a series of guidance documents with respect to the use of
nanotechnology in FDA- regulated products (Hamburg, 2012; U.S. FDA, 2015). For example, when
considering whether an U.S. FDA-regulated product involves nanotechnology, the U.S. FDA offers “Points
to Consider” such as whether a material or product is engineered to have at least one dimension in the
nanoscale range, or whether it exhibits chemical or physical properties or biological effects attributable to
its dimensions (Croce, 2014; U.S. FDA, 2014). In recent years, the European Union (EU) has been engaged
in a number of efforts to define “nanomaterials” and “engineered nanomaterial.” Particularly, the European
Commission recommended the following definition for a nanomaterial: “Nanomaterial means a natural,
incidental, or manufactured material containing particles, in an unbound state or as an aggregate or as
agglomerate and where, for 50% or more of the particles in the number size distribution, one or more
external dimensions in the size range 1–100 nm” (Commission Recommendation, 2011). The definitions
cited in this directive are generally based on the ISO definition; however, they have been adapted with the
goal of incorporating other technical concepts such as aggregation/agglomeration, particle size distribution,
and particle number concentration (Commission Recommendation, 2011). Additionally, the EU has issued
a series of directives in the fields of cosmetics (Regulation (EC) No 1223/2009), biocides (Regulation (EU)
No 528/2012), food (Regulation (EU) No 1363/2013, Regulation (EU) No 1363/2013), and any food that
was not used for human consumption to a significant degree, commonly denominate “novel food”.
26
(Regulation (EU) 2015/2283). Recently, extensive technical work has begun to focus on the goal of
providing recommendations on the possible use and limitations of some measurement techniques (MTs)
with respect to the application of the EU definition (Babick et al., 2016).
Efforts to adapt and/or recast existing regulations to define fundamental concepts and applications
of nanomaterials in consumer products are taking place in France (Decree No 2012-232) Belgium (Decree
No 2014/24329), Denmark (Decree No 644 of 13/06/2014), and Canada (Health Canada, 2011). These
countries have recently enacted their own policies to study the potential risks associated with the
commercialization of nanomaterials by collecting information and establishing inventories. For instance,
with the goal of identifying and assessing potential risks and benefits, Canadian regulatory agencies request
information from manufacturers and other stakeholders on physical-chemical properties such as
composition, purity, morphology, particle size/size distribution, chemical reactivity,
agglomeration/aggregation state, as well as information on the methods used to assign these properties
(Health Canada, 2011).
Despite efforts in recent years to properly define nanotechnology-related terms, more work needs
to be done with respect to the harmonization and standardization of the terminology used in this field. For
example, the term “nanoparticle” is defined differently by ISO (ISO/TS 80004-2, 2015), ASTM (ASTM
E2456-06, 2012), and IUPAC (Alemán et al., 2007) with regard to the number of dimensions and shapes
that can be attributed to NPs. This however, does not imply that one definition is accurate while another is
not; rather it demonstrates that definitions and terms in the nanotechnology field are still evolving and
highlights the importance of generating robust descriptors for these emerging materials to satisfy the variety
of angles where the terminology would be applied.
IMPACTS OF THE NANOPARTICLES AND SILVER NANOPARTICLES (AgNPS) ON
COMMERCE, TECHNOLOGY AND SOCIETY
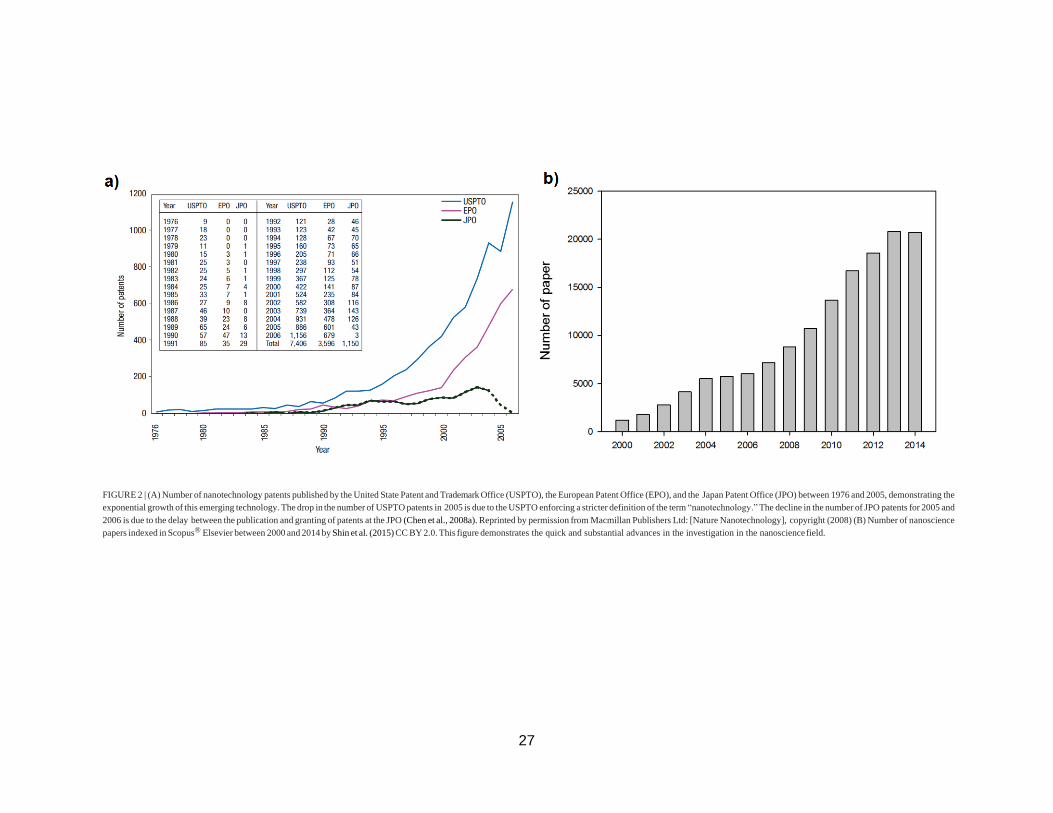
In the past decade, the world has seen an exponential growth in the application of nanoscience and
nanotechnology, leading to great strides in the development of new nanomaterials (see Figure 2). (López-
Lorente and Valcárcel, 2016).
27
FIGURE 2 | (A) Number of nanotechnology patents published by the United State Patent and Trademark Office (USPTO), the European Patent Office (EPO), and the Japan Patent Office (JPO) between 1976 and 2005, demonstrating the
exponential growth of this emerging technology. The drop in the number of USPTO patents in 2005 is due to the USPTO enforcing a stricter definition of the term “nanotechnology.” The decline in the number of JPO patents for 2005 and
2006 is due to the delay between the publication and granting of patents at the JPO (Chen et al., 2008a). Reprinted by permission from Macmillan Publishers Ltd: [Nature Nanotechnology], copyright (2008) (B) Number of nanoscience
papers indexed in Scopus® Elsevier between 2000 and 2014 by Shin et al. (2015) CC BY 2.0. This figure demonstrates the quick and substantial advances in the investigation in the nanoscience field.
28
This increase in innovation is largely due to the special properties that these materials possess at
the nanoscale, leading to enhancement of mechanical (Calahorra et al., 2016), dimensional (Lee et al.,
2011), electrical (Segev-Bar and Haick, 2013), magnetic (Reddy et al., 2012), photochemical (Watanabe et
al., 2006), and catalytic (Gawande et al., 2016) attributes, to name a few. In general terms, NP applications
are impacting different fields such as biomaterials (Ediriwickrema and Saltzman, 2015), composites
(Ahmad et al., 2015), ceramics (Birol et al., 2013), polymers (Pecher and Mecking, 2010), food (Tiede et
al., 2008), agriculture (Parisi et al., 2015; Phogat et al., 2016), and energy (Lohse and Murphy, 2012).
All of this escalation in the research and development of new NP applications will have a direct
impact on commerce and society. In 2011, it was estimated that US$ 65 billion had been invested into the
nanotechnology field (Miller and Wickson, 2015). Moreover, it was projected that a cumulative investment
of US$150 billion would be made by the private sector into the field by 2015 (Cientifica, 2011). It was
further predicted that nanotechnology in the form of NPs would impact different fields such as electronics,
information technology and manufactured goods in health care and life sciences (Lux Research, 2008;
Fiorino, 2010; Sargent, 2016). These projections are reflected in the growth of the numbers of consumer
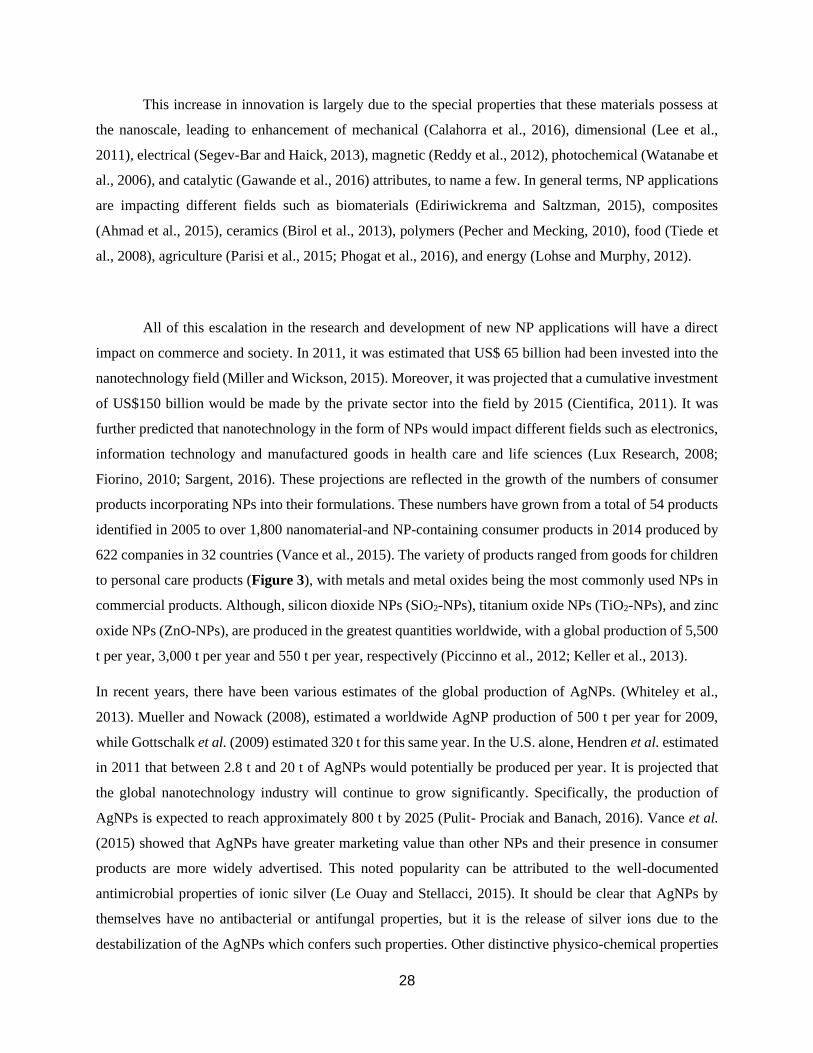
products incorporating NPs into their formulations. These numbers have grown from a total of 54 products
identified in 2005 to over 1,800 nanomaterial-and NP-containing consumer products in 2014 produced by
622 companies in 32 countries (Vance et al., 2015). The variety of products ranged from goods for children
to personal care products (Figure 3), with metals and metal oxides being the most commonly used NPs in
commercial products. Although, silicon dioxide NPs (SiO2-NPs), titanium oxide NPs (TiO2-NPs), and zinc
oxide NPs (ZnO-NPs), are produced in the greatest quantities worldwide, with a global production of 5,500
t per year, 3,000 t per year and 550 t per year, respectively (Piccinno et al., 2012; Keller et al., 2013).
In recent years, there have been various estimates of the global production of AgNPs. (Whiteley et al.,
2013). Mueller and Nowack (2008), estimated a worldwide AgNP production of 500 t per year for 2009,
while Gottschalk et al. (2009) estimated 320 t for this same year. In the U.S. alone, Hendren et al. estimated
in 2011 that between 2.8 t and 20 t of AgNPs would potentially be produced per year. It is projected that
the global nanotechnology industry will continue to grow significantly. Specifically, the production of
AgNPs is expected to reach approximately 800 t by 2025 (Pulit- Prociak and Banach, 2016). Vance et al.
(2015) showed that AgNPs have greater marketing value than other NPs and their presence in consumer
products are more widely advertised. This noted popularity can be attributed to the well-documented
antimicrobial properties of ionic silver (Le Ouay and Stellacci, 2015). It should be clear that AgNPs by
themselves have no antibacterial or antifungal properties, but it is the release of silver ions due to the
destabilization of the AgNPs which confers such properties. Other distinctive physico-chemical properties
29
of AgNPs such as high electrical and thermal conductivity (Alshehri et al., 2012), surface-enhanced Raman
scattering (Nie and Emory, 1997), catalytic activity (Xu et al., 2006), and non-linear optical properties
(Kelly et al., 2003), have led to a variety of new products and scientific applications (Tran et al., 2013).
FIGURE 3 | (A) Number of available nanomaterial-containing consumer products over time (since 2007) by category (black print) and sub category (red print). (B)
Claimed composition of nanomaterials listed in the Nanotechnology Consumer Product Inventory, grouped into five major categories: Not advertised, metal (including
metals and metal oxides), carbonaceous nanomaterials (carbon black, carbon nanotubes, fullerenes, graphene), silicon-based nanomaterials (silicon and silica), and other
(organics, polymers, ceramics, etc.). The insert in 3b shows the claimed elemental composition of nanomaterials listed in the metals category: silver, titanium, zinc, gold,
and other metals (magnesium, aluminum oxide, copper, platinum, iron, and iron oxides, etc.). Adapted from Vance et al. (2015) with the permission of Beilstein-Institut.
CC BY 2.0.
The physico-chemical properties mentioned above offer AgNPs the capability of being used in a
plethora of new commercial and technological applications, including as antiseptic agents in the medical
field, cosmetic, food packaging, bioengineering, electrochemistry, and catalysis industries (Keat et al.,
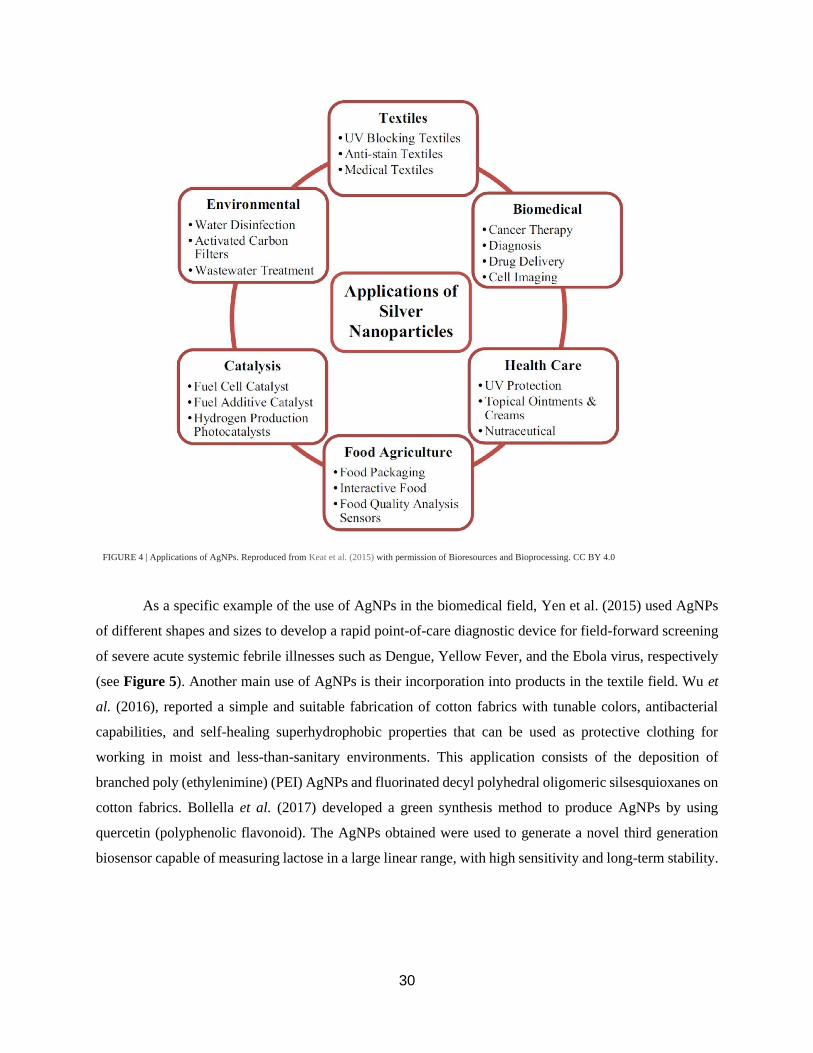
2015). As displayed in Figure 4, the antibacterial and antimicrobial activity of AgNPs are among the main
reasons for their use in the formulation of surface cleaners, toys, textiles, air and water disinfection,
antimicrobial catheters, antimicrobial gels, antimicrobial paints, food packaging supplies, clinical clothing,
and food preservation etc. (Wijnhoven et al., 2009; Tolaymat et al., 2010; Tran et al., 2013).
30
FIGURE 4 | Applications of AgNPs. Reproduced from Keat et al. (2015) with permission of Bioresources and Bioprocessing. CC BY 4.0
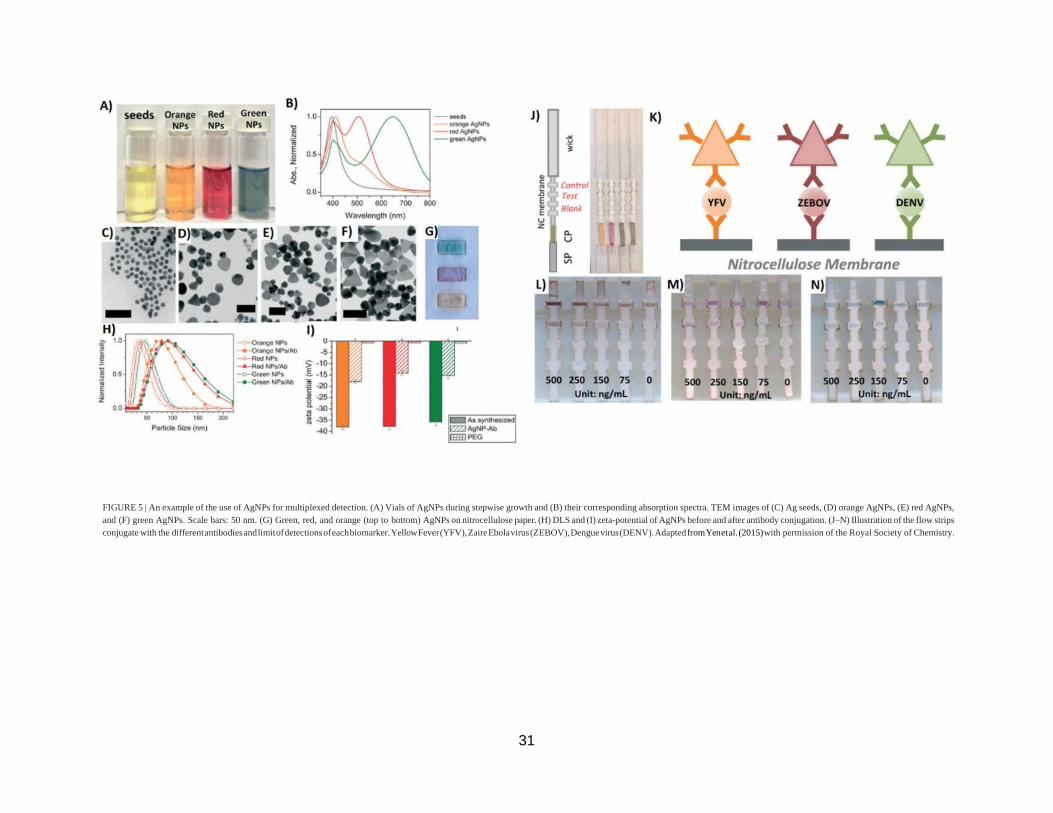
As a specific example of the use of AgNPs in the biomedical field, Yen et al. (2015) used AgNPs
of different shapes and sizes to develop a rapid point-of-care diagnostic device for field-forward screening
of severe acute systemic febrile illnesses such as Dengue, Yellow Fever, and the Ebola virus, respectively
(see Figure 5). Another main use of AgNPs is their incorporation into products in the textile field. Wu et
al. (2016), reported a simple and suitable fabrication of cotton fabrics with tunable colors, antibacterial
capabilities, and self-healing superhydrophobic properties that can be used as protective clothing for
working in moist and less-than-sanitary environments. This application consists of the deposition of
branched poly (ethylenimine) (PEI) AgNPs and fluorinated decyl polyhedral oligomeric silsesquioxanes on
cotton fabrics. Bollella et al. (2017) developed a green synthesis method to produce AgNPs by using
quercetin (polyphenolic flavonoid). The AgNPs obtained were used to generate a novel third generation
biosensor capable of measuring lactose in a large linear range, with high sensitivity and long-term stability.
31
FIGURE 5 | An example of the use of AgNPs for multiplexed detection. (A) Vials of AgNPs during stepwise growth and (B) their corresponding absorption spectra. TEM images of (C) Ag seeds, (D) orange AgNPs, (E) red AgNPs,
and (F) green AgNPs. Scale bars: 50 nm. (G) Green, red, and orange (top to bottom) AgNPs on nitrocellulose paper. (H) DLS and (I) zeta-potential of AgNPs before and after antibody conjugation. (J–N) Illustration of the flow strips
conjugate with the different antibodies and limit of detections of each biomarker. Yellow Fever (YFV), Zaire Ebola virus (ZEBOV), Dengue virus (DENV). Adapted from Yen et al. (2015) with permission of the Royal Society of Chemistry.
32
Despite the promising economic benefit of the use of AgNPs and NPs in general, there are societal
concerns associated with their use. For example, Miller and Wickson (2015) and Patenaude et al. (2015)
discussed some barriers to accurate risk assessment and management of NPs and nanomaterials in general.
These barriers include the lack of specific regulations for different types of NPs, the discrepancy between
definitions, the lack of validated analytical methods and test protocols, the scarcity of reliable information
about commercial use, and the lack of reliable exposure and toxicity data. Similarly, Hofmann et al. (2015)
discussed the need for analytical methodology to accurately characterize NP morphology as well as the
need for relevant toxicity assays in order to aid the development of regulations concerning inorganic NPs
in the biomedical field. All of these developments, capital investment, research and development, legislative
directives, and debate over regulatory approaches demonstrate the emergent role of NPs in technology,
commerce, and society and show the importance of thoroughly evaluating environment, health and safety
aspects associated with their use.
SILVER NANOPARTICLES (AgNPs): POSSIBLE IMPACTS ON ENVIRONMENT, HEALTH
AND SAFETY (EHS)
Potential Release of Ag and AgNPs in the Environment
With the increasing incorporation of nanomaterials into everyday consumer products, research
efforts have been recently undertaken to understand the fate, transport, and subsequent effects of these NPs
on the environment and higher organisms. Predictive models have been used in the U.S. and Europe to
provide a prognostication of concentrations of AgNPs in surface waters, sewage treatment plant effluents,
and sewage sludge; however, current data lack validation of the predictive modeling (Mueller and Nowack,
2008; Gottschalk et al., 2009). Further experimental modeling of assays is needed in order to implement
standardized air and aquatic screening for AgNPs.
33
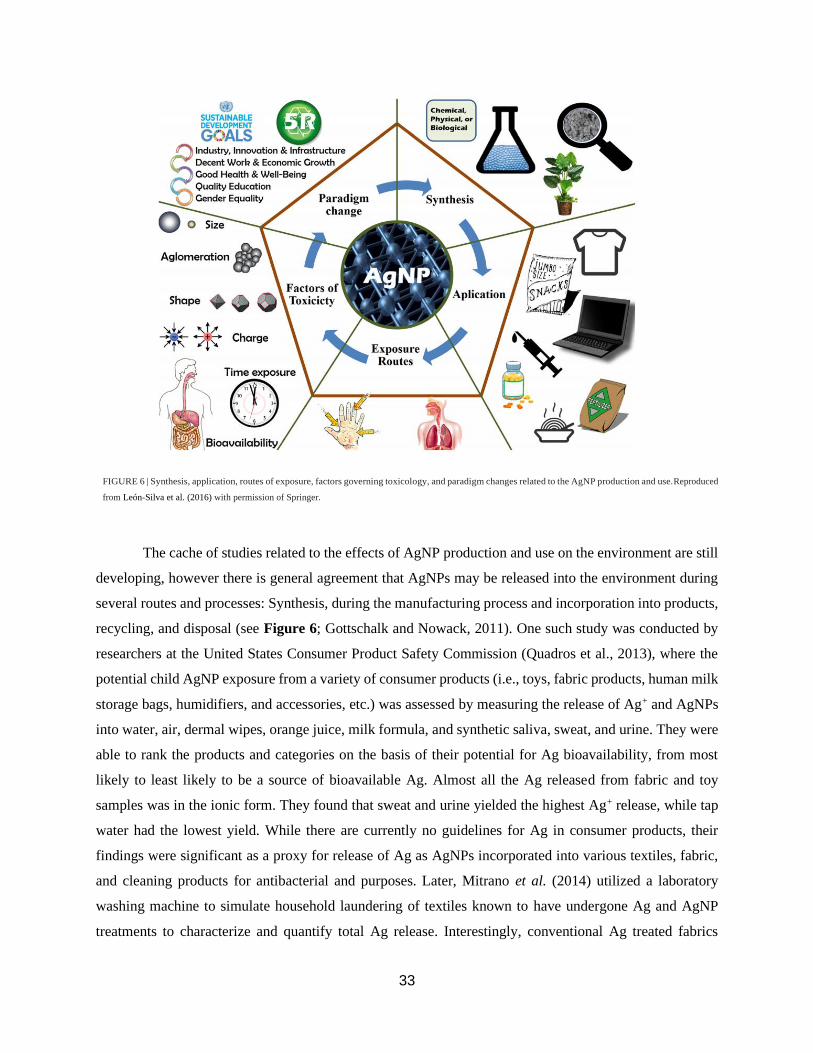
FIGURE 6 | Synthesis, application, routes of exposure, factors governing toxicology, and paradigm changes related to the AgNP production and use.Reproduced
from León-Silva et al. (2016) with permission of Springer.
The cache of studies related to the effects of AgNP production and use on the environment are still
developing, however there is general agreement that AgNPs may be released into the environment during
several routes and processes: Synthesis, during the manufacturing process and incorporation into products,
recycling, and disposal (see Figure 6; Gottschalk and Nowack, 2011). One such study was conducted by
researchers at the United States Consumer Product Safety Commission (Quadros et al., 2013), where the
potential child AgNP exposure from a variety of consumer products (i.e., toys, fabric products, human milk
storage bags, humidifiers, and accessories, etc.) was assessed by measuring the release of Ag+ and AgNPs
into water, air, dermal wipes, orange juice, milk formula, and synthetic saliva, sweat, and urine. They were
able to rank the products and categories on the basis of their potential for Ag bioavailability, from most
likely to least likely to be a source of bioavailable Ag. Almost all the Ag released from fabric and toy
samples was in the ionic form. They found that sweat and urine yielded the highest Ag+ release, while tap
water had the lowest yield. While there are currently no guidelines for Ag in consumer products, their
findings were significant as a proxy for release of Ag as AgNPs incorporated into various textiles, fabric,
and cleaning products for antibacterial and purposes. Later, Mitrano et al. (2014) utilized a laboratory
washing machine to simulate household laundering of textiles known to have undergone Ag and AgNP
treatments to characterize and quantify total Ag release. Interestingly, conventional Ag treated fabrics
34
yielded more total Ag and more nanoparticulate-sized Ag during fabric washing than the AgNP-treated
fabrics. This was evidence that conventional forms of Ag precipitate to form nanosized Ag (complexes)
and warrant careful considerations for regulatory action of nano-Ag as compared to conventional Ag forms.
In fact, several other studies have focused on assessments and quantification of the release of Ag from
AgNP-containing consumer products (Benn and Westerhoff, 2008; Kulthong et al., 2010; Von Goetz et al.,
2013). Studies such as these allow researchers to understand the behavior of AgNPs in real-world scenarios
as well as to aid risk assessments.
Interaction of AgNPs and Soil-Plant Systems
As residence times of NPs in soils and sediment generally exceed residence times in aquatic
systems, the soil-environment has been shown to act as a major sink for AgNPs (Zhai et al., 2016). Increased
interaction between terrestrial ecosystems and AgNPs are attributed to pathways that include on-site
wastewater management systems, biosolids application, improper disposal, accidental spills, and the
application of AgNPs-containing organic fertilizers and pesticides (Blaser et al., 2008; Anjum et al., 2013).
Soil is representative of a complex matrix in which NPs can interact, and thus constitutes a great conduit
toward understanding NP-physico-chemical behavior (Pan and Xing, 2012). Although limited studies exist
concerning soil/AgNP interaction, modification of AgNP properties such as dispersibility, stability,
agglomeration/aggregation, dissolution rate, aging, size, and surface area can occur through the interaction
of soil environments and AgNPs, thus affecting their availability, retention, binding affinity, transport, and
even toxicity to organisms (Bell and Kramer, 1999; Benn and Westerhoff, 2008; Geranio et al., 2009; Kim
et al., 2010; Cornelis et al., 2012).
Ag and AgNP composites have found use in the control of various phytopathogens as well as for
plant disease management (Liu et al., 2002; Park et al., 2006; Jo et al., 2009). Over the course of several
studies, it was demonstrated that AgNPs were effective against plant fungus, providing evidence that
AgNPs could serve a great purpose for controlling spore-producing fungal plant pathogens (Kim et al.,
2009b; Jung et al., 2010; Lamsal et al., 2011a, b). While the latter studies demonstrate the benefit of AgNP
soil treatment, AgNPs have also been found to have a deleterious effect, resulting in a drop in the metabolic
abilities and diversity of necessary soil microbial populations (Jo et al., 2009). Hänsch and Emmerling
(2010) identified that exposure to AgNPs of increasing concentration resulted in a significant decrease in
35
microbial mass. A study by Zhai et al. (2016) demonstrated the potential for AgNPs of different shapes to
disrupt the metabolic processes of natural soil microbial communities and also that soil microbes were more
vulnerable to AgNPs on the smaller size spectrum.
The state of AgNPs is highly dependent upon their interaction with surrounding medium
(Stebounova et al., 2011). Studies have provided compelling evidence that the interaction of AgNPs with
biological media and biomolecules is complicated and can lead to particle agglomeration, aggregation, and
dissolution (Stebounova et al., 2011; Argentiere et al., 2016). Investigations of the physical and chemical
transformation of AgNPs allow more informative assessments of the potential of AgNPs to induce toxic
responses (Park et al., 2013). Ionic strength, pH, and the presence of organic matter in biological and
environmental media have been identified as some of the most critical factors that may contribute to the
state and behavior of AgNPs. Stebounova et al. (2011) investigated the fate of AgNPs in two simulated
biological fluids (artificial interstitial fluid and artificial lysosomal fluid) and concluded that the incubation
of AgNPs in either simulated fluid led to both dissolution and precipitation of the NPs. AgNP-instability
was attributed to the failure of the protective coatings on the NPs to prevent aggregation in the biological
fluids (both of high ionic strength). In a similar way, citrate-stabilized AgNPs aggregated quickly in
standard media recommended by the Organization for Economic Co-operation and Development (OECD)
for Daphnia magna toxicity testing (Römer et al., 2011), where the high ionic strength of the media resulted
in changes in organism exposure levels. Loza et al. (2014) studied the dissolution kinetics and nature of
AgNPs after immersion in different media over 4,000 h. In their study, they hypothesized that the release
of silver ions led directly to silver toxicity and confirmed this via cell culture-, microbiological-, and
reactive oxygen species experiments. Researchers have also demonstrated that AgNPs in blood readily
interact with surrounding biomolecules such as proteins and lipids, leading to the formation of protein
coronas on the NP surface (Walczyk et al., 2010; Mahmoudi et al., 2013). On the other hand, it has been
shown that the release of silver ions can be potentially suppressed by the addition of humic and fulvic acids,
dissolved oxygen, natural and low salt sea water, and other organic matter (Liu and Hurt, 2010).
In Vitro and In Vivo AgNP Studies
In the past two decades, a large research effort has been devoted to the aspects of the toxicity of
AgNPs, covering investigations of environmental fate, and including a plethora of in vivo and in vitro
36
studies (Marambio-Jones and Hoek, 2010; Fabrega et al., 2011; Zhang et al., 2014). Comprehensive reviews
have been compiled that detail the synthesis, application, subsequent routes of exposure, and toxicological
mechanisms related to AgNP production and use (see Figure 6; León-Silva et al., 2016; Wen et al., 2016).
Published cytotoxicity tests and in vivo assays lend limited evidence to claims that silver is carcinogenic in
any tissue (U.S. Department of Health and Human Resources, 2010). However, a plethora of in vitro studies
have provided evidence that AgNPs are not only transported into cells and internalized, but target
endosomes and lysosomes (Asharani et al., 2009a; Luther et al., 2011), induce lung fibroblasts, impair the
cellular membrane, cause DNA damage and genotoxicity, chromosome aberration, and apoptosis (Almofti
et al., 2003; Asharani et al., 2009b; Yang et al., 2012; Jiang et al., 2013). Exposing A549 cells (human
alveolar basal epithelial cells) to AgNPs resulted in not only reactive oxygen species generation, but
reductions in cell viability and mitochondrial membrane potential (Chairuangkitti et al., 2013). Conversely,
exposure to AgNPs at high concentrations (up to 6.25 µg/mL) caused not only apoptosis and oxidative
stress but morphology changes in HT 1080 (human fibrosarcoma) and A431 cells (human skin/carcinoma)
cells which became less polyhedral, more fusiform, shrunken, and rounded (Arora et al., 2008).
While there is evidence that AgNPs are toxic (Maurer and Meyer, 2016), the full mechanisms of
toxicity are still not well- understood and research efforts should be devoted to gaining more clarity. The
main drawbacks to establishing a systematic comparison of the current published studies are the lack of
uniformity (in terms of size and shape) in the synthesis and the purification procedures of AgNPs, varying
size distributions, coatings, and precursors, a lack of particle characterization, and the lack of
implementation of validation with reference materials (Gliga et al., 2014; Gorham et al., 2014).
Nonetheless, increased oxidative stress, apoptosis, and genotoxicity have been highlighted as the main in
vitro outcomes of AgNP exposure (Kim and Ryu, 2013). These confounding differences in methodology
have often lead to contradictory findings in in vitro studies. Studies that compare AgNPs of varying sizes
show a greater toxic effect for particles of smaller diameter (Carlson et al., 2008; Braydich-Stolle et al.,
2010). Oxidative stress has been the main link to the toxicity of AgNPs themselves (Kim et al., 2009a), but
far more frequently, it is the dissolution of AgNPs that leads to toxic effects which makes an understanding
of the ion release kinetics for AgNPs paramount (Foldbjerg et al., 2015). Burrell (2003) found that although
inert in the presence of fluids and secretions, to release the biologically active Ag+ which of human tissues,
metallic silver ionizes in the presence of bodily has a high affinity to sulfydryl groups and other anionic
ligands of proteins, cell membranes, and tissue debris (Burrell, 2003). Although Ag ion release has often
been highlighted as the main cause of cytotoxicity and toxic effects, researchers find difficulty in
determining the extent of the toxicity of AgNPs when Ag ions are also present in solution (the Ag ion
37
induced effects often mask the effect of AgNPs at high metal ion concentrations). Foldbjerg et al. (2015)
assert that research studies are still rife with confounding results the make ascertaining the cause of toxicity
difficult to decipher. To date, the weight researchers must place on ion release when discussing AgNP
toxicity is still a difficult concept to discern.
While AgNPs have been shown to be toxic to bacteria, hence their main use in the formulation of
antibacterial products, significant evidence is present to support the toxicity of AgNPs to other organisms.
Marambio-Jones and Hoek (2010) provide comprehensive evidence that AgNPs cause inactivity not only
in bacterial cells, but also fungi, virii, and algae. AgNPs have also been found to be toxic to models such
as zebrafish (Yeo and Yoon, 2009), Drosophila melanogaster (Ahamed et al., 2010), Daphnia magna
(Scanlan et al., 2013), and Caenorhabditis elegans (Meyer et al., 2010 and Yang et al., 2014). Yeo and
Yoon (2009) found that nano-silver ions penetrated the skin and blood tube of zebrafish larvae in the form
of aggregates, while Ahamed et al. (2010) found that AgNPs induced heat shock, oxidative stress, DNA
damage, and apoptosis in Drosophila melanogaster. Further, silver nanowires were not only toxic to
Daphnia magna, but Scanlan et al. (2013) found that the surface coating of silver nanowires (AgNWs) was
dramatically modified (as compared to pristine AgNWs) when extracted from the organism’s hemolymph.
In correlation with the effect that AgNPs have on soil and soil ecosystems, toxic effects have also been
reported on a diverse range of soil invertebrates which include Eisenia fetida, Enchytraeus albidus, Eisenia
andrei, Porcellio scaber, and Folsomia candida (Tkalec et al., 2011; Hayashi et al., 2012, 2013; Gomes et
al., 2013; Schlich et al., 2013; Waalewijn- Kool et al., 2014; Gomes et al., 2015).
Effects of Ag, AgNPs, and Ag Constituents on Human Health
As can be seen in the aforementioned sections, AgNPs have been shown to have toxic effects to
both in vitro and in vivo models, however there is a limited number of studies that report the impacts of
AgNPs on human health (Korani et al., 2015); rather, the impact of silver is most often presented. Currently
silver, present in the human body in low concentrations via inhalation of air particulate and through diet
and drinking water, is considered relatively harmless to humans and is not regarded as toxic to the immune,
cardiovascular, nervous, or reproductive systems (ATSDR, 1990; Lansdown, 2010). Even though the
benefits of the Ag on human health are yet to be proven, colloidal silver suspensions are being incorporated
into health supplements (Fabrega et al., 2011). Occupational health studies have found that long-term
exposures to Ag have led to irreversible conditions such as argyria, wherein the skin turns bluish in color
38
as a response to the accumulation of Ag in body tissues (Hill, 1941; Wadhera and Fung, 2005). It is worthy
to note that the critical oral dosage that elicits this effect is not known and may vary from individual to
individual. Silver and nanosilver accumulation in the skin, liver, kidneys, corneas, gingiva, mucous
membranes, nails, and spleen are also possible (Rosenman et al., 1979; DiVincenzo et al., 1985; Hollinger,
1996; Sue et al., 2001; Wan et al., 1991). An extensive review of the exposure-related health effects of
silver and silver related compounds was conducted by Drake and Hazelwood in 2005 and later by Lansdown
in 2010 (Drake and Hazelwood, 2005; Lansdown, 2010). Studies have listed the liver as the primary organ
for silver accumulation and elimination. Even though the majority of Ag-containing consumer products are
designated for topical application, the risk of percutaneous absorption of silver is very low as the human
epidermis is a relatively impenetrable barrier (the exception being dermal abrasions, wounds, and cuts).
Lansdown (2006) also reasons that although there is an increasing use of Ag in silver thread and textile
fibers, there has been no evidence of increased blood silver or accumulation of silver precipitates in the skin
in chronic exposure and the risks of argyria in these cases have been deemed negligible. In the same vein,
the toxic risks associated with silver ingestion are low, as most products releasing Ag ions for oral or
gastrointestinal hygiene were removed from pharmacopeias and permitted lists in most countries, in light
of the risks of argyria (Lansdown, 2010). More comprehensive studies and research efforts are necessary
to clearly aid risk assessment, identify the toxic mechanisms of AgNPs and their toxicological effects where
areas of human health are concerned.
SYNTHESIS AND STABILIZATION OF SILVER NANOPARTICLES (AgNPs) IN LIQUID
PHASE
Generally, the synthesis of NPs can be classified in two main categories: Top-down, where the
procedure involves the use of bulk materials, such as metallic silver, that are reduced to form NPs using
physical, chemical, or mechanical processes; or bottom-up, where the procedure requires starting from
molecules, atoms, or ions to obtain NPs (Hornyak et al., 2008). Most NP synthesis approaches focus on
bottom-up procedures, particularly in liquid phase media (Klabunde, 2001; Cunningham and Bürgi, 2013;
Cushing et al., 2014; Majdalawieh et al., 2014) and nucleation theories and mechanisms have been
extensively described by Cushing et al. (2014), Viswanatha and Sarma (2007), Finney and Finke (2008),
Thanh et al. (2014), and Kettemann et al. (2016).
In recent years, the development of methods for the synthesis of AgNPs has been the subject of
significant interest (Tran et al., 2013). Generally, AgNPs are synthetized in liquid phase using chemical
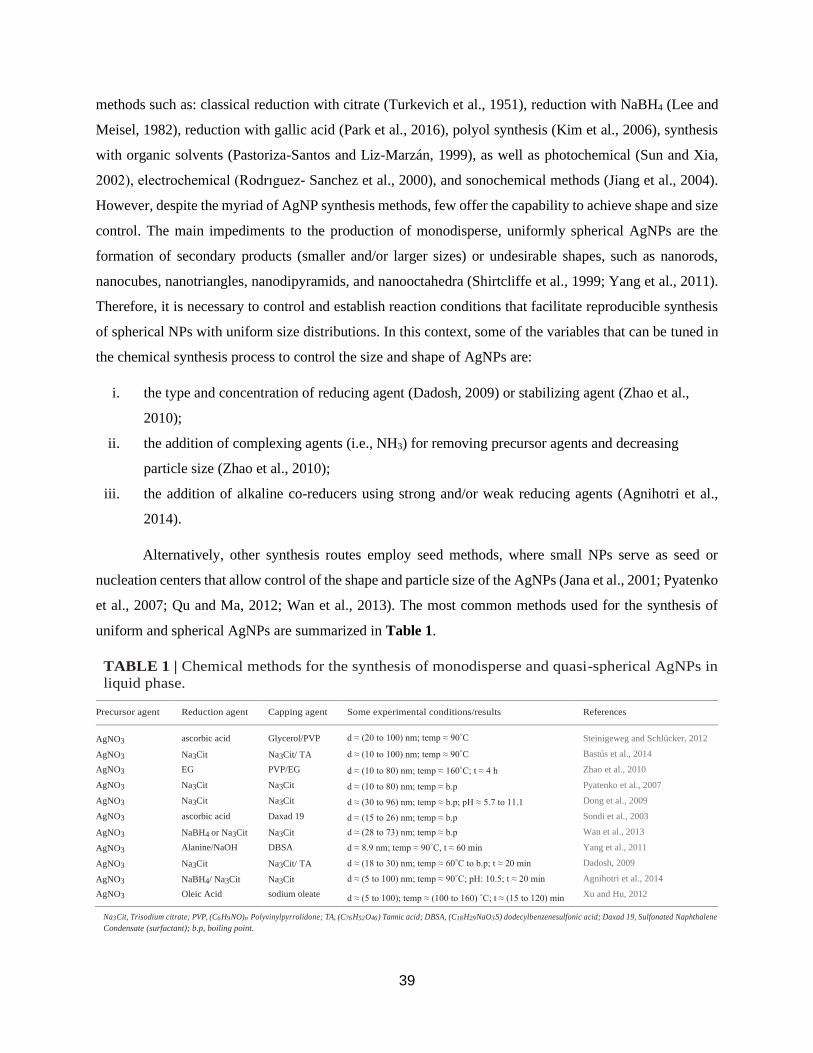
39
methods such as: classical reduction with citrate (Turkevich et al., 1951), reduction with NaBH4 (Lee and
Meisel, 1982), reduction with gallic acid (Park et al., 2016), polyol synthesis (Kim et al., 2006), synthesis
with organic solvents (Pastoriza-Santos and Liz-Marzán, 1999), as well as photochemical (Sun and Xia,
2002), electrochemical (Rodrıguez- Sanchez et al., 2000), and sonochemical methods (Jiang et al., 2004).
However, despite the myriad of AgNP synthesis methods, few offer the capability to achieve shape and size
control. The main impediments to the production of monodisperse, uniformly spherical AgNPs are the
formation of secondary products (smaller and/or larger sizes) or undesirable shapes, such as nanorods,
nanocubes, nanotriangles, nanodipyramids, and nanooctahedra (Shirtcliffe et al., 1999; Yang et al., 2011).
Therefore, it is necessary to control and establish reaction conditions that facilitate reproducible synthesis
of spherical NPs with uniform size distributions. In this context, some of the variables that can be tuned in
the chemical synthesis process to control the size and shape of AgNPs are:
i. the type and concentration of reducing agent (Dadosh, 2009) or stabilizing agent (Zhao et al.,
2010);
ii. the addition of complexing agents (i.e., NH3) for removing precursor agents and decreasing
particle size (Zhao et al., 2010);
iii. the addition of alkaline co-reducers using strong and/or weak reducing agents (Agnihotri et al.,
2014).
Alternatively, other synthesis routes employ seed methods, where small NPs serve as seed or
nucleation centers that allow control of the shape and particle size of the AgNPs (Jana et al., 2001; Pyatenko
et al., 2007; Qu and Ma, 2012; Wan et al., 2013). The most common methods used for the synthesis of
uniform and spherical AgNPs are summarized in Table 1.
TABLE 1 | Chemical methods for the synthesis of monodisperse and quasi-spherical AgNPs in
liquid phase.
Precursor agent Reduction agent Capping agent Some experimental conditions/results References
AgNO3 ascorbic acid Glycerol/PVP d ≈ (20 to 100) nm; temp ≈ 90◦C Steinigeweg and Schlücker, 2012
AgNO3 Na3Cit Na3Cit/ TA d ≈ (10 to 100) nm; temp ≈ 90◦C Bastús et al., 2014
AgNO3 EG PVP/EG d ≈ (10 to 80) nm; temp ≈ 160◦C; t ≈ 4 h Zhao et al., 2010
AgNO3 Na3Cit Na3Cit d ≈ (10 to 80) nm; temp ≈ b.p Pyatenko et al., 2007
AgNO3 Na3Cit Na3Cit d ≈ (30 to 96) nm; temp ≈ b.p; pH ≈ 5.7 to 11.1 Dong et al., 2009
AgNO3 ascorbic acid Daxad 19 d ≈ (15 to 26) nm; temp ≈ b.p Sondi et al., 2003
AgNO3 NaBH4 or Na3Cit Na3Cit d ≈ (28 to 73) nm; temp ≈ b.p Wan et al., 2013
AgNO3 Alanine/NaOH DBSA d ≈ 8.9 nm; temp ≈ 90◦C, t ≈ 60 min Yang et al., 2011
AgNO3 Na3Cit Na3Cit/ TA d ≈ (18 to 30) nm; temp ≈ 60◦C to b.p; t ≈ 20 min Dadosh, 2009
AgNO3 NaBH4/ Na3Cit Na3Cit d ≈ (5 to 100) nm; temp ≈ 90◦C; pH: 10.5; t ≈ 20 min Agnihotri et al., 2014
AgNO3 Oleic Acid sodium oleate d ≈ (5 to 100); temp ≈ (100 to 160) ◦C; t ≈ (15 to 120) min Xu and Hu, 2012
Na3 Cit, Trisodium citrate; PVP, (C6 H9 NO)n Polyvinylpyrrolidone; TA, (C76 H52 O46 ) Tannic acid; DBSA, (C18 H29 NaO3 S) dodecylbenzenesulfonic acid; Daxad 19, Sulfonated Naphthalene
Condensate (surfactant); b.p, boiling point.
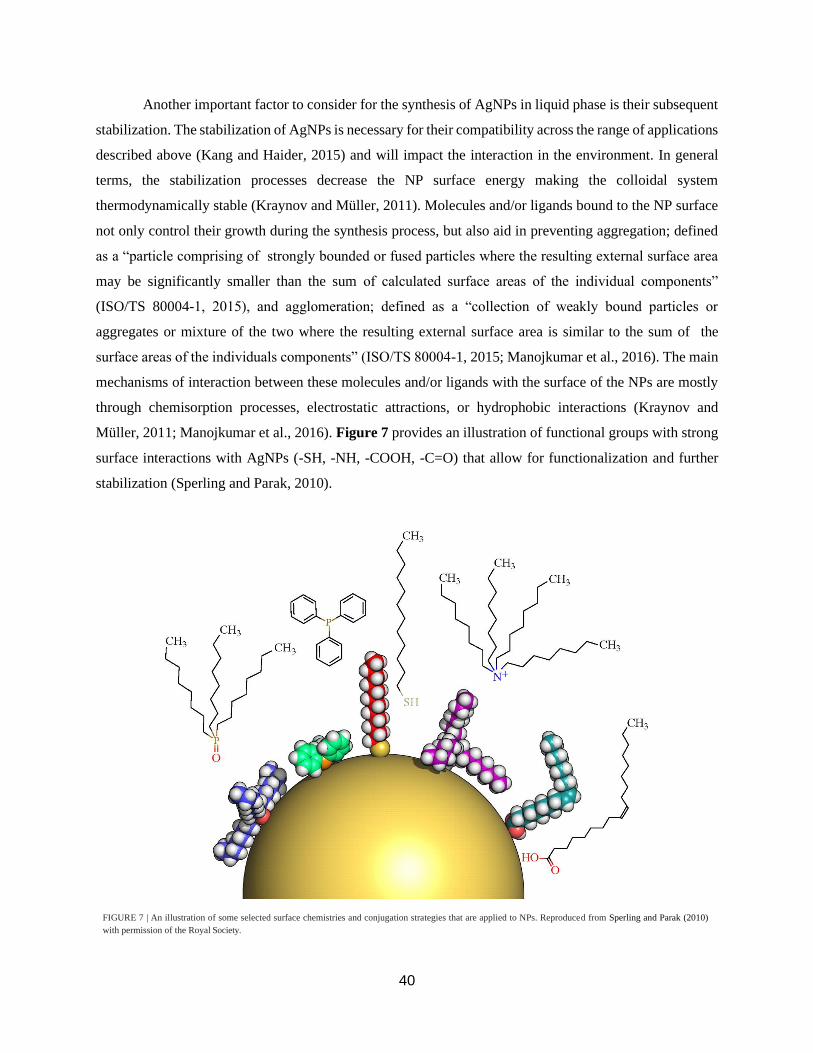
40
Another important factor to consider for the synthesis of AgNPs in liquid phase is their subsequent
stabilization. The stabilization of AgNPs is necessary for their compatibility across the range of applications
described above (Kang and Haider, 2015) and will impact the interaction in the environment. In general
terms, the stabilization processes decrease the NP surface energy making the colloidal system
thermodynamically stable (Kraynov and Müller, 2011). Molecules and/or ligands bound to the NP surface
not only control their growth during the synthesis process, but also aid in preventing aggregation; defined
as a “particle comprising of strongly bounded or fused particles where the resulting external surface area
may be significantly smaller than the sum of calculated surface areas of the individual components”
(ISO/TS 80004-1, 2015), and agglomeration; defined as a “collection of weakly bound particles or
aggregates or mixture of the two where the resulting external surface area is similar to the sum of the
surface areas of the individuals components” (ISO/TS 80004-1, 2015; Manojkumar et al., 2016). The main
mechanisms of interaction between these molecules and/or ligands with the surface of the NPs are mostly
through chemisorption processes, electrostatic attractions, or hydrophobic interactions (Kraynov and
Müller, 2011; Manojkumar et al., 2016). Figure 7 provides an illustration of functional groups with strong
surface interactions with AgNPs (-SH, -NH, -COOH, -C=O) that allow for functionalization and further
stabilization (Sperling and Parak, 2010).
FIGURE 7 | An illustration of some selected surface chemistries and conjugation strategies that are applied to NPs. Reproduced from Sperling and Parak (2010)
with permission of the Royal Society.
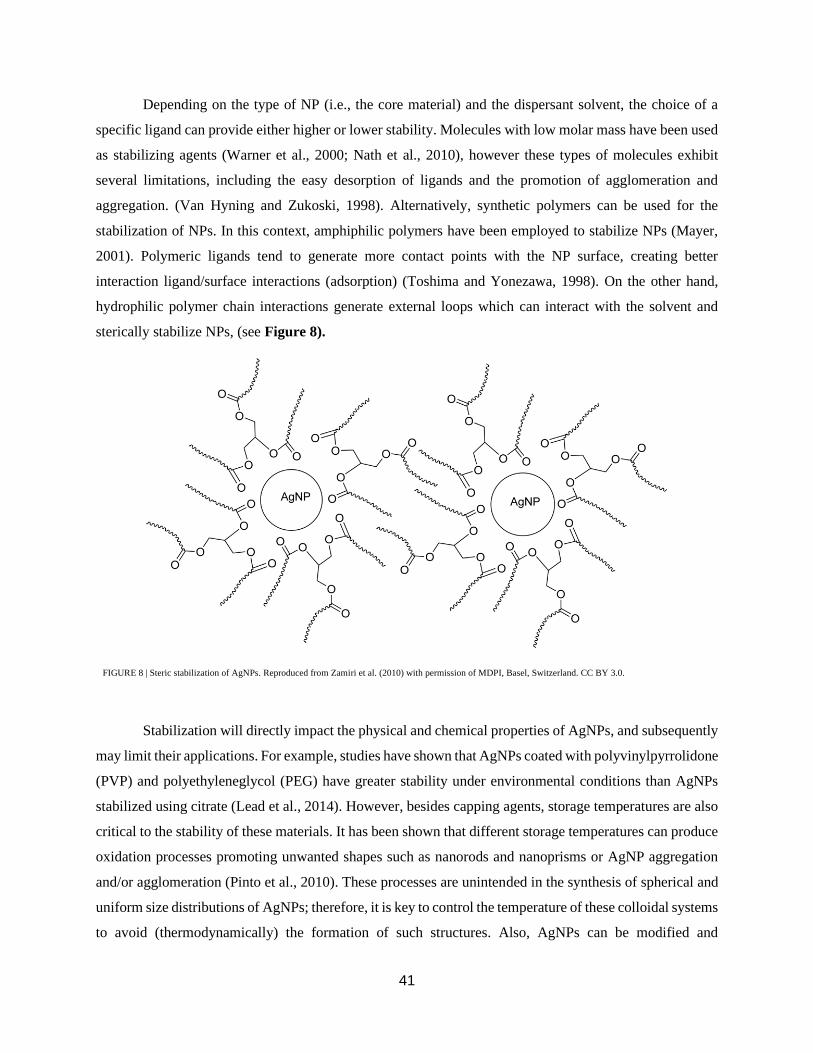
41
Depending on the type of NP (i.e., the core material) and the dispersant solvent, the choice of a
specific ligand can provide either higher or lower stability. Molecules with low molar mass have been used
as stabilizing agents (Warner et al., 2000; Nath et al., 2010), however these types of molecules exhibit
several limitations, including the easy desorption of ligands and the promotion of agglomeration and
aggregation. (Van Hyning and Zukoski, 1998). Alternatively, synthetic polymers can be used for the
stabilization of NPs. In this context, amphiphilic polymers have been employed to stabilize NPs (Mayer,
2001). Polymeric ligands tend to generate more contact points with the NP surface, creating better
interaction ligand/surface interactions (adsorption) (Toshima and Yonezawa, 1998). On the other hand,
hydrophilic polymer chain interactions generate external loops which can interact with the solvent and
sterically stabilize NPs, (see Figure 8).
FIGURE 8 | Steric stabilization of AgNPs. Reproduced from Zamiri et al. (2010) with permission of MDPI, Basel, Switzerland. CC BY 3.0.
Stabilization will directly impact the physical and chemical properties of AgNPs, and subsequently
may limit their applications. For example, studies have shown that AgNPs coated with polyvinylpyrrolidone
(PVP) and polyethyleneglycol (PEG) have greater stability under environmental conditions than AgNPs
stabilized using citrate (Lead et al., 2014). However, besides capping agents, storage temperatures are also
critical to the stability of these materials. It has been shown that different storage temperatures can produce
oxidation processes promoting unwanted shapes such as nanorods and nanoprisms or AgNP aggregation
and/or agglomeration (Pinto et al., 2010). These processes are unintended in the synthesis of spherical and
uniform size distributions of AgNPs; therefore, it is key to control the temperature of these colloidal systems
to avoid (thermodynamically) the formation of such structures. Also, AgNPs can be modified and
42
destabilized by photochemical reactions. Gorham et al. (2012) showed that AgNPs coated with citrate can
be destabilized with UV radiation exposure. Other factors to take into account with regard to the
destabilization of AgNPs are post-synthesis residues and incorrect purification procedures. For examples,
high concentrations of remnant precursors and/or reducing agents in the liquid phase promote the
transformation of AgNPs into new shapes such as nanorods, nanocubes, and nanotriangles (Murphy et al.,
2001; Dadosh, 2009; Pinto et al., 2010). Additionally, pH plays an important role which is shown where
amino acid-coated AgNPs have improved stability under acidic conditions (pH ≈ 3), eliminating the
formation of agglomerates due to suppression of intermolecular interactions between solvent and ligand
(Bayram et al., 2015).
Recently, it has been discovered that the use of biopolymers as a capping agents foster
biocompatibility and safety from toxicological points of view (Jena et al., 2012). Specifically, different
carbohydrates and their derivatives such as a guar gum (Vanamudan and Sudhakar, 2016), carboxymethyl
cellulose (CMC) (Velusamy et al., 2016), dextran (Cakic´ et al., 2016), kappa-carrageen (Elsupikhe et al.,
2015), sodium alginate (Chunfa et al., 2016), chitosan (Shanmugaraj and Ilanchelian, 2016), heparin (Kemp
et al., 2009), and hyaluronic acid (Yahyaei et al., 2016) have been employed to stabilize AgNPs. Proteins
have also been employed for the stabilization of AgNPs. Darroudi et al. (2011) provided a procedure for
the sonochemical synthesis of AgNPs using gelatin as both a reducing and coating agent, obtaining very
promising results in terms of sphericity and distribution of particles in the sub-10 nm range.
Furthermore, some studies demonstrate the good stability of capped biopolymer-AgNPs. Chen et
al. (2008b) obtained highly stable AgNPs-CMC that showed no apparent change in their optical spectrum
extinction when stored at 25 ºC for 58 days. Darroudi et al. (2011) determined that there is no change in
optical extinction spectrum of AgNPs capped with chitosan/gelatin over a period of 4 months. Shanmugaraj
and Ilanchelian (2016) later demonstrated that AgNPs capped with chitosan were stable for more than 4
months. All the studies described above, show that biopolymers can be used as capping agents and provide
evidence for employing these macromolecules as stabilizing agents for NPs in liquid phase. Overall, the
stabilization of AgNPs and other NPs in liquid phase is still considered a chemical challenge, mainly due
to the complexity of some liquid media (biological, environmental, organic, etc.), environmental factors,
and also due to the highly dynamic diffusion, sedimentation, agglomeration, and aggregation processes that
AgNP experience which can reduce their entropy.
43
MEASUREMENT AND CHARACTERIZATION OF SILVER NANOPARTICLES (AgNPs): A
METROLOGICAL APPROACH
As previously mentioned, NPs constitute a focus of interest in nanoscience and nanotechnology
(Kang and Haider, 2015; Sharma et al., 2015). Particularly, there is an interest in establishing controlled
chemical (e.g., chemical composition of the core, surface chemistry, bulk element composition,
internal/external chemistry of mixing state, and oxidation state) and physical properties (e.g., size, shape,
number and mass concentration, surface area, total mass, crystallinity, morphology, and optical properties)
of these nanoobjects. Moreover, due to advancements in the production and applications of nanomaterials,
scientists are developing new, and adapting classic, analytical techniques for the detection, characterization,
and quantification of NPs. An extensive discussion of the fundamentals and analytical capabilities of the
most common techniques for the characterization of NPs (specifically metal, metal oxide and metalloid)
has been thoroughly reviewed (Gunsolus and Haynes, 2015; Costa-Fernandez et al., 2016; Laborda et al.,
2016; Majedy and Lee, 2016) and can be used for further consultation. The main current measurement
techniques (MTs) for the characterization of NPs in general, and AgNPs in particular, and the requisite
information they provide are listed in Table 2.
Advances in the characterization of NPs need to be accompanied with a standardized metrological
approach (metrological traceability, estimation of the measurement uncertainty, use of
standardized/validated methods, use of reference materials, participation in interlaborary comparisons) to
assure the comparability of the measurements at the nanoscale. In others words, the measurements made
using a metrological approach allow the establishment of extremely important variables in the quality of
the measurements such as bias, precision and traceability to International System of Units (S.I).
Consequently, it allows accurate and concrete conclusions of the chemical or physical property studied at
the nanoscale. In the last decade, some institutions and standardization bodies have been working to
establish standards, protocols, guidelines, and procedures for the correct measurement and characterization
of NPs (see Table 3).
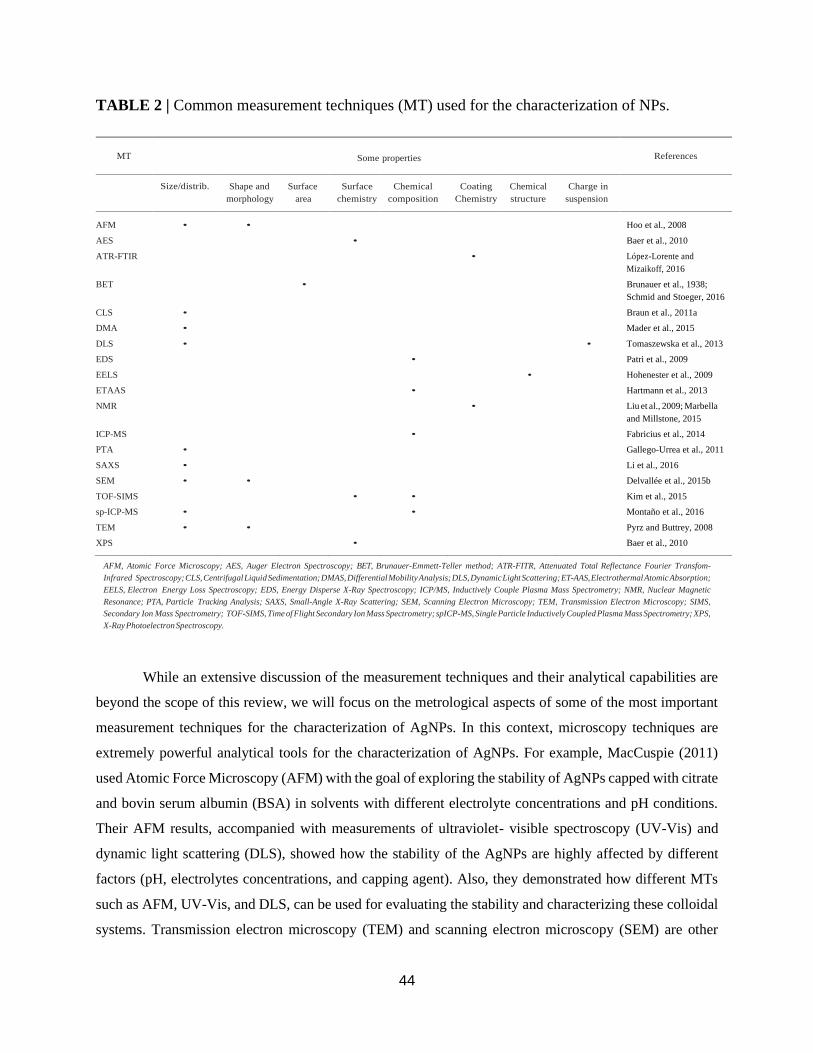
44
TABLE 2 | Common measurement techniques (MT) used for the characterization of NPs.
MT Some properties References
Size/distrib. Shape and
morphology
Surface
area
Surface
chemistry
Chemical
composition
Coating
Chemistry
Chemical
structure
Charge in
suspension
AFM • •
Hoo et al., 2008
AES • Baer et al., 2010
ATR-FTIR • López-Lorente and
Mizaikoff, 2016
BET • Brunauer et al., 1938;
Schmid and Stoeger, 2016
CLS • Braun et al., 2011a
DMA • Mader et al., 2015
DLS • • Tomaszewska et al., 2013
EDS • Patri et al., 2009
EELS • Hohenester et al., 2009
ETAAS • Hartmann et al., 2013
NMR • Liu et al., 2009; Marbella
and Millstone, 2015
ICP-MS • Fabricius et al., 2014
PTA • Gallego-Urrea et al., 2011
SAXS • Li et al., 2016
SEM • • Delvallée et al., 2015b
TOF-SIMS • • Kim et al., 2015
sp-ICP-MS • • Montaño et al., 2016
TEM • • Pyrz and Buttrey, 2008
XPS • Baer et al., 2010
AFM, Atomic Force Microscopy; AES, Auger Electron Spectroscopy; BET, Brunauer-Emmett-Teller method; ATR-FITR, Attenuated Total Reflectance Fourier Transfom-
Infrared Spectroscopy; CLS, Centrifugal Liquid Sedimentation; DMAS, Differential Mobility Analysis; DLS, Dynamic Light Scattering; ET-AAS, Electrothermal Atomic Absorption;
EELS, Electron Energy Loss Spectroscopy; EDS, Energy Disperse X-Ray Spectroscopy; ICP/MS, Inductively Couple Plasma Mass Spectrometry; NMR, Nuclear Magnetic
Resonance; PTA, Particle Tracking Analysis; SAXS, Small-Angle X-Ray Scattering; SEM, Scanning Electron Microscopy; TEM, Transmission Electron Microscopy; SIMS,
Secondary Ion Mass Spectrometry; TOF-SIMS, Time of Flight Secondary Ion Mass Spectrometry; spICP-MS, Single Particle Inductively Coupled Plasma Mass Spectrometry; XPS,
X-Ray Photoelectron Spectroscopy.
While an extensive discussion of the measurement techniques and their analytical capabilities are
beyond the scope of this review, we will focus on the metrological aspects of some of the most important
measurement techniques for the characterization of AgNPs. In this context, microscopy techniques are
extremely powerful analytical tools for the characterization of AgNPs. For example, MacCuspie (2011)
used Atomic Force Microscopy (AFM) with the goal of exploring the stability of AgNPs capped with citrate
and bovin serum albumin (BSA) in solvents with different electrolyte concentrations and pH conditions.
Their AFM results, accompanied with measurements of ultraviolet- visible spectroscopy (UV-Vis) and
dynamic light scattering (DLS), showed how the stability of the AgNPs are highly affected by different
factors (pH, electrolytes concentrations, and capping agent). Also, they demonstrated how different MTs
such as AFM, UV-Vis, and DLS, can be used for evaluating the stability and characterizing these colloidal
systems. Transmission electron microscopy (TEM) and scanning electron microscopy (SEM) are other
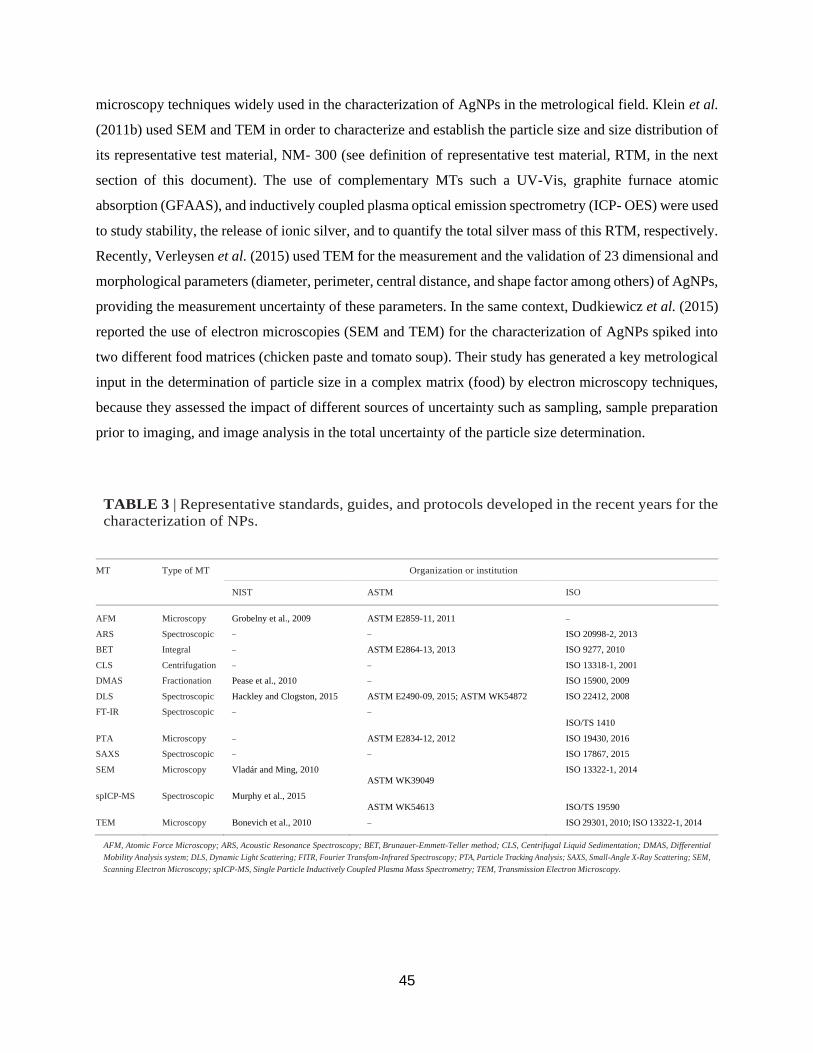
45
microscopy techniques widely used in the characterization of AgNPs in the metrological field. Klein et al.
(2011b) used SEM and TEM in order to characterize and establish the particle size and size distribution of
its representative test material, NM- 300 (see definition of representative test material, RTM, in the next
section of this document). The use of complementary MTs such a UV-Vis, graphite furnace atomic
absorption (GFAAS), and inductively coupled plasma optical emission spectrometry (ICP- OES) were used
to study stability, the release of ionic silver, and to quantify the total silver mass of this RTM, respectively.
Recently, Verleysen et al. (2015) used TEM for the measurement and the validation of 23 dimensional and
morphological parameters (diameter, perimeter, central distance, and shape factor among others) of AgNPs,
providing the measurement uncertainty of these parameters. In the same context, Dudkiewicz et al. (2015)
reported the use of electron microscopies (SEM and TEM) for the characterization of AgNPs spiked into
two different food matrices (chicken paste and tomato soup). Their study has generated a key metrological
input in the determination of particle size in a complex matrix (food) by electron microscopy techniques,
because they assessed the impact of different sources of uncertainty such as sampling, sample preparation
prior to imaging, and image analysis in the total uncertainty of the particle size determination.
TABLE 3 | Representative standards, guides, and protocols developed in the recent years for the
characterization of NPs.
MT Type of MT Organization or institution
NIST ASTM ISO
AFM Microscopy Grobelny et al., 2009 ASTM E2859-11, 2011 –
ARS Spectroscopic – – ISO 20998-2, 2013
BET Integral – ASTM E2864-13, 2013 ISO 9277, 2010
CLS Centrifugation – – ISO 13318-1, 2001
DMAS Fractionation Pease et al., 2010 – ISO 15900, 2009
DLS Spectroscopic Hackley and Clogston, 2015 ASTM E2490-09, 2015; ASTM WK54872 ISO 22412, 2008
FT-IR Spectroscopic – – ISO/TS 1410
PTA Microscopy – ASTM E2834-12, 2012 ISO 19430, 2016
SAXS Spectroscopic – – ISO 17867, 2015
SEM Microscopy Vladár and Ming, 2010 ASTM WK39049
ISO 13322-1, 2014
spICP-MS Spectroscopic Murphy et al., 2015 ASTM WK54613
ISO/TS 19590
TEM Microscopy Bonevich et al., 2010 – ISO 29301, 2010; ISO 13322-1, 2014
AFM, Atomic Force Microscopy; ARS, Acoustic Resonance Spectroscopy; BET, Brunauer-Emmett-Teller method; CLS, Centrifugal Liquid Sedimentation; DMAS, Differential
Mobility Analysis system; DLS, Dynamic Light Scattering; FITR, Fourier Transfom-Infrared Spectroscopy; PTA, Particle Tracking Analysis; SAXS, Small-Angle X-Ray Scattering; SEM,
Scanning Electron Microscopy; spICP-MS, Single Particle Inductively Coupled Plasma Mass Spectrometry; TEM, Transmission Electron Microscopy.
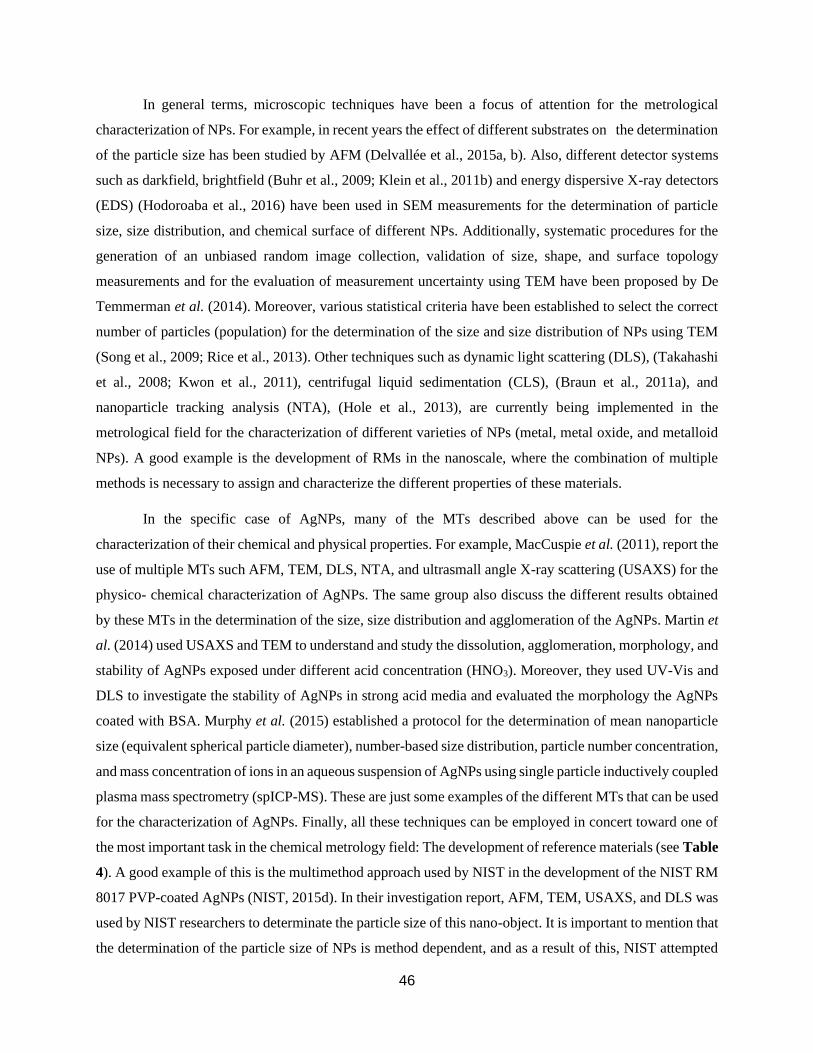
46
In general terms, microscopic techniques have been a focus of attention for the metrological
characterization of NPs. For example, in recent years the effect of different substrates on the determination
of the particle size has been studied by AFM (Delvallée et al., 2015a, b). Also, different detector systems
such as darkfield, brightfield (Buhr et al., 2009; Klein et al., 2011b) and energy dispersive X-ray detectors
(EDS) (Hodoroaba et al., 2016) have been used in SEM measurements for the determination of particle
size, size distribution, and chemical surface of different NPs. Additionally, systematic procedures for the
generation of an unbiased random image collection, validation of size, shape, and surface topology
measurements and for the evaluation of measurement uncertainty using TEM have been proposed by De
Temmerman et al. (2014). Moreover, various statistical criteria have been established to select the correct
number of particles (population) for the determination of the size and size distribution of NPs using TEM
(Song et al., 2009; Rice et al., 2013). Other techniques such as dynamic light scattering (DLS), (Takahashi
et al., 2008; Kwon et al., 2011), centrifugal liquid sedimentation (CLS), (Braun et al., 2011a), and
nanoparticle tracking analysis (NTA), (Hole et al., 2013), are currently being implemented in the
metrological field for the characterization of different varieties of NPs (metal, metal oxide, and metalloid
NPs). A good example is the development of RMs in the nanoscale, where the combination of multiple
methods is necessary to assign and characterize the different properties of these materials.
In the specific case of AgNPs, many of the MTs described above can be used for the
characterization of their chemical and physical properties. For example, MacCuspie et al. (2011), report the
use of multiple MTs such AFM, TEM, DLS, NTA, and ultrasmall angle X-ray scattering (USAXS) for the
physico- chemical characterization of AgNPs. The same group also discuss the different results obtained
by these MTs in the determination of the size, size distribution and agglomeration of the AgNPs. Martin et
al. (2014) used USAXS and TEM to understand and study the dissolution, agglomeration, morphology, and
stability of AgNPs exposed under different acid concentration (HNO3). Moreover, they used UV-Vis and
DLS to investigate the stability of AgNPs in strong acid media and evaluated the morphology the AgNPs
coated with BSA. Murphy et al. (2015) established a protocol for the determination of mean nanoparticle
size (equivalent spherical particle diameter), number-based size distribution, particle number concentration,
and mass concentration of ions in an aqueous suspension of AgNPs using single particle inductively coupled
plasma mass spectrometry (spICP-MS). These are just some examples of the different MTs that can be used
for the characterization of AgNPs. Finally, all these techniques can be employed in concert toward one of
the most important task in the chemical metrology field: The development of reference materials (see Table
4). A good example of this is the multimethod approach used by NIST in the development of the NIST RM
8017 PVP-coated AgNPs (NIST, 2015d). In their investigation report, AFM, TEM, USAXS, and DLS was
used by NIST researchers to determinate the particle size of this nano-object. It is important to mention that
the determination of the particle size of NPs is method dependent, and as a result of this, NIST attempted
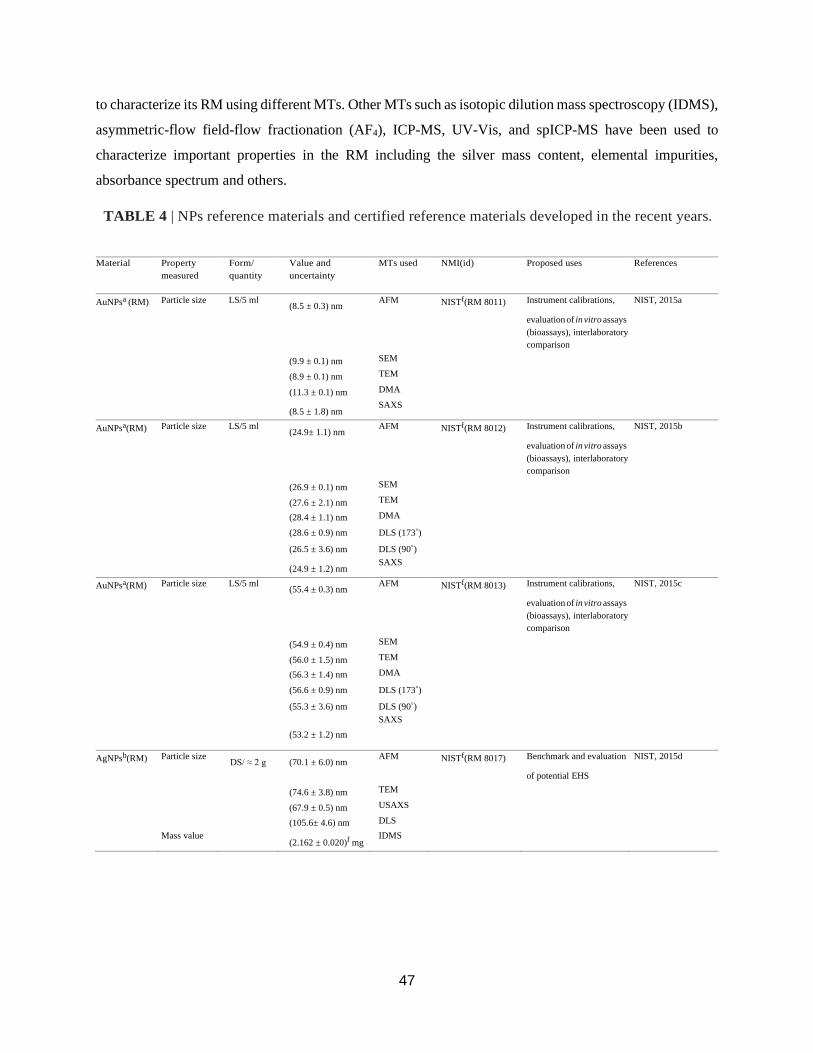
47
to characterize its RM using different MTs. Other MTs such as isotopic dilution mass spectroscopy (IDMS),
asymmetric-flow field-flow fractionation (AF4), ICP-MS, UV-Vis, and spICP-MS have been used to
characterize important properties in the RM including the silver mass content, elemental impurities,
absorbance spectrum and others.
TABLE 4 | NPs reference materials and certified reference materials developed in the recent years.
Material Property
measured
Form/
quantity
Value and
uncertainty
MTs used NMI(id) Proposed uses References
AuNPsa (RM) Particle size LS/5 ml (8.5 ± 0.3) nm
AFM NISTf(RM 8011) Instrument calibrations, NIST, 2015a
evaluation of in vitro assays
(bioassays), interlaboratory
comparison
(9.9 ± 0.1) nm SEM
(8.9 ± 0.1) nm TEM
(11.3 ± 0.1) nm DMA
(8.5 ± 1.8) nm
SAXS
AuNPsa(RM) Particle size LS/5 ml (24.9± 1.1) nm
AFM NISTf(RM 8012) Instrument calibrations, NIST, 2015b
evaluation of in vitro assays
(bioassays), interlaboratory
comparison
(26.9 ± 0.1) nm SEM
(27.6 ± 2.1) nm TEM
(28.4 ± 1.1) nm DMA
(28.6 ± 0.9) nm DLS (173◦)
(26.5 ± 3.6) nm DLS (90◦)
(24.9 ± 1.2) nm
SAXS
AuNPsa(RM) Particle size LS/5 ml (55.4 ± 0.3) nm
AFM NISTf(RM 8013) Instrument calibrations, NIST, 2015c
evaluation of in vitro assays
(bioassays), interlaboratory
comparison
(54.9 ± 0.4) nm SEM
(56.0 ± 1.5) nm TEM
(56.3 ± 1.4) nm DMA
(56.6 ± 0.9) nm DLS (173◦)
(55.3 ± 3.6) nm DLS (90◦)
(53.2 ± 1.2) nm
SAXS
AgNPsb(RM) Particle size DS/ ≈ 2 g (70.1 ± 6.0) nm
AFM NISTf(RM 8017) Benchmark and evaluation NIST, 2015d
of potential EHS
(74.6 ± 3.8) nm TEM
(67.9 ± 0.5) nm USAXS
(105.6± 4.6) nm DLS
Mass value (2.162 ± 0.020)f mg
IDMS
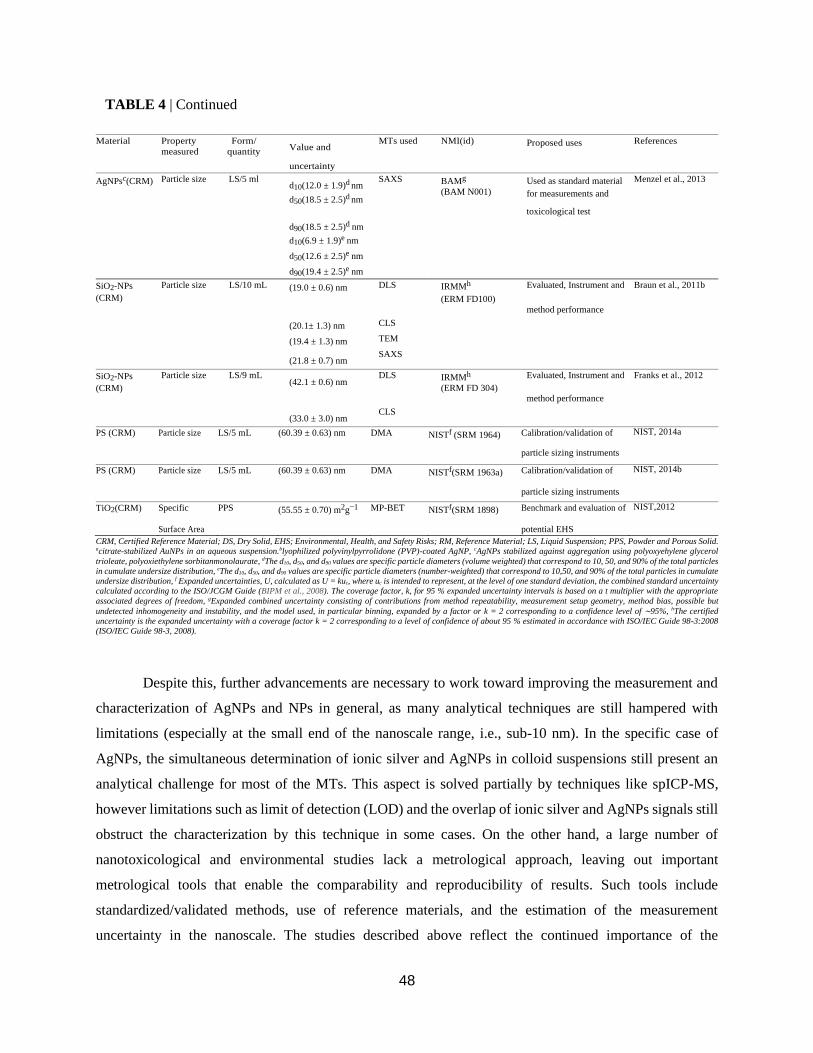
48
TABLE 4 | Continued
Material Property
measured
Form/
quantity Value and
uncertainty
MTs used NMI(id) Proposed uses References
AgNPsc(CRM) Particle size LS/5 ml d10(12.0 ± 1.9)d nm
d50(18.5 ± 2.5)d nm
SAXS BAMg
(BAM N001)
Used as standard material
for measurements and
Menzel et al., 2013
toxicological test
d90(18.5 ± 2.5)d nm
d10(6.9 ± 1.9)e nm
d50(12.6 ± 2.5)e nm
d90(19.4 ± 2.5)e nm
SiO2-NPs
(CRM)
Particle size LS/10 mL (19.0 ± 0.6) nm DLS IRMMh
(ERM FD100)
Evaluated, Instrument and Braun et al., 2011b
method performance
(20.1± 1.3) nm CLS
(19.4 ± 1.3) nm TEM
(21.8 ± 0.7) nm
SAXS
SiO2-NPs
(CRM)
Particle size LS/9 mL (42.1 ± 0.6) nm
DLS IRMMh
(ERM FD 304)
Evaluated, Instrument and Franks et al., 2012
method performance
(33.0 ± 3.0) nm
CLS
PS (CRM) Particle size LS/5 mL (60.39 ± 0.63) nm DMA NISTf (SRM 1964) Calibration/validation of
particle sizing instruments
NIST, 2014a
PS (CRM) Particle size LS/5 mL (60.39 ± 0.63) nm DMA NISTf(SRM 1963a) Calibration/validation of
particle sizing instruments
NIST, 2014b
TiO2(CRM)
Specific
Surface Area
PPS (55.55 ± 0.70) m2g−1 MP-BET NISTf(SRM 1898) Benchmark and evaluation of
potential EHS
NIST,2012
CRM, Certified Reference Material; DS, Dry Solid, EHS; Environmental, Health, and Safety Risks; RM, Reference Material; LS, Liquid Suspension; PPS, Powder and Porous Solid. acitrate-stabilized AuNPs in an aqueous suspension.blyophilized polyvinylpyrrolidone (PVP)-coated AgNP, cAgNPs stabilized against aggregation using polyoxyehylene glycerol
trioleate, polyoxiethylene sorbitanmonolaurate, dThe d10, d50, and d90 values are specific particle diameters (volume weighted) that correspond to 10, 50, and 90% of the total particles
in cumulate undersize distribution, eThe d10, d50, and d90 values are specific particle diameters (number-weighted) that correspond to 10,50, and 90% of the total particles in cumulate
undersize distribution, f Expanded uncertainties, U, calculated as U = kuc, where uc is intended to represent, at the level of one standard deviation, the combined standard uncertainty
calculated according to the ISO/JCGM Guide (BIPM et al., 2008). The coverage factor, k, for 95 % expanded uncertainty intervals is based on a t multiplier with the appropriate
associated degrees of freedom, gExpanded combined uncertainty consisting of contributions from method repeatability, measurement setup geometry, method bias, possible but
undetected inhomogeneity and instability, and the model used, in particular binning, expanded by a factor or k = 2 corresponding to a confidence level of ∼95%, hThe certified
uncertainty is the expanded uncertainty with a coverage factor k = 2 corresponding to a level of confidence of about 95 % estimated in accordance with ISO/IEC Guide 98-3:2008
(ISO/IEC Guide 98-3, 2008).
Despite this, further advancements are necessary to work toward improving the measurement and
characterization of AgNPs and NPs in general, as many analytical techniques are still hampered with
limitations (especially at the small end of the nanoscale range, i.e., sub-10 nm). In the specific case of
AgNPs, the simultaneous determination of ionic silver and AgNPs in colloid suspensions still present an
analytical challenge for most of the MTs. This aspect is solved partially by techniques like spICP-MS,
however limitations such as limit of detection (LOD) and the overlap of ionic silver and AgNPs signals still
obstruct the characterization by this technique in some cases. On the other hand, a large number of
nanotoxicological and environmental studies lack a metrological approach, leaving out important
metrological tools that enable the comparability and reproducibility of results. Such tools include
standardized/validated methods, use of reference materials, and the estimation of the measurement
uncertainty in the nanoscale. The studies described above reflect the continued importance of the
49
development of robust, comparable, analytical methodology in order to achieve improvement of
measurement in the nanoscale.
DEVELOPMENT OF NANOPARTICLE REFERENCE MATERIALS (RMs) IN THE
NANOSCALE
Advances in nanoscience create demand for improvement in measurement capabilities. Therefore,
quantitative measurements, stable instruments (in terms of drift, instrumental noise, sensitivity, and LOD),
measurement protocols, and reference materials (RMs) are metrological mechanisms necessary for the
advancement and consolidation of reliable and traceable measurements in this field (Picotto et al., 2009).
Specifically, RMs play an integral role in the improvement and quality assurance of measurements in the
nanoscale (see Figure 9). For example, (Montoro Bustos et al., 2015), reported the first post hoc
interlaboratory study using the NIST RM 8012 (AuNPs, nominal 30 nm diameter) and RM 8013 (AuNPs,
nominal 60 nm diameter) to evaluate the independent particle size measurements made by researchers in
academia, government, and industry using single particle inductively coupled plasma mass spectrometry
(spICP-MS). Meli et al. (2012), used different RMs, specifically the NIST RM 8011 (AuNPs, nominal 10
nm diameter), NIST RM 8012 (AuNPs, nominal 30 nm diameter), NIST RM 8013 (AuNPs, nominal 60 nm
diameter), and IRMM-304 (Colloidal Silica Reference Material developed by the Institute for Reference
Materials and Measurements, IRMM) in order to validate the measurement results and uncertainty
estimations reported by various European Metrology Institutes using different MTs (AFM, DLS, SAXS,
SEM). Others examples are consistent in demonstrating the critical role of RMs in improving the
comparability of the measurements in the nanoscale (Roebben et al., 2011; Braun et al., 2012). However,
in this context it is important to define what is considered a RM. According to ISO, a RM is a “material,
sufficiently homogeneous and stable with respect to one or more specified properties, which has been
established to be fit for its intended use in a measurement process” (ISO/Guide 30, 2015). In a practical
way, a RM is a material with enough trueness to be used as a standard in a measurement. Subsequently, a
certified reference material (CRM) is defined by ISO as a “reference material characterized by metrological
valid procedure for one or more specified properties, accompanied by a certificate that provides the value
of the specified property, its associated uncertainty and a statement of metrological traceability” (ISO Guide
30, 2015). The term “CRM” introduces two main metrological concepts: Measurement uncertainty and
metrological traceability. Therefore, the basic difference between a RM and CRM is the status of the
property values assigned to the material (Roebben et al., 2013). In the nanoscale, these definitions have the
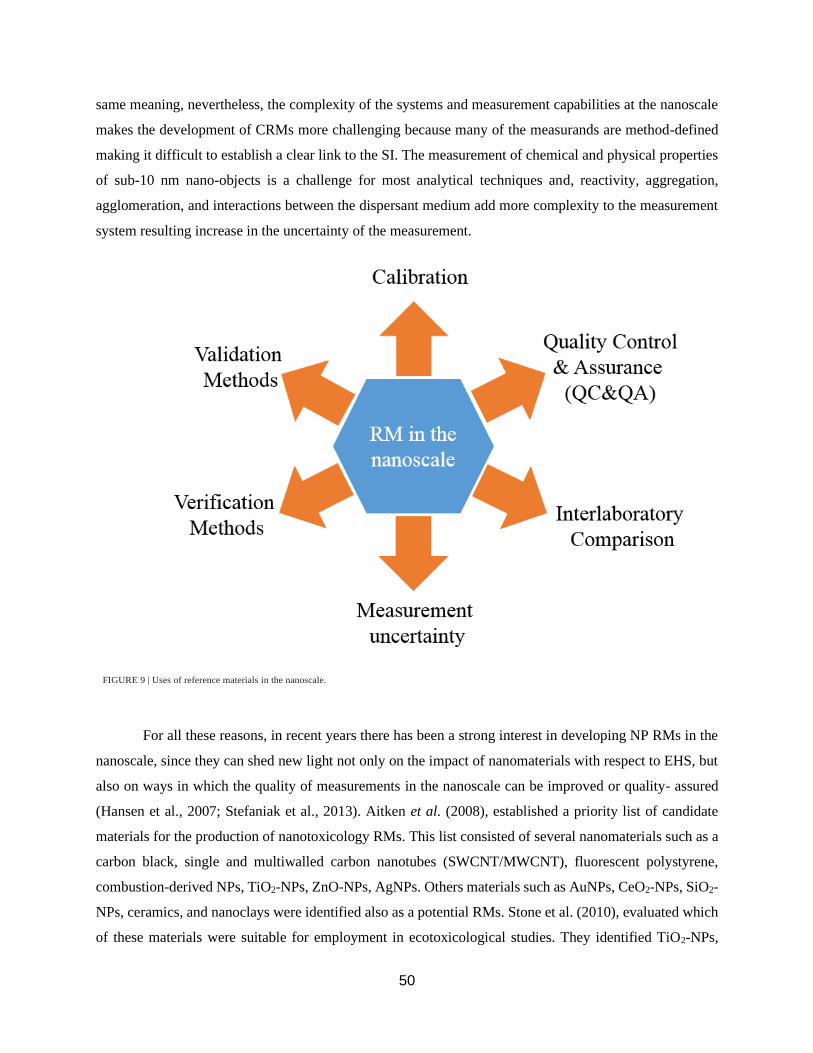
50
same meaning, nevertheless, the complexity of the systems and measurement capabilities at the nanoscale
makes the development of CRMs more challenging because many of the measurands are method-defined
making it difficult to establish a clear link to the SI. The measurement of chemical and physical properties
of sub-10 nm nano-objects is a challenge for most analytical techniques and, reactivity, aggregation,
agglomeration, and interactions between the dispersant medium add more complexity to the measurement
system resulting increase in the uncertainty of the measurement.
FIGURE 9 | Uses of reference materials in the nanoscale.
For all these reasons, in recent years there has been a strong interest in developing NP RMs in the
nanoscale, since they can shed new light not only on the impact of nanomaterials with respect to EHS, but
also on ways in which the quality of measurements in the nanoscale can be improved or quality- assured
(Hansen et al., 2007; Stefaniak et al., 2013). Aitken et al. (2008), established a priority list of candidate
materials for the production of nanotoxicology RMs. This list consisted of several nanomaterials such as a
carbon black, single and multiwalled carbon nanotubes (SWCNT/MWCNT), fluorescent polystyrene,
combustion-derived NPs, TiO2-NPs, ZnO-NPs, AgNPs. Others materials such as AuNPs, CeO2-NPs, SiO2-
NPs, ceramics, and nanoclays were identified also as a potential RMs. Stone et al. (2010), evaluated which
of these materials were suitable for employment in ecotoxicological studies. They identified TiO2-NPs,
51
polysterene beads labeled with fluorescent dyes, and AgNPs, as materials that would be useful to produce
test- or reference materials. A comprehensive approach for the prioritization of materials that can be
developed into reference materials was made recently by Stefaniak et al. (2013), where a list of 25
individual nano-objects was generated with scientific interest for the generation of RMs for risk assessment.
In particular, they highlighted NPs such as CeO-NPs, SiO2-NPs, TiO2-NPs, ZnO2- NPs, AuNPs, and
AgNPs. Table 4 lists RMs developed in the recent years by different National Metrology Institutes (NMIs).
As can be seen, the proposed purposes of these RMs ranges from instrumental calibration to the evaluation
of potential EHS risks. Despite the identification and prioritization of materials to be developed as RMs in
the nanoscale, the properties required to be assigned or certified have a huge importance in the development
of a new RM. Composition (elemental/molecular), surface area, particle size, particle size distribution,
morphology/shape/form, surface chemistry, agglomeration/aggregation state, crystal structure, and surface
charge are frequently suggested to be value-assigned in RM candidates. Additionally, some challenges still
remain from the metrological standpoint in regards to certifying properties in the nanoscale. Many of these
properties are only broadly defined or qualitative (i.e., aggregation and agglomeration), limiting the
possibility of assigning a reference value (Stefaniak et al., 2013). As mentioned above, many of these
properties are method-dependent; for instance, the determination of the particle size in a reference material
in the nanoscale is usually made using different MTs such as DLS, AFM, TEM, SEM, NTA, and others
which rely on different measurands (Kestens et al., 2016). The production of RMs requires the
establishment of validated methods with a full estimation of the uncertainty sources that have been involved
in the measurement (ISO/Guide 34, 2009). This aspect may seriously hinder the development of RMs,
because as previously mentioned, only a few standardized procedures for the characterization of properties
of NPs are available, the majority of which are focused on the determination of dimensional properties such
as particle size and particle size distribution (see Table 3).
Matrix plays an important role in the production and certification of NP RMs. Grombe et al. (2015),
described the feasibility of the development of RMs for the detection of AgNPs in food matrices. Their
results indicate significant differences in particle size when the AgNPs are dispersed in meat materials in
comparison to water suspensions. They also reported difficulties in the development of efficient methods
for the detection of AgNPs, principally due to AgNP reactivity being higher in comparison to more stable
NPs (e.g., metal oxides like TiO2). Furthermore, another important factor to consider in the production of
RMs at the nanoscale, is the form of the nanomaterial. Linsinger et al. (2011), discussed in detail two
different forms (states of matter) that are conceivable for NP RMs: Suspensions of particles and dry
powders. In suspension, NPs have better motion (promoted by Brownian Motion and diffusion process),
52
producing an easier dispersion and homogenization of the material. However, this can promote the
interaction with other molecules or even promote interaction between the NPs (aggregation, agglomeration,
Ostwaltd ripening, or coarsening). For example, Gorham et al. (2014) demonstrate AgNPs suspensions
capped with citrate lose their physical and chemical integrity by oxidation process and oxidation process
followed by photoreduction. On the contrary, in powder form, NPs are more stable, essentially because the
chemical changes only progress by diffusion, which is a rather slow process in this state of mater. To
promote long-term stability, some dry powder RMs are stored in inert atmospheres, preventing the chemical
degradation of the materials (Hornyak et al., 2008). MacCuspie et al. (2013), stabilized AgNPs in excess
PVP and then lyophilized the formulated AgNPs to produce a cake of NPs that can be reconstituted simply
by adding water. This approach resulted in a practical way to eliminate chemical changes of the AgNPs,
conserving the particle size within the shelf-life required for a RM and was used in the development of the
NIST RM 8017 Polyvinylpyrrolidone Coated Silver Nanoparticles (Nominal Diameter 75 nm) (NIST,
2015d). A drawback of the use of dry powder RMs is the possible need for redispersion protocols (Linsinger
et al., 2011) to ensure that a homogeneous suspension is formed. This can be problematic, especially in the
case of users with limited experience or expertise in sample preparation procedures and could generate a
bias which is not intrinsic to the property certified. On the other hand, NP RMs in suspension (liquid phase)
are characterized with respect to homogeneity and are easier to use. However, as was previously discussed
that NPs in liquid phase (colloidal suspensions) need to be correctly functionalized in order to prevent their
destabilization, which can create issues in ensuring long-term stability. In this aspect, Orts-Gil et al. (2013)
pointed out that the development of functionalized, colloidal, stable RMs, may improve comparability
between results across different laboratories, and provide convenience and feasibility in establishing multi-
parametric RMs for engineered NPs.
It is important to mention that the development of a NP RM is an arduous process that involves
many technical and production requirements (for example, production planning, production control,
material storage, material processing, data acquisition, data evaluation, and in the case of CRMs,
establishing metrological traceability, etc.) (ISO Guide 34, 2009). Recently, a new term has been proposed:
“Representative Test Material (RTM).” RTMs will serve to cover gaps in the availability of NP RMs
(Roebben et al., 2013). Specifically, a RTM is defined as “a material from a single batch, which is
sufficiently homogeneous and stable with respect to one or more specified properties, and which implicitly
is assumed to be fit for its intended use in the development of test methods which target properties other
than the properties for which homogeneity and stability have been demonstrated (ISO/TS 16195, 2013).”
In the recent years, the Organization for Economic Co-operation and Development (OECD), in conjunction
53
with the European Joint Research Center (JRC), has worked on the development of a wide range of RTMs
to support nanomaterial research and development. Some examples of the RTMs developed at this moment
are illustrated by Singh et al. (2011), Klein et al. (2011a), Rasmussen et al. (2014), Roebben et al. (2015)
and on the website of the JRC (JRC, 2016).
OUTLOOK AND PERSPECTIVES
Concepts, definitions, and terminology in nanoscience and nanotechnology are currently changing
in response to increased research efforts and the extraordinary growth that this area has experienced in the
last two decades. Several factors (economic, social, and environmental) are promoting the establishment of
robust and well-founded terminology that contribute to building sensible legislation and regulation.
However, the development and consistent implementation of defined “nano” terms represent a tremendous
challenge.
Regardless of the difficulty in implementing regulation and legislation, a large number of scientific
and technological applications and commercial products already incorporate NPs into their design.
Particularly, AgNPs have been listed as a one of the most used nano-objects in commerce, mainly due to
its versatile properties (catalytic, optical, engineering, electrical, biomedical, among others). The promising
economic and technological landscape of NP applications emphasizes the concern regarding possible
environmental, health, and safety (EHS) risks of these materials. In the last 10 years, toxicological,
ecotoxicological, and genotoxicogical effects of AgNPs have been indicated in many studies. So far, the
state of the art of nano-EHS research is promising and evolving, but its development is still limited in
comparison to the exponential growth of new applications and products that incorporate NPs into their
formulations. Moreover, the understanding of toxicity mechanisms, long-term accumulation effects, and
dose-response relationship is still in its infancy. As a result, more studies will center on making accurate
assessments of the implications and impacts of the production of AgNPs on EHS over the next years. To
address these challenging tasks, more studies and results derived from rigorous in vitro and in vivo studies
(e.g., bioaccumulation and bioavailability) will be necessary in order to elucidate the true impact of these
materials. These studies will provide a scientific and technical basis for building worldwide consensus on
regulation. Also, a concerted multidisciplinary effort must be continued to capitalize on initial findings in
order to advance the investigation of relevant environmental scenarios.
54
Other efforts should be made in the area of NP synthesis and stabilization. Nowadays, among the
great variety of chemical routes for the synthesis of AgNPs, only few enable control of the production of
NPs with sufficient homogeneity of size and shape, both key parameters and highly demanded in the
development of new applications. Besides that, the development of new synthesis routes that are much more
efficient and use green synthesis approaches present emerging strategies to make the production of AgNPs
more sustainable and environmentally friendly. Additionally, the use of biopolymers such as proteins,
carbohydrates, and other types of macromolecules as stabilizing and functionalizing agents can improve
the long-term stability of the AgNPs in liquid phase and increase biocompatibility with environmental and
biological systems. So far research into the stabilization of AgNPs using biopolymers is not sufficiently
advanced to establish a clear stabilization mechanism using these coating agents. The behavior of this type
of functionalized AgNPs under various conditions or factors that can compromise stability such as pH,
temperature, UV radiation, etc., has yet to be studied. Given the above concerns, it is necessary to perform
in-depth investigations of synthesis routes using biopolymers that control the shape, size, and stability of
AgNPs.
With regard to the metrological field, the characterization of NPs is still considered a challenge
because some measurement properties are method dependent, which hampers the comparison of values
obtained from different measurement techniques. Continuous efforts have been made by the scientific
community to standardize measurement protocols. In fact, some protocols, technical standards, and
procedures have already been generated by different international organizations (e.g., ISO/TC 229 and
ASTM E56) in order to provide more suitable and robust methods. Specifically, these efforts have focused
mainly on the dimensional properties (size, shape, and distribution) of nanomaterials. However, it is
necessary to develop/implement analytical techniques to extend the NP characterization capabilities toward
the measurement of other important properties such as surface chemistry, chemical structure, and chemical
composition. Moreover, the ability to provide traceability to the SI at the nanoscale level has also proven
to be quite a challenge. Some of the MTs may be directly or indirectly linked to the S.I., however many of
these MTs provide semiquantitative and/or qualitative measurements that are not metrologically traceable.
This is a limiting factor in areas such as nanotoxicology, ecotoxicology, and biomedical applications where
these properties like surface charge, hydrophobicity, and agglomeration state play critical roles. Finally, the
development of NP RMs is crucial to providing sound metrological tools for industry and the scientific
community implementation to evaluate their measurement capabilities. However, presently the availability
of NP RMs is quite limited because of the technical complexity that is involved the production of these
materials. Though more RMs have been developed in recent years, in many cases RMs are not available
55
for relevant measurands and to cover the myriad of scenarios where nanomaterials are being currently
applied. It is expected that in the next few years more RMs and RTMs will be released in order to provide
comparability and to assure the quality of measurements in the nanoscale.
AUTHOR CONTRIBUTIONS
BC reviewed the literature and wrote the manuscript text. MJ wrote the entire section entitled
"Silver nanoparticles (AgNPs): Possible impacts on environment, health, and safety (EHS)". KM, AM,
MW, and JV reviewed the manuscript text.
ACKNOWLEDGMENTS
The authors would like to thank Dr. Justin M. Gorham and Dr. Andre M. Striegel (Materials
Measurement Science Division, Chemical Sciences Division, respectively, NIST) for their thorough
reviews of the manuscript, as well as the Frontiers in Chemistry reviewers for their very useful comments
and suggestions.
REFERENCES
Agnihotri, S., Mukherji, S., and Mukherji, S. (2014). Size-controlled silver nanoparticles synthesized over the range 5–100 nm using the same protocol and their antibacterial efficacy. RSC Adv. 4, 3974–3983. doi: 10.1039/c3ra4 4507k
Ahamed, M., Posgai, R., Gorey, T. J., Nielsen, M., Hussain, S. M., and Rowe, J. J. (2010). Silver nanoparticles induced heat shock protein 70, oxidative stress and apoptosis in Drosophila melanogaster. Toxicol. Appl. Pharmacol. 242, 263–269. doi: 10.1016/j.taap.2009.10.016
Ahmad, R., Griffete, N., Lamouri, A., Felidj, N., Chehimi, M. M., and Mangeney, C. (2015). Nanocomposites of gold
nanoparticles@molecularly imprinted polymers: chemistry, processing, and applications in sensors. Chem. Mater. 27,5464−5478. doi: 10.1021/acs.chemmater.5b00138
Aitken, R. J., Hankin, S. M., Lang Tran, C., Donaldson, K., Stone, V., Cumpson, P., et al. (2008). A multidisciplinary approach to the identification of reference materials for engineered nanoparticle toxicology. Nanotoxicology 2, 71–78. doi: 10.1080/17435390802109177
Alemán, J. V., Chadwick, A. V., He, J., Hess, M., Horie, K., Jones, R. G., et al. (2007). Definitions of terms relating to the structure and
processing of sols, gels, networks, and inorganic-organic hybrid materials (IUPAC Recommendations 2007). Pure Appl. Chem. 79, 1801–1829. doi: 10.1351/pac200779101801
Almofti, M. R., Ichikawa, T., Yamashita, K., Terada, H., and Shinohara, Y. (2003). Silver ion induces a cyclosporine a-insensitive permeability transition in rat liver mitochondria and release of apoptogenic cytochrome C. J. Biochem. 134, 43–49. doi: 10.1093/jb/mvg111
Alshehri, A. H., Jakubowska, M., Młozniak, A., Horaczek, M., Rudka, D., Free, C. et al. (2012). Enhanced electrical conductivity of silver nanoparticles for highfrequency electronic applications. ACS Appl. Mater. Interfaces 4, 7007–7010. doi: 10.1021/am3022569
56
Anjum, N. A., Gill, S. S., Duarte, A. C., Pereira, E., and Ahmad, I. (2013). Silver nanoparticles in soil–plant systems. J. Nanopart. Res.
15, 1896. doi: 10.1007/s11051-013-1896-7
Argentiere, S., Cella, C., Cesaria, M., Milani, P., and Lenardi, C. (2016). Silver nanoparticles in complex biological media: assessment of colloidal stability and protein corona formation. J. Nanopart. Res. 18, 253. doi: 10.1007/s11051-016-3560-5
Arora, S., Jain, J., Rajwade, J. M., and Paknikar, K. M. (2008). Cellular responses induced by silver nanoparticles: in vitro studies. Toxicol. Lett. 179, 93–100. doi: 10.1016/j.toxlet.2008.04.009
Asharani, P. V., Hande, M. P., and Valiyaveettil, S. (2009a). Anti-proliferative activity of silver nanoparticles. BMC cell Biol. 10:65. doi: 10.1186/1471-2121-10-65
Asharani, P. V., Low Kah Mun, G., Hande, M. P., and Valiyaveettil, S. (2009b). Cytotoxicity and genotoxicity of silver nanoparticles in human cells. ACS Nano 3, 279–290. doi:10.1021/nn800596w
ASTM E2456-06 (2012). Standard Terminology Relating to Nanotechnology. ASTM International. Available online at: https://www.astm.org/cgi-bin/resolver.cgi? E2456-06(2012)
ASTM E2490-09 (2015). Standard Guide for Measurement of Particle Size Distribution of Nanomaterials in Suspension by Photon Correlation Spectroscopy (PCS). West Conshohocken, PA: ASTM International. Available online at: http://dx.doi.org/10.1520/E2490-
09R15
ASTM E2834-12 (2012). Standard Guide for Measurement of Particle Size Distribution of Nanomaterials in Suspension by Nanoparticle Tracking Analysis (NTA). ASTM International. Available online at: http://dx.doi.org/10.1520/E2834-12
ASTM E2859-11 (2011). Standard Guide for Size Measurement of Nanoparticles Using Atomic Force Microscopy. ASTM International. Available online at: http://dx.doi.org/10.1520/E2859-11
ASTM E2864-13 (2013) Standard Test Method for Measurement of Airborne Metal and Metal Oxide Nanoparticle Surface Area
Concentration in Inhalation Exposure Chambers using Krypton Gas Adsorption. West Conshohocken, PA: ASTM International, 2013. Available online at: https://doi.org/10.1520/E2864
ASTM WK39049. New Guide for Sample Preparation of Charge-Stabilized Metal Nanoparticles for Electron Microscopy. (document
under development). Available online at: https://www.astm.org/COMMIT/List%20of%20E56%20Standards%20and%20Work%20Items%2011-2014.doc
ASTM WK54613. New Guide for Standard Guide for the Analysis of Nanoparticles by Single Particle Inductively Coupled Plasma Mass
Spectrometry (SP-ICP-MS). (document under development). Available online at: https://www.astm.org/ COMMIT/SUBCOMMIT/E5602.htm
ASTM WK54872. New Test Method for Measuring the Size of Nanoparticles in Aqueous Media Using Batch-Mode Dynamic Light Scattering. (document under development). Available online at: https://www.astm.org/COMMIT/ SUBCOMMIT/E5602.htm
ATSDR (1990). Toxicological Profile for Silver. TP-90-24. Atlanta, GA: Agency for Toxic Substances and Disease Registry.
Babick, F., Mielke, J., Wohlleben, W., Weigel, S., and Hodoroaba, V. D. (2016). How reliably can a material be classified as a nanomaterial? Available particle-sizing techniques at work. J. Nanopart. Res. 18, 1–40. doi: 10.1007/s11051-016-3461-7
Baer, D. R., Gaspar, D. J., Nachimuthu, P., Techane, S. D., and Castner, D. G. (2010). Application of surface chemical analysis tools for characterization of nanoparticles. Anal. Bioanal. Chem. 396, 983–1002. doi: 10.1007/s00216-009-3360-1D.G.
Bastús, N. G., Merkoçi, F., Piella, J., and Puntes, V. (2014). Synthesis of highly monodisperse citrate-stabilized silver nanoparticles of up to 200nm: kinetic control and catalytic properties. Chem. Mater. 26, 2836−2846. doi: 10.1021/cm500316k
Bayram, S., Zahr, O., and Blum, A. M. (2015). Short ligands offer long-term water stability and plasmon tunability for silver nanoparticles. RSC Adv. 5, 6653–6559. doi: 10.1039/C4RA09667C
Bell, R. A., and Kramer, J. R. (1999). Structural chemistry and geochemistry of silver-sulfur compounds: critical review. Environ. Toxicol.
Chem. 18, 9–22. doi: 10.1002/etc.5620180103
Benn, T. M., and Westerhoff, P. (2008). Nanoparticle silver released into water from commercially available sock fabrics. Environ. Sci. Technol. 42, 4133–4139. doi: 10.1021/es7032718
BIPM, I., IFCC, I., IUPAC, I., and ISO, O. (2008). The International Vocabulary of Metrology—Basic and General Concepts and
Associated Terms (VIM), 3rd Edn. JCGM 200: 2012. JCGM (Paris: Joint Committee for Guides in Metrology). Available online at: http://www.bipm.org/en/publications/guides/vim.html
Birol, H., Renato, C., Guiotokuc, M., and Hotzab, D. (2013). Preparation of ceramic nanoparticles via cellulose assisted glycine nitrate process: a review. RSC Adv. 3, 2873–2884. doi: 10.1039/c2ra21810k
Blaser, S. A., Scheringer, M., MacLeod, M., and Hungerbühler, K. (2008). Estimation of cumulative aquatic exposure and risk due to silver: contribution of nano-functionalized plastics and textiles. Sci. Tot. Environ. 390, 396–409. doi: 10.1016/j.scitotenv.2007.10.010
57
Bollella, P., Schulz, C., Favero, G., Mazzei, F., Ludwig, R., Gorton, L., et al. (2017). Green synthesis and characterization of gold and
silver nanoparticles and their application for development of a third-generation lactose biosensor. Electroanal 29, 77–86. doi: 10.1002/elan.201600476
Bonevich, J. E., and Haller, W. K., NIST–NCL Method PCC- (2010). Measuring the Size of Nanoparticles Using Transmission Electron
Microscopy (TEM). Gaithersburg, MD: National Institute of Standards and Technology. Available online at: https://www.nist.gov/publications
Boverhof, D. R., Bramante, C. M., Butala, J. H., Clancy, S. F., Lafranconi, M., West, J., et al. (2015). Comparative assessment of nanomaterial definitions and safety evaluation considerations. Regul. Toxicol. Pharm. 73, 137–150. doi: 10.1016/j.yrtph.2015.06.001
Braun, A., Couteau, O., Franks, K., Kestens, V., Roebben, G., Lamberty, A., et al. (2011a). Validation of dynamic light scattering and
centrifugal liquid sedimentation methods for nanoparticle characterisation. Adv. Powder Technol. 22, 766–770. doi: 10.1016/j.apt.2010.11.001
Braun, A., Franks, K., Kestens, V., Roebben, G., Lamberty, A., and Linsinger, T. (2011b). Certification of Equivalent Spherical Diameters of Silica Nanoparticles in Water. ERM-FD100, Report EUR, 24620.
Braun, A., Kestens, V., Franks, K., Roebben, G., Lamberty, A., and Linsinger, T. P. (2012). A new certified reference material for size analysis of nanoparticles. J. Nanopart. Res. 14, 1–12. doi: 10.1007/s11051-012-1021-3
Braydich-Stolle, L. K., Lucas, B., Schrand, A., Murdock, R. C., Lee, T., Schlager, J. J., et al. (2010). Silver nanoparticles disrupt GDNF/Fyn kinase signaling in spermatogonial stem cells. Toxicol. Sci. 116, 577–589. doi: 10.1093/toxsci/kfq148
Brunauer, S., Emmett, P. H., and Teller, E. (1938). Adsorption of gases in multimolecular layers. J. Am. Chem. Soc. 60, 309–319. doi: 10.1021/ja0126 9a023
Buhr, E., Senftleben, N., Klein, T., Bergmann, D., Gnieser, D., Frase, C. G., et al. (2009). Characterization of nanoparticles by scanning electron microscopy in transmission mode. Meas. Sci. Technol. 20:084025. doi:10.1088/0957- 0233/20/8/084025
Burrell, R. E. (2003). A scientific perspective on the use of topical silver preparations. Ostomy Wound Manage. 49 (5Suppl.), 19–24. Available online at: http://www.o-wm.com/content/a-scientific-perspective-use-topical-silver- preparations
Cakic´, M., Glišic´, S., Nikolic´, G., Nikolic´, G. M., Cakic´, K., and Cvetinov, M. (2016). Synthesis, characterization and antimicrobial activity of dextran sulphate stabilized silver nanoparticles. J. Mol. Struct. 1110, 156–161. doi: 10.1016/j.molstruc.2016.01.040
Calahorra, Y., Shtempluck, O., Kotchetkov, V., and Yaish, Y. E. (2016). Young’s modulus, residual stress, and crystal orientation of doubly clamped silicon nanowire beams. Nano Lett. 15, 2945–2950. doi: 10.1021/nl5047939
Carlson, C., Hussain, S. M., Schrand, A. M. K., Braydich-Stolle, L., Hess, K. L., and Jones, R. (2008). Unique cellular interaction of silver nanoparticles: size-dependent generation of reactive oxygen species. J. Phys. Chem. B 112, 13608–13619. doi: 10.1021/jp712087m
Chairuangkitti, P., Lawanprasert, S., Roytrakul, S., Aueviriyavit, S., Phummiratch, D., Kulthong, K., et al. (2013). Silver nanoparticles
induce toxicity in A549 cells via ROS-dependent and ROS-independent pathways. Toxicol. In Vitro 27, 330–338. doi: 10.1016/j.tiv.2012.08.021
Chen, H., Roco, M. C., Li, X., and Lin, Y. (2008a). Trends in nanotechnology patents. Nat. Nanotechnol. 3, 123–125. doi: 10.1038/nnano.2008.51
Chen, J., Wang, J., Zhang, X., and Jin, Y. (2008b). Microwave-assisted green synthesis of silver nanoparticles by carboxymethyl cellulose sodium and silver nitrate. Mater. Chem. Phys. 108, 421–424. doi: 10.1016/j.matchemphys.2007.10.019
Chunfa, D., Xianglin, Z., Hao, C., and Chuanliang, C. (2016). Sodium alginate mediated route for the synthesis of monodisperse silver nanoparticles using glucose as reducing agents. Rare Metal Mater. Eng. 45, 261–266. doi:10.1016/S1875-5372(16)30051-0
Cientifica (2011). Global Funding of Nanotechnologies and Its Impact. London: Cientifica. Available online at: http://cientifica.com/wp-content/uploads/ downloads/2011/07/Global-Nanotechnology-Funding-Report-2011.pdf
Commission Recommendation (2011). Commission Recommendation of 18 October 2011 on the definition of nanomaterial 2011/696/EU.
Off. J. Eur. Union L 275, 38–40. Available online at: http://eur-lex.europa.eu/legal-content/EN/ ALL/?uri=OJ%3AL%3A2011%3A275%3ATOC
Contado, C. (2015). Nanomaterials in consumer products: a challenging analytical problem. Front. Chem. 3:48. doi: 10.3389/fchem.2015.00048
Cornelis, G., DooletteMadeleine Thomas, C., McLaughlin, M. J., Kirby, J. K., Beak, D. G., and Chittleborough, D. (2012). Retention and dissolution of engineered silver nanoparticles in natural soils. Soil Sci. Soc. Am. J. 76, 891–902. doi: 10.2136/sssaj2011.0360
Costa-Fernandez, J. M., Menendez-Miranda, M., Bouzas-Ramos, D., Saenz-Medel, A., and Encinar, J. R. (2016). Mass spectrometry for the characterization and quantification of engineered inorganic nanoparticles. Trends Anal Chem. TrAC 84, 139–148. doi: 10.1016/j.trac.2016.06.001
58
Croce, T. A. (2014). FDA’s Regulation of nanotechnology in food ingredients. Chemistry of food, food supplements, and food contact
materials: from production to plate. Am. Chem. Soc. Chapter 4, 41–50. doi: 10.1021/bk-2014-1159.ch004
Cunningham, A., and Bürgi, T. (2013). “Chapter 1 Bottom-up Organisation of Metallic” Nanoparticles”, in Amorpphous Nanophotonics, eds C. Rockstuhl and T. Scharf (Berlin; Heidelberg: Springer).
Cushing, B. L., Kolesnichenko, V. L., and O’Connor, C. J. (2014). Recent advances in the liquid-phase syntheses of inorganic nanoparticles. Chem. Rev. 104, 3893–3946. doi:10.1021/cr030027b
Dadosh, T. (2009). Synthesis of uniform silver nanoparticle with a controllable size. Mater. Lett. 63, 2236–2238. doi: 10.1016/j.matlet.2009. 07.042
Darroudi, M., Bin Ahmad, M. B., Abdullah, A. H., and Ibrahim, N. A. (2011). Green synthesis and characterization of gelatin-based and sugar- reduced silver nanoparticles. Int. J. Nanomedicine 6, 569–574. doi: 10.2147/ijn. s16867
De Temmerman, P. J., Lammertyn, J., De Ketelaere, B., Kestens, V., Roebben, G., Verleysen, E., et al. (2014). Measurement uncertainties of size, shape, and surface measurements using transmission electron microscopy of near- monodisperse, near-spherical nanoparticles. J. Nanopart. Res. 16, 1–22. doi: 10.1007/s11051-013-2177-1
Decree No 2012-232. Annual Declaration on Substances at Nanoscale in Application French Republic. Available online at: https://www.r-
nano.fr/?locale=en of Article R. 523-4 of the Environment Code. France: Official journal of the
Decree No 2014/24329. Royal Decree on the Placing on the Market of Substances Manufactured with Nanoparticle Status. Belgium:
Belgian Official Journal. Available online at: http://www.health.belgium.be/fr/environnement/ substances-chimiques/nanomateriaux/l-registre
Decree No 644 of 13/06/2014. On a Register of Mixtures and Articles that Contain Nanomaterials as well as the Requirement for Producers and Importers to Report to the Register. Danmark.
Delvallée, A., Feltin, N., Ducourtieux, S., Trabelsi, M., and Hochepied, J. F. (2015a). Toward an uncertainty budget for measuring nanoparticles by AFM. Metrologia 53:41. doi:10.1088/0026-1394/53/1/41
Delvallée, A., Feltin, N., Ducourtieux, S., Trabelsi, M., and Hochepied, J.F. (2015b). Direct comparison of AFM and SEM measurements on the same set of nanoparticles. Meas. Sci. Technol. 26: 085601. doi:10.1088/0957- 0233/26/8/085601
DiVincenzo, G. D., Giordano, C. J., and Schriever, L. S. (1985). Biologic monitoring of workers exposed to silver. Int. Arch. Occup. Environ. Health 56, 207–215. doi: 10.1007/BF00396598
Dong, X., Ji, X., Wu, H., Zhao, L., Li, J., and Yang, W. (2009). Shape control of silver nanoparticles by stepwise citrate reduction. J. Phys.
Chem. C 113, 6573–6576. doi: 10.1021/jp900775b
Drake, P. L., and Hazelwood, K. J. (2005). Exposure-related health effects of silver and silver compounds: a review. Ann. Occup. Hyg. 49, 575–585. doi: 10.1093/annhyg/mei019
Dudkiewicz, A., Boxall, A. B., Chaudhry, Q., Mølhave, K., Tiede, K., Hofmann, P., et al. (2015). Uncertainties of size measurements in electron microscopy characterization of nanomaterials in foods. Food Chem. 176, 472–479. doi:10.1016/j.foodchem.2014.12.071
Ediriwickrema, A., and Saltzman, W. M. (2015). Nanotherapy for Cancer: targeting and multifunctionality in the future of cancer therapies. ACS Biomater. Sci. Eng.1, 64−78. doi: 10.1021/ab500084g
Elsupikhe, R. F., Shameli, K., Ahmad, M. B., Ibrahim, N. A., and Zainudin, N. (2015). Green sonochemical synthesis of silver nanoparticles at varying concentrations of κ-carrageenan. Nanoscale Res. Lett. 10:1. doi: 10.1186/s11671-015-0916-1
Environmental Protection Agency (2015). (EPA), Chemical substances when manufactured or processed as nanoscale materials: TSCA reporting and recordkeeping requirements Fed. Regist. 80 18330. Available online at: http:// www.regulations.gov
Fabrega, J., Luoma, S. N., Tyler, C. R., Galloway, T. S., and Lead, J. R. (2011). Silver nanoparticles: behaviour and effects in the aquatic environment. Environ. Int. 37, 517–531. doi: 10.1016/j.envint.2010.10.012
Fabricius, A. L., Duester, L., Meermann, B., and Ternes, T. A. (2014). ICP- MS-based characterization of inorganic nanoparticles—sample preparation and off-line fractionation strategies. Anal. Bioanal. Chem. 406, 467–479. doi: 10.1007/s00216-013-7480-2
Finney, E. E., and Finke, R. G. (2008). Nanocluster nucleation and growth kinetic and mechanistic studies: a review emphasizing transition-metal nanoclusters. J. Colloid Interface Sci. 317, 351–374. doi: 10.1016/j.jcis.2007.05.092
Fiorino, D. (2010). Voluntary Initiatives, Regulation and Nanotechnology Oversight. Project on Emerging Nanotechnologies is Supported, Woodrow Wilson International Center for Scholar, 2010. Available online at: https://www. wilsoncenter.org/publication/pen-19-voluntary-initiatives-regulation-and- nanotechnology-oversight
Foldbjerg, R., Jiang, X., Micla˘u¸s, T., Chen, C., Autrup, H., and Beer, C. (2015). Silver nanoparticles–wolves in sheep’s clothing?. Toxicol. Res. 4, 563–575. doi: 10.1039/C4TX00110A
59
Franks, K., Braun, A., Charoud-Got, J., Couteau, O., Kestens, V., Lamberty, A., et al. (2012). Certification of the Equivalent Spherical
Diameters of Silica Nanoparticles in Aqueous Solution. ERM-FD304, Report EUR, 25018.
Gallego-Urrea, J. A., Tuoriniemi, J., and Hassellöv, M. (2011). Applications of particle-tracking analysis to the determination of size distributions and concentrations of nanoparticles in environmental, biological and food samples. TrAC-Trends Anal. Chem. 30, 473–483. doi:10.1016/j.trac.2011.01.005
Gawande, M. B., Goswami, A., Felpin, F. X., Asefa, T., Huang, X., Silva, R., et al. (2016). Cu and Cu-based nanoparticles: synthesis and applications in catalysis. Chem. Rev. 116, 3722–3811.doi: 10.1021/acs.chemrev.5b00482
Geranio, L., Heuberger, M., and Nowack, B. (2009). The behavior of silver nanotextiles during washing. Environ. Sci. Technol. 43, 8113–8118. doi: 10.1021/es9018332
Gliga, A. R., Skoglund, S., Wallinder, I. O., Fadeel, B., and Karlsson, H. L. (2014). Size-dependent cytotoxicity of silver nanoparticles in human lung cells: the role of cellular uptake, agglomeration and Ag release. Part Fibre Toxicol. 11:1. doi: 10.1186/1743-8977-11-11
Gomes, S. I., Hansen, D., Scott-Fordsmand, J. J., and Amorim, M. J. (2015). Effects of silver nanoparticles to soil invertebrates: oxidative stress biomarkers in Eisenia fetida. Environ. Pollut. 199, 49–55. doi: 10.1016/j.envpol.2015.01.01
Gomes, S. I., Soares, A. M., Scott-Fordsmand, J. J., and Amorim, M. J. (2013). Mechanisms of response to silver nanoparticles on
Enchytraeus albidus (Oligochaeta): survival, reproduction and gene expression profile. J. Hazard Mater. 254, 336–344. doi: 10.1016/j.jhazmat.2013.04.005
Gorham, J. M., Rohlfing, A. B., Lippa, K. A., MacCuspie, R. I., Hemmati, A., and Holbrook, R. D. (2014). Storage Wars: how citrate-
capped silver nanoparticle suspensions are affected by not-so-trivial decisions. J. Nanopart. Res. 16, 1–14. doi: 10.1007/s11051-014-2339-9
Gorham, J., MacCuspie, R. I., Klein, K. L., Fairbrother, H. D., and Holbrook,R. D. (2012). Uv-induced photochemical transformation of citrate-capped silver nanoparticle suspension. J. Nanopart. Res. 14, 1139. doi: 10.1007/s11051-012-1139-3
Gottschalk, F., and Nowack, B. (2011). The release of engineered nanomaterials to the environment. J. Environ. Monit. 13, 1145–1155. doi: 10.1039/C0EM00547A Gottschalk, F., Sonderer, T., Scholz, R. W., and Nowack, B. (2009). Modeled environmental concentrations
of engineered nanomaterials (TiO2, ZnO, Ag, CNT, fullerenes) for different regions. Environ. Sci. Technol. 43, 9216–9222.doi: 10.1021/es9015553.
Grobelny, J., Delrio, F. W., Pradeep, N., Kim, D. I., Hackley, V. A., and Cook,R. F. (2009). NIST—NCL Joint Assay Protocol, PCC-6: Size Measurement of Nanoparticles Using Atomic Force Microscopy. Gaithersburg, MD: NIST. Available online at: https://www.nist.gov/publications
Grombe, R., Allmaier, G., Charoud-Got, J., Dudkiewicz, A., Emteborg, H., Hofmann, T., et al. (2015). Feasibility of the development of
reference materials for the detection of Ag nanoparticles in food: neat dispersions and spiked chicken meat. Accred. Qual. Assur. 20, 3–16. doi: 10.1007/s00769-014-1100-5
Gunsolus, I. L., and Haynes, C. L. (2015). Analytical aspects of nanotoxicology.Anal. Chem. 88, 451–479. doi: 10.1021/acs.analchem.5b04221
Hackley, V. A., and Clogston, J. D. (2015). NIST Special Publication 1200-6 (2015). Measuring the Size of Nanoparticles in Aqueous
Media Using Batch-Mode Dynamic Light Scattering. Gaithersburg, MD: National Institute of Standards and Technology. Available online at: https://www.nist.gov/publications
Hamburg, M. A. (2012). FDA’s approach to regulation of products of nanotechnology. Science 336, 299–300. doi: 10.1126/science.1205441
Hänsch, M., and Emmerling, C. (2010). Effects of silver nanoparticles on the microbiota and enzyme activity in soil. J. Plant Nutr. Soil Sci. 173, 554–558. doi: 10.1002/jpln.200900358
Hansen, S. F., Larsen, B. H., Olsen, S. I., and Baun, A. (2007). Categorization framework to aid hazard identification of nanomaterials. Nanotoxicology 1, 243–253. doi:10.1080/17435390701727509
Hartmann, G., Hutterer, C., and Schuster, M. (2013). Ultra-trace determination of silver nanoparticles in water samples using cloud point extraction and ETAAS. J Anal. Atom. Spectrom. 28, 567–572. doi: 10.1039/C3JA 30365A
Hayashi, Y., Engelmann, P., Foldbjerg, R., Szabó, M., Somogyi, I., Pollák, E., et al. (2012). Earthworms and humans in vitro: characterizing evolutionarily conserved stress and immune responses to silver nanoparticles. Environ. Sci. Technol. 46, 4166–4173. doi: 10.1021/es3000905
Hayashi, Y., Heckmann, L. H., Simonsen, V., and Scott-Fordsmand, J. J. (2013). Time-course profiling of molecular stress responses to silver nanoparticles in the earthworm Eisenia fetida. Ecotoxicol. Environ. Saf. 98, 219–226. doi: 10.1016/j.ecoenv.2013.08.017
Health Canada (2011). Health Canada, Policy Statement on Health Canada’s Working Definition for Nanomaterial. (2011) Available online at: http://www.hc-sc.gc.ca/sr-sr/pubs/nano/pol-eng.php
60
Hendren, C. O., Mesnard, X., Dröge, J., and Wiesner, M. R. (2011). Estimating production data for five engineered nanomaterials as a
basis for exposure assessment. Environ. Sci. Technol. 45, 2562–2569. doi: 10.1021/es103300g
Hill, W. R. (1941). Argyria The pharmacology of silver. South Med. J. 34, 340. Hodoroaba, V. D., Rades, S., Salge, T., Mielke, J., Ortel, E., and Schmidt,
R. (2016). “Characterisation of nanoparticles by means of high-resolution SEM/EDS in transmission mode,” in IOP Conference Series: Materials Science and Engineering, Vol. 109 (Portoroz: IOP Publishing). doi: 10.1088/1757-899X/109/1/012006
Hofmann, M., Grainger, D. W., and Hofmann, H. (2015). Nanoparticles in medicine: current challenges facing inorganic nanoparticle toxicity assessments and standardizations. Nanomed. Nanotechnol. 11 1689–1694. doi: 10.1016/j.nano.2015.05.005
Hohenester, U., Ditlbacher, H., and Krenn, J. R. (2009). Electron-energy- loss spectra of plasmonic nanoparticles. Phy. Rev. Lett. 103:106801. doi: 10.1103/PhysRevLett.103.106801
Hole, P., Sillence, K., Hannell, C., Maguire, C. M., Roesslein, M., Suarez, G., et al. (2013). Interlaboratory comparison of size measurements on nanoparticles using nanoparticle tracking analysis (NTA). J. Nanopart. Res. 15, 1–12. doi: 10.1007/s11051-013-2101-8
Hollinger, M. A. (1996). Toxicological aspects of topical silver pharmaceuticals. Crit. Rev. Toxicol. 26, 255–260. doi:
10.3109/104084496090 12524
Hoo, C. M., Starostin, N., West, P., and Mecartney, M. L. (2008). A comparison of atomic force microscopy (AFM) and dynamic light scattering (DLS) methods to characterize nanoparticle size distributions. J. Nanopart. Res. 10, 89–96. doi: 10.1007/s11051-008-9435-7
Hornyak, G. L., Dutta, J., Tibbals, H. F., and Miller, F. P. (2008). Introduction to Nanosciences. Boca Raton, FL: CRC Press; Taylor and Francis Group.
ISO 13318-1 (2001). Determination of Particle Size Distribution by Centrifugal Liquid Sedimentation Methods – Part 1: General Principles and Guidelines. Geneva: International Organization for Standardization.
ISO 13322-1 (2014). Particle Size Analysis - Image Analysis Methods - Part 1: Static Image Analysis Methods. Geneva: International Organization for Standardization.
ISO 15900 (2009). Determination of Particle Size Distribution - Differential Electrical Mobility Analysis for Aerosol Particles. Geneva: International Organization for Standardization.
ISO 17867 (2015). Particle Size Analysis - Small-Angle X-ray Scattering. Geneva: International Organization for Standardization.
ISO 20998-2 (2013). Measurement and Characterization of Particles by Acoustic Methods — Part 2: Guidelines for Linear Theory. Geneva: International Organization for Standardization.
ISO 22412 (2008). Particle Size Analysis - Dynamic Light Scattering (DLS). Geneva: International Organization for Standardization.
ISO 29301 (2010). Microbeam Analysis - Analytical Transmission Electron Microscopy - Methods for Calibrating Image Magnification by Using Reference Materials having Periodic Structures. Geneva: International Organization for Standardization.
ISO 9277 (2010). Determination of the specific surface area of solids by gas adsorption - BET method. Geneva: International Organization for Standardization.
ISO 19430 (2016). Particle Size Analysis - Particle Tracking Analysis (PTA) Method. Geneva: International Organization for Standardization. (document under development).
ISO/Guide 30. Reference Materials - Selected Terms and Definitions. Geneva: International Organization for Standardization
ISO/Guide 34 (2009). General Requirements for the Competence of Reference Material Producers. Geneva: International Organization for Standardization.
ISO/IEC Guide 98-3 (2008). Uncertainty of Measurement - Part 3: Guide to the Expression of Uncertainty in Measurement (GUM: 1995). Geneva: International Organization for Standardization.
ISO/TS 1410 (2012). Surface Characterization of Gold Nanoparticles for Nanomaterial Specific Toxicity Screening: FT-IR Method. Geneva: International Organization for Standardization.
ISO/TS 16195 (2013). Guidance for Developing Representative Test Materials Consisting of Nano-objects in Dry Powder Form. Geneva: International Organization for Standardization.
ISO/TS 19590. Nanotechnologies - Size Distribution and Concentration of Inorganic Nanoparticles in Aqueous Media via Single Particle Inductively Coupled Plasma Mass Spectrometry. Geneva: International Organization for Standardization. (document under development)
ISO/TS 80004-1 (2015). Nanotechnologies-Vocabulary-Part 1: Core Terms. Geneva: International Organization for Standardization.
ISO/TS 80004-2 (2015). Nanotechnologies-Vocabulary-Part 2: Nano-Objects.Geneva: International Organization for Standardization.
61
ISO/TS 80004-4 (2011). Nanotechnologies-Vocabulary-Part 4: Nanostructured Materials. Geneva: International Organization for
Standardization.
Jana, N. R., Gearheart, L., and Murphy, C. J. (2001). Evidence for seed-mediated nucleation in the chemical reduction of gold salts to gold nanoparticles. Chem. Mater. 13, 2313–2322. doi: 10.1021/cm000662n
Jena, P., Mohanty, S., Mallick, R., Jacob, B., and Sonawane, A. (2012). Toxicity and antibacterial assessment of chitosan-coated silver nanoparticles on human pathogens and macrophage cells. Int. J. Nanomedicine 7, 1805–1818. doi: 10.2147/IJN.S28077
Jiang, L., P., Wang, A. N., Zhao, Y., Zhang, J. R., and Zhu, J. J. (2004). A novel route for the preparation of monodisperse silver nanoparticles via a pulsed sonoelectrochemical technique, Inorg. Chem. Commun. 7, 506–509. doi: 10.1016/j.inoche.2004.02.003
Jiang, X., Foldbjerg, R., Miclaus, T., Wang, L., Singh, R., Hayashi, Y., et al. (2013). Multi-platform genotoxicity analysis of silver nanoparticles in the model cell line CHO-K1. Toxicol. Lett. 222, 55–63.doi: 10.1016/j.toxlet.2013. 07.011
Jo, Y. K., Kim, B. H., and Jung, G. (2009). Antifungal activity of silver ions and nanoparticles on phytopathogenic fungi. Plant Dis. 93, 1037–1043. doi: 10.1094/PDIS-93-10-1037
Joint Research Center (2016). Nanomaterial Repository. Available online at: https://ec.europa.eu/jrc/en/scientific-tool/jrc-nanomaterials-repository (Accessed September 13, 2016).
Jung, J. H., Kim, S. W., Min, J. S., Kim, Y. J., Lamsal, K., Kim, K. S., et al. (2010). The effect of nano-silver liquid against the white rot of the green onion caused by Sclerotium cepivorum. Mycobiology 38, 39–45. doi: 10.4489/MYCO.2010.38.1.039
Kang, I. K., and Haider, A. (2015). Preparation of silver nanoparticles and their industrial and biomedical applications: a comprehensive review. Adv. Mater. Sci. 2015, 16. doi: 10.1155/2015/165257
Keat, C. L., Aziz, A., Eid, A. M., and Elmarzugi, N. A. (2015). Biosynthesis of nanoparticles and silver nanoparticles. Biorerour. Bioprocess. 2:47. doi:10.1186/s40643-015-0076-2
Keller, A. A., McFerran, S., Lazareva, A., and Suh, S. (2013). Global life cycle releases of engineered nanomaterials J. Nanopart. Res. 15, 1692. doi: 10.1007/s11051-013-1692-4
Kelly, K. L., Coronado, E., Zhao, L. L., and Schatz, G. C. (2003). The optical properties of metal nanoparticles: the influence of size, shape, and dielectric environment. J. Phys. Chem. B. 107, 668–677. doi: 10.1021/jp0 26731y
Kemp, M. M., Kumar, A., Clement, D., Ajayan, P., Mousa, S., and Linhardt, R. J. (2009). Hyaluronan-and heparin-reduced silver nanoparticles with antimicrobial properties. Nanomedicine 4, 421–429. doi: 10.2217/nnm.09.24.
Kestens, V., Roebben, G., Herrmann, J., Jämting, Å., Coleman, V., Minelli, C., et al. (2016). Challenges in the size analysis of a silica nanoparticle mixture as candidate certified reference material. J. Nanopart. Res. 18, 1–22. doi: 10.1007/s11051-016-3474-2
Kettemann, F., Birnbaum, A., Witte, S., Wuithschick, M., Pinna, N., Kraehnert, R., et al. (2016). Missing piece of the mechanism of the turkevich method: the critical role of citrate protonation. Chem. Mater. 28, 4072–4081. doi. 10.1021/acs.chemmater.6b01796
Kim, B., Park, C. S., Murayama, M., and Hochella Jr, M. F. (2010). Discovery and characterization of silver sulfide nanoparticles in final sewage sludge products. Environ. Sci. Technol. 44, 7509–7514. doi: 10.1021/es101565j
Kim, D., Jeong, S., and Moon, J. (2006). Synthesis of silver nanoparticles using the polyol process and the influence of precursor injection. Nanotechnology 17, 4019–4024. doi: 10.1088/0957-4484/17/16/004
Kim, S. W., Kim, K. S., Lamsal, K., Kim, Y. J., Kim, S. B., Jung, M., et al. (2009b). An in vitro study of the antifungal effect of silver nanoparticles on oak wilt pathogen Raffaelea sp. J Micro. Biotechnol. 19, 760–764. doi:10.4014/jmb.0812.649
Kim, S., and Ryu, D. Y. (2013). Silver nanoparticle-induced oxidative stress, genotoxicity and apoptosis in cultured cells and animal tissues. J. Appl. Toxicol. 33, 78–89. doi: 10.1002/jat.2792
Kim, S., Choi, J. E., Choi, J., Chung, K. H., Park, K., Yi, J., et al. (2009a). Oxidative stress-dependent toxicity of silver nanoparticles in
human hepatoma cells. Toxicol. In Vitro 23, 1076–1084. doi: 10.1016/j.tiv.2009.06.001
Kim, Y. P., Shon, H. K., Shin, S. K., and Lee, T. G. (2015). Probing nanoparticles and nanoparticle-conjugated biomolecules using time-of-flight secondary ion mass spectrometry. Mass Spectrom. Rev. 34, 237–247. doi: 10.1002/mas.21437
Klabunde, K. J. (2001). Nanoscale Materials in Chemistry. New York, NY: John Wiley & sons, Inc.
Klein, C. L., Comero, S., Stahlmecke, B., Romazanov, J., Kuhlbusch, T. A. J., Van Doren, E., et al. (2011a). NM-Series of Representative Manufactured Nanomaterials, NM-300 Silver, Characterisation, Stability, Homogeneity. EUR 24693 EN. ISBN 978-92-79-19068-1
Klein, T., Buhr, E., Johnsen, K. P., and Frase, C. G. (2011b). Traceable measurement of nanoparticle size using a scanning electron microscope in transmission mode (TSEM). Meas. Sci. Technol. 22:094002. doi: 10.1088/0957-0233/22/9/094002
Korani, M., Ghazizadeh, E., Korani, S., Hami, Z., and Mohammadi-Bardbori, A. (2015). Effects of silver nanoparticles on human health. Eur. J. Nanomed. 7, 51–62. doi: 10.1515/ejnm-2014-0032
62
Kraynov, A., and Müller, T. E (2011). Concepts for the Stabilization of Metal Nanoparticles in Ionic Liquids, Applications of Ionic Liquids
in Science and Technology. Ed Scott Handy, InTech. Available online at: http:// www.intechopen.com/books/applications-of-ionic-liquids-in-science-and- technology/concepts-for-the-stabilization-of-metal-nanoparticles-in-ionic- liquids
Kulthong, K., Srisung, S., Boonpavanitchakul, K., Kangwansupamonkon, W., and Maniratanachote, R. (2010). Determination of silver nanoparticle release from antibacterial fabrics into artificial sweat. Part Fibre Toxicol. 7, 8. doi: 10.1186/1743-8977-7-8
Kwon, S. Y., Kim, Y. G., Lee, S. H., and Moon, J. H. (2011). Uncertainty analysis of measurements of the size of nanoparticles in aqueous solutions using dynamic light scattering. Metrologia 48, 417. doi: 10.1088/0026-1394/48/5/024
Laborda, F., Bolea, E., Cepriá, G., Gómez, M. T., Jiménez, M. S., Pérez-Arantegui, J., et al. (2016). Detection, characterization and
quantification of inorganic engineered nanomaterials: a review of techniques and methodological approaches for the analysis of complex samples. Anal. Chim. Acta 904, 10–32. doi: 10.1016/j.aca.2015.11.008
Lamsal, K., Kim, S. W., Jung, J. H., Kim, Y. S., Kim, K. S., and Lee, Y. S. (2011a). Inhibition effects of silver nanoparticles against powdery mildews on cucumber and pumpkin. Mycobiology 39, 26–32. doi: 10.4489/MYCO.2011.39. 1.026
Lamsal, K., Kim, S. W., Jung, J. H., Kim, Y. S., Kim, K. S., and Lee, Y. S. (2011b). Application of silver nanoparticles for the control of Colletotrichum species in vitro and pepper anthracnose disease in field. Mycobiology 39, 194–199.doi: 10.5941/MYCO.2011.39.3.194
Lansdown, A. (2006). “Silver in health care: antimicrobial effects and safety in use,” in Biofunctional Textiles and the Skin, Vol. 33, eds U. C. Hipler and P. Elsner (London: Karger Publishers), 17–34.
Lansdown, A. B. (2010). A pharmacological and toxicological profile of silver as an antimicrobial agent in medical devices. Adv. Pharmacol. Sci. 2010, 1–16. doi: 10.1155/2010/910686
Le Ouay, B., and Stellacci, F. (2015). Antibacterial activity of silver nanoparticles: a surface science insight. Nano Today 10, 339–354. doi: 10.1016/j.nantod.2015.04.002
Lead, J. R., Tejamaya, M., Römer, I., and Merrifield, R. C. (2014). Stability of citrate, PVP, and PEG coated silver nanoparticles in ecotoxicology media. Environ. Sci. Technol. 46, 7011–7017. doi: 10.1021/es2038596
Lee, H., You, S., Pikhitsa, P. V., Kim, J., Kwon, S., Woo, C. G., et al. (2011). Three- dimensional assembly of nanoparticles from charged aerosols. Nano Lett. 11, 119–124.doi: 10.1021/nl103787k
Lee, P. C., and Meisel, D. (1982). Adsorption and surface-enhanced Raman of dyes on silver and gold sols. J. Phys. Chem. 86, 3391–3395. doi: 10.1021/j10021 4a025
León-Silva, S., Fernández-Luqueño, F., and López-Valdez, F. (2016). Silver Nanoparticles (AgNP) in the environment: a review of
potential risks on human and environmental health. Water Air Soil Pollut. 227, 306. doi: 10.1007/s11270-016-3022-9
Li, T., Senesi, A. J., and Lee, B. (2016). Small angle x-ray scattering for nanoparticle research. Chem. Rev. 116, 11128–11180. doi: 10.1021/acs.chemrev.5b00690
Lidén, G. (2011). The European commission tries to define nanomaterials. Ann.Occup. Hyg. 55, 1–5. doi: 10.1093/annhyg/meq092
Linsinger, T. P., Roebben, G., Solans, C., and Ramsch, R. (2011). Reference materials for measuring the size of nanoparticles. TrAC Trends Anal. Chem. 30, 18–27. doi: 10.1016/j.trac.2010.09.005
Liu, C. W., Chang, H. W., Sarkar, B., Saillard, J. Y., Kahlal, S., and Wu, Y. Y. (2009). Stable Silver (I) hydride complexes supported by diselenophosphate ligands. Inorg. Chem. 49, 468–475.doi: 10.1021/ic901408n
Liu, J., and Hurt, R. H. (2010). Ion release kinetics and particle persistence in aqueous nano-silver colloids. Environ. Sci. Technol. 44, 2169–2175. doi: 10.1021/es9035557
Liu, Y., Laks, P., and Heiden, P. (2002). Controlled release of biocides in solid wood. III. Preparation and characterization of surfactant-free nanoparticles. J. Appl. Polym. Sci. 86, 615–621.doi: 10.1002/app.10898
Lohse, S. E., and Murphy, C. F. (2012). Applications of colloidal inorganic nanoparticles: from medicine to energy. J. Am. Chem. Soc. 134, 15607−15620. Lohse, S. E., and Murphy, C. F. (2012). Applications of colloidal inorganic. doi: 10.1021/ja307589n
López-Lorente, Á. I., and Mizaikoff, B. (2016). Recent advances on the characterization of nanoparticles using infrared spectroscopy. TrAC Trends Anal. Chem. 84, 97–106. doi: 10.1016/j.trac.2016.01.012
López-Lorente, A. L., and Valcárcel, M. (2016). The third way in analytical nanoscience and nanotechnology: involvement of nanotools and nanoanalytes in the same analytical process. Trend Anal. Chem. 9, 1–9. doi: 10.1016/j.trac.2015.06.011
Lövestam, G., Rauscher, H., Roebben, G., Klüttgen, B. S., Gibson, N., Putaud, J. P., et al. (2010). Considerations on a definition of nanomaterial for regulatory purposes. Joint Res. Centre Refer. Rep. 1, 80001–80004. doi: 10.2788/98686
Loza, K., Diendorf, J., Sengstock, C., Ruiz-Gonzalez, L., Gonzalez-Calbet, J. M., Vallet-Regi, M., et al. (2014). The dissolution and biological effects of silver nanoparticles in biological media. J. Mater. Chem. B 2, 1634–1643. doi: 10.1039/C3TB21569E
63
Luther, E. M., Koehler, Y., Diendorf, J., Epple, M., and Dringen, R. (2011). Accumulation of silver nanoparticles by cultured primary
brain astrocytes. Nanotechnology 22:375101. doi: 10.1088/0957-4484/22/37/375101
Lux Research (2008). Lux Research. Nanomaterials State of the Market Q3 2008. Available online at: www.luxresearch.com.
MacCuspie, R. I. (2011). Colloidal stability of silver nanoparticles in biologically relevant conditions. J. Nanopart. Res. 13, 2893–2908. doi: 10.1007/s11051-010-0178-x
MacCuspie, R. I., Allen, A. J., Martin, M. N., and Hackley, V. A. (2013). Just add water: reproducible singly dispersed silver nanoparticle suspensions on- demand. J. Nanopart. Res. 15, 1–12. doi: 10.1007/s11051-013-1760-9
MacCuspie, R. I., Rogers, K., Patra, M., Suo, Z., Allen, A. J., Martin, M. N., et al. (2011). Challenges for physical characterization of silver nanoparticles under pristine and environmentally relevant conditions. J. Environ. Monit. 13, 1212–1226.doi: 10.1039/C1EM10024F
Mader, B. T., Ellefson, M. E., and Wolf, S. T. (2015). Measurements of nanomaterials in environmentally relevant water matrices using liquid nebulization/differential mobility analysis. Environ. Toxicol. Chem. 34, 833–842. doi: 10.1002/etc.2865
Mahmoudi, M., Monopoli, M. P., Rezaei, M., Lynch, I., Bertoli, F., McManus, J. J., et al. (2013). The protein corona mediates the impact of nanomaterials and slows amyloid beta fibrillation. ChemBioChem 14, 568–572. doi: 10.1002/cbic.201300007
Majdalawieh, A., Kanan, M. C., El-Kadri, O., and Kanan., S. M. (2014). Recent Advances in Gold and Silver Nanoparticles: Synthesis and Applications. J. Nanosci. Nanotechnol. 14, 4757–4780.
Majedy, S. Y., and Lee, H. K. (2016). Recent advances in the separation and quantification of metallic nanoparticles and ions in the environment. TrAC Trends Anal. Chem. 75, 183–196. doi: 10.1016/j.trac.2015.08.009
Manojkumar, K., Sivaramakrishna, A., and Vijayakrishna, K. (2016). A short review on stable metal nanoparticles using ionic liquids, supported ionic liquids, and poly(ionic liquids). J. Nanopart. Res. 18, 103. doi: 10.1007/s11051-016-3409-y
Marambio-Jones, C., and Hoek, E. M. (2010). A review of the antibacterial effects of silver nanomaterials and potential implications for human health and the environment. J. Nanopart. Res, 12, 1531–1551. doi: 10.1007/s11051-010- 9900-y
Marbella, L. E., and Millstone, J. E. (2015). NMR techniques for noble metal nanoparticles. Chem. Mater. 27, 2721–2739. doi: 10.1021/cm504809c
Martin, M. N., Allen, A. J., MacCuspie, R. I., and Hackley, V. A. (2014). Dissolution, agglomerate morphology, and stability limits of protein-coated silver nanoparticles. Langmuir 30, 11442–11452. doi: 10.1021/la502973z
Maurer, L. L., and Meyer, J. N. (2016). A systematic review of evidence for silver nanoparticle-induced mitochondrial toxicity. Environ.
Sci. Nano 3, 311–322. doi: 10.1039/c5en00187k
Mayer, A. B. R. (2001). Colloidal metal nanoparticles dispersed in amphiphilic polymers. Polym. Adv. Technol. 12, 96–106. doi: 10.1002/1099-1581(200101/02) 12:1/2<96::AID-PAT943>3.0.CO;2-G
Meli, F., Klein, T., Buhr, E., Frase, C. G., Gleber, G., Krumrey, M., et al. (2012). Traceable size determination of nanoparticles, a comparison among European metrology institutes. Meas. Sci. Technol. 23:125005. doi:10.1088/0957- 0233/23/12/125005
Menzel, M., Bienert, R., Bremser, W., Girod, M., Rolf, S., and Thünemann, A.F. (2013). Certification Report Certified Reference Material BAM-N001 Particle Size Parameters of Nano Silver. Berlin: Federal Institute for Materials Research and Testing.
Meyer, J. N., Lord, C. A., Yang, X. Y., Turner, E. A., Badireddy, A. R., Marinakos, S. M., et al. (2010). Intracellular uptake and associated toxicity of silver nanoparticles in Caenorhabditis elegans. Aquat. Toxicol. 100, 140–150. doi: 10.1016/j.aquatox.2010.07.016
Miller, G., and Wickson, F. (2015). Risk analysis of nanomaterials: exposing nanotechnology’s naked emperor. Rev. Policy Res. 32, 485–512. doi: 10.1111/ropr.12129
Mitrano, D. M., Rimmele, E., Wichser, A., Erni, R., Height, M., and Nowack, B. (2014). Presence of nanoparticles in wash water from conventional silver and nano-silver textiles. ACSnano 8, 7208–7219. doi:10.1021/nn502228w
Montaño, M. D., Olesik, J. W., Barber, A. G., Challis, K., and Ranville, J. F. (2016). Single Particle ICP-MS: advances toward routine analysis of nanomaterials. Anal. Bioanal. Chem. 408, 5053–5074. doi: 10.1007/s00216-016-9676-8
Montoro Bustos, A. R., Petersen, E. J., Possolo, A., and Winchester, M. R. (2015). Post hoc interlaboratory comparison of single particle ICP-MS size measurements of NIST gold nanoparticle reference materials. Anal. Chem. 87, 8809–8817. doi: 10.1021/acs.analchem.5b01741
Mueller, N. C., and Nowack, B. (2008). Exposure modeling of engineered nanoparticles in the environment. Environ. Sci. Technol. 42, 4447–4453. doi: 10.1021/es7029637
Murphy, C. J., Jana, N. R., and Gearheart, L. (2001). Evidence for seed-mediated nucleation in the chemical reduction of gold salts to gold nanoparticles. Chem. Mater. 13, 2313–2322. doi: 10.1021/cm000662n
64
Murphy, K. E., Liu, J., Bustos, A. R. M., Johnson, M. E., and Winchester, M.R. (2015). Characterization of Nanoparticle Suspensions
Using Single Particle Inductively Coupled Plasma Mass Spectrometry. Gaithersburg, MD: NIST Special Publication.
Nath, S., Jana, S., Pradhan, M., and Pal, T. (2010). Ligand-stabilized metal nanoparticles in organic solvent. J. Colloid Interfaces Sci. 341: 333–352. doi: 10.1016/j.jcis.2009.09.049
National Institute of Standards and Technology NIST (2012). Certificate of Analysis, Standard Reference Material 1898, Titanium Dioxide Nanomaterial. Available online at: https://www-s.nist.gov/srmors/certificates/1898.pdf
National Institute of Standards and Technology NIST (2014a). Certificate of Analysis, Standard Reference Material 1964, Nominal 60 nm Diameter Polystyrene Spheres. Available online at: https://www-s.nist.gov/srmors/ certificates/1964.pdf
National Institute of Standards and Technology NIST (2014b). Certificate of Analysis, Standard Reference Material 1963a, Nominal 100 nm Diameter Polystyrene Spheres. Available online at: (https://www-s.nist.gov/srmors/ certificates/1963a.pdf) accessed 09.13.16.
National Institute of Standards and Technology NIST (2015a). Reports of Investigation, Reference Material 8011, Gold Nanoparticles, Nominal 10 nm Diameter. Available online at: https://www-s.nist.gov/srmors/reports/8011.pdf National Institute of Standards and Technology
NIST (2015b). Reports of Investigation, Reference Material 8012, Gold Nanoparticles, Nominal 30 nm Diameter. Available online at:
https://www-s.nist.gov/srmors/reports/8012.pdf National Institute of Standards and Technology
NIST (2015c). Reports of Investigation, Reference Material 8013, Gold Nanoparticles, Nominal 60 nm Diameter. Available online at: https://www-s.nist.gov/srmors/reports/8013.pdf National Institute of Standards and Technology
NIST (2015d). Reports of Investigation, Reference Material 8017, Polyvinylpyrrolidone Coated Silver Nanoparticles, Nominal Diameter 75 nm. Available online at: https://www-s.nist.gov/srmors/view_report.cfm?srm=8012
Nie, S., and Emory, S. R. (1997). Probing single molecules and single nanoparticles by surface-enhanced Raman scattering. Science 275, 1102–1106. doi: 10.1126/science.275.5303.1102
Orts-Gil, G., Natte, K., and Österle, W. (2013). Multi-parametric reference nanomaterials for toxicology: state of the art, future challenges and potential candidates. RSC Adv. 3, 18202–18215. doi: 10.1039/C3RA 42112K
Pan, B., and Xing, B. (2012). Applications and implications of manufactured nanoparticles in soils: a review. Eur. J. Soil Sci. 63, 437–456. doi: 10.1111/j.1365-2389.2012.01475.x
Parisi, C., Vigani, M., and Rodríguez-Cerezo, E. (2015). Agricultural nanotechnologies: what are the current possibilities?. Nano Today 10, 124–127. doi: 10.1016/j.nantod.2014.09.009
Park, H. J., Kim, S. H., Kim, H. J., and Choi, S. H. (2006). A new composition of nanosized silica-silver for control of various plant diseases. Plant Pathol. J. 22, 295–302. doi: 10.5423/PPJ.2006.22.3.295
Park, J., Cha, S., Cho, S., and Park, Y. (2016). Green synthesis of gold and silver nanoparticles using gallic acid: catalytic activity and conversion yield toward the 4-nitrophenol reduction reaction. J. Nanopart. Res. 18, 166. doi: 10.1007/s11051-016-3466-2
Park, K., Tuttle, G., Sinche, F., and Harper, S. L. (2013). Stability of citrate- capped silver nanoparticles in exposure media and their effects on the development of embryonic zebrafish (Danio rerio). Arch. Pharm. Res. 36, 125–133. doi: 10.1007/s12272-013-0005-x
Pastoriza-Santos, I., and Liz-Marzán, L. M. (1999). Formation and stabilization of silver nanoparticles through reduction by N,N-Dimethylformamide. Langmuir 15, 948–951. doi: 10.1021/la980984u
Patenaude, J., Legault, G. A., Beauvais, J., Bernier, L., Be’land, J. P., Boissy, P., et al. (2015). Framework for the Analysis of
nanotechnologies’impacts and ethical acceptability: basis of an interdisciplinary approach to assessing novel technologies. Sci. Eng. Ethics 21, 293–315. doi:10.1007/s11948-014-9543-y
Patri, A., Umbreit, T., Zheng, J., Nagashima, K., Goering, P., Francke-Carroll, S., et al. (2009). Energy dispersive X-ray analysis of titanium dioxide nanoparticle distribution after intravenous and subcutaneous injection in mice. J. Appl. Toxicol., 29, 662–672. doi:
10.1002/jat.1454
Pease, III. L. F., Tsai, D. H., Zangmeister, R. A., Zachariah, M. R., Tarlov, M. J., and NIST–NCL Method PCC-5 (2010). Analysis of Gold Nanoparticles by Electrospray Differential Mobility Analysis. Gaithersburg, MD: National Institute of Standards and Technology.
Pecher, J., and Mecking, S. (2010). Nanoparticles of Conjugated Polymers. Chem.Rev. 110, 6260–6279. doi: 10.1021/cr100132y
Phogat, N., Ali Khan, S., Shankar, S., Ansary, A. A., and Uddin, I. (2016). Fate of inorganic nanoparticles in agriculture. Adv. Mater. Lett. 7, 03–12. doi: 10.5185/amlett.2016.6048
Piccinno, F., Gottschalk, F., Seeger, S., and Nowack, B. J. (2012). Industrial production quantities and uses of ten engineered nanomaterials in Europe and the world. J Nanopart. Res. 14, 1109. doi:10.1007/s11051-012-1109-9
Picotto, G. B., Koenders, L., and Wilkening, G. (2009). Nanoscale metrology. Meas. Sci. Technol. 20:080101. doi: 10.1088/0957-0233/20/8/080101
65
Pinto, V., Ferreira, M. J., Silva, R., Santos, H. A., Silva, S. F., and Pereira, C. M. (2010). Long time effect on the stability of silver
nanoparticles in aqueous medium: effect of the synthesis and storage conditions. Colloids Surf. A 364, 19–25. doi: 10.1016/j.colsurfa.2010.04.015
Pulit-Prociak, J., and Banach, M. (2016). Silver nanoparticles–a material of the future?. Open Chem. 14, 76–91. doi: 10.1515/chem-2016-0005
Pyatenko, A., Yamaguchi, M., and Suzuki, M. (2007). Synthesis of spherical silver nanoparticles with controllable sizes in aqueous solutions. J. Phys. Chem. C 111, 7910–7917. doi: 10.1021/jp071080x
Pyrz, W. D., and Buttrey, D. J. (2008). Particle size determination using TEM: a discussion of image acquisition and analysis for the novice microscopist. Langmuir 24, 11350–11360. doi: 10.1021/la801367j
Qu, Y., and Ma, Y. (2012). A simple approach towards uniform spherical Ag-like nanoparticles. Nanoscale 4, 3036–3039. doi:10.1039/C2NR30532A
Quadros, M. E., Pierson, I. V., R., Tulve, N. S., Willis, R., Rogers, K., Thomas, T. A., et al. (2013). Release of silver from nanotechnology-based consumer products for children. Environ. Sci. Technol. 47, 8894–8901. doi: 10.1021/es4015844
Rasmussen, K., Mast, J., De Temmerman, P. J., Verleysen, E., Waegeneers, N., Van Steen, F., et al. (2014). Titanium dioxide, NM-100,
NM-101, NM-102, NM- 103, NM-104, NM-105: Characterisation and Physico-Chemical Properties. JRC Science and Policy Reports. EUR 26637 EN.
Reddy, L. H., Arias, J. L., Nicolas, J., and Couvreur, P. (2012). Magnetic nanoparticles: design and characterization, toxicity and biocompatibility, pharmaceutical and biomedical applications. Chem. Rev. 112, 5818–5878. doi: 10.1021/cr300068p
Regulation (EC) No 1223/2009 of the European Parliament and of the Council of 30 November 2009 on cosmetic products. Off. J. Eur. Union. L342, (2009) 59–209. Available online at: http://eur-lex.europa.eu/
Regulation (EU) 2015/2283 of the European Parliament and of the Council of 25 November 2015 on novel foods, amending Regulation
(EU) No 1169/2011 of the European Parliament and of the Council and repealing Regulation (EC) No 258/97 of the European Parliament and of the Council and Commission Regulation (EC) No 1852/2001. Off. J. Eur. Union. L327, (2015) 1–22. Available online at: http://eur-lex.europa.eu/
Regulation (EU) No 528/2012 of the European Parliament and of the Council of 22 May 2012 concerning the making available on the market and use of biocidal products. Off. J. Eur. Union. L167, (2012) 1–123. Available online at: http://eur- lex.europa.eu/
Regulation (EU) No 1363/2013 of the Commission Delegated Regulation of 12 December 2013 amending Regulation (EU) No 1169/2011
of the European Parliament and of the Council on the provision of food information to consumers as regards the definition of ‘engineered
nanomaterials’. No 1363/2013. Off. J. Eur. Union L. 343, 26. Available online at: http://eur-lex. europa.eu/
Rice, S. B., Chan, C., Brown, S. C., Eschbach, P., Han, L., Ensor, D. S., et al. (2013). Particle size distributions by transmission electron microscopy: an interlaboratory comparison case study. Metrologia 50:663. doi: 10.1088/0026-1394/50/6/663
Rodrıguez-Sanchez, L., Blanco, M. C., and Lopez-Quintela, M. A. (2000). Electrochemical synthesis of silver nanoparticles. J. Phys. Chem. B 104, 9683–9688. doi: 10.1021/jp001761r
Roebben, G., Kestens, V., Varga, Z., Charoud-Got, J., Ramaye, Y., Gollwitzer, C., et al. (2015). Reference materials and representative test materials to develop nanoparticle characterization methods: the NanoChOp projectcase. Front. Chem. 3:56. doi: 10.3389/fchem.2015.00056
Roebben, G., Ramirez-Garcia, S., Hackley, V. A., Roesslein, M., Klaessig, F., Kestens, V., et al. (2011). Interlaboratory comparison of
size and surface charge measurements on nanoparticles prior to biological impact assessment. J. Nanopart. Res. 13, 2675–2687. doi:10.1007/s11051-011-0423-y
Roebben, G., Rasmussen, K., Kestens, V., Linsinger, T. P. J., Rauscher, H., Emons, H., et al. (2013). Reference materials and representative test materials: the nanotechnology case. J. Nanopart. Res. 15, 1–13. doi:10.1007/s11051-013-1455- 2
Römer, I., White, T. A., Baalousha, M., Chipman, K., Viant, M. R., and Lead, J. R. (2011). Aggregation and dispersion of silver nanoparticles in exposure media for aquatic toxicity tests. J. Chromatogr. A 1218, 4226–4233. doi: 10.1016/j.chroma.2011.03.034
Rosenman, K. D., Moss, A., and Kon, S. (1979). Argyria: clinical implications of exposure to silver nitrate and silver oxide. J. Occup. Med. 21, 430–435.
Sargent, Jr J. F. (2016). Nanotechnology: A Policy Primer. CRS Report. Congressional Research Service.
Scanlan, L. D., Reed, R. B., Loguinov, A. V., Antczak, P., Tagmount, A., Aloni, S., et al. (2013). Silver nanowire exposure results in internalization and toxicity to Daphnia magna. ACS Nano 7, 10681–10694. doi: 10.1021/nn4034103
Schlich, K., Klawonn, T., Terytze, K., and Hund-Rinke, K. (2013). Effects of silver nanoparticles and silver nitrate in the earthworm reproduction test. Environ. Toxicol. Chem. 32, 181–188.doi:10.1002/etc.2030
66
Schmid, O., and Stoeger, T. (2016). Surface area is the biologically most effective dose metric for acute nanoparticle toxicity in the lung.
J Aerosp. Sci. 99, 133–143. doi: 10.1016/j.jaerosci.2015.12.006
Segev-Bar, M., and Haick, H. (2013). Flexible sensors based on nanoparticles. ACSnano 7, 8366–8378. doi: 10.1021/nn402728g
Shanmugaraj, K., and Ilanchelian, M. (2016). Colorimetric determination of sulfide using chitosan-capped silver nanoparticles. Microchim. Acta 183, 1721–1728. doi: 10.1007/s00604-016-1802-y
Sharma, H., Mishra, P. K., Talegaonkar, S., and Vaidya, B. (2015). Metal nanoparticles: a theranostic nanotool against cancer. Drug Discov. Today 20, 1143–1151. doi: 10.1016/j.drudis.2015.05.009
Shin, S. W., Song, I. H., and Um, S. H. (2015). Role of physicochemical properties in nanoparticle toxicity. Nanomaterials 5, 1351–1365. doi: 10.3390/nano5031351
Shirtcliffe, N., Nickel, U., and Sheneider, S. J. (1999). Reproducible preparation of silver sols with small particle size using borohydride reduction: for use as nuclei for preparation of larger particles. J. Colloid Interface Sci. 211, 122–129. doi: 10.1006/jcis.1998.5980
Singh, C., Friedrichs, S., Levin, M., Birkedal, R., Jensen, K. A., and Pojana, G., et al. (2011). NMSeries of Representative Manufactured
Nanomaterials, Zinc Oxide NM-110, NM-111, NM-112, NM-113, Characterisation and Test Item Preparation. EUR 25066 EN, ISBN 978-92-79-22215-3
Sondi, I., Goia, D. V., and Matijevic´, E. (2003). Preparation of highly concentrated stable dispersions of uniform silver nanoparticles. J. Colloid Interface Sci. 260, 75–81. doi: 10.1016/S0021-9797(02)00205-9
Song, N. W., Park, K. M., Lee, I. H., and Huh, H. (2009). Uncertainty estimation of nanoparticle size distribution from a finite number of data obtained by microscopic analysis. Metrologia 46, 480. doi: 10.1088/0026-1394/46/5/012
Sperling, R. A., and Parak, W. J. (2010). Surface modification, functionalization and bioconjugation of colloidal inorganic nanoparticles. Philos. Trans. R. Soc. A 368, 1915. doi: 10.1098/rsta.2009.0273
Stebounova, L. V., Guio, E., and Grassian, V. H. (2011). Silver nanoparticles in simulated biological media: a study of aggregation, sedimentation, and dissolution. J. Nanopart. Res. 13, 233–244. doi: 10.1007/s11051-010- 0022-3
Stefaniak, A. B., Hackley, V. A., Roebben, G., Ehara, K., Hankin, S., Postek, M. T., et al. (2013). Nanoscale reference materials for environmental, health and safety measurements: needs, gaps and opportunities. Nanotoxicology 7, 1325–1337.doi: 10.3109/17435390.2012.739664
Steinigeweg, D., and Schlücker, S. (2012). Monodispersity and size control in the synthesis of 20–100 nm quasi-spherical silver nanoparticles by citrate and ascorbic acid reduction in glycerol–water mixtures. Chem. Commun. 48, 8682–8684. doi: 10.1039/c2cc33850e
Stone, V., Nowack, B., Baun, A., van den Brink, N., von der Kammer, F., Dusinska, M., et al. (2010). Nanomaterials for environmental
studies: classification, reference material issues, and strategies for physico-chemical characterisation. Sci. Tot. Environ. 408, 1745–1754. doi: 10.1016/j.scitotenv.2009.10.035
Sue, Y. M., Lee, J. Y. Y., Wang, M. C., Lin, T. K., Sung, J. M., and Huang, J. J. (2001). Generalized argyria in two chronic hemodialysis patients. Am. J. Kidney Dis. 37, 1048–1051. doi: 10.1016/S0272-6386(05)80023-X
Sun, Y., and Xia, Y. (2002). Shape-controlled synthesis of gold and silver nanoparticles. Science 298, 2176–2179. doi: 10.1126/science.1077229
Takahashi, K., Kato, H., Saito, T., Matsuyama, S., and Kinugasa, S. (2008). Precise measurement of the size of nanoparticles by dynamic light scattering with uncertainty analysis. Part. Part. Syst. Char. 25, 31–38. doi: 10.1002/ppsc.200700015
Thanh, N. T. K., Maclean, N., and Mahiddine, S. (2014). Mechanisms of nucleation and growth of nanoparticles in solution. Chem. Rev. 114, 7610–7630. doi: 10.1021/cr400544s
Tiede, K., Boxall, A. B., Tear, S. P., Lewis, J., David, H., and Hassellöv, M. (2008). Detection and characterization of engineered nanoparticles in food and the environment. Food Addit. Contam. 25, 795–821.doi: 10.1080/02652030802007553
Tkalec, Ž. P., Drobne, D., Vogel-Mikuš, K., Pongrac, P., Regvar, M., Štrus, J., et al. (2011). Micro-PIXE study of Ag in digestive glands of a nano-Ag fed arthropod (Porcellio scaber, Isopoda, Crustacea). Nucl. Instrum. Meth. Phys. Res. 269, 2286–2291. doi: 10.1016/j.nimb.2011.02.068
Tolaymat, T. M., El Badawy, A. M., Genaidy, A., Scheckel, K. G., Luxton, T. P., and Suidan, M. (2010). An evidence-based environmental
perspective of manufactured silver nanoparticle in syntheses and applications: a systematic review and critical appraisal of peer-reviewed scientific papers. Sci. Tot. Environ. 408, 999–1006. doi: 10.1016/j.scitotenv.2009.11.003
Tomaszewska, E., Soliwoda, K., Kadziola, K., Tkacz-Szczesna, B., Celichowski, G., Cichomski, M., et al. (2013). Detection limits of DLS
and UV-Vis spectroscopy in characterization of polydisperse nanoparticles colloids. J Nanomater. 2013:313081. doi: 10.1155/2013/313081
Toshima, N., and Yonezawa, T. (1998). Bimetallic nanoparticles-novel materials for chemical and physical applications. N. J. Chem. 22, 1179–1201. doi: 10.1039/A805753B
67
Tran, Q. H., Nguyen, V. Q., and Le, A. T. (2013). Silver nanoparticles: synthesis, properties, toxicology, applications and perspectives.
Adv. Nat. Sci. 4, 20. doi: 10.1088/2043-6262/4/3/033001
Turkevich, J., Stevenson, P. C., and Hillier, J. (1951). A study of the nucleation and growth processes in the synthesis of colloidal gold. Discuss. Faraday Soc. 55, 75. doi: 10.1039/D. F.9511100055
U.S. Department of Health and Human Resources, (2010). “12th Report on Carcinogens,” National Toxicology, Research Program, Research Triangle Park, NC, USA.
U.S. FDA (2014). U.S. Department of Health and Human Services, Food and Drug Administration (U.S. FDA), Guidance for Industry Considering Whether an FDA-Regulated Product Involves the Application of Nanotechnology, Adm: US Food Drug (2014). Available online at: http://www.fda.gov/RegulatoryInformation/Guidances/ucm257698.htm
U.S. FDA (2015). U.S. Department of Health and Human Services, Food and Drug Administration (U.S. FDA), FDA’s Approach to
Regulation of Nanotechnology Products, (2015). Available online at: http://www.fda.gov/ScienceResearch/ SpecialTopics/Nanotechnology/ucm301114.htm#guidance
Van Hyning, D. L., and Zukoski, C. F. (1998). Formation mechanisms and aggregation behavior of borohydride reduced silver particles. Langmuir 14, 7034–7040. doi: 10.1021/la980325h
Vanamudan, A., and Sudhakar, P. P. (2016). Biopolymer capped silver nanoparticles with potential for multifaceted applications. Int. J. Biol. Macromol. 86, 262–268. doi: 10.1016/j.ijbiomac.2016.01.056
Vance, M. E., Kuiken, T., Vejerano, E. P., McGinnis, S. P., Hochella Jr, M. F., Rejeski, D., et al. (2015). Nanotechnology in the real world: redeveloping the nanomaterial consumer products inventory. Beilstein J. Nanotechnol. 6, 1769–1780. doi: doi:10.3762/bjnano.6.181
Velusamy, P., Su, C. H., Kumar, G. V., Adhikary, S., Pandian, K., Gopinath, S. C., et al. (2016). Biopolymers regulate silver nanoparticle
under microwave irradiation for effective antibacterial and antibiofilm activities. PLoS ONE 11:e0157612. doi: 10.1371/journal.pone.0157612
Verleysen, E., Van Doren, E., Waegeneers, N., De Temmerman, P. J., Abi Daoud Francisco, M., and Mast, J. (2015). TEM and SP-ICP-MS analysis of the release of silver nanoparticles from decoration of pastry. J. Agric. Food Chem. 63, 3570–3578. doi: 10.1021/acs.jafc.5b00578
Viswanatha, R., and Sarma, D. D. (2007). “Chapter 4 Growth of Nanocrystals in Solution,” in Nanomaterials Chemistry, eds C. N. R. Rao, A. Muller, and A. K. Cheetham, Weinheim: WILEY-VCH Verlag GmbH & Co. KGaA.
Vladár, A. E., and Ming, B. (2010). Measuring the Size of Colloidal Gold Nano- particles Using High-Resolution Scanning Electron
Microscopy. Gaithersburg, MD: National Institute of Standards and Technology. Available online at:
https://ncl.cancer.gov/sites/default/files/protocols/NCL_Method_PCC-15.pdf
Von Goetz, N., Lorenz, C., Windler, L., Nowack, B., Heuberger, M., and Hungerbuhler, K. (2013). Migration of Ag-and TiO2-(Nano) particles from textiles into artificial sweat under physical stress: experiments and exposure modeling. Environ. Sci. Technol. 47, 9979–9987. doi: 10.1021/es304329w
Waalewijn-Kool, P. L., Klein, K., Forniés, R. M., and van Gestel, C. A. (2014). Bioaccumulation and toxicity of silver nanoparticles and silver nitrate to the soil arthropod Folsomia candida. Ecotoxicology 23, 1629–1637. doi: 10.1007/s10646-014-1302-y
Wadhera, A., and Fung, M. (2005). Systemic argyria associated with ingestion of colloidal silver. Dermatol. Online J. 11, 12. Available online at: https:// escholarship.org/uc/item/0832g6d3
Walczyk, D., Bombelli, F. B., Monopoli, M. P., Lynch, I., and Dawson, K. A. (2010). What the cell “sees” in bionanoscience. J Am. Chem. Soc. 132, 5761–5768. doi: 10.1021/ja910675v
Wan, A. T., Conyers, R. A., Coombs, C. J., and Masterton, J. P. (1991). Determination of silver in blood, urine, and tissues of volunteers and burn patients. Clin. Chem. 37, 1683–1687.
Wan, Y., Guo, Z., Jiang, X., Fang, K., Lu, X., Zhang, Y., et al. (2013). Quasi- spherical silver nanoparticles: aqueous synthesis and size
control by the seed-mediated Lee–Meisel method. J. Colloid Interface Sci. 394, 263–268. doi: 10.1016/j.jcis.2012.12.037
Warner, M. G., Reed, S. M., and Hutchison, J. E. (2000). Small, water-soluble, ligand-stabilized gold nanoparticles synthesized by interfacial ligand exchange reactions. Chem. Mater. 12, 3316–3320. doi: 10.1021/cm0003875
Watanabe, K., Menzel, D., Nilius, N., and Freund, J. H. (2006). Photochemistry on Metal Nanoparticles. Chem. Rev. 106, 4301–4320. doi: 10.1021/cr050167g
Wen, R., Hu, L., Qu, G., Zhou, Q., and Jiang, G. (2016). Exposure, tissue biodistribution, and biotransformation of nanosilver. Nanoimpact 2, 18–28. doi: 10.1016/j.impact.2016.06.001
Whiteley, C. M., Dalla Valle, M., Jones, K. C., and Sweetman, A. J. (2013). Challenges in assessing release, exposure and fate of silver nanoparticles within the UK environment. Environ. Sci. Process. Impact 15, 2050–2058. doi: 10.1039/c3em00226h
68
Wijnhoven, S. W., Peijnenburg, W. J., Herberts, C. A., Hagens, W. I., Oomen, A. G., Heugens, E. H., et al. (2009). Nano-silver–a review
of available data and knowledge gaps in human and environmental risk assessment. Nanotoxicology 3, 109–138. doi: 10.1080/17435390902725914
Wu, M., Ma, B., Pan, T., Chen, S., and Sun, J. (2016). Silver-nanoparticle- colored cotton fabrics with tunable colors and durable antibacterial and self-healing superhydrophobic properties. Adv. Funct. Mater. 26, 569–576. doi: 10.1002/adfm.201504197
Xu, R., Wang, D., Zhang, J., and Li, Y. (2006). Shape-dependent catalytic activity of silver nanoparticles for the oxidation of styrene. Chem. Asian J. 1, 888–893. doi: 10.1002/asia.200600260
Xu, Z., and Hu, G. (2012). Simple and green synthesis of monodisperse silver nanoparticles and surface enhanced Raman scattering activity. RSC Adv. 2, 11404–11409. doi: 10.1039/c2ra21745g
Yahyaei, B., Peyvandi, N., Akbari, H., Arabzadeh, S., Afsharnezhad, S., Ajoudanifar, H., et al. (2016). Production, assessment, and
impregnation of hyaluronic acid with silver nanoparticles that were produced by Streptococcus pyogenes for tissue engineering applications. Appl. Biol. Chem. 59, 227–237.
Yang, E. J., Kim, S., Kim, J. S., and Choi, I. H. (2012). Inflammasome formation and IL-1β release by human blood monocytes in response to silver nanoparticles. Biomaterials 33, 6858–6867. doi: 10.1016/j.biomaterials.2012.06.016
Yang, J., Yin, H., Jia, J., and Wei, Y. (2011). Facile synthesis of high-concentration, stable aqueous dispersions of uniform silver nanoparticles using aniline as a reductant. Langmuir 27, 5047–5053. doi: 10.1021/la200013z
Yang, X., Jiang, C., Hsu-Kim, H., Badireddy, A. R., Dykstra, M., Wiesner, M., et al. (2014). Silver nanoparticle behavior, uptake, and toxicity in Caenorhabditis elegans: effects of natural organic matter. Environ. Sci. Technol. 48, 3486–3495. doi: 10.1021/es404444n
Yen, C. W., Puig, H., Tam, J. O., Gómez-Márquez, J., Bosch, I., Hamad-Schifferli, K., et al. (2015). Multicolored silver nanoparticles for
multiplexed disease diagnostics: distinguishing dengue, yellow fever, and Ebola viruses. Lab Chip15, 1638–1641. doi: 10.1039/C5LC00055F
Yeo, M., and Yoon, J. (2009). Comparison of the effects of nano-silver antibacterial coatings and silver ions on zebrafish embryogenesis. Mol. Cell Toxicol. 5, 23–31. Available online at: http://www.koreascience.or.kr/article/ArticleFullRecord. jsp?cn=DDODB@_2009_v5n1_23
Zamiri, R., Zakaria, A., Ahangar, H. A., Sadrolhosseini, A. R., and Mahdi, M. A. (2010). Fabrication of silver nanoparticles dispersed in palm oil using laser ablation. Int. J. Mol. Sci. 11, 4764–4770. doi: 10.3390/ijms111 14764
Zhai, Y., Hunting, E. R., Wouters, M., Peijnenburg, W. J., and Vijver, M.G. (2016). Silver nanoparticles, ions, and shape governing soil microbial functional diversity: nano shapes micro. Front. Microbiol. 7:1123. doi: 10.3389/fmicb.2016.01123
Zhang, T., Wang, L., Chen, Q., and Chen, C. (2014). Cytotoxic potential of silver nanoparticles. Yonsei Med. J. 55, 283–291. doi: 10.3349/ymj.2014.55.2.283
Zhao, T., Sun, R., Yu, S., Zhang, Z., Zhou, L., Huang, H., et al. (2010). Size-controlled preparation of silver nanoparticles by a modified polyol method. Colloids Surf. A 366, 197–202. doi: 10.1016/j.colsurfa.2010. 06.005
69
Capítulo 4: Software estadístico e interactivo para el procesamiento,
visualización y análisis de los datos por spICP-MS.
4.1. Introducción
La espectrometría de masas de plasma de acoplamiento inductivo (ICP-MS) ha sido una de las
técnicas más útiles para la caracterización y cuantificación de diferentes materiales en el campo de la
química analítica (Montoro & Winchester, 2016). En los últimos 15 años, esta técnica se ha utilizado bajo
la modalidad de análisis individual de partículas por espectrometría de masas por acoplamiento inductivo
(spICP-MS) para la medición de partículas en el aire (Kawaguchi et al., 1986), suspensiones de
micropartículas y células (Nomizu et al., 1994). Más recientemente, se ha utilizado spICP-MS para la
caracterización fisicoquímica de diferentes propiedades de las NPs, como el tamaño medio, la distribución
del tamaño, la concentración del número de NPs y la concentración de masa de las NPs (Montoro-Bustos,
2016, Montoro-Bustos, 2018).
Específicamente, son Degueldre y Favarger (2003) quienes a inicios de los años 2000 discutieron
por primera vez la utilización de ICP-MS para el análisis de partículas individuales. En su investigación se
estableció el enfoque teórico y experimental para el análisis de coloides por spICP-MS que hoy en día ha
conllevado a la utilización de esta técnica analítica como una de las técnicas más prominentes para la
caracterización de suspensiones de NPs.
La idea básica subyacente detrás de esta técnica analítica (Figura 4.1) se basa en que las NPs al
introducirse e ionizarse en la antorcha del plasma generan una señal transitoria inducida por el destello de
iones en el plasma que a su vez puede detectarse y medirse para una masa iónica seleccionada por el
espectrómetro de masas (MS). La intensidad de la señal del MS se registra de manera temporal, en donde
los pulsos registrados son proporcionales al tamaño de partícula y la señal estable correspondiente a la
fracción del elemento estudiado en la suspensión coloidal. Además, la frecuencia de los pulsos es
directamente proporcional a la concentración de partículas en las suspensiones coloidales (Degueldre y
Favarger, 2003).
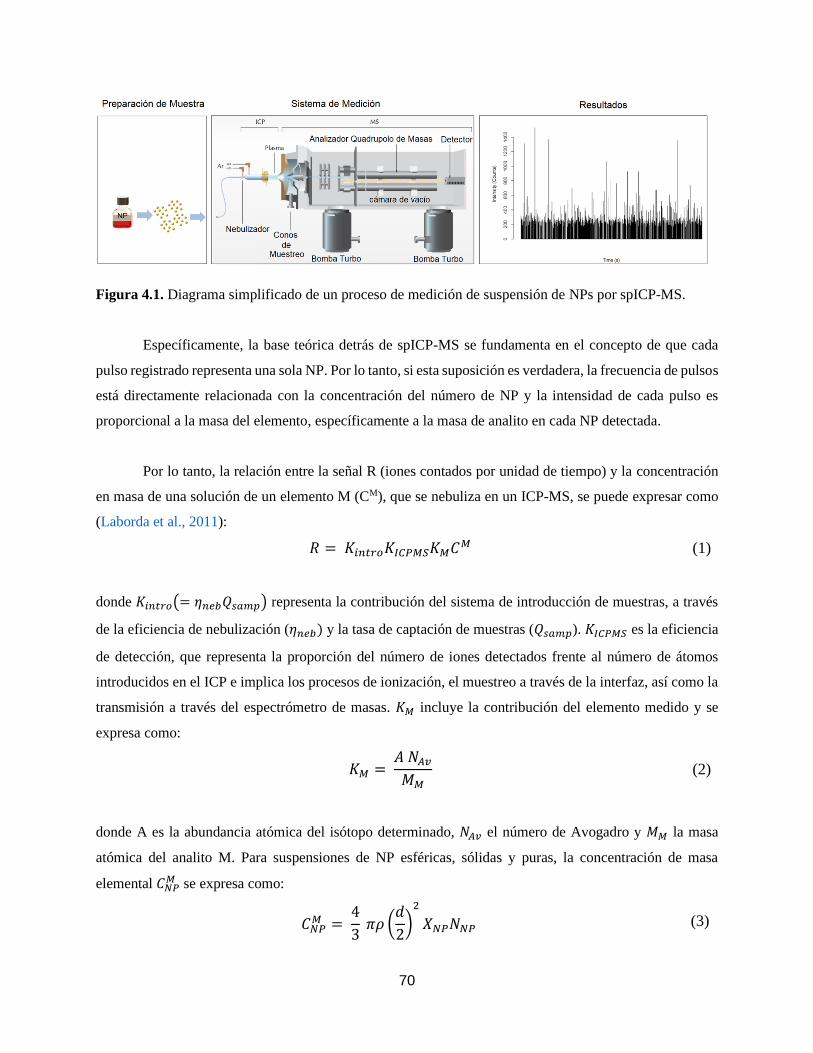
70
Figura 4.1. Diagrama simplificado de un proceso de medición de suspensión de NPs por spICP-MS.
Específicamente, la base teórica detrás de spICP-MS se fundamenta en el concepto de que cada
pulso registrado representa una sola NP. Por lo tanto, si esta suposición es verdadera, la frecuencia de pulsos
está directamente relacionada con la concentración del número de NP y la intensidad de cada pulso es
proporcional a la masa del elemento, específicamente a la masa de analito en cada NP detectada.
Por lo tanto, la relación entre la señal R (iones contados por unidad de tiempo) y la concentración
en masa de una solución de un elemento M (CM), que se nebuliza en un ICP-MS, se puede expresar como
(Laborda et al., 2011):
𝑅 = 𝐾𝑖𝑛𝑡𝑟𝑜𝐾𝐼𝐶𝑃𝑀𝑆𝐾𝑀𝐶𝑀 (1)
donde 𝐾𝑖𝑛𝑡𝑟𝑜(= 𝜂𝑛𝑒𝑏𝑄𝑠𝑎𝑚𝑝) representa la contribución del sistema de introducción de muestras, a través
de la eficiencia de nebulización (𝜂𝑛𝑒𝑏) y la tasa de captación de muestras (𝑄𝑠𝑎𝑚𝑝). 𝐾𝐼𝐶𝑃𝑀𝑆 es la eficiencia
de detección, que representa la proporción del número de iones detectados frente al número de átomos
introducidos en el ICP e implica los procesos de ionización, el muestreo a través de la interfaz, así como la
transmisión a través del espectrómetro de masas. 𝐾𝑀 incluye la contribución del elemento medido y se
expresa como:
𝐾𝑀 = 𝐴 𝑁𝐴𝑣𝑀𝑀
(2)
donde A es la abundancia atómica del isótopo determinado, 𝑁𝐴𝑣 el número de Avogadro y 𝑀𝑀 la masa
atómica del analito M. Para suspensiones de NP esféricas, sólidas y puras, la concentración de masa
elemental 𝐶𝑁𝑃𝑀 se expresa como:
𝐶𝑁𝑃𝑀 =
4
3 𝜋𝜌 (
𝑑
2)2
𝑋𝑁𝑃𝑁𝑁𝑃 (3)
71
donde d es el diámetro de la NP, ρ la densidad de la NP, 𝑋𝑁𝑃 la fracción de masa del elemento en la NP
(igual a 1 para un NP metálico) y 𝑁𝑁𝑃 la concentración del número de NPs. De esta forma la expresión (1)
se puede adaptar para la nebulización de esta suspensión de NPs como (Laborda et al., 2013):
𝑅 = 𝐾𝑖𝑛𝑡𝑟𝑜𝐾𝐼𝐶𝑃𝑀𝑆𝐾𝑀𝐾𝑁𝑃𝑁𝑁𝑃 (4)
donde 𝐾𝑁𝑃(=4
3𝜋𝜌 (
𝑑
2)3𝑋𝑁𝑃) incluyendo en esta expresión las propiedades físicas y químicas de las NPs
analizadas.
Uno de los aspectos de gran relevancia de la técnica spICP-MS, es que esta necesita del uso de
suspensiones suficientemente diluidas (cuyas concentraciones son ambientalmente relevantes, ng/L) para
detectar sólo una NP por lectura. Bajo tal condición, el flujo en las NPs que alcanzan el plasma (𝑄𝑁𝑃) y,
por lo tanto, la frecuencia de las NP detectadas (𝑓𝑁𝑃) viene dado por la última contribución de la expresión
5, donde:
𝑓𝑁𝑃 = 𝑄𝑁𝑃 = 𝜂𝑛𝑒𝑏𝑄𝑠𝑎𝑚𝑁𝑁𝑃
(5)
Cuando las mediciones se adquieren en modo resuelto en el tiempo, cada lectura dura un período
igual al tiempo de permanencia (𝑡𝑑𝑤𝑒𝑙𝑙). En tales condiciones, y si solo se detecta una NP durante una sola
lectura (𝜂𝑛𝑒𝑏𝑄𝑠𝑎𝑚𝑁𝑁𝑃 = 1), 𝑟𝑁𝑃 (= 𝐾𝐼𝐶𝑃𝑀𝑆𝐾𝑀𝐾𝑁𝑃) representan los recuentos totales por lectura y, las NP
pueden expresarse con respecto a su diámetro mediante la siguiente expresión (Laborda et al., 2013):
𝑟𝑁𝑃 =1
6 𝜋𝜌𝐾𝐼𝐶𝑃𝑀𝑆𝐾𝑀𝑑
3 (6)
Un abordaje más extenso sobre las expresiones y la base teórica anteriormente detalladas se pueden
encontrar en las investigaciones desarrolladas por Degueldre et al. (2003, 2004, 2006) y Laborda et al.
(2011; 2013a; 2013b). De igual manera, como alternativa práctica, Pace et al. (2011), presentó un protocolo
donde a partir de mediciones de estándares disueltos del elemento a analizar y su relación con las
mediciones realizadas a un material de referencia (MR) se puede establecer una expresión (factor de
eficiencia de transporte, 𝜂𝑒𝑓𝑓) que permite caracterizar cualquier tipo de composición química de NPs,
independientemente de la composición de los estándares y MR utilizados en el proceso de calibración. Un
72
abordaje detallado sobre aspectos inherentes a la preparación de los reactivos, calibrantes, preparación de
la muestra, análisis y condiciones de operación del ICP-MS, así como los cálculos intermedios, derivados
e incertidumbre de medición para la caracterización de nanomateriales mediante spICP-MS se puede
encontrar en la publicación especial del NIST titulada: “Special Publication 1200-21: Characterization of
nanoparticle suspensions using single particle inductively coupled plasma mass spectrometry” (Murphy et
al., 2015). Finalmente, un enfoque para abordar la validación de la metodología de medición por spICP-
MS en las mediciones rutinarias del tamaño promedio de NP y de la distribución de tamaños se puede
encontrar en la investigación realizada por Montoro Bustos, et al. (2018).
Los enfoques descritos anteriormente han sido la base teórica y experimental para el desarrollo de
mediciones en spICP-MS. Otras investigaciones en los últimos años han intentado mejorar las mediciones
utilizando ciertas correcciones (Liu et al., 2014), proponiendo nuevos algoritmos y diferentes estimaciones
estadísticas para reconocer las señales de las NPs (Tuoriniemi et al., 2015, Cornelis and Hassellöv, 2014,
Bi et al., 2014), así como mejores capacidades de resolución temporal para la adquisición de datos (Strenge
et al, 2015).
Actualmente, la técnica spICP-MS está impactando la forma en cómo se cuantifica y caracteriza
las NPs en suspensión acuosa. Por ejemplo, en los últimos años se han desarrollado diferentes aplicaciones
para la detección de NPs en agua potable y muestras ambientales (Donovan et al., 2016, Proulx et al., 2016);
también se han desarrollado métodos para caracterizar NPs en sistemas biológicos (Johnson et al., 2016;
Dan et al., 2016), entre otra gran cantidad de aplicaciones (Montaño et al., 2016).
En la caracterización de AgNPs esta técnica ha sido utilizada ampliamente en la determinación del
tamaño de partícula y concentración en número de partículas, demostrando tener exactitud similar a otras
técnicas comerciales como Dispersión Dinámica de la Luz (DLS), Centrífuga Diferencial por
Sedimentación (DCS), Análisis de Seguimiento de Nanopartículas (NTA), y Microscopia Electrónica de
Transmisión (TEM) (Pace, et al., 2012). spICP-MS ha sido utilizada en el área de toxicología para poder
caracterizar AgNPs y determinar el contenido de plata disuelta (Ag+) en muestras de plasma sanguíneo y
sangre proveniente de pacientes con quemaduras (Roman, et al., 2016). En el estudio de sistemas coloidales,
spICP-MS ha sido utilizada para comprender la estabilidad de suspensiones de AgNPs (recubiertas con
PVP o citrato) al ser sometidas a diferentes fuerzas iónicas y comprender los tipos de agregados formados
en estos sistemas (Kim, et al., 2017). Además, en la obtención de NPs bimetálicas de Au-Ag (núcleo-capa),
spICP-MS se ha utilizado para estudiar la estabilidad de este tipo de NPs en un agua moderadamente dura.
En el área de ciencias de los alimentos, se ha utilizado spICP-MS para comprender la liberación y disolución
73
de AgNPs presentes en el plástico de contenedores de comida (Fröhlich & Fröhlich, 2016). Por lo tanto,
queda claro con todo lo anterior que spICP-MS es una de las técnicas sumamente potente a nivel analítico
y con gran aplicabilidad para la caracterización de AgNPs en ua gran diversidad de diferentes escenarios.
Actualmente, se está iniciando la aplicación de spICP-MS en el estudio y comprensión de procesos
de síntesis química de NPs. Por ejemplo, Kéri et al. (2018) utilizó esta técnica para la caracterización de
nanomateriales de ingeniería obtenidos por medio de síntesis química. Específicamente, utilizó spICP-MS
en la caracterización de la composición elemental y estructural de NP bimetálicas de Au-Ag. Nath et al.
(2018), desarrollaron la síntesis de AgNPs, CuNPs y ZnO-NPs marcadas isotópicamente para poder
desarrollar estudios de rastreo en diferentes partes de las plantas en donde spICP-MS jugó un papel
primordial para corroborar el consumo (bioabsorciòn) y translocación de AgNPs en plantas de A. thaliana.
Recientemente, Zhang et al. (2019) empleó spICP-MS para determinar el tamaño de la formación de nuevas
AgNPs, así como la cinética de formación en un proceso de síntesis verde de AgNPs. Lo anterior demuestra
el potencial y gran capacidad que tiene spICP-MS para estudios de síntesis química de nanomateriales de
ingeniería.
Sin embargo, pese a todos estos grandes y promisorios avances que ha tenido la técnica durante
estos últimos años (Montoro Bustos & Winchester, 2016), muy poco se ha impulsado a nivel científico al
desarrollo de softwares que permitan un procesamiento de los datos más rápido, con un amplio fundamento
estadístico y que además, ostente una interface de fácil manejo y con alta interactividad que permita a la
comunidad científica tener una herramienta amigable que ayude a los procesos de inferencia, corrección,
procesamiento y cálculos inherentes al análisis de suspensiones de NPs por spICP-MS.
El siguiente capítulo muestra el manuscrito a ser enviado a la revista “Journal of Analytical Atomic
Spectrometry (JAAS), de la Royal Society of Chemistry”, el cual discute los esfuerzos científicos y
tecnológicos desarrollados en esta línea de investigación para obtener un software/aplicación web
interactiva desarrollada en entorno R llamada “NanoICP-MS” capaz de realizar la visualización interactiva
de los datos preveenientes de los análisis spICP-MS, el cálculo de los principales mensurandos involucrados
en el análisis de spICP-MS (tamaño, distribución de tamaño y número de nanopartículas concentración
(PNC), y visualización gráfica y análisis estadístico de dichos datos, con un tiempo de procesamiento
significativamente reducido (ms). Esta herramienta propone diferentes criterios estadístico (umbrales de
separación) para discriminar las diferentes señales (fondo del instrumento y señales de eventos de
partículas. Diferentes algoritmos paramétricos y robustos fueron introducidos en la aplicación “NanoICP-
MS” para proporcionar versatilidad en la estimación de la tendencia central de la distribución del tamaño
74
de partículas. Las salidas de datos incluyen (pero no se limitan a) por ejemplo, el modelo de regresión,
factor de respuesta iónico y de partículas, número de eventos de partículas, concentración de masa de
partículas, concentración de especies iónicas, error estándar (SE) de la población de partículas, rango
intercuartílico de la distribución de tamaños de particula, límite de detección y eficiencia de transporte (TE)
tanto por el método de tamaño de partícula como por el método de frecuencia. La aplicación “NanoICP-
MS” fue desarrollada para el procesamiento interno de conjuntos de datos spICP-MS resultantes del análisis
de materiales de referencia (suspensiones de nanopartículas diluidas y monodispersas). “NanoICP-MS”
muestra la capacidad de ser empleada en diferentes aplicaciones que van desde NP metálicas,
específicamente nanopartículas de oro (AuNP), nanopartículas de plata (AgNP) en suspensiones acuosas
medidas mediante adquisición de datos a escala de milisegundos hasta estudios in vivo sobre la captación
de AuNP modificadas por el nematodo Caenorhabditis elegans. Específicamente, el uso de este animal
simple e invertebrado (C.elegans) posee una gran importancia en la evaluación del potencial toxicicologico
y la eficacia de los nanomateriales (Johnson et al., 2017), por lo tanto era imperativo investigar y evaluar
la capacidad de “NanoICP-MS” para procesar datos provenientes de la absorción de nanopartículas de
ingeniería (ENP) ingeridas por vía oral por este tipo de nematodos.
75
4.2. NanoICP-MS: a new statistical and interactive web application for the
processing, visualization and analysis of nanoparticles suspensions using
single particle ICP-MS measurements
Artículo 2. Manuscrito a ser enviado a la revista Journal of Analytical Atomic
Spectrometry - Royal Society of Chemistry.
Bryan Calderón-Jiménez*, Gabriel Sarmanho, Ingo H. Strenge, Monique E. Johnson, Antonio
Montoro Bustos, Shu Wei Chou-Chen, Sara Stoud, Antonio Possolo, Jose R. Vega-Baudrit, Karen
E. Murphy
76
NanoICP-MS: a new statistical and interactive web
application for the processing, visualization and
analysis of nanoparticles suspensions using single
particle ICP-MS measurements
Bryan Calderón-Jiméneza,b,c*, Gabriel F. Sarmanhod, Ingo H. Strengea , Monique E. Johnsona,
Antonio Montoro Bustosa, Shu Wei Chou-Chene, Sara Stoudtf, Antonio Possolof, José R. Vega-
Baudritg, Karen E. Murphya
aNational Institute of Standards and Technology, Chemical Sciences Division, Material Measurement
Laboratory, Gaithersburg, MD, USA
bChemical Metrology Division, National Metrology Laboratory of Costa Rica, San José, CR
cPh.D Program in Natural Science for Development (DOCINADE), Technological Institute of Costa Rica,
National University, State Distance University, CR
dNational Institute of Metrology, Quality and Technology, Xerem, BR.
eUniversity of Costa Rica, School of Statistics, San José, CR
fNational Institute of Standards and Technology, Statistical Engineering Division, Information
Technology Laboratory, Gaithersburg, MD, USAgNational
gLaboratory of Nanotechnology, National Center of High Technology, San José, CR
*Correspondence:
Bryan Calderón Jiménez, [email protected]
77
Abstract
Advances in the synthesis, stabilization, and production of nanoparticles (NPs) have fostered a new
generation of commercial products and intensified scientific investigation of these materials. Recently,
single particle inductively coupled plasma-mass spectrometry (spICP-MS) has emerged as a highly
valuable analytical technique for the characterization of aqueous NP suspensions. In recent years, data
analysis tools such as spreadsheets, custom programs, and ICP-MS vendor software programs have been
developed to process large data sets associated with particle measurements by spICP-MS. However, a lack
of sophistication and transparency in the algorithms used, restrictions due to software licenses, and in some
cases the need for extensive knowledge in programming can limit the applicability of spICP-MS of existing
data analysis tools.
This study describes the development and applicability of a new statistical and interactive web application
we call NanoICP-MS, which supports interactive visualization of spICP-MS, computation of the principal
measurands involved in spICP-MS analysis (size, size distribution, and nanoparticle number concentration
(PNC), and provides graphical display and statistical analysis of data, with significantly reduced processing
time. NanoICP-MS was developed using the R environment, while its intuitive and user-friendly interface
for processing of spICP-MS data is largely based on the open-source R package Shiny, thus enabling a
friendly and interactive user app. Raw data files in .csv format from any ICP-MS instrument software
platform can be processed without requiring sophisticated knowledge of R-studio programming. Sample
data are processed simultaneously rather than sequentially resulting in reducing data analysis times. The
present study proposes different statistical criterion to discriminate instrument and reagent background
signals from particle event signals (i.e. for the purpose of determining the signal intensity threshold between
particulate and continuous signals). An extreme outlier approach is proposed as a strategy to deal with
systematic errors due to spurious particle agglomeration and anomalous measurement artifacts. Different
parametric and robust algorithms are included in the NanoICP-MS app to provide versatility in the
estimation of the central tendency of the particle size distribution (PSD). Data outputs include (but are not
limited to) for example, the regression model, ionic and particulate response factor, number of particle
events, particle mass concentration, ionic species concentration, standard error (SE) of the particle
population, interquartile range of the PSD, limit of detection, and transport efficiency (TE) by both the
particle size (PSTE) method and frequency method (PFTE). The NanoICP-MS app was developed for in-
house processing of spICP-MS data sets resulting from the analysis of calibration materials (dilute and
monodispersed nanoparticle suspensions). At present, the NanoICP-MS app demonstrates capabilities for
use in applications involving metallic NPs, specifically gold nanoparticles (AuNPs), silver nanoparticles
78
(AgNPs) in aqueous suspensions measured using millisecond-scaled data acquisition, and in-vivo study of
the the uptake of engineered AuNPs by the nematode Caenorhabditis elegans.
Keywords: spICP-MS, interactive web application, software development, data processing, gold
nanoparticles, silver nanoparticles.
1. Introduction
Nanoparticles (NP) have been a focus of interest for researchers in recent years due to their
extraordinary physical and chemical properties, and their potential use in many applications in the scientific
and technological fields (medicine, biotechnology, materials, catalysis, biosensors).1,2 However, despite the
promising scientific and technological impact of NPs, there are societal concerns associated with their use.
Specifically, the increasing incorporation of nano-objects into everyday consumer products is fostering
studies that seek to understand potential pathways and effects these new technologies have on the
environment, health and safety (nanoEHS).2,3
Several well-established analytical techniques such as atomic force microscopy (AFM), scanning
electron microscopy (SEM), transmission electron microscopy (TEM), dynamic light scattering (DLS),
particle tracking analysis (PTA) have been used in the recent years to achieve successful physico-chemical
characterization of NPs and nanomaterials (NMs) in general.4,5 However, some technical and practical
challenges associated with these analytical techniques still limit a robust and quantitative characterization
of NPs at enviromentally relevant concentrations.4
Single particle inductively couple plasma mass spectrometry (spICP-MS) has been considered an
emerging analytical technique that enables simultaneous measurements of NP size and number
quantification of metallonanoparticles at realistic environmental exposure concentrations (in the order of
ng L-1 or parts per trillion).6 This technique is capable of achieving detection limits for PNC in the range of
1000 particles per mL.7,8 Also, spICP-MS provides substantial information regarding elemental
composition, while it allows distinguishing of dissolved ionic species from NPs simultaneously in a
colloidal dispersion (a feat that most other analytical techniques have yet to achieve).8,84 Additionally, the
versatility of this technique enables the acquisition of pertinent information on colloidal dispersions such
as polydispersity and the agglomeration and/or aggregation state.9,80
79
The fundaments behind spICP-MS were introduced by Degueldre et al.10 approximately 10 years
ago. In brief, very dilute suspensions of NPs are nebulized and introduced to the plasma torch, generating
pulses or signals induced by the flashes of ions due to the ionization of NPs. If the ICP-MS is operated in
time-resolved analysis (TRA) mode, the mass spectrometer can record the individual signal event produced
by each NP. Thus, the frequency of the pulses is directly related with the PNC. Also, the signal intensity is
proportional to the mass of the metal in the NP, where a geometry can be assumed (e.g., spheres, cubes,
rods, wires).8,11 Currently, there are different approaches to measure particle size and quantify PNC using
spICP-MS.12,13,14 One of the approaches most adopted by the spICP-MS community was proposed by Pace
et al.,14 where the transport efficiency (TE) of the ICP mass spectrometer system is determined using
standard solutions and at least one NP reference material (known as particle size transport efficiency). The
predominant employment of this transport efficiency determination approach is primarily due by the
capability to analyze almost any type of metal base NPs and some oxide NPs. To this point, technical
protocols such as the one presented by Murphy et al.15 incorporated experimental and practical guidelines
for the implementation of the particle size transport efficiency approach for the characterization of NPs
suspensions using spICP-MS.
The novelty and expansion of scenarios where spICP-MS are currently used has led to the necessity
for new data processing strategies. Specifically, for continuous measurements made with dwell times ≥ 1
ms, the most critical factor is the separation and discrimination of the background signal from both the
dissolved and particulate signals. Several approaches have been proposed in recent years to obtain this goal,
the most common approach focused on a threshold criterion ( 𝐼𝑑𝑖𝑠𝑠 + 𝑛 ∙ 𝜎𝑑𝑖𝑠𝑠) , where Idiss is the
instrumental background signal or dissolved ionic fraction coming from the NPs destabilization and
𝜎𝑑𝑖𝑠𝑠, is the standard deviation of this signal) using the mean signal plus either three- (3𝜎) ,14,16 five- ( 5𝜎)
,17 or even seven times the standard deviation (7𝜎)18 to iteratively perform this delineation. Other authors,
such as Hadiouiet al.,19 applied an alternative threshold criterion which determined the percentage of events
erroneously counted as NPs when a low concentration ionic solution was analyzed. Despite the practicality
and simplicity of these threshold criterion algorithms, it is critical to emphasize that these approaches only
work well in the case where the signal of each NP in the respective suspension can be expected to
significantly exceed the threshold applied. Also, these approaches are very sensitive to the presence of
extreme outliers or anomalous data points; therefore, to accurately employ these algorithms it is necessary
to a priori eliminate such artifactual (anomalous) data points. Currently, there is no uniform or agreed upon
method for discriminating the background signals from particulate events. However, some studies as the
one developed by Laborda et al.,7 proposed a threshold criterion based on establishing of a critical value
(Sc) and calculating the size limit of detection, LD (size), using the background signal, and assuming a
80
Poisson-Normal distribution as a better means to describe this signal. Recently, other studies have strived
to create new strategies to process data from spICP-MS measurements, incorporating robust and
sophisticated algorithms. For example, Bi et al.20 proposed the use of K-means algorithms (a clustering
algorithm) to partition NPs and background signals. However, this approach still has limitations in cases
where particle events and background signals are relatively close in intensity. Also, Cornelis and
Hassellöv21 proposed a deconvolution method to achieve the separation of spICP-MS signals. However,
this approach involves a high level of sophisticated calculations to perform the deconvolution.
Another critical factor in spICP-MS measurements is post-analysis data processing. Data analysis
tools such as spreadsheets, custom programs and ICP-MS vendor software programs have been developed
in the recent years. Specifically, Peters et al.22 created a data evaluation tool using Microsoft Excel to
calculate particle size, PNC, and size distribution for spICP-Ms raw data. Cornelis et al.23 developed
sophisticated software to analyze spICP-MS data, capable of handling data acquired under conventional
and fast microsecond time resolution parameters. This software is equipped with different data processing
approaches to determine the threshold between particulate and continuous signals (such as the
deconvolution method), the 𝑛𝜎 threshold criterion method, K-means and others. However, this software
requires in-depth knowledge of the technique that may exclude non-expert users. Finally, a majority of ICP-
MS suppliers have developed tools24,25,26 that can process spICP-MS data from fast TRA (with 100 µs dwell
times or lower), determine TEs, calculate the diameter of the analyzed particles, and create histograms of
the PSD among other important experimental outputs for reporting spICP-MS data.
Despite these advances, challenges remain in the field of software and tools development for spICP-
MS. Thus, the necessity exists for better software interfaces with of intuitive operations, capable, of creating
interactive visualization of results, providing users a better exploration and interpretation of their spICP-
MS results. Depending on the software or data processing approach (e.g. spreadheets, vendor or third-party
software solutions), limitations still remain when working with large amounts of experimental data or with
complex experimental designs which create a tedious, complicated, and highly time-consuming data
processing experience for the user. A key aspect to improve spICP-MS software and tools is eliminating
the lack of transparency in the algorithms, codes, functions, and statistics used to perform data analyses
which make it difficult to understand, establish, and/or transfer the algorithms that govern the calculations
behind the software.
The study presented here describes the development and implementation of a new interactive web
application (IWA) for data processing in spICP-MS, capable of computing size, size distribution, and PNC
81
as well as providing an interactive graphical display and statistical analysis of imported data. NanoICP-MS
was developed to work with Shiny27 by RStudio28, which offers a user-friendly and open access interface.
This application allows the user to upload and process raw data files (in .csv format) from any spICP-MS
experiment, run on any ICP-MS instrument software acquired at TRA dwell times ≥ 1 ms. The IWA
facilitates rapid data processing without sophisticated programming and software knowledge. Sample data
are processed simultaneously rather than sequentially reducing data analysis times to a matter of minutes.
Different threshold approaches based in the use of LOD, Cumulative Distribution Function (CDF), and
Kernel Density Estimation (KDE) are introduced in NanoICP-MS in order to bring versatility to separate
particle signals from continuous signals.
At the present, the NanoICP-MS app can be used for applications involving liquid suspensions of
metallic NPs. Specifically, in this research, we demonstrate the applicability and capabilities of NanoICP-
MS to analyze and characterize the PS, PSD and PNC (using millisecond timescale data acquisition) of
spherical gold nanoparticles (AuNPs) dispersed in liquid media and stabilized with different coating agents
such as polyvinylpyrrolidone (PVP), branched polyethylenimine (bPEI) and citrate (Cit). Spherical AgNPs,
coated with PVP, have also been characterized using fast data acquisition and recombining the raw data to
create 10 ms dwell time data acquisition. In addition, the NanoICP-MS app was used to process data from
an in vivo study of the uptake of engineered AuNPs by the nematode Caenorhabditis elegans,
demonstrating the performance of the app within complex nanomaterial containing matrices.
2. Experimental section
2.1. Chemicals
Chemicals used during this research were analytical grade and used as received without further
purification. High-purity water (≥18 MΩ cm at 25 °C, Millipore) was used in all ICP-MS experiments.
Ionic gold standard solutions and ionic silver standard solutions, National Institute of Standards and
Technology (NIST) Standard Reference Material (SRM) 312129 and NIST SRM 315130 were used to
prepare all ionic gold and silver calibration standards for instrument calibration. Monodispersed, spherical
citrate-stabilized AuNPs with nominal diameters of 30 nm and 60 nm (NIST, Reference Material (RM)
801231 and NIST RM 8013,32 respectively) served as NP calibration materials. Nominal 30 nm diameter
monodispersed, spherical AuNP suspensions stabilized with PVP and bPEI were purchased from
nanoComposix (San Diego, CA). Citrate-stabilized commercial AuNP suspensions with nominal diameters
of 80 nm, 100 nm, and 150 nm were purchased from BBI Solutions (Cardiff, UK). A lyophilized PVP
82
(molar mass 40 kDa) coated-AgNP cake with a nominal core diameter of 75 nm (NIST RM 8017), and
commercial PVP coated-AgNPs with nominal values of 60 nm and 100 nm (purchased from
nanoComposix), were analyzed to explore the capabilities of the software in measuring reactive NPs. For
NIST RM 8017, the AgNP cake was reconstituted by adding 2 mL of water and stored at 4 °C in the dark
as is describe in the certificate of analysis.33 For the model organism experiment, the following chemicals
were mainly used: Caenorhabditis elegans (C. elegans, wild-type, Bristol strain, N2, Caenorhabditis
Genetics Center (CGC, University of Minnesota), citrate-stabilized commercial AuNP suspensions with
nominal diameters of 80 nm, 100 nm and 150 nm (purchased from BBI Solutions, Cardiff, UK), sodium
chloride (NaCl, 99.5 % purity, Sigma Aldrich, St Louis, MO), sucrose (enzyme-grade powder, molecular
biology grade, Sigma Aldrich), and tetramethylammonium hydroxide (TMAH, 25% (w/v) Alfa Aesar).
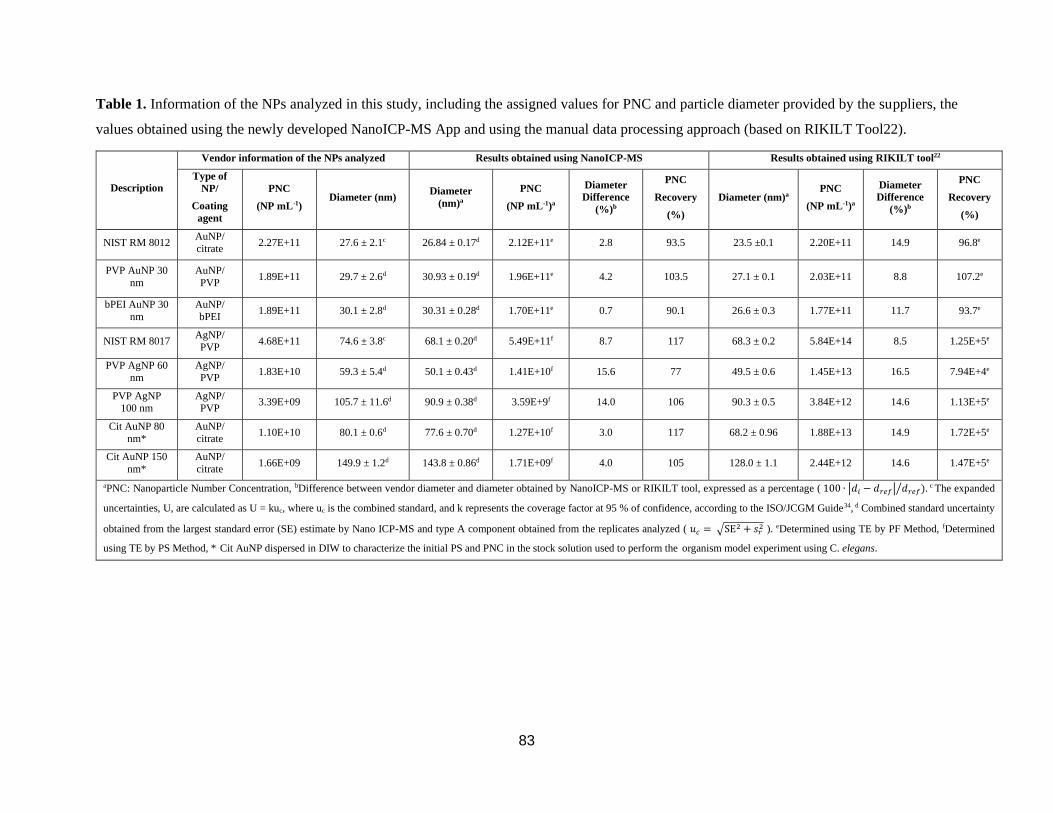
83
Table 1. Information of the NPs analyzed in this study, including the assigned values for PNC and particle diameter provided by the suppliers, the
values obtained using the newly developed NanoICP-MS App and using the manual data processing approach (based on RIKILT Tool22).
Description
Vendor information of the NPs analyzed Results obtained using NanoICP-MS Results obtained using RIKILT tool22
Type of
NP/
Coating
agent
PNC
(NP mL-1) Diameter (nm)
Diameter
(nm)a
PNC
(NP mL-1)a
Diameter
Difference
(%)b
PNC
Recovery
(%)
Diameter (nm)a PNC
(NP mL-1)a
Diameter
Difference
(%)b
PNC
Recovery
(%)
NIST RM 8012 AuNP/
citrate 2.27E+11 27.6 ± 2.1c 26.84 ± 0.17d 2.12E+11e 2.8 93.5 23.5 ±0.1 2.20E+11 14.9 96.8e
PVP AuNP 30
nm
AuNP/
PVP 1.89E+11 29.7 ± 2.6d 30.93 ± 0.19d 1.96E+11e 4.2 103.5 27.1 ± 0.1 2.03E+11 8.8 107.2e
bPEI AuNP 30
nm
AuNP/
bPEI 1.89E+11 30.1 ± 2.8d 30.31 ± 0.28d 1.70E+11e 0.7 90.1 26.6 ± 0.3 1.77E+11 11.7 93.7e
NIST RM 8017 AgNP/
PVP 4.68E+11 74.6 ± 3.8c 68.1 ± 0.20d 5.49E+11f 8.7 117 68.3 ± 0.2 5.84E+14 8.5 1.25E+5e
PVP AgNP 60
nm
AgNP/
PVP 1.83E+10 59.3 ± 5.4d 50.1 ± 0.43d 1.41E+10f 15.6 77 49.5 ± 0.6 1.45E+13 16.5 7.94E+4e
PVP AgNP
100 nm
AgNP/
PVP 3.39E+09 105.7 ± 11.6d 90.9 ± 0.38d 3.59E+9f 14.0 106 90.3 ± 0.5 3.84E+12 14.6 1.13E+5e
Cit AuNP 80
nm*
AuNP/
citrate 1.10E+10 80.1 ± 0.6d 77.6 ± 0.70d 1.27E+10f 3.0 117 68.2 ± 0.96 1.88E+13 14.9 1.72E+5e
Cit AuNP 150
nm*
AuNP/
citrate 1.66E+09 149.9 ± 1.2d 143.8 ± 0.86d 1.71E+09f 4.0 105 128.0 ± 1.1 2.44E+12 14.6 1.47E+5e
aPNC: Nanoparticle Number Concentration, bDifference between vendor diameter and diameter obtained by NanoICP-MS or RIKILT tool, expressed as a percentage ( 100 ∙ |𝑑𝑖 − 𝑑𝑟𝑒𝑓| 𝑑𝑟𝑒𝑓)⁄ . c The expanded
uncertainties, U, are calculated as U = kuc, where uc is the combined standard, and k represents the coverage factor at 95 % of confidence, according to the ISO/JCGM Guide34, d Combined standard uncertainty
obtained from the largest standard error (SE) estimate by Nano ICP-MS and type A component obtained from the replicates analyzed ( 𝑢𝑐 = √SE2 + 𝑠𝑟
2 ). eDetermined using TE by PF Method, fDetermined
using TE by PS Method, * Cit AuNP dispersed in DIW to characterize the initial PS and PNC in the stock solution used to perform the organism model experiment using C. elegans.
84
Table 1 details the coating agent, TEM mean diameter, and the PNC provided by suppliers for the
commercial NPs. For NIST RMs, the reference value mean diameters reported in the Reports of
Investigation (ROIs)31,32 by TEM were selected to determine the particle size, and the NP number
concentrations were calculated combining the particle size with the reported Au mass fractions. Note that
NIST RM 8013 information was not included in Table 1 because this material was used for the spICP-MS
calibration for all the experiments. The exception to this was the NPs liberated from exposed C. elegans,
where the 100 nm AuNP material was used as calibrant due to the 10-fold reduction of sensitivity required
to conduct the experiment successfully.
2.2. Instrumentation
Three different ICP-MS instrument platforms were used to perform the spICP-MS measurements
of RM and commercial AuNPs and AgNPs. Particularly, a Thermo Electron X Series X2 quadrupole ICP-
MS (Thermo, Waltham, MA, USA) was used for the nanocharacterization of AuNPs with different coating
agents, a NexION® 350D (PerkinElmer, Waltham, MA, USA) quadrupole ICP-MS was used for the
nanocharacterization of AgNPs with different sizes and a Thermo Electron X Series X7 quadrupole ICP-
MS (Thermo, Waltham, MA, USA) was used for the nanocharacterization of AuNPs exposed to an
organism model. Instrumental figures of merit including sample introduction systems, nebulization rates,
detector settings, and other relevant parameters are detailed in the Table S1.
2.3. Sample preparation
All spICP-MS working suspensions were prepared by gravimetric dilution of stock suspensions
with high purity water. The NIST RM 8017 AgNP cake was reconstituted following the instructions
detailed in the report of investigation.33 Working suspensions containing AuNPs and AgNPs had PNCs
ranging from 1.5 × 10⁷ L−1 to 3.0 × 10⁷ L−1. The AuNP working suspensions were bath-sonicated for 4 min
before spICP-MS measurement. All working suspensions were freshly prepared and in the case of AgNPs,
were analyzed within one half hour of preparation to avoid degradation. Ionic gold and ionic silver
calibration standards were prepared in desionized water (DIW) in the mass fraction range of 0.05 ng g−1 to
100 ng g−1 (Au), and 1 ng g−1 to 25 ng g−1 (Ag). Additional details and recommendations regarding
preparation of ionic standard solutions (for the calibration) and AuNP and AgNP suspensions for spICP-
85
MS measurements can be found in the NIST Special Publication 1200-2115. Additionally, a comprehensive
description of the culture and maintenance of C. elegans, their exposure to AuNPs, the efficient separation
of excess, uningested AuNPs from C. elegans using sucrose density gradient centrifugation, and the
extraction of AuNPs from biological tissue by TMAH, can be found in the article published by Johnson et
al.35and NIST Special Publication 1200-2436.
2.4. Data acquisition
During spICP-MS measurements of AuNPs and AgNPs, the signal intensity of 197Au (m/z) and
107Ag (m/z) were recorded in TRA mode (see Table S1), respectively. ThermoFisher PlasmaLab software
was used acquire measurement data on the Thermo X Series 2 and Thermo X7 Series 7 ICP-MS, whereas
the NexION® 350 ICP-MS employs a stand-alone software called SyngistixTM to perform spICP-MS
measurements. Intensity data from all three instruments, collected in units of counts per second, exported
as comma separated value files (.csv). Initially, samples were measured at TRA (0.02 ms dwell time) by
the NexION® 350 ICP-MS, and then the data were recombined to simulate 3 ms, 10 ms, and 20 ms dwell
times to execute data processing using the App.
3. A brief overview into NanoICP-MS App development
3.1. Packages and software
The framework behind the NanoICP-MS app is Shiny,27 an open-source package that enables the
creation of web-based applications using R Statistical Software.37 Shiny allows the implementation of
numerous capabilities of R, enabling R programmers to develop and the deploy NanoICP-MS app without
requiring knowledge of HTML, CSS, or JavaScript. Specifically, the capabilities of NanoICP-MS app are
enhanced by taking advantage of five R packages:
(i) Plotly38 provides flexible and interactive graphics;
(ii) DT39 offers an R interface to the JavaScript library data tables, which makes the tables
interactive (i.e., to search the table for a specific value);
(iii) shinyWidgets40 allows custom widgets and significantly improves the appearance of the
NanoICP-MS app, and;
(iv) shinyjs41 allows performance of commonly used JavaScript operations in shiny without having
any JavaScript knowledge;
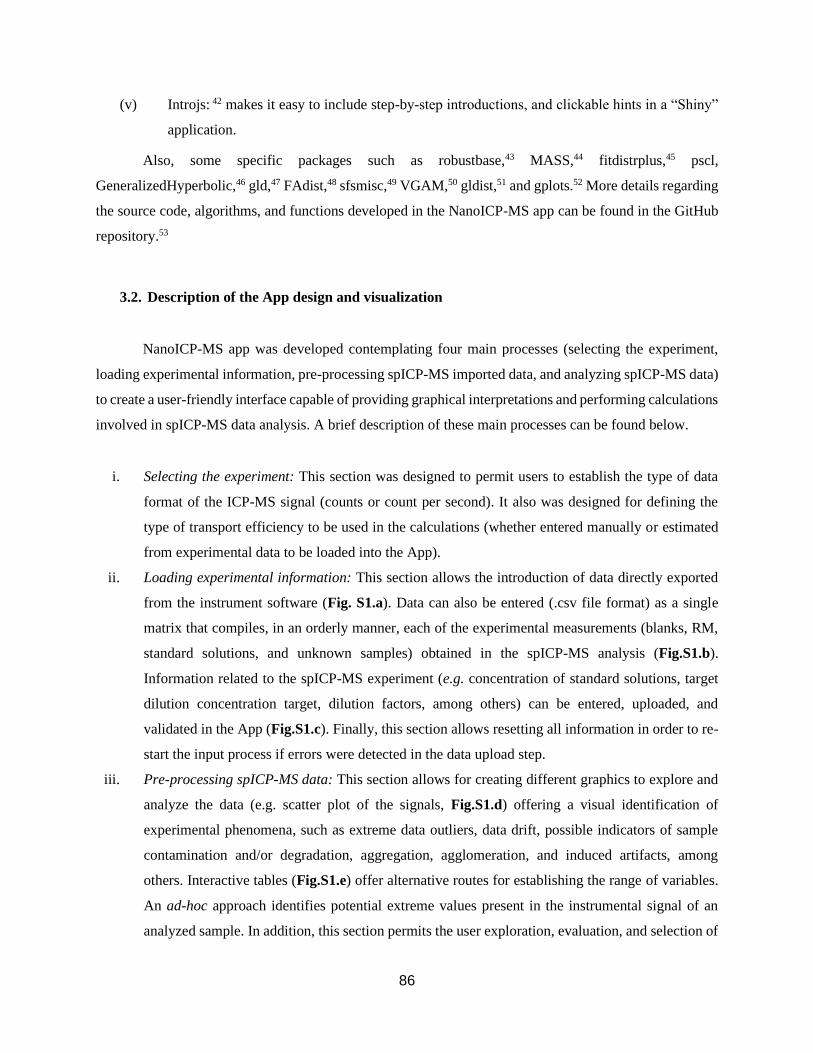
86
(v) Introjs: 42 makes it easy to include step-by-step introductions, and clickable hints in a “Shiny”
application.
Also, some specific packages such as robustbase,43 MASS,44 fitdistrplus,45 pscl,
GeneralizedHyperbolic,46 gld,47 FAdist,48 sfsmisc,49 VGAM,50 gldist,51 and gplots.52 More details regarding
the source code, algorithms, and functions developed in the NanoICP-MS app can be found in the GitHub
repository.53
3.2. Description of the App design and visualization
NanoICP-MS app was developed contemplating four main processes (selecting the experiment,
loading experimental information, pre-processing spICP-MS imported data, and analyzing spICP-MS data)
to create a user-friendly interface capable of providing graphical interpretations and performing calculations
involved in spICP-MS data analysis. A brief description of these main processes can be found below.
i. Selecting the experiment: This section was designed to permit users to establish the type of data
format of the ICP-MS signal (counts or count per second). It also was designed for defining the
type of transport efficiency to be used in the calculations (whether entered manually or estimated
from experimental data to be loaded into the App).
ii. Loading experimental information: This section allows the introduction of data directly exported
from the instrument software (Fig. S1.a). Data can also be entered (.csv file format) as a single
matrix that compiles, in an orderly manner, each of the experimental measurements (blanks, RM,
standard solutions, and unknown samples) obtained in the spICP-MS analysis (Fig.S1.b).
Information related to the spICP-MS experiment (e.g. concentration of standard solutions, target
dilution concentration target, dilution factors, among others) can be entered, uploaded, and
validated in the App (Fig.S1.c). Finally, this section allows resetting all information in order to re-
start the input process if errors were detected in the data upload step.
iii. Pre-processing spICP-MS data: This section allows for creating different graphics to explore and
analyze the data (e.g. scatter plot of the signals, Fig.S1.d) offering a visual identification of
experimental phenomena, such as extreme data outliers, data drift, possible indicators of sample
contamination and/or degradation, aggregation, agglomeration, and induced artifacts, among
others. Interactive tables (Fig.S1.e) offer alternative routes for establishing the range of variables.
An ad-hoc approach identifies potential extreme values present in the instrumental signal of an
analyzed sample. In addition, this section permits the user exploration, evaluation, and selection of
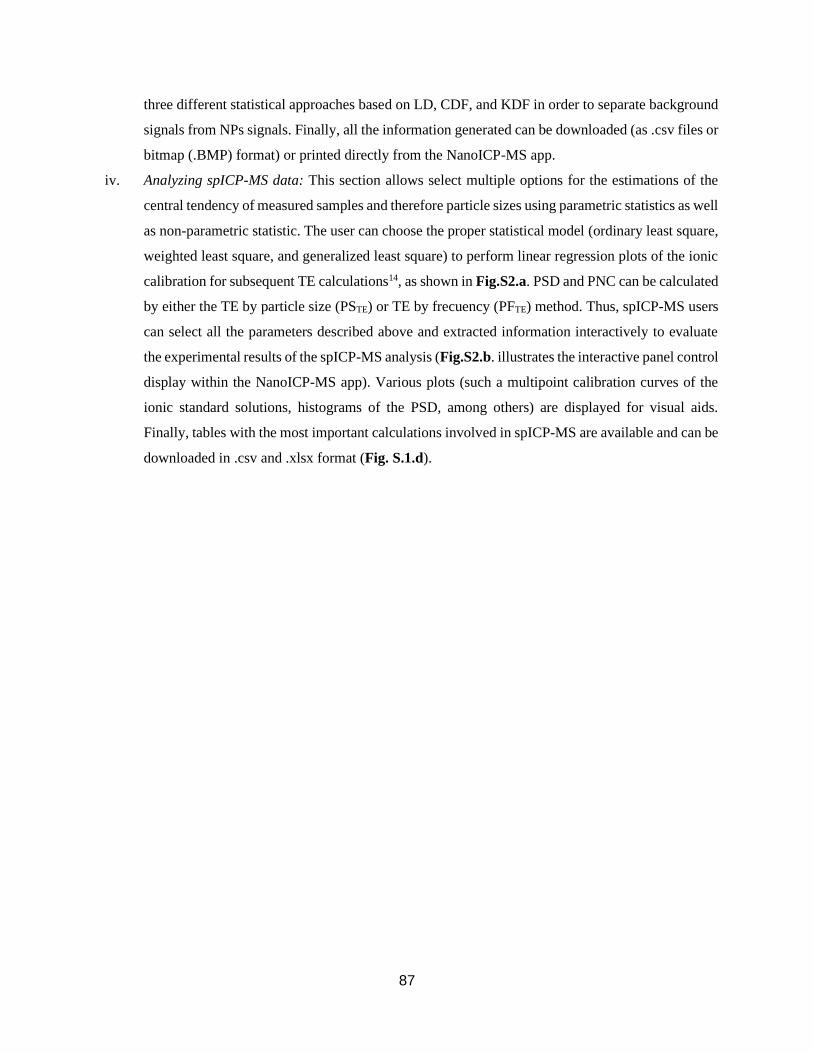
87
three different statistical approaches based on LD, CDF, and KDF in order to separate background
signals from NPs signals. Finally, all the information generated can be downloaded (as .csv files or
bitmap (.BMP) format) or printed directly from the NanoICP-MS app.
iv. Analyzing spICP-MS data: This section allows select multiple options for the estimations of the
central tendency of measured samples and therefore particle sizes using parametric statistics as well
as non-parametric statistic. The user can choose the proper statistical model (ordinary least square,
weighted least square, and generalized least square) to perform linear regression plots of the ionic
calibration for subsequent TE calculations14, as shown in Fig.S2.a. PSD and PNC can be calculated
by either the TE by particle size (PSTE) or TE by frecuency (PFTE) method. Thus, spICP-MS users
can select all the parameters described above and extracted information interactively to evaluate
the experimental results of the spICP-MS analysis (Fig.S2.b. illustrates the interactive panel control
display within the NanoICP-MS app). Various plots (such a multipoint calibration curves of the
ionic standard solutions, histograms of the PSD, among others) are displayed for visual aids.
Finally, tables with the most important calculations involved in spICP-MS are available and can be
downloaded in .csv and .xlsx format (Fig. S.1.d).
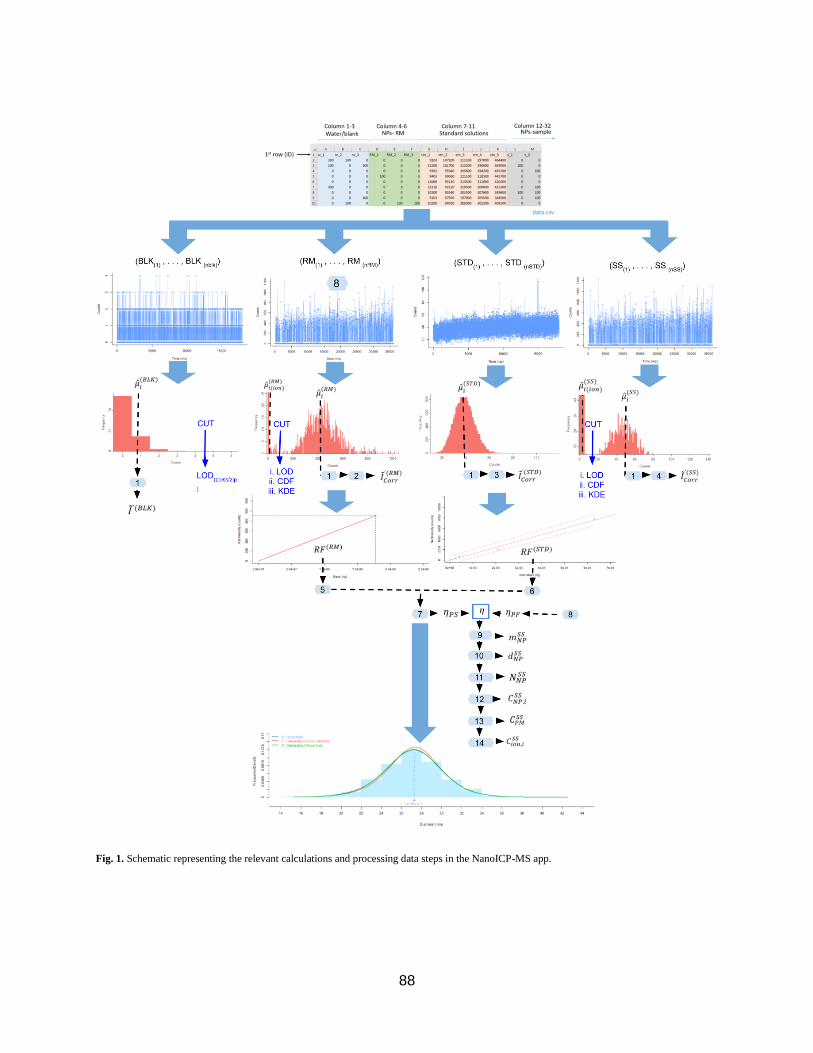
88
Fig. 1. Schematic representing the relevant calculations and processing data steps in the NanoICP-MS app.
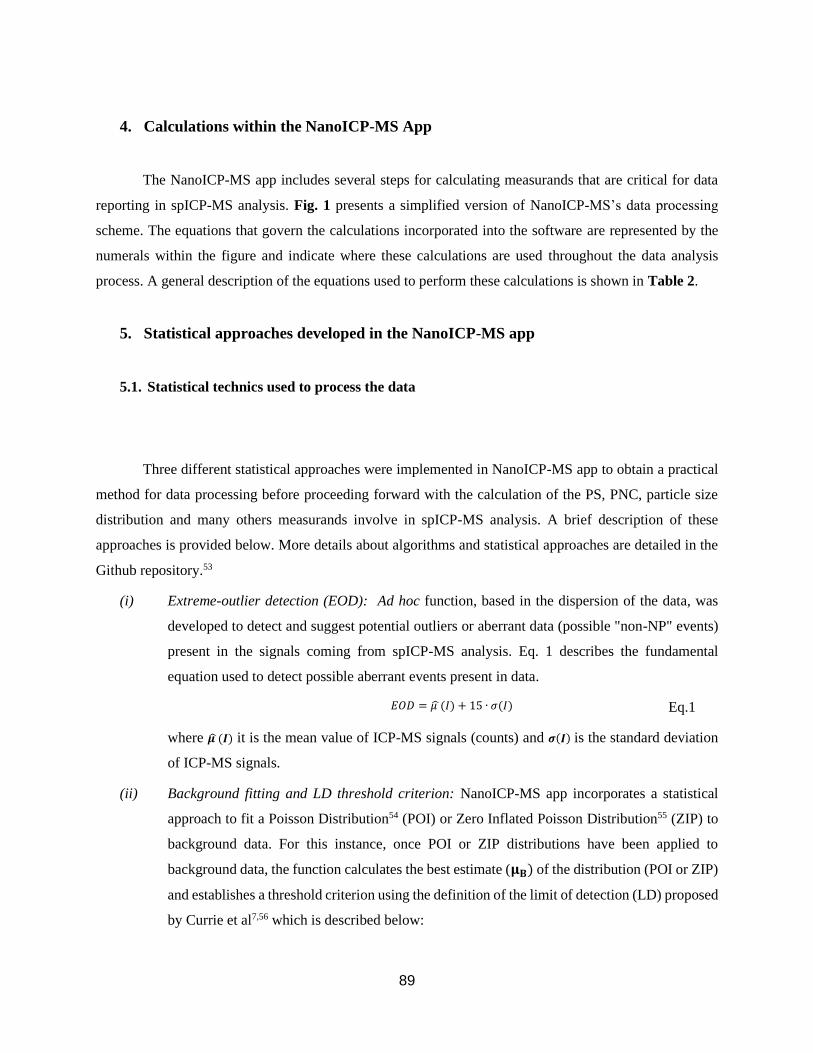
89
4. Calculations within the NanoICP-MS App
The NanoICP-MS app includes several steps for calculating measurands that are critical for data
reporting in spICP-MS analysis. Fig. 1 presents a simplified version of NanoICP-MS’s data processing
scheme. The equations that govern the calculations incorporated into the software are represented by the
numerals within the figure and indicate where these calculations are used throughout the data analysis
process. A general description of the equations used to perform these calculations is shown in Table 2.
5. Statistical approaches developed in the NanoICP-MS app
5.1. Statistical technics used to process the data
Three different statistical approaches were implemented in NanoICP-MS app to obtain a practical
method for data processing before proceeding forward with the calculation of the PS, PNC, particle size
distribution and many others measurands involve in spICP-MS analysis. A brief description of these
approaches is provided below. More details about algorithms and statistical approaches are detailed in the
Github repository.53
(i) Extreme-outlier detection (EOD): Ad hoc function, based in the dispersion of the data, was
developed to detect and suggest potential outliers or aberrant data (possible "non-NP" events)
present in the signals coming from spICP-MS analysis. Eq. 1 describes the fundamental
equation used to detect possible aberrant events present in data.
𝐸𝑂𝐷 = 𝜇 (𝐼) + 15 ∙ 𝜎(𝐼) Eq.1
where 𝝁 (𝑰) it is the mean value of ICP-MS signals (counts) and 𝝈(𝑰) is the standard deviation
of ICP-MS signals.
(ii) Background fitting and LD threshold criterion: NanoICP-MS app incorporates a statistical
approach to fit a Poisson Distribution54 (POI) or Zero Inflated Poisson Distribution55 (ZIP) to
background data. For this instance, once POI or ZIP distributions have been applied to
background data, the function calculates the best estimate (𝛍𝐁) of the distribution (POI or ZIP)
and establishes a threshold criterion using the definition of the limit of detection (LD) proposed
by Currie et al7,56 which is described below:
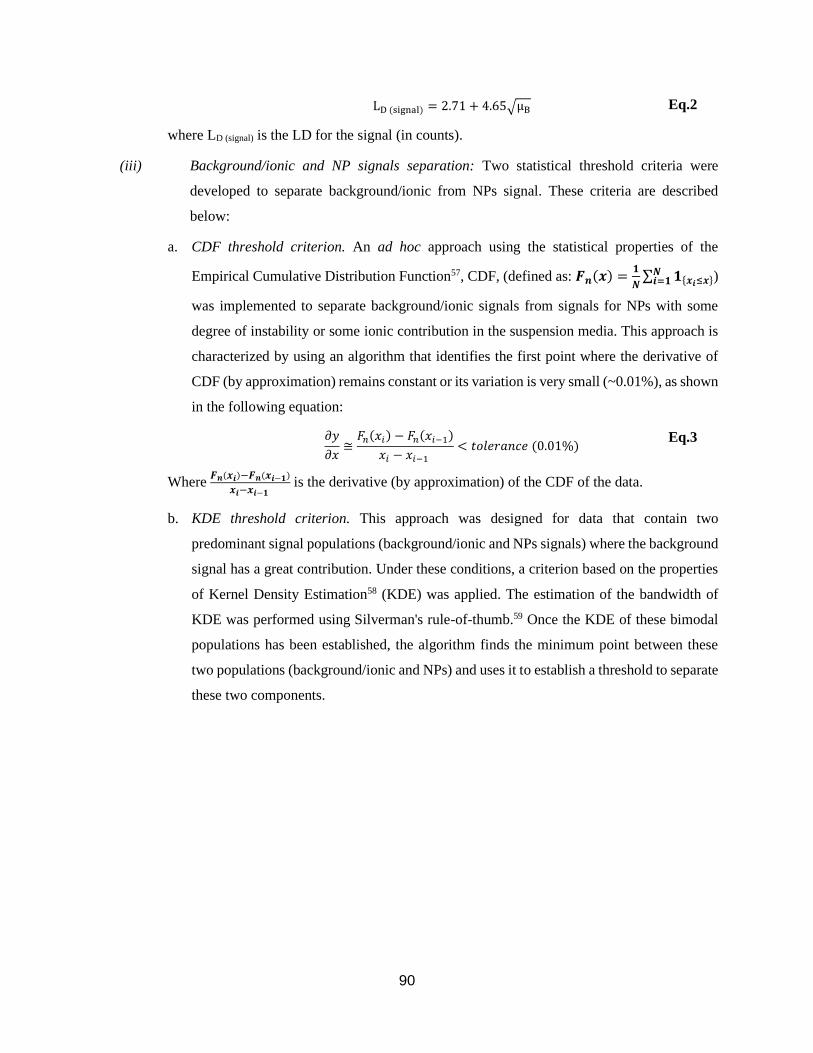
90
LD (signal) = 2.71 + 4.65√μB Eq.2
where LD (signal) is the LD for the signal (in counts).
(iii) Background/ionic and NP signals separation: Two statistical threshold criteria were
developed to separate background/ionic from NPs signal. These criteria are described
below:
a. CDF threshold criterion. An ad hoc approach using the statistical properties of the
Empirical Cumulative Distribution Function57, CDF, (defined as: 𝑭𝒏(𝒙) =𝟏
𝑵∑ 𝟏{𝒙𝒊≤𝒙}𝑵𝒊=𝟏 )
was implemented to separate background/ionic signals from signals for NPs with some
degree of instability or some ionic contribution in the suspension media. This approach is
characterized by using an algorithm that identifies the first point where the derivative of
CDF (by approximation) remains constant or its variation is very small (~0.01%), as shown
in the following equation:
𝜕𝑦
𝜕𝑥≅𝐹𝑛(𝑥𝑖) − 𝐹𝑛(𝑥𝑖−1)
𝑥𝑖 − 𝑥𝑖−1 < 𝑡𝑜𝑙𝑒𝑟𝑎𝑛𝑐𝑒 (0.01%)
Eq.3
Where 𝑭𝒏(𝒙𝒊)−𝑭𝒏(𝒙𝒊−𝟏)
𝒙𝒊−𝒙𝒊−𝟏 is the derivative (by approximation) of the CDF of the data.
b. KDE threshold criterion. This approach was designed for data that contain two
predominant signal populations (background/ionic and NPs signals) where the background
signal has a great contribution. Under these conditions, a criterion based on the properties
of Kernel Density Estimation58 (KDE) was applied. The estimation of the bandwidth of
KDE was performed using Silverman's rule-of-thumb.59 Once the KDE of these bimodal
populations has been established, the algorithm finds the minimum point between these
two populations (background/ionic and NPs) and uses it to establish a threshold to separate
these two components.
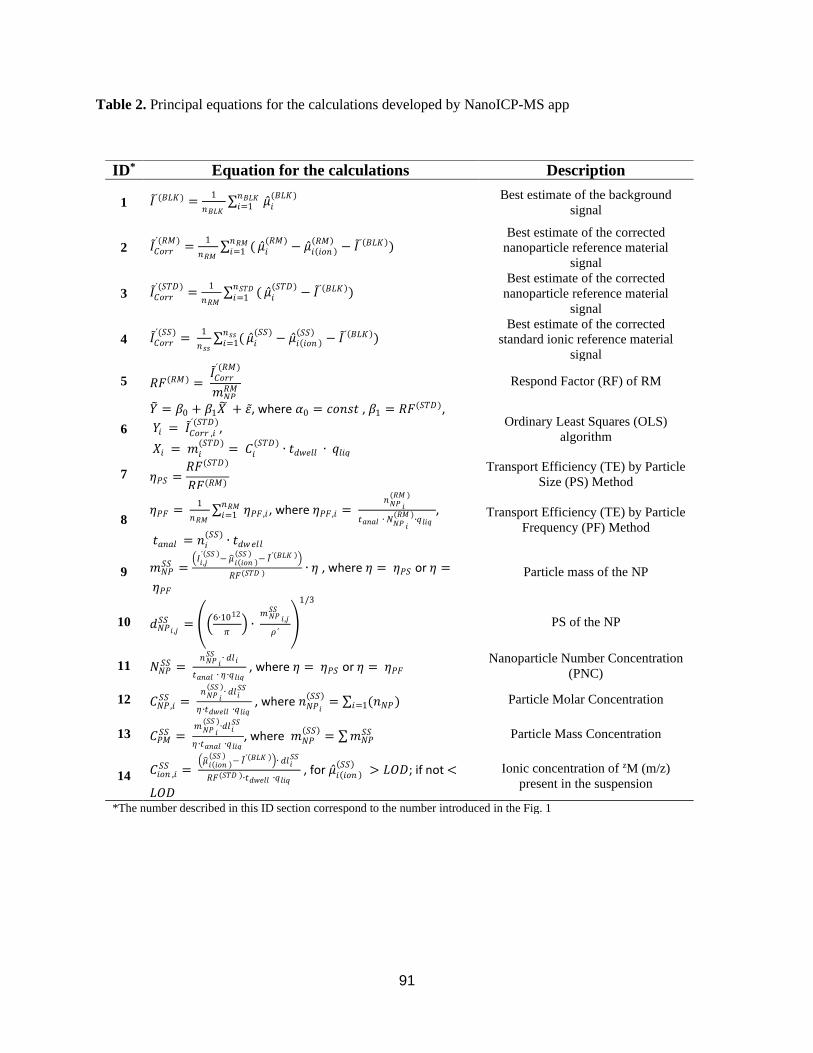
91
Table 2. Principal equations for the calculations developed by NanoICP-MS app
ID* Equation for the calculations Description
1 𝐼 ´(𝐵𝐿𝐾) =1
𝑛𝐵𝐿𝐾∑ 𝜇 𝑖
(𝐵𝐿𝐾)𝑛𝐵𝐿𝐾𝑖=1 Best estimate of the background
signal
2 𝐼 𝐶𝑜𝑟𝑟´(𝑅𝑀)
=1
𝑛𝑅𝑀∑ (𝑛𝑅𝑀𝑖=1 𝜇 𝑖
(𝑅𝑀)− 𝜇 𝑖(𝑖𝑜𝑛 )
(𝑅𝑀) − 𝐼 ´(𝐵𝐿𝐾)) Best estimate of the corrected
nanoparticle reference material
signal
3 𝐼 𝐶𝑜𝑟𝑟´(𝑆𝑇𝐷)
=1
𝑛𝑅𝑀∑ (𝑛𝑆𝑇𝐷𝑖=1 𝜇 𝑖
(𝑆𝑇𝐷)− 𝐼 ´(𝐵𝐿𝐾))
Best estimate of the corrected
nanoparticle reference material
signal
4 𝐼 𝐶𝑜𝑟𝑟´(𝑆𝑆)
= 1
𝑛𝑠𝑠∑ (𝑛𝑠𝑠𝑖=1 𝜇 𝑖
(𝑆𝑆)− 𝜇 𝑖(𝑖𝑜𝑛 )
(𝑆𝑆) − 𝐼 ´(𝐵𝐿𝐾)) Best estimate of the corrected
standard ionic reference material
signal
5 𝑅𝐹(𝑅𝑀) = 𝐼 𝐶𝑜𝑟𝑟
´(𝑅𝑀)
𝑚𝑁𝑃𝑅𝑀 Respond Factor (RF) of RM
6
𝑌 = 𝛽0 + 𝛽1𝑋 + 휀 , where 𝛼0 = 𝑐𝑜𝑛𝑠𝑡 , 𝛽1 = 𝑅𝐹(𝑆𝑇𝐷),
𝑌𝑖 = 𝐼 𝐶𝑜𝑟𝑟 ,𝑖´(𝑆𝑇𝐷)
,
𝑋𝑖 = 𝑚𝑖(𝑆𝑇𝐷)
= 𝐶𝑖(𝑆𝑇𝐷)
∙ 𝑡𝑑𝑤𝑒𝑙𝑙 ∙ 𝑞𝑙𝑖𝑞
Ordinary Least Squares (OLS)
algorithm
7 𝜂𝑃𝑆 =𝑅𝐹(𝑆𝑇𝐷)
𝑅𝐹(𝑅𝑀)
Transport Efficiency (TE) by Particle
Size (PS) Method
8 𝜂𝑃𝐹 =
1
𝑛𝑅𝑀∑ 𝜂𝑃𝐹 ,𝑖𝑛𝑅𝑀𝑖=1 , where 𝜂𝑃𝐹 ,𝑖 =
𝑛𝑁𝑃 𝑖(𝑅𝑀 )
𝑡𝑎𝑛𝑎𝑙 ∙ 𝑁𝑁𝑃 𝑖
(𝑅𝑀 )∙𝑞𝑙𝑖𝑞
,
𝑡𝑎𝑛𝑎𝑙 = 𝑛𝑖(𝑆𝑆)
∙ 𝑡𝑑𝑤𝑒𝑙𝑙
Transport Efficiency (TE) by Particle
Frequency (PF) Method
9 𝑚𝑁𝑃𝑆𝑆 =
(𝐼𝑖 ,𝑗´(𝑆𝑆 )
− 𝜇 𝑖(𝑖𝑜𝑛 )(𝑆𝑆 )
− 𝐼 ´(𝐵𝐿𝐾 ))
𝑅𝐹(𝑆𝑇𝐷 ) ∙ 𝜂 , where 𝜂 = 𝜂𝑃𝑆 or 𝜂 =
𝜂𝑃𝐹 Particle mass of the NP
10 𝑑𝑁𝑃𝑖 ,𝑗𝑆𝑆 = (
6∙1012
𝜋) ∙
𝑚𝑁𝑃 𝑖 ,𝑗𝑆𝑆
𝜌´
1/3
PS of the NP
11 𝑁𝑁𝑃𝑆𝑆 =
𝑛𝑁𝑃 𝑖𝑆𝑆 ∙ 𝑑𝑙 𝑖
𝑡𝑎𝑛𝑎𝑙 ∙ 𝜂∙𝑞𝑙𝑖𝑞 , where 𝜂 = 𝜂𝑃𝑆 or 𝜂 = 𝜂𝑃𝐹
Nanoparticle Number Concentration
(PNC)
12 𝐶𝑁𝑃 ,𝑖𝑆𝑆 =
𝑛𝑁𝑃 𝑖(𝑆𝑆 )
∙ 𝑑𝑙 𝑖𝑆𝑆
𝜂∙𝑡𝑑𝑤𝑒𝑙𝑙 ∙𝑞𝑙𝑖𝑞 , where 𝑛𝑁𝑃𝑖
(𝑆𝑆) = ∑ (𝑛𝑁𝑃)𝑖=1 Particle Molar Concentration
13 𝐶𝑃𝑀𝑆𝑆 =
𝑚𝑁𝑃 𝑖
(𝑆𝑆 )∙𝑑𝑙 𝑖
𝑆𝑆
𝜂∙𝑡𝑎𝑛𝑎𝑙 ∙𝑞𝑙𝑖𝑞, where 𝑚𝑁𝑃
(𝑆𝑆) = ∑𝑚𝑁𝑃𝑆𝑆 Particle Mass Concentration
14 𝐶𝑖𝑜𝑛 ,𝑖𝑆𝑆 =
(𝜇 𝑖(𝑖𝑜𝑛 )(𝑆𝑆 )
− 𝐼 ´(𝐵𝐿𝐾 ))∙ 𝑑𝑙 𝑖𝑆𝑆
𝑅𝐹(𝑆𝑇𝐷 )∙𝑡𝑑𝑤𝑒𝑙𝑙 ∙𝑞𝑙𝑖𝑞 , for 𝜇 𝑖(𝑖𝑜𝑛 )
(𝑆𝑆) > 𝐿𝑂𝐷; if not <
𝐿𝑂𝐷
Ionic concentration of zM (m/z)
present in the suspension
*The number described in this ID section correspond to the number introduced in the Fig. 1
92
5.2. Statistical models and estimators used in NanoICP-MS
NanoICP-MS uses three approaches to estimate, model, and perform graphical analysis of data
acquired by spICP-MS analyses. A brief description of these approaches is described below. More details
about algorithms and statistical approaches are detailed in the Github repository. 53
(i) Robust estimates. Huber’s algorithm60 was selected as a non-parametric approach to estimate the
robust mean and standard deviation of the signal population and/or PSD of the nanosuspensions.
The form Huber´s algorithm make these estimations are described by the following steps: 61 First
the algorithm orders the 𝑝 data items and identifies them as: {1},{2},...,𝑥{𝑝}. Then, identify and
calculate the robust average and robust standard deviation of these data as 𝑥∗=𝑚𝑒𝑑(𝑥) (𝑖=1,2,...,𝑝)
and 𝑠∗=1,483∙𝑚𝑒𝑑(|𝑥𝑖-𝑥∗|) (𝑖=1,2,...,𝑝). Then, updates the values of 𝑥∗ and 𝑠∗ using the following
function 𝑥𝑖∗ = {𝑥∗-𝛿 if 𝑥𝑖<𝑥∗-𝛿, 𝑥∗+𝛿 if 𝑥𝑖>𝑥∗+𝛿, otherwise 𝑥𝑖; where 𝛿=1.5∙𝑠∗. Finally, it calculate
the new values of 𝑥∗ and 𝑠∗ as: 𝒙∗ = ∑ 𝒙𝒊∗ 𝒑⁄
𝒑𝒊=𝟏 and 𝒔∗ = 𝟏. 𝟏𝟑𝟒√∑ (𝒙𝒊
∗ − 𝒙∗)𝟐𝒑𝒊=𝟏
(𝒑 − 𝟏)⁄ ,
algorithm repeat the process iteratively until the estimation of 𝑥∗ and 𝑠∗ converge.
(ii) Kernel density estimation (KDE). A non-parametric approach based on the properties of KDE58
was introduced into the software to calculate a best estimation of the signal population and/or PSD
of the nanosuspensions. Specifically, in a KDE each data point 𝒙𝒊 (𝑖 = 1, 2, … ,n) is replaced by a
specified distribution (Gaussian for this app), centered on the point and with a standard deviation
designated by the bandwidth (h).62 Under this condition, the normal distributions are added together
and the resulting distribution is a smooth curve given by the next equation:
𝑓(𝑥, ℎ) = 1
𝑛ℎ∑𝜙 (
𝑥 − 𝑥𝑖ℎ
)
𝑛
𝑖=1
Eq.4
where ��(𝒙, 𝒉) is the height of the curve at x-point, and 𝝓 is the standard normal density.
(iii) Parametric. NanoICP-MS can model and calculate parametric estimators of signal population
when pre-processing of data is performed. Also, these models and estimators are used to perform
the analysis of particle size and PSD of the nanosuspensions. For this instance, due to previous
advances obtained from the evaluation of data from spICP-MS measurements, nine different
distribution models6 (Normal, LogNormal, Gamma, Weibull-2-parameter, Weibull-3-parameter,
GLD, Hyperbolic, Skew-Laplace and Generalized Hyperbolic) were introduce into the app to
model and calculate central tendencies of spICP-MS data. A common model-selection known as
Bayesian Information Criterion63 (BIC) was used to determine which of these parametric models
fit best for subsequent calculations using the best parametrical model.
93
5.3. Calibration function approaches
Three different approaches to obtain the calibration function based on the use of ionic standard
solutions were introduced in the NanoICP-MS app, specifically models such an Ordinary Least Squares64
(OLS), Weighted Least Squares65 (WLS), and Generalized Least Squares65 (GLS) were included to provide
different approaches to fit the calibration function (Fig. S4.a).
6. Results and Discussion
6.1. Identification and suggestion of potential outliers and aberrant data present in spICP-MS
signals
One of the initial challenges faced in the development of NanoICP-MS app was to provide users a
method to identify possible outliers or aberrant data present in the signals coming from spICP-MS analysis.
These types of aberrant data are usually present in the measurements due to agglomeration and/or
aggregation generated in colloidal systems,66 automatic switching of the digital ICP-MS detector system to
the analog mode when the signal strength exceeds a certain threshold which magnifies the signals by 8 - 12
orders of magnitude,67 or possible effects of incomplete ionization of NPs in the plasma; however this last
effect has not been thoroughly studied.68 While the proportion of this type of data is relatively low
(commonly, <0.05%), its presence can bias the graphical interpretation and the results of spICP-MS
analyses (Fig. 1, 2, and Table 2). In fact, the special nature of spICP-MS measurements (TRA ≥1 ms) made
it necessary to develop a practical approach to identify these types of anomalies within the vast amount of
data generated by spICP-MS experiments. Thus, a distance-based approach was established from an ad hoc
evaluation of a large number of spICP-MS experiments conducted to characterize metallic NPs (AuNPs
and AgNPs). Specifically, from a multidimensional Cartesian perspective,69 it was observed that anomalous
data present in spICP-MS signals were significantly distanced from the overall data set. Therefore, if the
average signal is taken to define the location of most of the measured data set (𝝁 (𝑰)), a cut-off criterion can
be applied to identify and separate this type of aberrant or anomalous data.
In this regard, the general trend of data showed that it was common to find aberrant data above 15σ
of the average of the signals (𝝁 (𝑰)) obtained in a measurement (Eq.1) regardless the type of ICP-MS
platform used. After identifying these anomalous data, the algorithm searches within the subset of data for
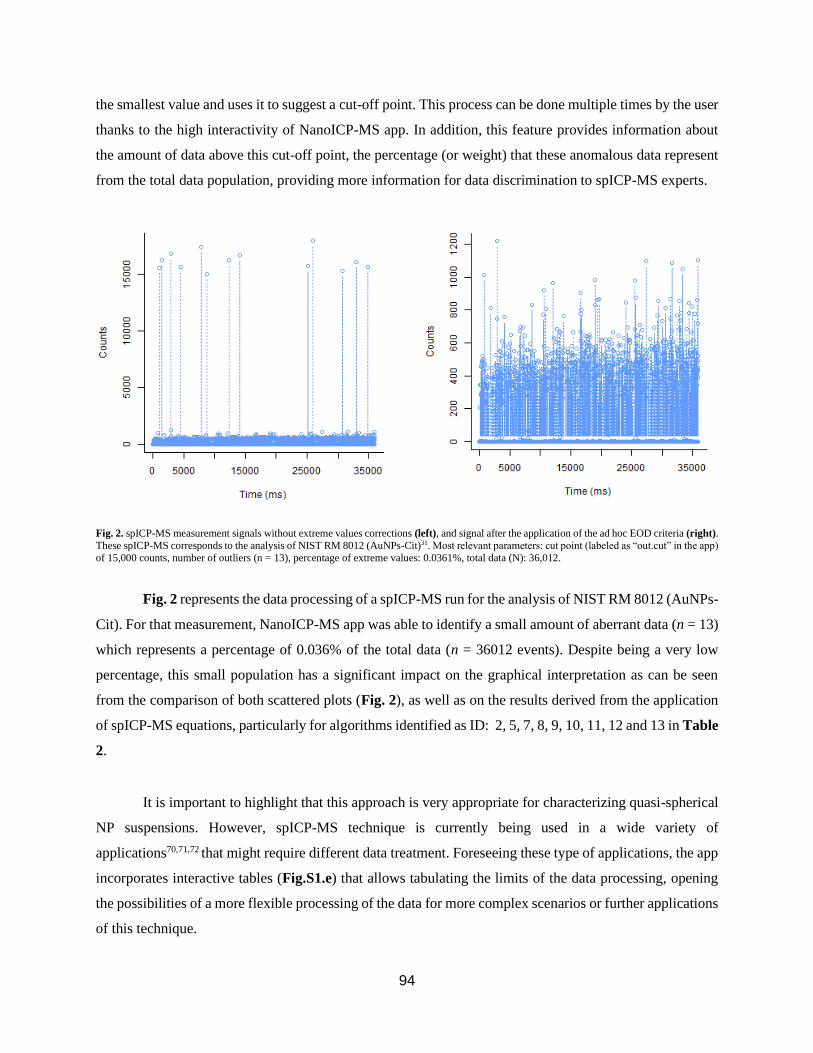
94
the smallest value and uses it to suggest a cut-off point. This process can be done multiple times by the user
thanks to the high interactivity of NanoICP-MS app. In addition, this feature provides information about
the amount of data above this cut-off point, the percentage (or weight) that these anomalous data represent
from the total data population, providing more information for data discrimination to spICP-MS experts.
Fig. 2. spICP-MS measurement signals without extreme values corrections (left), and signal after the application of the ad hoc EOD criteria (right).
These spICP-MS corresponds to the analysis of NIST RM 8012 (AuNPs-Cit)31. Most relevant parameters: cut point (labeled as “out.cut” in the app)
of 15,000 counts, number of outliers (n = 13), percentage of extreme values: 0.0361%, total data (N): 36,012.
Fig. 2 represents the data processing of a spICP-MS run for the analysis of NIST RM 8012 (AuNPs-
Cit). For that measurement, NanoICP-MS app was able to identify a small amount of aberrant data (n = 13)
which represents a percentage of 0.036% of the total data (n = 36012 events). Despite being a very low
percentage, this small population has a significant impact on the graphical interpretation as can be seen
from the comparison of both scattered plots (Fig. 2), as well as on the results derived from the application
of spICP-MS equations, particularly for algorithms identified as ID: 2, 5, 7, 8, 9, 10, 11, 12 and 13 in Table
2.
It is important to highlight that this approach is very appropriate for characterizing quasi-spherical
NP suspensions. However, spICP-MS technique is currently being used in a wide variety of
applications70,71,72 that might require different data treatment. Foreseeing these type of applications, the app
incorporates interactive tables (Fig.S1.e) that allows tabulating the limits of the data processing, opening
the possibilities of a more flexible processing of the data for more complex scenarios or further applications
of this technique.
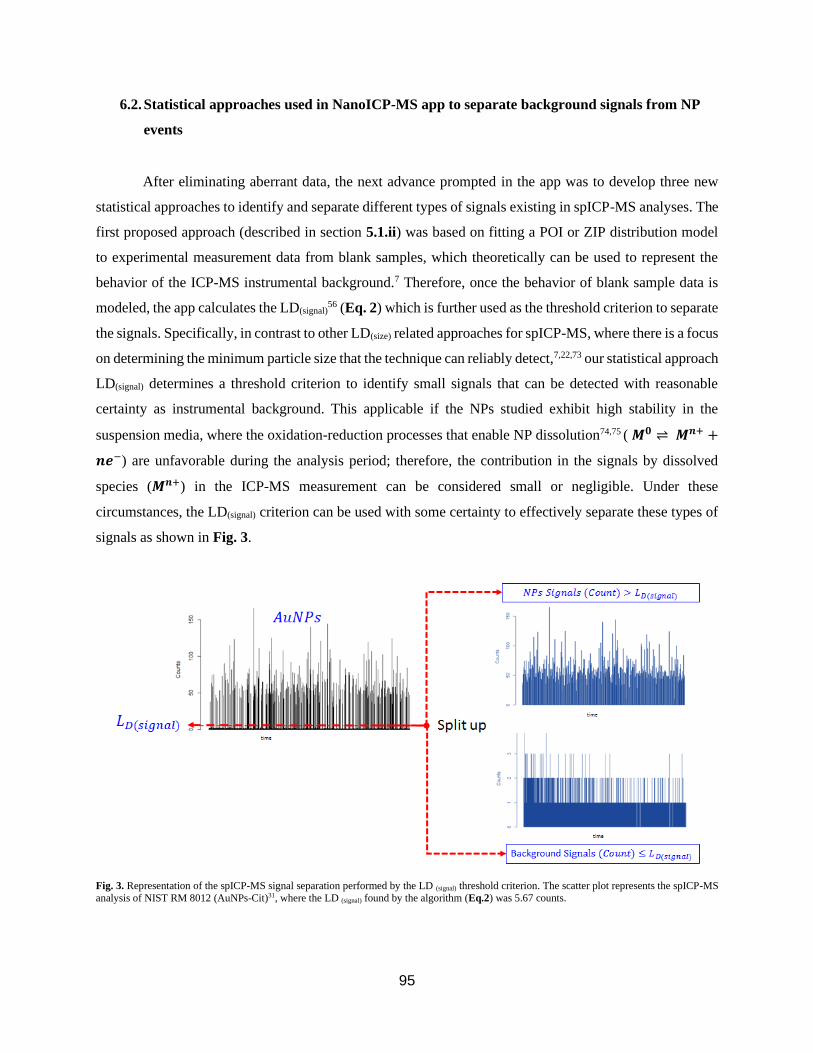
95
6.2. Statistical approaches used in NanoICP-MS app to separate background signals from NP
events
After eliminating aberrant data, the next advance prompted in the app was to develop three new
statistical approaches to identify and separate different types of signals existing in spICP-MS analyses. The
first proposed approach (described in section 5.1.ii) was based on fitting a POI or ZIP distribution model
to experimental measurement data from blank samples, which theoretically can be used to represent the
behavior of the ICP-MS instrumental background.7 Therefore, once the behavior of blank sample data is
modeled, the app calculates the LD(signal)56 (Eq. 2) which is further used as the threshold criterion to separate
the signals. Specifically, in contrast to other LD(size) related approaches for spICP-MS, where there is a focus
on determining the minimum particle size that the technique can reliably detect,7,22,73 our statistical approach
LD(signal) determines a threshold criterion to identify small signals that can be detected with reasonable
certainty as instrumental background. This applicable if the NPs studied exhibit high stability in the
suspension media, where the oxidation-reduction processes that enable NP dissolution74,75 ( 𝑴𝟎 ⇌ 𝑴𝒏+ +
𝒏𝒆−) are unfavorable during the analysis period; therefore, the contribution in the signals by dissolved
species (𝑴𝒏+) in the ICP-MS measurement can be considered small or negligible. Under these
circumstances, the LD(signal) criterion can be used with some certainty to effectively separate these types of
signals as shown in Fig. 3.
Fig. 3. Representation of the spICP-MS signal separation performed by the LD (signal) threshold criterion. The scatter plot represents the spICP-MS
analysis of NIST RM 8012 (AuNPs-Cit)31, where the LD (signal) found by the algorithm (Eq.2) was 5.67 counts.
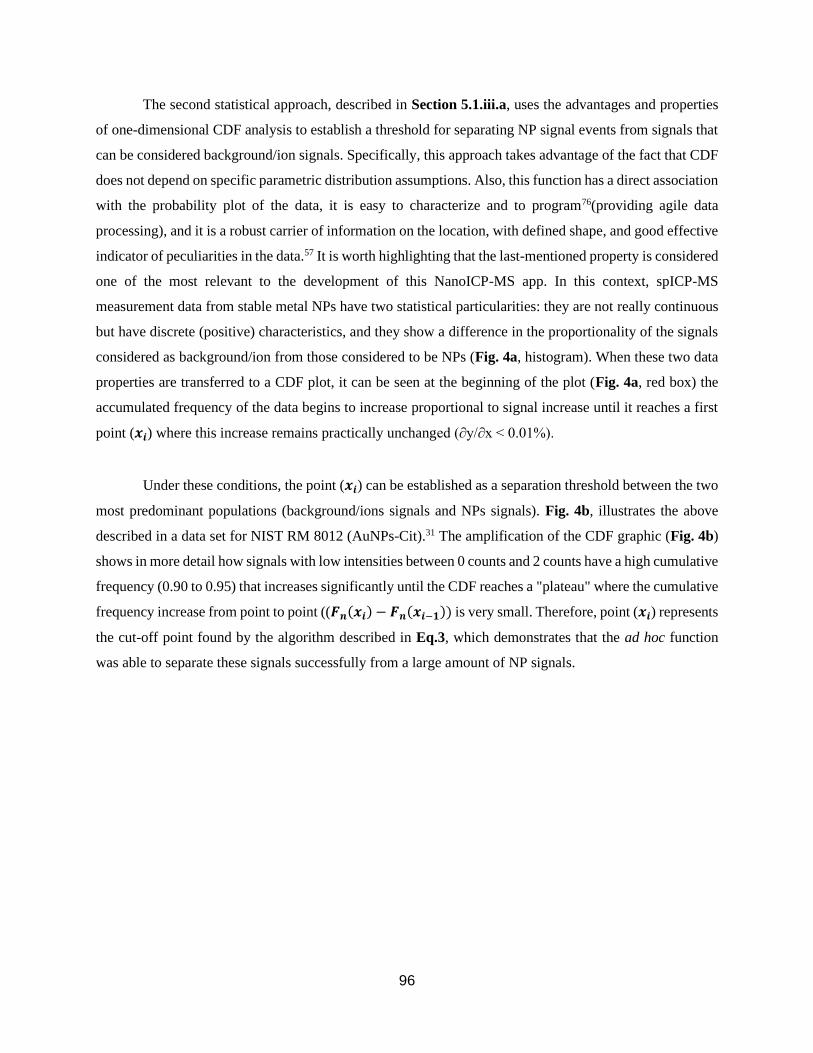
96
The second statistical approach, described in Section 5.1.iii.a, uses the advantages and properties
of one-dimensional CDF analysis to establish a threshold for separating NP signal events from signals that
can be considered background/ion signals. Specifically, this approach takes advantage of the fact that CDF
does not depend on specific parametric distribution assumptions. Also, this function has a direct association
with the probability plot of the data, it is easy to characterize and to program76(providing agile data
processing), and it is a robust carrier of information on the location, with defined shape, and good effective
indicator of peculiarities in the data.57 It is worth highlighting that the last-mentioned property is considered
one of the most relevant to the development of this NanoICP-MS app. In this context, spICP-MS
measurement data from stable metal NPs have two statistical particularities: they are not really continuous
but have discrete (positive) characteristics, and they show a difference in the proportionality of the signals
considered as background/ion from those considered to be NPs (Fig. 4a, histogram). When these two data
properties are transferred to a CDF plot, it can be seen at the beginning of the plot (Fig. 4a, red box) the
accumulated frequency of the data begins to increase proportional to signal increase until it reaches a first
point (𝒙𝒊) where this increase remains practically unchanged (∂y/∂x < 0.01%).
Under these conditions, the point (𝒙𝒊) can be established as a separation threshold between the two
most predominant populations (background/ions signals and NPs signals). Fig. 4b, illustrates the above
described in a data set for NIST RM 8012 (AuNPs-Cit).31 The amplification of the CDF graphic (Fig. 4b)
shows in more detail how signals with low intensities between 0 counts and 2 counts have a high cumulative
frequency (0.90 to 0.95) that increases significantly until the CDF reaches a "plateau" where the cumulative
frequency increase from point to point ((𝑭𝒏(𝒙𝒊) − 𝑭𝒏(𝒙𝒊−𝟏)) is very small. Therefore, point (𝒙𝒊) represents
the cut-off point found by the algorithm described in Eq.3, which demonstrates that the ad hoc function
was able to separate these signals successfully from a large amount of NP signals.
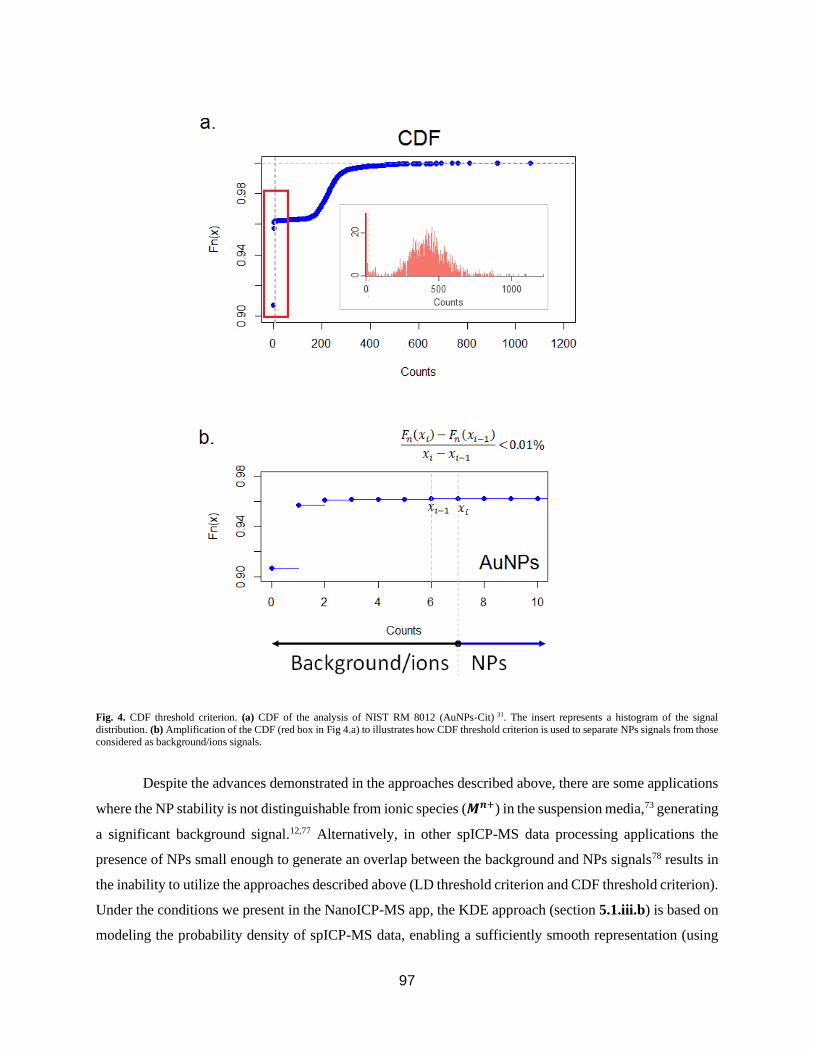
97
Fig. 4. CDF threshold criterion. (a) CDF of the analysis of NIST RM 8012 (AuNPs-Cit) 31. The insert represents a histogram of the signal
distribution. (b) Amplification of the CDF (red box in Fig 4.a) to illustrates how CDF threshold criterion is used to separate NPs signals from those
considered as background/ions signals.
Despite the advances demonstrated in the approaches described above, there are some applications
where the NP stability is not distinguishable from ionic species (𝑴𝒏+) in the suspension media,73 generating
a significant background signal.12,77 Alternatively, in other spICP-MS data processing applications the
presence of NPs small enough to generate an overlap between the background and NPs signals78 results in
the inability to utilize the approaches described above (LD threshold criterion and CDF threshold criterion).
Under the conditions we present in the NanoICP-MS app, the KDE approach (section 5.1.iii.b) is based on
modeling the probability density of spICP-MS data, enabling a sufficiently smooth representation (using
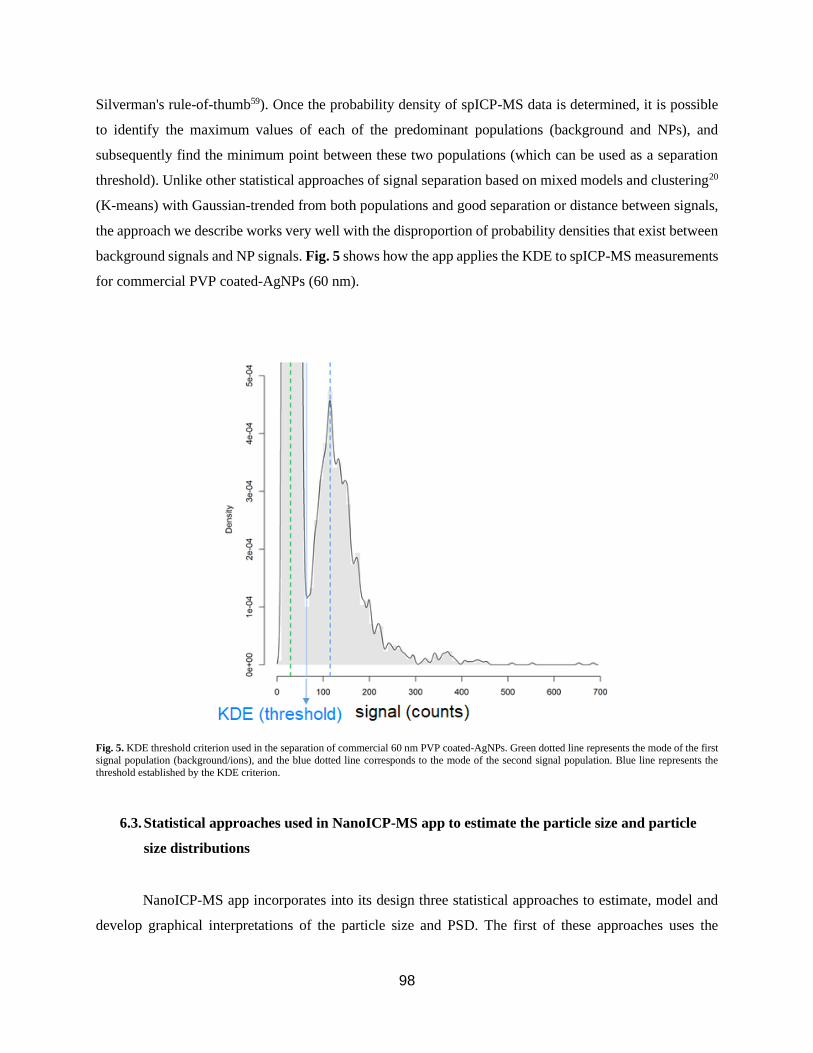
98
Silverman's rule-of-thumb59). Once the probability density of spICP-MS data is determined, it is possible
to identify the maximum values of each of the predominant populations (background and NPs), and
subsequently find the minimum point between these two populations (which can be used as a separation
threshold). Unlike other statistical approaches of signal separation based on mixed models and clustering20
(K-means) with Gaussian-trended from both populations and good separation or distance between signals,
the approach we describe works very well with the disproportion of probability densities that exist between
background signals and NP signals. Fig. 5 shows how the app applies the KDE to spICP-MS measurements
for commercial PVP coated-AgNPs (60 nm).
Fig. 5. KDE threshold criterion used in the separation of commercial 60 nm PVP coated-AgNPs. Green dotted line represents the mode of the first
signal population (background/ions), and the blue dotted line corresponds to the mode of the second signal population. Blue line represents the
threshold established by the KDE criterion.
6.3. Statistical approaches used in NanoICP-MS app to estimate the particle size and particle
size distributions
NanoICP-MS app incorporates into its design three statistical approaches to estimate, model and
develop graphical interpretations of the particle size and PSD. The first of these approaches uses the
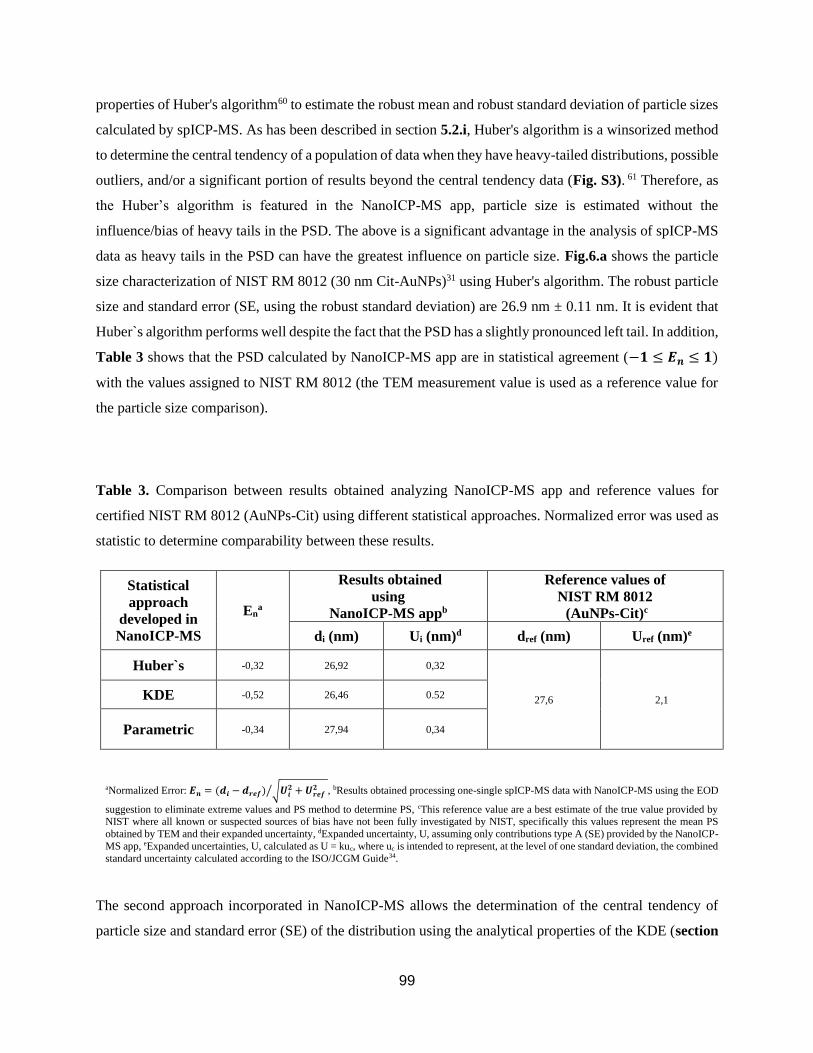
99
properties of Huber's algorithm60 to estimate the robust mean and robust standard deviation of particle sizes
calculated by spICP-MS. As has been described in section 5.2.i, Huber's algorithm is a winsorized method
to determine the central tendency of a population of data when they have heavy-tailed distributions, possible
outliers, and/or a significant portion of results beyond the central tendency data (Fig. S3). 61 Therefore, as
the Huber’s algorithm is featured in the NanoICP-MS app, particle size is estimated without the
influence/bias of heavy tails in the PSD. The above is a significant advantage in the analysis of spICP-MS
data as heavy tails in the PSD can have the greatest influence on particle size. Fig.6.a shows the particle
size characterization of NIST RM 8012 (30 nm Cit-AuNPs)31 using Huber's algorithm. The robust particle
size and standard error (SE, using the robust standard deviation) are 26.9 nm ± 0.11 nm. It is evident that
Huber`s algorithm performs well despite the fact that the PSD has a slightly pronounced left tail. In addition,
Table 3 shows that the PSD calculated by NanoICP-MS app are in statistical agreement (−𝟏 ≤ 𝑬𝒏 ≤ 𝟏)
with the values assigned to NIST RM 8012 (the TEM measurement value is used as a reference value for
the particle size comparison).
Table 3. Comparison between results obtained analyzing NanoICP-MS app and reference values for
certified NIST RM 8012 (AuNPs-Cit) using different statistical approaches. Normalized error was used as
statistic to determine comparability between these results.
Statistical
approach
developed in
NanoICP-MS
Ena
Results obtained
using
NanoICP-MS appb
Reference values of
NIST RM 8012
(AuNPs-Cit)c
di (nm) Ui (nm)d dref (nm) Uref (nm)e
Huber`s -0,32 26,92 0,32
27,6 2,1 KDE -0,52 26,46 0.52
Parametric -0,34 27,94 0,34
aNormalized Error: 𝑬𝒏 = (𝒅𝒊 −𝒅𝒓𝒆𝒇) √𝑼𝒊𝟐 +𝑼𝒓𝒆𝒇
𝟐 ⁄ , bResults obtained processing one-single spICP-MS data with NanoICP-MS using the EOD
suggestion to eliminate extreme values and PS method to determine PS, cThis reference value are a best estimate of the true value provided by NIST where all known or suspected sources of bias have not been fully investigated by NIST, specifically this values represent the mean PS
obtained by TEM and their expanded uncertainty, dExpanded uncertainty, U, assuming only contributions type A (SE) provided by the NanoICP-
MS app, eExpanded uncertainties, U, calculated as U = kuc, where uc is intended to represent, at the level of one standard deviation, the combined
standard uncertainty calculated according to the ISO/JCGM Guide34.
The second approach incorporated in NanoICP-MS allows the determination of the central tendency of
particle size and standard error (SE) of the distribution using the analytical properties of the KDE (section
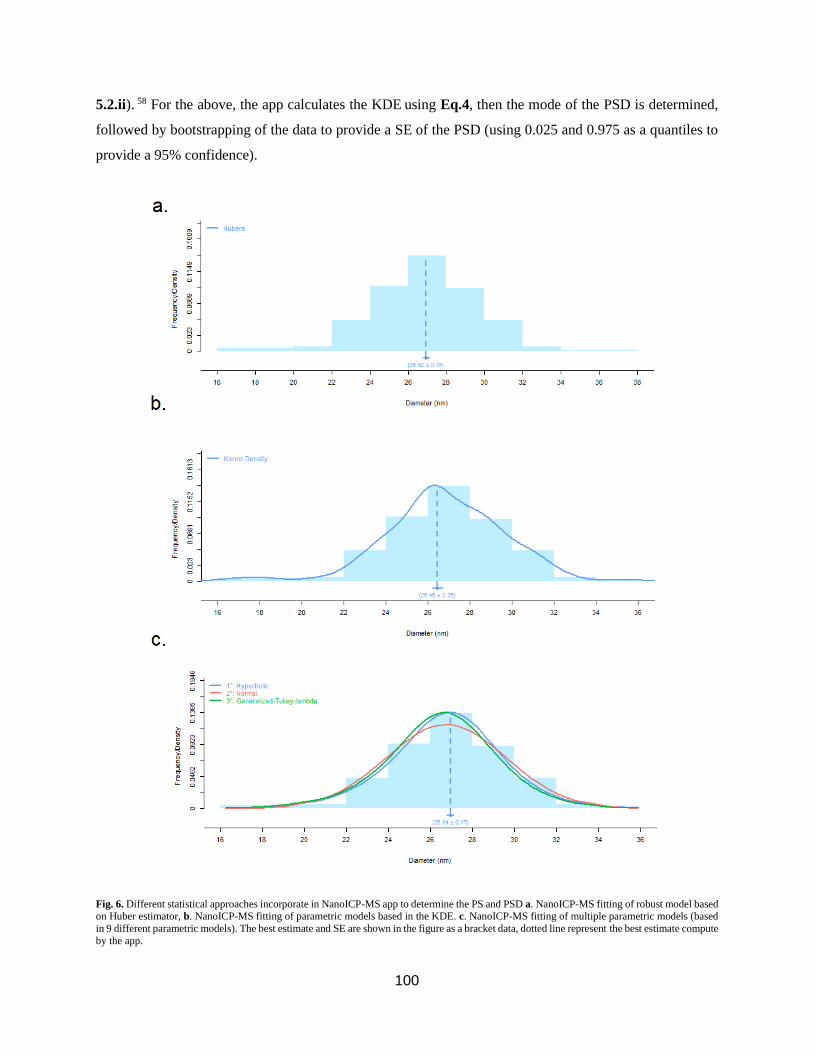
100
5.2.ii). 58 For the above, the app calculates the KDE using Eq.4, then the mode of the PSD is determined,
followed by bootstrapping of the data to provide a SE of the PSD (using 0.025 and 0.975 as a quantiles to
provide a 95% confidence).
Fig. 6. Different statistical approaches incorporate in NanoICP-MS app to determine the PS and PSD a. NanoICP-MS fitting of robust model based on Huber estimator, b. NanoICP-MS fitting of parametric models based in the KDE. c. NanoICP-MS fitting of multiple parametric models (based
in 9 different parametric models). The best estimate and SE are shown in the figure as a bracket data, dotted line represent the best estimate compute
by the app.
101
Fig.6.b displays the determination of particle size of the NIST RM 8012 (AuNPs-Cit)31 using the
KDE approach, obtaining a particle size (mode) and SE of 26.5 nm ± 0.52 nm. The standard error
determined in this approach is much higher than the one obtained by the robust approach method. A possible
explanation for this is that the standard error determined by the KDE approach is obtained through bootstrap
technique, which depends on the number of resampling made to determine standard error. However, similar
to the Huber`s approach, the results obtained by the KDE are statistically comparable (−𝟏 ≤ 𝑬𝒏 ≤ 𝟏) with
those declared in the ROI for the reference material (Table 3).
As described in Section 5.2, a third statistical approach was included in NanoICP-MS app to
analyze particle size and PSDs of spICP-MS data analysis using a parametric approach. Specifically, the
NanoICP-MS app offers the possibility to evaluate 9 different probability distributions models (section
5.2.iii) that can be adjusted to the PSDs. The selection and inclusion of these models was based on the
previous studies carried out by Montoro et al., (2015),6 where it was demonstrated that despite the fact that
Gaussian, lognormal and Weibull models fit reasonably well to the PSDs obtained by spICP-MS, there are
other models such as the Weibull (2-Parameters), Weibull (3-parameters), Hyperbolic, Skew-Laplace and
Generalized Hyperbolic that are better suited to features present in the tails of the distributions. Thus, to
facilitate the choice of a "fit for purpose" model, NanoICP-MS app calculates a BIC for each of the
distributions selected and then prioritizes the choice of the model with the lowest BIC value. Fig.6.c
highlights the determination of particle size of the NIST RM 801231 using the parametric approach,
obtaining a particle size (best estimate) and SE of 26.9 nm ± 0.2 nm. The distribution selected by the app
to model the PSD was a hyperbolic distribution. However, the software also indicates that other
distributions, such as Normal (Gaussian) and Generalize Hyperbolic, are also well-suited to this specific
experiment. Results showed in Table 3 demonstrate the applicability of this parametric approach and its
statistical comparability (−𝟏 ≤ 𝑬𝒏 ≤ 𝟏) with the references values for NIST RM 8012 (AuNPs-Cit).31
Finally, the results above demonstrate how this parametric approach is comparable with the non-parametric
approaches developed in this app (Huber`s and KDE). All of the above demonstrates the robust capabilities
of NanoICP-MS to provide different statistical approaches to reliably determine particle size in spICP-MS
measurements.
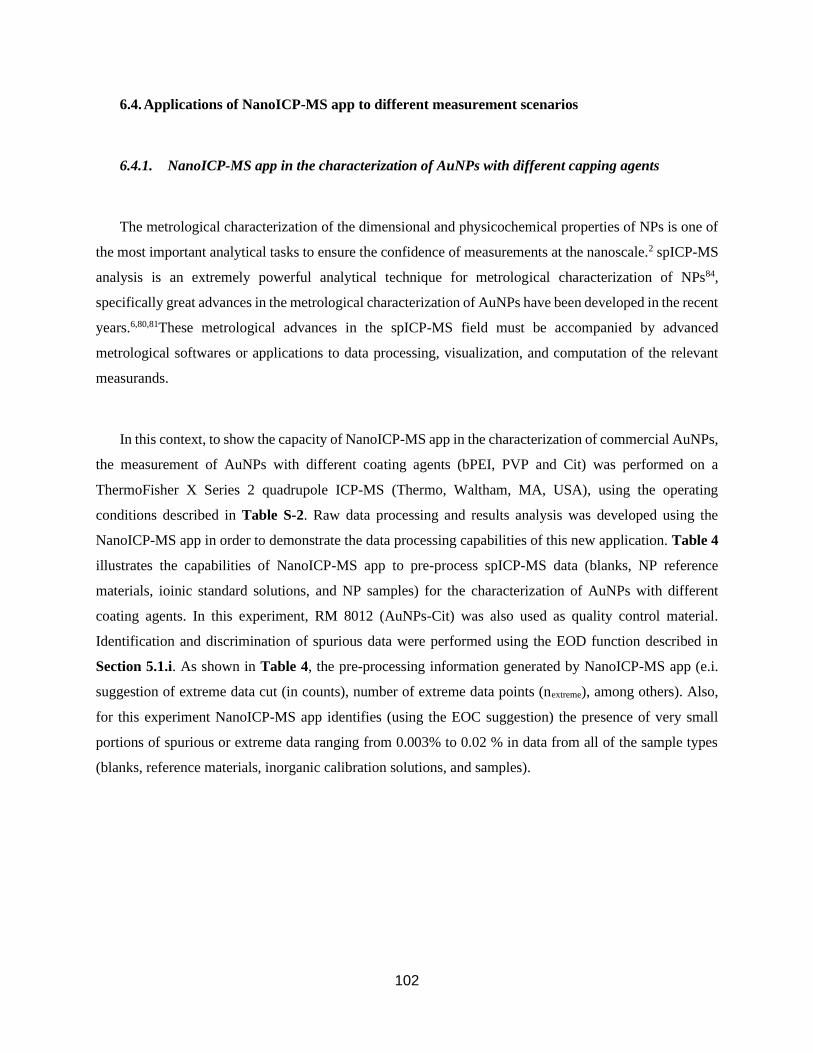
102
6.4. Applications of NanoICP-MS app to different measurement scenarios
6.4.1. NanoICP-MS app in the characterization of AuNPs with different capping agents
The metrological characterization of the dimensional and physicochemical properties of NPs is one of
the most important analytical tasks to ensure the confidence of measurements at the nanoscale.2 spICP-MS
analysis is an extremely powerful analytical technique for metrological characterization of NPs84,
specifically great advances in the metrological characterization of AuNPs have been developed in the recent
years.6,80,81These metrological advances in the spICP-MS field must be accompanied by advanced
metrological softwares or applications to data processing, visualization, and computation of the relevant
measurands.
In this context, to show the capacity of NanoICP-MS app in the characterization of commercial AuNPs,
the measurement of AuNPs with different coating agents (bPEI, PVP and Cit) was performed on a
ThermoFisher X Series 2 quadrupole ICP-MS (Thermo, Waltham, MA, USA), using the operating
conditions described in Table S-2. Raw data processing and results analysis was developed using the
NanoICP-MS app in order to demonstrate the data processing capabilities of this new application. Table 4
illustrates the capabilities of NanoICP-MS app to pre-process spICP-MS data (blanks, NP reference
materials, ioinic standard solutions, and NP samples) for the characterization of AuNPs with different
coating agents. In this experiment, RM 8012 (AuNPs-Cit) was also used as quality control material.
Identification and discrimination of spurious data were performed using the EOD function described in
Section 5.1.i. As shown in Table 4, the pre-processing information generated by NanoICP-MS app (e.i.
suggestion of extreme data cut (in counts), number of extreme data points (nextreme), among others). Also,
for this experiment NanoICP-MS app identifies (using the EOC suggestion) the presence of very small
portions of spurious or extreme data ranging from 0.003% to 0.02 % in data from all of the sample types
(blanks, reference materials, inorganic calibration solutions, and samples).
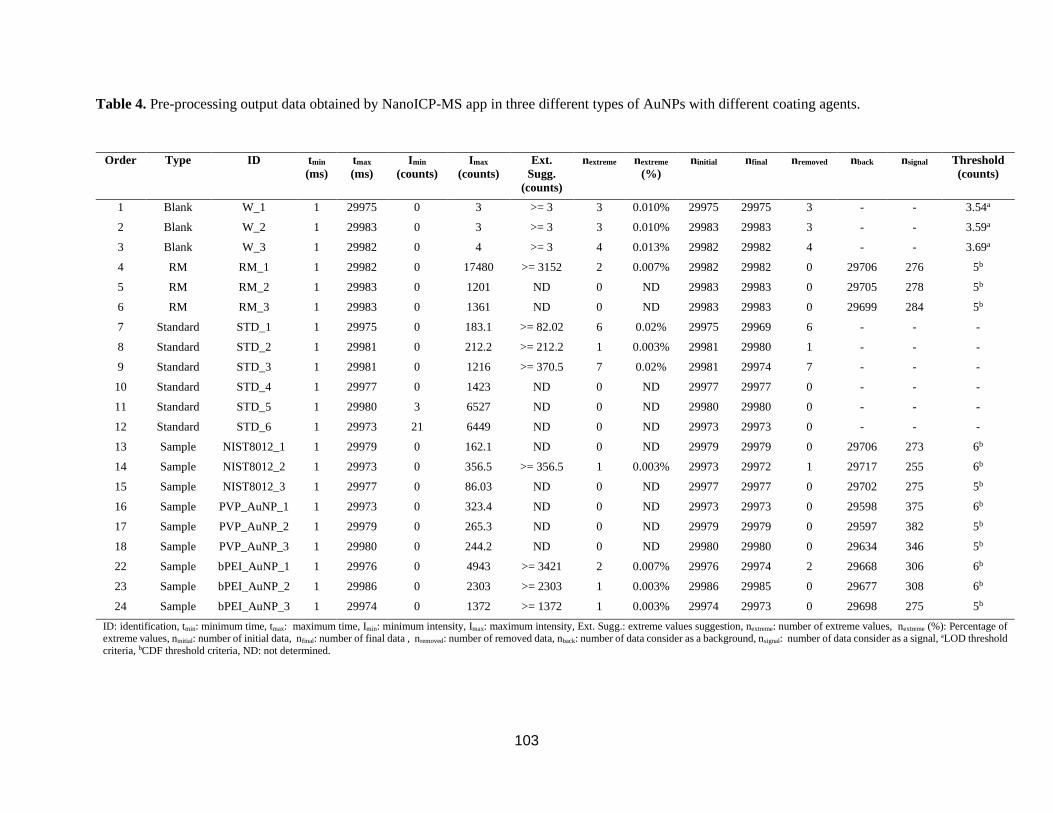
103
Table 4. Pre-processing output data obtained by NanoICP-MS app in three different types of AuNPs with different coating agents.
Order Type ID tmin
(ms)
tmax
(ms)
Imin
(counts)
Imax
(counts)
Ext.
Sugg.
(counts)
nextreme nextreme
(%)
ninitial nfinal nremoved nback nsignal Threshold
(counts)
1 Blank W_1 1 29975 0 3 >= 3 3 0.010% 29975 29975 3 - - 3.54a
2 Blank W_2 1 29983 0 3 >= 3 3 0.010% 29983 29983 3 - - 3.59a
3 Blank W_3 1 29982 0 4 >= 3 4 0.013% 29982 29982 4 - - 3.69a
4 RM RM_1 1 29982 0 17480 >= 3152 2 0.007% 29982 29982 0 29706 276 5b
5 RM RM_2 1 29983 0 1201 ND 0 ND 29983 29983 0 29705 278 5b
6 RM RM_3 1 29983 0 1361 ND 0 ND 29983 29983 0 29699 284 5b
7 Standard STD_1 1 29975 0 183.1 >= 82.02 6 0.02% 29975 29969 6 - - -
8 Standard STD_2 1 29981 0 212.2 >= 212.2 1 0.003% 29981 29980 1 - - -
9 Standard STD_3 1 29981 0 1216 >= 370.5 7 0.02% 29981 29974 7 - - -
10 Standard STD_4 1 29977 0 1423 ND 0 ND 29977 29977 0 - - -
11 Standard STD_5 1 29980 3 6527 ND 0 ND 29980 29980 0 - - -
12 Standard STD_6 1 29973 21 6449 ND 0 ND 29973 29973 0 - - -
13 Sample NIST8012_1 1 29979 0 162.1 ND 0 ND 29979 29979 0 29706 273 6b
14 Sample NIST8012_2 1 29973 0 356.5 >= 356.5 1 0.003% 29973 29972 1 29717 255 6b
15 Sample NIST8012_3 1 29977 0 86.03 ND 0 ND 29977 29977 0 29702 275 5b
16 Sample PVP_AuNP_1 1 29973 0 323.4 ND 0 ND 29973 29973 0 29598 375 6b
17 Sample PVP_AuNP_2 1 29979 0 265.3 ND 0 ND 29979 29979 0 29597 382 5b
18 Sample PVP_AuNP_3 1 29980 0 244.2 ND 0 ND 29980 29980 0 29634 346 5b
22 Sample bPEI_AuNP_1 1 29976 0 4943 >= 3421 2 0.007% 29976 29974 2 29668 306 6b
23 Sample bPEI_AuNP_2 1 29986 0 2303 >= 2303 1 0.003% 29986 29985 0 29677 308 6b
24 Sample bPEI_AuNP_3 1 29974 0 1372 >= 1372 1 0.003% 29974 29973 0 29698 275 5b
ID: identification, tmin: minimum time, tmax: maximum time, Imin: minimum intensity, Imax: maximum intensity, Ext. Sugg.: extreme values suggestion, nextreme: number of extreme values, nextreme (%): Percentage of extreme values, ninitial: number of initial data, nfinal: number of final data , nremoved: number of removed data, nback: number of data consider as a background, nsignal: number of data consider as a signal, aLOD threshold
criteria, bCDF threshold criteria, ND: not determined.
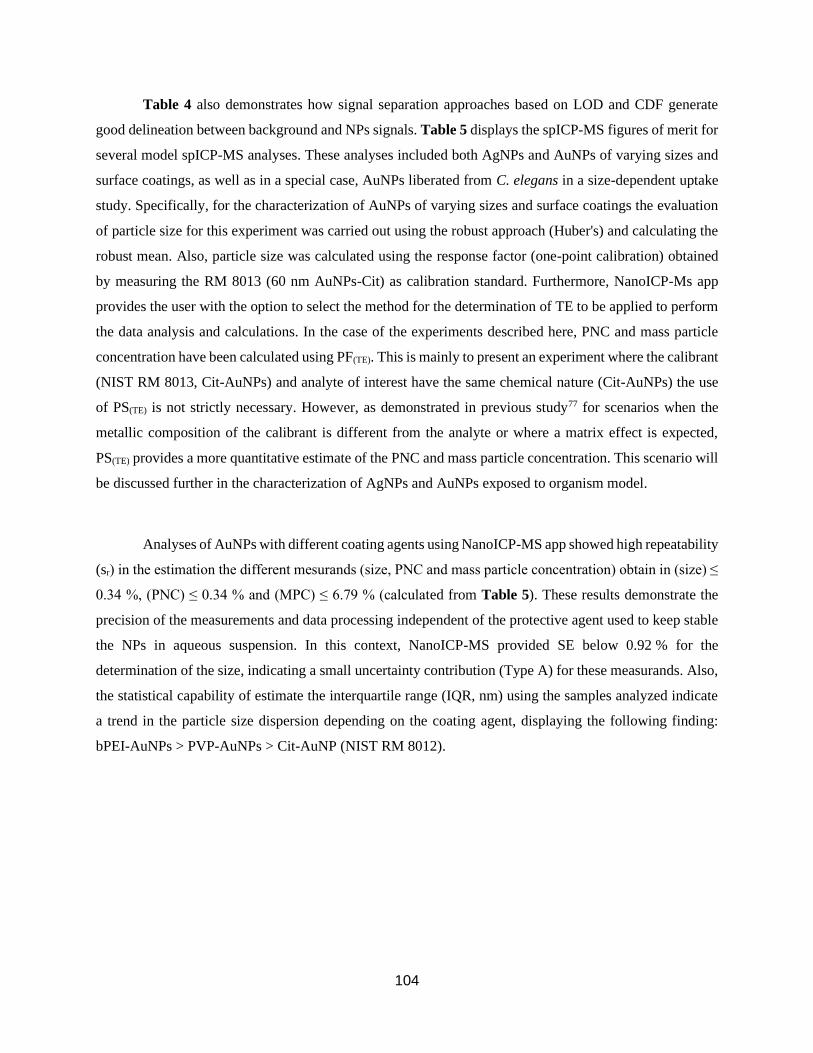
104
Table 4 also demonstrates how signal separation approaches based on LOD and CDF generate
good delineation between background and NPs signals. Table 5 displays the spICP-MS figures of merit for
several model spICP-MS analyses. These analyses included both AgNPs and AuNPs of varying sizes and
surface coatings, as well as in a special case, AuNPs liberated from C. elegans in a size-dependent uptake
study. Specifically, for the characterization of AuNPs of varying sizes and surface coatings the evaluation
of particle size for this experiment was carried out using the robust approach (Huber's) and calculating the
robust mean. Also, particle size was calculated using the response factor (one-point calibration) obtained
by measuring the RM 8013 (60 nm AuNPs-Cit) as calibration standard. Furthermore, NanoICP-Ms app
provides the user with the option to select the method for the determination of TE to be applied to perform
the data analysis and calculations. In the case of the experiments described here, PNC and mass particle
concentration have been calculated using PF(TE). This is mainly to present an experiment where the calibrant
(NIST RM 8013, Cit-AuNPs) and analyte of interest have the same chemical nature (Cit-AuNPs) the use
of PS(TE) is not strictly necessary. However, as demonstrated in previous study77 for scenarios when the
metallic composition of the calibrant is different from the analyte or where a matrix effect is expected,
PS(TE) provides a more quantitative estimate of the PNC and mass particle concentration. This scenario will
be discussed further in the characterization of AgNPs and AuNPs exposed to organism model.
Analyses of AuNPs with different coating agents using NanoICP-MS app showed high repeatability
(sr) in the estimation the different mesurands (size, PNC and mass particle concentration) obtain in (size) ≤
0.34 %, (PNC) ≤ 0.34 % and (MPC) ≤ 6.79 % (calculated from Table 5). These results demonstrate the
precision of the measurements and data processing independent of the protective agent used to keep stable
the NPs in aqueous suspension. In this context, NanoICP-MS provided SE below 0.92 % for the
determination of the size, indicating a small uncertainty contribution (Type A) for these measurands. Also,
the statistical capability of estimate the interquartile range (IQR, nm) using the samples analyzed indicate
a trend in the particle size dispersion depending on the coating agent, displaying the following finding:
bPEI-AuNPs > PVP-AuNPs > Cit-AuNP (NIST RM 8012).
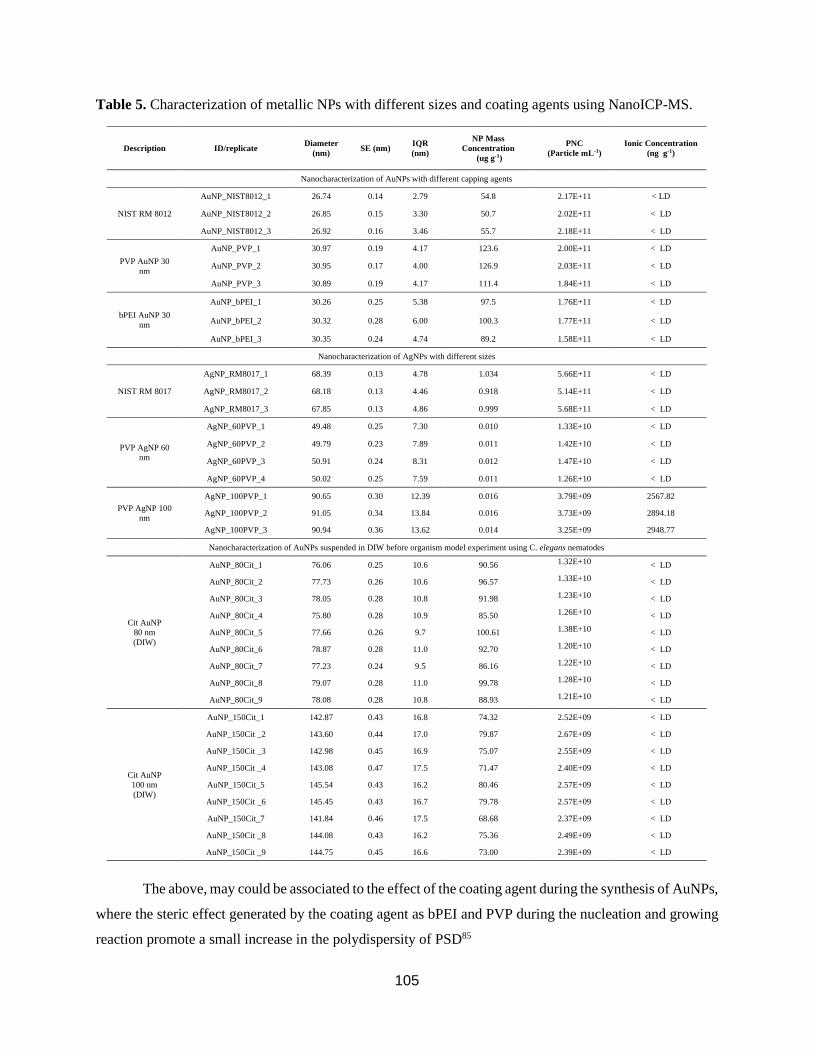
105
Table 5. Characterization of metallic NPs with different sizes and coating agents using NanoICP-MS.
The above, may could be associated to the effect of the coating agent during the synthesis of AuNPs,
where the steric effect generated by the coating agent as bPEI and PVP during the nucleation and growing
reaction promote a small increase in the polydispersity of PSD85
1
Description ID/replicate Diameter
(nm) SE (nm)
IQR
(nm)
NP Mass
Concentration
(ug g-1)
PNC
(Particle mL-1)
Ionic Concentration
(ng g-1)
Nanocharacterization of AuNPs with different capping agents
NIST RM 8012
AuNP_NIST8012_1 26.74 0.14 2.79 54.8 2.17E+11 < LD
AuNP_NIST8012_2 26.85 0.15 3.30 50.7 2.02E+11 < LD
AuNP_NIST8012_3 26.92 0.16 3.46 55.7 2.18E+11 < LD
PVP AuNP 30
nm
AuNP_PVP_1 30.97 0.19 4.17 123.6 2.00E+11 < LD
AuNP_PVP_2 30.95 0.17 4.00 126.9 2.03E+11 < LD
AuNP_PVP_3 30.89 0.19 4.17 111.4 1.84E+11 < LD
bPEI AuNP 30
nm
AuNP_bPEI_1 30.26 0.25 5.38 97.5 1.76E+11 < LD
AuNP_bPEI_2 30.32 0.28 6.00 100.3 1.77E+11 < LD
AuNP_bPEI_3 30.35 0.24 4.74 89.2 1.58E+11 < LD
Nanocharacterization of AgNPs with different sizes
NIST RM 8017
AgNP_RM8017_1 68.39 0.13 4.78 1.034 5.66E+11 < LD
AgNP_RM8017_2 68.18 0.13 4.46 0.918 5.14E+11 < LD
AgNP_RM8017_3 67.85 0.13 4.86 0.999 5.68E+11 < LD
PVP AgNP 60
nm
AgNP_60PVP_1 49.48 0.25 7.30 0.010 1.33E+10 < LD
AgNP_60PVP_2 49.79 0.23 7.89 0.011 1.42E+10 < LD
AgNP_60PVP_3 50.91 0.24 8.31 0.012 1.47E+10 < LD
AgNP_60PVP_4 50.02 0.25 7.59 0.011 1.26E+10 < LD
PVP AgNP 100
nm
AgNP_100PVP_1 90.65 0.30 12.39 0.016 3.79E+09 2567.82
AgNP_100PVP_2 91.05 0.34 13.84 0.016 3.73E+09 2894.18
AgNP_100PVP_3 90.94 0.36 13.62 0.014 3.25E+09 2948.77
Nanocharacterization of AuNPs suspended in DIW before organism model experiment using C. elegans nematodes
Cit AuNP
80 nm
(DIW)
AuNP_80Cit_1 76.06 0.25 10.6 90.56 1.32E+10 < LD
AuNP_80Cit_2 77.73 0.26 10.6 96.57 1.33E+10 < LD
AuNP_80Cit_3 78.05 0.28 10.8 91.98 1.23E+10 < LD
AuNP_80Cit_4 75.80 0.28 10.9 85.50 1.26E+10 < LD
AuNP_80Cit_5 77.66 0.26 9.7 100.61 1.38E+10 < LD
AuNP_80Cit_6 78.87 0.28 11.0 92.70 1.20E+10 < LD
AuNP_80Cit_7 77.23 0.24 9.5 86.16 1.22E+10 < LD
AuNP_80Cit_8 79.07 0.28 11.0 99.78 1.28E+10 < LD
AuNP_80Cit_9 78.08 0.28 10.8 88.93 1.21E+10 < LD
Cit AuNP
100 nm
(DIW)
AuNP_150Cit_1 142.87 0.43 16.8 74.32 2.52E+09 < LD
AuNP_150Cit _2 143.60 0.44 17.0 79.87 2.67E+09 < LD
AuNP_150Cit _3 142.98 0.45 16.9 75.07 2.55E+09 < LD
AuNP_150Cit _4 143.08 0.47 17.5 71.47 2.40E+09 < LD
AuNP_150Cit_5 145.54 0.43 16.2 80.46 2.57E+09 < LD
AuNP_150Cit _6 145.45 0.43 16.7 79.78 2.57E+09 < LD
AuNP_150Cit_7 141.84 0.46 17.5 68.68 2.37E+09 < LD
AuNP_150Cit _8 144.08 0.43 16.2 75.36 2.49E+09 < LD
AuNP_150Cit _9 144.75 0.45 16.6 73.00 2.39E+09 < LD
106
In terms of PNCs quantification, the three types of NPs, PVP-AuNPs, bPEI-AuNPs, and Cit-AuNP
(NIST RM 8012) showed similar results (Table 1) related to expected values calculated using TEM size
and gold mass concentration. Specifically, PNC recoveries of 103.5%, 90.1% and 93.5%, for the three
materials were obtained by NanoICP-MS app, respectively. These recoveries greater than 90% are
considered quantitative for the type of NPs using this analytical technique.82 Another important aspect to
highlight is how the NanoICP-MS app provides the mass concentration of the NP suspension. In this aspect,
it can be observed (Table 5) that very low concentration levels (fg/g) can be determined by the NanoICP-
MS app with good repeatability (sr < 8%) for all types of AuNPs analyzed (bPEI-AuNPs, PVP-AuNPs and
Cit-AuNP)
Although the vendor values are not strictly reliable in metrological terms, the comparative results
using NanoICP-MS and RIKILT show that the percentage difference between these values is less when
using the NanoICP-MS app. Specifically, Table 1 shows how the absolute percentage differences of the
particle size, are not higher than 4.2%, while in the case of RIKILT tools these differences are up to 14.9%.
With much more metrological confidence when using the values of the NIST RM 8012 (a highly
characterized RM) as reference to evaluate the accuracy of the data processing capabilities of both tools, it
can be observed (Table 1) that NanoICP-MS app provides differences of 2.8% while using the RIKILT
tool a 14.3% percentage difference was obtained. The main explanation for this difference is due to the
limitation of the RIKILT tool to calculate the particle size using PS(TE), an aspect that NanoICP-MS
incorporates in its calculations and design, as can be seen in Eqs. 7, 8, 9 and 10 of Table 2.
From a statistical perspective, the above results are equivalent to normalized errors (En) of 0.36 and
1.96, respectively; demonstrating NanoICP-MS app provides very accurate results (En ≤ 0.36) for the
estimation of particle size of AuNPs. On the other hand, when comparing the PNC results obtained by
NanoICP-MS and those obtained by the RIKILT tool it can be observed (Table 1) that for the specific case
of AuNPs, both provide quantitative recoveries for PNC (𝟏𝟏𝟎% ≤ 𝐑𝐞𝐜𝐨𝐯𝐞𝐫𝐲 ≤ 𝟗𝟎%). However, there
is a small discrepancy between the manual processing (RIKILT tool) and the one developed automatically
by NanoICP-MS app, which may be due to the use of EOD criteria to eliminate spurious data and the
approach used in NanoICP-MS app to perform the signal separation (background signal and NPs signals).
107
6.4.2. NanoICP-MS app in the characterization of AgNPs with different sizes
Characterization of AgNPs has taken great importance due its use different commercial and
technological applications such as antiseptic agents in the medical field, cosmetic, food packaging,
bioengineering, biosensors, electrochemistry, catalysis industries, among others2. Specifically, spICP-MS
has recently been used in the in vitro study of AgNPs in NP digestion processes,86 in the study of the stability
of AgNPs in aquatic matrices and different environmental conditions,87 in the characterization of AgNPs at
environmentally relevant conditions in lake waters,88 in the detection and characterization of AgNPs in soil
matrices,89 and the translocation of AgNPs in ex vivo human placenta perfusion model,99 among other
applications. Also, the determinations of the dimensional properties of AgNPs, as well as their PNC have
been parameters of high relevance in recent years to develop toxicological,90 ecotoxicological,91 and risk
assessment studies of NP-containing products.92
In order to demonstrate the capabilities of NanoICP-MS app in the characterization of relatively unstable
NPs such an AgNPs, two different types of PVP-AgNP sizes (60 nm and 100 nm) and the NIST RM 8017
(PVP-AgNP cake) were evaluated. As in the previous section, measurements of the NIST RM 8017 (PVP-
AgNP cake) were developed as method validation sample to evaluate the performance of particle size
measurement by spICP-MS. It is important to highlight that this experiment was performed with a
NexION® 350D (PerkinElmer, Waltham, MA, USA) quadrupole ICP-MS, where the operating conditions
of this instrument are detailed in Table S1. Also, another significant difference in this experiment is that
measurements were made using fast data acquisition conditions with microsecond time resolution, in which
data taken at 100 µs dwell time were recombined to generate a 10 ms dwell time data acquisition signal.
This means that signals obtained by MS detector at 100 µs are additively combined (∑) to simulate a 10 ms
signal. Another variant in this experiment was that the system was calibrated using inorganic standard Au
(NIST SRM 312129), inorganic standard Ag (NIST SRM 315130) solutions and AuNPs reference materials
(NIST RM 801332, Cit-AuNP). NP sizes were determined by selecting the robust approach (Huber's mean)
in the NanoICP-MS app, the calculation of PNC was performed by selecting the PS method. The general
results obtained by NanoICP-MS app are shown in Table 5.
Table 1 shows a summary and comparison with the RIKILT tool25. Unlike the results obtained for
the NIST 801231 (Cit-AuNPs), the measurements and processing data made on the NIST RM 8017 (PVP-
AgNP cake) showed a bias of 8.7 %, regardless of the application or tool (NanoICP-MS app or RIKILT
tool22) used to analyze the data. This finding indicates that this discrepancy is not attributable to the
calculation and data processing performed by either app. The observed bias can arise from a different
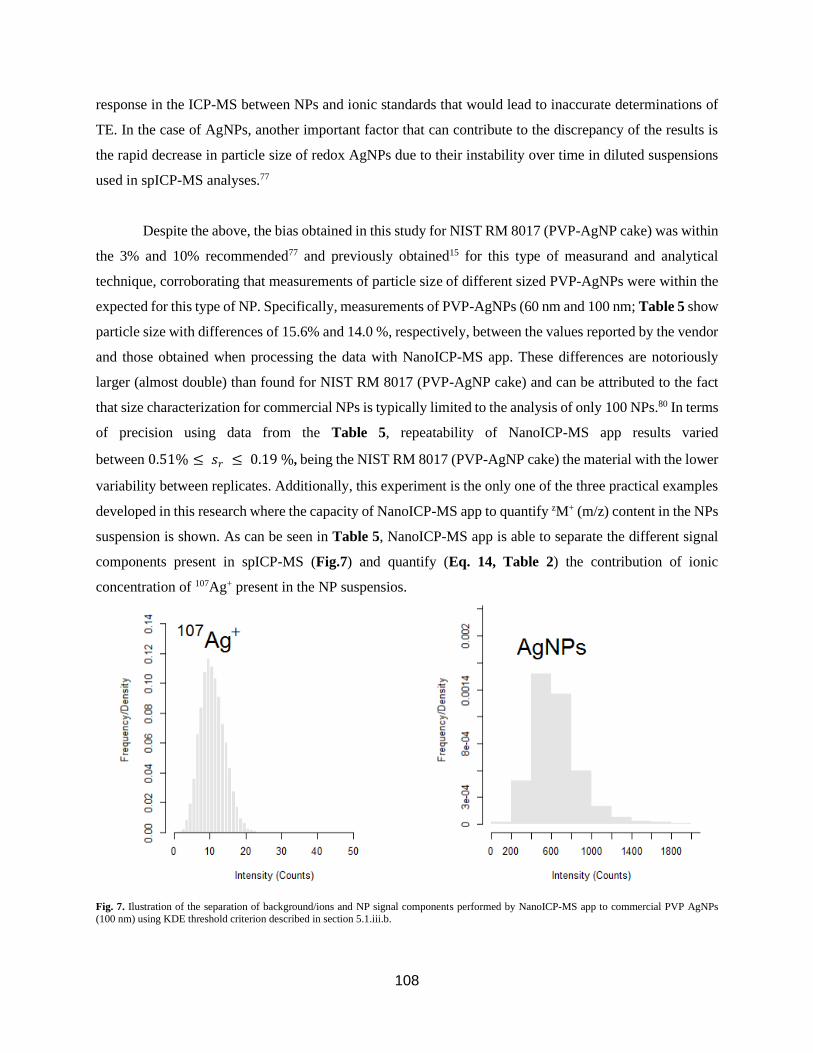
108
response in the ICP-MS between NPs and ionic standards that would lead to inaccurate determinations of
TE. In the case of AgNPs, another important factor that can contribute to the discrepancy of the results is
the rapid decrease in particle size of redox AgNPs due to their instability over time in diluted suspensions
used in spICP-MS analyses.77
Despite the above, the bias obtained in this study for NIST RM 8017 (PVP-AgNP cake) was within
the 3% and 10% recommended77 and previously obtained15 for this type of measurand and analytical
technique, corroborating that measurements of particle size of different sized PVP-AgNPs were within the
expected for this type of NP. Specifically, measurements of PVP-AgNPs (60 nm and 100 nm; Table 5 show
particle size with differences of 15.6% and 14.0 %, respectively, between the values reported by the vendor
and those obtained when processing the data with NanoICP-MS app. These differences are notoriously
larger (almost double) than found for NIST RM 8017 (PVP-AgNP cake) and can be attributed to the fact
that size characterization for commercial NPs is typically limited to the analysis of only 100 NPs.80 In terms
of precision using data from the Table 5, repeatability of NanoICP-MS app results varied
between 0.51% ≤ 𝑠𝑟 ≤ 0.19 %, being the NIST RM 8017 (PVP-AgNP cake) the material with the lower
variability between replicates. Additionally, this experiment is the only one of the three practical examples
developed in this research where the capacity of NanoICP-MS app to quantify zM+ (m/z) content in the NPs
suspension is shown. As can be seen in Table 5, NanoICP-MS app is able to separate the different signal
components present in spICP-MS (Fig.7) and quantify (Eq. 14, Table 2) the contribution of ionic
concentration of 107Ag+ present in the NP suspensios.
Fig. 7. Ilustration of the separation of background/ions and NP signal components performed by NanoICP-MS app to commercial PVP AgNPs
(100 nm) using KDE threshold criterion described in section 5.1.iii.b.
109
Another important aspect when processing and analyzing the results of this experiment with
NanoICP-MS is the remarkable ability of this app to reliably determine PNC for the analysis of unstable
systems such AgNPs. The results of Table 1 show that recoveries (117 %) of PNC obtained for PVP-AgNP
75 nm (NIST RM 8017) were within the range of PNC reported in previous studies in spICP-MS.15,77 For
the different sizes PVP-AgNPs, the PNC results of the analysis and data processing show results ranging
from 77% (PVP-AgNP, 60 nm) and 106% (PVP-AgNPs, 100 nm). When comparing these results with
those obtained with the RIKILT tool, a marked difference can be observed in the processing and estimates
of the PNC, since this tool generates estimates of the PNC that can be more than a thousand times greater
than those declared by the NPs vendors. Therefore, the results describe above show how NanoICP-MS app
will provide a more realistic and reliable estimation of the PNC, an aspect really important in studies in the
fields of nanotoxicology and nanoEHS.
6.4.3. Characterization of AuNPs after organism model experiment using C. elegans nematodes
The quantification of metal-based NPs in biological matrices to understand their biodistribution,
bioconcentration and bioaccumulation has been a very relevant research topic in recent years35 due to the
increasing technological, scientific and commercial applications that have been given to these engineering
nanomaterials (ENM). spICP-MS has demonstrated its great potential to determine the size and quantify
the PNC across a broad range of organisms.93,95 Specifically, protocols and research have been developed
to separate,96 improve97 and quantify ENMs35in toxicological and genetic studies on nematodes
(Caenorhabditis elegans (C. elegans)), demonstrating is an extremely powerful modality to understand the
effect and interaction of the ENMs at a biological level.
To assess the capabilities of the NanoICP-MS app in organism model experiments, different sizes
of Cit-AuNPs (80 nm, 100nm, and 150 nm) were exposed to C. elegans. spICP-MS measurements for this
experiment were performed with a Thermo X Series quadrupole ICP-MS (the operating conditions of this
instrument are detailed in Table S1). Also, it is important to highlight that prior to the C. elegans exposure
test, the initial stock commercial Cit-AuNPs were treated in two different ways: either dispersed in DIW or
digested with TMAH to mimic the matrix conditions of the C. elegans base digestion protocol. Both AuNPs
in water and after TMAH digestion were analyzed by spICP-MS to determine whether the TMAH digestion
process caused transformation of particle size (this would result in artefacts in analyzing the transformation
of particle size in the nematode samples). Furthermore, unlike the previous examples, a commercial 100
nm citrate stabilized AuNP material was used as a calibrant in this organism model due to the 10-fold
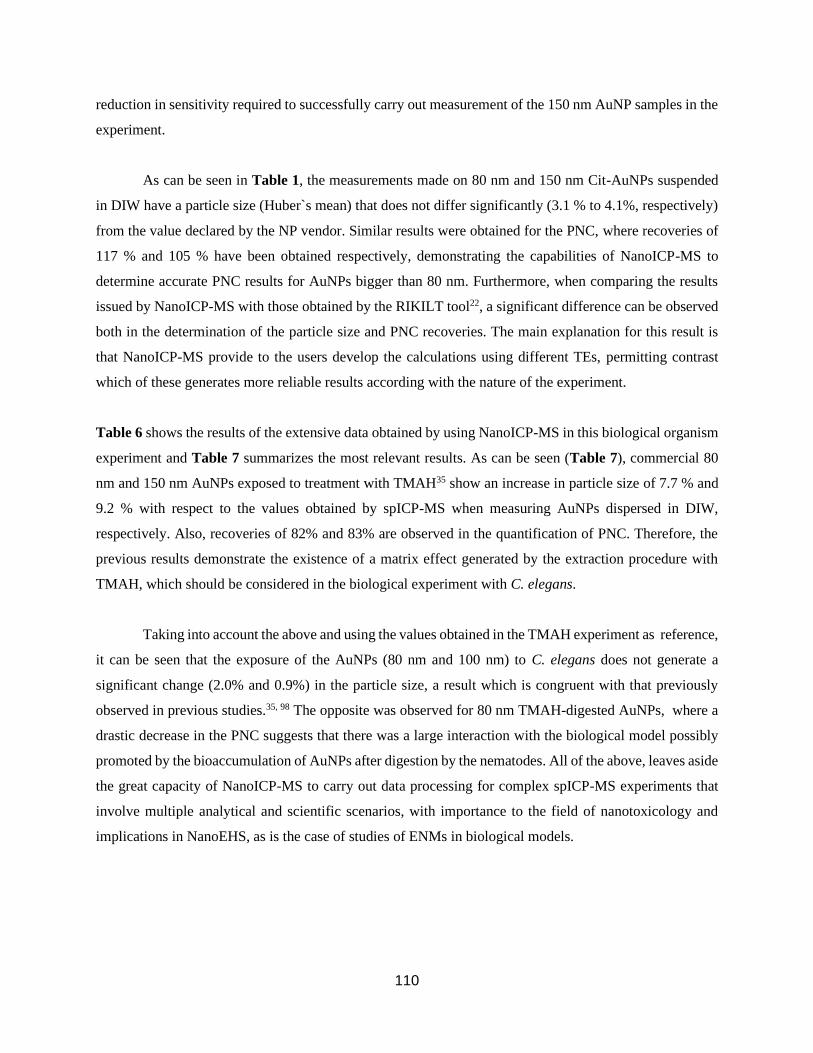
110
reduction in sensitivity required to successfully carry out measurement of the 150 nm AuNP samples in the
experiment.
As can be seen in Table 1, the measurements made on 80 nm and 150 nm Cit-AuNPs suspended
in DIW have a particle size (Huber`s mean) that does not differ significantly (3.1 % to 4.1%, respectively)
from the value declared by the NP vendor. Similar results were obtained for the PNC, where recoveries of
117 % and 105 % have been obtained respectively, demonstrating the capabilities of NanoICP-MS to
determine accurate PNC results for AuNPs bigger than 80 nm. Furthermore, when comparing the results
issued by NanoICP-MS with those obtained by the RIKILT tool22, a significant difference can be observed
both in the determination of the particle size and PNC recoveries. The main explanation for this result is
that NanoICP-MS provide to the users develop the calculations using different TEs, permitting contrast
which of these generates more reliable results according with the nature of the experiment.
Table 6 shows the results of the extensive data obtained by using NanoICP-MS in this biological organism
experiment and Table 7 summarizes the most relevant results. As can be seen (Table 7), commercial 80
nm and 150 nm AuNPs exposed to treatment with TMAH35 show an increase in particle size of 7.7 % and
9.2 % with respect to the values obtained by spICP-MS when measuring AuNPs dispersed in DIW,
respectively. Also, recoveries of 82% and 83% are observed in the quantification of PNC. Therefore, the
previous results demonstrate the existence of a matrix effect generated by the extraction procedure with
TMAH, which should be considered in the biological experiment with C. elegans.
Taking into account the above and using the values obtained in the TMAH experiment as reference,
it can be seen that the exposure of the AuNPs (80 nm and 100 nm) to C. elegans does not generate a
significant change (2.0% and 0.9%) in the particle size, a result which is congruent with that previously
observed in previous studies.35, 98 The opposite was observed for 80 nm TMAH-digested AuNPs, where a
drastic decrease in the PNC suggests that there was a large interaction with the biological model possibly
promoted by the bioaccumulation of AuNPs after digestion by the nematodes. All of the above, leaves aside
the great capacity of NanoICP-MS to carry out data processing for complex spICP-MS experiments that
involve multiple analytical and scientific scenarios, with importance to the field of nanotoxicology and
implications in NanoEHS, as is the case of studies of ENMs in biological models.
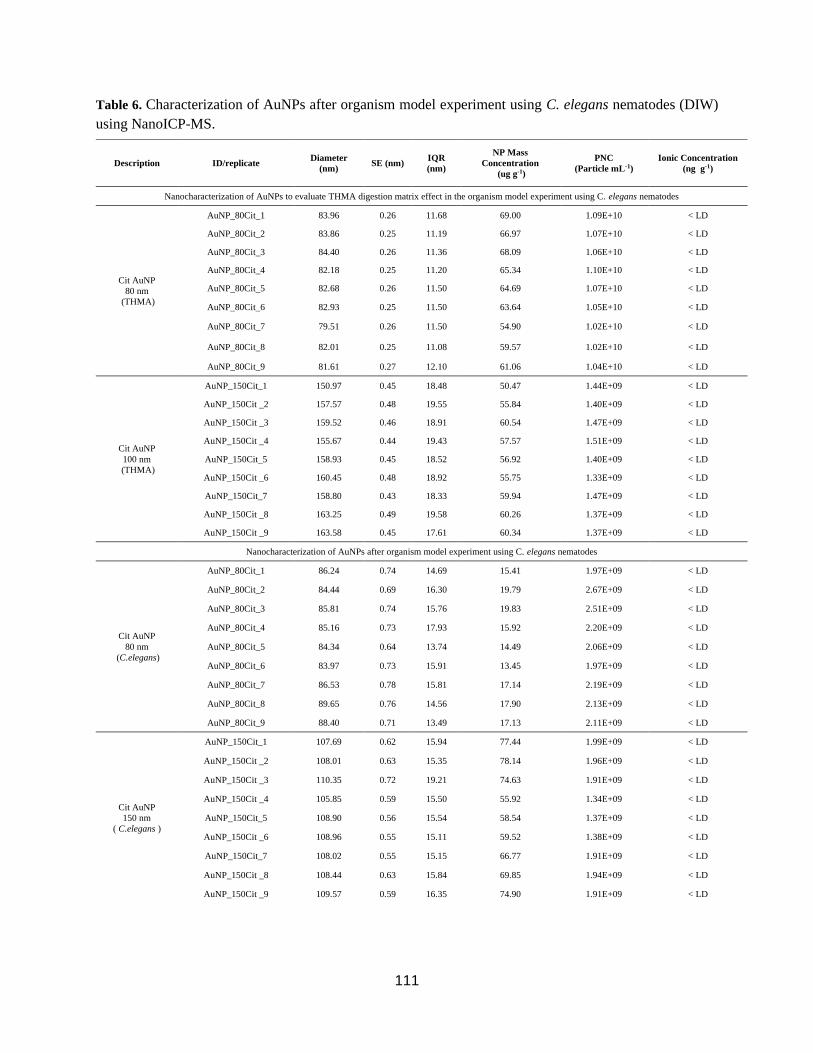
111
Table 6. Characterization of AuNPs after organism model experiment using C. elegans nematodes (DIW)
using NanoICP-MS.
Description ID/replicate Diameter
(nm) SE (nm)
IQR
(nm)
NP Mass
Concentration
(ug g-1)
PNC
(Particle mL-1)
Ionic Concentration
(ng g-1)
Nanocharacterization of AuNPs to evaluate THMA digestion matrix effect in the organism model experiment using C. elegans nematodes
Cit AuNP
80 nm
(THMA)
AuNP_80Cit_1 83.96 0.26 11.68 69.00 1.09E+10 < LD
AuNP_80Cit_2 83.86 0.25 11.19 66.97 1.07E+10 < LD
AuNP_80Cit_3 84.40 0.26 11.36 68.09 1.06E+10 < LD
AuNP_80Cit_4 82.18 0.25 11.20 65.34 1.10E+10 < LD
AuNP_80Cit_5 82.68 0.26 11.50 64.69 1.07E+10 < LD
AuNP_80Cit_6 82.93 0.25 11.50 63.64 1.05E+10 < LD
AuNP_80Cit_7 79.51 0.26 11.50 54.90 1.02E+10 < LD
AuNP_80Cit_8 82.01 0.25 11.08 59.57 1.02E+10 < LD
AuNP_80Cit_9 81.61 0.27 12.10 61.06 1.04E+10 < LD
Cit AuNP
100 nm
(THMA)
AuNP_150Cit_1 150.97 0.45 18.48 50.47 1.44E+09 < LD
AuNP_150Cit _2 157.57 0.48 19.55 55.84 1.40E+09 < LD
AuNP_150Cit _3 159.52 0.46 18.91 60.54 1.47E+09 < LD
AuNP_150Cit _4 155.67 0.44 19.43 57.57 1.51E+09 < LD
AuNP_150Cit_5 158.93 0.45 18.52 56.92 1.40E+09 < LD
AuNP_150Cit _6 160.45 0.48 18.92 55.75 1.33E+09 < LD
AuNP_150Cit_7 158.80 0.43 18.33 59.94 1.47E+09 < LD
AuNP_150Cit _8 163.25 0.49 19.58 60.26 1.37E+09 < LD
AuNP_150Cit _9 163.58 0.45 17.61 60.34 1.37E+09 < LD
Nanocharacterization of AuNPs after organism model experiment using C. elegans nematodes
Cit AuNP
80 nm
(C.elegans)
AuNP_80Cit_1 86.24 0.74 14.69 15.41 1.97E+09 < LD
AuNP_80Cit_2 84.44 0.69 16.30 19.79 2.67E+09 < LD
AuNP_80Cit_3 85.81 0.74 15.76 19.83 2.51E+09 < LD
AuNP_80Cit_4 85.16 0.73 17.93 15.92 2.20E+09 < LD
AuNP_80Cit_5 84.34 0.64 13.74 14.49 2.06E+09 < LD
AuNP_80Cit_6 83.97 0.73 15.91 13.45 1.97E+09 < LD
AuNP_80Cit_7 86.53 0.78 15.81 17.14 2.19E+09 < LD
AuNP_80Cit_8 89.65 0.76 14.56 17.90 2.13E+09 < LD
AuNP_80Cit_9 88.40 0.71 13.49 17.13 2.11E+09 < LD
Cit AuNP
150 nm
( C.elegans )
AuNP_150Cit_1 107.69 0.62 15.94 77.44 1.99E+09 < LD
AuNP_150Cit _2 108.01 0.63 15.35 78.14 1.96E+09 < LD
AuNP_150Cit _3 110.35 0.72 19.21 74.63 1.91E+09 < LD
AuNP_150Cit _4 105.85 0.59 15.50 55.92 1.34E+09 < LD
AuNP_150Cit_5 108.90 0.56 15.54 58.54 1.37E+09 < LD
AuNP_150Cit _6 108.96 0.55 15.11 59.52 1.38E+09 < LD
AuNP_150Cit_7 108.02 0.55 15.15 66.77 1.91E+09 < LD
AuNP_150Cit _8 108.44 0.63 15.84 69.85 1.94E+09 < LD
AuNP_150Cit _9 109.57 0.59 16.35 74.90 1.91E+09 < LD
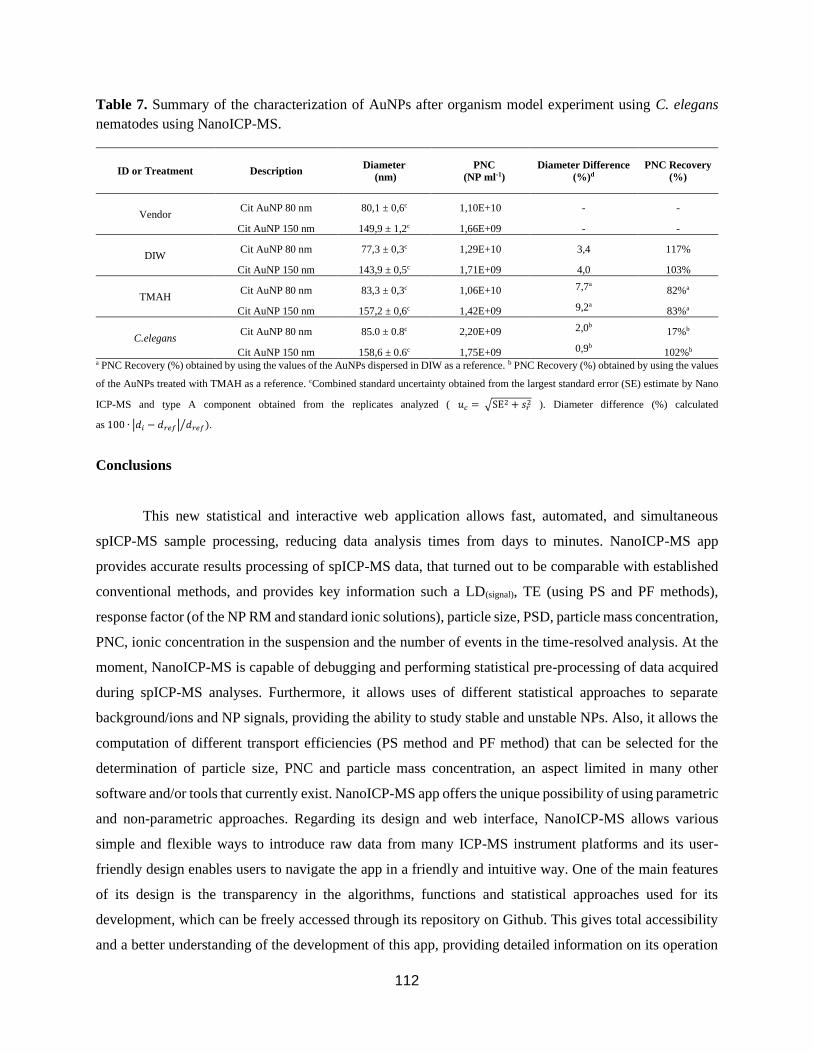
112
Table 7. Summary of the characterization of AuNPs after organism model experiment using C. elegans
nematodes using NanoICP-MS.
ID or Treatment Description Diameter
(nm)
PNC
(NP ml-1)
Diameter Difference
(%)d
PNC Recovery
(%)
Vendor Cit AuNP 80 nm 80,1 ± 0,6c 1,10E+10 - -
Cit AuNP 150 nm 149,9 ± 1,2c 1,66E+09 - -
DIW Cit AuNP 80 nm 77,3 ± 0,3c 1,29E+10 3,4 117%
Cit AuNP 150 nm 143,9 ± 0,5c 1,71E+09 4,0 103%
TMAH Cit AuNP 80 nm 83,3 ± 0,3c 1,06E+10 7,7a 82%a
Cit AuNP 150 nm 157,2 ± 0,6c 1,42E+09 9,2a 83%a
C.elegans Cit AuNP 80 nm 85.0 ± 0.8c 2,20E+09 2,0b 17%b
Cit AuNP 150 nm 158,6 ± 0.6c 1,75E+09 0,9b 102%b a PNC Recovery (%) obtained by using the values of the AuNPs dispersed in DIW as a reference. b PNC Recovery (%) obtained by using the values
of the AuNPs treated with TMAH as a reference. cCombined standard uncertainty obtained from the largest standard error (SE) estimate by Nano
ICP-MS and type A component obtained from the replicates analyzed ( 𝑢𝑐 = √SE2 + 𝑠𝑟
2 ). Diameter difference (%) calculated
as 100 ∙ |𝑑𝑖 − 𝑑𝑟𝑒𝑓| 𝑑𝑟𝑒𝑓)⁄ .
Conclusions
This new statistical and interactive web application allows fast, automated, and simultaneous
spICP-MS sample processing, reducing data analysis times from days to minutes. NanoICP-MS app
provides accurate results processing of spICP-MS data, that turned out to be comparable with established
conventional methods, and provides key information such a LD(signal), TE (using PS and PF methods),
response factor (of the NP RM and standard ionic solutions), particle size, PSD, particle mass concentration,
PNC, ionic concentration in the suspension and the number of events in the time-resolved analysis. At the
moment, NanoICP-MS is capable of debugging and performing statistical pre-processing of data acquired
during spICP-MS analyses. Furthermore, it allows uses of different statistical approaches to separate
background/ions and NP signals, providing the ability to study stable and unstable NPs. Also, it allows the
computation of different transport efficiencies (PS method and PF method) that can be selected for the
determination of particle size, PNC and particle mass concentration, an aspect limited in many other
software and/or tools that currently exist. NanoICP-MS app offers the unique possibility of using parametric
and non-parametric approaches. Regarding its design and web interface, NanoICP-MS allows various
simple and flexible ways to introduce raw data from many ICP-MS instrument platforms and its user-
friendly design enables users to navigate the app in a friendly and intuitive way. One of the main features
of its design is the transparency in the algorithms, functions and statistical approaches used for its
development, which can be freely accessed through its repository on Github. This gives total accessibility
and a better understanding of the development of this app, providing detailed information on its operation
113
that is usually limited by design or licensing in other existing softwares. The application is currently limited
to non-continuous measurements with 1-20 ms dwell time. Efforts are currently under way to develop
complementary software for application in continuous measurements with ≤ 100 µs spICP-MS analysis.
All of the above demonstrates the capabilities of the NanoICP-MS app to characterize metal base NPs.
Conflict of Interest Statement
The authors declare that the research was conducted in the absence of any commercial or financial
relationships that could be construed as a potential conflict of interest.
Acknowledgements
The authors would like to the Journal of Analytical Atomic Spectrometry reviewers for their very
useful comments and suggestions.
Note
Certain trade names and company products are mentioned in the text or identified in illustrations to
specify adequately the experimental procedure and equipment used. In no case does such identification
imply recommendation or endorsement by the National Institute of Standards and Technology nor does it
imply that the products are necessarily the best available for the purpose. The authors declare no competing
financial interest.
114
References
1. Daniel, M. C., & Astruc, D. Chemical Reviews, 2004, 104, 293-346, DOI: 10.1021/cr030698+.
2. Calderón-Jiménez, B., Johnson, M. E., Montoro Bustos, A. R., Murphy, K. E., Winchester, M. R., & Vega Baudrit, J. R.
Frontiers in Chemistry, 2017, 5, 6, DOI: 10.3389/fchem.2017.00006.
3. Liu, J., Murphy, K. E., MacCuspie, R. I., & Winchester, M. R. Analytical Chemistry, 86, 3405-3414, DOI: 10.1021/ac403775a.
4. Laborda, F., Bolea, E., Cepriá, G., Gómez, M. T., Jiménez, M. S., Pérez-Arantegui, J., & Castillo, J. R. Analytica Chimica Acta,
2016, 904, 10-32, DOI: 10.1016/j.aca.2015.11.008.
5. Lin, P. C., Lin, S., Wang, P. C., & Sridhar, R. Biotechnology Advances, 2014, 32, 711-726. DOI:
10.1016/j.biotechadv.2013.11.006.
6. Montoro Bustos, A. R., Petersen, E. J., Possolo, A., & Winchester, M. R. Analytical Chemistry, 2015, 87, 8809-8817, DOI:
10.1021/acs.analchem.5b01741.
7. Laborda, F., Jiménez-Lamana, J., Bolea, E., & Castillo, J. R. Journal of Analytical Atomic Spectrometry, 2013, 28, 1220-1232,
DOI: 10.1039/c3ja50100k.
8. Laborda, F., Bolea, E., & Jimenez-Lamana, J. Analytical Chemistry, 2014, 86, 2270-2278, DOI: 10.1021/ac402980q.
9. Jenkins, S. V., Qu, H., Mudalige, T., Ingle, T. M., Wang, R., Wang, F., ... & Zhang, Y. Biomaterials, 2015, 51, 226-237, DOI:
10.1016/j.biomaterials.2015.01.072.
10. Degueldre, C., Favarger, P. Y., & Bitea, C. Analytica Chimica Acta, 2004, 518, 137-142, DOI: 10.1016/S0927-7757(02)00568-
X.
11. Montaño, M. D., Olesik, J. W., Barber, A. G., Challis, K., & Ranville, J. F. Analytical and Bioanalytical Chemistry, 2016, 408,
5053-5074. DOI: 10.1007/s00216-016-9676-8.
12. Laborda, F., Jiménez-Lamana, J., Bolea, E., & Castillo, J. R. Journal of Analytical Atomic Spectrometry, 2011, 26, 1362-1371.
DOI: 10.1039/C0JA00098A.
13. Ramkorun-Schmidt, B., Pergantis, S. A., Esteban-Fernández, D., Jakubowski, N., & Günther, D. Analytical Chemistry, 2015,
87, 8687-8694, DOI: 10.1021/acs.analchem.5b01604.
14. Pace, H. E., Rogers, N. J., Jarolimek, C., Coleman, V. A., Higgins, C. P., & Ranville, J. F. Analytical Chemistry, 2011, 83,
9361-9369, DOI: 10.1021/ac201952t.
15. Murphy, K. E., Liu, J., Bustos, A. M., Johnson, M. E., & Winchester, M. R. NIST Special Publication, 2015, 1200-21, DOI:
10.6028/NIST.SP.1200-21.
16. Mitrano, D. M., Lesher, E. K., Bednar, A., Monserud, J., Higgins, C. P., & Ranville, J. F. Environmental Toxicology and
Chemistry, 2012, 31, 115-121, DOI: 10.1002/etc.719.
17. Tuoriniemi, J., Cornelis, G., & Hassellov, M. Analytical Chemistry, 2012, 84, 3965-3972, DOI: 10.1021/ac203005r.
18. Navratilova, J., Praetorius, A., Gondikas, A., Fabienke, W., Von der Kammer, F., & Hofmann, T. International Journal of
Environmental Research and Public Health, 2015, 12, 15756-15768, DOI: 10.3390/ijerph121215020.
19. Hadioui, M., Peyrot, C., & Wilkinson, K. J. Analytical Chemistry, 2014, 86, 4668-4674, DOI: 10.1021/ac5004932.
20. Bi, X., Lee, S., Ranville, J. F., Sattigeri, P., Spanias, A., Herckes, P., & Westerhoff, P. Journal of Analytical Atomic
Spectrometry, 2014 29, 1630-1639, DOI: 10.1039/C4JA00109E
21. Cornelis, G., & Hassellöv, M. Journal of Analytical Atomic Spectrometry, 2014, 29, 134-144, DOI: 10.1039/c3ja50160d.
22. Peters, R., Herrera-Rivera, Z., Undas, A., van der Lee, M., Marvin, H., Bouwmeester, H., & Weigel, S. Journal of Analytical
Atomic Spectrometry, 2015, 30, 1274-1285, DOI: 10.1039/C4JA00357H.
23. Cornelis, G. Nanocount version 3.2, 2014, http://blogg.slu.se/nanocount/files/2017/04/Manual_3_0.pdf.
24. Wilbur, S., Yamanaka, M., Sannac, S. Agilent Technologies, 2017, 5991-5516EN,
https://www.agilent.com/cs/library/whitepaper/public/ICP-MS_5991-5516EN-nanoparticles.pdf.
25. Hadioui, M., Wilkinson, K., Stephan, C. PerkinElmer, 2014, https://www.perkinelmer.com/lab-
solutions/resources/docs/NexION350XSilverNanoparticlesInSurfaceWater.pdf.
26. Kurcher, D., Wills, J.D., Docus, S.M. Thermo Fisher Scientific Inc, 2016, https://tools.thermofisher.com/content/sfs/brochures/TN-43279-LC-MS-nanoparticles-spICP-MS-npQuant-Qtegra-TN43279-
EN.pdf
27. RStudio, PBC, 2020, https://shiny.rstudio.com/
28. RStudio, PBC, 2020, https://rstudio.com/
29. NIST, Certificate of Analysis, 2018, https://www-s.nist.gov/srmors/certificates/3121.pdf
30. NIST, Certificate of Analysis, 2016, https://www-s.nist.gov/srmors/certificates/3151.pdf
31. NIST, Certificate of Analysis, 2015, https://www-s.nist.gov/srmors/certificates/8012.pdf
32. NIST, Certificate of Analysis, 2015, https://www-s.nist.gov/srmors/certificates/8013.pdf
115
33. NIST, Certificate of Analysis, 2015, https://www-s.nist.gov/srmors/certificates/8017.pdf
34. ISO, I., & OIML, B. (1995). Guide to the Expression of Uncertainty in Measurement. Geneva, Switzerland, 122.
35. Johnson, M. E., Hanna, S. K., Montoro Bustos, A. R., Sims, C. M., Elliott, L. C., Lingayat, A., ... & Scott, K. C. (2017). ACS
nano, 11, 526-540, DOI: 10.1021/acsnano.6b06582.
36. Johnson, M., Montoro, A.R., Hanna, S.K., Petersen, E.J., Murphy, K.E., Yu, L.L., Nelson, B.C., Winchester, M.R. NIST Special
Publication, 2015, 1200-24, https://nvlpubs.nist.gov/nistpubs/SpecialPublications/NIST.SP.1200-24.pdf.
37. The R Foundation for Statistical Computing, R version 3.5.3, https://www.r-project.org/.
38. Sievert et al., 2020, Package Plotly, https://cran.r-project.org/web/packages/plotly/index.html.
39. Xie et al., Package DT, 2020, https://cran.r-project.org/web/packages/DT/index.html.
40. Perrier et al., 2020, Package shinyWidgets, https://cran.r-project.org/web/packages/shinyWidgets/index.html.
41. Attali et al., 2020, Package shinyjs https://cran.r-project.org/web/packages/shinyjs/index.html
42. Ganz & Mehrabani, 2019, Package Introjs, https://github.com/carlganz/rintrojs.
43. Maechler et al., 2019, Package robustbase, http://robustbase.r-forge.r-project.org/.
44. Ripley et al., 2019, Package MASS, http://www.stats.ox.ac.uk/pub/MASS4/.
45. Delignette-Muller, et al., 2019, Package fitdistrplus, http://listes.univ-lyon1.fr/wws/info/fitdist-users
46. Scott, 2018, Package GeneralizedHyperbolic, https://r-forge.r-project.org/projects/rmetrics/.
47. King et al., 2020, Package gld, https://cran.r-project.org/package=gld.
48. Aucoin, 2015, Package FAdist, https://github.com/tpetzoldt/FAdist.
49. Maechler, et al., 2020, Package sfsmisc, https://cran.r-project.org/package=sfsmisc.
50. Thomas Yee & Moler, 2019, Package VGAM, https://cran.r-project.org/package=VGAM.
51. Package gldist, https://cran.r-project.org/src/contrib/Archive/gldist/
52. Warnes et al 2020, Package gplots, https://cran.r-project.org/package=gplots.
53. Sarmanho, G & Calderón-Jiménez, B, 2020, NIST, GitHub repository, https://github.com/usnistgov/NanoICP-MS.
54. Ulianov, A., Müntener, O., & Schaltegger, U. (2015). Journal of Analytical Atomic Spectrometry, 30, 1297-1321, DOI:
10.1039/C4JA00319E.
55. Xie, M., He, B., & Goh, T. N. Computational Statistics & Data Analysis, 2001, 38, 191-201, DOI: 10.1016/S0167-
9473(01)00033-0.
56. Currie, L. Journal of Radioanalytical and Nuclear Chemistry, 2008, 276, 285-297, DOI: 10.1007/s10967-008-0501-5.
57. Wilk, M. B., & Gnanadesikan, R. Biometrika, 1968, 55, 1-17. DOI: 10.1093/biomet/55.1.1. DOI: 10.2307/2334448.
58. Bhattacharya, P. K. (1967). Sankhyā: The Indian Journal of Statistics, Series A, 373-382.
59. Silverman, B. W. (1986). Density Estimation for Statistics and Data Analysis (Vol. 26). CRC press.
60. AMC. Analyst, 1989, 114, 1693-1697, DOI: 10.1039/AN9891401693.
61. Carobbi, C. (2017). Measurement, 110, 296-306. DOI: 10.1016/j.measurement.2017.07.006.
62. AMCTB, 2006, 4, 1- 2. https://www.rsc.org/images/brief4_tcm18-25925.pdf
63. Neath, A. A., & Cavanaugh, J. E. Wiley Interdisciplinary Reviews: Computational Statistics, 2012, 4, 199-203, DOI:
10.1002/wics.199.
64. Miller, J. N. Analyst, 1991, 116, 3-14, DOI: 10.1039/AN9911600003
65. Duer, W. C., Ogren, P. J., Meetze, A., Kitchen, C. J., Von Lindern, R., Yaworsky, D. C., ... & Gayer, J. A. Journal of Analytical
Toxicology, 2008. 32, 329-338, DOI: 10.1093/jat/32.5.329.
66. Kim, H. A., Lee, B. T., Na, S. Y., Kim, K. W., Ranville, J. F., Kim, S. O., ... & Eom, I. C. Chemosphere, 2017, 171, 468-475.
DOI: 10.1016/j.chemosphere.2016.12.063.
67. Wilschefski, S. C., & Baxter, M. R. The Clinical Biochemist Reviews, 2019, 40, 115. DOI: 10.33176/AACB-19-00024.
68. Mozhayeva, D., & Engelhard, C. (2020). Journal of Analytical Atomic Spectrometry. Advance Article. 10.1039/C9JA00206E.
69. Kotu, V., & Deshpande, B. (2018). Data Science: Concepts and Practice. Morgan Kaufmann. DOI: 10.1016/C2017-0-02113-4.
70. Laughton, S., Laycock, A., von der Kammer, F., Hofmann, T., Casman, E. A., Rodrigues, S. M., & Lowry, G. V. Journal of
Nanoparticle Research, 2019. 21, 174. DOI: 10.1007/s11051-019-4620-4.
71. Nwoko, K. C., Raab, A., Cheyne, L., Dawson, D., Krupp, E., & Feldmann, J. Journal of Chromatography B, 2019, 1124, 356-
365. DOI: 10.1016/j.jchromb.2019.06.029.
72. Keri, A., Sápi, A., Ungor, D., Sebők, D., Csapó, E., Kónya, Z., & Galbács, G. Journal of Analytical Atomic Spectrometry, 2020, Advance Article.
73. Lee, S., Bi, X., Reed, R. B., Ranville, J. F., Herckes, P., & Westerhoff, P. Environmental Science & Technology, 2014, 48,
10291-10300. DOI: 10.1021/es502422v.
116
74. Martin, M. N., Allen, A. J., MacCuspie, R. I., & Hackley, V. A. Langmuir, 2014, 30, 11442-11452. DOI: 10.1021/la502973z
75. Liu, J., & Hurt, R. H. (2010). Environmental Science & Technology, 44(6), 2169-2175. DOI: 10.1021/es9035557.
76. Pianosi, F., & Wagener, T. Environmental Modelling & Software, 2015, 67, 1-11. DOI: 10.1016/j.envsoft.2015.01.004.
77. Liu, J., Murphy, K. E., Winchester, M. R., & Hackley, V. A. Analytical and Bioanalytical Chemistry, 2017, 409, 6027-6039.
DOI: 10.1007/s00216-017-0530-4.
78. Fuchs, J., Aghaei, M., Schachel, T. D., Sperling, M., Bogaerts, A., & Karst, U. Analytical Chemistry, 2018, 90, 10271-10278.
DOI: 10.1021/acs.analchem.8b02007.
79. Spencer, C. J., Yakymchuk, C., & Ghaznavi, M. (2017). Geoscience Frontiers, 8, 1247-1252. DOI: 10.1016/j.gsf.2017.05.002.
80. Montoro-Bustos, A. R. M., Kavuri, P. P., Possolo, A. M., Farkas, N., Vladar, A., Murphy, K. E., & Winchester, M. R. Analytical
Chemistry, 2018, 90, (Analytical Chemistry). DOI: 10.1021/acs.analchem.8b03871.
81. Schavkan, A., Gollwitzer, C., Garcia-Diez, R., Krumrey, M., Minelli, C., Bartczak, D., ... & Baur, G. B, 2019, Nanomaterials, 9, 502, DOI: 10.3390/nano9040502
82. Johnson, M. E., Bustos, A. R. M., & Winchester, M. R. Analytical and bioanalytical chemistry, 2016, 408, 7629-7640. DOI:
10.1007/s00216-016-9844-x
83. Stefaniak, A. B., Hackley, V. A., Roebben, G., Ehara, K., Hankin, S., Postek, M. T., ... & Thünemann, A. F. Nanotoxicology,
2013, 7, 1325-1337. DOI: 10.3109/17435390.2012.739664.
84. Montoro Bustos, A.R., Winchester, M.R. Analytical and Bioanalytical Chemistry, 2016, 408, 5051-5052. DOI: 10.1007/s00216-
016-9638-1.
85. Thanh, N. T., Maclean, N., & Mahiddine, S. (2014). Chemical reviews, 114, 7610-7630. DOI: 10.1021/cr400544s.
86. Abdelkhaliq, A., van der Zande, M., Undas, A. K., Peters, R. J., & Bouwmeester, H. (2020). Nanotoxicology, 14, 111-126. DOI: 10.1080/17435390.2019.1675794
87. Telgmann, L., Nguyen, M. T. K., Shen, L., Yargeau, V., Hintelmann, H., & Metcalfe, C. D. (2016). Analytical and bioanalytical
chemistry, 408, 5169-5177. DOI: 10.1007/s00216-016-9685-7.
88. Newman, K., Metcalfe, C., Martin, J., Hintelmann, H., Shaw, P., & Donard, A. (2016). Journal of Analytical Atomic
Spectrometry, 31, 2069-2077. DOI: 10.1039/C6JA00221H.
89. El Hadri, H., & Hackley, V. A. (2017). Environmental Science: Nano, 4, 105-116. DOI: 10.1039/C6EN00322B.
90. Cho, Y. M., Mizuta, Y., Akagi, J. I., Toyoda, T., Sone, M., & Ogawa, K. (2018). Journal of toxicologic pathology, 31, 73-80.
DOI: 10.1293/tox.2017-0043.
91. Park, S. Y., Chung, J., Colman, B. P., Matson, C. W., Kim, Y., Lee, B. C., ... & Choi, J. (2015). Environmental toxicology and
chemistry, 34, 2023-2032. DOI: 10.1002/etc.3019.
92. Calcaterra, H., Shin, N., Quirk, P. L., & Tsai, C. S. (2020). Low Concentration Analysis of Silver Nanoparticles in Consumer
Spray Products. Atmosphere, 11, 403. DOI: 10.3390/atmos11040403.
93. Abdolahpur Monikh, F., Chupani, L., Zusková, E., Peters, R., Vancová, M., Vijver, M. G., ... & Peijnenburg, W. J. (2018).
Environmental Science & Technology, 53, 946-953. DOI: 10.1021/acs.est.8b03715.
94. Johnson, M. E., Hanna, S. K., Montoro Bustos, A. R., Sims, C. M., Elliott, L. C., Lingayat, A., ... & Scott, K. C. (2017). ACS
nano, 11(1), 526-540. DOI: 10.1021/acsnano.6b06582.
95. Petersen, E. J., Mortimer, M., Burgess, R. M., Handy, R., Hanna, S., Ho, K. T., ... & Spurgeon, D. (2019). Environmental
Science: Nano, 6(6), 1619-1656. DOI: 10.1039/C8EN01378K.
96. Johnson, M. E., Bustos, A. M., Hanna, S. K., Petersen, E. J., Murphy, K. E., Yu, L. L., ... & Winchester, M. R. (2017). NIST
Special Publication, 1200, 24. DOI: 10.6028/NIST.SP.1200-24.
97. Scanlan, L. D., Lund, S. P., Coskun, S. H., Hanna, S. K., Johnson, M. E., Sims, C. M., ... & Nelson, B. C. (2018). Scientific
Reports, 8, 1-12. DOI: 10.1038/s41598-018-19187-3.
98. Gray, E. P., Coleman, J. G., Bednar, A. J., Kennedy, A. J., Ranville, J. F., & Higgins, C. P. (2013). Environmental Science &
Technology, 47, 14315-14323. DOI: 10.1021/es403558c.
99. Vidmar, J., Loeschner, K., Correia, M., Larsen, E. H., Manser, P., Wichser, A., ... & Buerki-Thurnherr, T. (2018). Translocation
of silver nanoparticles in the ex vivo human placenta perfusion model characterized by single particle ICP-MS. Nanoscale, 10,
25, 11980-11991. DOI: 10.1039/C8NR02096E
117
4.3 Supporting Information
NanoICP-MS: a new statistical and interactive web
application for the processing, visualization and
analysis of nanoparticles suspensions using
single particle ICP-MS measurements
Bryan Calderón-Jiméneza,b,c*, Gabriel F. Sarmanho*d, Ingo H. Strengea , Monique E.
Johnsona, Antonio R. Montoro Bustosa, Sara Stoudte, Antonio Possolof, José R. Vega-
Baudritg, Karen E. Murphya
Abstract:
This section includes additional information of instrumental parameter used to perform spICP-
MS measurements, illustration of the app features and illustration of how Huber`s algorithm
works.
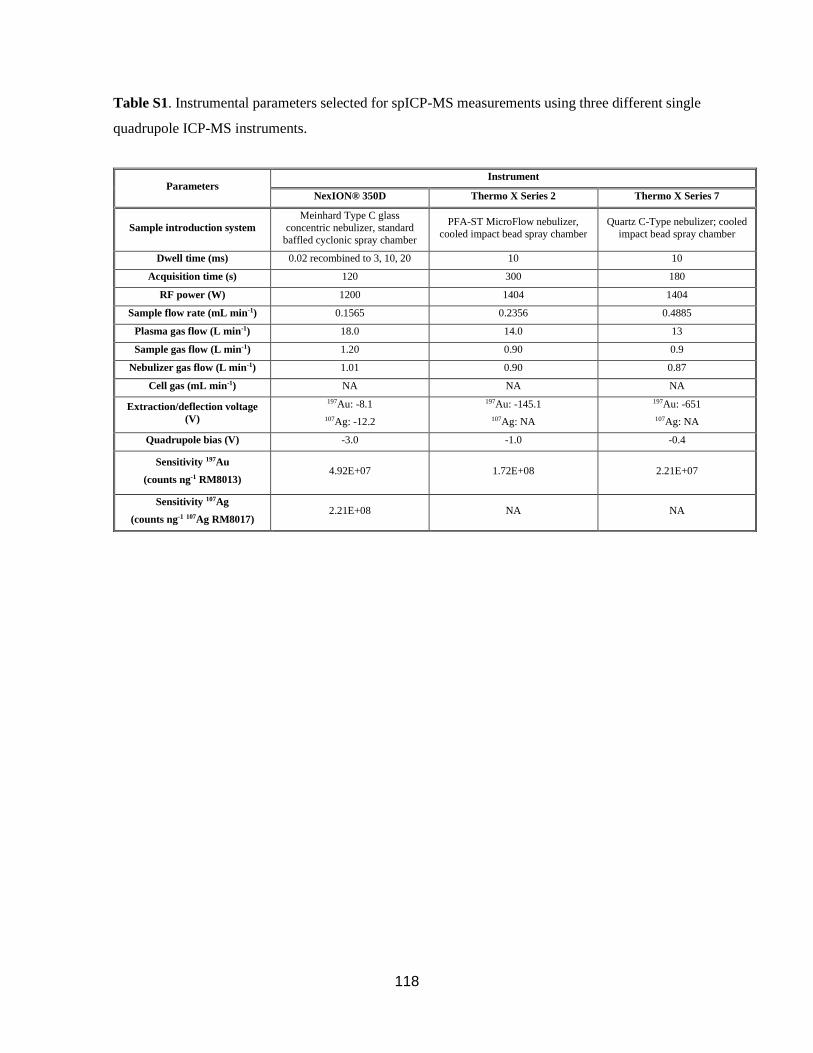
118
Table S1. Instrumental parameters selected for spICP-MS measurements using three different single
quadrupole ICP-MS instruments.
Parameters Instrument
NexION® 350D Thermo X Series 2 Thermo X Series 7
Sample introduction system
Meinhard Type C glass
concentric nebulizer, standard
baffled cyclonic spray chamber
PFA-ST MicroFlow nebulizer,
cooled impact bead spray chamber
Quartz C-Type nebulizer; cooled
impact bead spray chamber
Dwell time (ms) 0.02 recombined to 3, 10, 20 10 10
Acquisition time (s) 120 300 180
RF power (W) 1200 1404 1404
Sample flow rate (mL min-1) 0.1565 0.2356 0.4885
Plasma gas flow (L min-1) 18.0 14.0 13
Sample gas flow (L min-1) 1.20 0.90 0.9
Nebulizer gas flow (L min-1) 1.01 0.90 0.87
Cell gas (mL min-1) NA NA NA
Extraction/deflection voltage
(V)
197Au: -8.1
107Ag: -12.2
197Au: -145.1
107Ag: NA
197Au: -651
107Ag: NA
Quadrupole bias (V) -3.0 -1.0 -0.4
Sensitivity 197Au
(counts ng-1 RM8013) 4.92E+07 1.72E+08 2.21E+07
Sensitivity 107Ag
(counts ng-1 107Ag RM8017) 2.21E+08 NA NA
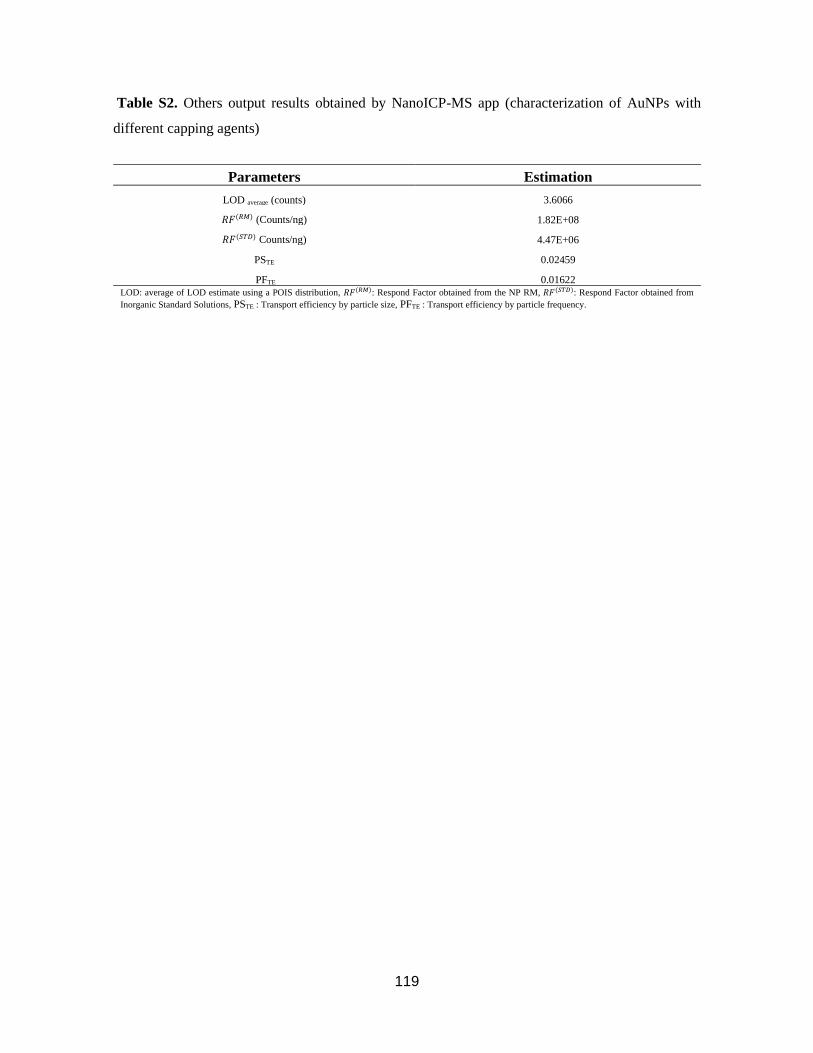
119
Table S2. Others output results obtained by NanoICP-MS app (characterization of AuNPs with
different capping agents)
Parameters Estimation
LOD average (counts) 3.6066
𝑅𝐹(𝑅𝑀) (Counts/ng) 1.82E+08
𝑅𝐹(𝑆𝑇𝐷) Counts/ng) 4.47E+06
PSTE 0.02459
PFTE 0.01622
LOD: average of LOD estimate using a POIS distribution, 𝑅𝐹(𝑅𝑀): Respond Factor obtained from the NP RM, 𝑅𝐹(𝑆𝑇𝐷): Respond Factor obtained from
Inorganic Standard Solutions, PSTE : Transport efficiency by particle size, PFTE : Transport efficiency by particle frequency.
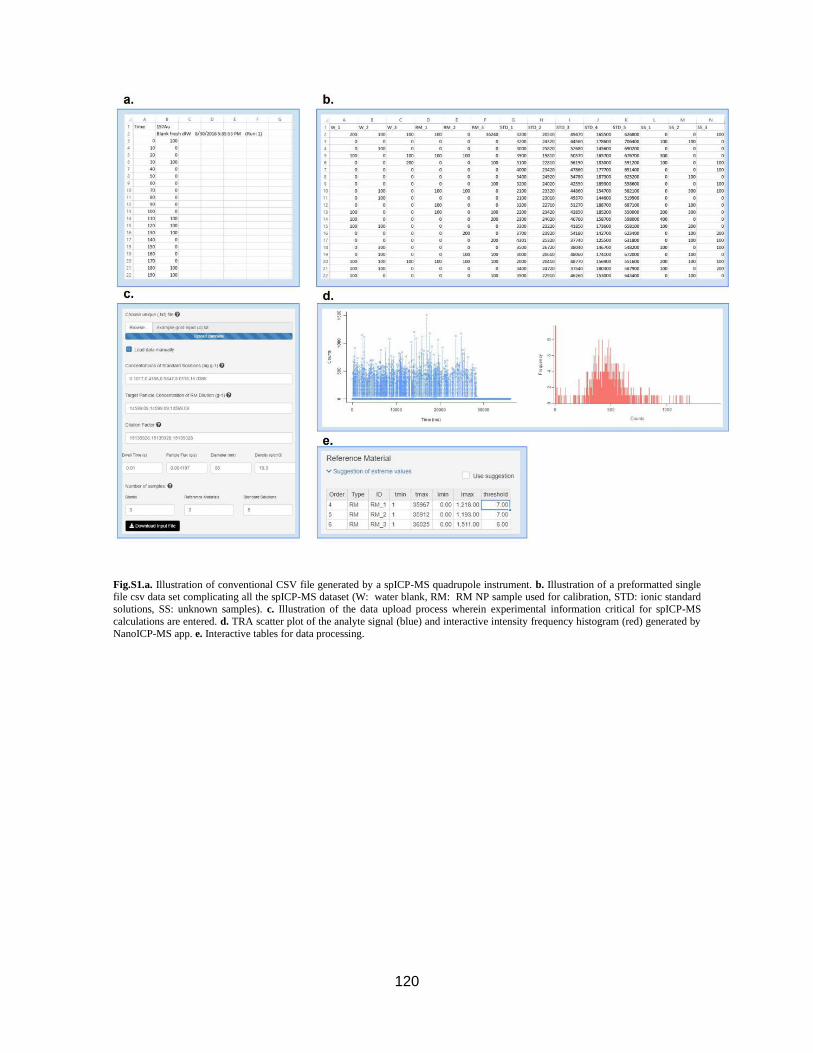
120
Fig.S1.a. Illustration of conventional CSV file generated by a spICP-MS quadrupole instrument. b. Illustration of a preformatted single file csv data set complicating all the spICP-MS dataset (W: water blank, RM: RM NP sample used for calibration, STD: ionic standard
solutions, SS: unknown samples). c. Illustration of the data upload process wherein experimental information critical for spICP-MS
calculations are entered. d. TRA scatter plot of the analyte signal (blue) and interactive intensity frequency histogram (red) generated by
NanoICP-MS app. e. Interactive tables for data processing.
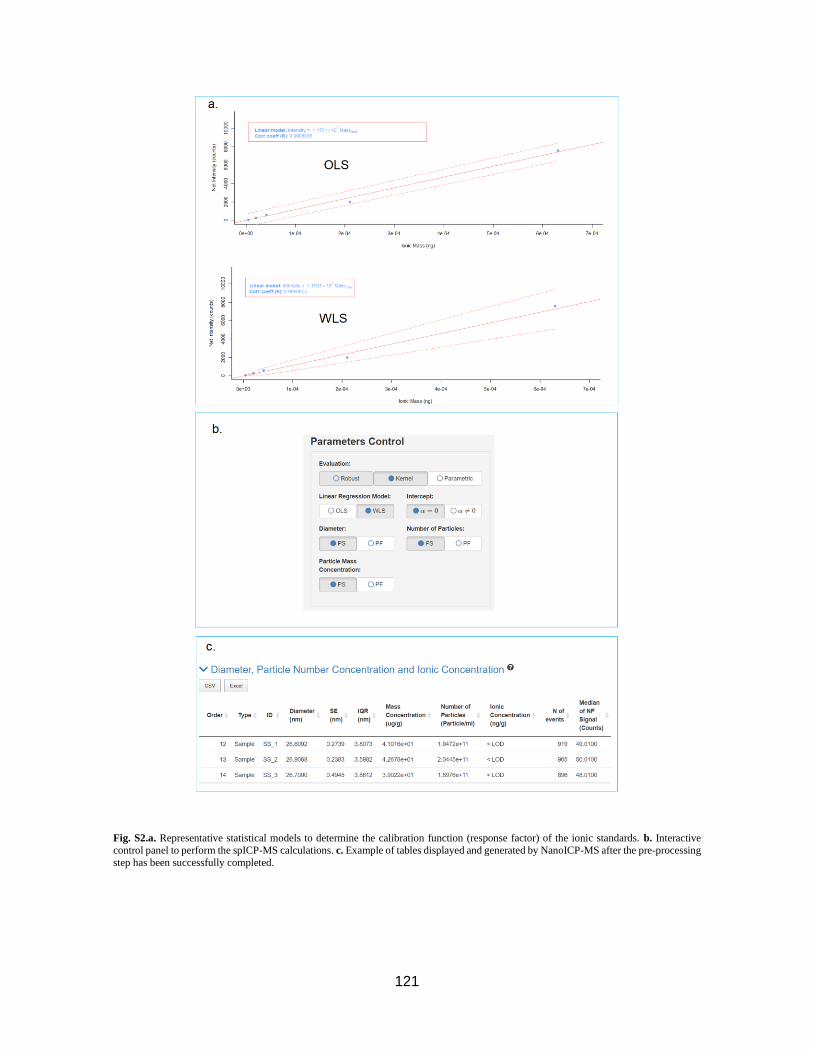
121
Fig. S2.a. Representative statistical models to determine the calibration function (response factor) of the ionic standards. b. Interactive
control panel to perform the spICP-MS calculations. c. Example of tables displayed and generated by NanoICP-MS after the pre-processing
step has been successfully completed.
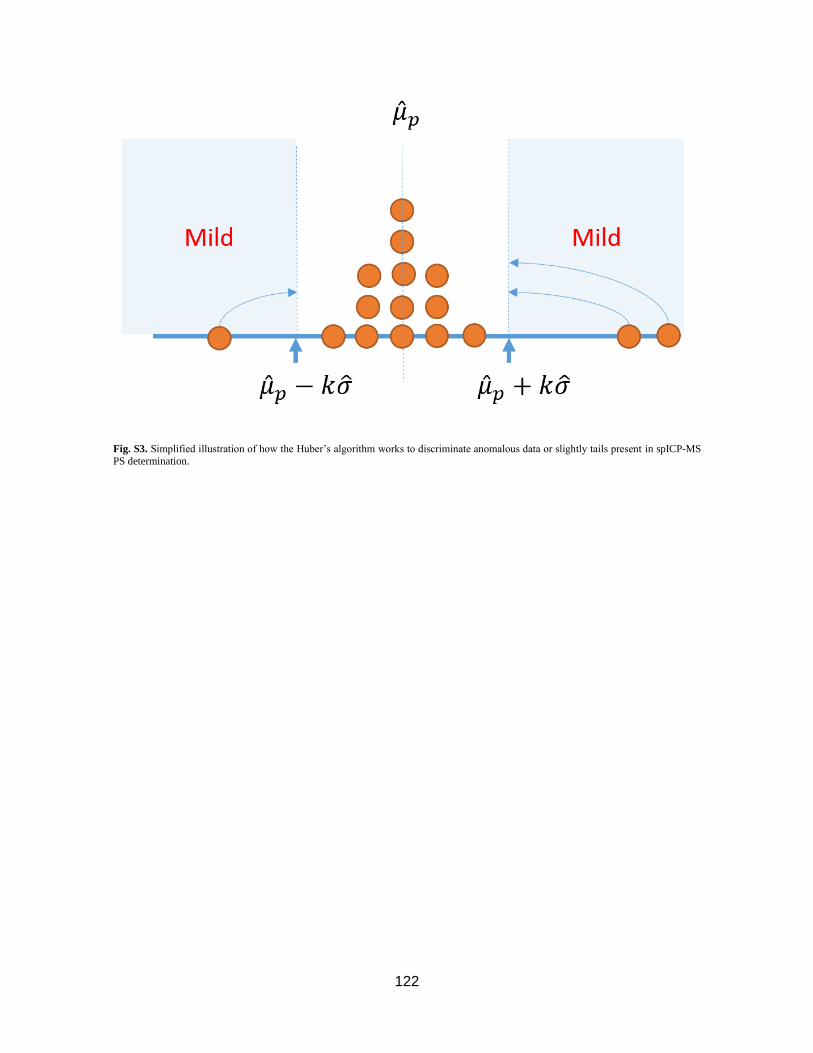
122
Fig. S3. Simplified illustration of how the Huber’s algorithm works to discriminate anomalous data or slightly tails present in spICP-MS
PS determination.
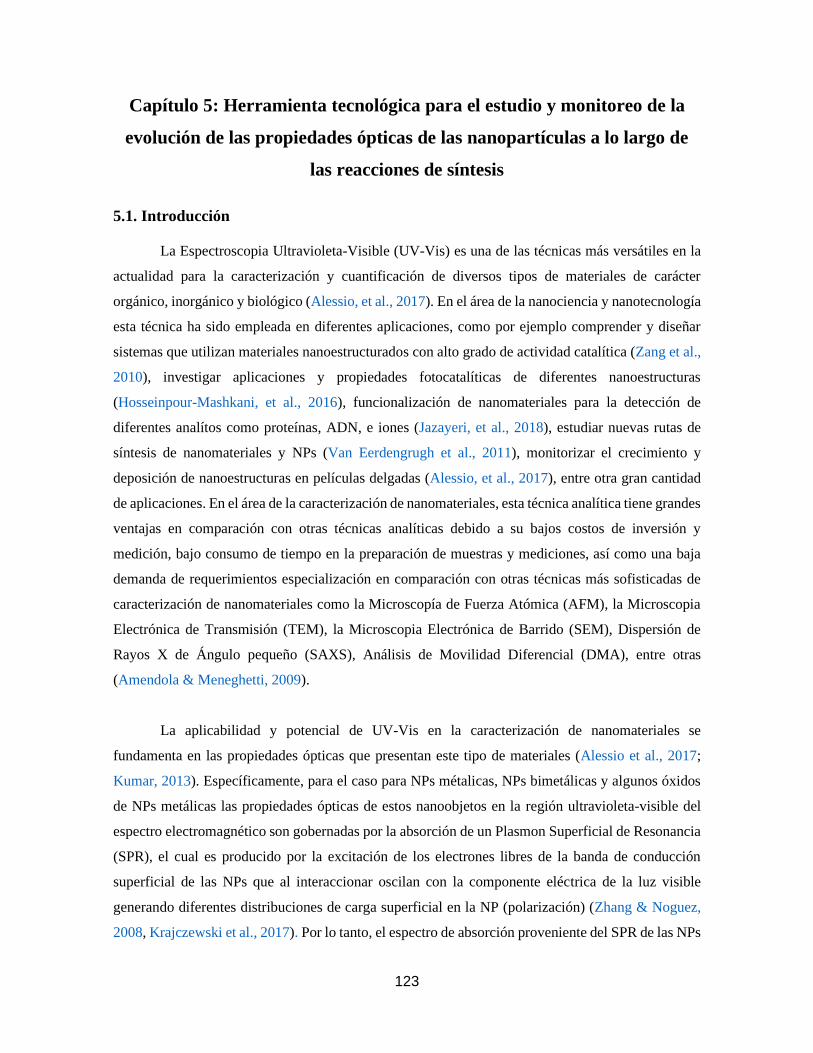
123
Capítulo 5: Herramienta tecnológica para el estudio y monitoreo de la
evolución de las propiedades ópticas de las nanopartículas a lo largo de
las reacciones de síntesis
5.1. Introducción
La Espectroscopia Ultravioleta-Visible (UV-Vis) es una de las técnicas más versátiles en la
actualidad para la caracterización y cuantificación de diversos tipos de materiales de carácter
orgánico, inorgánico y biológico (Alessio, et al., 2017). En el área de la nanociencia y nanotecnología
esta técnica ha sido empleada en diferentes aplicaciones, como por ejemplo comprender y diseñar
sistemas que utilizan materiales nanoestructurados con alto grado de actividad catalítica (Zang et al.,
2010), investigar aplicaciones y propiedades fotocatalíticas de diferentes nanoestructuras
(Hosseinpour-Mashkani, et al., 2016), funcionalización de nanomateriales para la detección de
diferentes analítos como proteínas, ADN, e iones (Jazayeri, et al., 2018), estudiar nuevas rutas de
síntesis de nanomateriales y NPs (Van Eerdengrugh et al., 2011), monitorizar el crecimiento y
deposición de nanoestructuras en películas delgadas (Alessio, et al., 2017), entre otra gran cantidad
de aplicaciones. En el área de la caracterización de nanomateriales, esta técnica analítica tiene grandes
ventajas en comparación con otras técnicas analíticas debido a su bajos costos de inversión y
medición, bajo consumo de tiempo en la preparación de muestras y mediciones, así como una baja
demanda de requerimientos especialización en comparación con otras técnicas más sofisticadas de
caracterización de nanomateriales como la Microscopía de Fuerza Atómica (AFM), la Microscopia
Electrónica de Transmisión (TEM), la Microscopia Electrónica de Barrido (SEM), Dispersión de
Rayos X de Ángulo pequeño (SAXS), Análisis de Movilidad Diferencial (DMA), entre otras
(Amendola & Meneghetti, 2009).
La aplicabilidad y potencial de UV-Vis en la caracterización de nanomateriales se
fundamenta en las propiedades ópticas que presentan este tipo de materiales (Alessio et al., 2017;
Kumar, 2013). Específicamente, para el caso para NPs métalicas, NPs bimetálicas y algunos óxidos
de NPs metálicas las propiedades ópticas de estos nanoobjetos en la región ultravioleta-visible del
espectro electromagnético son gobernadas por la absorción de un Plasmon Superficial de Resonancia
(SPR), el cual es producido por la excitación de los electrones libres de la banda de conducción
superficial de las NPs que al interaccionar oscilan con la componente eléctrica de la luz visible
generando diferentes distribuciones de carga superficial en la NP (polarización) (Zhang & Noguez,
2008, Krajczewski et al., 2017). Por lo tanto, el espectro de absorción proveniente del SPR de las NPs
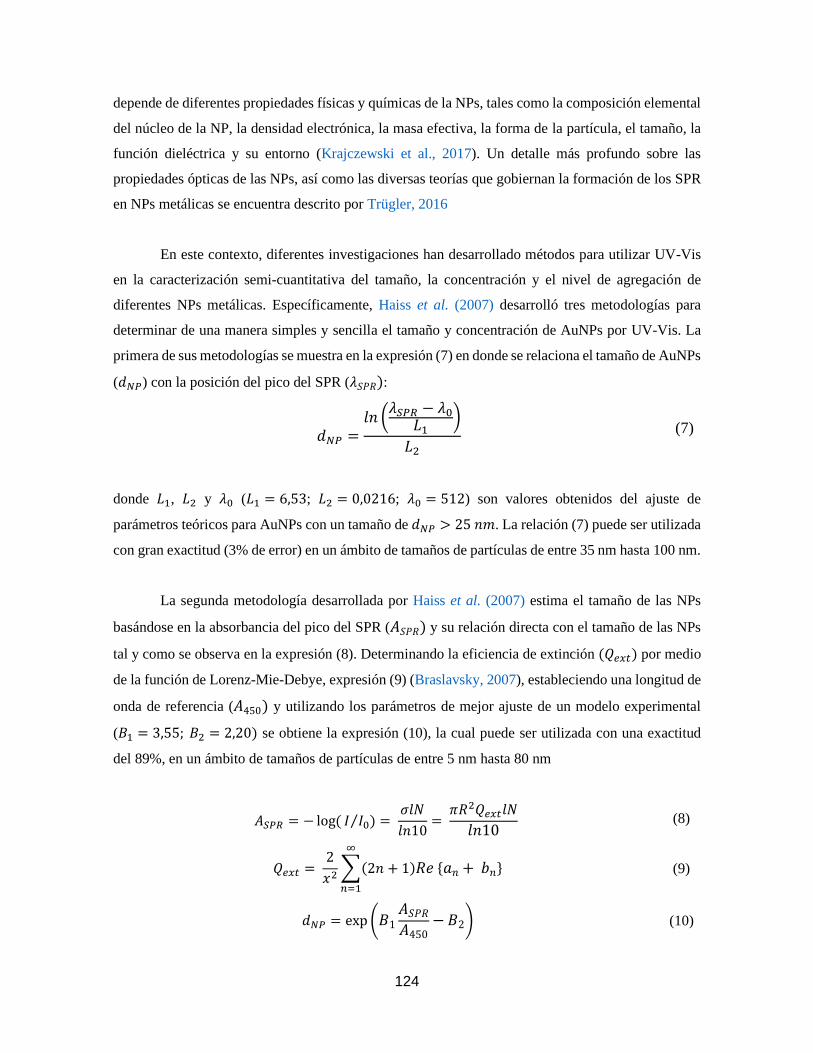
124
depende de diferentes propiedades físicas y químicas de la NPs, tales como la composición elemental
del núcleo de la NP, la densidad electrónica, la masa efectiva, la forma de la partícula, el tamaño, la
función dieléctrica y su entorno (Krajczewski et al., 2017). Un detalle más profundo sobre las
propiedades ópticas de las NPs, así como las diversas teorías que gobiernan la formación de los SPR
en NPs metálicas se encuentra descrito por Trügler, 2016
En este contexto, diferentes investigaciones han desarrollado métodos para utilizar UV-Vis
en la caracterización semi-cuantitativa del tamaño, la concentración y el nivel de agregación de
diferentes NPs metálicas. Específicamente, Haiss et al. (2007) desarrolló tres metodologías para
determinar de una manera simples y sencilla el tamaño y concentración de AuNPs por UV-Vis. La
primera de sus metodologías se muestra en la expresión (7) en donde se relaciona el tamaño de AuNPs
(𝑑𝑁𝑃) con la posición del pico del SPR (𝜆𝑆𝑃𝑅):
𝑑𝑁𝑃 =𝑙𝑛 (
𝜆𝑆𝑃𝑅 − 𝜆0𝐿1
)
𝐿2 (7)
donde 𝐿1, 𝐿2 y 𝜆0 (𝐿1 = 6,53; 𝐿2 = 0,0216; 𝜆0 = 512) son valores obtenidos del ajuste de
parámetros teóricos para AuNPs con un tamaño de 𝑑𝑁𝑃 > 25 𝑛𝑚. La relación (7) puede ser utilizada
con gran exactitud (3% de error) en un ámbito de tamaños de partículas de entre 35 nm hasta 100 nm.
La segunda metodología desarrollada por Haiss et al. (2007) estima el tamaño de las NPs
basándose en la absorbancia del pico del SPR (𝐴𝑆𝑃𝑅) y su relación directa con el tamaño de las NPs
tal y como se observa en la expresión (8). Determinando la eficiencia de extinción (𝑄𝑒𝑥𝑡) por medio
de la función de Lorenz-Mie-Debye, expresión (9) (Braslavsky, 2007), estableciendo una longitud de
onda de referencia (𝐴450) y utilizando los parámetros de mejor ajuste de un modelo experimental
(𝐵1 = 3,55; 𝐵2 = 2,20) se obtiene la expresión (10), la cual puede ser utilizada con una exactitud
del 89%, en un ámbito de tamaños de partículas de entre 5 nm hasta 80 nm
𝐴𝑆𝑃𝑅 = − log( 𝐼 𝐼0⁄ ) = 𝜎𝑙𝑁
𝑙𝑛10= 𝜋𝑅2𝑄𝑒𝑥𝑡𝑙𝑁
𝑙𝑛10 (8)
𝑄𝑒𝑥𝑡 = 2
𝑥2∑(2𝑛 + 1)𝑅𝑒 {𝑎𝑛 + 𝑏𝑛}
∞
𝑛=1
(9)
𝑑𝑁𝑃 = exp (𝐵1𝐴𝑆𝑃𝑅𝐴450
−𝐵2) (10)
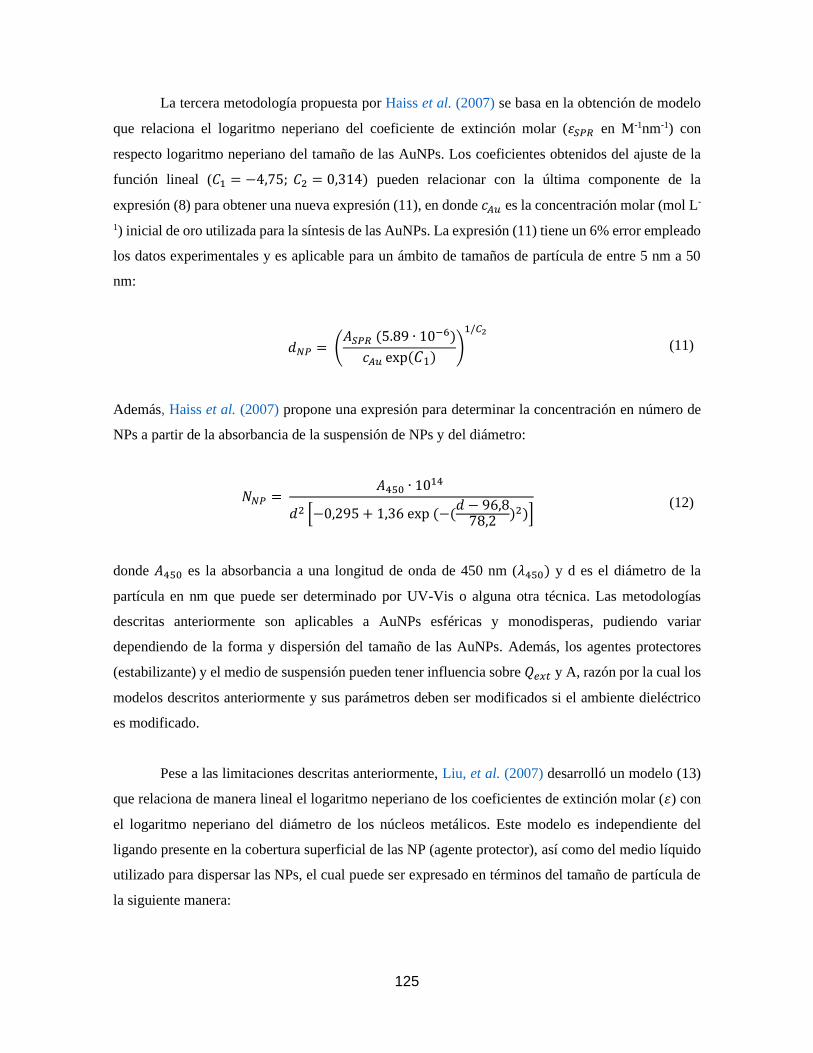
125
La tercera metodología propuesta por Haiss et al. (2007) se basa en la obtención de modelo
que relaciona el logaritmo neperiano del coeficiente de extinción molar (휀𝑆𝑃𝑅 en M-1nm-1) con
respecto logaritmo neperiano del tamaño de las AuNPs. Los coeficientes obtenidos del ajuste de la
función lineal (𝐶1 = −4,75; 𝐶2 = 0,314) pueden relacionar con la última componente de la
expresión (8) para obtener una nueva expresión (11), en donde 𝑐𝐴𝑢 es la concentración molar (mol L-
1) inicial de oro utilizada para la síntesis de las AuNPs. La expresión (11) tiene un 6% error empleado
los datos experimentales y es aplicable para un ámbito de tamaños de partícula de entre 5 nm a 50
nm:
𝑑𝑁𝑃 = (𝐴𝑆𝑃𝑅 (5.89 ∙ 10
−6)
𝑐𝐴𝑢 exp(𝐶1))
1/𝐶2
(11)
Además, Haiss et al. (2007) propone una expresión para determinar la concentración en número de
NPs a partir de la absorbancia de la suspensión de NPs y del diámetro:
𝑁𝑁𝑃 = 𝐴450 ∙ 10
14
𝑑2 [−0,295 + 1,36 exp (−(𝑑 − 96,878,2
)2)] (12)
donde 𝐴450 es la absorbancia a una longitud de onda de 450 nm (𝜆450) y d es el diámetro de la
partícula en nm que puede ser determinado por UV-Vis o alguna otra técnica. Las metodologías
descritas anteriormente son aplicables a AuNPs esféricas y monodisperas, pudiendo variar
dependiendo de la forma y dispersión del tamaño de las AuNPs. Además, los agentes protectores
(estabilizante) y el medio de suspensión pueden tener influencia sobre 𝑄𝑒𝑥𝑡 y A, razón por la cual los
modelos descritos anteriormente y sus parámetros deben ser modificados si el ambiente dieléctrico
es modificado.
Pese a las limitaciones descritas anteriormente, Liu, et al. (2007) desarrolló un modelo (13)
que relaciona de manera lineal el logaritmo neperiano de los coeficientes de extinción molar (휀) con
el logaritmo neperiano del diámetro de los núcleos metálicos. Este modelo es independiente del
ligando presente en la cobertura superficial de las NP (agente protector), así como del medio líquido
utilizado para dispersar las NPs, el cual puede ser expresado en términos del tamaño de partícula de
la siguiente manera:
126
𝑑𝑁𝑃 = 𝑒𝑥𝑝 (ln(휀) − 𝑎
𝑘) (13)
En la expresión (13) k y a (𝑘 = 3.32111; 𝑎 = 10.80505) son los coeficientes obtenidos del ajuste
de la función lineal, 휀 es el coeficiente de extinción expresado en M-1cm-1, 𝑑𝑁𝑃 es el diámetro del
núcleo metálico de las NPs en nm. Esta expresión puede ser utilizada en conjunto con la expresión
de la Ley de Beer-Lambert (𝐴 = 휀𝑐𝑙) (Braslavsky et al., 2007) para determinar la concentración de
partículas (Liu, et al. 2007).
Por otra parte, Doak et al. (2010) desarrollaron una modificación de la expresión (8) donde
se contempla el efecto de la distribución de tamaños de partículas sobre el SPR de AuNPs. Para
contemplar dicho efecto utilizó una combinación ponderada, 𝑊(𝑅𝑖), del espectro de absorbancia de
diversos tamaños de partícula, tal y como se muestra en la siguiente expresión (14)
𝐴𝑆𝑃𝑅 = 𝜋𝑙𝑁
𝑙𝑛10∑𝑅2𝑄𝑒𝑥𝑡(𝑅𝑖
2)𝑊(𝑅𝑖)
𝑛
𝑖=1
(14)
Con este método de simulación UV-Vis es posible estudiar el efecto de la aglomeración en
suspensiones de NPs al comparar los espectros experimentales con los obtenidos por medio de
simulación. De manera similar, Amendola & Meneghetti (2009) propusieron un método para poder
modelar y estudiar el tamaño de partícula, la concentración y el nivel de agregación de AuNPs no
esféricas por medio de UV-Vis. En su metodología se propone el uso del modelo Mie-Gans, el cual
es una extensión de la función de Lorenz-Mie-Debye que contempla la contribución de NPs con
formas esferoidales.
En el caso de las propiedades ópticas de AgNPs, diversas investigaciones se han realizado
para poder utilizar UV-Vis en los procesos de caracterización de este tipo de nanoobjetos. Doremus,
(1964) propone una expresión para determinar el coeficiente de absorción (𝛼 = 𝑎 ln 10 =
𝐴
𝑙 ln10) contemplando la constante dieléctrica de la NP metálica (15). La expresión (15) genera una
banda de forma Lorentziana de ancho (w) como se puede apreciar en la expresión (16). Relacionando
la definición de conductividad eléctrica (17), descrita por Doyle (1958) con la expresión (16) se
obtiene una nueva expresión (18) para determinar el tamaño de AgNPs a partir la determinación la
anchura a media altura (FWHM) del SPR representado en términos de su coeficiente de absorción.
El modelo anterior es aplicable para tamaños de partículas ≥ 10 nm y puede ser utilizado tambien
para AuNPs.
127
𝛼 = 9𝜋𝑝𝑛𝑑
3𝑐
𝜎
𝜆2
(𝜆𝑚2 − 𝜆2)2 + 𝜆2𝜆𝑚
4 𝜆𝑎2; 𝜆𝑚 = 𝜆𝑐(휀0 + 2𝑛𝑑
2)1/2; 𝜆𝑐 =(2𝜋𝑐)2𝑚
4𝜋𝑁𝑒휀𝑚2; 𝜆𝑎 =
2𝜆𝑐2𝜎
𝑐 (15)
𝜔 = 𝜆𝑚
2
𝜆𝑎=(휀0 + 2𝑛𝑑
2)𝑐
2𝜎= 𝐹𝑊𝐻𝑀 (16)
𝜎 = (𝑁𝑒𝑒2𝑅)/𝑚𝑢𝐹 (17)
𝑑𝑁𝑃 =(휀0 + 2𝑛𝑑
2)𝑐𝑚𝑢𝐹𝜔𝑁𝑒𝑒
2 (18)
Por otra parte, Paramelle et al. (2014) establece como determinar el tamaño y concentración
de AgNPs por medio de UV-Vis. Para esto desarrolla un método y modelo (19) en donde se relaciona
el 𝜆𝑆𝑃𝑅 con el tamaño de AgNPs. Este modelo es aplicable para tamaños de AgNPs que van de 20
nm hasta 100 nm.
𝑑𝑁𝑃 = √𝜆𝑆𝑃𝑅 − 𝑎
𝑏 (19)
Además, a partir de la obtención de los coeficientes de extinción molar de diversos tamaños
de AgNPs, esta investigación propone otros dos métodos para determinar el tamaño de partícula a
partir de esta magnitud espectroquímica. El primer modelo consiste en un modelo exponencial para
tamaños de partícula que van de los 10 nm hasta los 30 nm (16). El segundo modelo consiste en una
expresión lineal para tamaños de partícula que van de los 30 nm hasta los 100 nm (17), como se
muestra a continuación:
𝑑𝑁𝑃 =𝑙𝑛 (
휀 − 휀0𝐴 )
𝑅 (16)
𝑑𝑁𝑃 =휀 − 휀0𝑘
(17)
Finalmente, conociendo el paso de luz de la celda espectrofotométrica, Paramelle et al. (2014)
propone que la determinación de la concentración de AgNPs se puede realizar de manera no
destructiva a partir de la absorbancia de la muestra (𝐶 = 𝐴/휀𝑙).
Todo lo anterior demuestra algunos de los avances teóricos y experimentales para la
caracterización de NPs metálicas mediante UV-Vis. Sin embargo, pese a lo promisorio de estos
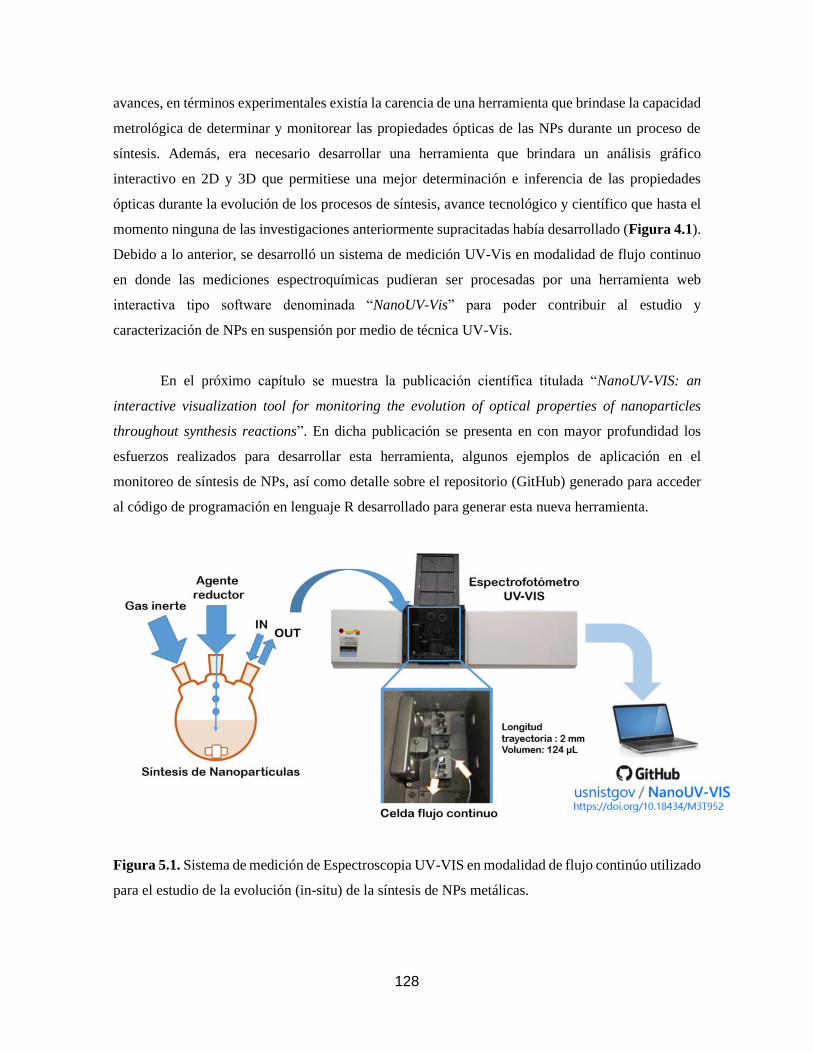
128
avances, en términos experimentales existía la carencia de una herramienta que brindase la capacidad
metrológica de determinar y monitorear las propiedades ópticas de las NPs durante un proceso de
síntesis. Además, era necesario desarrollar una herramienta que brindara un análisis gráfico
interactivo en 2D y 3D que permitiese una mejor determinación e inferencia de las propiedades
ópticas durante la evolución de los procesos de síntesis, avance tecnológico y científico que hasta el
momento ninguna de las investigaciones anteriormente supracitadas había desarrollado (Figura 4.1).
Debido a lo anterior, se desarrolló un sistema de medición UV-Vis en modalidad de flujo continuo
en donde las mediciones espectroquímicas pudieran ser procesadas por una herramienta web
interactiva tipo software denominada “NanoUV-Vis” para poder contribuir al estudio y
caracterización de NPs en suspensión por medio de técnica UV-Vis.
En el próximo capítulo se muestra la publicación científica titulada “NanoUV-VIS: an
interactive visualization tool for monitoring the evolution of optical properties of nanoparticles
throughout synthesis reactions”. En dicha publicación se presenta en con mayor profundidad los
esfuerzos realizados para desarrollar esta herramienta, algunos ejemplos de aplicación en el
monitoreo de síntesis de NPs, así como detalle sobre el repositorio (GitHub) generado para acceder
al código de programación en lenguaje R desarrollado para generar esta nueva herramienta.
Figura 5.1. Sistema de medición de Espectroscopia UV-VIS en modalidad de flujo continúo utilizado
para el estudio de la evolución (in-situ) de la síntesis de NPs metálicas.
129
5.2. NanoUV-VIS: an interactive visualization tool for monitoring the evolution of
optical properties of nanoparticles throughout synthesis reactions
Artículo 3. Basado en el artículo y software publicado en la revista Journal of
Research of National Institute of Standards and Technology (NIST), 122, 37 (2017)
https://doi.org/10.6028/jres.122.037
Bryan Calderón-Jiménez*, Gabriel F. Sarmanho, Karen E. Murphy, Antonio R. Montoro
Bustos and José R. Vega-Baudrit
130
NanoUV-VIS: an interactive visualization tool for
monitoring the evolution of optical properties of
nanoparticles throughout synthesis reactions
Bryan Calderon-Jimenez1,2, Gabriel F. Sarmanho1,3, Karen E. Murphy1, Antonio R. Montoro
Bustos1 and Jose R. Vega-Baudrit4
1National Institute of Standards and Technology,
Gaithersburg, MD 20899
2Costa Rican Metrology
Laboratory, San Jose, 1736-11501,
CR
3National Institute of Metrology, Quality and
Technology, Duque de Caxias, Rio de Janeiro, 2679-
9001, BR
4National Laboratory of Nanotechnology,
San Jose, 1174-1200, CR
[email protected] / [email protected]
[email protected] / [email protected]
Software DOI: https://doi.org/10.18434/M3T952
Software Version: 1.0
Key words: 2D spectrum; 3D spectrum; Full Width at Half Maximum; maximum optical absorbance; nanoparticles;
Surface Plasmon Resonance Peak; Ultraviolet/Visible Spectroscopy.
Accepted: September 6, 2017
Published: September 20, 2017JRes
https://doi.org/10.6028/jres.122.037
131
1. Summary
Engineered nanoparticles (NPs) are being used for a broad array of high technology
applications including sensing, imaging, targeted drug delivery, bio-diagnostics, catalysis,
optoelectronics and film growth seeding. [1, 2]. The enhanced optical, electrical and catalytic
properties of metal NPs are strongly correlated with their size, shape, and structure [3]. As such,
physicochemical characterization of NPs is critically important to ensure their effective use and
applicability. In this context, ultraviolet-visible spectroscopy (UV-VIS) is one of the most widely
used methods for measuring the optical properties and electronic structures of NPs [4]. UV-VIS
absorption bands are related to important properties such as the diameter [5], shape [2], and
polydispersion [6] of metallic and semiconductor NPs. Thus, this analytical technique is used during
NP synthesis to monitor NP formation, to assess suspension stability under different conditions and
media [7, 8], and to establish the optical properties of the newly formed nanomaterials [9].
In view of the extensive use of UV-VIS for NP characterization and monitoring of NP formation
during synthesis reactions, we developed NanoUV-VIS, an interactive web application designed for
the analysis of multiple UV-VIS absorbance spectra measured as a function of time. Graphical
visualizations of the data in two dimensions (spectrum plot, contourplot) and three dimensions
(surface plot) are created by this tool. In addition, the NanoUV-VIS tool evaluates and estimates
important parameters related to the absorption bands of NPs, including maximum optical absorbance,
surface plasmon resonance (SPR) peak, and the full width at half maximum (FWHM) of the UV-VIS
spectra. This information is available to download as a table in the software, as well as in the form of
interactive plots, where the scientist can compare the behavior of these parameters in order to better
interpret the outcomes of the experiment.
Though NanoUV-VIS was designed to visualize NP synthesis, this tool can be used for a wide range
of other applications in nanotechnology and nanoscience, such as the assessment of suspension
stability, the investigation of the influence of coating agents on the NP optical properties, and the
monitoring of seed-mediated NP synthesis, among others. Moreover, this data analysis and
visualization tool can be extended to other fields beyond nanotechnology in which spectrochemical
analysis by UV-VIS plays an important role.
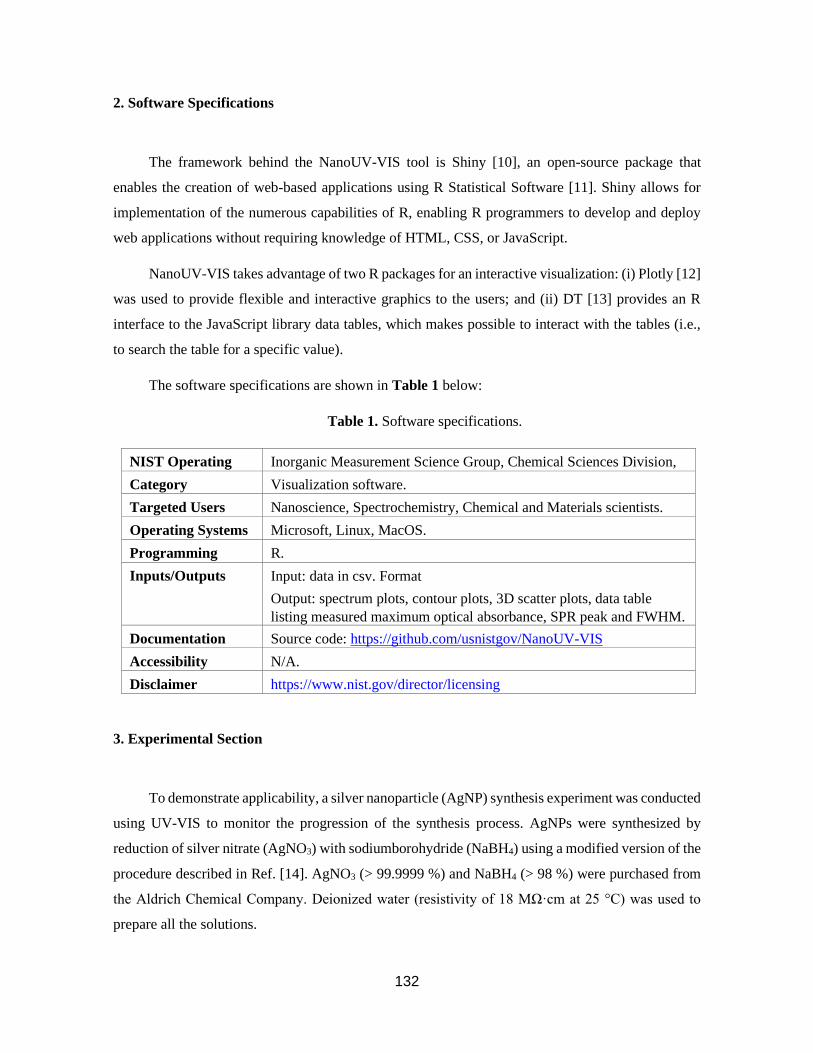
132
2. Software Specifications
The framework behind the NanoUV-VIS tool is Shiny [10], an open-source package that
enables the creation of web-based applications using R Statistical Software [11]. Shiny allows for
implementation of the numerous capabilities of R, enabling R programmers to develop and deploy
web applications without requiring knowledge of HTML, CSS, or JavaScript.
NanoUV-VIS takes advantage of two R packages for an interactive visualization: (i) Plotly [12]
was used to provide flexible and interactive graphics to the users; and (ii) DT [13] provides an R
interface to the JavaScript library data tables, which makes possible to interact with the tables (i.e.,
to search the table for a specific value).
The software specifications are shown in Table 1 below:
Table 1. Software specifications.
NIST Operating
Unit
Inorganic Measurement Science Group, Chemical Sciences Division,
MML Category Visualization software.
Targeted Users Nanoscience, Spectrochemistry, Chemical and Materials scientists.
Operating Systems Microsoft, Linux, MacOS.
Programming
Language
R.
Inputs/Outputs Input: data in csv. Format
Output: spectrum plots, contour plots, 3D scatter plots, data table
listing measured maximum optical absorbance, SPR peak and FWHM.
Documentation Source code: https://github.com/usnistgov/NanoUV-VIS
Accessibility N/A.
Disclaimer https://www.nist.gov/director/licensing
3. Experimental Section
To demonstrate applicability, a silver nanoparticle (AgNP) synthesis experiment was conducted
using UV-VIS to monitor the progression of the synthesis process. AgNPs were synthesized by
reduction of silver nitrate (AgNO3) with sodiumborohydride (NaBH4) using a modified version of the
procedure described in Ref. [14]. AgNO3 (> 99.9999 %) and NaBH4 (> 98 %) were purchased from
the Aldrich Chemical Company. Deionized water (resistivity of 18 MΩ·cm at 25 °C) was used to
prepare all the solutions.
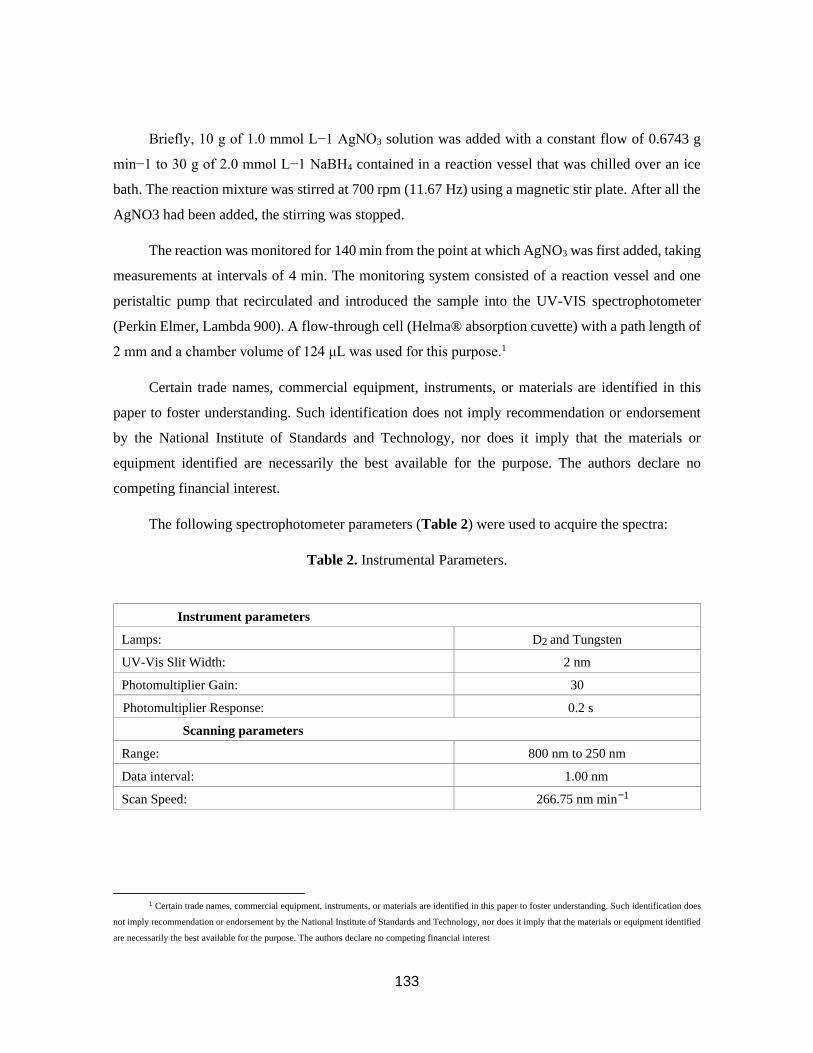
133
Briefly, 10 g of 1.0 mmol L−1 AgNO3 solution was added with a constant flow of 0.6743 g
min−1 to 30 g of 2.0 mmol L−1 NaBH4 contained in a reaction vessel that was chilled over an ice
bath. The reaction mixture was stirred at 700 rpm (11.67 Hz) using a magnetic stir plate. After all the
AgNO3 had been added, the stirring was stopped.
The reaction was monitored for 140 min from the point at which AgNO3 was first added, taking
measurements at intervals of 4 min. The monitoring system consisted of a reaction vessel and one
peristaltic pump that recirculated and introduced the sample into the UV-VIS spectrophotometer
(Perkin Elmer, Lambda 900). A flow-through cell (Helma® absorption cuvette) with a path length of
2 mm and a chamber volume of 124 μL was used for this purpose.1
Certain trade names, commercial equipment, instruments, or materials are identified in this
paper to foster understanding. Such identification does not imply recommendation or endorsement
by the National Institute of Standards and Technology, nor does it imply that the materials or
equipment identified are necessarily the best available for the purpose. The authors declare no
competing financial interest.
The following spectrophotometer parameters (Table 2) were used to acquire the spectra:
Table 2. Instrumental Parameters.
Instrument parameters
Lamps: D2 and Tungsten
UV-Vis Slit Width: 2 nm
Photomultiplier Gain: 30
Photomultiplier Response: 0.2 s
Scanning parameters
Range: 800 nm to 250 nm
Data interval: 1.00 nm
Scan Speed: 266.75 nm min−1
1 Certain trade names, commercial equipment, instruments, or materials are identified in this paper to foster understanding. Such identification does
not imply recommendation or endorsement by the National Institute of Standards and Technology, nor does it imply that the materials or equipment identified
are necessarily the best available for the purpose. The authors declare no competing financial interest
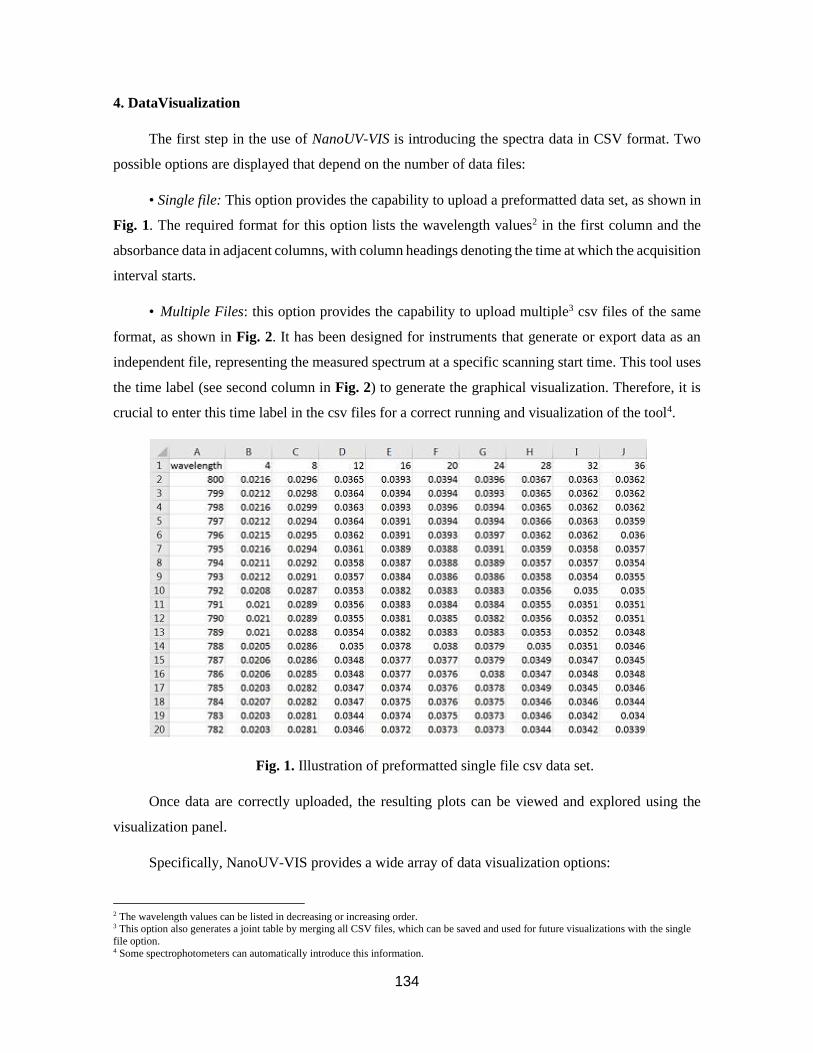
134
4. DataVisualization
The first step in the use of NanoUV-VIS is introducing the spectra data in CSV format. Two
possible options are displayed that depend on the number of data files:
• Single file: This option provides the capability to upload a preformatted data set, as shown in
Fig. 1. The required format for this option lists the wavelength values2 in the first column and the
absorbance data in adjacent columns, with column headings denoting the time at which the acquisition
interval starts.
• Multiple Files: this option provides the capability to upload multiple3 csv files of the same
format, as shown in Fig. 2. It has been designed for instruments that generate or export data as an
independent file, representing the measured spectrum at a specific scanning start time. This tool uses
the time label (see second column in Fig. 2) to generate the graphical visualization. Therefore, it is
crucial to enter this time label in the csv files for a correct running and visualization of the tool4.
Fig. 1. Illustration of preformatted single file csv data set.
Once data are correctly uploaded, the resulting plots can be viewed and explored using the
visualization panel.
Specifically, NanoUV-VIS provides a wide array of data visualization options:
2 The wavelength values can be listed in decreasing or increasing order. 3 This option also generates a joint table by merging all CSV files, which can be saved and used for future visualizations with the single
file option. 4 Some spectrophotometers can automatically introduce this information.
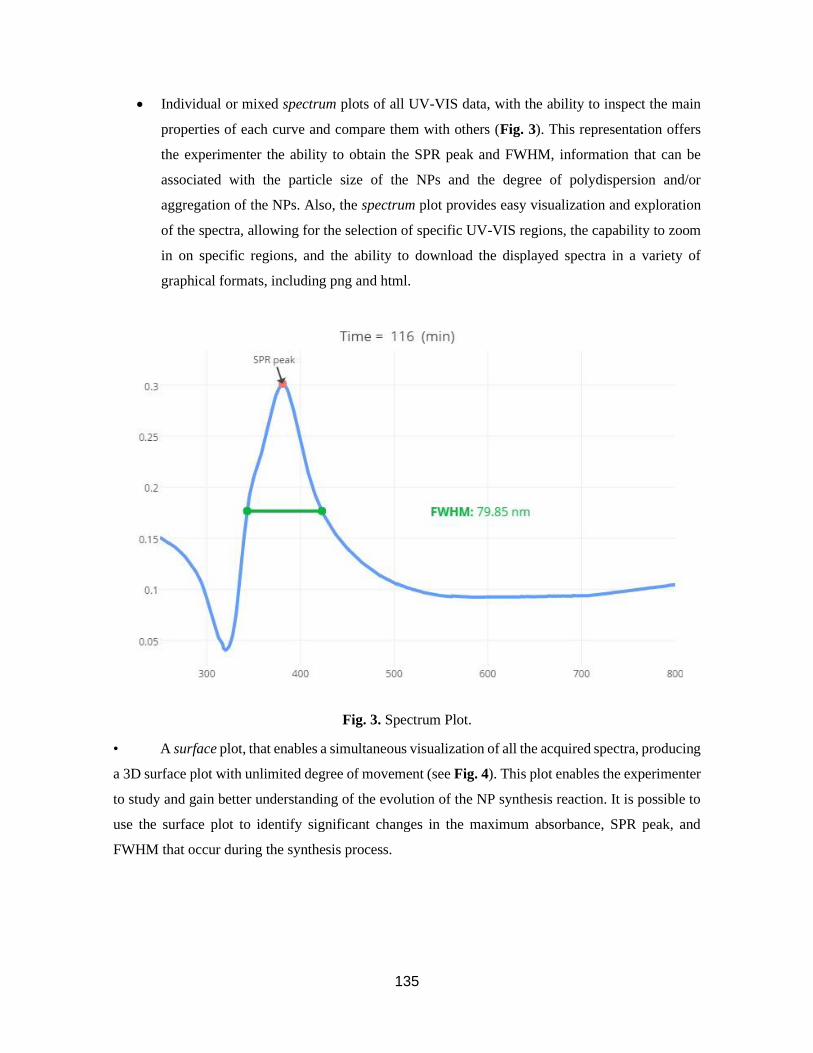
135
• Individual or mixed spectrum plots of all UV-VIS data, with the ability to inspect the main
properties of each curve and compare them with others (Fig. 3). This representation offers
the experimenter the ability to obtain the SPR peak and FWHM, information that can be
associated with the particle size of the NPs and the degree of polydispersion and/or
aggregation of the NPs. Also, the spectrum plot provides easy visualization and exploration
of the spectra, allowing for the selection of specific UV-VIS regions, the capability to zoom
in on specific regions, and the ability to download the displayed spectra in a variety of
graphical formats, including png and html.
Fig. 3. Spectrum Plot.
• A surface plot, that enables a simultaneous visualization of all the acquired spectra, producing
a 3D surface plot with unlimited degree of movement (see Fig. 4). This plot enables the experimenter
to study and gain better understanding of the evolution of the NP synthesis reaction. It is possible to
use the surface plot to identify significant changes in the maximum absorbance, SPR peak, and
FWHM that occur during the synthesis process.
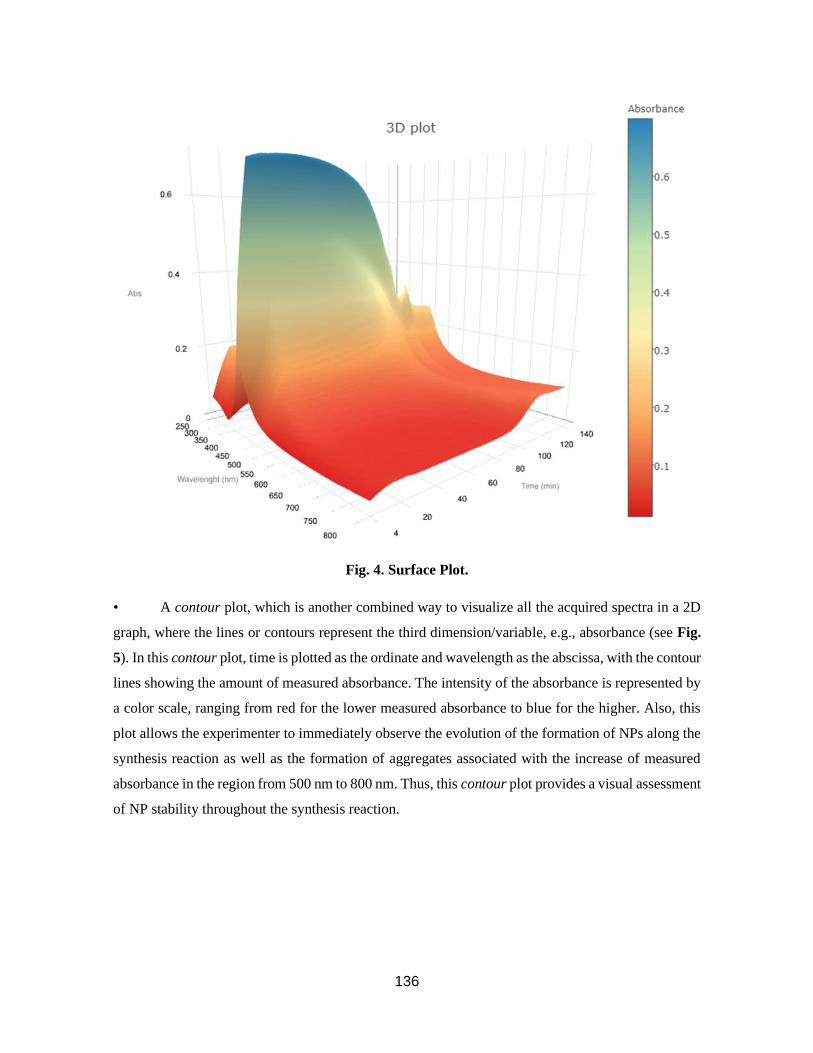
136
Fig. 4. Surface Plot.
• A contour plot, which is another combined way to visualize all the acquired spectra in a 2D
graph, where the lines or contours represent the third dimension/variable, e.g., absorbance (see Fig.
5). In this contour plot, time is plotted as the ordinate and wavelength as the abscissa, with the contour
lines showing the amount of measured absorbance. The intensity of the absorbance is represented by
a color scale, ranging from red for the lower measured absorbance to blue for the higher. Also, this
plot allows the experimenter to immediately observe the evolution of the formation of NPs along the
synthesis reaction as well as the formation of aggregates associated with the increase of measured
absorbance in the region from 500 nm to 800 nm. Thus, this contour plot provides a visual assessment
of NP stability throughout the synthesis reaction.
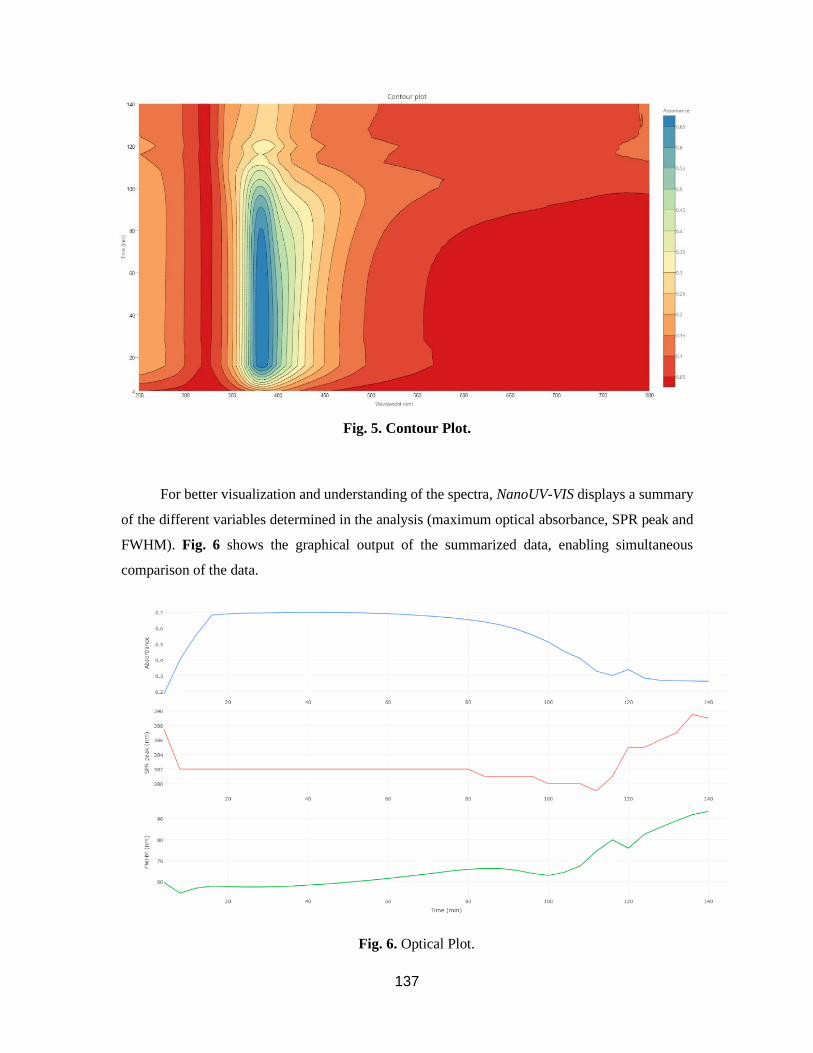
137
Fig. 5. Contour Plot.
For better visualization and understanding of the spectra, NanoUV-VIS displays a summary
of the different variables determined in the analysis (maximum optical absorbance, SPR peak and
FWHM). Fig. 6 shows the graphical output of the summarized data, enabling simultaneous
comparison of the data.
Fig. 6. Optical Plot.
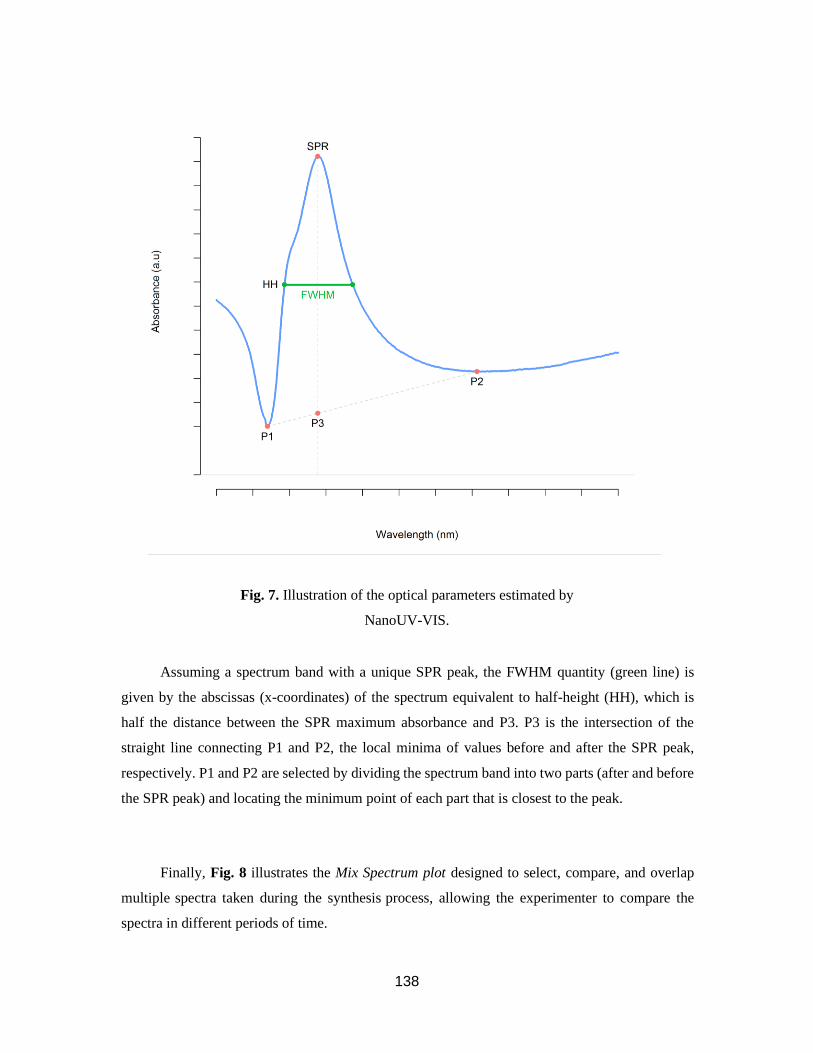
138
Fig. 7. Illustration of the optical parameters estimated by
NanoUV-VIS.
Assuming a spectrum band with a unique SPR peak, the FWHM quantity (green line) is
given by the abscissas (x-coordinates) of the spectrum equivalent to half-height (HH), which is
half the distance between the SPR maximum absorbance and P3. P3 is the intersection of the
straight line connecting P1 and P2, the local minima of values before and after the SPR peak,
respectively. P1 and P2 are selected by dividing the spectrum band into two parts (after and before
the SPR peak) and locating the minimum point of each part that is closest to the peak.
Finally, Fig. 8 illustrates the Mix Spectrum plot designed to select, compare, and overlap
multiple spectra taken during the synthesis process, allowing the experimenter to compare the
spectra in different periods of time.
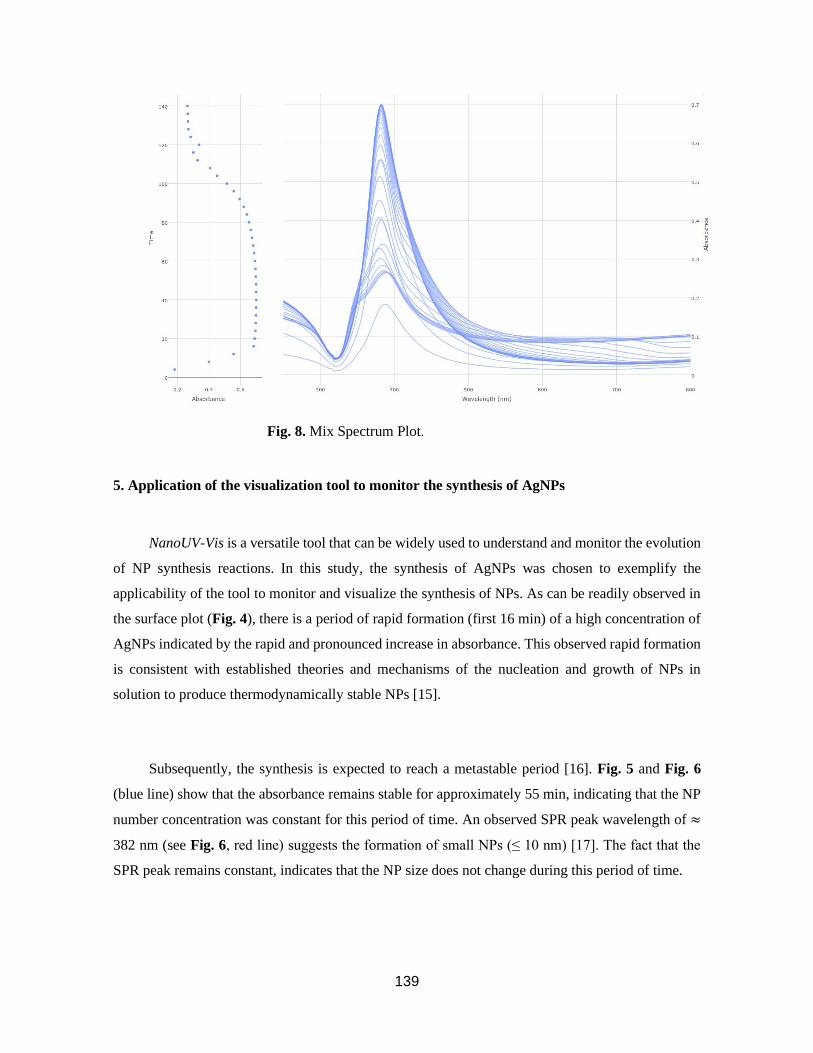
139
Fig. 8. Mix Spectrum Plot.
5. Application of the visualization tool to monitor the synthesis of AgNPs
NanoUV-Vis is a versatile tool that can be widely used to understand and monitor the evolution
of NP synthesis reactions. In this study, the synthesis of AgNPs was chosen to exemplify the
applicability of the tool to monitor and visualize the synthesis of NPs. As can be readily observed in
the surface plot (Fig. 4), there is a period of rapid formation (first 16 min) of a high concentration of
AgNPs indicated by the rapid and pronounced increase in absorbance. This observed rapid formation
is consistent with established theories and mechanisms of the nucleation and growth of NPs in
solution to produce thermodynamically stable NPs [15].
Subsequently, the synthesis is expected to reach a metastable period [16]. Fig. 5 and Fig. 6
(blue line) show that the absorbance remains stable for approximately 55 min, indicating that the NP
number concentration was constant for this period of time. An observed SPR peak wavelength of ≈
382 nm (see Fig. 6, red line) suggests the formation of small NPs (≤ 10 nm) [17]. The fact that the
SPR peak remains constant, indicates that the NP size does not change during this period of time.
140
It is important to note that this synthesis was performed without any steric or electrostatic
stabilizing agent. Thus, the stabilization of the AgNPs comes from the borohydride (BH4-) that has
remained in excess in the reaction medium. As can be seen in Fig. 5 and Fig. 6, after the metastable
period (t > 60 min), there is a decrease in the maximum absorption of the UV-VIS spectra, indicating
a decrease in the AgNP number concentration. This may signal that the remaining BH4- has partially
converted to borate (B(OH)4-), due to the high tendency of BH4
- to be hydrolyzed in water [18]. This
aspect would promote the coalescence or Ostwald ripening of the NPs, thereby producing the
observed decrease in the number concentration. After the synthesis progresses for a period of 120
min, the spectra show a significant increase in the wavelength of the SPR peak and FWHM (see Fig.
6 and Fig. 8), indicating an increase in the polydispersity and the size of the AgNP population.
The contour plot (see Figure 5) allows the experimenter to easily identify the aggregation of
AgNPs during the final stage of the synthesis as indicated by the large increase in the measured
absorbance in the region from 500 nm to 800 nm. This aggregation occurs after the complete
conversion of the BH4- to B(OH)4
-. In this case, the lack of both, a strong oxidizing agent and a
stabilizing agent in the medium, would contribute to surface oxidation [18] and consequently would
promote the aggregation of the NPs.
6. Impact
As illustrated in this manuscript, NanoUV-VIS provides new possibilities for convenient data
visualization that leads to better understanding of the evolution of NP synthesis processes. In addition,
this tool can be used to study the stability of NPs dispersions, including aggregation and
destabilization processes. Finally, the applicability and impact of this tool are not limited to UV-VIS
spectrochemical data acquisition. The functionality can additionally be expanded by incorporating
new R functions and modules, providing potential uses of this tool in other analytical techniques such
as fluorescence spectroscopy, dynamic light scattering, and hyphenated systems (e.g., asymmetric
flow field-flow fractionation and size exclusion chromatography on-line coupled to UV/VIS), among
others.
141
7. Acknowledgments
The authors would like to acknowledge Thomas Lafarge (NIST Statistical Engineering
Division) for his valuable technical suggestions in developing this application. We also want to
acknowledge Melody Smith (NIST Material Measurement Laboratory) for providing the
spectrophotometer facilities to perform the experiment.
8. References
[1] Calderon-Jimenez B, et al. (2017) Silver nanoparticles: technological advances, societal impacts, and metrological challenges.
Frontiers in chemistry 5. https://doi.org/10.3389/fchem.2017.00006
[2] Attia YA, Buceta D, Requejo FG, Giovanetti LJ, Lopez-Quintela MA (2015) Photostability of gold nanoparticles with different
shapes: the role of ag clusters. Nanoscale 7(26):11273–11279. https://doi.org/10.1039/C5NR01887K
[3] Sun Y, Xia Y (2002) Shape-controlled synthesis of gold and silver nanoparticles. Science 298(5601):2176–2179. https://doi.org/
https://doi.org/10.1126/science.1077229
[4] Smitha S, Nissamudeen K, Philip D, Gopchandran K (2008) Studies on surface plasmon resonance and photoluminescence of
silver nanoparticles. Spectrochimica Acta Part A: Molecular and Biomolecular Spectroscopy 71(1):186–190.
https://doi.org/10.1016/j.saa.2007.12.002
[5] Haiss W, Thanh NT, Aveyard J, Fernig DG (2007) Determination of size and concentration of gold nanoparticles from uv- vis
spectra. Analytical chemistry 79(11):4215–4221. https://doi.org/10.1021/ac0702084
[6] Agnihotri S, Mukherji S, Mukherji S (2014) Size-controlled silver nanoparticles synthesized over the range 5–100 nm using the
same protocol and their antibacterial efficacy. RSC Advances 4(8):3974–3983. https://doi.org/10.1039/ C3RA44507K
[7] Pinto VV, et al. (2010) Long time effect on the stability of silver nanoparticles in aqueous medium: effect of the synthesis and
storage conditions. Colloids and Surfaces A: Physicochemical and Engineering Aspects 364(1):19–25. https://doi.
org/10.1016/j.colsurfa.2010.04.015
[8] Gorham JM, et al. (2014) Storage wars: how citrate-capped silver nanoparticle suspensions are affected by not-so-trivial decisions.
Journal of Nanoparticle Research 16(4):2339. https://doi.org/10.1007/s11051-014-2339-9
[9] Kelly KL, Coronado E, Zhao LL, Schatz GC (2003) The optical properties of metal nanoparticles: the influence of size, shape,
and dielectric environment. J Phys Chem B https://doi.org/10.1021/jp026731y
[10] Chang W, Cheng J, Allaire J, Xie Y, McPherson J shiny: Web Application Framework for R, . R package version 1.0.3.9000
http://shiny.rstudio.com.
[11] R Core Team (2017) R: A Language and Environment for Statistical Computing R Foundation for Statistical Computing
Vienna, Austria, https://www.R-project.org/.
[12] Sievert C, et al. (2017) plotly: Create Interactive Web Graphics via ’plotly.js. R package version 4.6.0 https://CRAN. R-
project.org/package=plotly. [13] Xie Y (2016) DT: A Wrapper of the JavaScript Library ’DataTables’ R package version 0.2 https://CRAN.R-project.
org/package=DT.
[14] Mulfinger L, et al. (2007) Synthesis and study of silver nanoparticles. J Chem Educ 84(2):322.
[15] Thanh, N. T., et al. (2014). Mechanisms of nucleation and growth of nanoparticles in solution. Chemical reviews, 114(15), 7610-
https://7630. 10.1021/cr400544s
[16] Polte, J., et al. (2012). Formation mechanism of colloidal silver nanoparticles: analogies and differences to the growth of gold
nanoparticles. ACS Nano, 2012, 6 (7), 5791–5802. https://doi.org/10.1021/nn301724z
[17] Paramelle, D., et al. (2014). A rapid method to estimate the concentration of citrate capped silver nanoparticles from UV-visible
light spectra. Analyst, 139(19), 4855-4861. https://doi.org/10.1039/C4AN00978A
[18] Wuithschick, M., et al. (2013). Size-controlled synthesis of colloidal silver nanoparticles based on mechanistic understanding.
Chemistry of Materials, 25(23), 4679-4689. https://doi.org/10.1021/cm401851g
About the authors: Bryan Calderon-Jimenez is a Guest Researcher in the Chemical Sciences Division at NIST.
He is currently working on his Ph.D. degree in the fields of the physicochemical characterization of metallic
nanoparticles, development of statistical and web applications for characterization, and manufacturing of stable
nanoparticles. Gabriel F. Sarmanho is a Researcher of the National Institute of Metrology, Quality and
Technology (INMETRO), Brazil. He is currently acting as a Guest Researcher in the Statistical Engineering
Division (SED) of NIST. As an Applied Statistician in the metrological field, he develops statistical models,
methods and software tools to analyze measurement data, focusing in parametric and non-parametric inference,
Bayesian modelling, uncertainty evaluation and interlaboratory – Key Comparisons and Proficiency Testing –
data assessment. Dr. Antonio R. Montoro Bustos is a Guest Researcher in the Chemical Sciences Division at NIST.
His research efforts are focused on the application of single particle inductively coupled plasma mass spectrometry
142
(spICP-MS) for the characterization of nanomaterials at environmentally relevant concentrations, including
establishing the metrological traceability of the technique and studying impacts of matrix effects on the analytical
performance of spICP-MS. Karen E. Murphy is a Research Chemist in the Chemical Sciences Division and serves
as the nanometrology team leader for the Inorganic Measurement Science Group. Karen's research involves the
use of inductively coupled plasma mass spectrometry (ICP-MS) for the accurate analysis of inorganic elements in
nanomaterials, clinical and environmental samples. Her research focuses on the application of spICP-MS and
isotope dilution analysis including the development of high accuracy sample preparation procedures utilizing
chemical separations. Dr. Jose R. Vega-Baudrit is the director of the National Laboratory of Nanotechnology of
Costa Rica. His research and contributions are focused in the field of the development and characterization of
polymers and in the area of nanoscience and nanotechnology. The National Institute of Standards and Technology
is an agency of the U.S. Department of Commerce.
143
Capítulo 6: Síntesis sonoquímica de nanopartículas de plata con alta
estabilidad en medios acuoso
6.1. Introducción
Actualmente, existen una gran cantidad de métodos para la síntesis química y física de NPs
(Iravani et al., 2014). Específicamente, para la síntesis química de AgNPs se consideran bien
establecidos los siguientes métodos: reducción con citrato, reducción con borohidruro de sodio
(NaBH4), reducción con ácido gálico, reducción con poliol, síntesis con solventes orgánicos,
fotoquímicos, electroquímicos y sonoquimicos entre otros (Turkevich et al., 1951; Lee & Meisel
1982; Van Hyning & Zukoski, 1998; Pastoriza-Santos et al., 1999; Sun et al., 2002; Jiang, et al.,
2004). Sin embargo, pese a la existencia de una gran cantidad de métodos para la síntesis de AgNPs,
muy pocos confieren la capacidad de controlar el tamaño de partícula, distribución de tamaño de
partícula y forma necesarias para obtener NPs monodispersas y quasiesfericas (Steinigeweg &
Schlücker, 2012).
El principal inconveniente en este tipo de rutas de síntesis química es la formación de
subproductos o formas indeseables, como por ejemplo nanovarillas, nanocubos, nanotriángulos,
nanobipirámides y nanooctaedros (Shirtcliffe et al., 1999) por lo que se deben establecer condiciones
de reacción específicas y controladas para poder obtener NPs esféricas y distribuciones uniformes.
Algunas estas variables que se pueden modificar en la síntesis química para controlar la forma y el
tamaño de la NP son las siguientes: i) el tipo y concentración de agente reductor (Dadosh, 2009), tipo
de agente estabilizante (Sun et al., 2010), ii) adición de agentes acomplejantes (NH3) para la
eliminación de agente precursor y disminución del tamaño de partícula (Sun et al., 2010), iii) co-
reducciones alcalinas empleando agentes reductores fuertes y débiles. Por último, existen otro tipo de
rutas de síntesis que emplean núcleos de crecimiento o “semilla”, lo cual permiten controlar el tamaño
de las AgNPs y obtener NPs con distribuciones uniformes y quasi-esféricas (Jana et al., 2001).
En este contexto, la síntesis sonoquímica de nanomateriales es un área de investigación
sumamente promisoria, en donde se pueden generar reacciones químicas entre las moléculas debido
a la aplicación de radiación ultrasónica de alta potencia 20 KHz -10 MHz (Bang & Suslick, 2010).
Específicamente, el método sonoquímico ha sido estudiado para obtener diferentes tipos de
nanomateriales tales como nanoaleaciones, nanoóxidos, materiales compuestos entre otros, su mayor
nicho de aplicación se encuentra orientado a la obtención de NPs de metales nobles (He et al., 2014).
144
El mecanismo fundamental de la síntesis sonoquímica de NPs metálicas es el fenómeno de la
cavitación. Este efecto hidrodinámico genera burbujas gaseosas con diámetros de µm que cuando
colapsan e implosionan dentro del medio, generan la energía, temperatura (>5000 K) y presión (~1800
atm) suficiente para convertir las moléculas de solvente, en la mayoría de los casos agua, en radicales
libres, los cuales poseen el potencial electroquímico suficiente para reducir metales nobles como el
Au, Ag, Pt, Pb entre otros (Bang & Suslick, 2010). En la siguiente serie de ecuaciones se ejemplifica
el proceso de síntesis sonoquímica:
𝐻2𝑂 → 𝐻 ∙ +𝑂𝐻 ∙
𝐻 ∙ + 𝐻 ∙ → 𝐻2
𝐻 ∙ + 𝑂𝐻 ∙ → 𝐻2𝑂
𝑅𝐻 + 𝑂𝐻 ∙ (𝐻 ∙) → 𝑅 ∙ + 𝐻2𝑂
𝑂𝐻 ∙ + 𝑂𝐻 ∙ → 𝐻2𝑂2
𝑀𝑛+ + 𝑅 ∙ ( 𝑂𝐻 ∙) → 𝑀0
donde Mn+ es el agente precursor; que en el caso específico de NPs metálicas es la especie
iónica del metal y M0 es la especie reducida o NP producto de la reacción con los radicales libres.
Entre las ventajas que presenta esta técnica en comparación con los métodos químicos
convencionales de síntesis de NPs son: una rápida velocidad de reacción, condiciones controlables
de reacción, simplicidad y seguridad de la técnica, obtención de formas esféricas y uniformes,
distribuciones simétricas, además de conferir alta pureza a los nanomateriales obtenidos por esta
técnica (Mousavi & Ghasemi, 2010).
Por otra parte, pese a la existencia de gran cantidad de rutas para la obtención de AgNPs con
diversos tamaños y formas, son muy escasas las investigaciones que brindan información sistemática
para determinar y evaluar la estabilidad de las suspensiones de NPs sintetizadas y/o purificadas. Esta
falta de estudios sistemáticos, genera una gran brecha para el desarrollo de nuevas aplicaciones o
tecnologías que requieran de AgNPs con alta estabilidad durante su ciclo de vida.
Debido a todo lo anterior y a las marcadas ventajas que posee el método sonoquimico como
ruta de síntesis de nanomateriales, se desarrolló como último objetivo de esta investigación doctoral
una nueva ruta de síntesis sonoquímica capaz de obtener AgNPs en la escala inferior a los 15 nm
(sub-15 nm) con forma cuasi-esférica y alta estabilidad en suspensión acuosa. Los principles
resultados de este estudio muestran la obtención de AgNPs con un tamaño de partícula (por TEM) de
145
8,1 nm ± 2,4 nm con una dispersión estrecha de la distribución del tamaño (intervalo de cobertura del
95% de 3,4 nm a 13 nm). Los descriptores de forma (circularidad y redondez) utilizando TEM y
mediciones de alta resolución (HR)-TEM, confirmaron la generación de AgNP con formas cuasi-
esféricas. Finalmente, la evaluación de los efectos de la radiación ultravioleta (UVC: 254 nm y UVA:
365 nm) y la temperatura de almacenamiento sobre la estabilidad espectral reveló una alta estabilidad
de las propiedades ópticas y, por consiguiente, de las propiedades dimensionales de las sub-15 nm
AgNP en el corto plazo (600 min) y largo plazo (24 semanas). Se espera que las propiedades
superiores de estabilidad exhibidas por las AgNPs sintetizadas en esta investigación contribuyan a la
expansión de aplicaciones avanzadas en los campos de nanofluidos, nanocatálisis, textiles
funcionales, medicina, biomedicina, biosensores, materiales de referencia entre otras aplicaciones. A
continuación se presenta el artículo titulado “Sonochemical pathway for the synthesis of sub-15 nm
silver nanoparticles with near-spherical shape and high stability in aqueous media” el cual a sido
sometido a consideración en la revista “Nature-Scientific Reports” y en donde se aborda con mayor
profundidad lo descrito anteriormente.
146
6.2 Sonochemical pathway for the synthesis of silver nanoparticles with near-spherical
shape and high stability in aqueous media
Artículo 4. Manuscrito bajo revision en la revista Nature-Scientific Reports
Bryan Calderón-Jiménez*, Antonio R. Montoro Bustos, Reinaldo Pereira Reyes, Sergio A.
Paniagua and José R. Vega-Baudrit
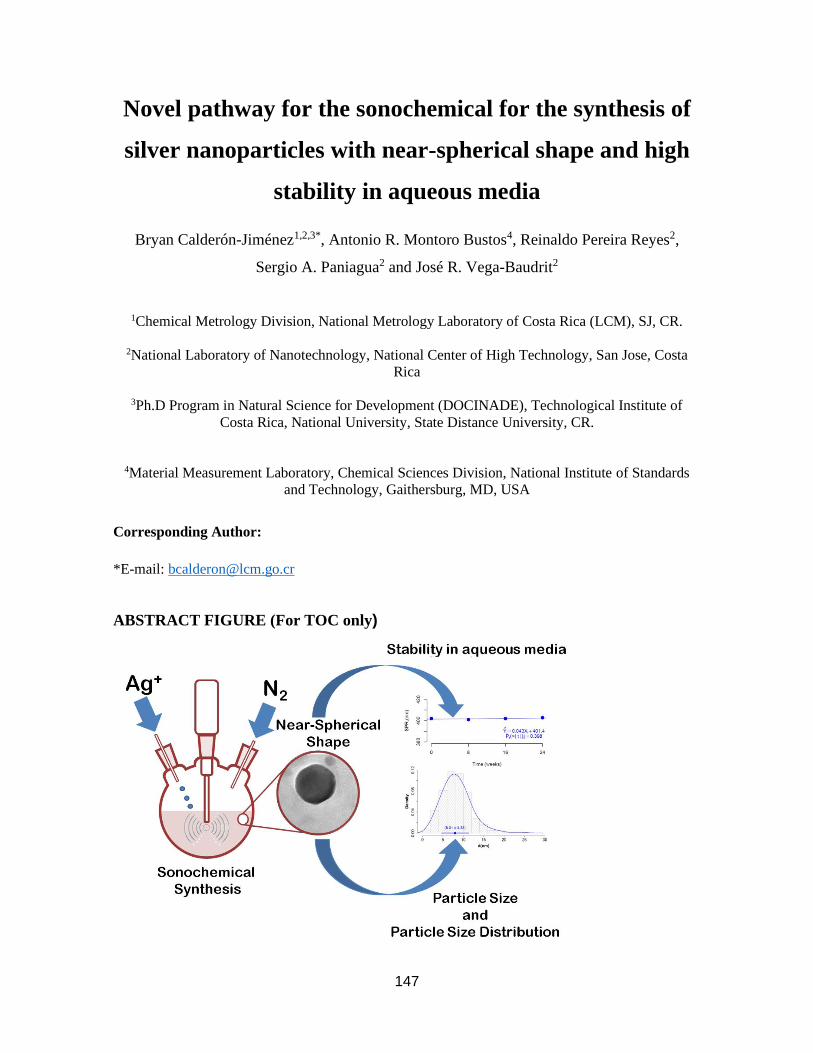
147
Novel pathway for the sonochemical for the synthesis of
silver nanoparticles with near-spherical shape and high
stability in aqueous media
Bryan Calderón-Jiménez1,2,3*, Antonio R. Montoro Bustos4, Reinaldo Pereira Reyes2,
Sergio A. Paniagua2 and José R. Vega-Baudrit2
1Chemical Metrology Division, National Metrology Laboratory of Costa Rica (LCM), SJ, CR.
2National Laboratory of Nanotechnology, National Center of High Technology, San Jose, Costa
Rica
3Ph.D Program in Natural Science for Development (DOCINADE), Technological Institute of
Costa Rica, National University, State Distance University, CR.
4Material Measurement Laboratory, Chemical Sciences Division, National Institute of Standards
and Technology, Gaithersburg, MD, USA
Corresponding Author:
*E-mail: [email protected]
ABSTRACT FIGURE (For TOC only)
148
ABSTRACT
Advances in nanoscience and nanotechnology have driven the generation of new applications where
silver nanoparticles (AgNPs) have a crucial role in the advancement of new technologies and
applications at the nanoscale. The present study shows the development of a novel sonochemical
synthesis pathway of sub-15 nm AgNPs with quasi-spherical shape and high stability in aqueous
suspension. Different analytical techniques such as online UV-Vis spectroscopy, Atomic Force
Microscopy (AFM), and Transmission Electron Microscopy (TEM) were complementarily used to
characterize the evolution of the properties of AgNPs synthesized with this new route. Furthermore,
different centrifugation conditions were studied to establish a practical, simple and straightforward
purification method. Particle size was determined by TEM employing two different deposition
methods, showing that purified AgNPs have a size of 8.1 nm ± 2.4 nm with a narrow dispersion of
the size distribution (95% coverage interval from 3.4 nm to 13 nm). Critical information of the shape
and crystalline structure of these sub-15 nm AgNPs, provided by shape descriptors (circularity and
roundness) using TEM and high resolution (HR)-TEM measurements, confirmed the generation of
AgNPs with quasi-spherical shapes with certain twin-fault particles promoted by the high energy of
the ultrasonic treatment. Finally, the evaluation of the effects of ultraviolet radiation (UVC: 254 nm
and UVA: 365 nm) and storage temperature on the spectral stability revealed a high stability of the
optical properties and subsequently dimensional properties of sub-15 nm AgNPs in the short-term
(600 min) and long-term (24 weeks). It is expected that the superior stability properties exhibited by
the synthesized sub-15 nm AgNPs would contribute to the expansion of their range of advanced
applications in the fields of nano-fluidics, nano-catalysis, functional textiles, medicine, biomedicine,
biosensors, and so forth.
KEYWORDS
Silver Nanoparticles, Synthesis, Sonochemistry, Near-Spherical, Monitoring, Purification, High
Stability, Aqueous Media.
149
INTRODUCTION
In recent years the world has seen an exponential growth of applications and technologies
developed in the field of nanoscience and nanotechnology1. Mainly, silver nanoparticles (AgNPs)
currently drive a predominant amount of new scientific developments and innovation, ranging from
the generation of new antiseptic2, antifungal3 and virucidal agents4, catalysts5, food packaging6,
textiles7, photoelectronics8, sensors9, bioengineering10, biomedicine11,12, electrochemistry13,
heterogeneous catalysis14, environmental treatment systems15 among others.
Most of these applications benefit from the intrinsic physicochemical properties that AgNPs
exhibit at the nanoscale: where particle size16, size distribution17 and shape18,19 are the predominant
dimensional properties to establish the design and type of application of these nanomaterials. An
imperative need to improve the applicability of AgNPs in new advanced technologies in the field of
plasmonic devices20 and nanoelectronic devices construction21, as well as to develop new applications
of medical devices and biomedical therapies for relevant diseases such as certain types of cancer22,23,
virus infections24 and pathogens25, among others.
In this context, finding new routes for the synthesis of AgNPs that increase the stability of
their dimensional properties is an indispensable scientific task for the development of advanced
applications in the field of nanoscience, nanotechnology, and nanometrology26. In fact, recent efforts
have focused on the development of bottom-up wet synthesis routes to obtain AgNPs with high size
control27, monodispersed size distribution28, and highly spherical shape9. Among them, several routes
for the synthesis of AgNPs have been reported for the obtention of different particle sizes ranging
from 5 nm to 100 nm29,30 and even larger than 100 nm31. Interestingly, it has been demonstrated that
some antibacterial29, optical32, and catalytic33 properties of AgNPs are significantly enhanced for
particle sizes smaller than 15 nm (sub-15 nm). Thus, despite the high surface area and tendency to
agglomeration, aggregation, and/or dissolution processes34, the obtention of highly stable sub-15 nm
AgNPs under controlled conditions has attracted great interest from the scientific community.
However, despite the long variety of approaches for the synthesis of AgNPs35, the routes that
achieve short-term stability in aqueous suspension are limited36-41, and particularly scarce for the
production of AgNPs with high long-term stability. Therefore, there is a clear need to develop new
synthesis routes for sub-15 nm AgNPs with high stability (> 3 months), to maintain their optical
150
properties and subsequently their dimensional properties, as well as to promote the development of
advanced applications with high stability requirements (e.g.; reference materials at the nanoscale).
The production and obtention of NPs and nanostructured materials using high-intensity
ultrasonic radiation has been studied during the last decades43. Specifically, the sonochemical method
has been studied for the synthesis of different types of noble metal NPs such as Au, Ag, Pt, Pb44, and
other nanomaterials such as alloys, oxides, composites, among others45,46.
The fundamental mechanism of sonochemical synthesis of metallic NPs is the cavitation
phenomenon. This hydrodynamic effect generates gaseous bubbles with µm diameters that collapse
and implode within the medium, generating sufficient energy, temperature (>5000 K) and pressure
(~1800 atm) to convert the solvent molecules47,48 in most cases water, into free radicals of highly
reactive species (HO2∙, H∙, OH∙, and perhaps eaq- (solvated electron)). These are capable of providing
sufficient chemical potential to reduce noble metals, among which Ag stands out48. The main
advantages of sonochemical methods include fast reaction speed, controllable reaction conditions,
simplicity and safety of the technique, obtention of spherical and uniform shapes, distributions with
a certain symmetry, and with a high purity to the nanomaterials49. Also, the use of sonochemistry
offers the possibility of generating AgNPs with particular small particle sizes50 which places it as a
promising pathway to obtain AgNPs in the range of sub-15 nm with defined dimensional properties
(size, size distribution, and shape) and potential stable metallic nuclei in aqueous media during a long
period of time.
This study presents the development of a novel sonochemical synthesis route to obtain sub-
15 nm AgNPs. Different analytical techniques such as online UV-Vis spectroscopy, Atomic Force
Microscopy (AFM), and Transmission Electron Microscopy (TEM) were complementarily used to
characterize the evolution of the properties of AgNPs synthesized with this new route. This multi-
technique characterization strategy helped to understand some mechanisms involved in the formation
of AgNPs that occur in this new pathway (nucleation, growth, coalescence,
agglomeration/aggregation) as well as to design a direct and simple strategy for the purification and
adequate characterization of this type of nanomaterial. Following this, a thorough evaluation of the
short-term stability of sub-15 nm AgNPs under UVC (254 nm) and UVA (356 nm) irradiation
conditions as well as their high long-term stability under two different storage temperature conditions
has been carried out.
151
EXPERIMENTAL SECTION
Chemicals
Chemicals used during this study were used as received without further purification. High-
purity water (≥18 MΩ cm at 25 °C resistivity, Millipore, MA, USA) was used to prepare all solutions
involve in the sonochemical synthesis. Silver nitrate (AgNO3), 99,999% (w/w), sodium borohydride
(NaBH4) 99% (w/w), trisodium citrate dehydrate (NaCit), poly-L-lysine (PLL) 0.1 % (w/v) in H2O
and Alcian blue 8GX in powder were purchase form Sigma Aldrich (MO, USA). Ethanol 95% (v/v)
was purchased from Merck (MO, USA). Carbon/Formvar film coated copper grids (400 mesh) were
acquired from Ted Pella Inc. (CA, USA) were used for TEM and HR-TEM. Freshly cleaved mica
surfaces were used as substrate for AFM characterization. Nitrogen (N2) with ultra-high purity (UHP
~99%) was purchased form Praxair Technology (AL, USA). Standard Reference Material® 203451
was used as transfer standard for the verification, drift control, and calibration of the wavelength scale
of UV-Vis absorption spectrophotometers. All glassware was washed with HNO3 10% (w/v), rinsed
with high-purity water, and oven dried before use.
Methods and instrumentation
Sonochemical reaction system
The system consisted of a 250 mL round bottom flask with three 14/20 necks (Sonics
Materials, CT, USA) coupled using an adapter (Sonics Materials, CT, USA) to a 700 W power
sonicator with an adjustable pulse (QSonica, CT, USA). A solid titanium sonicator probe with a
diameter of 12.7 mm was inserted inside the main neck. 40 mL of NaBH4 2.0 mM were placed inside
the sonochemical reaction vessel. The precursor agent (AgNO3, 1.0 mM) was continuously
introduced at 0.60 g min-1 using a capillary tube until the NaBH4 solution reached a temperature of
(0.0 ± 0.4) °C, that corresponded to a period of 30 min of thermostatic equilibrium in a
thermoregulated bath. To maintain a constant nitrogen atmosphere inside the flask to prevent any
oxidation of the AgNPs surface during the synthesis, a needle with nitrogen flow was used. This flow
was set to 1 mL min-1 by means of a rotameter (Cole-Palmer, IL, USA). The third neck was used as
a purge of the N2 and prevention of overpressure in the reaction system using an adapter with double
entry. The control of the reaction temperature at 0 °C was carried out by immersing the sonochemical
reaction vessel in a Lauda Ecoline RE104 bath (LK, Germany).
152
UV-Vis spectroscopy
An on-line UV-Vis system, similar to the reported by Calderón-Jiménez et al.,52, was used to
monitor and study the evolution of the optical properties during the sonochemical synthesis reaction
of AgNPs (Fig S1a). For this purpose, the sonochemical reaction system described above was coupled
with a peristaltic pump to introduce and recirculate the sample into the UV-Vis spectrophotometer
(Lambda 950, PerkinElmer, MA, USA) using a quartz flow cell (Helma® absorption cell, Mülheim,
Germany) with a path length of 2 mm and a chamber volume of 124 μL.
Stability measurements of purified AgNPs were performed in the UV-Vis spectrophotometer,
using a quartz cell (UV Quartz, PerkinElmer, MA, USA) with a path length of 10 mm and a chamber
volume of 1 mL. Acquisition of the absorbance spectra was performed using UV WinLab™ software,
and data were collected in .csv format. Graphical visualizations, processing as well as the
determination of the optical properties of AgNPs were performed using the interactive web
application NanoUV-VIS52,53.
Atomic Force Microscopy (AFM)
AFM measurements for the monitoring of the sonochemical synthesis were performed
following the ASTM E2859-1154 Standard Guide. Briefly, 25 µL of undiluted raw AgNPs were
deposited on a cleaved mica substrate previously activated with a 0.1% PLL solution that provides a
positively charged surface able to bond the AgNPs. Once AgNPs were bonded and air-dried on the
mica, images were captured with an Asylum Research model MFP-3D SA (Oxford Instruments,
Abingdon, UK) in non-contact (tapping) mode using a cantilever with a radii tip < 10 nm and stiffness
of 48 N m-1. Scan sizes of 3.0 µm x 3.0 µm with 512 lines and a scan speed of 1 Hz (per scan line)
were used to image. Image visualization and particle height analysis were performed using Gwyddion
(version 2.57) modular program55.
Transmission Electron Microscopy (TEM) and High-Resolution Transmission Electron Microscopy
(HR-TEM)
The "grid on drop" method was used as a quick and practical approach to deposit and
characterize the raw AgNP suspensions coming from sonochemical synthesis. Specifically, 5 µL of
153
undiluted AgNPs were deposited on the TEM grids and then dried for at least 24 h. In the case of the
nano-characterization of purified AgNPs, TEM grids (400 mesh Cu-Carbon/Formvar film-coated)
were previously treated using two different deposition methods: Alcian Blue 1% (w/v) solution based
on the protocol proposed by Mast Demeestere56, and PLL 0.1 % (w/v) solution recommended by
Mazia et al.,57. TEM measurements were performed on a JEM 2011 (JEOL, Tokyo, Japan)
instrument, in bright-field mode operating at 120 kV and using magnifications of approximately
between 40,000 and 80,000x. The micrographs (1024 pixels x 1024 pixels in size) were recorded
using a 1k x 1k CCD camera (794, Gatan). HR-TEM images of the purified AgNPs were recorded
using the same instrument using a magnification of approximately 600,000x.
Centrifugation and purification
The purification of the raw AgNPs was performed using a Sorvall WX Ultra Series, WX 80
Ultracentrifuge (Thermo Fisher Scientific, MA, USA) with a Beckman SW 50.1 swinging bucket
rotor (max. 5 mL) where 3.0 g of the NPs suspension were placed. Samples were vacuum centrifuged
using a relative centrifugal field (RCF) of 10,000 g, 20,000 g, and 30,000 g for 20 min with a
deceleration time of 5 min at a temperature of 4 ºC. Finally, the supernatant from the centrifugation
was carefully separated from the pellet deposited at the bottom of the test tubes. Both centrifugation
products (supernatant and pellet) were analyzed by TEM, as detailed above.
AgNPs subsamples for stability studies
A 25 mL batch of previously purified AgNPs was homogenized in an ultrasonic bath for 5
min to avoid possible agglomerations. The batch was subsequently divided into 1 mL subsamples
(total of 25 subsamples) (Fig S2). These subsamples were stored in 2 mL glass vials and in an inert
N2 (UHP) atmosphere. The vials were covered with aluminum foil and stored in the dark to prevent
any photo-degradative effect during the stability studies.
Stability of sub-15 nm AgNPs under UV radiation (Short-term stability)
A total of 5 subsamples were randomly taken from the purified AgNPs batch (Fig S2) to
perform the UV irradiation stability study. For this instance, AgNPs subsamples were transferred into
10 mm x 10 mm quartz cells transparent to UV radiation. A Spectroline CX-20 UV camera was used
to irradiate the sub-samples with both UV radiations. Two subsamples were used to study the effect
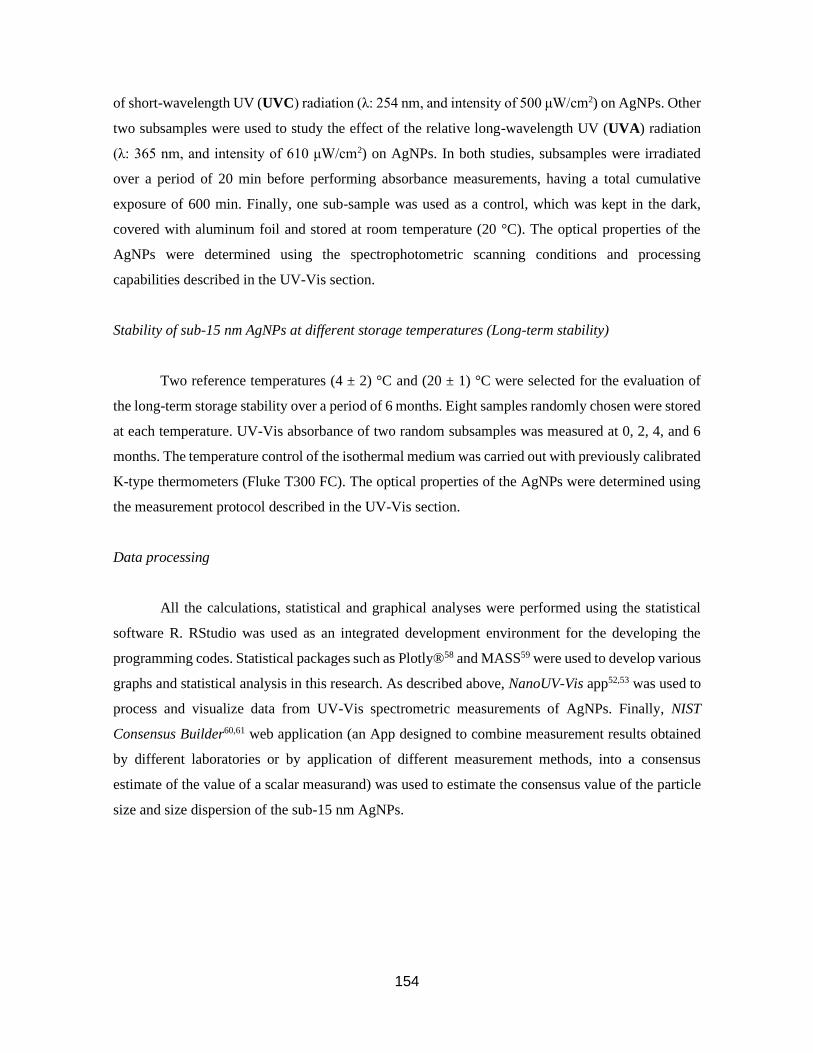
154
of short-wavelength UV (UVC) radiation (λ: 254 nm, and intensity of 500 μW/cm2) on AgNPs. Other
two subsamples were used to study the effect of the relative long-wavelength UV (UVA) radiation
(λ: 365 nm, and intensity of 610 μW/cm2) on AgNPs. In both studies, subsamples were irradiated
over a period of 20 min before performing absorbance measurements, having a total cumulative
exposure of 600 min. Finally, one sub-sample was used as a control, which was kept in the dark,
covered with aluminum foil and stored at room temperature (20 °C). The optical properties of the
AgNPs were determined using the spectrophotometric scanning conditions and processing
capabilities described in the UV-Vis section.
Stability of sub-15 nm AgNPs at different storage temperatures (Long-term stability)
Two reference temperatures (4 ± 2) °C and (20 ± 1) °C were selected for the evaluation of
the long-term storage stability over a period of 6 months. Eight samples randomly chosen were stored
at each temperature. UV-Vis absorbance of two random subsamples was measured at 0, 2, 4, and 6
months. The temperature control of the isothermal medium was carried out with previously calibrated
K-type thermometers (Fluke T300 FC). The optical properties of the AgNPs were determined using
the measurement protocol described in the UV-Vis section.
Data processing
All the calculations, statistical and graphical analyses were performed using the statistical
software R. RStudio was used as an integrated development environment for the developing the
programming codes. Statistical packages such as Plotly®58 and MASS59 were used to develop various
graphs and statistical analysis in this research. As described above, NanoUV-Vis app52,53 was used to
process and visualize data from UV-Vis spectrometric measurements of AgNPs. Finally, NIST
Consensus Builder60,61 web application (an App designed to combine measurement results obtained
by different laboratories or by application of different measurement methods, into a consensus
estimate of the value of a scalar measurand) was used to estimate the consensus value of the particle
size and size dispersion of the sub-15 nm AgNPs.
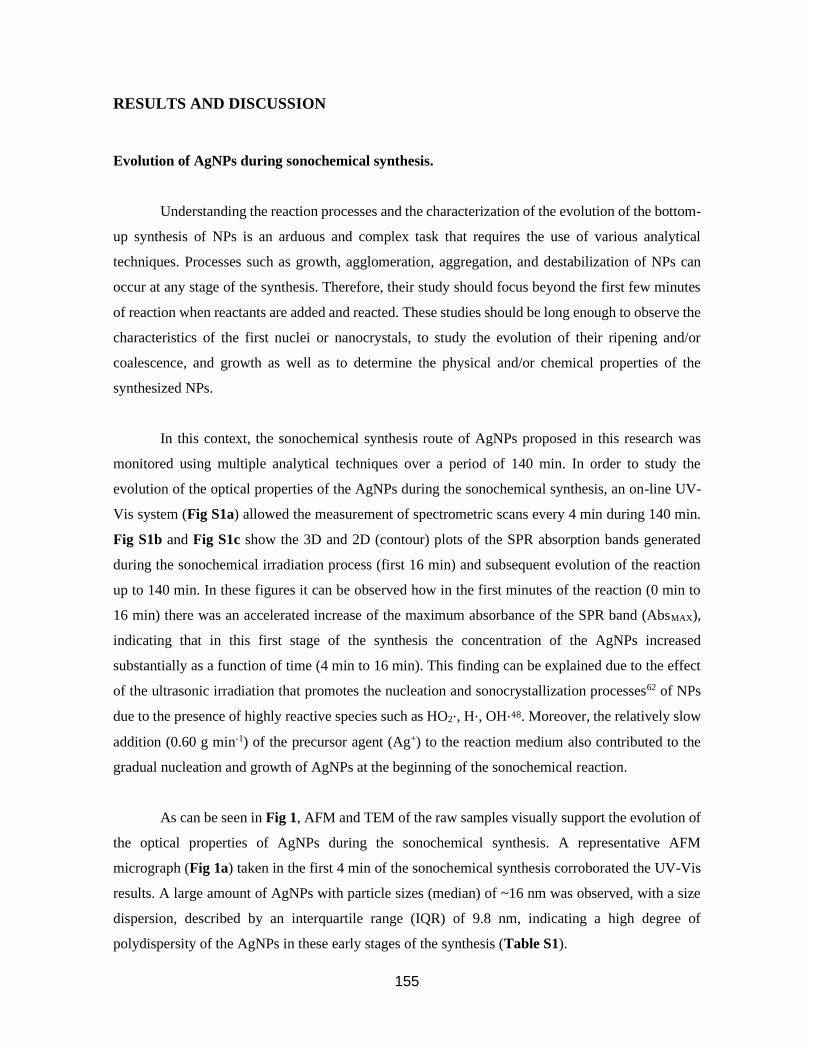
155
RESULTS AND DISCUSSION
Evolution of AgNPs during sonochemical synthesis.
Understanding the reaction processes and the characterization of the evolution of the bottom-
up synthesis of NPs is an arduous and complex task that requires the use of various analytical
techniques. Processes such as growth, agglomeration, aggregation, and destabilization of NPs can
occur at any stage of the synthesis. Therefore, their study should focus beyond the first few minutes
of reaction when reactants are added and reacted. These studies should be long enough to observe the
characteristics of the first nuclei or nanocrystals, to study the evolution of their ripening and/or
coalescence, and growth as well as to determine the physical and/or chemical properties of the
synthesized NPs.
In this context, the sonochemical synthesis route of AgNPs proposed in this research was
monitored using multiple analytical techniques over a period of 140 min. In order to study the
evolution of the optical properties of the AgNPs during the sonochemical synthesis, an on-line UV-
Vis system (Fig S1a) allowed the measurement of spectrometric scans every 4 min during 140 min.
Fig S1b and Fig S1c show the 3D and 2D (contour) plots of the SPR absorption bands generated
during the sonochemical irradiation process (first 16 min) and subsequent evolution of the reaction
up to 140 min. In these figures it can be observed how in the first minutes of the reaction (0 min to
16 min) there was an accelerated increase of the maximum absorbance of the SPR band (AbsMAX),
indicating that in this first stage of the synthesis the concentration of the AgNPs increased
substantially as a function of time (4 min to 16 min). This finding can be explained due to the effect
of the ultrasonic irradiation that promotes the nucleation and sonocrystallization processes62 of NPs
due to the presence of highly reactive species such as HO2⋅, H⋅, OH⋅48. Moreover, the relatively slow
addition (0.60 g min-1) of the precursor agent (Ag+) to the reaction medium also contributed to the
gradual nucleation and growth of AgNPs at the beginning of the sonochemical reaction.
As can be seen in Fig 1, AFM and TEM of the raw samples visually support the evolution of
the optical properties of AgNPs during the sonochemical synthesis. A representative AFM
micrograph (Fig 1a) taken in the first 4 min of the sonochemical synthesis corroborated the UV-Vis
results. A large amount of AgNPs with particle sizes (median) of ~16 nm was observed, with a size
dispersion, described by an interquartile range (IQR) of 9.8 nm, indicating a high degree of
polydispersity of the AgNPs in these early stages of the synthesis (Table S1).
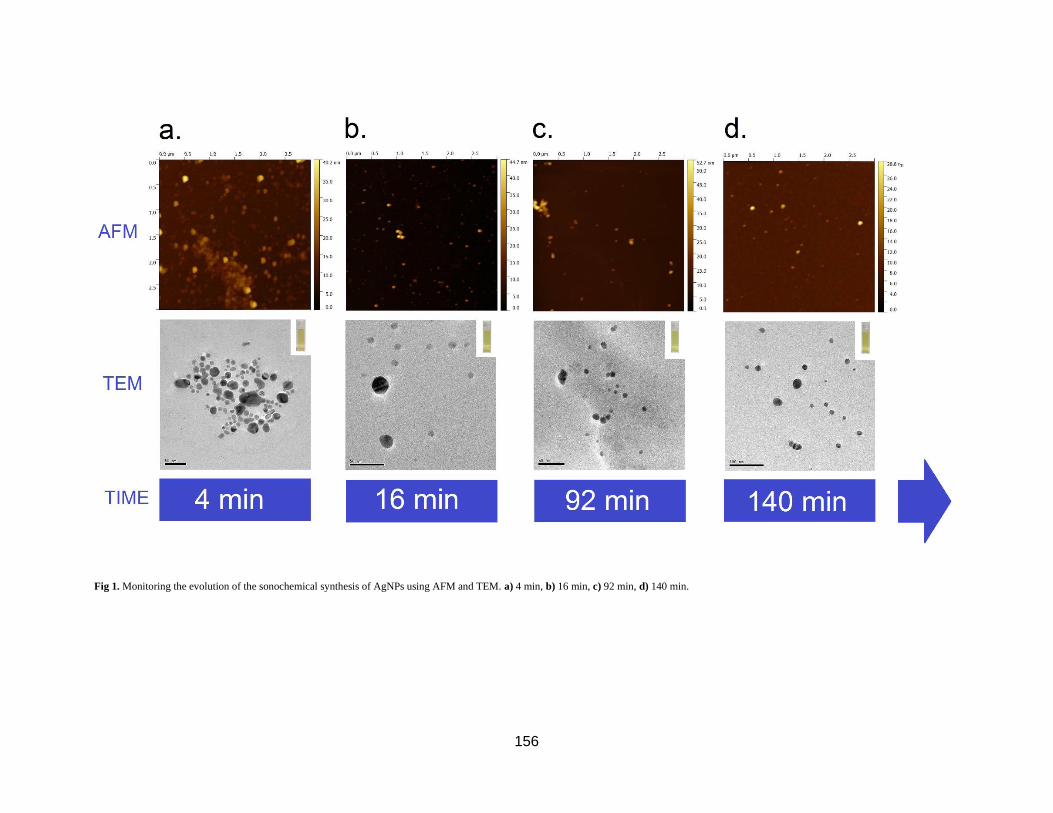
156
Fig 1. Monitoring the evolution of the sonochemical synthesis of AgNPs using AFM and TEM. a) 4 min, b) 16 min, c) 92 min, d) 140 min.
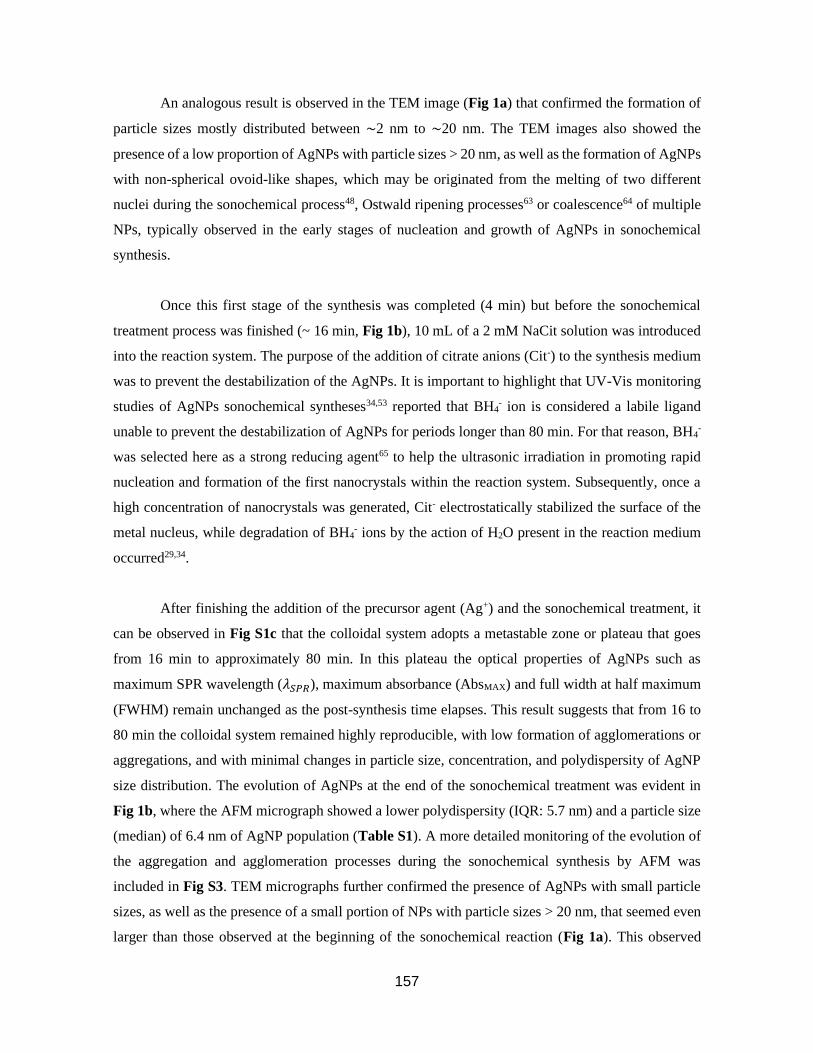
157
An analogous result is observed in the TEM image (Fig 1a) that confirmed the formation of
particle sizes mostly distributed between ~2 nm to ~20 nm. The TEM images also showed the
presence of a low proportion of AgNPs with particle sizes > 20 nm, as well as the formation of AgNPs
with non-spherical ovoid-like shapes, which may be originated from the melting of two different
nuclei during the sonochemical process48, Ostwald ripening processes63 or coalescence64 of multiple
NPs, typically observed in the early stages of nucleation and growth of AgNPs in sonochemical
synthesis.
Once this first stage of the synthesis was completed (4 min) but before the sonochemical
treatment process was finished (~ 16 min, Fig 1b), 10 mL of a 2 mM NaCit solution was introduced
into the reaction system. The purpose of the addition of citrate anions (Cit-) to the synthesis medium
was to prevent the destabilization of the AgNPs. It is important to highlight that UV-Vis monitoring
studies of AgNPs sonochemical syntheses34,53 reported that BH4- ion is considered a labile ligand
unable to prevent the destabilization of AgNPs for periods longer than 80 min. For that reason, BH4-
was selected here as a strong reducing agent65 to help the ultrasonic irradiation in promoting rapid
nucleation and formation of the first nanocrystals within the reaction system. Subsequently, once a
high concentration of nanocrystals was generated, Cit- electrostatically stabilized the surface of the
metal nucleus, while degradation of BH4- ions by the action of H2O present in the reaction medium
occurred29,34.
After finishing the addition of the precursor agent (Ag+) and the sonochemical treatment, it
can be observed in Fig S1c that the colloidal system adopts a metastable zone or plateau that goes
from 16 min to approximately 80 min. In this plateau the optical properties of AgNPs such as
maximum SPR wavelength (𝜆𝑆𝑃𝑅), maximum absorbance (AbsMAX) and full width at half maximum
(FWHM) remain unchanged as the post-synthesis time elapses. This result suggests that from 16 to
80 min the colloidal system remained highly reproducible, with low formation of agglomerations or
aggregations, and with minimal changes in particle size, concentration, and polydispersity of AgNP
size distribution. The evolution of AgNPs at the end of the sonochemical treatment was evident in
Fig 1b, where the AFM micrograph showed a lower polydispersity (IQR: 5.7 nm) and a particle size
(median) of 6.4 nm of AgNP population (Table S1). A more detailed monitoring of the evolution of
the aggregation and agglomeration processes during the sonochemical synthesis by AFM was
included in Fig S3. TEM micrographs further confirmed the presence of AgNPs with small particle
sizes, as well as the presence of a small portion of NPs with particle sizes > 20 nm, that seemed even
larger than those observed at the beginning of the sonochemical reaction (Fig 1a). This observed
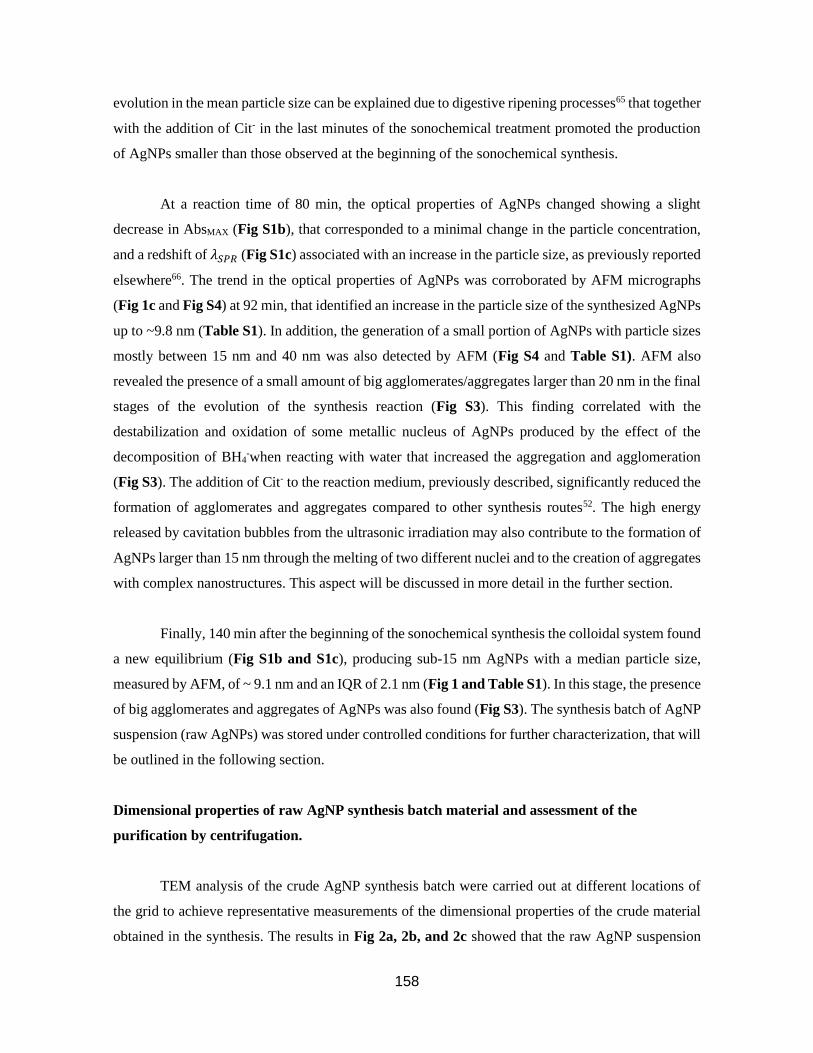
158
evolution in the mean particle size can be explained due to digestive ripening processes65 that together
with the addition of Cit- in the last minutes of the sonochemical treatment promoted the production
of AgNPs smaller than those observed at the beginning of the sonochemical synthesis.
At a reaction time of 80 min, the optical properties of AgNPs changed showing a slight
decrease in AbsMAX (Fig S1b), that corresponded to a minimal change in the particle concentration,
and a redshift of 𝜆𝑆𝑃𝑅 (Fig S1c) associated with an increase in the particle size, as previously reported
elsewhere66. The trend in the optical properties of AgNPs was corroborated by AFM micrographs
(Fig 1c and Fig S4) at 92 min, that identified an increase in the particle size of the synthesized AgNPs
up to ~9.8 nm (Table S1). In addition, the generation of a small portion of AgNPs with particle sizes
mostly between 15 nm and 40 nm was also detected by AFM (Fig S4 and Table S1). AFM also
revealed the presence of a small amount of big agglomerates/aggregates larger than 20 nm in the final
stages of the evolution of the synthesis reaction (Fig S3). This finding correlated with the
destabilization and oxidation of some metallic nucleus of AgNPs produced by the effect of the
decomposition of BH4-when reacting with water that increased the aggregation and agglomeration
(Fig S3). The addition of Cit- to the reaction medium, previously described, significantly reduced the
formation of agglomerates and aggregates compared to other synthesis routes52. The high energy
released by cavitation bubbles from the ultrasonic irradiation may also contribute to the formation of
AgNPs larger than 15 nm through the melting of two different nuclei and to the creation of aggregates
with complex nanostructures. This aspect will be discussed in more detail in the further section.
Finally, 140 min after the beginning of the sonochemical synthesis the colloidal system found
a new equilibrium (Fig S1b and S1c), producing sub-15 nm AgNPs with a median particle size,
measured by AFM, of ~ 9.1 nm and an IQR of 2.1 nm (Fig 1 and Table S1). In this stage, the presence
of big agglomerates and aggregates of AgNPs was also found (Fig S3). The synthesis batch of AgNP
suspension (raw AgNPs) was stored under controlled conditions for further characterization, that will
be outlined in the following section.
Dimensional properties of raw AgNP synthesis batch material and assessment of the
purification by centrifugation.
TEM analysis of the crude AgNP synthesis batch were carried out at different locations of
the grid to achieve representative measurements of the dimensional properties of the crude material
obtained in the synthesis. The results in Fig 2a, 2b, and 2c showed that the raw AgNP suspension
159
exhibited a high degree of homogeneity of the particle size. Particularly, TEM micrographs of crude
AgNPs taken at three different locations showed particle sizes (Median) of 9.1 nm, 10.1 nm, and 9.4
nm, respectively. Moreover, very similar values for the dispersion of particle sizes, expressed as the
median absolute deviation (MAD), of 3.3 nm, 3.4 nm, and 3.0 nm, respectively were obtained.
Additionally, the particle size distributions of the three different locations (based on a Kernel
distribution) showed a very similar trend; they did not significantly differ statistically at 95 %
confidence (Ftest < Fcrit) that made it possible to combine the individual particles from the three
different locations to estimate an overall value of the particle size and size distribution of raw AgNPs,
displayed in Fig 2d. Overall, the TEM characterization of the raw material provided a very
approximate estimate of the particle size (9.1 ± 3.3) nm and revealed the existence of a narrow size
distribution (IQR: 4.5 nm). While a positive asymmetry yielded by the presence of a small portion
(13 %) of AgNPs >15 nm, produced during the synthetic process, was detected in the global particle
size distribution, the majority of AgNPs (~87 %) was distributed around the median ± MAD. In this
context, the measurements made by AFM at the end of the monitoring (140 min) show an even
narrower IQR (2.1) than that obtained in TEM characterization. This variation can be attributed to the
already demonstrated method dependency of these measurements have on the nano-scale
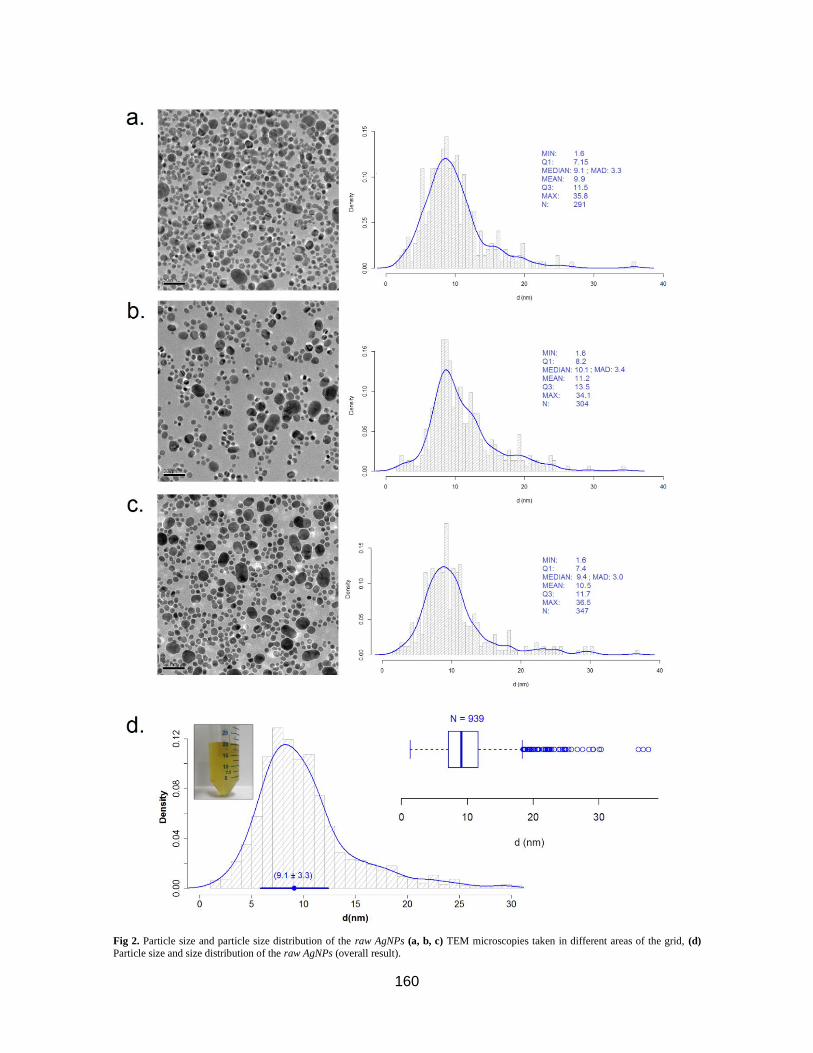
160
Fig 2. Particle size and particle size distribution of the raw AgNPs (a, b, c) TEM microscopies taken in different areas of the grid, (d)
Particle size and size distribution of the raw AgNPs (overall result).
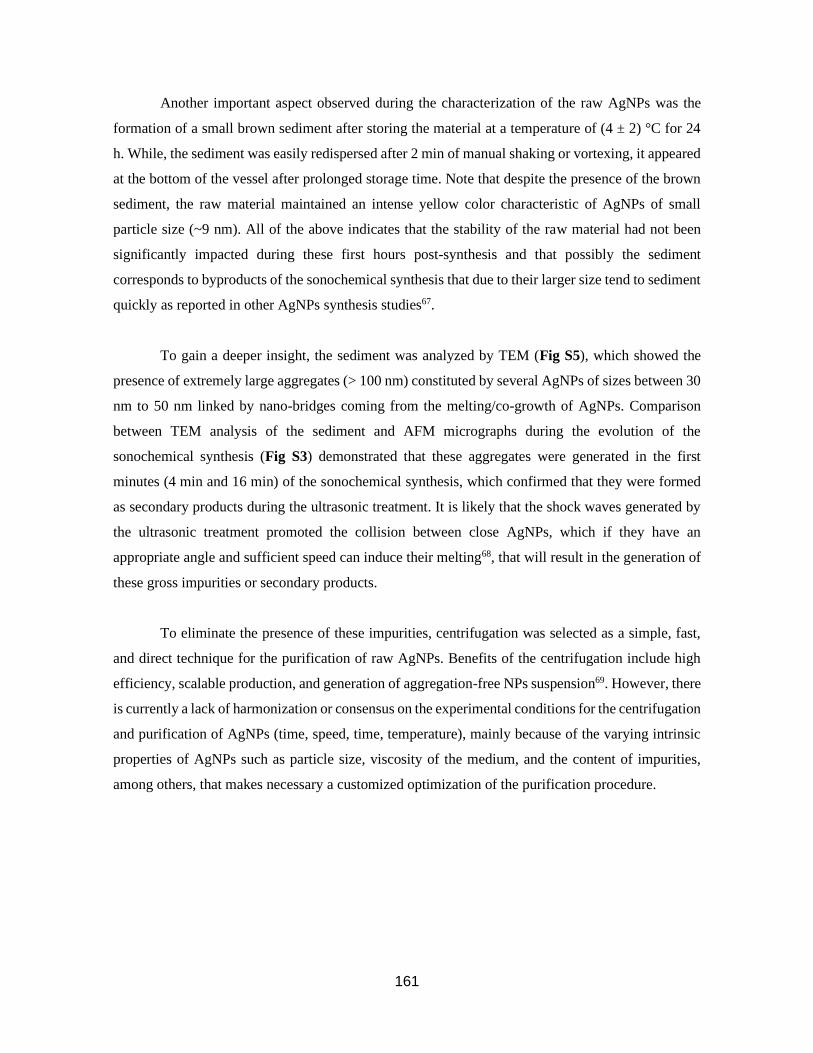
161
Another important aspect observed during the characterization of the raw AgNPs was the
formation of a small brown sediment after storing the material at a temperature of (4 ± 2) °C for 24
h. While, the sediment was easily redispersed after 2 min of manual shaking or vortexing, it appeared
at the bottom of the vessel after prolonged storage time. Note that despite the presence of the brown
sediment, the raw material maintained an intense yellow color characteristic of AgNPs of small
particle size (~9 nm). All of the above indicates that the stability of the raw material had not been
significantly impacted during these first hours post-synthesis and that possibly the sediment
corresponds to byproducts of the sonochemical synthesis that due to their larger size tend to sediment
quickly as reported in other AgNPs synthesis studies67.
To gain a deeper insight, the sediment was analyzed by TEM (Fig S5), which showed the
presence of extremely large aggregates (> 100 nm) constituted by several AgNPs of sizes between 30
nm to 50 nm linked by nano-bridges coming from the melting/co-growth of AgNPs. Comparison
between TEM analysis of the sediment and AFM micrographs during the evolution of the
sonochemical synthesis (Fig S3) demonstrated that these aggregates were generated in the first
minutes (4 min and 16 min) of the sonochemical synthesis, which confirmed that they were formed
as secondary products during the ultrasonic treatment. It is likely that the shock waves generated by
the ultrasonic treatment promoted the collision between close AgNPs, which if they have an
appropriate angle and sufficient speed can induce their melting68, that will result in the generation of
these gross impurities or secondary products.
To eliminate the presence of these impurities, centrifugation was selected as a simple, fast,
and direct technique for the purification of raw AgNPs. Benefits of the centrifugation include high
efficiency, scalable production, and generation of aggregation-free NPs suspension69. However, there
is currently a lack of harmonization or consensus on the experimental conditions for the centrifugation
and purification of AgNPs (time, speed, time, temperature), mainly because of the varying intrinsic
properties of AgNPs such as particle size, viscosity of the medium, and the content of impurities,
among others, that makes necessary a customized optimization of the purification procedure.
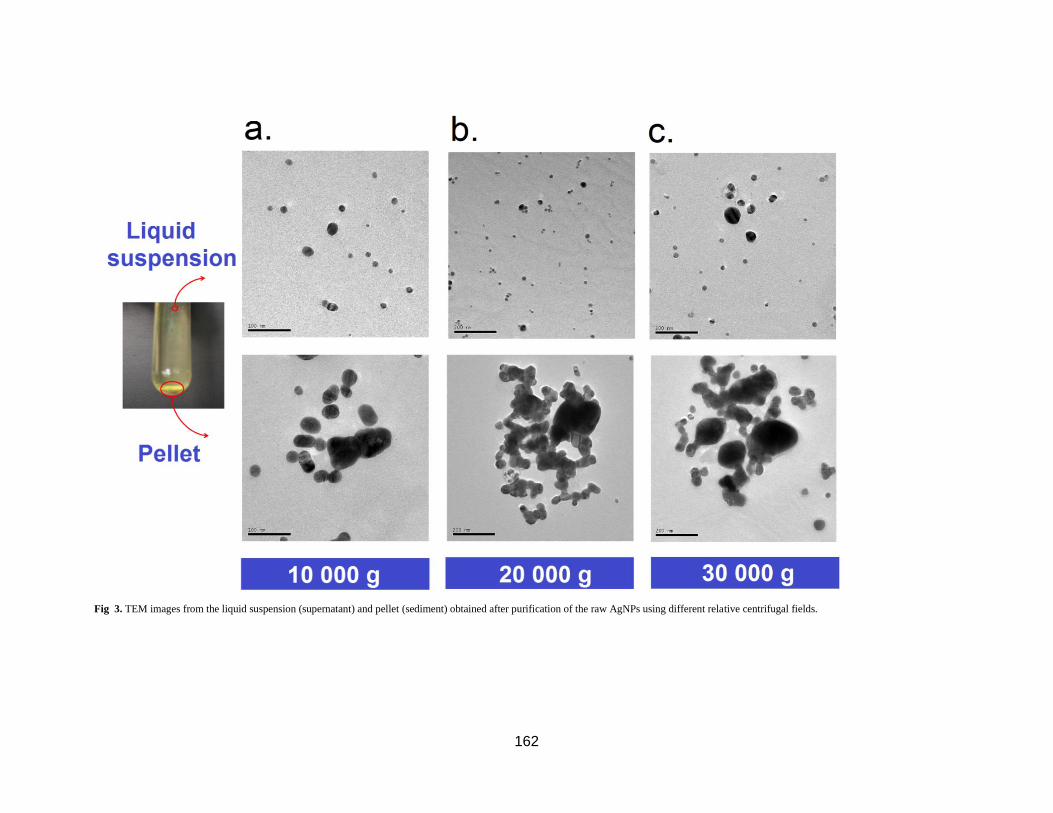
162
Fig 3. TEM images from the liquid suspension (supernatant) and pellet (sediment) obtained after purification of the raw AgNPs using different relative centrifugal fields.
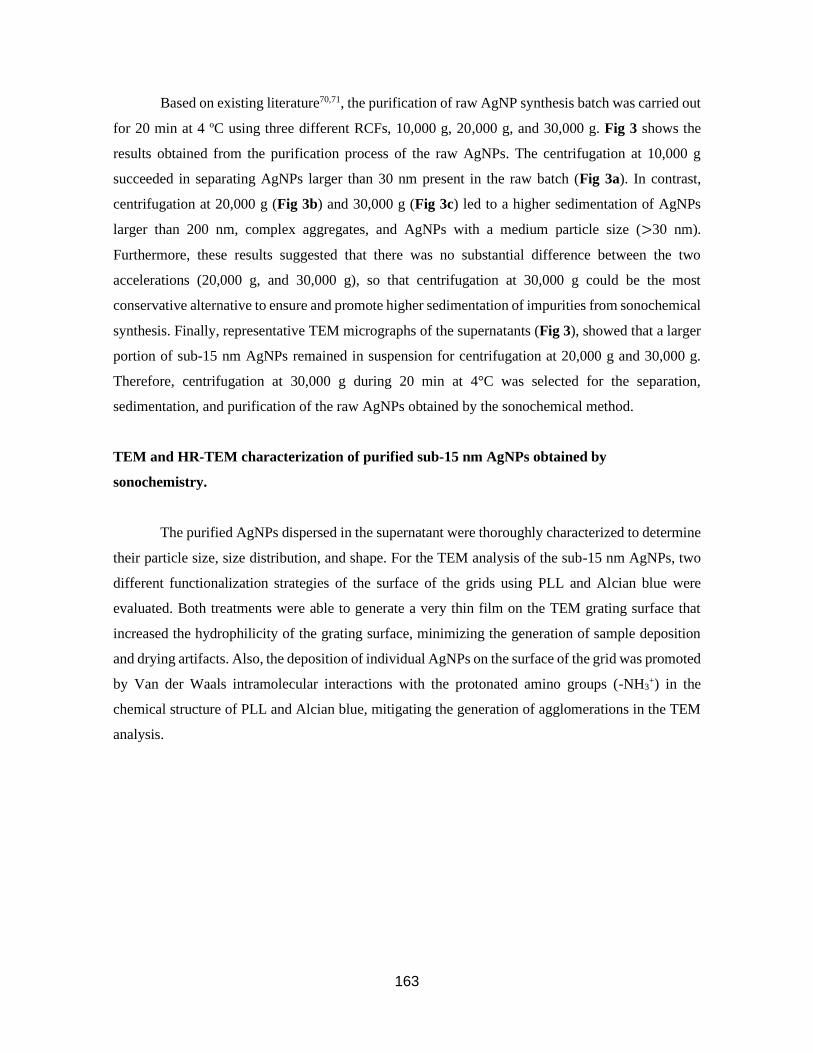
163
Based on existing literature70,71, the purification of raw AgNP synthesis batch was carried out
for 20 min at 4 ºC using three different RCFs, 10,000 g, 20,000 g, and 30,000 g. Fig 3 shows the
results obtained from the purification process of the raw AgNPs. The centrifugation at 10,000 g
succeeded in separating AgNPs larger than 30 nm present in the raw batch (Fig 3a). In contrast,
centrifugation at 20,000 g (Fig 3b) and 30,000 g (Fig 3c) led to a higher sedimentation of AgNPs
larger than 200 nm, complex aggregates, and AgNPs with a medium particle size (>30 nm).
Furthermore, these results suggested that there was no substantial difference between the two
accelerations (20,000 g, and 30,000 g), so that centrifugation at 30,000 g could be the most
conservative alternative to ensure and promote higher sedimentation of impurities from sonochemical
synthesis. Finally, representative TEM micrographs of the supernatants (Fig 3), showed that a larger
portion of sub-15 nm AgNPs remained in suspension for centrifugation at 20,000 g and 30,000 g.
Therefore, centrifugation at 30,000 g during 20 min at 4°C was selected for the separation,
sedimentation, and purification of the raw AgNPs obtained by the sonochemical method.
TEM and HR-TEM characterization of purified sub-15 nm AgNPs obtained by
sonochemistry.
The purified AgNPs dispersed in the supernatant were thoroughly characterized to determine
their particle size, size distribution, and shape. For the TEM analysis of the sub-15 nm AgNPs, two
different functionalization strategies of the surface of the grids using PLL and Alcian blue were
evaluated. Both treatments were able to generate a very thin film on the TEM grating surface that
increased the hydrophilicity of the grating surface, minimizing the generation of sample deposition
and drying artifacts. Also, the deposition of individual AgNPs on the surface of the grid was promoted
by Van der Waals intramolecular interactions with the protonated amino groups (-NH3+) in the
chemical structure of PLL and Alcian blue, mitigating the generation of agglomerations in the TEM
analysis.
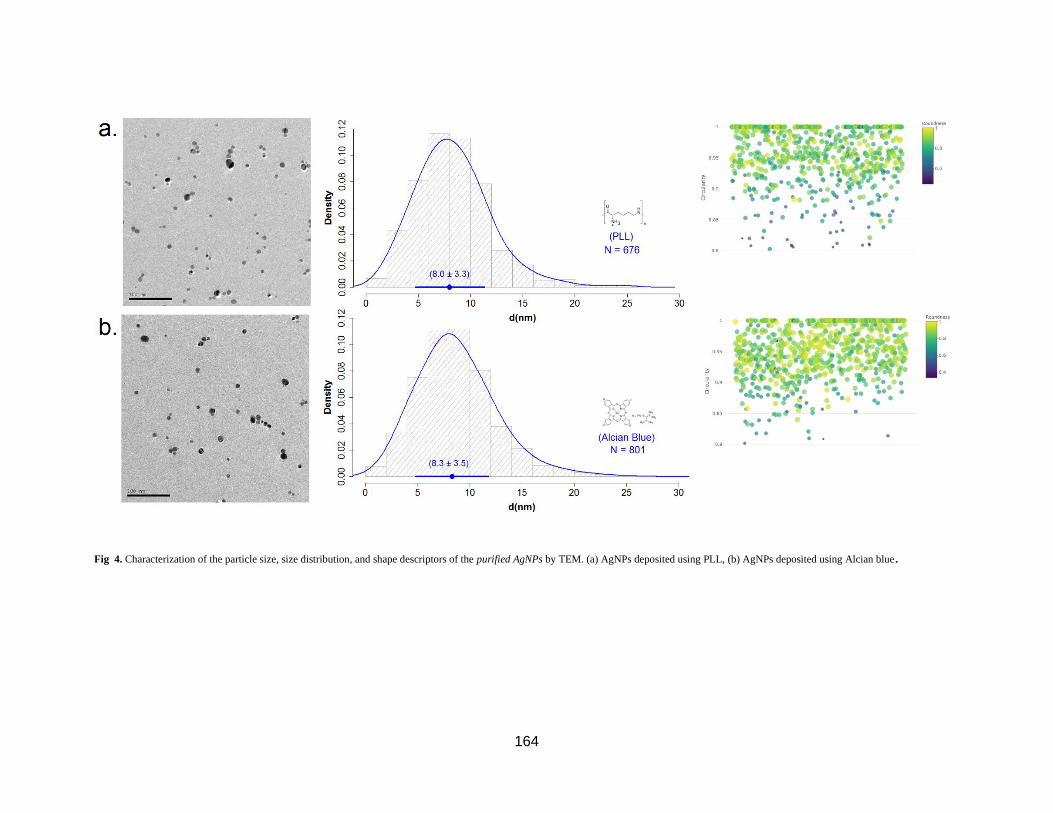
164
Fig 4. Characterization of the particle size, size distribution, and shape descriptors of the purified AgNPs by TEM. (a) AgNPs deposited using PLL, (b) AgNPs deposited using Alcian blue.
165
TEM size characterization of purified AgNPs was displayed in Fig 4. TEM images showed
that both deposition methods (PLL and Alcian blue) successfully promoted the deposition of clean
and single NPs of the purified sub-15 nm AgNPs with a minimal contribution of agglomerates and/or
artifacts. Note that more than 20 images for each deposition method were analyzed with a total
number of individual particles (N) of 676 and 801, respectively. This particle number was essential
to provide high statistical confidence72,73 and to decrease the uncertainty in the particle size
determination74. As can be seen in Fig 4, the particle size (median ± MAD) of AgNPs determined by
TEM using PLL and Alcian blue as functionalization agents was found to be 8.0 ± 3.3 nm (Fig 4.a),
and 8.3 ± 3.5 nm (Fig 4.b), respectively. Comparison of two means (Student t-test) indicated that no
significant differences at 95 % confidence (p <0.05) between both deposition methods were observed.
Therefore, both deposition methods can be used indistinctly to accurately characterize the particle
size of purified AgNPs. Due to the above, the final estimation of the particle size was a consensus
value between both TEM deposition methods, computed by the DerSimonian-Laird model using the
NIST consensus builder61. The estimation of the dispersion of the consensus value was carried out
using a parametric bootstrap. Thus, the consensus value for particle size of the purified AgNPs was
found to be 8.1 ± 2.4 nm with a 95% coverage interval that ranged from 3.4 nm to 13 nm (Fig 5),
which statistically demonstrated that purified AgNPs obtained by sonochemical method exhibited a
size distribution in the sub-15 nm scale.
The comparison of the particle size distribution of the raw AgNPs (9.1 ± 3.3) nm, Fig 2d the
purified AgNPs (Fig 4) demonstrated the effect of the purification step by centrifugation in the
narrowing of the particle size distribution mainly derived from the efficient elimination of a large
portion of AgNPs larger than 15 nm. Also, the functionalization of the TEM grids also helped to
reduce the dispersion of the determination of the size distribution since significantly minimized the
formation of artifacts and/or agglomerations during TEM measurements. In the case of the TEM
characterization of the raw AgNPs, the approach described above was not used in order to make a
quick and practical characterization of the raw material, which was presumed to be impure and to
need a subsequent purification process.
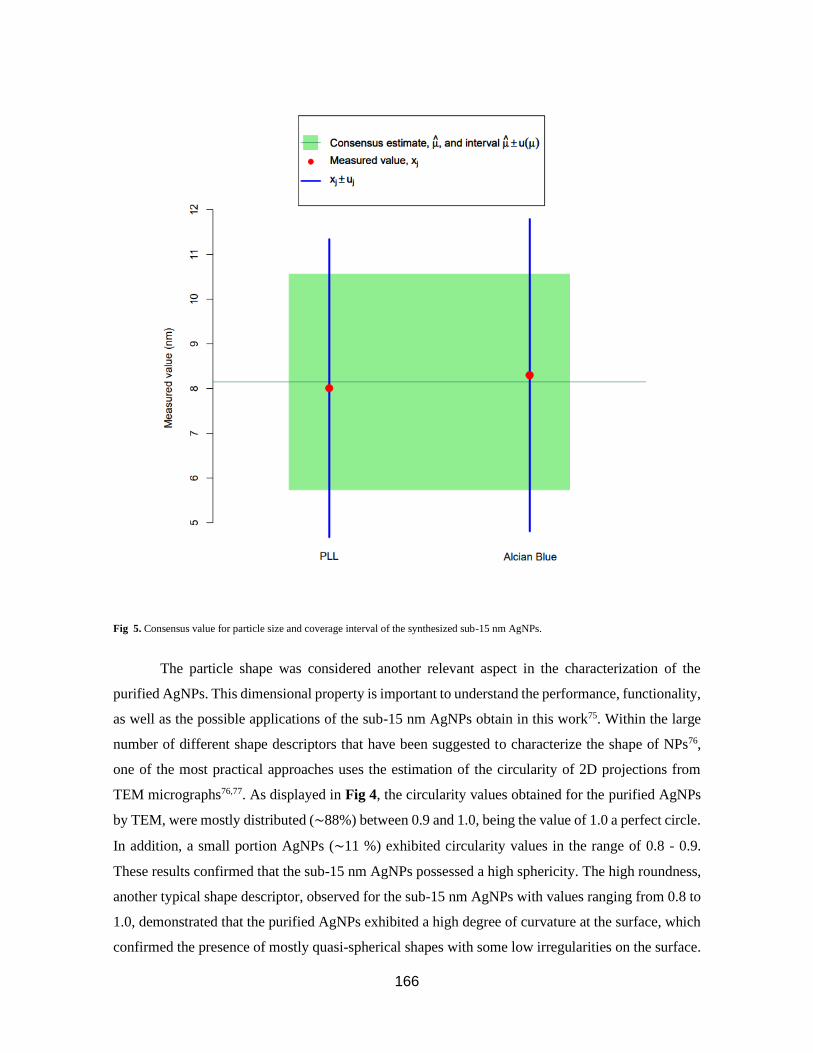
166
Fig 5. Consensus value for particle size and coverage interval of the synthesized sub-15 nm AgNPs.
The particle shape was considered another relevant aspect in the characterization of the
purified AgNPs. This dimensional property is important to understand the performance, functionality,
as well as the possible applications of the sub-15 nm AgNPs obtain in this work75. Within the large
number of different shape descriptors that have been suggested to characterize the shape of NPs76,
one of the most practical approaches uses the estimation of the circularity of 2D projections from
TEM micrographs76,77. As displayed in Fig 4, the circularity values obtained for the purified AgNPs
by TEM, were mostly distributed (~88%) between 0.9 and 1.0, being the value of 1.0 a perfect circle.
In addition, a small portion AgNPs (~11 %) exhibited circularity values in the range of 0.8 - 0.9.
These results confirmed that the sub-15 nm AgNPs possessed a high sphericity. The high roundness,
another typical shape descriptor, observed for the sub-15 nm AgNPs with values ranging from 0.8 to
1.0, demonstrated that the purified AgNPs exhibited a high degree of curvature at the surface, which
confirmed the presence of mostly quasi-spherical shapes with some low irregularities on the surface.
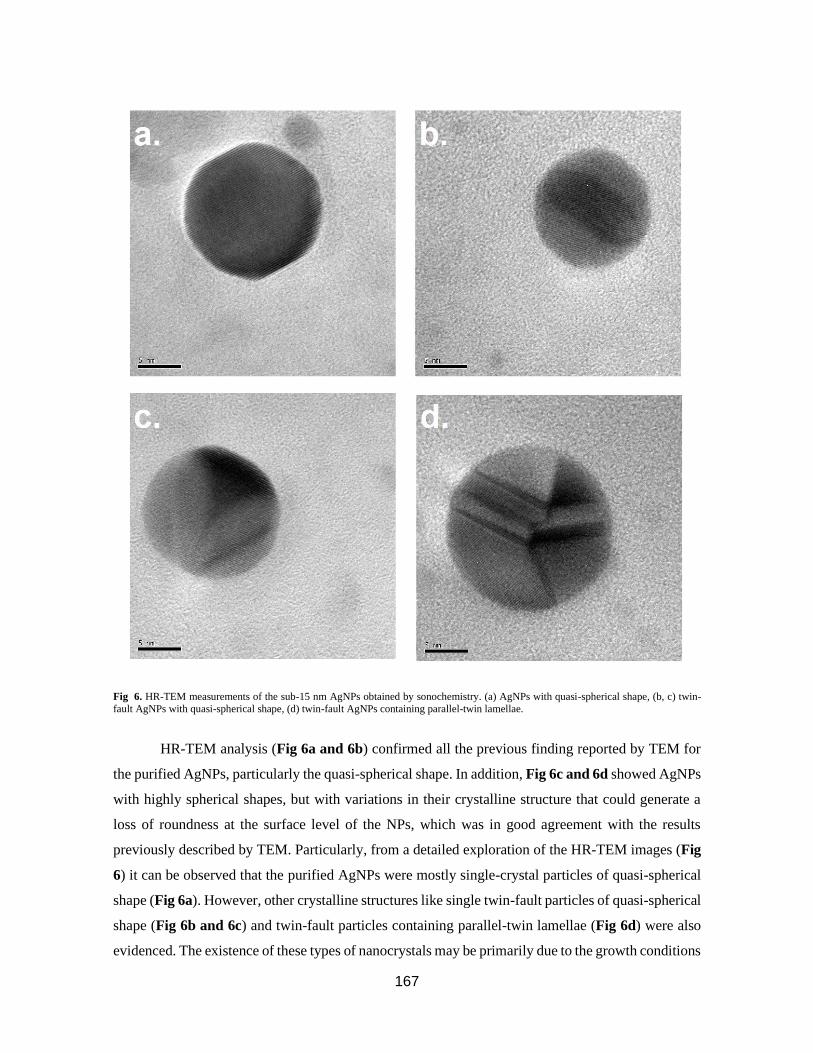
167
Fig 6. HR-TEM measurements of the sub-15 nm AgNPs obtained by sonochemistry. (a) AgNPs with quasi-spherical shape, (b, c) twin-
fault AgNPs with quasi-spherical shape, (d) twin-fault AgNPs containing parallel-twin lamellae.
HR-TEM analysis (Fig 6a and 6b) confirmed all the previous finding reported by TEM for
the purified AgNPs, particularly the quasi-spherical shape. In addition, Fig 6c and 6d showed AgNPs
with highly spherical shapes, but with variations in their crystalline structure that could generate a
loss of roundness at the surface level of the NPs, which was in good agreement with the results
previously described by TEM. Particularly, from a detailed exploration of the HR-TEM images (Fig
6) it can be observed that the purified AgNPs were mostly single-crystal particles of quasi-spherical
shape (Fig 6a). However, other crystalline structures like single twin-fault particles of quasi-spherical
shape (Fig 6b and 6c) and twin-fault particles containing parallel-twin lamellae (Fig 6d) were also
evidenced. The existence of these types of nanocrystals may be primarily due to the growth conditions
168
during sonochemical synthesis. In this context, it is well known77 that ultrasonic cavitation generates
hot spots with temperatures of ~5,000 °C, pressures of approximately 1,000 atm and heating and
cooling rates in excess of 1010 K s-1, which facilitates the generation of dramatic changes of the crystal
structures of the materials. In addition, as discussed above, sonochemical synthesis promotes the
coalescence or fusion of NPs as a mechanism of growth; therefore, the changes in the crystalline
structure of the NPs are primarily due to the ultrasonic treatment performed during the first minutes
of AgNPs synthesis.
Evaluation of the stability of the sub-15 nm AgNPs under different conditions.
Stability of sub-15 nm AgNPs under UV radiation (short-term stability)
Stability in terms of NPs size is defined as the preservation of the dimensionality of the NPs
during storage and/or experiment79. The limiting factor that hampers the implementation of sub-15
nm AgNPs with well-defined properties in the analytical and bioanalytical fields is the limited
stability because the high tendency to agglomeration, aggregation, and/or dissolution processes. For
this reason, a thorough evaluation of the stability of the synthesized sub-15 nm AgNPs under different
controlled storage and exposure conditions required to realistically assess their potential applications
and lifetime. In this context, monitoring the optical properties of purified AgNP suspension under
continuous exposure to UV radiation was selected as an accelerated test to evaluate the impact of a
highly energetic stimulus on the most relevant properties (median particle size, size dispersion, and
concentration) of AgNPs.
The evolution of the optical properties (SPR, absorbance, and FWHM) of the sub-15 nm
AgNPs when they were exposed to two types of irradiations in the UV region of the spectrum, UVA
(365 nm) and UVC (254 nm), was monitored every 20 min over a period of 600 min was illustrated
in Fig 7. In this study, a control sample was stored in the dark, covered with aluminum foil, and kept
under laboratory room conditions (20 °C, and relative humidity of 60 %). As can be seen in Fig 7
(blue dots) irradiation of the sub-15 nm AgNPs with UVA radiation induced a change in the optical
properties of the AgNPs from the beginning of the irradiation. In Fig 7a it can be observed how λSPR
(401 nm) was gradually shifted towards higher wavelengths until reaching a plateau at 405 nm for
300 min of irradiation. This shift in λSPR correlated with an increase in the particle size, as described
elsewhere66. Exposure to UVA radiation also caused a small increase in Absmax, which corresponded
with a small increase of the concentration of AgNPs in suspension. These results suggest that UVA
169
radiation has the ability to photo-induce an increase in the size of the sub-15 nm AgNPs, as well as
to generate the formation of new individual AgNPs due to its ability to oxidize the Cit- of the surface
of AgNPs41. The trend in λSPR also correlated with the results observed for FWHM (Fig 7b), that
gradually decreased reaching a minimum at 200 min of UVA exposure. Subsequently, the FWHM
increased slightly, however, it remains below that observed in the control sample (Fig 7b, red dots).
Therefore, the above result indicates that UVA radiation significantly reduced the polydispersity of
the size distribution of sub-15 nm AgNPs over time, which opens the opportunity for development of
new routes or treatments for the production of small AgNPs without changing significantly the
particle size, particle concentration, and improving its polydispersity of the size distribution.
A different behavior was observed for the stability study of AgNPs when under UVC (254
nm) irradiation. While both λSPR and FWHM gradually increased over time, AbsMAX drastically
decayed as a function of the exposure time to UVC radiation (Fig 7c).
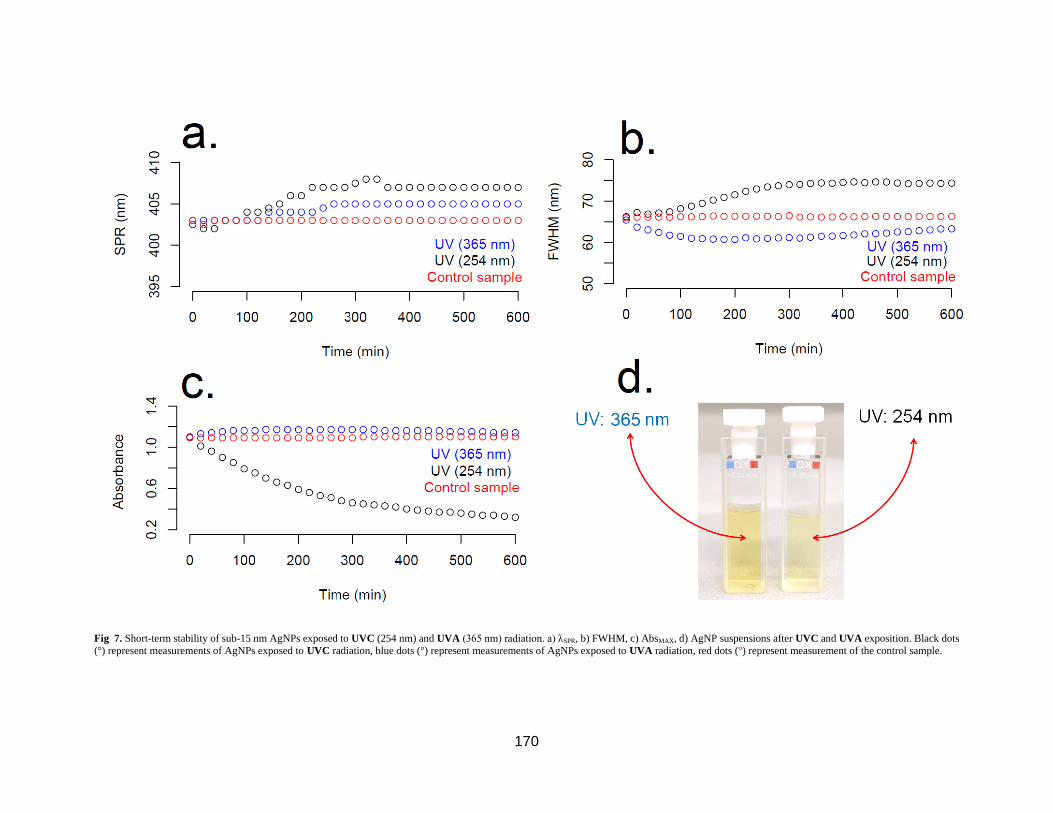
170
Fig 7. Short-term stability of sub-15 nm AgNPs exposed to UVC (254 nm) and UVA (365 nm) radiation. a) λSPR, b) FWHM, c) AbsMAX, d) AgNP suspensions after UVC and UVA exposition. Black dots
(°) represent measurements of AgNPs exposed to UVC radiation, blue dots (°) represent measurements of AgNPs exposed to UVA radiation, red dots (°) represent measurement of the control sample.
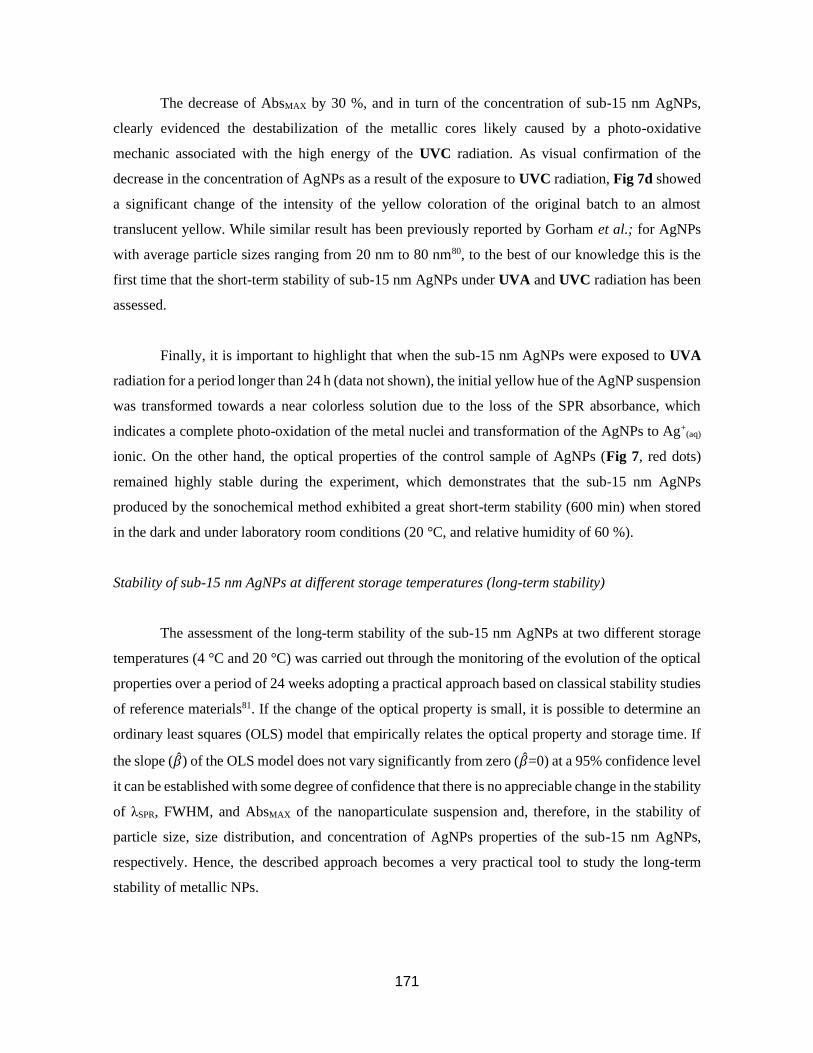
171
The decrease of AbsMAX by 30 %, and in turn of the concentration of sub-15 nm AgNPs,
clearly evidenced the destabilization of the metallic cores likely caused by a photo-oxidative
mechanic associated with the high energy of the UVC radiation. As visual confirmation of the
decrease in the concentration of AgNPs as a result of the exposure to UVC radiation, Fig 7d showed
a significant change of the intensity of the yellow coloration of the original batch to an almost
translucent yellow. While similar result has been previously reported by Gorham et al.; for AgNPs
with average particle sizes ranging from 20 nm to 80 nm80, to the best of our knowledge this is the
first time that the short-term stability of sub-15 nm AgNPs under UVA and UVC radiation has been
assessed.
Finally, it is important to highlight that when the sub-15 nm AgNPs were exposed to UVA
radiation for a period longer than 24 h (data not shown), the initial yellow hue of the AgNP suspension
was transformed towards a near colorless solution due to the loss of the SPR absorbance, which
indicates a complete photo-oxidation of the metal nuclei and transformation of the AgNPs to Ag+(aq)
ionic. On the other hand, the optical properties of the control sample of AgNPs (Fig 7, red dots)
remained highly stable during the experiment, which demonstrates that the sub-15 nm AgNPs
produced by the sonochemical method exhibited a great short-term stability (600 min) when stored
in the dark and under laboratory room conditions (20 °C, and relative humidity of 60 %).
Stability of sub-15 nm AgNPs at different storage temperatures (long-term stability)
The assessment of the long-term stability of the sub-15 nm AgNPs at two different storage
temperatures (4 °C and 20 °C) was carried out through the monitoring of the evolution of the optical
properties over a period of 24 weeks adopting a practical approach based on classical stability studies
of reference materials81. If the change of the optical property is small, it is possible to determine an
ordinary least squares (OLS) model that empirically relates the optical property and storage time. If
the slope (��) of the OLS model does not vary significantly from zero (��=0) at a 95% confidence level
it can be established with some degree of confidence that there is no appreciable change in the stability
of λSPR, FWHM, and AbsMAX of the nanoparticulate suspension and, therefore, in the stability of
particle size, size distribution, and concentration of AgNPs properties of the sub-15 nm AgNPs,
respectively. Hence, the described approach becomes a very practical tool to study the long-term
stability of metallic NPs.
172
Fig 8. Long-term stability of the sub-15 nm AgNPs stored at different temperature conditions (0 ºC and 20 ºC). The images illustrate the
OLS models of each optical property of the sub-15 AgNPs. The model OLS and t-Student test performed to the slope (��) is present in all
the images.
OLS regressions for each of the optical properties (λSPR, AbsMAX, FWHM) of the sub-15 nm
AgNPs obtained by the sonochemical method were plotted in Fig 8 for both storage conditions (4 °C
and 20 °C). In general, the slopes of the regressions did not vary significantly from zero (��=0) with
a level of confidence of 95% using a t-Student test with two degrees of freedom. Particularly, for the
storage at 4 °C (Fig 8a), λSPR remained practically unchanged (∆SPR ~ 1 nm) after 24 weeks, with a
slope statically equal to zero (��4 °𝐶𝑆𝑃𝑅= 0.043 nm weeks-1), which proved that the sub-15 nm AgNPs did
173
not experience a significant change in the median particle size. Furthermore, AbsMAX decreased by
less than 2% during 6 months of storage, resulting in a negative slope (��4 °𝐶𝐴𝑏𝑠= -0.001 weeks-1) that
indicated a minimal reduction of AgNPs concentration over time (Fig 8b). It seems very likely that
the slight loss in the absorbance was caused by the formation of a small portion of agglomerates
during the long storage period; a process kinetically unfavorable due to the low Brownian motion of
metallic NPs82 at low temperatures. In any case, the t-Student test indicated that ��4 °𝐶𝐴𝑏𝑠 did not differ
significantly from β =0 with a level of confidence of 95%, so it was possible to conclude that the
concentration of AgNPs did not vary significantly during the 6 months of storage. Similarly, while
��4 °𝐶𝐹𝑊𝐻𝑀 did not significantly differ from β =0, the slight increase in FWHM observed in Fig 8c might
be also attributed to the presence of a very small portion of agglomerates as discussed above. The
high long-term stability of the optical properties of sub-15 nm AgNPs at 4 °C was illustrated with the
perfect overlap of UV-Vis spectrum acquired at the beginning (T0) and at the end of the stability study
at 24 weeks (T24) as can be seen in Fig 8d.
On the other hand, a high long-term stability of the optical properties of the sub-15 nm AgNPs
stored at 20 °C was observed, similar to that previously described at 4 °C. Surprisingly, while ��20 °𝐶𝑆𝑃𝑅
did not significantly differ from ��=0, ��20 °𝐶𝑆𝑃𝑅 was found to be approximately the doble larger than ��4 °𝐶
𝑆𝑃𝑅
(Fig 8e). Thus, long term storage at 20 ° C seemed to cause a larger shift of λSPR (~2 nm) and
consequently of the particle size than 4 ° C. This finding agreed with the theories of NPs growth that
described that a rise in temperature can boost the diffusion of leftover monomers around the surface
of NPs65. In the case of the dispersion of the size distribution (Fig 8f) and concentration (Fig 8g) of
the sub-15 nm AgNPs, the stability study showed a slight increase of FWHM, AbsMAX (~ 2%), as well
as a higher variability of the OLS model residuals for the storage at 20 °C. These results could be
attributed to Ostwald ripening processes between the thermodynamically less stable AgNPs65.
However, further studies with alternative analytical techniques such as small-angle X-ray scattering
(USAXS) or in situ liquid TEM would be necessary for a more definite identification of the
mechanisms responsible for the change in the optical properties during long-term storage. The
comparison between UV-Vis spectra of AgNPs at the beginning of the stability study (T0) and at the
end of the stability study at 20 °C for a period of 24 weeks (T24), confirmed a minimal change in the
shape of the spectra UV-Vis, as observed for storage at 4 ° C (Fig 8h).
Overall, the high long-term stability achieved for the synthesized sub-15 nm AgNPs is a very
promising finding compared to the stability results reported for AgNPs with similar stabilizing agents
and particle size. Specifically, Izak-Na et al.;83 conducted a stability study for ~6 nm citrated-capped
174
AgNPs, synthesized by chemical reduction method, stored at laboratory temperature over a period of
6 months. A noticeable change in the UV-Vis spectrum, with a substantial decrease (~ 30 % loss) of
AbsMAX, as well as a redshift of λSPR were reported, which suggests a decrease in AgNP concentration
and an appreciable increase in particle size. The difference in long-term stability between both studies
could be attributed to the novel pathway proposed in this study.
CONCLUSIONS
The present investigation demonstrates the potential of a new sonochemical synthesis route
for the production of sub-15 nm AgNPs with high sphericity and high stability in aqueous media. A
multi-technique characterization of the evolution of AgNPs during sonochemical synthesis provided
a deeper understanding of the nucleation, growth, and destabilization processes. Alternatively,
thorough characterization of the raw AgNPs allowed to design a simple and direct purification
strategy based on centrifugation to remove coarse impurities (aggregates and large particle size
particles) generated as secondary products of the sonochemical irradiation and coalescence of NPs
during the synthesis process. TEM characterization, performed using different functionalization
strategies for the deposition of the AgNP suspensions, consistently revealed that the AgNPs obtained
by sonochemical method and purified by centrifugation exhibited a median particle size in the sub-
15 nm scale. These results also confirmed the quasi-spherical nature of the AgNPs with a high level
of circularity and roundness with different types of twin-faults in their crystalline structure created by
the high energy of the sonochemical treatment.
In this study, it was clearly demonstrated that the AgNPs synthesized by the sonochemical
method presented a high short-term stability under laboratory conditions. Furthermore, the stability
studies of the sub-15 nm AgNPs under UV light exposure indicated that UVA radiation favored the
improvement of some optical properties and consequently of their dimensional properties. This
finding opens the door to the development of new routes or treatments for the production of small
AgNPs with improved dimensional properties. On the other hand, it was described how UVC
radiation can significantly impacts the stability of the AgNPs metal nuclei, increasing the particle
size, generating a greater polydispersity, and decreasing substantially the particle concentration.
Finally, the good long-term stability under different storage conditions (4°C and 20°C) of the
optical properties of the synthesized sub-15 nm AgNPs over a period of 6 months make them a very
175
attractive candidate nanomaterial for the development of advanced applications in varying fields such
as development of reference materials, nanometrology, photovoltaic cells, nano-fluidics, nano-
catalysis (solid-liquid), innovative textile applications, medicine, biomedicine, biosensors, among
others.
ACKNOWLEDGEMENTS
The authors would like to thank the Journal of Chemistry of Materials reviewers for their
very useful comments and suggestions. Special thanks are due to the Inorganic Chemical Metrology
Group (ICMG) and International Affairs and Academic Office (IAAO) of NIST for supporting this
research, specifically to Dr. Michael Winchester, Dr. Claire Saundry, and M.S. Magdalena Navarro.
CONFLICTS OF INTEREST STATEMENT
The authors declare that the research was conducted in the absence of any commercial or
financial relationships that could be construed as a potential conflict of interest.
NOTE
Certain trade names and company products are mentioned in the text or identified in
illustrations to specify adequately the experimental procedure and equipment used. In no case does
such identification imply recommendation or endorsement by the institutions involve in this research
nor does it imply that the products are necessarily the best available for the purpose. The authors
declare no competing financial interest.
176
REFERENCES
1. Calderón-Jiménez, B.; Johnson, M. E.; Montoro Bustos, A. R.; Murphy, K. E.; Winchester, M. R.; Vega Baudrit, J. R. Silver
Nanoparticles: Technological Advances, Societal Impacts, and Metrological Challenges. Front. Chem. 2017, 5, 6, DOI: 10.3389/fchem.2017.00006
2. Deshmukh, S. P.; Patil, S. M.; Mullani, S. B.; Delekar, S. D. Silver nanoparticles as an effective disinfectant: A review. Mater.
Sci. Eng. C. 2019, C, 97, 954-965, DOI:10.1016/j.msec.2018.12.102 3. Koduru, J. R.; Kailasa, S. K.; Bhamore, J. R.; Kim, K. H.; Dutta, T.; Vellingiri, K. Phytochemical-assisted synthetic approaches
for silver nanoparticles antimicrobial applications: A review. Adv. Colloid Interfac. 2018, 256, 326-339,
DOI:10.1016/j.cis.2018.03.001 4. Balagna, C.; Perero, S.; Percivalle, E.; Nepita, E. V.; Ferraris, M. Virucidal effect against coronavirus SARS-CoV-2 of a silver
nanocluster/silica composite sputtered coating. Open Ceram. 2020, 1, 100006, DOI: 10.1016/j.oceram.2020.100006
5. Dong, X. Y.; Gao, Z. W.; Yang, K. F.; Zhang, W. Q.; Xu, L. W. Nanosilver as a new generation of silver catalysts in organic
transformations for efficient synthesis of fine chemicals. Catal. Sci: Technol. 2015, 5, 5, 2554-2574, DOI: 10.1039/C5CY00285K
6. Pulizzi, F. Nanotechnology in food: Silver-lined packaging. Nat. Nanotechnol. 2016, 1-1, DOI: 10.1038/nnano.2016.11
7. Butola, B. S.; Mohammad, F. Silver nanomaterials as future colorants and potential antimicrobial agents for natural and synthetic textile materials. RSC Adv. 2016, 6, 50, 44232-44247, DOI: 10.1039/C6RA05799C
8. Mota, D. R.; Lima, G. A. S.; Helene, G. B.; Pellosi, D. S. Tailoring Nanoparticle Morphology to Match Application: Growth under Low-Intensity Polychromatic Light Irradiation Governs the Morphology and Optical Properties of Silver Nanoparticles.
ACS Appl. Nano Mater. 2020, 3, 5, 4893-4903, DOI: 10.1021/acsanm.0c01078
9. Dou, Z.; Zhao, Z.; Zhang, M.; Xie, Y.; Yu, W.; Chen, Y. (2020). Uniform Near-Spherical Nanoscale Silver Films for Surface-Enhanced Raman Spectroscopy Sensing. ACS Appl. Nano Mater. 2020, 3, 2, 2008-2015, DOI: 10.1021/acsanm.0c00084
10. Fathi-Achachelouei, M.; Knopf-Marques, H.; Ribeiro da Silva, C. E.; Barthès, J.; Bat, E.; Tezcaner, A.; Vrana, N. E. Use of
nanoparticles in tissue engineering and regenerative medicine. Front. Bioeng. Biotechnol. 2019, 7, 113, DOI: 10.3389/fbioe.2019.00113
11. Ramesh, S.; Grijalva, M.; Debut, A.; Beatriz, G.; Albericio, F.; Cumbal, L. H. Peptides conjugated to silver nanoparticles in
biomedicine–a “value-added” phenomenon. Biomater. Sci. 2016, 4, 12, 1713-1725, DOI: 10.1039/C6BM00688D 12. Gherasim, O.; Puiu, R. A.; Bîrcă, A. C.; Burdușel, A. C.; Grumezescu, A. M. An Updated Review on Silver Nanoparticles in
Biomedicine. Nanomaterial, 2020, 10, 11, 2318, DOI: 10.3390/nano10112318
13. Tschulik, K.; Batchelor-McAuley, C.; Toh, H. S.; Stuart, E. J.; Compton, R. G. Electrochemical studies of silver nanoparticles: a guide for experimentalists and a perspective. Phys. Chem. Chem. Phys. 2014, 16, 2, 616-623, DOI: 10.1039/C3CP54221A
14. Panácek, A.; Prucek, R.; Hrbác, J.; Nevecná, T. J.; Šteffková, J.; Zboril, R.; Kvitek, L. Polyacrylate-assisted size control of
silver nanoparticles and their catalytic activity. Chem. Mater. 2014, 26, 3, 1332-1339, DOI: 10.1021/cm400635z 15. Du, C.; Lan, X.; An, G.; Li, Q.; Bai, G. Direct Surface Modification of Graphitic C3N4 with Porous Organic Polymer and Silver
Nanoparticles for Promoting CO2 Conversion. ACS Sustain. Chem. Eng. 2020. 8, 18, 7051-7058, DOI: 10.1021/acssuschemeng.0c00771
16. Togashi, T.; Tsuchida, K.; Soma, S.; Nozawa, R.; Matsui, J.; Kanaizuka, K.; Kurihara, M. Size-Tunable Continuous-Seed-
Mediated Growth of Silver Nanoparticles in Alkylamine Mixture via the Stepwise Thermal Decomposition of Silver
Oxalate. Chem. Mater. 2020, 32, 21, 9363-9370, DOI:10.1021/acs.chemmater.0c03303
17. Cascio, C.; Geiss, O.; Franchini, F.; Ojea-Jimenez, I.; Rossi, F.; Gilliland, D.; Calzolai, L. Detection, quantification and derivation of number size distribution of silver nanoparticles in antimicrobial consumer products. J. Anal. At. Spectrom.
2015, 30, 6, 1255-1265, DOI: 10.1039/C4JA00410H
18. Steiner, A. M.; Mayer, M.; Schletz, D.; Wolf, D.; Formanek, P.; Hübner, R.; Dulle,M.; Förster, S.; König, T.A.F.; Fery, A. Silver particles with rhombicuboctahedral shape and effective isotropic interactions with light. Chem. Mater. 2019, 31, 8, 2822-
2827, DOI:10.1021/acs.chemmater.8b05220
19. Cobley, C. M.; Skrabalak, S. E.; Campbell, D. J.; Xia, Y. Shape-controlled synthesis of silver nanoparticles for plasmonic and sensing applications. Plasmon. 2009, 4, 2, 171-179, DOI:10.1007/s11468-009-9088-0
20. Lin, X.; Lin, S.; Liu, Y.; Gao, M.; Zhao, H.; Liu, B.; Hasi, W.; Wang, L. Facile synthesis of monodisperse silver nanospheres
in aqueous solution via seed-mediated growth coupled with oxidative etching. Langmuir, 2018. 34, 21, 6077-6084, DOI: 10.1021/acs.langmuir.7b04343
21. Dai, X.; Li, Q.; Aldalbahi, A.; Wang, L.; Fan, C.; Liu, X. (2020). DNA-based fabrication for nanoelectronics. Nano. Lett. 2020,
20, 8, 5604-5615, DOI: 10.1021/acs.nanolett.0c02511 22. Huy, T. Q.; Huyen, P.; Le, A. T.; Tonezzer, M. Recent advances of silver nanoparticles in cancer diagnosis and treatment. Curr.
Med. Chem. Anticancer Agents. 2020, 20, 11, 1276-1287.DOI: 10.2174/1871520619666190710121727
23. Hepokur, C.; Kariper, İ. A.; Mısır, S.; Ay, E.; Tunoğlu, S.; Ersez, M. S.; Zeybek, Ü.; ErdemKuruca, S.; Yaylım, İ. Silver nanoparticle/capecitabine for breast cancer cell treatment. Toxicol. In Vitro, 2019, 61, 104600, DOI: 10.1016/j.tiv.2019.104600
24. Chu, H. W.; Lai, C. S.; Ko, J. Y.; Harroun, S. G.; Chuang, C. I.; Wang, R. Y.; Unnikrishnan, B.; Huang, C. C. Nanoparticle-
based LDI-MS immunoassay for the multiple diagnosis of viral infections. ACS Sens. 2019, 4, 6, 1543-1551, DOI: 10.1021/acssensors.9b00054
25. Dakal, T. C.; Kumar, A.; Majumdar, R. S.; Yadav, V. Mechanistic basis of antimicrobial actions of silver nanoparticles. Front.
microbiol. 2016, 7, 1831. DOI: 10.3389/fmicb.2016.0
26. Sharma, V. P.; Sharma, U.; Chattopadhyay, M.; Shukla, V. N. Advance applications of nanomaterials: a review. Mater. Today-Proceedings. 2018, 5, 2, 6376-6380, DOI: 10.1016/j.matpr.2017.12.248
27. Xing, L.; Xiahou, Y.; Zhang, P.; Du, W.; Xia, H. Size control synthesis of monodisperse, quasi-spherical silver nanoparticles to
realize surface-enhanced Raman scattering uniformity and reproducibility. ACS Appl. Mater. Interfaces. 2019, 11, 19, 17637-17646, DOI: 10.1021/acsami.9b02052
177
28. Chen, S.; Penn, R. L. Controlled Growth of Silver Nanoparticle Seeds Using Green Solvents. Cryst. Growth Des. 2019, 19, 8,
4332-4339, DOI:10.1021/acs.cgd.9b00051
29. Agnihotri, S.; Mukherji, S.; Mukherji, S. Size-controlled silver nanoparticles synthesized over the range 5–100 nm using the same protocol and their antibacterial efficacy. RSC Adv. 2014, 4, 8, 3974-3983, DOI: 10.1039/C3RA44507K
30. Dondi, R.; Su, W.; Griffith, G. A.; Clark, G.; Burley, G. A. Highly Size and Shape Controlled Synthesis of Silver Nanoparticles
via a Templated Tollens Reaction. Small, 2012, 8, 5, 770-776, DOI: 10.1002/smll.201101474 31. Bastús, N. G.; Merkoci, F.; Piella, J.; Puntes, V. Synthesis of highly monodisperse citrate-stabilized silver nanoparticles of up
to 200 nm: kinetic control and catalytic properties. Chem. Mater. 2014, 26, 9, 2836-2846, DOI: 10.1021/cm500316k
32. Feng, X.; Han, T.; Xiong, Y.; Wang, S.; Dai, T.; Chen, J.; Zhang, X.; Wang, G. Plasmon-enhanced electrochemiluminescence of silver nanoclusters for microRNA detection. ACS Sens. 2019, 4, 6, 1633-1640, DOI: 10.1021/acssensors.9b00413
33. Betancourt, A. P.; Goswami, D. Y.; Bhethanabotla, V. R.; Kuhn, J. N. Scalable and stable silica-coated silver nanoparticles,
produced by electron beam evaporation and rapid thermal annealing, for plasmon-enhanced photocatalysis. Catal. Commun. 2021, 149, 106213, DOI: 10.1016/j.catcom.2020.106213
34. Wuithschick, M.; Paul, B.; Bienert, R.; Sarfraz, A.; Vainio, U.; Sztucki, M.; Kraehnert, Ralph.; Strasser, P.; Rademann, K.;
Emmerling, F.; Polte, J. Size-controlled synthesis of colloidal silver nanoparticles based on mechanistic understanding. Chem. Mater. 2013, 25, 23, 4679-4689, DOI: 10.1021/cm401851g
35. Pryshchepa, O.; Pomastowski, P.; Buszewski, B. Silver nanoparticles: Synthesis, investigation techniques, and properties. Adv.
Colloid Interface Sci.; 2020. 102246, DOI:10.1016/j.cis.2020.102246 36. Doty, R. C.; Tshikhudo, T. R.; Brust, M.; Fernig, D. G. Extremely stable water-soluble Ag nanoparticles. Chem. Mater.
2005, 17, 18, 4630-4635, DOI: 10.1021/cm0508017
37. Skewis, L. R.; Reinhard, B. M. Control of colloid surface chemistry through matrix confinement: facile preparation of stable
antibody functionalized silver nanoparticles. ACS Appl. Mater. Interfaces, 2010, 2, 1, 35-40.https://doi.org/10.1021/am900822f 38. Balachandran, Y. L.; Girija, S.; Selvakumar, R.; Tongpim, S.; Gutleb, A. C.; Suriyanarayanan, S. Differently environment stable
bio-silver nanoparticles: study on their optical enhancing and antibacterial properties. PLoS One, 2013, 8, 10, e77043.DOI: 10.1371/journal.pone.0077043
39. Krutyakov, Y. A.; Kudrinsky, A. A.; Olenin, A. Y.; Lisichkin, G. V. Synthesis of highly stable silver colloids stabilized with
water soluble sulfonated polyaniline. Appl Surf Sci. 2010, 256, 23, 7037-7042, DOI: 10.1016/j.apsusc.2010.05.020
40. Deng, S. P.; Zhang, J. Y.; Ma, Z. W.; Wen, S.; Tan, S.; Cai, J. Y. Facile Synthesis of Long-Term Stable Silver Nanoparticles by Kaempferol and Their Enhanced Antibacterial Activity Against Escherichia coli and Staphylococcus aureus. J. Inorg.
Organomet. Polym. Mater. 2021, 1-13. DOI: 10.1007/s10904-020-01874-2
41. Gorham, J. M.; Rohlfing, A. B.; Lippa, K. A.; MacCuspie, R. I.; Hemmati, A.; Holbrook, R. D. Storage Wars: how citrate-capped silver nanoparticle suspensions are affected by not-so-trivial decisions. J. Nanoparticle Res. 2014, 16, 4, 1-14.
DOI:10.1007/s11051-014-2339-9
42. Chuan, J.; Li, Y.; Yang, L.; Sun, X.; Zhang, Q.; Gong, T.; Zhang, Z. Enhanced rifampicin delivery to alveolar macrophages by solid lipid nanoparticles. J. Nanoparticle Res. 2013, 15, 5, 1-9, DOI: 10.1007/s11051-017-3860-4
43. Hinman, J. J.; Suslick, K. S. Nanostructured materials synthesis using ultrasound. Sonochemistry, 2017, 59-94.DOI:
10.1007/s41061-016-0100-9
44. Kumar, A.; Mishra, B.; Tripathi, B. P. Polydopamine assisted synthesis of ultrafine silver nanoparticles for heterogeneous
catalysis and water remediation. Nano-Struct. Nano-Objects, 2020. 23, 100489.10.1016/j.nanoso.2020.100489
45. Bang, J. H.; Suslick, K. S. Applications of ultrasound to the synthesis of nanostructured materials.Adv. Mater. 2010, 22, 10, 1039-1059, DOI: 10.1002/adma.200904093
46. Shi, Y.; Zhu, C.; Wang, L.; Zhao, C.; Li, W.; Fung, K. K.; Ma, T.; Hagfeldt, A.; Wang, N. Ultrarapid sonochemical synthesis
of ZnO hierarchical structures: from fundamental research to high efficiencies up to 6.42% for quasi-solid dye-sensitized solar cells. Chem. Mater. 2013, 25, 6, 1000-1012, DOI: 10.1021/cm400220q
47. Iizuka, A.; Takeda, S.; Kumagai, K.; Yanagisawa, Y.; Yamasaki, A. Acceleration of the Rate of Silver Nanoparticle Formation
Using Microbubbles in a Sonochemical Process. Chem. Eng. Commun. 2017, 204, 3, 321-326, DOI: 10.1080/00986445.2016.1262360
48. Xu, H.; Suslick, K. S. Sonochemical synthesis of highly fluorescent Ag nanoclusters. ACS nano, 2010. 4, 6, 3209-3214.DOI:
https://doi.org/10.1021/nn100987k 49. Mousavi, M. F.; Ghasemi, S. 2011. Sonochemistry: A Suitable Method for Synthesis of Nano-structured Materials. Nova
Science Publishers. ISBN: 978-1-61761-310-4
50. Zhou, T.; Rong, M.; Cai, Z.; Yang, C. J.; Chen, X. Sonochemical synthesis of highly fluorescent glutathione-stabilized Ag nanoclusters and S 2− sensing. Nanoscale, 2012, 4, 14, 4103-4106, DOI: https://doi.org/10.1039/C2NR30718A
51. https://www-s.nist.gov/srmors/certificates/2034.pdf
52. Calderón-Jiménez, B.; Sarmanho, G.; Murphy, K. E.; Montoro-Bustos, A. R.; Vega-Baudrit, J. NanoUV-VIS: An Interactive Visualization Tool for Monitoring the Evolution of Optical Properties of Nanoparticles Throughout Synthesis Reaction, J. Res.
Natl. Inst. Stan. 2017, 122, 37, DOI: 10.6028/jres.122.037
53. NanoUV-VIS. 2021. GitHub repo, DOI: 10.18434/M3T952 54. ASTM E2859-11, Standard Guide for Size Measurement of Nanoparticles Using Atomic Force Microscopy, ASTM
International, West Conshohocken, PA, 2011, www.astm.org. DOI: 10.1520/E2859-11
55. Necas, D.; Klapetek, P. Gwyddion–Free SPM (AFM, SNOM/NSOM, STM, MFM) Data Analysis Software.2020. http://gwyddion. net (Data of access: 2020).
56. Mast, J.; Demeestere, L. Electron tomography of negatively stained complex viruses: application in their diagnosis. Diagn.
Pathol. 2009, 4, 1, 1-7, DOI:10.1186/1746-1596-4-5 57. Mazia, D.; Schatten, G.; Sale, W. Adhesion of cells to surfaces coated with polylysine. Applications to electron microscopy. J.
Cell Biol. 1975. 66, 1, 198-200, DOI: 10.1083/jcb.66.1.198
58. Plotly. 2021. Plotly R Open-Source Graphing Library (Electronic resource: 2020). Mode of access: https://plotly.com/r/ 59. Venables, W. N.; Ripley, B. D. 2013. Modern applied statistics with S-PLUS. Springer Science & Business Media.
60. Koepke, A.; Lafarge, T.; Possolo, A.; Toman, B. Consensus building for interlaboratory studies, key comparisons, and meta-
analysis. Metrologia, 2017, 54, 3, S34, DOI:10.1088/1681-7575/aa6c0e
178
61. Koepke A, Lafarge T, Toman B, Possolo A. 2017. NIST consensus builder — user’s manual. National Institute of Standards
and Technology, Gaithersburg, MD. https://consensus.nist.gov.
62. Sander, J. R.; Zeiger, B. W.; Suslick, K. S. Sonocrystallization and sonofragmentation. Ultrason. Sonochem. 2014, 21, 6, 1908-1915, DOI: 10.1016/j.ultsonch.2014.02.005
63. Gommes, C. J. Ostwald ripening of confined nanoparticles: chemomechanical coupling in nanopores. Nanoscale, 2019, 11, 15,
7386-7393, DOI: 10.1039/C9NR01349K 64. Ingham, B.; Lim, T. H.; Dotzler, C. J.; Henning, A.; Toney, M. F.; Tilley, R. D. How nanoparticles coalesce: an in-situ study of
Au nanoparticle aggregation and grain growth. Chem. Mater. 2011, 23, 14, 3312-3317, DOI: 10.1021/cm200354d
65. Thanh, N. T.; Maclean, N.; Mahiddine, S. Mechanisms of nucleation and growth of nanoparticles in solution. Chem. Rev. 2014, 114, 15, 7610-7630, DOI: 10.1021/cr400544s
66. Paramelle, D.; Sadovoy, A.; Gorelik, S.; Free, P.; Hobley, J.; Fernig, D. G. A rapid method to estimate the concentration of
citrate capped silver nanoparticles from UV-visible light spectra. Analyst, 2014, 139, 19, 4855-4861, DOI:10.1039/C4AN00978A
67. Ganguly, S.; Chakraborty, S. Sedimentation of nanoparticles in nanoscale colloidal suspensions. Phys. Lett. A, 2011, 375, 24,
2394-2399, DOI: 10.1016/j.physleta.2011.04.018 68. Doktycz, S. J.; Suslick, K. S. Interparticle collisions driven by ultrasound. Science, 1990, 247, 4946, 1067-1069,
DOI:10.1126/science.2309118
69. Qiu, P.; Mao, C. Viscosity gradient as a novel mechanism for the centrifugation‐based separation of nanoparticles. Adv. Mater. 2011, 23, 42, 4880-4885, DOI: 10.1002/adma.201102636
70. Dong, F.; Valsami-Jones, E.; Kreft, J. U. New, rapid method to measure dissolved silver concentration in silver nanoparticle
suspensions by aggregation combined with centrifugation. J. Nanoparticle Res. 2016, 18, 9, 1-12, DOI: 10.1007/s11051-016-3565-0
71. Loza, K.; Epple, M. Silver nanoparticles in complex media: an easy procedure to discriminate between metallic silver
nanoparticles, reprecipitated silver chloride, and dissolved silver species. RSC Adv. 2018, 8, 43, 24386-24391, DOI: 10.1039/C8RA04500C,
72. Rice, S. B.; Chan, C.; Brown, S. C.; Eschbach, P.; Han, L.; Ensor, D. S.; Stefaniak, A.B.; Bonevich, J.; Vladár,A.E.; Hight-
Walker, A.R.; Zheng, J.; Starnes, C.; Stromberg, A.; Ye, J.; Grulke, E. A. Particle size distributions by transmission electron microscopy: an interlaboratory comparison case study. Metrologia, 2013, 50, 6, 663, DOI: 10.1088/0026-1394/50/6/663
73. Montoro Bustos, A. R.; Purushotham, K. P.; Possolo, A.; Farkas, N.; Vladár, A. E.; Murphy, K. E.; Winchester, M. R. Validation
of single particle ICP-MS for routine measurements of nanoparticle size and number size distribution. Anal. Chem. 2018, 90, 24, 14376-14386, DOI: 10.1021/acs.analchem.8b03871
74. De Temmerman, P. J.; Lammertyn, J.; De Ketelaere, B.; Kestens, V.; Roebben, G.; Verleysen, E.; Mast, J. Measurement
uncertainties of size, shape, and surface measurements using transmission electron microscopy of near-monodisperse, near-spherical nanoparticles. J. Nanoparticle Res. 2014, 16, 1, 1-22, DOI: 10.1007/s11051-013-2177-1
75. González, E.; Arbiol, J.; Puntes, V. F. Carving at the nanoscale: sequential galvanic exchange and Kirkendall growth at room
temperature. Science, 2011, 334, 6061, 1377-1380, DOI: 10.1126/science.1212822 76. Kopanja, L.; Žunić, D.; Loncar, B.; Gyergyek, S.; Tadić, M. Quantifying shapes of nanoparticles using modified circularity and
ellipticity measures. Measurement, 2016, 92, 252-263, DOI: 10.1016/j.measurement.2016.06.021
77. Pokhrel, N.; Vabbina, P. K.; Pala, N. Sonochemistry: science and engineering. Ultrason. Sonochem. 2016, 29, 104-128, DOI: 10.1016/j.ultsonch.2015.07.023
78. Radziuk, D.; Grigoriev, D.; Zhang, W.; Su, D.; Mohwald, H.; Shchukin, D. Ultrasound-assisted fusion of preformed gold
nanoparticles. J. Phys. Chem. C. 2010, 114, 4, 1835-1843, DOI: 10.1021/jp910374s 79. Phan, H. T.; Haes, A. J. What does nanoparticle stability mean?. J. Phys. Chem. C. 2019, 123, 27, 16495-16507, DOI:
10.1021/acs.jpcc.9b00913
80. Gorham, J. M.; MacCuspie, R. I.; Klein, K. L.; Fairbrother, D. H.; Holbrook, R. D. UV-induced photochemical transformations of citrate-capped silver nanoparticle suspensions. J. Nanoparticle Res. 2012, 14, 10, 1-16, DOI:10.1007/s11051-012-1139-3
81. Van der Veen, A. M.; Linsinger, T. P.; Lamberty, A.; Pauwels, J. Uncertainty calculations in the certification of reference
materials. Accreditation Qual. Assur. 2001, 6, 6, 257-263, DOI: 10.1007/s007690000292 82. Wijenayaka, L. A.; Ivanov, M. R.; Cheatum, C. M.; Haes, A. J. Improved parametrization for extended Derjaguin, Landau,
Verwey, and Overbeek predictions of functionalized gold nanosphere stability. J. Phys. Chem. C. 2015, 119, 18, 10064-10075,
DOI: 10.1021/acs.jpcc.5b00483 83. Izak-Nau, E.; Huk, A.; Reidy, B.; Uggerud, H.; Vadset, M.; Eiden, S.; Voetz, M.; Himly, M.; Duschl, A.; Dusinskac, M, Lynch,
I. Impact of storage conditions and storage time on silver nanoparticles' physicochemical properties and implications for their biological effects. RSC Adv. 2015, 5, 102, 84172-84185, DOI: 10.1039/C5RA10187E
176
6.3 Supporting Information
Novel pathway for the sonochemical for the synthesis of
silver nanoparticles with near-spherical shape and high
stability in aqueous media
Bryan Calderón-Jiménez1,2,3*, Antonio R. Montoro Bustos4, Reinaldo Pereira Reyes2, Sergio A.
Paniagua2 and José R. Vega-Baudrit2
1Chemical Metrology Division, National Metrology Laboratory of Costa Rica (LCM), SJ, CR.
2National Laboratory of Nanotechnology, National Center of High Technology, San Jose, Costa Rica
3Ph.D Program in Natural Science for Development (DOCINADE), Technological Institute of Costa
Rica, National University, State Distance University, CR.
4Material Measurement Laboratory, Chemical Sciences Division, National Institute of Standards and
Technology, Gaithersburg, MD, USA
ABSTRACT:
This supplementary material shows the results obtained in the on-line monitoring carried out by UV-Vis
spectroscopy of the sonochemical synthesis of AgNPs (2D and 3D plots), as well as a diagram of the
equipment used to monitor the evolution of the optical properties of the NPs. In addition, results of the
AFM measurements developed during the monitoring of the synthesis are shown to confirm the generation
of agglomerations and aggregates. Estimates of the particle size distribution (using AFM) during synthesis
monitoring as well as a statistical summary of these size distributions is detailed. Finally, information is
provided on the TEM images of the aggregates formed during the synthesis and separation during the
purification process.
*Correspondence:
Bryan Calderón Jiménez, [email protected]
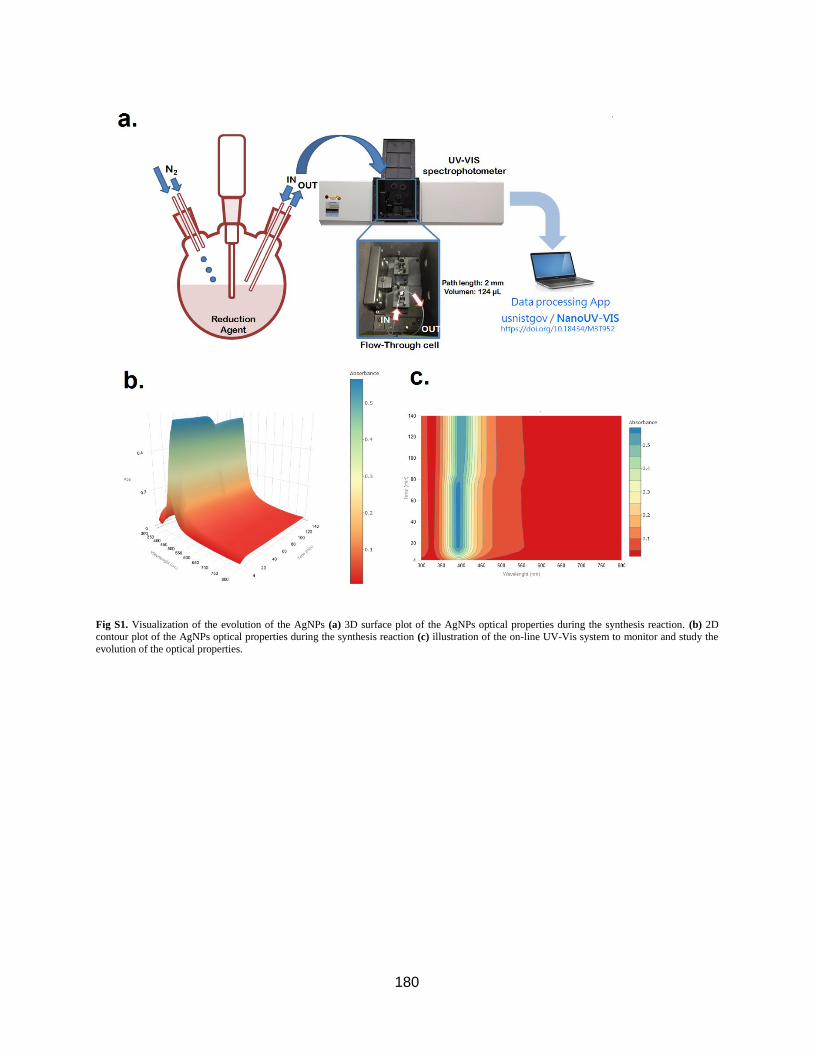
180
Fig S1. Visualization of the evolution of the AgNPs (a) 3D surface plot of the AgNPs optical properties during the synthesis reaction. (b) 2D contour plot of the AgNPs optical properties during the synthesis reaction (c) illustration of the on-line UV-Vis system to monitor and study the
evolution of the optical properties.
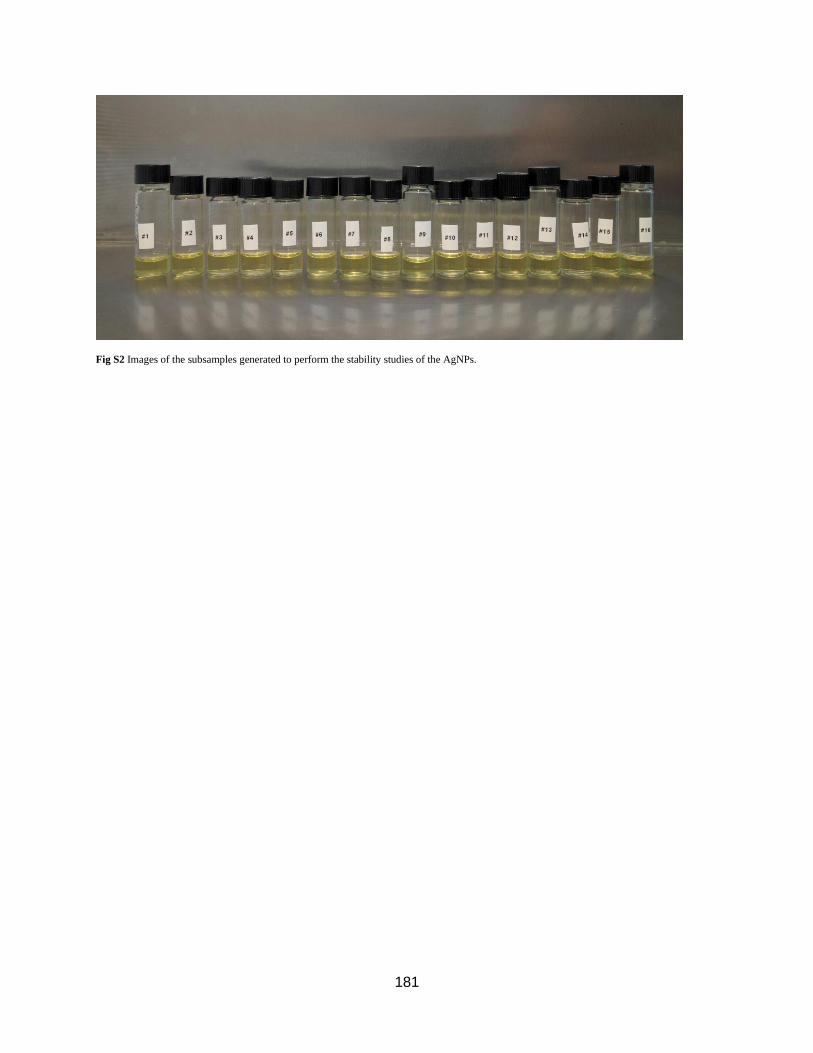
181
Fig S2 Images of the subsamples generated to perform the stability studies of the AgNPs.
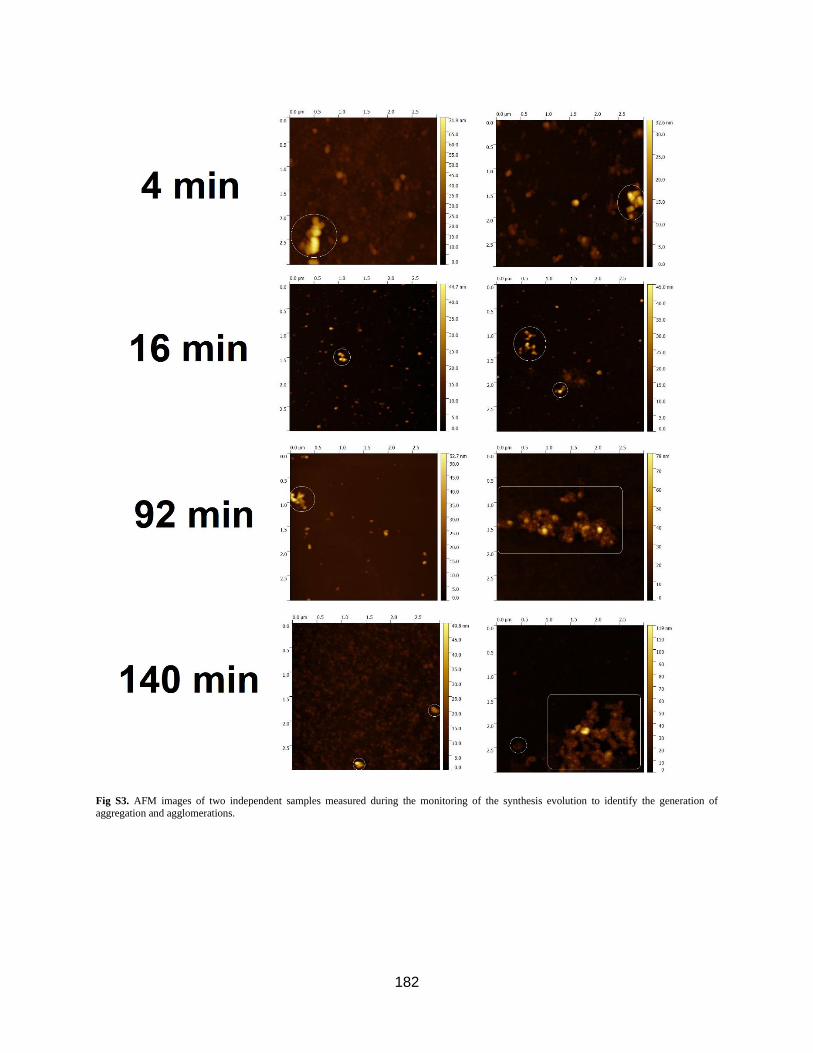
182
Fig S3. AFM images of two independent samples measured during the monitoring of the synthesis evolution to identify the generation of
aggregation and agglomerations.
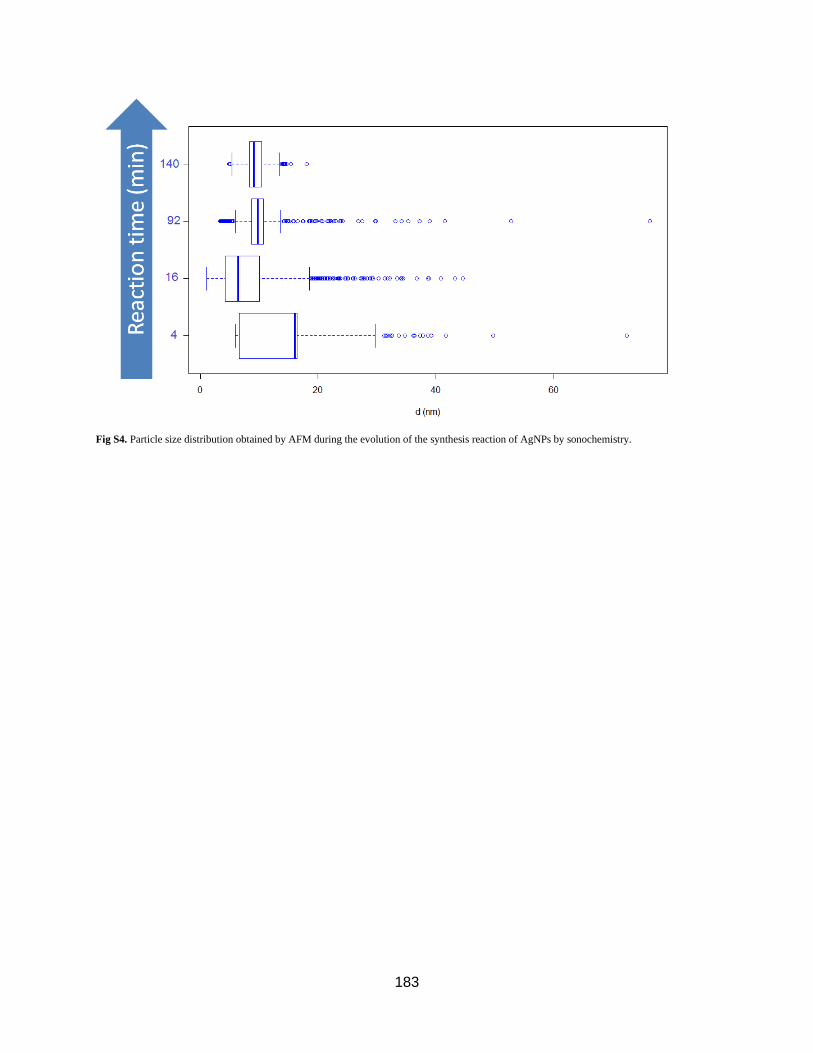
183
Fig S4. Particle size distribution obtained by AFM during the evolution of the synthesis reaction of AgNPs by sonochemistry.
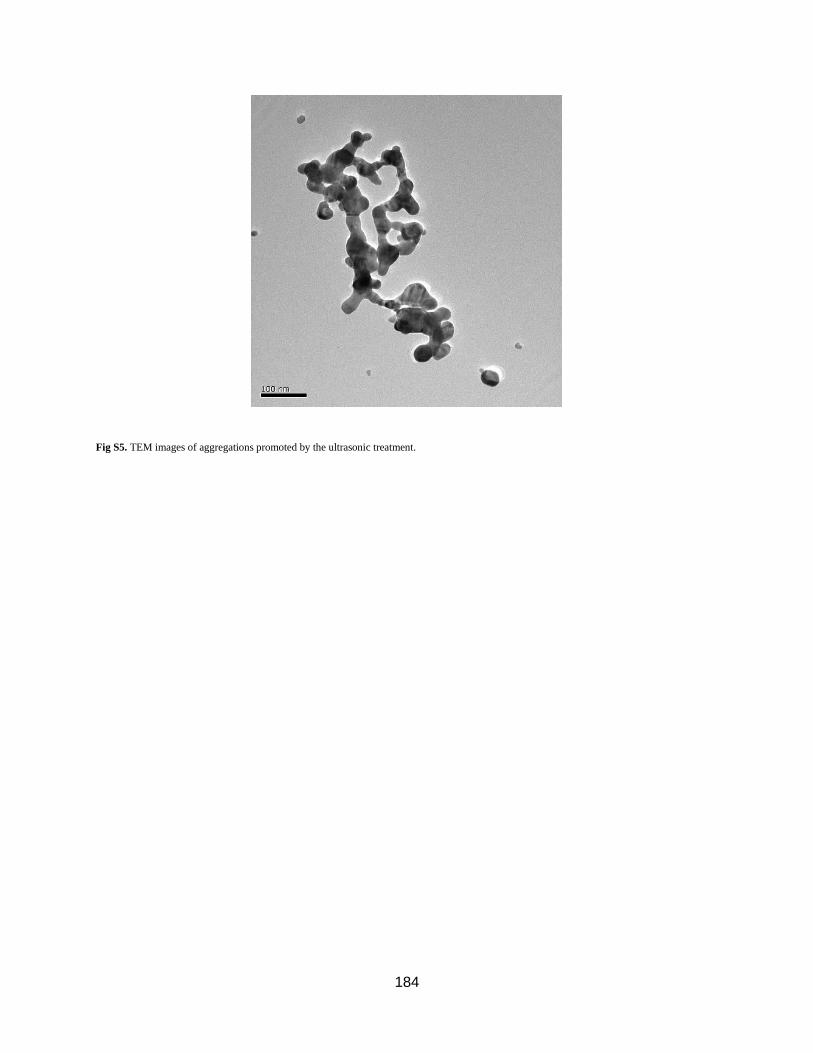
184
Fig S5. TEM images of aggregations promoted by the ultrasonic treatment.
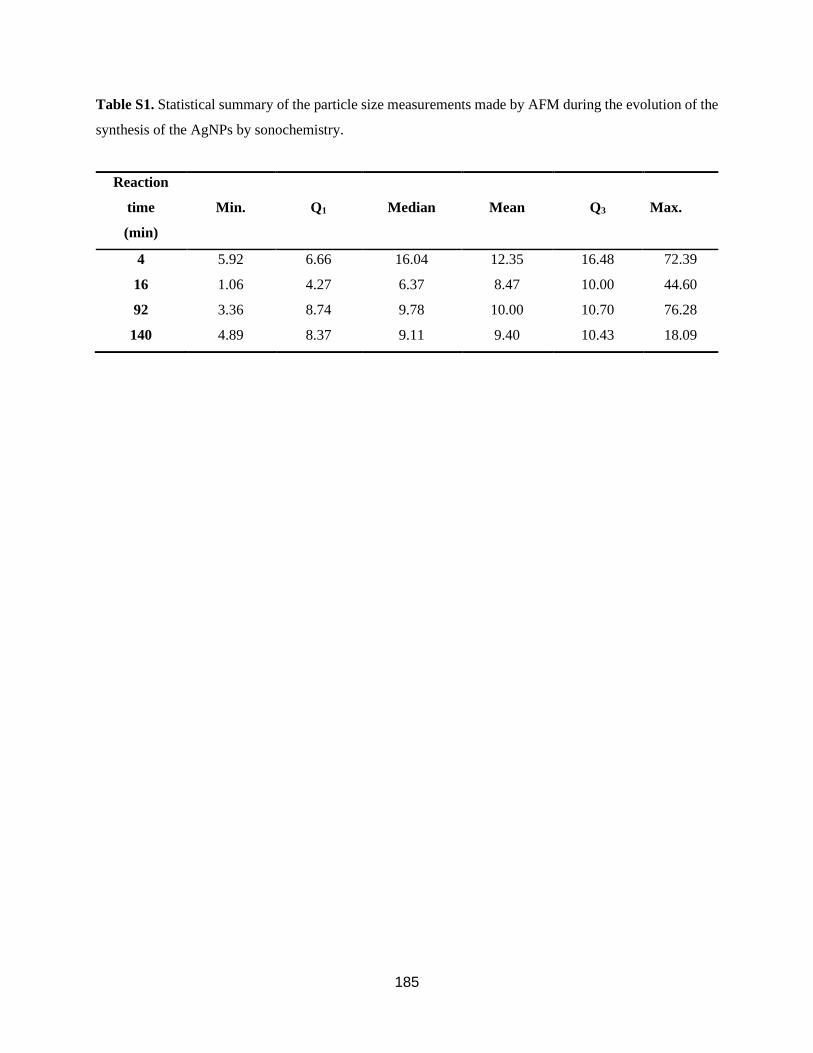
185
Table S1. Statistical summary of the particle size measurements made by AFM during the evolution of the
synthesis of the AgNPs by sonochemistry.
Reaction
time
(min)
Min. Q1 Median Mean Q3
Max.
4 5.92 6.66 16.04 12.35 16.48 72.39
16 1.06 4.27 6.37 8.47 10.00 44.60
92 3.36 8.74 9.78 10.00 10.70 76.28
140 4.89 8.37 9.11 9.40 10.43 18.09
186
Capítulo 7: Conclusiones globales
Las principales conclusiones que se pueden extraer de la investigación realizada en esta Tesis
Doctoral pueden resumirse en los cuatros puntos que siguen:
1. Queda patente que la herramienta denominada “NanoICP-MS dotará al campo de la caracterización
de nanomateriales y nanometrología de un software capaz de estudiar, visualizar, explorar, procesar
y determinar las propiedades físico-químicas de las AgNPs, así como otros nanomateriales de
ingeniería por medio de una de las técnicas analíticas emergentes más relevantes y promisorias
como lo es spICP-MS. Esta herramienta es un avance significativo a nivel científico para un
procesamiento expedito, rápido y confiable de los datos generados por este tipo de mediciones en
la nanoescala.
2. En el mismo sentido, la herramienta de visualización y procesamiento de datos “NanoUV-Vis” abre
a nivel científico una nueva forma de estudiar y monitorear las propiedades ópticas de las NPs
durante los procesos de reacciones de síntesis químicas de NPs en suspensión, dotando a la
comunidad científica de una novedosa herramienta tecnológica capaz de procesar, visualizar
estudiar y utilizar la técnica UV-Vis en el monitoreo de procesos de síntesis y la nanofabricación
de nanomateriales. Lo anterior abre un gran abanico de posibilidades en donde esta herramienta
puede ser implementada en el desarrollo, estudio y comprensión de los procesos de formación,
estabilización e interacción que poseen los nanomateriales en medios termodinámicamente
dinámicos como lo son las suspensiones coloidales, entre otra gran cantidad de aplicaciones.
3. En términos generales ambas herramientas avanzadas: “NanoICP-MS” y “NanoUV-Vis” se
caracterizan por brindar la posibilidad de ser rápidas, sencillas e interactivas para procesar los datos
provenientes de estudios de caracterización de nanomateriales de ingeniería en diversas áreas de la
nanociencia como los son la nanotoxicología, nanoecotoxicología, NanoEHS, nanofabricación,
nanometrología, entre otros campos. Lo anterior tiene un impacto sustancial para el desarrollo
científico, ya que estas herramientas permiten disminuir el tiempo invertido para el procesamiento
e interpretación de este tipo de datos. Por lo tanto, los investigadores puedran redireccionar su
tiempo y esfuerzo científicos a otras actividades sustanciales del quehacer científico a nivel
experimental.
187
4. Finalmente, el presente estudio dotó a la comunidad científica de un nuevo camino para la síntesis
de AgNPs sub-15 nm con alta esfericidad y estabilidad en medio acuoso. Este avance abre la
posibilidad de desarrollar nuevas aplicaciones en diversos campos de la nanociencia donde la
estabilidad posee un rol fundamental tal como la nanometrología (desarrollo de MR en la
nanoescala), los nanofluidos, la nanocatálisis, los textiles funcionales, la medicina, la biomedicina,
los biosensores, entre otra gran variedad de aplicaciones.
188
Capítulo 8: Recomendaciones y trabajos futuros
De los resultados obtenidos en esta tesis doctoral es posible sugerir algunas líneas de investigación
futura, en particular:
1. Gracias a que la herramienta“NanoICP-MS” proporciona información estadística veraz sobre los
principales modelos y mesurandos determinados por spICP-MS, es posible desarrollar futuras
investigaciones para incorporar en esta herramienta un módulo para la estimación de la
incertidumbre de medición, brindando un potencial metrológico a procesos de caracterización de
NPs, producción de materiales de referencia, intercomparaciones, entre otra basta cantidad de
trabajos realizados en el campos de la nanometrología y nanociencia.
2. Si bien la herramienta “NanoICP-MS” brinda grandes avances en el procesamiento de datos de
spICP-MS registrados en milisegundos, queda todavía pendiente desarrollar futuros avances para
desarrollar o acoplar la presente herramienta a datos provenientes de análisis realizados en una
resolución de tiempo de microsegundos. Este tipo de análisis disminuye la probabilidad de
generación de artefactos de medición tales como la coincidencia de partículas y eventos de
partículas divididas, mejorando la medición de las NPs mediante la técnica de spICP-MS.
3. Las capacidades analíticas de la herramienta “NanoUV-Vis” pueden ser incrementadas o
potenciadas con investigaciones futuras dirigidas a desarrollar un módulo que determine el tamaño
de partícula, la concentración (mol/L) y la concentración en número de NPs a partir de las
propiedades ópticas de la NPs y el uso de modelos empíricos desarrollados recientemente para este
tipo de nanomateriales.
4. Las capacidades de la herramienta “NanoUV-Vis” pueden ser transferidas a otras técnicas
analíticas, con alta relevancia en la caracterización de nanomateriales como por ejemplo la
espectroscopia de fluorescencia, la dispersión dinámica de la luz (DLS), el fraccionamiento en flujo
mediante campo de flujo asimétrico (AF4), cromatografía de exclusión por tamaño acoplada a UV-
Vis entre otras. Además, el impacto de esta herramienta no se limita únicamente al estudio y
monitoreo de la evolución de NPs a lo largo de la síntesis, ya que podría aplicarse a estudios de
estabilidad de materiales orgánicas de alta pureza, estudios espectroquímicos de líneas espectrales
de ciertos elementos (por ejemplo Hg) que son utilizados como patrones intrínsecos en la
189
determinación de la magnitud de longitud de onda, además del uso en estudios fármaco-cinéticos
de diferentes tipos de medicamentos, entre otros estudios.
5. En el campo de la síntesis sonoquímica, la nueva ruta desarrollada en esta investigación permite
obtener AgNPs esféricas con una gran estabilidad que podrían ser utilizadas como semilla para la
obtención de AgNPs con mayor tamaño de partícula, por lo que futuros trabajos en el área de
síntesis sonoquimica y crecimiento de NPs podrían desarrollarse para expandir la capacidad de
obtención de diferentes tamaños y formas de partículas.
6. Las AgNPs sintetizadas en el presente estudio demostraron obtener una gran estabilidad en
suspensión acuosa. Sin embargo, para incrementar aún más su estabilidad en periodos sumamente
largos (t > 2 años) sería promisorio estudiar la adición de otros agentes estabilizantes de carácter
estérico que disminuyan los fenómenos de aglomeración y agregación de las AgNPs.
7. Finalmente, queda pendiente estudiar la estabilidad de las AgNPs obtenidas por el método
sonoquimico al ser sometidas a procesos de liofilización y re-dispesión en diferentes tipos de
solventes, aspecto que sería de gran importancia para el desarrollo de nuevos materiales de
referencia en la nanoescala. Lo anterior constituiría un gran avance científico para la producción
de materiales de referencia sub-15 nm lo suficientemente estables en periodos largos, los cuales no
se encuentran disponibles actualmente.
190
Capítulo 9: Anexos
9.1. Contribución en Conferencias, Talleres, Seminarios y otras actividades afines
9.1.1. NIST Sigma Xi
Conferencia: NIST Chapter of Sigma XI
Ubicación: Gaithersburg, MD, USA
Afiliación: National Institute of Standards and Technology (NIST)
Categoría: Poster: Chemistry/Position 41C
Título: “New statistical tool for automated data processing of single particle
ICP-MS for the size determination and quantification of gold
nanoparticles”
Autores: Bryan Calderón-Jiménez*, Sara Stoudt, Gabriel Samanho, Antonio
R. Montoro Bustos, Monique E. Johnson, Karen E. Murphy
Resumen: Advances in the synthesis, stabilization, and production of nanoparticles (NPs) have fostered a
new generation of commercial products and intensified scientific investigation of these
materials. Recently, single particle inductively coupled plasma-mass spectrometry (spICP-MS) has emerged as a highly valuable analytical technique for the characterization of aqueous NP
suspensions. The capability of spICP-MS to simultaneously measure nanoparticle size, size
distribution, and particle number concentration at very low NP number concentration, makes this measurement technique extremely useful from a metrological and analytical point of view.
However, single particle ICP-MS datasets are large. For measurements on the millisecond scale
a typical sample measurement contains tens of thousands of data points and for measurements on the microsecond scale, millions of data points are acquired, making data processing complex
and laborious. In recent years, some data analysis tools such as spreadsheets [1], custom
programs [2], and ICP-MS vendor software programs have been developed. However, a lack of sophistication and transparency in the algorithms used, restrictions due to software licenses, and
in some cases, the need for extensive knowledge in programming can limit the applicability of
these spICP-MS data analysis tools. This study describes the development of a new spICP-MS data processing tool capable of
computing size, size distribution and number concentration as well as providing graphical display and statistical analysis of the data. At present, the tool can be used for applications
involving inert NPs and has been used to characterize gold nanoparticle (AuNP) suspensions
measured using millisecond-scale data acquisition. The tool was developed to work with Shiny by RStudio which provides a user-friendly interface. Raw data files in csv format from any ICP-
MS instrument vendor can be processed and results rapidly generated without sophisticated
knowledge of R-studio programming. Sample data are processed simultaneously rather than sequentially reducing data analysis times from days to minutes.
This tool uses the criterion of limit of detection based on a Poisson-normal approximation [3] to
separate the instrument and reagent background signal from particle signals. An extreme outlier correction approach was proposed as a strategy to deal with systematic error due to particle
agglomeration and/or particle coincidence. Different parametric and robust algorithms are
included in the tool to provide versatility in the estimation of the central tendency of the particle size distribution. Particularly, Huber’s algorithm [4] provides an excellent alternative to the
arithmetic mean in order to mitigate the effect of mild outliers on the computed particle size.
Additional programs outputs include the critical value, limit of detection, transport efficiency by the particle size method, and transport efficiency by the frequency method. Efforts are currently
under way to develop this software for application to all types of NPs measurable by spICP-MS
analysis.
[1] Peters, R., Herrera-Rivera, Z., Undas, A., van der Lee, M., Marvin, H., Bouwmeester, H., &
Weigel, S. (2015). Single particle ICP-MS combined with a data evaluation tool as a routine technique for the analysis of nanoparticles in complex matrices. Journal of Analytical Atomic
Spectrometry, 30(6), 1274-1285.
[2] Strenge, I., & Engelhard, C. (2016). Capabilities of fast data acquisition with microsecond time resolution in inductively coupled plasma mass spectrometry and identification of signal
artifacts from millisecond dwell times during detection of single gold nanoparticles. Journal of
Analytical Atomic Spectrometry, 31(1), 135-144.
191
[3] Currie, L. (2008). On the detection of rare, and moderately rare, nuclear events. Journal of
Radioanalytical and Nuclear Chemistry, 276(2), 285-297. [4] Analytical Methods Committee. (1989). Robust statistics–how not to reject outliers. Part 1.
Basic concepts. Analyst, 114(12), 1693-1697.
9.1.2. SCIX 2017
Conferencia: SCIX 2017
Ubicación: Reno, NV, USA
Afiliación: Federation of Analytical Chemistry and Spectroscopy Societies
(FACSS)
Categoría: Poster: 17THPNano: Nanotechnology
Título: “Interactive web-based visualization tool for monitoring optical
properties of nanoparticles during synthesis reactions”
Autores: Bryan Calderón-Jiménez*, Gabriel F. Sarmanho, Karen E. Murphy,
Antonio R. Montoro Bustos and José R. Vega Baudrit
Resumen: Engineered nanoparticles (ENPs) are being used for a broad array of high technology
applications including sensing, imaging, targeted drug delivery, bio-diagnostics, catalysis,
optoelectronics, film growth seeding, and other purposes [1, 2]. The enhanced optical, electrical, and catalytic properties of metal NPs are strongly correlated to control of their size, shape, and
structure [3]. As such, physicochemical characterization of NPs is critically important and
ultraviolet/visible spectroscopy (UV/VIS) is one of the most widely used methods for measuring the optical properties and electronic structures of NPs [4]. We have developed an interactive
web application to analyze multiple UV-VIS absorbance spectra as a function of time to create
different graphical visualizations in two and three dimensions including, spectrum, surface, and contour plots. This tool evaluates important parameters of the absorption bands of the NPs.
Specifically, it provides the maximum optical absorbance, the surface plasmon resonance (SPR)
peak and full width at half maximum (FWHM). These parameters are closely related to the diameter, shape, and polydispersity of metal and semiconductor NPs. Therefore, this application
can be used to monitor the processes occurring during the manufacture of NPs, to understand
NP stability under different conditions and mediums, and to establish optical properties of NPs for studies that use spectrochemical analysis (UV-VIS) as a technique to characterize NPs.
This research provides to the scientific community a user-friendly and interactive visualization
tool to estimate, explore and understand the optical properties of nanoparticles throughout synthesis reactions.
[1] Calderón-Jiménez B, et al. (2017). NanoUV-VIS: an interactive visualization tool for monitoring the evolution of optical properties of nanoparticles throughout synthesis reactions.
Journal of Research of NIST, (accepted, Sep 6, 2017).
[2] Calderón-Jiménez B, et al. (2017) Silver nanoparticles: technological advances, societal impacts, and metrological challenges. Frontiers in chemistry 5.
https://doi.org/10.3389/fchem.2017.00006
[3] Attia YA, Buceta D, Requejo FG, Giovanetti LJ, López-Quintela MA (2015) Photostability of gold nanoparticles with different shapes: the role of ag clusters. Nanoscale 7
(26):11273–11279. https://doi.org/10.1039/C5NR01887K
[4] Sun Y, Xia Y (2002) Shape-controlled synthesis of gold and silver nanoparticles. Science 298(5601):2176–2179. https://doi.org/ https://doi.org/10.1126/science.1077229
192
9.1.3. Metrology Discussion Seminar
Seminario: Metrology Discussion Seminar
Ubicación: Gaithersburg, MD, USA
Afiliación: National Institute of Standards and Technology (NIST)
Título: “Interactive Web Application for the Characterization of
Nanoparticles”
Autores: Bryan Calderón-Jiménez*, Gabriel F. Sarmanho, Antonio Montoro
Bustos, Ingo H. Strenge, Sara Stoudt, Monique E. Johnson, Karen E.
Murphy, Antonio Possolo, Michael R. Winchester
Resumen:
Nanoparticles (NPs) show different physical and chemical properties compared to their
macroscale analogs. This is primarily due to their small size and, consequently, the exceptional surface area of these materials. Presently, advances in the synthesis, stabilization, and production
of NPs have fostered a new generation of commercial products and intensified scientific
investigation within the nanotechnology field. Nanocharacterization have been crucial to develop new applications and understanding the
chemical and physical nature of NPs in the nanoscale. This presentation are going to address the
development of two interactive web applications (IWA) to improve the data processing and better exploration of UV-Vis spectrochemical analysis of metallic nanoparticles (1,2) and single
particle inductively couple plasma mass spectrometry (spICP-MS) as a powerful analytical
technique for the nanocharacterization of NPs suspensions (3,4).
1. Calderón-Jiménez B*, Sarmanho GF, Murphy KE, Montoro Bustos AR, Vega-
Baudrit JR (2017) NanoUV-VIS: An Interactive Visualization Tool for Monitoring the Evolution of Optical Properties of Nanoparticles Throughout Synthesis Reactions. J Res Natl
Inst Stan 122 (2017 Sept 20). https://doi.org/10.6028/jres.122.037 ; Software:
https://doi.org/10.18434/M3T952
2. Calderón-Jiménez, B*, Gabriel F Sarmanho, Karen E Murphy, Antonio R Montoro
Bustos, José R Vega Baudrit. Interactive web-based visualization tool for monitoring optical properties of nanoparticles during synthesis reactions. 17THPNano: (Poster) -Nanotechnology,
Conference: SCIX 2017, Affiliation: Federation of Analytical Chemistry and Spectroscopy
Societies (FACSS), Reno, NV, USA, https://doi.org/10.13140/RG.2.2.27131.6224
3. Calderón-Jiménez, B*., Stoudt, S, Samanho, G, Montoro Bustos A.R, Johnson, M.E.,
Murphy, K.E. (2017). New statistical tool for automated data processing of single particle ICP-MS for the size determination and quantification of gold nanoparticles. Twenty-Fourth Annual
NIST Sigma XI Postdoctoral Poster. Sigma XI-The Scientific Research Society, National
Instituted of Standard and Technology, Gaithersburg, Maryland, USA, position 41 B.
4. Calderón-Jiménez, B*, Sarmanho, G., Stoudt, S., Montoro Bustos, AR., Strenge, IH,
Johnson, M.E, Murphy, K.E, Possolo, A., Winchester, M.R. (2018). NanoICP-MS: New statistical and interactive web application for the determination and quantification of metallic
nanoparticles by single particle ICP-MS. Journal of Analytical Atomic Spectrometry,
Manuscript in preparation.
193
Referencias
Alessio, P., Aoki, P. H., Furini, L. N., Aliaga, A. E., & Constantino, C. J. L. (2017). Spectroscopic
techniques for characterization of nanomaterials. In Nanocharacterization techniques (pp. 65-98).
William Andrew Publishing. Doi: https://doi.org/10.1016/B978-0-323-49778-7.00003-5
Analytical Methods Committee. (1989). Robust statistics–how not to reject outliers. Part 1. Basic
concepts. Analyst, 114(12), 1693-1697. Doi: https://doi.org/10.1039/AN9891401693
Amendola, V., & Meneghetti, M. (2009). Size evaluation of gold nanoparticles by UV− vis
spectroscopy. The Journal of Physical Chemistry C, 113(11), 4277-4285. Doi:
https://doi.org/10.1021/jp8082425
Arruda, S. C., Silva, A.L., Galazzi R.M., Azevedo R, A., Marco Arruda A.Z. (2015). Nanoparticles
applied to plant science: A review, Talanta, 131:693-705. Doi:
https://doi.org/10.1016/j.talanta.2014.08.050
Babick, F., Mielke, J., Wohlleben, W., Weigel, S., & Hodoroaba, V. D. (2016). How reliably can a
material be classified as a nanomaterial? Available particle-sizing techniques at work. Journal of
Nanoparticle Research, 18, 6, 1-40. Doi: https://doi.org/10.1007/s11051-016-3461-7
Bang, J. H., & Suslick, K. S. (2010). Applications of ultrasound to the synthesis of nanostructured
materials. Advanced materials, 22(10), 1039-1059. Doi: https://doi.org/10.1002/adma.200904093
Berekaa, M.M. (2015). Nanotechnology in Food Industry; Advances in Food processing, Packaging
and Food Safety, International Journal of Current Microbiology and Applied Sciences, 4, 345-357.
Doi: https://doi.org/10.1351/pac200779030293
Bi, X., Lee, S., Ranville, J. F., Sattigeri, P., Spanias, A., Herckes, P., & Westerhoff, P. (2014).
Quantitative resolution of nanoparticle sizes using single particle inductively coupled plasma mass
spectrometry with the K-means clustering algorithm. Journal of Analytical Atomic Spectrometry,
29(9), 1630-1639. Doi: https://doi.org/10.1039/C4JA00109E
Bhattacharya, P. K. (1967). Sankhyā: The Indian Journal of Statistics, Series A, 373-382. Doi: https://www.jstor.org/stable/i25049488
Braslavsky, S. E. (2007). Glossary of terms used in photochemistry, (IUPAC Recommendations
2006). Pure and Applied Chemistry, 79(3), 293-465. Doi: https://doi.org/10.1351/pac200779030293
Cornelis, G., & Hassellöv, M. (2014). A signal deconvolution method to discriminate smaller
nanoparticles in single particle ICP-MS. Journal of Analytical Atomic Spectrometry, 29(1), 134-144.
Doi: https://doi.org/10.1039/C3JA50160D
Dadosh, T. (2009). Synthesis of uniform silver nanoparticle with a controllable size. Materials
Letters, 63 2236–2238. Doi: https://doi.org/10.1016/j.matlet.2009.07.042
Dan, Y., Ma, X., Zhang, W., Liu, K., Stephan, C., & Shi, H. (2016). Single particle ICP-MS method
development for the determination of plant uptake and accumulation of CeO 2 nanoparticles.
Analytical and bioanalytical chemistry, 408(19), 5157-5167. Doi: https://doi.org/10.1007/s00216-
016-9565-1
194
Degueldre, C., & Favarger (2003). Colloid analysis by single particle inductively coupled plasma-
mass spectroscopy: a feasibility study. Colloids and Surfaces A: Physicochemical and Engineering
Aspects, 217(1-3), 137-142. Doi: https://doi.org/10.1016/S0927-7757(02)00568-X
Degueldre, C., Favarger, P. Y., & Bitea, C. (2004). Zirconia colloid analysis by single particle
inductively coupled plasma–mass spectrometry. Analytica Chimica Acta, 518(1-2), 137-142. Doi:
https://doi.org/10.1016/j.talanta.2003.10.016
Degueldre, C., Favarger, P. Y., Rosse, R., & Wold, S. (2006). Uranium colloid analysis by single
particle inductively coupled plasma-mass spectrometry. Talanta, 68(3), 623-628. Doi:
https://doi.org/10.1016/j.talanta.2005.05.006
Donovan, A. R., Adams, C. D., Ma, Y., Stephan, C., Eichholz, T., & Shi, H. (2016). Detection of zinc
oxide and cerium dioxide nanoparticles during drinking water treatment by rapid single particle ICP-
MS methods. Analytical and bioanalytical chemistry, 408(19), 5137-5145. Doi:
https://doi.org/10.1007/s00216-016-9432-0
Doremus, R. H. (1965). Optical properties of small silver particles. The Journal of Chemical Physics,
42(1), 414-417. Doi: https://doi.org/10.1063/1.1695709
Doyle, W. T. (1958). Absorption of light by colloids in alkali halide crystals. Physical Review, 111(4),
1067. Doi: https://doi.org/10.1103/PhysRev.111.1067
Fabozzi, F. J., Focardi, S. M., Rachev, S. T., & Arshanapalli, B. G. (2014). The basics of financial
econometrics: Tools, concepts, and asset management applications. John Wiley & Sons.
Fröhlich, E., & Fröhlich, E. (2016). Cytotoxicity of nanoparticles contained in food on intestinal cells
and the gut microbiota. International journal of molecular sciences, 17(4), 509. Doi:
https://doi.org/10.3390/ijms17040509
Gupta, M.N., Gautam, S., Dubey, P. (2013). A facile and green ultrasonic-assisted synthesis of BSA
conjugated silver nanoparticles. Colloids and Surfaces B: Biointerfaces 102 (2013) 879– 883. Doi:
https://doi.org/10.1016/j.colsurfb.2012.10.007
Haiss, W., Thanh, N. T., Aveyard, J., & Fernig, D. G. (2007). Determination of size and concentration
of gold nanoparticles from UV− Vis spectra. Analytical chemistry, 79(11), 4215-4221. Doi:
https://doi.org/10.1021/ac0702084
He, C., Liu, L., Fang, Z., Li, J., Guo, J., & Wei, J. (2014). Formation and characterization of silver
nanoparticles in aqueous solution via ultrasonic irradiation. Ultrasonics sonochemistry, 21(2), 542-
548. Doi: https://doi.org/10.1016/j.ultsonch.2013.09.003
Hofmann-Amtenbrink, M., Grainger, D.W., Hofmann, H. (2015). Nanoparticles in medicine: Current
challenges facing inorganic nanoparticle toxicity assessments and standardizations. Nanomedicine:
Nanotechnology, Biology and Medicine, 11, 1689–1694. Doi:
https://doi.org/10.1016/j.nano.2015.05.005
Hosseinpour-Mashkani, S. M., Sobhani-Nasab, A., & Mehrzad, M. (2016). Controlling the synthesis
SrMoO 4 nanostructures and investigation its photocatalyst application. Journal of Materials Science:
Materials in Electronics, 27(6), 5758-5763. Doi: https://doi.org/10.1007/s10854-016-4489-2
195
Huang, S., Wang, L., Liu, L., Hou, Y., Li, L. (2015) Nanotechnology in agriculture, livestock, and
aquaculture in China. A review. Agronomy for Sustainable Agriculture, 35, 369–400. Doi:
https://doi.org/10.1007/s13593-014-0274-x
Hyeon,T., Manna, L., Wong, S.S. (2015). Sustainable nanotechnology. Chemical Society Reviews,
Editor Letter. Doi: https://doi.org/10.1039/C5CS90072G
Ivask A, Kurvet I., Kasemets K.,Blinova I., Aruoja V, et al. (2014) Size-Dependent Toxicity of Silver
Nanoparticles to Bacteria, Yeast, Algae, Crustaceans and Mammalian Cells In Vitro. PLoS ONE 9
(7): e102108. Doi: https://doi.org/10.1371/journal.pone.0102108
Jiang L, P., Wang, A.N., Zhao, Y., Zhang, J.R., Zhu, J.J. A novel route for the preparation of
monodisperse silver nanoparticles via a pulsed sonoelectrochemical technique, Inorganic Chemistry
Communications 7 (2004) 506–509. Doi: https://doi.org/10.1016/j.inoche.2004.02.003
Jana, N.R., Gearheart, L., Murphy, C.J. (2001). Evidence for Seed-Mediated Nucleation in the
Chemical Reduction of Gold Salts to Gold Nanoparticles. Chemistry of Materials, 13, 2313-2322.
Doi: https://doi.org/10.1021/cm000662n
Jazayeri, M. H., Aghaie, T., Avan, A., Vatankhah, A., & Ghaffari, M. R. S. (2018). Colorimetric
detection based on gold nano particles (GNPs): An easy, fast, inexpensive, low-cost and short time
method in detection of analytes (protein, DNA, and ion). Sensing and bio-sensing research, 20, 1-8.
Doi: https://doi.org/10.1016/j.sbsr.2018.05.002
Johnson, M. E., Hanna, S. K., Montoro Bustos, A. R., Sims, C. M., Elliott, L. C., Lingayat, A., et al.,.
(2017). Separation, sizing, and quantitation of engineered nanoparticles in an organism model using
inductively coupled plasma mass spectrometry and image analysis. ACS nano, 11(1), 526-540. Doi:
https://doi.org/10.1021/acsnano.6b06582
Jorio, A., & Dresselhaus, M. S. Nanostructured Materials: Metrology. Encyclopedia of Materials:
Science and Technology, 2014, Pages 1-7. Doi: https://doi.org/10.1016/b978-008043152-9.02225-9
Kawaguchi, H., Fukasawa, N., & Mizuike, A. (1986). Investigation of airborne particles by
inductively coupled plasma emission spectrometry calibrated with monodisperse aerosols.
Spectrochimica Acta Part B: Atomic Spectroscopy, 41(12), 1277-1286. Doi: https://doi.org/10.1016/0584-8547(86)80006-4
Kéri, A., Kálomista, I., Ungor, D., Bélteki, Á., Csapó, E., Dékány, I., ... & Galbács, G. (2018).
Determination of the structure and composition of Au-Ag bimetallic spherical nanoparticles using
single particle ICP-MS measurements performed with normal and high temporal resolution. Talanta,
179, 193-199. Doi: https://doi.org/10.1016/j.talanta.2017.10.056
Kim, H. A., Lee, B. T., Na, S. Y., Kim, K. W., Ranville, J. F., Kim, S. O., ... & Eom, I. C. (2017).
Characterization of silver nanoparticle aggregates using single particle-inductively coupled plasma-
mass spectrometry (spICP-MS). Chemosphere, 171, 468-475. Doi:
https://doi.org/10.1016/j.chemosphere.2016.12.063
Klein, S., Comero, B., Stahlmecke, J., Romazanov, T.A.J., Kuhlbusch, E., Van Doren, P-J., De
Temmerman J., Mast, P., Wick, H., Krug, G., Locoro, K., Hund-Rinke., W. Kördel., S. Friedrichs,
G., Maier, J., Werner., Linsinger, T and B.M. Gawlik. NM-Series of Representative Manufactured
196
Nanomaterials. NM-300 Silver. Characterisation, Stability, Homogeneity. European Commission
Joint Research Centre. Institute for Health and Consumer Protection Luxembourg, European Union,
2011. Doi: https://core.ac.uk/download/pdf/38621213.pdf
Krajczewski, J., Kołątaj, K., & Kudelski, A. (2017). Plasmonic nanoparticles in chemical analysis.
RSC Advances, 7(28), 17559-17576. Doi: https://doi.org/10.1039/C7RA01034F
Krishnaraja, C., Harperb, S.L., Yuna, S. (2015). In Vivo toxicological assessment of biologically
synthesized silver nanoparticles in adult Zebrafish (Danio rerio). Journal of Hazardous Materials,
301, 480–491. Doi: https://doi.org/10.1016/j.jhazmat.2015.09.022
Köhler A. & Som, C. (2014). Risk preventative innovation strategies for emerging technologies the
cases of nano-textiles and smart textiles, Technovation. Doi:
https://www.dora.lib4ri.ch/empa/islandora/object/empa:15235
Kumar, C. S. (Ed.). (2013). UV-VIS and photoluminescence spectroscopy for nanomaterials
characterization (pp. 231-285). Berlin, Heidelberg: Springer. Doi: https://doi.org/10.1007/978-3-642-
27594-4
Laborda, F., Jiménez-Lamana, J., Bolea, E., & Castillo, J. R. (2011). Selective identification,
characterization and determination of dissolved silver (I) and silver nanoparticles based on single
particle detection by inductively coupled plasma mass spectrometry. Journal of Analytical Atomic
Spectrometry, 26(7), 1362-1371. Doi: https://doi.org/10.1039/C0JA00098A
Laborda, F., Jiménez-Lamana, J., Bolea, E., & Castillo, J. R. (2013a). Critical considerations for the
determination of nanoparticle number concentrations, size and number size distributions by single
particle ICP-MS. Journal of Analytical Atomic Spectrometry, 28(8), 1220-1232. Doi:
https://doi.org/10.1039/C3JA50062D
Laborda, F., Bolea, E., & Jimenez-Lamana, J. (2013b). Single particle inductively coupled plasma
mass spectrometry: a powerful tool for nanoanalysis. Journal of Analytical Atomic Spectrometry, 86
(5), 2270–2278. Doi: https://doi.org/10.1021/ac402980q
Lee P. C. and D. Meisel. (1982). Adsorption and Surface-Enhanced Raman of Dyes on Silver and
Gold SolsJ. Phys. Chem. 1982, 86, 3391-3395. Doi: https://doi.org/10.1021/j100214a025
Liu, J., Murphy, K. E., MacCuspie, R. I., & Winchester, M. R. (2014). Capabilities of single particle
inductively coupled plasma mass spectrometry for the size measurement of nanoparticles: a case
study on gold nanoparticles. Analytical Chemistry, 86(7), 3405-3414. Doi:
https://doi.org/10.1021/ac403775a
Logothetidis, S. Nanostrutured Materials and Their Applications. Springer, Edición 8, 2012. Doi:
https://doi.org/10.1007/978-3-642-22227-6
Menzel, M., Bienert, W., Bremser, W., Girod, M., Rolf, S., Thünemann, F., Emmerling. Certification
Report. Certified Reference Material BAM-N001, Particle size parameters of Nano Silver. BAM
Federal Institute for Materials Research and Testing, Berlin, Germany.
Mousavi, M.F and Ghasemi S. Chapter 1: Sonochemistry: A suitable Method for Synthesis of Nano-
Structured Materials. Sonochemistry; Theory, Reaction, Syntheses and Applications. Nova Science
197
Publishers, New York, USA, 2010. Descargado de:
http://amedbs.com/books/download/id=552628&type=file
Mody VV, Siwale R, Singh A, Mody HR. Introduction to metallic nanoparticles. J Pharm Bioall Sci.,
2, 282-9. Doi: https://doi.org/10.4103/0975-7406.72127
Montoro Bustos, A. R., Petersen, E. J., Possolo, A., & Winchester, M. R. (2015). Post hoc
interlaboratory comparison of single particle ICP-MS size measurements of NIST gold nanoparticle
reference materials. Analytical chemistry, 87(17), 8809-8817. Doi:
https://doi.org/10.1021/acs.analchem.5b01741
Montoro, A. R., & Winchester, M. R. (2016). Single-particle-ICP-MS advances. Anal Bioanal Chem.
2016 Jul; 408(19): 5051–5052. Doi: https://doi.org/10.1007/s00216-016-9638-1
Montoro Bustos, A. R., Purushotham, K. P., Possolo, A., Farkas, N., Vladár, A. E., Murphy, K. E., &
Winchester, M. R. (2018). Validation of Single Particle ICP-MS for Routine Measurements of
Nanoparticle Size and Number Size Distribution. Analytical chemistry, 90(24), 14376-14386. Doi:
https://doi.org/10.1021/acs.analchem.8b03871
Murphy, K. E., Liu, J., Bustos, A. M., Johnson, M. E., & Winchester, M. R. (2015). Characterization
of nanoparticle suspensions using single particle inductively coupled plasma mass spectrometry.
NIST Special Publication, 1200, 21. Doi: https://doi.org/10.6028/NIST.SP.1200-21
McShan, D., Paresh, C.R, Yu, H. (2014). Molecular toxicity mechanism of nanosilver. Journal of
Food and Drug Analysis, 22, 116-127. Doi: https://doi.org/10.1016/j.jfda.2014.01.010
Nano Risk Framework. (2007). http://www.nanoriskframework.com/OECD (organization for
Economic Cooperation and Development). 2010. Series on the safety of manufactured nanomaterials.
Report 27: List of manufacture nanomaterials and list of endpoints for phase one of the sponsorship
programme for the testing of manufactured nanomaterials. EU.
Nath, J., Dror, I., Landa, P., Vanek, T., Kaplan-Ashiri, I., & Berkowitz, B. (2018). Synthesis and
characterization of isotopically-labeled silver, copper and zinc oxide nanoparticles for tracing studies
in plants. Environmental Pollution, 242, 1827-1837. Doi:
https://doi.org/10.1016/j.envpol.2018.07.084
Nomizu, T., Kaneco, S., Tanaka, T., Ito, D., Kawaguchi, H., & Vallee, B. T. (1994). Determination
of calcium content in individual biological cells by inductively coupled plasma atomic emission
spectrometry. Analytical Chemistry, 66(19), 3000-3004. Doi: https://doi.org/10.1021/ac00091a004
NIST (2015). Report of Investigation. Reference Material 8017. Polyvinylpyrrolidone Coated Silver
Nanoparticles. Gaithersburg, MD, EEUU.
Pace, H. E., Rogers, N. J., Jarolimek, C., Coleman, V. A., Higgins, C. P., & Ranville, J. F. (2011).
Determining transport efficiency for the purpose of counting and sizing nanoparticles via single
particle inductively coupled plasma mass spectrometry. Analytical chemistry, 83(24), 9361-9369.
Doi: https://doi.org/10.1021/ac201952t
Palmero, P. (2015). Structural Ceramic Nanocomposites: A review of properties and Powders
Synthesis Methods, Nanomaterials 2015, 5: 656-696. Doi: https://doi.org/10.3390/nano5020656
198
Paramelle, D., Sadovoy, A., Gorelik, S., Free, P., Hobley, J., & Fernig, D. G. (2014). A rapid method
to estimate the concentration of citrate capped silver nanoparticles from UV-visible light spectra.
Analyst, 139(19), 4855-4861. Doi: https://doi.org/10.1039/C4AN00978A
Pastoriza-Santos, I., Liz-Marzán, L.M. (1999). Formation and stabilization of silver nanoparticles
through reduction by N,N-Dimethylformamide. Langmuir 15, 948–951. Doi:
https://doi.org/10.1021/la980984u
Proulx, K., Hadioui, M., & Wilkinson, K. J. (2016). Separation, detection and characterization of
nanomaterials in municipal wastewaters using hydrodynamic chromatography coupled to ICPMS and
single particle ICPMS. Analytical and bioanalytical chemistry, 408(19), 5147-5155. Doi:
https://doi.org/10.1007/s00216-016-9451-x
Roebben, G., Rasmussen, K., Kestens, V., Linsinger T. P. J., Rauscher H., Emons H., Stam H. (2013).
Reference materials and representative test materials: the nanotechnology case. J Nanopart Res 15,
1455. Doi: https://doi.org/10.1007/s11051-013-1455-2
Roman, M., Rigo, C., Castillo-Michel, H. et al. (2016). Hydrodynamic chromatography coupled to
single-particle ICP-MS for the simultaneous characterization of AgNPs and determination of
dissolved Ag in plasma and blood of burn patients. Analytical and Bioanalytical Chemistry, 408(19): 5109–5124. Doi: https://doi.org/10.1007/s00216-015-9014-6
Shirtcliffe, N., Nickel, U., & Schneider, S. (1999). Reproducible preparation of silver sols with small
particle size using borohydride reduction: for use as nuclei for preparation of larger particles. Journal
of colloid and interface science, 211, 1, 122-129. Doi: https://doi.org/10.1006/jcis.1998.5980
Sun, R., Huang, H., Zhao, T., Yu, S., Zhang, Z., Zhou, L., Du, R. (2010). Colloids and Surfaces A:
Physicochem. Eng. Aspects 366, 197–202. Doi: https://doi.org/10.1016/j.colsurfa.2010.06.005
Suslick, K.S & Bang, J.H. (2010). Application of ultrasound to the synthesis of nanostructured
materials. Advance materials, 22, 1039-1059
Strenge, I., & Engelhard, C. (2016). Capabilities of fast data acquisition with microsecond time
resolution in inductively coupled plasma mass spectrometry and identification of signal artifacts from
millisecond dwell times during detection of single gold nanoparticles. Journal of Analytical Atomic
Spectrometry, 31(1), 135-144. Doi: https://doi.org/10.1039/C5JA00177C
Steinigeweg, D., and Schlücker, S. (2012). Monodispersity and size control in the synthesis of 20–
100 nm quasi-spherical silver nanoparticles by citrate and ascorbic acid reduction in glycerol–water
mixtures. Chem. Commun. 48, 8682–8684. Doi: https://doi.org/doi10.1039/c2cc33850e
Stefaniak, A.B., Hackley, V.A., Roebben, G., Ehara, K, Hankin, S, Postek, M.T., Lynch, I., Fu, W.E,
Linsinger, T.PJ, &. Thünemann AF. (2013). Nanoscale reference materials for environmental, health
and safety measurements: needs, gaps and opportunities. Nanotoxicology, 1–13. Doi:
https://doi.org/10.3109/17435390.2012.739664
Tiede, K., Boxall, A. B., Tear, S. P., Lewis, J., David, H., & Hassellöv, M. (2008). Detection and
characterization of engineered nanoparticles in food and the environment. Food Additives and
Contaminants, 25(7), 795-821. Doi: https://doi.org/10.1080/02652030802007553
199
Turkevich, J., Stevenson, P.C., Hillier, J. (1951). A study of the nucleation and growth processes in
the synthesis of colloidal gold. Discuss. Faraday Soc. 55, 75. Doi:
https://doi.org/10.1039/DF9511100055
Tuoriniemi, J., Cornelis, G., & Hassellöv, M. (2015). A new peak recognition algorithm for detection
of ultra-small nano-particles by single particle ICP-MS using rapid time resolved data acquisition on
a sector-field mass spectrometer. Journal of Analytical Atomic Spectrometry, 30(8), 1723-1729. Doi: https://doi.org/10.1039/C5JA00113G
Trügler, A. (2016). Optical properties of metallic nanoparticles. 1er Edition. Springer International
Publishing, Switzerland. Doi: https://doi.org/10.1007/978-3-319-25074-8
Van Eerdenbrugh, B., Alonzo, D. E., & Taylor, L. S. (2011). Influence of particle size on the
ultraviolet spectrum of particulate-containing solutions: implications for in-situ concentration
monitoring using UV/Vis fiber-optic probes. Pharmaceutical research, 28(7), 1643-1652. Doi:
https://doi.org/10.1007/s11095-011-0399-4
Van Hyning, D.L., Zukoski, C.F. (1998): Formation mechanisms and aggregation behavior of
borohydride reduced silver particles. Langmuir 14, 7034–7040. Doi:
https://doi.org/10.1021/la980325h
Vance, M. E., Kuiken, T., Vejerano, E. P., McGinnis, S. P., Hochella Jr, M. F., Rejeski, D., et al.
(2015). Nanotechnology in the real world: Redeveloping the nanomaterial consumer products
inventory. Beilstein J. Nanotechnol. 6, 1769-1780. Doi: https://doi.org/doi:10.3762/bjnano.6.181
Vasileva, P., Donkova, B., Karadjova, I., & Dushkin, C. (2011). Synthesis of starch-stabilized silver
nanoparticles and their application as a surface plasmon resonance-based sensor of hydrogen
peroxide. Colloids and Surfaces A: Physicochemical and Engineering Aspects, 382(1-3), 203-210.
Doi: https://doi.org/10.1016/j.colsurfa.2010.11.060
Darroudi, M., Ahmad, M. B., Abdullah, A. H., & Ibrahim, N. A. (2011). Green synthesis and
characterization of gelatin-based and sugar-reduced silver nanoparticles. International journal of
nanomedicine, 6, 569. Doi: https://doi.org/10.2147/IJN.S16867
Zhao, T., Sun, R., Yu, S., Zhang, Z., Zhou, L., Huang, H., & Du, R. (2010). Size-controlled
preparation of silver nanoparticles by a modified polyol method. Colloids and Surfaces A:
Physicochemical and Engineering Aspects, 366(1-3), 197-202. Doi:
https://doi.org/10.1126/science.1077229
Zhang, H., Huang, Y., Gu, J., Keller, A., Qin, Y., Bian, Y., & Zhao, L. (2019). Single particle ICP-
MS and GC-MS provide a new insight into the formation mechanisms during the green synthesis of
AgNPs. New Journal of Chemistry, 43(9), 3946-3955. Doi: https://doi.org/10.1039/C8NJ06291A