derivation of economic values for the simmentaler breed in south africa
TRANSCRIPT
South African Journal of Animal Science 2007, 37 (2) © South African Society for Animal Science
107
Derivation of economic values for the Simmentaler breed in South Africa
J.F. Kluyts, F.W.C. Neser# and M.J. Bradfield Department of Animal Science, University of the Free State, P.O. Box 339, Bloemfontein 9300, South Africa
_______________________________________________________________________________________ Abstract
The purpose of this paper was to derive economic values for beef production, carcass quality and fitness traits for the Simmentaler breed in Southern Africa. Income was partitioned between weaners, surplus heifers and cull cows. Expenses were calculated for all classes and included feed cost, husbandry cost and marketing cost. Economic values were derived as partial derivatives of the profit equation. Results emphasised the relative importance of fertility. Economic values, expressed per genetic standard deviation in South African Rand per cow, corrected with the discounted gene flow method are, 25.57, 15.21, -13.95 and -69.29 for weaning weight direct, weaning weight maternal, heifer sale weight (at 600 days) and mature cow weight, 20.96, 0.39, -3.52 and 0.18 for dressing percentage, backfat thickness, tenderness and marbling as well as 18.98, -93.82, 1.08 and 1.15 for calving rate, days-to-calving, calving-ease (direct) and calving-ease (maternal), respectively. _______________________________________________________________________________________ Keywords: Beef cattle, breeding objectives, discounted gene flow # Corresponding author. E-Mail: [email protected] Introduction
Animal breeding is part of the strategic planning of production (Groen et al., 1997) and is aimed at changing the genetic merit of animals in coming generations, so that they can produce the desired products economically more efficiently (relative to the present generation) under future economic, natural and social circumstances (Dekkers, 1991). Development of the breeding program involves three major steps. The first step, the breeding goal definition, includes definition of the aggregate genotype and deriving discounted economic values. The second step is breeding value estimation. This step includes deciding what traits to include in the selection index as well as the derivation of regression coefficients (b - values) to be included in the index. The third step is breeding program optimisation. Hazel (1943) defined the breeding objective (aggregate genotype) as a linear function of the economically important traits to be improved and the discounted economic values for these traits.
Methods to derive economic values can be divided into objective and non-objective methods (Groen et al., 1997). The principal tool in objective methods is modelling (systems analysis) where a model is an equation or a set of equations that represent the behaviour of a system. Two approaches of systems analysis can be distinguished, namely: the positive approach or data evaluation and the normative approach or data simulation (Harris & Freeman, 1993; Weigel et al., 1995). For data simulation models, the terms “profit function” or “profit equation” and “bio-economic model” are used (Tess et al., 1983; Groen, 1988).
The economic value of a trait represents the change in profit per unit product as a result of one unit change in the genetic merit of the trait considered (Groen et al., 1997). Economic values are derived by partial differentiation of the profit equation (efficiency equation) with respect to individual traits. The partial derivative gives the slope (rate of change) of the profit equation at the population mean value for all other traits (Harris, 1970; Bekman & Van Arendonk, 1993; Phocas et al., 1998).
Beef cattle selection programmes in South Africa have evolved over many years. There was, however, no economic definition of an overall breeding objective or any attempt to derive economic values for beef cattle breeding. The objectives of this article, therefore, were: (1) to define breeding objectives for the Simmentaler breed in Southern Africa; (2) to derive economic values for production (growth), product quality (carcass quality) and fitness traits in production circumstances without product or output restrictions. Materials & Methods
The sequential procedure developed by Ponzoni & Newman (1989) to define breeding objectives for domestic livestock was used. Specification of the breeding, production and marketing system is the first step.
The South African Journal of Animal Science is available online at http://www.sasas.co.za/sajas.asp

South African Journal of Animal Science 2007, 37 (2) © South African Society for Animal Science
108
For this study a general purpose pure breeding system was modelled based on the parameters of the Simmentaler breed in South Africa. The perspective taken was to define the breeding objective for a breeding industry, but in the interest of commercial cow-calf-producers (at farm level) where profit is expressed per female unit (producing cow). Since the production (on natural grazing) and sale of weaner calves to feedlots is the most popular production system that beef producers in South Africa employ (Van Zyl et al., 1993), it was also the system modelled for this study. The decision as to which heifers are retained as replacements and which are sold as being surplus occurs coincident with their attainment of final weight. Table 1 summarizes the management variables included in the model.
Table 1 Management variables included in the model ___________________________________________________________________________________ Variable Value ----------------------------------------------------------------------------------------------------------------------------- Number of cows 100 Cow age groups 6 Number of lactations / calvings 5 Number of bulls 4% Age at weaning ± 200 days Marketing age - weaners weaning (7 – 9 months) Marketing age - heifers ± 19 months Age at breeding ± 15 - 21 months Primary breeding and calving season ± November / August Secondary breeding and calving season ± June / March Feeding system grazing on natural pasture Dipping 3 treatments per year Drenching 2 treatments per year Vaccination standard program a __________________________________________________________________________________ a as prescribed by the Onderstepoort Veterinary Institute
Since animal breeding is a long-term process it is incorrect to ignore discounting as it will lead to bias in the relative selection emphasis on traits and to non-optimum genetic responses. Furthermore, the costs and benefits in animal breeding are realised at different times, and with different probabilities. An appropriate discount rate was chosen according to the methods discussed by Smith (1978). Economic values were then adjusted for both time and frequency of expression by using the discounted gene flow (DGF) method of McClintock & Cunningham (1974).
The second step is the identification of sources (Table 2) of income and expense, i.e. the modelling of profit from this typical herd or breeding industry. The identification of sources of income and expense enables the development of a profit equation.
During the third phase the profit equation is expressed as a function of biological traits that impact on income, expense or both (Ponzoni & Newman, 1989). This investigation will also include mature-cow-weight which can be considered as a production trait, as well as an input trait. A linear relationship between profit and the level of performance in production traits (Table 3) was assumed.
The difficulty and expense of measuring feed intake and efficiency in grazing animals mean that feed intake is usually excluded as a trait in the breeding objective. However, providing feed to cattle is the single largest expense in most commercial beef production enterprises (Archer et al., 1999; Jenkins & Ferrell, 2002). Feed intake is generally correlated with output traits and therefore examination of feed intake or production outputs in isolation of each other usually provides little or no indication of the efficiency of production (Archer et al., 1999). For these reasons feed intake was included as a cost function in the profit equation. Economic values for carcass / sale weight were, therefore, adjusted for anticipated correlated responses in feed intake as suggested by Amer et al. (1998). The cost of providing feed to grazing animals is, however, difficult to quantify (Arthur et al. 2001). It was, therefore, assumed that animals have a certain intake of dry material (DM) which is related to age and size as well as stage and level of production. This
The South African Journal of Animal Science is available online at http://www.sasas.co.za/sajas.asp

South African Journal of Animal Science 2007, 37 (2) © South African Society for Animal Science
109
quantity was derived from NRC-tables (Van der Merwe & Smith, 1991) and from a technical review by an ARC working party under the chairmanship of Blaxter (1988). As a first alternative it was assumed that intake was from a standard reference feed (Eragrostis curvula) with known general quality and average price (R 400.00/ton or R 0.40/kg feed with 90% DM = ± R 0.45/kg DM). This is to a certain extent similar to the methods used by Groen & Korver (1989) and Amer et al. (2001). As a second alternative feed costs can also be calculated based on agistment rates (Ponzoni & Newman, 1989). For the derivation of economic values for production traits, the first alternative was employed.
Table 2 Summary of input variables for the model ___________________________________________________________________________________________________________________ Symbol Meaning Value Weaners (♂) Heifers Cows ------------------------------------------------------------------------------------------------------------------------------------------------ NCW number calves weaned 0.39N 0.41N - NSH number surplus heifers - 0.11N - NCC number of cull cows (performance + age) - - 0.25N WW weaning weight 240 kg - - FW heifer cull weight/sale weight - 458 kg - MCW mature cow weight - - 567 kg fi food intake (% DM/kg live weight) 2.6% 2.3% 2.2% v animal value (R/kg) R 7.70 R 6.07 R 5.54 vF feed value/kg DM R 0.45 R 0.45 R 0.45 agistment rate/kg DM R 0.09 R 0.09 R 0.09 hc husbandry cost: dipping 1.1 cent/kg/treatment R 5.28 R 15.12 R 18.72 drenching 3.9 cent/kg /treatment R 9.36 R 36.10 R 44.68 vaccination R 20.59 R 11.54 R 11.54 labour R 3.33/man/hour mc mating cost/year - - R 160.00 FWF final weight feedlot 436 kg - - CW carcass weight 240 kg - - DP dressing percentage 55 % - - vvWW value weaner/kg R 7.70 vC value carcass/kg < A2A3 a (13%) b R 12.94 = A2A3 (86%) R 13.50 > A2A3 (1%) R 12.86 ________________________________________________________________________________________________ a age / fatness class where A represents a young animal with no permanent incisors and 2/3 indicate backfat thickness from 1 to 5 mm b from Simmentaler feedlot data Table 3 Parameters a for the beef production traits included in the breeding objective ________________________________________________________________________________________________ Trait Symbol h² Mean (kg) σP σA ------------------------------------------------------------------------------------------------------------------------------------------------ Weaning weight –direct WWD 0.21 237 26.49 12.04 Weaning weight – maternal WWM 0.12 237 26.49 9.0 Final weight (600 days) FWH 0.32 458 38.05 21.47 Mature Cow weight MCW 0.43 567 52.92 34.64 ________________________________________________________________________________________________ a provided by Breedplan International for S.A. Simmentaler
The monetary value of slaughtered animals is determined by carcass weight, dressing percentage and carcass quality. Meat (carcass) quality is managed by means of a meat classification/grading system based on
The South African Journal of Animal Science is available online at http://www.sasas.co.za/sajas.asp

South African Journal of Animal Science 2007, 37 (2) © South African Society for Animal Science
110
animal age, carcass fat content, sex and conformation (www.samic.co.za). Although carcass weight and dressing percentage are clearly defined traits, carcass quality may be characterized in different ways. Indicators of carcass quality can roughly be subdivided into two groups: (1) indicators measured on a continuous scale (lean meat, fat percentage, fat depth) and (2) indicators measured on an ordered categorical scale (classes for age, fleshiness and fat covering). The price per kilogram of carcass is usually determined by ordered categorical traits.
In most present applications the economic values of traits are assumed to be independent of the population mean of these traits. However, many traits present an optimum range, resulting in a dependency between the economic value and the population mean. Examples of this can be found especially in traits related to carcass quality.
For quality traits a profit function is in most cases only approximately known in terms of the thresholds below and above which the product is only acceptable for lower prices (e.g. fatness) or not acceptable at all (e.g. a lack of tenderness). The calculation of economic values for traits with an optimum range (optimum traits) assumes that this optimum range can be defined (Hovenier et al., 1993). Furthermore, the magnitude of these price differences has to be generated by the market.
Income is a function of the number of animals (weaners/fed steers) available for sale, the weight of these animals (carcasses) as well as the quality (value) of these carcasses. The value of the carcass is a function of the carcass quality (grading). For this study it was assumed that there are also classes (with price differences) for tenderness and marbling which influence the value of the carcass. This is in agreement with the conclusion of Hovenier et al. (1993) that, the marginal income per animal (carcass) is a function of the fraction of the population (carcasses) within the optimum range (quality), the price difference between products within and products outside the optimum range, and the amount of product produced per animal (weight). Wolfovà et al. (1995) also included dressing percentage and fat covering (quality class) in their analysis. Parameters for quality traits are summarized in Table 4. Table 4 Parameters for the product quality traits to be included in the breeding objective ________________________________________________________________________________________________ Trait Symbol h² Mean σP σA ----------------------------------------------------------------------------------------------------------------------------------------------- Dressing percentage (%) DP 0.39a 55d 1.9 1.19 Backfat thickness (mm) BF 0.44 2.4d 1.3 0.86 Tenderness (WBS kg) T 0.29 4.3b 1.3 0.70 Marbling (score) M 0.38 3.0c 0.82 0.50 ________________________________________________________________________________________________ a from Koots et al. (1994) b from Cundiff et al. (2004)
c Barwick & Henzell (1999) d from South African feedlot data
Hovenier et al. (1993) discussed a method to calculate marginal income functions and to derive
economic values for traits with an intermediate optimum such as meat quality (e.g. fatness). They expressed income per carcass as a function of the trait means and assumed that carcasses were classified into different quality classes with different prices. The marginal income function will be dependent on the population level for the optimum trait (µ), the standard deviation for this trait (σ), the width of the optimum range (and other ranges), the price difference between products within and outside the optimum range, and the quantity of product produced per animal (Hovenier et al., 1993).
The calculation of economic values for these optimum categorical traits requires the definition of quality classes (truncation points between classes) for each trait. Furthermore, it was assumed, for these categorical traits, that there is an unobserved underlying normal distribution of the sum of genetic and environmental values, and that the phenotypic category is defined by threshold values on this distribution (Koots et al., 1994; Falconer & Mackay, 1996). Therefore, given a certain population mean µ and a normal probability distribution [X ~ N (µ, σ2)] of the trait f(x | µ), the fraction of the population within the defined quality classes can be determined. It is also necessary to know (or assume) the price for carcasses within a
The South African Journal of Animal Science is available online at http://www.sasas.co.za/sajas.asp

South African Journal of Animal Science 2007, 37 (2) © South African Society for Animal Science
111
given quality class. Income per carcass can then be seen as the average value of carcasses in the population or as the expected value of a carcass.
For the derivation of the economic value for dressing percentage it was assumed that profit (π) is a function of the number of animals available for sale (NCW), final weight (FWF), dressing percentage (DP) and the average value (vC) of a carcass.
Truncation points for fatness classes (L, I, F) representing lean, intermediate and fat, respectively. The price per kg carcass weight within each category as well as the probabilities (dependent on the population mean level of performance) for carcasses to be in a certain class, are shown in Table 5. Truncation points were chosen based on the South African meat classification system. Table 5 Summary of values/prices (x) in R/kg carcass weight, probabilities before (P) and after a trait change (P*), and truncation points (t) in mm backfat thickness associated with different fatness classes ________________________________________________________________________________________________ Fatness class Range x (pi) f(x) = P(X = x) t P* ------------------------------------------------------------------------------------------------------------------------------------------------
L A0/A1 12.94 0.125 < 1mm 0.027 I A2/A3 13.50 0.856 1 – 5 mm 0.878 F >A3 12.86 0.019 > 5 mm 0.095
________________________________________________________________________________________________ Boleman et al. (1997) and Lusk et al. (2001) concluded that consumers could discern between
categories of tenderness and were willing to pay a premium for improved tenderness. Truncation points for beef tenderness classes (T, I, U) representing tender, intermediate and tough (unacceptable) respectively. The price per kg carcass weight within each category as well as the probabilities for carcasses to be in a certain class, are shown in Table 6. Truncation points were chosen similar to those reported by Shackelford et al. (1991).
A guaranteed tender steak costs, in the butcheries of a well known supermarket chain in the Gauteng Province of South Africa, on average R 7.00/kg more than a standard steak. If it is assumed that 30% of beef cuts (proportion of high priced cuts – SAMIC – South African Meat Industries Company) on a weight basis would benefit from improved tenderness, the price per kg of carcass would increase (premium paid) by about 9% from an average value of R 13.50 to R 14.70. It was further assumed that the same amount would be discounted from the tough (unacceptable) carcass (Table 6). Table 6 Summary of values/prices (x) in R/kg carcass weight, probabilities before (P) and after a trait change (P*), and WBS-truncation points (t) in kg shear force associated with different tenderness classes _________________________________________________________________________________________________________ Tenderness class x (pi) f(x) = P(X = x) t a P* --------------------------------------------------------------------------------------------------------------------------------
T 14.70 0.3791 < 3.9 0.3502 I 13.50 0.2123 3.9 – 4.6 0.2110 U 12.30 0.4086 > 4.6 0.4388
a from Shackelford et al. (1991) Jeremiah et al. (1993) as quoted by Devitt et al. (2002) reported that the relative choice of consumers
between tenderness and marbling is in the order of 3:1. It was then assumed that, since consumers are prepared to pay a 9% premium for a guaranteed tender carcass, they would also be prepared to pay a 3% premium for carcasses in the optimum marbling score class. Barwick & Henzell (1999) indicated a lower premium (± 30% lower than for the optimum class) for the highest marbling score classes.
Truncation points for marbling score classes (L, O, H) representing low, optimum and high, respectively. The price per kg carcass weight within each category as well as the probabilities for carcasses
The South African Journal of Animal Science is available online at http://www.sasas.co.za/sajas.asp

South African Journal of Animal Science 2007, 37 (2) © South African Society for Animal Science
112
to be in a certain class, are shown in Table 7. Truncation points were chosen based on the study by Barwick & Henzell (1999). Table 7 Summary of values/prices (x) in R/kg carcass weight, probabilities before (P) and after a trait change (P*), and marbling score truncation points (t) for different marbling score classes ________________________________________________________________________________________________ Marbling score class Range x (pi) f(x) = P(X = x) t P* ------------------------------------------------------------------------------------------------------------------------------------------------
L 0, 1 13.50 0.1113 < 2 0.0898 O 2, 3, 13.90 0.7525 2 – 3.9 0.7457 H 4, 5, 6 13.77 0.1362 > 3.9 0.1645
________________________________________________________________________________________________
Biological and economic efficiency of the cow herd are most clearly reflected in the number of calves weaned per cow exposed. The weight of the weaned calves is generally of secondary importance in defining biological efficiency in integrated systems, but plays a significant role in defining economic efficiency for the cow-calf producer (Notter, 2002). Achievement of high levels of cow efficiency would be facilitated by high levels of maternal calving ease. Therefore, the number of calves weaned (NCW) can be seen as a function of fertility (calving rate (CR) or days to calving (CD)) and mortality due to dystocia. CR was defined as the number of calves born (0 or 1) per cow present in the herd and CD as the date on which the cow calved within the calving season relative to the date the first calf was born (Ponzoni, 1992).
Since there are, at present, no parameter estimates for functional traits for the Simmentaler breed in Southern Africa, estimates reported in the literature were used and summarised in Table 8. Although more recent estimates were available, the weighted mean heritabilities reported by Koots et al. (1994) were used. Table 8 Parameters for the functional traits to be included in the breeding objective __________________________________________________________________________________________________________________ Trait Symbol h² Mean σP σA ----------------------------------------------------------------------------------------------------------------------------------------------- Calving rate CR 0.17 86% 3.47 1.43 Days to calving CD 0.08 60 days 25.0 7.07 Calving ease (direct) CED 0.13 95.7% a 2.02 0.73 Calving ease (maternal) CEM 0.12 95.7% 2.02 0.70 ________________________________________________________________________________________________ a % unassisted calvings
Data for the derivation of the economic value for CR was provided by the Simmentaler Cattle
Breeders’ Society of Southern Africa (SCBSSA). For this analysis a herd size of 100 cows and a mean calving rate of 86% were assumed. It was further assumed that CR is a binary trait [bi (100, 0.86)] and, therefore, scored in only two categories. If the mean performance in the herd for this trait increased by one unit (µ = 87), the probability of success will increase as well. This implies that, for this assumed typical Simmentaler herd, there will be one more calf available for sale. The economic value of CR can, therefore, be related directly to the number of calves weaned (NCW).
Data to derive the economic value for CD were also provided by the SCBSSA. However, these data were very limited as information on only 2226 calvings, recorded over a 10 year period (1992 – 2001), were available. Although records on bull entry dates and calving dates exist on farm level these records were not readily available. To properly capture this information is of utmost importance. For this study only four herds had reliable information available for a restricted calving season. Since these calvings were recorded as independent events occurring in four 28-day periods (112 days), CD was considered to be a discrete random variable. In this study it was assumed that surplus offspring were slaughtered at a fixed age. Thus a reduction in CD would result in slaughtering at an earlier date but not in the production of heavier slaughter animals,
The South African Journal of Animal Science is available online at http://www.sasas.co.za/sajas.asp
South African Journal of Animal Science 2007, 37 (2) © South African Society for Animal Science
113
and consequently not in a change in profit per animal (weaner) sold. The economic value of CD was derived according to the reasoning of Ponzoni & Newman (1989) where a reduction (improvement) in one day in the mean CD reduced the number of barren cows by 1%. It also means that there is a 1% increase in surplus weaners for sale and one less heifer needed to replace a barren cow. Ponzoni & Newman (1989) assumed a normal distribution for calving day whereas Amer et al. (1996) modelled a skewed calving day distribution with economic values for CD 30% lower than under assumed normality.
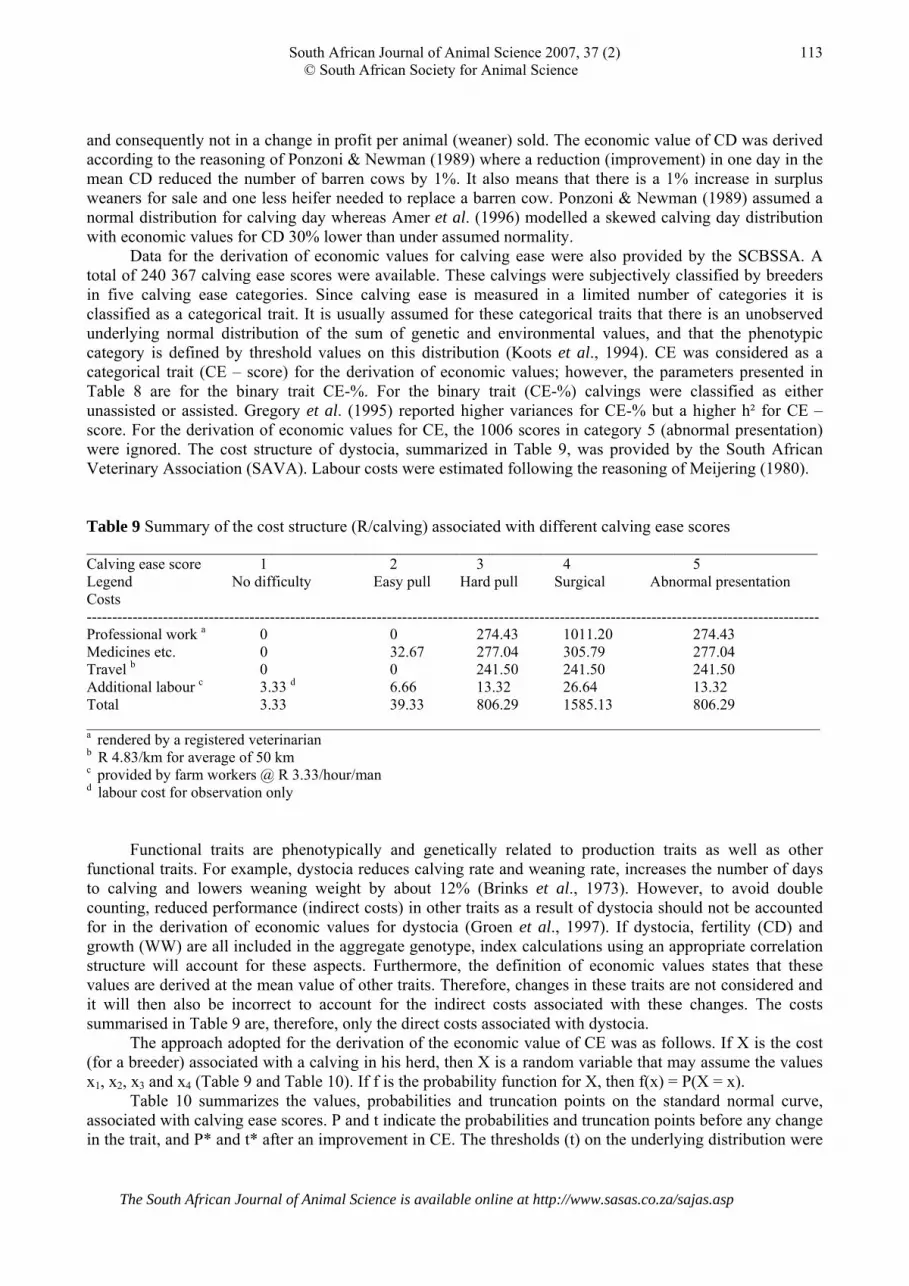
Data for the derivation of economic values for calving ease were also provided by the SCBSSA. A total of 240 367 calving ease scores were available. These calvings were subjectively classified by breeders in five calving ease categories. Since calving ease is measured in a limited number of categories it is classified as a categorical trait. It is usually assumed for these categorical traits that there is an unobserved underlying normal distribution of the sum of genetic and environmental values, and that the phenotypic category is defined by threshold values on this distribution (Koots et al., 1994). CE was considered as a categorical trait (CE – score) for the derivation of economic values; however, the parameters presented in Table 8 are for the binary trait CE-%. For the binary trait (CE-%) calvings were classified as either unassisted or assisted. Gregory et al. (1995) reported higher variances for CE-% but a higher h² for CE – score. For the derivation of economic values for CE, the 1006 scores in category 5 (abnormal presentation) were ignored. The cost structure of dystocia, summarized in Table 9, was provided by the South African Veterinary Association (SAVA). Labour costs were estimated following the reasoning of Meijering (1980).
Table 9 Summary of the cost structure (R/calving) associated with different calving ease scores _______________________________________________________________________________________ Calving ease score 1 2 3 4 5 Legend No difficulty Easy pull Hard pull Surgical Abnormal presentation Costs ------------------------------------------------------------------------------------------------------------------------------------------------ Professional work a 0 0 274.43 1011.20 274.43 Medicines etc. 0 32.67 277.04 305.79 277.04 Travel b 0 0 241.50 241.50 241.50 Additional labour c 3.33 d 6.66 13.32 26.64 13.32 Total 3.33 39.33 806.29 1585.13 806.29 ________________________________________________________________________________________________ a rendered by a registered veterinarian b R 4.83/km for average of 50 km c provided by farm workers @ R 3.33/hour/man d labour cost for observation only
Functional traits are phenotypically and genetically related to production traits as well as other functional traits. For example, dystocia reduces calving rate and weaning rate, increases the number of days to calving and lowers weaning weight by about 12% (Brinks et al., 1973). However, to avoid double counting, reduced performance (indirect costs) in other traits as a result of dystocia should not be accounted for in the derivation of economic values for dystocia (Groen et al., 1997). If dystocia, fertility (CD) and growth (WW) are all included in the aggregate genotype, index calculations using an appropriate correlation structure will account for these aspects. Furthermore, the definition of economic values states that these values are derived at the mean value of other traits. Therefore, changes in these traits are not considered and it will then also be incorrect to account for the indirect costs associated with these changes. The costs summarised in Table 9 are, therefore, only the direct costs associated with dystocia.
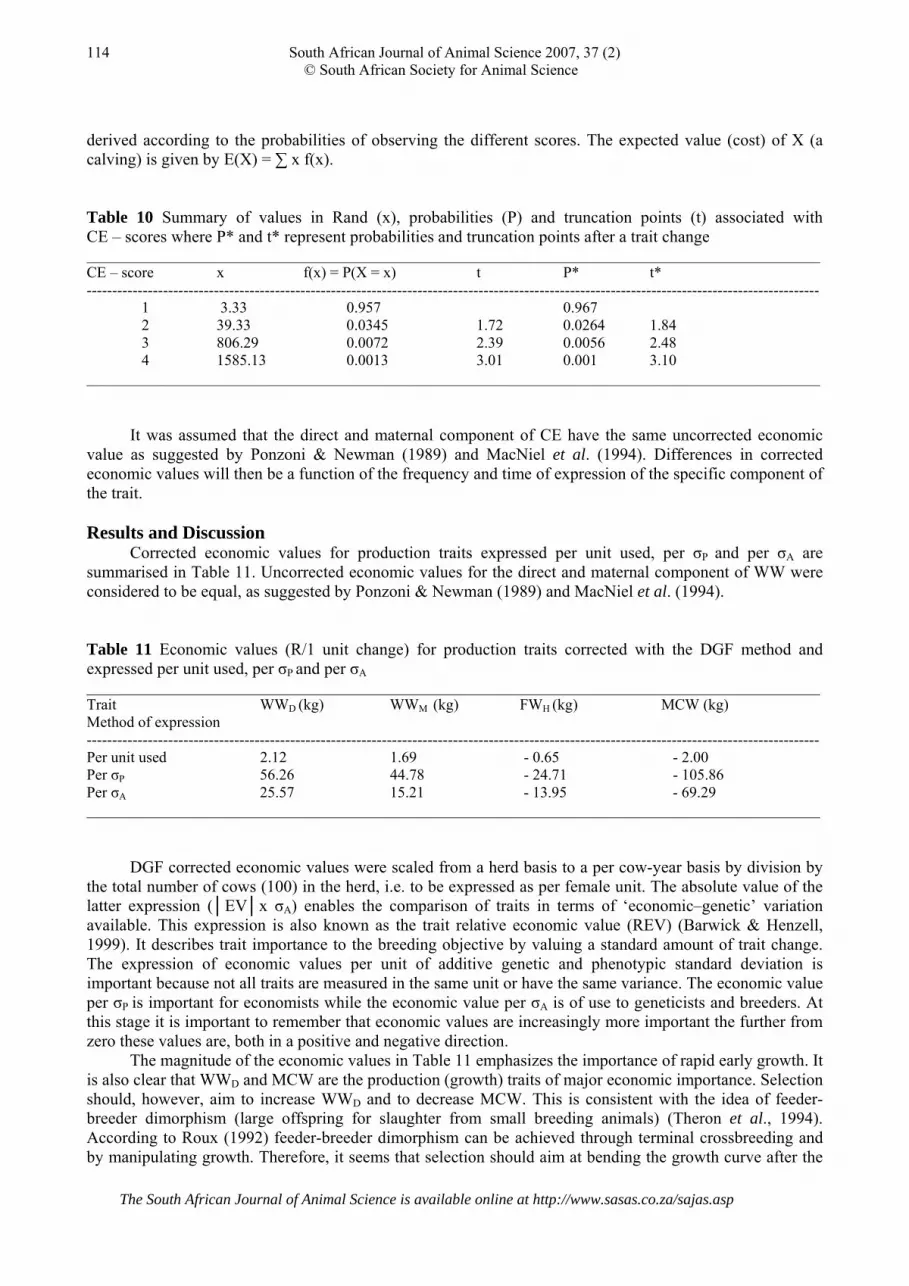
The approach adopted for the derivation of the economic value of CE was as follows. If X is the cost (for a breeder) associated with a calving in his herd, then X is a random variable that may assume the values x1, x2, x3 and x4 (Table 9 and Table 10). If f is the probability function for X, then f(x) = P(X = x).
Table 10 summarizes the values, probabilities and truncation points on the standard normal curve, associated with calving ease scores. P and t indicate the probabilities and truncation points before any change in the trait, and P* and t* after an improvement in CE. The thresholds (t) on the underlying distribution were
The South African Journal of Animal Science is available online at http://www.sasas.co.za/sajas.asp
South African Journal of Animal Science 2007, 37 (2) © South African Society for Animal Science
114
derived according to the probabilities of observing the different scores. The expected value (cost) of X (a calving) is given by E(X) = ∑ x f(x). Table 10 Summary of values in Rand (x), probabilities (P) and truncation points (t) associated with CE – scores where P* and t* represent probabilities and truncation points after a trait change ________________________________________________________________________________________________ CE – score x f(x) = P(X = x) t P* t* ------------------------------------------------------------------------------------------------------------------------------------------------
1 3.33 0.957 0.967 2 39.33 0.0345 1.72 0.0264 1.84 3 806.29 0.0072 2.39 0.0056 2.48 4 1585.13 0.0013 3.01 0.001 3.10
________________________________________________________________________________________________
It was assumed that the direct and maternal component of CE have the same uncorrected economic value as suggested by Ponzoni & Newman (1989) and MacNiel et al. (1994). Differences in corrected economic values will then be a function of the frequency and time of expression of the specific component of the trait. Results and Discussion
Corrected economic values for production traits expressed per unit used, per σP and per σA are summarised in Table 11. Uncorrected economic values for the direct and maternal component of WW were considered to be equal, as suggested by Ponzoni & Newman (1989) and MacNiel et al. (1994). Table 11 Economic values (R/1 unit change) for production traits corrected with the DGF method and expressed per unit used, per σP and per σA ________________________________________________________________________________________________ Trait WWD (kg) WWM (kg) FWH (kg) MCW (kg) Method of expression ------------------------------------------------------------------------------------------------------------------------------------------------ Per unit used 2.12 1.69 - 0.65 - 2.00 Per σP 56.26 44.78 - 24.71 - 105.86 Per σA 25.57 15.21 - 13.95 - 69.29 ________________________________________________________________________________________________
DGF corrected economic values were scaled from a herd basis to a per cow-year basis by division by the total number of cows (100) in the herd, i.e. to be expressed as per female unit. The absolute value of the latter expression (│EV│x σA) enables the comparison of traits in terms of ‘economic–genetic’ variation available. This expression is also known as the trait relative economic value (REV) (Barwick & Henzell, 1999). It describes trait importance to the breeding objective by valuing a standard amount of trait change. The expression of economic values per unit of additive genetic and phenotypic standard deviation is important because not all traits are measured in the same unit or have the same variance. The economic value per σP is important for economists while the economic value per σA is of use to geneticists and breeders. At this stage it is important to remember that economic values are increasingly more important the further from zero these values are, both in a positive and negative direction.
The magnitude of the economic values in Table 11 emphasizes the importance of rapid early growth. It is also clear that WWD and MCW are the production (growth) traits of major economic importance. Selection should, however, aim to increase WWD and to decrease MCW. This is consistent with the idea of feeder-breeder dimorphism (large offspring for slaughter from small breeding animals) (Theron et al., 1994). According to Roux (1992) feeder-breeder dimorphism can be achieved through terminal crossbreeding and by manipulating growth. Therefore, it seems that selection should aim at bending the growth curve after the
The South African Journal of Animal Science is available online at http://www.sasas.co.za/sajas.asp

South African Journal of Animal Science 2007, 37 (2) © South African Society for Animal Science
115
point of marketing. Given the positive genetic correlation between MCW and WWD (rG = 0.4) means that inclusion of MCW (with a negative value) and WWD (with a positive value) in the breeding objective will not necessarily cause weaning weight to increase or mature weight to decrease but it might prevent mature weight from increasing further.
These results are in agreement with the conclusion of Groen et al. (1997) that mature body weight of cattle usually has a negative economic value since marginal costs associated with increased feed requirements exceed marginal revenues from increased body weight of culled animals. Furthermore, Spelman & Garrick (1997) concluded that inclusion of live weight (MCW) with a negative economic value in a selection index resulted in higher economic response. If feed intake had not been included as a cost function in the profit equation, heifer sale weight (FWH) and cow weight (MCW) would have had positive economic values. Furthermore, if feed costs were derived from agistment rates (R 0.09/kg DM) marginal costs associated with increased feed requirements would have been lower than marginal revenues from increased body weight. Economic values for body weight would then also have been positive. Based on agistment rates, DGF corrected economic values (R/unit) of +0.19 and +0.37 were derived for FW and MCW, respectively. These results would obviously have a major effect on the breeding objective, economic response through selection and production efficiency.
As mentioned, the economic values of growth traits, especially heifer and cow weight, depend, to a large extent on the value of the feed consumed and beef prices. Note that in South Africa approximately 75% of cattle slaughtered are finished through a feedlot (expensive feed) whereas the cow herd is usually kept on pastures (relatively cheap feed). These results illustrate the importance of feed intake and of an accurate estimate of the cost of feed. Ideally, feed intake should be measured in a pasture situation. However, accounting for the cost of feed in the objective may be sufficient for improving overall response to selection for improved productivity. There are two options to account for feed inputs. The approach taken in this study reflects the situation faced by individual producers in an environment where they are individually inconsequential to prices for inputs and products. Therefore, producers would have the option to buy or rent pasture or purchase feedstuffs to meet any increased need for feed resources. Alternatively, feed resources could be considered fixed and the production enterprise rescaled in response to changes in feed requirements. The latter approach seems warranted only in planning nationwide breeding programs where the possibility of obtaining additional feed resources may be limited. It is important to realize that these different options (rent pasture, purchase feedstuffs, and rescale enterprise) will result in different economic values.
Compared to the economic values derived for production (growth) traits and functional traits, the economic values for product quality traits (Table 12) are the least important. Table 12 Economic values (R/1 unit change) for product / quality traits corrected with the DGF method and expressed per unit used, per σP, and per σA ________________________________________________________________________________________________ Trait DP BF T M Method of expression ------------------------------------------------------------------------------------------------------------------------------------------------ Per unit used 17.61 0.45 - 5.03 0.35 Per σP 33.46 0.59 - 6.54 0.29 Per σA 20.96 0.39 - 3.52 0.18 ________________________________________________________________________________________________
This is in agreement with the general belief that functional traits are economically the most important
followed by production traits. The exception is dressing percentage (DP) with an economic value similar to that of the production traits. This is to be expected as DP is not a quality trait as such but can be regarded as a production trait. This higher value for DP is similar to the results obtained by Wolfovà et al. (1995). Among the three quality traits (BF, T and M) to include in the breeding objective, tenderness (T) is the most important (-R 3.52) followed by backfat thickness (BF) (R 0.39) and marbling (M) (R 0.18). Although tenderness is economically the most important beef quality trait it is not an optimum trait. Optimum traits have an intermediate optimum value (intermediate mean performance in the population). This is not the case
The South African Journal of Animal Science is available online at http://www.sasas.co.za/sajas.asp

South African Journal of Animal Science 2007, 37 (2) © South African Society for Animal Science
116
with tenderness where a maximum rather than an intermediate value is ideal. This may change in future as too soft meat may be undesirable to consumers. However, given the current mean and / or expected rate of progress this is not an issue yet.
Since the economic value of optimum traits (e.g. backfat thickness and marbling) depend on the population mean value for these traits, optimum traits may have positive, zero or negative economic values. The low economic values for BF and M may, therefore, suggest that these traits are close to the optimum value (optimum mean performance). To test the possibility of obtaining a negative economic value it was assumed that the mean backfat thickness in the population was 4 mm (µ = 4 mm) and that it increased, through selection, to 5 mm (µ* = 5 mm). The expected value of a carcass (at 4 mm) was computed as R 13.37 [E(X) = 13.37] and after a one unit (1 mm) increase in mean performance (at 5 mm) as R 13.20 [E(X)* = 13.20]. The uncorrected economic value at this level of performance in the population is then E(X)* – E(X) = - R 0.17/kg carcass weight. At an average carcass weight of 240 kg (Table 2) the uncorrected economic value would then be –R 40.80. This negative economic value confirms the above mentioned phenomenon.
To determine the optimum backfat thickness under the current pricing system, the expected value of a carcass was determined at assumed different mean levels for the trait (BF) by employing the method discussed above. Results are summarised in Figure 1 and certain conclusions can be drawn. The most obvious is the fact that backfat thickness is indeed an optimum trait. It is also clear that the optimum value or optimum mean performance for this trait is 3 mm. At this level of performance the expected value of a carcass or the mean value of carcasses in the breed / population will be R 13.44/kg. At mean values to the left of (less than) 3 mm the trait BF will have a positive economic value whereas to the right of (more than) 3 mm the economic value will be negative. Although only a pure-breeding system was dealt with in this study, one should remember that mate genotype (mean performance of the breed to be crossed with) should, in crossbreeding programmes be taken into consideration as it may have an influence on the economic value of optimum traits. These results also emphasise the importance of knowing the correct mean values for traits, especially optimum traits, as not only the magnitude of economic values can change but also the sign. Re-derivation of economic values after a trait change is also of major importance.
13.1
13.15
13.2
13.25
13.3
13.35
13.4
13.45
13.5
0 1 2 3 4 5 6
Back fat (mm)
Car
cass
val
ue (R
)
Figure 1 Expected values [E(X)] in Rand/kg of carcass at different mean levels (mm backfat thickness) for the trait backfat
The South African Journal of Animal Science is available online at http://www.sasas.co.za/sajas.asp

South African Journal of Animal Science 2007, 37 (2) © South African Society for Animal Science
117
One unit increase in the traits CR (calving rate) and CD (days to calving), have three components that impact on profit from the herd. One component is due to the sale of weaner calves, the second component is due to the sale of surplus heifers and the third component due to the number of cull cows (barren rate). As shown in the previous section, an improvement in CR and CD will result in one more weaner for sale and, therefore, one less barren cow to be replaced with a heifer.
Corrected economic values for functional traits, expressed per unit used, per σP, and per σA are summarised in Table 13. The magnitude of these economic values emphasizes the relative economic importance of fertility. Compared with the economic values for production traits, fertility is at least six times as important as growth (WW) in a typical Simmentaler herd employing a pasture based cow-calf production system. Results from Wolfovà et al. (in press) also suggested that functional traits (direct calving performance and longevity of cows) are of primary economic importance in all production systems and marketing strategies.
Table 13 Economic values (R/1 unit change) for functional traits corrected with the DGF method and expressed per unit used, per σP and per σA ________________________________________________________________________________________________ Trait CR CD CED CEMMethod of expression ------------------------------------------------------------------------------------------------------------------------------------------------ Per unit used 13.27 - 13.27 1.48 1.64 Per σP 46.05 - 331.75 2.99 3.31 Per σA 18.98 - 93.82 1.08 1.15 ________________________________________________________________________________________________
Ponzoni (1992) examined the genetic consequences of using either CD or CR as a measure of female fertility and concluded the choice should only depend on the relative values of reliable phenotypic and genetic parameters. This conclusion by Ponzoni (1992) was also demonstrated in this study, where the best option for inclusion in the selection objective seems to be CD. Johnston & Bunter (1996) found a high genetic correlation (rG = -0.97) between CD and CR and similar heritabilities for both traits, leading to the conclusion that the same trait was being measured. Since these are complex traits and the components of both include factors such as conception rate, length of the post-partum anoestrus interval (PPI) and gestation length (GL), this assessment is probably valid. As CD is able to distinguish between early and late calvers, Johnston & Bunter (1996) were in favour of using CD as a measure of fertility.
At mean values of close to 100% the scope of improvement by selection for CR will be exhausted. By contrast, genetic gains in CD at that point could still be achievable. The economic value of CD would, however, be different to that assumed in this study. Benefits would no longer be the consequence of improved reproductive rate, but rather that of a more concentrated calving.
The expected cost associated with a calving before any improvement in the trait CE was computed from the data in Table 10 as R 12.41 [E(X) = 12.41]. After one unit (1%) improvement in the number of unassisted calvings (score 1) the probabilities (P*) for the different calving ease scores change to the values given in Table 10. For these new probabilities the expected value of X was computed as R 10.36 [E(X)* = 10.36]. The change in profit due to an improvement in the trait is E(X) – E(X)* = R 2.05. The expected cost of a calving (cc) can, therefore, be related to CE by equation (1) as:
cc = µ cc + (µ CE – CE) 2.05 (1)
Where cc is the expected cost of a calving, µ cc is the cost of a calving at mean performance in the trait
CE, µ CE is the mean performance in the trait CE (% unassisted calvings) and CE can be seen as the % unassisted calvings in a specific herd or the new level of performance in the trait after an improvement. This reasoning assumes a linear relationship between CE and the cost of a calving. This assumption holds for small changes in CE.
The South African Journal of Animal Science is available online at http://www.sasas.co.za/sajas.asp
South African Journal of Animal Science 2007, 37 (2) © South African Society for Animal Science
118
The economic value of a trait may depend on the level of performance in the trait itself, or on the level of other traits. Evaluation of non-linearity of economic values can be performed by deriving economic values at different starting values for genetic merit of the animals. Groen et al. (1994) studied the relative efficiency of non-linear indices versus regular updating economic values according to new population averages. They concluded that directly optimizing response over multiple generations yield slightly higher economic responses than stepwise (each generation) adjustment of a linear index. Furthermore, a quadratic index was less efficient than a linear index when considering multiple generations. Groen et al. (1997) concluded that for non-linear profit functions there are no uniformly best solutions. Maximum progress will always be achieved by a linear index, but for a non-linear profit function, the index that results in maximum genetic gain in the future will be a function of the selection intensity.
Therefore, to evaluate the non-linearity of the economic value for CE it was assumed that the percentage unassisted calvings is only 75% (Pscore 1 = 0.75) and not 95.7%. This higher number of assisted calvings can be related to heifer calvings (Gregory et al., 1995). It was further assumed that the probability of other calving ease scores changes proportionally. The expected cost of a calving at this level of performance in the breed was computed as R 56.52. The uncorrected economic value of R 2.28 is R 0.23 higher than the value previously derived from the data. These results emphasize not only that non-linearity does exist but also that this non-linearity is not extreme. By employing equation (1) the expected cost of a calving (cc) was computed as R 54.85 indicating that equation (1) is fairly robust to changes in the mean performance of CE. It was, therefore, concluded that, unless the non-linearity for functional traits is extreme, non-linearity will cause second order effects that are of minor importance in relation to the rate of genetic gain expected.
The findings of the present study are a function of the assumptions made during the development of the model and can, therefore, not be compared directly with the results from other studies. Munoz-Luna et al. (1988), for instance, derived a negative economic value for dystocia percentage. However, since dystocia can be considered as the opposite of calving ease (with a positive economic value) this negative value is to be expected. Koots & Gibson (1998) and Amer et al. (2001) included indirect costs associated with reduced production, fertility and survival. In this study, these indirect costs were not accounted for because they were already included in the mean performance of traits also included in the breeding objective.
Conclusions
Only the Simmentaler situation was investigated in this study. However, the model enables the examination of the effect of variation in, for instance, herd composition, product values and costs, phenotypic and genetic parameters, as well as production systems. The lack of sufficient information on phenotypic and genetic parameters may limit the expansion or practical application of the model. Therefore, recording of beef cattle performance should, in future, aim at satisfying the needs of breeding objective development. Furthermore, the necessity of economic data recorded across several years, to have economic values with reasonable precision, suggests a need for a long-term commitment to systematic recording of both economic and production information at the producer level.
At present there is no consumer driven price differentials for the majority of carcass traits in South Africa. This shortcoming prevents the formal derivation of economic values for these traits. Since there is an increasing awareness of and an interest in product quality by breeders and consumers alike, more and better information to include in the model will in future become available. Live animal ultrasound data and gene marker technology in combination with carcass data can be powerful tools to enhance genetic evaluation and selection for carcass quality. Assumptions made in this study should, however, in the mean time suffice. Furthermore, inclusion of these traits in the breeding objective may reflect possible future developments in the beef market.
Optimal utilization of genetic evaluations for quality traits in combination with genetic evaluation for other traits involves determination of the economic importance of improving quality traits relative to the economic importance of improving other traits. Since the economic values of product quality traits are low (under the current price structure) these traits will only be of interest for selection programmes and be included in the selection index, if they are favourably correlated with economically more important traits. The long-term survival and prosperity of the beef industry depends on its economic viability, which is served
The South African Journal of Animal Science is available online at http://www.sasas.co.za/sajas.asp

South African Journal of Animal Science 2007, 37 (2) © South African Society for Animal Science
119
by improving its competitiveness, profitability and economic efficiency by focusing on characteristics that customers want.
The choice of the right selection criteria seems to be one of the most important decisions to be taken not only by breeders but also by administrators of performance recording schemes. Under most circumstances the difference between using different criteria for fertility will be small compared to the effect of ignoring reproduction altogether. The choice of a trait(s) would not only depend on the relative values of reliable phenotypic and genetic parameters but will also be influenced by non-genetic considerations such as ease and cost of incorporation into the performance recording scheme as well as acceptance by breeders. It is, however, recommended that breeders adopt a management system that will enable them to record bull entry dates, calving dates and the pregnancy status of cows.
The economic values for calving-ease were derived from a purely economic point of view. Aspects of animal welfare may, in future, become increasingly relevant and cannot be ignored.
Acknowledgements
The NRF provided financial support for this study. The Simmentaler Cattle Breeders’ Society of Southern Africa, Breedplan International, Anton Casteleijn, senior economist S.A. Reserve Bank, Tertius Gous, S. Afr. Veterinary Association, Peter Milton (Beefcor Feedlot) and Hennie Gerber (SAMIC) provided data and information used in this study. References Amer, P.R., Crump, R. & Simm, G., 1998. A terminal sire selection index for UK beef cattle. Anim. Sci. 67,
445-454. Amer, P.R., Simm, G., Keane, M.G., Diskin, M.G. & Wickham, B.W., 2001. Breeding objectives for beef
cattle in Ireland. Livest. Prod. Sci. 67, 223-239. Archer, J.A., Richardson, E.C., Herd, R.M. & Arthur, P.F., 1999. Potential for selection to improve
efficiency of feed use in beef cattle: a review. Aust. J. Agric. Res. 50, 147-161. Arthur, P.F., Archer, J.A., Johnson, D.J., Herd, R.M., Richardson, E.C. & Parnell, P.F., 2001. Genetic and
phenotypic variance and covariance components for feed intake, feed efficiency, and other post weaning traits in Angus cattle. J. Anim. Sci. 79, 2805-2811.
Barwick, S.A. & Henzell, A.L., 1999. Assessing the value of improved marbling in beef breeding objectives and selection. Aust. J. Agric. Res. 50, 503-512.
Bekman, H. & Van Arendonk, J.A.M., 1993. Derivation of economic values for veal, beef and milk production traits using profit equations. Livest. Prod. Sci. 34, 35-56.
Blaxter, K., 1988. The Nutrient Requirements of Ruminant Livestock. Commonwealth Agricultural Bureaux. Lavenham Press Ltd, Suffolk.
Boleman, S.J., Boleman, S.L., Miller, R.K., Taylor, J.F., Cross, H.R., Wheeler, T.L., Koohmaraie, M., Schackelford, S.D., Miller, M.F., West, R.L., Johnson, D.D. & Savell, J.W., 1997. Consumer evaluation of beef of known categories of tenderness. J. Anim. Sci. 75, 1521-1524.
Brinks, J.S., Olson, J.E. & Carrol, E.J., 1973. Calving difficulty and its association with subsequent production in Herefords. J. Anim. Sci. 36, 11-17.
Dekkers, J.C.M., 1991. Estimation of economic values for dairy breeding goals: bias due to sub-optimal management policies. Livest. Prod. Sci. 29, 131-149.
Devitt, C.J.B., Wilton, J.W., Mandell, I.B., Fernandes, T.L. & Miller, S.P., 2002. Genetic evaluation of tenderness in the longissimus in multi-breed populations of beef cattle and the implications of selection. In: Proc. 7th Wrld. Cong. Genet. Appl. Livest. Prod., Montpellier (France).
Falconer, D.S. & Mackay, T.F.C., 1996. Introduction to Quantitative Genetics. Prentice Hall, London. Gregory, K.E., Cundiff, L.V. & Koch, R.M., 1995. Genetic and phenotypic (co)variances for growth and
carcass traits of purebred and composite populations of beef cattle. J. Anim. Sci. 73, 1920-1926. Groen, A.F., 1988. Derivation of economic values in cattle breeding: A model at farm level. Agric. Syst. 27,
195-213. Groen, A.F. & Korver, S., 1989. The economic value of feed intake capacity of dairy cows. Livest. Prod. Sci.
22, 269-281.
The South African Journal of Animal Science is available online at http://www.sasas.co.za/sajas.asp

South African Journal of Animal Science 2007, 37 (2) © South African Society for Animal Science
120
Groen, A.F., Meuwissen, T.H.E., Vollema, A.R. & Brascamp, E.W., 1994. A comparison of alternative index procedures for multiple generation selection on non-linear profit. Anim. Prod. 59, 1-9.
Groen, A.F., Steine, T., Colleau, J., Pederson, J., Pribyl, J. & Reinsch, N., 1997. Economic values in dairy cattle breeding, with special reference to functional traits. Report of an EAAP-working group. Livest. Prod. Sci. 49, 1-21.
Harris, D.L., 1970. Breeding for efficiency in livestock production: Defining the economic objectives. J. Anim. Sci. 30, 860-865.
Harris, B.L. & Freeman, A.E., 1993. Economic weights for milk yield traits and herd life under various economic conditions and production quotas. J. Dairy Sci. 76, 868-879.
Hazel, L.N., 1943. The genetic basis for constructing selection indexes. Genetics 28, 476-490. Hovenier, R., Brascamp, E.W., Kanis, E., Van der Werf, J.H.J. & Wassenberg, A.P.A.M., 1993. Economic
values of optimum traits: The example of meat quality in pigs. J. Anim. Sci. 71, 1429-1433. Jenkins, T.G. & Ferrell, C.L., 2002. Beef cow efficiency – revisited. In: Proc. 34th BIF Conf.
http://www.beefimprovement.org/proceedings.html Johnston, D.J. & Bunter, K.L., 1996. Days to calving in Angus cattle: Genetic and environmental effects, and
covariances with other traits. Livest. Prod. Sci. 45, 13-22. Koots, K.R. & Gibson, J.P., 1998. Effects of production and marketing circumstances on the economic
values for beef production traits. Can. J. Anim. Sci. 78, 47-55. Koots, K.R., Gibson, J.P., Smith, C. & Wilton, J.W., 1994. Analysis of published genetic parameter
estimates for beef production traits. 1. Heritability. Anim. Breed. Abst. 62, 309-338. Lusk, J.L., Fox, J.A., Schroeder, T.C., Mintert, J. & Koohmaraie, M., 2001. In-store valuation of steak
tenderness. Amer. J. Agric. Econ. 83, 539-550. MacNiel, M.D., Newman, S., Enns, R.M. & Stewart-Smith, J., 1994. Relative economic values for Canadian
beef production using specialized sire and dam lines. Can. J. Anim. Sci. 74, 411-417. McClintock, A.E. & Cunningham, E.P., 1974. Selection in dual purpose cattle populations: defining the
breeding objective. Anim. Prod. 18, 237-247. Meijering, A., 1980. Beef crossing with Dutch Friesian cows: Model calculations on expected levels of
calving difficulties and their consequences for profitability. Livest. Prod. Sci. 7, 419-436. Munoz-Luna, A., Yadav, S.B.S. & Dempfle, L., 1988. Derivation of economic weights for several traits for
the Rubia-Gallega cattle in Spain. J. Anim. Breed. Genet. 105, 372-383. Notter, D.R., 2002. Defining biological efficiency of beef production. In: Proc. 34th BIF Symp. Omaha,
Nebraska (USA). Phocas, F., Bloch, C., Chapelle, P., Bècherel, F., Renand, G. & Mènissier, F., 1998. Developing a breeding
objective for a French purebred beef cattle selection programme. Livest. Prod. Sci. 57, 49-65. Ponzoni, R.W., 1992. Which trait for genetic improvement of beef cattle reproduction: calving rate or
calving day? J. Anim. Breed. Genet. 109, 119-128. Ponzoni, R.W. & Newman, S., 1989 Developing breeding objectives for Australian beef cattle breeding.
Anim. Prod. 49, 35-47. Roux, C.Z., 1992. Maximum herd efficiency in meat production. 3. Feeder – breeder dimorphism. S. Afr. J.
Anim. Sci. 22, 11-15. Shackelford, S.D., Morgan, J.B., Cross, H.R. & Savell, J.W., 1991. Identification of threshold levels for
Warner-Bratzler shear force in beef top loin steaks. J. Muscle Foods 2, 289-296. Smith, C., 1978. The effect of inflation and form of investment on the estimated value of genetic
improvement in farm livestock. Anim. Prod. 26, 101-110. Spelman, R.J. & Garrick, D.J., 1997. Effect of live weight and differing economic values on response to
selection for milk fat, protein, volume and live weight. J. Dairy Sci. 80, 2557-2562. Tess, M.W., Bennett, G.L. & Dickerson, G.E., 1983. Simulation of genetic changes in life cycle efficiency of
pork production. 1. A bioeconomic model. J. Anim. Sci. 56, 336-353. Theron, H.E., Scholtz, M.M. & Roux, C.Z., 1994. Genetic relationship between growth traits in Bonsmara
heifer and bull calves on different nutritional regimes. S. Afr. J. Anim. Sci. 24, 67-70. Van der Merwe, F.J. & Smith, W.A., 1991. Dierevoeding. Anim Sci (Pty) Ltd, Pinelands.
The South African Journal of Animal Science is available online at http://www.sasas.co.za/sajas.asp

South African Journal of Animal Science 2007, 37 (2) © South African Society for Animal Science
121
Van Zyl, J.C., Maree, C. & Seifert, W., 1993. Beef production systems. In: Livestock Production Systems. Principles and Practice. Eds. Maree, C. & Casey, N.H., Agri – Development Foundation. Pretoria. pp. 89-123.
Weigel, D.J., Cassell, B.G., Hoeschelle, I. & Pearson, R.E., 1995. Multiple-trait prediction of transmitting abilities for herd life and estimation of economic weights using relative net income adjusted for opportunity cost. J. Dairy Sci. 78, 639-647.
Wolfovà, M., Wolf, J. & Hyànek, J., 1995. Economic weights for beef production traits in the Czech Republic. Livest. Prod. Sci. 43, 63-73.
Wolfovà, M., Wolf, J., Pribyl, J., Zahradkova, R. & Kica, J., 2005. Breeding objectives for beef cattle used in different production systems. 1. Model development. Livest. Prod. Sci. 95, 201-215.
The South African Journal of Animal Science is available online at http://www.sasas.co.za/sajas.asp