demand for agricultural credit by rural ... - core
TRANSCRIPT
DEMAND FOR AGRICULTURAL CREDIT BY RURAL SMALLHOLDER FARMERS:
A CASE OF CLIMATE SMART AGRICULTURE VILLAGES IN NYANDO BASIN,
KENYA
By
Elly Kyalo Musembi
X50/85347/2016
A Research Thesis Submitted in Partial Fulfillment to the School of Economics, the
University of Nairobi for the Award of the Degree of Master of Arts in Economics.
October, 2019
ii
DECLARATION
This research paper is my original work and has not been presented for any degree award in any
institution.
ELLY KYALO MUSEMBI
X50/85347/2016
Signature………………………………….. Date……………………………………………..
SUPERVISORS’ DECLARATION
This research paper has been submitted for examination with our approval as university
supervisors.
Prof. Richard M. Mulwa
CASELAP and School of Economics
Signature……………………………….……… Date……………………...............................
Dr. John K. Gathiaka
School of Economics
Signature……………………………….……… Date……………………...............................

iii
Table of Contents DECLARATION ............................................................................................................................ ii
ABSTRACT .................................................................................................................................... v
DEDICATION ............................................................................................................................... vi
ACKNOWLEDGEMENT ............................................................................................................ vii
ACRONYMS AND ABBREVIATIONS .................................................................................... viii
LIST OF FIGURES ....................................................................................................................... ix
LIST OF TABLES .......................................................................................................................... x
CHAPTER ONE: INTRODUCTION ............................................................................................. 1
1.1 Background of the study ............................................................................................................ 1
1.2 Statement of the Research Problem ........................................................................................... 8
1.3 Research Questions .................................................................................................................. 10
1.4 Study Objectives ...................................................................................................................... 10
1.5 The Hypothesis of the Study .................................................................................................... 10
1.6 The Significance of the Study .................................................................................................. 11
CHAPTER TWO: LITERATURE REVIEW ..........................................................12
2.1 Climate Smart Agriculture and Climate Change ..................................................................... 12
2.2 Demand and Supply of Agricultural Credit ............................................................................. 13
2.3 Empirical Literature ................................................................................................................. 16
2.3.1 A Primer on Demand ............................................................................................................ 16
2.3.2 Factors affecting Demand for Credit .................................................................................... 17
2.3.3 Demand for credit and CSA practices................................................................................... 23
2.5 Chapter summary ..................................................................................................................... 24
CHAPTER THREE: METHODOLOGY ................................................................26
3.1. Study Area .............................................................................................................................. 26
3.2. Data Needs, Types and Sources .............................................................................................. 27
3.3. Sampling and Sample Size Determination .............................................................................. 28
3.4. Questionnaire Design and Data Collection ............................................................................. 30
3.5 DATA ANALYSIS .................................................................................................................. 31
iv
3.5.1 Analytical Framework .......................................................................................................... 31
3.5.2 Theoretical Framework ......................................................................................................... 31
3.5.3 Conceptual Framework ......................................................................................................... 34
3.6 Empirical Model Specification ............................................................................................... 36
CHAPTER FOUR: RESULTS AND DISCUSSION ..............................................44
4.1 Descriptive analysis ................................................................................................................. 44
4.2 Credit sources, access and use ................................................................................................. 47
4.3 Credit market participation and intensity ................................................................................. 50
4.3.1 Credit market participation ................................................................................................... 52
4.3.2 Intensity of credit use ............................................................................................................ 55
CHAPTER FIVE: CONCLUSION AND RECOMMENDATIONS ......................58
REFERENCES .........................................................................................................61
v
ABSTRACT
The effect of climate change and variability on agricultural production systems cannot be
underestimated especially in rural areas. Farmers more than often experience increased
agricultural losses and reduced productivity due to weather vagaries, little or no investment in
their farms etc. Rural smallholder farmers are most affected and are faced with a number of
challenges such as lack of insurance services, limited access to credit facilities especially from
formal sources, among many others problems as they try to adapt and mitigate the impact of
changing climatic conditions and effects of global warming. With the absence of insurance and
limited access to financial resources (agricultural credit) the ability of the farmers to adopt smart
farming technologies that can cushion them from such losses is threatened. In order to inform
policy a lot of research work has been done on agricultural credit but resulted to inconsistent
findings and conclusions in different regions. With such in mind, more research is needed on
credit market participation, the intensity of participation and the choice of credit market more so
in specific regions of the developing countries. The findings of these studies will augment the
already existing knowledge and policies that actually reflect the needs of those particular
communities for rural sustainable development in general and agriculture in particular. This
research paper assessed loan facilities demanded by smallholder farmers‟, factors affecting
borrowing decisions and the subsequent factors that influence the intensity of borrowing by these
farmers in climate-smart villages of Nyando, Kisumu in an attempt to finance agricultural
production and adopt smart farming practices. By use of stratified sampling a 120 households
were sampled from participating and non-participating households. Data on individual,
institutional and socioeconomic characteristics was collected from these farm households by
university of Nairobi masters students in conjunction with CCAFS using structured
questionnaire. Data analysis employed descriptive and quantitative methods using double hurdle
model. The findings show that loan repayment period, number of groups household members are
into and collateral influence positively the household decision to borrow with the intensity of
participation being positively and significantly influenced by loan repayment period and
household wealth endowment. Therefore groups should be used to finance farmers and unlock
their economic potential.
vi
DEDICATION
I dedicate this work to my lovely wife (Claudia Jane and my unborn child), my caring and
always supportive parents (Regina and Musembi), my brothers (Sylvester and victor) and sisters
(Jennifer, Jane, and Cecilia) for their love, encouragement, and support throughout the academic
journey.
vii
ACKNOWLEDGEMENT
I thank God for granting me good health and understanding throughout my study period. Great
gratitude goes to my family, parents and other family members who have provided moral,
emotional and material support through the study period. I am extremely grateful to my
supervisors, Prof. Richard Mulwa and Dr. Kamau Gathiaka for their wise guidance and
encouragement, critical comments and advice which together enabled me to complete this great
piece of work.
viii
ACRONYMS AND ABBREVIATIONS
ASAL Arid and Semi-Arid Lands
CCAFS Climate Change Agriculture and Food Security
CGIAR Consultative group for international agricultural research
CSA Climate-smart agriculture
CSAP Climate-smart agriculture practices
AGRA Alliance for green revolution in Africa
OECD Organization for economic corporation and development
GDP Gross domestic product
IMF International monetary fund
PDF Probability distribution function
ILRI International Livestock Research Institute
CIAT International Center for Tropical Agriculture
UNFCCC United Nations Framework Convention on Climate Change
ix
LIST OF FIGURES
Figure 1: The map of the study area ............................................................................................. 27
Figure 2: Conceptual Framework ................................................................................................. 35
Figure 3: Graph of household head education level ..................................................................... 47
Figure 4: Graph of farmers credit use ........................................................................................... 48
Figure 5: Graph credit market participation by gender ................................................................. 52
x
LIST OF TABLES
Table 1. Frequencies of households across strata in 2017 CCAFS End line Survey.................... 29
Table 2. Frequencies of households across strata in the Baseline Survey .................................... 30
Table 3. Variable description and measurement ........................................................................... 43
Table 4. Variable summary ........................................................................................................... 45
Table 5. Percentage and frequency distribution of other variables ............................................... 46
Table 6. Credit sources ................................................................................................................. 47
Table 7. Other loan uses................................................................................................................ 49
Table 8.Loans for CSA ................................................................................................................. 50
Table 9. Analytical results ............................................................................................................ 50
1
CHAPTER ONE: INTRODUCTION
1.1 Background of the study
The importance of agriculture in solving the problem of food security can be seen from the
priority it's accorded in the African development agenda. It is also through agriculture that the
world targets to achieve sustainable development agenda two of ending hunger by 2030.
Agriculture accounts for 15% of total global GDP and 32% in Africa (OECD and FAO, 2016). It
employs over half of the labour force, and it's the means of livelihood for a majority of rural
smallholder farmers (IMF, 2012). Smallholder farms account for approximately 80% of all farms
in sub-Saharan Africa and employ about 175 million people directly (AGRA, 2014). In these
countries, women provide over half of the total labor force (FAO, 2015). Dixon et al., (2003),
smallholder farmers in Africa are classified using agro-ecological zones, farm portfolio, land size
and returns from farming activities. In densely populated areas these farmers own and farm on
less than a hectare of land although the size of land might go up to ten hectares in less populated
areas (Ibid)
In Kenya, agriculture is still the leading contributor to real GDP although its contribution has
been declining since 1964. The sector contributed 36.6% of the real GDP in the period between
1964 and 1974 and continued to decline from 26.5% to 24.5% in the periods from 1990 to 1995,
and 1996 to 2000, respectively (Kabubo-Mariara & Karanja, 2007). Hitherto, the sector has
remained a key contributor to Kenya‟s economic development accounting for 32% of the
country‟s GDP and 65% of total exports earnings, while employing over 80% of the county‟s
rural working population and about 18% of total formal employment. The official figures are
2
scanty but it is approximated that women represent about 48% of the total agricultural work
force. The continued reliance on agriculture and the importation of maize, rice and wheat among
others which are Kenya‟s major staple foods amplify the need for sustainable, resilient increase
in productivity for food security and economic growth through promotion of CSA initiatives
(World Bank, CIAT, 2015).
Smallholder production in the country is mainly subsistence. It faces a lot of challenges such as
limited or no access to credit, inability to access or afford production inputs and irrigation
equipment, lack or limited access to markets, limited market information and agricultural
extension services, all of which hamper agricultural investments adding to the risk of food
insecurity (Ibid). The production potential of smallholder farmers can be ameliorated by
adoption of modern farming practices, but financial constraints remain a major barrier
(Rosegrant et al., 2002). Farm credit plays an integral part in enhancing agricultural productivity.
It facilitates farmers' access to agricultural inputs such as planting materials, fertilizers, and
financing other farm activities like weeding, harvesting and marketing farm products where
farmers‟ incomes fall short. Credit facilities help in improving the welfare of the rural poor
farmers via financing consumptions as well as reducing the opportunity costs of vital assets
(Auma & Mensah, 2014).
In 2011, an estimated 3.5 million Kenyans were declared food insecure, which is an increase
compared to 1.5million in 2009. This was as a result of below average rainfall making it the
driest year since 1950 (World Bank, CIAT, 2015). One such area where people are food insecure
is the Nyando basin which was the area of our study. Poor land preparation, lack of proper crop
husbandry during the growing period and harvest and post-harvest losses, unreliable and
3
inadequate rainfall, lack of credit facilities or access and climatic shocks like droughts and
flooding are some of the challenges farmers face during the production period in Nyando basin
(CCAFS, 2012).
The Nyando basin has two rain seasons; March to May, and October to December. Smallholder
farmers in this area cultivate mainly seasonal food crops e.g. maize, beans, sorghum, millet,
sweet potatoes and keep goats, sheep, chicken and in some households cattle (CCAFS, 2012).
The farmers prepare their land and sow/plant between February and March (Ibid). Most farmers
in the area hire tractors for ploughing and harrowing as they prepare to plant. Hiring tractors,
farm labour, agricultural inputs such as certified drought and pests tolerant seeds, fertilizers,
weeding, and pesticides requires financial resources. The income of smallholder farmers in
Nyando is low. To finance these activities farmers may need to seek additional financial
resources which mainly come from informal credit sources. The harvesting period runs from
June to July. With the threat of harvest and post-harvest losses due to pests, disease and
deteriorating quality, farmers ought to harvest and store their crops within the shortest time to
minimize such losses. Harvesting is labor intensive and requires extra labor especially where
family labour is not enough. It is through credit that these households hire casual labour to
supplement family labour. The cropping seasons in the basin have been affected and change
almost always due to climate change and variability. Occasionally the rains fail, or it‟s
inadequate resulting to crop failure while in other times the area experience floods that affect the
farming calendar, destroy crops, kill livestock and displace farmers from their farms.
Provision of good quality inputs, better and stable markets, better and sustainable land
management practices, innovative agricultural financing and climate-smart technologies and
practices are critical for sustained agricultural production (Njeru et al., 2015). Although the
4
agricultural sector contributes immensely to Africa's GDP and employs most of the rural
workforce, a small fraction of commercial lending is directed to the sector (Jack et al., 2016).
Most of it goes directly to the large-scale commercial farmers, crowding out smallholder
farmers. Commercial banks lack interest to lend to the sector due to the risky nature of its
activities, such as drought-related losses, unpredictable weather patterns, pest and disease attack
losses, huge transaction costs and lack of collateral among others which are amplified by
fluctuating commodity prices. Also, microfinance institutions prefer lending to the commercial
and trade sector where they fetch high returns, resulting in an insignificant allocation of credit to
smallholder farmers (Poulton & Kanyiga, 2014).
Two-thirds of rural farmers in the country do not have access to adequate financial services
necessary to better their incomes and welfare (Poulton & Kanyiga, 2014). As a result, these
farmers turn to informal credit options such as Merry go rounds, farmers/community local
groups, borrowing from each other, family savings among others to finance farming activities
like planting, buying seeds, weeding, harvesting, and storage and marketing costs and for
consumption during in between harvests (Jack et al., 2016). These informal lending sources in
most cases lack capacity to provide enough credit for the farmers‟ needs. This exposes them to
difficulties during the production period. These challenges are compounded by the effects of
climate change and climate variability. To address the challenges of climate change and
variability in the region, CCAFS has introduced climate smart agriculture (CSA) program in the
basin.
Agriculture, including agro-industries, receives only a small share of total lending of commercial
banks portfolios amounting to about 10% in Africa (Hassan, 2010). Loans are barely given to
smallholder farmers and especially to women. According to Sarris (2017), 5 to 10 % more male
5
smallholder farmers can access credit compared to female smallholder farmers. With better
access to credit, modern farming technologies and improved farming practices, the productivity
and income levels of the many smallholder farmers can be enhanced (Babcock, 2015). Although
credit to smallholder farmers is growing, there is still a considerable deficit that needs to be
addressed.
Despite Kenya having a relatively well developed financial sector, access to bank credit by
smallholder farmers remains an uphill task. The small number of banks in the rural areas and the
high cost of formal credit also make it hard for farmers to access bank credit. Women farmers do
not have secure land-owning rights, and this puts them in a disadvantaged position to access
formal credit. Most poor farmers do not have bank accounts and even do not know how to open
one and those who have do not use them. This makes other financial services like insurance or
formal savings unavailable. As a result, farmers' capacity to invest in productivity-enhancing
assets is compromised and exposure to spot market vagaries and weather shocks is increased,
contributing to greater vulnerability (Sarris, 2017).
One of the ways of coping with vulnerability and changing climate is the adoption of Climate
Smart Agriculture (CSA), an approach that helps people to sustainably manage agricultural
systems to respond to climate change (Schaller et al., 2017). The concept was developed by FAO
aimed at achieving sustainable agricultural development for food security under climate change
(FAO, 2013). It is based on the triple objectives of sustainably increasing productivity and
incomes, reducing greenhouse gas emissions where applicable and possible, and adapting to
climate change. The definition of CSA does not call for strict "triple wins" in every project as
some projects can only target one of the three objectives at a time. It is designed to promote
synergies among agricultural projects that are environmentally-friendly. Climate Smart
6
Agriculture (CSA) has gained recognition both globally and locally as a prime solution to the
challenges affecting agricultural production caused by climatic changes and global warming
(Grosjean et al., 2016). The increased recognition is aimed at bettering agricultural productivity
as well as building resilience to climate change risks among smallholder farming and pastoral
communities in affected regions.
CSA comprises of different elements including management of farms through sustainable land
management systems, livestock, crops, and aquaculture among others. There are some suggested
approaches to implement CSA projects that include expanding evidence base through research,
supporting enabling policy frameworks, strengthening national and local institutions, enhancing
financing options, and implementing practices at field level. Funding options, coupled with right
CSA practices, have been associated with increased production (Bryan et al., 2013).
The Consultative Group for International Agriculture Research (CGIAR) program on climate
change Agriculture and Food Security (CCAFS) in partnership with VI Agro forestry started a
climate-smart village farm program (CSVs) (cross breeding of Galla goat and red Maasai sheep,
chicken rearing, greenhouse farming, fodder and tree planting, and water harvesting technologies
(micro catchment) among others), targeting smallholder farmers in Nyando. The site suited the
program as the area is characterized by high population density, high temperatures, high
evaporation rate, a degraded natural environment, degraded soil fertility, unreliable rainfall,
occasional flooding, and low agricultural productivity. CSVs are community steered,
participatory, and inclusive. Farm households in the climate-smart villages are in self-help
groups where over 70% of the active members are women (CCAFS, 2018).
7
The Galla goat project is a breeding program meant to improve the adaptability of local goats to
climate change. These goats grow bigger, faster, have better milk and meat production, fetch
higher prices in the market and are suited for harsh condition. Agro forestry is planting of trees
and crops and has the potential to curb land degradation by preventing erosion especially by
runoff thus it helps improve soils for better agricultural productivity .Several agro forestry
practices have been applied in Kenya with positive results. They include; fertilizer trees such as
Calliandra spp, Leucena Leucocephala and Terminalia browni. Farmers in Nyando basin
quickly started realizing the value of agroforestry, where they do alley/strip cropping, that is,
plantings strips of maize, sorghum and other crops in alternating strips of multi-purpose trees
that stabilize and enrich the soil (World Bank, CIAT, 2015). As a result, demand for the fodder
trees led to the emergence of more nurseries to supply tree seedlings.
Water harvesting is another smart technology where rain water is accumulated and stored for use
instead of being let to run off. According to Recha (2017), farmers in Nyando rely on rivers and
streams for water but with worsening effect of climate Change, and destruction of water towers
river water levels have gone down and others started drying up. However through CSA
technologies, farmers are encouraged to practice water harvesting through investing in water
harvesting pans (micro catchment). The pans vary in size and capacity ranging from 48000 to
100000 liters per individual household which can be used up to three months.
The other smart technologies are green house and fish farming. Three smart farms (Onyuongo,
Lower Kamula and Obinju) were set up and managed by youth and women groups. These smart
farms serve as learning sites where farmers learn and acquire aquaculture and green house
farming skills which include site selection, soil quality, water quality, pond construction, stock
8
rating, predator management, harvesting techniques, preservation, marketing and book keeping
techniques, Recha (2017).
Financing interventions play a key role in promoting and facilitating adoptions of CSA practices.
The adoption of CSA practices supports the development, improvement, and sustainability of
agricultural production. Evidence from Nyando climate-smart program has shown that access to
credit is an enabler to adopting smart farming practices as the program invented the community
innovation fund. Households in Nyando who used to practice subsistence farming especially
women-headed households were able to adopt smart farming practices and as a result could
afford variety of more nutritious food for their families and pay school fees for their children.
Women with the help of the fund could access loans at reasonable rates and and invest in better
yielding crops, early varieties and livestock (CCAFS 2017).Although the initiative is no longer
advancing loans to these farmers, they are using table banking to save and access loans to
continue financing their activities. Through these initiatives women are empowered and are able
to help contribute to the household income. CCAFS has been working with other stakeholders
like World Neighbors, VI Agroforestry, ILRI and Kenya's Ministry of Livestock Development
and the local farmers to improve the productivity of the small ruminants (sheep and goats).
Overall, over 400 farm households in Nyando are reaping benefits of the interventions targeting
small ruminants of which a good number are women-headed.
1.2 Statement of the Research Problem
Most smallholder farmers, unable to access formal loans from commercial banks, turn to
informal financial sources such as shylocks, merry-go-rounds, table banking, traders and
pawnbrokers that are not regulated by the Central Bank of Kenya. These informal loan sources
are not formally registered and the services extended to those farmers depend mostly on
9
membership and relationships that have been established over time. The loans from these sources
are not sufficient to help farmers buy enough farm inputs, adopt sustainable farming practices,
etc. This impedes adoption of substantial investment in agricultural technologies such as climate-
smart agriculture, resulting in low productivity and threatening food security in the country.
Further, the effects of climate change continue to affect agricultural productivity across the arid
and semi-arid areas (ASALs); and Kenya, being 80% ASAL, has experienced frequent and
persistent droughts that are as a result of climate change and climate variability. Climate-smart
agriculture is seen to offer a solution to such problems. However adopting CSA requires
financial resource investment and most of the poor rural smallholder farmers have low income
and limited access to credit. Those problems have been heavily linked to the supply side of credit
which has been the focus of most studies, while ignoring the demand side. In addition, the few
studies done on the demand side of credit have given inconsistent findings and conclusions
(Kofarmata et al., 2016). The contextual and geographical differences across the research areas
might have contributed to such discrepancies. Household socio-economic characteristics in a
particular area, soil quality, climatic conditions, financial market differences and cultural
practices might also have contributed to such disparities. This study adds to the limited literature
on the demand side of credit access by assessing the factors influencing agricultural loan market
participation, the amount of credit accessed, and the preferred choice of credit market (credit
source) in Nyando region, which is representative of many other areas in developing countries.
The findings will augment other studies in this area and also inform policy for sustainable rural
credit market development.
10
1.3 Research Questions
This study is guided by the following research questions;
1. What loan facilities do smallholder CSA farmers in Nyando demand at various times in a
farming calendar year?
2. What factors influence both farmers‟ credit market participation and the amount of loan
funds demanded by smallholder CSA farmers in Nyando?
1.4 Study Objectives
The main objective of the study is to establish the factors that influence demand for loan funds
by smallholder farmers under CSA (Climate-smart agriculture) projects in Nyando. The specific
objectives of the study include, to:
1. To determine the loan facilities that smallholder CSA farmers in Nyando demand at
various times in a farming calendar year.
2. To identify factors that influence both farmers‟ credit market participation and the
amount of loan funds demanded by smallholder CSA farmers in Nyando.
3. To draw policy recommendations from the study findings.
1.5 The Hypothesis of the Study
The study will test the following hypothesis;
1. Farmers in Nyando basin do not demand for any loan facilities at any time of the year.
2. Hypothesized factors do not have any effect on both farmers‟ credit market participation
and amount demanded.
11
1.6 The Significance of the Study
This study will shed light on the credit needs among smallholder farmers embracing CSA
practices and how the needs are spread along the farming calendar. With such information on
smallholder farmers‟ credit needs, stakeholders in CSA projects in the country can plan, and
improve CSA financing. The CSA project needs expansion, especially after realizing the benefits
associated with it. Scaling up CSA to other areas should be accompanied by lessons learned like
better and sustainable financing.
The study is expected to benefit a broad scope of stakeholders including farmers, scholars,
government, and financing/credit-giving organizations. Farmers will benefit from the study if the
findings are used to make policies and design financing models that reflect their credit needs,
especially for CSA adoption and scaling up. The research will also help scholars by adding to the
existing literature on agricultural financing especially on CSA practices. The government can use
the information from the study findings to design financing programs consistent with the credit
needs of the smallholder CSA adopters. Financial institutions will understand the credit needs of
the farmers and their demand, and this will enable them to come up with tailor-made credit
facilities addressing their financial needs. Finally, the findings of this study can assist
policymakers to come up with better ways to design, implement smallholder farmer financing
models.
12
CHAPTER TWO: LITERATURE REVIEW
This chapter reviews the literature on different aspects of credit/loan facilities needed by
smallholder farmers at different times, factors affecting demand for credit, as well as providing
literature on how demand for credit/loanable funds is affected by CSA adoption/investment. The
motivation of the literature review is informed by the continued demand for loan/credit among
the smallholder farmers in Kenya, the challenges associated with persistent low agricultural
productivity among these farmers, and the impact of CSA adoption/investment on demand for
credit facilities among the smallholder farmers.
2.1 Climate Smart Agriculture and Climate Change
After signing the UNFCCC in 1992, governments and businesses have increased their attention
and commitment towards climate change (Kolk et al., 2008). Developing countries are the most
vulnerable and affected by climate change effects since they greatly depend on agriculture.
According to FAO & EU (2014), the economic development of the emerging nations is being
threatened by the effects of climate change and variability on agriculture. Agriculture has been
facing enormous challenges of adapting to changing weather conditions, having to contribute to
the reduction of greenhouse gases and providing food for the ever-increasing world population.
Climate-smart agriculture has been suggested as the solution to these problems since it aims at
increasing productivity, enhancing adaptation to climate change and reducing the emission of
greenhouse gases.
It is from this premise that a lot of research continue to be carried out on agriculture and climate
change on the developing nations (Branca et al., 2011). CSA can be seen as a concept that is
bridging the gap between knowledge and policy. This is because it seeks to integrate and form a
13
basis for the appropriate technical, policy and investment aspects required for agriculture to
respond to climate change and meet increased future food demand. The focus has shifted to
adoption and diffusion and technological innovations from start-ups to big players playing a
significant role in deciding the rate of adoption and diffusion of CSA. Climate-smart agriculture
is relatively a new concept and still in its infancy in South East Asia and sub-Saharan Africa. It is
a concept that was launched in 2011 and it's still in its initial stages of development. There are
pilot programs in west and east Africa. In East Africa it is being piloted in Kenya, Ethiopia,
Uganda and Tanzania (CCAFS, 2015). In Kenya, the climate smart village program was started
in Nyando basin in Kisumu and Kericho Counties. According to CCAFS (2015), approximately
412 farm households have joined CBOs in the climate-smart village‟s majority of whom are
women.
The diffusion and adoption of the CSA practices has been slow (Kempi &Volpi, 2008). This may
pose a major threat because of the limited timeframe that the world has to deal with climate
change and how faster its impact is spreading. There is therefore a need to understand the
barriers to adoption so that the information can help in designing and implementing interventions
that can help overcome those challenges. Attention now has turned to research and policy on
CSA to ensure increased and successful adoption and diffusion of these CSA innovation
technologies.
2.2 Demand and Supply of Agricultural Credit
Production of food crops in Africa is faced with several challenges including weak land tenure
system, limited irrigation facilities, climate variability, shrinking arable land caused by land
14
degradation and urbanization, and deteriorating soil fertility caused by continued use of the farms
(Omboi, &Wangai, 2011). Uncertified planting materials, poor marketing and distribution
system, low access to credit facilities, and high cost of agricultural inputs have compromised
farmer's preparation and successful planting and harvesting leading to reduced yields. During
cultivation and growing of crops, farmers need to weed and apply fertilizer to ensure high crop
production. According to Hossain (1988) during planting farmers needed credit facilities to
facilitate the acquisition of fertilizer and other related weeding equipment and labour. There is
also a growing recognition of the fact that institutional credit is increasingly becoming an
integral part in modernizing agriculture (ibid). Agricultural credit is defined as loans given to
farmers to assist them in buying farm inputs, certified seeds and for use as capital investment in
the farm to carry out different farming processes among other uses (Dethier & Effenberger,
2012). As the name suggests, these credit facilities are confined to agricultural development.
Technological changes are critical in managing crops to ensure maximum yield. When farmers
adopt new farming technologies, they increase the demand for labour and other labour-intensive
entrepreneurial activities that further create the demand for credit facilities to enable successful
planting and harvesting processes. Farmers, therefore, need to embrace credit facilities that
enable them to improve crop sustainability and increase the prospects of achieving the expected
yields. Yawson et al., (2010) asserted that the availability of subsidized fertilizers to smallholder
farmers and access as influenced by credit facilities was associated with the frequency of use and
ultimately changes in farm food production. Credit facilities, especially loans, are also said to
influence how farmers access agricultural extension services that further influence the outcomes
of their farming experiences. It is clear that there is high demand for credit to finance farm
15
operations, adoption of better farming technologies and other agricultural needs but the extent to
which individual factors influence the demand is not known. Also access and supply of credit,
especially from formal sources do not match the demand and farmers then opt for informal
credit.
It is believed that demand for credit by smallholder farmers outstrips supply. This presumption
implies that most rural households exhibit positive demand for loan facilities, but the lending
institutions normally determine participation in the loan market. As a result many studies both
theoretical and empirical have focused on the supply side constraints with little emphasis on the
demand side (Mpuga, 2010). Several studies have been done on both access and demand for
credit in different continents, regions, and countries yielding inconsistent outcomes. A study by
Gurmessa and Ndinda (2017), cited that there is a substantial unmet investment demand for
small and medium and micro enterprises amounting up to 80 % and 90 % respectively in Latin
America and African countries. In China, several studies have shown that more than 75 % of
demand for credit in the rural areas is either unmet or rationed. Similarly, Muayila, and Tollens
(2012) in their study in DRC found out that an estimated 71% of the participating households
had experienced some form of credit constraints or rationing. From these studies, it is evident
that smallholder farmers‟ exhibit positive demand for loan funds but, credit limited access;
rationing and participation in the credit market are popular challenges across, Asia, Africa and
Latin America.
A study on fertilizer subsidy in Ghana by Yawson et al., (2010) found out that farmers needed
loan funds to purchase fertilizer and prepare the field for planting. They further argued that
farmers were prepared to take subsidized fertilizer if it was accessible, available, and affordable.
16
Also the study found that improved access through the provision of credit facilities to farmers
was preferred since the majority of the sampled farmers were poor subsistence farmers who
needed assistance to access necessary facilities like inputs, storage facilities, and marketing
channels. During planting seasons, farmers needed credit facilities to help access fertilizer, pay
for farm labour in preparation for planting season, and to acquire planting seeds.
2.3 Empirical Literature
2.3.1 A Primer on Demand
The demand of a good or service at particular time and price reflects the level of utility that
consumers expect to derive from it. Individuals demand goods and services such as healthcare,
credit, food, shelter etc to satisfy their wants. The concept has been used by economist but it‟s
Alfred Marshall in 1890 in his principle of economics who developed it as he explained the idea
of demand and supply curves. The demand for financial services, like other products or services,
is determined by own price, the price of related goods or services, level of income, and other
factors. The price for credit usually is the interest charged, and based on demand theory, when
the interest rate is high the amount of credit demanded by borrowers reduces ceteris paribus
(Paul, 2004). Demand for credit is also influenced by income level, education of the borrower,
number of dependents and household size. An increase in these factors will increase the demand
for credit. Distance to the lending institutions and age of the borrower impacts demand for credit
negatively. This is to mean that the longer the distance and advanced the age of the borrower the
lesser the demand (Dorward and Omamo 2009).
In this study credit demand is defined as the amount of money a CSA farmer is able to access
and borrow to fulfill his or her household consumption and agricultural activity needs such as
17
buying farm inputs, hiring extra labour for farming activities and cover costs related to
agriculture activity including farm preparation, planting, weeding, and harvesting. This is
assumed to depend on a number of factors. Kirman, (2006) pointed out that the quantity a
consumer wants to buy depends on many factors including tastes and preferences, which may
depend on age, sex, education or religion and the price of the commodity. Blandon et al., (2009)
argued that close substitutes and compliments affect the amount of a good purchased like credit,
for example, a consumer has to decide whether to borrow from formal commercial institutions,
formal government subsidized institutions, or from informal credit markets. If one cannot afford
to borrow from formal sources, then they opt for informal markets and vice versa.
2.3.2 Factors affecting Demand for Credit
According to (World Bank, CIAT, 2015) One of the major challenges that is faced by
smallholder farmers is access to financial instruments. However, this problem is mainly on
supply side of credit and includes impediments such as stringent and unfavorable policies like
rationed loan amounts, cumbersome application processes and limitations in terms of credit use
or its purpose. Majority of commercial lenders make assumptions about the poor farmers that
they are unable to save adequately; thus their interest levels are somehow sensitive to their credit
demand. Farmers' incomes are also uneven, and this affects the level of interests they are likely
to be charged from their savings. Lack of savings is associated with reduced chances of
accessing credit from banks. Lenders also have low trust for peasant farmers in having the
capacity to repay the loans given. Majority of farmers prefer to store their savings in the form of
household assets like livestock (cows, goats, chicken), land as opposed to saving in banks to
increase their credit scores (Mpuga,2010). Markets rates, therefore, discourage farmers who see
18
the loans as expensive to pay. Farmers, especially women, have resulted in having informal
savings inform of chamas or merry-go-rounds where members in a group contribute to save and
then access the savings as wholesome once their turn comes or use the savings as collateral for
loans.
Smallholder farmers prefer short-term small amounts of credit as opposed to large amounts and
long-term lending preferred by formal lending institution (Schmidt and Kropp, 1987). According
to Swain (2007) limited empirical evidence exists on the factors that influence demand for
agricultural credit. Atieno (1997) argued that there had been a failure in correctly identifying the
credit needs of the rural farmers and as a result most credit programs that have been used for
rural development in many developing countries have not had much success. Schmidt and Kropp
(1987) cited that lending policies of an institution influence credit access. Farmers or borrowers
will not qualify or apply for credit if the duration and terms of payment and security
requirements do not fit their needs.
Dorward and Omamo (2009) cited that socio-economic characteristics and institutional factors
influence the demand for financial services. The level of income of the household, the size of the
household, education, age, marital status, gender, occupation and farming experience,
agricultural extension services, bank accounts (or saving culture), and group membership (e.g.
chamas) are some of the factors that influence demand for financial services. In addition, Bigsten
et al., (2003), using a multicounty dataset and probit model, cites that the cost of borrowing from
credit sources in emerging markets differ in certain aspects such as information asymmetry,
collateral, risks , distance to lending institutions, and credit transactions. A study by Atieno
(1997) analyses the significance of institutional lending terms and conditions in determining
19
farmers demand for credit using farm level cross-sectional data from Nakuru district of Kenya
and cites that income level, distance to credit sources, credit history and assets endowment
influence borrowing decisions for rural farmers. Hussien (2007) using farm household survey
data from Ethiopia in 2005 and stochastic frontier analysis and limited dependent variable
econometric tools also cited that some of the reasons why farmers prefer credit from informal
sources as opposed to formal sources are that informal sources are more flexible in terms of loan
repayment.
According to Miller and Ladman (1983), on a study on factors impeding credit use in
smallholder farmers in Bolivia, cites farm households who constantly borrow are seen to have
higher resource base, higher household incomes, large farm size, higher education levels, greater
use of improved technology higher level of market integration, a large number of cattle, larger
operating costs and investments, and higher risk ability. A study in Egypt by Mohieldin and
Write (2000), using primary data and probit models, cite that total assets, educational level,
ownership of land, and sizes of the household influence borrowing decisions. Assefa (1989)
found out that Men tend to borrow more from the formal and semiformal sources than women
do.
The complexity of risks and uncertainties faced by farming communities complicate their
decision to borrow (Muayila, and Tollens, 2012). According to Swain, (2007), using household
data in India and a type 3 Tobit model, farmers faced with poor access to markets, limited access
to new technological innovations, little or no access to support services and low return on capital
are those who are located in areas with poor infrastructural facilities and usually own small and
fragmented land plots which can affect their credit demand negatively. Atieno, (2001) on a study
20
on the role of institutional lending policies among formal and informal credit institutions in
determining the access of small-scale enterprises to credit in Kenya identified several factors that
tend to influence the farm household borrowing decisions negatively. Some of these factors
include; limited or lack of viable enterprise to finance, poor support services, farming and
markets risks, poor infrastructure, frail entrepreneurship capacity, lack of collateral and other
credit requirements, lack of desirable loan qualities (credit duration, loan amount and
repayment), and high costs of borrowing .
Some studies have argued that the main problem faced by the poor rural farmers is lack of access
to credit but not the high interest charged. A couple of empirical findings have shown that
interest rates charged affect the credit demand negatively. Studies done in the Philippines
Chandra et al., (2017), on analysis of Gendered vulnerabilities of smallholder farmers to climate
change in conflict-prone areas using focused group interviews, Ghana by Akudugu, (2012) on a
study on determinants of farm credit using data from 250 respondents and logit and Tobit
models, and Ethiopia by Girma and Abebaw, (2015) cited that increasing the borrowing rates
reduced demand for credit. Nevertheless, a study from Kenya (Atieno, 1997) on the effects of
institutional factors on credit demand by farmers found no significant association between
interest and loan demand. In Ethiopia, high transaction costs, in general, had a negative influence
the demand for formal credit (Grime and Abebaw, 2015).
Distance to the lending institutions in many cases was cited to negatively influence demand for
credit. Studies on factor analysis on loan demand using Tobit model (Akudugu, 2012; Jianqiang,
& Bing, 2008) cited that there exists a negative and significant relationship between distance to
21
the credit institution and loan demand. It is expected that this relationship is negative because it
is directly related to information asymmetry, credit costs, and accessibility as in most cases the
longer the distance the more trips one has to take, more time one has to spend etc.
Education level is believed to influence credit demand positively; however, some studies have
found some inconsistencies. Studies in Kenya (Mensah, 2014), Nigeria (Akpanet et al., 2013),
Ethiopia (Girma and Abebaw, 2015), China (Rui and Xi, 2010), Uganda (Mpuga, 2010), and
Ghana (Akudugu 2012) found that education level affected credit demand positively. However,
another study from China by Jianqiang, & Bing (2008) showed that education had a negative
influence on credit demand. Wiboonpongse et al., (2006) found no significant relationship
between education level and credit demand in Thailand. Despite the inconsistencies, overall
studies have shown that education is among the key variables that influence the borrowing
decision.
Age is believed to have an inverse relationship with demand as it is thought that as age advances
farmers will demand less of credit. However studies carried out in Uganda (Mpuga, 2010) and
Nigeria (Akpanet al., 2013) found out that there is a positive relationship between the age of the
household head or farmer and credit demand. This could be attributed to the fact that older
farmers are more likely to have more assets like land which they can use as collateral. However,
a study by Jianqiang, & Bing (2008) in China found out that age had a significant negative
influence on credit demand. Other studies in Ethiopia by (Girma and Abebaw, 2015) and (Swain,
2007) in India found no statistically significant relationship between credit demand and age.
22
Gender of the household head or the farmer is another major factor that influences demand for
loans. According to studies by Girma and Abebaw, (2015) in Ethiopia and Mpuga, (2010) in
Uganda, women are less likely to borrow from formal institutions. However according to
Akudugu (2012), men seemed less likely to demand for credit in Ghana. Gurmessa & Ndinda,
(2017) found no significant relationship between gender and loan demand in Ethiopia. This
means the relationship between gender and loan demand is region specific. Farm size is another
factor that influence demand for credit facilities. Studies in Ethiopia by (Girma and Abebaw,
2015) China (Jianqiang, & Bing, 2008), India (Swain, 2007), Kenya (Atieno, 1997) and Ghana
(Akudugu, 2012) found out that farm size has a positive influence on loan demand. This could be
because farmers with large farms may need loans to finance large farming operations and could
use their farms as collateral to access loans.
Schools fees and medical expenses also influence demand for credit. According to Girma and
Abebaw (2015) in Ethiopia and Jianqiang, & Bing (2010) in China, spending on school fees and
medical expenses affected household decisions to borrow positively. Similarly, a study by
Jianqiang, & Bing (2008) in China found out that production and management expenditure had a
positive influence on loan demand. Another factor that is expected to have an impact on loan
demand is household size. Swain (2007) in India found that household size influenced demand
for credit positively. In Kenya, Messah, (2011) and Mpuga, (2010) in Uganda found that family
size and loan demand has a negative relationship.
Off-farm income is also expected to influence loan demand although it has exhibited varying
results in different studies. According to Girma and Abebaw (2015), there was a negative
23
influence of non-farm income on loan demand in Ethiopia; while Jianqiang & Bing (2008) found
a positive relationship in China. Girma and Abebaw (2015) in another study in Ethiopia, and
Atieno (1997) in Kenya found no significant correlation between non-farm income and loan
demand. Studies by Jianqiang, & Bing (2008) and (Mpuga, 2010) cited that asset value and net
worthy impacted demand positively. Farmers with high net worth and who own a lot of assets
tend to exhibit high demand for loans because they can provide collateral for the loans and need
more financial power to carry out their operations.
2.3.3 Demand for credit and CSA practices
Climate-smart agriculture (CSA) practices include sustainable agricultural practices, profitable
agricultural ventures among others. According to Ojoko et al., (2017), using cross sectional data
from 120 rural households and ordered probit regression model there are several factors that
affect the level of use, adoption and diffusion of climate smart agriculture practices (CSAPs)
among farmers. These authors opined that farmers with lower levels of income will adopt CSAPs
if they have access to credit. They found out that when farmers have access to credit, they are
able to afford more smart farming technologies that wound be otherwise expensive to acquire
with their incomes. Again the low CSAPs user/adopters will increase their adoption if they have
access to loan funds. The demand for credit facilities to engage in CSAPs is also influenced by
the information farmers have on the benefits of the climate-adaptive agriculture.
Another study in Nigeria by Amau and Ayantoye (2015), found out that access to loan funds by
the farming households can be used to increase production via the purchase and use of modern
farming technologies and certified planting materials. Akudugu et al., (2012) in his study on
24
Adoption of modern agricultural production technologies by farm households in Ghana cited that
access to credit is one of the influencing factors for farmers to adopt modern farming
technologies and thus poor rural household who also lack access to credit find it hard to access
smart farming technologies. Meybeck and Gitz (2013) insists that governments, NGOs (non-
governmental organizations) and other community-based organizations need to be informed of
the benefits of CSA and the climate change mitigation practices. Sharing of information to the
farmers is likely to create demand for, and consumption of credit facilities made for improving
climate-smart agricultural practices. Thus the importance of credit access in influencing the
adoption of smart farming technologies cannot be underestimated.
2.5 Chapter summary
The literature review identified categories of factors affecting credit demand including
institutional It also identified individual factors that influenced demand for loan facilities like
age, education, gender of the household head, farm size, and farming experience. The other
identified category of factors dealt with socio-economic determinants including income levels of
farmers, occupation, belonging to a social group/chamas, and the type of information shared
among the farmers. The literature review tried to establish the credit facilities needed across a
farming calendar where it was identified that farmers required credit facilities during farm
preparations where they purchase fertiliser, farm labour, and agricultural extension services as
well as during harvesting seasons.
From the literature, it is evident that Credit demand is influenced by categorized factors like
institutional factors, individual factors, social-economic and the CSA practices embraced. Also
25
most studies have tried to model demand and access combined and thus used probit, Tobit, or
logit models while a few used double hurdle model to model separately farmers credit market
participation and the intensity of participation. Also, the extent of the adoption and diffusion of
CSA practices is not known in sub-Saharan Africa as very limited literature exist.
26
CHAPTER THREE: METHODOLOGY
This chapter presents the methods and procedures used in this study. It includes the description
of the study area; data types, needs and sources, sampling procedure and sample size
determination, questionnaire design and data collection, conceptual framework, theoretical
model and the empirical model.
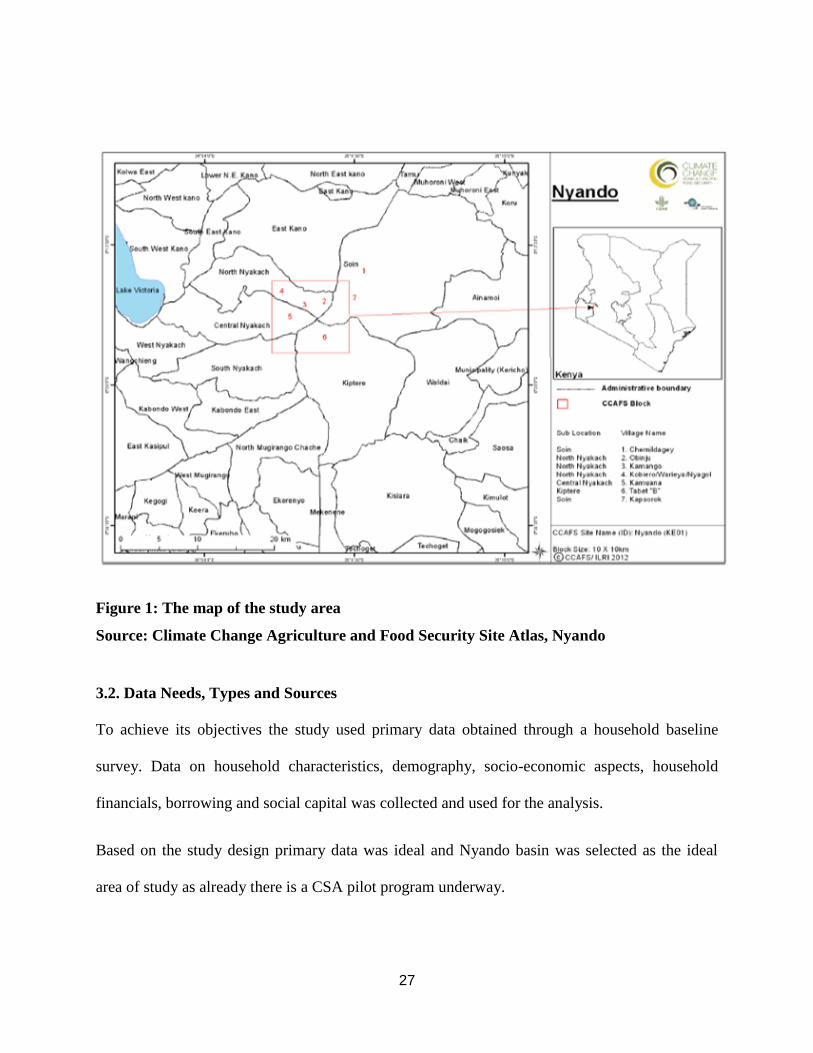
3.1. Study Area
The study was carried out in Nyando basin covering part of Kericho and Kisumu Counties in
Western Kenya (see Figure 1). This area consists of humid and sub-humid zones with rainfall of
about 900-1200 mm spread over two rainy seasons (ICRAF, 2008). It is characterized by land
degradation majorly from soil erosion and water runoff which cause the formation of deep
gullies that have affected about 40% of the landscape (Ibid). The area has been experiencing
increased weather variations with severe droughts and floods that have affected agricultural
production and food security (Förch et al., 2013). Poverty levels are high (over half of the
population live below the poverty line) and diseases including HIV are also prevalent. The
primary source of livelihood for the locals here is mixed farming which is done on farm sizes of
less than one hectare. For the past decade, nothing much has changed in terms of agricultural
practices as farmers still practice mono-cropping, poor crop husbandry, little or no conservation
agriculture, keeping traditional low yielding livestock varieties among others, in most
households, and this has resulted in dwindling agricultural productivity. As a result, food security
and nutritional status of most households is compromised as they cannot meet daily dietary needs
all year round and experience at least a month of hunger. In Nyando maize, sorghum, millet,
groundnuts, sugarcane are the main crops, and livestock kept here are local breeds with some
areas having dairy cows.
27
Figure 1: The map of the study area
Source: Climate Change Agriculture and Food Security Site Atlas, Nyando
3.2. Data Needs, Types and Sources
To achieve its objectives the study used primary data obtained through a household baseline
survey. Data on household characteristics, demography, socio-economic aspects, household
financials, borrowing and social capital was collected and used for the analysis.
Based on the study design primary data was ideal and Nyando basin was selected as the ideal
area of study as already there is a CSA pilot program underway.
28
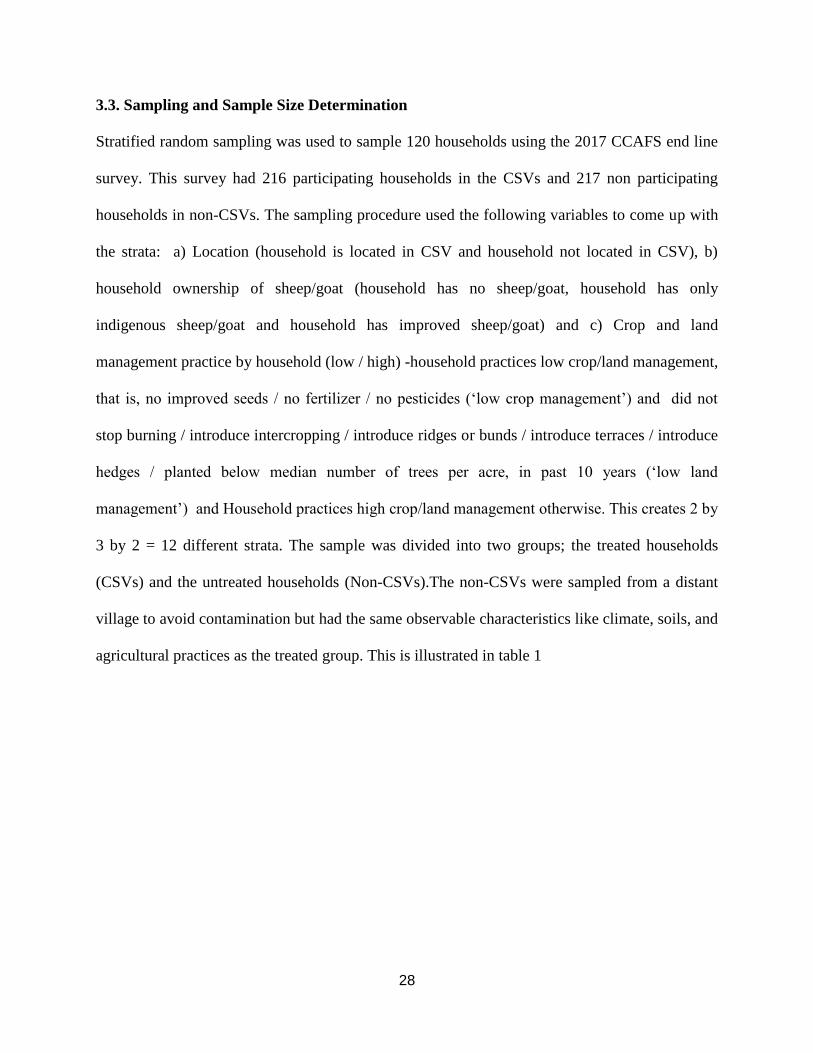
3.3. Sampling and Sample Size Determination
Stratified random sampling was used to sample 120 households using the 2017 CCAFS end line
survey. This survey had 216 participating households in the CSVs and 217 non participating
households in non-CSVs. The sampling procedure used the following variables to come up with
the strata: a) Location (household is located in CSV and household not located in CSV), b)
household ownership of sheep/goat (household has no sheep/goat, household has only
indigenous sheep/goat and household has improved sheep/goat) and c) Crop and land
management practice by household (low / high) -household practices low crop/land management,
that is, no improved seeds / no fertilizer / no pesticides („low crop management‟) and did not
stop burning / introduce intercropping / introduce ridges or bunds / introduce terraces / introduce
hedges / planted below median number of trees per acre, in past 10 years („low land
management‟) and Household practices high crop/land management otherwise. This creates 2 by
3 by 2 = 12 different strata. The sample was divided into two groups; the treated households
(CSVs) and the untreated households (Non-CSVs).The non-CSVs were sampled from a distant
village to avoid contamination but had the same observable characteristics like climate, soils, and
agricultural practices as the treated group. This is illustrated in table 1
29
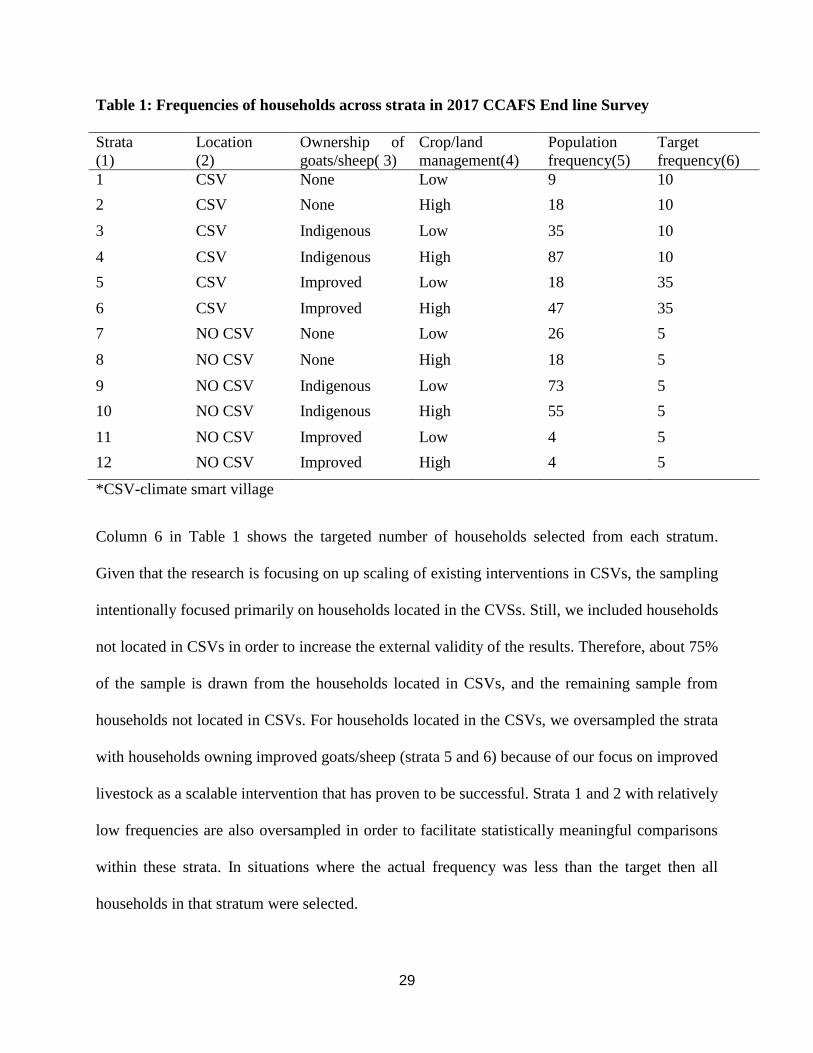
Table 1: Frequencies of households across strata in 2017 CCAFS End line Survey
Strata
(1)
Location
(2)
Ownership of
goats/sheep( 3)
Crop/land
management(4)
Population
frequency(5)
Target
frequency(6)
1 CSV None Low 9 10
2 CSV None High 18 10
3 CSV Indigenous Low 35 10
4 CSV Indigenous High 87 10
5 CSV Improved Low 18 35
6 CSV Improved High 47 35
7 NO CSV None Low 26 5
8 NO CSV None High 18 5
9 NO CSV Indigenous Low 73 5
10 NO CSV Indigenous High 55 5
11 NO CSV Improved Low 4 5
12 NO CSV Improved High 4 5
*CSV-climate smart village
Column 6 in Table 1 shows the targeted number of households selected from each stratum.
Given that the research is focusing on up scaling of existing interventions in CSVs, the sampling
intentionally focused primarily on households located in the CVSs. Still, we included households
not located in CSVs in order to increase the external validity of the results. Therefore, about 75%
of the sample is drawn from the households located in CSVs, and the remaining sample from
households not located in CSVs. For households located in the CSVs, we oversampled the strata
with households owning improved goats/sheep (strata 5 and 6) because of our focus on improved
livestock as a scalable intervention that has proven to be successful. Strata 1 and 2 with relatively
low frequencies are also oversampled in order to facilitate statistically meaningful comparisons
within these strata. In situations where the actual frequency was less than the target then all
households in that stratum were selected.
30
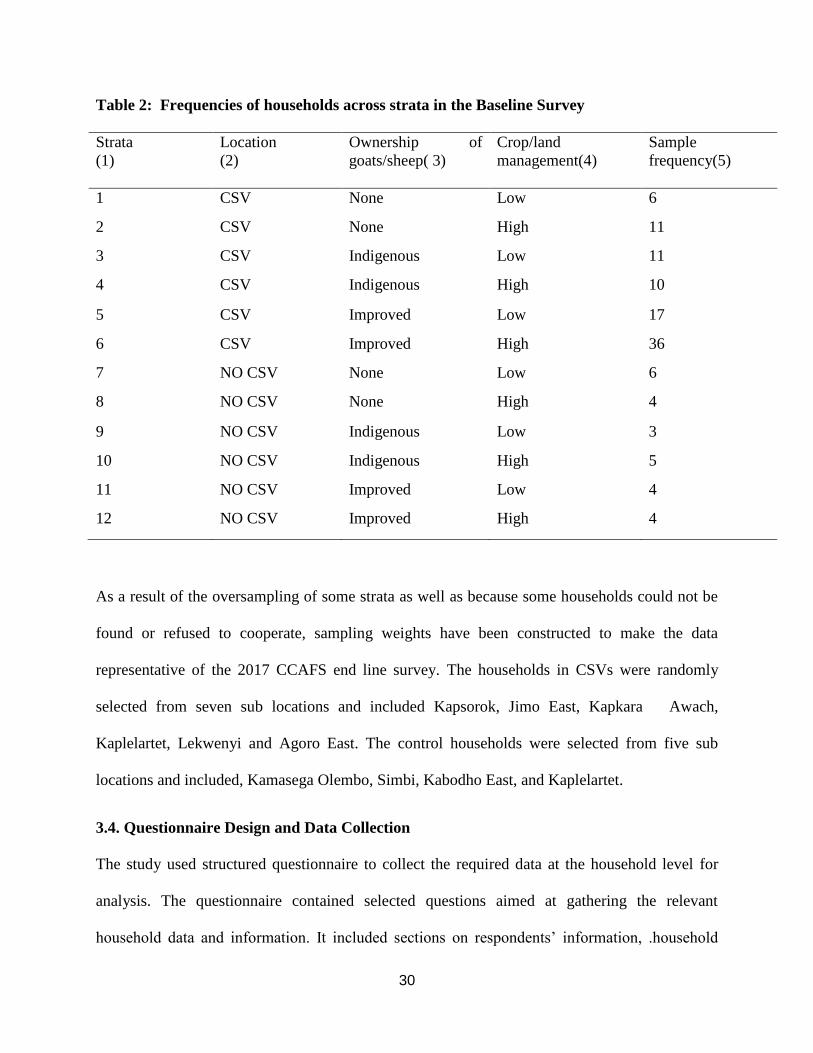
Table 2: Frequencies of households across strata in the Baseline Survey
Strata
(1)
Location
(2)
Ownership of
goats/sheep( 3)
Crop/land
management(4)
Sample
frequency(5)
1 CSV None Low 6
2 CSV None High 11
3 CSV Indigenous Low 11
4 CSV Indigenous High 10
5 CSV Improved Low 17
6 CSV Improved High 36
7 NO CSV None Low 6
8 NO CSV None High 4
9 NO CSV Indigenous Low 3
10 NO CSV Indigenous High 5
11 NO CSV Improved Low 4
12 NO CSV Improved High 4
As a result of the oversampling of some strata as well as because some households could not be
found or refused to cooperate, sampling weights have been constructed to make the data
representative of the 2017 CCAFS end line survey. The households in CSVs were randomly
selected from seven sub locations and included Kapsorok, Jimo East, Kapkara Awach,
Kaplelartet, Lekwenyi and Agoro East. The control households were selected from five sub
locations and included, Kamasega Olembo, Simbi, Kabodho East, and Kaplelartet.
3.4. Questionnaire Design and Data Collection
The study used structured questionnaire to collect the required data at the household level for
analysis. The questionnaire contained selected questions aimed at gathering the relevant
household data and information. It included sections on respondents‟ information, .household
31
demography, community groups, loans and borrowing aspects, savings, household assets and
land ownership and use. Primary data both qualitative and quantitative was collected using open
data kit application (ODK) through a baseline survey from sampled farm households both male
and female headed, in Nyando basin through a one on one interview. The data was collected by
university of Nairobi masters students in conjunction with CCAFS. The study questionnaire was
piloted to test the appropriateness of the questions to the target population, to test if the results
will fulfill the purpose of the study and identify any possible errors that could affect the results.
3.5 Data Analysis
The data was saved in a central server where it was extracted in excel format. It was then
imported to STATA where cleaning, variable selection, labeling and naming was done for
analysis. The analysis included descriptive statistics and regression analysis.
3.5.1 Analytical Framework
This section discusses theoretical framework used and illustrates the conceptual framework for
the research paper.
3.5.2 Theoretical Framework
According to Verbeek (2004), in binary dichotomous models, individuals have to make decision
whether to act or not to act. In this regard individuals‟ decisions are random and might be
affected and influenced by certain factors. The probability therefore is bounded by zero and one
that is described by a cumulative probability distribution function. When this distribution is
normal it gives a probit model.
Econometrically probit model is commonly used in describing binary choices, for instance, a
consumer who makes a choice to buy particular product or not or a farmer who makes a decision
32
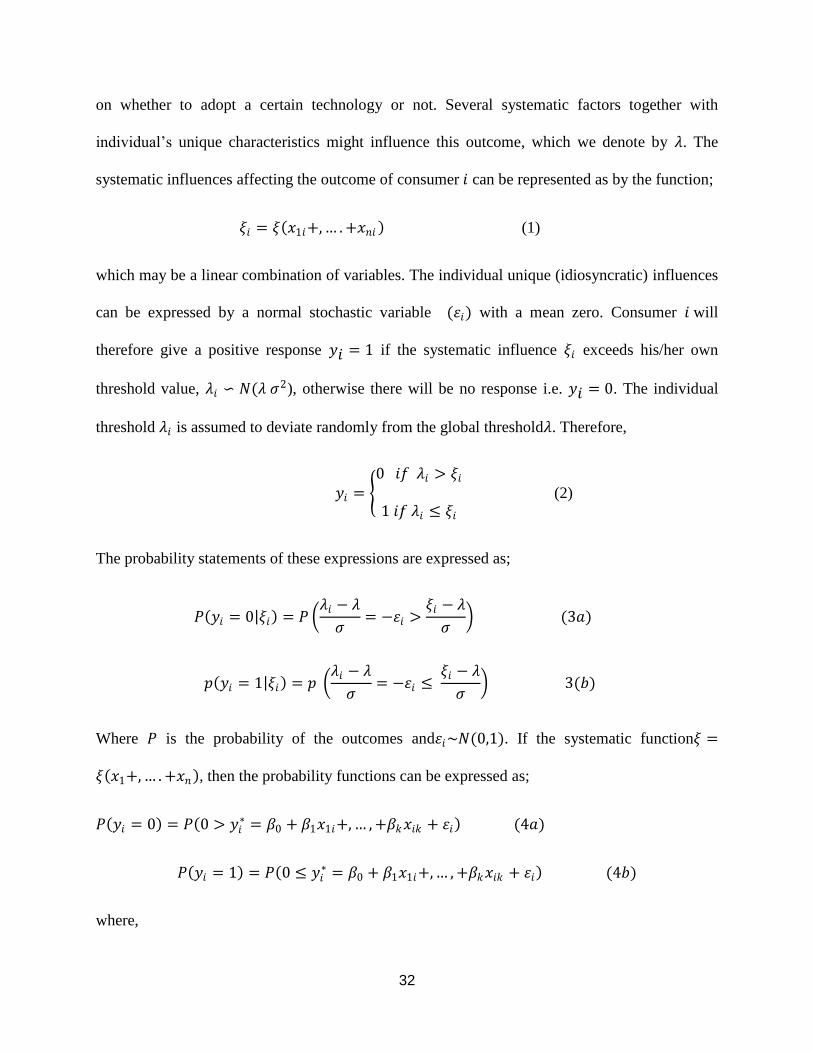
on whether to adopt a certain technology or not. Several systematic factors together with
individual‟s unique characteristics might influence this outcome, which we denote by 𝜆. The
systematic influences affecting the outcome of consumer 𝑖 can be represented as by the function;
𝜉𝑖 = 𝜉 𝑥1𝑖+, … . +𝑥𝑛𝑖 (1)
which may be a linear combination of variables. The individual unique (idiosyncratic) influences
can be expressed by a normal stochastic variable (𝜀𝑖) with a mean zero. Consumer 𝑖 will
therefore give a positive response 𝑦𝑖 = 1 if the systematic influence 𝜉𝑖 exceeds his/her own
threshold value, 𝜆𝑖 ∽ 𝑁(𝜆 𝜍2), otherwise there will be no response i.e. 𝑦𝑖 = 0. The individual
threshold 𝜆𝑖 is assumed to deviate randomly from the global threshold𝜆. Therefore,
𝑦𝑖 = 0 𝑖𝑓 𝜆𝑖 > 𝜉𝑖
1 𝑖𝑓 𝜆𝑖 ≤ 𝜉𝑖
(2)
The probability statements of these expressions are expressed as;
𝑃 𝑦𝑖 = 0 𝜉𝑖 = 𝑃 𝜆𝑖 − 𝜆
𝜍= −𝜀𝑖 >
𝜉𝑖 − 𝜆
𝜍 (3𝑎)
𝑝 𝑦𝑖 = 1 𝜉𝑖 = 𝑝 𝜆𝑖 − 𝜆
𝜍= −𝜀𝑖 ≤
𝜉𝑖 − 𝜆
𝜍 3(𝑏)
Where 𝑃 is the probability of the outcomes and𝜀𝑖~𝑁(0,1). If the systematic function𝜉 =
𝜉 𝑥1+, … . +𝑥𝑛 , then the probability functions can be expressed as;
𝑃 𝑦𝑖 = 0 = 𝑃 0 > 𝑦𝑖∗ = 𝛽0 + 𝛽1𝑥1𝑖+, … , +𝛽𝑘𝑥𝑖𝑘 + 𝜀𝑖 (4𝑎)
𝑃 𝑦𝑖 = 1 = 𝑃 0 ≤ 𝑦𝑖∗ = 𝛽0 + 𝛽1𝑥1𝑖+, … , +𝛽𝑘𝑥𝑖𝑘 + 𝜀𝑖 (4𝑏)
where,
33
𝛽0 + 𝛽1𝑥1𝑖+, … , +𝛽𝑘𝑥𝑖𝑘 =𝜉 𝑥1𝑖+, … . +𝑥𝑛𝑖 − 𝜆
𝜍 (5)
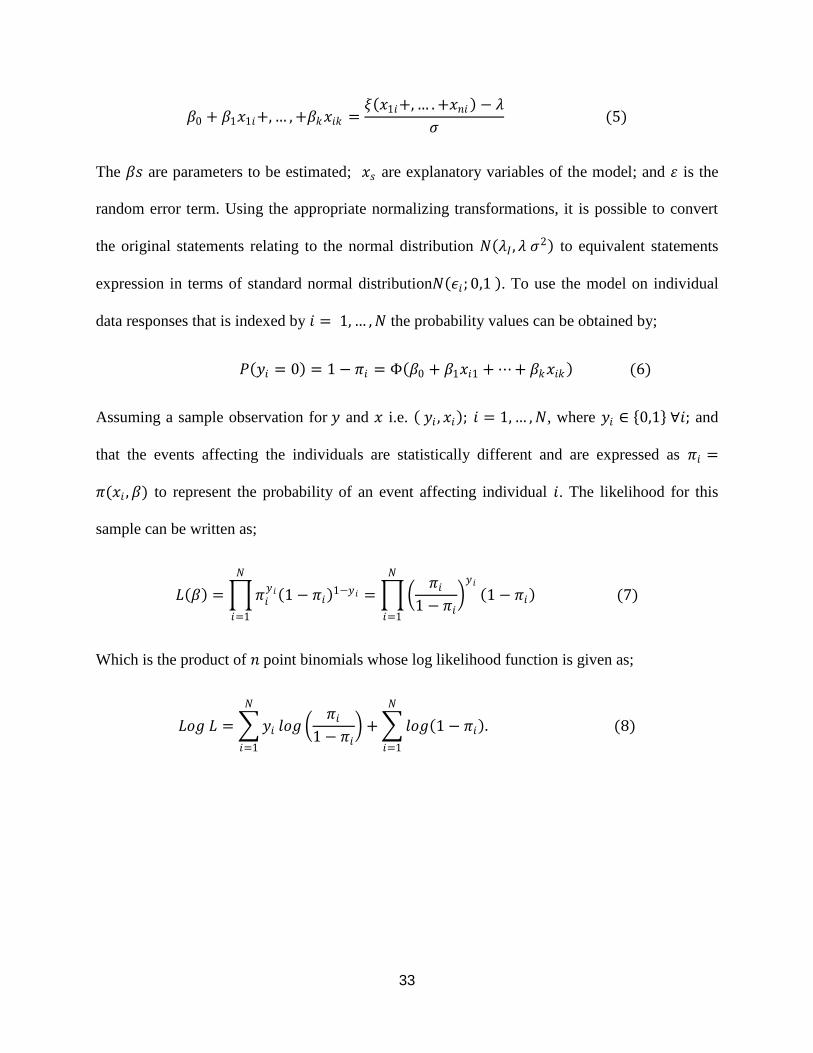
The 𝛽𝑠 are parameters to be estimated; 𝑥𝑠 are explanatory variables of the model; and 𝜀 is the
random error term. Using the appropriate normalizing transformations, it is possible to convert
the original statements relating to the normal distribution 𝑁 𝜆𝐼 , 𝜆 𝜍2 to equivalent statements
expression in terms of standard normal distribution𝑁 𝜖𝑖 ; 0,1 . To use the model on individual
data responses that is indexed by 𝑖 = 1, … , 𝑁 the probability values can be obtained by;
𝑃 𝑦𝑖 = 0 = 1 − 𝜋𝑖 = Φ 𝛽0 + 𝛽1𝑥𝑖1 + ⋯ + 𝛽𝑘𝑥𝑖𝑘 (6)
Assuming a sample observation for 𝑦 and 𝑥 i.e. 𝑦𝑖 , 𝑥𝑖 ; 𝑖 = 1, … , 𝑁, where 𝑦𝑖 ∈ 0,1 ∀𝑖; and
that the events affecting the individuals are statistically different and are expressed as 𝜋𝑖 =
𝜋(𝑥𝑖 , 𝛽) to represent the probability of an event affecting individual 𝑖. The likelihood for this
sample can be written as;
𝐿 𝛽 = 𝜋𝑖𝑦𝑖 1 − 𝜋𝑖
1−𝑦𝑖 = 𝜋𝑖
1 − 𝜋𝑖 𝑦𝑖
𝑁
𝑖=1
𝑁
𝑖=1
1 − 𝜋𝑖 (7)
Which is the product of 𝑛 point binomials whose log likelihood function is given as;
𝐿𝑜𝑔 𝐿 = 𝑦𝑖
𝑁
𝑖=1
𝑙𝑜𝑔 𝜋𝑖
1 − 𝜋𝑖 + 𝑙𝑜𝑔 1 − 𝜋𝑖 .
𝑁
𝑖=1
(8)
34
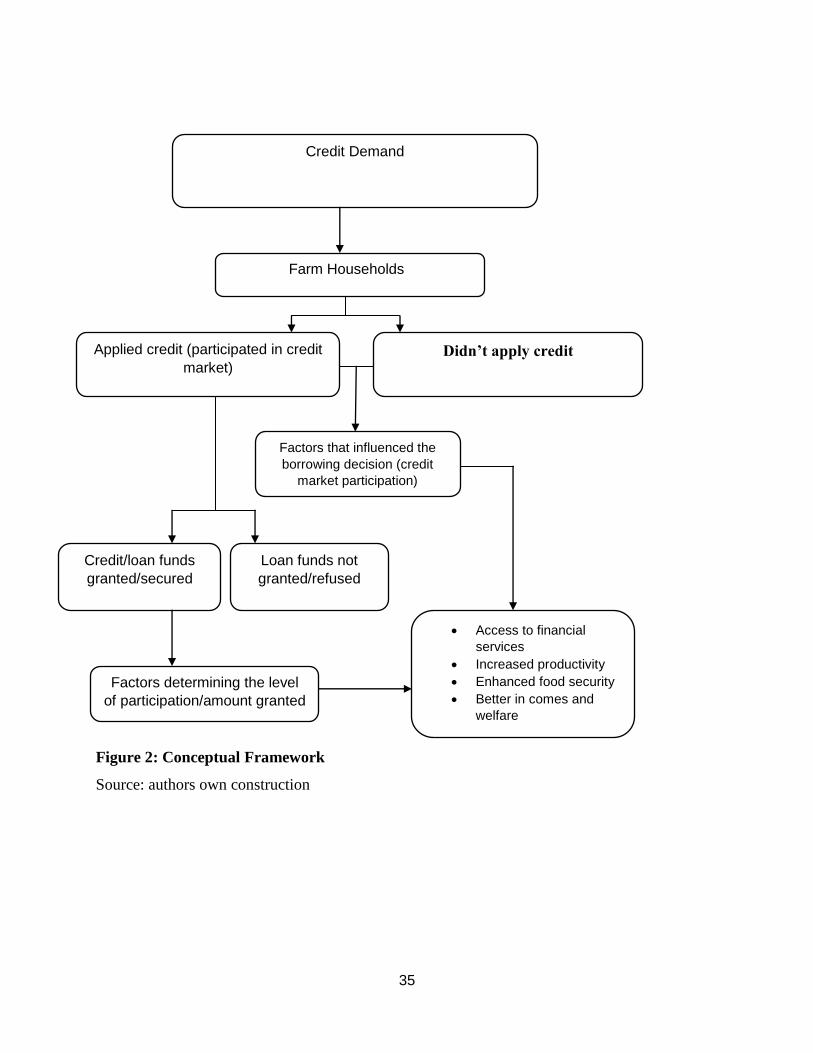
3.5.3 Conceptual Framework
The conceptual framework highlights the factors that influence the decision that households take in the
process of demanding for credit. A household will only demand for credit if there is a need or a want they
need to address and their regular income falls short thus creating a financial gap. The decision whether to
apply for credit after identifying their financial gap will be determined by a number of factors some which
include gender and age of the household head, wealth endowment, and ability to produce collateral
among others. Some farmers after analyzing the requirements of the credit market will opt out while
others will proceed to apply for credit. Those who apply might either secure or be denied depending on
whether they meet the criteria laid down by the credit givers. There are again factors that dictate the
amount given to those applicants who are successful. The amount secures might be influenced by the
same or different factors as the decision to participate in the credit market. Those who seek to participate
in the credit market are aiming to access financial service to increase their productivity, enhance food
security, and diversify their incomes and better there welfare. The chart below highlights
diagrammatically the process of credit demand.
35
Figure 2: Conceptual Framework
Source: authors own construction
Credit Demand
Applied credit (participated in credit
market) Didn’t apply credit
Farm Households
Factors that influenced the
borrowing decision (credit
market participation)
Credit/loan funds
granted/secured
Loan funds not
granted/refused
Factors determining the level
of participation/amount granted
(participation intensity)
Access to financial
services
Increased productivity
Enhanced food security
Better in comes and
welfare
36
3.6 Empirical Model Specification
Tobit model has been commonly used in studies analyzing the factors influencing borrowing
decision and intensity of participation assuming that the same sets of factors affect the two stages
(Greene, 2007). However, normally, the decision on whether to participate and extend of
participation can be jointly or separately made. In a case where the decision is jointly made the
Tobit model is the most suitable (Greene, 2007; Teklewold et al., 2006). A lot of previous works
on factors influencing demand for loan funds have used this assumption.
Borrowing from Cragg (1971), Moffat (2005) and Kefyalewet et al., (2016) the study used
double hurdle model and maximum likelihood estimation technique. This model overcomes the
weaknesses of the both Heckman selection and Tobit models of assuming once the first stage has
been passed there are no zero observations in the second stage and being too restrictive, that is,
the same set of variables affect the two decisions respectively (Beshir, 2013; Tura, 2010).
This study assumes that the credit market participation decision precedes the amount of loan
demanded by a farm household and the factors influencing each might differ (Gebremedhin and
Swinton, 2003). In such a case double hurdle becomes the most appropriate model to use
whereby a probit regression is followed by a truncated regression on the non-zero observations
for decision to borrow and amount borrowed respectively (Cragg, 1971). According to Cragg,
(1971) the Tobit model has a weakness of attributing the censoring to a standard corner solution
thereby assuming that non-borrowing is attributed to economic factors only .
37
The double-hurdle model is a generalization of the Tobit model, in which two separate
independent processes determine the decision to borrow and the level of participation (Greene,
2007; Gebremedhin and Swinton, 2003).It is applied in a manner that, the two hurdles have
equations associated with them, taking in the effects of farmer's characteristics. According to
Moffat, (2005), the independent variables may be found in both equations or in either one,
however, a variable occurring in two equations might have opposite effects. The double-hurdle
(Cragg, 1971), assumes that farm households make two decisions with regard to the decision to
participate and level of participation. Each hurdle is guided by the household‟s socio-economic
characteristics. A different latent variable is therefore used to model each decision process.
This process entails running two regressions. The first is the probit model regression to identify
determinants of credit market participation (decision to borrow) by all the 122 farm households
in Nyando. Then the second stage involves running a truncated regression for those farm
households who participated in the market and secured credit to analyze the factors affecting the
amount of credit secured.
From Cragg (1971), Moffat (2005), Getachew & Nego (2016) and Kefyalewet al, (2016) the two
hurdles can be expressed as:
𝑏𝑖 = 𝛼𝒛𝒊 + 𝑣𝑖 (9)
𝑦𝑖 = 𝛽𝒙𝒊 + 𝜀𝑖 (10)
where; 𝒛𝒊 is a vector of explanatory variables for borrowing decision; 𝒙𝒊 is a vector of
explanatory variables influencing amount of loan secured/received, while 𝑣𝑖 and 𝜀𝑖 are error
terms. Equations 1 and 2 are assumed to be independent and the error terms are random and
38
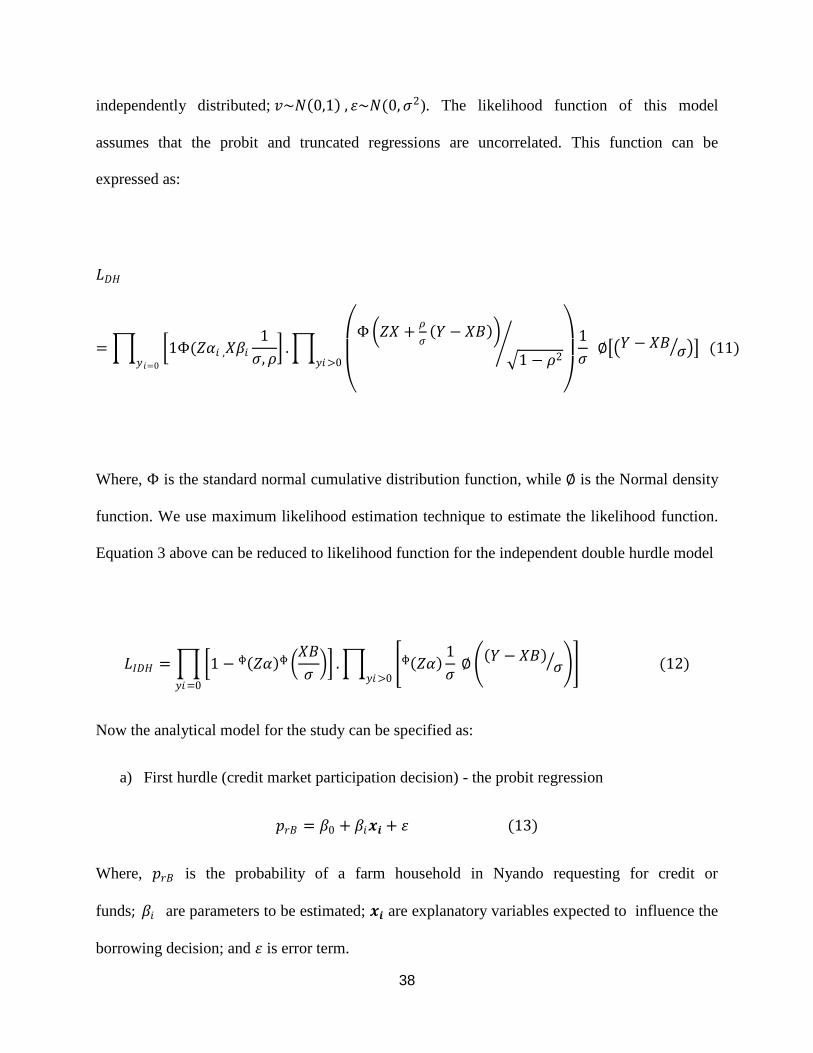
independently distributed; 𝑣~𝑁 0,1 , 𝜀~𝑁(0, 𝜍2). The likelihood function of this model
assumes that the probit and truncated regressions are uncorrelated. This function can be
expressed as:
𝐿𝐷𝐻
= 1Φ(𝑍𝛼𝑖 ,𝑋𝛽𝑖
1
𝜍, 𝜌
𝑦𝑖=0
.
Φ 𝑍𝑋 +
𝜌
𝜍 𝑌 − 𝑋𝐵
1 − 𝜌2
1
𝜍 ∅ 𝑌 − 𝑋𝐵
𝜍 𝑦𝑖>0
(11)
Where, Φ is the standard normal cumulative distribution function, while ∅ is the Normal density
function. We use maximum likelihood estimation technique to estimate the likelihood function.
Equation 3 above can be reduced to likelihood function for the independent double hurdle model
𝐿𝐼𝐷𝐻 = 1 − ᶲ 𝑍𝛼 ᶲ 𝑋𝐵
𝜍 . ᶲ 𝑍𝛼
1
𝜍 ∅
𝑌 − 𝑋𝐵 𝜍
𝑦𝑖>0𝑦𝑖=0
(12)
Now the analytical model for the study can be specified as:
a) First hurdle (credit market participation decision) - the probit regression
𝑝𝑟𝐵 = 𝛽0 + 𝛽𝑖𝒙𝒊 + 𝜀 (13)
Where, 𝑝𝑟𝐵 is the probability of a farm household in Nyando requesting for credit or
funds; 𝛽𝑖 are parameters to be estimated; 𝒙𝒊 are explanatory variables expected to influence the
borrowing decision; and 𝜀 is error term.
39
b) The second hurdle (amount of credit) –truncated regression. The underlying latent
variable has the following relationship.
𝑦𝑖∗ = 𝛽0 + 𝛽𝑖𝒛𝒊 + 𝜇𝑖 𝜇𝑖 𝑧 ∼ 𝑁(0, 𝜍2 ) (14𝑎)
𝑦𝑖 = 𝑦𝑖
∗ 𝑖𝑓 𝑦𝑖∗ > 0
0 𝑜𝑡𝑒𝑟𝑤𝑖𝑠𝑒
(14𝑏)
Where, 𝑦𝑖 is observed amount of credit received by the i-th farmer; 𝛽𝑖 are parameters to be
estimated; 𝑧𝑖 are explanatory variables determining credit received; and 𝜇𝑖 is the error term. The
variables used for the study are:
40
Dependent Variable (𝒚𝒊)
The depended variables for the study are decision to borrow loan (binary variable) with 1 or 0
and; amount of loan funds that individual farmers have borrowed (continuous variable). It was
obtained from the responses by the farmers.
Explanatory Variables
Gender of the household head (GE): Gender of the household head is a dummy variable
assuming the value of 1 if the responded is a male and 0 otherwise. Women are considered
disadvantaged especially in the rural areas because most do not have rights to property especially
land hence they have challenges accessing credit. This might reduce their demand for loan funds.
This study expects a positive relationship between loan demand and male headed households.
The influence of group membership might also have a positive influence on loan demand. Since
most of the group members are women, this might give a different outcome that women headed
households might be borrowing more.
Number of Groups: This is the number of groups household members from a particular
household belong to. The more the groups the ease of accessing credit. Groups are a form of
social capital and through them farmers have access to information and mentorship. It is
expected that it will influence credit demand positively.
Wealth Index (WI): Wealth index is a gauge of a household's collective living standards. It is
computed using data on household‟s possession of certain set of assets: televisions and bicycles,
housing construction materials, and water access and sanitation facilities among others. It is
computed using principal components analysis by summing up five categories of capital: natural
capital that comprises of total land size owned and cultivated farm size by a household; physical
41
capital which includes assets like bicycles, motor vehicles, motor bikes wheelbarrows etc.;
human capital which is represented by household labor capacity; social capital (group
membership); and financial capital . A weighted average of all the above represents the
household wealth endowment.
Age of the farm household head (AG): This is the number of years the farm household head
has lived as at the time of the research interview. Age is attributed with more accumulated assets,
experience and wealth. Farmers with high endowment of assets tend to show increased loan
demand since they can provide the collateral needed. However older people might tend to be risk
averse and sometimes might show low demand for loan funds. The expected relationship is
therefore indeterminate.
Education level of the farmer (EDUC): This is defined as the number of years of formal
schooling of farm household head. Farmers with more years of schooling are expected to have
access to more information and knowledge about new farming technologies, how to access
formal credit among other aspects. The more educated a farmer is, the more it is expected they
will exhibit increased loan demand.
Investing in Climate-smart practices/technologies (CSAPs): Climate-smart technologies are
associated with increased productivity. However, climate-smart technologies are expensive and
require funding especially for poor smallholder farmers. Thus, it is expected that farmers
exposed to CSA exhibit increased loan demand to invest in these technologies. However more
interventions might mean that the farm household has diversified income sources and might not
require loans to offset its financial needs. This variable is assumed to have a positive influence
on decision to get loan and also the loan amount.
42
Collateral (group shares): Collateral is expected to have positive influence on demand. Farmers
with large tracks of land and are wealth endowed including social capital can afford to provide
collateral to access loans. However, in Nyando most farmers borrow from groups and use their
shares in those groups as collateral. It is expected that group shares have a positive influence on
credit demand among these farmers.
Household savings: This is a dummy variable assuming the value of 1 if the household saves
and 0 otherwise. From literature, Savings have both positive and negative influence on credit
demand. A household with more savings may not demand for credit as they can use their savings
to finance farm operations and other household financial needs. However savings might also act
as a security for credit and more savings might lead to more credit as the household has the
capacity to repay.
Primary occupation: It‟s a dummy variable assuming 1 if the household head primary
occupation is agriculture related (rearing animals and crop farming) and 0 otherwise. It‟s
expected that farmers practicing agriculture as their main occupation will need to increase
productivity and thus may seek for credit to do so. Agricultural production is a risk occupation
full of uncertainties and irregular outcomes and this might be a discouragement to farmers to
seek for credit to invest in their production.
Household size: This is the total number of people in household who live and eat together. The
more members in a household the more financial needs they have such as school fees, health
expense etc. This is expected to influence demand for credit positively.
Loan repayment period: The duration over which a farmer is required to repay a loan plus its
interest. It‟s expected to influence credit demand positively if the repayment period is long and
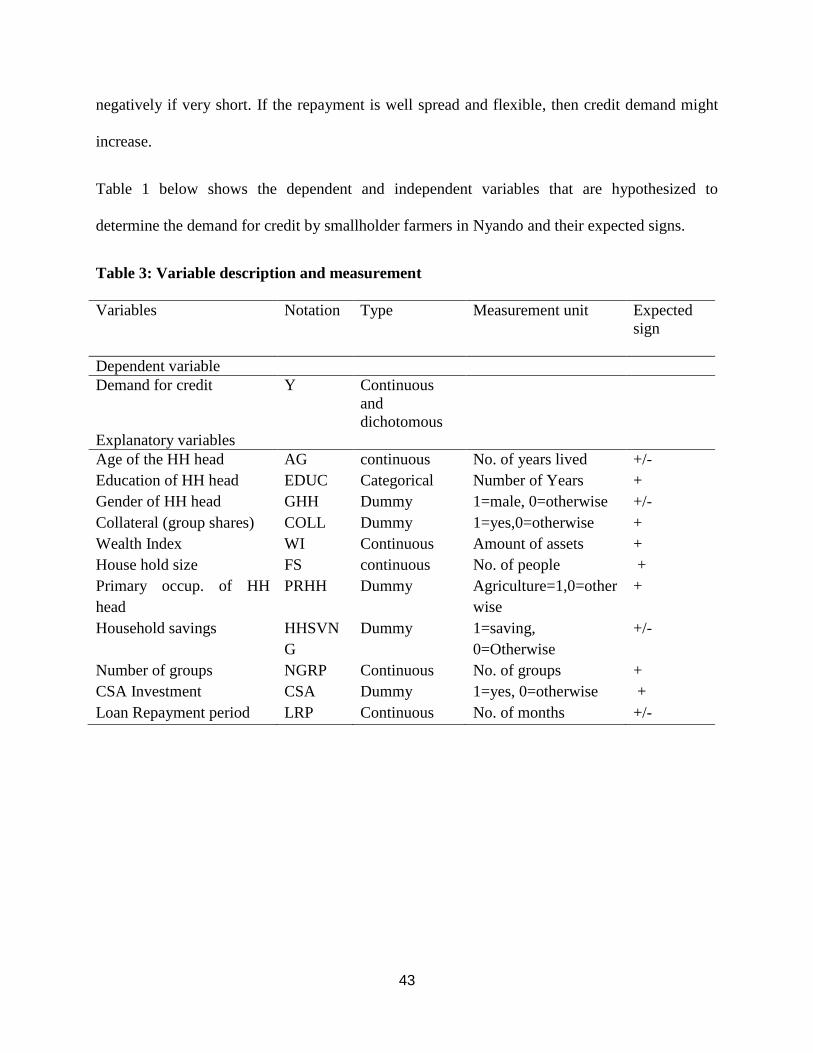
43
negatively if very short. If the repayment is well spread and flexible, then credit demand might
increase.
Table 1 below shows the dependent and independent variables that are hypothesized to
determine the demand for credit by smallholder farmers in Nyando and their expected signs.
Table 3: Variable description and measurement
Variables Notation Type
Measurement unit
Expected
sign
Dependent variable
Demand for credit Y Continuous
and
dichotomous
Explanatory variables
Age of the HH head AG continuous No. of years lived +/-
Education of HH head EDUC Categorical Number of Years +
Gender of HH head GHH Dummy 1=male, 0=otherwise +/-
Collateral (group shares) COLL Dummy 1=yes,0=otherwise +
Wealth Index WI Continuous Amount of assets +
House hold size FS continuous No. of people +
Primary occup. of HH
head
PRHH Dummy Agriculture=1,0=other
wise
+
Household savings HHSVN
G
Dummy 1=saving,
0=Otherwise
+/-
Number of groups NGRP Continuous No. of groups +
CSA Investment CSA Dummy 1=yes, 0=otherwise +
Loan Repayment period LRP Continuous No. of months +/-
44
CHAPTER FOUR: RESULTS AND DISCUSSION
This chapter presents and discusses the study results. It is divided into two main sections:
descriptive statistics of the farm households in the study and econometrics results and analysis of
the factors influencing both credit market participation and intensity by the smallholder farmers
in Nyando.
4.1 Descriptive analysis
The descriptive statistics gives a summary of all the variables used in the study. From Table 4,
the average age of the household head is 54 years with the youngest being 25 and the oldest 94.
The number of groups that household members belonged to range from 0 to 6 groups with an
average of 1.7 groups per household. Loan repayment period ranged from zero to 48 months (2
years) with an average of 3.36 months. Among the 122 households interviewed the smallest
household had 1 member with the largest having 14 members. The mean family size was 6
members which often lead to high dependency ratio. Number of CSA practices adopted by
households ranged from 1 to 6 practices while household savings ranged from 0 to Ksh.400, 000
with an average of about ksh.13, 000.The average interest rate charged on loans was about 8 %
with the highest rate being 53%.
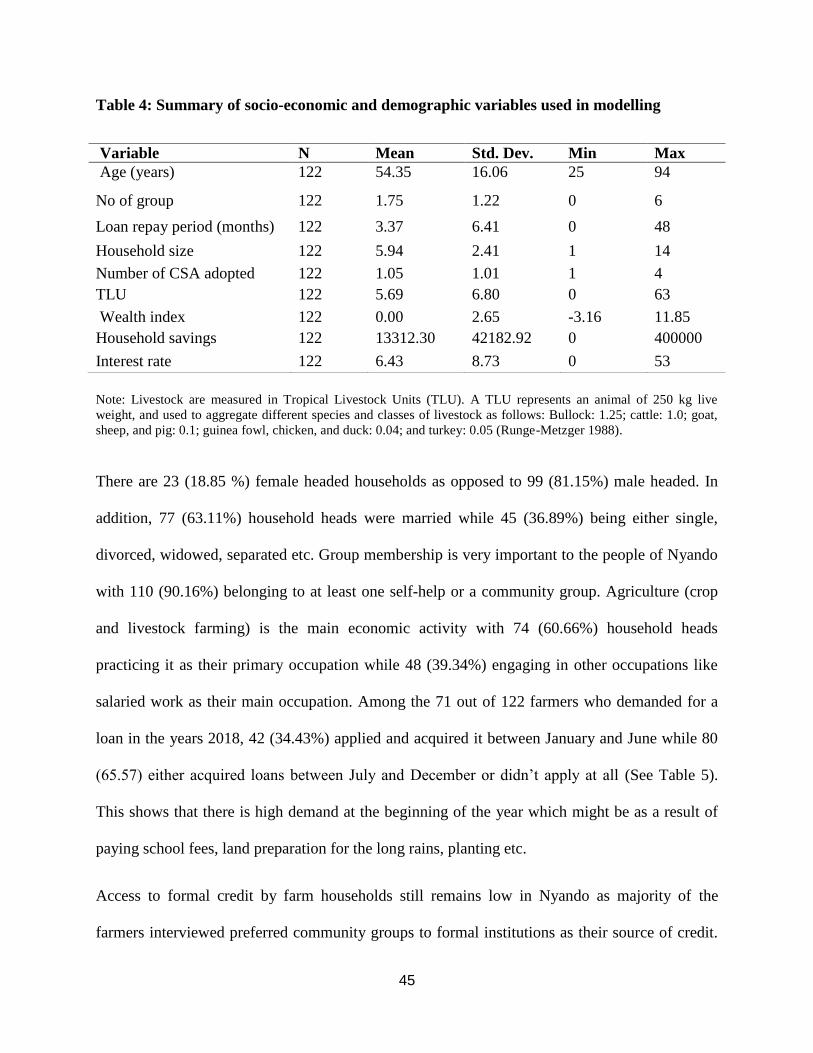
45
Table 4: Summary of socio-economic and demographic variables used in modelling
Note: Livestock are measured in Tropical Livestock Units (TLU). A TLU represents an animal of 250 kg live
weight, and used to aggregate different species and classes of livestock as follows: Bullock: 1.25; cattle: 1.0; goat,
sheep, and pig: 0.1; guinea fowl, chicken, and duck: 0.04; and turkey: 0.05 (Runge-Metzger 1988).
There are 23 (18.85 %) female headed households as opposed to 99 (81.15%) male headed. In
addition, 77 (63.11%) household heads were married while 45 (36.89%) being either single,
divorced, widowed, separated etc. Group membership is very important to the people of Nyando
with 110 (90.16%) belonging to at least one self-help or a community group. Agriculture (crop
and livestock farming) is the main economic activity with 74 (60.66%) household heads
practicing it as their primary occupation while 48 (39.34%) engaging in other occupations like
salaried work as their main occupation. Among the 71 out of 122 farmers who demanded for a
loan in the years 2018, 42 (34.43%) applied and acquired it between January and June while 80
(65.57) either acquired loans between July and December or didn‟t apply at all (See Table 5).
This shows that there is high demand at the beginning of the year which might be as a result of
paying school fees, land preparation for the long rains, planting etc.
Access to formal credit by farm households still remains low in Nyando as majority of the
farmers interviewed preferred community groups to formal institutions as their source of credit.
Variable N Mean Std. Dev. Min Max
Age (years) 122 54.35 16.06 25 94
No of group 122 1.75 1.22 0 6
Loan repay period (months) 122 3.37 6.41 0 48
Household size 122 5.94 2.41 1 14
Number of CSA adopted 122 1.05 1.01 1 4
TLU 122 5.69 6.80 0 63
Wealth index 122 0.00 2.65 -3.16 11.85
Household savings 122 13312.30 42182.92 0 400000
Interest rate 122 6.43 8.73 0 53
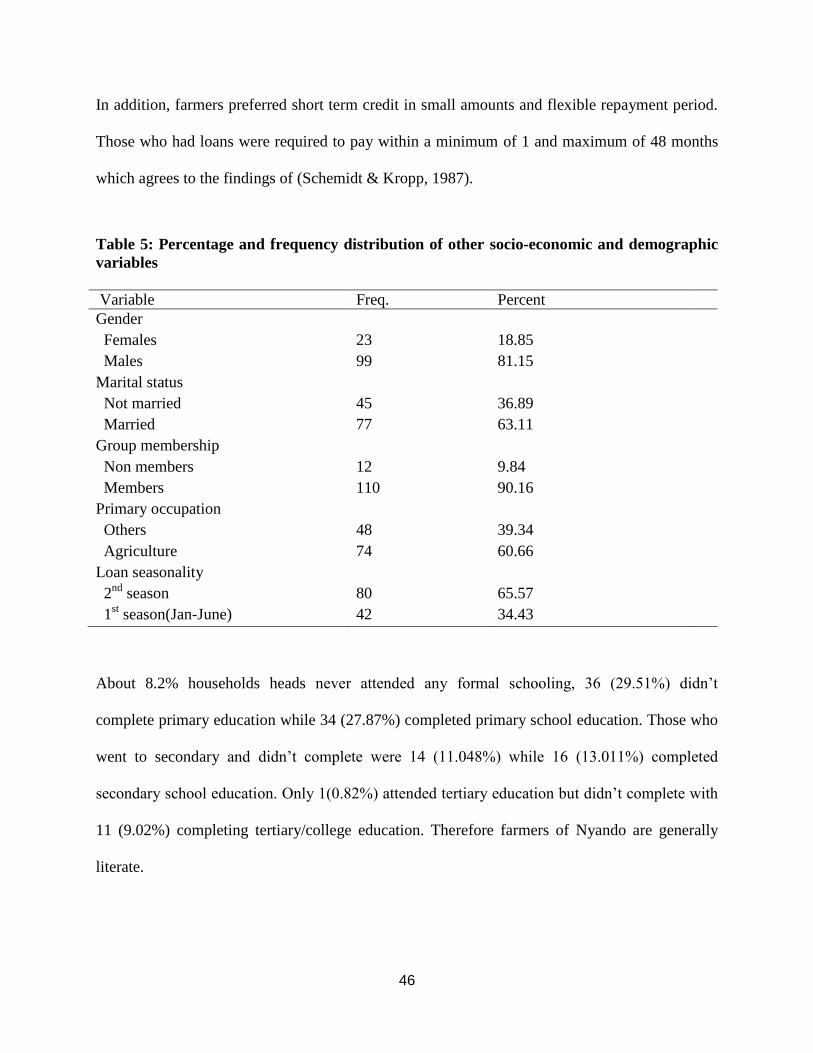
46
In addition, farmers preferred short term credit in small amounts and flexible repayment period.
Those who had loans were required to pay within a minimum of 1 and maximum of 48 months
which agrees to the findings of (Schemidt & Kropp, 1987).
Table 5: Percentage and frequency distribution of other socio-economic and demographic
variables
Variable Freq. Percent
Gender
Females 23 18.85
Males 99 81.15
Marital status
Not married 45 36.89
Married 77 63.11
Group membership
Non members 12 9.84
Members 110 90.16
Primary occupation
Others 48 39.34
Agriculture 74 60.66
Loan seasonality
2nd
season 80 65.57
1st season(Jan-June) 42 34.43
About 8.2% households heads never attended any formal schooling, 36 (29.51%) didn‟t
complete primary education while 34 (27.87%) completed primary school education. Those who
went to secondary and didn‟t complete were 14 (11.048%) while 16 (13.011%) completed
secondary school education. Only 1(0.82%) attended tertiary education but didn‟t complete with
11 (9.02%) completing tertiary/college education. Therefore farmers of Nyando are generally
literate.
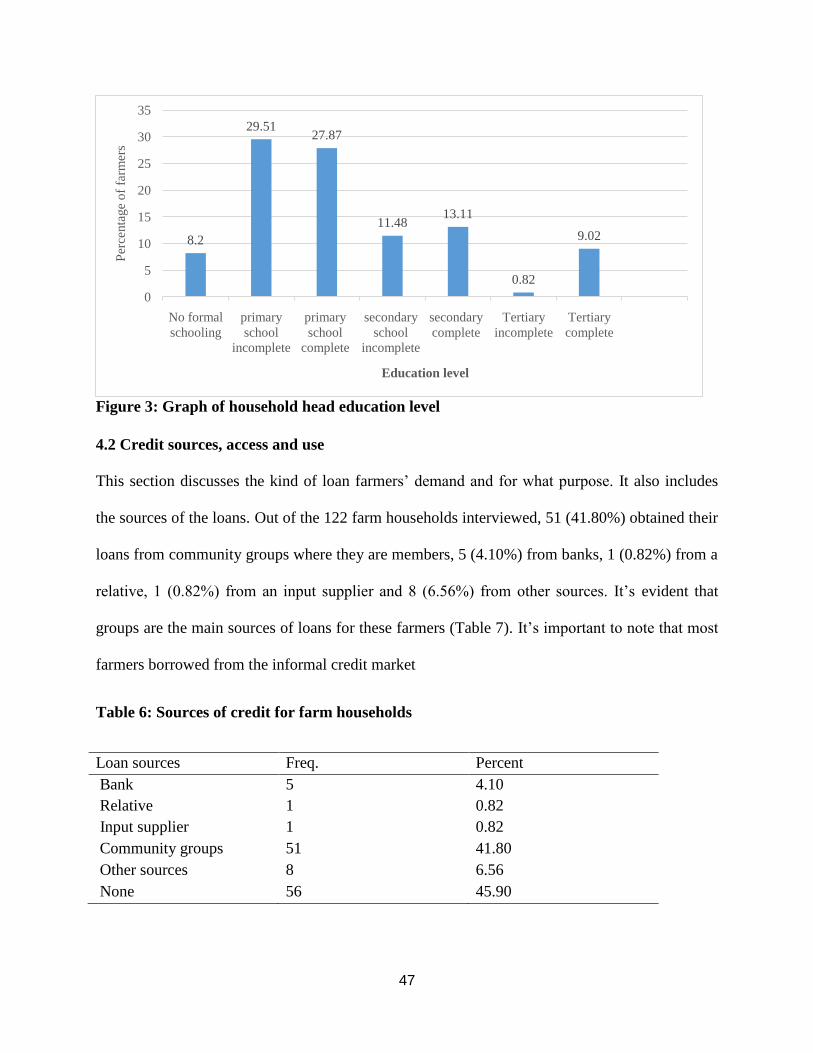
47
Figure 3: Graph of household head education level
4.2 Credit sources, access and use
This section discusses the kind of loan farmers‟ demand and for what purpose. It also includes
the sources of the loans. Out of the 122 farm households interviewed, 51 (41.80%) obtained their
loans from community groups where they are members, 5 (4.10%) from banks, 1 (0.82%) from a
relative, 1 (0.82%) from an input supplier and 8 (6.56%) from other sources. It‟s evident that
groups are the main sources of loans for these farmers (Table 7). It‟s important to note that most
farmers borrowed from the informal credit market
Table 6: Sources of credit for farm households
Loan sources Freq. Percent
Bank 5 4.10
Relative 1 0.82
Input supplier 1 0.82
Community groups 51 41.80
Other sources 8 6.56
None 56 45.90
8.2
29.5127.87
11.4813.11
0.82
9.02
0
5
10
15
20
25
30
35
No formal
schooling
primary
school
incomplete
primary
school
complete
secondary
school
incomplete
secondary
complete
Tertiary
incomplete
Tertiary
complete
Per
centa
ge
of
farm
ers
Education level
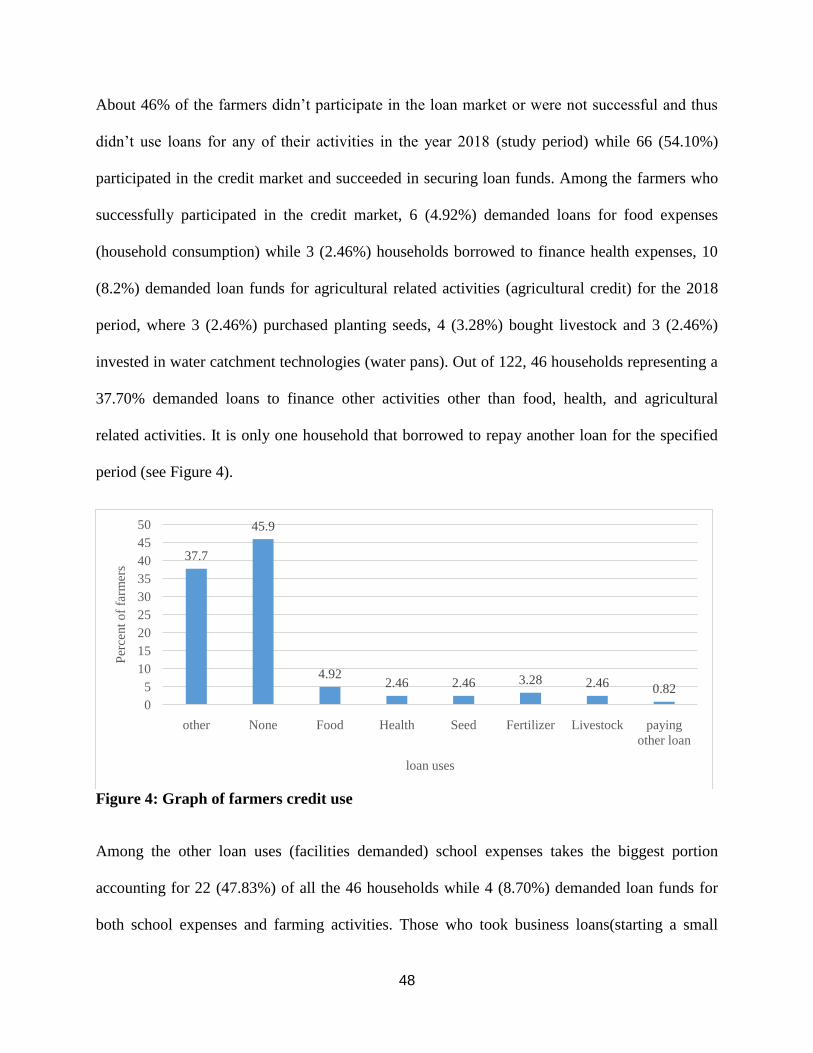
48
About 46% of the farmers didn‟t participate in the loan market or were not successful and thus
didn‟t use loans for any of their activities in the year 2018 (study period) while 66 (54.10%)
participated in the credit market and succeeded in securing loan funds. Among the farmers who
successfully participated in the credit market, 6 (4.92%) demanded loans for food expenses
(household consumption) while 3 (2.46%) households borrowed to finance health expenses, 10
(8.2%) demanded loan funds for agricultural related activities (agricultural credit) for the 2018
period, where 3 (2.46%) purchased planting seeds, 4 (3.28%) bought livestock and 3 (2.46%)
invested in water catchment technologies (water pans). Out of 122, 46 households representing a
37.70% demanded loans to finance other activities other than food, health, and agricultural
related activities. It is only one household that borrowed to repay another loan for the specified
period (see Figure 4).
Figure 4: Graph of farmers credit use
Among the other loan uses (facilities demanded) school expenses takes the biggest portion
accounting for 22 (47.83%) of all the 46 households while 4 (8.70%) demanded loan funds for
both school expenses and farming activities. Those who took business loans(starting a small
37.7
45.9
4.922.46 2.46 3.28 2.46 0.82
0
5
10
15
20
25
30
35
40
45
50
other None Food Health Seed Fertilizer Livestock paying
other loan
Per
cent
of
farm
ers
loan uses
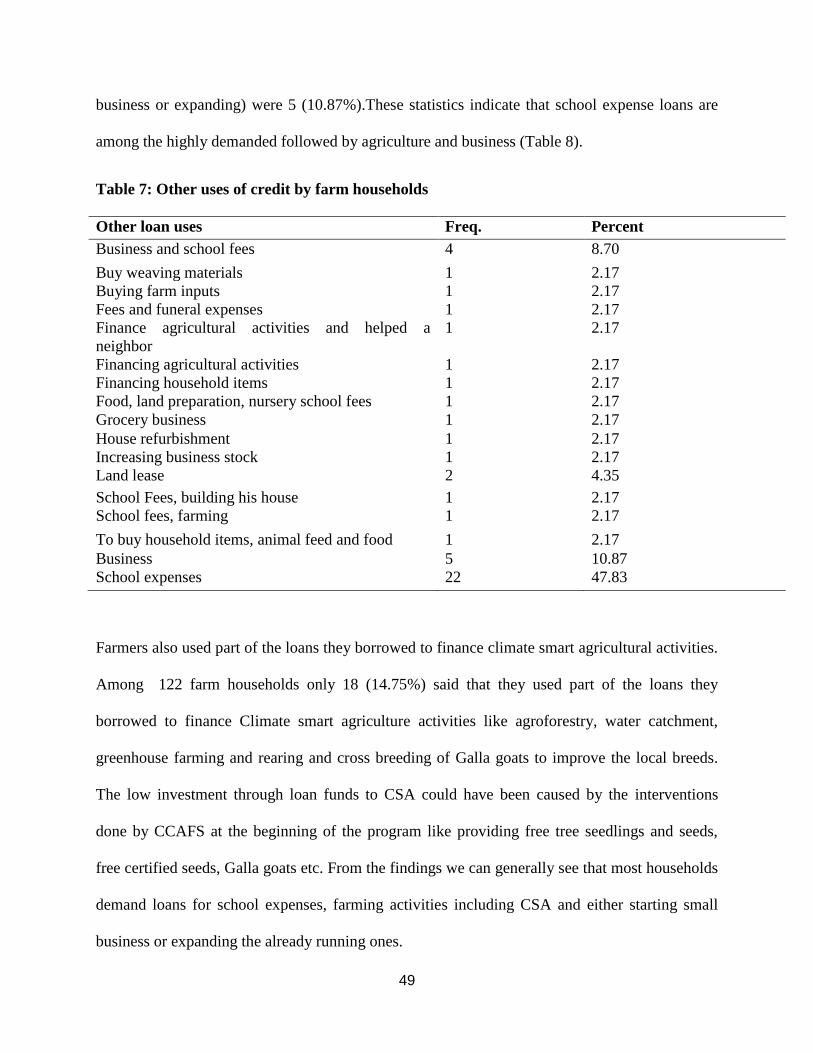
49
business or expanding) were 5 (10.87%).These statistics indicate that school expense loans are
among the highly demanded followed by agriculture and business (Table 8).
Table 7: Other uses of credit by farm households
Other loan uses Freq. Percent
Business and school fees 4 8.70
Buy weaving materials 1 2.17
Buying farm inputs 1 2.17
Fees and funeral expenses 1 2.17
Finance agricultural activities and helped a
neighbor
1 2.17
Financing agricultural activities 1 2.17
Financing household items 1 2.17
Food, land preparation, nursery school fees 1 2.17
Grocery business 1 2.17
House refurbishment 1 2.17
Increasing business stock 1 2.17
Land lease 2 4.35
School Fees, building his house 1 2.17
School fees, farming 1 2.17
To buy household items, animal feed and food 1 2.17
Business 5 10.87
School expenses 22 47.83
Farmers also used part of the loans they borrowed to finance climate smart agricultural activities.
Among 122 farm households only 18 (14.75%) said that they used part of the loans they
borrowed to finance Climate smart agriculture activities like agroforestry, water catchment,
greenhouse farming and rearing and cross breeding of Galla goats to improve the local breeds.
The low investment through loan funds to CSA could have been caused by the interventions
done by CCAFS at the beginning of the program like providing free tree seedlings and seeds,
free certified seeds, Galla goats etc. From the findings we can generally see that most households
demand loans for school expenses, farming activities including CSA and either starting small
business or expanding the already running ones.
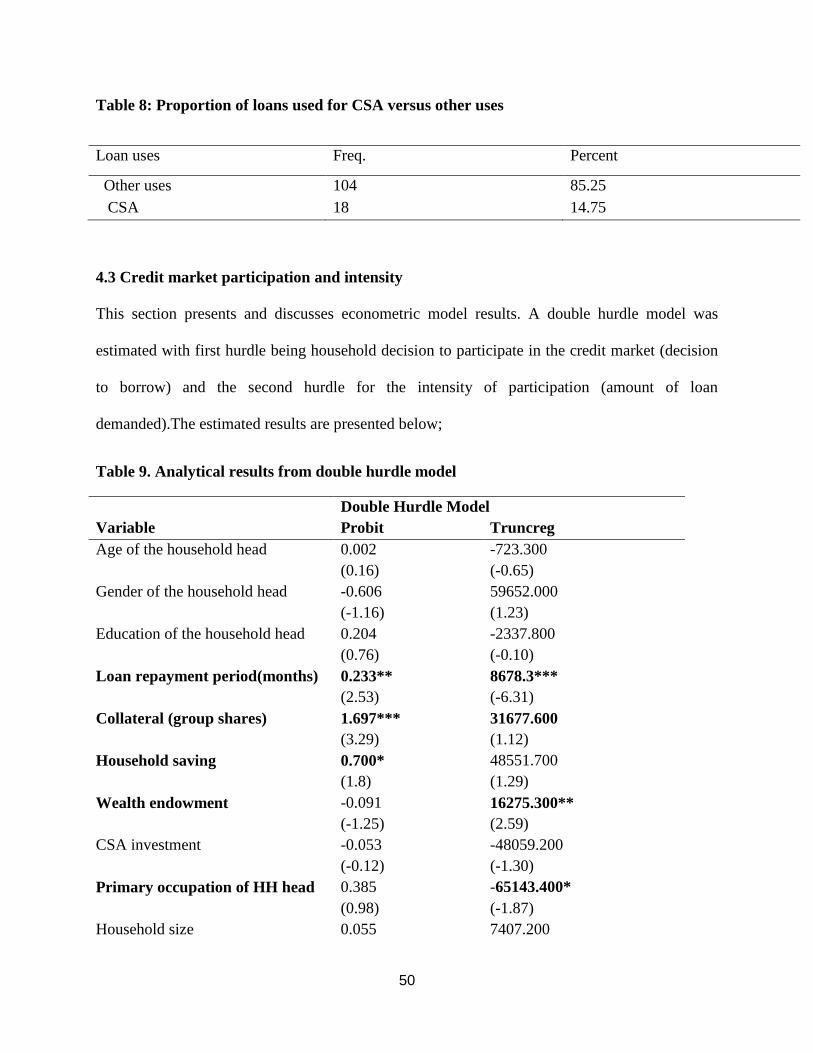
50
Table 8: Proportion of loans used for CSA versus other uses
Loan uses Freq. Percent
Other uses 104 85.25
CSA 18 14.75
4.3 Credit market participation and intensity
This section presents and discusses econometric model results. A double hurdle model was
estimated with first hurdle being household decision to participate in the credit market (decision
to borrow) and the second hurdle for the intensity of participation (amount of loan
demanded).The estimated results are presented below;
Table 9. Analytical results from double hurdle model
Double Hurdle Model
Variable Probit Truncreg
Age of the household head 0.002 -723.300
(0.16) (-0.65)
Gender of the household head -0.606 59652.000
(-1.16) (1.23)
Education of the household head 0.204 -2337.800
(0.76) (-0.10)
Loan repayment period(months) 0.233** 8678.3***
(2.53) (-6.31)
Collateral (group shares) 1.697*** 31677.600
(3.29) (1.12)
Household saving 0.700* 48551.700
(1.8) (1.29)
Wealth endowment -0.091 16275.300**
(-1.25) (2.59)
CSA investment -0.053 -48059.200
(-0.12) (-1.30)
Primary occupation of HH head 0.385 -65143.400*
(0.98) (-1.87)
Household size 0.055 7407.200
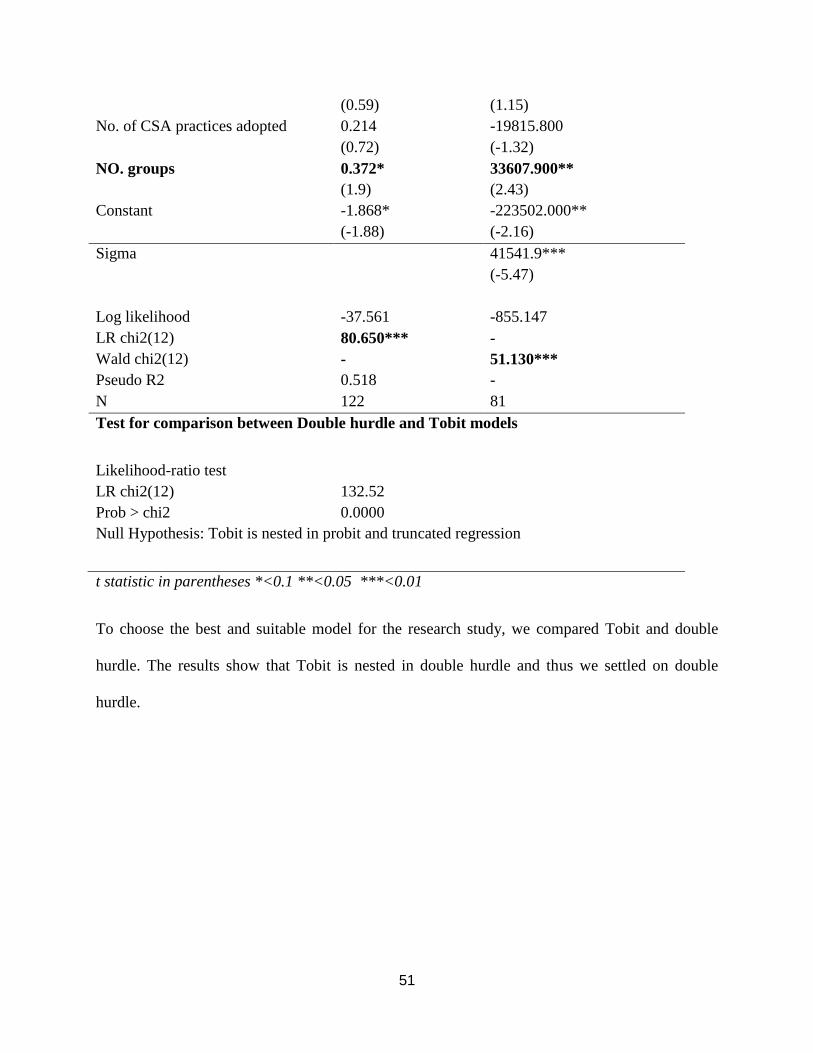
51
(0.59) (1.15)
No. of CSA practices adopted 0.214 -19815.800
(0.72) (-1.32)
NO. groups 0.372* 33607.900**
(1.9) (2.43)
Constant -1.868* -223502.000**
(-1.88) (-2.16)
Sigma
41541.9***
(-5.47)
Log likelihood -37.561 -855.147
LR chi2(12) 80.650*** -
Wald chi2(12) - 51.130***
Pseudo R2 0.518 -
N 122 81
Test for comparison between Double hurdle and Tobit models
Likelihood-ratio test
LR chi2(12) 132.52
Prob > chi2 0.0000
Null Hypothesis: Tobit is nested in probit and truncated regression
t statistic in parentheses *<0.1 **<0.05 ***<0.01
To choose the best and suitable model for the research study, we compared Tobit and double
hurdle. The results show that Tobit is nested in double hurdle and thus we settled on double
hurdle.
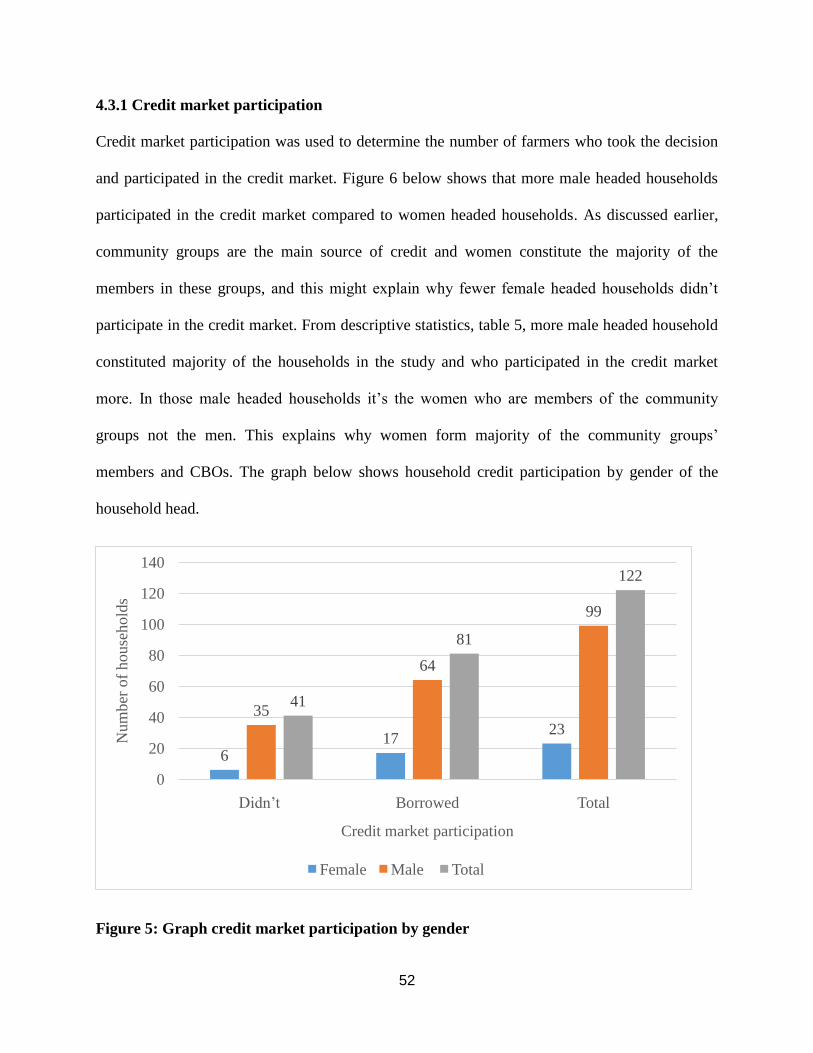
52
4.3.1 Credit market participation
Credit market participation was used to determine the number of farmers who took the decision
and participated in the credit market. Figure 6 below shows that more male headed households
participated in the credit market compared to women headed households. As discussed earlier,
community groups are the main source of credit and women constitute the majority of the
members in these groups, and this might explain why fewer female headed households didn‟t
participate in the credit market. From descriptive statistics, table 5, more male headed household
constituted majority of the households in the study and who participated in the credit market
more. In those male headed households it‟s the women who are members of the community
groups not the men. This explains why women form majority of the community groups‟
members and CBOs. The graph below shows household credit participation by gender of the
household head.
Figure 5: Graph credit market participation by gender
617
23
35
64
99
41
81
122
0
20
40
60
80
100
120
140
Didn‟t Borrowed Total
Num
ber
of
house
hold
s
Credit market participation
Female Male Total
53
From the probit model results in Table 11, several factors influence credit market participation in
Nyando basin. These factors are discussed below.
Loan repayment period: Loan repayment period showed a positive and significant correlation
with household credit market participation at 5% significance level, mostly in the informal credit
market. The longer the repayment period the more farmers are likely to participate in the
informal credit market. If the loan repayment period is extended by 1 month, then household
credit market participation is likely to increase by 4.9%. If the repayment period is spread over a
longer period then farmers can pay back their loans without much strain. This also shows the
flexibility is loan repayment which agrees with the findings of (Hussien 2007) in Ethiopia, where
he found out that among other reasons farmers preferred credit from informal loan sources
because of their flexibility in loan repayment in terms of amount and duration. Atieno, (2001)
also agrees with the study finding that terms of loan repayment affect the decision of farmers to
borrow.
Collateral (group shares): Farm household who used group shares as their loan collateral were
likely to borrow more especially from the informal market (community and self-help groups).
Using group shares as collateral showed a positive and significant relationship with decision to
borrow at 1% significance level. If a household uses group shares as collateral their likelihood of
borrowing will increase by 29%. It is easy to access a loan from the community groups if a
farmer has shares as the farmers contributions will be used as collateral to guarantee the loan. If
more lenders encourage and embrace use of group shares as collateral there is a high likelihood
that credit market participation might be increased. Group membership and contribution help
influence and improve credit access as they provide joint guarantee to loans applied by members
(Akudugu et al.2009); (Armendariz and Morduch 2005) and (Kah et al. 2005).
54
Household savings: Household savings might influence credit demand both positively and
negatively. From our findings, household saving had a positive and significant influence on
farmers‟ decision to borrow at 10% significance level. If a household starts to save it‟s likely that
their chances of borrowing will increase by16%. In our case farmers save through groups and the
more shares a farmer has the more money they can access. Thus those with more savings can
borrow larger amounts. According to Koomson et al. (2014) the probability of borrowing
decreases with low savings and income and increase with high savings and high income.
Number of groups: Being in more groups has a positive and significant influence on informal
credit market participation at 10% significance level. Membership in an extra group is likely to
increases chances of participating in the informal credit market by 7.8 %.The more groups farm
household members are in, the more likely they will borrow. The findings agree with Iyanda et
al. (2014) who concluded that investment in social capital through actively being part of a group
and participating in activities like decision making, increase the probability of credit access.
Laffont and N‟Guessan, (2000) agrees with the study finding that through groups farmers
overcome the obstacle of information asymmetry especially in the remote areas for potential
borrowers and thus the demand for credit will increase with an individual being a member of a
group. Darie, (2012) in Uganda found out that groups provided social capital needed by
smallholder farmers to access farm credit. Groups also provide training and mentorship on
savings and credit and thus are critical in determining credit demand in rural areas of developing
world (Huppi and Feder 1990).
55
4.3.2 Intensity of credit use
The truncated regression model in Table 11 shows that the following factors influence the
intensity of participation in credit markets in Nyando Basin.
Loan repayment period: Loan repayment period showed a positive and significant correlation
with amount of credit demanded. The longer the repayment period the more credit farmers are
likely to demand. If the repayment period is increased with one month the amount demanded will
increase by ksh. 8678.34. Holding other factors constant, with more time to repay, farmers might
be encouraged to increase the amount they borrow. According to Atieno (2001) decision to
borrow and amount of credit demanded is affected among other things by duration, amount and
terms of payment given.
Wealth endowment: Household wealth endowment has a positive and significant influence on
credit amount demand at 5% significance level. If the wealth index of a household increases
with one unit, the amount demanded is likely to increase by ksh.16, 275.3. The more a household
is endowed the more credit they are likely to borrow. This is because they have more assets that
can be used as collateral for the loans or large parcels of land and thus need more resources to
carry out operations on the farms. Also with large cultivated land size, the farm households
utilize more farm inputs such as fertilizer, seed, labour (hired labour) and others that need
additional resource that might be obtained through credit. Mohieldin and Write (2000) had
similar findings in Egypt that borrowers who are characterized by greater assets and high
earnings could use them as collateral and may demand for credit more. Jianqiang, & Bing (2008)
and (Mpuga, 2010) cited that asset value and net worthy impacts demand positively. Farmers
with high net worth and who own a lot of assets tend to exhibit high demand for loans because
they can provide collateral for the loans and need more financial power to carry out their
56
operations. Miller and Ladman (1983) found out that households who borrow more are seen to
have among other things high resource base and large number of cattle. Magri (2002) opined that
at some level an increase in household wealth endowment might raise consumption levels which
in turn increases demand for credit. Also Crook, (2001), Duca and Rosenthal, (1997), Gropp et
al., (1997) and Cox and Jappelli, (1993) who find household wealth to be an important
determinant of demand for credit.
Primary occupation: The influence of household head primary occupation on the amount of
credit demanded especially from the informal market was found to be negative and significant at
10%. If household head is practicing agriculture as primary occupation then their amount of
credit demanded will likely reduce by ksh.65, 143.38.According to Kiplimo et al., (2015)
individuals engaged in agricultural sector as their main occupation (farmers) are unlikely to
apply for credit as compared to their counterparts in other sectors. This may be as a result of risk
of crop failure and unpredictability of agricultural production coupled with price fluctuation.
Additionally Laffont and N‟Guessan, (2002) were of the opinion that households with regular off
farm income and employment tend to participate and borrow more compared to those who are in
agricultural sector as they can easily cushion themselves against risks of crop failure and
livestock losses.
Number of groups: There was a positive and significance relationship between the number of
groups and amount of credit demanded by farm households. The more community and self-help
groups a household has subscribed to, the more likely that the amount borrowed will increase. If
a household joins an extra one group the amount borrowed is likely to increase by Ksh.33,
607.91. Laffont and N‟Guessan, (2000) observed that knowledge of each other among
57
smallholder farmers in groups overcome information asymmetry problem in credit financial
markets, particularly in remote rural communities. Darie, (2012) in Uganda found out that
groups provided social capital needed by smallholder farmers to access farm credit.
58
CHAPTER FIVE: CONCLUSION AND RECOMMENDATIONS
According to Gabre-Madhin, et al., (2003) credit has been increasingly accepted as a vital
instrument that help the poor rural households to escape the fangs of poverty as it helps enhance
productivity through accumulating production assets. Despite its importance, access to credit still
remains a challenge especially to the rural poor smallholder farmers. In the wake of climate
change and its impacts, there is need for farmers to adopt, diffuse, out scale and upscale smart
farming technologies in order to adapt and mitigate the impacts of climate change and
variability. Understanding the credit needs of the smallholder farmers is key as it will help
stakeholders design financial instruments to help them invest in these technologies, build and
increase capacity.
From the descriptive statistics it‟s evident that most of the credit comes from informal sources
and groups are the most important and preferred source of credit for the people of Nyando.
Although Nyando farmers have realized and understood the importance and benefits of climate
smart agriculture, a small percentage (15%) of these farmers are using loans to finance it. Among
the farm households involved in the study at least 50% of them borrowing for School expenses.
Agricultural credit is crucial is bettering rural agricultural productivity. As shown from the
model results flexible loan repayment terms, innovative use of collateral like groups shares,
wealth endowment, farmers groups and household savings are key positive significant factors
that influence demand for credit by smallholder rural farmers while primary occupation
(agriculture) has a negative effect on credit demand.
Use of group shares as collateral is commonly used to secure credit as most borrowing is from
community self-help groups. Access to formal credit seems limited and the choice of it not
59
preferred by many. The results confirms that smallholder‟s farmers might be credit constrained
or rationed as practicing agriculture as the main occupation shows a negative correlation with
credit demand.
Based on the above conclusions the study recommends that:
The government in collaboration with NGOs and other stakeholders should fast track the
implementation of the climate smart agriculture strategic plan (2017-2026) alongside
providing CSA tailored financing options to help adoption, up scaling and out scaling of
CSA.
The state and other stakeholders should consider using groups as a financing avenue as
they have shown high success rate thus a viable option for credit provision to the needy
poor farmers compared to set ups that crop up every time there is a government or NGO
credit package.
Financing and lending stakeholders (formal) need to consider simplifying lending
procedures and making loan repayments and collateral flexible enough to the reach of the
needy poor farmers and using the groups financing model to penetrate this section of the
population.
Groups provide social capital which act as collateral when accessing credit, and can be
used for technological transfer awareness. Thus if a government intends to penetrate rural
finance to the rural farmers they can do so by using groups as opposed to ad hoc-set ups
that normally mushroom when a finance package arise.
Farmers especially rural smallholder farmers practicing agriculture are more credit
constrained and prone to risks and losses as opposed to the other economic sectors, and

60
the state can help them by providing crop and livestock insurance facility through farmer
groups to cushion them against farming risks.
61
REFERENCES
Akudugu, M. A. (2012) Estimation of the determinants of credit demand by farmers and supply
by rural banks in Ghana's Upper East Region. Asian Journal of Agriculture and Rural
Development, 2(2), 189.
Atieno, R. (1997) Determinants of credit demand by smallholder farmers in Kenya: An
empirical analysis. Der Tropenlandwirt-Journal of Agriculture in the Tropics and
Subtropics, 98(1), 63-71.
Atieno, R. (2001). Formal and informal institutions‟ lending policies and access to credit by
small-scale enterprises in Kenya: An empirical assessment.
Gabre-Madhin, E. Z., Amha, W., Tafara, E., Schluter, J., Teshome, T., & Kilkile, G. (2003).
Getting markets right in Ethiopia: An institutional and legal analysis of grain and coffee
marketing. Addis Ababa.
Auma, D. & Mensah, A. (2014) Determinants of credit access and demand among small-holder
farmers in Tigray region, Ethiopia.
Rosegrant, M. W., Cai, X., & Cline, S. A. (2002). World water and food to 2025: dealing with
scarcity. Intl Food Policy Res Inst.
Awokuse, T. O., & Xie, R. (2015). Does agriculture really matter for economic growth in
developing countries?.Canadian Journal of Agricultural Economics/Revue Canadienne
d'agroeconomie, 63(1), 77-99.
Babcock, L. H. (2015). Mobile payments: How digital finance is transforming agriculture.
Blandon, J., Henson, S., & Islam, T. (2009). Marketing preferences of small‐scale
farmers in the context of new agrifood systems: a stated choice model.
Agribusiness: An International Journal, 25(2), 251-267.
Branca, G., McCarthy, N., Lipper, L., &Jolejole, M. C. (2011). Climate-smart agriculture: a
synthesis of empirical evidence of food security and mitigation benefits from improved
cropland management. Mitigation of climate change in agriculture series, 3, 1-42.
Bryan, E., Ringler, C., Okoba, B., Koo, J., Herrero, M., &Silvestri, S. (2013). Can agriculture
support climate change adaptation, greenhouse gas mitigation and rural livelihoods?
Insights from Kenya. Climatic Change, 118(2), 151-165.
62
Campbell, B. M., Thornton, P., Zougmoré, R., Van Asten, P., & Lipper, L. (2014). Sustainable
intensification: What is its role in climate-smart agriculture? Current Opinion in Environmental
Sustainability, 8, 39-43.
CGIAR. (2018). Photostory: Responding to climate-related risks to address food insecurity in
Nyando, Kenya. Retrieved from https://ccafs.cgiar.org/blog/photo-story-responding
climate-related-risks-address-food-insecurity-nyando-kenya#.WrUcd4q-NIU
Chandra, A., Dargusch, P., McNamara, K. E., Caspe, A. M., &Dalabajan, D. (2017). A study of
climate-smart farming practices and climate-resiliency field schools in Mindanao, the
Philippines. World Development, 98, 214-230.
CSAF. (2014). Theory of Change. Retrieved from https://www.csaf.net/impact/theory-of-change
Dethier, J. J. &Effenberger, A. (2012). Agriculture and Development: A brief review of the
literature. Economic Systems, 36(2), 175-205
Dorward, A., & Omamo, S. (2009). A Framework for Analyzing Institutions, In Dorward, A. R.
and S. W. Omamo (Eds). Institutional Perspective on Africa Agricultural Development
(75-110). International Food Policy Research Institute, Washington, D.C
Ferede, K. H. (2012). Determinants of Rural Households Demand for and Access to Credit in
Microfinance Institutions. Retrieved from edepotlink_i238245_001.pdf
Girma, M., &Abebaw, D. (2015, July). Determinants of Formal Credit Market Participation by
Rural Farm Households: Micro-level evidence from Ethiopia. In Paper for presentation
at the 13 th International Conference on the Ethiopian Economy. Ethiopian Economic
Association (EEA) Conference Centre, Addis Ababa, Ethiopia.
Grosjean, G., Monteils, F., Hamilton, S. D., Blaustein-Rejto, D., Gatto, M., Talsma, T.,& Bui,
Y. (2016). Increasing resilience to droughts in Viet Nam: The role of forests,
agroforestry, and climate-smart agriculture.
Gurmessa, N. E. (2016). The Role of a Credit Guarantee in Alleviating Credit Constraints among
Coffee Farmers‟ Cooperatives In Ethiopia. Retrieved from
http://uir.unisa.ac.za/bitstream/handle/10500/22454/thesis_negussie%20efa%20gurmess
.pdf?sequence=1&isAllowed=y
Gurmessa, N. E., &Ndinda, C. (2017) Smallholders‟ Access to and Demand for Credit and
Influencing Factors: Policy and Research Implications for Ethiopia.
63
Harvey, C. A., Chacón, M., Donatti, C. I., Garen, E., Hannah, L., Andrade, A., & Clement, C.
(2014). Climate‐smart landscapes: opportunities and challenges for integrating
adaptation and mitigation in tropical agriculture. Conservation Letters, 7(2), 77-90.
Hassan, R. M. (2010). Implications of climate change for agricultural sector performance in
Africa: policy challenges and research agenda. Journal of African Economies,
19(suppl_2), ii77-ii105.
Hengsdijk, H., Conijn, J. G., &Verhagen, A. (2015). Climate Smart Agriculture: Synthesis of
case studies in Ghana, Kenya and Zimbabwe (No. 624). Wageningen UR.
Hildenbrand, W. (2014). Market demand: Theory and empirical evidence (Vol. 215). Princeton
University Press.
Hossain, M. (1988). Credit for alleviation of rural poverty: The Grameen Bank in Bangladesh
(Vol. 65). Intl Food Policy Res Inst.
Jack, W., Kremer, M., De Laat, J., & Suri, T. (2016). Borrowing Requirements, Credit Access,
and Adverse Selection: Evidence from Kenya (No. w22686). National Bureau of
Economic Research.
Jianqiang, G., &Jianqiang, & Bing, Z. (2008). Factor Analysis on Farmer Loan Demand: Based
on Empirical Data From Jiangsu Province [J]. Chinese Agricultural Science Bulletin, 5,
106.
Kimani, J. G., &Ruigu, G. R. (2017). The Impact of Research and Development Investment on
Agricultural Sector Performance in Kenya. Journal of Agricultural Policy, 2(1), 34-
57.Kirman, A. (2006). Demand theory and general equilibrium: from explanation to
introspection, a journey down the wrong road. History of Political Economy,
38(Suppl_1), 246-280.
Lipper, L., Thornton, P., Campbell, B. M., Baedeker, T., Braimoh, A., Bwalya, M. & Hottle,
R. (2014). Climate-smart agriculture for food security. Nature Climate Change, 4(12),
1068.
McCarthy, N., Lipper, L., &Branca, G. (2011). Climate-smart agriculture: smallholder adoption
and implications for climate change adaptation and mitigation. Mitigation of Climate
Change in Agriculture Working Paper, 3, 1-37.
Meybeck, A. &Gitz, V. (2013). „Module 1: Why Climate-Smart Agriculture, Forestry and
Fisheries‟, in FAO, Climate-Smart Agriculture Sourcebook (2013).
64
Meyer, R. L. (2015). Financing agriculture and rural areas in sub-Saharan Africa: Progress,
challenges and the way forward.
Moscati, I. (2007). Early experiments in consumer demand theory: 1930-1970. History of
political economy, 39(3), 359.
Mpuga, P. (2010). Constraints in access to and demand for rural credit: Evidence from Uganda.
African Development Review, 22(1), 115-148.
Muayila, K. H., & Tollens, E. (2012). Assessing the impact of credit constraints on farm
household economic welfare in the hinterland of Kinshasa, democratic republic of
Congo. African Journal of Food, Agriculture, Nutrition and Development, 12(3), 6095
6109.
Muthinja, M. (2017). Why informal financial markets are here to stay. Retrieved from
https://www.businessdailyafrica.com/analysis/Why-informal-financial-markets-are-here
to-stay/539548-3937182-xmcwq2z/index.html
Njeru, T. N., Mano, Y., & Otsuka, K. (2015). Role of Access to Credit in Rice Production in
Sub-Saharan Africa: The Case of Mwea Irrigation Scheme in Kenya. Journal of African
Economies, 25(2), 300-321.
OECD-FAO Agricultural Outlook 2016-2025. (2016). Agriculture in Sub-Saharan Africa:
Prospects and challenges for the next decade. Retrieved from http://www.fao.org/3/a
BO092E.pdf
Omboi, B. M., &Wangai, P. N. (2011). Factors that influence the demand for credit for credit
among small-scale investors: A case study of Meru central district, Kenya.
Nwaru J.C. (2011) Determinants of Informal Credit Demand and Supply among Food Crop
Farmers in Akwa Ibom State, Nigeria. Journal of Rural and Community Development 6, 1
(2011) 129–139
Poulton, C., & Kanyinga, K. (2014). The politics of revitalizing agriculture in Kenya.
Development Policy Review, 32(s2).
Ramirez-Villegas, J., Lamanna, C., van Wijk, M., Corner-Dolloff, C., Rosenstock, T. S., &
Girvetz, E. H. (2016). Evidence and risk-based planning for a climate-smart agriculture.
Roberts, L. C. (2017). An analysis of determinants of access to and use of credit by smallholder
farmers in Suakoko District, Liberia.
65
Sarris, A. (2017). Financial Needs and Tools for Agricultural Development and Transformation
Pertinent to Low-Income and Low–Middle-Income Countries. In Food Security and
Sustainability (pp. 101-120). Palgrave Macmillan, Cham.
Schaller, M., Barth, E., Blies, D., Röhrig, F., &Schümmelfeder, M. (2017). Climate Smart
Agriculture (CSA): Conservation Agriculture (CA).
Swain, R. B. (2007). The demand and supply of credit for households. Applied Economics
39(21), 2681-2692.
Yawson, D. O., Armah, F. A., Afrifa, E. K., & Dadzie, S. K. (2010). Ghana‟s fertilizer subsidy
policy: Early field lessons from farmers in the central region. Journal of sustainable
development in Africa, 12(3), 191-203.Chen, Ke Chen and Chiivakul, M. (2008). What
Drives Household Borrowing and Credit Constraints? Evidence from Bosnia and Herzegovina.
New York.
Jorgenson, D. (1967). The Theory of Investment Behaviour. Business (Vol. I, pp. 129-188).
Mpuga, P. (2004, March). Demand for credit in rural Uganda: Who cares for the peasants? In A
paper presented at the conference on growth, poverty reduction and human development
in Africa. Centre for the Studies of African Economies.
Soman, D., & Cheema, A. (2002). The Effect of Credit on Spending Decisions: The Role of the
Credit Limit and Credibility. Marketing Science, 21(1), 32-53.
doi:10.1287/mksc.21.1.32.155
Ojoko, E. A., Akinwunmi, J. A., Yusuf, S. A., & Oni, O. A. (2017). Factors influencing the level
of use of Climate-Smart Agricultural Practices (CSAPs) in Sokoto state, Nigeria. Journal
of Agricultural Sciences, 62(3), 315-327.
Gujarati D. (2004) Basic Econometrics, 4th Editions; McGraw-HILL/Irwin, New York
Cooper, P.J.M., Dimes, J., Rao, K.P.C., Shapiro, B., Shiferaw, B. and Twomlow, S. (2008). Copi
ng better with current climatic variability in the rain-fed farming systems of sub-Saharan
Africa: An essential first step in adapting to future climate change? Agriculture,
Ecosysems and Environment 126: 24–35.
Kabubo-Mariara, J., & Karanja, F. K. (2007). The economic impact of climate change on Kenyan
crop agriculture: A Ricardian approach. The World Bank.
66
OECD/FAO (2016), “Agriculture in Sub-Saharan Africa: Prospects and challenges for the next
decade”, in OECD-FAO Agricultural Outlook 2016-2025, OECD Publishing, Paris
Cochran, W., (1963). “Sampling Techniques”. 2nd Ed., New York: John Wiley and Sons, Inc.
Kabubo-Mariara, J., & Karanja, F. K. (2007). The economic impact of climate change on Kenyan
crop agriculture: A Ricardian approach. The World Bank.
Schmidt, R. H., Kropp, E., &Weires, E. (1987). Rural finance. Guiding principles. GTZ
Wiboonpongse, A., Sriboonchitta, S., &Chaovanapoonphol, Y. (2006). The Demand for Loans
for Major Rice in the Upper North of Thailand (No. 1004-2016-78883).
Lawal, W. A., &Abdullahi, I. B. (2011). Impact of informal agricultural financing on agricultural
production in the rural economy of Kwara State, Nigeria. International Journal of
Business and Social Science, 2(19), 241-248.
Chisasa, J. (2016). Determinants of the demand for credit by smallholder farmers: survey results
from South Africa. International Journal of Economic Policy in Emerging
Economies, 9(1), 26-46.
World Bank; CIAT. (2015). Climate-Smart Agriculture in Kenya. CSA Country Profiles for
Africa, Asia, and Latin America and the Caribbean Series. Washington D.C.: The World
Bank Group.
Kofarmata, Y. I., Applanaidu, S. D., & Hassan, S. (2016). Determinants of demand for credit: A
conceptual review. Asian Journal of Economics and Empirical Research, 3(1), 6-10.
Carroll, J., McCarthy, S., & Newman, C. (2005). An econometric analysis of charitable
donations in the Republic of Ireland. Vol. XX, No. XX, Issue, Year.
Kefyalew, G., &Jembere, T. (2016). PART FIVE: BUSINESS AND
ECONOMICS. WolaitaSodo University May 12-13, 2016, 272.
Getachew, M., & Nego, J. (2016). PART ONE: AGRICULTURE, ENVIRONMENT AND
NATURAL RESOURCES. Wolaita Sodo University May 12-13, 2016, 6.
Kiplimo, J. C., Ngenoh, E., Koech, W., & Bett, J. K. (2015). Determinants of Access to Credit
Financial Services by Smallholder Farmers in Kenya. Journal of Development and
Agricultural Economics, 7(9), 303-313.
Crook, J. (2001). The demand for household debt in the USA: evidence from the 1995 Survey of
Consumer Finance. Applied Financial Economics, 11(1), 83-91.
67
Duca, J. V., & Rosenthal, S. S. (1993). Borrowing constraints, household debt, and racial
discrimination in loan markets. Journal of Financial intermediation, 3(1), 77-103.
Iyanda, J. O., Afolami, C. A., Obayelu, A. E., & Ladebo, O. J. (2014). Social capital and access
to credit among cassava farming households in Ogun State, Nigeria. Journal of
Agriculture and Environmental Sciences, 3(2), 175-196.
Akudugu, M. A., Guo, E., & Dadzie, S. K. (2012). Adoption of modern agricultural production
technologies by farm households in Ghana: What factors influence their decisions?
Verbeek, M. (2004). Models with Limited Dependent Variables. A guide to modern
econometrics, 189-254.