delineation of rice cropping systems in the mekong delta river using multitemporal ers-sar
TRANSCRIPT
RICE CROPPING SYSTEMS IN MEKONG DELTA... http://www.crisp.nus.edu.sg/~research/research/forest...
1 of 9 10-Oct-03 12:55 PM
Delineation of Rice Cropping Systems in the Mekong River Delta using Multitemporal ERS Synthetic ApertureRadar
Soo Chin LIEW(a)
Suan Pheng
KAM(b)
To-Phuc TUONG(b)
Ping CHEN(a)
Vo-Quang MINH(c)
Laarni
BALABABA(d)
Hock LIM(a)
(a)Centre for Remote Imaging, Sensing and Processing, National University of Singapore,Lower Kent Ridge Road, Singapore 119260 Tel: (+65) 7723220, Fax: (+65) 7757717Email: [email protected], http://www.crisp.nus.edu.sg
(b)International Rice Research Institute, P.O. Box 933, 1099 Manila, Philippines Email: [email protected], http://www.cgiar.org/irri/
(c)Department of Soil Science, Faculty of Agriculture, University of Can Tho, Can Tho,Vietnam
(d)Natural Resources Program, Asian Institute of Technology, Bangkok, Thailand
Abstract
The aim of this study is to use multitemporal ERS-2 satellite synthetic aperture radar (SAR) images indelineating and mapping areas under different rice cropping systems in the Mekong river delta, Vietnam.Five change index maps were generated from the six images acquired between June and December, 1996.Using a 3-dB threshold, the pixels in each change index map were classified into one of three classes:increasing, decreasing or constant backscattering. The five change index maps were used to generate acomposite map with 243 possible change classes. After discarding the minority classes, and merging thedominant classes with similar backscatter time series, the thematic classes of rice cropping systems practicedin the study area were delineated.
Keywords: multitemporal, synthetic aperture radar, rice, Mekong delta, agriculture
Introduction
Rice cultivation in the Mekong river delta is largely governed by hydrology, rainfall pattern and the availability ofirrigation. Given the diversity of the cropping systems, it would be very difficult, if not impossible, to discriminate theareas under different planting systems using one single-date image. Multi-temporal images are required to monitor thespatial and temporal growth patterns of the rice crops and subsequently to identify the cropping systems practiced at aparticular region. Multispectral visible/near infrared images such as those from the SPOT or LANDSAT satellites could beused for this purpose. Unfortunately, a large part of the rice growing season coincides with the rainy period resulting inlimited availability of cloud-free images throughout the growing season. The use of cloud penetrating SAR wouldovercome this problem.
The objective of this study is to use multi-temporal ERS-2 SAR data to delineate and map the spatial distribution of thevarious rice cropping systems in the Mekong River Delta. The study was confined within a 100 km by 100 km area coveredby one ERS-2 SAR scene, (track 75, frame 3411 shifted 30%) which includes parts of Soc Trang and Bac Lieu provincesin the Mekong river delta, Vietnam (see Fig. 1 and inset for the location map).
Rice Cropping Systems in the Mekong Delta
There are three main rice seasons in the Mekong river delta (see Table 1). Two of the seasons (HT and M) coincide with the rainy season which typically starts in May and lasts until November. The annual rainfall in the study area varies from1600 to 2000 mm. The three rice seasons, in various combinations governed by hydrology, rainfall pattern and availabilityof irrigation, constitute the variety of rice-based cropping systems practiced in the Mekong river delta [1].
The major rice cropping systems in this area are the single rice crop (SC), double rice crop (DC) and triple rice crop (TC)systems (see Table 2). The single rice crop is invariably the Mua (M), which has traditionally been the rainfed ricecropping system using local, traditional varieties with a longer growth period. It is practiced mainly in the tidally-inundatedcoastal area subjected to salinity intrusion prior to the rainy season. The double cropping system may be the Dong Xuan-He
RICE CROPPING SYSTEMS IN MEKONG DELTA... http://www.crisp.nus.edu.sg/~research/research/forest...
2 of 9 10-Oct-03 12:55 PM
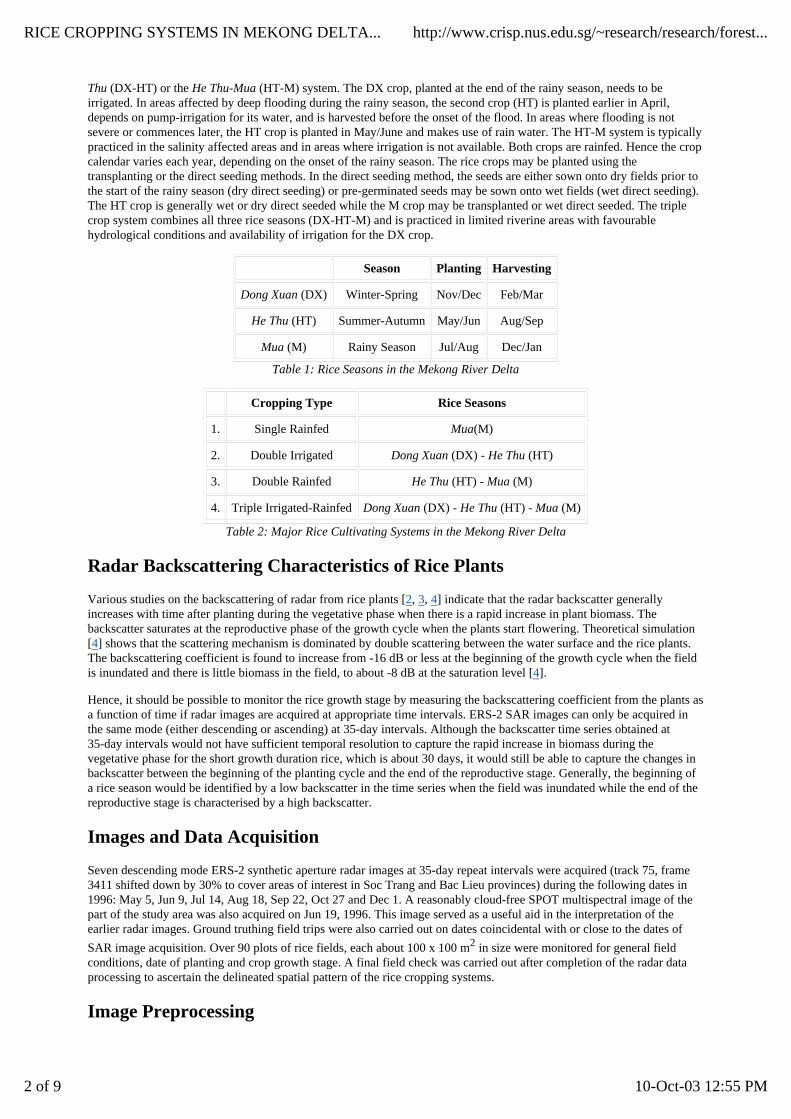
Thu (DX-HT) or the He Thu-Mua (HT-M) system. The DX crop, planted at the end of the rainy season, needs to beirrigated. In areas affected by deep flooding during the rainy season, the second crop (HT) is planted earlier in April,depends on pump-irrigation for its water, and is harvested before the onset of the flood. In areas where flooding is notsevere or commences later, the HT crop is planted in May/June and makes use of rain water. The HT-M system is typicallypracticed in the salinity affected areas and in areas where irrigation is not available. Both crops are rainfed. Hence the cropcalendar varies each year, depending on the onset of the rainy season. The rice crops may be planted using thetransplanting or the direct seeding methods. In the direct seeding method, the seeds are either sown onto dry fields prior tothe start of the rainy season (dry direct seeding) or pre-germinated seeds may be sown onto wet fields (wet direct seeding).The HT crop is generally wet or dry direct seeded while the M crop may be transplanted or wet direct seeded. The triplecrop system combines all three rice seasons (DX-HT-M) and is practiced in limited riverine areas with favourablehydrological conditions and availability of irrigation for the DX crop.
Table 1: Rice Seasons in the Mekong River Delta
Season Planting Harvesting
Dong Xuan (DX) Winter-Spring Nov/Dec Feb/Mar
He Thu (HT) Summer-Autumn May/Jun Aug/Sep
Mua (M) Rainy Season Jul/Aug Dec/Jan
Table 2: Major Rice Cultivating Systems in the Mekong River Delta
Cropping Type Rice Seasons
1. Single Rainfed Mua(M)
2. Double Irrigated Dong Xuan (DX) - He Thu (HT)
3. Double Rainfed He Thu (HT) - Mua (M)
4. Triple Irrigated-Rainfed Dong Xuan (DX) - He Thu (HT) - Mua (M)
Radar Backscattering Characteristics of Rice Plants
Various studies on the backscattering of radar from rice plants [2, 3, 4] indicate that the radar backscatter generallyincreases with time after planting during the vegetative phase when there is a rapid increase in plant biomass. Thebackscatter saturates at the reproductive phase of the growth cycle when the plants start flowering. Theoretical simulation[4] shows that the scattering mechanism is dominated by double scattering between the water surface and the rice plants.The backscattering coefficient is found to increase from -16 dB or less at the beginning of the growth cycle when the fieldis inundated and there is little biomass in the field, to about -8 dB at the saturation level [4].
Hence, it should be possible to monitor the rice growth stage by measuring the backscattering coefficient from the plants asa function of time if radar images are acquired at appropriate time intervals. ERS-2 SAR images can only be acquired inthe same mode (either descending or ascending) at 35-day intervals. Although the backscatter time series obtained at35-day intervals would not have sufficient temporal resolution to capture the rapid increase in biomass during thevegetative phase for the short growth duration rice, which is about 30 days, it would still be able to capture the changes inbackscatter between the beginning of the planting cycle and the end of the reproductive stage. Generally, the beginning ofa rice season would be identified by a low backscatter in the time series when the field was inundated while the end of thereproductive stage is characterised by a high backscatter.
Images and Data Acquisition
Seven descending mode ERS-2 synthetic aperture radar images at 35-day repeat intervals were acquired (track 75, frame3411 shifted down by 30% to cover areas of interest in Soc Trang and Bac Lieu provinces) during the following dates in1996: May 5, Jun 9, Jul 14, Aug 18, Sep 22, Oct 27 and Dec 1. A reasonably cloud-free SPOT multispectral image of thepart of the study area was also acquired on Jun 19, 1996. This image served as a useful aid in the interpretation of theearlier radar images. Ground truthing field trips were also carried out on dates coincidental with or close to the dates of
SAR image acquisition. Over 90 plots of rice fields, each about 100 x 100 m2 in size were monitored for general fieldconditions, date of planting and crop growth stage. A final field check was carried out after completion of the radar dataprocessing to ascertain the delineated spatial pattern of the rice cropping systems.
Image Preprocessing
RICE CROPPING SYSTEMS IN MEKONG DELTA... http://www.crisp.nus.edu.sg/~research/research/forest...
3 of 9 10-Oct-03 12:55 PM
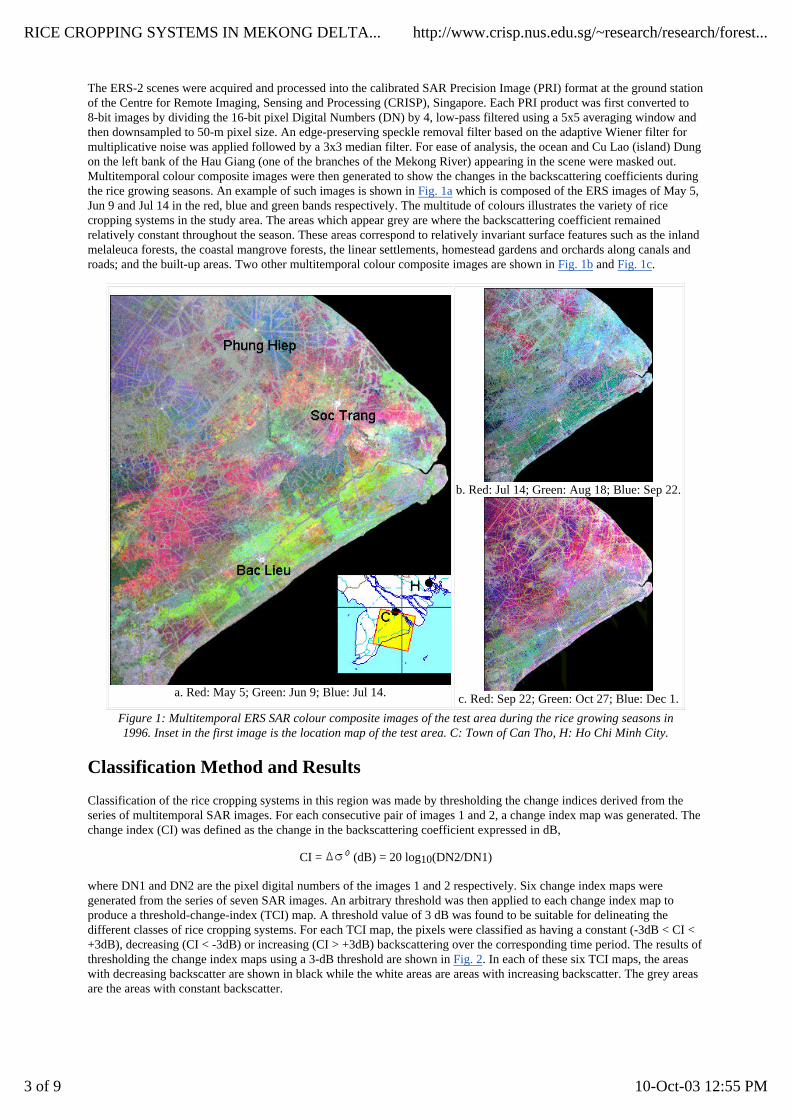
The ERS-2 scenes were acquired and processed into the calibrated SAR Precision Image (PRI) format at the ground stationof the Centre for Remote Imaging, Sensing and Processing (CRISP), Singapore. Each PRI product was first converted to8-bit images by dividing the 16-bit pixel Digital Numbers (DN) by 4, low-pass filtered using a 5x5 averaging window andthen downsampled to 50-m pixel size. An edge-preserving speckle removal filter based on the adaptive Wiener filter formultiplicative noise was applied followed by a 3x3 median filter. For ease of analysis, the ocean and Cu Lao (island) Dungon the left bank of the Hau Giang (one of the branches of the Mekong River) appearing in the scene were masked out.Multitemporal colour composite images were then generated to show the changes in the backscattering coefficients duringthe rice growing seasons. An example of such images is shown in Fig. 1a which is composed of the ERS images of May 5,Jun 9 and Jul 14 in the red, blue and green bands respectively. The multitude of colours illustrates the variety of ricecropping systems in the study area. The areas which appear grey are where the backscattering coefficient remainedrelatively constant throughout the season. These areas correspond to relatively invariant surface features such as the inlandmelaleuca forests, the coastal mangrove forests, the linear settlements, homestead gardens and orchards along canals androads; and the built-up areas. Two other multitemporal colour composite images are shown in Fig. 1b and Fig. 1c.
Figure 1: Multitemporal ERS SAR colour composite images of the test area during the rice growing seasons in1996. Inset in the first image is the location map of the test area. C: Town of Can Tho, H: Ho Chi Minh City.
a. Red: May 5; Green: Jun 9; Blue: Jul 14.
b. Red: Jul 14; Green: Aug 18; Blue: Sep 22.
c. Red: Sep 22; Green: Oct 27; Blue: Dec 1.
Classification Method and Results
Classification of the rice cropping systems in this region was made by thresholding the change indices derived from theseries of multitemporal SAR images. For each consecutive pair of images 1 and 2, a change index map was generated. Thechange index (CI) was defined as the change in the backscattering coefficient expressed in dB,
CI = (dB) = 20 log10(DN2/DN1)
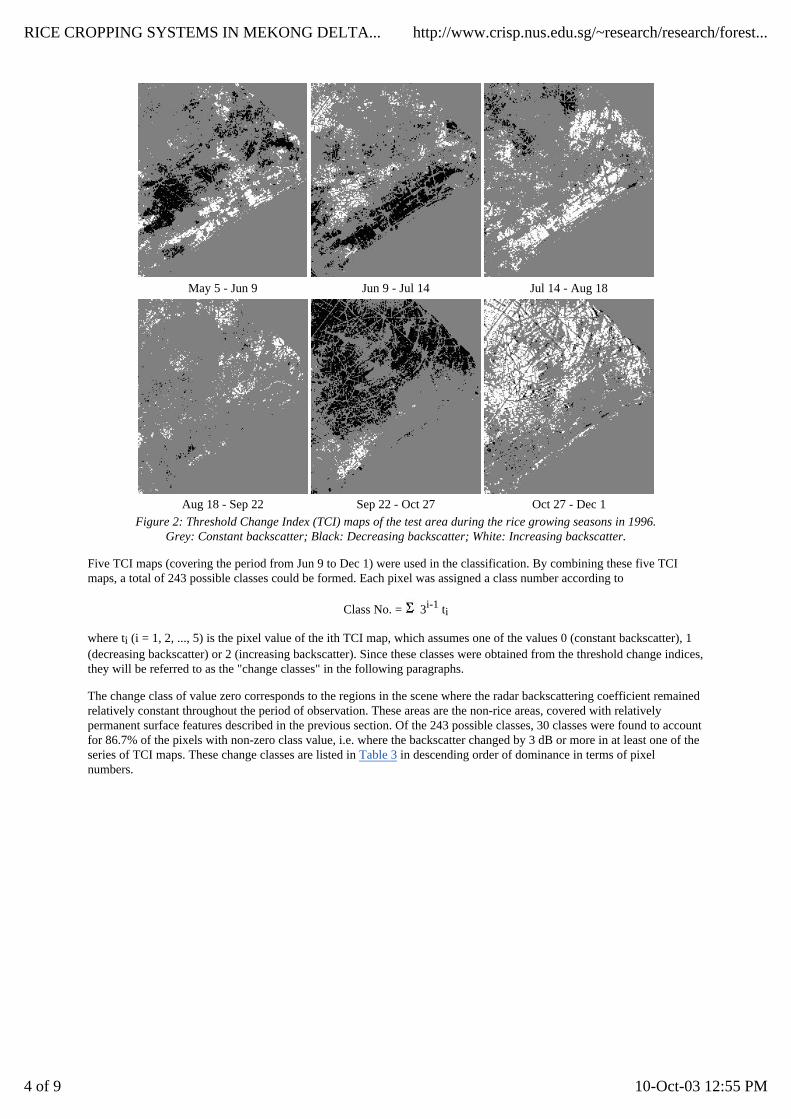
where DN1 and DN2 are the pixel digital numbers of the images 1 and 2 respectively. Six change index maps weregenerated from the series of seven SAR images. An arbitrary threshold was then applied to each change index map toproduce a threshold-change-index (TCI) map. A threshold value of 3 dB was found to be suitable for delineating thedifferent classes of rice cropping systems. For each TCI map, the pixels were classified as having a constant (-3dB < CI <+3dB), decreasing (CI < -3dB) or increasing (CI > +3dB) backscattering over the corresponding time period. The results ofthresholding the change index maps using a 3-dB threshold are shown in Fig. 2. In each of these six TCI maps, the areaswith decreasing backscatter are shown in black while the white areas are areas with increasing backscatter. The grey areasare the areas with constant backscatter.
RICE CROPPING SYSTEMS IN MEKONG DELTA... http://www.crisp.nus.edu.sg/~research/research/forest...
4 of 9 10-Oct-03 12:55 PM
Figure 2: Threshold Change Index (TCI) maps of the test area during the rice growing seasons in 1996.Grey: Constant backscatter; Black: Decreasing backscatter; White: Increasing backscatter.
May 5 - Jun 9 Jun 9 - Jul 14 Jul 14 - Aug 18
Aug 18 - Sep 22 Sep 22 - Oct 27 Oct 27 - Dec 1
Five TCI maps (covering the period from Jun 9 to Dec 1) were used in the classification. By combining these five TCImaps, a total of 243 possible classes could be formed. Each pixel was assigned a class number according to
Class No. = 3i-1 ti
where ti (i = 1, 2, ..., 5) is the pixel value of the ith TCI map, which assumes one of the values 0 (constant backscatter), 1(decreasing backscatter) or 2 (increasing backscatter). Since these classes were obtained from the threshold change indices,they will be referred to as the "change classes" in the following paragraphs.
The change class of value zero corresponds to the regions in the scene where the radar backscattering coefficient remainedrelatively constant throughout the period of observation. These areas are the non-rice areas, covered with relativelypermanent surface features described in the previous section. Of the 243 possible classes, 30 classes were found to accountfor 86.7% of the pixels with non-zero class value, i.e. where the backscatter changed by 3 dB or more in at least one of theseries of TCI maps. These change classes are listed in Table 3 in descending order of dominance in terms of pixelnumbers.

RICE CROPPING SYSTEMS IN MEKONG DELTA... http://www.crisp.nus.edu.sg/~research/research/forest...
5 of 9 10-Oct-03 12:55 PM
Table 3: Change classes derived from five TCI maps
Class Number Cumulative Frequency
189 15.8
7 25.5
27 32.2
191 38.5
81 44.7
162 49.4
195 53.7
6 57.2
1 60.6
207 63.0
196 65.0
2 67.0
18 68.8
33 70.5
212 72.1
29 73.6
45 75.1
210 76.5
169 77.5
194 78.6
54 79.5
61 80.4
209 81.3
192 82.1
163 83.0
21 83.8
190 84.5
19 85.3
208 86.0
164 86.7
A number of change classes were associated with and merged into a thematic class of rice cropping system on the basis ofsimilarity in their time series of radar backscattering ( in dB) as well as their geographical distribution pattern. Fieldknowledge about the type of rice cropping system that might be practiced in a particular geographical region was alsoconsidered when assigning the thematic classes. Of the 30 dominant change classes, 24 could be assigned to the majorthematic classes of rice cropping systems. Six change classes remained unclassified. They were very likely the non-riceclasses. The backscatter time series of the dominant change classes were grouped and graphed for the major thematic
RICE CROPPING SYSTEMS IN MEKONG DELTA... http://www.crisp.nus.edu.sg/~research/research/forest...
6 of 9 10-Oct-03 12:55 PM
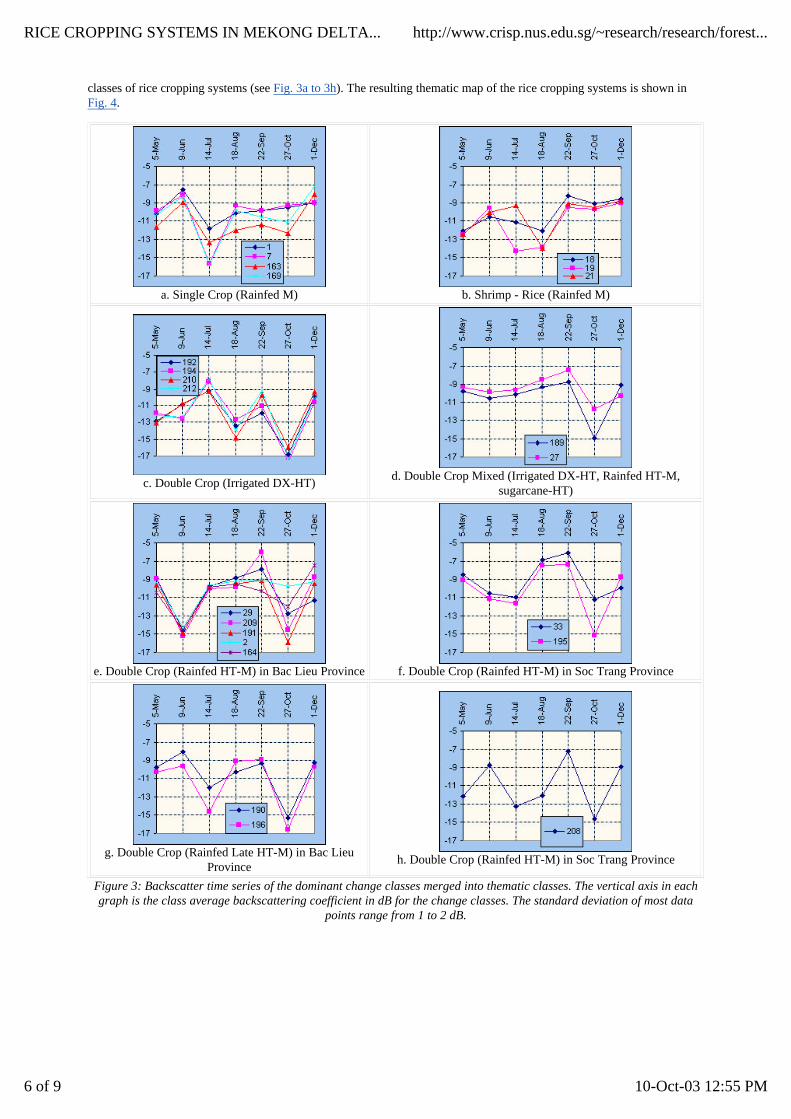
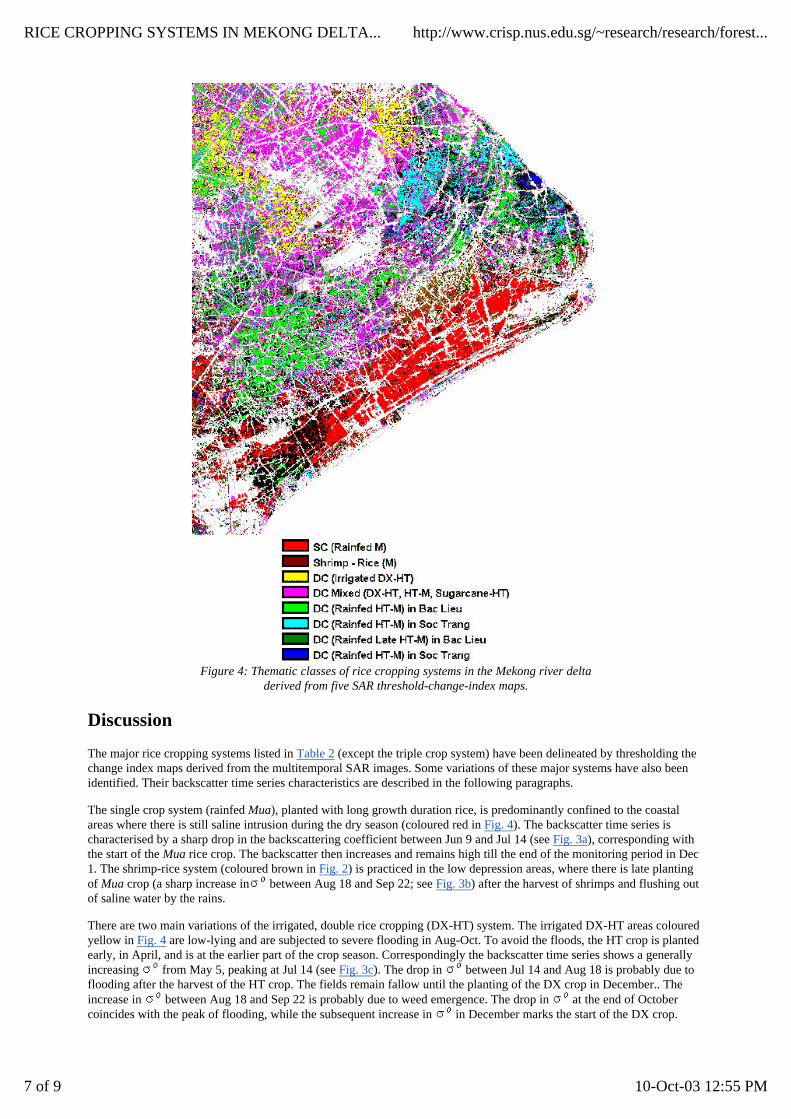
classes of rice cropping systems (see Fig. 3a to 3h). The resulting thematic map of the rice cropping systems is shown inFig. 4.
Figure 3: Backscatter time series of the dominant change classes merged into thematic classes. The vertical axis in eachgraph is the class average backscattering coefficient in dB for the change classes. The standard deviation of most data
points range from 1 to 2 dB.
a. Single Crop (Rainfed M) b. Shrimp - Rice (Rainfed M)
c. Double Crop (Irrigated DX-HT)d. Double Crop Mixed (Irrigated DX-HT, Rainfed HT-M,
sugarcane-HT)
e. Double Crop (Rainfed HT-M) in Bac Lieu Province f. Double Crop (Rainfed HT-M) in Soc Trang Province
g. Double Crop (Rainfed Late HT-M) in Bac LieuProvince
h. Double Crop (Rainfed HT-M) in Soc Trang Province
RICE CROPPING SYSTEMS IN MEKONG DELTA... http://www.crisp.nus.edu.sg/~research/research/forest...
7 of 9 10-Oct-03 12:55 PM
Figure 4: Thematic classes of rice cropping systems in the Mekong river deltaderived from five SAR threshold-change-index maps.
Discussion
The major rice cropping systems listed in Table 2 (except the triple crop system) have been delineated by thresholding thechange index maps derived from the multitemporal SAR images. Some variations of these major systems have also beenidentified. Their backscatter time series characteristics are described in the following paragraphs.
The single crop system (rainfed Mua), planted with long growth duration rice, is predominantly confined to the coastalareas where there is still saline intrusion during the dry season (coloured red in Fig. 4). The backscatter time series is characterised by a sharp drop in the backscattering coefficient between Jun 9 and Jul 14 (see Fig. 3a), corresponding with the start of the Mua rice crop. The backscatter then increases and remains high till the end of the monitoring period in Dec1. The shrimp-rice system (coloured brown in Fig. 2) is practiced in the low depression areas, where there is late plantingof Mua crop (a sharp increase in between Aug 18 and Sep 22; see Fig. 3b) after the harvest of shrimps and flushing outof saline water by the rains.
There are two main variations of the irrigated, double rice cropping (DX-HT) system. The irrigated DX-HT areas colouredyellow in Fig. 4 are low-lying and are subjected to severe flooding in Aug-Oct. To avoid the floods, the HT crop is plantedearly, in April, and is at the earlier part of the crop season. Correspondingly the backscatter time series shows a generallyincreasing from May 5, peaking at Jul 14 (see Fig. 3c). The drop in between Jul 14 and Aug 18 is probably due to flooding after the harvest of the HT crop. The fields remain fallow until the planting of the DX crop in December.. Theincrease in between Aug 18 and Sep 22 is probably due to weed emergence. The drop in at the end of Octobercoincides with the peak of flooding, while the subsequent increase in in December marks the start of the DX crop.
RICE CROPPING SYSTEMS IN MEKONG DELTA... http://www.crisp.nus.edu.sg/~research/research/forest...
8 of 9 10-Oct-03 12:55 PM
The backscatter time series for the area coloured magenta in Fig. 4 is characterised by a distinct drop in on Oct 27, followed by a steep increase in backscatter (see Fig. 3d). The earlier part of the profile shows a slight drop in on Jun 9, followed by a gradual increase of radar backscatter, reaching a peak on Sep 22. This category is found predominantly inareas where the second variation of the irrigated DX-HT cropping system occurs. In these areas which are not so severelyaffected by flooding during the rainy season, the HT crop is planted later, in May/June, to take advantage of the rains. Theincreasing from July to September indicates the HT crop in the fields. The drop in on Oct 27 may be due to thepeak floods. It was also noted that in the irrigated area, the class number 27 (the backscatter series of which is included inFig. 3d) occurs mainly in the periphery of the rice areas, just behind the linear settlements and associated homesteadorchards and miscellaneous planting. Field investigation and interviews with the local residents reveal that these locationsare associated with the sugarcane-rice (HT) cropping system.
The magenta-coloured pixels (Fig. 4) also occur scattered in the rainfed areas, with some concentrations along the mainroad leading from Soc Trang to Bac Lieu. Ground observations indicate that the rainfed HT-M system is practiced in someparts of this area, where the dry direct-seeded HT crop is planted between May/June and Aug/Sep, followed by the Muacrop in Oct. Because of the similar crop calendar of the HT crop for both the irrigated DX-HT and the rainfed HT-Mcropping systems, it is coincidental that these two systems exhibit similar characteristics in their backscatter time series.For the HT-M system, the increase in backscatter between Oct 27 and Dec 1 is probably due to the Mua crop, while in thecase of the DX-HT system, the increase could be due to weed emergence. This backscatter time series probably alsoreflects the sugarcane-HT rice cropping system mentioned above.
Four other variations of the double cropping rainfed HT-M systems which exhibit distinctive backscatter time series can beidentified. The system practiced mainly in the Bac Lieu province (coloured light green in Fig. 4) is characterised by two distinct drops in the backscatter time series, i.e. on Jun 9 and Oct 27 (see Fig. 3e). In these areas which are lower-lying, thefields are flooded in June, hence the corresponding drop in in the Jun 9 scene. The wet field conditions allow for wetdirect seeding of the HT crop. The increase in after October corresponds with the Mua crop. The bright green pixels which appear within the irrigated DX-HT magenta area west of Phung Hiep correspond with swampy areas which are notcultivated. It is also coincidental that the backscatter time profile of this swampy area resembles that of the wet directseeded HT-M cropping system.
On the other hand in most of Soc Trang province which is on relatively higher ground (coloured cyan in Fig. 4), there is no distinct dip in in the backscatter time series (see Fig.3f); there was no early season inundation of the rice fields. TheHT crop is mainly dry direct seeded, hence the corresponding increase in backscatter between Jul 14 and Aug 18.. As is thecase of the light green areas, the increase in after October corresponds with the Mua crop.
In the more inland region of Bac Lieu province (coloured dark green in Fig. 4), the HT-M system is characterised by twodips in the backscatter time series on Jul 14 (late HT) and Oct 27 (Fig. 3g). Roughly east of Soc Trang town, close to the Hua Giang river, is a small but rather homogeneous area coloured dark blue (Fig. 4) which has a distinctive backscatter time series (see Fig. 3h). The cropping system in this area is similar to that of the cyan-coloured area of Soc Trangprovince. However as this area can be subjected to tidal inundation, the backscatter profile could be altered.
The triple crop system has not been identified. Since this system is not commonly practiced, it is most probably includedunder the minority classes not considered in this study.
Conclusions
In conclusion, the dominant rice cultivating systems practiced in the study area have been delineated in this study bythresholding the change index maps derived from multitemporal SAR images followed by human interpretation of theradar backscatter time series. The thresholding process produces 243 possible change classes characterised by their uniquesignature of radar backscatter time series. The dominant change classes are merged into one of the several thematic classesof rice cropping systems based on their similarity in the backscatter time series and their geographical distribution.However, ambiguity still exists in assigning some change classes to their respective thematic classes. For example, one ofthe rainfed HT-M systems has similar radar backscatter time series as the irrigated DX-HT system, and possibly with arice-nonrice cropping system. An acquisition in April or sometime during the peak of the DX crop is probably needed toresolve this ambiguity. Use of ascending mode images may help to increase the temporal resolution of the backscatter timeseries. However, mixing the two modes of acquisition may complicate the interpretation of the backscatter time series dueto the different orientations of the ground with respect to the SAR line of sight.
References
T.P. Tuong, C.T. Hoanh and N.T. Khiem. 1991. Agro-hydrological factors as land qualities in land evaluation forrice cropping patterns in the Mekong Delta of Vietnam, in P. Deturck and F.N. Ponnamperuma (eds.) Rice Production on Acid Soils of the Tropics. Institute of Fundamental Studies, Kandy, Sri Lanka.
1.
T. Le Toan, H. Laur, E. Mougin, and A. Lopes, 1989. Multitemporal and dual-polarization observations of 2.
RICE CROPPING SYSTEMS IN MEKONG DELTA... http://www.crisp.nus.edu.sg/~research/research/forest...
9 of 9 10-Oct-03 12:55 PM
agricultural vegetation covers by X-band SAR images. IEEE Trans. Geosci. Remote Sensing, 27, pp. 709-717.
T. Kurosu, M. Fujita, and K. Chiba, 1995. Monitoring of rice crop growth from space using ERS-1 C-band SAR. IEEE Trans. Geosci. Remote Sensing, 33, pp. 1092-1096.
3.
T. Le Toan, F. Ribbes, L.-F. Wang, N. Floury, K.-H. Ding, J. A. Kong, M. Fujita, and T. Kurosu, 1997. Rice crop mapping and monitoring using ERS-1 data based on experiment and modeling results. IEEE Trans. Geosci. Remote Sensing, 35, pp. 41-56.
4.