wheat outlook: december - usda ers
TRANSCRIPT

The U.S. 2016/17 all-wheat supply and demand estimates are unchanged this month. The season average price remains at $3.70 per bushel, with the range narrowed from 40 cents to 20 cents. Several key USDA National Agricultural Statistics Service reports are due out next month and include Grain Stocks, Winter Wheat and Canola Seedings, as well as final estimates of 2016/17 production figures.
A sharp increase in wheat supplies in Australia is expected to intensify the competition facing U.S. exports during the latter part of 2016/17. Despite strong export commitments, U.S. wheat export prospects are unchanged, reflecting increased competitor supplies and the slowing pace of sales. With global consumption projected only slightly higher, global ending stocks rise, putting additional downward pressure on wheat prices.
Wheat Outlook
Jennifer Bond [email protected] Olga Liefert [email protected]
U.S. Balance Sheet Unchanged, World Production Raised on Gains in Australia
Economic Research Service
Situation and Outlook
WHS-16l
December 13, 2016
Wheat Chart Gallery will be updated on January 17, 2017.
The next release is January 17, 2017. -------------- Approved by the World Agricultural Outlook Board.

2016/17 U.S. Wheat Balance Sheet Unchanged from November
December is a quiet month for the U.S. wheat balance sheet. Ahead of the January release of USDA NASS’s Crop Production, Grain Stocks, and Winter Wheat and Canola Seedings reports, 2016/17 supply and use categories are unchanged. Slight adjustments to the by-class breakouts for imports and exports are made and are reflected in updated quarterly and annual projections. Based on current prices and wheat marketings to date, the season average farm price range is narrowed from 40 cents to 20 cents this month. The low and high end of the range are now $3.60 and $3.80 per bushel, respectively.
Winter Wheat
In January, USDA NASS will release the Crop Production 2016 Summary which will provide final wheat production estimates for the 2016/17 marketing year. NASS will also release its first official projections of winter wheat by class and desert Durum seeded area for 2017. Last year’s January Winter Wheat Seedings report (name now changed to Winter Wheat and Canola Seedings) indicated planted area was projected to decline by 7 percent from 2015. For 2017/18, another year-to-year reduction in winter wheat planted area is anticipated and underpins a year-over decline in the all-wheat planted area projection released in the USDA long-term agricultural projections, available here: http://www.usda.gov/oce/commodity/projections/index.htm. These early-released baseline projections peg all wheat at 48.5 million acres, down from 50.2 million acres in 2016. The 2016/17 planted area was itself down 4.8 million acres from the 2015/16 projection. Year-to-year declines are largely attributable to relatively low wheat prices, which are anticipated to persist through the 2017/18 marketing year before recovering some to $4.30 per bushel in 2018/19.
Prices for Hard Red Winter (HRW) wheat in the 2016/17 marketing year have been lower than the year prior and are reflective of below-average protein levels. Lower protein levels are often associated with high-yielding crops. Indeed, despite lower year-to-year planted and harvest area, HRW wheat production reached 1.082 billion bushels, more than 30 percent larger than 2015/16. Near ideal weather conditions greatly benefited the crop’s development and boosted HRW yields to record highs for the 2016/17 marketing year.
As the new winter wheat crop heads into dormancy, the proportion of the 2017 crop rated “good” to “excellent” is higher than at the same time in 2016 and above the 5-year average (figure 1). Crop ratings have been steady for several weeks, unlike the previous season when the proportion of the 2016 crop rated “good” to “excellent” rose steadily through the fall. In contrast to last year, much of the nation’s winter wheat production belt, which is concentrated in the nation’s midsection, has recently experienced dry conditions. The USDA Office of the Chief Economist estimates that approximately 27 percent of winter wheat production is within an area experiencing drought. Sections of the High Central Plains, have been particularly affected by dryness. Areas of drought and abnormal dryness are indicated on the USDA U.S Drought Monitor website: http://droughtmonitor.unl.edu/data/jpg/current/current_usdm.jpg
Domestic Outlook
2Wheat Outlook/WHS-16l/December 13, 2016
Economic Research Service, USDA

Based on the pace of trade to date, imports of Soft Red Winter (SRW) are raised 4 million bushels to 36 million. HRW and White wheat imports are unchanged this month and remain at 7 million and 8 million bushels respectively. HRW exports are raised 5 million bushels to 395 million, also based on the pace of trade to date. In November, U.S. Census Bureau data indicated a 288,693 metric ton shipment of U.S. HRW was destined for Morocco, with numerous smaller allotments to other countries contributing to HRW inspections of 725,902 metric tons. November inspections followed a strong showing in October, when 830,150 metric tons of HRW were inspected. In November 2015, just 431,725 metric tons of HRW were inspected ahead of export.
Spring Wheat and Durum
No production changes are made to Spring or Durum wheat this month. Slight adjustments to imports and exports are made and include a 2-million-bushel reduction to Hard Red Spring (HRS) and Durum imports, now projected at 40 and 34 million bushels, respectively. Reduced imports of Durum reflect the pace of trade and expectations of lower imports of Canadian Durum, stemming from quality issues related to vomitoxin contamination. HRS exports are unchanged at 295 million bushels, more than 40 million bushels higher than the 2015/16 figure. Durum exports are reduced by 5 million bushels to 25 million.
Season Average Farm Price Unchanged, Range Narrowed
The wheat season average price is unchanged this month and remains at $3.70 per bushel at the midpoint. The price range is narrowed from 40 cents to 20 cents and is $3.60 on the low end and $3.80 on the high end. USDA NASS monthly price data indicates that the current crop all-wheat price is closely following the 2015 price pattern. In October, strengthening HRS prices pulled the all-wheat price up as the HRW price remained level and near an average of $3.00 per bushel. Wide carrying charges in Kansas City wheat futures continue to support HRW holding; low cash prices have not provided a strong incentive to move wheat.
4547495153555759616365
10/23/2016 10/30/2016 11/6/2016 11/13/2016 11/20/2016 11/27/2016
Percent
2017 2016 5-year average
Source: USDA, National Agricultural Statistics Service Crop Progress weekly report and Economic Research Service calculations.
Figure 1: Winter wheat, percent of U.S. crop rated "good" to "excellent"
3Wheat Outlook/WHS-16l/December 13, 2016
Economic Research Service, USDA
Sharp Increase in Australia Boosts World Wheat Production This month, the world is projected to have much higher wheat production, leading to expanded wheat trade, higher consumption, and increased stocks. The changes are driven mainly by Australia, where a huge wheat output is expected, but are also supported by much lesser increases in projected production in China, the European Union, and Brazil. See table A for specific country changes and a brief discussion. Projections of Australian 2016/17 wheat production increased 4.7 million tons this month to reach 33.0 million, by far the largest wheat crop in the country’s history. Excellent weather conditions throughout the wheat-growing period underpin a sharp increase in projected wheat yields. The increase is based on the quantitative USDA analysis that uses several complimentary approaches and models to come up with the best yield estimate for each wheat-producing region of the country: Vegetation Health Index (VHI), which measures not only the density of vegetation but also accounts for temperature; Normalized Difference Vegetation Index (NDVI), which is used for remote sensing of vegetation for yield forecast; and a model based on the analysis of precipitation trends in analogue years. The analysis indicates that Australian wheat yields (as well as yields of all other winter crops, such as barley, oats, and canola) in all parts of the country fared extremely well in the current growing season, and are forecast at 2.54 tons per hectare, which is almost 20 percent above the last record of 2011/12. With this yield and a slightly higher wheat area (projected by the Australian Bureau of Agricultural Resource Economics and Sciences [ABARES] in its December report), the forecast for wheat output in the current 2016/17 year is at an all-time record level. The record size of the crop has been fully driven by the eastern states of the country, where precipitation was abundant, while mild temperatures prolonged the wheat growing season, boosting yields to a level never seen before. Even some flooding and water-logging in New South Wales (NSW) and Victoria (VC) appear not to have harmed the crops in any significant way. Recent dryness, which is excellent for maturation and harvesting, is expected to benefit the wheat quality. On the other hand, the major wheat-producing state, Western Australia (WA), is forecast to produce a good, but not exceptional, crop. And though wheat yields in WA are projected to be higher than average, they did not reach their full potential, as several untimely September frosts affected yield in a number of areas. Normally, WA produces on average (past 10 years) about 36 percent of Australia’s wheat, but its share of output this year is expected to fall to 29 percent. As Eastern Australia is on track to produce far beyond the previous record amount of winter crops, wheat being the most important among them, the quality of the crop is crucial for determining Australian export potential. It appears that wheat quality (its protein level) in the eastern states is much better than was expected, given that yields and the protein level of wheat usually are negatively correlated, and that this year wheat protein content was not lowered by the record yields. It is especially high in NSW, which is in line for producing 32 percent of Australian wheat this year. Anecdotal evidence attributes this fact to the additional nitrogen in the soil, both from applications and from the remainder from last year.
International Outlook
4 Wheat Outlook/WHS-16l/December 13, 2016
Economic Research Service, USDA

Country or region Crop year Production Change1 Comments
World 751.3 +6.5 A large increase in record-high world wheat production, up 15.8 million tons compared to previous record of 2015/16.
Foreign 688.4 +6.5 The same as above, as there are no changes in U.S. wheat production.
United States June-May 62.9 No change
Australia Oct-Sep 33.0 +4.7
Excellent weather conditions throughout wheat growing period underpin sharp increase in projected wheat yields. The increase is based on quantitative USDA analysis of Vegetation Health Index (VHI) and other models. With a slightly higher projected area (issued by the ABARES ) the forecasts for all winter crops in the current 2016/17 year are at a record level. See details above.
China July-June 128.9 +0.9The increase in wheat production matches the latest information released by the National Bureau of Statistics (NBS).
European Union July-June 144.0 +0.4At this point, the increase is a fine-tuning of the European wheat area and output. This month, small changes are made for Spain, Czech Republic, and Bulgaria.
Brazil Oct-Sep 6.7 +0.4The increase in wheat production matches the latest information released by CONAB (Companhia Nacional de Abastecimento) , the national food fupply agency.
Canada July-June 31.7 +0.2
The increase is based on the latest Statistics Canada survey that provides final production estimates for the current crop year, which indicated record yields despite snow that delayed harvesting in Alberta and Saskatchewan, and reduced harvested area.
1Change from previous month. Changes of less than 0.1 million tons are also made for several countries; see map A.Source: USDA, Foreign Agricultural Service, Production, Supply, and Distribution online database.
Million tons
Table A - Wheat production at a glance (2016/17), December 2016
5Wheat Outlook/WHS-16l/December 13, 2016
Economic Research Service, USDA

Map A – Wheat production changes for 2016/17, December 2016
Source: USDA, Foreign Agricultural Service, Production, Supply, and Distribution database. Global Wheat Consumption Projected Higher… World wheat domestic consumption for 2016/17 is forecast up 3.3 million tons this month to 739.8 million. Wheat feed and residual use is up 1.2 million tons to 148.1 million, while wheat food, seed, and industrial use is increased by 1.1 million tons. Abundant supplies of low-quality, competitively priced wheat encourage additional wheat feeding in wheat-producing countries, and an expansion of wheat consumption in a number of cost-conscious importing countries. At-a-glance information on this month’s changes in wheat domestic consumption is presented in table B.
6 Wheat Outlook/WHS-16l/December 13, 2016
Economic Research Service, USDA

Country or region
Domestic consumption Change1 Comments
World 739.8 +3.3 Includes both feed and residual use as well as food, seed, and industrial use (FSI).
Foreign 704.6 +3.3 The same as above, as there are no changes in U.S. wheat domestic use.
United States 35.2 No change
Australia 8.0 +0.5By definition, the category "feed and residual use" includes losses that are proportional to the size of crop. With a record-high wheat crop, Australian residual use is increased.
Brazil 11.3 +0.5 Additional supplies of low-quality wheat are expected to be used for feeding.
European Union 129.2 +0.5 Higher estimated wheat production; additional supplies of low-quality wheat that is expected to be used for feeding.
Vietnam 3.0 +0.3
With feed-quality wheat prices at historical lows, the country's pace of imports is high. Additional wheat from Australia and Europe is partly used for food, and partly to expand its wheat feeding for both animals and aquaculture. It is worth mentioning that the feed and residual use category by definition includes unaccounted for wheat sent to neighboring countries.
Canada 9.9 +0.2
Further increase in feed use in Canada is expected. Record-level precipitation and snow accumulation in Alberta and Saskatchewan is expected to reduce wheat quality and to make more wheat available for feeding.
Bangladesh 6.4 +0.2 Food use is up this month, reflecting a high pace of wheat imports, mainly from Russia, Ukraine, Canada, and Australia.
Indonesia 9.2 -0.1
Food use in Indonesia is projected higher by 0.3 million tons, while feed use is reduced by 0.4 million this month (with total consumption down slightly), as the government reportedly put a brake on issuing feed wheat import licenses to shift feeding towards domestically produced corn. Indonesia continues to import food grade wheat mainly from Australia. See "COUNTRY FOCUS: INDONESIA" in the text of feed grain outlook for December.
Table B - Wheat domestic consumption at a glance (2016/17), December 2016
Million tons
Source: USDA, Foreign Agricultural Service, Production, Supply, and Distribution online database.
1Change from previous month.
Note: Wheat food use is also raised 0.1 million tons, each, for Jordan and Nigeria based on higher imports.
7Wheat Outlook/WHS-16l/December 13, 2016
Economic Research Service, USDA

…And So Are Ending Stocks The projected expansion of world wheat supplies exceeds higher projected consumption, such that estimates for global ending stocks are up. Stocks are now projected to advance the record to 252.1 million tons, up 2.9 million. Multiple changes in stocks are made this month as a result of specific countries’ production and trade revisions. At-a-glance information for this month’s changes in wheat ending stocks is presented in map C. Map C – Wheat ending stocks’ changes for 2016/17, December 2016
Source: USDA, Foreign Agricultural Service, Production, Supply, and Distribution database. World Wheat Record Trade Continues To Rise Projected record world wheat trade for the international 2016/17 July-June trade year is further increased this month by 1.8 million tons, to 175.4 million. A substantial increase in projected wheat supplies puts further pressure on wheat prices. Wheat-importing countries are taking advantage of this opportunity to use more competitively priced, abundant supplies of lower-quality wheat. The countries in East and Southeast Asia are expected to benefit especially from proximity to ample Australian wheat supplies. Export prospects for 2016/17 are adjusted significantly for Australia, and less for other countries, to reflect supply shifts. Huge wheat supplies and declining prices in Australia boost its exports, up 2.5 million tons to 23.0 million (and up 3.5 million tons to 24.0 million for its local October-September marketing year), on par with its previous record of 2011/12. Russian exports are reduced 1.0 million tons to 29.0 million, as its pace of exports, though vigorous, does not support the level of exports projected before. See the narrative on Russia below.
8 Wheat Outlook/WHS-16l/December 13, 2016
Economic Research Service, USDA

COUNTRY FOCUS: RUSSIA
Russian Wheat Exports Reduced, Despite Record Domestic Harvest (Submitted by William Liefert, ERS/USDA)
In 2016/17, Russia is projected to have a total grain harvest of 118.8 million tons (together with pulses and buckwheat), including a record wheat crop of 72 million. However, USDA is lowering the country’s wheat exports this month from 30 to 29 million tons. One reason is that most other major wheat suppliers will also produce record-large crops, such as Australia, or higher-than-average harvests, such as the United States, Canada, Argentina, Ukraine, and Kazakhstan, generating record world wheat output of 751 million tons. Among major producers, only the EU (and especially France) will have a disappointing crop, of 144 million tons, almost 6 million tons below last year. Most of Russia’s wheat exports are low-quality food wheat, with North Africa and Middle East being major markets, though the country is also expanding exports to Africa and some Asian markets.
Russian wheat exports are also under pressure as the ruble has been strengthening (appreciating) against major Western currencies (see chart below), which hurts the price competitiveness on world markets of all Russian exports, and wheat in particular. The ruble has been appreciating over most of the past year, with the ruble to U.S. dollar rate falling from 77 rubles/dollar in January 2016 to 64 in December. The ruble appreciation has occurred mainly because over the year world oil prices have risen, with the average crude spot price increasing from $30 in January 2016 to $52 in December. The ruble exchange rate closely follows the world oil price because about two-thirds of Russia’s foreign exchange earnings come from energy exports, such that when oil prices rise (fall), world demand for the ruble correspondingly increases (decreases).
A third reason for decreasing Russian wheat exports is possible logistical and infrastructural constraints. In recent years, Russia has substantially increased its port capacity for exporting grain (mainly out of the Black Sea), such that in 2015 the country exported a record 34.5 million tons of grain, and total grain exports of 38.6 million tons are projected for 2016. However, exports beyond that volume could be a stretch for the country’s ports. Other challenges also remain for exporting a large amount of wheat and grain concerning rail transport (rail car deficit, inconsistent transportation charges), ambiguous and often superfluous required documentation, and adverse winter weather conditions as rivers freeze, snow and ice impede domestic transportation, and rough winds slow down loading at ports.
With a record harvest and reduced exports, Russian wheat stocks are expected to almost double year-to-year to 10.1 million tons.
9Wheat Outlook/WHS-16l/December 13, 2016
Economic Research Service, USDA
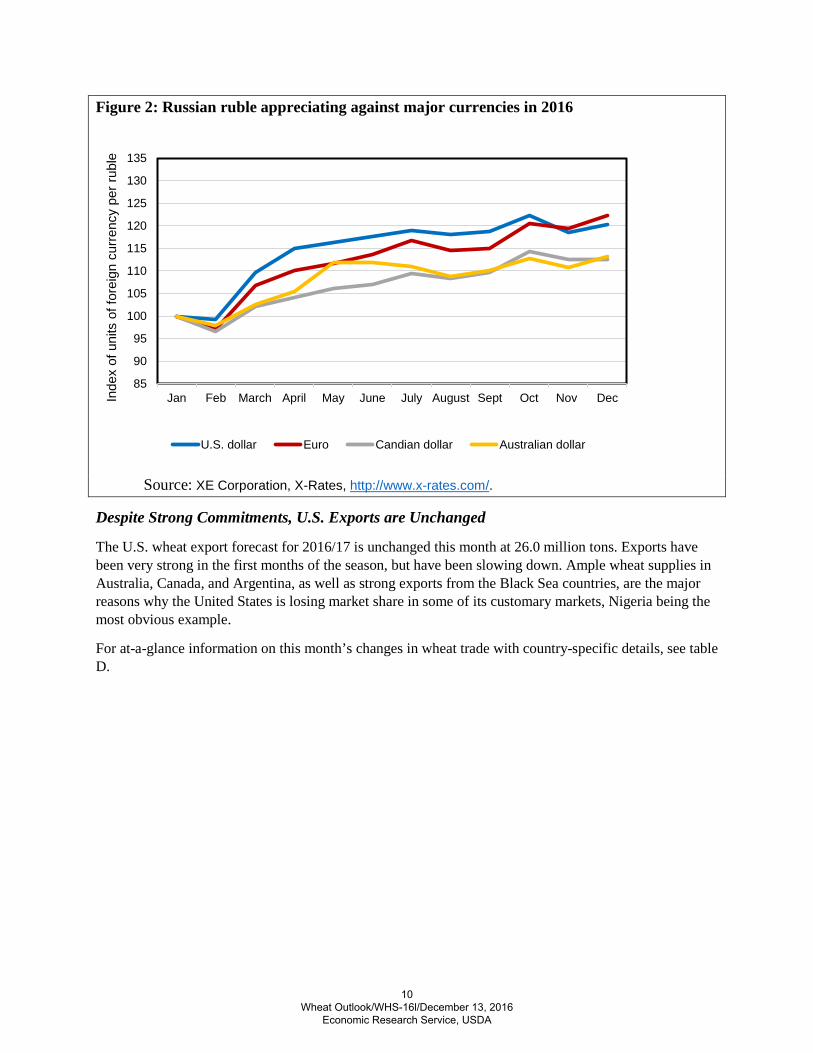
Figure 2: Russian ruble appreciating against major currencies in 2016
Source: XE Corporation, X-Rates, http://www.x-rates.com/.
Despite Strong Commitments, U.S. Exports are Unchanged
The U.S. wheat export forecast for 2016/17 is unchanged this month at 26.0 million tons. Exports have been very strong in the first months of the season, but have been slowing down. Ample wheat supplies in Australia, Canada, and Argentina, as well as strong exports from the Black Sea countries, are the major reasons why the United States is losing market share in some of its customary markets, Nigeria being the most obvious example.
For at-a-glance information on this month’s changes in wheat trade with country-specific details, see table D.
85
90
95
100
105
110
115
120
125
130
135
Jan Feb March April May June July August Sept Oct Nov DecInde
x of
uni
ts o
f for
eign
cur
renc
y pe
r rub
le
U.S. dollar Euro Candian dollar Australian dollar
10 Wheat Outlook/WHS-16l/December 13, 2016
Economic Research Service, USDA

Country or region Trade Change1 Comments
July-June international trade year
World 175.4 +1.8
Foreign 149.4 +1.8
United States 26.0 No changeDespite strong export commitments, U.S. wheat export prospects are unchanged, reflecting increased competitor supplies and the slowing pace of sales.
Australia 23.0 +2.5
Record-high projected wheat output, ample exportable supplies, and declining domestic prices make Australia highly competitive. In addition to its traditional exports of milling wheat, Australia is expected to supply more wheat to countries of Southeast Asia, partly replacing Argentina.
Argentina 8.2 +0.2
The increase is based on the strong wheat export shipment pace in October-November, the last months of Argentine 2015/16 local marketing year that ends in November. The December-November marketing year overlaps with the 2016/17 international trade year that starts in July.
Brazil 1.6 +0.1 Higher exportable supplies of wheat this month.
Russia 29.0 -1.0
Appreciation of the local currency (ruble) vis-à-vis currencies of all major wheat exporters. The decline is supported by the pace of exports that is high, but not sufficient to reach the previously projected level. See "COUNTRY FOCUS: RUSSIA" in the report above.
Brazil 7.0 +0.4
Higher pace of wheat imports from Argentina, Paraguay, and Uruguay in recent months despite larger projected output. Wheat output in Brazil is expected to have a large share of low-quality crop, and Brazilian millers need higher-quality wheat for blending purposes.
Bangladesh 5.1 +0.4Higher pace of wheat imports from Russia, Ukraine, Canada, and Australia in recent months. Prospects of even cheaper wheat purchases from Australia with its record-high crop.
Indonesia 8.8 +0.3
Though in the last few years Ukraine became one of the largest exporters to the countries of Southeast Asia, Australia remains the major supplier of food-quality wheat to the region. In recent months, wheat prices for Australian wheat started to decline, reflecting the record harvest, and Australia seems to be increasing its traditionally large exports to the region. Indonesia is part of the region, and is projected to get a share of the increased cheap Australian wheat supplies.
Vietnam 3.3 +0.3 The above is applicable to Vietnam.
Thailand 3.8 +0.2 The above is applicable to Thailand, though the country remains the top importer from Ukraine.
1Change from previous month. Smaller changes for wheat imports are made for a number of countries; see map D.
Source: USDA, Foreign Agricultural Service, Production, Supply, and Distribution online database.
Wheat Exports (2016/17)
Wheat Imports (2016/17)
Table D - Wheat trade at a glance (2016/17), December 2016
Million tons
Note: Wheat imports are also up 0.1 million tons for Nigeria.
11Wheat Outlook/WHS-16l/December 13, 2016
Economic Research Service, USDA

0.00
1.00
2.00
3.00
4.00
5.00
6.00
7.00
June July Aug. Sept. Oct. Nov. Dec. Jan. Feb. Mar. Apr. May
Market year
2014/15 2015/16 2016/17
Source: USDA, National Agricultural Statistics Service, Agricultural Prices.
Figure 1All wheat average prices received by farmersDollars per bushel
0.00
1.00
2.00
3.00
4.00
5.00
6.00
7.00
8.00
June July Aug. Sept. Oct. Nov. Dec. Jan. Feb. Mar. Apr. May
Market year
2014/15 2015/16 2016/17
Figure 2Hard red winter wheat average prices received by farmers
Source: USDA, National Agricultural Statistics Service, Agricultural Prices.
Dollars per bushel
0.00
1.00
2.00
3.00
4.00
5.00
6.00
7.00
June July Aug. Sept. Oct. Nov. Dec. Jan. Feb. Mar. Apr. May
Market year
2014/15 2015/16 2016/17
Figure 3Hard red spring wheat average prices received by farmers
Source: USDA, National Agricultural Statistics Service, Agricultural Prices.
Dollars per bushel
12 Wheat Outlook/WHS-16l/December 13, 2016
Economic Research Service, USDA
0.00
1.00
2.00
3.00
4.00
5.00
6.00
June July Aug. Sept. Oct. Nov. Dec. Jan. Feb. Mar. Apr. May
Market year
2014/15 2015/16 2016/17
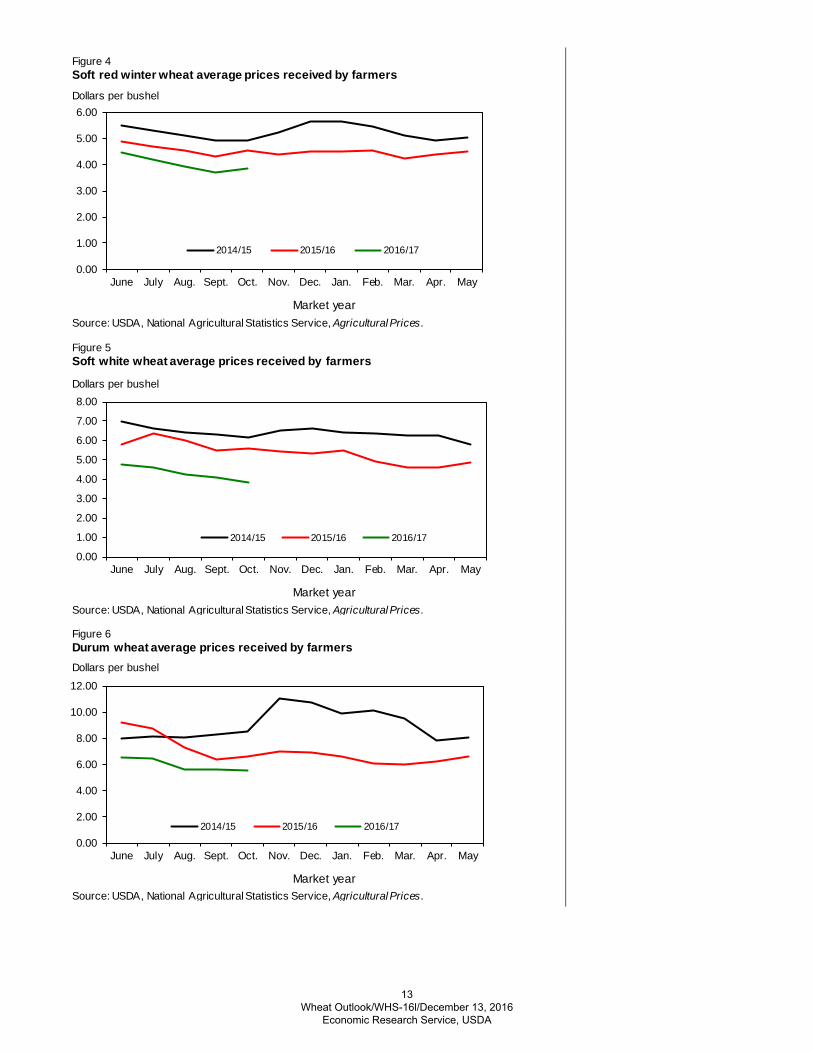
Figure 4Soft red winter wheat average prices received by farmers
Source: USDA, National Agricultural Statistics Service, Agricultural Prices.
Dollars per bushel
0.00
1.00
2.00
3.00
4.00
5.00
6.00
7.00
8.00
June July Aug. Sept. Oct. Nov. Dec. Jan. Feb. Mar. Apr. May
Market year
2014/15 2015/16 2016/17
Figure 5Soft white wheat average prices received by farmers
Source: USDA, National Agricultural Statistics Service, Agricultural Prices.
Dollars per bushel
0.00
2.00
4.00
6.00
8.00
10.00
12.00
June July Aug. Sept. Oct. Nov. Dec. Jan. Feb. Mar. Apr. May
Market year
2014/15 2015/16 2016/17
Figure 6Durum wheat average prices received by farmersDollars per bushel
Source: USDA, National Agricultural Statistics Service, Agricultural Prices.
13Wheat Outlook/WHS-16l/December 13, 2016
Economic Research Service, USDA
0 100 200 300 400 500 600
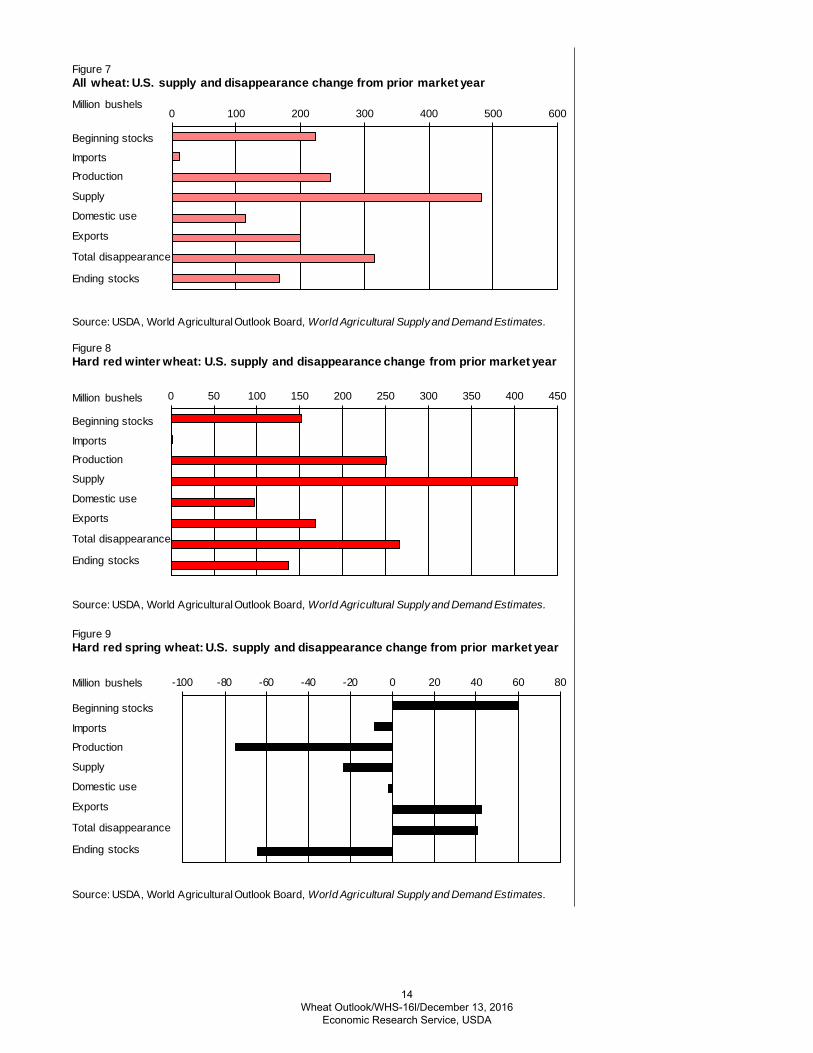
Figure 7All wheat: U.S. supply and disappearance change from prior market year
Beginning stocks
Imports
Production
Supply
Domestic use
Exports
Ending stocks
Total disappearance
Million bushels
Source: USDA, World Agricultural Outlook Board, World Agricultural Supply and Demand Estimates.
0 50 100 150 200 250 300 350 400 450
Figure 8Hard red winter wheat: U.S. supply and disappearance change from prior market year
Million bushels
Source: USDA, World Agricultural Outlook Board, World Agricultural Supply and Demand Estimates.
Beginning stocks
Imports
Production
Supply
Domestic use
Exports
Total disappearance
Ending stocks
-100 -80 -60 -40 -20 0 20 40 60 80
Figure 9Hard red spring wheat: U.S. supply and disappearance change from prior market year
Beginning stocks
Imports
Production
Supply
Domestic use
Exports
Ending stocks
Total disappearance
Million bushels
Source: USDA, World Agricultural Outlook Board, World Agricultural Supply and Demand Estimates.
14 Wheat Outlook/WHS-16l/December 13, 2016
Economic Research Service, USDA

-40 -30 -20 -10 0 10 20 30 40 50
Figure 10Soft red winter wheat: U.S. supply and disappearance change from prior market year
Beginning stocks
Imports
Production
Supply
Domestic use
Exports
Ending stocks
Total disappearance
Million bushels
Source: USDA, World Agricultural Outlook Board, World Agricultural Supply and Demand Estimates.
0 10 20 30 40 50 60 70 80
Figure 11White wheat: U.S. supply and disappearance change from prior market year
Beginning stocks
Imports
Production
Supply
Domestic use
Exports
Ending stocks
Total disappearance
Million bushels
Source: USDA, World Agricultural Outlook Board, World Agricultural Supply and Demand Estimates.
15 Wheat Outlook/WHS-16l/December 13, 2016
Economic Research Service, USDA

2010/11 2011/12 2012/13 2013/14 2014/15 2015/16 2016/17Area:Planted Million acres 52.6 54.3 55.3 56.2 56.8 55.0 50.2Harvested Million acres 46.9 45.7 48.8 45.3 46.4 47.3 43.9
Yield Bushels per acre 46.1 43.6 46.2 47.1 43.7 43.6 52.6
Supply:Beginning stocks Million bushels 975.6 863.0 742.6 717.9 590.3 752.4 975.7Production Million bushels 2,163.0 1,993.1 2,252.3 2,135.0 2,026.3 2,061.9 2,309.7Imports¹ Million bushels 96.9 113.1 124.3 172.5 151.3 112.9 125.0Total supply Million bushels 3,235.6 2,969.2 3,119.2 3,025.3 2,767.9 2,927.2 3,410.4
Disappearance:Food use Million bushels 925.6 941.4 950.8 955.1 958.2 957.4 963.0Seed use Million bushels 70.7 75.6 73.1 77.0 79.4 67.2 69.0Feed and residual use Million bushels 84.8 158.5 365.3 226.7 113.7 151.9 260.0Total domestic use Million bushels 1,081.1 1,175.5 1,389.3 1,258.8 1,151.3 1,176.5 1,292.0Exports¹ Million bushels 1,291.4 1,051.1 1,012.1 1,176.2 864.1 775.1 975.0Total disappearance Million bushels 2,372.6 2,226.6 2,401.4 2,435.1 2,015.5 1,951.6 2,267.0
Ending stocks Million bushels 863.0 742.6 717.9 590.3 752.4 975.7 1,143.4
Stocks-to-use ratio 36.4 33.4 29.9 24.2 37.3 50.0 50.4
Loan rate Dollars per bushel 2.94 2.94 2.94 2.94 2.94 2.94 2.94Contract/direct payment rate Dollars per bushel 0.52 0.52 0.52 0.52Farm price² Dollars per bushel 5.70 7.24 7.77 6.87 5.99 4.89 3.60-3.80
Market value of production Million dollars 12,579 14,269 17,383 14,604 11,915 10,203 8,546
Latest market year is projected; previous market year is estimated. Totals may not add due to rounding.¹Includes flour and selected other products expressed in grain-equivalent bushels.²U.S. season-average price based on monthly prices weighted by monthly marketings. Prices do not include an allowance for loans outstanding and government purchases.Source: USDA, World Agricultural Outlook Board, World Agricultural Supply and Demand Estimates and supporting materials.
Date run: 12/12/2016
Table 1--Wheat: U.S. market year supply and disappearance, 12/13/2016Item and unit
16Wheat Outlook/WHS-16l/December 13, 2016
Economic Research Service, USDA

All wheatHard red
winter¹Hard red
spring¹Soft red winter¹ White¹ Durum
Area:Planted acreage Million acres 55.00 29.17 12.62 7.09 4.16 1.95Harvested acreage Million acres 47.32 23.22 12.33 5.89 3.96 1.91
Yield Bushels per acre 43.58 35.77 46.03 60.92 55.70 43.96
Supply:Beginning stocks Million bushels 752.39 293.74 212.00 154.00 67.00 25.66Production Million bushels 2,061.94 830.45 567.64 359.05 220.79 84.01Imports² Million bushels 112.91 6.20 48.55 18.24 6.18 33.73Total supply Million bushels 2,927.25 1,130.38 828.19 531.30 293.98 143.40
Disappearance:Food use Million bushels 957.40 391.29 251.00 153.00 83.00 79.11Seed use Million bushels 67.19 29.69 16.67 11.70 5.50 3.64Feed and residual use Million bushels 151.89 37.33 36.09 89.97 -15.01 3.52Total domestic use Million bushels 1,176.48 458.31 303.75 254.67 73.49 86.27Exports² Million bushels 775.08 226.46 252.47 120.00 146.81 29.33Total disappearance Million bushels 1,951.56 684.77 556.22 374.67 220.30 115.60
Ending stocks Million bushels 975.69 445.62 271.97 156.63 73.68 27.80
Area:Planted acreage Million acres 50.15 26.59 10.95 6.02 4.19 2.41Harvested acreage Million acres 43.89 21.86 10.67 4.98 4.02 2.37
Yield Bushels per acre 52.62 49.48 46.23 69.37 71.04 44.02
Supply:Beginning stocks Million bushels 975.69 445.62 271.97 156.63 73.68 27.80Production Million bushels 2,309.68 1,081.69 493.13 345.23 285.51 104.12Imports² Million bushels 125.00 7.00 40.00 36.00 8.00 34.00Total supply Million bushels 3,410.36 1,534.31 805.09 537.86 367.19 165.92
Disappearance:Food use Million bushels 963.00 375.00 267.00 155.00 86.00 80.00Seed use Million bushels 69.00 31.00 15.00 14.00 6.00 3.00Feed and residual use Million bushels 260.00 150.00 20.00 80.00 10.00 .00Total domestic use Million bushels 1,292.00 556.00 302.00 249.00 102.00 83.00Exports² Million bushels 975.00 395.00 295.00 90.00 170.00 25.00Total disappearance Million bushels 2,267.00 951.00 597.00 339.00 272.00 108.00
Ending stocks Million bushels 1,143.36 583.31 208.09 198.86 95.19 57.92
Table 2--Wheat by class: U.S. market year supply and disappearance, 12/13/2016
Market year, item, and unit2015/16
2016/17
Date run: 12/12/2016
Latest market year is projected; previous market year is estimated. Totals may not add due to rounding.¹Area and yield data are unpublished National Agricultural Statistics Service data. Supply and disappearance data, except production, are approximations.²Includes flour and selected other products expressed in grain-equivalent bushels.Source: USDA, National Agricultural Statistics Service, Crop Production and unpublished data; and USDA, World Agricultural Outlook Board, World Agricultural Supply and Demand Estimates and supporting materials.
17 Wheat Outlook/WHS-16l/December 13, 2016
Economic Research Service, USDA

Production Imports¹ Total supply Food use Seed useFeed and
residual use Exports¹ Ending stocksJun-Aug 2,512 28 2,845 236 1 405 345 1,858Sep-Nov 28 1,886 238 54 -124 295 1,422Dec-Feb 36 1,458 219 1 28 170 1,040Mar-May 35 1,075 233 21 -41 206 657Mkt. year 2,512 127 2,945 927 78 268 1,015 657
Jun-Aug 2,209 28 2,893 231 1 251 200 2,209Sep-Nov 24 2,234 237 44 -81 252 1,782Dec-Feb 30 1,812 222 1 31 201 1,356Mar-May 37 1,393 229 21 -59 227 976Mkt. year 2,209 119 2,984 919 68 142 879 976
Jun-Aug 2,163 27 3,166 235 1 215 265 2,450Sep-Nov 24 2,473 242 51 -63 311 1,933Dec-Feb 23 1,956 221 1 308 1,425Mar-May 22 1,448 228 16 -67 407 863Mkt. year 2,163 97 3,236 926 71 85 1,291 863
Jun-Aug 1,993 21 2,877 230 5 201 295 2,147Sep-Nov 32 2,179 244 51 -16 238 1,663Dec-Feb 30 1,693 231 1 44 217 1,199Mar-May 30 1,229 236 19 -70 301 743Mkt. year 1,993 113 2,969 941 76 159 1,051 743
Jun-Aug 2,252 26 3,020 238 1 403 264 2,115Sep-Nov 33 2,148 247 55 -22 198 1,671Dec-Feb 35 1,705 229 1 5 235 1,235Mar-May 31 1,266 238 15 -20 315 718Mkt. year 2,252 124 3,119 951 73 365 1,012 718
Jun-Aug 2,135 36 2,889 235 4 422 358 1,870Sep-Nov 48 1,918 249 53 -168 309 1,475Dec-Feb 42 1,517 231 2 -1 228 1,057Mar-May 47 1,104 240 18 -27 282 590Mkt. year 2,135 172 3,025 955 77 227 1,176 590
Jun-Aug 2,026 44 2,661 239 6 256 253 1,907Sep-Nov 35 1,942 248 49 -93 208 1,530Dec-Feb 37 1,566 231 2 8 185 1,140Mar-May 36 1,176 240 22 -58 219 752Mkt. year 2,026 151 2,768 958 79 114 864 752
Jun-Aug 2,062 27 2,841 240 1 298 205 2,097Sep-Nov 27 2,124 249 45 -108 192 1,746Dec-Feb 34 1,781 230 1 -1 179 1,372Mar-May 25 1,397 239 20 -37 199 976Mkt. year 2,062 113 2,927 957 67 152 775 976
Jun-Aug 2,310 33 3,318 238 2 284 267 2,527Mkt. year 2,310 125 3,410 963 69 260 975 1,143
Table 3--Wheat: U.S. quarterly supply and disappearance (million bushels), 12/13/2016
Market year and quarter2008/09
2009/10
2010/11
2011/12
Date run: 12/12/2016
2012/13
2013/14
2014/15
2015/16
2016/17
Latest market year is projected; previous market year is estimated. Totals may not add due to rounding.¹Includes flour and selected other products expressed in grain-equivalent bushels.Source: USDA, World Agricultural Outlook Board, World Agricultural Supply and Demand Estimates and supporting materials.
18Wheat Outlook/WHS-16l/December 13, 2016
Economic Research Service, USDA

Wheat ground for flour
+ Food imports² + Nonmilled food use³ - Food exports² = Food use⁴
Jun 74,070 2,740 2,000 1,760 77,050Jul 74,244 3,035 2,000 1,866 77,413Aug 81,143 2,853 2,000 1,541 84,455Sep 78,025 2,507 2,000 1,812 80,720Oct 82,617 2,941 2,000 1,825 85,733Nov 79,077 2,731 2,000 2,075 81,734Dec 74,226 2,908 2,000 1,625 77,509Jan 73,996 2,815 2,000 1,661 77,150Feb 73,409 2,614 2,000 1,824 76,198Mar 77,884 3,024 2,000 2,183 80,725Apr 75,805 2,889 2,000 1,681 79,012May 77,507 2,948 2,000 1,847 80,609Jun 74,155 3,374 2,000 1,760 77,769Jul 74,749 2,992 2,000 1,850 77,891Aug 81,695 2,786 2,000 1,889 84,592Sep 78,556 2,771 2,000 1,928 81,399Oct 82,604 2,861 2,000 2,119 85,346Nov 79,065 2,994 2,000 2,050 82,009Dec 74,215 2,873 2,000 2,118 76,969Jan 73,643 2,770 2,000 2,026 76,386Feb 73,058 2,756 2,000 1,655 76,159Mar 77,511 2,851 2,000 2,146 80,216Apr 74,776 4,207 2,000 1,771 79,212May 76,456 2,836 2,000 2,023 79,268Jun 73,149 2,934 2,000 2,137 75,945Jul 74,188 2,642 2,000 1,666 77,164Aug 81,082 3,196 2,000 1,856 84,422Sep 77,966 2,537 2,000 2,120 80,383Oct 2,969 2,323 646
Table 4--Wheat: Monthly food disappearance estimates (1,000 grain-equivalent bushels), 12/13/2016
Mkt year and month1
2014/15
2015/16
2016/17
¹Current year is preliminary. Previous year is preliminary through August of current year, estimated afterwards.²Food imports and exports used to calculate total food use. Includes all categories of wheat flour, semolina, bulgur, and couscous and selected categories of pasta.³Wheat prepared for food use by processes other than milling.⁴Estimated food use equals wheat ground for flour plus food imports plus nonmilled food use minus food exports. Source: Data through the 2nd quarter of 2011 was calculated using data from U.S. Department of Commerce, Bureau of the Census’ Flour Milling Products (MQ311A) and U.S. Department of Commerce, Bureau of Economic Analysis’ Foreign Trade Statistics. Subsequent flour milling calculations are based on data from the North American Millers' Association.
Date run: 12/12/2016
19Wheat Outlook/WHS-16l/December 13, 2016
Economic Research Service, USDA
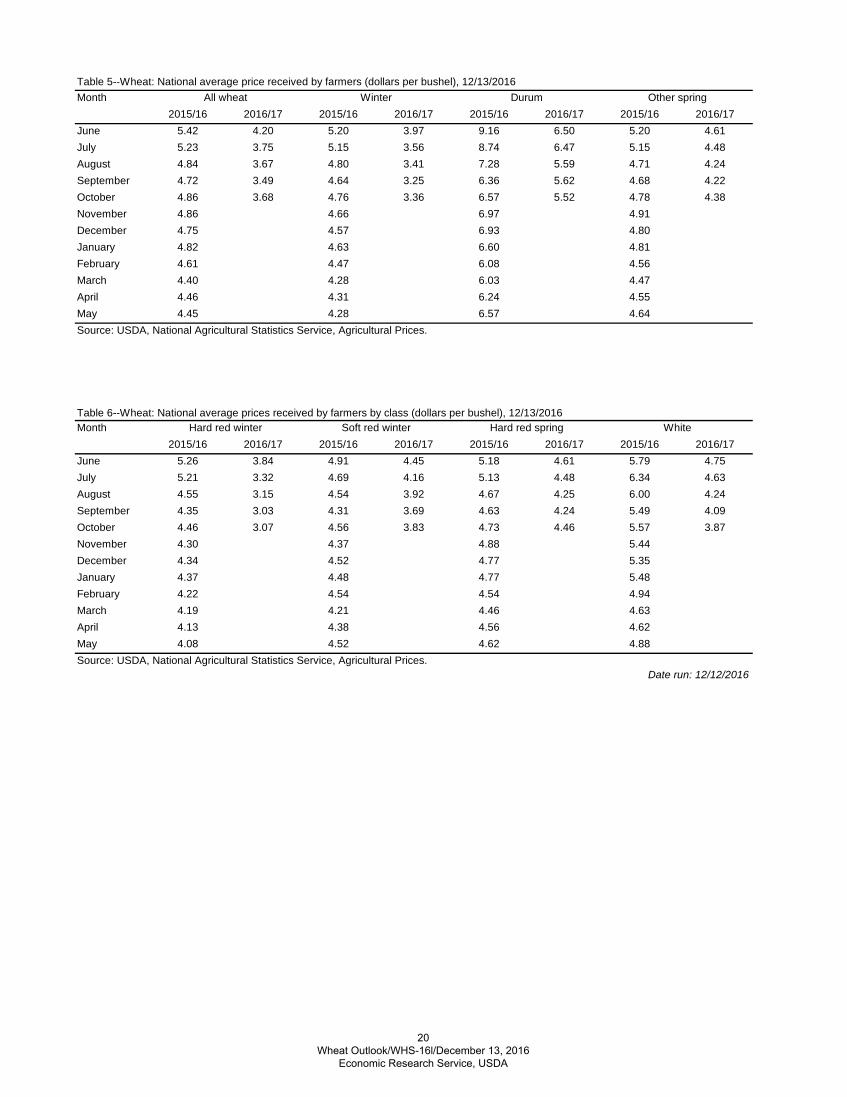
2015/16 2016/17 2015/16 2016/17 2015/16 2016/17 2015/16 2016/17June 5.42 4.20 5.20 3.97 9.16 6.50 5.20 4.61July 5.23 3.75 5.15 3.56 8.74 6.47 5.15 4.48August 4.84 3.67 4.80 3.41 7.28 5.59 4.71 4.24September 4.72 3.49 4.64 3.25 6.36 5.62 4.68 4.22October 4.86 3.68 4.76 3.36 6.57 5.52 4.78 4.38November 4.86 4.66 6.97 4.91December 4.75 4.57 6.93 4.80January 4.82 4.63 6.60 4.81February 4.61 4.47 6.08 4.56March 4.40 4.28 6.03 4.47April 4.46 4.31 6.24 4.55May 4.45 4.28 6.57 4.64
2015/16 2016/17 2015/16 2016/17 2015/16 2016/17 2015/16 2016/17June 5.26 3.84 4.91 4.45 5.18 4.61 5.79 4.75July 5.21 3.32 4.69 4.16 5.13 4.48 6.34 4.63August 4.55 3.15 4.54 3.92 4.67 4.25 6.00 4.24September 4.35 3.03 4.31 3.69 4.63 4.24 5.49 4.09October 4.46 3.07 4.56 3.83 4.73 4.46 5.57 3.87November 4.30 4.37 4.88 5.44December 4.34 4.52 4.77 5.35January 4.37 4.48 4.77 5.48February 4.22 4.54 4.54 4.94March 4.19 4.21 4.46 4.63April 4.13 4.38 4.56 4.62May 4.08 4.52 4.62 4.88
Table 5--Wheat: National average price received by farmers (dollars per bushel), 12/13/2016Month All wheat Winter Durum Other spring
Source: USDA, National Agricultural Statistics Service, Agricultural Prices.Date run: 12/12/2016
Source: USDA, National Agricultural Statistics Service, Agricultural Prices.
Table 6--Wheat: National average prices received by farmers by class (dollars per bushel), 12/13/2016Month Hard red winter Soft red winter Hard red spring White
20 Wheat Outlook/WHS-16l/December 13, 2016
Economic Research Service, USDA
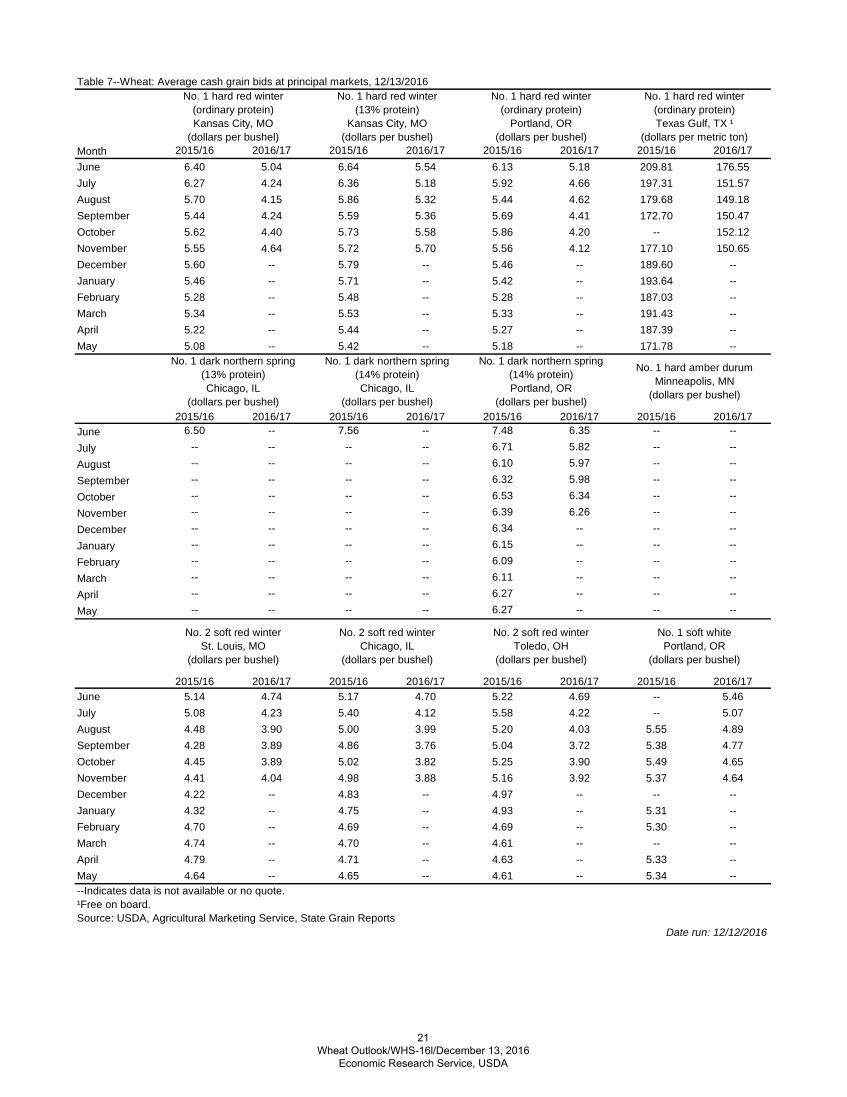
2015/16 2016/17 2015/16 2016/17 2015/16 2016/17 2015/16 2016/17June 6.40 5.04 6.64 5.54 6.13 5.18 209.81 176.55July 6.27 4.24 6.36 5.18 5.92 4.66 197.31 151.57August 5.70 4.15 5.86 5.32 5.44 4.62 179.68 149.18September 5.44 4.24 5.59 5.36 5.69 4.41 172.70 150.47October 5.62 4.40 5.73 5.58 5.86 4.20 -- 152.12November 5.55 4.64 5.72 5.70 5.56 4.12 177.10 150.65December 5.60 -- 5.79 -- 5.46 -- 189.60 --January 5.46 -- 5.71 -- 5.42 -- 193.64 --February 5.28 -- 5.48 -- 5.28 -- 187.03 --March 5.34 -- 5.53 -- 5.33 -- 191.43 --April 5.22 -- 5.44 -- 5.27 -- 187.39 --May 5.08 -- 5.42 -- 5.18 -- 171.78 --
2015/16 2016/17 2015/16 2016/17 2015/16 2016/17 2015/16 2016/17June 6.50 -- 7.56 -- 7.48 6.35 -- --July -- -- -- -- 6.71 5.82 -- --August -- -- -- -- 6.10 5.97 -- --September -- -- -- -- 6.32 5.98 -- --October -- -- -- -- 6.53 6.34 -- --November -- -- -- -- 6.39 6.26 -- --December -- -- -- -- 6.34 -- -- --January -- -- -- -- 6.15 -- -- --February -- -- -- -- 6.09 -- -- --March -- -- -- -- 6.11 -- -- --April -- -- -- -- 6.27 -- -- --May -- -- -- -- 6.27 -- -- --
2015/16 2016/17 2015/16 2016/17 2015/16 2016/17 2015/16 2016/17June 5.14 4.74 5.17 4.70 5.22 4.69 -- 5.46July 5.08 4.23 5.40 4.12 5.58 4.22 -- 5.07August 4.48 3.90 5.00 3.99 5.20 4.03 5.55 4.89September 4.28 3.89 4.86 3.76 5.04 3.72 5.38 4.77October 4.45 3.89 5.02 3.82 5.25 3.90 5.49 4.65November 4.41 4.04 4.98 3.88 5.16 3.92 5.37 4.64December 4.22 -- 4.83 -- 4.97 -- -- --January 4.32 -- 4.75 -- 4.93 -- 5.31 --February 4.70 -- 4.69 -- 4.69 -- 5.30 --March 4.74 -- 4.70 -- 4.61 -- -- --April 4.79 -- 4.71 -- 4.63 -- 5.33 --May 4.64 -- 4.65 -- 4.61 -- 5.34 --
No. 2 soft red winterToledo, OH
(dollars per bushel)
No. 1 soft whitePortland, OR
(dollars per bushel)
Table 7--Wheat: Average cash grain bids at principal markets, 12/13/2016
Month
No. 1 hard red winter (ordinary protein)Kansas City, MO
(dollars per bushel)
No. 1 hard red winter (13% protein)
Kansas City, MO(dollars per bushel)
No. 1 hard red winter (ordinary protein)
Portland, OR(dollars per bushel)
No. 1 hard red winter (ordinary protein)Texas Gulf, TX ¹
(dollars per metric ton)
--Indicates data is not available or no quote.¹Free on board.Source: USDA, Agricultural Marketing Service, State Grain Reports
Date run: 12/12/2016
No. 1 dark northern spring (13% protein)Chicago, IL
(dollars per bushel)
No. 1 dark northern spring (14% protein)Chicago, IL
(dollars per bushel)
No. 1 dark northern spring (14% protein)Portland, OR
(dollars per bushel)
No. 1 hard amber durumMinneapolis, MN
(dollars per bushel)
No. 2 soft red winterSt. Louis, MO
(dollars per bushel)
No. 2 soft red winterChicago, IL
(dollars per bushel)
21Wheat Outlook/WHS-16l/December 13, 2016
Economic Research Service, USDA

May Jun Jul Aug Sep Oct2016 2016 2016 2016 2016 2016
All wheat grain 64,011 85,398 75,502 100,797 103,769 61,679All wheat flour¹ 1,464 1,710 1,338 1,401 1,669 1,870All wheat products² 593 460 371 496 480 485Total all wheat 66,069 87,567 77,210 102,694 105,917 64,034
All wheat grain 4,091 5,757 7,078 10,957 9,149 5,946All wheat flour¹ 1,200 1,266 1,058 1,339 1,180 1,272All wheat products² 1,658 1,698 1,614 1,892 1,378 1,717Total all wheat 6,948 8,721 9,750 14,187 11,707 8,934
Table 8--Wheat: U.S. exports and imports for last 6 months (1,000 bushels), 12/13/2016
ItemExports
Imports
Totals may not add due to rounding.¹Expressed in grain-equivalent bushels. Includes meal, groats, and durum.²Expressed in grain-equivalent bushels. Includes bulgur, couscous, and selected categories of pasta.Source: U.S. Department of Commerce, U.S. Census Bureau, Foreign Trade Statistics; and ERS calculations using Census trade statistics.
Date run: 12/12/2016
22Wheat Outlook/WHS-16l/December 13, 2016
Economic Research Service, USDA

Table 9--Wheat: U.S. exports, Census and export sales comparison (1,000 metric tons)2014/15 2015/16 2016/17 (as of 12/01/16)
Importing Out-country Shipments standing Total Data Export Export Export source Census1 sales2 Census1 sales2 sales2
Country:China 331 332 609 764 553 180 733Japan 3,054 3,121 2,499 2,434 1,286 253 1,539Mexico 2,842 2,721 2,503 2,318 1,271 597 1,867Nigeria 1,790 1,904 1,457 1,401 591 265 855Philippines 2,376 2,338 2,077 2,118 1,503 444 1,946Korean Rep. 1,181 1,148 1,093 1,074 567 443 1,010Egypt 156 387 99 42 0 45 45Taiwan 983 1,002 1,129 1,034 568 166 734Indonesia 691 643 666 608 484 170 654Venezuela 457 438 252 239 215 30 245European Union 658 724 831 934 407 44 451Total grain 22,610 22,622 20,467 19,440 13,049 6,320 19,369Total (including products) 23,249 22,693 21,117 19,544 13,128 6,350 19,478USDA forecast of Census 21,094 26,5351Source: U.S. Department of Commerce, U.S. Census Bureau.2Source: USDA, Foreign Agricultural Service, U.S. Export Sales .
23Wheat Outlook/WHS-16l/December 13, 2016
Economic Research Service, USDA