decoding of complex isothermal chromatograms recovered from space missions
TRANSCRIPT

Journal of Chromatography A, 1002 (2003) 179–192www.elsevier.com/ locate/chroma
D ecoding of complex isothermal chromatograms recovered fromspace missions
Identification of molecular structurea , a a a*Maria Chiara Pietrogrande , Ilaria Tellini , Luisa Pasti , Francesco Dondi ,
b c dCyril Szopa , Robert Sternberg , Claire Vidal-MadjaraDepartment of Chemistry, University of Ferrara, Via L. Borsari 46, 44100Ferrara, Italy
b `SA, UMR CNRS 7620, 91371Verrieres-le-Buisson, Francec ´LISA, UMR CNRS 7583, 94010Creteil Cedex, France
dLRP, CNRS, 94320 Thiais, France
Received 28 February 2003; received in revised form 22 April 2003; accepted 23 April 2003
Abstract
A chemometric approach, based on the study of the autocovariance function, is described to study isothermal GCchromatograms of multicomponent mixtures: isothermal GC analysis is the method of choice in space missions since it is, todate, the only method compatible with flight constraints. Isothermal GC chromatograms look inhomogeneous and disorderedwith peak density decreasing at higher retention times: a time axis transformation is proposed to make retention anhomogeneous process so that CH addition in terms of an homologous series yields a constant retention increment. The time2
axis is transformed into a new scale based on the retention times ofn-alkanes, as they are the basis of the universal Kovatsindices procedure. The order introduced into the chromatogram by retention time linearization can be simply singled out bythe experimental autocorrelation function (EACF) plot: if constant inter-distances are repeated in different regions of thechromatogram, well-shaped peaks are evident in the EACF plot. By comparison, with a standard mixture it is possible toidentify peaks diagnostic of specific molecular structures: study of the EACF plot provides information on sample chemicalcomposition. The procedure was applied to standard mixtures containing compounds representative of the planetaryatmospheres that will be investigated in the near future: in particular, those related to Titan’s atmosphere (Cassini–Huygensmission) and cometary’s nucleus (Rosetta mission). The employed experimental conditions simulated those applied to GCinstruments installed on space probes and landers in space missions. The method was applied to two specific investigationsrelated to space research, i.e., a comparison of retention selectivity of different GC columns and identification of thechemical composition of an unknown mixture. 2003 Elsevier Science B.V. All rights reserved.
Keywords: Chemometrics; Autocovariance function; Volatile organic compounds
1 . Introduction
*Corresponding author. Tel.:139-0532-291-152; fax:139-In previous papers it has been demonstrated that a0532-240-709.
E-mail address: [email protected](M.C. Pietrogrande). chemometric approach based on Fourier analysis
0021-9673/03/$ – see front matter 2003 Elsevier Science B.V. All rights reserved.doi:10.1016/S0021-9673(03)00727-1

180 M.C. Pietrogrande et al. / J. Chromatogr. A 1002 (2003) 179–192
(FA) is a powerful tool for decoding a complex concerns energy savings which imposes temperaturechromatogram, i.e., to extract all the information and pressure limitations; for these reasons, iso-contained therein regarding the mixture—number of thermal separations are currently the only onescomponents, abundance distribution—and separa- compatible with flight constraints[19–26]. The lowtion—separation performance, retention pattern[1– separation performance obtained under isothermal12]. In particular, its power lies in its ability to conditions results in an increase in the signal com-magnify ordered retention patterns, if present in the plexity and peak overlapping usually present inchromatogram, and single them out from the ‘‘dis- separations of multicomponent mixtures such asordered forest’’ of random peaks[6,7,11,12].In fact, planetary atmospheres[14,27–29]. In this case, thea chromatogram of a multicomponent sample dis- use of a mathematical approach, to deconvolveplays a crowd of peaks randomly distributed within incompletely resolved peaks and to interpret thethe chromatographic space and usually overlapping chromatogram, is mandatory if one wants to extractso that the ordered structure, if present, is hidden and all the analytical information hidden therein, that isextremely difficult to detect. The order—peaks ap- ‘‘to decode’’ the complex chromatogram[8,10].pearing at repeated distances as a sequence (homolo- In this paper an extension of the FA proceduregous series), or at constant distances located in consisting of a time axis transformation is proposeddifferent parts of the chromatogram—is related to to evaluate complex isothermal chromatogramsspecific chemical structure variations in the separated [3,12]: the retention time inhomogeneity is removedcompounds and can be used to identify the presence and the presence of an ordered structure, i.e., re-of such structures in the mixture. The procedure has tention time repetitiveness related to specific molecu-been successfully applied to chromatograms obtained lar structures, can be singled out. The reliability ofunder temperature-programming conditions[5–11]. the procedure was tested on chromatograms ofRecently, the method has also been extended to standard and unknown mixtures obtained understudy isothermal GC chromatograms[12]: the isothermal conditions simulating those usually ap-statistical handling of such chromatograms is compli- plied in in situ analysis of extra-terrestrial atmos-cated by the fact that they look inhomogeneous and pheres or soils (lander). Simulation conditions con-disordered—they are more crowded at small or cern the Cassini–Huygens mission, developed inintermediate retention times, while fewer peaks order to study the atmospheric composition of Titan,appear at higher retention times—and peak width is Saturn’s largest moon, in 2005[19,20], and thenot constant, since it increases with retention time cometary sampling and composition (COSAC) ex-[13–16]. periment on board the cometary nucleus lander of the
To date, isothermal GC separations have not been Rosetta mission to be launched in 2003popular, due to their low separation power and [21,22,25,26].The proposed procedure can also beefficiency: the best separation performance can be applied to chromatograms showing inhomogeneity inachieved by a proper optimization of temperature- retention pattern, i.e., obtained in conditions far fromprogrammed conditions[14–17]. However, iso- optimal temperature-programmed conditions, i.e.,thermal GC analysis is the method of choice for the pseudo-isothermal conditions[14–17].analysis of extra-terrestrial atmospheres in spacemissions: GC instruments are installed on spaceprobes and landers for in situ analyses in solar 2 . Experimentalsystem explorations to identify and quantify gaseousor vaporizable constituents of planetary atmospheres Standard mixtures were selected to represent theand surfaces[18–26]. Specific requirements are chemical composition of comet’s nucleus[20–imposed by flight conditions: GC equipment must 22,25,26]:hydrocarbons and oxygenated compoundshave an extremely low mass and consume little with carbon atom numbers ranging from two topower, but must provide high efficiency, resolution, eight. A detailed list of the compounds is reported insensitivity and reliability, working automatically or Table 1.under remote control[18]. The strongest constraint Sample analysis was performed using a Mega

M.C. Pietrogrande et al. / J. Chromatogr. A 1002 (2003) 179–192 181
T able 1 quired in digitized form using the following expres-Standard compounds representing the chemical composition of sion [1,2]:comet’s nucleus
N2k1Hydrocarbons Alcohols ˆ ˆ]EACVF(t)5 ?O (Y 2 Y )(Y 2 Y ),j j1kn-Heptane 1-Butanol M j51n-Octane 1-Pentanol
k50,1,2, . . .M 2 1 (1)n-Nonane 1-Hexanoln-Decane 1-Heptanol
ˆn-Undecane 1-Octanol whereY is the digitized chromatogram signal,Y isjn-Dodecane its mean value, andM is the truncation point in theKetones Acetates EACVF computation. The timet is the inter-distance2-Butanone Propyl acetate between subsequent points in the chromatogram and2-Pentanone Butyl acetate assumes discretek values ranging from 0 toM 2 1.2-Hexanone Amyl acetate
The autocorrelation function (ACF), representing2-Heptanone Hexyl acetatethe ACVF normalized to the value computed at time0, is more frequently used than the ACVF itself. The
Series 5160 gas chromatograph (Fisons Instruments,ACF describes the short- and long-range correlationMilan, Italy) equipped with a flame ionization de- between subsequent peak positions. When EACF istection (FID) system. The columns used were poly- computed on chromatograms obtained under tem-siloxane-based wall-coated open tubular (WCOT) perature-programming conditions, i.e. nearly con-capillary columns (Restek, Bellafonte, PA, USA): a stant peak shape, its plot vs. the correlation inter-MTX 1 silanized stainless-steel (10 m30.15 mm distance exhibits two informative regions[5–7,11].I.D., d 0.8mm) and a RTX-20 column (10 m30.25 (i) The first part of the EACF contains thef
mm I.D., d 1 mm) similar to those used in the shortest-range correlation and depends only on thef
COSAC experiment[25,26]. Previous studies con- shape of the single-component peaks. It resemblescerning space applications showed that these col- the descending half of a Gaussian peak describingumns make it possible to separate a wide range of the mean peak shape averaged on all the peaks in thecomponents and exhibit high resistance properties chromatogram. Theoretical expressions have been(long lifetime, low bleeding, thermal stability, good derived [1–4] and a simplified procedure has beensurface coating): therefore, they are two of the GC developed[7,8] to extract information from this partcolumns selected for the Rosetta mission[19–26]. of the ACVF by a simple graphical inspection.The analyses were performed under isothermal con- Without any handling of particular regions of theditions in the 30–608C temperature range, which is chromatogram or specific peaks, whole chromato-the operating temperature planned for the COSAC gram computation [Eq. (1)] makes it possible toexperiments. The carrier gas was hydrogen with a obtain a correct estimate of chromatographic parame-
21flow-rate of 25.6 cm s . FID was used. A split ters such as the number of components,m, andmode injection was used (with a splitting ratio of average peak shape parameters (s).500:1). (ii) The second part (i.e., widest-range correlation
inter-distance) is determined by the distribution ofthe retention increments: if an ordered retention
3 . Theory pattern exists in the chromatogram—peaks appearingat constant inter-distances repeated in different parts
3 .1. Autocovariance function under temperature- of the chromatogram—some positive peaks areprogramming conditions present at the corresponding distance values in the
EACF plot [5–7,11]. In contrast to the originalThe chemometric approach, based on Fourier chromatogram where peak overcrowding hides repe-
analysis, studies the autocovariance function (ex- titions in the retention pattern, the EACF plot retainsperimental ACVF, EACVF), which can be directly only a small number of repeated peaks, corre-computed from the experimental chromatogram ac- sponding to the most abundant /most repeated inter-

182 M.C. Pietrogrande et al. / J. Chromatogr. A 1002 (2003) 179–192
distances. The result is that the EACF plot is much separation usually exhibit uniform density over the0simpler and a simple visual inspection allows one to partition free energyDm axis, i.e. the ratioDm /
0identify regularities in the retention pattern which D(Dm ), wherem, the number of single componentsreflect specific structure variations in the separated of the complex mixture, will prove to be constant.compounds. Moreover, information on the quantita- Consequently, the intervalDm /Dlog t will also ber
tive composition of the samples can also be obtained: constant[14–17]. Likewise for a given homologouswhile the position of the EACF peaks is related to series, logt increases linearly with the carbonr
0the specific molecular structure, their height is number,n [15], sinceD(Dm ) is constant for a CH2related to the abundance of repetitiveness in the increment. As a consequence, peak density is higherchromatogram, i.e., the number of repeated peaks at small or intermediate retention times and de-and their heights[7]. creases at higher retention times. Likewise, when
The basic assumption of this approach is that a terms ofn-alkane series are analyzed under iso-complex chromatogram looks like a random series of thermal conditions, an inhomogeneous chromato-peaks. In other words, single component (SC) peaks gram is obtained (Fig. 1a), where repetitivity diag-can be found with a constant probability per time nostic for the presence of a homologous series isunit at any point in the chromatogram[1,2]; this totally absent: the autocovariance function computedmeans that, along the chromatogram time axis, the from the isothermal–isocratic chromatogram will notsingle component density is constant. This assump- exhibit the features described above for program-tion leads one to conclude that the SC peak position ming temperature/gradient elution conditions andis described by a Poisson probability density function will show a disordered pattern (Fig. 1a, inset).and the distribution of retention time increments is Therefore, a time axis transformation into a newgiven by the exponential distribution. This is true for scale is required to make retention an homogeneousgradient LC or temperature-programmed GC sepa- process yielding constant retention increments forrations [5–11,14]. Moreover, the most general ex- CH addition in terms of a homologous series. If2
pression of ACVF is obtained when the peak width Y(x) represents the chromatographic signal, wherexis constant (gradient or temperature-programming is the retention time, a transformation of the timeconditions), while in isothermal GC separations peak axis into a new scale:width increases with retention time[3,12,27,28].The z 5 g(x) (2)FA model has been extended to describe these
is proposed. In order to preserve the total signal area,chromatograms by developing different theoreticalthe following condition must be fulfilled:models: a general expression has been derived which
holds when peak width is randomly distributed along Y (x)dx 5 Y (z)dz (3)1 2the time axis and is linearly dependent on retentionwhich expresses the area conservation in the trans-time [3]. The FA procedure allows an accurateformation of frequency functions (Hamilton), or:estimation of the number of components,m, and the
standard deviation of the narrowest (s ) and the1 Y [ g(x)]2]]]Y (z)5 (4)largest peak (s ): it has been successfully applied to 12 g9(x)
isothermal chromatograms simulating space missionanalyses[12]. where Y (x) is the original chromatogram in the1
original time axisx, Y (z) is the transformed chro-2
3 .2. Linearization procedure matogram in the newz-axis, z 5 g(x) is the functionwhich relates the original time axis to the newz-axis
In isocratic or isothermal separations the retention andg9(x) is the first derivative vs.x of g(x). One canprocess is inhomogeneous, since under these con-see that, at a givenz position of the transformed
0ditions the partition free energyDm controlling the chromatogram, the value of the signalY is different2
retention is linearly related to logt (logarithm of the from the corresponding valueY in the originalr 1
retention time). Under these conditions the different chromatogram, according to Eq. (4). Asz 5 g(x), onecomponents of a complex multicomponent mixture can assume the functionz 5 log(x) as mentioned

M.C. Pietrogrande et al. / J. Chromatogr. A 1002 (2003) 179–192 183
Fig. 1. Isothermal chromatogram of a standard mixture containing C –Cn-alkanes and C –C ketones. RTX-20 column, isothermal7 11 5 721conditions at 608C, flow-rate 25.6 cm s . (a) Original chromatogram and plot of EACF computed from it (inset); (b) linearized
chromatogram and plot of EACF computed from it (inset).
above. Here, a different approach has been followed: subsequent terms of a homologous series, i.e., CH2
an empirical transformation of the chromatogram addition. Therefore, the applied transformation haswhich ensures a constantDz increment between the the property:

184 M.C. Pietrogrande et al. / J. Chromatogr. A 1002 (2003) 179–192
Y (x)Dx 5 Y (z)Dz (5) conserve the chromatographic area under the trans-1 2
formation. If terms of an homologous series areover subsequent regions of the chromatogram be- present in the sample (Fig. 1a) a structured chro-tween subsequent members of the homologous matogram characterized by retention repetition isseries, in agreement with Eq. (3). obtained after the linearization procedure (Fig. 1b).
The retention time dependence ofn-alkanes onn If the sample contains incomplete homologous serieswas selected as reference since it is the basis for the or components that do not belong to any series, ituniversal procedure of Kovats indices[16]. Com- yields a disordered retention pattern. It is well knownponents of then-alkane series containing seven to that the superposition of different series of oligo-eleven carbon atoms were submitted to isothermal mers—i.e., the case of real mixtures consisting ofGC analysis (chromatogram inFig. 1a) and the assorted members of many classes of compounds—inter-distance between subsequent terms was consid- as well as the randomness of uncorrelated com-ered. The distanceDx in the original retention pounds leads to the domination of a random dis-7–8
0axis was assumed as a constantDz retention incre- tribution along theDm axis [28,29]. The au-ment in the new scale: subsequent retention regions, tocovariance function was then calculated on thei.e., Dx , Dx andDx , were linearly trans- re-scaled chromatogram: a simple visual inspection8–9 9–10 10–11
formed into newDz regions according to the plot of the EACF plot (Fig. 1b,inset) makes it possible toreported inFig. 2 (isothermal separation at 608C on single out constant repetitiveness diagnostic of thea RTX-20 column). In practice, the chromatogram presence of homologous series.reported inFig. 1b is the empirical transformation of The time axis transformation also yields a de-the original chromatogram inFig. 1a using a func- crease in peak width, as a consequence of thetion corresponding to Eq. (2). In eachDx region the reduction of the acquisition frequency to obtainacquisition frequency was reduced to obtain constant constantDz intervals. The most retained peaks,Dz intervals. When some points of the original output which appear strongly fronting in the original iso-signalY (x) are deleted, their values are added to the thermal chromatogram (Fig. 1a), become narrower1
re-scaled signalY (z) in order to preserve the original and more symmetrical after the linearization pro-2
chromatographic area, i.e., to fulfill Eq. (4) and cedure, yielding a nearly constant peak width (Fig.
Fig. 2. Empirical linearization procedure for an isothermal chromatogram (isothermal separation at 608C on a RTX-20 column).x: originalretention times for C –C alkanes;z: linearized retention times yielding constant intervalsDz.7 12

M.C. Pietrogrande et al. / J. Chromatogr. A 1002 (2003) 179–192 185
Fig. 3. Isothermal chromatogram of a standard mixture containingn-alkanes (HY), alcohols (AL) and ketones (KE). RTX-20 column,21isothermal conditions at 608C, flow-rate 25.6 cm s . (a) Original chromatogram, linearized chromatogram in the inset: inter-distance
repetitiveness is indicated by the arrows; (b) plot of EACF computed from the linearized chromatogram.
1b). As a consequence, the EACF plot computed on inhomogeneous retention pattern characteristic ofthe linearized chromatogram shows narrow, well- isothermal separation (Fig. 1a). After the lineariza-shaped peaks (Fig. 1b, inset). tion procedure, the chromatogram looks ordered
(Fig. 1b): a constant inter-distance of 0.75 min wasobtained for all the terms of then-alkane series as
4 . Results well as for the terms of different homologous series,i.e., ketones, as shown inFig. 1b. The order intro-
A standard mixture containingn-alkanes and duced into the chromatogram by retention timeketones with a carbon number ranging from seven to linearization can be simply singled out by the ACVFeleven was analyzed under isothermal conditions at approach: the EACF plot computed on the linearized60 8C on the RTX-20 column (flow-rate 25.6 cm chromatogram clearly shows well-shaped peaks at21s ): the obtained chromatogram clearly shows an 0.75 min and 1.5 and 2.25 min, i.e., multiple inter-

186 M.C. Pietrogrande et al. / J. Chromatogr. A 1002 (2003) 179–192
Fig. 4. Isothermal chromatogram of a standard mixture containingn-hydrocarbons (HY), alcohols (AL) and acetates (AC). RTX-20 column,21isothermal conditions at 608C, flow-rate 25.6 cm s . (a) Original chromatogram, linearized chromatogram in the inset: inter-distance
repetitiveness is indicated by arrows; (b) plot of EACF computed from the linearized chromatogram.
distances (Fig. 1b, inset). Moreover,Fig. 1b shows (Fig. 1b, inset) and these can be used to identify thethat, after the linearization procedure, the inter-dis- presence ofn-alkanes and ketones in the analyzedtance between compounds belonging to components mixture.of different homologue classes is also constant: This approach is also useful for more complexketones fall into the chromatogram between two mixtures: a mixture containing three different classessubsequent hydrocarbons with constant inter-distance of compounds—n-alkanes, alcohols and ketones—values of 0.28 and 0.47 min repeated in different was analyzed at 608C (the obtained chromatogram isparts of the linearized chromatogram. As a conse- shown inFig. 3a). After the linearization procedurequence, the EACF plot computed on the linearized an ordered chromatogram is obtained (Fig. 3a,inset):chromatogram shows peaks at 0.28 and 0.47 min its properties can be identified in the EACF plot (Fig.
M.C. Pietrogrande et al. / J. Chromatogr. A 1002 (2003) 179–192 187
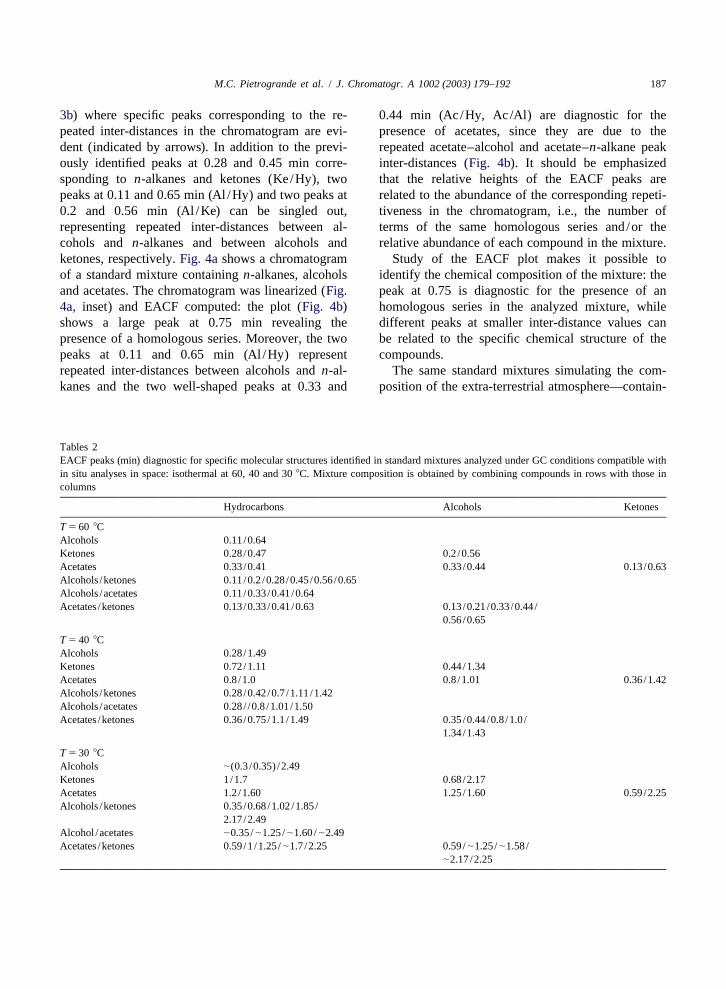
3b) where specific peaks corresponding to the re- 0.44 min (Ac/Hy, Ac/Al) are diagnostic for thepeated inter-distances in the chromatogram are evi- presence of acetates, since they are due to thedent (indicated by arrows). In addition to the previ- repeated acetate–alcohol and acetate–n-alkane peakously identified peaks at 0.28 and 0.45 min corre- inter-distances (Fig. 4b). It should be emphasizedsponding ton-alkanes and ketones (Ke/Hy), two that the relative heights of the EACF peaks arepeaks at 0.11 and 0.65 min (Al /Hy) and two peaks at related to the abundance of the corresponding repeti-0.2 and 0.56 min (Al /Ke) can be singled out, tiveness in the chromatogram, i.e., the number ofrepresenting repeated inter-distances between al- terms of the same homologous series and/or thecohols and n-alkanes and between alcohols and relative abundance of each compound in the mixture.ketones, respectively.Fig. 4ashows a chromatogram Study of the EACF plot makes it possible toof a standard mixture containingn-alkanes, alcohols identify the chemical composition of the mixture: theand acetates. The chromatogram was linearized (Fig. peak at 0.75 is diagnostic for the presence of an4a, inset) and EACF computed: the plot (Fig. 4b) homologous series in the analyzed mixture, whileshows a large peak at 0.75 min revealing the different peaks at smaller inter-distance values canpresence of a homologous series. Moreover, the two be related to the specific chemical structure of thepeaks at 0.11 and 0.65 min (Al /Hy) represent compounds.repeated inter-distances between alcohols andn-al- The same standard mixtures simulating the com-kanes and the two well-shaped peaks at 0.33 and position of the extra-terrestrial atmosphere—contain-
T ables 2EACF peaks (min) diagnostic for specific molecular structures identified in standard mixtures analyzed under GC conditions compatible within situ analyses in space: isothermal at 60, 40 and 308C. Mixture composition is obtained by combining compounds in rows with those incolumns
Hydrocarbons Alcohols Ketones
T 5 60 8CAlcohols 0.11/0.64Ketones 0.28/0.47 0.2/0.56Acetates 0.33/0.41 0.33/0.44 0.13/0.63Alcohols /ketones 0.11/0.2/0.28/0.45/0.56/0.65Alcohols /acetates 0.11/0.33/0.41/0.64Acetates/ketones 0.13/0.33/0.41/0.63 0.13/0.21/0.33/0.44/
0.56/0.65
T 5 40 8CAlcohols 0.28/1.49Ketones 0.72/1.11 0.44/1.34Acetates 0.8/1.0 0.8/1.01 0.36/1.42Alcohols /ketones 0.28/0.42/0.7/1.11/1.42Alcohols /acetates 0.28/ /0.8 /1.01/1.50Acetates/ketones 0.36/0.75/1.1/1.49 0.35/0.44/0.8/1.0 /
1.34/1.43
T 5 30 8CAlcohols |(0.3/0.35) /2.49Ketones 1/1.7 0.68/2.17Acetates 1.2/1.60 1.25/1.60 0.59/2.25Alcohols /ketones 0.35/0.68/1.02/1.85/
2.17/2.49Alcohol /acetates |0.35/|1.25/|1.60/|2.49Acetates/ketones 0.59/1/1.25/|1.7/2.25 0.59/|1.25/|1.58/
|2.17/2.25

188 M.C. Pietrogrande et al. / J. Chromatogr. A 1002 (2003) 179–192
ing n-alkanes, alcohols, acetates and ketones—wereTable 2) show that, under each experimental con-also analyzed under different isothermal conditions dition, it is possible to identify EACF peaks diagnos-(30 and 408C) compatible with in situ analyses in tic of the presence of two or more classes ofspace[25,26]. On the linearized chromatograms the compounds present in the analyzed mixture.EACF was computed and specific EACF peaks can The developed procedure has been applied to twobe identified: the obtained results (summarized in specific investigations related to space research: a
Fig. 5. Selectivity of MTX 1 and RTX-20 columns towardsn-hydrocarbons, alcohols and ketones. Isothermal conditions at 608C, flow-rate2125.6 cm s . (a) Experimental isothermal chromatogram obtained with the MTX 1 column (linearized chromatogram in the inset); (b)
experimental isothermal chromatogram obtained with the RTX-20 column (linearized chromatogram in the inset); (c) plots of EACVFcomputed from the linearized chromatograms obtained with the MTX 1 (———) and RTX-20 (? ? ?) columns.

M.C. Pietrogrande et al. / J. Chromatogr. A 1002 (2003) 179–192 189
comparison of two different GC columns in order to of the EACF peak at 0.68 min (Fig. 5c). As aselect the best retention selectivity and a study of the consequence, a significantly better separation can bechemical composition of an unknown mixture. obtained on the RTX-20 column than on MXT 1.
This result is obvious for the separation of simple4 .1. Comparison of the retention selectivity of two mixtures, such as those yielding the chromatogramsdifferent GC columns shown in the inset ofFig. 5a and b,but it is not so
clear with the forest of peaks present in a complexA standard mixture was analyzed under the same chromatogram having very crowded peaks[12]. In
separation conditions (608C with a flow-rate of 25.6 these chromatograms, extraction of information on21cm s ) on MTX-1 and RTX-20 columns (Fig. 5a specific compounds is very difficult and study of the
and b). The EACF was computed for the linearized EACF plot is very powerful in such cases.chromatograms (Fig. 5a and b,inset): a comparisonof the obtained EACF plots (Fig. 5c) makes it 4 .2. Study of the chemical composition of anpossible to investigate the different selectivity of the unknown mixturetwo stationary phases in a very immediate way. TheEACF peaks related to CH retention increment— An unknown sample was analyzed under iso-2
i.e., selectivity vs. carbon number—for both columns thermal conditions: a Light Petroleum (Fluka) (b.p.are very close (0.68 and 0.75 min for MXT 1 and 100–1608C) was submitted to GC analysis at 408C
21RTX-20, respectively), while peaks related to the on the RTX-20 column (flow-rate 25.6 cm s ). Theinter-distance between different classes—i.e., selec- extended FA procedure, developed to study iso-tivity vs. different chemical classes—are located in thermal chromatograms[3,12], was applied to thedifferent regions. For alcohol–ketone pair selectivity, obtained chromatogram (lower chromatogram inFig.for the RTX-20 column the inter-distance between 6a): the number of components,m, can be estimatedalcohol and ketone peaks is well defined (0.20 and as well as the standard deviation of the narrowest,0.56 min) as shown by the well-shaped EACF peaks. s , and largest,s , peaks. The obtainedm value was1 2
On the other hand, no baseline separation is obtained 54: this value permits an estimate of the extent ofwith the MXT 1 column, as shown by the shoulders overlappingg 5 p /m, i.e., the fraction of components
Fig. 5. (continued)

190 M.C. Pietrogrande et al. / J. Chromatogr. A 1002 (2003) 179–192
Fig. 6. GC separation of a Light Petroleum (b.p. 100–1608C) sample. Column, RTX-20; isothermal temperature conditions, 408C;21flow-rate, 25.6 cm s . (a) Chromatograms of the Light Petroleum sample (lower curve) and a standardn-alkane mixture (upper curve).
Inset: linearized chromatogram of the Light Petroleum sample. (b) Comparison between the plot of EACF computed on the linearizedchromatograms of the original (———) andn-alkane-enriched mixture (? ? ?). (c) Comparison between the plot of EACF computed on thelinearized chromatograms of the original (———) and acetate-enriched mixture (? ? ?).
present in the mixture,m, which appear in the analytical information (number of components) pres-chromatogram as peaks,p. Since 33 peaks can be ent in the chromatogram can be observed. Also, thedetected in the chromatogram (p 533) the obtained separation performance can be estimated by meansg value is 0.61: this means that only 61% of the of the standard deviation of the narrowest,s 5 0.011

M.C. Pietrogrande et al. / J. Chromatogr. A 1002 (2003) 179–192 191
Fig. 6. (continued)
min, and largest peaks,s 5 0.06 min. The reliability Table 2) from those shown in the original EACF plot2
of the obtained values was checked by comparison (shoulders at 0.9 min,Fig. 6c).with s values estimated independently using asoftware package[12]. Moreover, in order to obtaininformation on sample chemical composition, the 5 . Conclusionsoriginal chromatogram was linearized (Fig. 6a,inset)and the EACF function was computed (plot inFig. The described extension of the chemometric FA6b and c): the EACF peaks were compared with approach to the study of isothermal chromatogramsthose obtained from standard mixtures (Table 2) as a proves useful in characterizing complex chromato-diagnostic for the identification of specific molecular grams showing an inhomogeneous retention pattern,structures. The presence ofn-alkanes was identified i.e., chromatograms obtained under isothermal or farin the mixture, while alcohols, acetates and ketones from optimal temperature-programmed conditions.were ruled out (they are beyond the abundance The reported linearization procedure makes it pos-threshold level of the method). The presence of sible to obtain a chemical characterization of thespecific molecular structures can be checked by analyzed sample since the presence of specificenriching the original sample with the corresponding molecular structures can be easily identified throughstandard compounds: if the original EACF peaks are simple graphical inspection of the EACF plot assignificantly increased, the presence of the corre- compared to analysis of standard mixtures. In addi-sponding compounds is confirmed. This result was tion, information on separation properties—i.e, mix-obtained by enriching the analyzed mixture with ture complexity,m, and system performance,s—cann-alkanes (upper chromatogram inFig. 6a): their be extracted from the EACF plot, as previouslypresence is confirmed by the correspondence be- reported[12].tween the EACF plots of the original and enriched The method represents an exceptional tool forchromatograms (Fig. 6b). On the contrary, the interpreting data recovered from space missions:presence of acetates can be ruled out: in fact, if these simple handling of the original data makes it possiblestandards are added to the sample, the EACF peaks to extract information on the number and chemicalobtained are significantly different (0.8 and 1 min, structure of components of extra-terrestrial matter.
192 M.C. Pietrogrande et al. / J. Chromatogr. A 1002 (2003) 179–192
[10] A . Felinger, M.C. Pietrogrande, Anal. Chem. 73 (2001)Moreover, the information obtained on separation618A.performance can be used to develop proper GC
[11] M .C. Pietrogrande, P. Coll, R. Sternberg, C. Szopa, R.instrumentation and columns that provide the bestNavarro-Gonzalez, C. Vidal-Majar, F. Dondi, J. Chromatogr.
possible performance under the extreme flight con- A 939 (2001) 69.ditions of future space missions. [12] M .C. Pietrogrande, P. Coll, R. Sternberg, C. Szopa, R.
Navarro-Gonzalez, C. Vidal-Majar, F. Dondi, J. Sep. Sci. 26The proposed method is the initial step in a(2003) 569.general linearization approach: it is a simplified
[13] J .M. Davis, J.C. Giddings, Anal. Chem. 55 (1983) 418.procedure based on an experimental reference chro-[14] C . Giddings, Unified Separation Science, Wiley, New York,matogram. Further development concerning the ana-
1991.lytical derivatization of the mathematical function is ´[15] B .L. Karger, L.R. Snyder, Cs. Horvath, An Introduction tocurrently being studied. Separation Science, Wiley, New York, 1973.
[16] A .B. Littlewood, Gas Chromatography: Principles, Tech-niques and Applications, Academic Press, New York, 1970.
[17] L .M. Blumberg, M.S. Klee, J. Chromatogr. A 933 (2001) 13.6 . Nomenclature[18] S .O. Akapo, J.-M.D. Dimandja, D.R. Valentin, G.C. Carle, J.
Chromatogr. A 842 (1999) 147.ACVF autocovariance function [19] A . Aflalaye, S. Anguel, R. Sternberg, F. Raulin, C. Vidal-EACVF experimental autocovariance function Madjar, J. Chromatogr. A 746 (1996) 63.
[20] R . Sternberg, C. Szopa, D. Coscia, S. Zubrzycki, F. Raulin,ACF autocorrelation functionC. Vidal-Madjar, H. Niemann, G. Israel, J. Chromatogr. AEACF experimental autocorrelation function846 (1999) 307.FA Fourier analysis
[21] C . Szopa, R. Sternberg, D. Coscia, H. Cottin, F. Raulin, F.Goesmann, H. Rosenbauer, J. Chromatogr. A 863 (1999)157.
R eferences [22] R . Sternberg, F. Raulin, C. Vidal-Madjar, in: I.D. Wilson,E.R. Adlard, M. Cooke, C.F. Poole (Eds.), Encyclopedia ofSeparation Science, Vol. 9, Academic Press, London, 2000,[1] A . Felinger, L. Pasti, F. Dondi, Anal. Chem. 62 (1990) 1846.p. 4212.[2] A . Felinger, L. Pasti, P. Reschiglian, F. Dondi, Anal. Chem.
[23] P . Coll, D. Coscia, N. Smith, M.-C. Gazeau, S.I. Ramirez, G.62 (1990) 1854.Cernogora, G. Israel, F. Raulin, Planet. Space Sci. 47 (1999)[3] A . Felinger, L. Pasti, F. Dondi, Anal. Chem. 63 (1991) 2627.1331.[4] A . Felinger, L. Pasti, F. Dondi, Anal. Chem. 64 (1992) 2164.
[24] P . Coll, J.-C. Guillemin, M.-C. Gazeau, F. Raulin, Planet.[5] F . Dondi, A. Betti, L. Pasti, M.C. Pietrogrande, A. Felinger,Space Sci. 47 (1999) 1433.Anal. Chem. 65 (1993) 2209.
[25] C . Szopa, R. Sternberg, D. Coscia, F. Raulin, C. Vidal-[6] M .C. Pietrogrande, L. Pasti, F. Dondi, M.H. Bollain Rod-Madjar, J. Chromatogr. A 904 (2000) 73.riguez, M.A. Carro Diaz, J. High Resolut. Chromatogr. 17
[26] C . Szopa, R. Sternberg, D. Coscia, F. Raulin, C. Vidal-(1994) 839.Madjar, H. Rosenbauer, J. Chromatogr. A 953 (2002) 165.[7] M .C. Pietrogrande, F. Dondi, A. Felinger, J. High Resolut.
[27] M . Joll, D. Bowlin, J.M. Davis, Anal. Chim. Acta 302Chromatogr. 19 (1996) 327.(1995) 133.[8] F . Dondi, M.C. Pietrogrande, A. Felinger, Chromatographia
[28] J .M. Davis, J. Microcol. Sep. 9 (1997) 193.45 (1997) 435.[9] M .C. Pietrogrande, D. Ghedini, G. Velada, F. Dondi, Analyst [29] A . Felinger, Data Analysis and Signal Processing in Chroma-
123 (1998) 1199. tography, Elsevier, Amsterdam, 1998.