decarbonization wedges - alliance ancre
TRANSCRIPT
Decarbonization Wedges
November 2015Report
Networks/Grids
Transport
Marine
Biomass
Wind
Building
CCSHydro
SolarIndustry
Storage
GeothermalNuclear
Power to Gas and H2
Networks/Grids
TransportMarine
Biomass
WindBuilding
CCS
HydroSolar
IndustryStorage
GeothermalNuclear
Power to Gas and H2
Power to Gas/H2
This study was carried out under the supervision of the ANCRE Thematic Group 9 on Energy Prospect (GP9), hosted by N. Alazard-Toux, P. Criqui and JG. Devezeaux de Lavergne. L. Chevallet, S. Gentier, E. Hache, E. Le Net, Ph. Menanteau and Fr. Thais also took part in the thematic group. Other ANCRE thematic groups have contributed to this report, notably JL. Achard, Fr. Allard, O. Authier, A. Babarit, Fr. Badin, F. Bazile, O. Bernard. JP. Birat, P. Brault, A. Burnol, Fr. Carré, F. Delrue, A. Dufour, JL. Duplan, P. Durand, O. Duval, H. Fabriol, P. Ferrant, G. Flamant, L. Forti, J. Garnier, M. Gimenez, O. Goyeneche, N. Hadj Said, Fr. Jasserand, F. Kalaydjian, M. Le Boulluec, J. Legrand, D. Lorne, P. Lucchese, S. Magand, Ph. Malbranche, N. Mermillod, F. Monot, B. Olivier, P. Pacaud, Ph. Papillon, C. Ponsot-Jacquin, D. Quenard, X. Rachez, M. Rapin, Ph. Rocher, B. Sanjuan, V. Sauvant-Moynot, R. Tilagone, S. Vinot. This report would not have been complete without the help of student interns working for the ANCRE: R. Berthomieu and A. Vajnovszki.
The report and the templates are available on ANCRE website: http://www.allianceenergie.fr Le rapport et les fiches sont disponibles sur le site de l’alliance : http://www.allianceenergie.fr
Founded on 17 July 2009 on the initiative of the Minister for Higher Education and Research and the Secretary of State for Ecology, the mission of ANCRE (French National Alliance for Energy Research Coordination) is to increase the effectiveness of French research in the field of energy and to suggest a coordinated policy for research between French public and private bodies: CEA, CNRS, IFPEN and CPU (French University Presidents’ Conference), ANDRA, BRGM, CDEFI, CIRAD, CSTB, IFREMER, IFSTTAR, INERIS, INRA, INRIA, IRD, IRSN, IRSTEA, LNE and ONERA.
3
Foreword/Avant-propos 2015 is a particularly eventful year in the field of energy. From 30 November through 11 December, France will host the 21st Conference of the Parties on Climate Change (COP21) in Paris. The expectations for this international event are high. Its main goal is to obtain an agreement to keep global warming below 2° C by securing a set of voluntary commitments from the various countries and regions of the world to reduce global greenhouse gas emissions and by mobilizing $100 billion per year from 2020 onwards to finance climate change policies, especially in developing countries. In France, the year 2015 was also marked by the adoption of the Energy Transition and Green Growth Act that set a course and defined a roadmap, through a set of objectives, aimed at helping our country reduce its CO2 emissions in the field of energy. In this context, ANCRE (French National Alliance for Energy Research Coordination) would like to reiterate the major role of energy research and innovation in reducing anthropogenic (i.e. human induced) greenhouse gas emissions through research conducted on decarbonization wedges, a key technology in the fight against climate change in the field of energy on a planetary scale. Limiting the temperature increase on the earth's surface to 2° C by 2100 is a challenging target, but it could be achievable with the rapid, sustained development and wide dissemination of a broad set of technologies. However, to achieve this goal, it is indispensable to conduct research aimed at speeding up low carbon technologies deployment and at reducing their cost. Through this joint report to which numerous researchers and experts contributed, ANCRE wishes to continue its efforts to build a global strategic vision that an Alliance comprising nearly 19 different research institutions can provide. This study follows the work conducted on energy transition scenarios for France1 and the roadmaps drawn up by the ten programmatic groups structuring the Alliance. All this work is contributing to foster French and European strategic thinking in the field of energy. We hope that this report on Decarbonization Wedges will be widely presented and disseminated at both French and international levels, promoting discussion and reflection on the role of research and innovation in the field of energy. 2015 est une année particulièrement riche pour le domaine de l’Energie. La France accueille à Paris, du 30 novembre au 11 décembre, la 21ème Conférence des Parties sur le Changement Climatique (COP21). Les attentes concernant ce rendez-vous international sont fortes. Son principal objectif est d’obtenir un accord pour maintenir le réchauffement climatique en-dessous de 2°C, en collectant l’ensemble des engagements volontaires des différents pays ou régions du monde pour une diminution globale des émissions de gaz à effet de serre et en mobilisant 100 G$ par an à partir de 2020 pour financer les politiques de changement climatique, notamment dans les pays en développement. Sur un plan national, l’année 2015 a également été marquée par l’adoption de la Loi pour la Transition Energétique et la Croissance Verte qui fixe un cap et définit, à travers un ensemble d’objectifs, la trajectoire qui doit permettre à notre pays de réduire ses émissions de CO2 dans le domaine de l’énergie. Dans ce contexte, l’ANCRE (Alliance Nationale de Coordination de la Recherche pour l’Energie) souhaite à travers le travail mené sur les « Decarbonization Wedges », que l’on pourrait traduire par les technologies clés pour lutter contre le changement climatique dans le domaine de l’Energie à l’échelle de la planète, rappeler le rôle majeur que joue la recherche et l’innovation dans le domaine de l’énergie pour limiter les émissions anthropiques de gaz à effet de serre. Contenir l’augmentation de la température de la surface du globe à 2°C d’ici 2100 est un objectif très ambitieux, mais celui-ci apparaît atteignable avec le développement à un rythme soutenu et une diffusion à grande échelle d’un large portefeuille de technologies. Il est cependant indispensable pour y parvenir de mener les travaux visant à accélérer le déploiement des technologies à bas carbone et à en réduire les coûts. A travers ce rapport collectif auquel ont participé de nombreux chercheurs et experts, l’ANCRE souhaite poursuivre sa contribution à la construction d’une vision stratégique globale que peut apporter une Alliance constituée de près de 19 institutions différentes de recherche. Ce travail fait suite à celui mené sur les scénarios de transition énergétique pour la France2 et aux feuilles de route établies par les dix groupes programmatiques qui structurent l’Alliance, autant de travaux qui contribuent aux réflexions nationales et européennes dans le domaine de l’énergie. Notre objectif est que ce rapport sur les « Decarbonization Wedges » fasse l’objet de nombreuses présentations, tant au niveau français qu’au niveau international, et permette d’alimenter les échanges et les questionnements sur le rôle de la recherche et de l’innovation dans le domaine de l’énergie.
Didier Houssin President of the ANCRE alliance
1 ANCRE’s energy transition scenarios are available at http://www.allianceenergie.fr 2 Scénarios de l’ANCRE pour la transition énergétique, disponible à cette adresse : http://www.allianceenergie.fr

Table of contents 1 Introduction ................................................................................................................................................ 7
2 Contribution of the different technologies to decarbonization: the vision from the DDP national contributions .............................................................................................................................................. 8
2.1 Technological options to reduce GHG emissions in DDPP ................................................................. 8
2.2 The Deep Decarbonization Pathways Project (DDPP) ........................................................................ 9
2.3 The methodology to identify the main wedges ................................................................................. 9
2.4 Which wedges for a deep decarbonization? .................................................................................... 11
2.4.1 Total CO2 emissions, final consumption and power mix .......................................................... 11
2.4.2 Regional CO2 emissions, demand/supply-side wedges ............................................................ 12
2.4.3 Regional power CO2 emissions, supply-side wedges ............................................................... 14
3 Contribution of the different technologies to decarbonization: the vision of the research community in the ANCRE alliance ................................................................................................................................... 15
3.1 The ANCRE DW study: key factors ................................................................................................... 15
3.2 Development capacity of the main technologies for decarbonization ............................................ 16
3.2.1 Efficiency & decarbonization in industry .................................................................................. 16
3.2.2 Efficiency & decarbonization in the building sector ................................................................. 16
3.2.3 Efficiency & decarbonization in the transportation sector ...................................................... 17
3.2.4 Renewable energy .................................................................................................................... 17
3.2.5 Nuclear energy ......................................................................................................................... 18
3.2.6 CO₂ capture and storage .......................................................................................................... 18
3.3 Evolution of technologies for the ANCRE experts: analysis of key factors ...................................... 19
3.3.1 Technology maturity dynamics ................................................................................................ 19
3.3.2 Wedges’ dynamics (in terms of avoided emissions) ................................................................ 20
3.3.3 Major bottlenecks .................................................................................................................... 21
3.3.4 Radical and incremental innovations ....................................................................................... 22
3.4 Evaluation of the potential of new technologies for deep decarbonization ................................... 23
4 Public policies to accelerate the development of low-carbon technologies ........................................... 26
4.1 A systemic perspective: decarbonization as a sociotechnical process ............................................ 27
4.2 The technology-push approach: the global R&D effort is not sufficient.......................................... 28
4.3 Demand-Pull: which type of economic tools must be favored? ...................................................... 28
4.4 Guiding companies in the transition between technology-push and demand-pull approaches ..... 29
4.5 Integrated policies: the timing and alignment of technology policies ............................................. 30
4.6 International cooperation and technological transfers ................................................................... 31
5 Main conclusions ...................................................................................................................................... 32
6 Appendix 1: comparison between DWs and the DDPP ............................................................................ 34
7 Appendix 2: main results per family ......................................................................................................... 36
8 Appendix 3: DW seminar (16th of October 2015) ..................................................................................... 51
6
List of figures Figure 1 – Overview of the DW study ................................................................................................................ 8 Figure 2 - Four country groupings from DDPP ................................................................................................. 11 Figure 3 – DDPP: CO2 emissions - world results (different scales) ................................................................... 12 Figure 4 – DDPP: CO2 emissions - regional results (different scales) ............................................................... 13 Figure 5 – DDPP: Power CO2 emissions - regional results (different scales) ................................................... 14 Figure 6 –Technology maturity ........................................................................................................................ 19 Figure 7 –Dynamics according to wedges and maturity .................................................................................. 20 Figure 8 – Main bottlenecks ............................................................................................................................. 21 Figure 9 – Radical and incremental innovations vs. bottlenecks ..................................................................... 23 Figure 10 – Radical and incremental innovations according to technology families ....................................... 23 Figure 11 – DDPP abatement objectives compared to potential CO2 abatement estimated by ANCRE-WGs 24 Figure 12 - Wedges dynamics in the DW study ................................................................................................ 26 Figure 13 - Multi-level perspective on transitions ........................................................................................... 27 Figure 14 - IEA Energy R&D budgets and oil prices .......................................................................................... 28 Figure 15 – Learning impact: solar power as an example ................................................................................ 29 Figure 16 – The “Death Valley” for new energy technologies ......................................................................... 30 Figure 17 - Public policy instruments ............................................................................................................... 30 Figure 18 - Wedges dynamics in the “adjusted” DW study (cf. above table) .................................................. 36
List of tables Table 1 – The 17 wedges in DDPP .................................................................................................................... 10 Table 2 - Mitigation potential scaling ............................................................................................................... 15 Table 3 - Mitigation potential of energy and environmental efficiency in industry ........................................ 16 Table 4 - Mitigation potential of CO₂ mitigation technologies in the cement industry ................................... 16 Table 5 - Mitigation potential of low-carbon steelmaking ............................................................................... 16 Table 6 - Mitigation potential of low-carbon building and building envelopes ............................................... 17 Table 7 - Mitigation potential of thermal engines, hybrid and electric vehicles and H₂ vehicles .................... 17 Table 8 - Mitigation potential of Renewable energy technologies .................................................................. 18 Table 9 - Mitigation potential of nuclear energy ............................................................................................. 18 Table 10 - Mitigation potential of CO₂ capture and storage ............................................................................ 18 Table 11– Identifying the major bottlenecks ................................................................................................... 22 Table 12 – DDPP abatement contributions compared to DW estimated contributions (in GtCO2) ................ 25 Table 13 – DW structure: technologies ............................................................................................................ 34 Table 14 – TRL scale and DW maturity scaling ................................................................................................. 34 Table 15 – DW and DDPP (%) ........................................................................................................................... 35 Table 16 – DW and DDP: wedges structures’ impacts ..................................................................................... 36
7
1 Introduction
In late 2015 France will be hosting and chairing the 21st Session of the Conference of the Parties to the United Nations Framework Convention on Climate Change, or COP21. The aim of this conference is to reach a global agreement based on national contributions (INDC)3 and on an investment framework to tackle climate change and to boost the transition toward resilient, low-carbon societies and economies.
Created in 2009 in response to an OPECST4 recommendation and with the support of the Minister for Higher Education and Research and the Minister for Ecology and Energy, ANCRE, the National Alliance for Energy Research Coordination, brings together all the French public research organizations concerned with energy issues. The aim of ANCRE is to enhance the efficiency of French research in the field of energy through a coordinated strategy for research and development. ANCRE aims to propose roadmaps considered as strategic for R&D in relation to industrial objectives in order to overcome the main scientific, technological, economic and societal bottlenecks.
ANCRE will be taking part in the COP21 debates with its vision on the role of technologies in reducing global CO₂ emissions, in keeping with the limitation of global temperature increase to 2°C above pre-industrial levels by 2100, or 2°C scenario. Within the framework of the study carried out by ANCRE, experts were asked to identify and to evaluate what S. Pacala and R. Socolow call "Decarbonization Wedges", that is levers (most of them being technological levers) which appear to be crucial to the deep decarbonization of the global energy system.
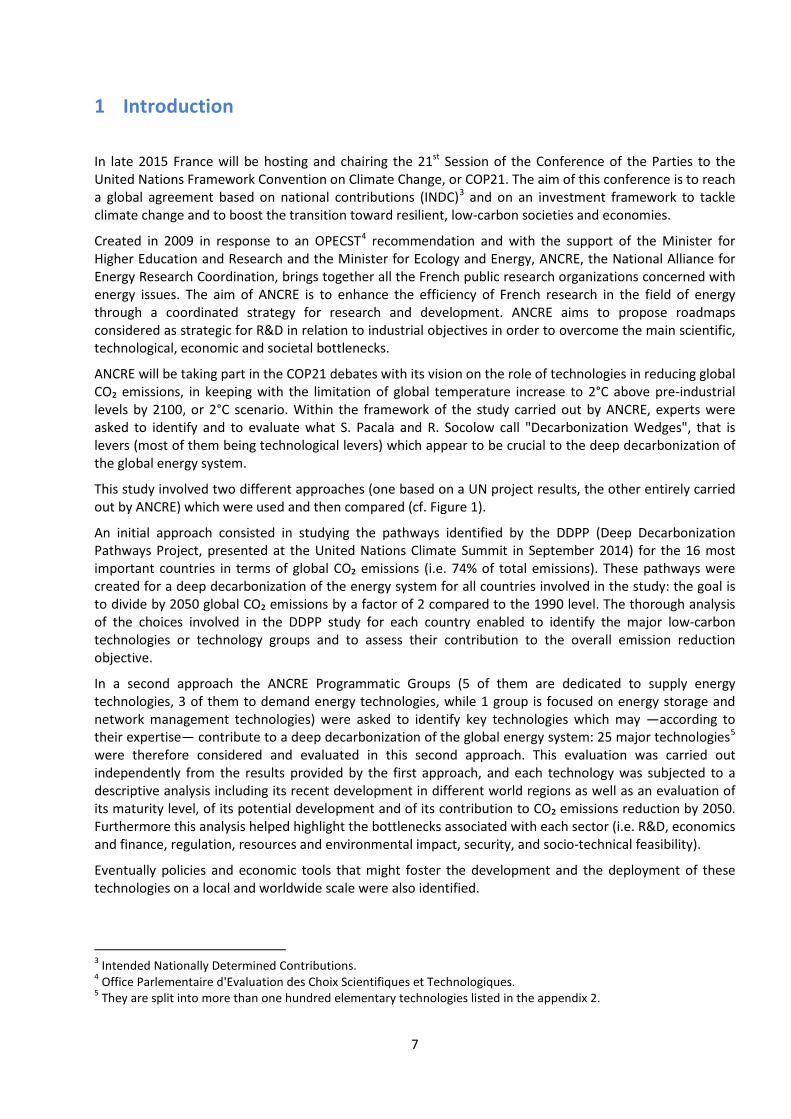
This study involved two different approaches (one based on a UN project results, the other entirely carried out by ANCRE) which were used and then compared (cf. Figure 1).
An initial approach consisted in studying the pathways identified by the DDPP (Deep Decarbonization Pathways Project, presented at the United Nations Climate Summit in September 2014) for the 16 most important countries in terms of global CO₂ emissions (i.e. 74% of total emissions). These pathways were created for a deep decarbonization of the energy system for all countries involved in the study: the goal is to divide by 2050 global CO₂ emissions by a factor of 2 compared to the 1990 level. The thorough analysis of the choices involved in the DDPP study for each country enabled to identify the major low-carbon technologies or technology groups and to assess their contribution to the overall emission reduction objective.
In a second approach the ANCRE Programmatic Groups (5 of them are dedicated to supply energy technologies, 3 of them to demand energy technologies, while 1 group is focused on energy storage and network management technologies) were asked to identify key technologies which may —according to their expertise— contribute to a deep decarbonization of the global energy system: 25 major technologies5 were therefore considered and evaluated in this second approach. This evaluation was carried out independently from the results provided by the first approach, and each technology was subjected to a descriptive analysis including its recent development in different world regions as well as an evaluation of its maturity level, of its potential development and of its contribution to CO₂ emissions reduction by 2050. Furthermore this analysis helped highlight the bottlenecks associated with each sector (i.e. R&D, economics and finance, regulation, resources and environmental impact, security, and socio-technical feasibility).
Eventually policies and economic tools that might foster the development and the deployment of these technologies on a local and worldwide scale were also identified.
3 Intended Nationally Determined Contributions. 4 Office Parlementaire d'Evaluation des Choix Scientifiques et Technologiques. 5 They are split into more than one hundred elementary technologies listed in the appendix 2.
8
Figure 1 – Overview of the DW study
This report therefore yields a first and rather synthetic vision of the study6 that ANCRE carried out to assess decarbonization wedges (DW) on a global scale and to compare what is desirable to what is feasible and to make the desirable become feasible.
2 Contribution of the different technologies to decarbonization: the vision from the DDP national contributions
2.1 Technological options to reduce GHG emissions in DDPP
The Deep Decarbonization Pathways Project (DDPP) was launched in 2013 to ensure that deep decarbonization scenarios were identified for the largest GHG-emitting countries that is 16 countries which account for 74% of total energy CO₂ emissions from energy. Within this framework, the studies that were carried out in 2014 and in 2015 aim at identifying the major technological and non-technological options considered by these countries to abate their CO₂ emissions. This assessment is detailed hereafter.
It is no surprise that improving energy efficiency, decarbonizing electricity production and other energy carriers as well as substituting low-carbon carriers to fossil fuels in the major energy-consuming sectors appear as the three main options.
Decarbonizing final energy in the end-use sectors does not only imply developing new electricity uses (other low-carbon energy sources such as biomass, geothermal energy, residual heat, … can contribute as well) but it is clear that electrification will play a crucial role for industrial processes, in the building sector and above all for mobility. This is why decarbonization implies that the carbon content per kWh be notably reduced through renewable energy production, through nuclear power (in some world regions) and through CCS: in many countries the latter technology appears to be implemented at the end of the projection period in order to meet ambitious emissions reduction targets.
Eventually it is worth noting that technological changes have been thoroughly assessed in this study but that they also imply an evolution in lifestyles, behavior, regional development, industrial production profiles and even a new growth pattern.
6 This work has been presented and discussed during a seminar (16th of October) − cf. appendix 3. The inputs of the seminar are integrated in the report.
9
2.2 The Deep Decarbonization Pathways Project (DDPP)7
This project aims to illustrate how countries could pursue their national development priorities while achieving a deep decarbonization of energy systems by 2050 consistent with the 2°C limit. This project is co-founded and led by the Sustainable Development Solutions Network (SDSN) and the Institute for Sustainable Development and International Relations (IDDRI).
The DDPP is a collaborative initiative to understand and show how individual countries can transition to a low-carbon economy. It comprises 16 country research teams from countries representing about three quarters of global CO₂ energy emissions and corresponding to different stages of development: Australia, Brazil, Canada, China, France, Germany, India, Indonesia, Italy, Japan, Mexico, Russia, South Africa, South Korea, the U.K. and the U.S.A. Each country research team has developed one or more national deep decarbonization pathways to 2050, focusing in a first place on its technical feasibility.
The 16 illustrative initial pathways developed by the research teams share three common pillars of deep decarbonization of national energy systems:
• Energy efficiency and conservation; • Decarbonization of electricity; • Fuel switching to low-carbon carrier.
These three pillars are common to all countries but their contribution to the decarbonization pathway varies greatly among the 16 countries according to the national circumstances. Differentiating national circumstances include, among others, socio-economic conditions and the new needs associated to economic growth, the availability of renewable energy resources, and the national political imperatives regarding the development of renewable energy, nuclear power, CCS, and other technologies.
The aim of the analysis carried out on these deep decarbonization pathways in the ANCRE Decarbonization Wedges study is to characterize the strategies established by the 16 countries according to their level of economic development and carbon intensity and to identify which main levers or wedges are needed.
2.3 The methodology to identify the main wedges
The Decarbonization Wedges (DW) study aims at identifying the main levers implemented to achieve the deep decarbonization of energy systems. The idea of “wedge” is freely based on the seminal article by S. Pacala and R. Socolow (2004)8 and must be interpreted as an action or as a generic technology (a wedge) leading to a significant GHG emissions reduction and contributing to the abatement of baseline emissions towards a 2°C pathway.
The methodology developed by CNRS-UGA is based on the Logarithmic Mean Divisia Index method (Wang et al., 2005)9 applied to the national dashboards provided in the DDPP. In a series of sectoral Kaya equations, the impacts of three categories of factors that explain the variations in emissions are identified: activity, sectoral energy intensity and sectoral carbon intensity of energy. For each sector, taking into account changes in the activity factor allows to calculate a counter-factual situation with constant energy and carbon intensities (on a decadal basis).
7 http://unsdsn.org/what-we-do/deep-Decarbonization-pathways/ 8 S. Pacala & R. Socolow (2004), “Stabilization Wedges: Solving the Climate Problem for the Next 50 Years with Current Technologies”, Science (vol. 305). 9 Wang C, Chen J. & Zou J. (2005), “Decomposition of energy-related CO2 emission in China”, Energy (vol. 30).
10
The approach involves measuring —with no need for a baseline—, the impacts of the three pillars for decarbonization, which are “efficiency, decarbonization and diffusion of low-carbon energy carriers” while identifying 17 DWs, described as follows: - 6 demand-side DWs, for energy intensity and carbon intensity of energy carriers in three sectors —i.e.
buildings, transport and industry10; - and for the power sector, 11 low-carbon power generation technologies —i.e. gas (as a mere substitute
to coal), gas with CCS, coal with CCS, nuclear power, hydropower, onshore wind power, offshore wind power, solar PV, concentrating solar power, biomass and other (e.g. geothermal).
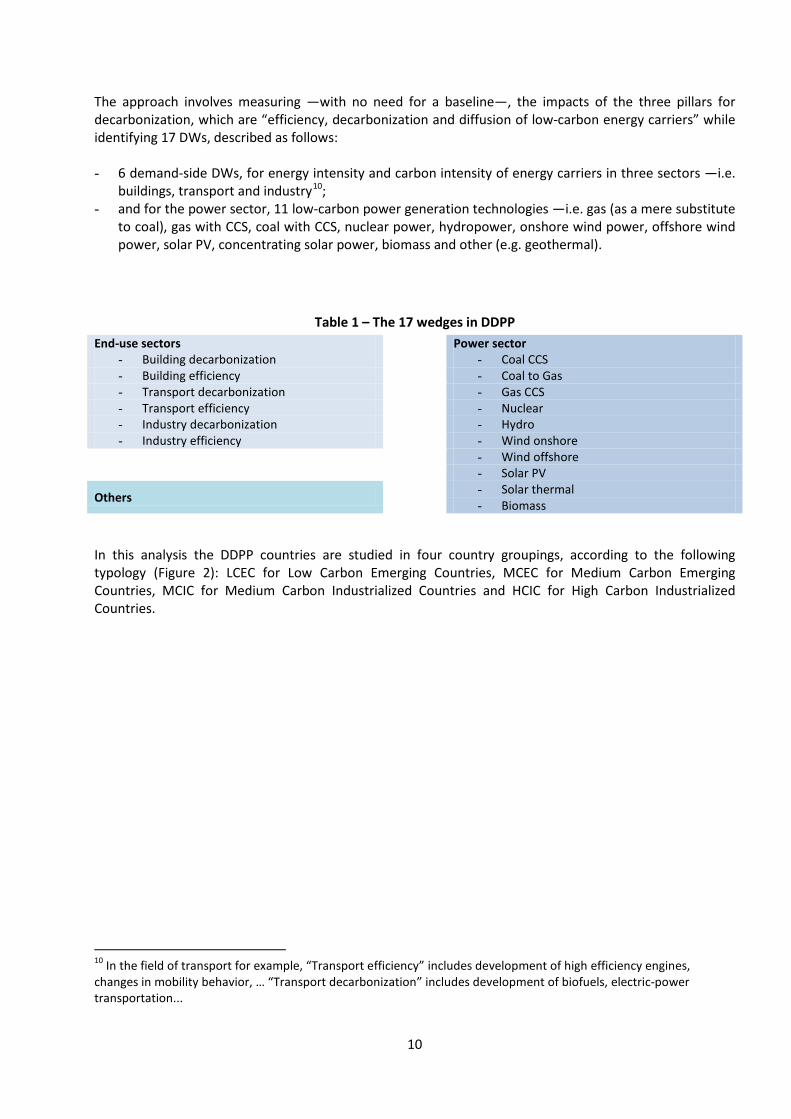
Table 1 – The 17 wedges in DDPP End-use sectors Power sector
- Building decarbonization - Coal CCS - Building efficiency - Coal to Gas - Transport decarbonization - Gas CCS - Transport efficiency - Nuclear - Industry decarbonization - Hydro - Industry efficiency - Wind onshore
- Wind offshore - Solar PV
Others - Solar thermal - Biomass
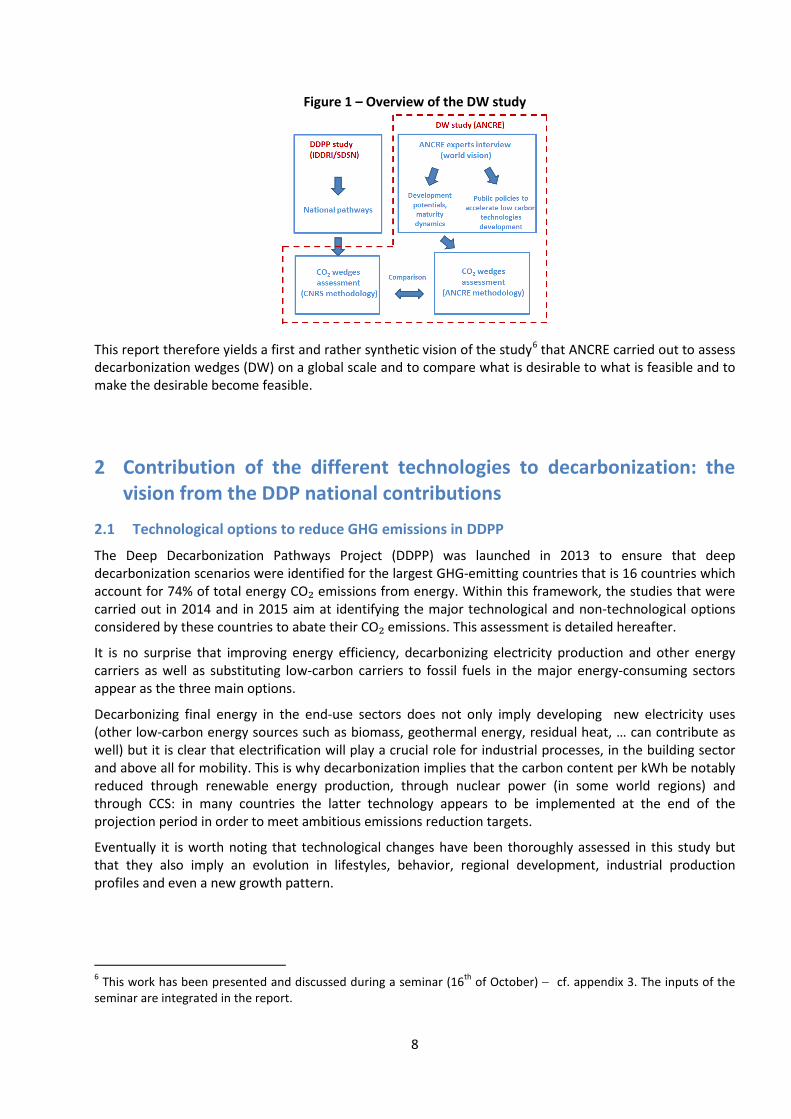
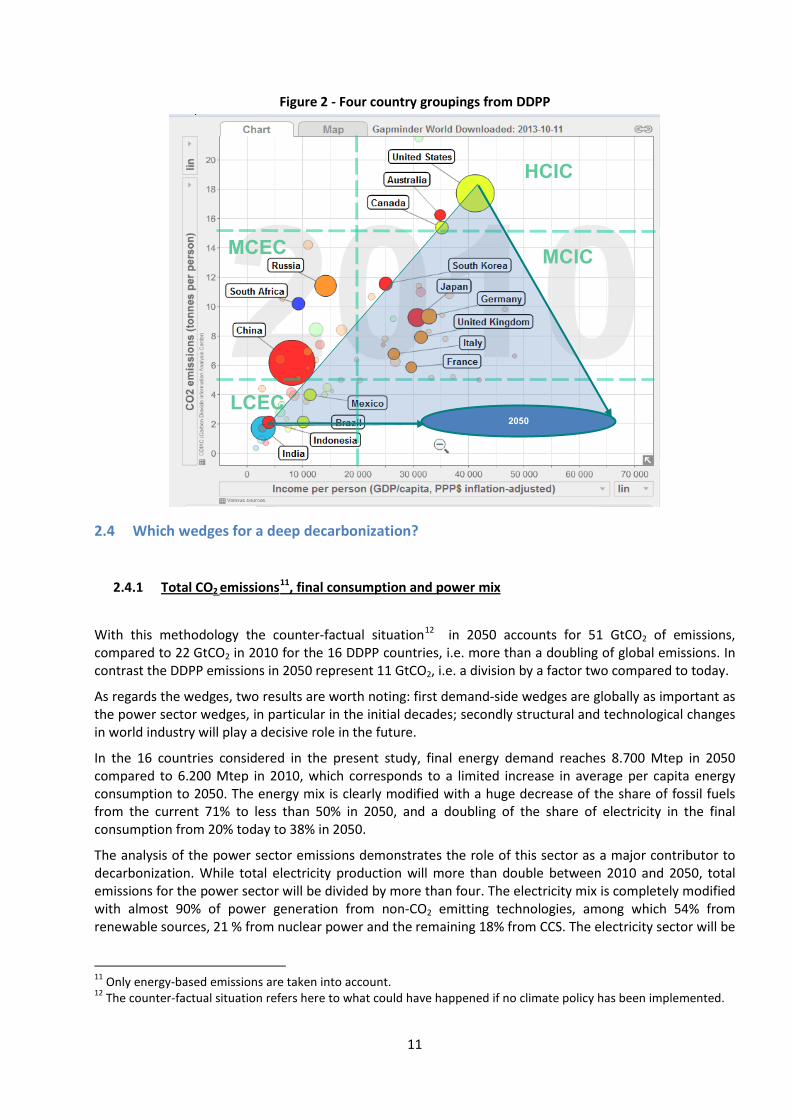
In this analysis the DDPP countries are studied in four country groupings, according to the following typology (Figure 2): LCEC for Low Carbon Emerging Countries, MCEC for Medium Carbon Emerging Countries, MCIC for Medium Carbon Industrialized Countries and HCIC for High Carbon Industrialized Countries.
10 In the field of transport for example, “Transport efficiency” includes development of high efficiency engines, changes in mobility behavior, … “Transport decarbonization” includes development of biofuels, electric-power transportation...
11
Figure 2 - Four country groupings from DDPP
2.4 Which wedges for a deep decarbonization?
2.4.1 Total CO2 emissions11, final consumption and power mix
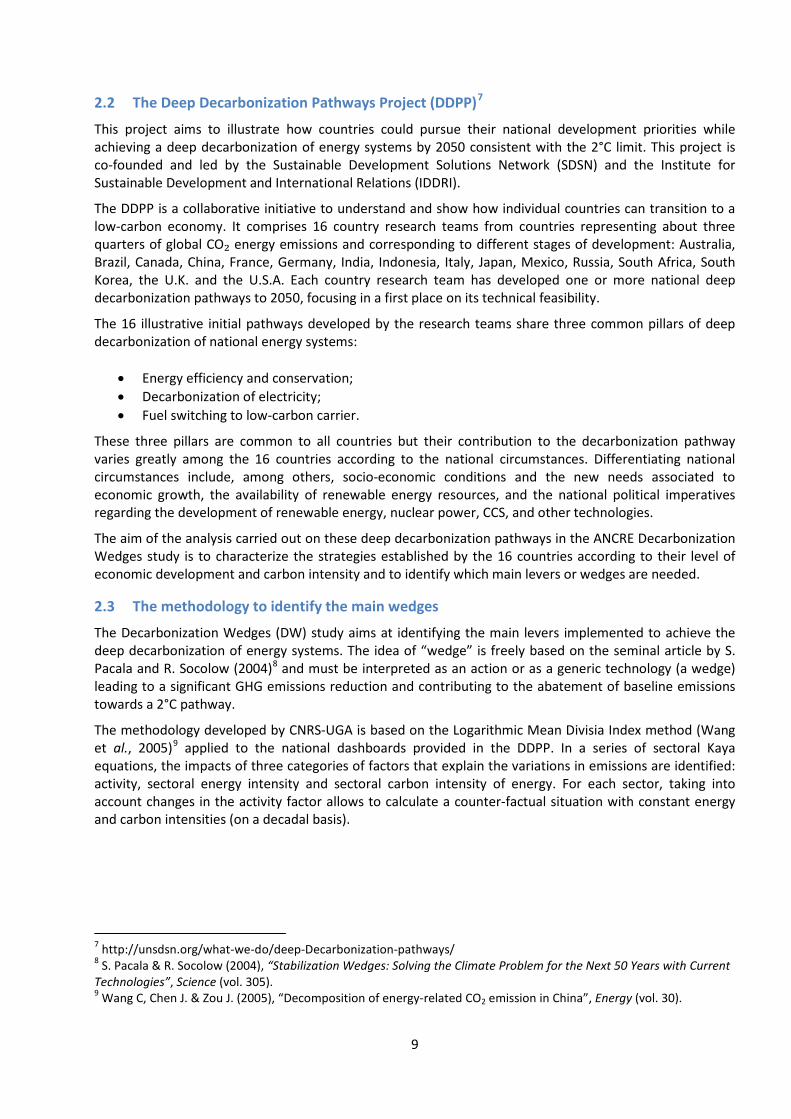
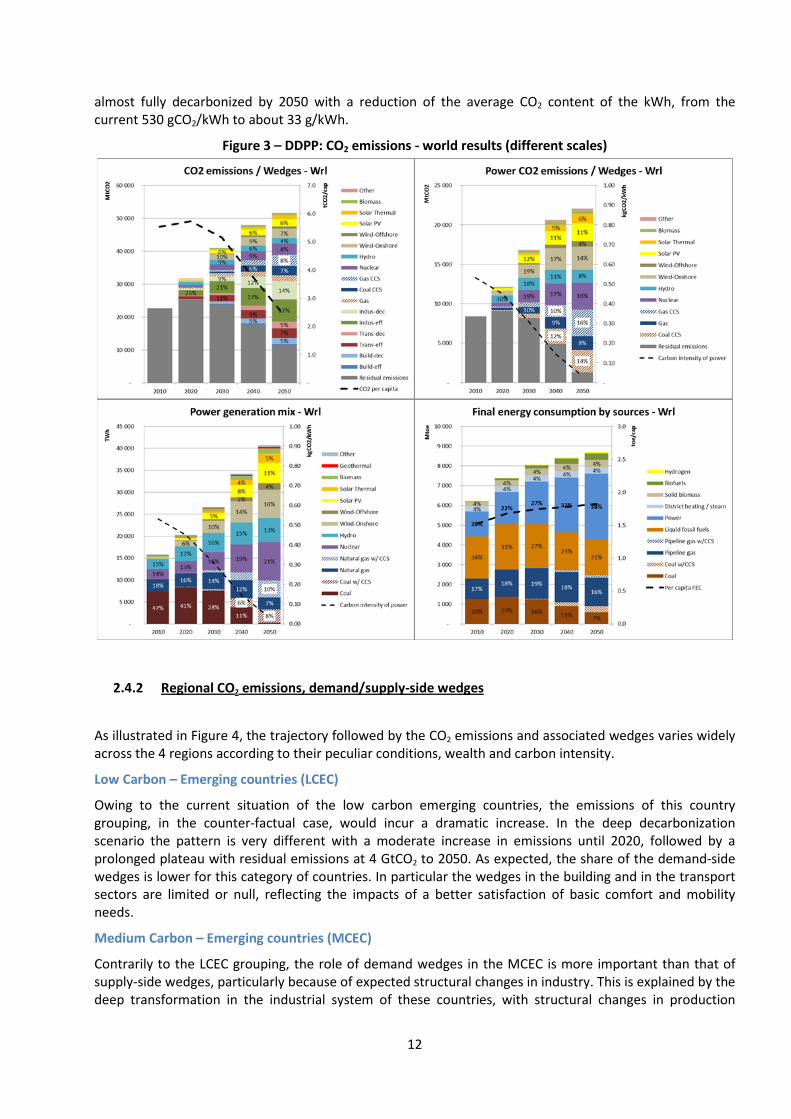
With this methodology the counter-factual situation12 in 2050 accounts for 51 GtCO2 of emissions, compared to 22 GtCO2 in 2010 for the 16 DDPP countries, i.e. more than a doubling of global emissions. In contrast the DDPP emissions in 2050 represent 11 GtCO2, i.e. a division by a factor two compared to today.
As regards the wedges, two results are worth noting: first demand-side wedges are globally as important as the power sector wedges, in particular in the initial decades; secondly structural and technological changes in world industry will play a decisive role in the future.
In the 16 countries considered in the present study, final energy demand reaches 8.700 Mtep in 2050 compared to 6.200 Mtep in 2010, which corresponds to a limited increase in average per capita energy consumption to 2050. The energy mix is clearly modified with a huge decrease of the share of fossil fuels from the current 71% to less than 50% in 2050, and a doubling of the share of electricity in the final consumption from 20% today to 38% in 2050.
The analysis of the power sector emissions demonstrates the role of this sector as a major contributor to decarbonization. While total electricity production will more than double between 2010 and 2050, total emissions for the power sector will be divided by more than four. The electricity mix is completely modified with almost 90% of power generation from non-CO2 emitting technologies, among which 54% from renewable sources, 21 % from nuclear power and the remaining 18% from CCS. The electricity sector will be
11 Only energy-based emissions are taken into account. 12 The counter-factual situation refers here to what could have happened if no climate policy has been implemented.
LCEC
MCEC
HCIC
MCIC
2050
12
almost fully decarbonized by 2050 with a reduction of the average CO2 content of the kWh, from the current 530 gCO2/kWh to about 33 g/kWh.
Figure 3 – DDPP: CO2 emissions - world results (different scales)
2.4.2 Regional CO2 emissions, demand/supply-side wedges
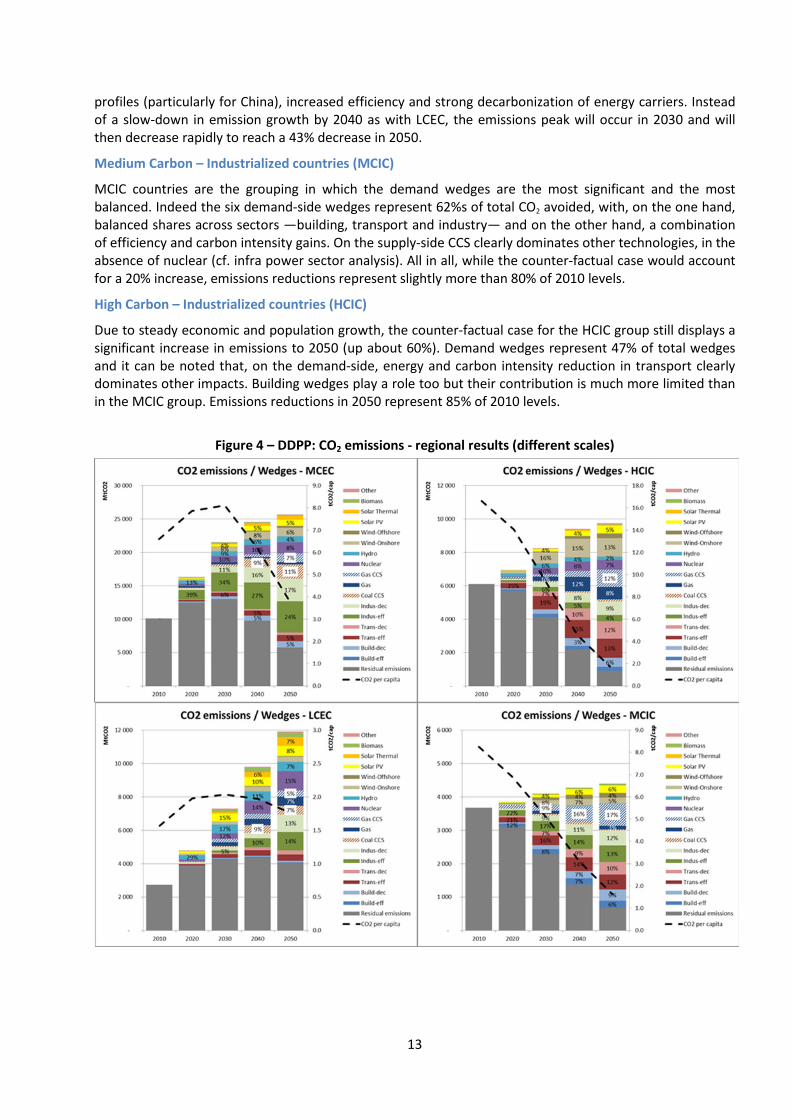
As illustrated in Figure 4, the trajectory followed by the CO2 emissions and associated wedges varies widely across the 4 regions according to their peculiar conditions, wealth and carbon intensity.
Low Carbon – Emerging countries (LCEC)
Owing to the current situation of the low carbon emerging countries, the emissions of this country grouping, in the counter-factual case, would incur a dramatic increase. In the deep decarbonization scenario the pattern is very different with a moderate increase in emissions until 2020, followed by a prolonged plateau with residual emissions at 4 GtCO2 to 2050. As expected, the share of the demand-side wedges is lower for this category of countries. In particular the wedges in the building and in the transport sectors are limited or null, reflecting the impacts of a better satisfaction of basic comfort and mobility needs.
Medium Carbon – Emerging countries (MCEC)
Contrarily to the LCEC grouping, the role of demand wedges in the MCEC is more important than that of supply-side wedges, particularly because of expected structural changes in industry. This is explained by the deep transformation in the industrial system of these countries, with structural changes in production
13
profiles (particularly for China), increased efficiency and strong decarbonization of energy carriers. Instead of a slow-down in emission growth by 2040 as with LCEC, the emissions peak will occur in 2030 and will then decrease rapidly to reach a 43% decrease in 2050.
Medium Carbon – Industrialized countries (MCIC)
MCIC countries are the grouping in which the demand wedges are the most significant and the most balanced. Indeed the six demand-side wedges represent 62%s of total CO2 avoided, with, on the one hand, balanced shares across sectors —building, transport and industry— and on the other hand, a combination of efficiency and carbon intensity gains. On the supply-side CCS clearly dominates other technologies, in the absence of nuclear (cf. infra power sector analysis). All in all, while the counter-factual case would account for a 20% increase, emissions reductions represent slightly more than 80% of 2010 levels.
High Carbon – Industrialized countries (HCIC)
Due to steady economic and population growth, the counter-factual case for the HCIC group still displays a significant increase in emissions to 2050 (up about 60%). Demand wedges represent 47% of total wedges and it can be noted that, on the demand-side, energy and carbon intensity reduction in transport clearly dominates other impacts. Building wedges play a role too but their contribution is much more limited than in the MCIC group. Emissions reductions in 2050 represent 85% of 2010 levels.
Figure 4 – DDPP: CO2 emissions - regional results (different scales)
14
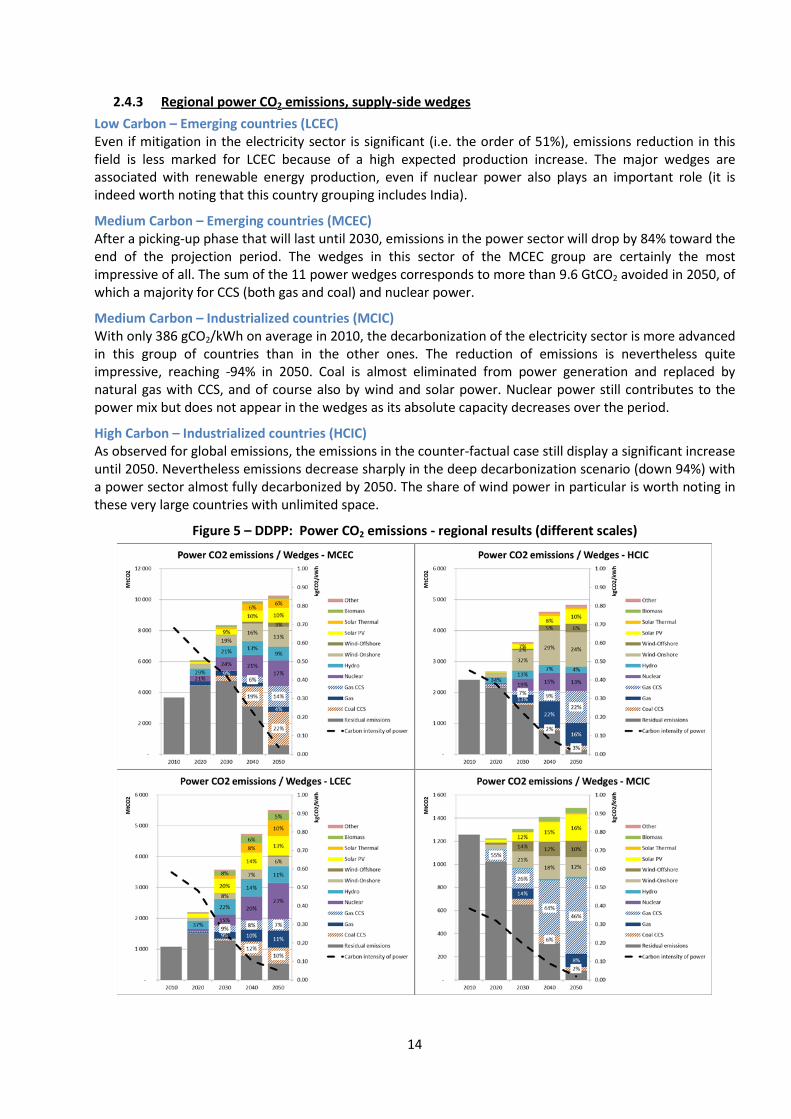
2.4.3 Regional power CO2 emissions, supply-side wedges Low Carbon – Emerging countries (LCEC) Even if mitigation in the electricity sector is significant (i.e. the order of 51%), emissions reduction in this field is less marked for LCEC because of a high expected production increase. The major wedges are associated with renewable energy production, even if nuclear power also plays an important role (it is indeed worth noting that this country grouping includes India).
Medium Carbon – Emerging countries (MCEC) After a picking-up phase that will last until 2030, emissions in the power sector will drop by 84% toward the end of the projection period. The wedges in this sector of the MCEC group are certainly the most impressive of all. The sum of the 11 power wedges corresponds to more than 9.6 GtCO2 avoided in 2050, of which a majority for CCS (both gas and coal) and nuclear power.
Medium Carbon – Industrialized countries (MCIC) With only 386 gCO2/kWh on average in 2010, the decarbonization of the electricity sector is more advanced in this group of countries than in the other ones. The reduction of emissions is nevertheless quite impressive, reaching -94% in 2050. Coal is almost eliminated from power generation and replaced by natural gas with CCS, and of course also by wind and solar power. Nuclear power still contributes to the power mix but does not appear in the wedges as its absolute capacity decreases over the period.
High Carbon – Industrialized countries (HCIC) As observed for global emissions, the emissions in the counter-factual case still display a significant increase until 2050. Nevertheless emissions decrease sharply in the deep decarbonization scenario (down 94%) with a power sector almost fully decarbonized by 2050. The share of wind power in particular is worth noting in these very large countries with unlimited space.
Figure 5 – DDPP: Power CO2 emissions - regional results (different scales)
15
3 Contribution of the different technologies to decarbonization: the vision of the research community in the ANCRE alliance
3.1 The ANCRE DW study: key factors
The aim of this study is for ANCRE to offer a worldwide vision of the different low-carbon technologies and end-use sectors by 2050 in order to explore the potential of key technologies. A pro-active perspective was adopted —notably in terms of technological development, the goal being to meet the requirements of the 2°C scenario, hopefully by 2100. Changing behaviors and societies are crucial to guide the evolution of GHG emissions, which will imply mobilizing new technologies: the DW study aims at describing their respective potentials. Technological templates have been designed with four elements corresponding to major dimensions for all technologies, in order to provide a foresight of their respective contribution to CO₂ emissions reduction by 2050:
- Describing technologies or sectors with recent development in different world regions; - Assessing current technological readiness level, potential development and contribution to CO₂
emissions reduction by 2050; - Evaluating performance and bottlenecks (R&D, economy, regulation, security and sociotechnical
feasibility); - Estimating the nature of innovations (either incremental or radical innovations) needed to
overcome the bottlenecks mentioned earlier.
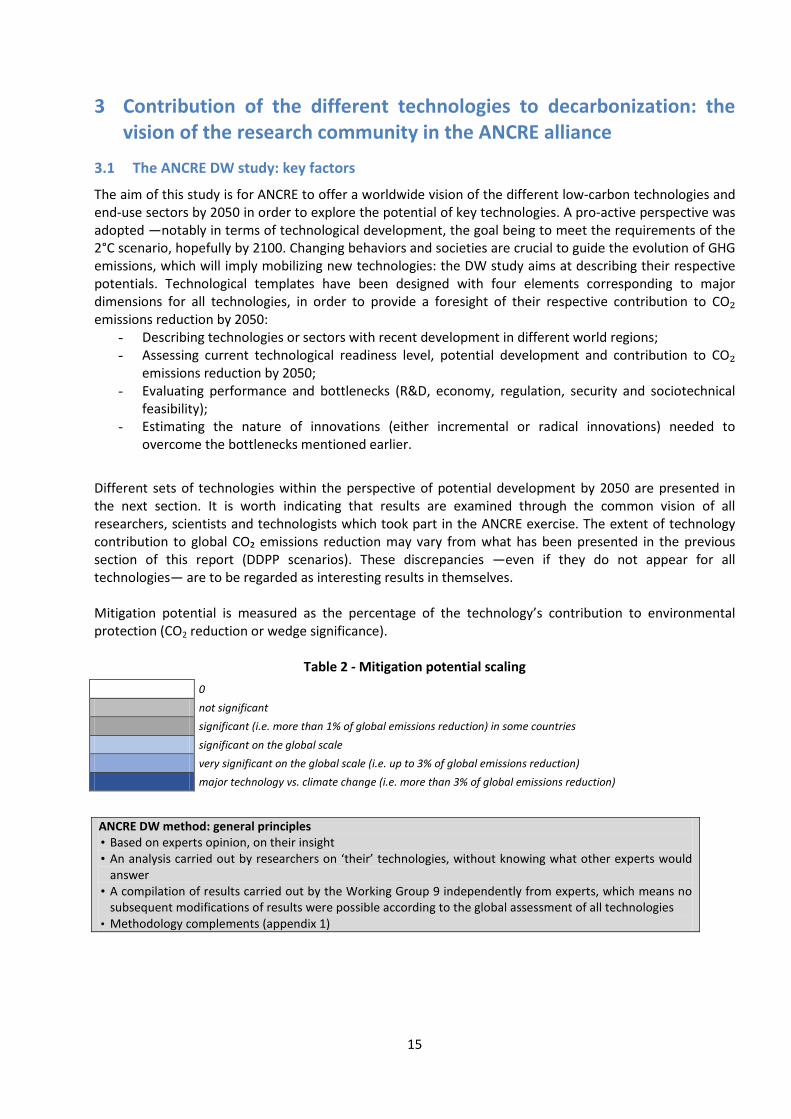
Different sets of technologies within the perspective of potential development by 2050 are presented in the next section. It is worth indicating that results are examined through the common vision of all researchers, scientists and technologists which took part in the ANCRE exercise. The extent of technology contribution to global CO₂ emissions reduction may vary from what has been presented in the previous section of this report (DDPP scenarios). These discrepancies —even if they do not appear for all technologies— are to be regarded as interesting results in themselves. Mitigation potential is measured as the percentage of the technology’s contribution to environmental protection (CO2 reduction or wedge significance).
Table 2 - Mitigation potential scaling 0.0 0
0.5 not significant
1.2 significant (i.e. more than 1% of global emissions reduction) in some countries
2.2 significant on the global scale
3.5 very significant on the global scale (i.e. up to 3% of global emissions reduction)
4.5 major technology vs. climate change (i.e. more than 3% of global emissions reduction)
ANCRE DW method: general principles • Based on experts opinion, on their insight • An analysis carried out by researchers on ‘their’ technologies, without knowing what other experts would
answer • A compilation of results carried out by the Working Group 9 independently from experts, which means no
subsequent modifications of results were possible according to the global assessment of all technologies • Methodology complements (appendix 1)
16
3.2 Development capacity of the main technologies for decarbonization
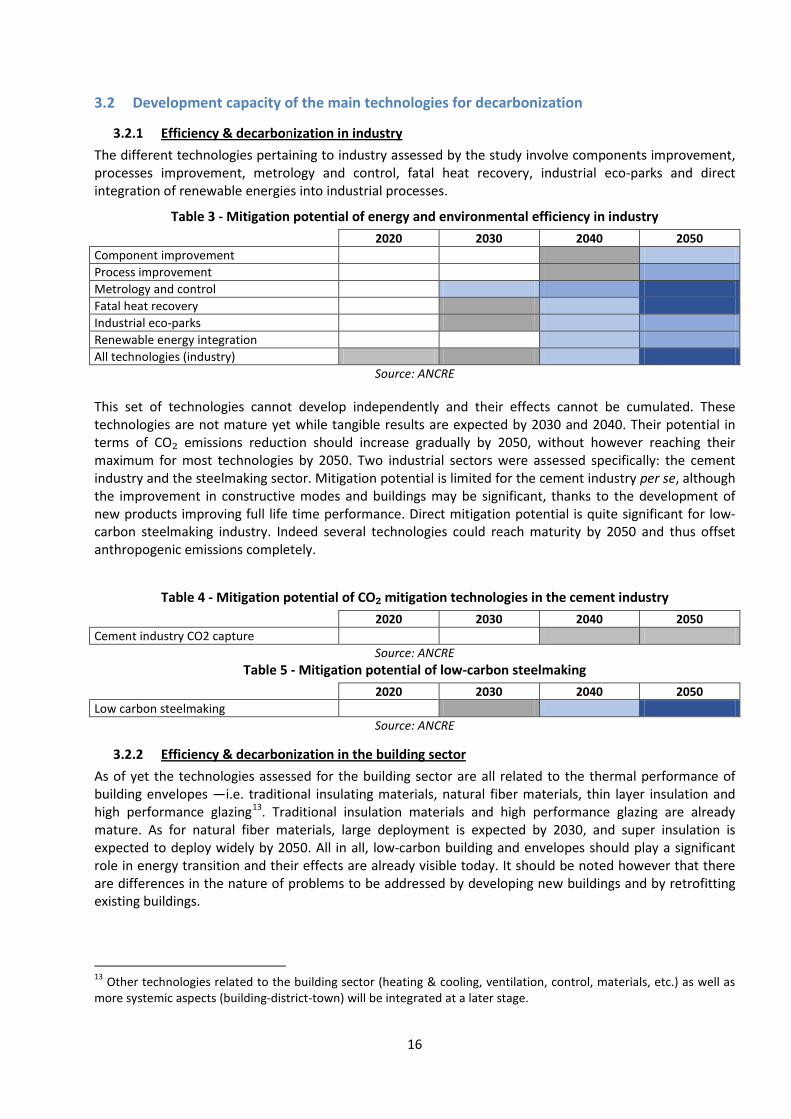
3.2.1 Efficiency & decarbonization in industry The different technologies pertaining to industry assessed by the study involve components improvement, processes improvement, metrology and control, fatal heat recovery, industrial eco-parks and direct integration of renewable energies into industrial processes.
Table 3 - Mitigation potential of energy and environmental efficiency in industry
2020 2030 2040 2050
Component improvement 0.0 0.0 1.0 2.0 Process improvement 0.0 0.0 1.5 3.5 Metrology and control 0.0 2.0 3.0 4.0 Fatal heat recovery 0.0 1.0 2.0 4.0 Industrial eco-parks 0.0 1.0 2.0 3.0 Renewable energy integration 0.0 0.0 2.0 3.0 All technologies (industry) 0.5 1.0 2.3 4.0
Source: ANCRE
This set of technologies cannot develop independently and their effects cannot be cumulated. These technologies are not mature yet while tangible results are expected by 2030 and 2040. Their potential in terms of CO₂ emissions reduction should increase gradually by 2050, without however reaching their maximum for most technologies by 2050. Two industrial sectors were assessed specifically: the cement industry and the steelmaking sector. Mitigation potential is limited for the cement industry per se, although the improvement in constructive modes and buildings may be significant, thanks to the development of new products improving full life time performance. Direct mitigation potential is quite significant for low-carbon steelmaking industry. Indeed several technologies could reach maturity by 2050 and thus offset anthropogenic emissions completely.
Table 4 - Mitigation potential of CO₂ mitigation technologies in the cement industry
2020 2030 2040 2050
Cement industry CO2 capture 0.0 0.0 0.5 0.5 Source: ANCRE
Table 5 - Mitigation potential of low-carbon steelmaking
2020 2030 2040 2050
Low carbon steelmaking 0.0 1.0 2.0 4.0 Source: ANCRE
3.2.2 Efficiency & decarbonization in the building sector As of yet the technologies assessed for the building sector are all related to the thermal performance of building envelopes —i.e. traditional insulating materials, natural fiber materials, thin layer insulation and high performance glazing13. Traditional insulation materials and high performance glazing are already mature. As for natural fiber materials, large deployment is expected by 2030, and super insulation is expected to deploy widely by 2050. All in all, low-carbon building and envelopes should play a significant role in energy transition and their effects are already visible today. It should be noted however that there are differences in the nature of problems to be addressed by developing new buildings and by retrofitting existing buildings.
13 Other technologies related to the building sector (heating & cooling, ventilation, control, materials, etc.) as well as more systemic aspects (building-district-town) will be integrated at a later stage.
17
Table 6 - Mitigation potential of low-carbon building and building envelopes
2020 2030 2040 2050
Building 2.0 3.0 3.0 3.0 Source: ANCRE
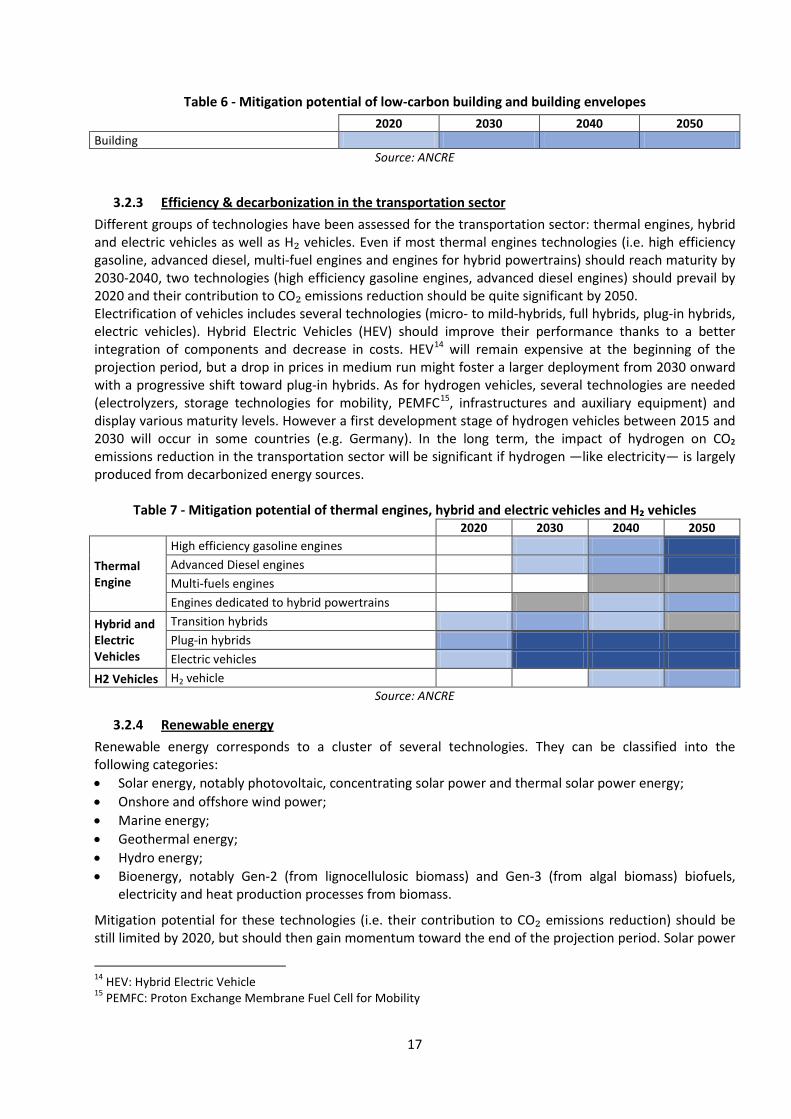
3.2.3 Efficiency & decarbonization in the transportation sector Different groups of technologies have been assessed for the transportation sector: thermal engines, hybrid and electric vehicles as well as H₂ vehicles. Even if most thermal engines technologies (i.e. high efficiency gasoline, advanced diesel, multi-fuel engines and engines for hybrid powertrains) should reach maturity by 2030-2040, two technologies (high efficiency gasoline engines, advanced diesel engines) should prevail by 2020 and their contribution to CO₂ emissions reduction should be quite significant by 2050. Electrification of vehicles includes several technologies (micro- to mild-hybrids, full hybrids, plug-in hybrids, electric vehicles). Hybrid Electric Vehicles (HEV) should improve their performance thanks to a better integration of components and decrease in costs. HEV14 will remain expensive at the beginning of the projection period, but a drop in prices in medium run might foster a larger deployment from 2030 onward with a progressive shift toward plug-in hybrids. As for hydrogen vehicles, several technologies are needed (electrolyzers, storage technologies for mobility, PEMFC15, infrastructures and auxiliary equipment) and display various maturity levels. However a first development stage of hydrogen vehicles between 2015 and 2030 will occur in some countries (e.g. Germany). In the long term, the impact of hydrogen on CO₂ emissions reduction in the transportation sector will be significant if hydrogen —like electricity— is largely produced from decarbonized energy sources.
Table 7 - Mitigation potential of thermal engines, hybrid and electric vehicles and H₂ vehicles
2020 2030 2040 2050
Thermal Engine
High efficiency gasoline engines 0.0 2.0 3.0 4.0 Advanced Diesel engines 0.0 2.0 3.0 4.0 Multi-fuels engines 0.0 0.0 1.0 1.0 Engines dedicated to hybrid powertrains 0.0 1.0 2.0 3.0
Hybrid and Electric Vehicles
Transition hybrids 2.0 3.0 2.0 1.0 Plug-in hybrids 3.0 4.0 4.0 4.0 Electric vehicles 2.0 4.0 4.0 4.0
H2 Vehicles H2 vehicle 0.0 0.0 2.0 3.0 Source: ANCRE
3.2.4 Renewable energy Renewable energy corresponds to a cluster of several technologies. They can be classified into the following categories: • Solar energy, notably photovoltaic, concentrating solar power and thermal solar power energy; • Onshore and offshore wind power; • Marine energy; • Geothermal energy; • Hydro energy; • Bioenergy, notably Gen-2 (from lignocellulosic biomass) and Gen-3 (from algal biomass) biofuels,
electricity and heat production processes from biomass.
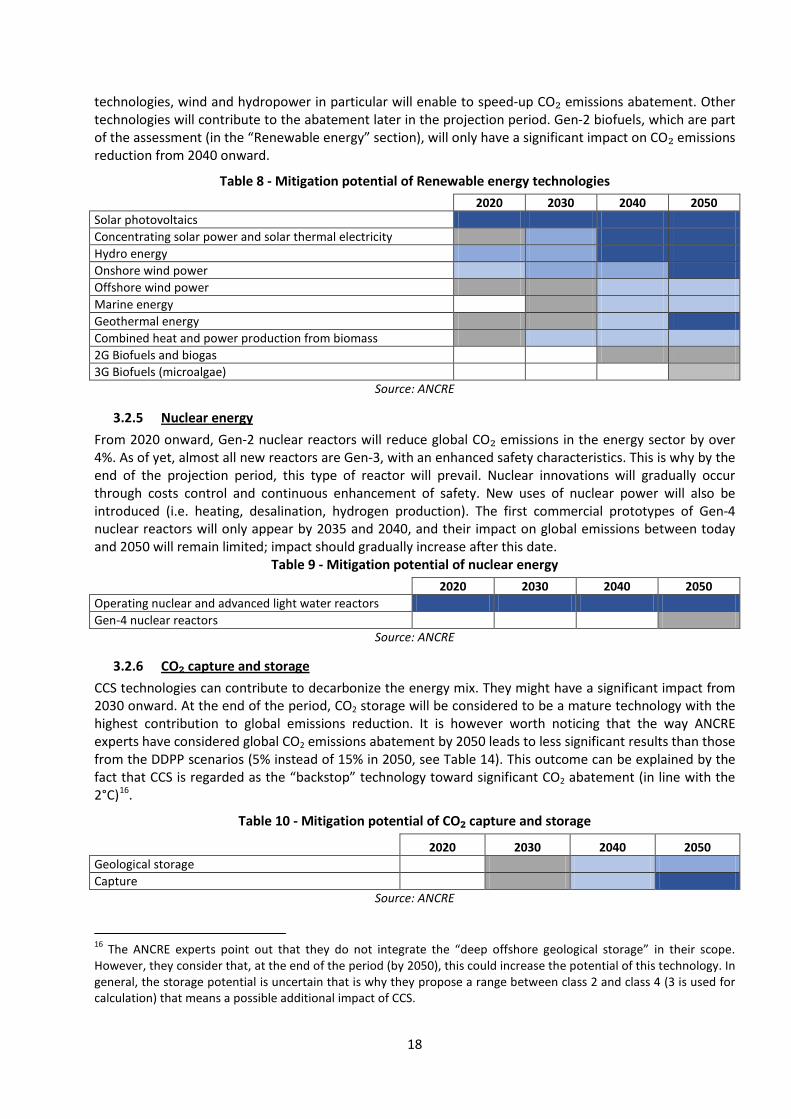
Mitigation potential for these technologies (i.e. their contribution to CO₂ emissions reduction) should be still limited by 2020, but should then gain momentum toward the end of the projection period. Solar power
14 HEV: Hybrid Electric Vehicle 15 PEMFC: Proton Exchange Membrane Fuel Cell for Mobility
18
technologies, wind and hydropower in particular will enable to speed-up CO₂ emissions abatement. Other technologies will contribute to the abatement later in the projection period. Gen-2 biofuels, which are part of the assessment (in the “Renewable energy” section), will only have a significant impact on CO₂ emissions reduction from 2040 onward.
Table 8 - Mitigation potential of Renewable energy technologies
2020 2030 2040 2050
Solar photovoltaics 4.0 4.0 4.0 4.0 Concentrating solar power and solar thermal electricity 1.0 3.0 4.0 4.0 Hydro energy 3.0 3.0 4.0 4.0 Onshore wind power 2.0 3.0 3.0 4.0 Offshore wind power 1.0 1.0 2.0 2.0 Marine energy 0.0 1.0 2.0 2.0 Geothermal energy 1.0 1.5 2.5 4.0 Combined heat and power production from biomass 1.0 2.0 2.0 2.5 2G Biofuels and biogas 0.0 0.0 1.0 1.0 3G Biofuels (microalgae) 0.0 0.0 0.0 0.5
Source: ANCRE
3.2.5 Nuclear energy From 2020 onward, Gen-2 nuclear reactors will reduce global CO₂ emissions in the energy sector by over 4%. As of yet, almost all new reactors are Gen-3, with an enhanced safety characteristics. This is why by the end of the projection period, this type of reactor will prevail. Nuclear innovations will gradually occur through costs control and continuous enhancement of safety. New uses of nuclear power will also be introduced (i.e. heating, desalination, hydrogen production). The first commercial prototypes of Gen-4 nuclear reactors will only appear by 2035 and 2040, and their impact on global emissions between today and 2050 will remain limited; impact should gradually increase after this date.
Table 9 - Mitigation potential of nuclear energy
2020 2030 2040 2050
Operating nuclear and advanced light water reactors 4.0 4.0 4.0 4.0 Gen-4 nuclear reactors 0.0 0.0 0.0 1.0
Source: ANCRE
3.2.6 CO₂ capture and storage CCS technologies can contribute to decarbonize the energy mix. They might have a significant impact from 2030 onward. At the end of the period, CO2 storage will be considered to be a mature technology with the highest contribution to global emissions reduction. It is however worth noticing that the way ANCRE experts have considered global CO2 emissions abatement by 2050 leads to less significant results than those from the DDPP scenarios (5% instead of 15% in 2050, see Table 14). This outcome can be explained by the fact that CCS is regarded as the “backstop” technology toward significant CO2 abatement (in line with the 2°C)16.
Table 10 - Mitigation potential of CO₂ capture and storage
2020 2030 2040 2050
Geological storage 0.0 1.0 2.0 3.0 Capture 0.0 1.0 2.0 4.0
Source: ANCRE
16 The ANCRE experts point out that they do not integrate the “deep offshore geological storage” in their scope. However, they consider that, at the end of the period (by 2050), this could increase the potential of this technology. In general, the storage potential is uncertain that is why they propose a range between class 2 and class 4 (3 is used for calculation) that means a possible additional impact of CCS.
19
3.3 Evolution of technologies for the ANCRE experts: analysis of key factors
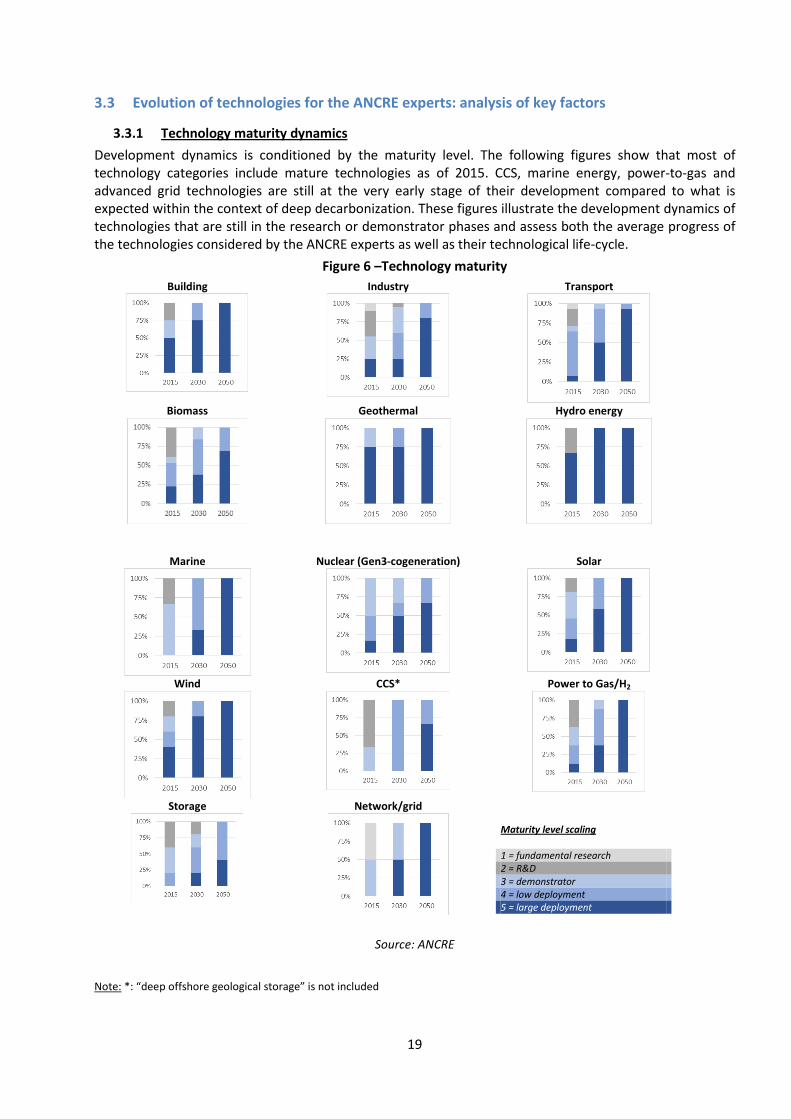
3.3.1 Technology maturity dynamics Development dynamics is conditioned by the maturity level. The following figures show that most of technology categories include mature technologies as of 2015. CCS, marine energy, power-to-gas and advanced grid technologies are still at the very early stage of their development compared to what is expected within the context of deep decarbonization. These figures illustrate the development dynamics of technologies that are still in the research or demonstrator phases and assess both the average progress of the technologies considered by the ANCRE experts as well as their technological life-cycle.
Figure 6 –Technology maturity
Building
Industry
Transport
Biomass
Geothermal
Hydro energy
Marine
Nuclear (Gen3-cogeneration)
Solar
Wind
CCS*
Power to Gas/H2
Storage
Network/grid
Maturity level scaling 1 = fundamental research 2 = R&D 3 = demonstrator 4 = low deployment 5 = large deployment
Source: ANCRE
Note: *: “deep offshore geological storage” is not included
20
Hydro, geothermal, biomass, nuclear, wind and solar power appear to be the major new technologies in 10 to 15 years’ time, whereas marine, CCS, grids, power-to-gas and storage technologies will require at least twice that duration to reach maturity 17.
The above maturity criterion combines the intrinsic maturity of the respective technologies as well as their deployment and their contribution to CO₂ emissions reduction (wedges).
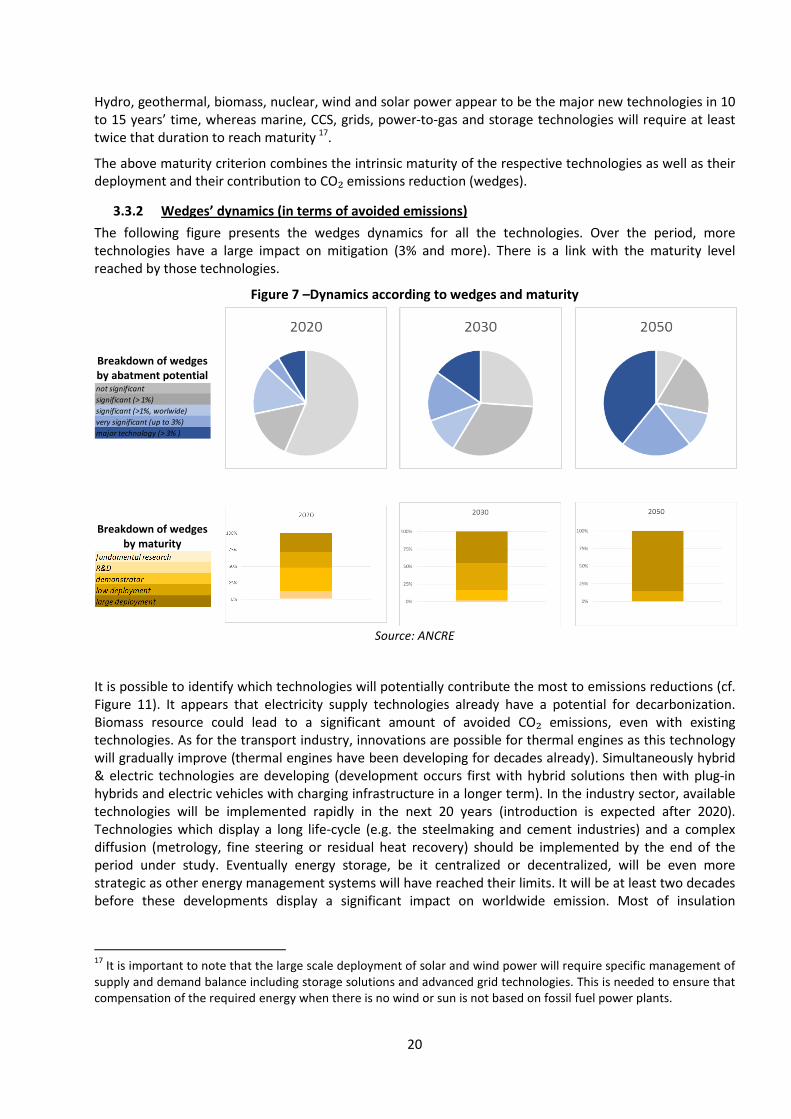
3.3.2 Wedges’ dynamics (in terms of avoided emissions) The following figure presents the wedges dynamics for all the technologies. Over the period, more technologies have a large impact on mitigation (3% and more). There is a link with the maturity level reached by those technologies.
Figure 7 –Dynamics according to wedges and maturity
Breakdown of wedges by abatment potential
Breakdown of wedges by maturity
Source: ANCRE
It is possible to identify which technologies will potentially contribute the most to emissions reductions (cf. Figure 11). It appears that electricity supply technologies already have a potential for decarbonization. Biomass resource could lead to a significant amount of avoided CO₂ emissions, even with existing technologies. As for the transport industry, innovations are possible for thermal engines as this technology will gradually improve (thermal engines have been developing for decades already). Simultaneously hybrid & electric technologies are developing (development occurs first with hybrid solutions then with plug-in hybrids and electric vehicles with charging infrastructure in a longer term). In the industry sector, available technologies will be implemented rapidly in the next 20 years (introduction is expected after 2020). Technologies which display a long life-cycle (e.g. the steelmaking and cement industries) and a complex diffusion (metrology, fine steering or residual heat recovery) should be implemented by the end of the period under study. Eventually energy storage, be it centralized or decentralized, will be even more strategic as other energy management systems will have reached their limits. It will be at least two decades before these developments display a significant impact on worldwide emission. Most of insulation
17 It is important to note that the large scale deployment of solar and wind power will require specific management of supply and demand balance including storage solutions and advanced grid technologies. This is needed to ensure that compensation of the required energy when there is no wind or sun is not based on fossil fuel power plants.
not significantsignificant (> 1%)significant (>1%, worlwide)very significant (up to 3%)major technology (> 3% )
21
technologies in the building sector are directly available, but this technology family could evolve within 10 to 20 years, leading to significant emissions reduction.
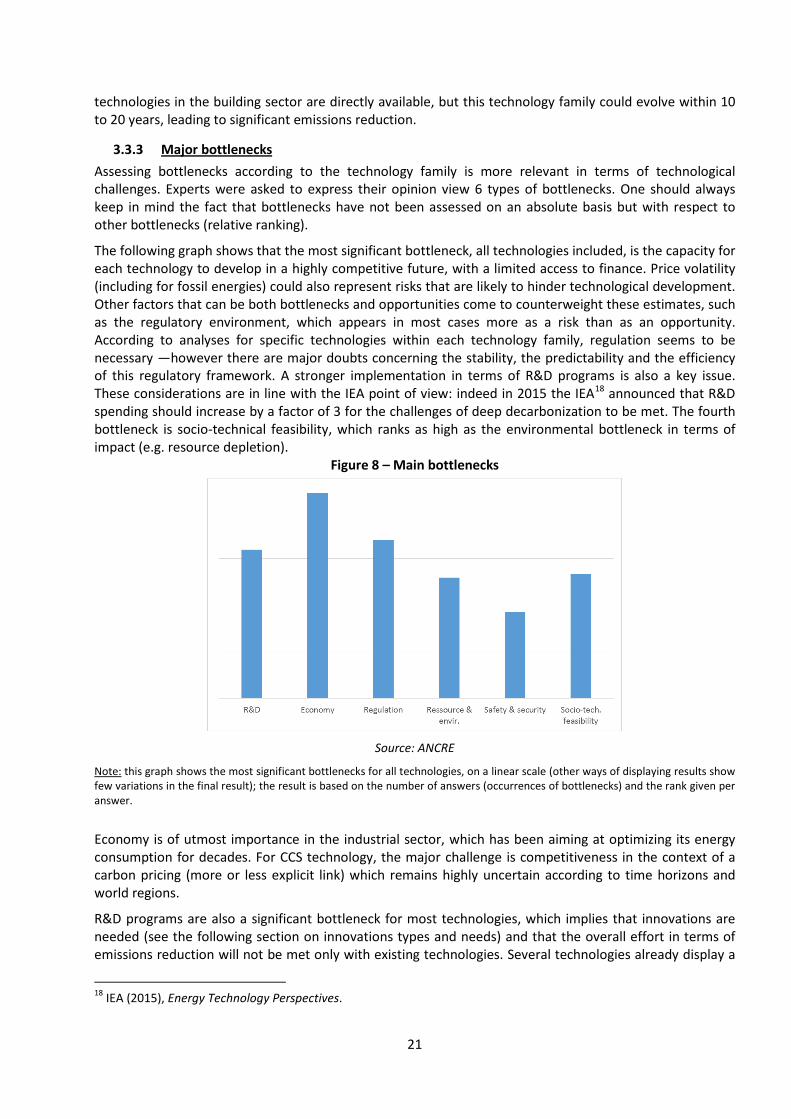
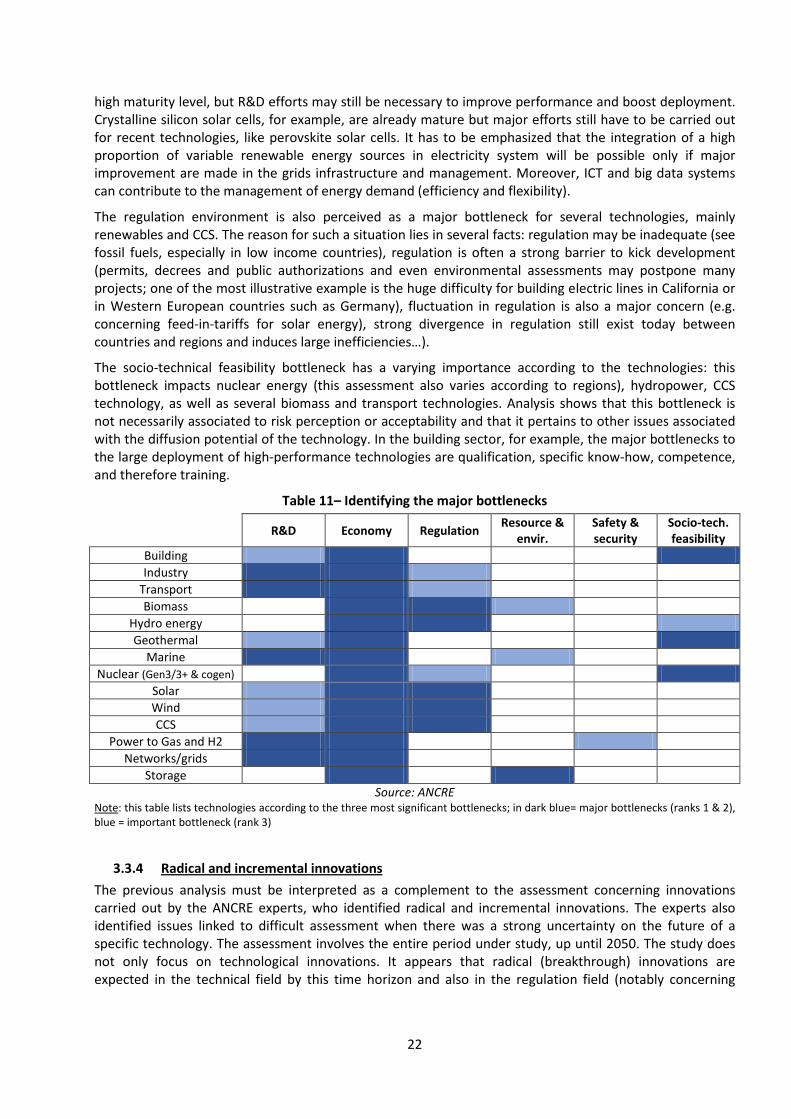
3.3.3 Major bottlenecks Assessing bottlenecks according to the technology family is more relevant in terms of technological challenges. Experts were asked to express their opinion view 6 types of bottlenecks. One should always keep in mind the fact that bottlenecks have not been assessed on an absolute basis but with respect to other bottlenecks (relative ranking).
The following graph shows that the most significant bottleneck, all technologies included, is the capacity for each technology to develop in a highly competitive future, with a limited access to finance. Price volatility (including for fossil energies) could also represent risks that are likely to hinder technological development. Other factors that can be both bottlenecks and opportunities come to counterweight these estimates, such as the regulatory environment, which appears in most cases more as a risk than as an opportunity. According to analyses for specific technologies within each technology family, regulation seems to be necessary —however there are major doubts concerning the stability, the predictability and the efficiency of this regulatory framework. A stronger implementation in terms of R&D programs is also a key issue. These considerations are in line with the IEA point of view: indeed in 2015 the IEA18 announced that R&D spending should increase by a factor of 3 for the challenges of deep decarbonization to be met. The fourth bottleneck is socio-technical feasibility, which ranks as high as the environmental bottleneck in terms of impact (e.g. resource depletion).
Figure 8 – Main bottlenecks
Source: ANCRE
Note: this graph shows the most significant bottlenecks for all technologies, on a linear scale (other ways of displaying results show few variations in the final result); the result is based on the number of answers (occurrences of bottlenecks) and the rank given per answer.
Economy is of utmost importance in the industrial sector, which has been aiming at optimizing its energy consumption for decades. For CCS technology, the major challenge is competitiveness in the context of a carbon pricing (more or less explicit link) which remains highly uncertain according to time horizons and world regions.
R&D programs are also a significant bottleneck for most technologies, which implies that innovations are needed (see the following section on innovations types and needs) and that the overall effort in terms of emissions reduction will not be met only with existing technologies. Several technologies already display a
18 IEA (2015), Energy Technology Perspectives.
22
high maturity level, but R&D efforts may still be necessary to improve performance and boost deployment. Crystalline silicon solar cells, for example, are already mature but major efforts still have to be carried out for recent technologies, like perovskite solar cells. It has to be emphasized that the integration of a high proportion of variable renewable energy sources in electricity system will be possible only if major improvement are made in the grids infrastructure and management. Moreover, ICT and big data systems can contribute to the management of energy demand (efficiency and flexibility).
The regulation environment is also perceived as a major bottleneck for several technologies, mainly renewables and CCS. The reason for such a situation lies in several facts: regulation may be inadequate (see fossil fuels, especially in low income countries), regulation is often a strong barrier to kick development (permits, decrees and public authorizations and even environmental assessments may postpone many projects; one of the most illustrative example is the huge difficulty for building electric lines in California or in Western European countries such as Germany), fluctuation in regulation is also a major concern (e.g. concerning feed-in-tariffs for solar energy), strong divergence in regulation still exist today between countries and regions and induces large inefficiencies…).
The socio-technical feasibility bottleneck has a varying importance according to the technologies: this bottleneck impacts nuclear energy (this assessment also varies according to regions), hydropower, CCS technology, as well as several biomass and transport technologies. Analysis shows that this bottleneck is not necessarily associated to risk perception or acceptability and that it pertains to other issues associated with the diffusion potential of the technology. In the building sector, for example, the major bottlenecks to the large deployment of high-performance technologies are qualification, specific know-how, competence, and therefore training.
Table 11– Identifying the major bottlenecks
R&D Economy Regulation Resource & envir.
Safety & security
Socio-tech. feasibility
Building 4 5 3 2 1 6 Industry 5 6 4 2 1 3
Transport 5 6 4 2 1 3 Biomass 3 6 5 4 1 2
Hydro energy 3 6 5 1 2 4 Geothermal 4 6 3 2 1 5
Marine 6 5 1 4 3 2 Nuclear (Gen3/3+ & cogen) 1 5 4 3 2 6
Solar 4 5 6 3 1 2 Wind 4 6 5 1 2 3 CCS 4 6 5 2 1 3
Power to Gas and H2 6 5 2 3 4 1 Networks/grids 5 6 3 2 2 3
Storage 3 6 3 5 3 2 Source: ANCRE
Note: this table lists technologies according to the three most significant bottlenecks; in dark blue= major bottlenecks (ranks 1 & 2), blue = important bottleneck (rank 3)
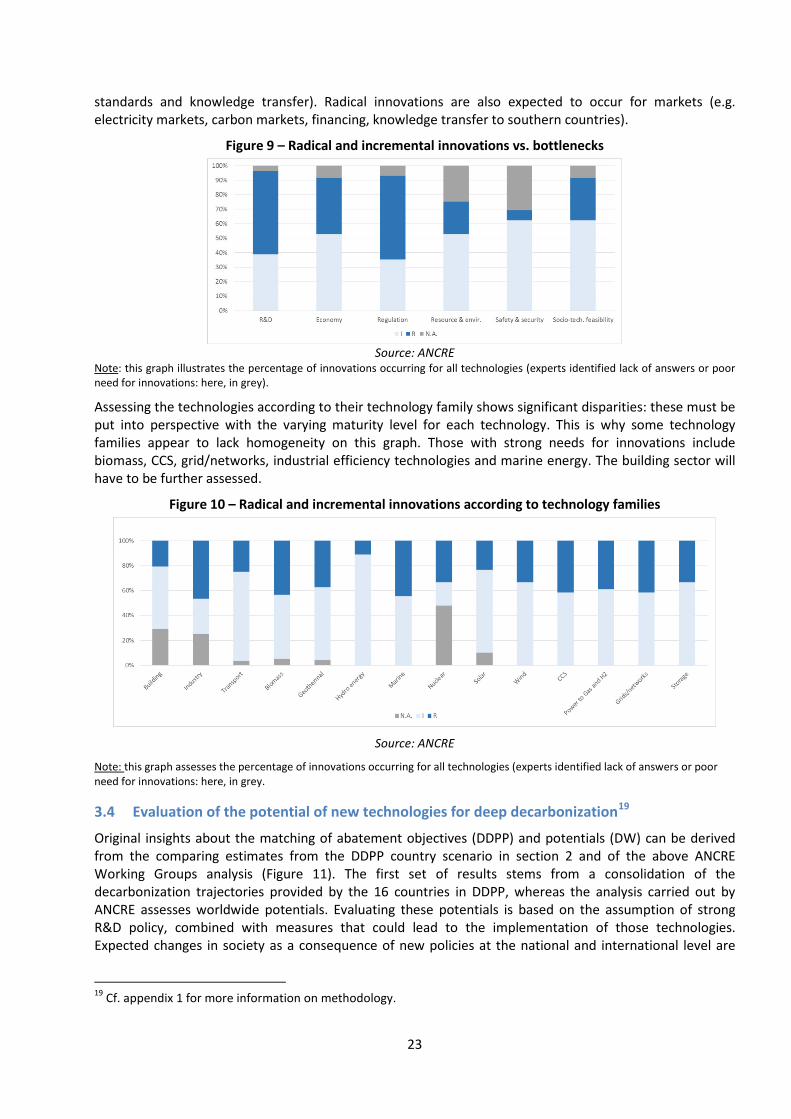
3.3.4 Radical and incremental innovations The previous analysis must be interpreted as a complement to the assessment concerning innovations carried out by the ANCRE experts, who identified radical and incremental innovations. The experts also identified issues linked to difficult assessment when there was a strong uncertainty on the future of a specific technology. The assessment involves the entire period under study, up until 2050. The study does not only focus on technological innovations. It appears that radical (breakthrough) innovations are expected in the technical field by this time horizon and also in the regulation field (notably concerning
23
standards and knowledge transfer). Radical innovations are also expected to occur for markets (e.g. electricity markets, carbon markets, financing, knowledge transfer to southern countries).
Figure 9 – Radical and incremental innovations vs. bottlenecks
Source: ANCRE
Note: this graph illustrates the percentage of innovations occurring for all technologies (experts identified lack of answers or poor need for innovations: here, in grey).
Assessing the technologies according to their technology family shows significant disparities: these must be put into perspective with the varying maturity level for each technology. This is why some technology families appear to lack homogeneity on this graph. Those with strong needs for innovations include biomass, CCS, grid/networks, industrial efficiency technologies and marine energy. The building sector will have to be further assessed.
Figure 10 – Radical and incremental innovations according to technology families
Source: ANCRE
Note: this graph assesses the percentage of innovations occurring for all technologies (experts identified lack of answers or poor need for innovations: here, in grey.
3.4 Evaluation of the potential of new technologies for deep decarbonization19
Original insights about the matching of abatement objectives (DDPP) and potentials (DW) can be derived from the comparing estimates from the DDPP country scenario in section 2 and of the above ANCRE Working Groups analysis (Figure 11). The first set of results stems from a consolidation of the decarbonization trajectories provided by the 16 countries in DDPP, whereas the analysis carried out by ANCRE assesses worldwide potentials. Evaluating these potentials is based on the assumption of strong R&D policy, combined with measures that could lead to the implementation of those technologies. Expected changes in society as a consequence of new policies at the national and international level are
19 Cf. appendix 1 for more information on methodology.
24
also crucial. It is also worth noting that the global result from the ANCRE experts is in one hand optimistic (because of the willingness to cope with the 2°C objective) and in the other hand under-evaluated (as major but not all technologies20 that could contribute to CO2 abatement have been assessed). Eventually the review of technologies may not be free of subjectivity. This review denotes the expectations of the ANCRE expert groups for the future of the technologies they are considering.
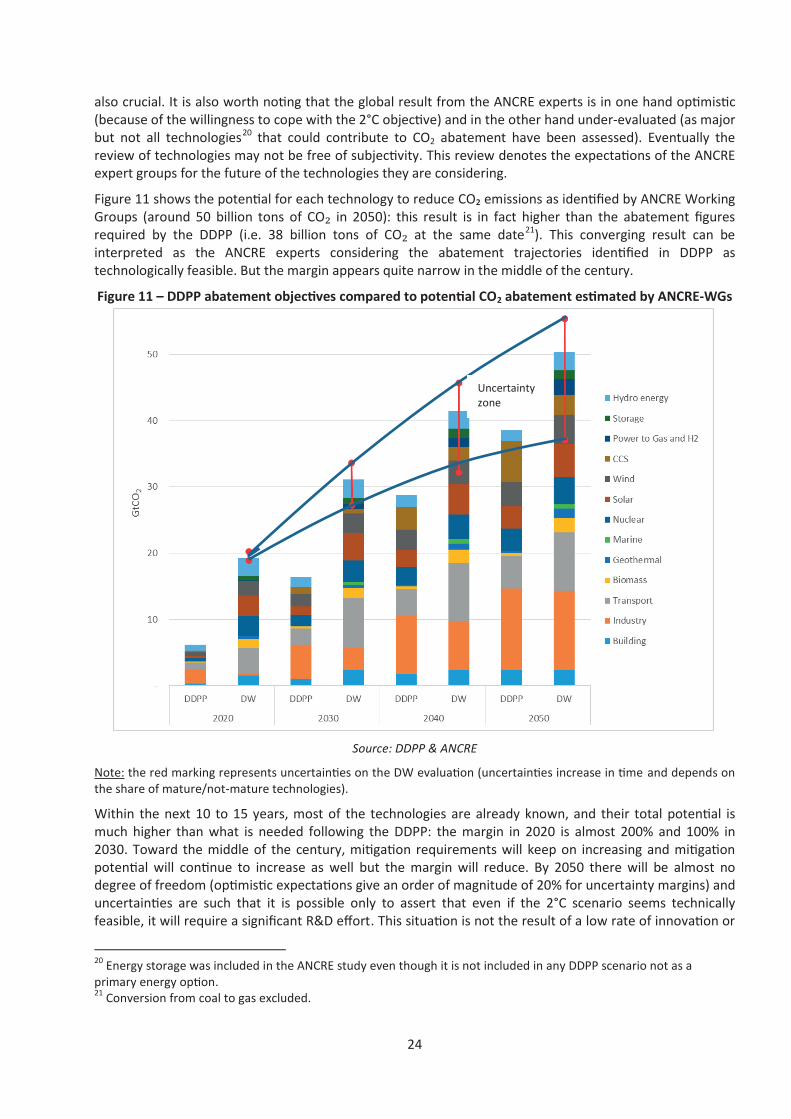
Figure 11 shows the potential for each technology to reduce CO₂ emissions as identified by ANCRE Working Groups (around 50 billion tons of CO₂ in 2050): this result is in fact higher than the abatement figures required by the DDPP (i.e. 38 billion tons of CO₂ at the same date21). This converging result can be interpreted as the ANCRE experts considering the abatement trajectories identified in DDPP as technologically feasible. But the margin appears quite narrow in the middle of the century.
Figure 11 – DDPP abatement objectives compared to potential CO2 abatement estimated by ANCRE-WGs
Source: DDPP & ANCRE
Note: the red marking represents uncertainties on the DW evaluation (uncertainties increase in time and depends on the share of mature/not-mature technologies).
Within the next 10 to 15 years, most of the technologies are already known, and their total potential is much higher than what is needed following the DDPP: the margin in 2020 is almost 200% and 100% in 2030. Toward the middle of the century, mitigation requirements will keep on increasing and mitigation potential will continue to increase as well but the margin will reduce. By 2050 there will be almost no degree of freedom (optimistic expectations give an order of magnitude of 20% for uncertainty margins) and uncertainties are such that it is possible only to assert that even if the 2°C scenario seems technically feasible, it will require a significant R&D effort. This situation is not the result of a low rate of innovation or
20 Energy storage was included in the ANCRE study even though it is not included in any DDPP scenario not as a primary energy option. 21 Conversion from coal to gas excluded.
Uncertainty zone
25
of a lack of new technologies (even if it appears difficult to integrate breakthrough technologies). Technical progress is assumed to be very dynamic in the DW exercise, but the need in terms of GHG reduction is expected to be even higher.
The main supply energy technologies capable of speeding up the 2°C pathway are by order of CO2 reduction potential solar energy (10 % of global potential reduction), wind power (9 %), Gen-3 nuclear reactors (8.5%), then hydro energy (mostly in Southern countries) and biomass (taking into account productions of heat, biofuels and electricity), as well as other new energy technologies (e.g. geothermal and marine energy). CCS and storage technologies will also play a central role in reducing global emissions. However ANCRE estimated that CCS potential for mitigation will be of lesser importance compared to what the DDPP study suggested (5% according to ANCRE vs. 15% for the DDPP by 2050). Innovations around networks and grids could also play a great role in the CO2 reduction within the integration of the renewable technologies. However the amount of CO2 reduction linked to these technologies are difficult to assess.
Concerning end-uses, new decarbonization technologies implemented by the middle of the century should include industry (24% of global reduction) and transports (18%). On the global scale, the ANCRE study suggests that the building sector could play a smaller role in emissions reduction (5% of global reduction); however, this share is slightly different if we change the scope of DW closer to the one used in DDPP (cf. appendix 1). In that case, by incorporating a share of geothermal energy and 100% of thermal solar (BT), building represents 9% of the global reduction.
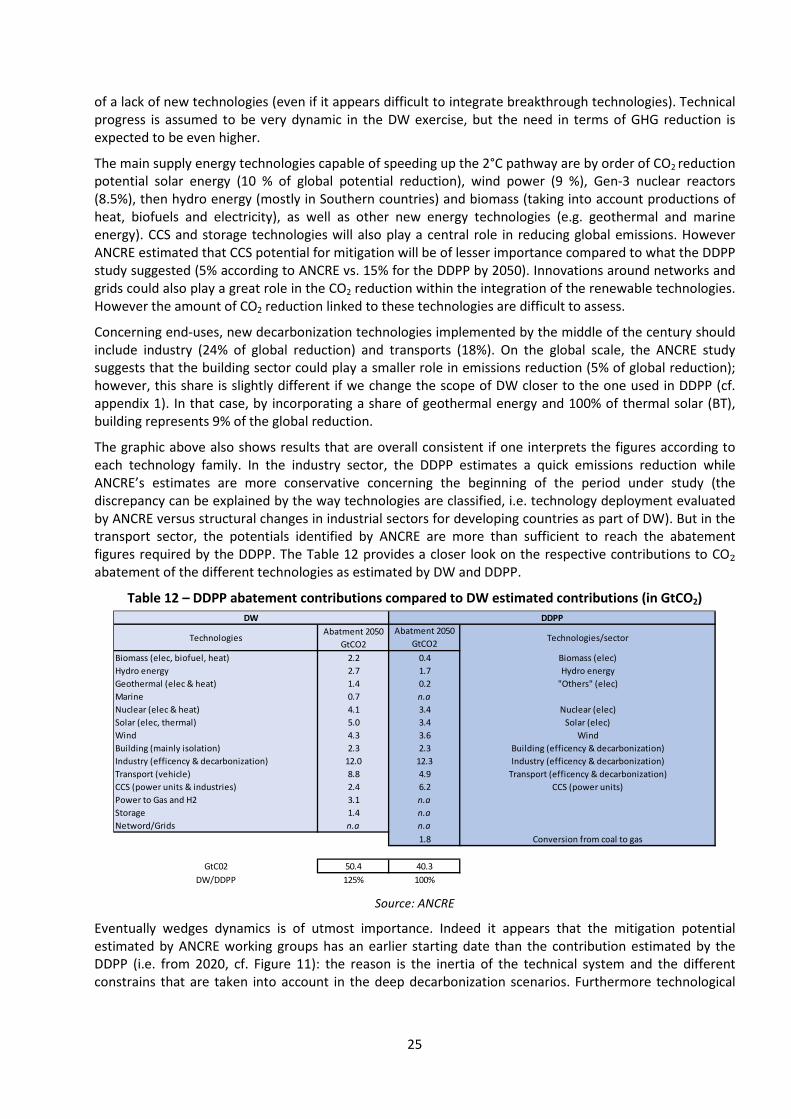
The graphic above also shows results that are overall consistent if one interprets the figures according to each technology family. In the industry sector, the DDPP estimates a quick emissions reduction while ANCRE’s estimates are more conservative concerning the beginning of the period under study (the discrepancy can be explained by the way technologies are classified, i.e. technology deployment evaluated by ANCRE versus structural changes in industrial sectors for developing countries as part of DW). But in the transport sector, the potentials identified by ANCRE are more than sufficient to reach the abatement figures required by the DDPP. The Table 12 provides a closer look on the respective contributions to CO₂ abatement of the different technologies as estimated by DW and DDPP.
Table 12 – DDPP abatement contributions compared to DW estimated contributions (in GtCO2)
Source: ANCRE
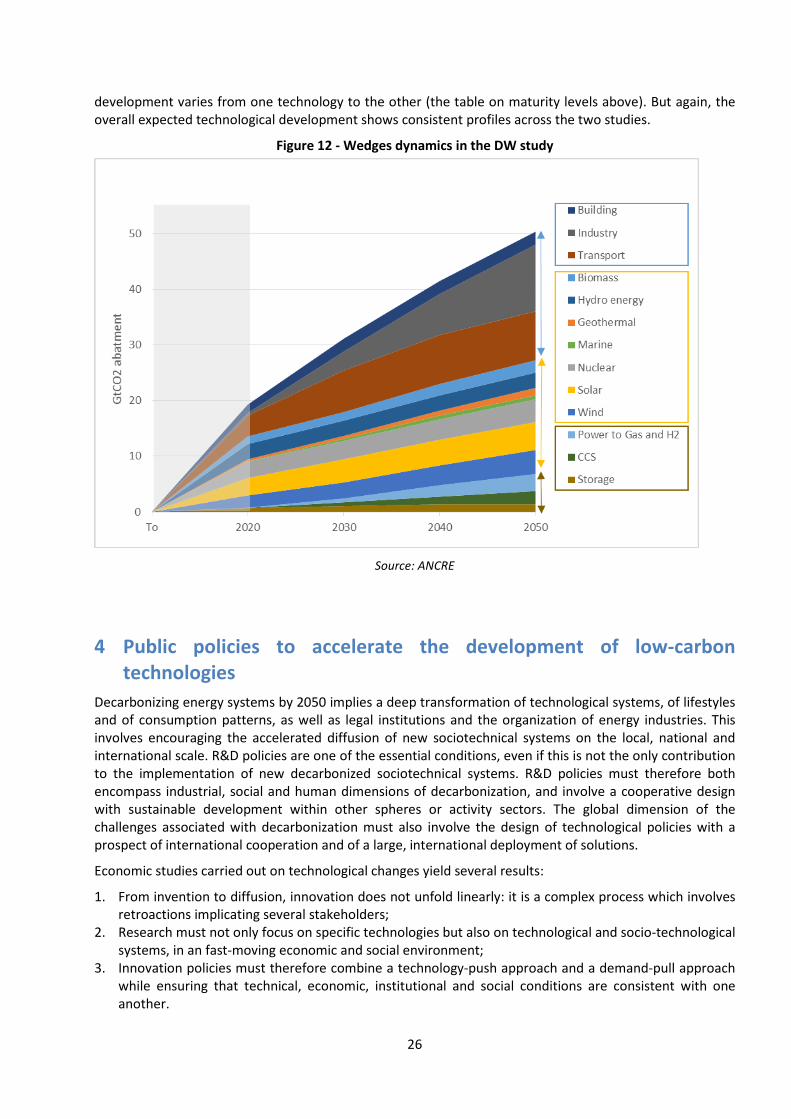
Eventually wedges dynamics is of utmost importance. Indeed it appears that the mitigation potential estimated by ANCRE working groups has an earlier starting date than the contribution estimated by the DDPP (i.e. from 2020, cf. Figure 11): the reason is the inertia of the technical system and the different constrains that are taken into account in the deep decarbonization scenarios. Furthermore technological
TechnologiesAbatment 2050
GtCO2Abatment 2050
GtCO2Biomass (elec, biofuel, heat) 2.2 0.4Hydro energy 2.7 1.7Geothermal (elec & heat) 1.4 0.2Marine 0.7 n.aNuclear (elec & heat) 4.1 3.4Solar (elec, thermal) 5.0 3.4Wind 4.3 3.6Building (mainly isolation) 2.3 2.3Industry (efficency & decarbonization) 12.0 12.3Transport (vehicle) 8.8 4.9CCS (power units & industries) 2.4 6.2Power to Gas and H2 3.1 n.aStorage 1.4 n.aNetword/Grids n.a n.a
1.8
GtC02 50.4 40.3DW/DDPP 125% 100%
Conversion from coal to gas
WindBuilding (efficency & decarbonization)Industry (efficency & decarbonization)
Transport (efficency & decarbonization)CCS (power units)
Hydro energy"Others" (elec)
Nuclear (elec)Solar (elec)
DW
Technologies/sector
Biomass (elec)
DDPP
26
development varies from one technology to the other (the table on maturity levels above). But again, the overall expected technological development shows consistent profiles across the two studies.
Figure 12 - Wedges dynamics in the DW study
Source: ANCRE
4 Public policies to accelerate the development of low-carbon technologies
Decarbonizing energy systems by 2050 implies a deep transformation of technological systems, of lifestyles and of consumption patterns, as well as legal institutions and the organization of energy industries. This involves encouraging the accelerated diffusion of new sociotechnical systems on the local, national and international scale. R&D policies are one of the essential conditions, even if this is not the only contribution to the implementation of new decarbonized sociotechnical systems. R&D policies must therefore both encompass industrial, social and human dimensions of decarbonization, and involve a cooperative design with sustainable development within other spheres or activity sectors. The global dimension of the challenges associated with decarbonization must also involve the design of technological policies with a prospect of international cooperation and of a large, international deployment of solutions.
Economic studies carried out on technological changes yield several results:
1. From invention to diffusion, innovation does not unfold linearly: it is a complex process which involves retroactions implicating several stakeholders;
2. Research must not only focus on specific technologies but also on technological and socio-technological systems, in an fast-moving economic and social environment;
3. Innovation policies must therefore combine a technology-push approach and a demand-pull approach while ensuring that technical, economic, institutional and social conditions are consistent with one another.
27
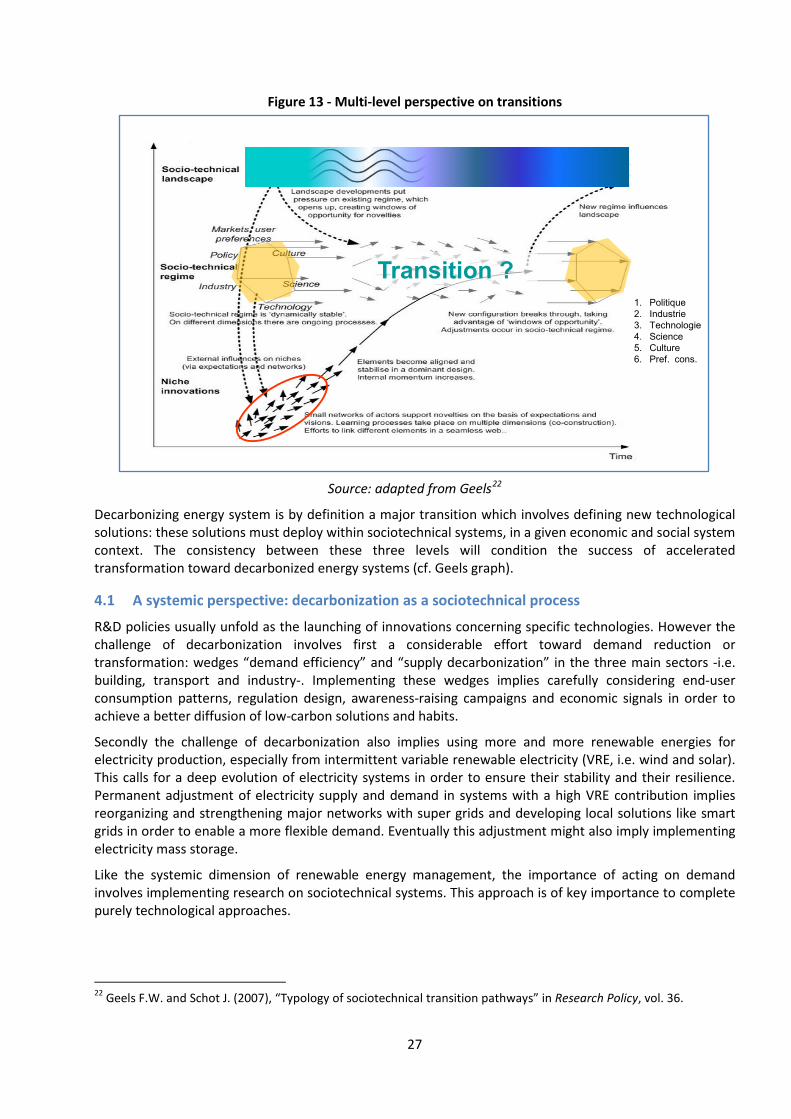
Figure 13 - Multi-level perspective on transitions
Source: adapted from Geels22
Decarbonizing energy system is by definition a major transition which involves defining new technological solutions: these solutions must deploy within sociotechnical systems, in a given economic and social system context. The consistency between these three levels will condition the success of accelerated transformation toward decarbonized energy systems (cf. Geels graph).
4.1 A systemic perspective: decarbonization as a sociotechnical process
R&D policies usually unfold as the launching of innovations concerning specific technologies. However the challenge of decarbonization involves first a considerable effort toward demand reduction or transformation: wedges “demand efficiency” and “supply decarbonization” in the three main sectors -i.e. building, transport and industry-. Implementing these wedges implies carefully considering end-user consumption patterns, regulation design, awareness-raising campaigns and economic signals in order to achieve a better diffusion of low-carbon solutions and habits.
Secondly the challenge of decarbonization also implies using more and more renewable energies for electricity production, especially from intermittent variable renewable electricity (VRE, i.e. wind and solar). This calls for a deep evolution of electricity systems in order to ensure their stability and their resilience. Permanent adjustment of electricity supply and demand in systems with a high VRE contribution implies reorganizing and strengthening major networks with super grids and developing local solutions like smart grids in order to enable a more flexible demand. Eventually this adjustment might also imply implementing electricity mass storage.
Like the systemic dimension of renewable energy management, the importance of acting on demand involves implementing research on sociotechnical systems. This approach is of key importance to complete purely technological approaches.
22 Geels F.W. and Schot J. (2007), “Typology of sociotechnical transition pathways” in Research Policy, vol. 36.
Transition ?1. Politique2. Industrie3. Technologie4. Science5. Culture6. Pref. cons.
28
4.2 The technology-push approach: the global R&D effort is not sufficient
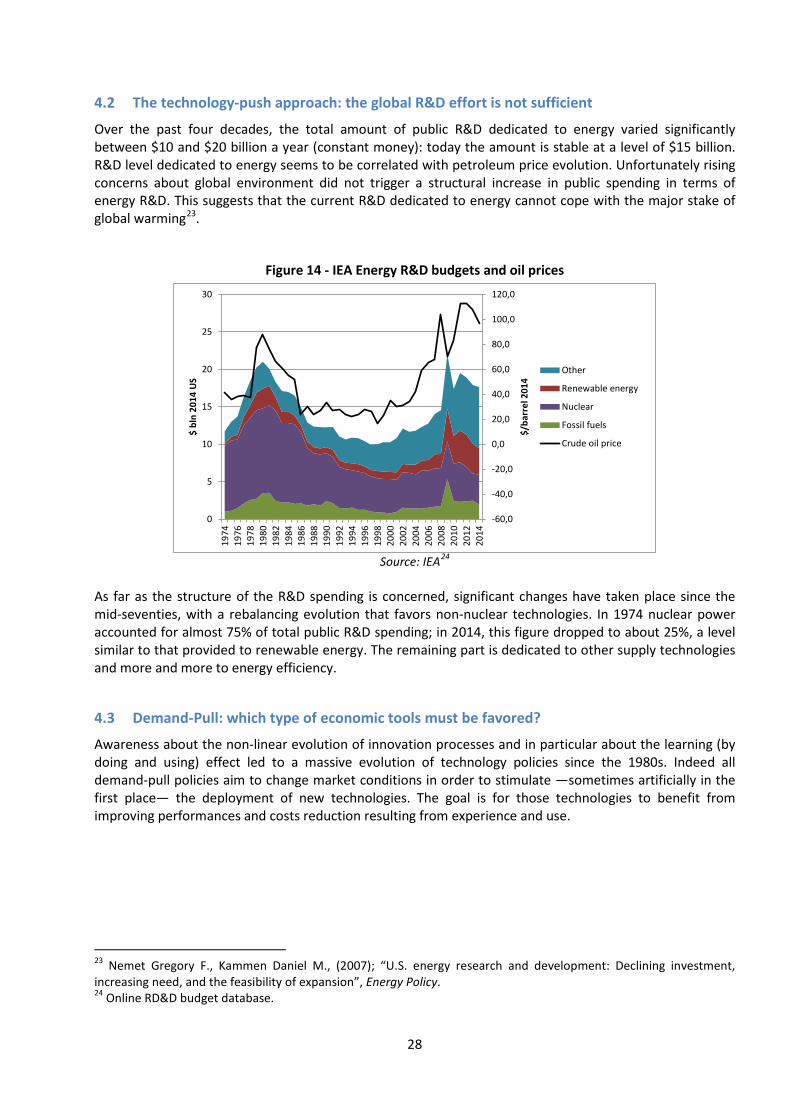
Over the past four decades, the total amount of public R&D dedicated to energy varied significantly between $10 and $20 billion a year (constant money): today the amount is stable at a level of $15 billion. R&D level dedicated to energy seems to be correlated with petroleum price evolution. Unfortunately rising concerns about global environment did not trigger a structural increase in public spending in terms of energy R&D. This suggests that the current R&D dedicated to energy cannot cope with the major stake of global warming23.
Figure 14 - IEA Energy R&D budgets and oil prices
Source: IEA24
As far as the structure of the R&D spending is concerned, significant changes have taken place since the mid-seventies, with a rebalancing evolution that favors non-nuclear technologies. In 1974 nuclear power accounted for almost 75% of total public R&D spending; in 2014, this figure dropped to about 25%, a level similar to that provided to renewable energy. The remaining part is dedicated to other supply technologies and more and more to energy efficiency.
4.3 Demand-Pull: which type of economic tools must be favored?
Awareness about the non-linear evolution of innovation processes and in particular about the learning (by doing and using) effect led to a massive evolution of technology policies since the 1980s. Indeed all demand-pull policies aim to change market conditions in order to stimulate —sometimes artificially in the first place— the deployment of new technologies. The goal is for those technologies to benefit from improving performances and costs reduction resulting from experience and use.
23 Nemet Gregory F., Kammen Daniel M., (2007); “U.S. energy research and development: Declining investment, increasing need, and the feasibility of expansion”, Energy Policy. 24 Online RD&D budget database.
-60,0
-40,0
-20,0
0,0
20,0
40,0
60,0
80,0
100,0
120,0
0
5
10
15
20
25
30
1974
1976
1978
1980
1982
1984
1986
1988
1990
1992
1994
1996
1998
2000
2002
2004
2006
2008
2010
2012
2014
$/ba
rrel
201
4
$ bl
n 20
14 U
S
Other
Renewable energy
Nuclear
Fossil fuels
Crude oil price
29
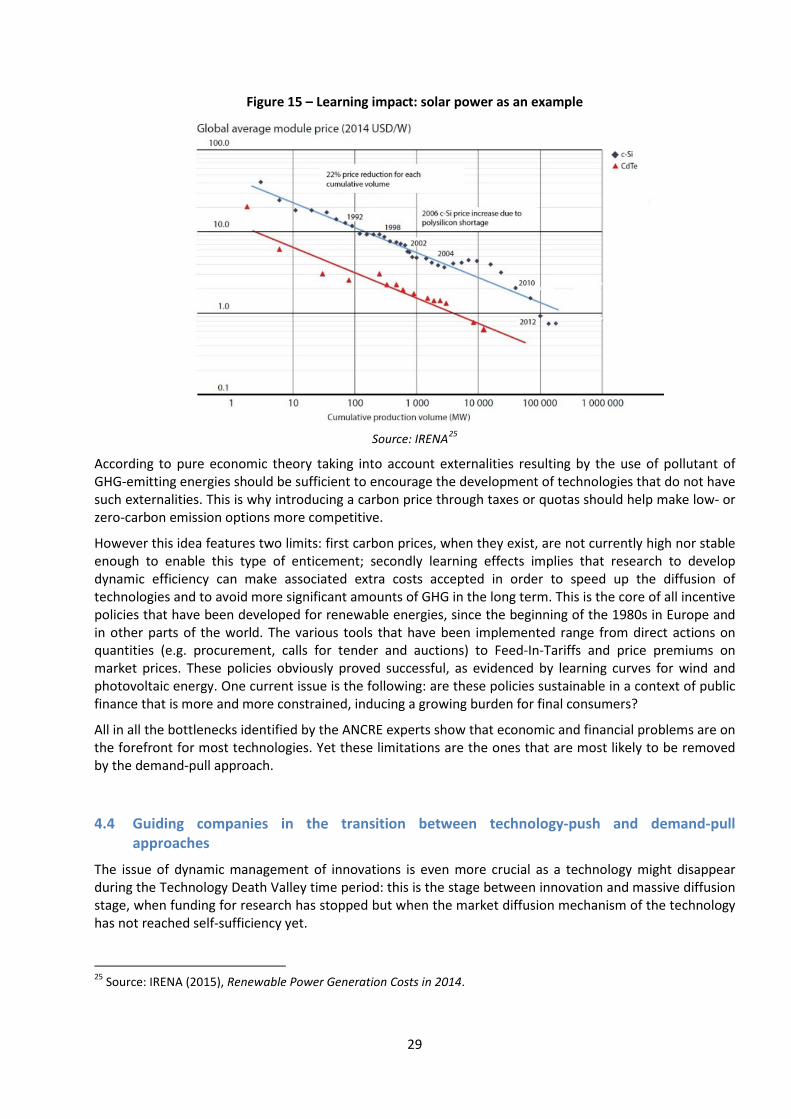
Figure 15 – Learning impact: solar power as an example
Source: IRENA25
According to pure economic theory taking into account externalities resulting by the use of pollutant of GHG-emitting energies should be sufficient to encourage the development of technologies that do not have such externalities. This is why introducing a carbon price through taxes or quotas should help make low- or zero-carbon emission options more competitive.
However this idea features two limits: first carbon prices, when they exist, are not currently high nor stable enough to enable this type of enticement; secondly learning effects implies that research to develop dynamic efficiency can make associated extra costs accepted in order to speed up the diffusion of technologies and to avoid more significant amounts of GHG in the long term. This is the core of all incentive policies that have been developed for renewable energies, since the beginning of the 1980s in Europe and in other parts of the world. The various tools that have been implemented range from direct actions on quantities (e.g. procurement, calls for tender and auctions) to Feed-In-Tariffs and price premiums on market prices. These policies obviously proved successful, as evidenced by learning curves for wind and photovoltaic energy. One current issue is the following: are these policies sustainable in a context of public finance that is more and more constrained, inducing a growing burden for final consumers?
All in all the bottlenecks identified by the ANCRE experts show that economic and financial problems are on the forefront for most technologies. Yet these limitations are the ones that are most likely to be removed by the demand-pull approach.
4.4 Guiding companies in the transition between technology-push and demand-pull approaches
The issue of dynamic management of innovations is even more crucial as a technology might disappear during the Technology Death Valley time period: this is the stage between innovation and massive diffusion stage, when funding for research has stopped but when the market diffusion mechanism of the technology has not reached self-sufficiency yet.
25 Source: IRENA (2015), Renewable Power Generation Costs in 2014.
30
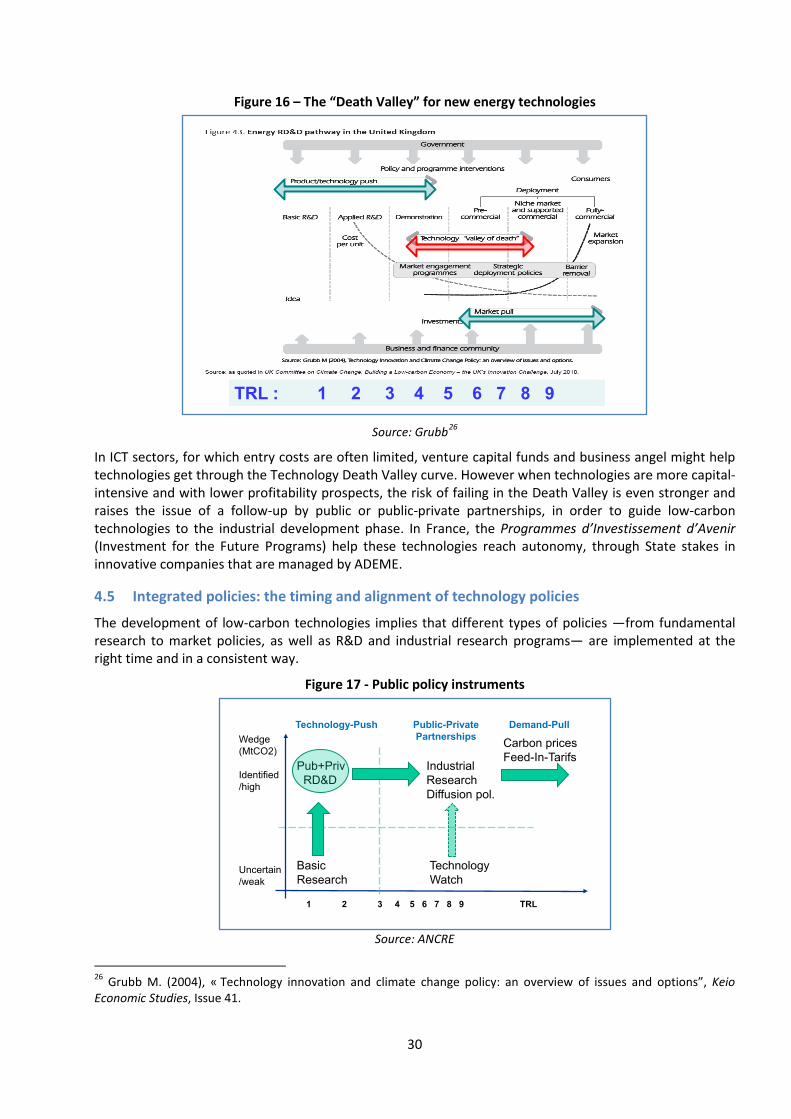
Figure 16 – The “Death Valley” for new energy technologies
Source: Grubb26
In ICT sectors, for which entry costs are often limited, venture capital funds and business angel might help technologies get through the Technology Death Valley curve. However when technologies are more capital-intensive and with lower profitability prospects, the risk of failing in the Death Valley is even stronger and raises the issue of a follow-up by public or public-private partnerships, in order to guide low-carbon technologies to the industrial development phase. In France, the Programmes d’Investissement d’Avenir (Investment for the Future Programs) help these technologies reach autonomy, through State stakes in innovative companies that are managed by ADEME.
4.5 Integrated policies: the timing and alignment of technology policies
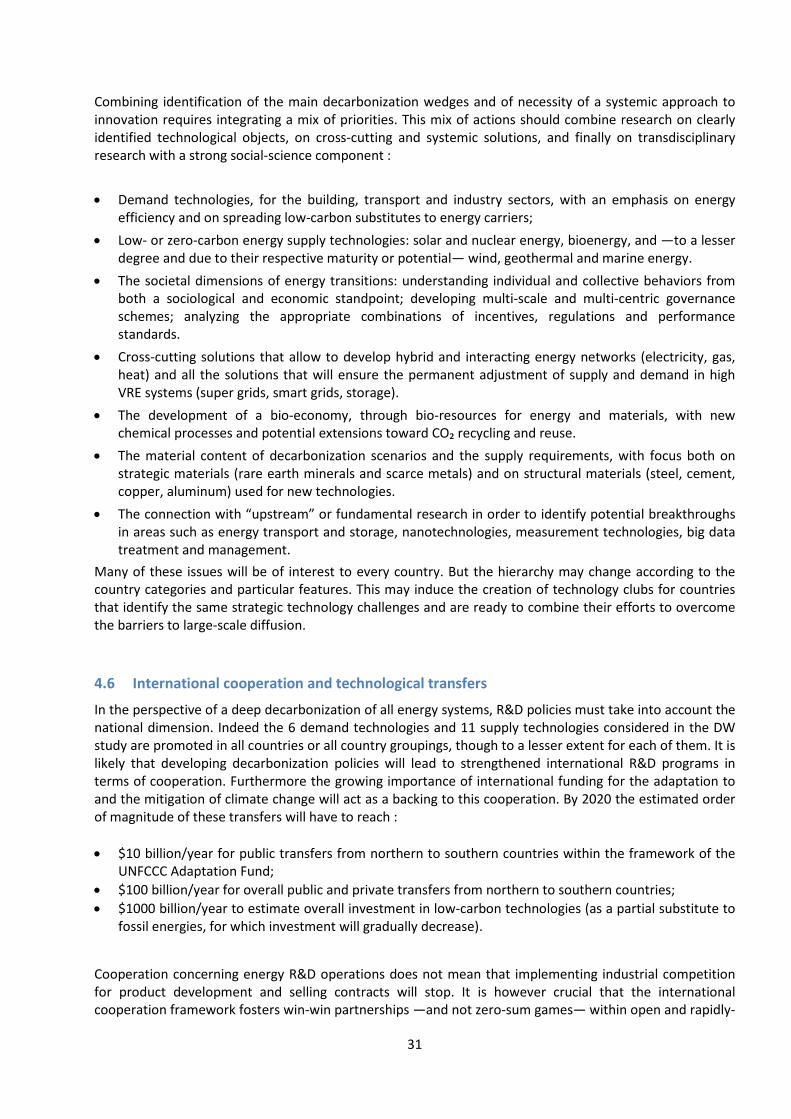
The development of low-carbon technologies implies that different types of policies —from fundamental research to market policies, as well as R&D and industrial research programs— are implemented at the right time and in a consistent way.
Figure 17 - Public policy instruments
Source: ANCRE
26 Grubb M. (2004), « Technology innovation and climate change policy: an overview of issues and options”, Keio Economic Studies, Issue 41.
TRL : 1 2 3 4 5 6 7 8 9
Pub+Priv IndustrialRD&D Research
Diffusion pol.
Basic TechnologyResearch Watch
Wedge(MtCO2)
Identified/high
Uncertain/weak
1 2 3 4 5 6 7 8 9 TRL
Technology-Push Public-Private Demand-PullPartnerships Carbon prices
Feed-In-Tarifs
31
Combining identification of the main decarbonization wedges and of necessity of a systemic approach to innovation requires integrating a mix of priorities. This mix of actions should combine research on clearly identified technological objects, on cross-cutting and systemic solutions, and finally on transdisciplinary research with a strong social-science component : • Demand technologies, for the building, transport and industry sectors, with an emphasis on energy
efficiency and on spreading low-carbon substitutes to energy carriers; • Low- or zero-carbon energy supply technologies: solar and nuclear energy, bioenergy, and —to a lesser
degree and due to their respective maturity or potential— wind, geothermal and marine energy. • The societal dimensions of energy transitions: understanding individual and collective behaviors from
both a sociological and economic standpoint; developing multi-scale and multi-centric governance schemes; analyzing the appropriate combinations of incentives, regulations and performance standards.
• Cross-cutting solutions that allow to develop hybrid and interacting energy networks (electricity, gas, heat) and all the solutions that will ensure the permanent adjustment of supply and demand in high VRE systems (super grids, smart grids, storage).
• The development of a bio-economy, through bio-resources for energy and materials, with new chemical processes and potential extensions toward CO₂ recycling and reuse.
• The material content of decarbonization scenarios and the supply requirements, with focus both on strategic materials (rare earth minerals and scarce metals) and on structural materials (steel, cement, copper, aluminum) used for new technologies.
• The connection with “upstream” or fundamental research in order to identify potential breakthroughs in areas such as energy transport and storage, nanotechnologies, measurement technologies, big data treatment and management.
Many of these issues will be of interest to every country. But the hierarchy may change according to the country categories and particular features. This may induce the creation of technology clubs for countries that identify the same strategic technology challenges and are ready to combine their efforts to overcome the barriers to large-scale diffusion.
4.6 International cooperation and technological transfers
In the perspective of a deep decarbonization of all energy systems, R&D policies must take into account the national dimension. Indeed the 6 demand technologies and 11 supply technologies considered in the DW study are promoted in all countries or all country groupings, though to a lesser extent for each of them. It is likely that developing decarbonization policies will lead to strengthened international R&D programs in terms of cooperation. Furthermore the growing importance of international funding for the adaptation to and the mitigation of climate change will act as a backing to this cooperation. By 2020 the estimated order of magnitude of these transfers will have to reach : • $10 billion/year for public transfers from northern to southern countries within the framework of the
UNFCCC Adaptation Fund; • $100 billion/year for overall public and private transfers from northern to southern countries; • $1000 billion/year to estimate overall investment in low-carbon technologies (as a partial substitute to
fossil energies, for which investment will gradually decrease).
Cooperation concerning energy R&D operations does not mean that implementing industrial competition for product development and selling contracts will stop. It is however crucial that the international cooperation framework fosters win-win partnerships —and not zero-sum games— within open and rapidly-
32
developing markets. This will probably lead to a deep reflection on intellectual property rights associated with low-carbon technologies and on collaborative international management of these rights. Intellectual property rights are indeed at stake as they must not hinder the development of low-carbon technologies. This is particularly true for less advanced countries, which would otherwise experience significant difficulties in reconciling internal constraints and development priorities with the deployment of low-carbon technologies.
5 Main conclusions The method used in this study is innovative as it combines the concept of decarbonization wedges (avoided CO2 emissions which are retained as achievable in consistent scenarios) applied to the energy trajectories in the Deep Decarbonization Pathways Project (DDPP) and the evaluation of abatement potentials for the corresponding technologies, as estimated by ANCRE experts. The technological assessment of abatement potentials was carried out with a detailed dynamic approach from the present period up to 2050. One hundred and height basic technologies belonging to fourteen different technology groupings have been assessed, with the aim to estimate for each of them, maturity, bottlenecks, innovation types and the abatement potential. The goal of this study is indeed to compare the energy trajectories and abatement options as described in DDPP with the technical abatement potentials according to a 2°C scenario as viewed by ANCRE experts. This study also provides a vision on the most promising technological innovations and the solutions to foster their diffusion. Naturally, this study includes several limitations. However these limitations do not significantly lessen the importance of the results that follow.
The main characteristics of this study are: • The methodology involves defining and assessing technological abatement potential in a dynamic way,
as well as checking if these potentials are large enough to develop a set of deep decarbonization pathways;
• The technological wedges that are implemented in the DDPP trajectories are identified and quantified; • The ANCRE Working Groups carried out a structured assessment in order to highlight the main factors
driving low-carbon technologies development.
Several main conclusions are drawn:
• The 108 technologies identified by ANCRE bring a major contribution to reduce the CO₂ emissions by more than 45 billion tons by 2050, compared to a business-as-usual scenario, amount required to follow a trajectory compatible with the 2°C target.
• In the short term (10 to 15 years) the theoretical potentials from existing technologies are significant and can allow to position the energy system on a 2°C trajectory, provided that political actions foster mitigation through technological and behavioral changes.
• On a longer term, the margins of maneuver will have disappeared and a very significant R&D effort will be needed beforehand, in order to make the 2°C scenario technically feasible, regardless of economic and social constraints.
• The main bottlenecks to the deployment of existing technologies indeed pertain to economy and finance as capital-intensive technologies often raise issues of cost-competitiveness and funding capacity. Similarly the regulation environment does not always foster technological development while, due to a possible lack of adequate R&D effort, the large uncertainties on the future costs and performances of new technologies may hinder their development.
• In 2050, the main energy supply technologies for the 2°C target come out as solar energy (10 % of global potential reduction), wind power (9 %), Gen-3 nuclear reactors (8.5%), hydro energy (mostly in southern countries) and biomass, as well as other new energies (e.g. geothermal and marine energy). CCS and storage technologies will also play an important role in reducing global emissions. However the
33
ANCRE considers that CCS potential will be of a lesser importance (5%) compared to what the DDPP study suggests (15%);
• Concerning the end-use sectors, the energy efficiency and decarbonized energy carriers technologies will be implemented mostly in industry (24% of global 2050 potential reduction) and transports (18%). The ANCRE study suggests that the building sector may play a somewhat less important role at global level, as reductions will be concentrated in Europe and Japan (9% of total with thermal solar and geothermal energy).
• The assessment shows that radical innovations are expected in several technology groupings. These breakthroughs do not only pertain to the technologies themselves, but also to the regulation environment (standards, intellectual property, etc.), to market design (organization, access to finance, subsidies, taxes) and to system design and operation (super grids, smart grids, large deployment of ICT, power to gas and energy storage, e.g. for variable energy production management). The ANCRE experts estimate that there are relatively few bottlenecks referring to socio-technical feasibility, which are mainly associated with nuclear power (especially in European countries) and CCS. In fact, this dimension is a challenging one and will be developed in future ANCRE works in collaboration with the French Alliance for Social Sciences (ATHENA).
ANCRE proposes several measures to be implemented in the short term in order to foster the availability of new technologies on a global scale. Most actions involve: • Enhancing R&D efforts: (i) focusing short term R&D efforts on strategic technology groupings that have
the most promising emissions reduction potentials; (ii) increasing R&D efforts on a large scale in the long term and for all low carbon technologies in order to start preparing the technological potentials of the long and very long term – the OECD/IEA advocates a threefold increase in R&D spending with increasing diversity.
• As far as socio-technical or economic bottlenecks are concerned, research in the social sciences for energy transitions has to be encouraged in order to better identify factors that can concretely foster success of the most relevant technologies in the different world regions.
• Preparing the development of technologies with a potential maturity by 2030 and onward, by deploying generic technologies which can facilitate the emergence of radical innovations and by helping technologies with a low Time Readiness Level to get through the “Valley of Death” and reach market deployment. Interdisciplinary research could be of a great help in that sense.
• Implementing a market approach – or demand-pull strategies – as a complement to the pure technological approach – the technology-push policies – in order to benefit from a wider dissemination and the associated learning effects. Subsidies, feed-in tariffs or premium, auctions and strike prices are different tools that can be implemented to achieve appropriate coordination.
• Fostering innovation for low carbon solutions through technology transfers or local capacity building in the developing world regions. In this regard, new solutions will be needed to help solving intellectual property right issues. Redistribution of part of the revenues from new carbon taxes or emission quotas may for example, may benefit to technology transfers through direct finance or patent buybacks.
Finally, these results show the importance of a strong and quick involvement for the development and diffusion of low carbon solutions, both at national and international scale. This involvement will boost innovation and also accompany behavioral changes that will enable the implementation of low-carbon options, starting with existing technologies and continuing with new emerging technologies and systems on a large scale.
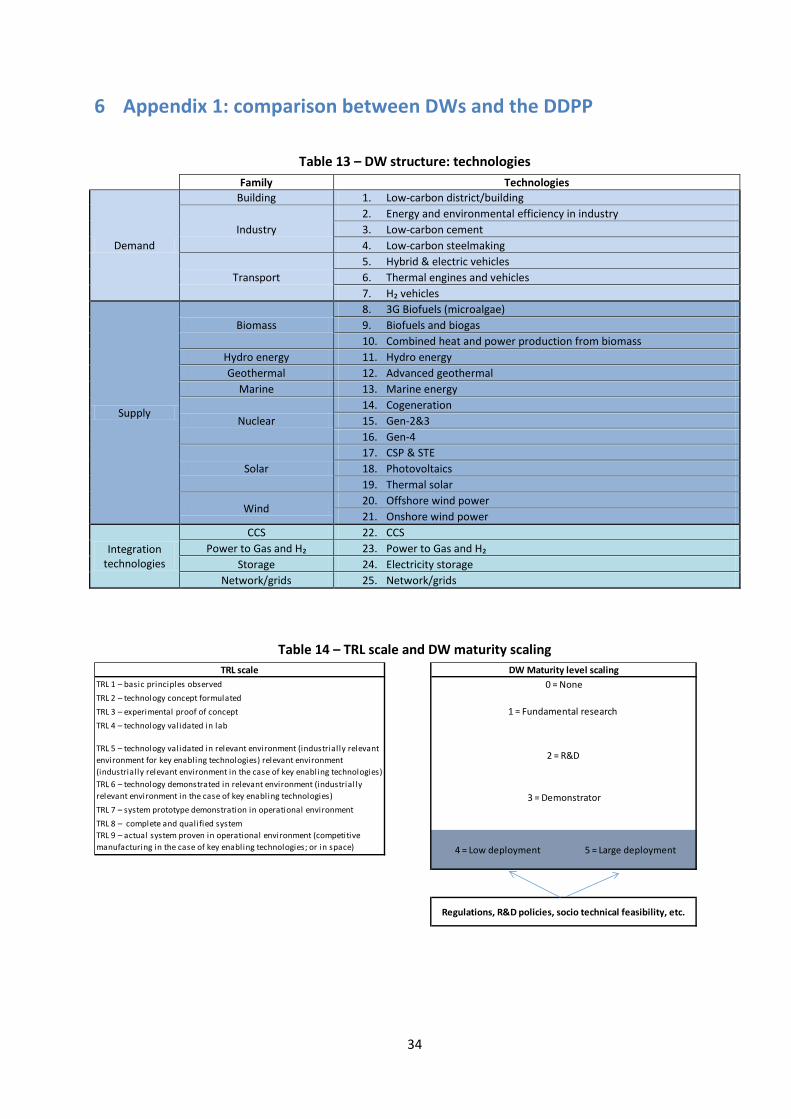
34
6 Appendix 1: comparison between DWs and the DDPP
Table 13 – DW structure: technologies
Family Technologies
Demand
Building 1. Low-carbon district/building
Industry 2. Energy and environmental efficiency in industry 3. Low-carbon cement 4. Low-carbon steelmaking
Transport 5. Hybrid & electric vehicles 6. Thermal engines and vehicles 7. H₂ vehicles
Supply
Biomass 8. 3G Biofuels (microalgae) 9. Biofuels and biogas 10. Combined heat and power production from biomass
Hydro energy 11. Hydro energy Geothermal 12. Advanced geothermal
Marine 13. Marine energy
Nuclear 14. Cogeneration 15. Gen-2&3 16. Gen-4
Solar 17. CSP & STE 18. Photovoltaics 19. Thermal solar
Wind 20. Offshore wind power 21. Onshore wind power
Integration technologies
CCS 22. CCS Power to Gas and H₂ 23. Power to Gas and H₂
Storage 24. Electricity storage Network/grids 25. Network/grids
Table 14 – TRL scale and DW maturity scaling
TRL scaleTRL 1 – basic principles observedTRL 2 – technology concept formulated TRL 3 – experimental proof of concept TRL 4 – technology validated in lab
TRL 5 – technology validated in relevant environment (industrially relevant environment for key enabling technologies) relevant environment (industrially relevant environment in the case of key enabling technologies)TRL 6 – technology demonstrated in relevant environment (industrially relevant environment in the case of key enabling technologies)TRL 7 – system prototype demonstration in operational environmentTRL 8 – complete and qualified systemTRL 9 – actual system proven in operational environment (competitive manufacturing in the case of key enabling technologies; or in space)
Regulations, R&D policies, socio technical feasibility, etc.
DW Maturity level scaling0 = None
1 = Fundamental research
2 = R&D
3 = Demonstrator
4 = Low deployment 5 = Large deployment
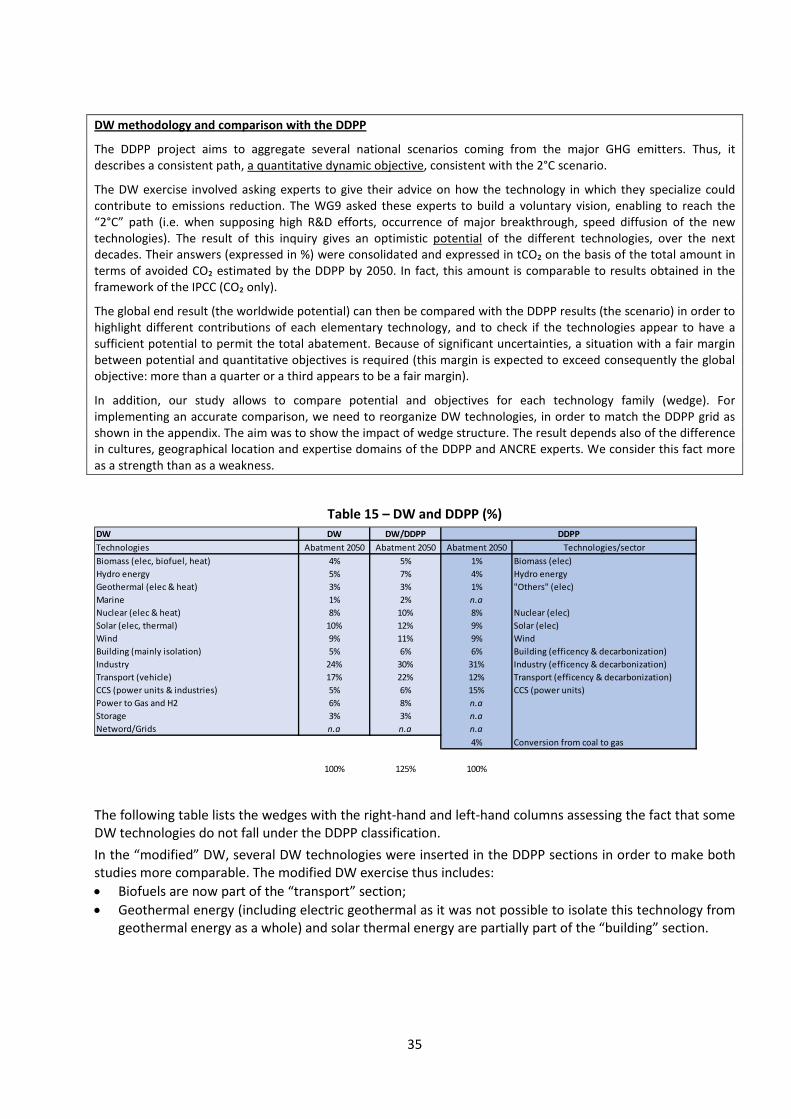
35
DW methodology and comparison with the DDPP
The DDPP project aims to aggregate several national scenarios coming from the major GHG emitters. Thus, it describes a consistent path, a quantitative dynamic objective, consistent with the 2°C scenario.
The DW exercise involved asking experts to give their advice on how the technology in which they specialize could contribute to emissions reduction. The WG9 asked these experts to build a voluntary vision, enabling to reach the “2°C” path (i.e. when supposing high R&D efforts, occurrence of major breakthrough, speed diffusion of the new technologies). The result of this inquiry gives an optimistic potential of the different technologies, over the next decades. Their answers (expressed in %) were consolidated and expressed in tCO₂ on the basis of the total amount in terms of avoided CO₂ estimated by the DDPP by 2050. In fact, this amount is comparable to results obtained in the framework of the IPCC (CO₂ only).
The global end result (the worldwide potential) can then be compared with the DDPP results (the scenario) in order to highlight different contributions of each elementary technology, and to check if the technologies appear to have a sufficient potential to permit the total abatement. Because of significant uncertainties, a situation with a fair margin between potential and quantitative objectives is required (this margin is expected to exceed consequently the global objective: more than a quarter or a third appears to be a fair margin).
In addition, our study allows to compare potential and objectives for each technology family (wedge). For implementing an accurate comparison, we need to reorganize DW technologies, in order to match the DDPP grid as shown in the appendix. The aim was to show the impact of wedge structure. The result depends also of the difference in cultures, geographical location and expertise domains of the DDPP and ANCRE experts. We consider this fact more as a strength than as a weakness.
Table 15 – DW and DDPP (%)
The following table lists the wedges with the right-hand and left-hand columns assessing the fact that some DW technologies do not fall under the DDPP classification. In the “modified” DW, several DW technologies were inserted in the DDPP sections in order to make both studies more comparable. The modified DW exercise thus includes: • Biofuels are now part of the “transport” section; • Geothermal energy (including electric geothermal as it was not possible to isolate this technology from
geothermal energy as a whole) and solar thermal energy are partially part of the “building” section.
DW DW DW/DDPPTechnologies Abatment 2050 Abatment 2050 Abatment 2050 Technologies/sectorBiomass (elec, biofuel, heat) 4% 5% 1% Biomass (elec)Hydro energy 5% 7% 4% Hydro energyGeothermal (elec & heat) 3% 3% 1% "Others" (elec)Marine 1% 2% n.aNuclear (elec & heat) 8% 10% 8% Nuclear (elec)Solar (elec, thermal) 10% 12% 9% Solar (elec)Wind 9% 11% 9% WindBuilding (mainly isolation) 5% 6% 6% Building (efficency & decarbonization)Industry 24% 30% 31% Industry (efficency & decarbonization)Transport (vehicle) 17% 22% 12% Transport (efficency & decarbonization)CCS (power units & industries) 5% 6% 15% CCS (power units)Power to Gas and H2 6% 8% n.aStorage 3% 3% n.aNetword/Grids n.a n.a n.a
4% Conversion from coal to gas
100% 125% 100%
DDPP
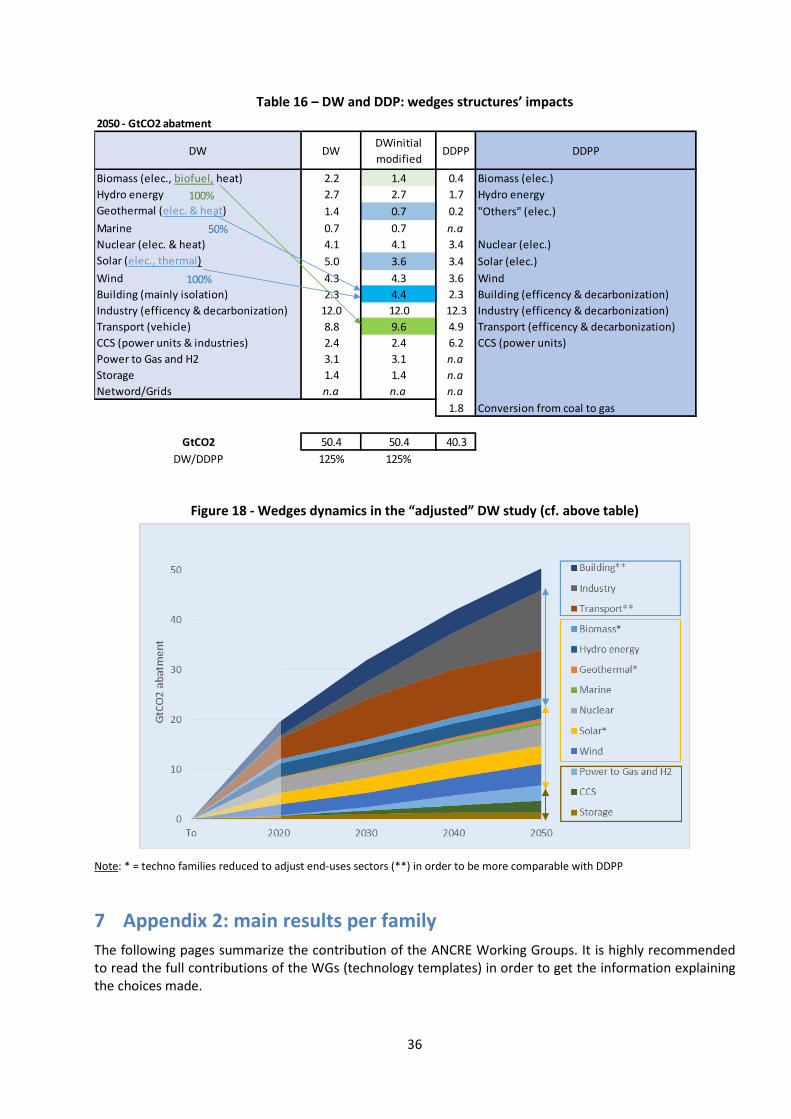
36
Table 16 – DW and DDP: wedges structures’ impacts
Figure 18 - Wedges dynamics in the “adjusted” DW study (cf. above table)
Note: * = techno families reduced to adjust end-uses sectors (**) in order to be more comparable with DDPP
7 Appendix 2: main results per family The following pages summarize the contribution of the ANCRE Working Groups. It is highly recommended to read the full contributions of the WGs (technology templates) in order to get the information explaining the choices made.
2050 - GtCO2 abatment
DW DWDWinitial modified
DDPP DDPP
Biomass (elec., biofuel, heat) 2.2 1.4 0.4 Biomass (elec.)Hydro energy 2.7 2.7 1.7 Hydro energyGeothermal (elec. & heat) 1.4 0.7 0.2 "Others" (elec.)Marine 0.7 0.7 n.aNuclear (elec. & heat) 4.1 4.1 3.4 Nuclear (elec.)Solar (elec., thermal) 5.0 3.6 3.4 Solar (elec.)Wind 4.3 4.3 3.6 WindBuilding (mainly isolation) 2.3 4.4 2.3 Building (efficency & decarbonization)Industry (efficency & decarbonization) 12.0 12.0 12.3 Industry (efficency & decarbonization)Transport (vehicle) 8.8 9.6 4.9 Transport (efficency & decarbonization)CCS (power units & industries) 2.4 2.4 6.2 CCS (power units)Power to Gas and H2 3.1 3.1 n.aStorage 1.4 1.4 n.aNetword/Grids n.a n.a n.a
1.8 Conversion from coal to gas
GtCO2 50.4 50.4 40.3DW/DDPP 125% 125%
100%
50%
100%
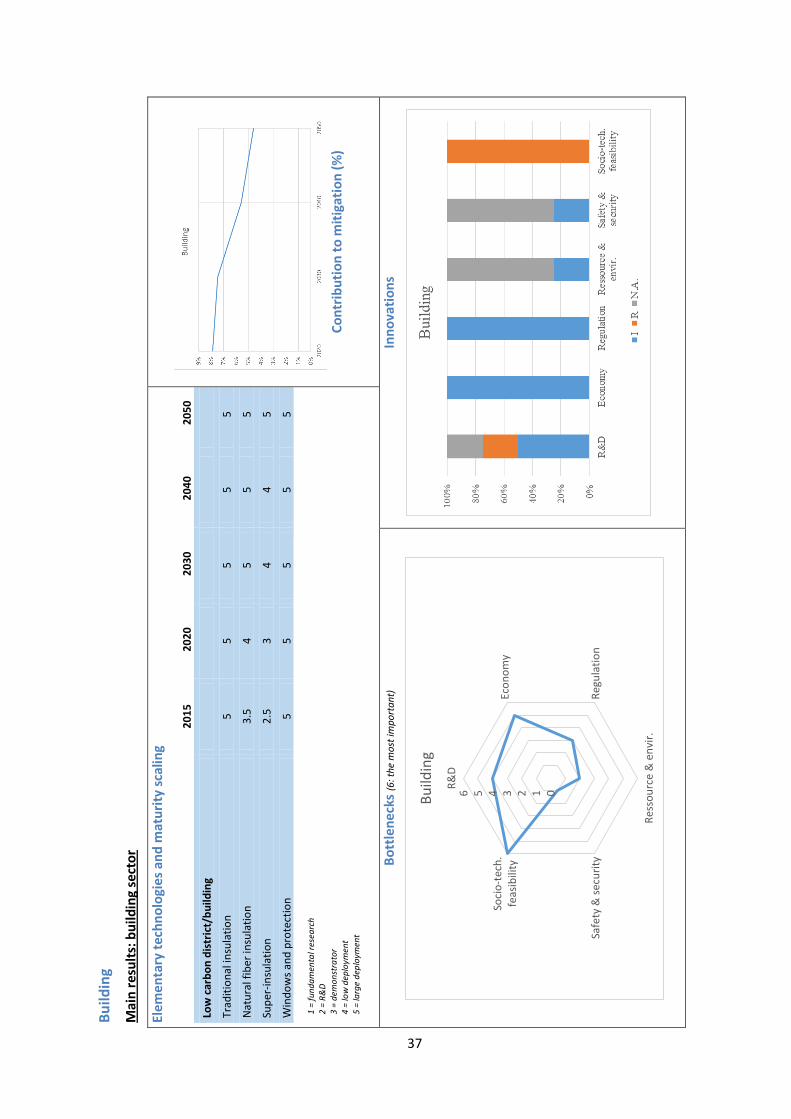
Build
ing
Mai
n re
sults
: bui
ldin
g se
ctor
Elem
enta
ry te
chno
logi
es a
nd m
atur
ity sc
alin
g
20
15
202
0 2
030
204
0 2
050
Low
car
bon
dist
rict/
build
ing
Trad
ition
al in
sula
tion
5 5
5 5
5
Nat
ural
fibe
r ins
ulat
ion
3.5
4 5
5 5
Supe
r-in
sula
tion
2.5
3 4
4 5
Win
dow
s and
pro
tect
ion
5 5
5 5
5 1
= fu
ndam
enta
l res
earc
h 2
= R&
D 3
= de
mon
stra
tor
4 =
low
dep
loym
ent
5 =
larg
e de
ploy
men
t
Cont
ribut
ion
to m
itiga
tion
(%)
Bott
lene
cks (
6: th
e m
ost i
mpo
rtan
t)
Inno
vatio
ns
0123456R&D
Econ
omy
Regu
latio
n
Ress
ourc
e &
env
ir.
Safe
ty &
secu
rity
Soci
o-te
ch.
feas
ibili
ty
Build
ing
37
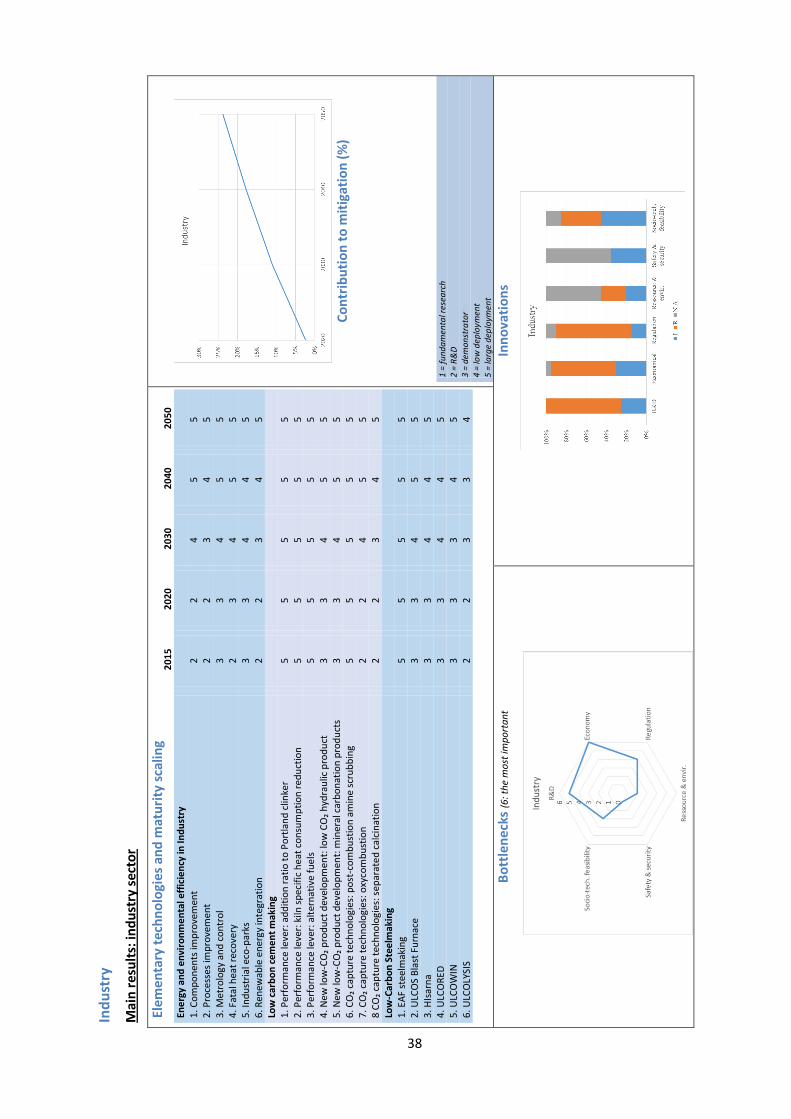
Indu
stry
Mai
n re
sults
: ind
ustr
y se
ctor
Elem
enta
ry te
chno
logi
es a
nd m
atur
ity sc
alin
g 2
015
202
0 2
030
204
0 2
050
Ener
gy a
nd e
nviro
nmen
tal e
ffici
ency
in In
dust
ry
1.
Com
pone
nts i
mpr
ovem
ent
2 2
4 5
5 2.
Pro
cess
es im
prov
emen
t 2
2 3
4 5
3. M
etro
logy
and
con
trol
3
3 4
5 5
4. F
atal
hea
t rec
over
y 2
3 4
5 5
5. In
dust
rial e
co-p
arks
3
3 4
4 5
6. R
enew
able
ene
rgy
inte
grat
ion
2 2
3 4
5 Lo
w c
arbo
n ce
men
t mak
ing
1.
Per
form
ance
leve
r: ad
ditio
n ra
tio to
Por
tland
clin
ker
5 5
5 5
5 2.
Per
form
ance
leve
r: ki
ln sp
ecifi
c he
at c
onsu
mpt
ion
redu
ctio
n 5
5 5
5 5
3. P
erfo
rman
ce le
ver:
alte
rnat
ive
fuel
s 5
5 5
5 5
4. N
ew lo
w-C
O₂ p
rodu
ct d
evel
opm
ent:
low
CO
₂ hyd
raul
ic p
rodu
ct
3 3
4 5
5 5.
New
low
-CO
₂ pro
duct
dev
elop
men
t: m
iner
al c
arbo
natio
n pr
oduc
ts
3 3
4 5
5 6.
CO
₂ cap
ture
tech
nolo
gies
: pos
t-co
mbu
stio
n am
ine
scru
bbin
g 5
5 5
5 5
7. C
O₂ c
aptu
re te
chno
logi
es: o
xyco
mbu
stio
n 2
2 4
5 5
8 CO
₂ cap
ture
tech
nolo
gies
: sep
arat
ed c
alci
natio
n
2 2
3 4
5 Lo
w-C
arbo
n St
eelm
akin
g
1.
EAF
stee
lmak
ing
5 5
5 5
5 2.
ULC
OS
Blas
t Fur
nace
3
3 4
5 5
3. H
Isar
na
3 3
4 4
5 4.
ULC
ORE
D 3
3 4
4 5
5. U
LCO
WIN
3
3 3
4 5
6. U
LCO
LYSI
S 2
2 3
3 4
Cont
ribut
ion
to m
itiga
tion
(%)
1 =
fund
amen
tal r
esea
rch
2 =
R&D
3 =
dem
onst
rato
r 4
= lo
w d
eplo
ymen
t 5
= la
rge
depl
oym
ent
Bott
lene
cks (
6: th
e m
ost i
mpo
rtan
t
Inno
vatio
ns
38
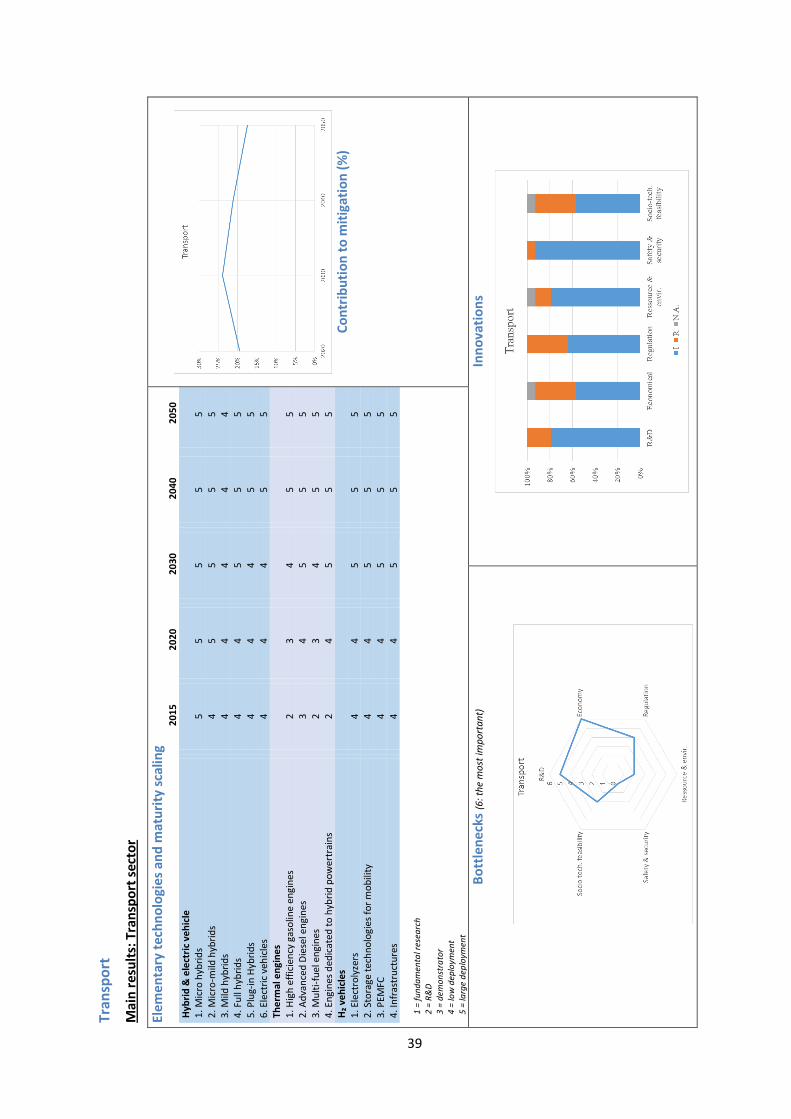
Tran
spor
t
Mai
n re
sults
: Tra
nspo
rt se
ctor
Elem
enta
ry te
chno
logi
es a
nd m
atur
ity sc
alin
g
2
015
202
0 2
030
204
0 2
050
Hybr
id &
ele
ctric
veh
icle
1. M
icro
hyb
rids
5 5
5 5
5 2.
Mic
ro-m
ild h
ybrid
s 4
5 5
5 5
3. M
ild h
ybrid
s 4
4 4
4 4
4. F
ull h
ybrid
s 4
4 5
5 5
5. P
lug-
in H
ybrid
s 4
4 4
5 5
6. E
lect
ric v
ehic
les
4 4
4 5
5 Th
erm
al e
ngin
es
1.
Hig
h ef
ficie
ncy
gaso
line
engi
nes
2 3
4 5
5 2.
Adv
ance
d Di
esel
eng
ines
3
4 5
5 5
3. M
ulti-
fuel
eng
ines
2
3 4
5 5
4. E
ngin
es d
edic
ated
to h
ybrid
pow
ertr
ains
2
4 5
5 5
H₂ v
ehic
les
1.
Ele
ctro
lyze
rs
4 4
5 5
5 2.
Sto
rage
tech
nolo
gies
for m
obili
ty
4 4
5 5
5 3.
PEM
FC
4 4
5 5
5 4.
Infr
astr
uctu
res
4 4
5 5
5 1
= fu
ndam
enta
l res
earc
h 2
= R&
D 3
= de
mon
stra
tor
4 =
low
dep
loym
ent
5 =
larg
e de
ploy
men
t
Cont
ribut
ion
to m
itiga
tion
(%)
Bott
lene
cks (
6: th
e m
ost i
mpo
rtan
t)
Inno
vatio
ns
39
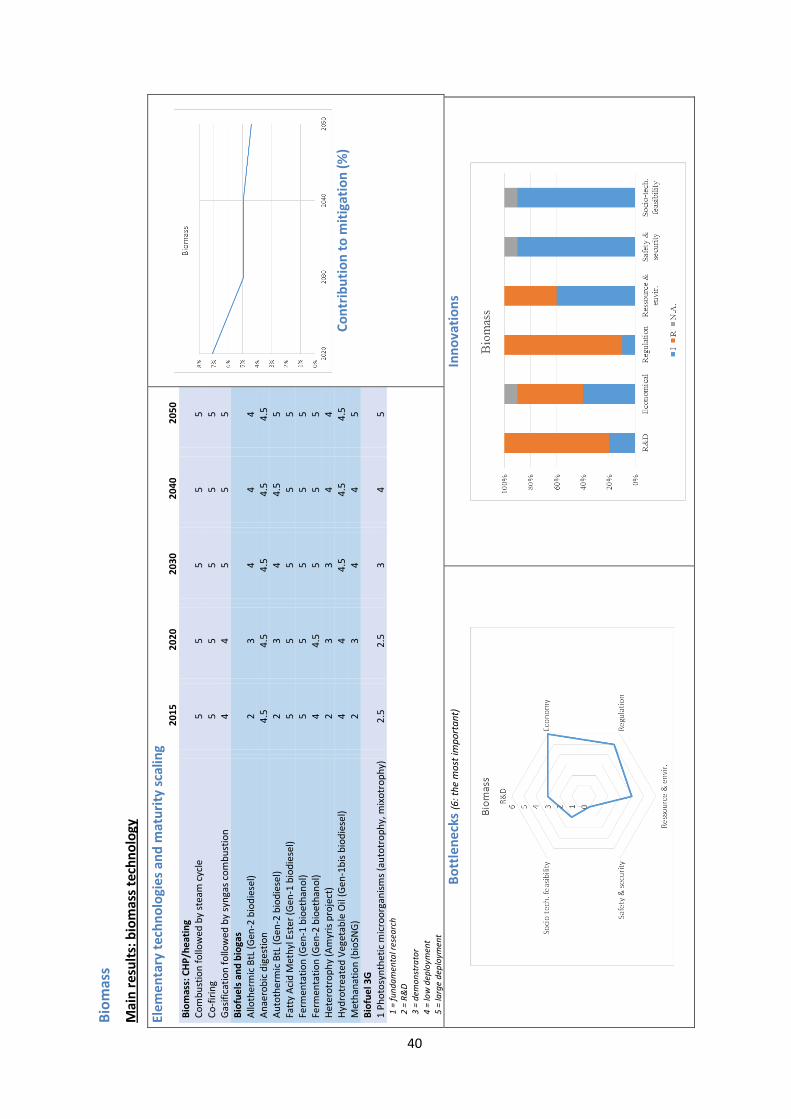
Biom
ass
Mai
n re
sults
: bio
mas
s tec
hnol
ogy
Elem
enta
ry te
chno
logi
es a
nd m
atur
ity sc
alin
g
2
015
202
0 2
030
204
0 2
050
Biom
ass:
CHP
/hea
ting
Co
mbu
stio
n fo
llow
ed b
y st
eam
cyc
le
5 5
5 5
5 Co
-firin
g 5
5 5
5 5
Gasif
icat
ion
follo
wed
by
syng
as c
ombu
stio
n 4
4 5
5 5
Biof
uels
and
bio
gas
Al
loth
erm
ic B
tL (G
en-2
bio
dies
el)
2 3
4 4
4 An
aero
bic
dige
stio
n 4.
5 4.
5 4.
5 4.
5 4.
5 Au
toth
erm
ic B
tL (G
en-2
bio
dies
el)
2 3
4 4.
5 5
Fatt
y Ac
id M
ethy
l Est
er (G
en-1
bio
dies
el)
5 5
5 5
5 Fe
rmen
tatio
n (G
en-1
bio
etha
nol)
5 5
5 5
5 Fe
rmen
tatio
n (G
en-2
bio
etha
nol)
4 4.
5 5
5 5
Hete
rotr
ophy
(Am
yris
proj
ect)
2
3 3
4 4
Hydr
otre
ated
Veg
etab
le O
il (G
en-1
bis b
iodi
esel
) 4
4 4.
5 4.
5 4.
5 M
etha
natio
n (b
ioSN
G)
2 3
4 4
5 Bi
ofue
l 3G
1
Phot
osyn
thet
ic m
icro
orga
nism
s (au
totr
ophy
, mix
otro
phy)
2.
5 2.
5 3
4 5
1 =
fund
amen
tal r
esea
rch
2 =
R&D
3 =
dem
onst
rato
r 4
= lo
w d
eplo
ymen
t 5
= la
rge
depl
oym
ent
Cont
ribut
ion
to m
itiga
tion
(%)
Bott
lene
cks (
6: th
e m
ost i
mpo
rtan
t)
Inno
vatio
ns
40
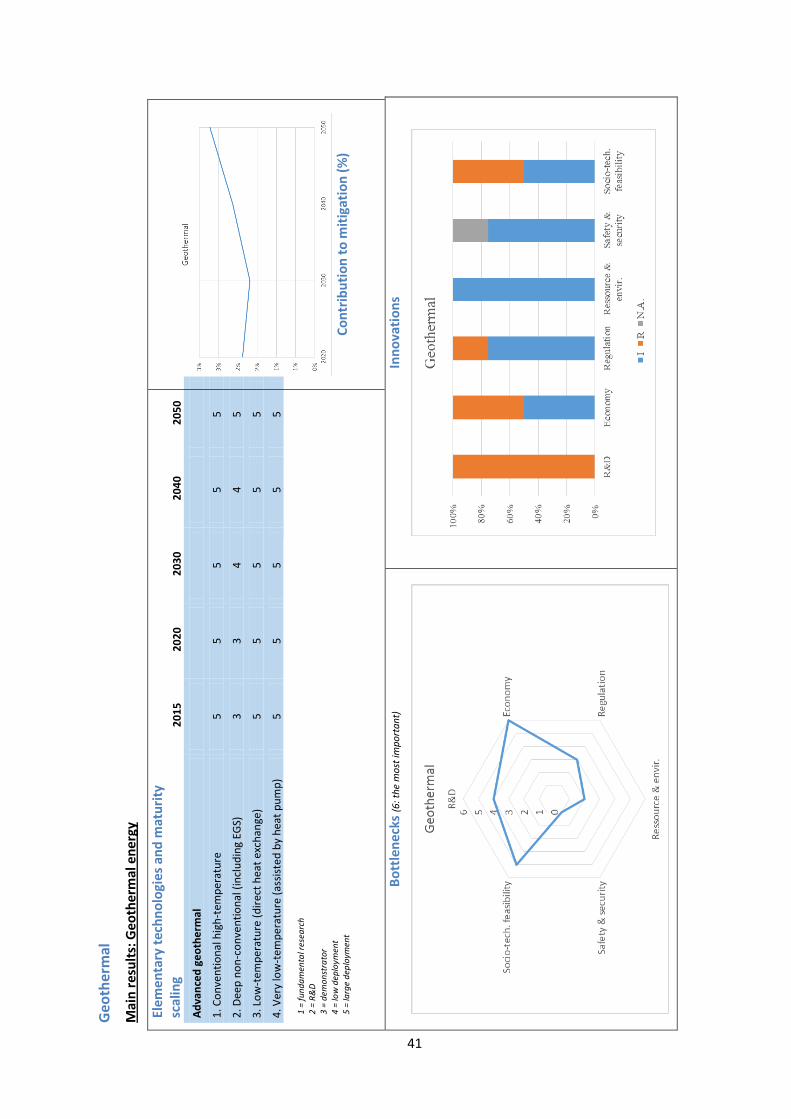
Geo
ther
mal
Mai
n re
sults
: Geo
ther
mal
ene
rgy
Elem
enta
ry te
chno
logi
es a
nd m
atur
ity
scal
ing
201
5 2
020
203
0 2
040
205
0
Adva
nced
geo
ther
mal
1. C
onve
ntio
nal h
igh-
tem
pera
ture
5
5 5
5 5
2. D
eep
non-
conv
entio
nal (
incl
udin
g EG
S)
3 3
4 4
5
3. L
ow-t
empe
ratu
re (d
irect
hea
t exc
hang
e)
5 5
5 5
5
4. V
ery
low
-tem
pera
ture
(ass
isted
by
heat
pum
p)
5 5
5 5
5 1
= fu
ndam
enta
l res
earc
h 2
= R&
D 3
= de
mon
stra
tor
4 =
low
dep
loym
ent
5 =
larg
e de
ploy
men
t
Cont
ribut
ion
to m
itiga
tion
(%)
Bott
lene
cks (
6: th
e m
ost i
mpo
rtan
t)
Inno
vatio
ns
41
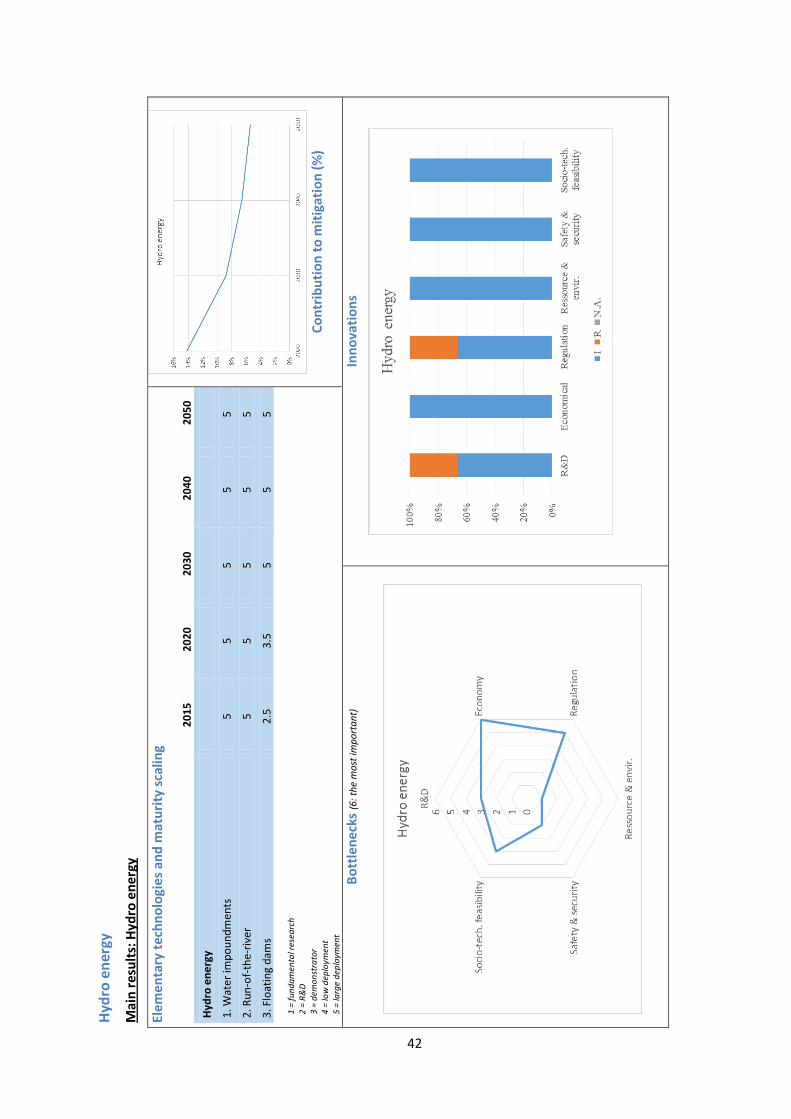
Hydr
o en
ergy
Mai
n re
sults
: Hyd
ro e
nerg
y
Elem
enta
ry te
chno
logi
es a
nd m
atur
ity sc
alin
g
2
015
202
0 2
030
204
0 2
050
Hydr
o en
ergy
1. W
ater
impo
undm
ents
5
5 5
5 5
2. R
un-o
f-the
-riv
er
5 5
5 5
5
3. F
loat
ing
dam
s 2.
5 3.
5 5
5 5
1 =
fund
amen
tal r
esea
rch
2 =
R&D
3 =
dem
onst
rato
r 4
= lo
w d
eplo
ymen
t 5
= la
rge
depl
oym
ent
Cont
ribut
ion
to m
itiga
tion
(%)
Bott
lene
cks (
6: th
e m
ost i
mpo
rtan
t)
Inno
vatio
ns
42
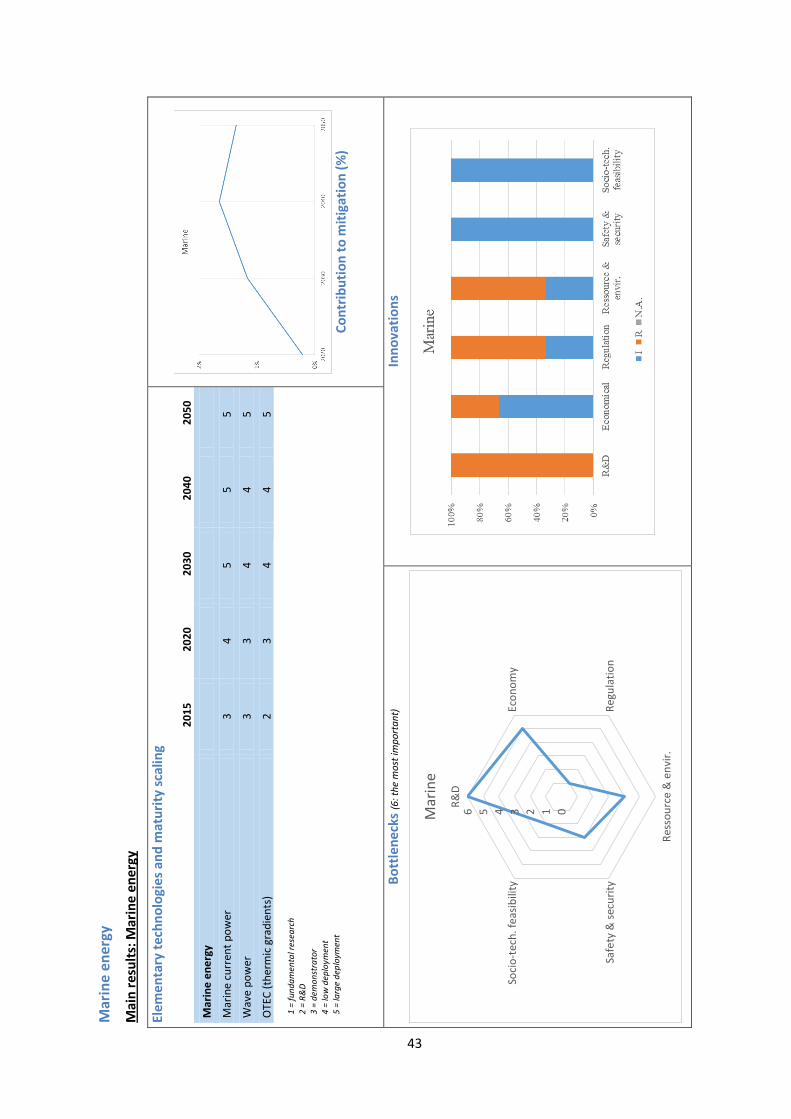
Mar
ine
ener
gy
Mai
n re
sults
: Mar
ine
ener
gy
Elem
enta
ry te
chno
logi
es a
nd m
atur
ity sc
alin
g
2
015
202
0 2
030
204
0 2
050
Mar
ine
ener
gy
Mar
ine
curr
ent p
ower
3
4 5
5 5
Wav
e po
wer
3
3 4
4 5
OTE
C (t
herm
ic g
radi
ents
) 2
3 4
4 5
1 =
fund
amen
tal r
esea
rch
2 =
R&D
3 =
dem
onst
rato
r 4
= lo
w d
eplo
ymen
t 5
= la
rge
depl
oym
ent
Cont
ribut
ion
to m
itiga
tion
(%)
Bott
lene
cks (
6: th
e m
ost i
mpo
rtan
t)
Inno
vatio
ns
0123456R&D
Econ
omy
Regu
latio
n
Ress
ourc
e &
env
ir.
Safe
ty &
secu
rity
Soci
o-te
ch. f
easib
ility
Mar
ine
43
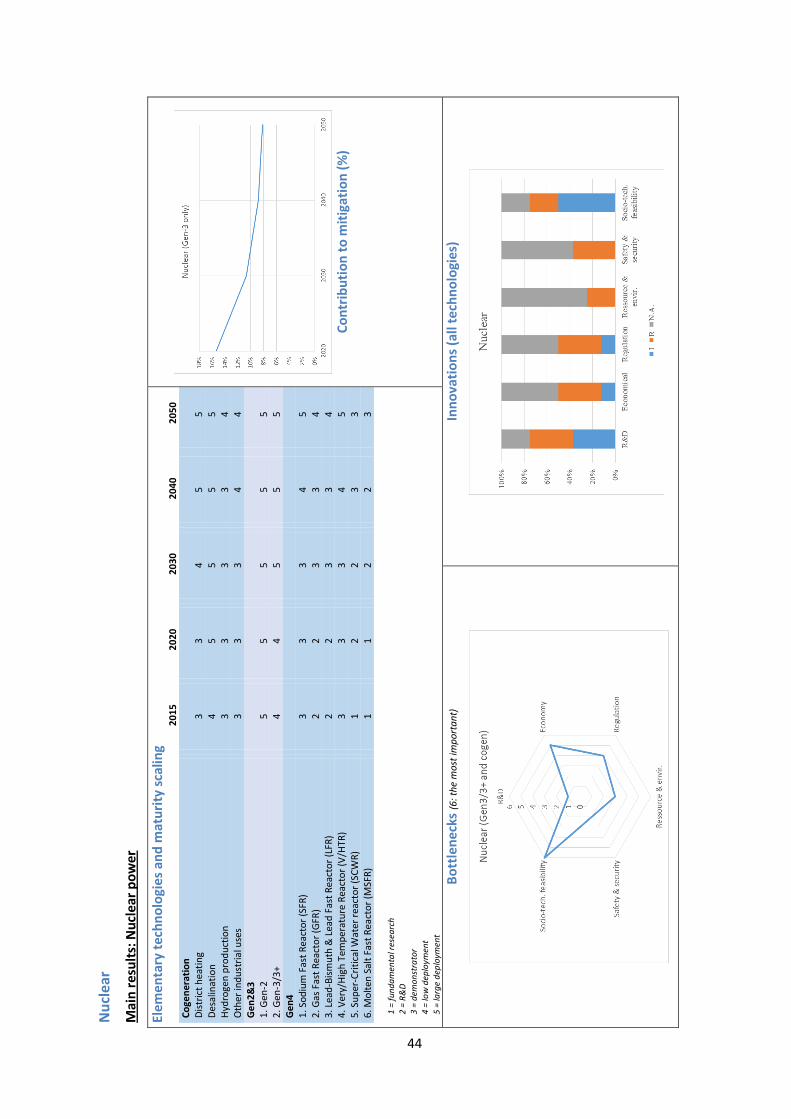
Nuc
lear
Mai
n re
sults
: Nuc
lear
pow
er
Elem
enta
ry te
chno
logi
es a
nd m
atur
ity sc
alin
g
2
015
202
0 2
030
204
0 2
050
Coge
nera
tion
Di
stric
t hea
ting
3 3
4 5
5 De
salin
atio
n 4
5 5
5 5
Hydr
ogen
pro
duct
ion
3 3
3 3
4 O
ther
indu
stria
l use
s 3
3 3
4 4
Gen
2&3
1.
Gen
-2
5 5
5 5
5 2.
Gen
-3/3
+ 4
4 5
5 5
Gen
4
1. S
odiu
m F
ast R
eact
or (S
FR)
3 3
3 4
5 2.
Gas
Fas
t Rea
ctor
(GFR
) 2
2 3
3 4
3. L
ead-
Bism
uth
& L
ead
Fast
Rea
ctor
(LFR
) 2
2 3
3 4
4. V
ery/
High
Tem
pera
ture
Rea
ctor
(V/H
TR)
3 3
3 4
5 5.
Sup
er-C
ritic
al W
ater
reac
tor (
SCW
R)
1 2
2 3
3 6.
Mol
ten
Salt
Fast
Rea
ctor
(MSF
R)
1 1
2 2
3 1
= fu
ndam
enta
l res
earc
h 2
= R&
D 3
= de
mon
stra
tor
4 =
low
dep
loym
ent
5 =
larg
e de
ploy
men
t
Cont
ribut
ion
to m
itiga
tion
(%)
Bott
lene
cks (
6: th
e m
ost i
mpo
rtan
t)
Inno
vatio
ns (a
ll te
chno
logi
es)
44
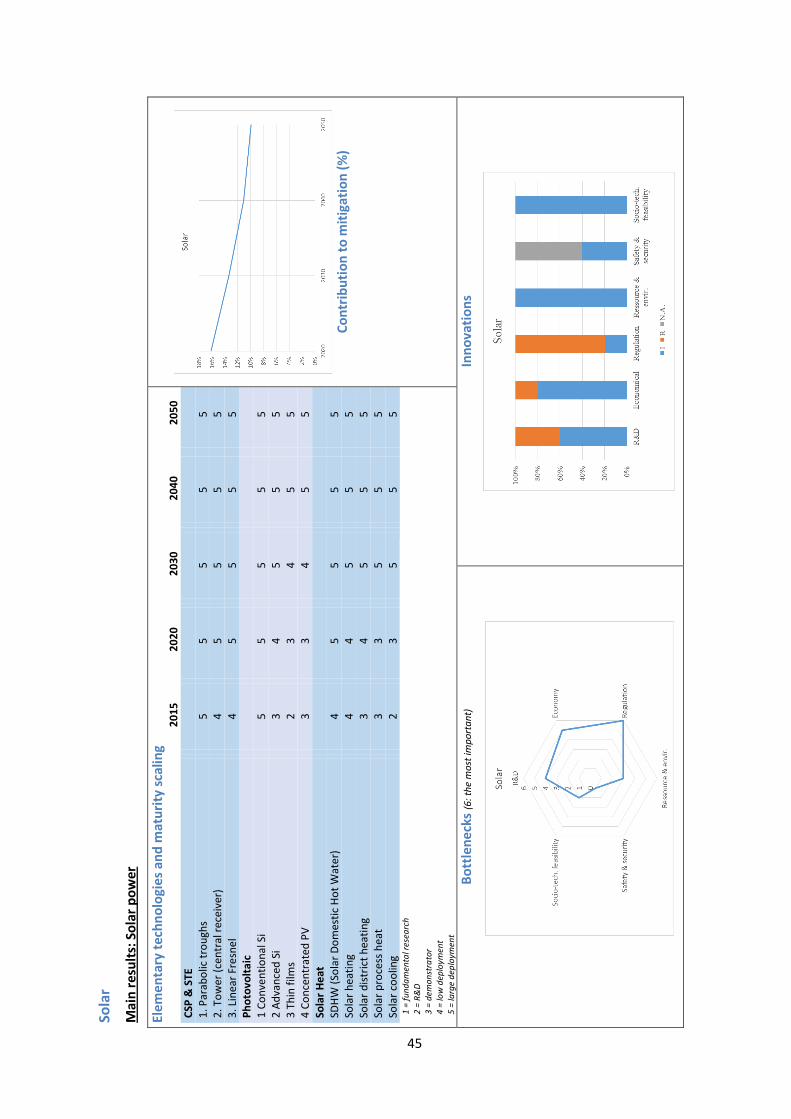
Sola
r
Mai
n re
sults
: Sol
ar p
ower
Elem
enta
ry te
chno
logi
es a
nd m
atur
ity sc
alin
g
2
015
202
0 2
030
204
0 2
050
CSP
& S
TE
1.
Par
abol
ic tr
ough
s 5
5 5
5 5
2. T
ower
(cen
tral
rece
iver
) 4
5 5
5 5
3. L
inea
r Fre
snel
4
5 5
5 5
Phot
ovol
taic
1 Co
nven
tiona
l Si
5 5
5 5
5 2
Adva
nced
Si
3 4
5 5
5 3
Thin
film
s 2
3 4
5 5
4 Co
ncen
trat
ed P
V 3
3 4
5 5
Sola
r Hea
t
SDHW
(Sol
ar D
omes
tic H
ot W
ater
) 4
5 5
5 5
Sola
r hea
ting
4 4
5 5
5 So
lar d
istric
t hea
ting
3 4
5 5
5 So
lar p
roce
ss h
eat
3 3
5 5
5 So
lar c
oolin
g 2
3 5
5 5
1 =
fund
amen
tal r
esea
rch
2 =
R&D
3 =
dem
onst
rato
r 4
= lo
w d
eplo
ymen
t 5
= la
rge
depl
oym
ent
Cont
ribut
ion
to m
itiga
tion
(%)
Bott
lene
cks (
6: th
e m
ost i
mpo
rtan
t)
Inno
vatio
ns
45
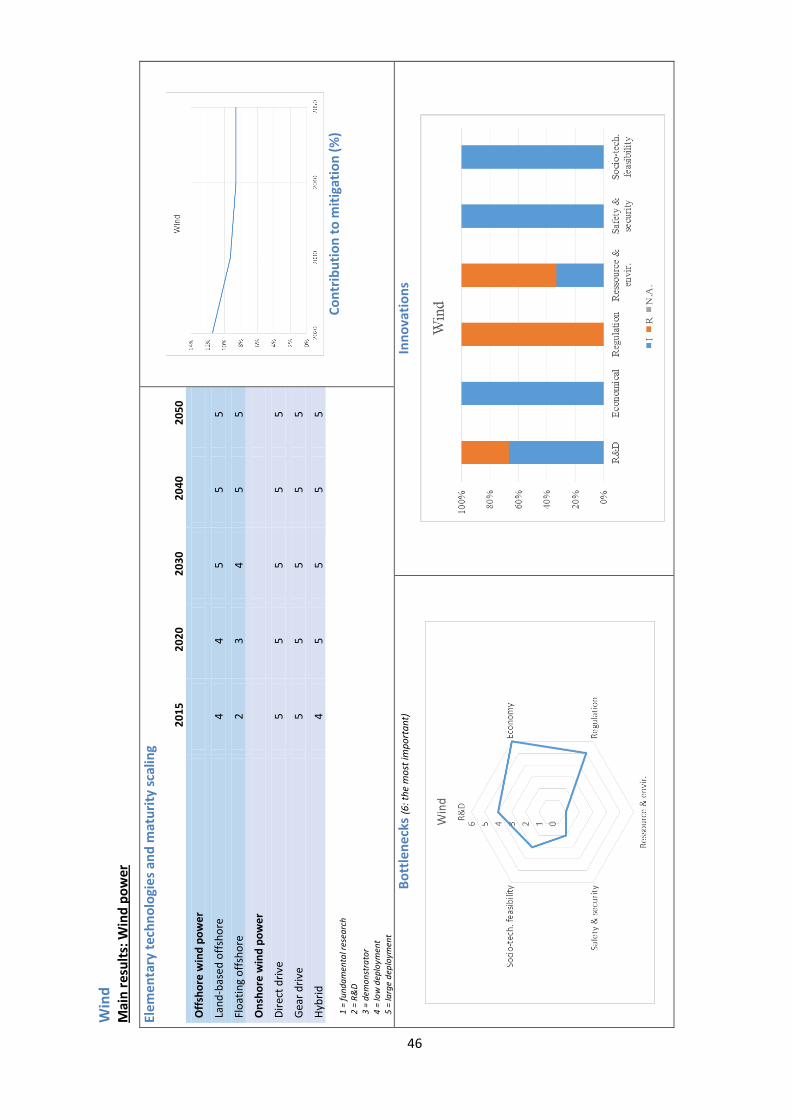
Win
d M
ain
resu
lts: W
ind
pow
er
Elem
enta
ry te
chno
logi
es a
nd m
atur
ity sc
alin
g
2
015
202
0 2
030
204
0 2
050
Off
shor
e w
ind
pow
er
Land
-bas
ed o
ffsho
re
4 4
5 5
5
Floa
ting
offs
hore
2
3 4
5 5
Ons
hore
win
d po
wer
Dire
ct d
rive
5 5
5 5
5
Gear
driv
e 5
5 5
5 5
Hybr
id
4 5
5 5
5 1
= fu
ndam
enta
l res
earc
h 2
= R&
D 3
= de
mon
stra
tor
4 =
low
dep
loym
ent
5 =
larg
e de
ploy
men
t
Cont
ribut
ion
to m
itiga
tion
(%)
Bott
lene
cks (
6: th
e m
ost i
mpo
rtan
t)
Inno
vatio
ns
46
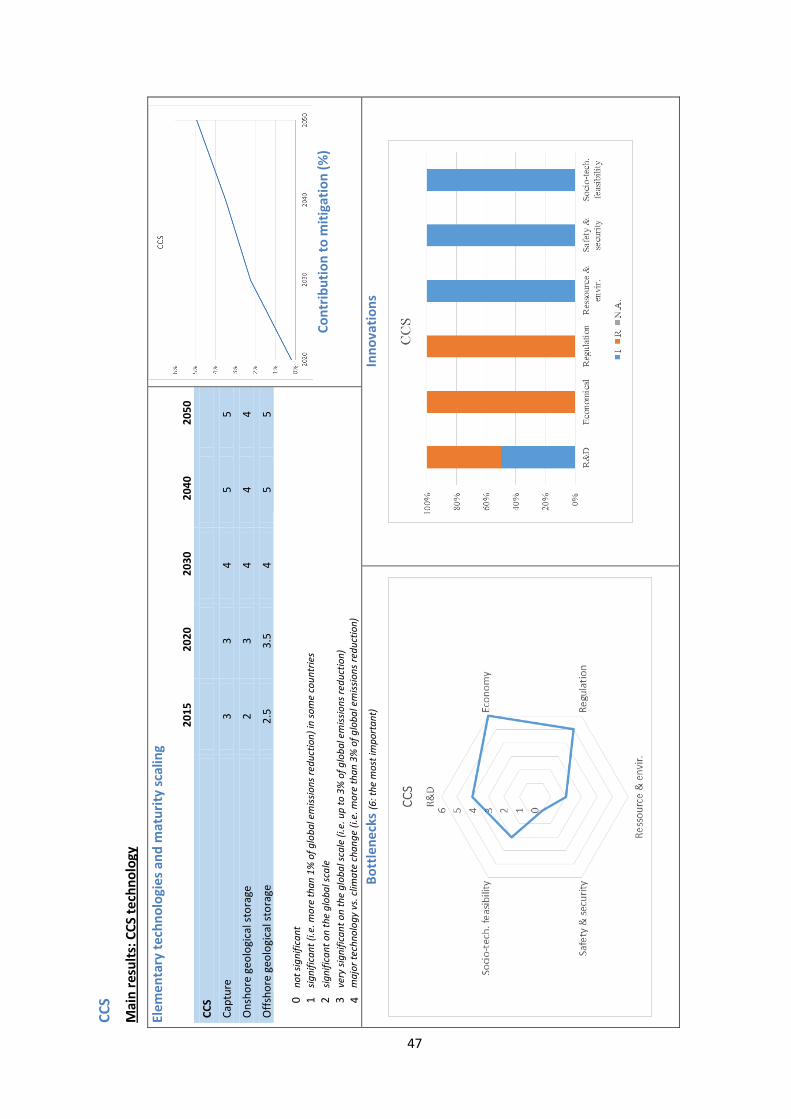
CCS
Mai
n re
sults
: CCS
tech
nolo
gy
Elem
enta
ry te
chno
logi
es a
nd m
atur
ity sc
alin
g
2
015
202
0 2
030
204
0 2
050
CCS
Capt
ure
3 3
4 5
5
Ons
hore
geo
logi
cal s
tora
ge
2 3
4 4
4
Offs
hore
geo
logi
cal s
tora
ge
2.5
3.5
4 5
5 0
not s
igni
fican
t 1
signi
fican
t (i.e
. mor
e th
an 1
% o
f glo
bal e
miss
ions
redu
ctio
n) in
som
e co
untr
ies
2 sig
nific
ant o
n th
e gl
obal
scal
e 3
very
sign
ifica
nt o
n th
e gl
obal
scal
e (i.
e. u
p to
3%
of g
loba
l em
issio
ns re
duct
ion)
4
maj
or te
chno
logy
vs.
clim
ate
chan
ge (i
.e. m
ore
than
3%
of g
loba
l em
issio
ns re
duct
ion)
Cont
ribut
ion
to m
itiga
tion
(%)
Bott
lene
cks (
6: th
e m
ost i
mpo
rtan
t)
Inno
vatio
ns
47
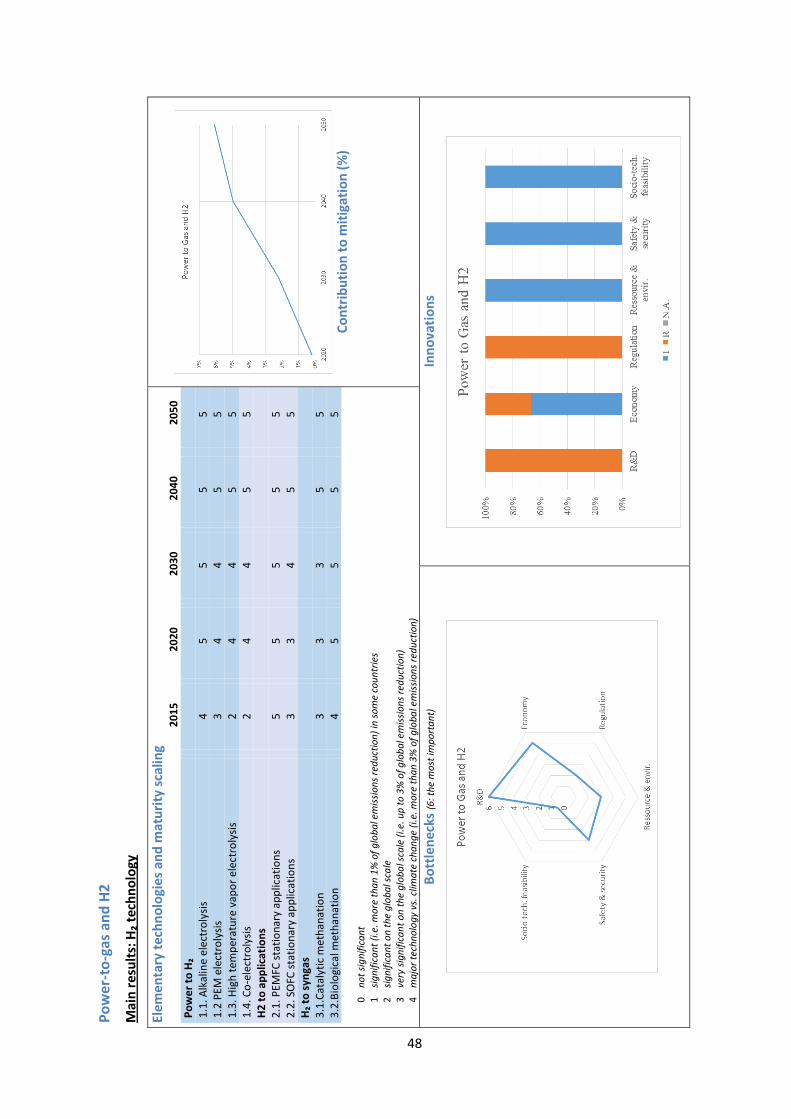
Pow
er-t
o-ga
s and
H2
Mai
n re
sults
: H₂ t
echn
olog
y
Elem
enta
ry te
chno
logi
es a
nd m
atur
ity sc
alin
g
2
015
202
0 2
030
204
0 2
050
Pow
er to
H₂
1.
1. A
lkal
ine
elec
trol
ysis
4 5
5 5
5 1.
2 PE
M e
lect
roly
sis
3 4
4 5
5 1.
3. H
igh
tem
pera
ture
vap
or e
lect
roly
sis
2 4
4 5
5 1.
4. C
o-el
ectr
olys
is
2 4
4 5
5 H2
to a
pplic
atio
ns
2.
1. P
EMFC
stat
iona
ry a
pplic
atio
ns
5 5
5 5
5 2.
2. S
OFC
stat
iona
ry a
pplic
atio
ns
3 3
4 5
5 H₂
to sy
ngas
3.1.
Cata
lytic
met
hana
tion
3 3
3 5
5 3.
2.Bi
olog
ical
met
hana
tion
4
5 5
5 5
0 no
t sig
nific
ant
1 sig
nific
ant (
i.e. m
ore
than
1%
of g
loba
l em
issio
ns re
duct
ion)
in so
me
coun
trie
s 2
signi
fican
t on
the
glob
al sc
ale
3 ve
ry si
gnifi
cant
on
the
glob
al sc
ale
(i.e.
up
to 3
% o
f glo
bal e
miss
ions
redu
ctio
n)
4 m
ajor
tech
nolo
gy v
s. c
limat
e ch
ange
(i.e
. mor
e th
an 3
% o
f glo
bal e
miss
ions
redu
ctio
n)
Cont
ribut
ion
to m
itiga
tion
(%)
Bott
lene
cks (
6: th
e m
ost i
mpo
rtan
t)
Inno
vatio
ns
48
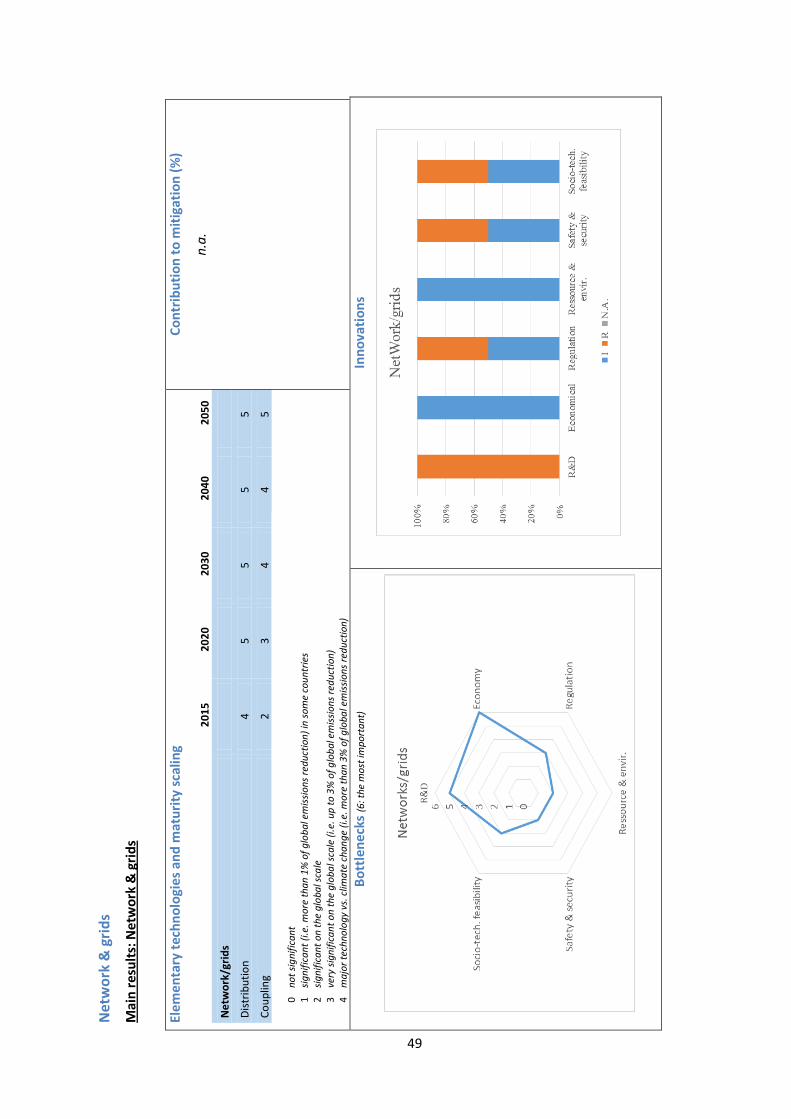
Net
wor
k &
grid
s
Mai
n re
sults
: Net
wor
k &
grid
s
Elem
enta
ry te
chno
logi
es a
nd m
atur
ity sc
alin
g
2
015
202
0 2
030
204
0 2
050
Net
wor
k/gr
ids
Dist
ribut
ion
4 5
5 5
5
Coup
ling
2 3
4 4
5 0
not s
igni
fican
t 1
signi
fican
t (i.e
. mor
e th
an 1
% o
f glo
bal e
miss
ions
redu
ctio
n) in
som
e co
untr
ies
2 sig
nific
ant o
n th
e gl
obal
scal
e 3
very
sign
ifica
nt o
n th
e gl
obal
scal
e (i.
e. u
p to
3%
of g
loba
l em
issio
ns re
duct
ion)
4
maj
or te
chno
logy
vs.
clim
ate
chan
ge (i
.e. m
ore
than
3%
of g
loba
l em
issio
ns re
duct
ion)
Cont
ribut
ion
to m
itiga
tion
(%)
n.a.
Bott
lene
cks (
6: th
e m
ost i
mpo
rtan
t)
Inno
vatio
ns
49
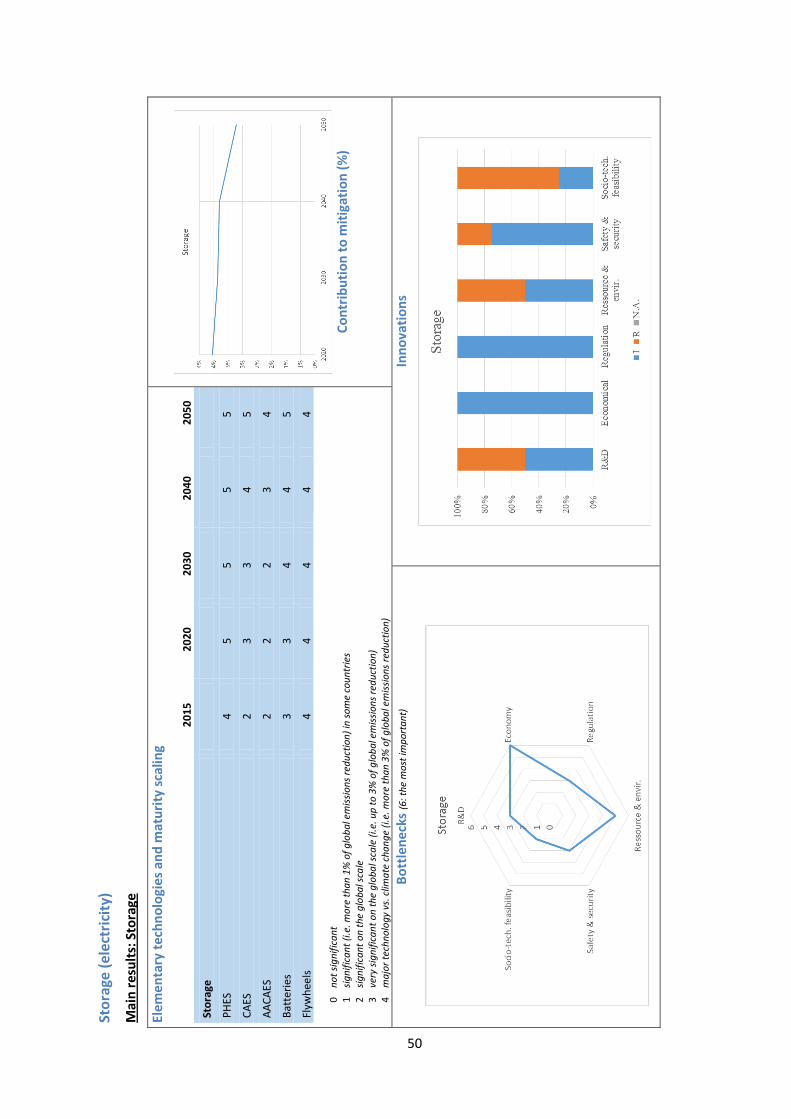
Stor
age
(ele
ctric
ity)
Mai
n re
sults
: Sto
rage
Elem
enta
ry te
chno
logi
es a
nd m
atur
ity sc
alin
g
2
015
202
0 2
030
204
0 2
050
Stor
age
PHES
4
5 5
5 5
CAES
2
3 3
4 5
AACA
ES
2 2
2 3
4
Batt
erie
s 3
3 4
4 5
Flyw
heel
s 4
4 4
4 4
0 no
t sig
nific
ant
1 sig
nific
ant (
i.e. m
ore
than
1%
of g
loba
l em
issio
ns re
duct
ion)
in so
me
coun
trie
s 2
signi
fican
t on
the
glob
al sc
ale
3 ve
ry si
gnifi
cant
on
the
glob
al sc
ale
(i.e.
up
to 3
% o
f glo
bal e
miss
ions
redu
ctio
n)
4 m
ajor
tech
nolo
gy v
s. c
limat
e ch
ange
(i.e
. mor
e th
an 3
% o
f glo
bal e
miss
ions
redu
ctio
n)
Cont
ribut
ion
to m
itiga
tion
(%)
Bott
lene
cks (
6: th
e m
ost i
mpo
rtan
t)
Inno
vatio
ns
50
51
8 Appendix 3: DW seminar (October 16th, 2015) ANCRE - National Alliance for the Coordination of Research on Energy
TOWARDS 2°C SCENARIOS: LOW-CARBON TECHNOLOGIES IN THE “DECARBONIZATION WEDGES” STUDY
Paris, Ministry of National Education, Higher Education and Research, October 16th, 2015
PROGRAMME
• Opening - Didier Houssin, IFPEN, President of Ancre
• COP21 challenges and the Deep Decarbonization Pathways Project (DDPP, SDSN-IDDRI) - Henri Waisman, IDDRI
• Lessons from the “Decarbonization Wedges” study (ANCRE)
- Evaluation of wedges based on the DDPP scenarios: methodology and results - Patrick Criqui, UPMF, Ancre GP9
- Major findings: potential of low-carbon technologies for the next 40 years - Jean-Guy Devezeaux, CEA, Ancre GP9
• Round Table: Technology foresight-1 “Energy demand and system integration technologies”
Introduction by Nathalie Alazard-Toux, IFPEN, Ancre GP9
Hervé Charrue, CSTB, Ancre GP7 (building) Daniel Clément, Ademe Michel Gimenez, Lafarge-Holcim, Ancre GP8 (Industry) Nicolas Martin, CEA, Ancre GP10 (networks) Catherine Ponsot-Jacquin, IFPEN, Ancre GP10 (networks) Richard Tilagone, IFPEN, Ancre GP6 (Transportation)
• Round Table: Technology foresight-2 “Energy supply technologies“
Introduction by Patrick Criqui, CNRS-UGA, GP9 Ancre
Sébastien Candel, Académie des sciences Franck Carré, CEA, Ancre GP3 (Nuclear) Jean-Luc Duplan, IFPEN, Ancre GP1(biomass) Hubert Fabriol, BRGM, Ancre GP2 (Wind, geothermal & marine energies) Philippe Malbranche, CEA, Ancre GP4 (solar)
• The European vision - Pierre Dechamps, European Commission, DG -Research
• Round Table: “Public policies, international cooperation and the deployment of low-carbon technologies”
Introduction by Jean-Guy Devezeaux de Lavergne, CEA, Ancre GP9
Jean-Pierre Birat, IF Steelman, GP8 Dominique Mazière, EERA Antonio Soria, JRC-IPTS Claire Tutenuit, EPE Karl-Friedrich Ziegahn, KIT Marco Moroni, MENESR
• Synthesis: Nathalie Alazard-Toux IFPEN, Ancre GP9
• Closing: Philippe Lavocat, Ministry in charge of Higher Education and Research
52
MAIN ISSUES AND DISCUSSIONS
Scope of the study, common features and national peculiarities in the decarbonization pathways
The DW study describes the main Decarbonization Wedges to 2050 for the 16 countries covered by the SDSN DDPP study, which today account for three-fourth of energy related CO2 emissions. National specificities are important to tackle the challenge of massive reduction, and this is precisely what the DDPP study tends to capture. The methodology used however allows a harmonized treatment of the data included in the country templates and it also allows organizing the results in consistent country groupings. One original feature of the DDPP+DW studies is that they allow to analyze the deployment of a clearly identified set of low carbon technologies in very different national conditions.
However some robust results come out of the study, such as the crucial role of the “i. energy efficiency, ii. decarbonization of energy carriers and iii. electrification of an increasing share of end-uses“ or the almost full decarbonization of electricity generation by 2050. The role of renewable (more than 50% in 2050) and nuclear (around 20%) are also common features of decarbonization for most regions.
Methodology
The DW methodology is original as it combines the analysis of energy scenarios – produced with or without modelling tools – and experts’ views in a consistent technology appraisal approach. This allows to raise many questions:
Paradigm shifts
The DW study discussions showed that climate policies will trigger a complete change of paradigm for the energy sectors: technologies, markets, consumer behavior will develop along new lines with more intelligent and interdependent systems, including at local level. Stakeholders, market designs and business models will evolve together with increasing environmental constraints and innovation opportunities. Risks and uncertainties will also increase in the first stage of the transition. This need to be taken into account in international and national policies, in order to provide the necessary conditions and signals for appropriate low carbon investment decisions.
This raises the question of how to combine “technology oriented approach” with a more qualitative consideration of the underlying evolutions in public policies, regulatory institutions, industry organization, market design and consumer behaviors. Identifying the technological potentials is only a first stage in the framing of the possible markets trends and large uncertainties bars have to be introduced in order to account for a high degree of uncertainty, both in the long and in the short term.
Is there a national perception bias on the future of low carbon technologies?
In the comparison of the decarbonization pathways, which are produced by national teams in DDPP, with the ANCRE assessment, one may suspect the existence of national bias due to the very different underlying perceptions of constraints and opportunities in the decarbonization process. Technology supply, costs and performances should converge in the long run, but to what degree? This is probably a key question for future energy research and innovation policies – so as for international cooperation policies – and the ANCRE assessment tried to carefully explore this dimension of the problem in the work of the different Working Groups.
How to account for radical innovations or breakthroughs?
The need for breakthroughs is clearly identified in several domains. In fact, most of today’s energy technologies have been born in the 70s or 80s. It can be expected that the convergence of the Information and Communication Technologies and of the new energy technologies may result in
53
brand new patterns for the organization of energy systems, at regional, national and local level. The emergence of new socio-technical systems clearly comes out as a major methodological challenge for engineers, economists and social scientists. The ANCRE’s study, which combines two approaches (DDPP and DW) still doesn’t fully addresses this difficult question.
New methods and new research areas
The question of how to best stimulate technology deployment is probably located at the frontiers of the knowledge in the economics of innovation. The understanding of the respective role of technology-push and demand-pull strategies, of the potential impacts of economic instruments (environmental taxation, emission quotas, feed-in tariffs…) should be enhanced and better shared between engineers, economists and social scientists. Work performed through an intense dialog in the DW study has indeed resulted in valuable exchanges and insights on non-technological matters. This can be viewed as promising pathways in order to reduce the knowledge gaps between different research communities and should be encouraged in the future.
One of the goals of the DW study has indeed been to associate different expertise to overcome the complexity of assessing the technology deployment potentials. One of these field lies in the different communities of social sciences and the interactions between the ANCRE and the ATHENA (French Alliance for research in social sciences) should be actively promoted. In fact, mainly economists have worked on the DW project (in close link with technologists).
Technical points and possible improvements
Many questions, facts and proposals have been discussed in order to improve the quality and robustness of the study. Among them, we can quote: • Learning effects and cost dynamics • Environemental evaluation at system level • Dependence on rare and structural materials • Energy and Carbon price • Geopolitics (including fossil fuels producers) • Market design and regulation • Geographical aspects (eg centralized/decentralized energy systems) • Financing of R&D • International collaborative research • Industry involvement, coopetition and technology transfers • System innovations (energy storage, networks optimization, smart grids and ICTs)
Agreement on the main findings
By the end of the meeting, all participants agreed on the main finding of the study, among them:
• The importance of technological change and innovation for meeting the 2°C target
• The relevance of active R&D policies for the early step of new technologies developments, to be completed by the introduction of economic instrument for high TRL options (carbon price, economic tools and incentives, access to capital, rules for technological transfers…). Regulation also appeared as of central importance.
• The need to enlarge the study to the socio-technical feasibility dimensions
54
The Decarbonization Wedges approach after the COP21
The aim of DW is to propose a global framework in term of potential of new technologies in order to be improved, challenged, and enlarged to major factors such as the eventual deployment of technologies depending mainly on social choices (once the technologies are available in fair conditions). This work should be one of the inputs in the process of INDCs revision over time. It could also help to identify the main domains in which coordination and cooperation is needed at international level, in order to foster the as-quick-as-possible development of decarbonization technologies

www.allianceenergie.fr