decarbonization pathways for paraguay's energy sector
TRANSCRIPT
2 Decarbonization Pathways for Paraguay’s Energy Sector
Please cite as
Columbia Center on Sustainable Investment (CCSI), Quadracci Sustainable Engineering Lab at Co-lumbia University, and Centro de Recursos Naturales, Energía y Desarrollo (CRECE). Decarbonization Pathways for Paraguay’s Energy Sector. New York: CCSI, October 2021, http://ccsi.colum-bia.edu/content/paraguay-energy. Ministry of Finance Óscar Llamosas Díaz, Ministro de Hacienda Iván Haas, Viceministro de Economía
Institutional Authors and Project Team
Project Leads Jeffrey D. Sachs James Spalding Columbia Center on Sustainable Investment (CCSI)
Perrine Toledano Martin Dietrich Brauch Bryan Michael Sherrill
Quadracci Sustainable Engineering Lab at Columbia University
Vijay Modi Yinbo Hu Yuezi Wu
Centro de Recursos Naturales, Energía y Desarrollo (CRECE)
Daniel Ríos Festner Victorio Oxilia Cecilia Llamosas Martín Oviedo Pascottini Diana Valdéz Barboza Estela Riveros Matías Sacco
This report was commissioned by the Ministry of Finance of the Republic of Paraguay and funded by the Development Bank of Latin America (Banco de Desarrollo de América Latina [CAF]).
3 Decarbonization Pathways for Paraguay’s Energy Sector
Acknowledgements
The authors would like to acknowledge the tremendous contributions of other members of the project team: Prof. Jeffrey D. Sachs and James Spalding, for their intellectual leadership, and Juan Pablo Nogues, Advisor to the Minister of Finance, for his coordination role as liaison with the Ministry of Fi-nance of Paraguay. All three have provided invaluable inputs and feedback throughout the project. The authors would also like to thank the following institutions and organizations that provided us with invaluable information during our consultations: Ministry of Finance (Ministerio de Hacienda), Na-tional Electricity Administration (Administración Nacional de Electricidad) (ANDE), Vice Ministry of Mines and Energy (Vice Ministerio de Minas y Energia) (VMME), and National Forestry Institute (Insti-tuto Forestal Nacional) (INFONA). The authors are also thankful for the feedback received from individual experts interviewed in their personal capacities during the consultation period: Gabriela Mesquita, Gerardo Blanco, Hector Richer, and Victor Romero. Finally, the authors are grateful to the Development Bank of Latin America (Banco de Desarrollo de América Latina) (CAF), the sponsor of this project and report.
4 Decarbonization Pathways for Paraguay’s Energy Sector
About the Institutional Authors
The Columbia Center on Sustainable Investment (CCSI) is a joint center of Columbia Law School and the Earth Institute at Columbia University and the only university-based applied research center and forum dedicated to the study, practice, and discussion of sustainable international investment. CCSI integrates legal, economic, and policy expertise, and approaches sustainable investment holisti-cally, bridging investment law, natural resource management, human rights, economics, political economy, and environmental management. It conducts rigorous research, provides policy analysis and advisory services, offers educational programs, develops tools and resources, and fosters multi-stakeholder dialogue and knowledge sharing among policymakers, development advocates, scholars, business leaders, and community stakeholders. It works to strengthen the sustainable development potential of international investment, and to ensure that international investment is mutually benefi-cial for investors and the citizens of recipient countries. Learn more at http://ccsi.columbia.edu. The Quadracci Sustainable Engineering Lab (QSEL), jointly under the aegis of the School of Engi-neering & Applied Science and the Earth Institute (now Climate School) at Columbia University, uses engineering and social science approaches to help address energy and infrastructure issues in a range of country settings. With a problem-driven mindset, its team of engineers work with analytics, instru-mentation, measurements, satellite imagery, and public data to assist in the design, planning, and operation of energy and infrastructure systems. QSEL's main areas of research fall broadly under two themes: firstly, energy access, energy for growth and productive uses, resource/infrastructure plan-ning for access and renewable integration, demand estimation, and the role of novel payment systems in breaking barriers to upfront costs; and secondly, decarbonization of energy systems, electrification of heat/transport, digitization, and battery and thermal storage. Learn more at https://qsel.columbia.edu. The Natural Resources and Energy Research Center (Centro de Recursos Naturales, Energía y Desarrollo – CRECE) is a multidisciplinary think-tank based in Asunción, Paraguay, dedicated to de-signing and developing solutions to public problems in the field of energy, sustainable mobility, the governance of natural resources, and development. Our team seeks to provide policy-relevant evi-dence and tools to decision-makers and actors in the public and private sectors, also involving civil society in the discussion on issues of high public interest. CRECE'S team is made up of professionals with solid technical training and experience in providing policy and practice-oriented advice and in managing policy-relevant research and development projects. The team has ample expertise in elec-trical, industrial, and electromechanical engineering, economics, law, politics, and public policy and works in partnership with the Energy Systems Research Group (GISE) at the National University of Asunción. Find out more about us at www.creceparaguay.org.
5 Decarbonization Pathways for Paraguay’s Energy Sector
Table of Contents
List of Figures ............................................................................................................................8
List of Tables ............................................................................................................................9
List of Boxes .............................................................................................................................9
List of Acronyms and Abbreviations ............................................................................................ 10
1. Pathways to Decarbonize the Energy Demand Sector: An Overview ....................................... 11 1.1 Goals and Scope ............................................................................................................................... 11 1.2 Trends in Energy Development ....................................................................................................... 12
1.2.1 International Trends ........................................................................................................ 12 1.2.2 Domestic Trends in Paraguay .......................................................................................... 12 1.2.3 Greenhouse Gas Emissions in Paraguay ......................................................................... 14
1.3 Scenarios for Large-Scale Change ................................................................................................... 17 1.3.1 Greenhouse Gas Emissions .............................................................................................. 18 1.3.2 Energy Demand ................................................................................................................ 20 1.3.3 Demand by Fuel Type ...................................................................................................... 22 1.3.4 Electricity Demand ........................................................................................................... 24
1.4 Sectoral Challenges to Decarbonizing the Energy Demand Profile ............................................... 26 1.4.1 Electricity Sector .............................................................................................................. 26 1.4.2 Peak-Demand Supply Crunch Solutions ......................................................................... 27 1.4.3 Building and Energy Efficiency ........................................................................................ 27 1.4.4 Land Use and Biomass Sector ......................................................................................... 28 1.4.5 Transport Sector .............................................................................................................. 28 1.4.6 Financing the Decarbonization ....................................................................................... 29
1.5 Recommendations for All Sectors and Levels of Government ....................................................... 29
2. The Electricity Sector in Paraguay ...................................................................................... 41 2.1 Current Situation .............................................................................................................................. 41
2.1.1 Capacity and Power Sources ........................................................................................... 41 2.1.2 Domestic Supply .............................................................................................................. 42 2.1.3 Demand ............................................................................................................................ 42 2.1.4 Cost and Price of Electricity ............................................................................................. 44
2.2 Problems Faced by the Electricity Sector ........................................................................................ 47 2.2.1 Technical Problems ......................................................................................................... 47 2.2.2 Non-Technical / Commercial Losses ............................................................................... 50 2.2.3 Institutional constraints .................................................................................................. 54
2.3 Planned Investments and Energy Strategy ..................................................................................... 56 2.3.1 ANDE’s 2021–2040 Master Generation Plan, 2021–2030 Master Transmission and
Distribution Plans and 2021- 2025 Master Plan for Information and Telecommunications ....................................................................................................... 56
2.3.2 Electricity Demand Projections ....................................................................................... 61 2.4 Solutions for the Electricity Sector .................................................................................................. 66
2.4.1 Institutional Solutions ..................................................................................................... 66 2.4.2 Technical Approach ......................................................................................................... 70
2.5 Findings and Recommendations for the Electric Sector - Summary ............................................ 75
6 Decarbonization Pathways for Paraguay’s Energy Sector
3. How to Cover Peak Demand Cost-Effectively........................................................................ 77 3.1 The Problem of Peak Demand in Paraguay ..................................................................................... 77 3.2 Required Domestic Investment to Cover Peak Demand Cost-Effectively ...................................... 77
3.2.1 Assumptions ..................................................................................................................... 78 3.2.2 Inputs ................................................................................................................................ 79 3.2.3 Results .............................................................................................................................. 79
3.3 Regional Connection Challenges and Findings ............................................................................... 84 3.3.1 Assumptions ..................................................................................................................... 85 3.3.2 Inputs ................................................................................................................................ 87 3.3.3 Results .............................................................................................................................. 87
3.4 Case Study for the Cono Sur Region: SIEPAC Regional Inter-Connection Framework .................. 91 3.4.1 Background ...................................................................................................................... 91 3.4.2 Framework ....................................................................................................................... 93 3.4.3 Country Examples ............................................................................................................ 94 3.4.4 Lessons Learned ............................................................................................................... 94 3.4.5 Steps Forward .................................................................................................................. 95
3.5 Recommendations for Cost-Effectively Covering Energy Demand ................................................ 95
4. Energy Efficiency and Building Sector ................................................................................. 97 4.1 Current Situation .............................................................................................................................. 97
4.1.1 Energy Efficiency .............................................................................................................. 97 4.1.2 Building Sector ................................................................................................................. 98
4.2 Institutional Solutions for Critical Efficiency Improvements ....................................................... 100 4.3 Solutions for the Building Sector ................................................................................................... 103
4.3.1 National Building Efficiency Code ................................................................................. 103 4.3.2 New Building Strategy ................................................................................................... 104 4.3.3 Existing Building Strategy .............................................................................................. 104 4.3.4 Energy-Efficient Appliances ........................................................................................... 105
4.4 Recommendations ......................................................................................................................... 107
5. The Biomass Sector in Paraguay ....................................................................................... 108 5.1 Current Situation ............................................................................................................................ 108
5.1.1 Industrial Biomass ......................................................................................................... 112 5.1.2 Residential Biomass ....................................................................................................... 114
5.2 Problems Surrounding Biomass .................................................................................................... 115 5.2.1 Low Prices for Biomass .................................................................................................. 115 5.2.2 Deforestation Problems ................................................................................................. 115 5.2.3 Poor Enforcement .......................................................................................................... 119
5.3 Solutions for the Biomass Sector .................................................................................................. 121 5.3.1 Current initiatives to slow down deforestation and accelerate reforestation ............ 121 5.3.2 Improvements in Industrial Consumption .................................................................... 123 5.3.3 Improvements in Clean Cooking ................................................................................... 124
5.4 Recommendations for the Biomass Sector ................................................................................... 125
7 Decarbonization Pathways for Paraguay’s Energy Sector
6. The Transportation Sector in Paraguay ............................................................................. 127 6.1 Imported Fossil Fuel Trends .......................................................................................................... 127 6.2 Electric Transportation .................................................................................................................. 130
6.2.1 Private Cars .................................................................................................................... 130 6.2.2 Electric Trains ................................................................................................................. 132 6.2.3 Urban Public Transportation ......................................................................................... 133
6.3 Pathways for Decarbonized Transportation ................................................................................. 134 6.3.1 Reducing Reliance on Private Cars and Augmenting Reliance
on Public Transportation ............................................................................................... 134 6.3.2 Electric vehicles .............................................................................................................. 135 6.3.3 Green Hydrogen Production .......................................................................................... 145 6.3.4 Biofuel Production ......................................................................................................... 148
6.4 Summary of Findings and Recommendations .............................................................................. 153
7. How to Finance Decarbonization ...................................................................................... 155 7.1 Public Financial Management: Legal Framework ......................................................................... 155 7.2 Problems in Revenue Administration ............................................................................................ 157
7.2.1 Revenue Collection ........................................................................................................ 157 7.2.2 Recurrent Expenditures ................................................................................................. 159 7.2.3 Public Participation ....................................................................................................... 161
7.3 Financing the Decarbonization: Solutions .................................................................................... 161 7.3.1 Capitalizing on Electricity Sector Savings ..................................................................... 161 7.3.2 Incentivizing Private Sector Participation in the Electricity Sector ............................. 163 7.3.3 Improving Regulatory Framework for Sustainable Finance ........................................ 166 7.3.4 Deploying Paraguay-tailored Carbon Pricing ............................................................... 169 7.3.5 Assessing the Fiscal Space for Bond Issuance in Post-COVID-19 ................................. 171 7.3.6 Preparing the Economy to Seize the Windfall of the Green Economy
Growth Potential ............................................................................................................ 173 7.4 Summary of Findings and Recommendations .............................................................................. 174
8 Decarbonization Pathways for Paraguay’s Energy Sector
List of Figures
Figure 1: Final Energy Consumption by Source (%), 1990–2019........................................................................................................................ 13 Figure 2: Final Energy Consumption by Source (thousand metric tons of oil equivalent [kTOE]), 1990–2019 ................................................ 14 Figure 3: Global Warming Potential for All Sectors at Point of Emissions by Sector in %, 2015 ....................................................................... 14 Figure 4: Total GHG Emissions per Capita excluding Land-Use Change and Forestry (tCO2e) (Only countries with GHG emissions per capita greater than 4 tCO2e) ............................................................................................... 15 Figure 5: Global Warming Potential for Energy Use Sectors at Point of Emissions by Sector in %, 2018 ......................................................... 16 Figure 6: 20-Year Global Warming Potential (Stated Policies), Fixed Economic Growth .................................................................................. 17 Figure 7: 20-Year Global Warming Potential (Scenarios 1, 2, and 3), Energy Use Sectors ................................................................................. 19 Figure 8: Energy Demand by Sector (in kTOE) ................................................................................................................................................... 22 Figure 9: Share Participation of Energy Demand by sector by Scenario in 2050 (Scenario 1 interior, Scenario 2 middle, Scenario 3 exterior) .............................................................................................................. 22 Figure 10: Energy Source Type as a Percentage of Energy Demand in 2050 by Scenario ................................................................................. 23 Figure 11: Energy Demand by Fuel Type (in kTOE) ............................................................................................................................................ 24 Figure 12: Electricity Demand by Sector (in GWh).............................................................................................................................................. 25 Figure 13: Share Participation of Electricity Demand by sector by Scenario in 2050 (Scenario 1 interior, Scenario 3 Exterior) ..................... 25 Figure 14: Electricity Consumption in Paraguay Compared with the Region (2017) ........................................................................................ 43 Figure 15: Peak Load and Load Factor ............................................................................................................................................................... 44 Figure 16: Overall Cost of Electricity: PYG 362.2/kWh or USD 0.056/kWh in 2019 ............................................................................................. 45 Figure 17: Average Annual Electricity Sales and Distribution Losses by Percent (2009-2014) .......................................................................... 48 Figure 18: Average Number of Power Cuts Annually and Estimated Duration in Asunción .............................................................................. 52 Figure 19: Cost of planned generation over time (left axis: MW, Right Axis: USD Million) ................................................................................. 58 Figure 20: ANDE’s Peak Demand Growth Projections ........................................................................................................................................ 62 Figure 21: Comparison of Energy Not Supplied (ENS) Percentage by Scenario ................................................................................................ 65 Figure 22: Power Supply Failure Frequency for Peak demand .......................................................................................................................... 65 Figure 23: Potential Operation and Maintenance Savings by Utility Sector ..................................................................................................... 72 Figure 24: Power System Load Zones of Paraguay ............................................................................................................................................ 78 Figure 25: Energy Mix at Peak Load (Existing Capacity) ..................................................................................................................................... 80 Figure 26: Energy Mix at Peak Load (Base Growth Scenario) ............................................................................................................................. 81 Figure 27: Transmission Grid Capacity at 1.5x 2019 Load .................................................................................................................................. 82 Figure 28: Energy Mix at Peak Load (with Ice Storage in Pink) .......................................................................................................................... 83 Figure 29: Regional Energy Transmission in the SIESUR Region (2019) ............................................................................................................ 85 Figure 30: Nodal Map Structure for SimSEE model ............................................................................................................................................ 86 Figure 31: Load Band Overlap on Decreasing Weekly Load Curve .................................................................................................................... 86 Figure 32: Location of SIEPAC ............................................................................................................................................................................. 92 Figure 33: Annual Energy Transactions on SIEPAC ............................................................................................................................................ 92 Figure 34: Organizational Structure of MER (in Yellow) ..................................................................................................................................... 93 Figure 35: Sources of Energy Consumption in Paraguay and Neighboring Countries in 2018 ....................................................................... 108 Figure 36: Energy Consumption of Electricity and Firewood in Paraguay in TJ .............................................................................................. 109 Figure 37: Biomass Consumption by Sector (2019) and Source (2019) ........................................................................................................... 110 Figure 38: Consumption of Wood Fuel by Sector (2019) .................................................................................................................................. 111 Figure 39: Energy consumption by the industrial sector (2000-2018) ............................................................................................................. 112 Figure 40: Percent Total Energy Demand of Industrial Sector by Subsector .................................................................................................. 113 Figure 41: Population Breakdown by Percentage of Fuel Consumption for Cooking, 2017 ........................................................................... 114 Figure 42: Deforestation Rates over Time ........................................................................................................................................................ 117 Figure 43: Forest Coverage vs. Population Growth and Associated Increase in Demand for Wood ............................................................... 118 Figure 44: Import of Energy by Source (%), 1990 - 2019 .................................................................................................................................. 127 Figure 45: Share of Total Fossil Fuel Consumption by Type of Vehicle (2011) ................................................................................................ 128 Figure 46: Vehicle Ownership by Type and Department (2020) ....................................................................................................................... 130 Figure 47: Cost Comparison of EVs and ICE vehicles in Paraguay ................................................................................................................... 138 Figure 48: Breakdown of Costs Associated with Electric and ICE Vehicles (in British Pounds), 2020 ............................................................. 140 Figure 49: Annual Costs of an Electric Bus Versus an ICE bus in Asunción in USD .......................................................................................... 142 Figure 50: Investment and Operation Cost Comparison (net present values), Asunción (6692 buses) .......................................................... 142 Figure 51: Integration Schematic for Hydrogen Integration ............................................................................................................................ 146 Figure 52: Paraguay’s Largest Crops: Production and Area Harvested, 2019/2020 ........................................................................................ 148 Figure 53: Evolution of Bioethanol Production in Paraguay, 2005–2016 ........................................................................................................ 150 Figure 54: Tax Rates in Paraguay and Regional Countries (in %) .................................................................................................................... 158 Figure 55: Tax to GDP Ratio in Paraguay and Neighboring Countries (in % of GDP) ....................................................................................... 158 Figure 56: Percentile Rank for Select South American Countries based on World Bank Governance Indicators, 2019 ........................................... 160
9 Decarbonization Pathways for Paraguay’s Energy Sector
List of Tables Table 1: Percent Change in GHG Emission Output by Scenario ........................................................................................................... 18 Table 2: Energy Savings by Sector as Percent of Sector Energy Demand ............................................................................................ 21 Table 3: Summary of Report Recommendations by Sector .................................................................................................................. 35 Table 4: Paraguay’s Power Sources, 2019 ............................................................................................................................................. 41 Table 5: Electricity Supply ..................................................................................................................................................................... 42 Table 6: Electricity Demand ................................................................................................................................................................... 42 Table 7: Overall Costs of Electricity Sold in 2019 .................................................................................................................................. 45 Table 8: Tariff Structure ......................................................................................................................................................................... 46 Table 9: Social Tariff Structure and Beneficiaries ................................................................................................................................. 46 Table 10: Electricity Transmission Infrastructure in Paraguay, 2020–2030.......................................................................................... 47 Table 11: Transmission Losses from 2021–2030 ................................................................................................................................... 49 Table 12: Average Losses of the System in Percent (2014-2018) .......................................................................................................... 50 Table 13: Types of Detected Non-technical Losses, 2019 ..................................................................................................................... 51 Table 14: Impact of Electricity Constraints on Businesses ................................................................................................................... 53 Table 15: Electricity Related Questions from the Business Survey 2017 .............................................................................................. 53 Table 16: Planned Electricity Generation Projects by ANDE 2021-2040 by Region of Operation ........................................................ 57 Table 17: Necessary Electricity Generation Projects to develop by IPPSE ........................................................................................... 63 Table 18: Summary of SimSEE Model Scenarios ................................................................................................................................... 64 Table 19: Pliego 21 Tariff Structure for Peak and Off-Peak Energy and Reserve Energy ..................................................................... 74 Table 20: Power System Load Zones of Paraguay ................................................................................................................................ 79 Table 21: Summary of Data for Open Market Scenarios ....................................................................................................................... 88 Table 22: Probability of not-supplied energy for Peak Demand in 2050 (closed vs open market) ...................................................... 89 Table 23: Investments by Scenario ........................................................................................................................................................ 90 Table 24: Asuncion City Ordinance Tax Break for Constructions ......................................................................................................... 99 Table 25: Building Sector Actions in PNEE .......................................................................................................................................... 100 Table 26: Paraguay RISE Score: Global, 2019 ...................................................................................................................................... 101 Table 27: Paraguay RISE Score for Renewable Energy and Energy Efficiency, 2019 .......................................................................... 102 Table 28: Average Cost of Fuel Wood .................................................................................................................................................. 115 Table 29: Yearly Rate of Gain or Loss of Forest Area During the Given Period ................................................................................... 116 Table 30: More Competitive Alternatives than CCS at Certain Electricity Prices ............................................................................... 124 Table 31: Traffic Volume by Mode (2020) ............................................................................................................................................ 133 Table 32: Vehicle Fleet Targets for Scenario 3 Targets by Fuel Type .................................................................................................. 135 Table 33: GHG Emissions in the Transport Sector for Scenario 3 by Subsector (In Thousand metric tons of CO2e) .................................. 136 Table 34: Original ICE vs. EV Bus Analysis Assumptions ..................................................................................................................... 141 Table 35: Main features of the Fiscal Responsibility Law .................................................................................................................... 157 Table 36: Role of Financial Regulation in Decarbonization ................................................................................................................ 167
List of Boxes Box 1: Recent Statistics on Paraguay’s Electricity Sector ..................................................................................................................... 26 Box 2: Most Important Electric Grid Development Projects During the 2013–2018 Period ................................................................. 48 Box 3: Curbing Distribution Losses in Brazil .......................................................................................................................................... 67 Box 4: Efficiency of the Management Contract in Haiti ......................................................................................................................... 68 Box 5: Education Outreach in Peru ........................................................................................................................................................ 69 Box 6: Direct Load Control Program in Vietnam and in the United States ........................................................................................... 73 Box 7: Dynamic Pricing in the United States ......................................................................................................................................... 75 Box 8: Bureau of Energy Efficiency of India ......................................................................................................................................... 101 Box 9: Thermal Water Facility as Value Added Service in Colombia ................................................................................................... 102 Box 10: Five Science-Based Principles for a Passive Building ............................................................................................................. 104 Box 11: Forestry Laws/Regulations and Responsible Institutions ...................................................................................................... 119 Box 12: Central Bank’s Guidelines for an E&S System at FI ................................................................................................................ 168 Box 13: Costa Rica: Recycling Fuel Tax into Fiscal Allocation to Protect Forests ............................................................................... 170
10 Decarbonization Pathways for Paraguay’s Energy Sector
List of Acronyms and Abbreviations AC Air conditioning ACEPAR Paraguay Steel
(Aceros del Paraguay) ANDE National Electricity Administration
(Administración Nacional de Electricidad) BRT Bus Rapid Transit CAF Development Bank of Latin America
(Banco de Desarrollo de América Latina) CRECE Center of Natural Resources, Energy, and Development
(Centro de Recursos Naturales, Energia, y Desarrollo) DR Demand Response EIB European Investment Bank EV Electric Vehicle FAO Food and Agriculture Organization of the United Nations FEPASA Paraguay Central Railway Co. Limited
(Ferrocarriles del Paraguay S.A.) FONACIDE National Fund for Public Investment and Development
(Fondo Nacional de Inversión Pública y Desarrollo) GDP Gross Domestic Product GHG Greenhouse Gas GWh Gigawatt Hour ICE Internal combustion engine ICT Information and Communication Technologies IDB Inter-American Development Bank IEA International Energy Agency IFC International Finance Corporation INFONA National Forestry Institute (Instituto Forestal Nacional) IPP Independent Power Producer IPPSE Institute of Paraguayan Professionals of the Electricity Sector
(Instituto Paraguayo de Profesionales del Sector Eléctrico) IRENA International Renewable Energy Agency kV Kilovolt kWh Kilowatt Hour LEAP Low Emissions Analysis Platform MAG Ministry of Agriculture and Livestock
(Ministerio de Agricultura y Ganadería) MW Megawatt MWh Megawatt Hour NDC Nationally Determined Contribution NPV Net Present Value PY-RAM Paraguay Energy Resources Adequacy Model SIESUR System of Energy Integration of the South SME Small and Medium-Sized Enterprises TOE Metric tons of oil equivalent TWh Terawatt Hour VMME Vice Ministry of Mines and Energy
(Vice Ministerio de Minas y Energia)
11 Decarbonization Pathways for Paraguay’s Energy Sector
1. Pathways to Decarbonize the Energy Demand Sector: An Overview
Goals and Scope
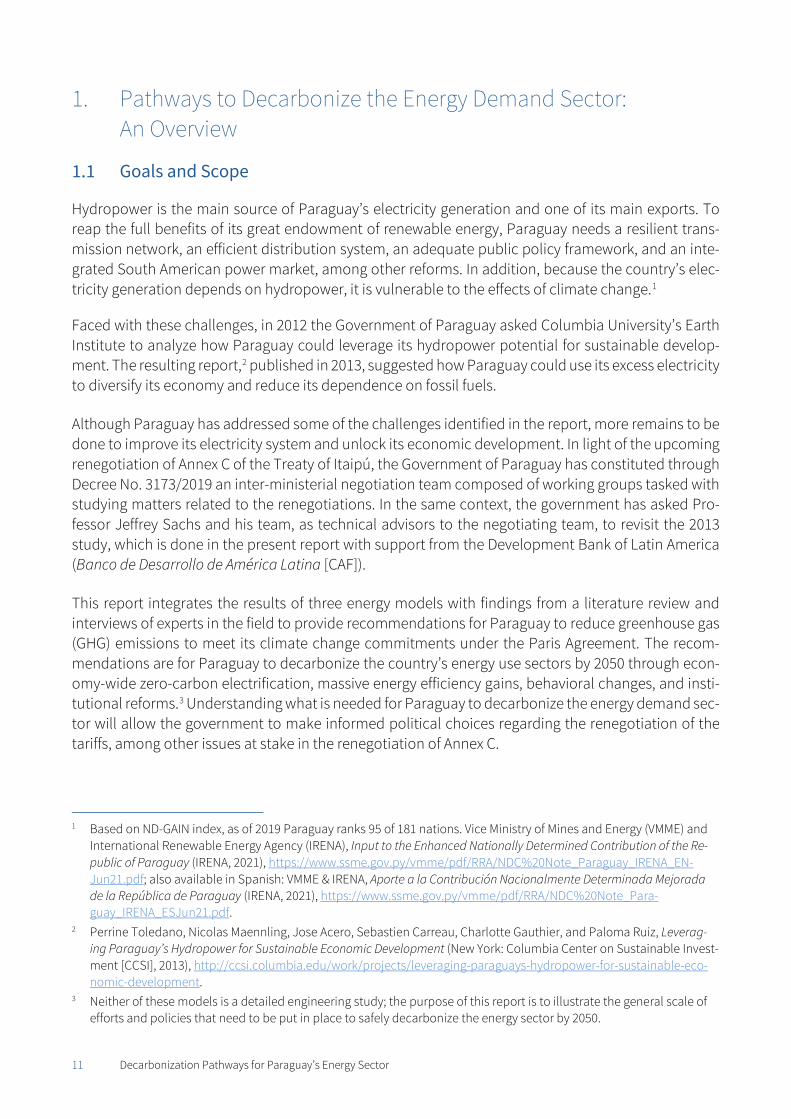
Hydropower is the main source of Paraguay’s electricity generation and one of its main exports. To reap the full benefits of its great endowment of renewable energy, Paraguay needs a resilient trans-mission network, an efficient distribution system, an adequate public policy framework, and an inte-grated South American power market, among other reforms. In addition, because the country’s elec-tricity generation depends on hydropower, it is vulnerable to the effects of climate change.1
Faced with these challenges, in 2012 the Government of Paraguay asked Columbia University’s Earth Institute to analyze how Paraguay could leverage its hydropower potential for sustainable develop-ment. The resulting report,2 published in 2013, suggested how Paraguay could use its excess electricity to diversify its economy and reduce its dependence on fossil fuels.
Although Paraguay has addressed some of the challenges identified in the report, more remains to be done to improve its electricity system and unlock its economic development. In light of the upcoming renegotiation of Annex C of the Treaty of Itaipú, the Government of Paraguay has constituted through Decree No. 3173/2019 an inter-ministerial negotiation team composed of working groups tasked with studying matters related to the renegotiations. In the same context, the government has asked Pro-fessor Jeffrey Sachs and his team, as technical advisors to the negotiating team, to revisit the 2013 study, which is done in the present report with support from the Development Bank of Latin America (Banco de Desarrollo de América Latina [CAF]).
This report integrates the results of three energy models with findings from a literature review and interviews of experts in the field to provide recommendations for Paraguay to reduce greenhouse gas (GHG) emissions to meet its climate change commitments under the Paris Agreement. The recom-mendations are for Paraguay to decarbonize the country’s energy use sectors by 2050 through econ-omy-wide zero-carbon electrification, massive energy efficiency gains, behavioral changes, and insti-tutional reforms.3 Understanding what is needed for Paraguay to decarbonize the energy demand sec-tor will allow the government to make informed political choices regarding the renegotiation of the tariffs, among other issues at stake in the renegotiation of Annex C.
1 Based on ND-GAIN index, as of 2019 Paraguay ranks 95 of 181 nations. Vice Ministry of Mines and Energy (VMME) and
International Renewable Energy Agency (IRENA), Input to the Enhanced Nationally Determined Contribution of the Re-public of Paraguay (IRENA, 2021), https://www.ssme.gov.py/vmme/pdf/RRA/NDC%20Note_Paraguay_IRENA_EN-Jun21.pdf; also available in Spanish: VMME & IRENA, Aporte a la Contribución Nacionalmente Determinada Mejorada de la República de Paraguay (IRENA, 2021), https://www.ssme.gov.py/vmme/pdf/RRA/NDC%20Note_Para-guay_IRENA_ESJun21.pdf.
2 Perrine Toledano, Nicolas Maennling, Jose Acero, Sebastien Carreau, Charlotte Gauthier, and Paloma Ruiz, Leverag-ing Paraguay’s Hydropower for Sustainable Economic Development (New York: Columbia Center on Sustainable Invest-ment [CCSI], 2013), http://ccsi.columbia.edu/work/projects/leveraging-paraguays-hydropower-for-sustainable-eco-nomic-development.
3 Neither of these models is a detailed engineering study; the purpose of this report is to illustrate the general scale of efforts and policies that need to be put in place to safely decarbonize the energy sector by 2050.
12 Decarbonization Pathways for Paraguay’s Energy Sector
Trends in Energy Development
1.2.1 International Trends
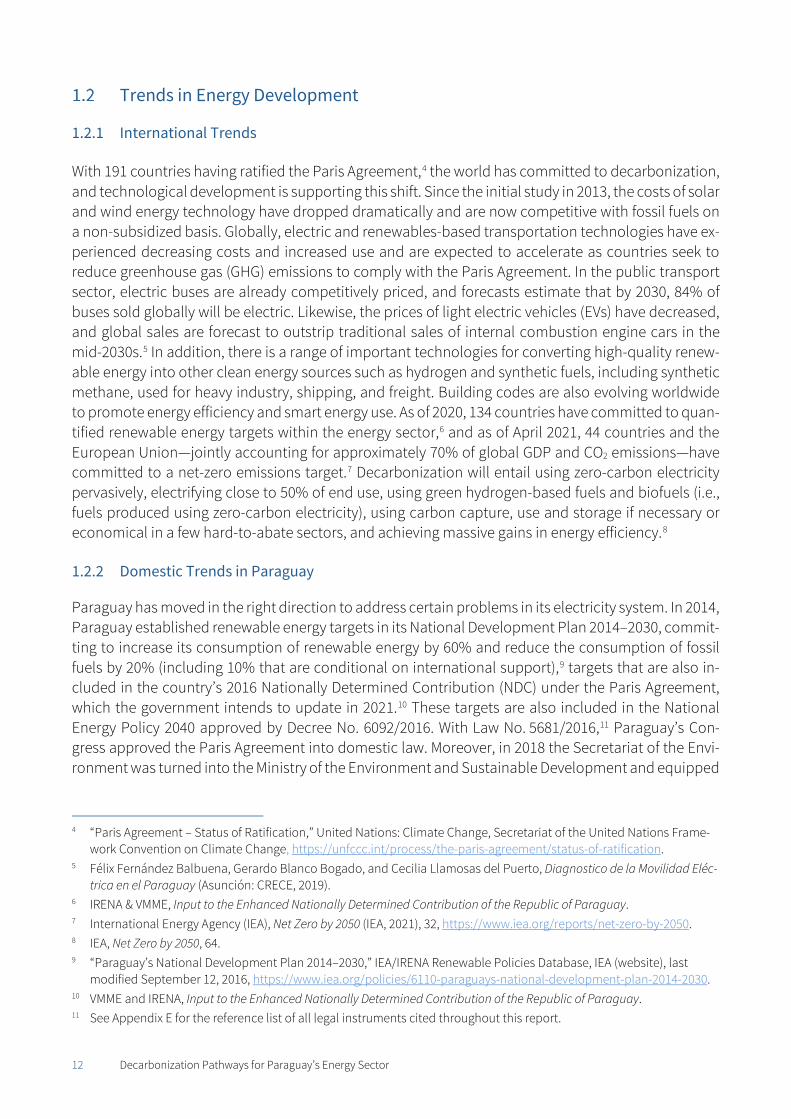
With 191 countries having ratified the Paris Agreement,4 the world has committed to decarbonization, and technological development is supporting this shift. Since the initial study in 2013, the costs of solar and wind energy technology have dropped dramatically and are now competitive with fossil fuels on a non-subsidized basis. Globally, electric and renewables-based transportation technologies have ex-perienced decreasing costs and increased use and are expected to accelerate as countries seek to reduce greenhouse gas (GHG) emissions to comply with the Paris Agreement. In the public transport sector, electric buses are already competitively priced, and forecasts estimate that by 2030, 84% of buses sold globally will be electric. Likewise, the prices of light electric vehicles (EVs) have decreased, and global sales are forecast to outstrip traditional sales of internal combustion engine cars in the mid-2030s.5 In addition, there is a range of important technologies for converting high-quality renew-able energy into other clean energy sources such as hydrogen and synthetic fuels, including synthetic methane, used for heavy industry, shipping, and freight. Building codes are also evolving worldwide to promote energy efficiency and smart energy use. As of 2020, 134 countries have committed to quan-tified renewable energy targets within the energy sector,6 and as of April 2021, 44 countries and the European Union—jointly accounting for approximately 70% of global GDP and CO2 emissions—have committed to a net-zero emissions target.7 Decarbonization will entail using zero-carbon electricity pervasively, electrifying close to 50% of end use, using green hydrogen-based fuels and biofuels (i.e., fuels produced using zero-carbon electricity), using carbon capture, use and storage if necessary or economical in a few hard-to-abate sectors, and achieving massive gains in energy efficiency.8
1.2.2 Domestic Trends in Paraguay
Paraguay has moved in the right direction to address certain problems in its electricity system. In 2014, Paraguay established renewable energy targets in its National Development Plan 2014–2030, commit-ting to increase its consumption of renewable energy by 60% and reduce the consumption of fossil fuels by 20% (including 10% that are conditional on international support),9 targets that are also in-cluded in the country’s 2016 Nationally Determined Contribution (NDC) under the Paris Agreement, which the government intends to update in 2021.10 These targets are also included in the National Energy Policy 2040 approved by Decree No. 6092/2016. With Law No. 5681/2016,11 Paraguay’s Con-gress approved the Paris Agreement into domestic law. Moreover, in 2018 the Secretariat of the Envi-ronment was turned into the Ministry of the Environment and Sustainable Development and equipped
4 “Paris Agreement – Status of Ratification,” United Nations: Climate Change, Secretariat of the United Nations Frame-
work Convention on Climate Change, https://unfccc.int/process/the-paris-agreement/status-of-ratification. 5 Félix Fernández Balbuena, Gerardo Blanco Bogado, and Cecilia Llamosas del Puerto, Diagnostico de la Movilidad Eléc-
trica en el Paraguay (Asunción: CRECE, 2019). 6 IRENA & VMME, Input to the Enhanced Nationally Determined Contribution of the Republic of Paraguay. 7 International Energy Agency (IEA), Net Zero by 2050 (IEA, 2021), 32, https://www.iea.org/reports/net-zero-by-2050. 8 IEA, Net Zero by 2050, 64. 9 “Paraguay’s National Development Plan 2014–2030,” IEA/IRENA Renewable Policies Database, IEA (website), last
modified September 12, 2016, https://www.iea.org/policies/6110-paraguays-national-development-plan-2014-2030. 10 VMME and IRENA, Input to the Enhanced Nationally Determined Contribution of the Republic of Paraguay. 11 See Appendix E for the reference list of all legal instruments cited throughout this report.
13 Decarbonization Pathways for Paraguay’s Energy Sector
with a National Office of Climate Change.12 The country has also been discussing or has already adopted policies and laws to encourage investment in or consumption of green technologies (such as opening up electricity generation to independent power producers [IPPs], encouraging the adoption of EVs, and labeling efficient home appliances), and to lay the basis for deploying a smart grid in five years, in line with ANDE’s Master Plan 2021–2030.
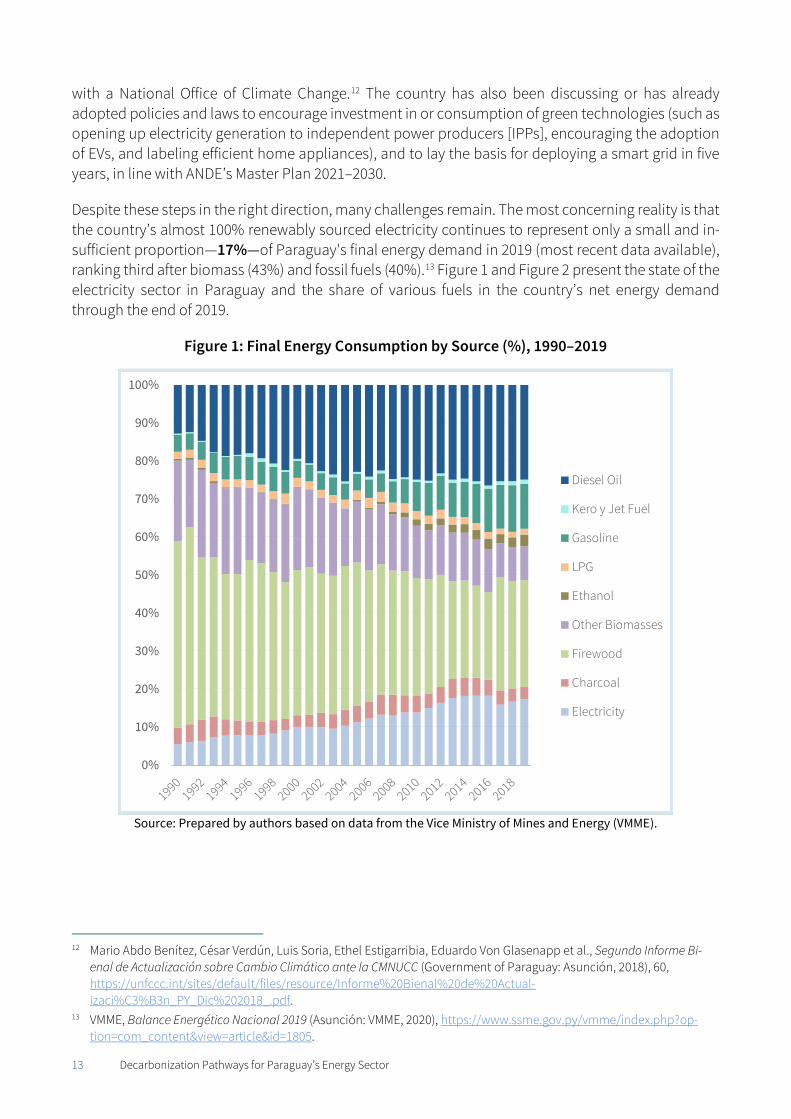
Despite these steps in the right direction, many challenges remain. The most concerning reality is that the country’s almost 100% renewably sourced electricity continues to represent only a small and in-sufficient proportion—17%—of Paraguay's final energy demand in 2019 (most recent data available), ranking third after biomass (43%) and fossil fuels (40%).13 Figure 1 and Figure 2 present the state of the electricity sector in Paraguay and the share of various fuels in the country’s net energy demand through the end of 2019.
Figure 1: Final Energy Consumption by Source (%), 1990–2019
Source: Prepared by authors based on data from the Vice Ministry of Mines and Energy (VMME).
12 Mario Abdo Benítez, César Verdún, Luis Soria, Ethel Estigarribia, Eduardo Von Glasenapp et al., Segundo Informe Bi-
enal de Actualización sobre Cambio Climático ante la CMNUCC (Government of Paraguay: Asunción, 2018), 60, https://unfccc.int/sites/default/files/resource/Informe%20Bienal%20de%20Actual-izaci%C3%B3n_PY_Dic%202018_.pdf.
13 VMME, Balance Energético Nacional 2019 (Asunción: VMME, 2020), https://www.ssme.gov.py/vmme/index.php?op-tion=com_content&view=article&id=1805.
0%
10%
20%
30%
40%
50%
60%
70%
80%
90%
100%
Diesel Oil
Kero y Jet Fuel
Gasoline
LPG
Ethanol
Other Biomasses
Firewood
Charcoal
Electricity
14 Decarbonization Pathways for Paraguay’s Energy Sector
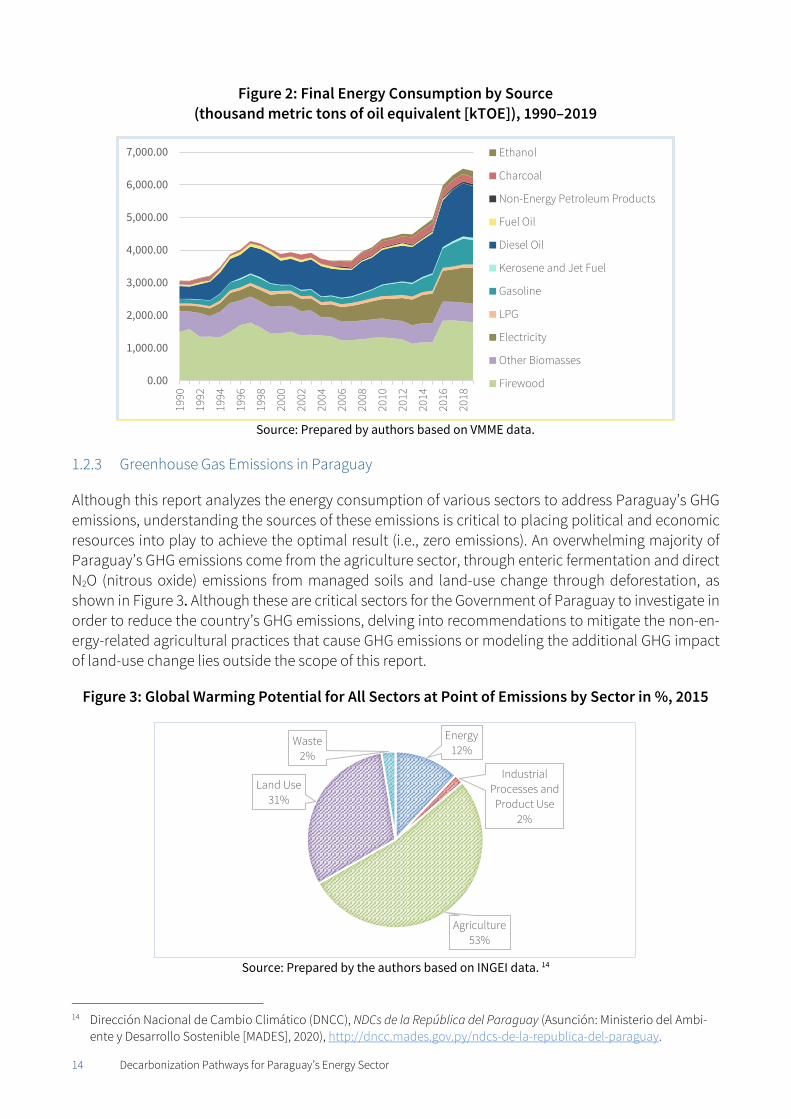
Figure 2: Final Energy Consumption by Source (thousand metric tons of oil equivalent [kTOE]), 1990–2019
Source: Prepared by authors based on VMME data.
1.2.3 Greenhouse Gas Emissions in Paraguay
Although this report analyzes the energy consumption of various sectors to address Paraguay’s GHG emissions, understanding the sources of these emissions is critical to placing political and economic resources into play to achieve the optimal result (i.e., zero emissions). An overwhelming majority of Paraguay’s GHG emissions come from the agriculture sector, through enteric fermentation and direct N2O (nitrous oxide) emissions from managed soils and land-use change through deforestation, as shown in Figure 3. Although these are critical sectors for the Government of Paraguay to investigate in order to reduce the country’s GHG emissions, delving into recommendations to mitigate the non-en-ergy-related agricultural practices that cause GHG emissions or modeling the additional GHG impact of land-use change lies outside the scope of this report.
Figure 3: Global Warming Potential for All Sectors at Point of Emissions by Sector in %, 2015
Source: Prepared by the authors based on INGEI data. 14
14 Dirección Nacional de Cambio Climático (DNCC), NDCs de la República del Paraguay (Asunción: Ministerio del Ambi-
ente y Desarrollo Sostenible [MADES], 2020), http://dncc.mades.gov.py/ndcs-de-la-republica-del-paraguay.
0.00
1,000.00
2,000.00
3,000.00
4,000.00
5,000.00
6,000.00
7,000.00
1990
1992
1994
1996
1998
2000
2002
2004
2006
2008
2010
2012
2014
2016
2018
Ethanol
Charcoal
Non-Energy Petroleum Products
Fuel Oil
Diesel Oil
Kerosene and Jet Fuel
Gasoline
LPG
Electricity
Other Biomasses
Firewood
Energy12%
Industrial Processes and
Product Use2%
Agriculture53%
Land Use31%
Waste2%
15 Decarbonization Pathways for Paraguay’s Energy Sector
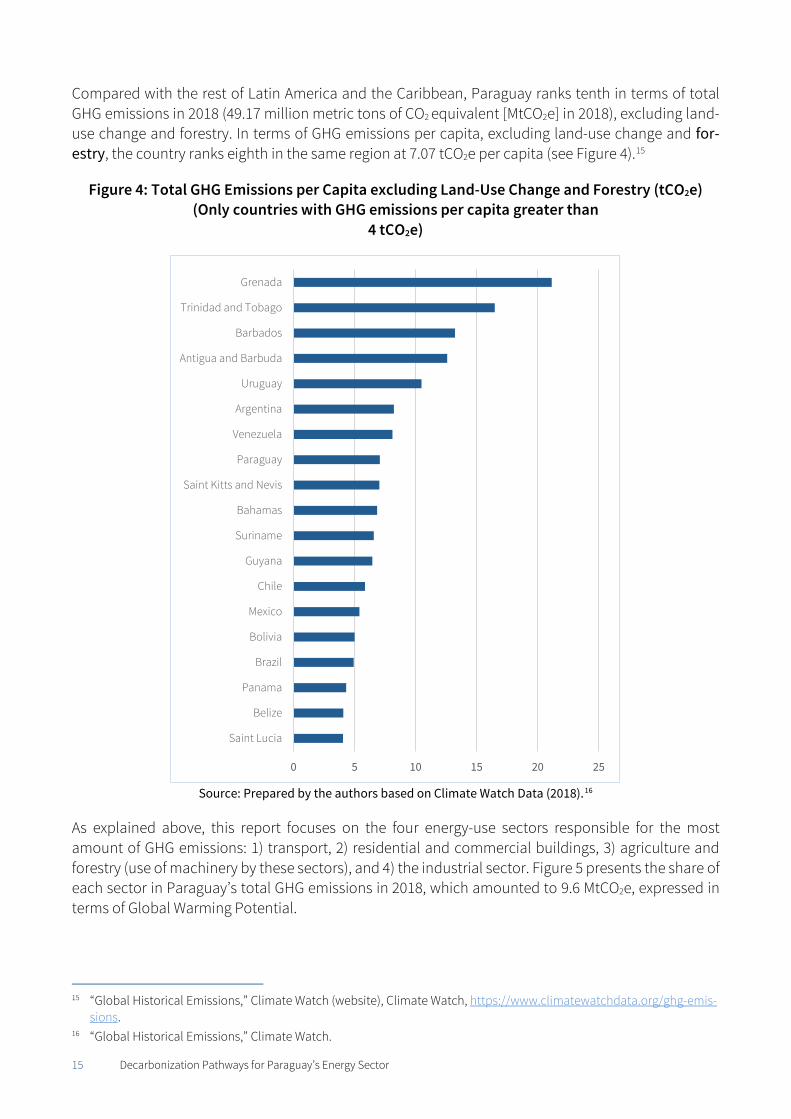
Compared with the rest of Latin America and the Caribbean, Paraguay ranks tenth in terms of total GHG emissions in 2018 (49.17 million metric tons of CO2 equivalent [MtCO2e] in 2018), excluding land-use change and forestry. In terms of GHG emissions per capita, excluding land-use change and for-estry, the country ranks eighth in the same region at 7.07 tCO2e per capita (see Figure 4).15
Figure 4: Total GHG Emissions per Capita excluding Land-Use Change and Forestry (tCO2e) (Only countries with GHG emissions per capita greater than
4 tCO2e)
Source: Prepared by the authors based on Climate Watch Data (2018).16
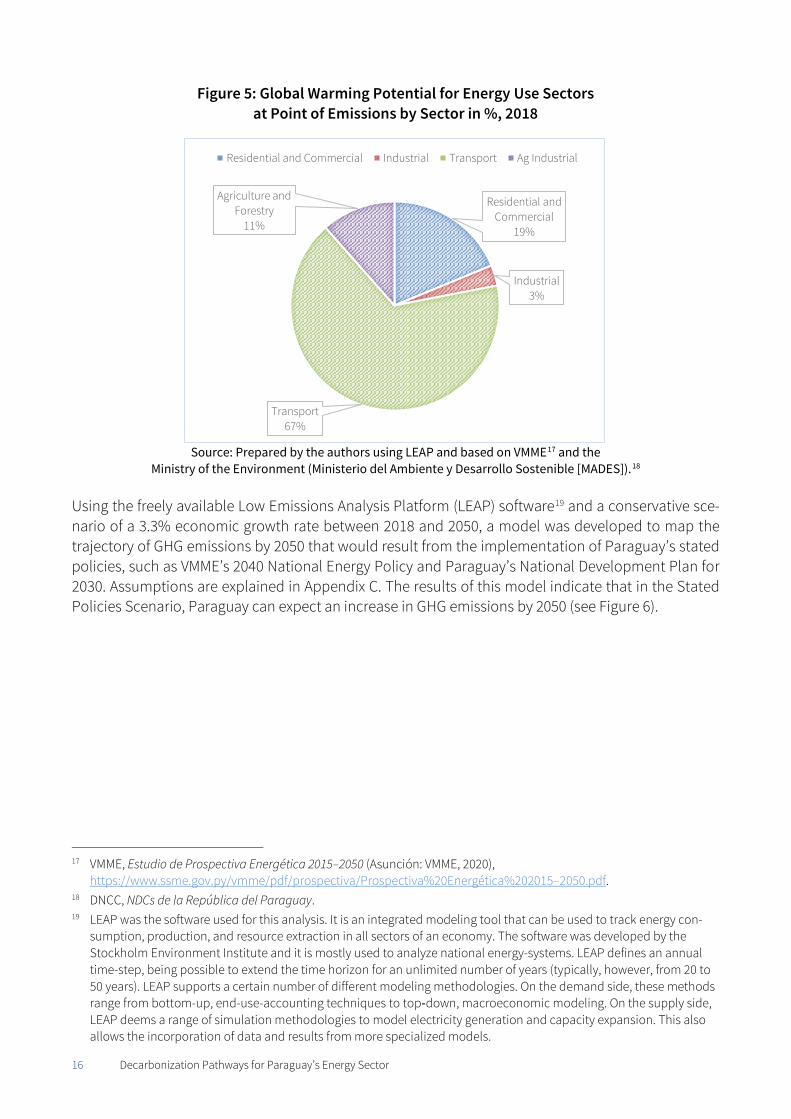
As explained above, this report focuses on the four energy-use sectors responsible for the most amount of GHG emissions: 1) transport, 2) residential and commercial buildings, 3) agriculture and forestry (use of machinery by these sectors), and 4) the industrial sector. Figure 5 presents the share of each sector in Paraguay’s total GHG emissions in 2018, which amounted to 9.6 MtCO2e, expressed in terms of Global Warming Potential.
15 “Global Historical Emissions,” Climate Watch (website), Climate Watch, https://www.climatewatchdata.org/ghg-emis-
sions. 16 “Global Historical Emissions,” Climate Watch.
0 5 10 15 20 25
Saint Lucia
Belize
Panama
Brazil
Bolivia
Mexico
Chile
Guyana
Suriname
Bahamas
Saint Kitts and Nevis
Paraguay
Venezuela
Argentina
Uruguay
Antigua and Barbuda
Barbados
Trinidad and Tobago
Grenada
16 Decarbonization Pathways for Paraguay’s Energy Sector
Figure 5: Global Warming Potential for Energy Use Sectors at Point of Emissions by Sector in %, 2018
Source: Prepared by the authors using LEAP and based on VMME17 and the
Ministry of the Environment (Ministerio del Ambiente y Desarrollo Sostenible [MADES]).18
Using the freely available Low Emissions Analysis Platform (LEAP) software19 and a conservative sce-nario of a 3.3% economic growth rate between 2018 and 2050, a model was developed to map the trajectory of GHG emissions by 2050 that would result from the implementation of Paraguay’s stated policies, such as VMME’s 2040 National Energy Policy and Paraguay’s National Development Plan for 2030. Assumptions are explained in Appendix C. The results of this model indicate that in the Stated Policies Scenario, Paraguay can expect an increase in GHG emissions by 2050 (see Figure 6).
17 VMME, Estudio de Prospectiva Energética 2015–2050 (Asunción: VMME, 2020),
https://www.ssme.gov.py/vmme/pdf/prospectiva/Prospectiva%20Energética%202015–2050.pdf. 18 DNCC, NDCs de la República del Paraguay. 19 LEAP was the software used for this analysis. It is an integrated modeling tool that can be used to track energy con-
sumption, production, and resource extraction in all sectors of an economy. The software was developed by the Stockholm Environment Institute and it is mostly used to analyze national energy-systems. LEAP defines an annual time-step, being possible to extend the time horizon for an unlimited number of years (typically, however, from 20 to 50 years). LEAP supports a certain number of different modeling methodologies. On the demand side, these methods range from bottom-up, end-use-accounting techniques to top‐down, macroeconomic modeling. On the supply side, LEAP deems a range of simulation methodologies to model electricity generation and capacity expansion. This also allows the incorporation of data and results from more specialized models.
Residential and Commercial
19%
Industrial3%
Transport67%
Agriculture and Forestry
11%
Residential and Commercial Industrial Transport Ag Industrial
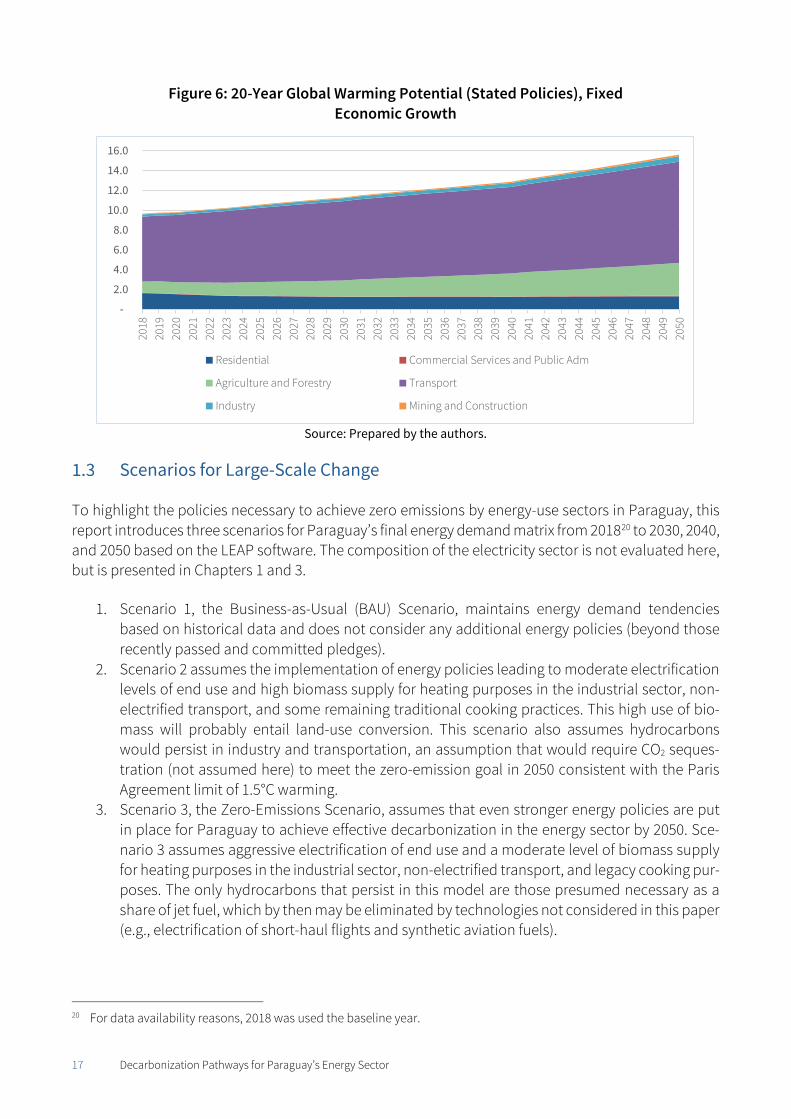
17 Decarbonization Pathways for Paraguay’s Energy Sector
Figure 6: 20-Year Global Warming Potential (Stated Policies), Fixed Economic Growth
Source: Prepared by the authors.
Scenarios for Large-Scale Change
To highlight the policies necessary to achieve zero emissions by energy-use sectors in Paraguay, this report introduces three scenarios for Paraguay’s final energy demand matrix from 201820 to 2030, 2040, and 2050 based on the LEAP software. The composition of the electricity sector is not evaluated here, but is presented in Chapters 1 and 3.
1. Scenario 1, the Business-as-Usual (BAU) Scenario, maintains energy demand tendencies based on historical data and does not consider any additional energy policies (beyond those recently passed and committed pledges).
2. Scenario 2 assumes the implementation of energy policies leading to moderate electrification levels of end use and high biomass supply for heating purposes in the industrial sector, non-electrified transport, and some remaining traditional cooking practices. This high use of bio-mass will probably entail land-use conversion. This scenario also assumes hydrocarbons would persist in industry and transportation, an assumption that would require CO2 seques-tration (not assumed here) to meet the zero-emission goal in 2050 consistent with the Paris Agreement limit of 1.5°C warming.
3. Scenario 3, the Zero-Emissions Scenario, assumes that even stronger energy policies are put in place for Paraguay to achieve effective decarbonization in the energy sector by 2050. Sce-nario 3 assumes aggressive electrification of end use and a moderate level of biomass supply for heating purposes in the industrial sector, non-electrified transport, and legacy cooking pur-poses. The only hydrocarbons that persist in this model are those presumed necessary as a share of jet fuel, which by then may be eliminated by technologies not considered in this paper (e.g., electrification of short-haul flights and synthetic aviation fuels).
20 For data availability reasons, 2018 was used the baseline year.
-
2.0
4.0
6.0
8.0
10.0
12.0
14.0
16.020
1820
1920
2020
2120
2220
2320
2420
2520
2620
2720
2820
2920
3020
3120
3220
3320
3420
3520
3620
3720
3820
3920
4020
4120
4220
4320
4420
4520
4620
4720
4820
4920
50
Residential Commercial Services and Public Adm
Agriculture and Forestry Transport
Industry Mining and Construction
18 Decarbonization Pathways for Paraguay’s Energy Sector
Scenarios 2 and 3 differ by the role of two key elements in energy system transitions: 1) the extent of end-use electrification in transport, industries, and buildings, and 2) the extent of biomass utilization for energy.21 Although Scenarios 2 and 3 both include policies that emphasize drastic changes to en-ergy efficiency gains and electrification in multiple sectors, Scenario 3 reaches zero hydrocarbon use by 2050, whereas Scenario 2 assumes progress toward that end while relying on a much higher share of biomass than Scenario 3. Appendices A (focusing on the 2018 baseline of useful energy intensity) and B (focusing on Scenarios 1, 2, and 3) provide the full set of assumptions and calculations underly-ing this section.
Scenario 3 mobilizes all pillars of decarbonization mentioned by the International Energy Agency (IEA) besides carbon capture, utilization, and storage: “energy efficiency, behavioral changes, electrifica-tion, renewables, hydrogen and hydrogen‐based fuels, bioenergy.”22
This report considers zero-emission (rather than ‘net-zero’) decarbonization, emphasizing the need to prioritize the phasing-out of the use of fossil fuels in the energy sector, while recognizing that nature-based solutions to sequester CO2 in vegetation and soils will also be needed to achieve net-negative CO2 emissions in the future.23
1.3.1 Greenhouse Gas Emissions
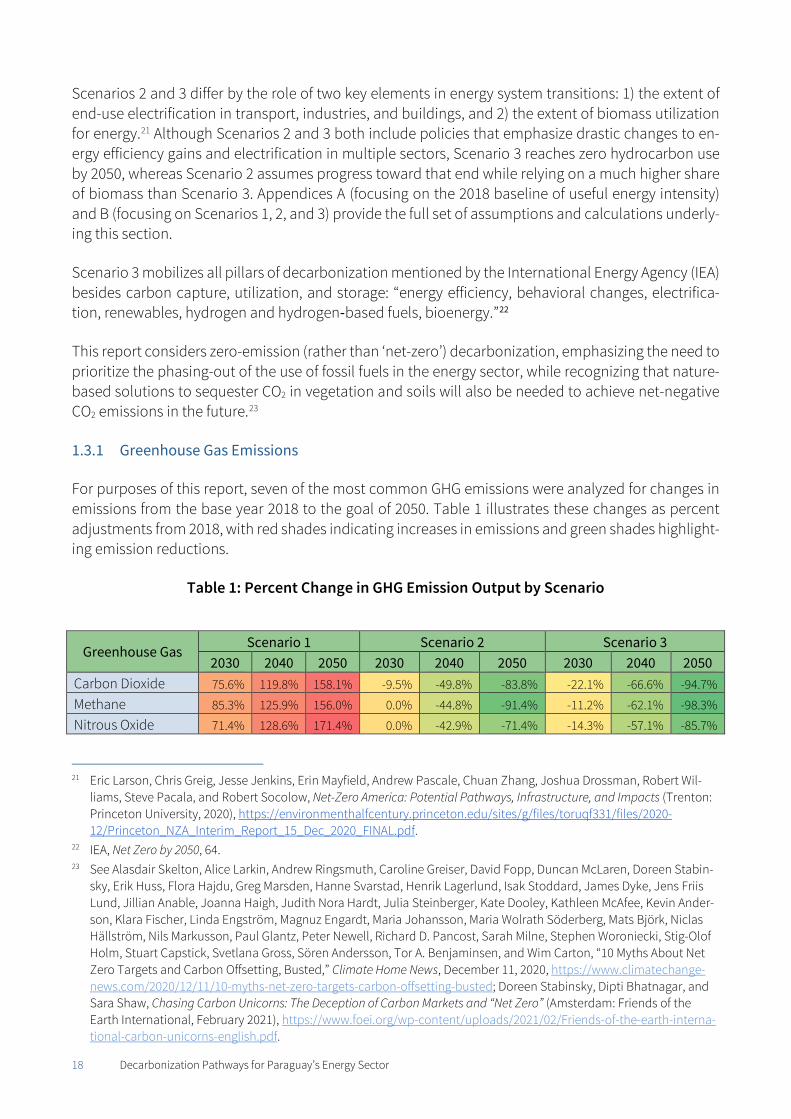
For purposes of this report, seven of the most common GHG emissions were analyzed for changes in emissions from the base year 2018 to the goal of 2050. Table 1 illustrates these changes as percent adjustments from 2018, with red shades indicating increases in emissions and green shades highlight-ing emission reductions.
Table 1: Percent Change in GHG Emission Output by Scenario
Greenhouse Gas Scenario 1 Scenario 2 Scenario 3
2030 2040 2050 2030 2040 2050 2030 2040 2050 Carbon Dioxide 75.6% 119.8% 158.1% -9.5% -49.8% -83.8% -22.1% -66.6% -94.7% Methane 85.3% 125.9% 156.0% 0.0% -44.8% -91.4% -11.2% -62.1% -98.3% Nitrous Oxide 71.4% 128.6% 171.4% 0.0% -42.9% -71.4% -14.3% -57.1% -85.7%
21 Eric Larson, Chris Greig, Jesse Jenkins, Erin Mayfield, Andrew Pascale, Chuan Zhang, Joshua Drossman, Robert Wil-
liams, Steve Pacala, and Robert Socolow, Net-Zero America: Potential Pathways, Infrastructure, and Impacts (Trenton: Princeton University, 2020), https://environmenthalfcentury.princeton.edu/sites/g/files/toruqf331/files/2020-12/Princeton_NZA_Interim_Report_15_Dec_2020_FINAL.pdf.
22 IEA, Net Zero by 2050, 64. 23 See Alasdair Skelton, Alice Larkin, Andrew Ringsmuth, Caroline Greiser, David Fopp, Duncan McLaren, Doreen Stabin-
sky, Erik Huss, Flora Hajdu, Greg Marsden, Hanne Svarstad, Henrik Lagerlund, Isak Stoddard, James Dyke, Jens Friis Lund, Jillian Anable, Joanna Haigh, Judith Nora Hardt, Julia Steinberger, Kate Dooley, Kathleen McAfee, Kevin Ander-son, Klara Fischer, Linda Engström, Magnuz Engardt, Maria Johansson, Maria Wolrath Söderberg, Mats Björk, Niclas Hällström, Nils Markusson, Paul Glantz, Peter Newell, Richard D. Pancost, Sarah Milne, Stephen Woroniecki, Stig-Olof Holm, Stuart Capstick, Svetlana Gross, Sören Andersson, Tor A. Benjaminsen, and Wim Carton, “10 Myths About Net Zero Targets and Carbon Offsetting, Busted,” Climate Home News, December 11, 2020, https://www.climatechange-news.com/2020/12/11/10-myths-net-zero-targets-carbon-offsetting-busted; Doreen Stabinsky, Dipti Bhatnagar, and Sara Shaw, Chasing Carbon Unicorns: The Deception of Carbon Markets and “Net Zero” (Amsterdam: Friends of the Earth International, February 2021), https://www.foei.org/wp-content/uploads/2021/02/Friends-of-the-earth-interna-tional-carbon-unicorns-english.pdf.
19 Decarbonization Pathways for Paraguay’s Energy Sector
Carbon Monoxide 105.2% 146.1% 169.0% 13.0% -41.3% -97.2% 0.9% -56.6% -97.6% Non-Methane VOCs 104.8% 145.9% 169.1% 12.6% -41.4% -96.8% 0.5% -56.7% -97.4% Nitrogen Oxides 87.1% 131.3% 165.5% -10.8% -57.1% -92.8% -21.4% -69.6% -96.9% Sulfur Dioxide 71.6% 117.2% 162.3% -25.5% -65.0% -89.4% -32.6% -75.7% -99.2%
Source: Prepared by the authors based on LEAP results.
While Scenario 1 shows an overall increase in GHG emissions, the other scenarios identify a significant decrease in GHG emissions. Scenario 3, with its emphasis on minimization of fossil fuels, sees the big-gest reduction in GHG emissions by 2050 is achieved through Scenario 3.
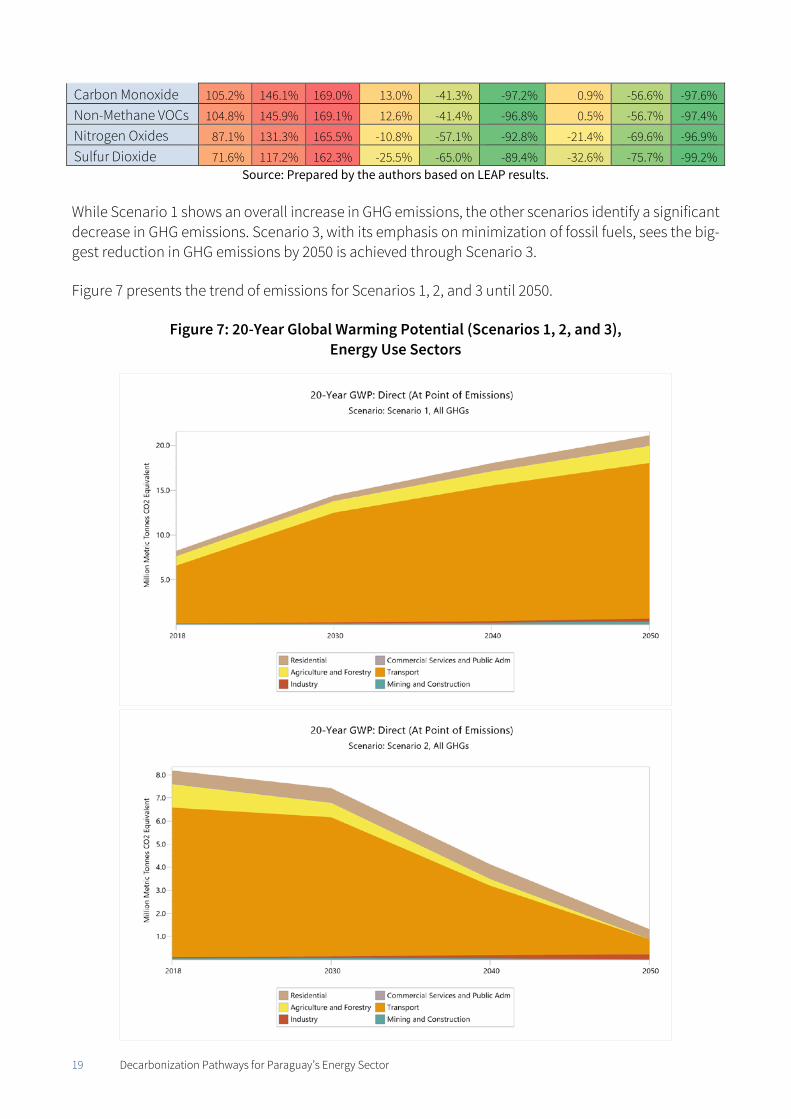
Figure 7 presents the trend of emissions for Scenarios 1, 2, and 3 until 2050.
Figure 7: 20-Year Global Warming Potential (Scenarios 1, 2, and 3), Energy Use Sectors
20 Decarbonization Pathways for Paraguay’s Energy Sector
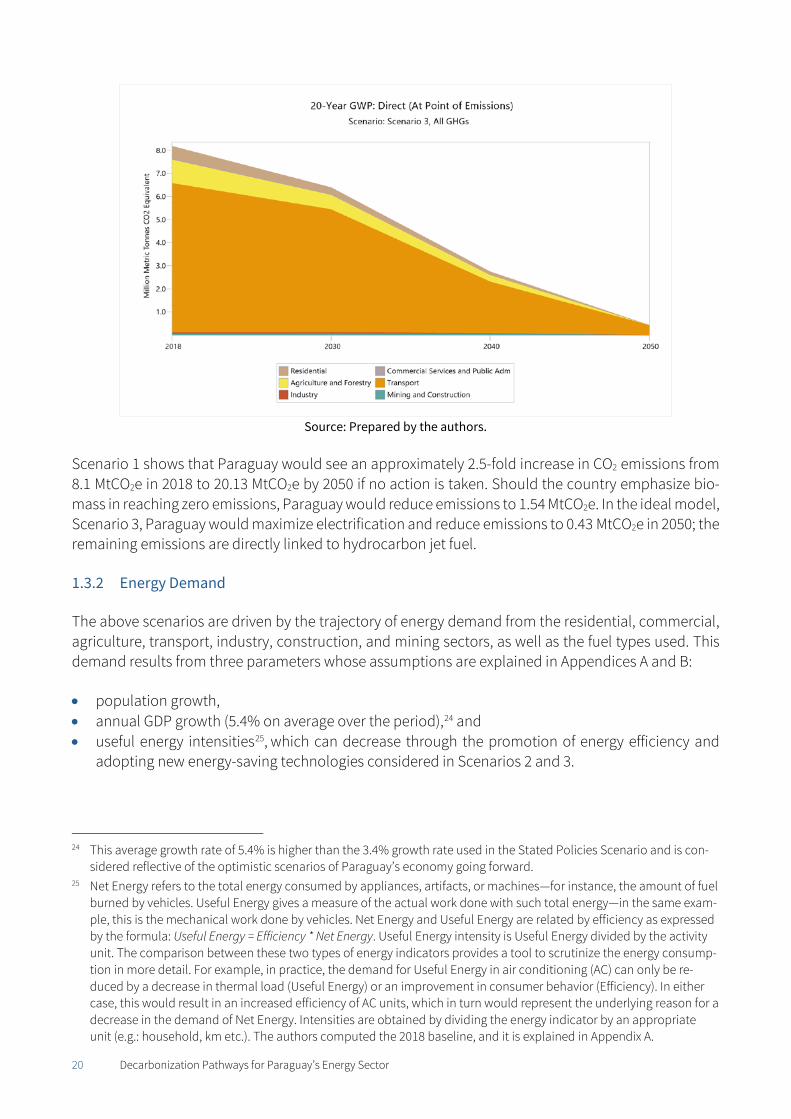
Source: Prepared by the authors.
Scenario 1 shows that Paraguay would see an approximately 2.5-fold increase in CO2 emissions from 8.1 MtCO2e in 2018 to 20.13 MtCO2e by 2050 if no action is taken. Should the country emphasize bio-mass in reaching zero emissions, Paraguay would reduce emissions to 1.54 MtCO2e. In the ideal model, Scenario 3, Paraguay would maximize electrification and reduce emissions to 0.43 MtCO2e in 2050; the remaining emissions are directly linked to hydrocarbon jet fuel.
1.3.2 Energy Demand
The above scenarios are driven by the trajectory of energy demand from the residential, commercial, agriculture, transport, industry, construction, and mining sectors, as well as the fuel types used. This demand results from three parameters whose assumptions are explained in Appendices A and B:
• population growth, • annual GDP growth (5.4% on average over the period),24 and • useful energy intensities25, which can decrease through the promotion of energy efficiency and
adopting new energy-saving technologies considered in Scenarios 2 and 3.
24 This average growth rate of 5.4% is higher than the 3.4% growth rate used in the Stated Policies Scenario and is con-
sidered reflective of the optimistic scenarios of Paraguay’s economy going forward. 25 Net Energy refers to the total energy consumed by appliances, artifacts, or machines—for instance, the amount of fuel
burned by vehicles. Useful Energy gives a measure of the actual work done with such total energy—in the same exam-ple, this is the mechanical work done by vehicles. Net Energy and Useful Energy are related by efficiency as expressed by the formula: Useful Energy = Efficiency * Net Energy. Useful Energy intensity is Useful Energy divided by the activity unit. The comparison between these two types of energy indicators provides a tool to scrutinize the energy consump-tion in more detail. For example, in practice, the demand for Useful Energy in air conditioning (AC) can only be re-duced by a decrease in thermal load (Useful Energy) or an improvement in consumer behavior (Efficiency). In either case, this would result in an increased efficiency of AC units, which in turn would represent the underlying reason for a decrease in the demand of Net Energy. Intensities are obtained by dividing the energy indicator by an appropriate unit (e.g.: household, km etc.). The authors computed the 2018 baseline, and it is explained in Appendix A.
21 Decarbonization Pathways for Paraguay’s Energy Sector
Each sector has different catalysts for efficiency improvements. In general:
• Residential: improved refrigeration and room ventilation • Commercial and Public: better consumption habits for illumination, heating, and cooling • Industry: vapor, direct heat, driving force, and process cooling technology improvements • Agriculture and Forestry: replacement of tractors and production technologies • Mining and Construction: no changes were assumed in energy efficiency • Transport: efficient driving techniques, especially for buses
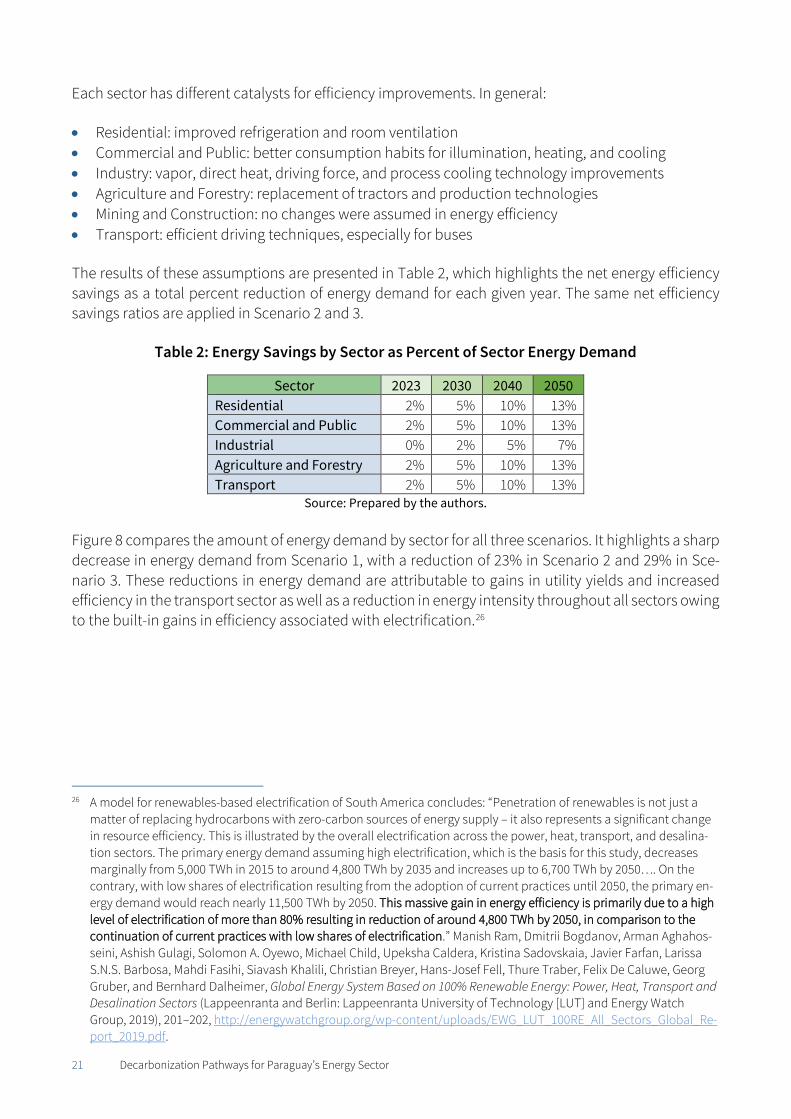
The results of these assumptions are presented in Table 2, which highlights the net energy efficiency savings as a total percent reduction of energy demand for each given year. The same net efficiency savings ratios are applied in Scenario 2 and 3.
Table 2: Energy Savings by Sector as Percent of Sector Energy Demand
Sector 2023 2030 2040 2050 Residential 2% 5% 10% 13% Commercial and Public 2% 5% 10% 13% Industrial 0% 2% 5% 7% Agriculture and Forestry 2% 5% 10% 13% Transport 2% 5% 10% 13%
Source: Prepared by the authors.
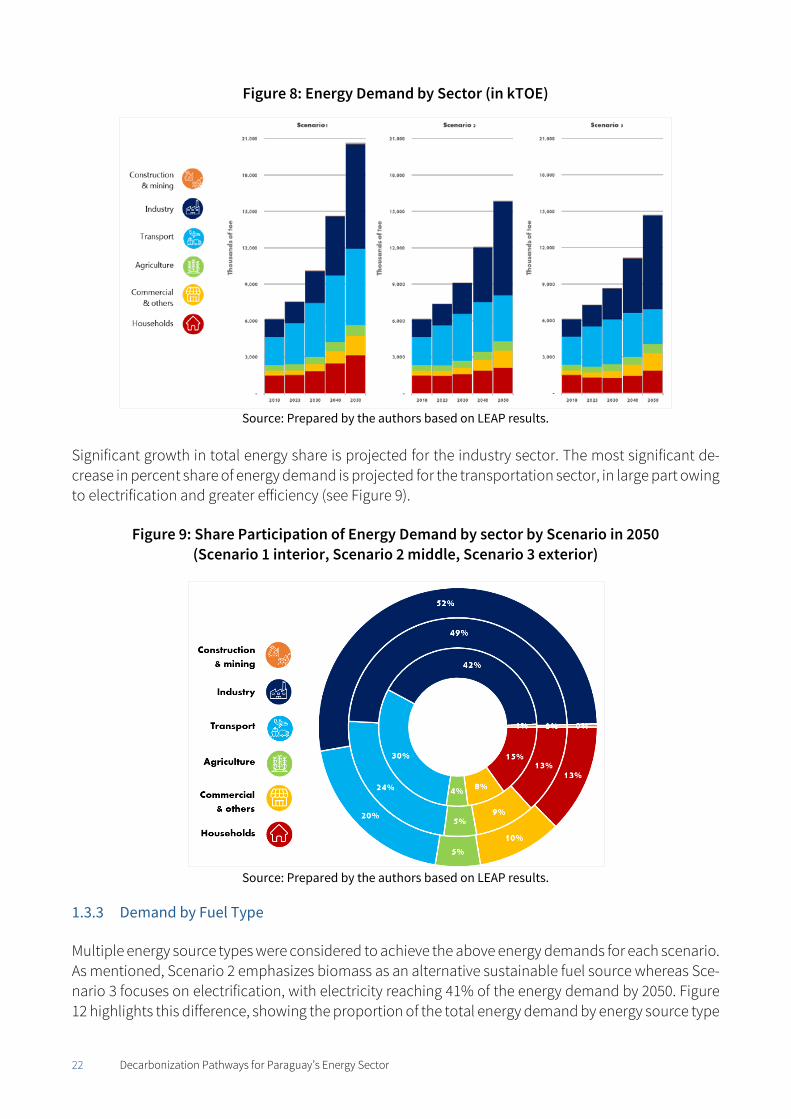
Figure 8 compares the amount of energy demand by sector for all three scenarios. It highlights a sharp decrease in energy demand from Scenario 1, with a reduction of 23% in Scenario 2 and 29% in Sce-nario 3. These reductions in energy demand are attributable to gains in utility yields and increased efficiency in the transport sector as well as a reduction in energy intensity throughout all sectors owing to the built-in gains in efficiency associated with electrification.26
26 A model for renewables-based electrification of South America concludes: “Penetration of renewables is not just a
matter of replacing hydrocarbons with zero-carbon sources of energy supply – it also represents a significant change in resource efficiency. This is illustrated by the overall electrification across the power, heat, transport, and desalina-tion sectors. The primary energy demand assuming high electrification, which is the basis for this study, decreases marginally from 5,000 TWh in 2015 to around 4,800 TWh by 2035 and increases up to 6,700 TWh by 2050…. On the contrary, with low shares of electrification resulting from the adoption of current practices until 2050, the primary en-ergy demand would reach nearly 11,500 TWh by 2050. This massive gain in energy efficiency is primarily due to a high level of electrification of more than 80% resulting in reduction of around 4,800 TWh by 2050, in comparison to the continuation of current practices with low shares of electrification.” Manish Ram, Dmitrii Bogdanov, Arman Aghahos-seini, Ashish Gulagi, Solomon A. Oyewo, Michael Child, Upeksha Caldera, Kristina Sadovskaia, Javier Farfan, Larissa S.N.S. Barbosa, Mahdi Fasihi, Siavash Khalili, Christian Breyer, Hans-Josef Fell, Thure Traber, Felix De Caluwe, Georg Gruber, and Bernhard Dalheimer, Global Energy System Based on 100% Renewable Energy: Power, Heat, Transport and Desalination Sectors (Lappeenranta and Berlin: Lappeenranta University of Technology [LUT] and Energy Watch Group, 2019), 201–202, http://energywatchgroup.org/wp-content/uploads/EWG_LUT_100RE_All_Sectors_Global_Re-port_2019.pdf.
22 Decarbonization Pathways for Paraguay’s Energy Sector
Figure 8: Energy Demand by Sector (in kTOE)
Source: Prepared by the authors based on LEAP results.
Significant growth in total energy share is projected for the industry sector. The most significant de-crease in percent share of energy demand is projected for the transportation sector, in large part owing to electrification and greater efficiency (see Figure 9).
Figure 9: Share Participation of Energy Demand by sector by Scenario in 2050 (Scenario 1 interior, Scenario 2 middle, Scenario 3 exterior)
Source: Prepared by the authors based on LEAP results.
1.3.3 Demand by Fuel Type
Multiple energy source types were considered to achieve the above energy demands for each scenario. As mentioned, Scenario 2 emphasizes biomass as an alternative sustainable fuel source whereas Sce-nario 3 focuses on electrification, with electricity reaching 41% of the energy demand by 2050. Figure 12 highlights this difference, showing the proportion of the total energy demand by energy source type
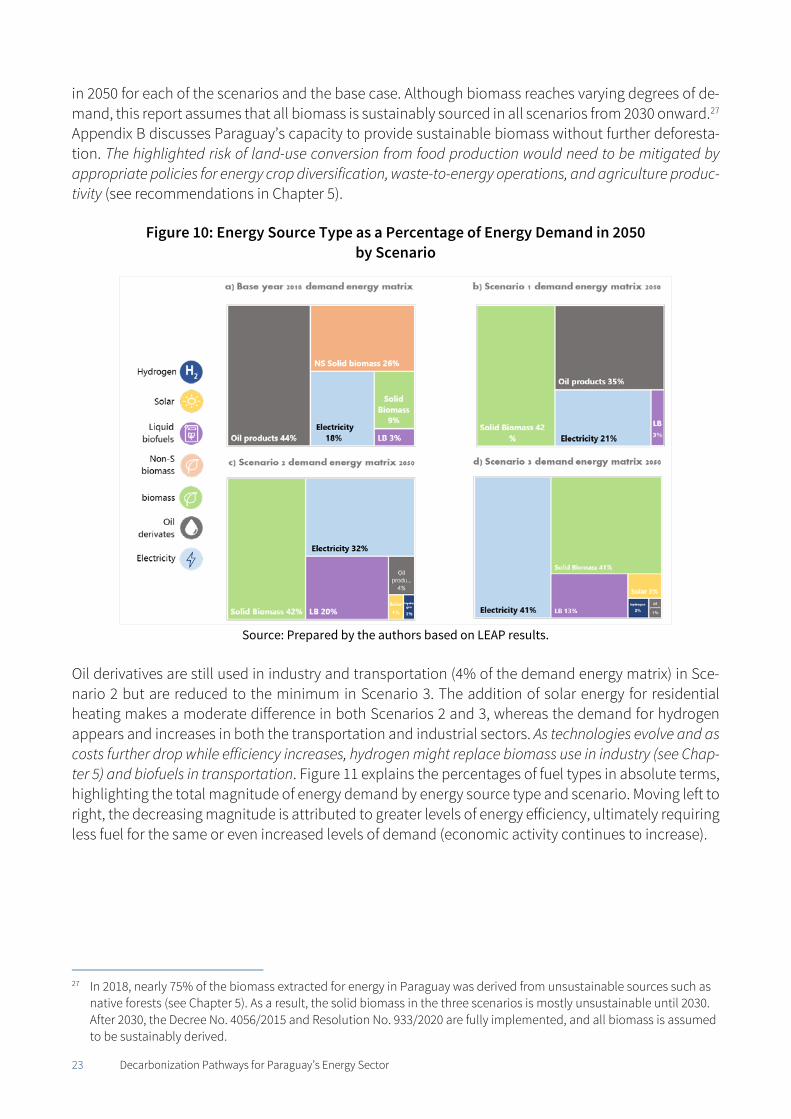
23 Decarbonization Pathways for Paraguay’s Energy Sector
in 2050 for each of the scenarios and the base case. Although biomass reaches varying degrees of de-mand, this report assumes that all biomass is sustainably sourced in all scenarios from 2030 onward.27 Appendix B discusses Paraguay’s capacity to provide sustainable biomass without further deforesta-tion. The highlighted risk of land-use conversion from food production would need to be mitigated by appropriate policies for energy crop diversification, waste-to-energy operations, and agriculture produc-tivity (see recommendations in Chapter 5).
Figure 10: Energy Source Type as a Percentage of Energy Demand in 2050 by Scenario
Source: Prepared by the authors based on LEAP results.
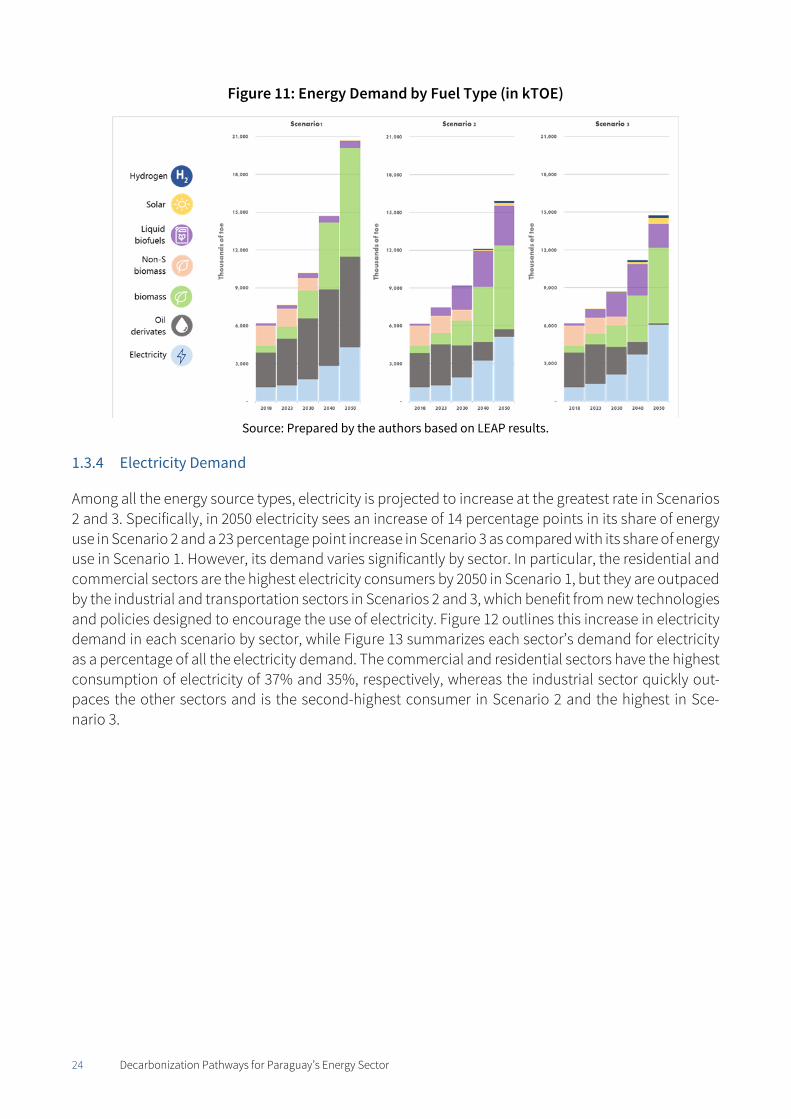
Oil derivatives are still used in industry and transportation (4% of the demand energy matrix) in Sce-nario 2 but are reduced to the minimum in Scenario 3. The addition of solar energy for residential heating makes a moderate difference in both Scenarios 2 and 3, whereas the demand for hydrogen appears and increases in both the transportation and industrial sectors. As technologies evolve and as costs further drop while efficiency increases, hydrogen might replace biomass use in industry (see Chap-ter 5) and biofuels in transportation. Figure 11 explains the percentages of fuel types in absolute terms, highlighting the total magnitude of energy demand by energy source type and scenario. Moving left to right, the decreasing magnitude is attributed to greater levels of energy efficiency, ultimately requiring less fuel for the same or even increased levels of demand (economic activity continues to increase).
27 In 2018, nearly 75% of the biomass extracted for energy in Paraguay was derived from unsustainable sources such as
native forests (see Chapter 5). As a result, the solid biomass in the three scenarios is mostly unsustainable until 2030. After 2030, the Decree No. 4056/2015 and Resolution No. 933/2020 are fully implemented, and all biomass is assumed to be sustainably derived.
24 Decarbonization Pathways for Paraguay’s Energy Sector
Figure 11: Energy Demand by Fuel Type (in kTOE)
Source: Prepared by the authors based on LEAP results.
1.3.4 Electricity Demand
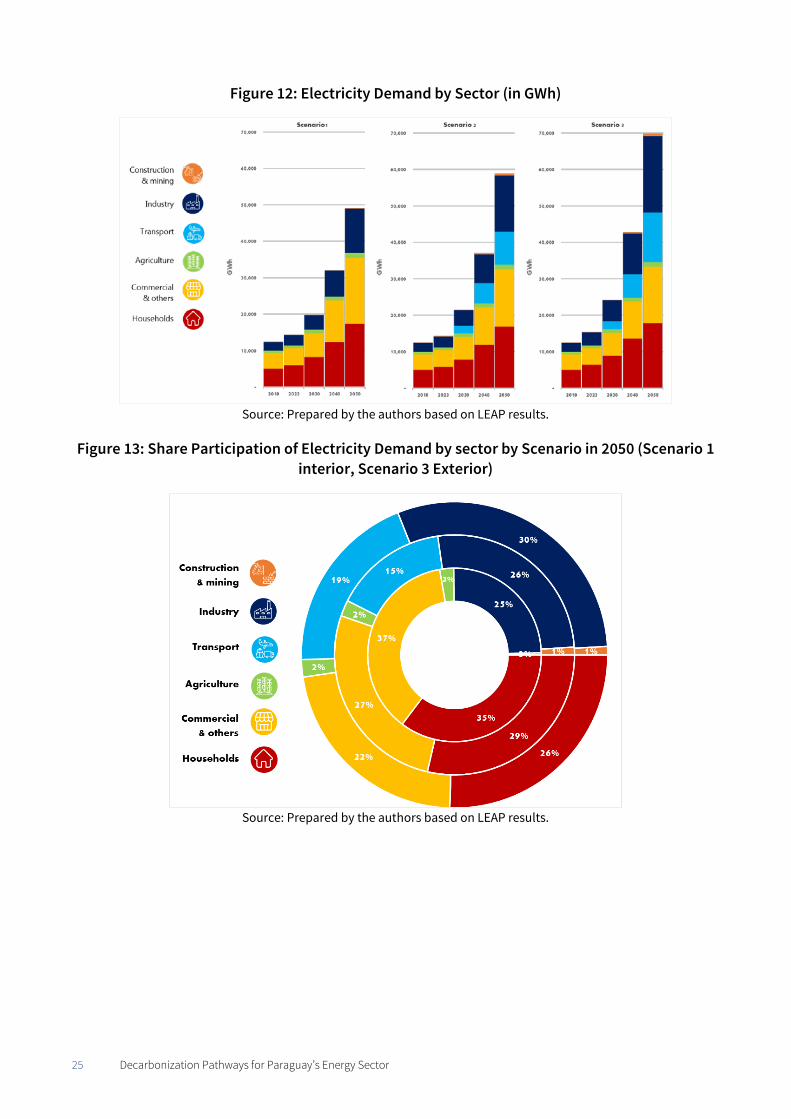
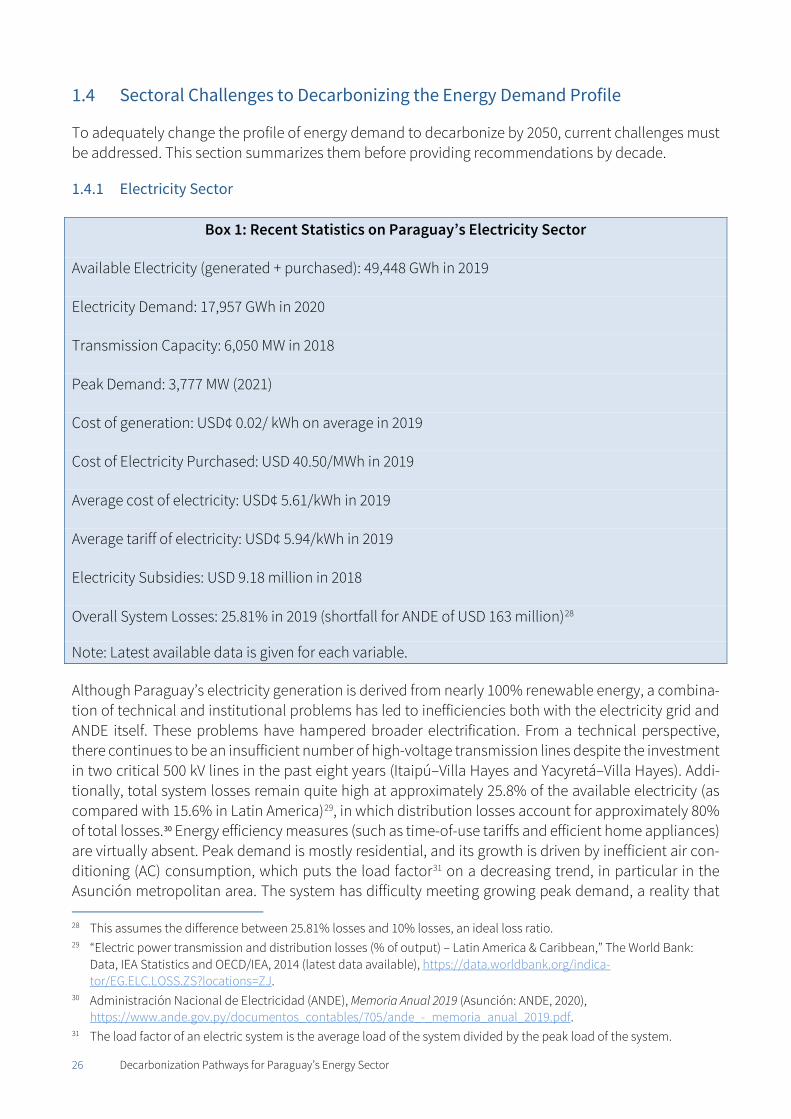
Among all the energy source types, electricity is projected to increase at the greatest rate in Scenarios 2 and 3. Specifically, in 2050 electricity sees an increase of 14 percentage points in its share of energy use in Scenario 2 and a 23 percentage point increase in Scenario 3 as compared with its share of energy use in Scenario 1. However, its demand varies significantly by sector. In particular, the residential and commercial sectors are the highest electricity consumers by 2050 in Scenario 1, but they are outpaced by the industrial and transportation sectors in Scenarios 2 and 3, which benefit from new technologies and policies designed to encourage the use of electricity. Figure 12 outlines this increase in electricity demand in each scenario by sector, while Figure 13 summarizes each sector’s demand for electricity as a percentage of all the electricity demand. The commercial and residential sectors have the highest consumption of electricity of 37% and 35%, respectively, whereas the industrial sector quickly out-paces the other sectors and is the second-highest consumer in Scenario 2 and the highest in Sce-nario 3.
25 Decarbonization Pathways for Paraguay’s Energy Sector
Figure 12: Electricity Demand by Sector (in GWh)
Source: Prepared by the authors based on LEAP results.
Figure 13: Share Participation of Electricity Demand by sector by Scenario in 2050 (Scenario 1 interior, Scenario 3 Exterior)
Source: Prepared by the authors based on LEAP results.
26 Decarbonization Pathways for Paraguay’s Energy Sector
Sectoral Challenges to Decarbonizing the Energy Demand Profile
To adequately change the profile of energy demand to decarbonize by 2050, current challenges must be addressed. This section summarizes them before providing recommendations by decade.
1.4.1 Electricity Sector
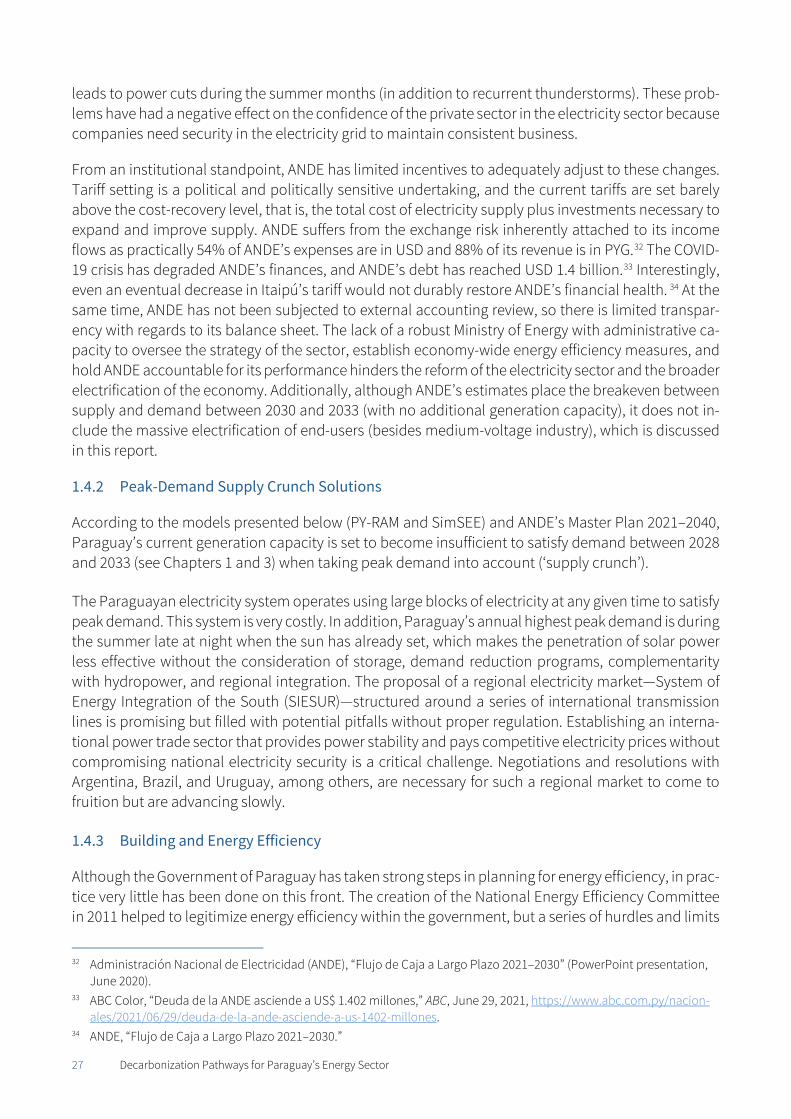
Box 1: Recent Statistics on Paraguay’s Electricity Sector
Available Electricity (generated + purchased): 49,448 GWh in 2019
Electricity Demand: 17,957 GWh in 2020
Transmission Capacity: 6,050 MW in 2018
Peak Demand: 3,777 MW (2021)
Cost of generation: USD¢ 0.02/ kWh on average in 2019
Cost of Electricity Purchased: USD 40.50/MWh in 2019
Average cost of electricity: USD¢ 5.61/kWh in 2019
Average tariff of electricity: USD¢ 5.94/kWh in 2019
Electricity Subsidies: USD 9.18 million in 2018
Overall System Losses: 25.81% in 2019 (shortfall for ANDE of USD 163 million)28
Note: Latest available data is given for each variable.
Although Paraguay’s electricity generation is derived from nearly 100% renewable energy, a combina-tion of technical and institutional problems has led to inefficiencies both with the electricity grid and ANDE itself. These problems have hampered broader electrification. From a technical perspective, there continues to be an insufficient number of high-voltage transmission lines despite the investment in two critical 500 kV lines in the past eight years (Itaipú–Villa Hayes and Yacyretá–Villa Hayes). Addi-tionally, total system losses remain quite high at approximately 25.8% of the available electricity (as compared with 15.6% in Latin America)29, in which distribution losses account for approximately 80% of total losses.30 Energy efficiency measures (such as time-of-use tariffs and efficient home appliances) are virtually absent. Peak demand is mostly residential, and its growth is driven by inefficient air con-ditioning (AC) consumption, which puts the load factor31 on a decreasing trend, in particular in the Asunción metropolitan area. The system has difficulty meeting growing peak demand, a reality that 28 This assumes the difference between 25.81% losses and 10% losses, an ideal loss ratio. 29 “Electric power transmission and distribution losses (% of output) – Latin America & Caribbean,” The World Bank:
Data, IEA Statistics and OECD/IEA, 2014 (latest data available), https://data.worldbank.org/indica-tor/EG.ELC.LOSS.ZS?locations=ZJ.
30 Administración Nacional de Electricidad (ANDE), Memoria Anual 2019 (Asunción: ANDE, 2020), https://www.ande.gov.py/documentos_contables/705/ande_-_memoria_anual_2019.pdf.
31 The load factor of an electric system is the average load of the system divided by the peak load of the system.
27 Decarbonization Pathways for Paraguay’s Energy Sector
leads to power cuts during the summer months (in addition to recurrent thunderstorms). These prob-lems have had a negative effect on the confidence of the private sector in the electricity sector because companies need security in the electricity grid to maintain consistent business.
From an institutional standpoint, ANDE has limited incentives to adequately adjust to these changes. Tariff setting is a political and politically sensitive undertaking, and the current tariffs are set barely above the cost-recovery level, that is, the total cost of electricity supply plus investments necessary to expand and improve supply. ANDE suffers from the exchange risk inherently attached to its income flows as practically 54% of ANDE’s expenses are in USD and 88% of its revenue is in PYG.32 The COVID-19 crisis has degraded ANDE’s finances, and ANDE’s debt has reached USD 1.4 billion.33 Interestingly, even an eventual decrease in Itaipú’s tariff would not durably restore ANDE’s financial health. 34 At the same time, ANDE has not been subjected to external accounting review, so there is limited transpar-ency with regards to its balance sheet. The lack of a robust Ministry of Energy with administrative ca-pacity to oversee the strategy of the sector, establish economy-wide energy efficiency measures, and hold ANDE accountable for its performance hinders the reform of the electricity sector and the broader electrification of the economy. Additionally, although ANDE’s estimates place the breakeven between supply and demand between 2030 and 2033 (with no additional generation capacity), it does not in-clude the massive electrification of end-users (besides medium-voltage industry), which is discussed in this report.
1.4.2 Peak-Demand Supply Crunch Solutions
According to the models presented below (PY-RAM and SimSEE) and ANDE’s Master Plan 2021–2040, Paraguay’s current generation capacity is set to become insufficient to satisfy demand between 2028 and 2033 (see Chapters 1 and 3) when taking peak demand into account (‘supply crunch’).
The Paraguayan electricity system operates using large blocks of electricity at any given time to satisfy peak demand. This system is very costly. In addition, Paraguay’s annual highest peak demand is during the summer late at night when the sun has already set, which makes the penetration of solar power less effective without the consideration of storage, demand reduction programs, complementarity with hydropower, and regional integration. The proposal of a regional electricity market—System of Energy Integration of the South (SIESUR)—structured around a series of international transmission lines is promising but filled with potential pitfalls without proper regulation. Establishing an interna-tional power trade sector that provides power stability and pays competitive electricity prices without compromising national electricity security is a critical challenge. Negotiations and resolutions with Argentina, Brazil, and Uruguay, among others, are necessary for such a regional market to come to fruition but are advancing slowly.
1.4.3 Building and Energy Efficiency
Although the Government of Paraguay has taken strong steps in planning for energy efficiency, in prac-tice very little has been done on this front. The creation of the National Energy Efficiency Committee in 2011 helped to legitimize energy efficiency within the government, but a series of hurdles and limits
32 Administración Nacional de Electricidad (ANDE), “Flujo de Caja a Largo Plazo 2021–2030” (PowerPoint presentation,
June 2020). 33 ABC Color, “Deuda de la ANDE asciende a US$ 1.402 millones,” ABC, June 29, 2021, https://www.abc.com.py/nacion-
ales/2021/06/29/deuda-de-la-ande-asciende-a-us-1402-millones. 34 ANDE, “Flujo de Caja a Largo Plazo 2021–2030.”
28 Decarbonization Pathways for Paraguay’s Energy Sector
on the committee’s power have made it unable to enforce decisions. Alternatively, the role of energy efficiency is broadly taken up by a number of ministries with no clear leader on regulation from a fund-ing perspective. As a result, the building sector significantly suffers from a lack of duly enforced effi-ciency guidelines for both material selection (in the case of new buildings), subsidized retrofits (in the case of existing buildings), and incentive programs for efficient home appliances. Residential buildings represent a pressing issue for Paraguay, not only because of the efficiency of home appliances but also because of the high load. The only existing tax break program encouraging sustainable construction is in Asunción and experiences very slow uptake because it is not adapted to small-to-medium-sized buildings and not a part of a broader coherent vision and regulatory package on sustainable buildings.
1.4.4 Land Use and Biomass Sector
Biomass, specifically firewood, is the largest fuel source consumed in Paraguay at 43% of the total energy demand (2019). According to the latest source, only 17% of fuel wood demand is met by wood from managed forests. The country continues to remove forest at one of the highest rates in all of South America at approximately 325,000 hectares per year, mostly in the Western Chaco region.35 Fur-thermore, land-use change for cattle grazing and agricultural development has substantially in-creased in recent years, resulting in an ever-increasing deforestation rate. However, low fuel wood prices and easy access to forested land have created a strong disincentive for the private sector to switch to cleaner energy sources and have also had a devastating effect on the forests of Paraguay. Biomass energy sources accounted for 80.3% of the industrial sector’s energy consumption in 2019, and the share of biomass energy in the industrial sector has increased since 2000. The large majority of the rural population cannot afford efficient electric appliances to transition away from fuelwood for cooking, and the industry does not have the regulatory or economic incentive to switch from biomass to clean power for their thermal needs. A well-written policy cannot be efficiently enforced owing to a lack of administrative oversight and cross-ministerial coordination, which bogs down attempts to re-duce deforestation.
1.4.5 Transport Sector
Imported fuels such as diesel and gasoline not only cost the country USD 1.3 billion per year and ex-acerbate Paraguay’s foreign exchange risk, but they also make the transport sector the highest GHG emitter among the energy end-users in the country, with approximately 67% of GHG emissions from energy use. Efforts to establish electrified public transport have not been successful, including at-tempts to establish a bus rapid transit (BRT) in Asunción, Ferrocarriles del Paraguay S.A.’s (FEPASA) railroad project, and an electric bus fleet, which has only been partially replaced to date. The lack of minimum fuel efficiency requirements and penalties for importing vehicles as old as 10 years—the oldest age for imported vehicles in South America—makes electrifying private cars much more diffi-cult. Some EV incentivizing bills are lingering in Congress. The expansion of a green hydrogen market has the potential to provide alternative heavy-duty transport fuel, but there is no installed infrastruc-ture or policy regulation for this type of industry to be built. The production of soy, which could be used to produce biofuels, is geared towards exports; biofuel production relies on a few crops whose productive yields are low and not sufficiently overseen to avoid the risk of exacerbating deforestation or land-use conversion.
35 Food and Agriculture Organization (FAO), Global Forest Resources Assessment 2015 (Rome: FAO, 2015),
http://www.fao.org/3/a-i4808e.pdf.
29 Decarbonization Pathways for Paraguay’s Energy Sector
1.4.6 Financing the Decarbonization
The energy sector investments outlined in ANDE’s most recent master plan amount to approximately USD 6.3 billion by 2030, with USD 1.2 billion for generation, USD 3.0 billion for transmission, and USD 2.1 billion for distribution. The generation investment up to 2040 will cost USD 3.5 billion. Information and Telecommunications work is expected to cost USD 218 million by 2025. The overall amount of the master plan is USD 9 billion, and financing sources remain unclear.
Although the Government of Paraguay’s fiscal discipline has tremendously improved following the 2013 Fiscal Responsibility Law, some issues with public financial management remain: lack of ac-countability at the municipal level, public wage growth uncorrelated with an increase in competen-cies, weak public participation, and a low effective tax-to-GDP ratio, currently at 14% compared with the Latin American average of 23%. This situation is now compounded by the COVID-19 pandemic, bringing the fiscal deficit from 1.7% in 2019 to 6.5% in 2020. Moreover, the recovery package does not include any specific provision to promote green growth, which is a missed opportunity for decarboni-zation. There is also a lack of a framework for private sector participation in the green energy sector: outdated organic law of ANDE, delayed passing of the implementation decree (Decree No. 5226/2021) of the sovereign guarantee law (Law No. 6324/2019), ill-designed IPP law (Law No. 3009/2006), the dif-ficulty of accessing finance, and lack of fiscal incentives. Finally, there is political pressure to turn Itaipú’s debt payoff into lower tariffs for the consumer, which could deprive Paraguay of much-needed resources.
Recommendations for All Sectors and Levels of Government
This report presents six overarching ideas for its vision of the decarbonization pathway of Paraguay’s energy sector:
1. The 2050 zero-emissions scenario is feasible and desirable. A robust and capacitated Ministry of Energy should be created to oversee the decarbonization of the energy sector. Decarbonization should be implemented by a reformed ANDE that is financially healthy and operationally modern, digitized in the services it provides, and open to private sector participation in electricity genera-tion and distribution.
2. ANDE’s master plan should anticipate a massive need for electrification of end-uses (vehicles, ap-pliances, homes, and industry), aligned with the 2050 zero-emissions scenario. This need should translate into massive investments in modern and clean generation, mainly binational hydro-power plants and solar generation combined with storage technologies.
3. Optimize investment in electricity generation and ensure a balanced load growth as demand grows, efforts should be conducted on seven fronts:
1) Minimizing commercial and non-commercial distribution losses using digitization 2) Deploying demand response programs 3) Deploying inexpensive storage technologies 4) Deploying incentive programs for efficient home appliances 5) Deploying the soft and hard infrastructure of a regional energy market 6) Encouraging public transportation over private transportation 7) Systematically searching for efficiency gains throughout the energy end-uses and developing
associated enforceable policies (e.g., building codes, efficiency standards)
30 Decarbonization Pathways for Paraguay’s Energy Sector
4. Green hydrogen and other green fuels should also be introduced to stop all reliance on unsustain-able biomass and fossil fuels.
5. Deforestation of unmanaged forests should immediately stop; at the same time, the reforestation policy and the critical biomass certification program, which has been in the implementation phase since July 2021, should be enforced. The development of green fuels should involve an increase in the yield and type of energy crops for priority domestic use.
6. Financing sources for decarbonization should come from energy efficiency–related savings, tax reforms, strong revenue management systems avoiding wasteful recurrent expenditures, issuance of concessional bonds from multilateral development bank (MDB) partners, and the amortization of Itaipú's debt, which should not be fully translated into lower consumer tariffs for the domestic economy.
Because economy-wide decarbonization involves five parallel transitions in 1) infrastructure, 2) energy economy, 3) land use, 4) jobs, and 5) law and policy,36 below are detailed policy and techno-economic recommendations according to these transitions. They are addressed to the Government of Paraguay and are meant to be adopted in full collaboration with all stakeholders, including the private sector, financial actors, and civil society.
Infrastructure Transition
• Ground Paraguay’s infrastructure transition on four pillars: 1) expansion of renewable energy gen-eration sources, 2) energy efficiency, 3) electrification of end uses, and 4) carbon capture when necessary.
• Leverage digitization and technology (including smart meters) in both hardware and software to ensure that operation is efficient (low technical and non-technical losses), easy to manage (moni-tor growth, loading of assets, and maintenance), resilient (in case of faults, disruptions), and nim-ble (addressing changes in demand and supply). These technologies do not require technological breakthroughs and can leverage local talent.
• Massively invest in zero-carbon energy sources and mobilize the complementarity of binational projects and utility-scale solar plants with storage technologies, to address the upcoming peak demand–related supply crunch.
• Implement mechanisms and incentives to ensure a balanced growth of load, especially during time when the grid does not experience peak loads, and ultimately to ensure that load factors im-prove as load growth occurs.
• Examine the business case to introduce energy storage, such as hydropeaking and thermal storage (e.g., ice storage), and demand reduction programs as options to manage peak loads.
• Establish the hard and soft infrastructure of a regional power market with neighbors to limit exces-sive investment in generation while guaranteeing energy security.
• Develop strategies to secure efficiency gains throughout the end uses of energy, and examine the gap-financing needed to determine what policy incentives would be required:
36 Sustainable Development Solutions Network (SDSN), America’s Zero Carbon Action Plan (SDSN, 2020), https://irp-
cdn.multiscreensite.com/6f2c9f57/files/uploaded/zero-carbon-action-plan%20%281%29.pdf.
31 Decarbonization Pathways for Paraguay’s Energy Sector
o In buildings: Adopt building codes that mandate construction patterns based on low-carbon materials,
energy-efficient appliances, and storage technologies, and expand the adoption and pro-motion of certifications (e.g., LEED).
Systematically consider the cost-effectiveness of efficient technology for new buildings, such as ice-cooling storage in thermal districts combined with rooftop solar generation.
Retrofit existing buildings. Adopt stringent national standards on energy efficiency. Incentivize efficient home appliances. Establish dynamic pricing.
o In transportation: Revive projects to electrify public passenger transportation (including electric bus and rail
systems, particularly in the Asunción metropolitan area). Conduct urban planning and roadway designs to facilitate clean, reliable, and fast public
transit. Anticipate the roll-out of electric charging infrastructure for public transportation and pri-
vate EVs. Plan for an all-EV light-duty bus fleet while emphasizing car sharing and public transport to
limit the need for, and demand for, individually owned vehicles; Advance the piloting of green hydrogen infrastructure for heavy vehicles, developing busi-
ness models involving the government, hydrogen truck manufacturers and importers, and the freight and cargo business.
o In industry, optimize the energy mix between sustainable biomass and electricity while mod-ernizing all equipment to maximize efficiency.
Energy Economy Transition
• Take immediate action to decarbonize Paraguay’s energy sector in a cost-effective and productive way, in conjunction with employment and welfare development, ensuring that utility-side invest-ment addresses not only generation, transmission, and distribution, but also consumer-side end-use equipment needs, especially those of the low-income population.
• Create a program for the large-scale dissemination of safe, efficient, and smartly subsidized home appliances and end-use devices for small- and medium-scale consumers, including for electric cooking and water heating. Electricity at USD 20/MWh is one-fifth the cost of retail LPG cylinders, and a distribution network already exists (i.e., ANDE’s grid). Well-designed incentivized adoption over a number of years can create a shift in practices, starting with urban populations.
• Capitalize on revenue from energy savings and massive electrification of energy end-use to finance the decarbonization of the energy sector.
o Invest the unique annual windfall that will potentially stem from the Itaipú debt payoff (accru-
ing to the Government of Paraguay if Itaipú’s tariffs are not lowered following a ratified bilateral agreement, or to ANDE if Itaipú’s tariffs are lowered, applying the current conditions of Annex C) in the country’s decarbonization, and consider that passing on Itaipú’s tariff reduction to
32 Decarbonization Pathways for Paraguay’s Energy Sector
consumers is likely to leave ANDE worse off, with little benefit for the overall Paraguayan econ-omy.
• Regularly evaluate electricity tariffs and subsidies to effectively improve collection rates and in-crease revenue.
• Adopt new financing mechanisms, such as sustainable development bonds, green bonds, local
currency bonds leveraging pension funds, and carbon tax systems (e.g., fuel tax and auctionable ecosystem certificates), building on positive experiences in other Latin American countries.
• Transparently implement any increases in the tax burden or in electricity tariffs and combine these
with incentives for households to motivate behavioral change (e.g., efficient home appliances, re-forestation by land owners) and ensure political feasibility.
• Significantly improve the government’s capacity to transparently collect tax money and spend it
on public goods rather than on recurrent expenditure to maintain macroeconomic discipline while investing in the energy transition.
• Work together with Paraguay’s high-income country partners to advocate for long-term MDB part-
ners such as CAF and IDB to support long-term development finance by taking advantage of their highly favorable market terms (such as long maturities and low interest rates) and passing them on to Paraguay as a recipient country, thereby enabling Paraguay to borrow at a scale and terms similar to those enjoyed by developed countries.
• Request that donors maintain and promote strengthened regulation for both public and private
investments. • Promote investment in clean energy and zero-carbon industrial sectors in the country and region—
including lithium-ion batteries, ice-storage technologies, and data centers—to create a feedback loop between industry and energy in which industry anchors electricity demand and skill develop-ment, and in turn a robust, clean, and modern electricity system supports the thorough and zero-carbon industrialization of the country.
Land Use Transition
• Plan policy around the climate–land–energy nexus, given that decarbonization requires land for forest conservation and the end of deforestation (with priority), carbon land sinks, sustainable bi-omass feedstocks, and the siting of zero-carbon energy infrastructure.
• Increase Paraguay’s energy crop yields, diversify its energy crops, consistently enforce reforesta-tion policy and the critical biomass certification program in the implementation phase since July 2021, and prioritize domestic use over exports to guarantee the supply of biomass for direct con-sumption and the production of biofuels and ensure the environmental and social sustainability of biomass and biofuel projects.
• Encourage reduced consumption and greater efficiency of biomass by the residential and indus-
trial sectors by requiring minimum efficiency levels for equipment, establishing quotas on biomass
33 Decarbonization Pathways for Paraguay’s Energy Sector
consumption for energy use, creating incentives programs to eliminate the consumption of bio-mass in cooking stoves in urban areas, and progressively introducing green hydrogen as an alter-native fuel in the industrial sector.
• Monitor deforestation with drones and aerial satellites to immediately cease the deforestation of
virgin forests; intensify reforestation efforts; and seek international support for forest conservation and reforestation.
Jobs Transition
• Enact labor and education policies for retraining and upskilling and provide financial assistance to support those who stand to lose because of the transition, particularly those in fossil fuel– and biomass-dependent sectors.
• Focus on skills-based jobs training in the green industry and building construction, two sectors that will experience drastic changes in the coming decades.
• Prioritize the technology use and computer skills in digitizing the electric sector and promoting a
competent workforce. Law and Policy Transition
• Conduct an in-depth study of the required infrastructure changes over the next 10 years—involving a macro-modeling exercise to prioritize investment and devise associated fiscal scenarios—to es-tablish clear targets and outline policies to reach these targets.
• Establish a robust and well-funded Ministry of Energy as a starting point to oversee the electricity sector, modernize the electricity system, monitor ANDE’s performance to improve its efficiency, and open up to the private sector through a master plan to define and implement the country’s long-term vision and a costed shorter-term strategy for energy development, including the decar-bonization pathway.
• Considerably strengthen the Technical Committee for Efficiency to achieve meaningful efficiency
gains throughout the economy in close coordination with ANDE.
• Reform ANDE’s governance, purview, and methods through a revision of its organic law, adapting it to a changing electricity sector, to enable ANDE to open up to the private sector (starting with the generation segment), engage in value-added services, and systematically seek efficiency.
• Create strong channels of coordination within the government, notably among MADES, INFONA,
the Ministry of Agriculture and Cattle Farming (Ministerio de Agricultura y Ganadería [MAG]), the Ministry of Industry and Commerce, and the Ministry of Labor, Employment, and Social Security.
• Enact and consistently enforce a coherent vision and regulations on sustainable buildings, includ-
ing codes requiring new higher-end construction to be grid-responsive and efficient and the im-plementation of strict efficiency standards for home appliances.
34 Decarbonization Pathways for Paraguay’s Energy Sector
• Enact and consistently enforce regulations on the age of imported vehicles (following worldwide and continental trends), emission standards, sustainable biomass, and public participation in pol-icymaking.
• Set up a private-facing interface with the Ministry of Finance to enable the participation of the pri-
vate sector in infrastructure.
• Conduct cost-benefit analyses prior to granting any fiscal incentives to encourage economy-wide decarbonization, and regularly review fiscal incentives to ensure that expenditure is effective and not wasteful.
• Implement robust policy planning and stakeholder engagement with regards to the difficult trade-
offs among technological choices, land use, and jobs.
Addressing the challenge of GHG emissions and decarbonization is necessary to unlock Paraguay’s vast domestic economic potential and enable Paraguay to meet its climate change commitment un-der the Paris Agreement. High-quality clean energy supplies and services will be critical to Paraguay’s continued economic growth and sustainable development in a world committed to decarbonization. This report takes advantage of global advances in green technologies to forge Paraguay’s decarboni-zation pathway while satisfying its growing energy needs. Analyzing data and scenarios both in Para-guay and internationally, this report provides a timeline of recommendations for complete decarbon-ization by 2050.
SDSN has been advising countries seeking to decarbonize to adopt a backcasting approach, which means starting from the end goal, which is carbon neutrality and decarbonized infrastructure, and working backwards to understand what needs to be done in the short- and mid-term. Thus, before any bill drafting or policy design, there is a need to determine what a policy needs to accomplish and to do so there is a need to understand the physical transition all the way through to the end state.37 This approach does not imply that policies will stay unchanged and fixed for decades. On the contrary, energy transition policies should adapt to changes and progress in technologies and science. How-ever, urgent action is needed now based on current knowledge as well as a roadmap toward the end goal. A long-term plan also facilitates stakeholder engagement and societal understanding38 on ways to accomplish a just transition.39 This is the mindset of the following roadmap, which is only illustrative. The Government of Paraguay should carefully undertake the necessary in-depth studies for further elaboration and implementa-tion.
37 2050 Pathways Platform, 2050 Pathways: A Handbook (2050 Pathways, 2017), https://2050pathways.org/wp-con-
tent/uploads/2017/09/2050Pathways-Handbook-1.pdf. 38 As discussed in Conference on “Estrategias a largo plazo y nuestras CND,” June 25, 2021, Panel: Qué son las LTS y NDC
en el contexto de Ministerio de Hacienda. 39 2050 Pathways Platform, 2050 Pathways: A Handbook.
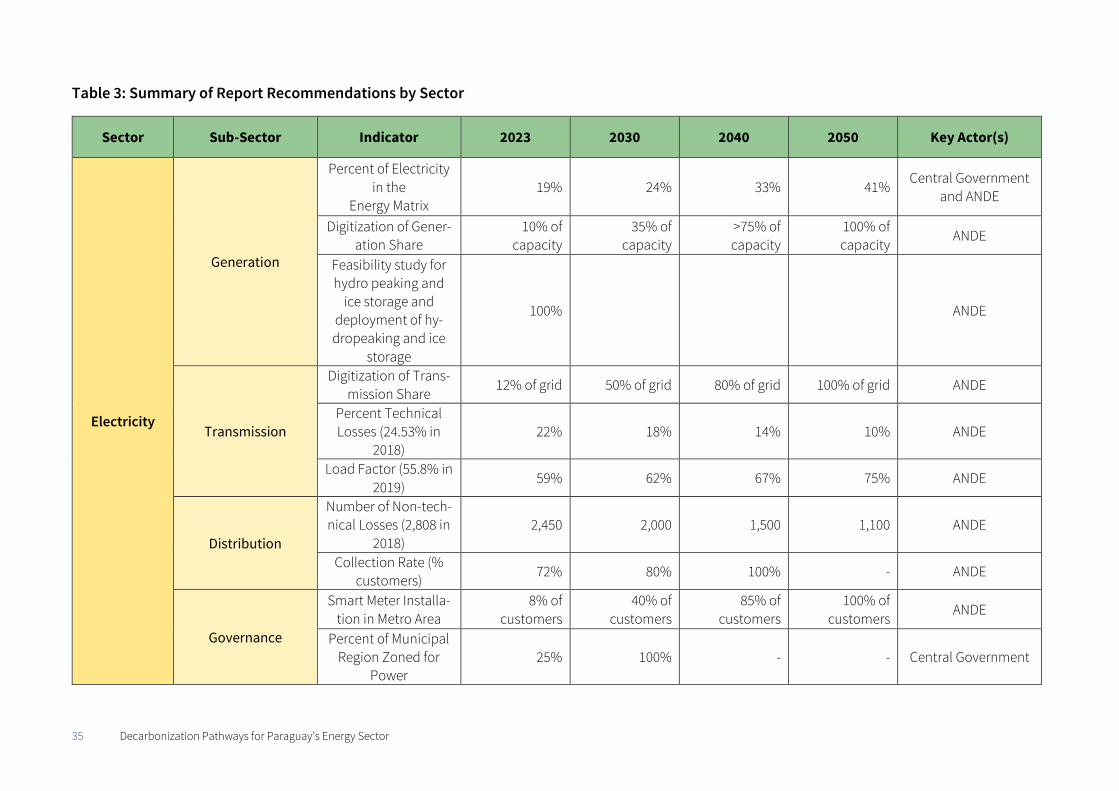
35 Decarbonization Pathways for Paraguay’s Energy Sector
Table 3: Summary of Report Recommendations by Sector
Sector Sub-Sector Indicator 2023 2030 2040 2050 Key Actor(s)
Electricity
Generation
Percent of Electricity in the
Energy Matrix 19% 24% 33% 41%
Central Government and ANDE
Digitization of Gener-ation Share
10% of capacity
35% of capacity
>75% of capacity
100% of capacity
ANDE
Feasibility study for hydro peaking and
ice storage and deployment of hy-dropeaking and ice
storage
100% ANDE
Transmission
Digitization of Trans-mission Share
12% of grid 50% of grid 80% of grid 100% of grid ANDE
Percent Technical Losses (24.53% in
2018) 22% 18% 14% 10% ANDE
Load Factor (55.8% in 2019)
59% 62% 67% 75% ANDE
Distribution
Number of Non-tech-nical Losses (2,808 in
2018) 2,450 2,000 1,500 1,100 ANDE
Collection Rate (% customers)
72% 80% 100% - ANDE
Governance
Smart Meter Installa-tion in Metro Area
8% of customers
40% of customers
85% of customers
100% of customers
ANDE
Percent of Municipal Region Zoned for
Power 25% 100% - - Central Government
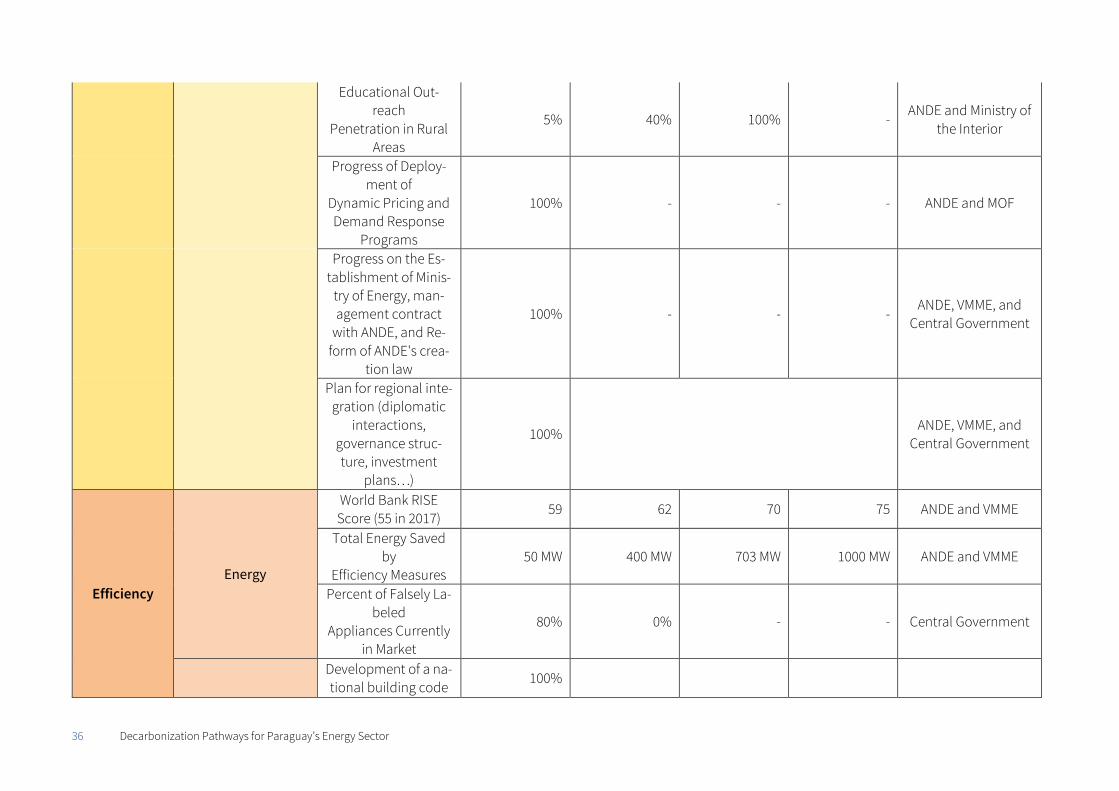
36 Decarbonization Pathways for Paraguay’s Energy Sector
Educational Out-reach
Penetration in Rural Areas
5% 40% 100% - ANDE and Ministry of
the Interior
Progress of Deploy-ment of
Dynamic Pricing and Demand Response
Programs
100% - - - ANDE and MOF
Progress on the Es-tablishment of Minis-
try of Energy, man-agement contract
with ANDE, and Re-form of ANDE's crea-
tion law
100% - - - ANDE, VMME, and
Central Government
Plan for regional inte-gration (diplomatic
interactions, governance struc-ture, investment
plans…)
100% ANDE, VMME, and Central Government
Efficiency Energy
World Bank RISE Score (55 in 2017)
59 62 70 75 ANDE and VMME
Total Energy Saved by
Efficiency Measures 50 MW 400 MW 703 MW 1000 MW ANDE and VMME
Percent of Falsely La-beled
Appliances Currently in Market
80% 0% - - Central Government
Development of a na-tional building code
100%
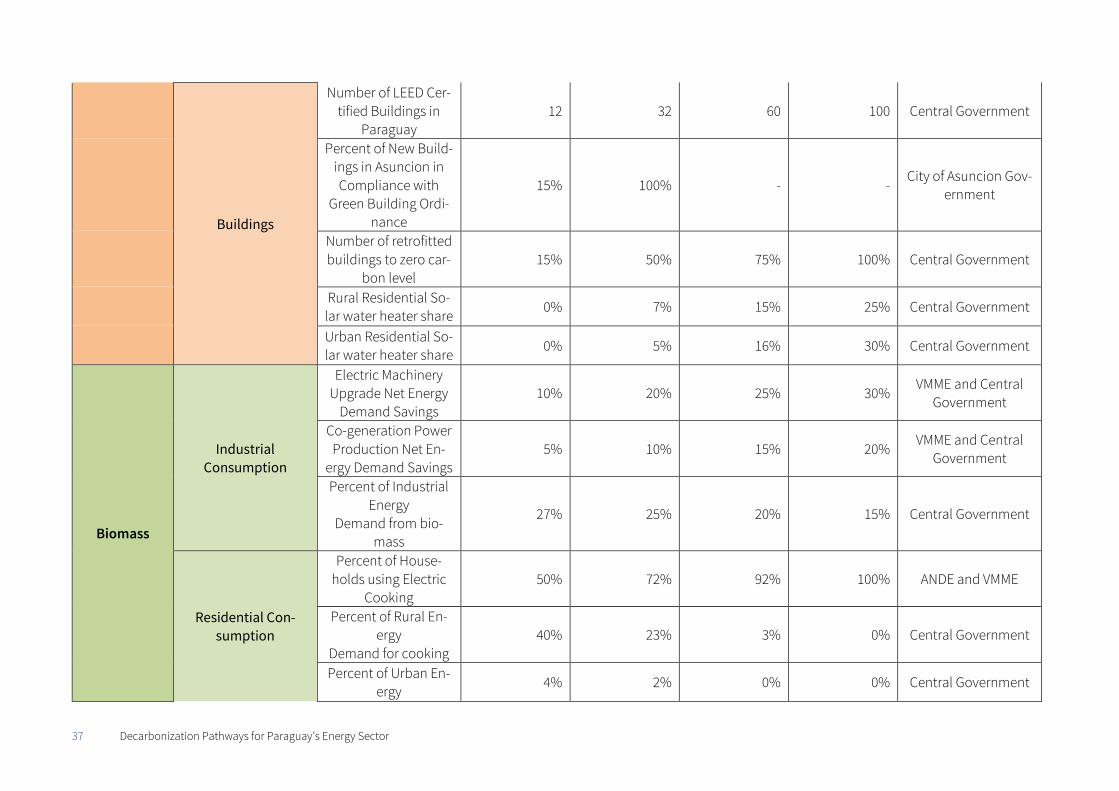
37 Decarbonization Pathways for Paraguay’s Energy Sector
Buildings
Number of LEED Cer-tified Buildings in
Paraguay 12 32 60 100 Central Government
Percent of New Build-ings in Asuncion in Compliance with
Green Building Ordi-nance
15% 100% - - City of Asuncion Gov-
ernment
Number of retrofitted buildings to zero car-
bon level 15% 50% 75% 100% Central Government
Rural Residential So-lar water heater share
0% 7% 15% 25% Central Government
Urban Residential So-lar water heater share
0% 5% 16% 30% Central Government
Biomass
Industrial Consumption
Electric Machinery Upgrade Net Energy
Demand Savings 10% 20% 25% 30%
VMME and Central Government
Co-generation Power Production Net En-
ergy Demand Savings 5% 10% 15% 20%
VMME and Central Government
Percent of Industrial Energy
Demand from bio-mass
27% 25% 20% 15% Central Government
Residential Con-sumption
Percent of House-holds using Electric
Cooking 50% 72% 92% 100% ANDE and VMME
Percent of Rural En-ergy
Demand for cooking 40% 23% 3% 0% Central Government
Percent of Urban En-ergy
4% 2% 0% 0% Central Government
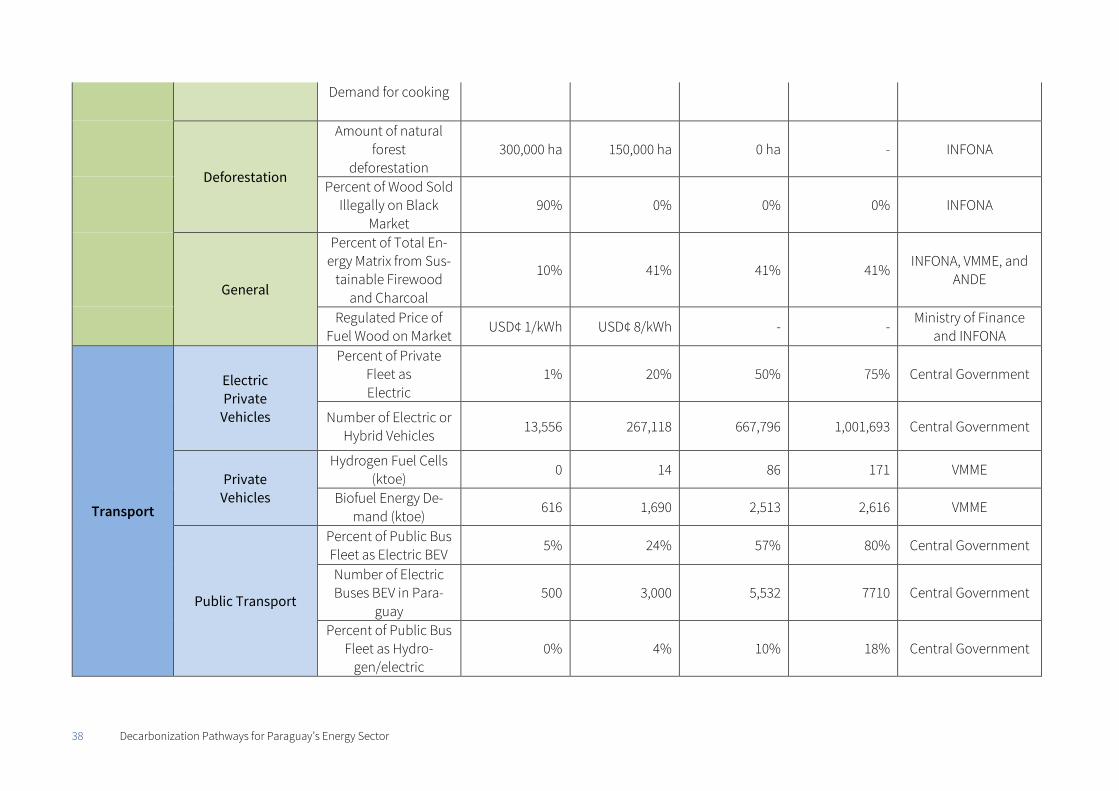
38 Decarbonization Pathways for Paraguay’s Energy Sector
Demand for cooking
Deforestation
Amount of natural forest
deforestation 300,000 ha 150,000 ha 0 ha - INFONA
Percent of Wood Sold Illegally on Black
Market 90% 0% 0% 0% INFONA
General
Percent of Total En-ergy Matrix from Sus-
tainable Firewood and Charcoal
10% 41% 41% 41% INFONA, VMME, and
ANDE
Regulated Price of Fuel Wood on Market
USD¢ 1/kWh USD¢ 8/kWh - - Ministry of Finance
and INFONA
Transport
Electric Private
Vehicles
Percent of Private Fleet as Electric
1% 20% 50% 75% Central Government
Number of Electric or Hybrid Vehicles
13,556 267,118 667,796 1,001,693 Central Government
Private Vehicles
Hydrogen Fuel Cells (ktoe)
0 14 86 171 VMME
Biofuel Energy De-mand (ktoe)
616 1,690 2,513 2,616 VMME
Public Transport
Percent of Public Bus Fleet as Electric BEV
5% 24% 57% 80% Central Government
Number of Electric Buses BEV in Para-
guay 500 3,000 5,532 7710 Central Government
Percent of Public Bus Fleet as Hydro-
gen/electric 0% 4% 10% 18% Central Government
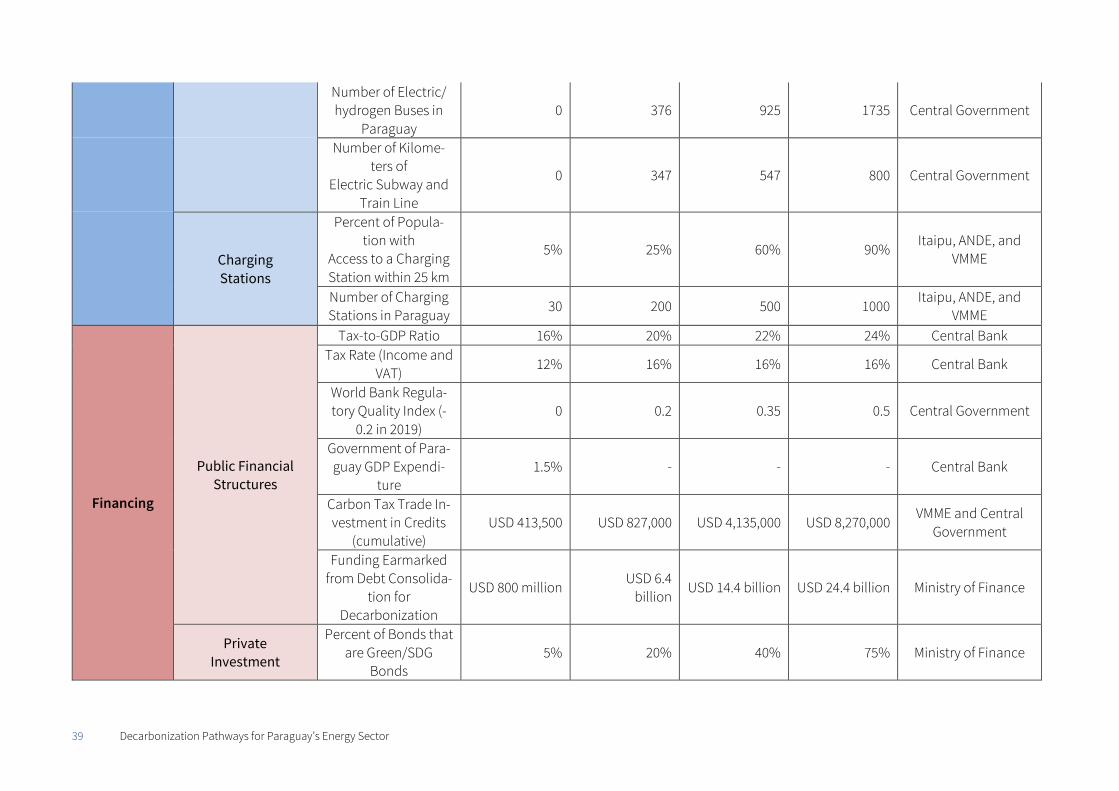
39 Decarbonization Pathways for Paraguay’s Energy Sector
Number of Electric/ hydrogen Buses in
Paraguay 0 376 925 1735 Central Government
Number of Kilome-ters of
Electric Subway and Train Line
0 347 547 800 Central Government
Charging Stations
Percent of Popula-tion with
Access to a Charging Station within 25 km
5% 25% 60% 90% Itaipu, ANDE, and
VMME
Number of Charging Stations in Paraguay
30 200 500 1000 Itaipu, ANDE, and
VMME
Financing
Public Financial Structures
Tax-to-GDP Ratio 16% 20% 22% 24% Central Bank Tax Rate (Income and
VAT) 12% 16% 16% 16% Central Bank
World Bank Regula-tory Quality Index (-
0.2 in 2019) 0 0.2 0.35 0.5 Central Government
Government of Para-guay GDP Expendi-
ture 1.5% - - - Central Bank
Carbon Tax Trade In-vestment in Credits
(cumulative) USD 413,500 USD 827,000 USD 4,135,000 USD 8,270,000
VMME and Central Government
Funding Earmarked from Debt Consolida-
tion for Decarbonization
USD 800 million USD 6.4
billion USD 14.4 billion USD 24.4 billion Ministry of Finance
Private Investment
Percent of Bonds that are Green/SDG
Bonds 5% 20% 40% 75% Ministry of Finance
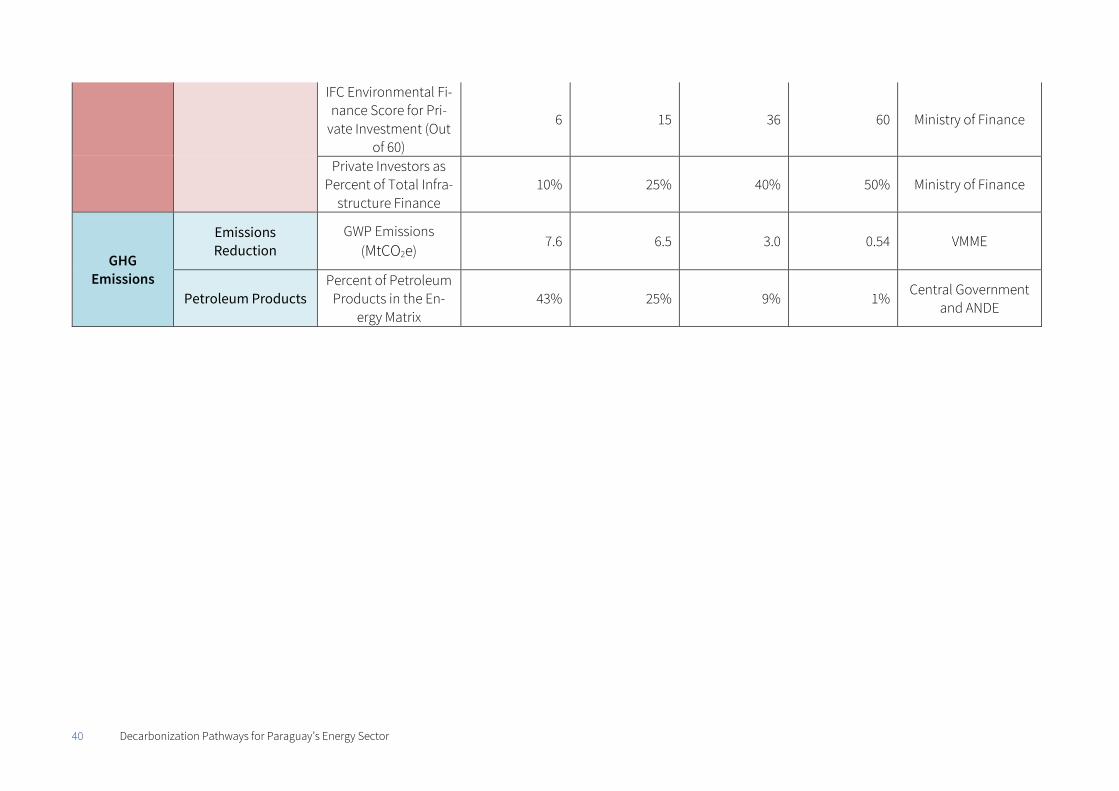
40 Decarbonization Pathways for Paraguay’s Energy Sector
IFC Environmental Fi-nance Score for Pri-
vate Investment (Out of 60)
6 15 36 60 Ministry of Finance
Private Investors as Percent of Total Infra-
structure Finance 10% 25% 40% 50% Ministry of Finance
GHG Emissions
Emissions Reduction
GWP Emissions (MtCO2e)
7.6 6.5 3.0 0.54 VMME
Petroleum Products Percent of Petroleum
Products in the En-ergy Matrix
43% 25% 9% 1% Central Government
and ANDE
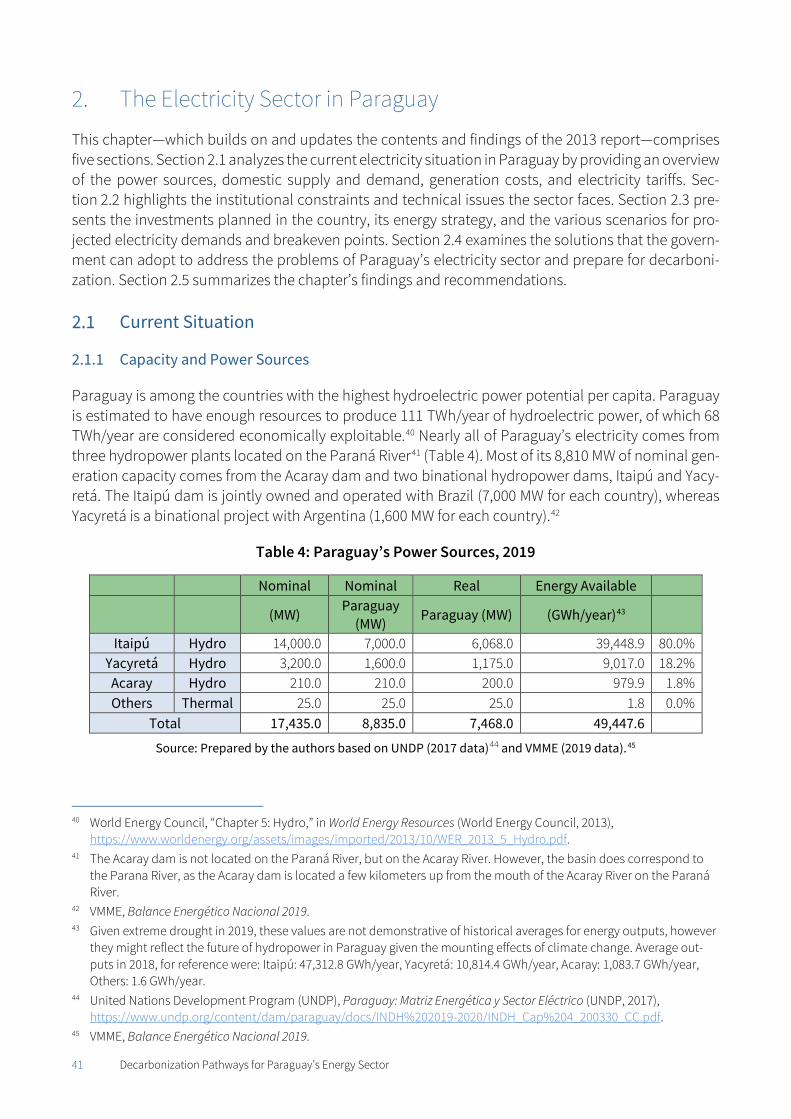
41 Decarbonization Pathways for Paraguay’s Energy Sector
2. The Electricity Sector in Paraguay
This chapter—which builds on and updates the contents and findings of the 2013 report—comprises five sections. Section 2.1 analyzes the current electricity situation in Paraguay by providing an overview of the power sources, domestic supply and demand, generation costs, and electricity tariffs. Sec-tion 2.2 highlights the institutional constraints and technical issues the sector faces. Section 2.3 pre-sents the investments planned in the country, its energy strategy, and the various scenarios for pro-jected electricity demands and breakeven points. Section 2.4 examines the solutions that the govern-ment can adopt to address the problems of Paraguay’s electricity sector and prepare for decarboni-zation. Section 2.5 summarizes the chapter’s findings and recommendations.
Current Situation
2.1.1 Capacity and Power Sources
Paraguay is among the countries with the highest hydroelectric power potential per capita. Paraguay is estimated to have enough resources to produce 111 TWh/year of hydroelectric power, of which 68 TWh/year are considered economically exploitable.40 Nearly all of Paraguay’s electricity comes from three hydropower plants located on the Paraná River41 (Table 4). Most of its 8,810 MW of nominal gen-eration capacity comes from the Acaray dam and two binational hydropower dams, Itaipú and Yacy-retá. The Itaipú dam is jointly owned and operated with Brazil (7,000 MW for each country), whereas Yacyretá is a binational project with Argentina (1,600 MW for each country).42
Table 4: Paraguay’s Power Sources, 2019
Nominal Nominal Real Energy Available
(MW) Paraguay
(MW) Paraguay (MW) (GWh/year)43
Itaipú Hydro 14,000.0 7,000.0 6,068.0 39,448.9 80.0% Yacyretá Hydro 3,200.0 1,600.0 1,175.0 9,017.0 18.2% Acaray Hydro 210.0 210.0 200.0 979.9 1.8% Others Thermal 25.0 25.0 25.0 1.8 0.0%
Total 17,435.0 8,835.0 7,468.0 49,447.6
Source: Prepared by the authors based on UNDP (2017 data)44 and VMME (2019 data).45
40 World Energy Council, “Chapter 5: Hydro,” in World Energy Resources (World Energy Council, 2013),
https://www.worldenergy.org/assets/images/imported/2013/10/WER_2013_5_Hydro.pdf. 41 The Acaray dam is not located on the Paraná River, but on the Acaray River. However, the basin does correspond to
the Parana River, as the Acaray dam is located a few kilometers up from the mouth of the Acaray River on the Paraná River.
42 VMME, Balance Energético Nacional 2019. 43 Given extreme drought in 2019, these values are not demonstrative of historical averages for energy outputs, however
they might reflect the future of hydropower in Paraguay given the mounting effects of climate change. Average out-puts in 2018, for reference were: Itaipú: 47,312.8 GWh/year, Yacyretá: 10,814.4 GWh/year, Acaray: 1,083.7 GWh/year, Others: 1.6 GWh/year.
44 United Nations Development Program (UNDP), Paraguay: Matriz Energética y Sector Eléctrico (UNDP, 2017), https://www.undp.org/content/dam/paraguay/docs/INDH%202019-2020/INDH_Cap%204_200330_CC.pdf.
45 VMME, Balance Energético Nacional 2019.
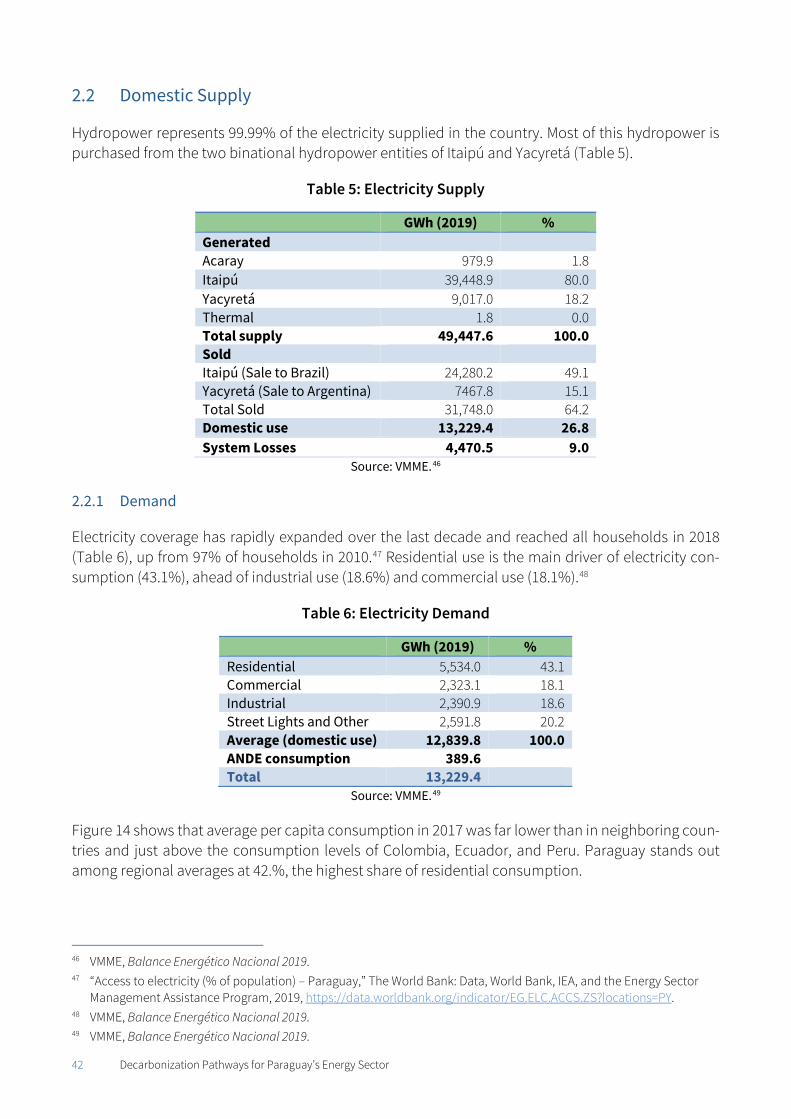
42 Decarbonization Pathways for Paraguay’s Energy Sector
Domestic Supply
Hydropower represents 99.99% of the electricity supplied in the country. Most of this hydropower is purchased from the two binational hydropower entities of Itaipú and Yacyretá (Table 5).
Table 5: Electricity Supply
GWh (2019) % Generated Acaray 979.9 1.8 Itaipú 39,448.9 80.0 Yacyretá 9,017.0 18.2 Thermal 1.8 0.0 Total supply 49,447.6 100.0 Sold Itaipú (Sale to Brazil) 24,280.2 49.1 Yacyretá (Sale to Argentina) 7467.8 15.1 Total Sold 31,748.0 64.2 Domestic use 13,229.4 26.8 System Losses 4,470.5 9.0
Source: VMME.46
2.2.1 Demand
Electricity coverage has rapidly expanded over the last decade and reached all households in 2018 (Table 6), up from 97% of households in 2010.47 Residential use is the main driver of electricity con-sumption (43.1%), ahead of industrial use (18.6%) and commercial use (18.1%).48
Table 6: Electricity Demand
GWh (2019) % Residential 5,534.0 43.1 Commercial 2,323.1 18.1 Industrial 2,390.9 18.6 Street Lights and Other 2,591.8 20.2 Average (domestic use) 12,839.8 100.0 ANDE consumption 389.6 Total 13,229.4
Source: VMME.49
Figure 14 shows that average per capita consumption in 2017 was far lower than in neighboring coun-tries and just above the consumption levels of Colombia, Ecuador, and Peru. Paraguay stands out among regional averages at 42.%, the highest share of residential consumption.
46 VMME, Balance Energético Nacional 2019. 47 “Access to electricity (% of population) – Paraguay,” The World Bank: Data, World Bank, IEA, and the Energy Sector
Management Assistance Program, 2019, https://data.worldbank.org/indicator/EG.ELC.ACCS.ZS?locations=PY. 48 VMME, Balance Energético Nacional 2019. 49 VMME, Balance Energético Nacional 2019.
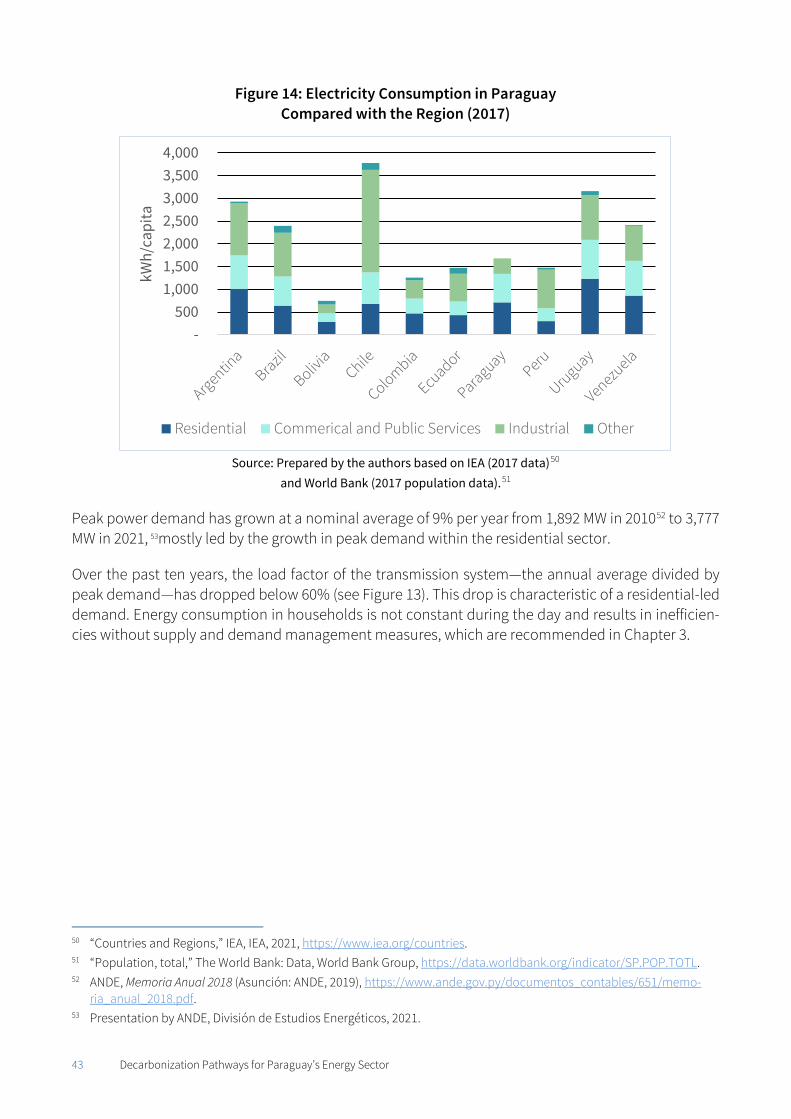
43 Decarbonization Pathways for Paraguay’s Energy Sector
Figure 14: Electricity Consumption in Paraguay Compared with the Region (2017)
Source: Prepared by the authors based on IEA (2017 data)50
and World Bank (2017 population data).51
Peak power demand has grown at a nominal average of 9% per year from 1,892 MW in 201052 to 3,777 MW in 2021, 53mostly led by the growth in peak demand within the residential sector.
Over the past ten years, the load factor of the transmission system—the annual average divided by peak demand—has dropped below 60% (see Figure 13). This drop is characteristic of a residential-led demand. Energy consumption in households is not constant during the day and results in inefficien-cies without supply and demand management measures, which are recommended in Chapter 3.
50 “Countries and Regions,” IEA, IEA, 2021, https://www.iea.org/countries. 51 “Population, total,” The World Bank: Data, World Bank Group, https://data.worldbank.org/indicator/SP.POP.TOTL. 52 ANDE, Memoria Anual 2018 (Asunción: ANDE, 2019), https://www.ande.gov.py/documentos_contables/651/memo-
ria_anual_2018.pdf. 53 Presentation by ANDE, División de Estudios Energéticos, 2021.
- 500
1,000 1,500 2,000 2,500 3,000 3,500 4,000
kWh/
capi
ta
Residential Commerical and Public Services Industrial Other
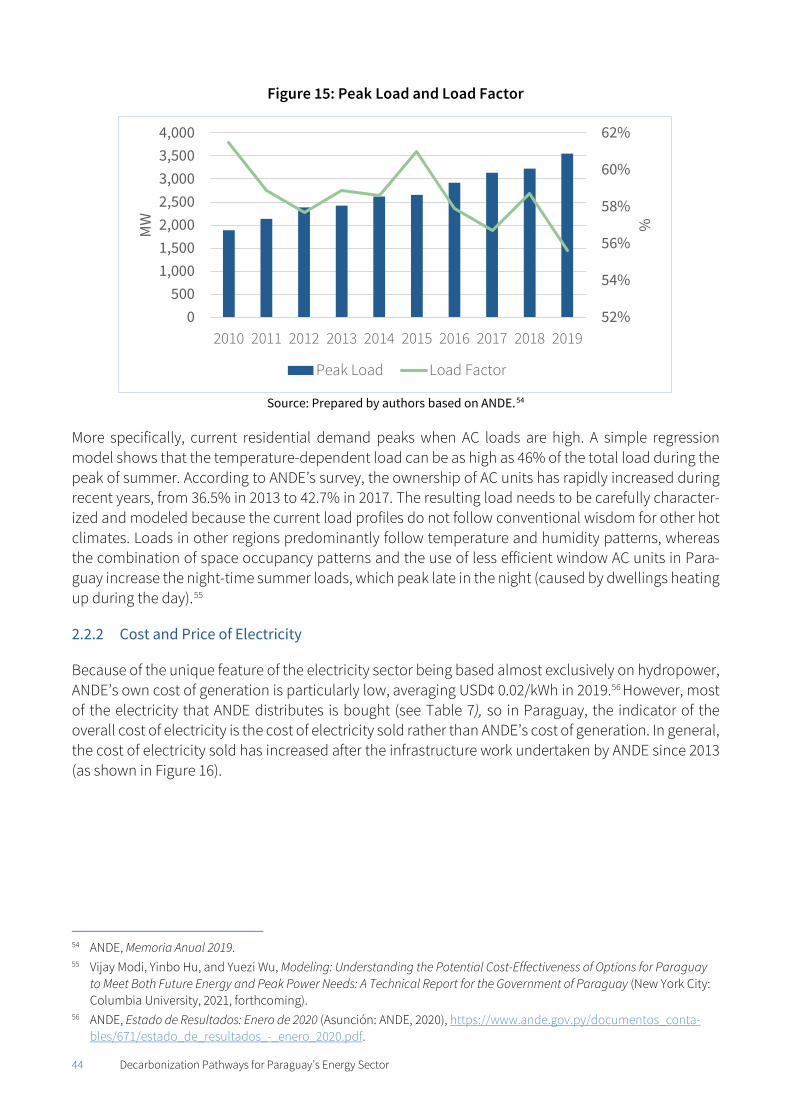
44 Decarbonization Pathways for Paraguay’s Energy Sector
Figure 15: Peak Load and Load Factor
Source: Prepared by authors based on ANDE.54
More specifically, current residential demand peaks when AC loads are high. A simple regression model shows that the temperature-dependent load can be as high as 46% of the total load during the peak of summer. According to ANDE’s survey, the ownership of AC units has rapidly increased during recent years, from 36.5% in 2013 to 42.7% in 2017. The resulting load needs to be carefully character-ized and modeled because the current load profiles do not follow conventional wisdom for other hot climates. Loads in other regions predominantly follow temperature and humidity patterns, whereas the combination of space occupancy patterns and the use of less efficient window AC units in Para-guay increase the night-time summer loads, which peak late in the night (caused by dwellings heating up during the day).55
2.2.2 Cost and Price of Electricity
Because of the unique feature of the electricity sector being based almost exclusively on hydropower, ANDE’s own cost of generation is particularly low, averaging USD¢ 0.02/kWh in 2019.56 However, most of the electricity that ANDE distributes is bought (see Table 7), so in Paraguay, the indicator of the overall cost of electricity is the cost of electricity sold rather than ANDE’s cost of generation. In general, the cost of electricity sold has increased after the infrastructure work undertaken by ANDE since 2013 (as shown in Figure 16).
54 ANDE, Memoria Anual 2019. 55 Vijay Modi, Yinbo Hu, and Yuezi Wu, Modeling: Understanding the Potential Cost-Effectiveness of Options for Paraguay
to Meet Both Future Energy and Peak Power Needs: A Technical Report for the Government of Paraguay (New York City: Columbia University, 2021, forthcoming).
56 ANDE, Estado de Resultados: Enero de 2020 (Asunción: ANDE, 2020), https://www.ande.gov.py/documentos_conta-bles/671/estado_de_resultados_-_enero_2020.pdf.
52%
54%
56%
58%
60%
62%
0500
1,0001,5002,0002,5003,0003,5004,000
2010 2011 2012 2013 2014 2015 2016 2017 2018 2019
%MW
Peak Load Load Factor
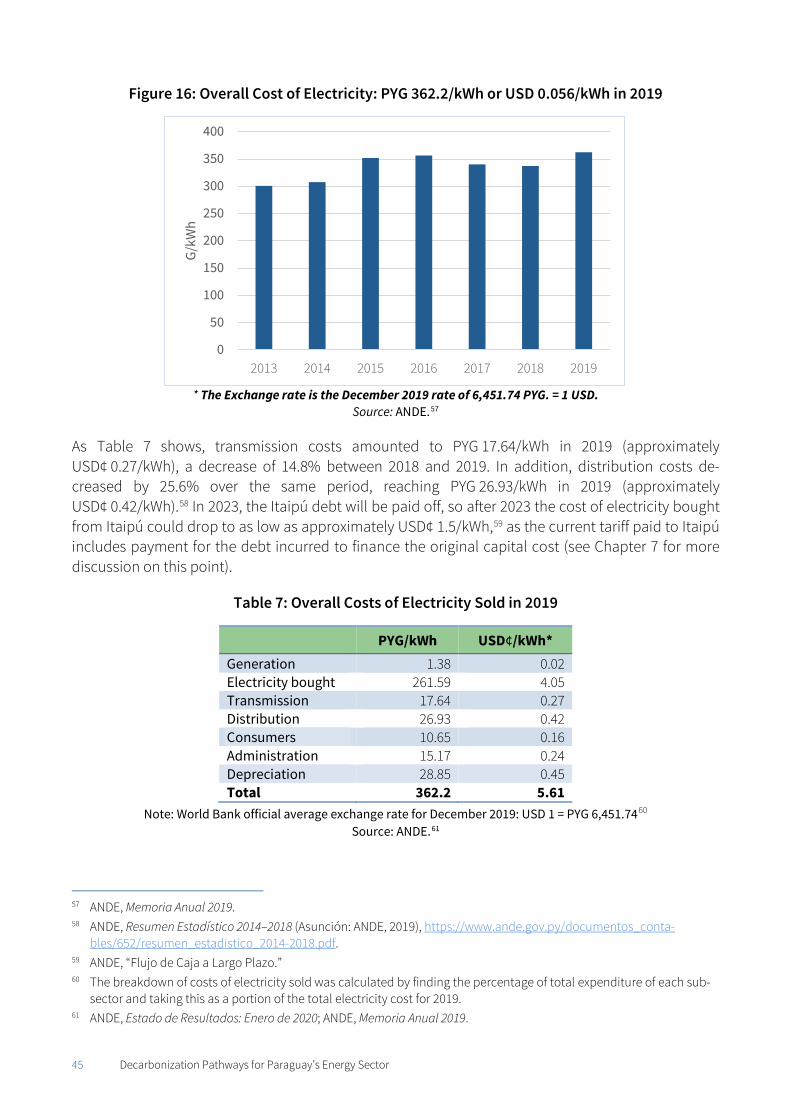
45 Decarbonization Pathways for Paraguay’s Energy Sector
Figure 16: Overall Cost of Electricity: PYG 362.2/kWh or USD 0.056/kWh in 2019
* The Exchange rate is the December 2019 rate of 6,451.74 PYG. = 1 USD.
Source: ANDE.57
As Table 7 shows, transmission costs amounted to PYG 17.64/kWh in 2019 (approximately USD¢ 0.27/kWh), a decrease of 14.8% between 2018 and 2019. In addition, distribution costs de-creased by 25.6% over the same period, reaching PYG 26.93/kWh in 2019 (approximately USD¢ 0.42/kWh).58 In 2023, the Itaipú debt will be paid off, so after 2023 the cost of electricity bought from Itaipú could drop to as low as approximately USD¢ 1.5/kWh,59 as the current tariff paid to Itaipú includes payment for the debt incurred to finance the original capital cost (see Chapter 7 for more discussion on this point).
Table 7: Overall Costs of Electricity Sold in 2019
PYG/kWh USD¢/kWh* Generation 1.38 0.02 Electricity bought 261.59 4.05 Transmission 17.64 0.27 Distribution 26.93 0.42 Consumers 10.65 0.16 Administration 15.17 0.24 Depreciation 28.85 0.45 Total 362.2 5.61
Note: World Bank official average exchange rate for December 2019: USD 1 = PYG 6,451.7460 Source: ANDE.61
57 ANDE, Memoria Anual 2019. 58 ANDE, Resumen Estadístico 2014–2018 (Asunción: ANDE, 2019), https://www.ande.gov.py/documentos_conta-
bles/652/resumen_estadistico_2014-2018.pdf. 59 ANDE, “Flujo de Caja a Largo Plazo.” 60 The breakdown of costs of electricity sold was calculated by finding the percentage of total expenditure of each sub-
sector and taking this as a portion of the total electricity cost for 2019. 61 ANDE, Estado de Resultados: Enero de 2020; ANDE, Memoria Anual 2019.
0
50
100
150
200
250
300
350
400
2013 2014 2015 2016 2017 2018 2019
G/kW
h
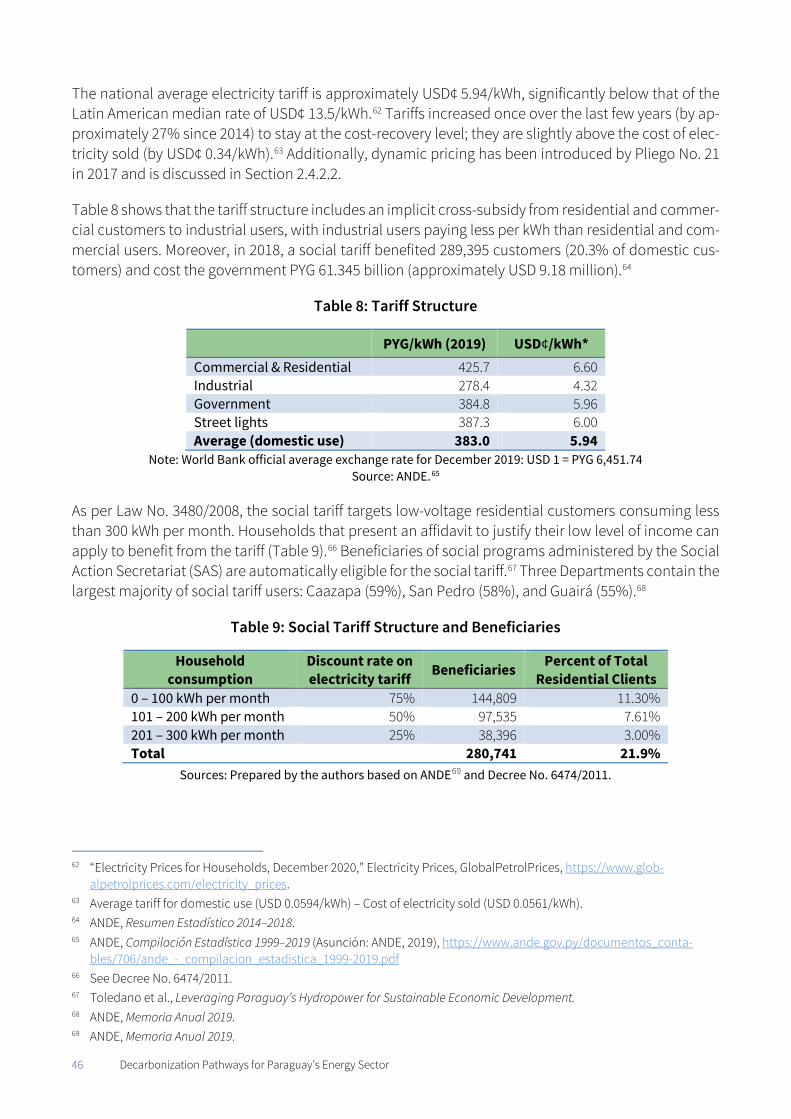
46 Decarbonization Pathways for Paraguay’s Energy Sector
The national average electricity tariff is approximately USD¢ 5.94/kWh, significantly below that of the Latin American median rate of USD¢ 13.5/kWh.62 Tariffs increased once over the last few years (by ap-proximately 27% since 2014) to stay at the cost-recovery level; they are slightly above the cost of elec-tricity sold (by USD¢ 0.34/kWh).63 Additionally, dynamic pricing has been introduced by Pliego No. 21 in 2017 and is discussed in Section 2.4.2.2.
Table 8 shows that the tariff structure includes an implicit cross-subsidy from residential and commer-cial customers to industrial users, with industrial users paying less per kWh than residential and com-mercial users. Moreover, in 2018, a social tariff benefited 289,395 customers (20.3% of domestic cus-tomers) and cost the government PYG 61.345 billion (approximately USD 9.18 million).64
Table 8: Tariff Structure
PYG/kWh (2019) USD¢/kWh* Commercial & Residential 425.7 6.60 Industrial 278.4 4.32 Government 384.8 5.96 Street lights 387.3 6.00 Average (domestic use) 383.0 5.94
Note: World Bank official average exchange rate for December 2019: USD 1 = PYG 6,451.74 Source: ANDE.65
As per Law No. 3480/2008, the social tariff targets low-voltage residential customers consuming less than 300 kWh per month. Households that present an affidavit to justify their low level of income can apply to benefit from the tariff (Table 9).66 Beneficiaries of social programs administered by the Social Action Secretariat (SAS) are automatically eligible for the social tariff.67 Three Departments contain the largest majority of social tariff users: Caazapa (59%), San Pedro (58%), and Guairá (55%).68
Table 9: Social Tariff Structure and Beneficiaries
Household consumption
Discount rate on electricity tariff Beneficiaries Percent of Total
Residential Clients 0 – 100 kWh per month 75% 144,809 11.30% 101 – 200 kWh per month 50% 97,535 7.61% 201 – 300 kWh per month 25% 38,396 3.00% Total 280,741 21.9%
Sources: Prepared by the authors based on ANDE69 and Decree No. 6474/2011.
62 “Electricity Prices for Households, December 2020,” Electricity Prices, GlobalPetrolPrices, https://www.glob-
alpetrolprices.com/electricity_prices. 63 Average tariff for domestic use (USD 0.0594/kWh) – Cost of electricity sold (USD 0.0561/kWh). 64 ANDE, Resumen Estadístico 2014–2018. 65 ANDE, Compilación Estadística 1999–2019 (Asunción: ANDE, 2019), https://www.ande.gov.py/documentos_conta-
bles/706/ande_-_compilacion_estadistica_1999-2019.pdf 66 See Decree No. 6474/2011. 67 Toledano et al., Leveraging Paraguay’s Hydropower for Sustainable Economic Development. 68 ANDE, Memoria Anual 2019. 69 ANDE, Memoria Anual 2019.
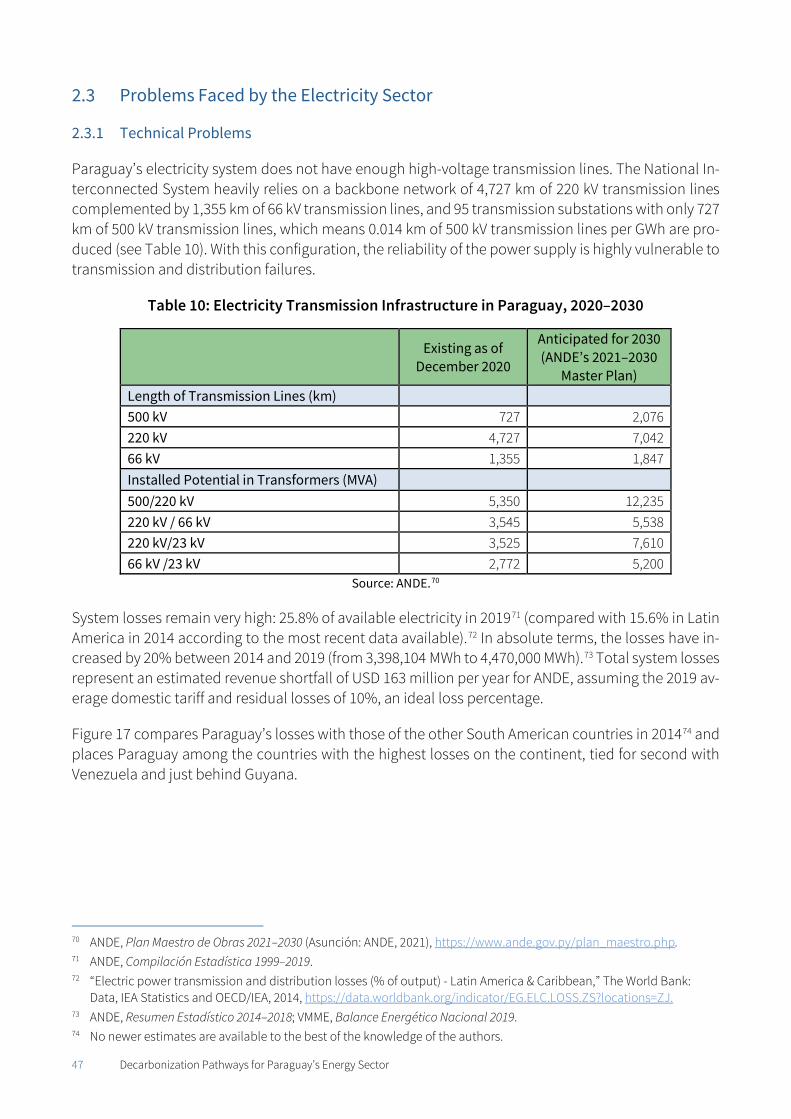
47 Decarbonization Pathways for Paraguay’s Energy Sector
Problems Faced by the Electricity Sector
2.3.1 Technical Problems
Paraguay’s electricity system does not have enough high-voltage transmission lines. The National In-terconnected System heavily relies on a backbone network of 4,727 km of 220 kV transmission lines complemented by 1,355 km of 66 kV transmission lines, and 95 transmission substations with only 727 km of 500 kV transmission lines, which means 0.014 km of 500 kV transmission lines per GWh are pro-duced (see Table 10). With this configuration, the reliability of the power supply is highly vulnerable to transmission and distribution failures.
Table 10: Electricity Transmission Infrastructure in Paraguay, 2020–2030
Existing as of December 2020
Anticipated for 2030 (ANDE’s 2021–2030
Master Plan) Length of Transmission Lines (km)
500 kV 727 2,076 220 kV 4,727 7,042 66 kV 1,355 1,847 Installed Potential in Transformers (MVA)
500/220 kV 5,350 12,235 220 kV / 66 kV 3,545 5,538 220 kV/23 kV 3,525 7,610 66 kV /23 kV 2,772 5,200
Source: ANDE.70
System losses remain very high: 25.8% of available electricity in 201971 (compared with 15.6% in Latin America in 2014 according to the most recent data available).72 In absolute terms, the losses have in-creased by 20% between 2014 and 2019 (from 3,398,104 MWh to 4,470,000 MWh).73 Total system losses represent an estimated revenue shortfall of USD 163 million per year for ANDE, assuming the 2019 av-erage domestic tariff and residual losses of 10%, an ideal loss percentage.
Figure 17 compares Paraguay’s losses with those of the other South American countries in 201474 and places Paraguay among the countries with the highest losses on the continent, tied for second with Venezuela and just behind Guyana.
70 ANDE, Plan Maestro de Obras 2021–2030 (Asunción: ANDE, 2021), https://www.ande.gov.py/plan_maestro.php. 71 ANDE, Compilación Estadística 1999–2019. 72 “Electric power transmission and distribution losses (% of output) - Latin America & Caribbean,” The World Bank:
Data, IEA Statistics and OECD/IEA, 2014, https://data.worldbank.org/indicator/EG.ELC.LOSS.ZS?locations=ZJ. 73 ANDE, Resumen Estadístico 2014–2018; VMME, Balance Energético Nacional 2019. 74 No newer estimates are available to the best of the knowledge of the authors.
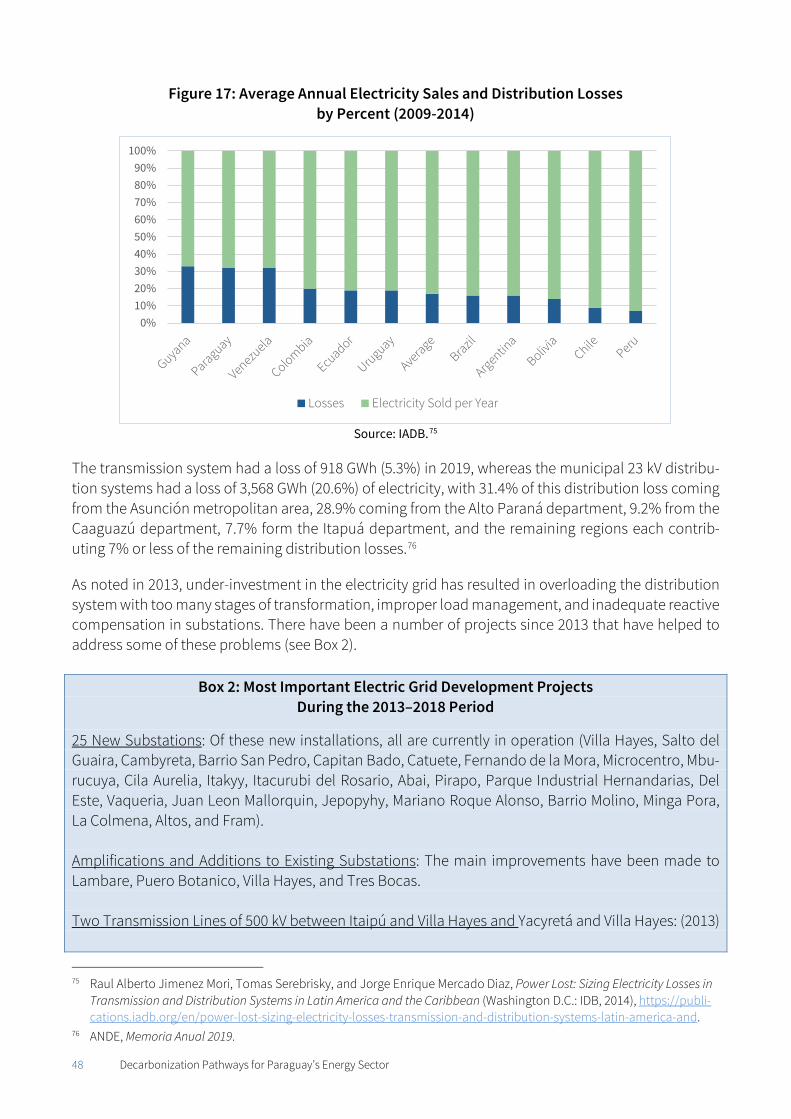
48 Decarbonization Pathways for Paraguay’s Energy Sector
Figure 17: Average Annual Electricity Sales and Distribution Losses by Percent (2009-2014)
Source: IADB.75
The transmission system had a loss of 918 GWh (5.3%) in 2019, whereas the municipal 23 kV distribu-tion systems had a loss of 3,568 GWh (20.6%) of electricity, with 31.4% of this distribution loss coming from the Asunción metropolitan area, 28.9% coming from the Alto Paraná department, 9.2% from the Caaguazú department, 7.7% form the Itapuá department, and the remaining regions each contrib-uting 7% or less of the remaining distribution losses.76
As noted in 2013, under-investment in the electricity grid has resulted in overloading the distribution system with too many stages of transformation, improper load management, and inadequate reactive compensation in substations. There have been a number of projects since 2013 that have helped to address some of these problems (see Box 2).
Box 2: Most Important Electric Grid Development Projects During the 2013–2018 Period
25 New Substations: Of these new installations, all are currently in operation (Villa Hayes, Salto del Guaira, Cambyreta, Barrio San Pedro, Capitan Bado, Catuete, Fernando de la Mora, Microcentro, Mbu-rucuya, Cila Aurelia, Itakyy, Itacurubi del Rosario, Abai, Pirapo, Parque Industrial Hernandarias, Del Este, Vaqueria, Juan Leon Mallorquin, Jepopyhy, Mariano Roque Alonso, Barrio Molino, Minga Pora, La Colmena, Altos, and Fram). Amplifications and Additions to Existing Substations: The main improvements have been made to Lambare, Puero Botanico, Villa Hayes, and Tres Bocas. Two Transmission Lines of 500 kV between Itaipú and Villa Hayes and Yacyretá and Villa Hayes: (2013)
75 Raul Alberto Jimenez Mori, Tomas Serebrisky, and Jorge Enrique Mercado Diaz, Power Lost: Sizing Electricity Losses in
Transmission and Distribution Systems in Latin America and the Caribbean (Washington D.C.: IDB, 2014), https://publi-cations.iadb.org/en/power-lost-sizing-electricity-losses-transmission-and-distribution-systems-latin-america-and.
76 ANDE, Memoria Anual 2019.
0%10%20%30%40%50%60%70%80%90%
100%
Losses Electricity Sold per Year
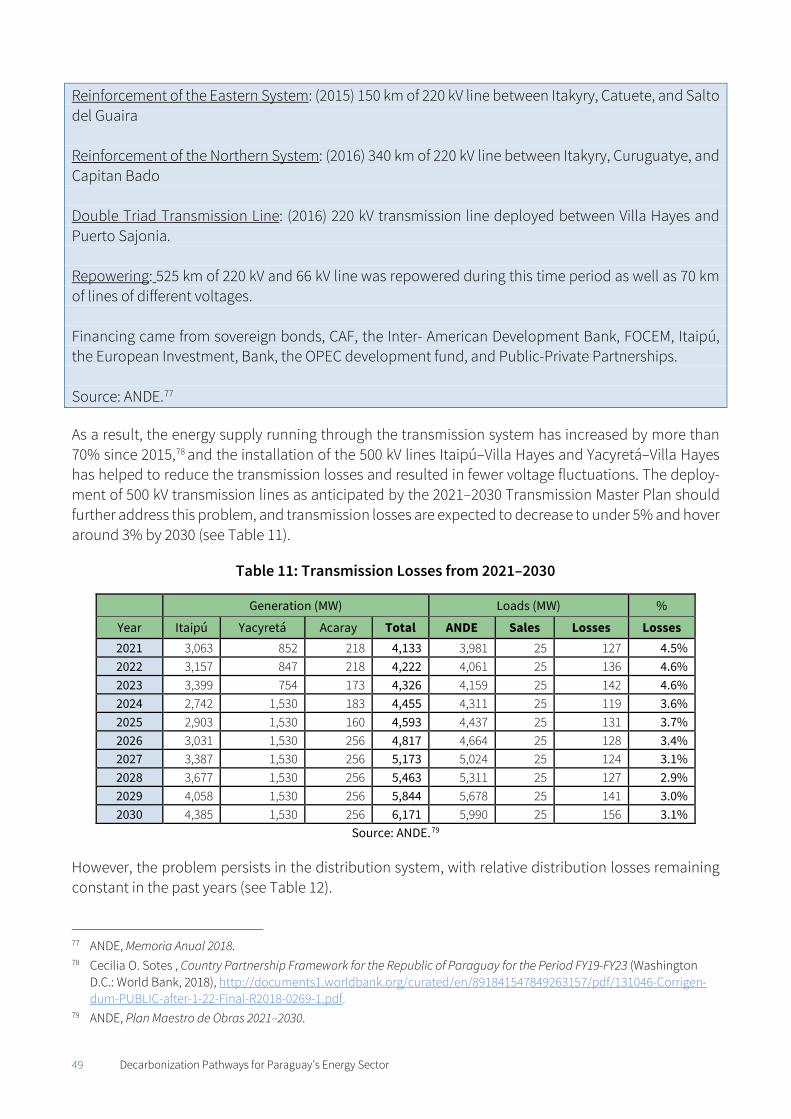
49 Decarbonization Pathways for Paraguay’s Energy Sector
Reinforcement of the Eastern System: (2015) 150 km of 220 kV line between Itakyry, Catuete, and Salto del Guaira Reinforcement of the Northern System: (2016) 340 km of 220 kV line between Itakyry, Curuguatye, and Capitan Bado Double Triad Transmission Line: (2016) 220 kV transmission line deployed between Villa Hayes and Puerto Sajonia. Repowering: 525 km of 220 kV and 66 kV line was repowered during this time period as well as 70 km of lines of different voltages. Financing came from sovereign bonds, CAF, the Inter- American Development Bank, FOCEM, Itaipú, the European Investment, Bank, the OPEC development fund, and Public-Private Partnerships. Source: ANDE.77
As a result, the energy supply running through the transmission system has increased by more than 70% since 2015,78 and the installation of the 500 kV lines Itaipú–Villa Hayes and Yacyretá–Villa Hayes has helped to reduce the transmission losses and resulted in fewer voltage fluctuations. The deploy-ment of 500 kV transmission lines as anticipated by the 2021–2030 Transmission Master Plan should further address this problem, and transmission losses are expected to decrease to under 5% and hover around 3% by 2030 (see Table 11).
Table 11: Transmission Losses from 2021–2030
Generation (MW) Loads (MW) %
Year Itaipú Yacyretá Acaray Total ANDE Sales Losses Losses 2021 3,063 852 218 4,133 3,981 25 127 4.5% 2022 3,157 847 218 4,222 4,061 25 136 4.6% 2023 3,399 754 173 4,326 4,159 25 142 4.6% 2024 2,742 1,530 183 4,455 4,311 25 119 3.6% 2025 2,903 1,530 160 4,593 4,437 25 131 3.7% 2026 3,031 1,530 256 4,817 4,664 25 128 3.4% 2027 3,387 1,530 256 5,173 5,024 25 124 3.1% 2028 3,677 1,530 256 5,463 5,311 25 127 2.9% 2029 4,058 1,530 256 5,844 5,678 25 141 3.0% 2030 4,385 1,530 256 6,171 5,990 25 156 3.1%
Source: ANDE.79
However, the problem persists in the distribution system, with relative distribution losses remaining constant in the past years (see Table 12).
77 ANDE, Memoria Anual 2018. 78 Cecilia O. Sotes , Country Partnership Framework for the Republic of Paraguay for the Period FY19-FY23 (Washington
D.C.: World Bank, 2018), http://documents1.worldbank.org/curated/en/891841547849263157/pdf/131046-Corrigen-dum-PUBLIC-after-1-22-Final-R2018-0269-1.pdf.
79 ANDE, Plan Maestro de Obras 2021–2030.
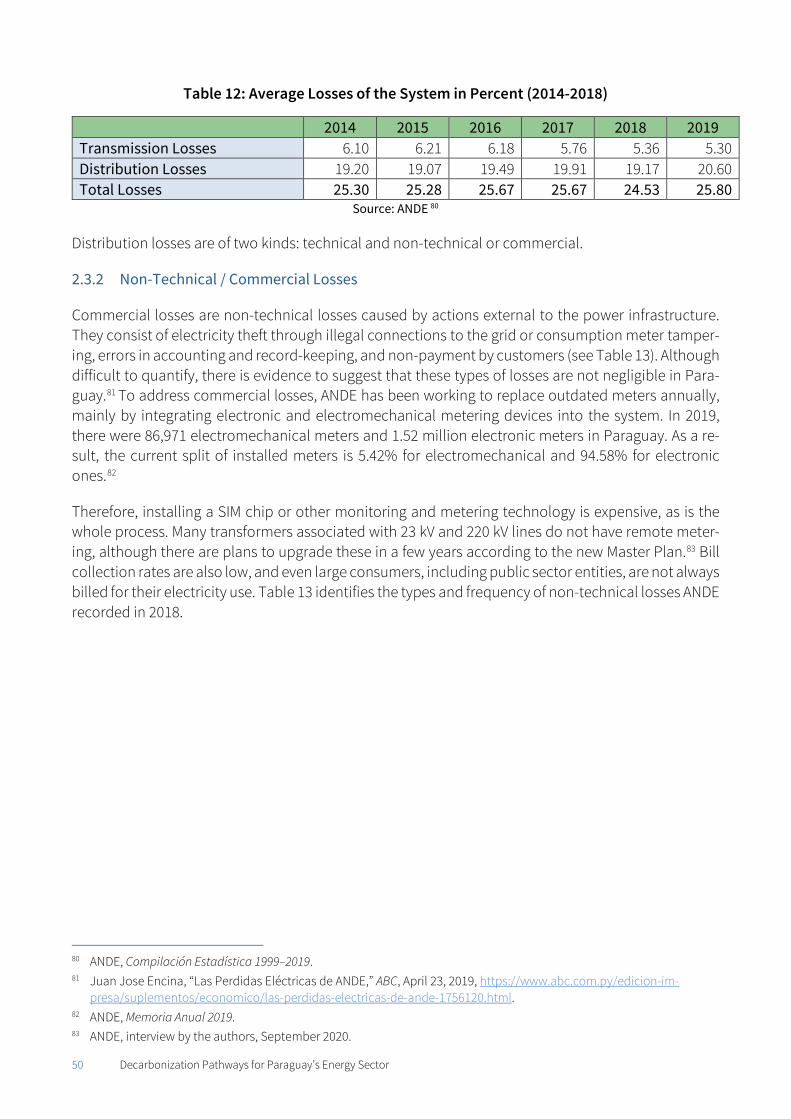
50 Decarbonization Pathways for Paraguay’s Energy Sector
Table 12: Average Losses of the System in Percent (2014-2018)
2014 2015 2016 2017 2018 2019 Transmission Losses 6.10 6.21 6.18 5.76 5.36 5.30 Distribution Losses 19.20 19.07 19.49 19.91 19.17 20.60 Total Losses 25.30 25.28 25.67 25.67 24.53 25.80
Source: ANDE 80
Distribution losses are of two kinds: technical and non-technical or commercial.
2.3.2 Non-Technical / Commercial Losses
Commercial losses are non-technical losses caused by actions external to the power infrastructure. They consist of electricity theft through illegal connections to the grid or consumption meter tamper-ing, errors in accounting and record-keeping, and non-payment by customers (see Table 13). Although difficult to quantify, there is evidence to suggest that these types of losses are not negligible in Para-guay.81 To address commercial losses, ANDE has been working to replace outdated meters annually, mainly by integrating electronic and electromechanical metering devices into the system. In 2019, there were 86,971 electromechanical meters and 1.52 million electronic meters in Paraguay. As a re-sult, the current split of installed meters is 5.42% for electromechanical and 94.58% for electronic ones.82
Therefore, installing a SIM chip or other monitoring and metering technology is expensive, as is the whole process. Many transformers associated with 23 kV and 220 kV lines do not have remote meter-ing, although there are plans to upgrade these in a few years according to the new Master Plan.83 Bill collection rates are also low, and even large consumers, including public sector entities, are not always billed for their electricity use. Table 13 identifies the types and frequency of non-technical losses ANDE recorded in 2018.
80 ANDE, Compilación Estadística 1999–2019. 81 Juan Jose Encina, “Las Perdidas Eléctricas de ANDE,” ABC, April 23, 2019, https://www.abc.com.py/edicion-im-
presa/suplementos/economico/las-perdidas-electricas-de-ande-1756120.html. 82 ANDE, Memoria Anual 2019. 83 ANDE, interview by the authors, September 2020.
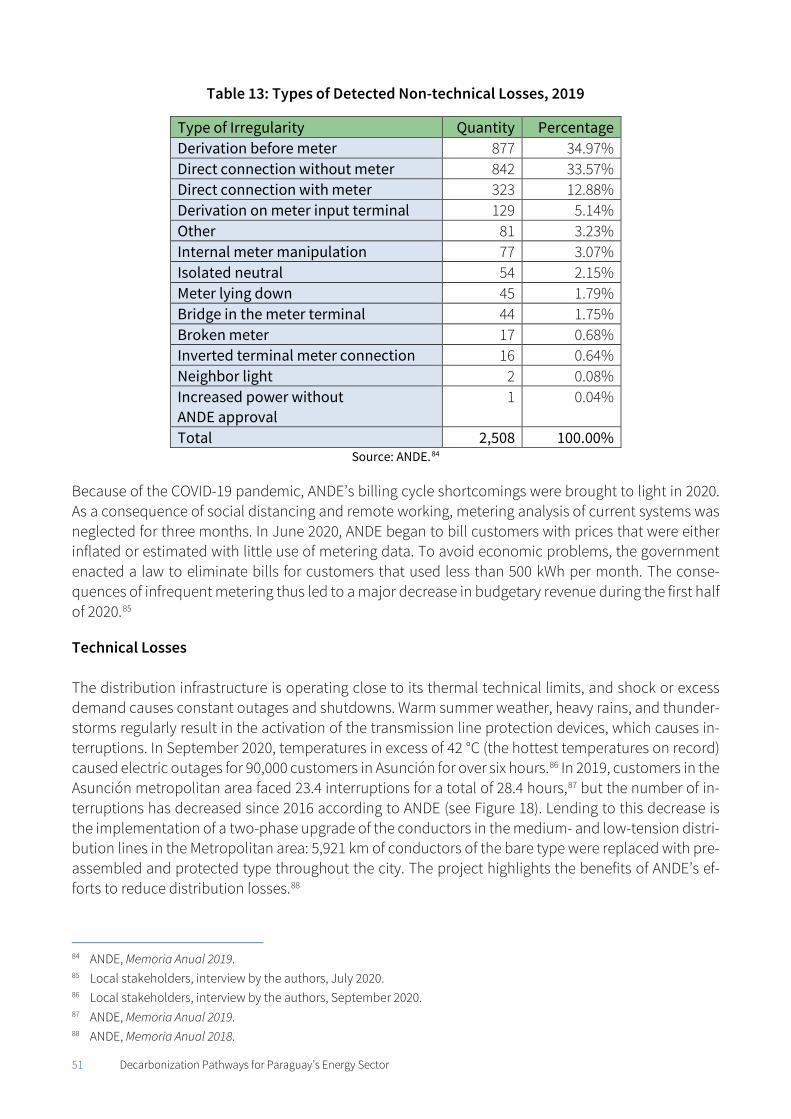
51 Decarbonization Pathways for Paraguay’s Energy Sector
Table 13: Types of Detected Non-technical Losses, 2019
Type of Irregularity Quantity Percentage Derivation before meter 877 34.97% Direct connection without meter 842 33.57% Direct connection with meter 323 12.88% Derivation on meter input terminal 129 5.14% Other 81 3.23% Internal meter manipulation 77 3.07% Isolated neutral 54 2.15% Meter lying down 45 1.79% Bridge in the meter terminal 44 1.75% Broken meter 17 0.68% Inverted terminal meter connection 16 0.64% Neighbor light 2 0.08% Increased power without ANDE approval
1 0.04%
Total 2,508 100.00% Source: ANDE.84
Because of the COVID-19 pandemic, ANDE’s billing cycle shortcomings were brought to light in 2020. As a consequence of social distancing and remote working, metering analysis of current systems was neglected for three months. In June 2020, ANDE began to bill customers with prices that were either inflated or estimated with little use of metering data. To avoid economic problems, the government enacted a law to eliminate bills for customers that used less than 500 kWh per month. The conse-quences of infrequent metering thus led to a major decrease in budgetary revenue during the first half of 2020.85
Technical Losses The distribution infrastructure is operating close to its thermal technical limits, and shock or excess demand causes constant outages and shutdowns. Warm summer weather, heavy rains, and thunder-storms regularly result in the activation of the transmission line protection devices, which causes in-terruptions. In September 2020, temperatures in excess of 42 °C (the hottest temperatures on record) caused electric outages for 90,000 customers in Asunción for over six hours.86 In 2019, customers in the Asunción metropolitan area faced 23.4 interruptions for a total of 28.4 hours,87 but the number of in-terruptions has decreased since 2016 according to ANDE (see Figure 18). Lending to this decrease is the implementation of a two-phase upgrade of the conductors in the medium- and low-tension distri-bution lines in the Metropolitan area: 5,921 km of conductors of the bare type were replaced with pre-assembled and protected type throughout the city. The project highlights the benefits of ANDE’s ef-forts to reduce distribution losses.88
84 ANDE, Memoria Anual 2019. 85 Local stakeholders, interview by the authors, July 2020. 86 Local stakeholders, interview by the authors, September 2020. 87 ANDE, Memoria Anual 2019. 88 ANDE, Memoria Anual 2018.
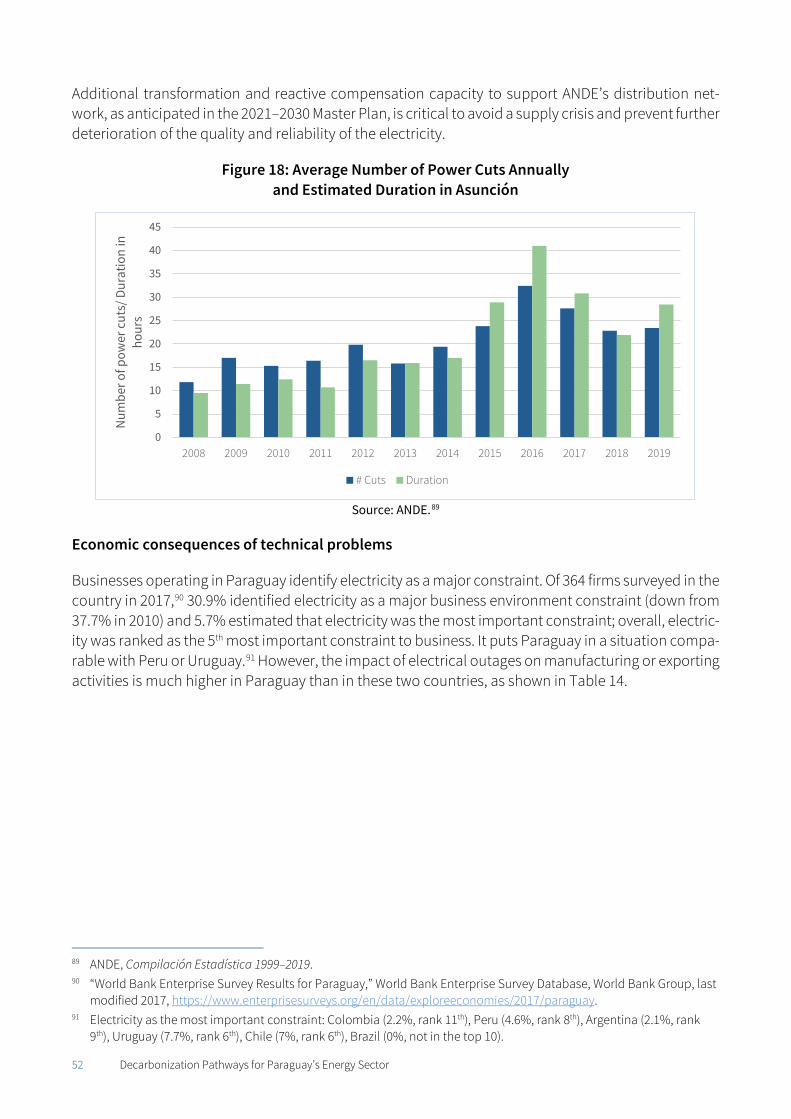
52 Decarbonization Pathways for Paraguay’s Energy Sector
Additional transformation and reactive compensation capacity to support ANDE’s distribution net-work, as anticipated in the 2021–2030 Master Plan, is critical to avoid a supply crisis and prevent further deterioration of the quality and reliability of the electricity.
Figure 18: Average Number of Power Cuts Annually and Estimated Duration in Asunción
Source: ANDE.89
Economic consequences of technical problems
Businesses operating in Paraguay identify electricity as a major constraint. Of 364 firms surveyed in the country in 2017,90 30.9% identified electricity as a major business environment constraint (down from 37.7% in 2010) and 5.7% estimated that electricity was the most important constraint; overall, electric-ity was ranked as the 5th most important constraint to business. It puts Paraguay in a situation compa-rable with Peru or Uruguay.91 However, the impact of electrical outages on manufacturing or exporting activities is much higher in Paraguay than in these two countries, as shown in Table 14.
89 ANDE, Compilación Estadística 1999–2019. 90 “World Bank Enterprise Survey Results for Paraguay,” World Bank Enterprise Survey Database, World Bank Group, last
modified 2017, https://www.enterprisesurveys.org/en/data/exploreeconomies/2017/paraguay. 91 Electricity as the most important constraint: Colombia (2.2%, rank 11th), Peru (4.6%, rank 8th), Argentina (2.1%, rank
9th), Uruguay (7.7%, rank 6th), Chile (7%, rank 6th), Brazil (0%, not in the top 10).
0
5
10
15
20
25
30
35
40
45
2008 2009 2010 2011 2012 2013 2014 2015 2016 2017 2018 2019
Num
ber o
f pow
er c
uts/
Dur
atio
n in
ho
urs
# Cuts Duration
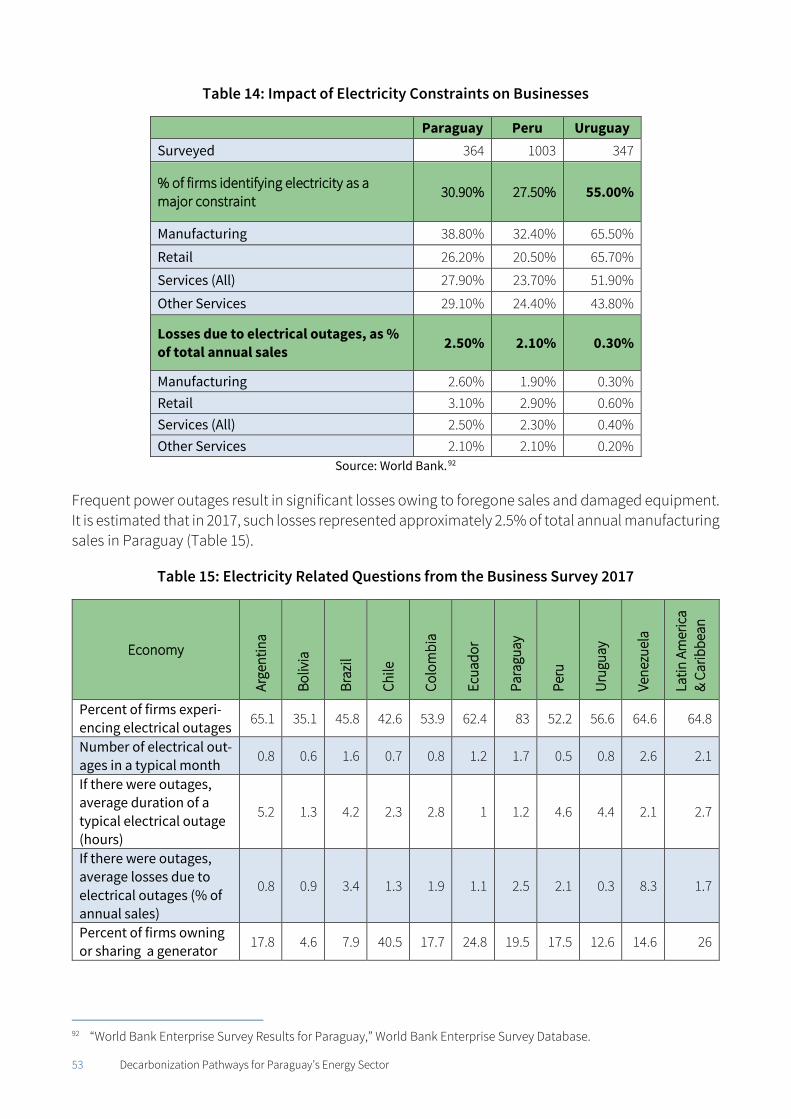
53 Decarbonization Pathways for Paraguay’s Energy Sector
Table 14: Impact of Electricity Constraints on Businesses
Paraguay Peru Uruguay Surveyed 364 1003 347
% of firms identifying electricity as a major constraint
30.90% 27.50% 55.00%
Manufacturing 38.80% 32.40% 65.50%
Retail 26.20% 20.50% 65.70%
Services (All) 27.90% 23.70% 51.90%
Other Services 29.10% 24.40% 43.80%
Losses due to electrical outages, as % of total annual sales 2.50% 2.10% 0.30%
Manufacturing 2.60% 1.90% 0.30% Retail 3.10% 2.90% 0.60% Services (All) 2.50% 2.30% 0.40% Other Services 2.10% 2.10% 0.20%
Source: World Bank.92
Frequent power outages result in significant losses owing to foregone sales and damaged equipment. It is estimated that in 2017, such losses represented approximately 2.5% of total annual manufacturing sales in Paraguay (Table 15).
Table 15: Electricity Related Questions from the Business Survey 2017
Economy
Arge
ntin
a
Boliv
ia
Braz
il
Chile
Colo
mbi
a
Ecua
dor
Para
guay
Peru
Uru
guay
Vene
zuel
a
Latin
Am
eric
a &
Carib
bean
Percent of firms experi-encing electrical outages 65.1 35.1 45.8 42.6 53.9 62.4 83 52.2 56.6 64.6 64.8
Number of electrical out-ages in a typical month
0.8 0.6 1.6 0.7 0.8 1.2 1.7 0.5 0.8 2.6 2.1
If there were outages, average duration of a typical electrical outage (hours)
5.2 1.3 4.2 2.3 2.8 1 1.2 4.6 4.4 2.1 2.7
If there were outages, average losses due to electrical outages (% of annual sales)
0.8 0.9 3.4 1.3 1.9 1.1 2.5 2.1 0.3 8.3 1.7
Percent of firms owning or sharing a generator 17.8 4.6 7.9 40.5 17.7 24.8 19.5 17.5 12.6 14.6 26
92 “World Bank Enterprise Survey Results for Paraguay,” World Bank Enterprise Survey Database.
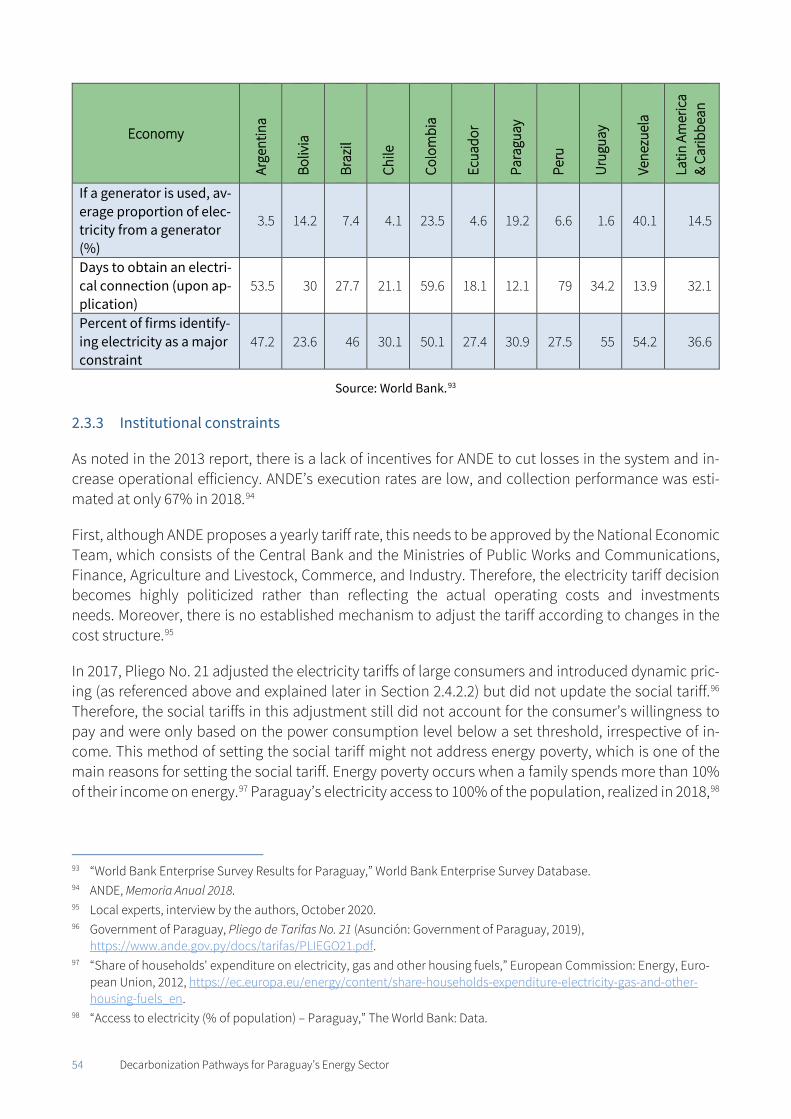
54 Decarbonization Pathways for Paraguay’s Energy Sector
Economy
Arge
ntin
a
Boliv
ia
Braz
il
Chile
Colo
mbi
a
Ecua
dor
Para
guay
Peru
Uru
guay
Vene
zuel
a
Latin
Am
eric
a &
Carib
bean
If a generator is used, av-erage proportion of elec-tricity from a generator (%)
3.5 14.2 7.4 4.1 23.5 4.6 19.2 6.6 1.6 40.1 14.5
Days to obtain an electri-cal connection (upon ap-plication)
53.5 30 27.7 21.1 59.6 18.1 12.1 79 34.2 13.9 32.1
Percent of firms identify-ing electricity as a major constraint
47.2 23.6 46 30.1 50.1 27.4 30.9 27.5 55 54.2 36.6
Source: World Bank.93
2.3.3 Institutional constraints
As noted in the 2013 report, there is a lack of incentives for ANDE to cut losses in the system and in-crease operational efficiency. ANDE’s execution rates are low, and collection performance was esti-mated at only 67% in 2018.94
First, although ANDE proposes a yearly tariff rate, this needs to be approved by the National Economic Team, which consists of the Central Bank and the Ministries of Public Works and Communications, Finance, Agriculture and Livestock, Commerce, and Industry. Therefore, the electricity tariff decision becomes highly politicized rather than reflecting the actual operating costs and investments needs. Moreover, there is no established mechanism to adjust the tariff according to changes in the cost structure.95
In 2017, Pliego No. 21 adjusted the electricity tariffs of large consumers and introduced dynamic pric-ing (as referenced above and explained later in Section 2.4.2.2) but did not update the social tariff.96 Therefore, the social tariffs in this adjustment still did not account for the consumer’s willingness to pay and were only based on the power consumption level below a set threshold, irrespective of in-come. This method of setting the social tariff might not address energy poverty, which is one of the main reasons for setting the social tariff. Energy poverty occurs when a family spends more than 10% of their income on energy.97 Paraguay’s electricity access to 100% of the population, realized in 2018,98
93 “World Bank Enterprise Survey Results for Paraguay,” World Bank Enterprise Survey Database. 94 ANDE, Memoria Anual 2018. 95 Local experts, interview by the authors, October 2020. 96 Government of Paraguay, Pliego de Tarifas No. 21 (Asunción: Government of Paraguay, 2019),
https://www.ande.gov.py/docs/tarifas/PLIEGO21.pdf. 97 “Share of households' expenditure on electricity, gas and other housing fuels,” European Commission: Energy, Euro-
pean Union, 2012, https://ec.europa.eu/energy/content/share-households-expenditure-electricity-gas-and-other-housing-fuels_en.
98 “Access to electricity (% of population) – Paraguay,” The World Bank: Data.
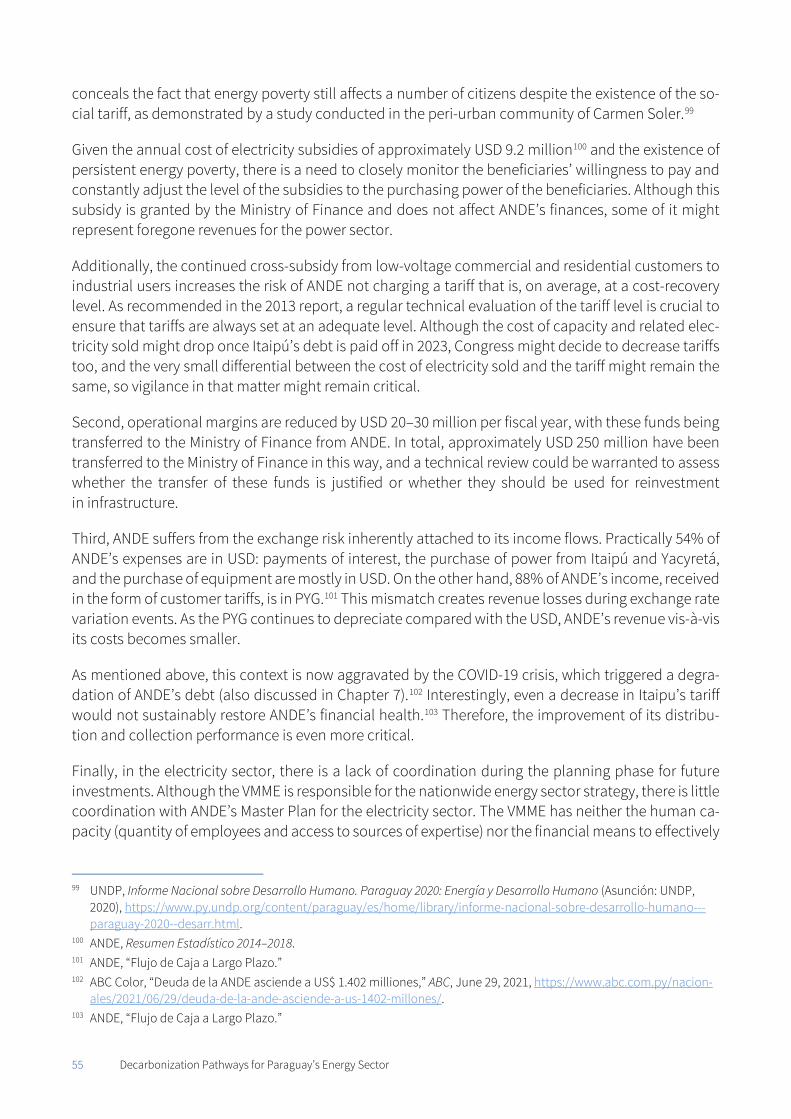
55 Decarbonization Pathways for Paraguay’s Energy Sector
conceals the fact that energy poverty still affects a number of citizens despite the existence of the so-cial tariff, as demonstrated by a study conducted in the peri-urban community of Carmen Soler.99
Given the annual cost of electricity subsidies of approximately USD 9.2 million100 and the existence of persistent energy poverty, there is a need to closely monitor the beneficiaries’ willingness to pay and constantly adjust the level of the subsidies to the purchasing power of the beneficiaries. Although this subsidy is granted by the Ministry of Finance and does not affect ANDE’s finances, some of it might represent foregone revenues for the power sector.
Additionally, the continued cross-subsidy from low-voltage commercial and residential customers to industrial users increases the risk of ANDE not charging a tariff that is, on average, at a cost-recovery level. As recommended in the 2013 report, a regular technical evaluation of the tariff level is crucial to ensure that tariffs are always set at an adequate level. Although the cost of capacity and related elec-tricity sold might drop once Itaipú’s debt is paid off in 2023, Congress might decide to decrease tariffs too, and the very small differential between the cost of electricity sold and the tariff might remain the same, so vigilance in that matter might remain critical.
Second, operational margins are reduced by USD 20–30 million per fiscal year, with these funds being transferred to the Ministry of Finance from ANDE. In total, approximately USD 250 million have been transferred to the Ministry of Finance in this way, and a technical review could be warranted to assess whether the transfer of these funds is justified or whether they should be used for reinvestment in infrastructure.
Third, ANDE suffers from the exchange risk inherently attached to its income flows. Practically 54% of ANDE’s expenses are in USD: payments of interest, the purchase of power from Itaipú and Yacyretá, and the purchase of equipment are mostly in USD. On the other hand, 88% of ANDE’s income, received in the form of customer tariffs, is in PYG.101 This mismatch creates revenue losses during exchange rate variation events. As the PYG continues to depreciate compared with the USD, ANDE’s revenue vis-à-vis its costs becomes smaller.
As mentioned above, this context is now aggravated by the COVID-19 crisis, which triggered a degra-dation of ANDE’s debt (also discussed in Chapter 7).102 Interestingly, even a decrease in Itaipu’s tariff would not sustainably restore ANDE’s financial health.103 Therefore, the improvement of its distribu-tion and collection performance is even more critical.
Finally, in the electricity sector, there is a lack of coordination during the planning phase for future investments. Although the VMME is responsible for the nationwide energy sector strategy, there is little coordination with ANDE’s Master Plan for the electricity sector. The VMME has neither the human ca-pacity (quantity of employees and access to sources of expertise) nor the financial means to effectively
99 UNDP, Informe Nacional sobre Desarrollo Humano. Paraguay 2020: Energía y Desarrollo Humano (Asunción: UNDP,
2020), https://www.py.undp.org/content/paraguay/es/home/library/informe-nacional-sobre-desarrollo-humano---paraguay-2020--desarr.html.
100 ANDE, Resumen Estadístico 2014–2018. 101 ANDE, “Flujo de Caja a Largo Plazo.” 102 ABC Color, “Deuda de la ANDE asciende a US$ 1.402 milliones,” ABC, June 29, 2021, https://www.abc.com.py/nacion-
ales/2021/06/29/deuda-de-la-ande-asciende-a-us-1402-millones/. 103 ANDE, “Flujo de Caja a Largo Plazo.”
56 Decarbonization Pathways for Paraguay’s Energy Sector
conduct its role.104 ANDE’s size (4,914 staff in 2018,105 31% more than in 2011) and political influence grants the company direct access to government executives, thereby bypassing the VMME. The re-quired amounts to finance the planned investments in the master plans have been directly paid out to ANDE and not channeled through the VMME: Law No. 966/1964, “Ley Orgánica de la ANDE,” allows ANDE to manage its own resources without any need to validate its plans with other institutions.106 At the same time, ANDE has not been subjected to external accounting review, so there is little transpar-ency with regards to its balance sheet.
Planned Investments and Energy Strategy
2.4.1 ANDE’s 2021–2040 Master Generation Plan, 2021–2030 Master Transmission and Distribu-tion Plans and 2021- 2025 Master Plan for Information and Telecommunications
ANDE’s Master Plan 2021–2040, ANDE’s official document highlighting specific projects and expansion plans in electricity generation until 2040 and in the electricity grid until 2030, fundamentally focuses on the deployment of generation and transmission works that will allow it to meet the growth of peak demand with a reasonable generation reserve margin (10%) and increase the power supply’s reliabil-ity. In this plan, ANDE assumes an average annual growth rate of demand of 4.88% from 2021-2040 (and 5.9% from 2021 to 2030). For the first time, ANDE has deployed a digitization plan.
The master plan up to 2030 is expected to cost approximately USD 6.3 billion, with USD 1.2 billion for generation,107 USD 3.0 billion for transmission investments, and USD 2.1 billion for distribution.108 The generation investment up to 2040 will cost USD 3.5 billion. Information and Telecommunications work is expected to cost USD 218 million by 2025.
Power Generation Projects
ANDE plans to seize the remaining domestic hydropower potential by adjusting to both large- and small-scale hydropower plants (see Table 16 and Figure 19).109 Currently, only the retrofit of the Acaray plant is funded and being executed with the assistance of a USD 125 million loan from the Inter-Amer-ican Development Bank (IDB).110 With the drastic drop in the cost of solar power in the last five years since the last ANDE Master Plan and a potential 1.11 billion MWh/year of electricity generation from solar, ANDE has pushed forward with a number of plans for solar PV farms and battery storage devel-opment.
104 Cecilia Llamosas, Paul Upham, and Gerardo Blanco, “Multiple Streams, Resistance and Energy Policy Change in Para-
guay (2004–2014),” Energy Research & Social Science 42 (2018), 226–236. 105 ANDE, Memoria Anual 2018. 106 ANDE’s budget that is financed by bonds and loans benefits from the Ministry of Finance’s oversight. 107 ANDE, Plan Maestro de Obras 2021–2030. 108 ANDE, Plan Maestro de Obras 2021–2030. 109 ANDE, Plan Maestro de Obras 2021–2030. 110 IRENA, Aporte a la Contribución Nacionalmente Determinada Mejorada de la República de Paraguay.
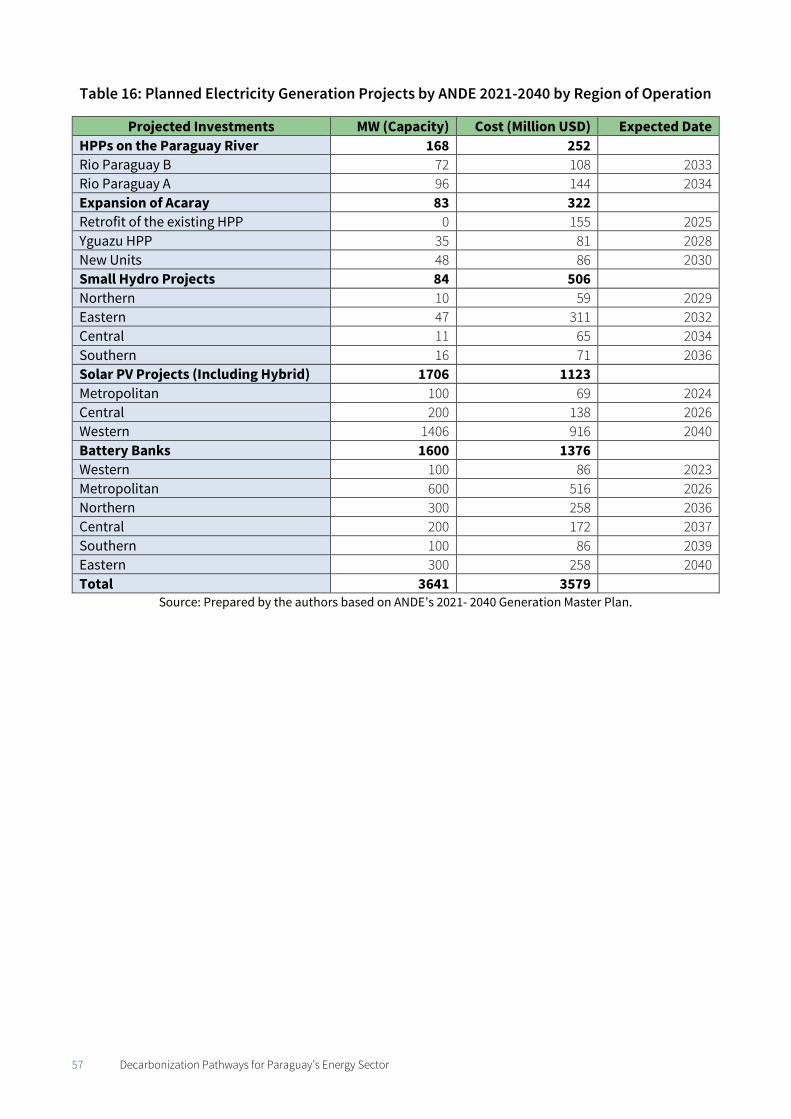
57 Decarbonization Pathways for Paraguay’s Energy Sector
Table 16: Planned Electricity Generation Projects by ANDE 2021-2040 by Region of Operation
Projected Investments MW (Capacity) Cost (Million USD) Expected Date HPPs on the Paraguay River 168 252
Rio Paraguay B 72 108 2033 Rio Paraguay A 96 144 2034 Expansion of Acaray 83 322
Retrofit of the existing HPP 0 155 2025 Yguazu HPP 35 81 2028 New Units 48 86 2030 Small Hydro Projects 84 506
Northern 10 59 2029 Eastern 47 311 2032 Central 11 65 2034 Southern 16 71 2036 Solar PV Projects (Including Hybrid) 1706 1123
Metropolitan 100 69 2024 Central 200 138 2026 Western 1406 916 2040 Battery Banks 1600 1376
Western 100 86 2023 Metropolitan 600 516 2026 Northern 300 258 2036 Central 200 172 2037 Southern 100 86 2039 Eastern 300 258 2040 Total 3641 3579
Source: Prepared by the authors based on ANDE’s 2021- 2040 Generation Master Plan.
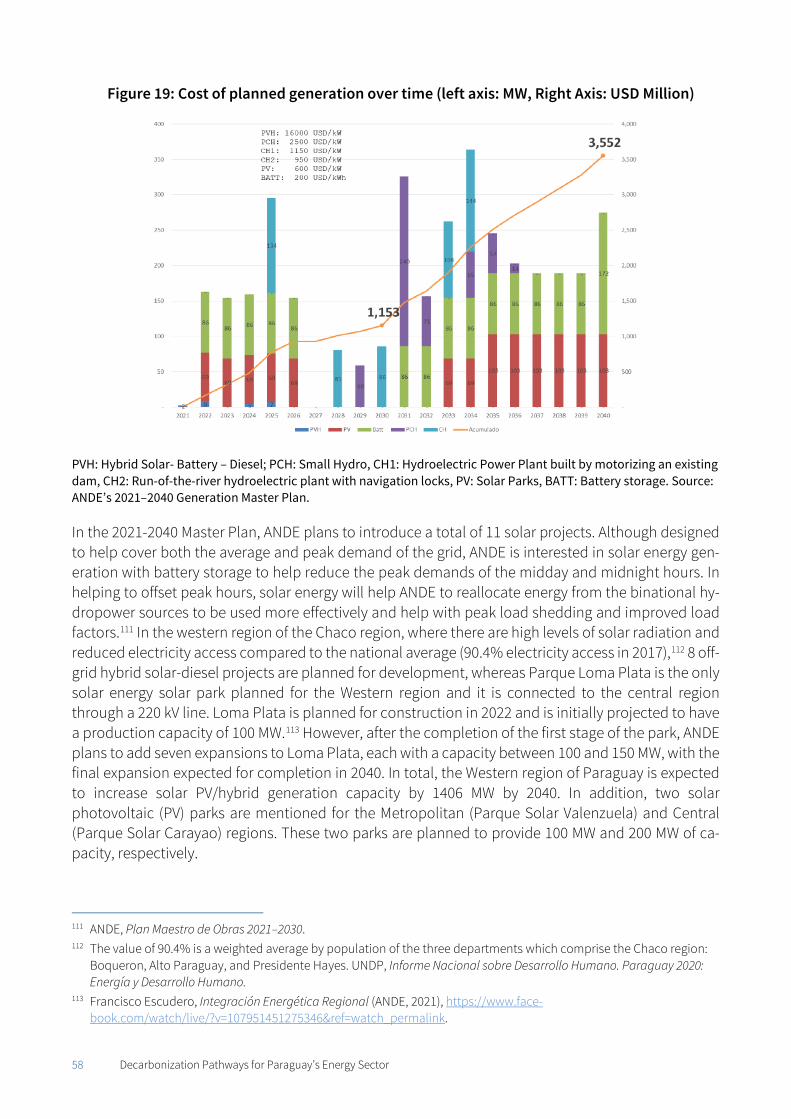
58 Decarbonization Pathways for Paraguay’s Energy Sector
Figure 19: Cost of planned generation over time (left axis: MW, Right Axis: USD Million)
PVH: Hybrid Solar- Battery – Diesel; PCH: Small Hydro, CH1: Hydroelectric Power Plant built by motorizing an existing dam, CH2: Run-of-the-river hydroelectric plant with navigation locks, PV: Solar Parks, BATT: Battery storage. Source: ANDE’s 2021–2040 Generation Master Plan.
In the 2021-2040 Master Plan, ANDE plans to introduce a total of 11 solar projects. Although designed to help cover both the average and peak demand of the grid, ANDE is interested in solar energy gen-eration with battery storage to help reduce the peak demands of the midday and midnight hours. In helping to offset peak hours, solar energy will help ANDE to reallocate energy from the binational hy-dropower sources to be used more effectively and help with peak load shedding and improved load factors.111 In the western region of the Chaco region, where there are high levels of solar radiation and reduced electricity access compared to the national average (90.4% electricity access in 2017),112 8 off-grid hybrid solar-diesel projects are planned for development, whereas Parque Loma Plata is the only solar energy solar park planned for the Western region and it is connected to the central region through a 220 kV line. Loma Plata is planned for construction in 2022 and is initially projected to have a production capacity of 100 MW.113 However, after the completion of the first stage of the park, ANDE plans to add seven expansions to Loma Plata, each with a capacity between 100 and 150 MW, with the final expansion expected for completion in 2040. In total, the Western region of Paraguay is expected to increase solar PV/hybrid generation capacity by 1406 MW by 2040. In addition, two solar photovoltaic (PV) parks are mentioned for the Metropolitan (Parque Solar Valenzuela) and Central (Parque Solar Carayao) regions. These two parks are planned to provide 100 MW and 200 MW of ca-pacity, respectively.
111 ANDE, Plan Maestro de Obras 2021–2030. 112 The value of 90.4% is a weighted average by population of the three departments which comprise the Chaco region:
Boqueron, Alto Paraguay, and Presidente Hayes. UNDP, Informe Nacional sobre Desarrollo Humano. Paraguay 2020: Energía y Desarrollo Humano.
113 Francisco Escudero, Integración Energética Regional (ANDE, 2021), https://www.face-book.com/watch/live/?v=107951451275346&ref=watch_permalink.
59 Decarbonization Pathways for Paraguay’s Energy Sector
Because of public resistance to any energy source other than hydropower114 (further discussed in Sec-tion 2.4.1) and a lack of grid connection, intermittent diesel generation continues to be the principal electricity source in the Western regions, alongside the use of unsustainable fuelwood as an energy source (see Chapter 5). In this context, ANDE’s plan to invest in decentralized solar energy is a welcome development. In many countries, independent power producers (IPP) effectively run decentralized en-ergy. Enabling the participation of IPPs (see discussion on their challenges in Chapter 7) might release public finances and help ANDE concentrate on its most important duty: a well-functioning grid. In ad-dition, the plan remains unclear as to why diesel is included in the hybrid plants and whether and when diesel will be phased out. However, as noted below, ANDE is preparing for the expansion of the grid in the Chaco region, which should ultimately replace these hybrid decentralized systems.
Transmission Infrastructure
Approximately 53% of the new transmission infrastructure will serve the Asunción metropolitan area, and approximately 37% of the investment supports the expansion of the 500 kV network (with the re-mainder for 220 kV and 66 kV).
Six 500 kV transmission line projects are anticipated to be built by 2030. Four lines (8,000 MW) should connect the Itaipú dam to Asunción: a 360-km line between Margen Derecha and Villa Hayes, two 200-km lines between Yguazú and Valenzuela, and a 54-km line between Margen Derecha and Yguazú (for which Congress approved loan funding in 2019).115 Two lines (4,000 MW) are planned to connect Asun-ción with the Yacyretá dam: a 230-km line between Ayolas and Valenzuela and a 255-km line between Emboscada and Horqueta. ANDE is finalizing a joint interconnection between Itaipú and Yacyretá, which will provide a central backbone of transmission infrastructure critical for the optimization of the transmission infrastructure as well as greater flexibility and reliability of the system.
With the inclusion of these more efficient transmission lines, the technical losses of the transmission infrastructure are expected to decrease to 3.1% by 2030.
Moreover, ANDE anticipates the construction of five substations in the Chaco region in or after 2030. In the meantime, the plan includes the development of two 220 kV lines in the Chaco region, although no particulars details have yet been provided.
Distribution Infrastructure
More than 63% of the investment in distribution infrastructure in 2021–2030 will serve the Metropolitan Subsystem. Approximately 38% of the overall investment supports network expansion (new power lines and transformers), whereas approximately 31% will be used to enhance network reliability by strengthening existing lines both above and below ground. Sixty percent of the investment is concen-trated on the first five years of the plan.
The plan does not express ambitious reduction targets for distribution losses. It anticipates that the deployment of 500 kV lines, the strengthening of distribution lines, and the development of decentralized small-scale hydropower capacity will maintain losses at current levels, even as
114 Local stakeholders, interview by the authors, February 2020. 115 ANDE, Plan Maestro de Obras 2021–2030; local stakeholders, interview by the authors, September 2020.
60 Decarbonization Pathways for Paraguay’s Energy Sector
the amount of electricity passing through the system increases, thereby reducing the percentage of technical losses.116
Information and Communications Technology (ICT) Infrastructure
For the first time, ANDE has included a report dedicated to planning the development of ICT infrastruc-ture. In this report, mapping the years 2021–2025, ANDE identifies three key areas for improvement: 1) Information Technology Systems, 2) Communication Systems, and 3) Control and Automation Sys-tems. In total, ANDE estimates spending USD 218.43 million over the five years.
In the realm of information technology, ANDE is looking to invest USD 130 million over five years to promote the growth of data centers, corporate maintenance, commercial spending, and advanced metering technology. With these tools, ANDE will be able to reduce inefficiencies within ANDE by streamlining client–customer relations and promoting constant data feedback at distribution meters across the grid.
ANDE is also looking to develop communication systems, promoting digital radio, 4G/LTE data service, fiber optic cable improvements, and a greater number of communication terminals throughout the country to support the grid. These improvements are expected to cost USD 38.9 million over five years, with most of the investment taking place by 2023 to accelerate the installation and operation of sys-tem processes.
Supervisory Control and Data Acquisition (SCADA) systems are currently installed and operate at all levels of ANDE from generation to 23 kV distribution lines. In addition, in 2018, ANDE launched the System of Integral Distribution Consumption (SGIDE) in 26 distribution centers throughout Asunción and metropolitan area. Designed to improve the transparency of system operations with clients, this technology, financially supported by CAF, will allow clients to understand the distribution-based op-erations ANDE undertakes in the coming years.117 However, to better monitor and control the Metro-politan Subsystem, ANDE is proposing even greater integration of this and other technologies to pro-mote automation of the grid. To date, ANDE is in talks to develop a SCADA pilot study in Asunción. The upgrade to the current system in the city will cost USD 100 million and involve a pilot program. Should Congress approve to expand the pilot, ANDE would implement the technology throughout the coun-try.118 Aside from SCADA, ANDE is also pursuing the development of real-time operational spending technology, which will help monitor costs and spending of maintenance operations as well as cyber-security to promote the defense of operational technologies from any potential threats. The antici-pated cost for automation is USD 49.5 million over the five years.
General comment on the omissions of the Master Plan The new master plan sets an overall long-term vision, a medium-term strategy with clear goals, and a short-term, costed action plan with financing options attached to it. However, it lacks sufficient con-sideration of the challenges of further electrification of energy end-uses such as the building, trans-portation, and industry sectors as well as the critical need to improve energy efficiency on the supply and demand side to slow deployment of the required investment and improve reliability. Clear targets
116 ANDE, Plan Maestro de Obras 2021–2030. 117 “ANDE realizó el lanzamiento oficial del Sistema de Gestión Integral de Distribución,” Economía Virtual, October 17, 2018, http://economiavirtual.com.py/web/pagina-general.php?codigo=19235. 118 ANDE, interview by the authors, September 2020.
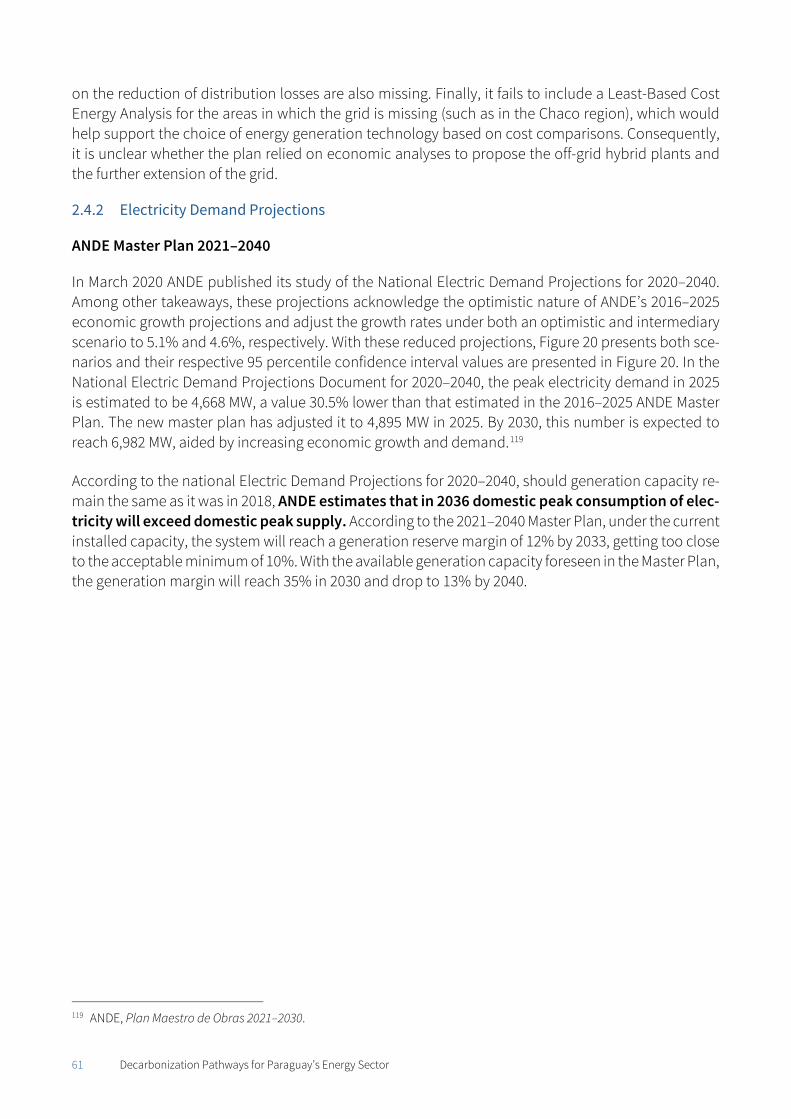
61 Decarbonization Pathways for Paraguay’s Energy Sector
on the reduction of distribution losses are also missing. Finally, it fails to include a Least-Based Cost Energy Analysis for the areas in which the grid is missing (such as in the Chaco region), which would help support the choice of energy generation technology based on cost comparisons. Consequently, it is unclear whether the plan relied on economic analyses to propose the off-grid hybrid plants and the further extension of the grid.
2.4.2 Electricity Demand Projections
ANDE Master Plan 2021–2040
In March 2020 ANDE published its study of the National Electric Demand Projections for 2020–2040. Among other takeaways, these projections acknowledge the optimistic nature of ANDE’s 2016–2025 economic growth projections and adjust the growth rates under both an optimistic and intermediary scenario to 5.1% and 4.6%, respectively. With these reduced projections, Figure 20 presents both sce-narios and their respective 95 percentile confidence interval values are presented in Figure 20. In the National Electric Demand Projections Document for 2020–2040, the peak electricity demand in 2025 is estimated to be 4,668 MW, a value 30.5% lower than that estimated in the 2016–2025 ANDE Master Plan. The new master plan has adjusted it to 4,895 MW in 2025. By 2030, this number is expected to reach 6,982 MW, aided by increasing economic growth and demand.119
According to the national Electric Demand Projections for 2020–2040, should generation capacity re-main the same as it was in 2018, ANDE estimates that in 2036 domestic peak consumption of elec-tricity will exceed domestic peak supply. According to the 2021–2040 Master Plan, under the current installed capacity, the system will reach a generation reserve margin of 12% by 2033, getting too close to the acceptable minimum of 10%. With the available generation capacity foreseen in the Master Plan, the generation margin will reach 35% in 2030 and drop to 13% by 2040.
119 ANDE, Plan Maestro de Obras 2021–2030.
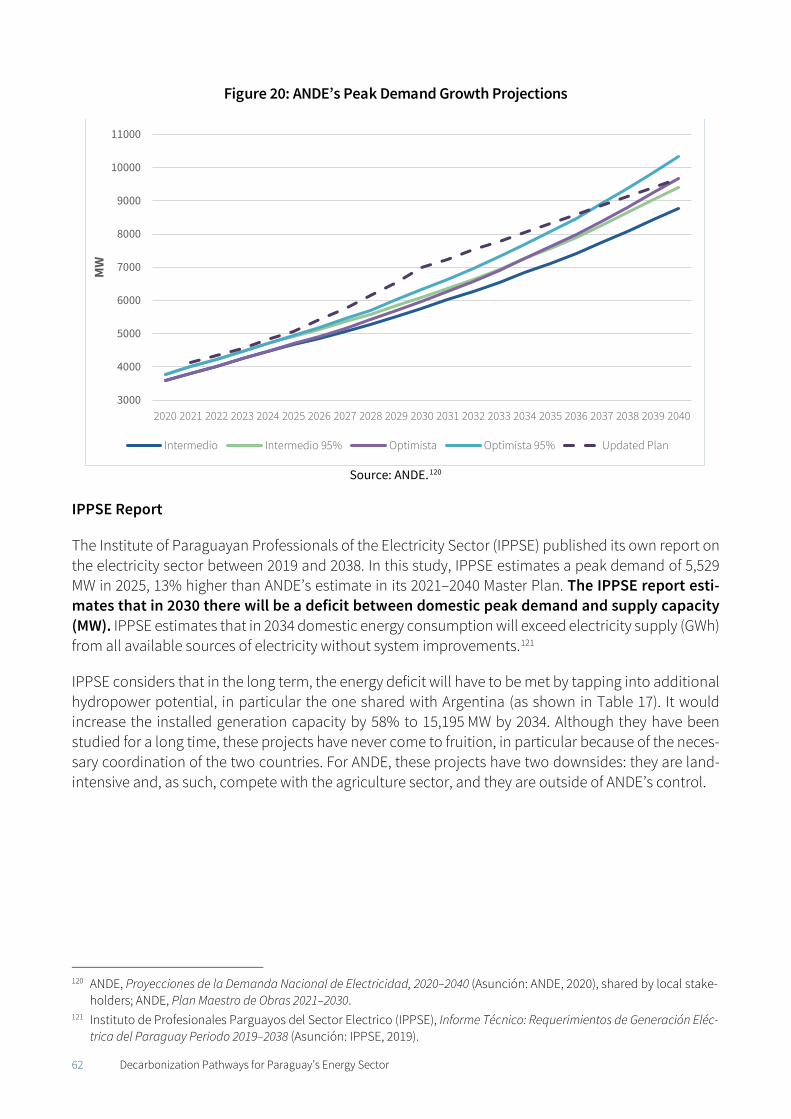
62 Decarbonization Pathways for Paraguay’s Energy Sector
Figure 20: ANDE’s Peak Demand Growth Projections
Source: ANDE.120
IPPSE Report
The Institute of Paraguayan Professionals of the Electricity Sector (IPPSE) published its own report on the electricity sector between 2019 and 2038. In this study, IPPSE estimates a peak demand of 5,529 MW in 2025, 13% higher than ANDE’s estimate in its 2021–2040 Master Plan. The IPPSE report esti-mates that in 2030 there will be a deficit between domestic peak demand and supply capacity (MW). IPPSE estimates that in 2034 domestic energy consumption will exceed electricity supply (GWh) from all available sources of electricity without system improvements.121
IPPSE considers that in the long term, the energy deficit will have to be met by tapping into additional hydropower potential, in particular the one shared with Argentina (as shown in Table 17). It would increase the installed generation capacity by 58% to 15,195 MW by 2034. Although they have been studied for a long time, these projects have never come to fruition, in particular because of the neces-sary coordination of the two countries. For ANDE, these projects have two downsides: they are land-intensive and, as such, compete with the agriculture sector, and they are outside of ANDE’s control.
120 ANDE, Proyecciones de la Demanda Nacional de Electricidad, 2020–2040 (Asunción: ANDE, 2020), shared by local stake-
holders; ANDE, Plan Maestro de Obras 2021–2030. 121 Instituto de Profesionales Parguayos del Sector Electrico (IPPSE), Informe Técnico: Requerimientos de Generación Eléc-
trica del Paraguay Periodo 2019–2038 (Asunción: IPPSE, 2019).
3000
4000
5000
6000
7000
8000
9000
10000
11000
2020 2021 2022 2023 2024 2025 2026 2027 2028 2029 2030 2031 2032 2033 2034 2035 2036 2037 2038 2039 2040
MW
Intermedio Intermedio 95% Optimista Optimista 95% Updated Plan
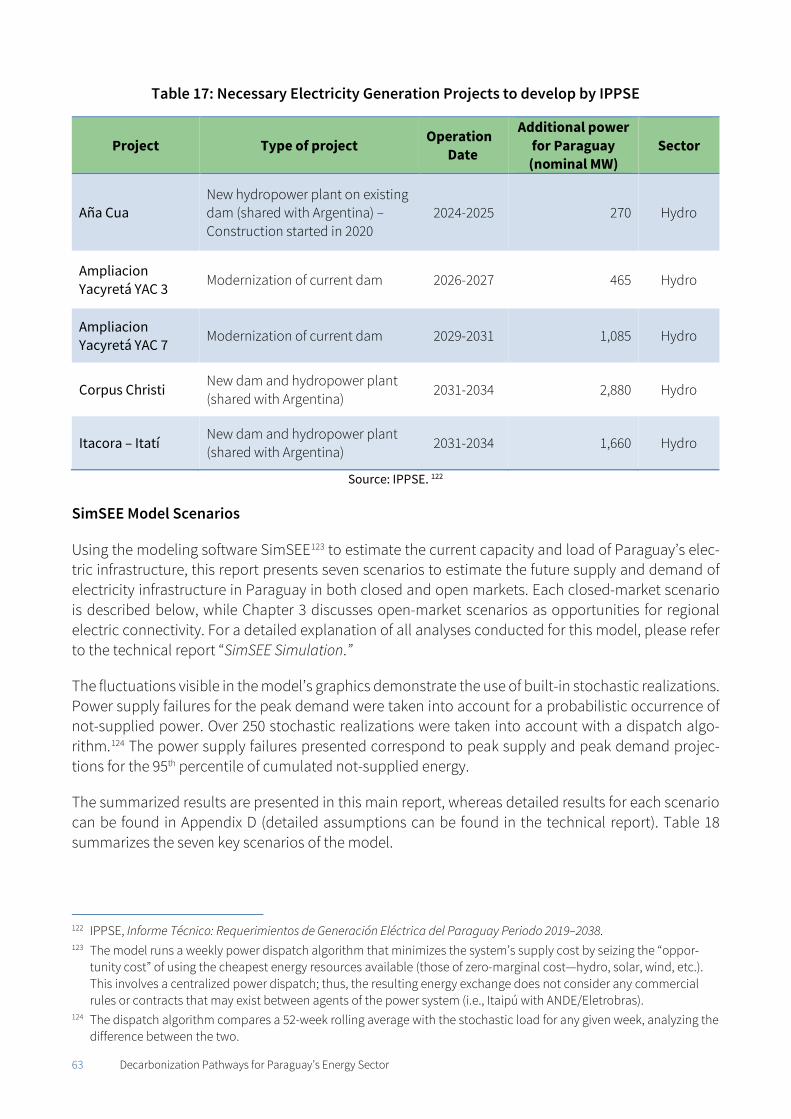
63 Decarbonization Pathways for Paraguay’s Energy Sector
Table 17: Necessary Electricity Generation Projects to develop by IPPSE
Project Type of project Operation
Date
Additional power for Paraguay
(nominal MW)
Sector
Aña Cua New hydropower plant on existing dam (shared with Argentina) – Construction started in 2020
2024-2025 270 Hydro
Ampliacion Yacyretá YAC 3
Modernization of current dam 2026-2027 465 Hydro
Ampliacion Yacyretá YAC 7
Modernization of current dam 2029-2031 1,085 Hydro
Corpus Christi New dam and hydropower plant (shared with Argentina)
2031-2034 2,880 Hydro
Itacora – Itatí New dam and hydropower plant (shared with Argentina)
2031-2034 1,660 Hydro
Source: IPPSE. 122
SimSEE Model Scenarios
Using the modeling software SimSEE123 to estimate the current capacity and load of Paraguay’s elec-tric infrastructure, this report presents seven scenarios to estimate the future supply and demand of electricity infrastructure in Paraguay in both closed and open markets. Each closed-market scenario is described below, while Chapter 3 discusses open-market scenarios as opportunities for regional electric connectivity. For a detailed explanation of all analyses conducted for this model, please refer to the technical report “SimSEE Simulation.”
The fluctuations visible in the model’s graphics demonstrate the use of built-in stochastic realizations. Power supply failures for the peak demand were taken into account for a probabilistic occurrence of not-supplied power. Over 250 stochastic realizations were taken into account with a dispatch algo-rithm.124 The power supply failures presented correspond to peak supply and peak demand projec-tions for the 95th percentile of cumulated not-supplied energy.
The summarized results are presented in this main report, whereas detailed results for each scenario can be found in Appendix D (detailed assumptions can be found in the technical report). Table 18 summarizes the seven key scenarios of the model.
122 IPPSE, Informe Técnico: Requerimientos de Generación Eléctrica del Paraguay Periodo 2019–2038. 123 The model runs a weekly power dispatch algorithm that minimizes the system’s supply cost by seizing the “oppor-
tunity cost” of using the cheapest energy resources available (those of zero-marginal cost—hydro, solar, wind, etc.). This involves a centralized power dispatch; thus, the resulting energy exchange does not consider any commercial rules or contracts that may exist between agents of the power system (i.e., Itaipú with ANDE/Eletrobras).
124 The dispatch algorithm compares a 52-week rolling average with the stochastic load for any given week, analyzing the difference between the two.
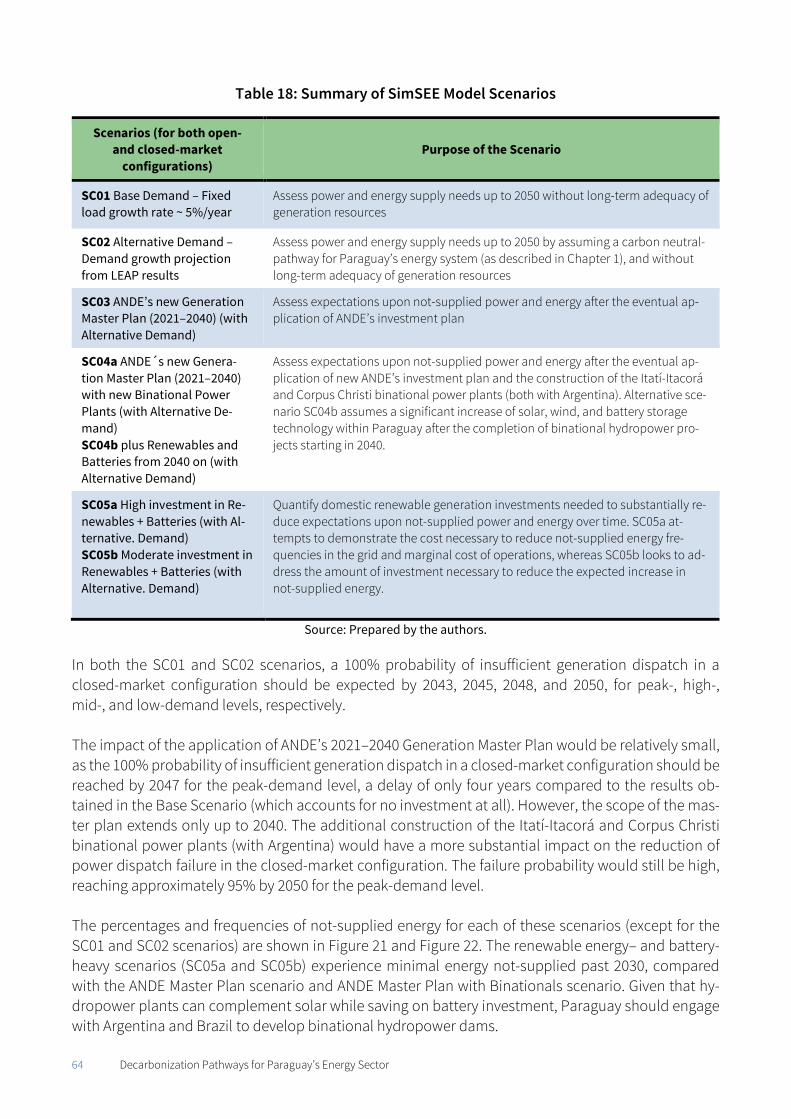
64 Decarbonization Pathways for Paraguay’s Energy Sector
Table 18: Summary of SimSEE Model Scenarios
Scenarios (for both open- and closed-market
configurations) Purpose of the Scenario
SC01 Base Demand – Fixed load growth rate ~ 5%/year
Assess power and energy supply needs up to 2050 without long-term adequacy of generation resources
SC02 Alternative Demand – Demand growth projection from LEAP results
Assess power and energy supply needs up to 2050 by assuming a carbon neutral-pathway for Paraguay’s energy system (as described in Chapter 1), and without long-term adequacy of generation resources
SC03 ANDE’s new Generation Master Plan (2021–2040) (with Alternative Demand)
Assess expectations upon not-supplied power and energy after the eventual ap-plication of ANDE’s investment plan
SC04a ANDE´s new Genera-tion Master Plan (2021–2040) with new Binational Power Plants (with Alternative De-mand) SC04b plus Renewables and Batteries from 2040 on (with Alternative Demand)
Assess expectations upon not-supplied power and energy after the eventual ap-plication of new ANDE’s investment plan and the construction of the Itatí-Itacorá and Corpus Christi binational power plants (both with Argentina). Alternative sce-nario SC04b assumes a significant increase of solar, wind, and battery storage technology within Paraguay after the completion of binational hydropower pro-jects starting in 2040.
SC05a High investment in Re-newables + Batteries (with Al-ternative. Demand) SC05b Moderate investment in Renewables + Batteries (with Alternative. Demand)
Quantify domestic renewable generation investments needed to substantially re-duce expectations upon not-supplied power and energy over time. SC05a at-tempts to demonstrate the cost necessary to reduce not-supplied energy fre-quencies in the grid and marginal cost of operations, whereas SC05b looks to ad-dress the amount of investment necessary to reduce the expected increase in not-supplied energy.
Source: Prepared by the authors.
In both the SC01 and SC02 scenarios, a 100% probability of insufficient generation dispatch in a closed-market configuration should be expected by 2043, 2045, 2048, and 2050, for peak-, high-, mid-, and low-demand levels, respectively. The impact of the application of ANDE’s 2021–2040 Generation Master Plan would be relatively small, as the 100% probability of insufficient generation dispatch in a closed-market configuration should be reached by 2047 for the peak-demand level, a delay of only four years compared to the results ob-tained in the Base Scenario (which accounts for no investment at all). However, the scope of the mas-ter plan extends only up to 2040. The additional construction of the Itatí-Itacorá and Corpus Christi binational power plants (with Argentina) would have a more substantial impact on the reduction of power dispatch failure in the closed-market configuration. The failure probability would still be high, reaching approximately 95% by 2050 for the peak-demand level. The percentages and frequencies of not-supplied energy for each of these scenarios (except for the SC01 and SC02 scenarios) are shown in Figure 21 and Figure 22. The renewable energy– and battery-heavy scenarios (SC05a and SC05b) experience minimal energy not-supplied past 2030, compared with the ANDE Master Plan scenario and ANDE Master Plan with Binationals scenario. Given that hy-dropower plants can complement solar while saving on battery investment, Paraguay should engage with Argentina and Brazil to develop binational hydropower dams.
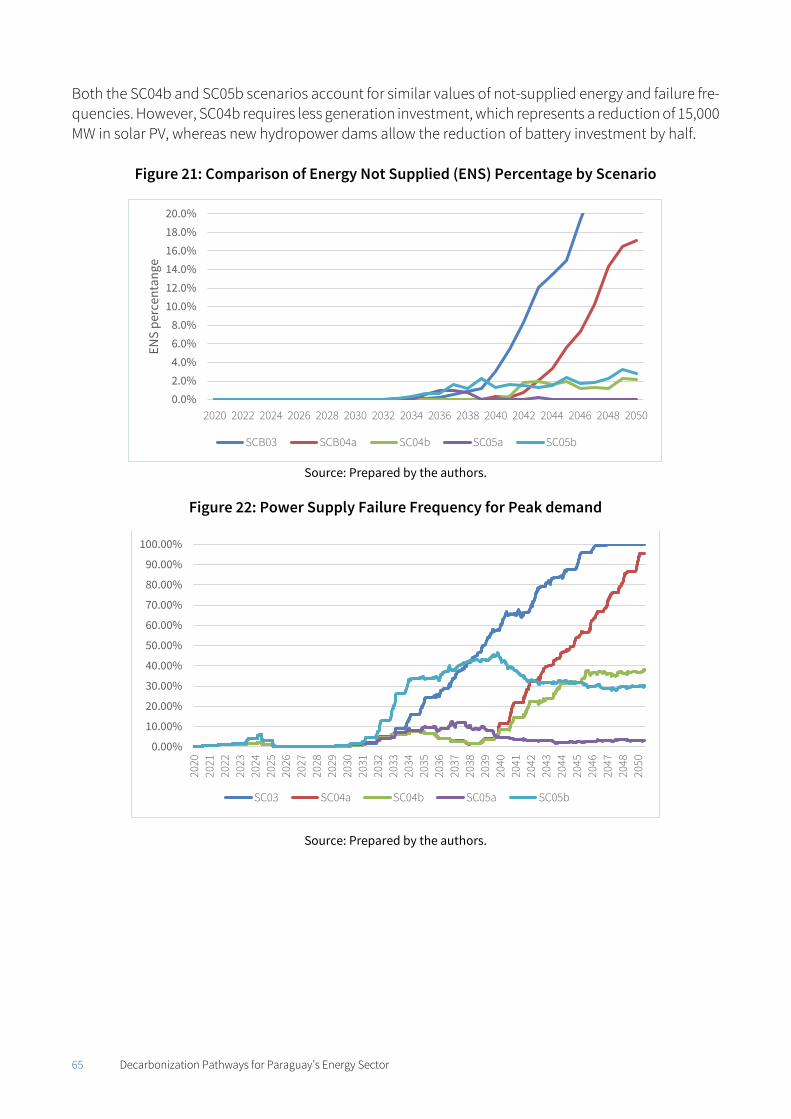
65 Decarbonization Pathways for Paraguay’s Energy Sector
Both the SC04b and SC05b scenarios account for similar values of not-supplied energy and failure fre-quencies. However, SC04b requires less generation investment, which represents a reduction of 15,000 MW in solar PV, whereas new hydropower dams allow the reduction of battery investment by half.
Figure 21: Comparison of Energy Not Supplied (ENS) Percentage by Scenario
Source: Prepared by the authors.
Figure 22: Power Supply Failure Frequency for Peak demand
Source: Prepared by the authors.
0.0%2.0%4.0%6.0%8.0%
10.0%12.0%14.0%16.0%18.0%20.0%
2020 2022 2024 2026 2028 2030 2032 2034 2036 2038 2040 2042 2044 2046 2048 2050
ENS
perc
enta
nge
SCB03 SCB04a SC04b SC05a SC05b
0.00%
10.00%
20.00%
30.00%
40.00%
50.00%
60.00%
70.00%
80.00%
90.00%
100.00%
2020
2021
2022
2023
2024
2025
2026
2027
2028
2029
2030
2031
2032
2033
2034
2035
2036
2037
2038
2039
2040
2041
2042
2043
2044
2045
2046
2047
2048
2050
SC03 SC04a SC04b SC05a SC05b
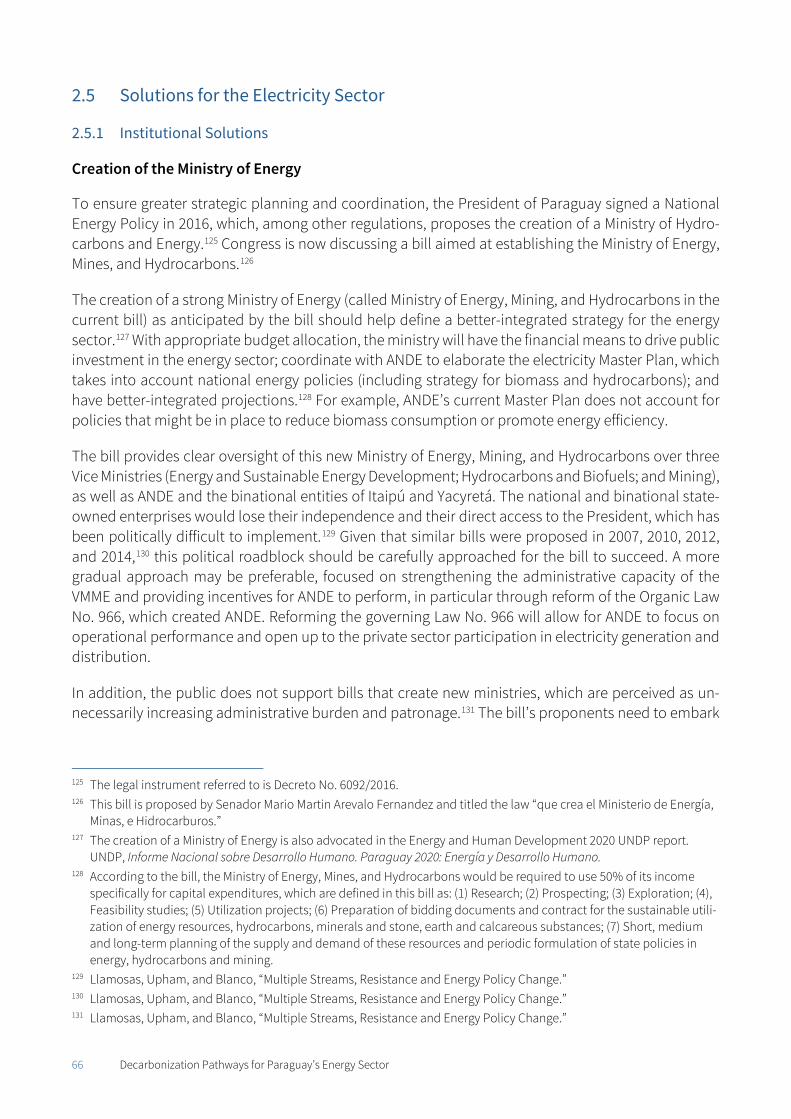
66 Decarbonization Pathways for Paraguay’s Energy Sector
Solutions for the Electricity Sector
2.5.1 Institutional Solutions
Creation of the Ministry of Energy
To ensure greater strategic planning and coordination, the President of Paraguay signed a National Energy Policy in 2016, which, among other regulations, proposes the creation of a Ministry of Hydro-carbons and Energy.125 Congress is now discussing a bill aimed at establishing the Ministry of Energy, Mines, and Hydrocarbons.126
The creation of a strong Ministry of Energy (called Ministry of Energy, Mining, and Hydrocarbons in the current bill) as anticipated by the bill should help define a better-integrated strategy for the energy sector.127 With appropriate budget allocation, the ministry will have the financial means to drive public investment in the energy sector; coordinate with ANDE to elaborate the electricity Master Plan, which takes into account national energy policies (including strategy for biomass and hydrocarbons); and have better-integrated projections.128 For example, ANDE’s current Master Plan does not account for policies that might be in place to reduce biomass consumption or promote energy efficiency.
The bill provides clear oversight of this new Ministry of Energy, Mining, and Hydrocarbons over three Vice Ministries (Energy and Sustainable Energy Development; Hydrocarbons and Biofuels; and Mining), as well as ANDE and the binational entities of Itaipú and Yacyretá. The national and binational state-owned enterprises would lose their independence and their direct access to the President, which has been politically difficult to implement.129 Given that similar bills were proposed in 2007, 2010, 2012, and 2014,130 this political roadblock should be carefully approached for the bill to succeed. A more gradual approach may be preferable, focused on strengthening the administrative capacity of the VMME and providing incentives for ANDE to perform, in particular through reform of the Organic Law No. 966, which created ANDE. Reforming the governing Law No. 966 will allow for ANDE to focus on operational performance and open up to the private sector participation in electricity generation and distribution.
In addition, the public does not support bills that create new ministries, which are perceived as un-necessarily increasing administrative burden and patronage.131 The bill’s proponents need to embark
125 The legal instrument referred to is Decreto No. 6092/2016. 126 This bill is proposed by Senador Mario Martin Arevalo Fernandez and titled the law “que crea el Ministerio de Energía,
Minas, e Hidrocarburos.” 127 The creation of a Ministry of Energy is also advocated in the Energy and Human Development 2020 UNDP report.
UNDP, Informe Nacional sobre Desarrollo Humano. Paraguay 2020: Energía y Desarrollo Humano. 128 According to the bill, the Ministry of Energy, Mines, and Hydrocarbons would be required to use 50% of its income
specifically for capital expenditures, which are defined in this bill as: (1) Research; (2) Prospecting; (3) Exploration; (4), Feasibility studies; (5) Utilization projects; (6) Preparation of bidding documents and contract for the sustainable utili-zation of energy resources, hydrocarbons, minerals and stone, earth and calcareous substances; (7) Short, medium and long-term planning of the supply and demand of these resources and periodic formulation of state policies in energy, hydrocarbons and mining.
129 Llamosas, Upham, and Blanco, “Multiple Streams, Resistance and Energy Policy Change.” 130 Llamosas, Upham, and Blanco, “Multiple Streams, Resistance and Energy Policy Change.” 131 Llamosas, Upham, and Blanco, “Multiple Streams, Resistance and Energy Policy Change.”
67 Decarbonization Pathways for Paraguay’s Energy Sector
on a strong communications campaign to educate the public on how the lack of a capacitated Ministry of Energy is at the origin of many of the power outages that they regularly suffer from.
Improving ANDE’s performance and introducing performance incentives To address ANDE’s incentives, a performance contract between the Ministry of Energy or the Govern-ment of Paraguay and ANDE could create a system of checks and balances on the public utility. The Ministry of Energy bill mentioned above would create the legal space for this as it stipulates that the regulated entities would have clear performance goals and would be assessed against them. Perfor-mance contracts—written agreements clarifying objectives and motivations—would be effective in controlling tariffs, investments, subsidies, social objectives, and funding. To date, the Government of Paraguay has established the National Council of Public Companies in 2019 as a mechanism to verify compliance of public companies with performance standards. This council, setting out the perfor-mance objectives expected from ANDE, has had limited success in broaching labor policy issues re-lated to ANDE’s employees.132
As discussed in the 2013 report, performance indicators can be designed to reward good managerial performance and sanction underperformance. These indicators could include net income, return on assets, debt and equity ratios, interest cover, dividend policy, productivity improvements, customer satisfaction indices, connection targets, human resource issues, procurement policy, and environ-mental adherence. However, as noted in 2013, performance contracts can be defeated by politics and should only be used if the government is willing “to deal with the challenges of information asym-metry, effective incentives, and credible commitments.”133
Increasing incentives in the distribution sector could improve bill collection rates and system perfor-mance. Given the characteristics of the electricity sector in Paraguay, this is paramount to curbing high distribution and commercial losses.
For instance, in the 2010s, in Brazil, six publicly owned distribution companies were characterized by low capacity, poor management, lack of commercial discipline, and political interference by local au-thorities. Therefore, their privatization failed and the federal state-owned company Eletrobras, in col-laboration with the World Bank, had to restructure them before envisioning privatization (see Box 3).134
Box 3: Curbing Distribution Losses in Brazil
By emphasizing the development of proper project management procedure, smart-grid network equipment, advanced metering technology, and regulating illegal connections, the World Bank’s col-laborative project with Eletrobras in Brazil significantly increased the collection rates of the distribu-tion companies by adding 500,000 new consumers to the billing collection cycle (a 16% increase in regional consumers and 0.7% increase in national consumers). It also improved the quality of services delivered by the companies. Average interruption times dropped up to 25% in only seven years. To address distribution losses, the project rehabilitated 988 km of medium- and low-voltage line as well
132 “Consejo de empresas públicas recibió propuesta acordada de la ANDE,” Radio Nacional, February 18, 2020,
http://www.radionacional.gov.py/consejo-de-empresas-publicas-recibio-propuesta-acordada-de-la-ande. 133 Toledano et al., Leveraging Paraguay’s Hydropower for Sustainable Economic Development. 134 Fernando Manibog, “Electrobras Distribution Rehabilitation: Implementation Completion Report (ICR) Review” (Wash-
ington D.C.: World Bank Group, 2019), https://documents1.worldbank.org/curated/en/190321548790271333/pdf/Bra-zil-ELETROBRAS-Distribution-Rehabilitation.pdf.
68 Decarbonization Pathways for Paraguay’s Energy Sector
as constructed 1,015 km of new transmission lines. The Eletrobras project also invested in the instal-lation and replacement of meters, installing advanced metering systems for 84% of targeted custom-ers and saving over 725 GWh in recovered and aggregated electricity during the six-year life of the pro-ject.
Source: World Bank.135
In Paraguay, two private distribution companies entered the distribution network, the Mennonites Co-operative in the Central Chaco region (Western Subsystem) and CLYFSA in the city of Villarrica (Central Subsystem), and have been distributing electricity since the 1960s.136 Understanding the extent to which the distribution in these subsystems is more efficient and experiences fewer non-technical losses would be a useful first step towards entertaining the idea of privatizing distribution on a larger scale. A wider privatization of distribution might come across the same issue as the privatization of generation: the tariff price, which is politically fixed, is too low for outside companies to compete.
Opening distribution to competition through a performance contract, as described above, also called a Management Contract model, would allow ANDE to retain full ownership of the electricity assets and grant a private contractor the responsibility to run operations without acquiring equity or incurring commercial risk (see example in Box 4 from Haiti). Although this kind of reform was recommended in 2013, it has not yet been deployed, although it has been mentioned as a necessary development in Paraguay’s Sustainable Energy Agenda for 2019–2023.137
Box 4: Efficiency of the Management Contract in Haiti
Under a Transition Management Contract between the state-owned utility and distribution company Electricity of Haiti (EDH), the United States Agency for International Development (USAID), the IDB, and the Government of Haiti from 2011 to 2013, 23,000 new connections were installed (at a pace far greater than the previous expansion rate), the cost-recovery ratio to overall expenditures improved from 18% to 33.2%, and an additional USD 55.1 million was collected over the contract period.
Source: USAID.138
Management contracts give private-sector managers the power to lay off excess staff, cut services to delinquent customers, and raise tariffs to rationalize energy use, which are measures that managers of publicly owned utility companies try to avoid. Although potential gains are distributed over time, layoffs and service cuts to delinquent customers might come at a political cost.139
Municipal zoning for efficient grid planning To improve the electricity planning mechanism, municipal zoning would help to optimize grid invest-ments. Although there are currently no plans by ANDE to apply municipal zoning, promoting the iden-
135 Manibog, “Electrobras Distribution Rehabilitation.” 136 Local experts, interview by the authors, September 2020. 137 VMME, Agenda de Energía Sostenible del Paraguay 2019–2023 (Asunción: VMME, 2019),
https://www.ssme.gov.py/vmme/pdf/agenda/AgendaEnerdelParaguay%20-%20VFInal_compressed.pdf. 138 Randall Wood, Best Practices for Performance-Based Management Contracts for the Power Sector (Washington D.C.:
USAID, 2018), https://www.usaid.gov/sites/default/files/documents/1865/ECO_RTI_2018_Performance-Based-Man-agement-Contracts-Best-Practices.pdf.
139 Toledano et al., Leveraging Paraguay’s Hydropower for Sustainable Economic Development.
69 Decarbonization Pathways for Paraguay’s Energy Sector
tification and definition of residential, commercial, and industrial areas would ensure that invest-ments meet the voltage needs required for each zone. In the absence of zoning, industries do not lo-cate themselves accordingly, increasing uncertainty regarding electricity investment needs and mak-ing it more difficult to optimize grid expansion. This leads to an increase in average connection times and distribution costs.
Value-Added Services In an effort to improve revenue and serviceability to customers, ANDE could consider integrating ser-vices that normally do not fall under the purview of utility companies to improve revenue sources in PYG. For example, using ANDE’s existing fiber-optic cable networks to expand access of internet con-nectivity through collaborations with private internet providers is a means of adding value to existing ANDE services. Copel in the state of Paraná, Brazil, is a utility doing just that through its wholly owned subsidiary, Copel Telecom.140 Moreover, such a collaboration would generate revenue for ANDE through an optic cable leasing agreement. With the same objective, ANDE could also be involved in energy efficiency programs (see Chapter 4).
Raising Awareness For many Paraguayans, there is a high level of misunderstanding of how the electricity system oper-ates. To them, having such large hydropower generation sources and not making cheap energy avail-able for everyone is a major fault of ANDE. These misunderstandings, in many instances, mean that government-owned electricity generation sources that are much closer to these rural communities are not being adopted and are instead mistaken as more expensive energy options. For example, commu-nities in the Western Chaco region of Paraguay, an area approximately 700 km away from the Itaipú dam, prefer to have electricity from Itaipú instead of local sources. Because they believe that the en-ergy from Itaipú, as one of the largest dams in the world, should belong to them, communities reject offers to install or use solar or wind energy in the Chaco region.141 With this mindset, the misunder-standing of electricity losses through transmission itself is on full display, and the consequences are the persistence of diesel motors and firewood as energy sources to compensate for the lack of grid connection.
Working to provide public awareness campaigns on the functionality of affordable energy sources for customers geographically distant from hydropower plants such as Itaipú would debunk these com-mon misunderstandings. Moreover, it would reduce distribution losses by creating more socially ac-ceptable decentralized sources of electric generation. Box 5 details how Peru used education about the electricity sector to aid its National Rural Electrification scheme.
Box 5: Education Outreach in Peru
As part of the Government of Peru’s Rural Electrification Scheme (REI Part II), rural schools are priori-tized for obtaining access to electricity. Having these newly powered schools as focal points, the gov-ernment then uses videos and leaflets prepared by professionals to promote knowledge of renewable energy for both children and adults. The Government of Peru then collaborates with private distribu-tion companies with service in rural communities to use them as local educators for renewable energy
140 “Brazil’s Copel Telecom Scales State-of-the-Art Fiber Optic Internet with Coriant 200g Solution” Businesswire, August,
7, 2018, https://www.businesswire.com/news/home/20180807005021/en/Brazil%E2%80%99s-Copel-Telecom-Scales-State-of-the-Art-Fiber-Optic-Internet-with-Coriant-200G-Solution.
141 Former ANDE executive, interview by the authors, September 2020.
70 Decarbonization Pathways for Paraguay’s Energy Sector
education. With an outlined curriculum for renewable energy education, the government has identi-fied a number of rural schools in different departments throughout the country so as to have the great-est educational impact in rural communities. Source: World Bank.142
2.5.2 Technical Approach
Most of the investments in the Master Plan address the transmission infrastructure gap. These invest-ments are crucial to reduce power outages and cut transmission losses. Additionally, they are critical to using Paraguay’s full allocation of Itaipú’s energy.143 However, transmission losses only account for less than 6% of the overall system losses. More needs to be done to tackle the distribution losses, particularly the technical losses related to management deficiencies both at the distribution and com-mercial level.144 Furthermore, greater emphasis should be placed on smoothing electricity consump-tion during the day and slowing electricity consumption growth rates over time through efficiency and reduction of distribution losses (reinforced in Section 2.4.2.2 and in Chapter 3).
2.5.2.1 Supply-side Approaches The expansion of an advanced metering system applied to medium and large consumers through smart grids allows optimization of electricity consumption by informing users of real-time prices, peak hour start and end times, accumulated consumption, and other alerts. Experience in both developing and developed countries shows that medium and large consumers are responsive to clear and timely information on pricing options. The rate of return and payback periods for installing an advanced me-tering system for large consumers are usually attractive. The World Bank estimates that, subject to average tariff levels and electricity theft levels, the installation of an advanced metering device, includ-ing a component allowing remote disconnection and reconnection, requires an investment of USD 240 on average for both large low-voltage consumers and high- and medium-voltage consum-ers.145 In Paraguay, this is equivalent to an electricity consumption of 4,286 kWh per year at an electric-ity price of USD¢ 5.60 per kWh. Therefore, the investment can be rapidly recovered by billing previously unmetered customers. Although these estimations do not account for recurrent costs associated with field meter readings, these are likely to be minimal because labor costs in Paraguay are low compared with the recovered electricity and associated revenue.
The main constraint for ANDE to implement smart grids is an obsolete distribution network. Although ANDE acknowledges that smart grids have a great potential to reduce distribution losses by informing consumers, the current age of the existing distribution network (ranging from 30 to 40 years old) makes it difficult to install smart-grid systems. 146 Even so, ANDE’s new Master Plan 2021-2030 highlights an 142 Sustainable Development Department, Implementation Completion and Results Report: Republic of Peru Rural Electrifi-
cation Project (World Bank, 2013), http://documents1.worldbank.org/cu-rated/en/325061468297302609/pdf/ICR23580P090110C0disclosed010230140.pdf.
143 Fully using Paraguay’s allocation would reinforce Paraguay’s position at the 2023 renegotiation of Annex C of the Itapú treaty.
144 Encina, “Las Perdidas Eléctricas de ANDE.” 145 Varun Nangia, Samuel Oguah, and Kwawu Gaba, “Can Utilities Realize the Benefits of Advanced Metering Infrastruc-
ture? Lessons from The World Bank’s Portfolio,” Live Wire, no. 2016/66 (Washington D.C.: World Bank Group, 2016), https://olc.worldbank.org/content/can-utilities-realize-benefits-advanced-metering-infrastructure-lessons-world-bank%E2%80%99s.
146 Former ANDE executive, interview by the authors, September 2020.
71 Decarbonization Pathways for Paraguay’s Energy Sector
anticipated budget of USD 109 million over the next five years to install advanced metering technology throughout the grid, starting in and around the Metropolitan area (based on a feasibility study fi-nanced by CAF).
Digitization
Most utility companies analyze their IT systems as they do their physical assets, planning, building, and operating the systems over a few decades before they are considered obsolete and replaced. The problem with this traditional viewpoint is that the project’s cost recovery is often maintained to just cover the initial investment rather than considering increased revenue generation of up to two to three times the initial cost.147 If, instead, utilities noted that the initial investment in IT systems could mod-ernize projects and greatly improve both the life of the project and potential revenue, there could be a means of financial gain.
In general, there are four main categorical benefits from digitization and improvements in IT. The first, improved effectiveness, has the potential to reduce the severity of events like electrical outages and power cuts. Second, improved efficiency can generate savings from reduced maintenance costs and time to market for electricity consumption. Third, a reduced risk of modernization efforts is another potential benefit, derived from the savings of cost and scheduling that would occur from IT improve-ments. Finally, enabled technological evolution has the potential to reduce investment in core IT and allow for funds to be distributed to other necessary parts of the electricity network infrastructure. 148
After smart-grid networks are well-established in Paraguay, the next step will be for ANDE to embrace the digitization revolution to optimize its networks, service to customers, and monitoring capabilities. With ANDE’s recent development of an ICT blueprint for rapid modernization and digitization of its existing grid, ANDE is on track to take advantage of the many benefits associated with this process. However, it remains to be seen to what extent the allocated budget for ICT becomes a fully detailed reality. Once digitization becomes an integral part of ANDEs operations, other technologies could be adopted. For instance, some utilities have taken advantage of drones, image processing, and LIDAR technologies for the automatic inspection of power lines. 149
Because reducing distribution losses is ANDE’s fundamental challenge, it should be supported in im-plementing its plan. ANDE can also use digitization to predict the probability of modeling failure. Based on various inputs, including geographical information, historical anomalies, and meteorologi-cal information, ANDE can predict the likelihood of system failure at different points along the value chain. Using predictive modeling in this way can help ANDE to forecast failures before they happen and strategize funding to modernize equipment before failures occur.150 The launch of SGIDE is a first step in the right direction.
147 Eelco de Jong, Anand Mohanrangan, Aditya Pande, and Parker Shi, “Why Utility Boards Should Care about IT Architec-
ture,” in McKinsey & Company, The Digital Utility: New challenges, capabilities, and opportunities (McKinsey, 2018), https://www.mckinsey.com/~/media/McKinsey/Industries/Electric%20Power%20and%20Natural%20Gas/Our%20In-sights/The%20Digital%20Utility/The%20Digital%20Utility.pdf.
148 De Jong et al., Why Utility Boards Should Care about IT Architecture. 149 Marcus Braun, Eelco de Jong, Alfonso Encina, and Tim Kniker, “Fueling Utility Innovation Through Analytics,” McKin-
sey & Company: Electric Power & Natural Gas, April 17, 2018, https://www.mckinsey.com/industries/electric-power-and-natural-gas/our-insights/fueling-utility-innovation-through-analytics#.
150 Marcus Braun, Eelco de Jong, Alfonso Encina, and Tim Kniker, “Fueling Utility Innovation Through Analytics.”
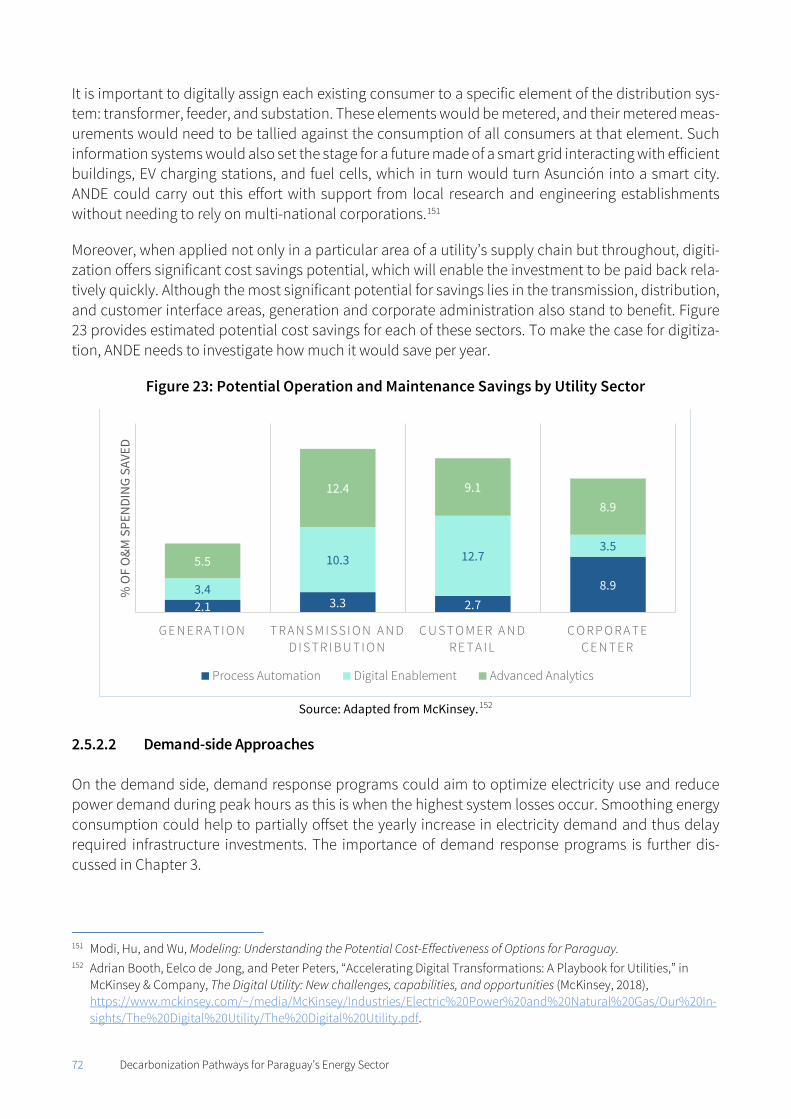
72 Decarbonization Pathways for Paraguay’s Energy Sector
It is important to digitally assign each existing consumer to a specific element of the distribution sys-tem: transformer, feeder, and substation. These elements would be metered, and their metered meas-urements would need to be tallied against the consumption of all consumers at that element. Such information systems would also set the stage for a future made of a smart grid interacting with efficient buildings, EV charging stations, and fuel cells, which in turn would turn Asunción into a smart city. ANDE could carry out this effort with support from local research and engineering establishments without needing to rely on multi-national corporations.151
Moreover, when applied not only in a particular area of a utility’s supply chain but throughout, digiti-zation offers significant cost savings potential, which will enable the investment to be paid back rela-tively quickly. Although the most significant potential for savings lies in the transmission, distribution, and customer interface areas, generation and corporate administration also stand to benefit. Figure 23 provides estimated potential cost savings for each of these sectors. To make the case for digitiza-tion, ANDE needs to investigate how much it would save per year.
Figure 23: Potential Operation and Maintenance Savings by Utility Sector
Source: Adapted from McKinsey.152
2.5.2.2 Demand-side Approaches On the demand side, demand response programs could aim to optimize electricity use and reduce power demand during peak hours as this is when the highest system losses occur. Smoothing energy consumption could help to partially offset the yearly increase in electricity demand and thus delay required infrastructure investments. The importance of demand response programs is further dis-cussed in Chapter 3.
151 Modi, Hu, and Wu, Modeling: Understanding the Potential Cost-Effectiveness of Options for Paraguay. 152 Adrian Booth, Eelco de Jong, and Peter Peters, “Accelerating Digital Transformations: A Playbook for Utilities,” in
McKinsey & Company, The Digital Utility: New challenges, capabilities, and opportunities (McKinsey, 2018), https://www.mckinsey.com/~/media/McKinsey/Industries/Electric%20Power%20and%20Natural%20Gas/Our%20In-sights/The%20Digital%20Utility/The%20Digital%20Utility.pdf.
2.1 3.3 2.78.93.4
10.3 12.73.5
5.5
12.4 9.18.9
G E N E R A T I O N T R A N S M I S S I O N A N D D I S T R I B U T I O N
C U S T O M E R A N D R E T A I L
C O R P O R A T E C E N T E R
% O
F O
&M S
PEN
DIN
G SA
VED
Process Automation Digital Enablement Advanced Analytics
73 Decarbonization Pathways for Paraguay’s Energy Sector
Direct Load Control programs
Direct load control programs remotely switch off specific appliances to reduce peak loads. Typical demand reductions are approximately 0.3 kW of energy consumption for air conditioners and 0.72 kW for water heaters used by commercial customers.153 The switch can be operated through radio signals or digital paging. Depending on the duty cycle selected, the switch turns off the condensing unit or element for a specific period or various fractions of a period (e.g., 10 minutes every hour). Direct load control programs also typically limit the number of times or hours that a customer’s appliance can be turned off per year or per season. Box 6 identifies examples of these types of direct load control pro-grams in two different countries.
Box 6: Direct Load Control Program in Vietnam and in the United States
In a Direct Load Control pilot program implemented in Vietnam, the load control was exercised only when the electric grid was experiencing a significant imbalance between supply and demand. The 2,000 participating customers were guaranteed that the load control would not be imposed more than 60 times in a year.154
While Direct Load Control is not widespread in emerging and developing countries, it has been in op-eration for several decades in the United States. A variety of utilities started to develop and deploy large programs in the late 1960s and expanded them significantly since to include dozens of direct load control programs as of 2020. Duke Energy Florida’s Energy Wise Home Program is one of the larg-est of these programs, with 960,000 customers.155 Average costs in the United States for the 11 largest demand reduction companies amount to USD 47/kW, with residential sectors being more costly than their commercial and industrial counterparts.156 Dynamic pricing
Dynamic pricing also has potential benefits for customers because a shift in consumption patterns can lead to lower tariffs. Current regulations in Paraguay charge larger consumers a basic-load reserve tariff and penalize them if they go above this threshold. This requires consumers to accurately project their consumption on an annual basis and conclude a one-year contract with ANDE. Current thresh-olds of incidence are above 10% of the load reserve for customers connected to medium-tension lines and 5% for those connected to high and very high tension lines.157 In addition, the current cost of peak demand energy according to Pliego 21 varies from the off-peak energy price for both substation and line connections.158 Table 19 lays out these plans.
153 Burns and McDonnell Engineering Company, Demand Side Management Study (Kansas City: Burns and McDonnell
Engineering Company, 2019), https://cms.cws.net/content/rpu.org/files/RPU%20Demand%20Side%20Manage-ment%20Study.pdf.
154 Charles River Associates, Applications of Dynamic Pricing in Developing and Emerging Economies (Washington D.C.: World Bank, 2005), https://www.slideshare.net/lmaurer/Applications-of-Dynamic-Pricing-50505
155 Thomas Artau, “Duke Energy Florida’s Award-Winning Initiative,” presentation recording, PLMA, August 4, 2016, https://www.peakload.org/DukeFla.
156 Asa Hopkins and Melissa Whited, Best Practices in Utility Demand Response Programs (Cambridge, MA: Synapse Energy Economics, 2017), https://www.synapse-energy.com/sites/default/files/Utility-DR-17-010.pdf.
157 ANDE, “Condiciones Generales: Modificación de la Potencia Reservada” (ANDE, 2018), https://www.ande.gov.py/docs/tarifas/ande_potencia_reservada_carta_condiciones_generales.pdf.
158 Republic of Paraguay, Decree No. 6904, 2017; Republic of Paraguay, Pliego de Tarifas No. 21.
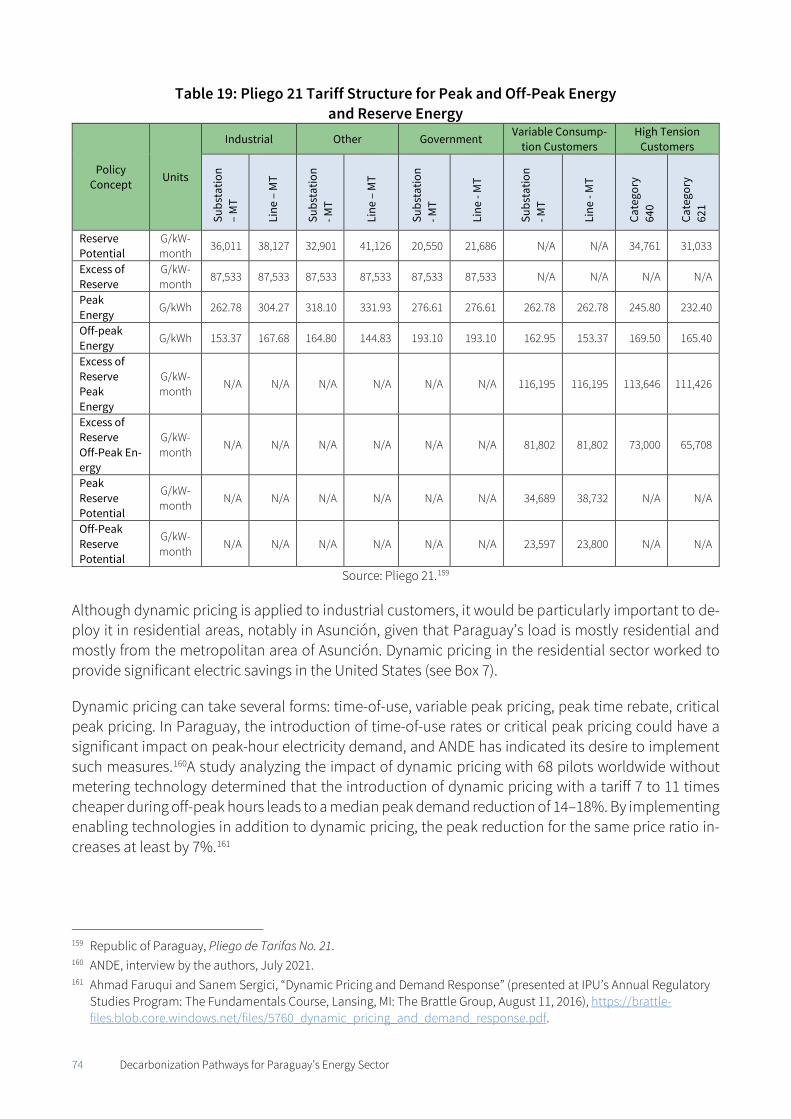
74 Decarbonization Pathways for Paraguay’s Energy Sector
Table 19: Pliego 21 Tariff Structure for Peak and Off-Peak Energy and Reserve Energy
Policy Concept Units
Industrial Other Government Variable Consump-tion Customers
High Tension Customers
Subs
tatio
n –
MT
Line
– M
T
Subs
tatio
n - M
T
Line
– M
T
Subs
tatio
n - M
T
Line
- M
T
Subs
tatio
n - M
T
Line
- M
T
Cate
gory
64
0
Cate
gory
62
1
Reserve Potential
G/kW-month
36,011 38,127 32,901 41,126 20,550 21,686 N/A N/A 34,761 31,033
Excess of Reserve
G/kW-month
87,533 87,533 87,533 87,533 87,533 87,533 N/A N/A N/A N/A
Peak Energy
G/kWh 262.78 304.27 318.10 331.93 276.61 276.61 262.78 262.78 245.80 232.40
Off-peak Energy G/kWh 153.37 167.68 164.80 144.83 193.10 193.10 162.95 153.37 169.50 165.40
Excess of Reserve Peak Energy
G/kW-month
N/A N/A N/A N/A N/A N/A 116,195 116,195 113,646 111,426
Excess of Reserve Off-Peak En-ergy
G/kW-month
N/A N/A N/A N/A N/A N/A 81,802 81,802 73,000 65,708
Peak Reserve Potential
G/kW-month
N/A N/A N/A N/A N/A N/A 34,689 38,732 N/A N/A
Off-Peak Reserve Potential
G/kW-month
N/A N/A N/A N/A N/A N/A 23,597 23,800 N/A N/A
Source: Pliego 21.159
Although dynamic pricing is applied to industrial customers, it would be particularly important to de-ploy it in residential areas, notably in Asunción, given that Paraguay’s load is mostly residential and mostly from the metropolitan area of Asunción. Dynamic pricing in the residential sector worked to provide significant electric savings in the United States (see Box 7).
Dynamic pricing can take several forms: time-of-use, variable peak pricing, peak time rebate, critical peak pricing. In Paraguay, the introduction of time-of-use rates or critical peak pricing could have a significant impact on peak-hour electricity demand, and ANDE has indicated its desire to implement such measures.160A study analyzing the impact of dynamic pricing with 68 pilots worldwide without metering technology determined that the introduction of dynamic pricing with a tariff 7 to 11 times cheaper during off-peak hours leads to a median peak demand reduction of 14–18%. By implementing enabling technologies in addition to dynamic pricing, the peak reduction for the same price ratio in-creases at least by 7%.161
159 Republic of Paraguay, Pliego de Tarifas No. 21. 160 ANDE, interview by the authors, July 2021. 161 Ahmad Faruqui and Sanem Sergici, “Dynamic Pricing and Demand Response” (presented at IPU’s Annual Regulatory
Studies Program: The Fundamentals Course, Lansing, MI: The Brattle Group, August 11, 2016), https://brattle-files.blob.core.windows.net/files/5760_dynamic_pricing_and_demand_response.pdf.
75 Decarbonization Pathways for Paraguay’s Energy Sector
Box 7: Dynamic Pricing in the United States
U.S. consumers could save up to USD 10 billion per year if everyone transitioned from a flat-rate pricing scheme to dynamic pricing. Over 60% of pilot tests in the United States have shown a peak reduction of 10% or more from adjusted pricing during peak load times.162 A study analyzing customers of the Smart Energy Rewards program of Baltimore Gas and Electric, which allows customers to earn USD 1.25 per kWh on Energy Savings Days, showed that customers saved 32 GWh of electricity with this promotion between 2013 and 2016, amounting to a savings of almost USD 40 million.163 In New York City, Con Edison offers two types of peak rebate programs (2-hour and 21-hour notification pro-grams). The benefit for participants can amount to USD 180 per year for each kW pledged to curtail during periods that power demand is highest.164 Such programs are also beneficial for the system op-erator or utilities. As of 2006, the New York Independent System Operator saved up to USD 91 million annually, with an average peak load shaving of 865 MW.165
Findings and Recommendations for the Electric Sector - Summary
Institutional Solutions 1. Creating a strong Ministry of Energy to oversee the sector and the appropriated financial means
should help define a better-integrated energy strategy, particularly when embarking on the decar-bonization of the Paraguayan economy, and monitor the efficiency of the public power utility that is currently not incentivized to improve performance. Although delineating the precise contours of this institutional reform must be the object of a detailed study, lying outside the scope of this study, this report recommends the following basic guidelines. Organic Law No. 966, which created ANDE, should be reformed, and private sector participation should be encouraged in distribution to in-crease collection rates and system performance. The ministry would also be responsible for coor-dinating energy plans with other institutions. A bill for the creation of such a ministry is now in Congress but might fail, like many preceding bills, because of vested interests. However, passing such a bill is fundamental; it should be designed so that its passage is politically feasible. It also needs broad public support, and is critical to organize a sensitization campaign highlighting its necessity and creating the link between the absence of a ministry and routine power outages.
2. ANDE’s master plan should indicate how to achieve further electrification of end-use sectors (such
as those using biomass) and support high energy efficiency gains among electricity consumers. The plan should also be articulated around municipal zoning by residential, commercial, and in-dustrial zones to help the planning process for electricity infrastructure. The master plan should provide flexibility to adapt to changing electricity generation technologies as well as publish the
162 Faruqui and Sergici, “Dynamic Pricing and Demand Response.” 163 AEE Institute, “Case Study: Navigating Utility Business Model Reform” (AEE Institute, 2017),
https://info.aee.net/hubfs/MD%20DR%20Final.pdf. 164 “Smart Usage Rewards for Reducing Electric Demand,” ConEdison, https://www.coned.com/en/save-money/rebates-
incentives-tax-credits/rebates-incentives-tax-credits-for-commercial-industrial-buildings-customers/smart-usage-rewards/smart-usage-rewards-for-reducing-electric-demand.
165 Federal Energy Regulatory Commission (FERC) The California Independent System Operator Corporation (California ISO), ISO New England, Inc. (ISO-NE), Midwest Independent Transmission System Operator, Inc. (Midwest ISO), New York Independent System Operator (NYISO), PJM Interconnection, L.L.C. (PJM), and Southwest Power Pool, Inc. (SPP), ISO/RTO Metrics Report: Appendix C (FERC, 2010), https://www.ferc.gov/sites/default/files/2020-05/summary-rto-met-rics-report.pdf.
76 Decarbonization Pathways for Paraguay’s Energy Sector
levelized cost of energy (LCOE) analysis justifying the choice of generation technology, in particular for more remote areas. This LCOE analysis should consider market prices and their evolution as anticipated by reference sources such as IRENA and IEA (see Chapter 3).
3. ANDE’s exposure to foreign exchange risk, which is degrading its finances with the depreciation of PYG, should be addressed. Green bonds (see Chapter 7) or the sale of value-added services for increased revenue should be explored to reduce that exposure.
Technical solutions
1. Although it is important to build new-generation plants and transmission lines to accommodate
higher demand, Paraguay also needs to reduce distribution losses, which account for 78% of total losses. The modernization of the distribution networks, the installation of effective communica-tion systems through fiber optics to enable the expansion of advanced metering systems, and broader digitization advances should be fast-tracked and hurdles removed to reduce both tech-nical and non-technical distribution losses.
2. Adopting Direct Load Control programs and expanding dynamic pricing to residential customers in the Asunción metropolitan area could reduce consumption during peak hours (see Chapter 3 for further explanations). Creating general guidelines for the improved governance and regulation of energy efficiency should help to mitigate energy consumption (see Chapter 3). These measures are necessary to improve the load factor, which is below 60%, as well as reduce electricity system investment.
3. The tariffs are slightly above the cost of the electricity sold. Because the costs associated with gen-
eration and transmission (cost of energy and capacity) and the costs of distribution are evolving separately with different drivers, it is worth tracking and reporting these separately. This will also enable more accurate tariff adjustments. Moreover, there is a cross-subsidy from low-voltage resi-dential customers to industrial users, and the subsidy for low-income customers is ill-designed. A regular technical evaluation of the tariff structure subsidies and of tariffs for non-subsidy custom-ers would help to maximize potential collection rates, increase overall revenue, and address en-ergy poverty. Although the cost of electricity sold might drop once Itaipú’s debt is paid off in 2023, Congress might also decide to decrease tariffs, which could further endanger the future financing needs of ANDE; therefore, it is critical to continue to monitor the difference between the cost of electricity sold and the tariff (see Chapter 7 for further discussion on the impact of the tariff).
77 Decarbonization Pathways for Paraguay’s Energy Sector
3. How to Cover Peak Demand Cost-Effectively
This chapter addresses the electricity “supply crunch” relative to the peak demand highlighted in Chapter 1 by introducing two models showing how to cover peak demand cost effectively. The first is a resource adequacy model showing the necessary investment in generation, storage, and inter-zonal transmission that minimizes the annual operational cost and annualized capital investment of the power system. The second model, already discussed in the previous chapter, examines the potential for regional electricity imports and exports in the Southern Cone region as a whole through seven dif-ferent scenarios. Neither of these models is a detailed engineering study of the full electricity distribu-tion, transmission, and system of Paraguay and its neighboring countries. Instead, they involve mod-eling as an aid to suggest potential pathways for Paraguay to explore in order to reduce the cost of covering peak demand. Moreover, any modeling of the future is fraught with challenges of assump-tions—whether of demand, supply, or costs. This chapter is divided into four sections. After describing the problem of peak demand in Paraguay in Section 1, Section 2 introduces the resource adequacy model and highlights the key findings from a high-level perspective (based on the technical report “Modeling: Understanding the potential cost-ef-fectiveness of options for Paraguay to meet both future energy and peak power needs”). Section 3 ex-plains the regional interconnection model, with both key findings and ideal scenarios for an optimistic outlook for Paraguay (based on the technical report SimSEE Simulation). Section 4 reflects on the find-ings of each of these studies and introduces the SIEPAC regional electric market system in Central America as a case study to show what a regional electricity market could look like for Paraguay in terms of effective political and financial frameworks. Section 5 summarizes the next steps and key recom-mendations for Paraguay to overcome the challenge of growing energy demand approaching 2050.
The Problem of Peak Demand in Paraguay
The Paraguayan electricity system operates using large blocks of electricity at any given time to satisfy peak demand. As a result, a set amount of electricity is generated to account for peak demand times, even if not all of the energy in the block is used during that time. If the peak demand reaches a certain threshold, ANDE releases a large amount of energy into the distribution system. This system is very costly, as shown by the two models described in the following sections. In addition, as discussed in Chapter 2, Paraguay’s annual highest peak demand is during the summer, late at night when the sun does not shine, which makes the penetration of solar power less effective without consideration of storage, demand reduction programs, complementarity with hydropower, and regional integration, as discussed in the following sections.
Required Domestic Investment to Cover Peak Demand Cost-Effectively
As mentioned in Section 2.3.2, ANDE estimates a supply crunch to occur approximately 2033–2036 when taking peak demand into account. To assess cost-effective solutions to address this supply crunch, this report presents the Paraguay Energy Resources Adequacy Model (PY-RAM), a co-optimized capacity-planning and dispatch model over a year of hourly operation. The model considers electricity load records, the topology of transmission lines between the countries’ six load zones, the availability of renewable energy resources, the cost structure of power generation and purchasing, and proposed
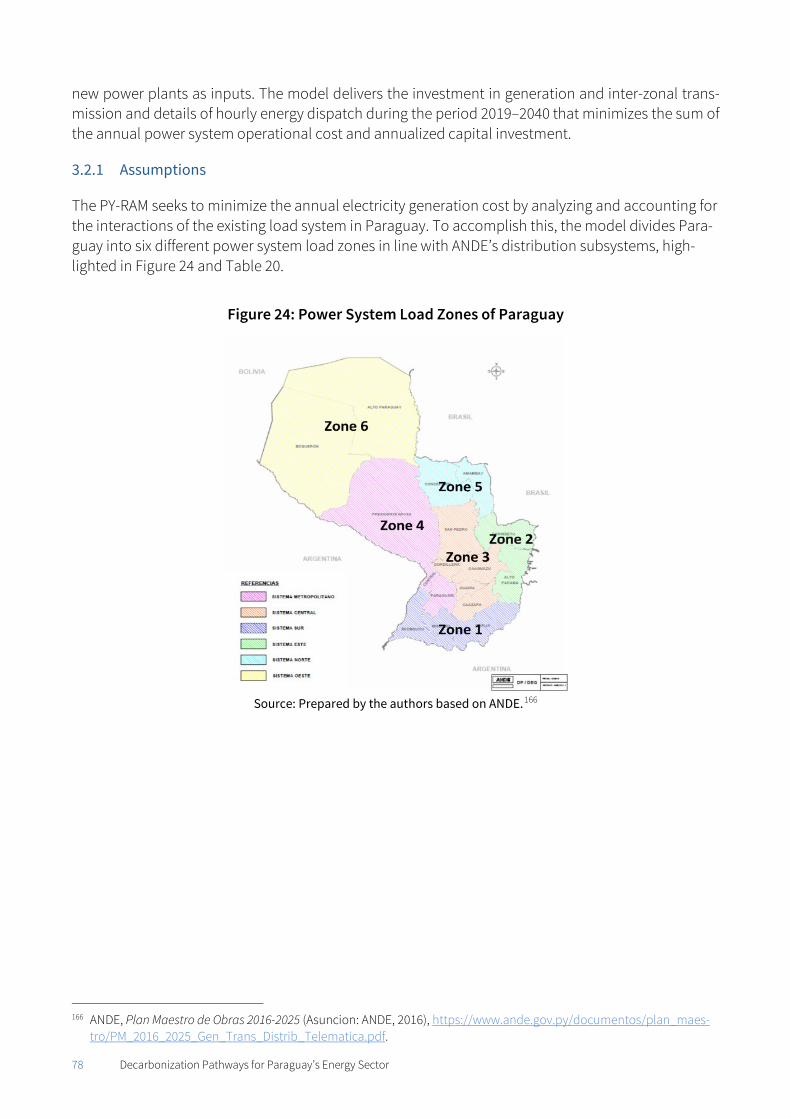
78 Decarbonization Pathways for Paraguay’s Energy Sector
new power plants as inputs. The model delivers the investment in generation and inter-zonal trans-mission and details of hourly energy dispatch during the period 2019–2040 that minimizes the sum of the annual power system operational cost and annualized capital investment.
3.2.1 Assumptions
The PY-RAM seeks to minimize the annual electricity generation cost by analyzing and accounting for the interactions of the existing load system in Paraguay. To accomplish this, the model divides Para-guay into six different power system load zones in line with ANDE’s distribution subsystems, high-lighted in Figure 24 and Table 20.
Figure 24: Power System Load Zones of Paraguay
Source: Prepared by the authors based on ANDE.166
166 ANDE, Plan Maestro de Obras 2016-2025 (Asuncion: ANDE, 2016), https://www.ande.gov.py/documentos/plan_maes-
tro/PM_2016_2025_Gen_Trans_Distrib_Telematica.pdf.
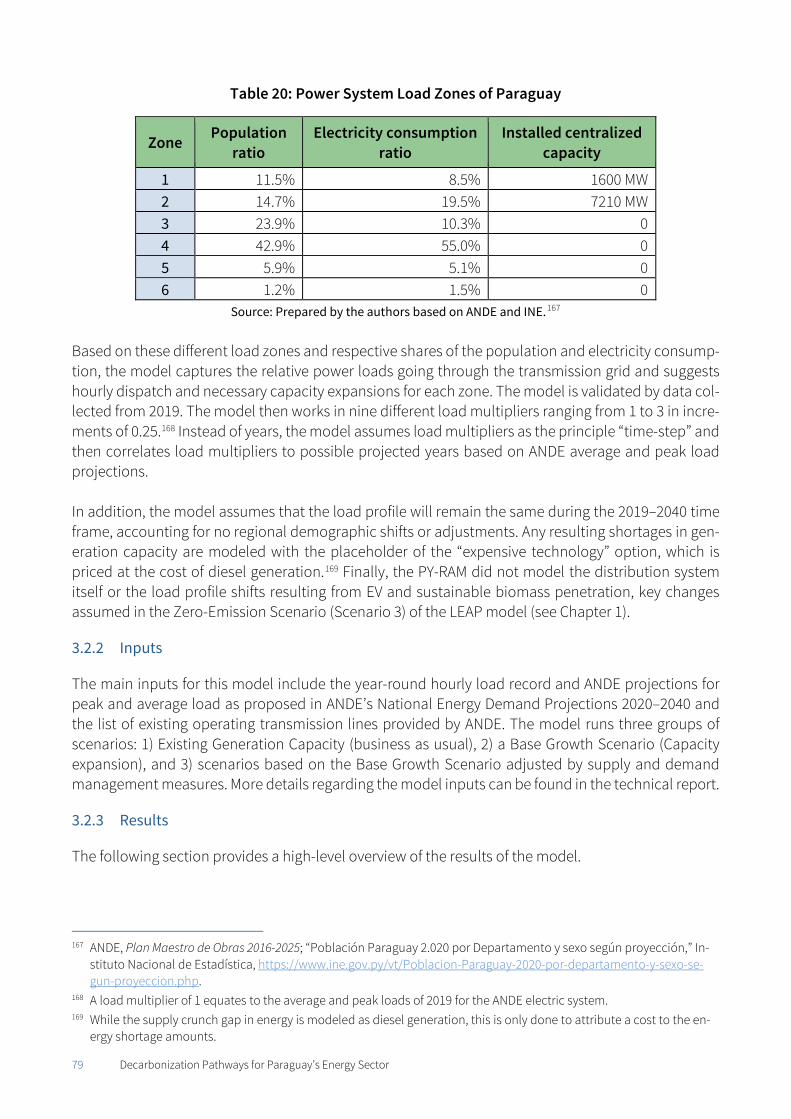
79 Decarbonization Pathways for Paraguay’s Energy Sector
Table 20: Power System Load Zones of Paraguay
Zone Population
ratio Electricity consumption
ratio Installed centralized
capacity
1 11.5% 8.5% 1600 MW 2 14.7% 19.5% 7210 MW 3 23.9% 10.3% 0 4 42.9% 55.0% 0 5 5.9% 5.1% 0 6 1.2% 1.5% 0
Source: Prepared by the authors based on ANDE and INE.167
Based on these different load zones and respective shares of the population and electricity consump-tion, the model captures the relative power loads going through the transmission grid and suggests hourly dispatch and necessary capacity expansions for each zone. The model is validated by data col-lected from 2019. The model then works in nine different load multipliers ranging from 1 to 3 in incre-ments of 0.25.168 Instead of years, the model assumes load multipliers as the principle “time-step” and then correlates load multipliers to possible projected years based on ANDE average and peak load projections. In addition, the model assumes that the load profile will remain the same during the 2019–2040 time frame, accounting for no regional demographic shifts or adjustments. Any resulting shortages in gen-eration capacity are modeled with the placeholder of the “expensive technology” option, which is priced at the cost of diesel generation.169 Finally, the PY-RAM did not model the distribution system itself or the load profile shifts resulting from EV and sustainable biomass penetration, key changes assumed in the Zero-Emission Scenario (Scenario 3) of the LEAP model (see Chapter 1).
3.2.2 Inputs
The main inputs for this model include the year-round hourly load record and ANDE projections for peak and average load as proposed in ANDE’s National Energy Demand Projections 2020–2040 and the list of existing operating transmission lines provided by ANDE. The model runs three groups of scenarios: 1) Existing Generation Capacity (business as usual), 2) a Base Growth Scenario (Capacity expansion), and 3) scenarios based on the Base Growth Scenario adjusted by supply and demand management measures. More details regarding the model inputs can be found in the technical report.
3.2.3 Results
The following section provides a high-level overview of the results of the model.
167 ANDE, Plan Maestro de Obras 2016-2025; “Población Paraguay 2.020 por Departamento y sexo según proyección,” In-
stituto Nacional de Estadística, https://www.ine.gov.py/vt/Poblacion-Paraguay-2020-por-departamento-y-sexo-se-gun-proyeccion.php.
168 A load multiplier of 1 equates to the average and peak loads of 2019 for the ANDE electric system. 169 While the supply crunch gap in energy is modeled as diesel generation, this is only done to attribute a cost to the en-
ergy shortage amounts.
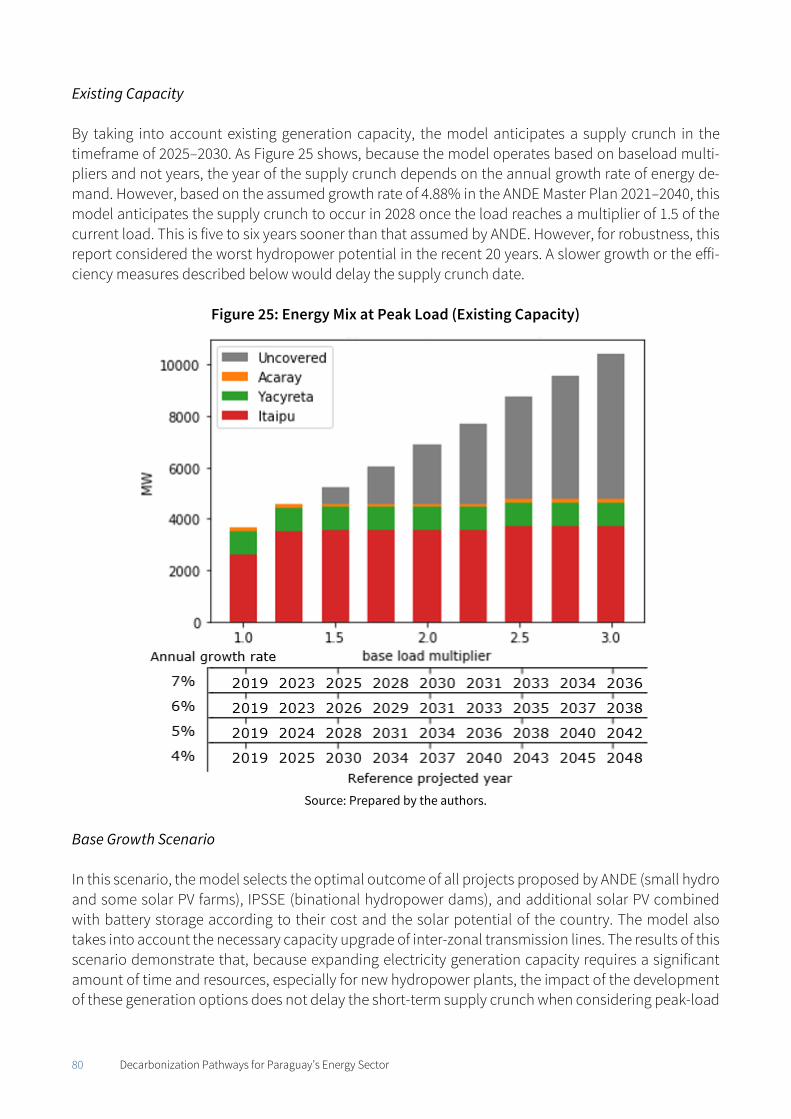
80 Decarbonization Pathways for Paraguay’s Energy Sector
Existing Capacity By taking into account existing generation capacity, the model anticipates a supply crunch in the timeframe of 2025–2030. As Figure 25 shows, because the model operates based on baseload multi-pliers and not years, the year of the supply crunch depends on the annual growth rate of energy de-mand. However, based on the assumed growth rate of 4.88% in the ANDE Master Plan 2021–2040, this model anticipates the supply crunch to occur in 2028 once the load reaches a multiplier of 1.5 of the current load. This is five to six years sooner than that assumed by ANDE. However, for robustness, this report considered the worst hydropower potential in the recent 20 years. A slower growth or the effi-ciency measures described below would delay the supply crunch date.
Figure 25: Energy Mix at Peak Load (Existing Capacity)
Source: Prepared by the authors.
Base Growth Scenario In this scenario, the model selects the optimal outcome of all projects proposed by ANDE (small hydro and some solar PV farms), IPSSE (binational hydropower dams), and additional solar PV combined with battery storage according to their cost and the solar potential of the country. The model also takes into account the necessary capacity upgrade of inter-zonal transmission lines. The results of this scenario demonstrate that, because expanding electricity generation capacity requires a significant amount of time and resources, especially for new hydropower plants, the impact of the development of these generation options does not delay the short-term supply crunch when considering peak-load
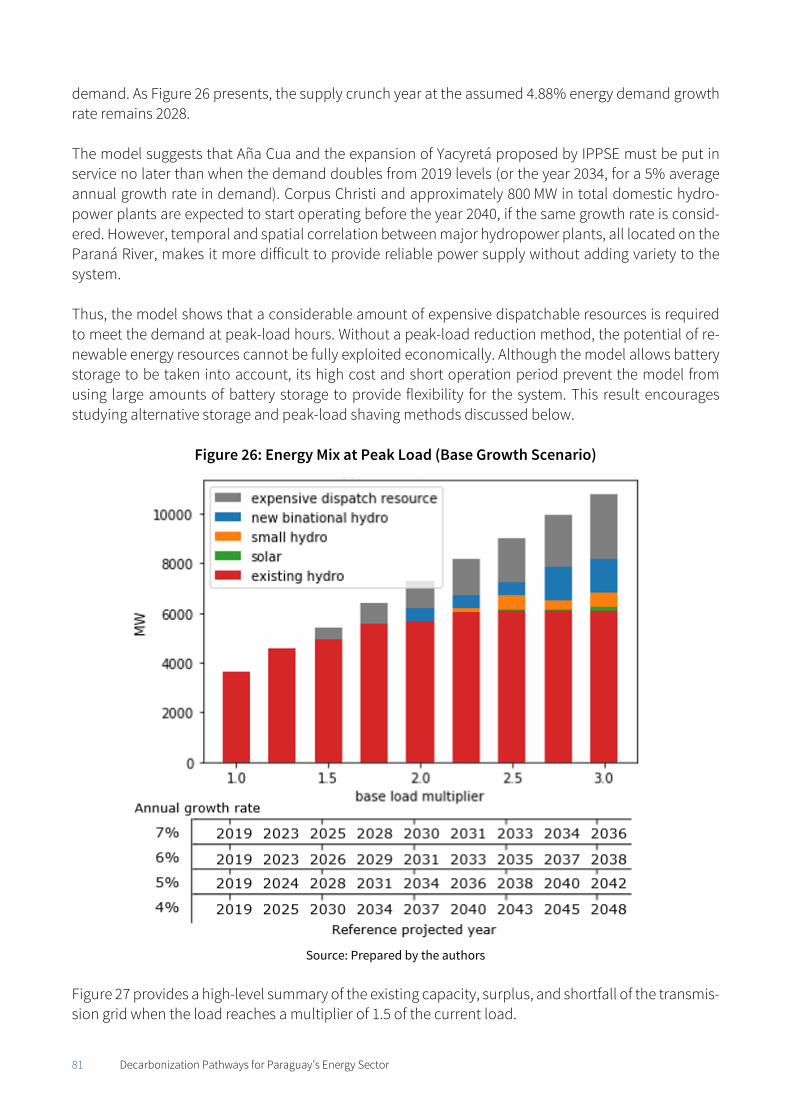
81 Decarbonization Pathways for Paraguay’s Energy Sector
demand. As Figure 26 presents, the supply crunch year at the assumed 4.88% energy demand growth rate remains 2028. The model suggests that Aña Cua and the expansion of Yacyretá proposed by IPPSE must be put in service no later than when the demand doubles from 2019 levels (or the year 2034, for a 5% average annual growth rate in demand). Corpus Christi and approximately 800 MW in total domestic hydro-power plants are expected to start operating before the year 2040, if the same growth rate is consid-ered. However, temporal and spatial correlation between major hydropower plants, all located on the Paraná River, makes it more difficult to provide reliable power supply without adding variety to the system. Thus, the model shows that a considerable amount of expensive dispatchable resources is required to meet the demand at peak-load hours. Without a peak-load reduction method, the potential of re-newable energy resources cannot be fully exploited economically. Although the model allows battery storage to be taken into account, its high cost and short operation period prevent the model from using large amounts of battery storage to provide flexibility for the system. This result encourages studying alternative storage and peak-load shaving methods discussed below.
Figure 26: Energy Mix at Peak Load (Base Growth Scenario)
Source: Prepared by the authors
Figure 27 provides a high-level summary of the existing capacity, surplus, and shortfall of the transmis-sion grid when the load reaches a multiplier of 1.5 of the current load.
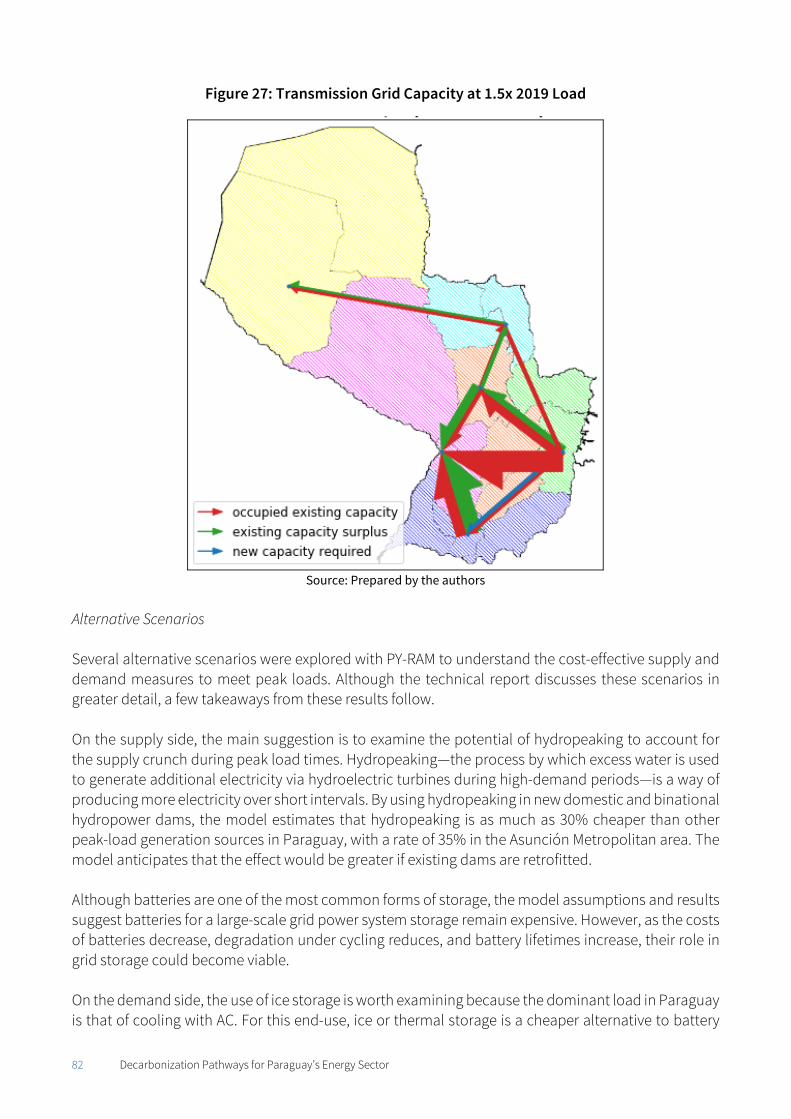
82 Decarbonization Pathways for Paraguay’s Energy Sector
Figure 27: Transmission Grid Capacity at 1.5x 2019 Load
Source: Prepared by the authors
Alternative Scenarios Several alternative scenarios were explored with PY-RAM to understand the cost-effective supply and demand measures to meet peak loads. Although the technical report discusses these scenarios in greater detail, a few takeaways from these results follow. On the supply side, the main suggestion is to examine the potential of hydropeaking to account for the supply crunch during peak load times. Hydropeaking—the process by which excess water is used to generate additional electricity via hydroelectric turbines during high-demand periods—is a way of producing more electricity over short intervals. By using hydropeaking in new domestic and binational hydropower dams, the model estimates that hydropeaking is as much as 30% cheaper than other peak-load generation sources in Paraguay, with a rate of 35% in the Asunción Metropolitan area. The model anticipates that the effect would be greater if existing dams are retrofitted. Although batteries are one of the most common forms of storage, the model assumptions and results suggest batteries for a large-scale grid power system storage remain expensive. However, as the costs of batteries decrease, degradation under cycling reduces, and battery lifetimes increase, their role in grid storage could become viable. On the demand side, the use of ice storage is worth examining because the dominant load in Paraguay is that of cooling with AC. For this end-use, ice or thermal storage is a cheaper alternative to battery
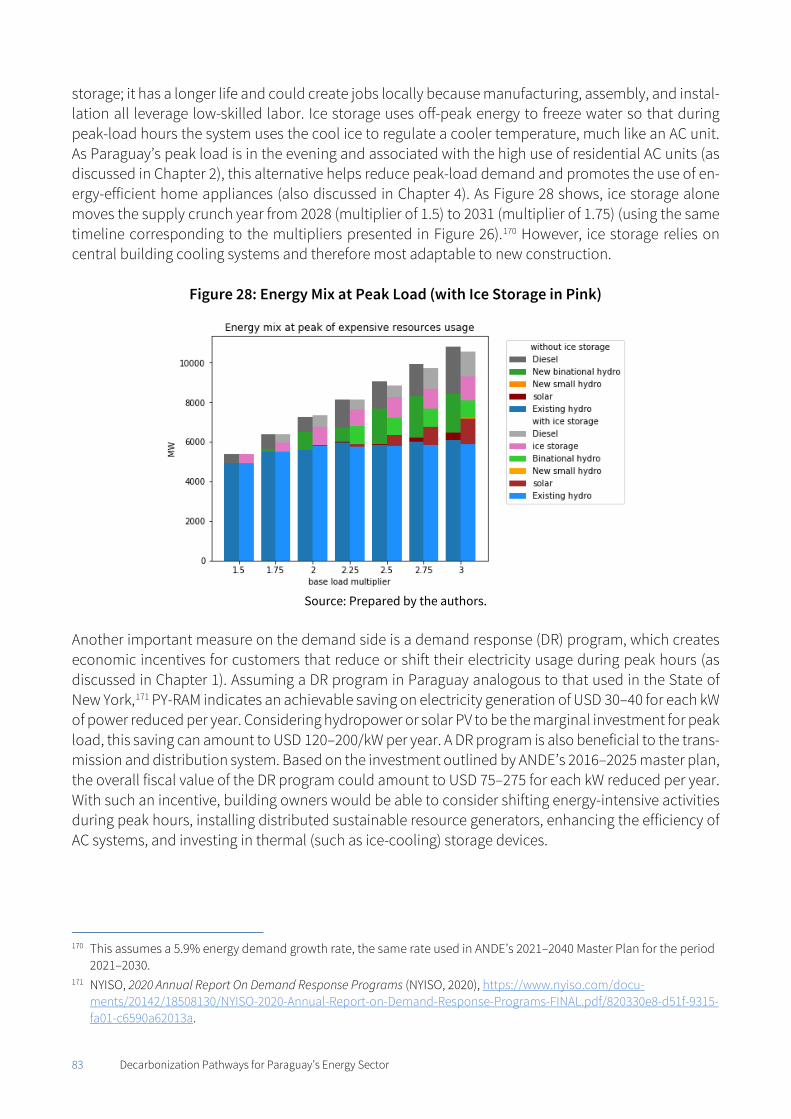
83 Decarbonization Pathways for Paraguay’s Energy Sector
storage; it has a longer life and could create jobs locally because manufacturing, assembly, and instal-lation all leverage low-skilled labor. Ice storage uses off-peak energy to freeze water so that during peak-load hours the system uses the cool ice to regulate a cooler temperature, much like an AC unit. As Paraguay’s peak load is in the evening and associated with the high use of residential AC units (as discussed in Chapter 2), this alternative helps reduce peak-load demand and promotes the use of en-ergy-efficient home appliances (also discussed in Chapter 4). As Figure 28 shows, ice storage alone moves the supply crunch year from 2028 (multiplier of 1.5) to 2031 (multiplier of 1.75) (using the same timeline corresponding to the multipliers presented in Figure 26).170 However, ice storage relies on central building cooling systems and therefore most adaptable to new construction.
Figure 28: Energy Mix at Peak Load (with Ice Storage in Pink)
Source: Prepared by the authors.
Another important measure on the demand side is a demand response (DR) program, which creates economic incentives for customers that reduce or shift their electricity usage during peak hours (as discussed in Chapter 1). Assuming a DR program in Paraguay analogous to that used in the State of New York,171 PY-RAM indicates an achievable saving on electricity generation of USD 30–40 for each kW of power reduced per year. Considering hydropower or solar PV to be the marginal investment for peak load, this saving can amount to USD 120–200/kW per year. A DR program is also beneficial to the trans-mission and distribution system. Based on the investment outlined by ANDE’s 2016–2025 master plan, the overall fiscal value of the DR program could amount to USD 75–275 for each kW reduced per year. With such an incentive, building owners would be able to consider shifting energy-intensive activities during peak hours, installing distributed sustainable resource generators, enhancing the efficiency of AC systems, and investing in thermal (such as ice-cooling) storage devices.
170 This assumes a 5.9% energy demand growth rate, the same rate used in ANDE’s 2021–2040 Master Plan for the period
2021–2030. 171 NYISO, 2020 Annual Report On Demand Response Programs (NYISO, 2020), https://www.nyiso.com/docu-
ments/20142/18508130/NYISO-2020-Annual-Report-on-Demand-Response-Programs-FINAL.pdf/820330e8-d51f-9315-fa01-c6590a62013a.
84 Decarbonization Pathways for Paraguay’s Energy Sector
Energy storage in combination with a DR program would facilitate the penetration of renewable en-ergy. The model simulated the solar and wind potential based on open-source databases,172 assuming future-looking installation expenditures. The model reveals that fixed solar PV panels and wind tur-bines have the largest capacity factor in northwestern Paraguay and that the value of solar and wind is amplified when introducing energy storage technologies. Distributed renewable energy generators through solar home systems and mini-grids can provide additional benefits to the distribution system, which are not evaluated in the model. Summary of Results From this analysis, the following conclusions emerge: 1. The role of energy storage is critical to catalyzing the development of variable renewable energy
sources such as solar PV and wind.
2. Given the time to develop utility-scale generation and the associated grid, Paraguay will experi-ence a supply crunch as early as 2028, even when taking into account generation expansion if growth continues as projected.
3. Cheaper commercial energy storage options such as ice storage and hydropeaking combined
with efficiency measures, such as DR programs, energy-efficient home appliances, and building codes (see Chapter 4), are worth examining. These will allow ANDE to considerably delay the sup-ply crunch and buy time, thereby reducing the time mismatch between the supply failure and the operation of new electricity generation infrastructure. They could enable ANDE to postpone the need for grid-connected batteries and take advantage of the reduction of their cost, which is ex-pected to halve in 10 years.
4. Investment in digitization as well as data collection and analysis is key to ensure timely monitor-
ing of this strategy. There is a backlog of deferred distribution system maintenance leading to both reliability issues and poor operational performance, as discussed in Chapter 1, and end-use appliance efficiency appears to be low, driven by highly price-conscious consumers that purchase low-capex imported window AC units without adequate benchmarking and standards. New con-struction, driven by urbanization and rising income, can drive rapid adoption of more energy-ef-ficient home appliances, which in turn can make it difficult for the utility to keep up with the het-erogeneous load.
Regional Connection Challenges and Findings
Currently, Paraguay finds itself interconnected with Brazil via Itaipú with 14,000 MW and Acaray with 200 MW (currently not operational) and with Argentina with Yacyretá with 3,100 MW, Guarambaré with 80 MW, and El Dorado with 30 MW. Brazil is interconnected with Argentina with a potential of 2100 MW and a 50 MW connection near Paso de los Libres. Uruguay is connected with Argentina with a 2,000 MW potential and Brazil with a 570 MW total potential. The major regional interconnections are iden-tified in Figure 29.
172 “Photovoltaic Geographical Information System,” EU Science Hub, European Commission, March 24, 2021,
https://ec.europa.eu/jrc/en/pvgis; “Integrated Surface Database,” National Centers for Environmental Information (NCEI), National Oceanic and Atmospheric Administration (NOAA), https://www.ncdc.noaa.gov/isd.
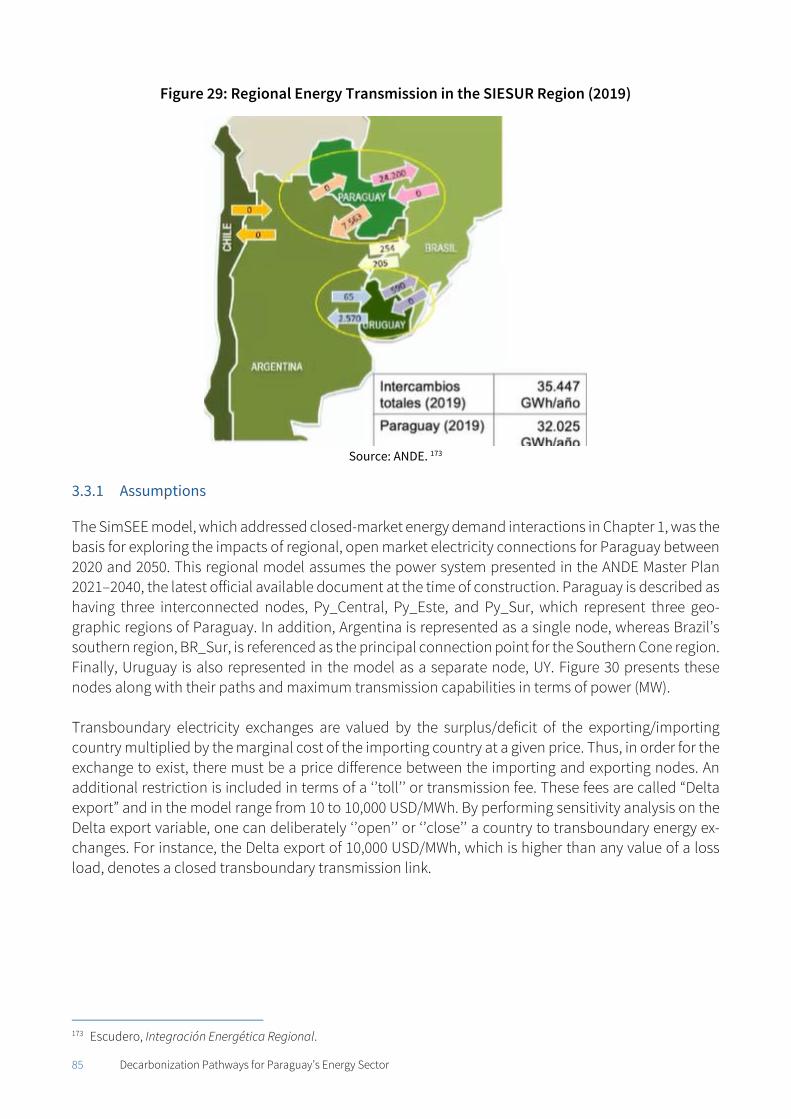
85 Decarbonization Pathways for Paraguay’s Energy Sector
Figure 29: Regional Energy Transmission in the SIESUR Region (2019)
Source: ANDE. 173
3.3.1 Assumptions
The SimSEE model, which addressed closed-market energy demand interactions in Chapter 1, was the basis for exploring the impacts of regional, open market electricity connections for Paraguay between 2020 and 2050. This regional model assumes the power system presented in the ANDE Master Plan 2021–2040, the latest official available document at the time of construction. Paraguay is described as having three interconnected nodes, Py_Central, Py_Este, and Py_Sur, which represent three geo-graphic regions of Paraguay. In addition, Argentina is represented as a single node, whereas Brazil’s southern region, BR_Sur, is referenced as the principal connection point for the Southern Cone region. Finally, Uruguay is also represented in the model as a separate node, UY. Figure 30 presents these nodes along with their paths and maximum transmission capabilities in terms of power (MW). Transboundary electricity exchanges are valued by the surplus/deficit of the exporting/importing country multiplied by the marginal cost of the importing country at a given price. Thus, in order for the exchange to exist, there must be a price difference between the importing and exporting nodes. An additional restriction is included in terms of a ‘’toll’’ or transmission fee. These fees are called “Delta export” and in the model range from 10 to 10,000 USD/MWh. By performing sensitivity analysis on the Delta export variable, one can deliberately ‘’open’’ or ‘’close’’ a country to transboundary energy ex-changes. For instance, the Delta export of 10,000 USD/MWh, which is higher than any value of a loss load, denotes a closed transboundary transmission link.
173 Escudero, Integración Energética Regional.
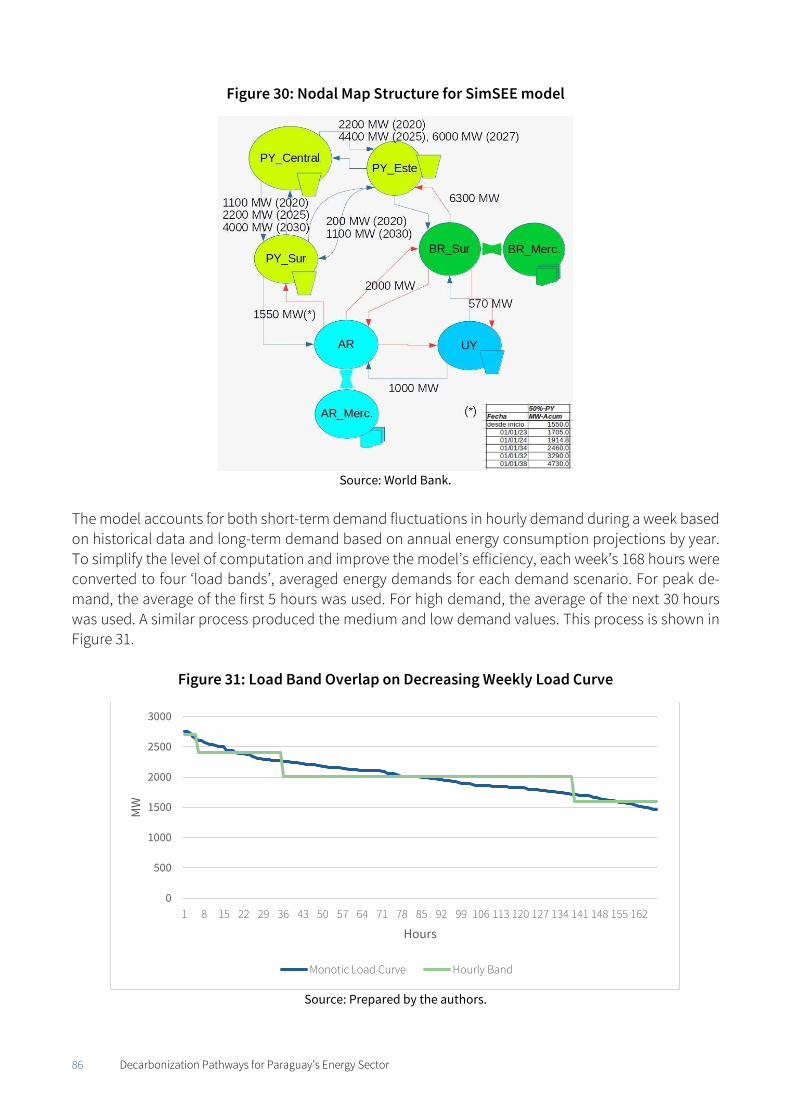
86 Decarbonization Pathways for Paraguay’s Energy Sector
Figure 30: Nodal Map Structure for SimSEE model
Source: World Bank.
The model accounts for both short-term demand fluctuations in hourly demand during a week based on historical data and long-term demand based on annual energy consumption projections by year. To simplify the level of computation and improve the model’s efficiency, each week’s 168 hours were converted to four ‘load bands’, averaged energy demands for each demand scenario. For peak de-mand, the average of the first 5 hours was used. For high demand, the average of the next 30 hours was used. A similar process produced the medium and low demand values. This process is shown in Figure 31.
Figure 31: Load Band Overlap on Decreasing Weekly Load Curve
Source: Prepared by the authors.
0
500
1000
1500
2000
2500
3000
1 8 15 22 29 36 43 50 57 64 71 78 85 92 99 106 113 120 127 134 141 148 155 162
MW
Hours
Monotic Load Curve Hourly Band
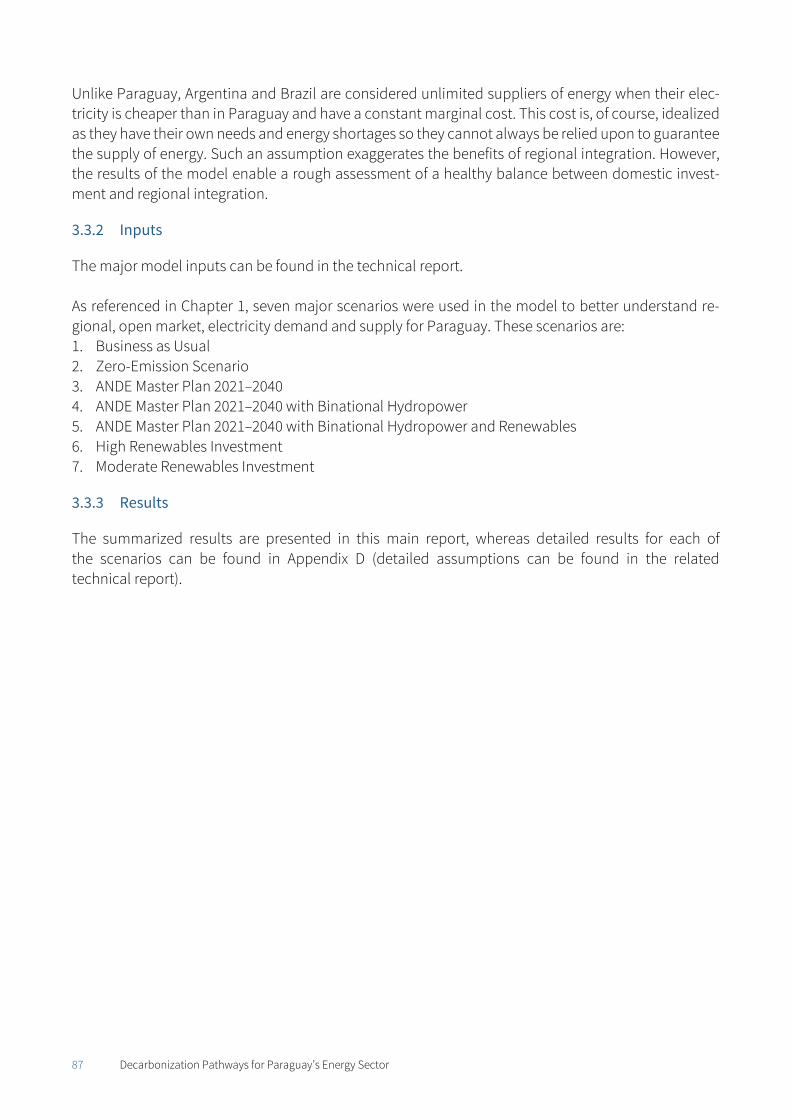
87 Decarbonization Pathways for Paraguay’s Energy Sector
Unlike Paraguay, Argentina and Brazil are considered unlimited suppliers of energy when their elec-tricity is cheaper than in Paraguay and have a constant marginal cost. This cost is, of course, idealized as they have their own needs and energy shortages so they cannot always be relied upon to guarantee the supply of energy. Such an assumption exaggerates the benefits of regional integration. However, the results of the model enable a rough assessment of a healthy balance between domestic invest-ment and regional integration.
3.3.2 Inputs
The major model inputs can be found in the technical report. As referenced in Chapter 1, seven major scenarios were used in the model to better understand re-gional, open market, electricity demand and supply for Paraguay. These scenarios are: 1. Business as Usual 2. Zero-Emission Scenario 3. ANDE Master Plan 2021–2040 4. ANDE Master Plan 2021–2040 with Binational Hydropower 5. ANDE Master Plan 2021–2040 with Binational Hydropower and Renewables 6. High Renewables Investment 7. Moderate Renewables Investment
3.3.3 Results
The summarized results are presented in this main report, whereas detailed results for each of the scenarios can be found in Appendix D (detailed assumptions can be found in the related technical report).
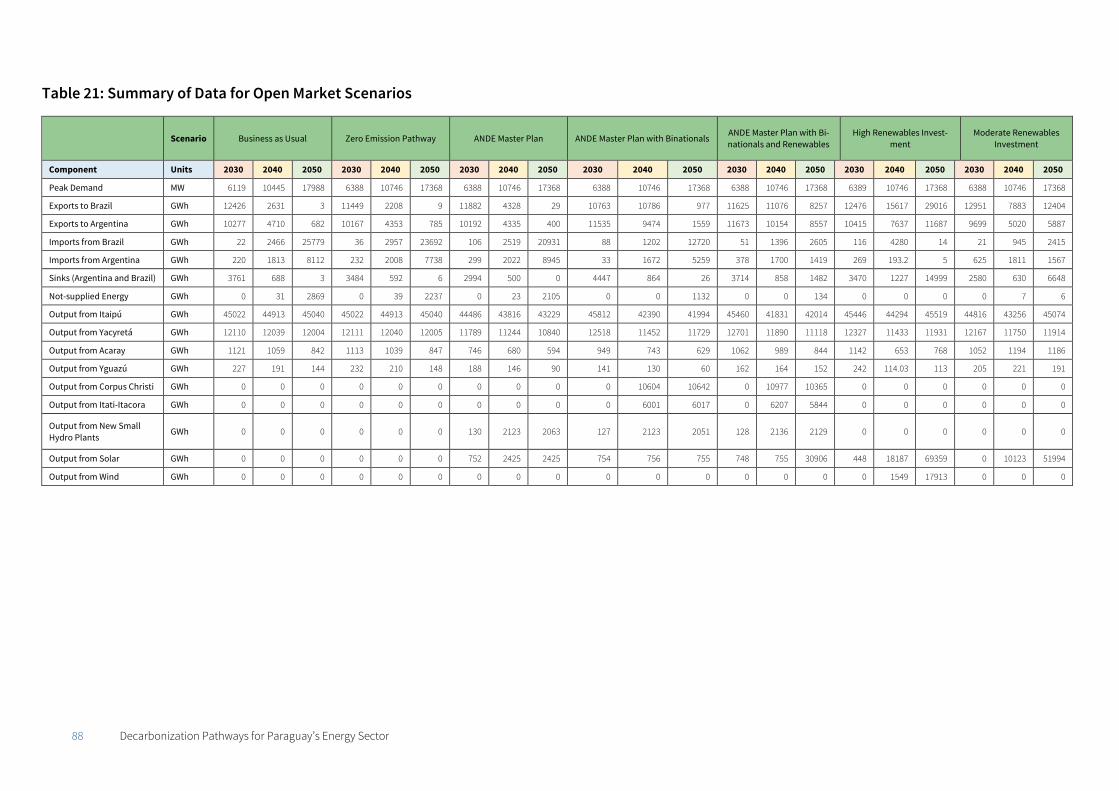
88 Decarbonization Pathways for Paraguay’s Energy Sector
Table 21: Summary of Data for Open Market Scenarios
Scenario Business as Usual Zero Emission Pathway ANDE Master Plan ANDE Master Plan with Binationals ANDE Master Plan with Bi-nationals and Renewables
High Renewables Invest-ment
Moderate Renewables Investment
Component Units 2030 2040 2050 2030 2040 2050 2030 2040 2050 2030 2040 2050 2030 2040 2050 2030 2040 2050 2030 2040 2050
Peak Demand MW 6119 10445 17988 6388 10746 17368 6388 10746 17368 6388 10746 17368 6388 10746 17368 6389 10746 17368 6388 10746 17368
Exports to Brazil GWh 12426 2631 3 11449 2208 9 11882 4328 29 10763 10786 977 11625 11076 8257 12476 15617 29016 12951 7883 12404
Exports to Argentina GWh 10277 4710 682 10167 4353 785 10192 4335 400 11535 9474 1559 11673 10154 8557 10415 7637 11687 9699 5020 5887
Imports from Brazil GWh 22 2466 25779 36 2957 23692 106 2519 20931 88 1202 12720 51 1396 2605 116 4280 14 21 945 2415
Imports from Argentina GWh 220 1813 8112 232 2008 7738 299 2022 8945 33 1672 5259 378 1700 1419 269 193.2 5 625 1811 1567
Sinks (Argentina and Brazil) GWh 3761 688 3 3484 592 6 2994 500 0 4447 864 26 3714 858 1482 3470 1227 14999 2580 630 6648
Not-supplied Energy GWh 0 31 2869 0 39 2237 0 23 2105 0 0 1132 0 0 134 0 0 0 0 7 6
Output from Itaipú GWh 45022 44913 45040 45022 44913 45040 44486 43816 43229 45812 42390 41994 45460 41831 42014 45446 44294 45519 44816 43256 45074
Output from Yacyretá GWh 12110 12039 12004 12111 12040 12005 11789 11244 10840 12518 11452 11729 12701 11890 11118 12327 11433 11931 12167 11750 11914
Output from Acaray GWh 1121 1059 842 1113 1039 847 746 680 594 949 743 629 1062 989 844 1142 653 768 1052 1194 1186
Output from Yguazú GWh 227 191 144 232 210 148 188 146 90 141 130 60 162 164 152 242 114.03 113 205 221 191
Output from Corpus Christi GWh 0 0 0 0 0 0 0 0 0 0 10604 10642 0 10977 10365 0 0 0 0 0 0
Output from Itati-Itacora GWh 0 0 0 0 0 0 0 0 0 0 6001 6017 0 6207 5844 0 0 0 0 0 0
Output from New Small Hydro Plants
GWh 0 0 0 0 0 0 130 2123 2063 127 2123 2051 128 2136 2129 0 0 0 0 0 0
Output from Solar GWh 0 0 0 0 0 0 752 2425 2425 754 756 755 748 755 30906 448 18187 69359 0 10123 51994
Output from Wind GWh 0 0 0 0 0 0 0 0 0 0 0 0 0 0 0 0 1549 17913 0 0 0
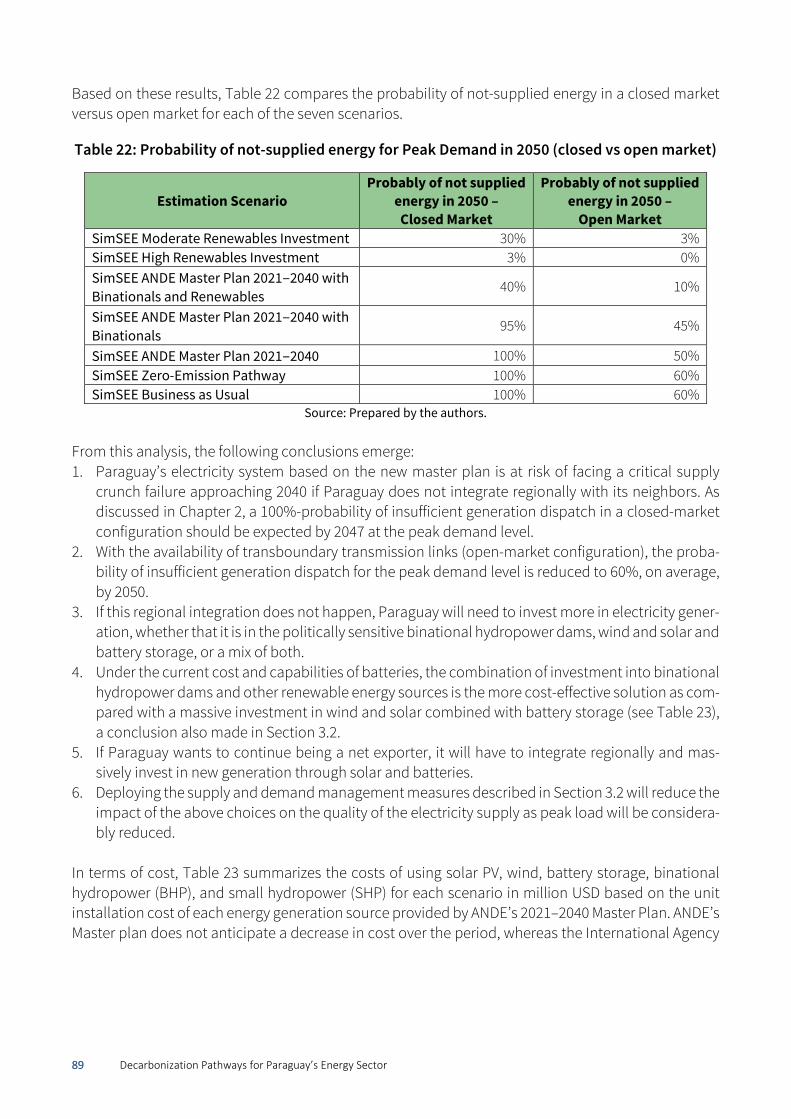
89 Decarbonization Pathways for Paraguay’s Energy Sector
Based on these results, Table 22 compares the probability of not-supplied energy in a closed market versus open market for each of the seven scenarios.
Table 22: Probability of not-supplied energy for Peak Demand in 2050 (closed vs open market)
Estimation Scenario Probably of not supplied
energy in 2050 – Closed Market
Probably of not supplied energy in 2050 –
Open Market SimSEE Moderate Renewables Investment 30% 3% SimSEE High Renewables Investment 3% 0% SimSEE ANDE Master Plan 2021–2040 with Binationals and Renewables
40% 10%
SimSEE ANDE Master Plan 2021–2040 with Binationals
95% 45%
SimSEE ANDE Master Plan 2021–2040 100% 50% SimSEE Zero-Emission Pathway 100% 60% SimSEE Business as Usual 100% 60%
Source: Prepared by the authors. From this analysis, the following conclusions emerge: 1. Paraguay’s electricity system based on the new master plan is at risk of facing a critical supply
crunch failure approaching 2040 if Paraguay does not integrate regionally with its neighbors. As discussed in Chapter 2, a 100%-probability of insufficient generation dispatch in a closed-market configuration should be expected by 2047 at the peak demand level.
2. With the availability of transboundary transmission links (open-market configuration), the proba-bility of insufficient generation dispatch for the peak demand level is reduced to 60%, on average, by 2050.
3. If this regional integration does not happen, Paraguay will need to invest more in electricity gener-ation, whether that it is in the politically sensitive binational hydropower dams, wind and solar and battery storage, or a mix of both.
4. Under the current cost and capabilities of batteries, the combination of investment into binational hydropower dams and other renewable energy sources is the more cost-effective solution as com-pared with a massive investment in wind and solar combined with battery storage (see Table 23), a conclusion also made in Section 3.2.
5. If Paraguay wants to continue being a net exporter, it will have to integrate regionally and mas-sively invest in new generation through solar and batteries.
6. Deploying the supply and demand management measures described in Section 3.2 will reduce the impact of the above choices on the quality of the electricity supply as peak load will be considera-bly reduced.
In terms of cost, Table 23 summarizes the costs of using solar PV, wind, battery storage, binational hydropower (BHP), and small hydropower (SHP) for each scenario in million USD based on the unit installation cost of each energy generation source provided by ANDE’s 2021–2040 Master Plan. ANDE’s Master plan does not anticipate a decrease in cost over the period, whereas the International Agency
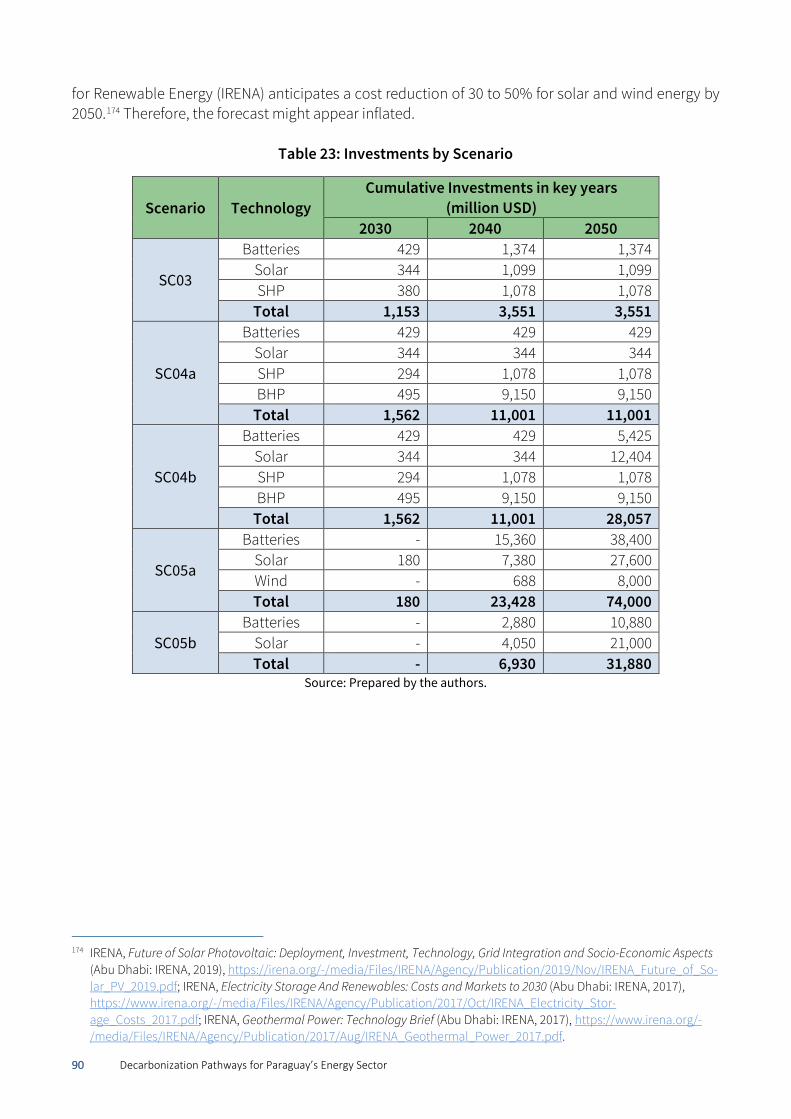
90 Decarbonization Pathways for Paraguay’s Energy Sector
for Renewable Energy (IRENA) anticipates a cost reduction of 30 to 50% for solar and wind energy by 2050.174 Therefore, the forecast might appear inflated.
Table 23: Investments by Scenario
Scenario Technology Cumulative Investments in key years
(million USD) 2030 2040 2050
SC03
Batteries 429 1,374 1,374 Solar 344 1,099 1,099 SHP 380 1,078 1,078
Total 1,153 3,551 3,551
SC04a
Batteries 429 429 429 Solar 344 344 344 SHP 294 1,078 1,078 BHP 495 9,150 9,150
Total 1,562 11,001 11,001
SC04b
Batteries 429 429 5,425 Solar 344 344 12,404 SHP 294 1,078 1,078 BHP 495 9,150 9,150
Total 1,562 11,001 28,057
SC05a
Batteries - 15,360 38,400 Solar 180 7,380 27,600 Wind - 688 8,000 Total 180 23,428 74,000
SC05b Batteries - 2,880 10,880
Solar - 4,050 21,000 Total - 6,930 31,880
Source: Prepared by the authors.
174 IRENA, Future of Solar Photovoltaic: Deployment, Investment, Technology, Grid Integration and Socio-Economic Aspects
(Abu Dhabi: IRENA, 2019), https://irena.org/-/media/Files/IRENA/Agency/Publication/2019/Nov/IRENA_Future_of_So-lar_PV_2019.pdf; IRENA, Electricity Storage And Renewables: Costs and Markets to 2030 (Abu Dhabi: IRENA, 2017), https://www.irena.org/-/media/Files/IRENA/Agency/Publication/2017/Oct/IRENA_Electricity_Stor-age_Costs_2017.pdf; IRENA, Geothermal Power: Technology Brief (Abu Dhabi: IRENA, 2017), https://www.irena.org/-/media/Files/IRENA/Agency/Publication/2017/Aug/IRENA_Geothermal_Power_2017.pdf.
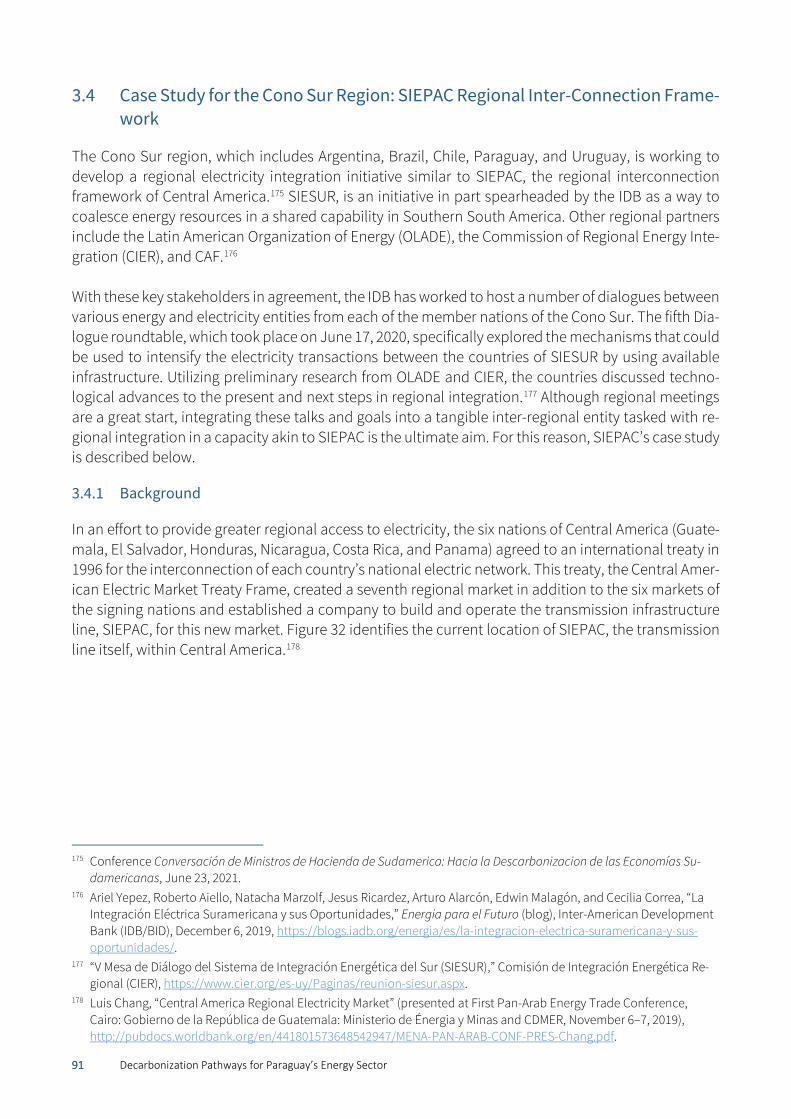
91 Decarbonization Pathways for Paraguay’s Energy Sector
Case Study for the Cono Sur Region: SIEPAC Regional Inter-Connection Frame-work
The Cono Sur region, which includes Argentina, Brazil, Chile, Paraguay, and Uruguay, is working to develop a regional electricity integration initiative similar to SIEPAC, the regional interconnection framework of Central America.175 SIESUR, is an initiative in part spearheaded by the IDB as a way to coalesce energy resources in a shared capability in Southern South America. Other regional partners include the Latin American Organization of Energy (OLADE), the Commission of Regional Energy Inte-gration (CIER), and CAF.176 With these key stakeholders in agreement, the IDB has worked to host a number of dialogues between various energy and electricity entities from each of the member nations of the Cono Sur. The fifth Dia-logue roundtable, which took place on June 17, 2020, specifically explored the mechanisms that could be used to intensify the electricity transactions between the countries of SIESUR by using available infrastructure. Utilizing preliminary research from OLADE and CIER, the countries discussed techno-logical advances to the present and next steps in regional integration.177 Although regional meetings are a great start, integrating these talks and goals into a tangible inter-regional entity tasked with re-gional integration in a capacity akin to SIEPAC is the ultimate aim. For this reason, SIEPAC’s case study is described below.
3.4.1 Background
In an effort to provide greater regional access to electricity, the six nations of Central America (Guate-mala, El Salvador, Honduras, Nicaragua, Costa Rica, and Panama) agreed to an international treaty in 1996 for the interconnection of each country’s national electric network. This treaty, the Central Amer-ican Electric Market Treaty Frame, created a seventh regional market in addition to the six markets of the signing nations and established a company to build and operate the transmission infrastructure line, SIEPAC, for this new market. Figure 32 identifies the current location of SIEPAC, the transmission line itself, within Central America.178
175 Conference Conversación de Ministros de Hacienda de Sudamerica: Hacia la Descarbonizacion de las Economías Su-
damericanas, June 23, 2021. 176 Ariel Yepez, Roberto Aiello, Natacha Marzolf, Jesus Ricardez, Arturo Alarcón, Edwin Malagón, and Cecilia Correa, “La
Integración Eléctrica Suramericana y sus Oportunidades,” Energia para el Futuro (blog), Inter-American Development Bank (IDB/BID), December 6, 2019, https://blogs.iadb.org/energia/es/la-integracion-electrica-suramericana-y-sus-oportunidades/.
177 “V Mesa de Diálogo del Sistema de Integración Energética del Sur (SIESUR),” Comisión de Integración Energética Re-gional (CIER), https://www.cier.org/es-uy/Paginas/reunion-siesur.aspx.
178 Luis Chang, “Central America Regional Electricity Market” (presented at First Pan-Arab Energy Trade Conference, Cairo: Gobierno de la República de Guatemala: Ministerio de Énergia y Minas and CDMER, November 6–7, 2019), http://pubdocs.worldbank.org/en/441801573648542947/MENA-PAN-ARAB-CONF-PRES-Chang.pdf.
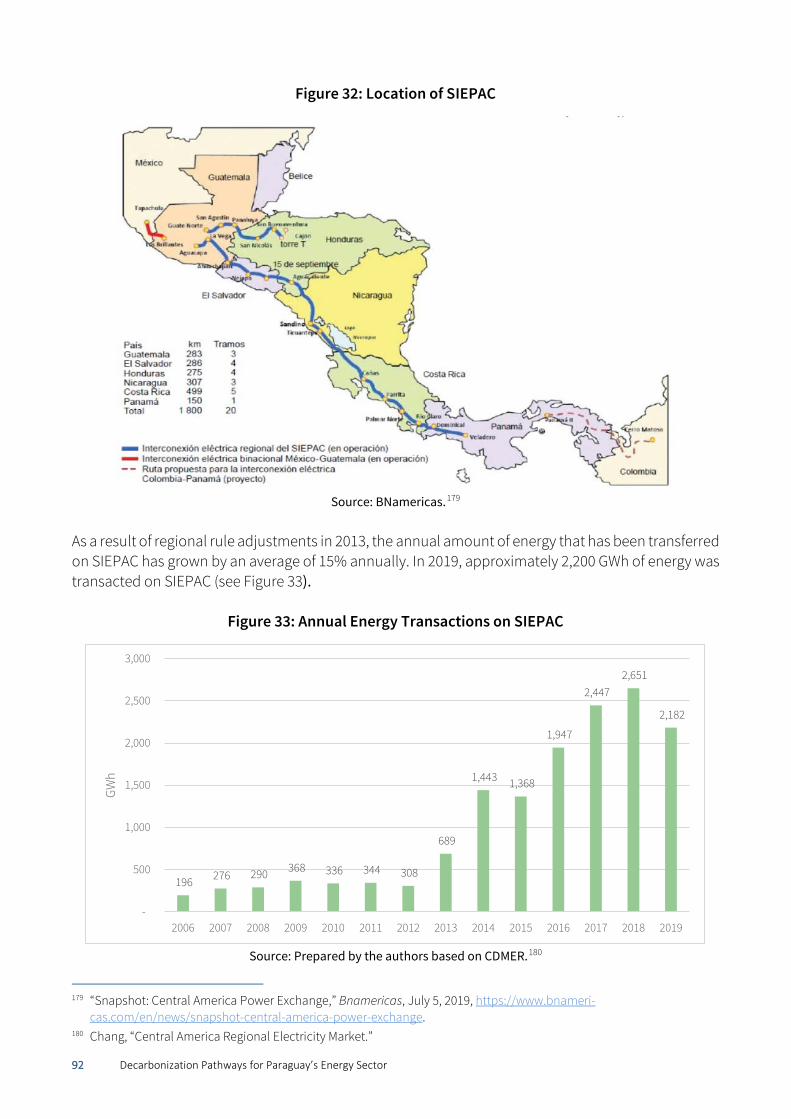
92 Decarbonization Pathways for Paraguay’s Energy Sector
Figure 32: Location of SIEPAC
Source: BNamericas.179
As a result of regional rule adjustments in 2013, the annual amount of energy that has been transferred on SIEPAC has grown by an average of 15% annually. In 2019, approximately 2,200 GWh of energy was transacted on SIEPAC (see Figure 33).
Figure 33: Annual Energy Transactions on SIEPAC
Source: Prepared by the authors based on CDMER.180
179 “Snapshot: Central America Power Exchange,” Bnamericas, July 5, 2019, https://www.bnameri-
cas.com/en/news/snapshot-central-america-power-exchange. 180 Chang, “Central America Regional Electricity Market.”
196 276 290 368 336 344 308
689
1,443 1,368
1,947
2,447 2,651
2,182
-
500
1,000
1,500
2,000
2,500
3,000
2006 2007 2008 2009 2010 2011 2012 2013 2014 2015 2016 2017 2018 2019
GWh
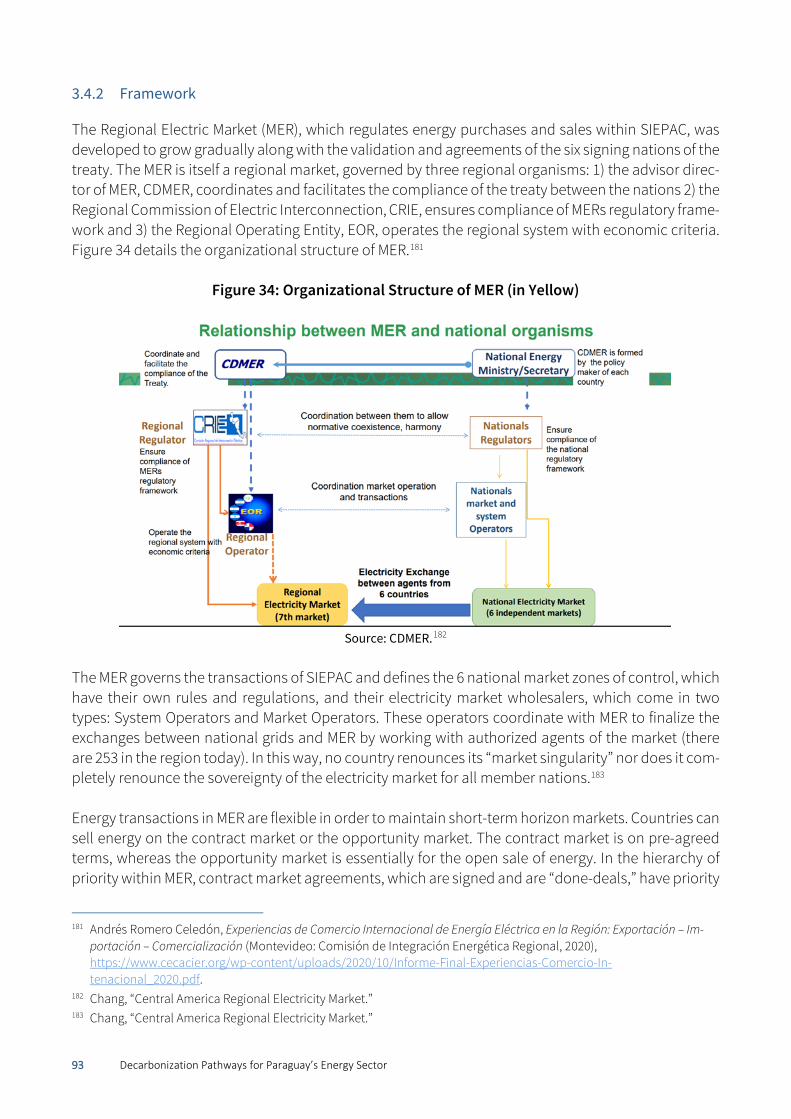
93 Decarbonization Pathways for Paraguay’s Energy Sector
3.4.2 Framework
The Regional Electric Market (MER), which regulates energy purchases and sales within SIEPAC, was developed to grow gradually along with the validation and agreements of the six signing nations of the treaty. The MER is itself a regional market, governed by three regional organisms: 1) the advisor direc-tor of MER, CDMER, coordinates and facilitates the compliance of the treaty between the nations 2) the Regional Commission of Electric Interconnection, CRIE, ensures compliance of MERs regulatory frame-work and 3) the Regional Operating Entity, EOR, operates the regional system with economic criteria. Figure 34 details the organizational structure of MER.181
Figure 34: Organizational Structure of MER (in Yellow)
Source: CDMER.182
The MER governs the transactions of SIEPAC and defines the 6 national market zones of control, which have their own rules and regulations, and their electricity market wholesalers, which come in two types: System Operators and Market Operators. These operators coordinate with MER to finalize the exchanges between national grids and MER by working with authorized agents of the market (there are 253 in the region today). In this way, no country renounces its “market singularity” nor does it com-pletely renounce the sovereignty of the electricity market for all member nations.183 Energy transactions in MER are flexible in order to maintain short-term horizon markets. Countries can sell energy on the contract market or the opportunity market. The contract market is on pre-agreed terms, whereas the opportunity market is essentially for the open sale of energy. In the hierarchy of priority within MER, contract market agreements, which are signed and are “done-deals,” have priority
181 Andrés Romero Celedón, Experiencias de Comercio Internacional de Energía Eléctrica en la Región: Exportación – Im-
portación – Comercialización (Montevideo: Comisión de Integración Energética Regional, 2020), https://www.cecacier.org/wp-content/uploads/2020/10/Informe-Final-Experiencias-Comercio-In-tenacional_2020.pdf.
182 Chang, “Central America Regional Electricity Market.” 183 Chang, “Central America Regional Electricity Market.”
94 Decarbonization Pathways for Paraguay’s Energy Sector
for sale and consumption over contracts that are not yet signed. Additionally, contracts that are not signed have priority over agreements in the opportunity market. 184 Approximately 34% of transactions take place on the opportunity market, whereas the remaining 66% take place on the contract market.185
3.4.3 Country Examples
Not all countries interact with the MER to the same degree. In fact, there is substantial variation both in terms of countries that inject energy into MER and those that draw out energy. Two countries that stand out in particular are El Salvador and Guatemala. El Salvador El Salvador operates as a net importer of energy from SIEPAC and the MER through flexible regulation and a free internal market. All agents within El Salvador can purchase and sell energy at the national or regional level to satisfy final user demand. In the wholesale market of El Salvador, there exists a Market of Contracts in which agreements are freely established between participants in the market and a System Market Regulator (MRS). The MRS is the operating organism that settles discrepancies between committed energy sales and real energy sales within El Salvador’s market on a daily basis. These interactions are unique to the country as it has established its own national policy to reflect the open opportunity to have flexible transactions with MER. 186 Guatemala Guatemala operates as a net exporter of energy to SIEPAC and the MER by considering the sale and purchase of blocks of energy at least 2 MW in size. These blocks must be associated with an efficient firm/agent demand or offer to be considered by Guatemala’s domestic regulation. The same limits apply to importers and exporters, and the specific regulation distinguishes between demand and sup-ply commercialization. Demand commercialization is the activity in which the trader assumes all the commercial responsibility of a user, whereas supply commercialization is the activity in which the trader assumes the commercial responsibilities of a participant producer within Guatemala. In order to make export transactions in the short term (less than one year), the exporter must confirm that they have a guaranteed contract with a supply firm that is not compromised by another contract that would then cover a demand firm or potential reserve of energy. In other words, Guatemala regulates internal competition between supply and demand markets to ensure that there is a sufficient supply of energy for export to the MER. 187
3.4.4 Lessons Learned
Twenty-four years of service as a Regional Electricity Market has made the SIEPAC a source of infor-mation on the successes of a regionally integrated electricity market. To have a successful regional market, it must be very well regulated in accordance with national electricity markets. To accomplish this, the regional regulator organism (CRIE) must work to constantly coordinate with national regula-
184 Romero Celedón, Experiencias de Comercio Internacional de Energía Eléctrica en la Región. 185 Chang, “Central America Regional Electricity Market.” 186 Romero Celedón, Experiencias de Comercio Internacional de Energía Eléctrica en la Región. 187 Romero Celedón, Experiencias de Comercio Internacional de Energía Eléctrica en la Región.
95 Decarbonization Pathways for Paraguay’s Energy Sector
tion entities from each country to ensure that the rules pertaining to the MER are consistent with na-tional guidelines. Additionally, the regional regulator must respect the market model of each country without attempts to supersede jurisdiction. For the MER to be successful, it had to yield autonomy to the states and give them the ability to deter-mine how to harmonize not only with other nations but with the regional electric grid as a whole. Each country, when allowed to adapt individual rules to engage market agents to perform transactions on the regional market, was able to hedge against domestic loss and fill demand and supply shortage and excess. Such rules to hedge against a lack of energy within each of the six countries are necessary to guarantee a strong regional interface between and among each nation within the regional grid.
3.4.5 Steps Forward
Although the SIEPAC project has been successful and the metrics for this success are quantifiable, there are a number of challenges that remain to further develop the system in coming years. Currently, the treaty nations are in the process of drafting a third protocol amendment, an addendum to the current system that would seek to improve infrastructure and direct regulation of the system moving forward.188 The third protocol is working to address institutional weakness by: 1) reinforcing the role of CDMER as the policy branch of the MER, whereas CRIE and EOR are the technical branches of the MER with no control over policy regulation and 2) creating a regional committee of Appellations, which will help advise resolutions and adjustments to rules issued by CRIE.189 Moreover, the system’s de-signed maximum capacity of 300 MW has not yet been reached. Collaboration between national re-gional organizations to highlight where investment for national transmission lines needs to take place will help ease SIEPAC use at a national level.
In the future, the challenge with the MER will be how to effectively incorporate states that are not par-ties to the treaty. Creating guidelines for external participation in the MER and SIEPAC will require the creation of political, technical, and regulatory principles as well as the necessary infrastructure to cre-ate such opportunities.190
Recommendations for Cost-Effectively Covering Energy Demand
1. Cost-effective commercial energy storage options such as ice storage and hydropeaking com-bined with the deployment of efficiency measures such as DR programs as well as energy-efficient home appliances and building codes (see Chapter 4), will allow ANDE to considerably delay the supply crunch and buy time, thereby reducing the time mismatch between the supply failure and the operation of new electricity generation infrastructure. It will also enable ANDE to seize the cost advantage of battery storage, whose cost is expected to halve in 10 years. Investment in digitization as well as data collection and analysis, as discussed in Chapter 1, is key to ensuring that this strat-egy is monitored in a timely manner.
2. Creating a regional electricity market from which additional electricity could be purchased would
limit the need for new generation capacity in the country and create a less expensive alternative to fill the generation/demand gap, delaying the supply crunch in various scenarios by 8 to 10 years.
188 Chang, “Central America Regional Electricity Market.” 189 Chang, “Central America Regional Electricity Market.” 190 Chang, “Central America Regional Electricity Market.”
96 Decarbonization Pathways for Paraguay’s Energy Sector
Paraguay’s large development of solar energy (and to a lesser extent, wind) with battery (beyond what is anticipated in the 2021–2040 Master Plan) could help ensure national security of supply while turning Paraguay into an electricity exporter again. Moderating their investment will involve the development of binational hydropower dams. The role of already cost-effective energy storage (such as hydropeaking and ice storage) is critical to catalyzing the development of solar PV and wind in Paraguay. Implementing demand response programs and an economy-wide energy effi-ciency program will help optimize the interaction with the regional market.191
3. Regional integration is fraught with political economy challenges and national energy security concerns. Overcoming these challenges will require SIESUR to emulate the governance and mar-ket rules of SIEPAC, enabling regional integration while respecting the sovereignty of each coun-try’s electricity market. Collective investment in the electricity corridors and interconnectors will also have to be incurred by all Cono Sur countries.
191 As discussed in Conference on “Integracion Energética Regional,” Panel: Iniciativas de Integración Regional de Amer-
ica del Sur, June 23, 2021 (SINEA y SIESUR).

97 Decarbonization Pathways for Paraguay’s Energy Sector
4. Energy Efficiency and Building Sector
Paraguay suffers from a lack of enforceable efficiency programs, standards, and norms across the economy, particularly in the building sector. From a decarbonization perspective, the residential building sector in Paraguay is mostly electrified, except for a number of cooking stoves that still use biomass and LPG in urban areas, and mainly biomass in rural areas (see Chapter 5). The biomass consumption question is addressed in Chapter 5, whereas this chapter deals with the key problem of energy efficiency192 in Paraguay’s buildings, providing an overview of current efficiency pol-icies in general and as they apply to the building sector, and suggesting recommendations to make these policies more effective.
Current Situation
4.1.1 Energy Efficiency
The National Energy Efficiency Committee (CNEE) was established in 2011 under the lead of the VMME and comprising representatives from eleven organizations including ANDE, the Ministry of Industry and Commerce (MIC), the National University of Asunción (UNA), the Science and Technology Council (CONACyT), Petróleos Paraguayos (PETROPAR), the Ministry of Education (MEC), Itaipú, and Yacyretá, among others. As the first step taken toward regulated energy efficiency measures, the CNEE enacted the National Energy Efficiency Plan (PNEE), published in 2014, which sets guidelines for the implemen-tation of “immediate and strategic measures for energy efficiency” across the industrial, transport, building, and agricultural sectors.193 The benefits suggested in the plan include reduced company operating costs, decreased environmental pollution, and increased competitiveness in the commer-cial sector.194 Moreover, the National Institute of Technology and Standardization (INTN) is responsible for the de-velopment of technical standards within Paraguay. The INTN operates through Technical Comittees for Standarization (CTN), which are created to develop national standards. The CTN 51 was created for the development of technical standards on energy efficiency and specifically labels for equipment and appliances—including air conditioners, light bulbs, and fans—with energy efficiency ratings. The purpose of these labels is to provide educational outreach to both manufacturers and consumers on energy efficiency ratings of publicly available products.195
192 Energy efficiency involves eliminating energy waste to use less energy to perform the same task; thus, energy effi-
ciency helps reduce energy demand, lowers cost, and reduces greenhouse gas emissions in a way that is considered cheaper than changing the energy matrix. “Energy Efficiency,” Environmental and Energy Study Institute, https://www.eesi.org/topics/energy-efficiency/description#:~:text=Energy%20efficiency%20simply%20means%20us-ing,household%20and%20economy%2Dwide%20level.
193 Fabiana Silvero, Maria Fernanda Silva Rodrigues, and Sergio Montelpare, “Energy Efficiency Policies to Face Buildings’ Climate,” Applied Sciences 10, no. 11 (June 2020): https://www.researchgate.net/publication/342041297_Energy_Effi-ciency_Policies_to_Face_Buildings'_Climate_Change_Effects_in_Paraguay.
194 CNEE, Plan Nacional de Eficiencia Energética de la Republica de Paraguay (Asunción: CNEE, 2014), https://www.ssme.gov.py/vmme/pdf/eficiencia/PNEE-CNEE%20-%20FINAL.pdf.
195 Silvero, Rodrigues, and Montelpare, “Energy Efficiency Policies to Face Buildings’ Climate.”
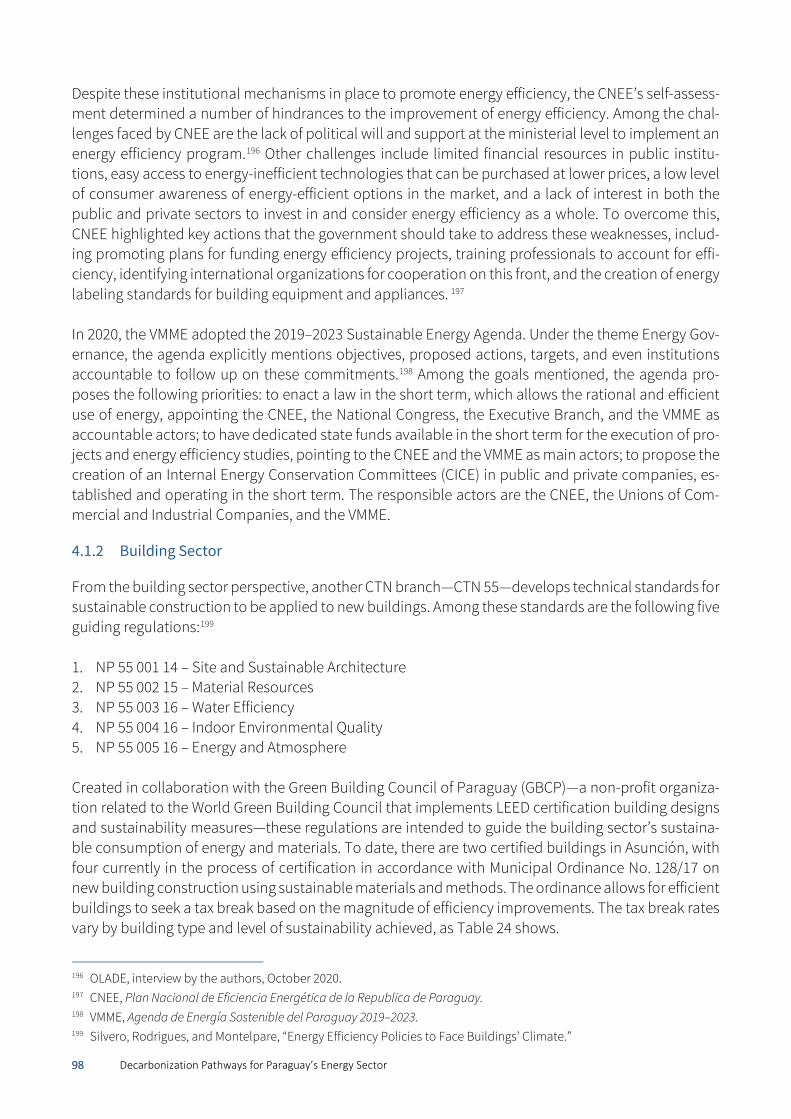
98 Decarbonization Pathways for Paraguay’s Energy Sector
Despite these institutional mechanisms in place to promote energy efficiency, the CNEE’s self-assess-ment determined a number of hindrances to the improvement of energy efficiency. Among the chal-lenges faced by CNEE are the lack of political will and support at the ministerial level to implement an energy efficiency program.196 Other challenges include limited financial resources in public institu-tions, easy access to energy-inefficient technologies that can be purchased at lower prices, a low level of consumer awareness of energy-efficient options in the market, and a lack of interest in both the public and private sectors to invest in and consider energy efficiency as a whole. To overcome this, CNEE highlighted key actions that the government should take to address these weaknesses, includ-ing promoting plans for funding energy efficiency projects, training professionals to account for effi-ciency, identifying international organizations for cooperation on this front, and the creation of energy labeling standards for building equipment and appliances. 197 In 2020, the VMME adopted the 2019–2023 Sustainable Energy Agenda. Under the theme Energy Gov-ernance, the agenda explicitly mentions objectives, proposed actions, targets, and even institutions accountable to follow up on these commitments.198 Among the goals mentioned, the agenda pro-poses the following priorities: to enact a law in the short term, which allows the rational and efficient use of energy, appointing the CNEE, the National Congress, the Executive Branch, and the VMME as accountable actors; to have dedicated state funds available in the short term for the execution of pro-jects and energy efficiency studies, pointing to the CNEE and the VMME as main actors; to propose the creation of an Internal Energy Conservation Committees (CICE) in public and private companies, es-tablished and operating in the short term. The responsible actors are the CNEE, the Unions of Com-mercial and Industrial Companies, and the VMME.
4.1.2 Building Sector
From the building sector perspective, another CTN branch—CTN 55—develops technical standards for sustainable construction to be applied to new buildings. Among these standards are the following five guiding regulations:199 1. NP 55 001 14 – Site and Sustainable Architecture 2. NP 55 002 15 – Material Resources 3. NP 55 003 16 – Water Efficiency 4. NP 55 004 16 – Indoor Environmental Quality 5. NP 55 005 16 – Energy and Atmosphere Created in collaboration with the Green Building Council of Paraguay (GBCP)—a non-profit organiza-tion related to the World Green Building Council that implements LEED certification building designs and sustainability measures—these regulations are intended to guide the building sector’s sustaina-ble consumption of energy and materials. To date, there are two certified buildings in Asunción, with four currently in the process of certification in accordance with Municipal Ordinance No. 128/17 on new building construction using sustainable materials and methods. The ordinance allows for efficient buildings to seek a tax break based on the magnitude of efficiency improvements. The tax break rates vary by building type and level of sustainability achieved, as Table 24 shows.
196 OLADE, interview by the authors, October 2020. 197 CNEE, Plan Nacional de Eficiencia Energética de la Republica de Paraguay. 198 VMME, Agenda de Energía Sostenible del Paraguay 2019–2023. 199 Silvero, Rodrigues, and Montelpare, “Energy Efficiency Policies to Face Buildings’ Climate.”
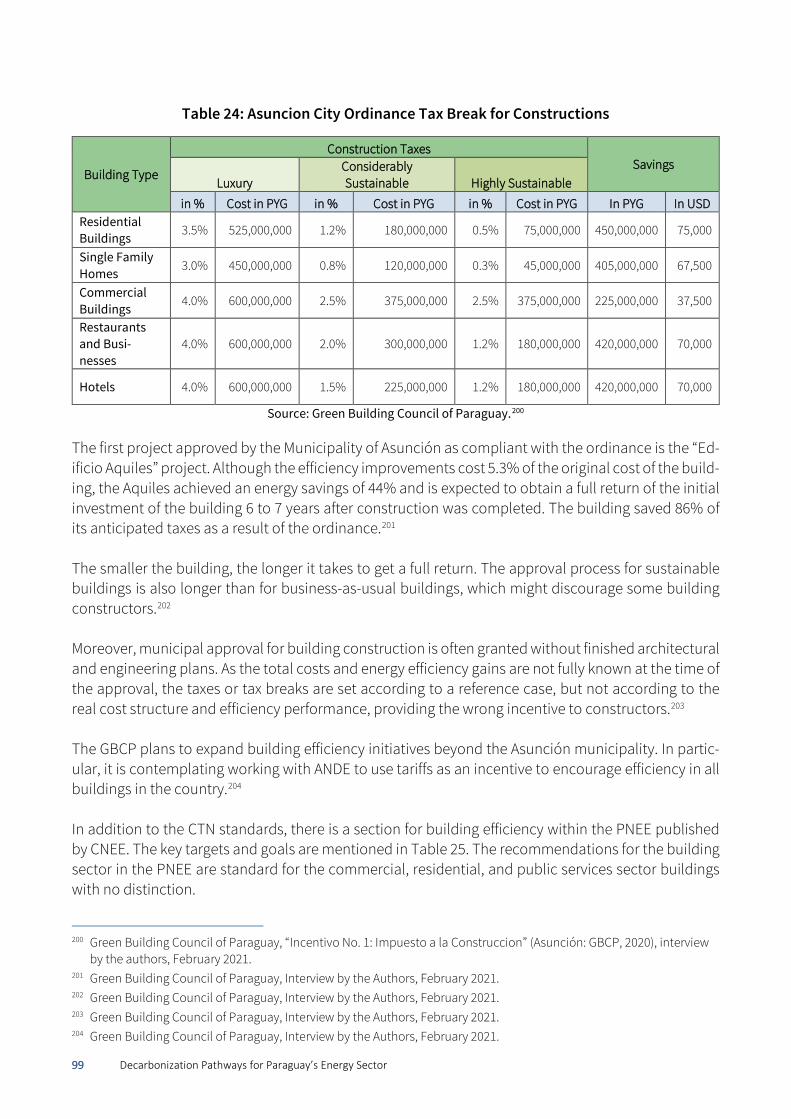
99 Decarbonization Pathways for Paraguay’s Energy Sector
Table 24: Asuncion City Ordinance Tax Break for Constructions
Building Type
Construction Taxes Savings
Luxury Considerably Sustainable Highly Sustainable
in % Cost in PYG in % Cost in PYG in % Cost in PYG In PYG In USD Residential Buildings 3.5% 525,000,000 1.2% 180,000,000 0.5% 75,000,000 450,000,000 75,000
Single Family Homes 3.0% 450,000,000 0.8% 120,000,000 0.3% 45,000,000 405,000,000 67,500
Commercial Buildings
4.0% 600,000,000 2.5% 375,000,000 2.5% 375,000,000 225,000,000 37,500
Restaurants and Busi-nesses
4.0% 600,000,000 2.0% 300,000,000 1.2% 180,000,000 420,000,000 70,000
Hotels 4.0% 600,000,000 1.5% 225,000,000 1.2% 180,000,000 420,000,000 70,000
Source: Green Building Council of Paraguay.200
The first project approved by the Municipality of Asunción as compliant with the ordinance is the “Ed-ificio Aquiles” project. Although the efficiency improvements cost 5.3% of the original cost of the build-ing, the Aquiles achieved an energy savings of 44% and is expected to obtain a full return of the initial investment of the building 6 to 7 years after construction was completed. The building saved 86% of its anticipated taxes as a result of the ordinance.201 The smaller the building, the longer it takes to get a full return. The approval process for sustainable buildings is also longer than for business-as-usual buildings, which might discourage some building constructors.202 Moreover, municipal approval for building construction is often granted without finished architectural and engineering plans. As the total costs and energy efficiency gains are not fully known at the time of the approval, the taxes or tax breaks are set according to a reference case, but not according to the real cost structure and efficiency performance, providing the wrong incentive to constructors.203 The GBCP plans to expand building efficiency initiatives beyond the Asunción municipality. In partic-ular, it is contemplating working with ANDE to use tariffs as an incentive to encourage efficiency in all buildings in the country.204 In addition to the CTN standards, there is a section for building efficiency within the PNEE published by CNEE. The key targets and goals are mentioned in Table 25. The recommendations for the building sector in the PNEE are standard for the commercial, residential, and public services sector buildings with no distinction.
200 Green Building Council of Paraguay, “Incentivo No. 1: Impuesto a la Construccion” (Asunción: GBCP, 2020), interview
by the authors, February 2021. 201 Green Building Council of Paraguay, Interview by the Authors, February 2021. 202 Green Building Council of Paraguay, Interview by the Authors, February 2021. 203 Green Building Council of Paraguay, Interview by the Authors, February 2021. 204 Green Building Council of Paraguay, Interview by the Authors, February 2021.
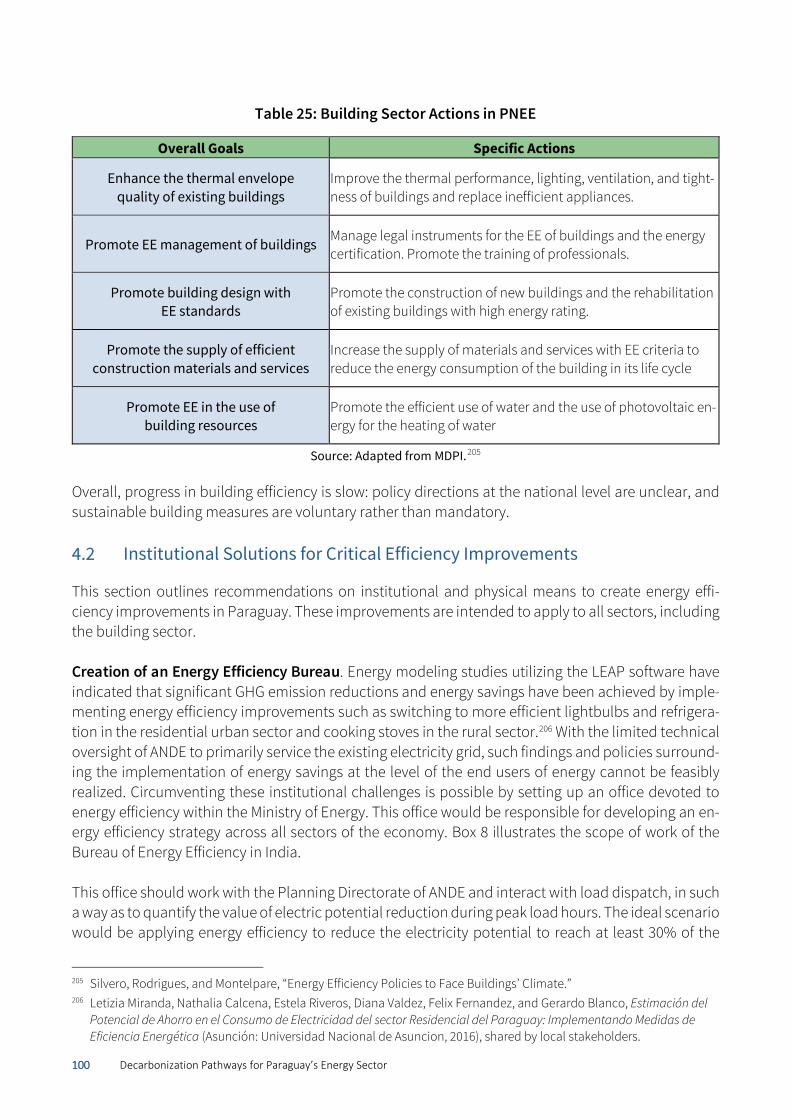
100 Decarbonization Pathways for Paraguay’s Energy Sector
Table 25: Building Sector Actions in PNEE
Overall Goals Specific Actions
Enhance the thermal envelope quality of existing buildings
Improve the thermal performance, lighting, ventilation, and tight-ness of buildings and replace inefficient appliances.
Promote EE management of buildings Manage legal instruments for the EE of buildings and the energy certification. Promote the training of professionals.
Promote building design with EE standards
Promote the construction of new buildings and the rehabilitation of existing buildings with high energy rating.
Promote the supply of efficient construction materials and services
Increase the supply of materials and services with EE criteria to reduce the energy consumption of the building in its life cycle
Promote EE in the use of building resources
Promote the efficient use of water and the use of photovoltaic en-ergy for the heating of water
Source: Adapted from MDPI.205 Overall, progress in building efficiency is slow: policy directions at the national level are unclear, and sustainable building measures are voluntary rather than mandatory.
Institutional Solutions for Critical Efficiency Improvements
This section outlines recommendations on institutional and physical means to create energy effi-ciency improvements in Paraguay. These improvements are intended to apply to all sectors, including the building sector. Creation of an Energy Efficiency Bureau. Energy modeling studies utilizing the LEAP software have indicated that significant GHG emission reductions and energy savings have been achieved by imple-menting energy efficiency improvements such as switching to more efficient lightbulbs and refrigera-tion in the residential urban sector and cooking stoves in the rural sector.206 With the limited technical oversight of ANDE to primarily service the existing electricity grid, such findings and policies surround-ing the implementation of energy savings at the level of the end users of energy cannot be feasibly realized. Circumventing these institutional challenges is possible by setting up an office devoted to energy efficiency within the Ministry of Energy. This office would be responsible for developing an en-ergy efficiency strategy across all sectors of the economy. Box 8 illustrates the scope of work of the Bureau of Energy Efficiency in India. This office should work with the Planning Directorate of ANDE and interact with load dispatch, in such a way as to quantify the value of electric potential reduction during peak load hours. The ideal scenario would be applying energy efficiency to reduce the electricity potential to reach at least 30% of the
205 Silvero, Rodrigues, and Montelpare, “Energy Efficiency Policies to Face Buildings’ Climate.” 206 Letizia Miranda, Nathalia Calcena, Estela Riveros, Diana Valdez, Felix Fernandez, and Gerardo Blanco, Estimación del
Potencial de Ahorro en el Consumo de Electricidad del sector Residencial del Paraguay: Implementando Medidas de Eficiencia Energética (Asunción: Universidad Nacional de Asuncion, 2016), shared by local stakeholders.
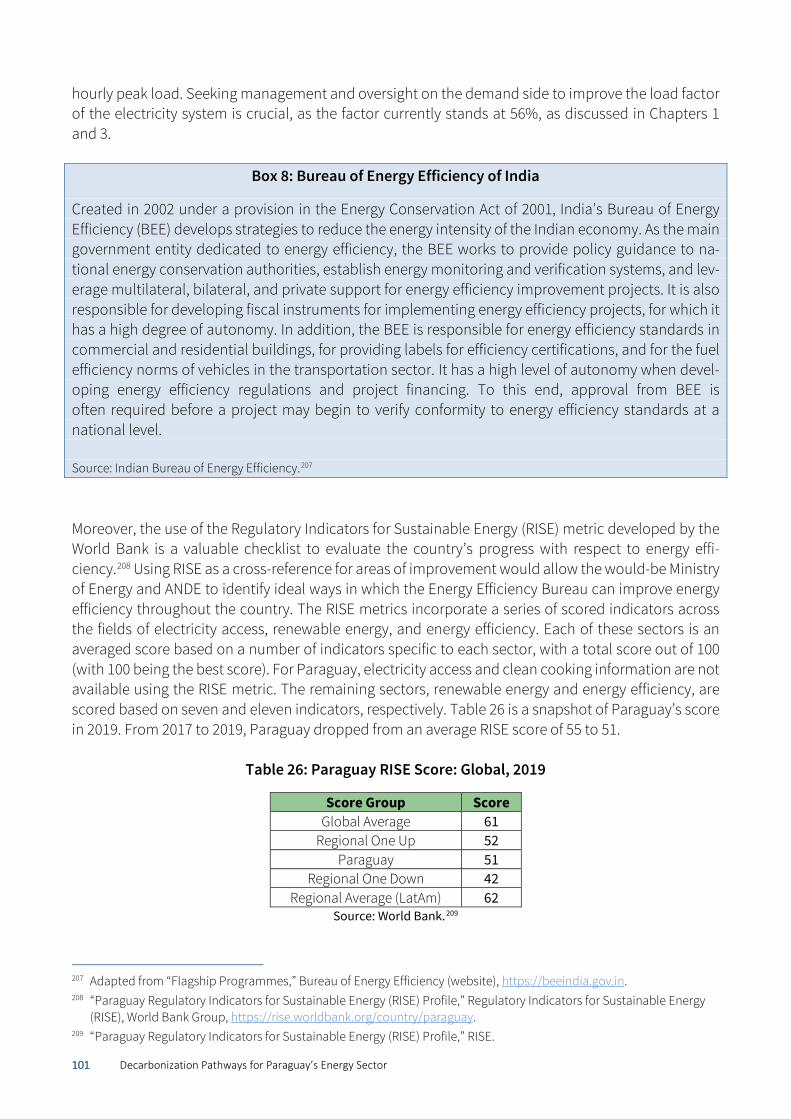
101 Decarbonization Pathways for Paraguay’s Energy Sector
hourly peak load. Seeking management and oversight on the demand side to improve the load factor of the electricity system is crucial, as the factor currently stands at 56%, as discussed in Chapters 1 and 3.
Box 8: Bureau of Energy Efficiency of India
Created in 2002 under a provision in the Energy Conservation Act of 2001, India’s Bureau of Energy Efficiency (BEE) develops strategies to reduce the energy intensity of the Indian economy. As the main government entity dedicated to energy efficiency, the BEE works to provide policy guidance to na-tional energy conservation authorities, establish energy monitoring and verification systems, and lev-erage multilateral, bilateral, and private support for energy efficiency improvement projects. It is also responsible for developing fiscal instruments for implementing energy efficiency projects, for which it has a high degree of autonomy. In addition, the BEE is responsible for energy efficiency standards in commercial and residential buildings, for providing labels for efficiency certifications, and for the fuel efficiency norms of vehicles in the transportation sector. It has a high level of autonomy when devel-oping energy efficiency regulations and project financing. To this end, approval from BEE is often required before a project may begin to verify conformity to energy efficiency standards at a national level. Source: Indian Bureau of Energy Efficiency.207
Moreover, the use of the Regulatory Indicators for Sustainable Energy (RISE) metric developed by the World Bank is a valuable checklist to evaluate the country’s progress with respect to energy effi-ciency.208 Using RISE as a cross-reference for areas of improvement would allow the would-be Ministry of Energy and ANDE to identify ideal ways in which the Energy Efficiency Bureau can improve energy efficiency throughout the country. The RISE metrics incorporate a series of scored indicators across the fields of electricity access, renewable energy, and energy efficiency. Each of these sectors is an averaged score based on a number of indicators specific to each sector, with a total score out of 100 (with 100 being the best score). For Paraguay, electricity access and clean cooking information are not available using the RISE metric. The remaining sectors, renewable energy and energy efficiency, are scored based on seven and eleven indicators, respectively. Table 26 is a snapshot of Paraguay’s score in 2019. From 2017 to 2019, Paraguay dropped from an average RISE score of 55 to 51.
Table 26: Paraguay RISE Score: Global, 2019
Score Group Score Global Average 61
Regional One Up 52 Paraguay 51
Regional One Down 42 Regional Average (LatAm) 62
Source: World Bank.209
207 Adapted from “Flagship Programmes,” Bureau of Energy Efficiency (website), https://beeindia.gov.in. 208 “Paraguay Regulatory Indicators for Sustainable Energy (RISE) Profile,” Regulatory Indicators for Sustainable Energy
(RISE), World Bank Group, https://rise.worldbank.org/country/paraguay. 209 “Paraguay Regulatory Indicators for Sustainable Energy (RISE) Profile,” RISE.
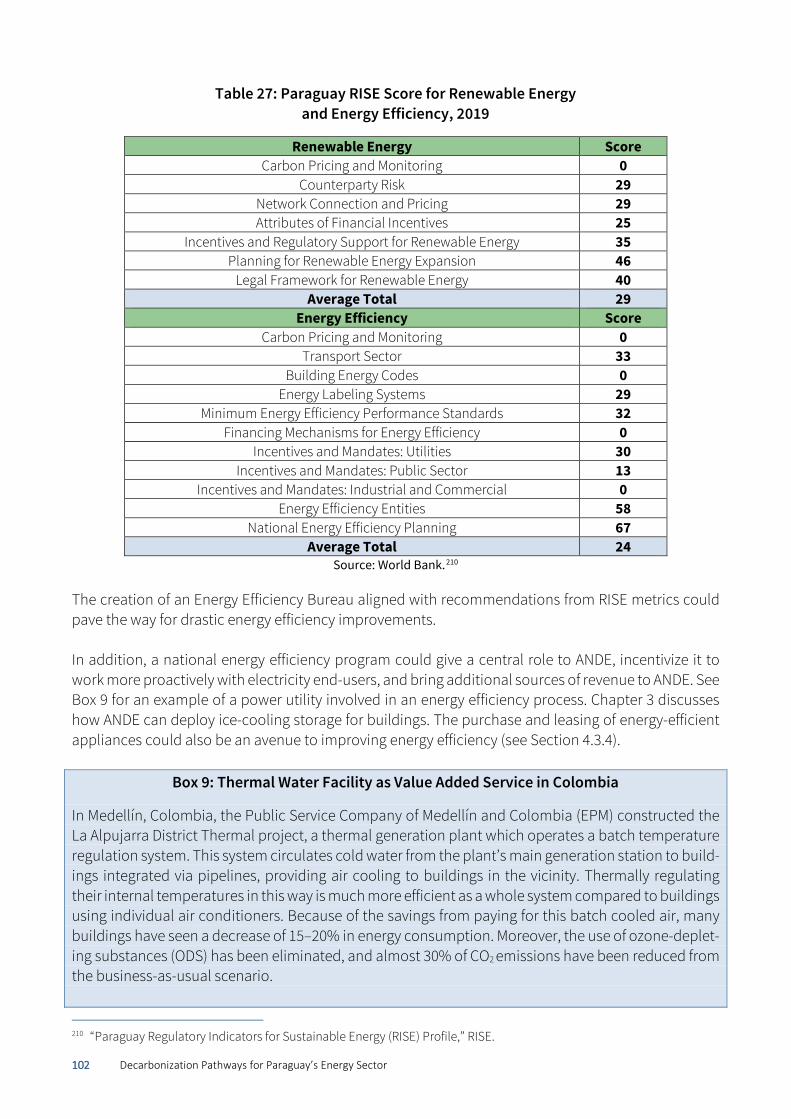
102 Decarbonization Pathways for Paraguay’s Energy Sector
Table 27: Paraguay RISE Score for Renewable Energy and Energy Efficiency, 2019
Renewable Energy Score Carbon Pricing and Monitoring 0
Counterparty Risk 29 Network Connection and Pricing 29 Attributes of Financial Incentives 25
Incentives and Regulatory Support for Renewable Energy 35 Planning for Renewable Energy Expansion 46
Legal Framework for Renewable Energy 40 Average Total 29
Energy Efficiency Score Carbon Pricing and Monitoring 0
Transport Sector 33 Building Energy Codes 0
Energy Labeling Systems 29 Minimum Energy Efficiency Performance Standards 32
Financing Mechanisms for Energy Efficiency 0 Incentives and Mandates: Utilities 30
Incentives and Mandates: Public Sector 13 Incentives and Mandates: Industrial and Commercial 0
Energy Efficiency Entities 58 National Energy Efficiency Planning 67
Average Total 24 Source: World Bank.210
The creation of an Energy Efficiency Bureau aligned with recommendations from RISE metrics could pave the way for drastic energy efficiency improvements. In addition, a national energy efficiency program could give a central role to ANDE, incentivize it to work more proactively with electricity end-users, and bring additional sources of revenue to ANDE. See Box 9 for an example of a power utility involved in an energy efficiency process. Chapter 3 discusses how ANDE can deploy ice-cooling storage for buildings. The purchase and leasing of energy-efficient appliances could also be an avenue to improving energy efficiency (see Section 4.3.4).
Box 9: Thermal Water Facility as Value Added Service in Colombia
In Medellín, Colombia, the Public Service Company of Medellín and Colombia (EPM) constructed the La Alpujarra District Thermal project, a thermal generation plant which operates a batch temperature regulation system. This system circulates cold water from the plant’s main generation station to build-ings integrated via pipelines, providing air cooling to buildings in the vicinity. Thermally regulating their internal temperatures in this way is much more efficient as a whole system compared to buildings using individual air conditioners. Because of the savings from paying for this batch cooled air, many buildings have seen a decrease of 15–20% in energy consumption. Moreover, the use of ozone-deplet-ing substances (ODS) has been eliminated, and almost 30% of CO2 emissions have been reduced from the business-as-usual scenario. 210 “Paraguay Regulatory Indicators for Sustainable Energy (RISE) Profile,” RISE.
103 Decarbonization Pathways for Paraguay’s Energy Sector
This project enters EPM’s strategy “to favor competitive and sustainable territories based on energy efficiency processes, reduction of operating costs, customer loyalty and reduction of emissions that pollute the environment.” Source: ACI Medellín.211
Solutions for the Building Sector
Achieving zero emissions in the building sector can be broken down into four main steps: 1. Reduce energy use through energy efficiency 2. Electrify existing appliances 3. Decarbonize the electricity grid 4. Use low-carbon construction materials212 Paraguay has already achieved Step 3 through its hydroelectric power generation. When it comes to Step 2, most urban household needs (such as heat and hot water) are already mostly electrified (69.4% of energy use in urban households), except for remaining cooking stoves that rely on LPG in urban households (18.8% of energy use in urban households) or biomass in rural households (29.2% of en-ergy use in rural households), as detailed in Appendix A. As a result, the building sector must work to tackle steps 1 and 4, while evolving towards electrifying the remaining cooking stoves that rely on LPG in urban settings. This requires new building codes, new procurement practices for construction materials, and incentive programs for efficient home appliances.
4.3.1 National Building Efficiency Code
Although tax breaks and opportunities exist for buildings in Asunción to be built with energy-efficient components, very few constructors are aware that such economic incentives exist; outside the munic-ipality of Asunción, there is not much interest and progress in building efficiency.213 To reach national-level improvements on building efficiency, the national government could consider coordinating efficiency measures via ANDE for energy or via local municipalities through tax breaks. However, a more effective avenue would be to enact and consistently enforce a national building effi-ciency code that all buildings in the country must comply with by a certain time. The national govern-ment should consider leading or sponsoring initiatives to communicate cost savings resulting from efficiency, unlocking national tax incentives, and supporting municipalities seeking compliance with financial incentives at a national level.
211 “Thermal District: Green Infrastructure that Cares for the Air we Breathe in Medellín,” ACI Medellín, February 15, 2019,
https://www.acimedellin.org/thermal-district-green-infrastructure-that-cares-for-the-air-we-breathe-in-medel-lin/?lang=en.
212 Laurie Kerr and Roger Platt, “Chapter 5.4: Accelerating Deep Decarbonization in the U.S. Buildings Sector,” in Amer-ica’s Zero Carbon Action Plan, Jeffrey Sachs and ed. Elena Crete et al. (SDSN, 2020), https://irp-cdn.multiscreen-site.com/6f2c9f57/files/uploaded/zero-carbon-action-plan%20%281%29.pdf.
213 Green Building Council of Paraguay, interview by the authors, November 2020.
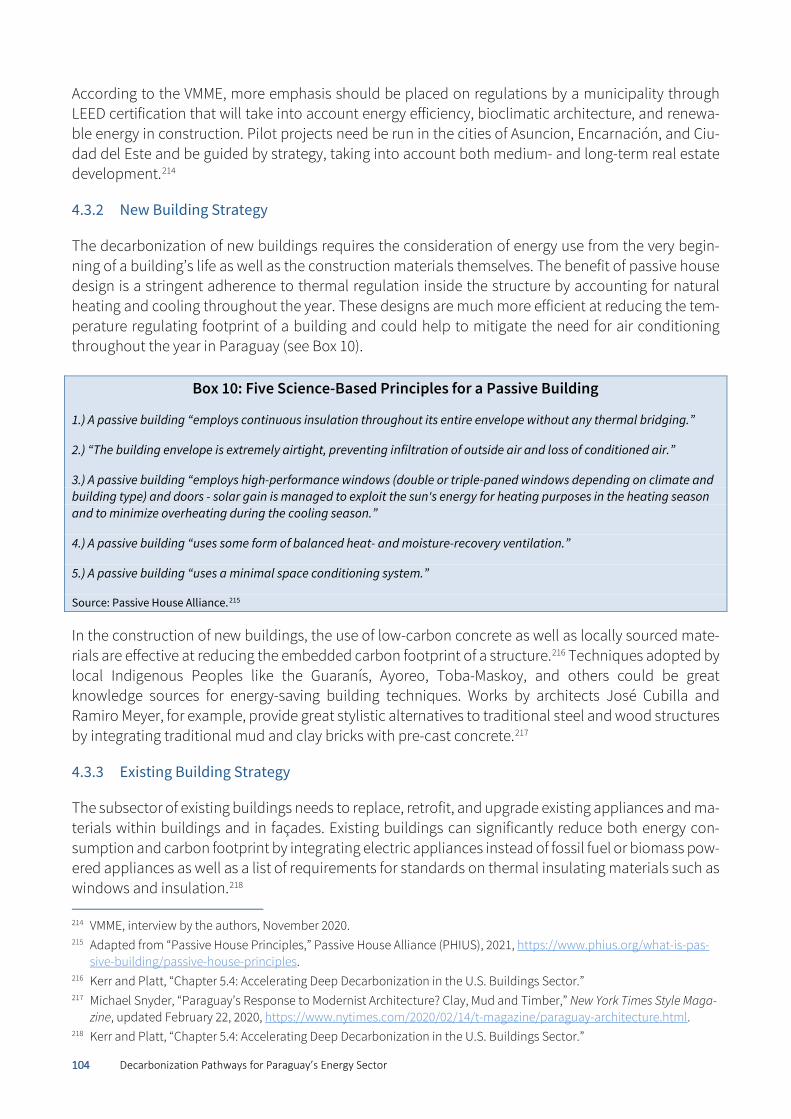
104 Decarbonization Pathways for Paraguay’s Energy Sector
According to the VMME, more emphasis should be placed on regulations by a municipality through LEED certification that will take into account energy efficiency, bioclimatic architecture, and renewa-ble energy in construction. Pilot projects need be run in the cities of Asuncion, Encarnación, and Ciu-dad del Este and be guided by strategy, taking into account both medium- and long-term real estate development.214
4.3.2 New Building Strategy
The decarbonization of new buildings requires the consideration of energy use from the very begin-ning of a building’s life as well as the construction materials themselves. The benefit of passive house design is a stringent adherence to thermal regulation inside the structure by accounting for natural heating and cooling throughout the year. These designs are much more efficient at reducing the tem-perature regulating footprint of a building and could help to mitigate the need for air conditioning throughout the year in Paraguay (see Box 10).
Box 10: Five Science-Based Principles for a Passive Building
1.) A passive building “employs continuous insulation throughout its entire envelope without any thermal bridging.”
2.) “The building envelope is extremely airtight, preventing infiltration of outside air and loss of conditioned air.”
3.) A passive building “employs high-performance windows (double or triple-paned windows depending on climate and building type) and doors - solar gain is managed to exploit the sun's energy for heating purposes in the heating season and to minimize overheating during the cooling season.”
4.) A passive building “uses some form of balanced heat- and moisture-recovery ventilation.”
5.) A passive building “uses a minimal space conditioning system.”
Source: Passive House Alliance.215
In the construction of new buildings, the use of low-carbon concrete as well as locally sourced mate-rials are effective at reducing the embedded carbon footprint of a structure.216 Techniques adopted by local Indigenous Peoples like the Guaranís, Ayoreo, Toba-Maskoy, and others could be great knowledge sources for energy-saving building techniques. Works by architects José Cubilla and Ramiro Meyer, for example, provide great stylistic alternatives to traditional steel and wood structures by integrating traditional mud and clay bricks with pre-cast concrete.217
4.3.3 Existing Building Strategy
The subsector of existing buildings needs to replace, retrofit, and upgrade existing appliances and ma-terials within buildings and in façades. Existing buildings can significantly reduce both energy con-sumption and carbon footprint by integrating electric appliances instead of fossil fuel or biomass pow-ered appliances as well as a list of requirements for standards on thermal insulating materials such as windows and insulation.218 214 VMME, interview by the authors, November 2020. 215 Adapted from “Passive House Principles,” Passive House Alliance (PHIUS), 2021, https://www.phius.org/what-is-pas-
sive-building/passive-house-principles. 216 Kerr and Platt, “Chapter 5.4: Accelerating Deep Decarbonization in the U.S. Buildings Sector.” 217 Michael Snyder, “Paraguay’s Response to Modernist Architecture? Clay, Mud and Timber,” New York Times Style Maga-
zine, updated February 22, 2020, https://www.nytimes.com/2020/02/14/t-magazine/paraguay-architecture.html. 218 Kerr and Platt, “Chapter 5.4: Accelerating Deep Decarbonization in the U.S. Buildings Sector.”
105 Decarbonization Pathways for Paraguay’s Energy Sector
4.3.4 Energy-Efficient Appliances
Alternatively, or in parallel to direct load and demand response programs mentioned in Chapters 1 and 3, the government could develop an incentive program for consumers to switch to efficient home appliances. Although consumers are often unwilling to purchase energy-efficient appliances on their own because of the relatively high up-front cost compared to regular appliances, lack of information, and lack of technical expertise,219 various financial frameworks that have been employed globally can improve their willingness and access to more energy-efficient appliances. The first model, and un-doubtedly the most widely used, is the direct financing by government budgets. This framework usu-ally has a short-term horizon but is effective at leveraging large amounts of capital.220 A variation of this framework is using revenue generated from a small ad valorem tax applied to elec-tricity consumed by ratepayers. This method has a longer-term horizon and can help cover the cost of implementing the program. Revenue generated from this tax is placed into a general fund (an internal funding pool within the utility), which is then applied to energy efficiency programs. An example of this framework is in Allentown, Pennsylvania, with the PPL Electric Utility. Under the U.S. government’s required energy savings program for low-income customers, the Low-Income WRAP program, PPL of-fers free energy audits, energy education, and even direct installation of energy-efficient appliances. As of 2018, PPL has achieved 26,241 MWh in savings while spending USD 11,403,000 for its programs to reach 25,648 households.221 Another financial framework is known as a revolving fund and involves the collaboration of local banks incentivized by the government to provide more favorable loans to consumers wishing to invest in energy efficiency improvements. A good example of this scheme is Germany’s Kreditanstalt für Wied-eraufbau (KfW) development bank’s collaboration with other institutions. This program provides gen-erous financing terms on large loans for energy efficiency upgrades and has seen great success due to its penetration into the residential sector and the ability to get much more affordable capital to use for upgrades.222 In turn, the consumers of these loans pay them back in large part with the energy sav-ings achieved through the energy upgrades. As a result of this payback method, this scheme is often better suited for replacement of larger equipment, which has greater energy savings to repay the loans.223 Another financial model, known as a feebate model, is a financial model that applies a tax on high-energy appliances to subsidize energy-efficient appliances. In South Korea, this feebate model intro-duces a 5–6.5% tax on energy-consuming appliances. Revenues generated from this tax are then used to subsidize the purchase of highly efficient appliances for low-income households in the country.224 This financing model has the potential to be a revenue-neutral policy and can often run independently
219 Stephane de la Rue du Can, Greg Leventis, Amol Phadke, and Anand Gopal, Design of Incentive Programs for Accelerat-
ing Penetration of Energy-Efficient Appliances (Berkeley: International Energy Studies Group, 2014), https://www.sci-encedirect.com/science/article/pii/S0301421514002705.
220 De la Rue du Can et al., Design of Incentive Programs for Accelerating Penetration of Energy-Efficient Appliances. 221 “Low-Income and Multifamily EE Programs,” America Council for an Energy-Efficient Economy (ACEEE): State and Lo-
cal Policy Database, ACEEE, 2020, https://database.aceee.org/city/low-income-multifamily. 222 De la Rue du Can et al., Design of Incentive Programs for Accelerating Penetration of Energy-Efficient Appliances. 223 “Energy Efficiency, Corporate Environmental Protection and Renewable Energies,” KfW, https://www.kfw.de/in-
landsfoerderung/Companies/Energy-and-the-environment/. 224 De la Rue du Can et al., Design of Incentive Programs for Accelerating Penetration of Energy-Efficient Appliances.
106 Decarbonization Pathways for Paraguay’s Energy Sector
of government budgets. At the same time, this framework’s success is contingent on close monitoring of the budgetary balance to be successful. One final framework began in India under the Programmatic Clean Development Mechanism (CDM). Under this scheme,225 the state utility receives CDM revenue from each CFL lightbulb that is sold, as these are 70% more energy efficient than incandescent light bulbs.226 In turn, these revenues are passed on to the consumers in the form of rebates on CFLs, which make them competitive with incan-descent bulbs. In this way, once the program gets going, the purchase of CFLs makes more economic sense. In Latin America, a number of countries have successfully made the transition to more efficient appli-ances in households and businesses. In Chile, programs were established to replace incandescent light bulbs with CFLs, mandatory efficiency labels were placed on both household appliances and light-duty vehicles, and energy efficiency was added into the national educational curriculum. Bolivia replaced 19 million light bulbs with CFLs between 2008 and 2012 with an estimated savings of 182 MW of energy during peak hours. In Guyana, the government zeroed the value-added tax (VAT) rate on all energy-efficient appliances and technology related to renewable energy to push for greater adoption of these technologies.227 In Paraguay, studies have shown that there is a great potential for savings by implementing efficiency measures for home appliances in the residential sector (lighting, air conditioning, refrigeration, electric transformers, and electric motors). According to one study, by 2030, efficiency measures for these five technologies in the residential sector could save 5,500 GWh, equivalent to USD 396 million.228 Accord-ing to another study, by 2040, these would amount to 47,333.5 GWh of accumulated energy, equivalent to USD 1.078 billion in savings. The maximum power displaced by applying the efficiency measures is 703.40 MW by 2040, which would enable saving USD 2.813 billion.229
225 De la Rue du Can et al., Design of Incentive Programs for Accelerating Penetration of Energy-Efficient Appliances. 226 “How Energy-Efficient Light Bulbs Compare with Traditional Incadescents,” Electricity and Fuel, U.S. Department of
Energy, https://www.energy.gov/energysaver/save-electricity-and-fuel/lighting-choices-save-you-money/how-en-ergy-efficient-light.
227 Pauline Ravillard, Franco Carvajal, David Lopez Soto, J. Enrique Chueca Montuenga, Katherine M. Antonio, Yi Ji, and Michelle Hallack, Towards Greater Energy Efficiency in Latin America and the Caribbean: Progress and Policies (Inter-American Development Bank [IDB], 2019), https://publications.iadb.org/publications/english/document/To-wards_Greater_Energy_Efficiency_in_Latin_America_and_the_Caribbean_Progress_and_Policies.pdf.
228 “Paraguay Savings Policy Assessment,” United for Energy (U4E), UN Environmental Programme (UNEP), 2019, https://united4efficiency.org/country-assessments/paraguay/.
229 Miranda et al., Estimación del Potencial de Ahorro en el Consumo de Electricidad del sector Residencial del Paraguay.
107 Decarbonization Pathways for Paraguay’s Energy Sector
Recommendations
Energy Efficiency
1. A department of the would-be Ministry of Energy dedicated to energy efficiency could help reduce the energy intensity of the economy as a whole by developing appropriate strategies and ensuring the interaction of ANDE with energy end-users such as the building and industrial sectors as well as the transportation sector. It would also provide additional sources of revenue to ANDE.
2. A consolidation and nationalization of the CTN’s efforts to apply stringent appliance efficiency
standards needs to take place. As it stands, unofficial merchants are using fake labels to promote inefficient appliances in national markets.230 Only a strong centrally regulated system will effec-tively combat misinformation in the marketplace.
Building Sector
1. The creation of a National Energy Code for buildings would provide Paraguay with a central au-
thority for building upgrades. The code should require that all new buildings incorporate thermal insulation practices and not use fossil fuel boilers. Additionally, this code would account for sus-tainable construction codes at the national level for new buildings, which would emphasize low-carbon concrete and locally sourced building materials to decrease the amount of embodied car-bon in the building sector. Energy efficiency collaborations with ANDE could be enforced along with the National Energy Code. The municipalities should be involved in the enforcement of the codes. Tax breaks such as those deployed in Asunción could be expanded but should be rede-signed following a cost-benefit analysis to be more effective.
2. The Government of Paraguay should work to establish a branch of the VMME, and eventually of the future Ministry of Energy, that would provide a funding mechanism in the form of subsidies and direct funding for the investment of smart building retrofits and upgrades. Incentive programs are also needed for consumers to switch to efficient homes. Potential sources of funding could come from taxes on outdated building appliances and materials as well as savings in power demand, which could amount to USD 2.8 billion by 2040.
230 Local stakeholders, interview by the authors, September 2020.
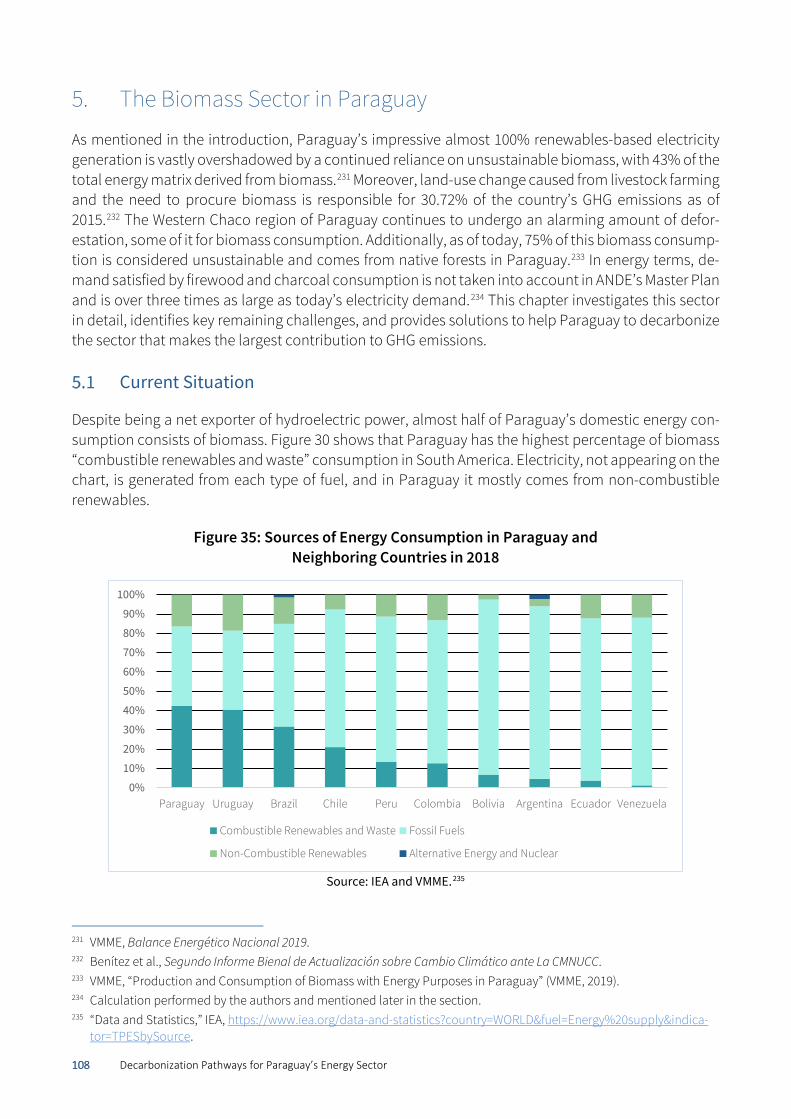
108 Decarbonization Pathways for Paraguay’s Energy Sector
5. The Biomass Sector in Paraguay
As mentioned in the introduction, Paraguay’s impressive almost 100% renewables-based electricity generation is vastly overshadowed by a continued reliance on unsustainable biomass, with 43% of the total energy matrix derived from biomass.231 Moreover, land-use change caused from livestock farming and the need to procure biomass is responsible for 30.72% of the country’s GHG emissions as of 2015.232 The Western Chaco region of Paraguay continues to undergo an alarming amount of defor-estation, some of it for biomass consumption. Additionally, as of today, 75% of this biomass consump-tion is considered unsustainable and comes from native forests in Paraguay.233 In energy terms, de-mand satisfied by firewood and charcoal consumption is not taken into account in ANDE’s Master Plan and is over three times as large as today’s electricity demand.234 This chapter investigates this sector in detail, identifies key remaining challenges, and provides solutions to help Paraguay to decarbonize the sector that makes the largest contribution to GHG emissions.
Current Situation
Despite being a net exporter of hydroelectric power, almost half of Paraguay’s domestic energy con-sumption consists of biomass. Figure 30 shows that Paraguay has the highest percentage of biomass “combustible renewables and waste” consumption in South America. Electricity, not appearing on the chart, is generated from each type of fuel, and in Paraguay it mostly comes from non-combustible renewables.
Figure 35: Sources of Energy Consumption in Paraguay and Neighboring Countries in 2018
Source: IEA and VMME.235
231 VMME, Balance Energético Nacional 2019. 232 Benítez et al., Segundo Informe Bienal de Actualización sobre Cambio Climático ante La CMNUCC. 233 VMME, “Production and Consumption of Biomass with Energy Purposes in Paraguay” (VMME, 2019). 234 Calculation performed by the authors and mentioned later in the section. 235 “Data and Statistics,” IEA, https://www.iea.org/data-and-statistics?country=WORLD&fuel=Energy%20supply&indica-
tor=TPESbySource.
0%
10%
20%
30%
40%
50%
60%
70%
80%
90%
100%
Paraguay Uruguay Brazil Chile Peru Colombia Bolivia Argentina Ecuador Venezuela
Combustible Renewables and Waste Fossil Fuels
Non-Combustible Renewables Alternative Energy and Nuclear
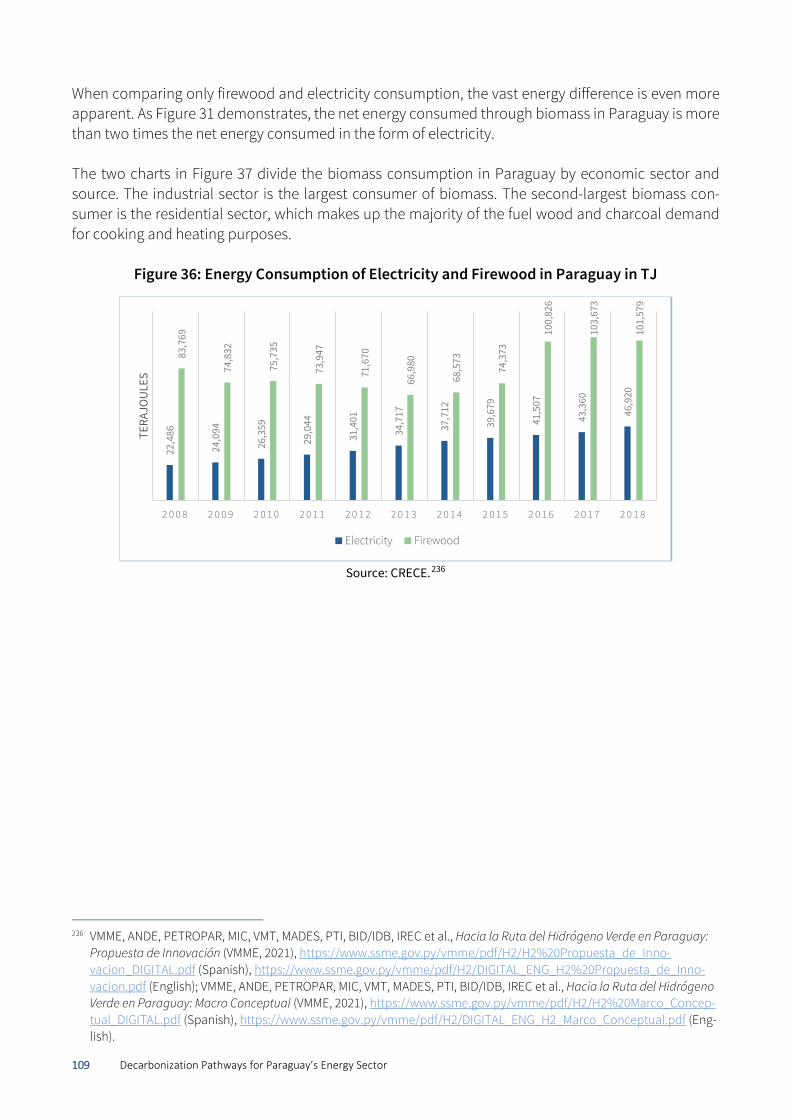
109 Decarbonization Pathways for Paraguay’s Energy Sector
When comparing only firewood and electricity consumption, the vast energy difference is even more apparent. As Figure 31 demonstrates, the net energy consumed through biomass in Paraguay is more than two times the net energy consumed in the form of electricity. The two charts in Figure 37 divide the biomass consumption in Paraguay by economic sector and source. The industrial sector is the largest consumer of biomass. The second-largest biomass con-sumer is the residential sector, which makes up the majority of the fuel wood and charcoal demand for cooking and heating purposes.
Figure 36: Energy Consumption of Electricity and Firewood in Paraguay in TJ
Source: CRECE.236
236 VMME, ANDE, PETROPAR, MIC, VMT, MADES, PTI, BID/IDB, IREC et al., Hacia la Ruta del Hidrógeno Verde en Paraguay:
Propuesta de Innovación (VMME, 2021), https://www.ssme.gov.py/vmme/pdf/H2/H2%20Propuesta_de_Inno-vacion_DIGITAL.pdf (Spanish), https://www.ssme.gov.py/vmme/pdf/H2/DIGITAL_ENG_H2%20Propuesta_de_Inno-vacion.pdf (English); VMME, ANDE, PETROPAR, MIC, VMT, MADES, PTI, BID/IDB, IREC et al., Hacia la Ruta del Hidrógeno Verde en Paraguay: Macro Conceptual (VMME, 2021), https://www.ssme.gov.py/vmme/pdf/H2/H2%20Marco_Concep-tual_DIGITAL.pdf (Spanish), https://www.ssme.gov.py/vmme/pdf/H2/DIGITAL_ENG_H2_Marco_Conceptual.pdf (Eng-lish).
22,4
86
24,0
94
26,3
59
29,0
44
31,4
01
34,7
17
37,7
12
39,6
79
41,5
07
43,3
60
46,9
20
83,7
69
74,8
32
75,7
35
73,9
47
71,6
70
66,9
80
68,5
73
74,3
73
100,
826
103,
673
101,
579
2 0 0 8 2 0 0 9 2 0 1 0 2 0 1 1 2 0 1 2 2 0 1 3 2 0 1 4 2 0 1 5 2 0 1 6 2 0 1 7 2 0 1 8
TERA
JOU
LES
Electricity Firewood
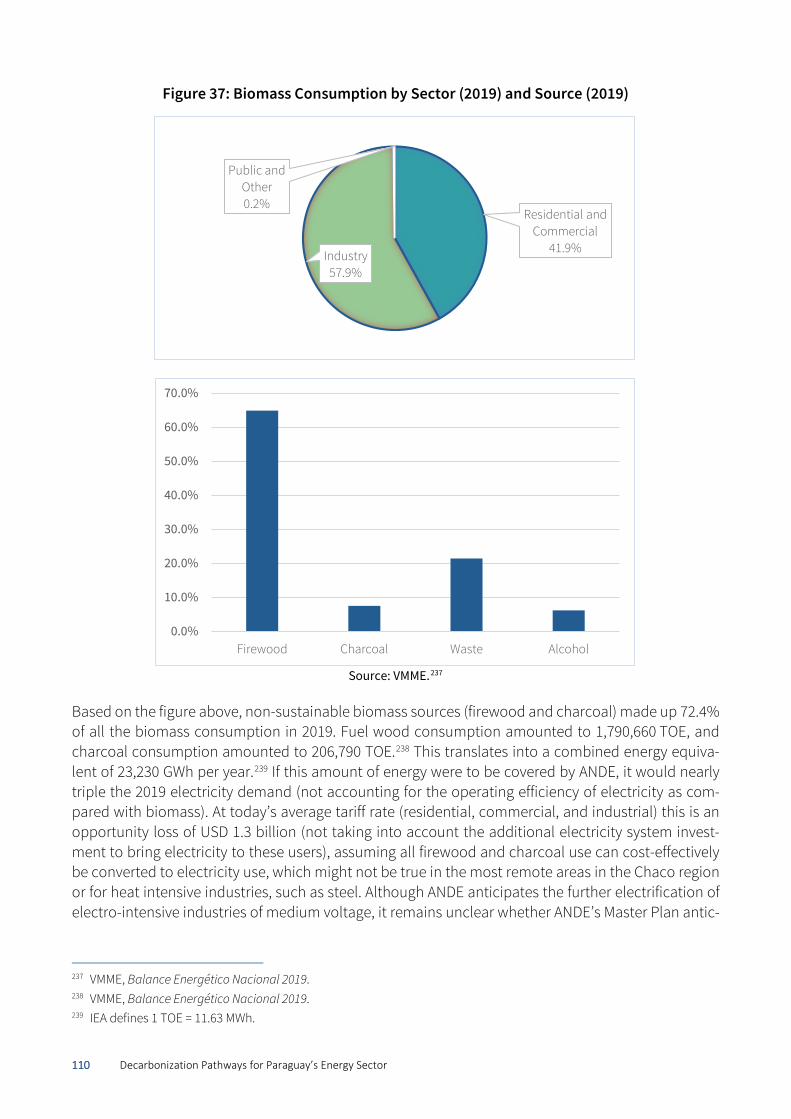
110 Decarbonization Pathways for Paraguay’s Energy Sector
Figure 37: Biomass Consumption by Sector (2019) and Source (2019)
Source: VMME.237
Based on the figure above, non-sustainable biomass sources (firewood and charcoal) made up 72.4% of all the biomass consumption in 2019. Fuel wood consumption amounted to 1,790,660 TOE, and charcoal consumption amounted to 206,790 TOE.238 This translates into a combined energy equiva-lent of 23,230 GWh per year.239 If this amount of energy were to be covered by ANDE, it would nearly triple the 2019 electricity demand (not accounting for the operating efficiency of electricity as com-pared with biomass). At today’s average tariff rate (residential, commercial, and industrial) this is an opportunity loss of USD 1.3 billion (not taking into account the additional electricity system invest-ment to bring electricity to these users), assuming all firewood and charcoal use can cost-effectively be converted to electricity use, which might not be true in the most remote areas in the Chaco region or for heat intensive industries, such as steel. Although ANDE anticipates the further electrification of electro-intensive industries of medium voltage, it remains unclear whether ANDE’s Master Plan antic-
237 VMME, Balance Energético Nacional 2019. 238 VMME, Balance Energético Nacional 2019. 239 IEA defines 1 TOE = 11.63 MWh.
Residential and Commercial
41.9%Industry57.9%
Public and Other0.2%
0.0%
10.0%
20.0%
30.0%
40.0%
50.0%
60.0%
70.0%
Firewood Charcoal Waste Alcohol
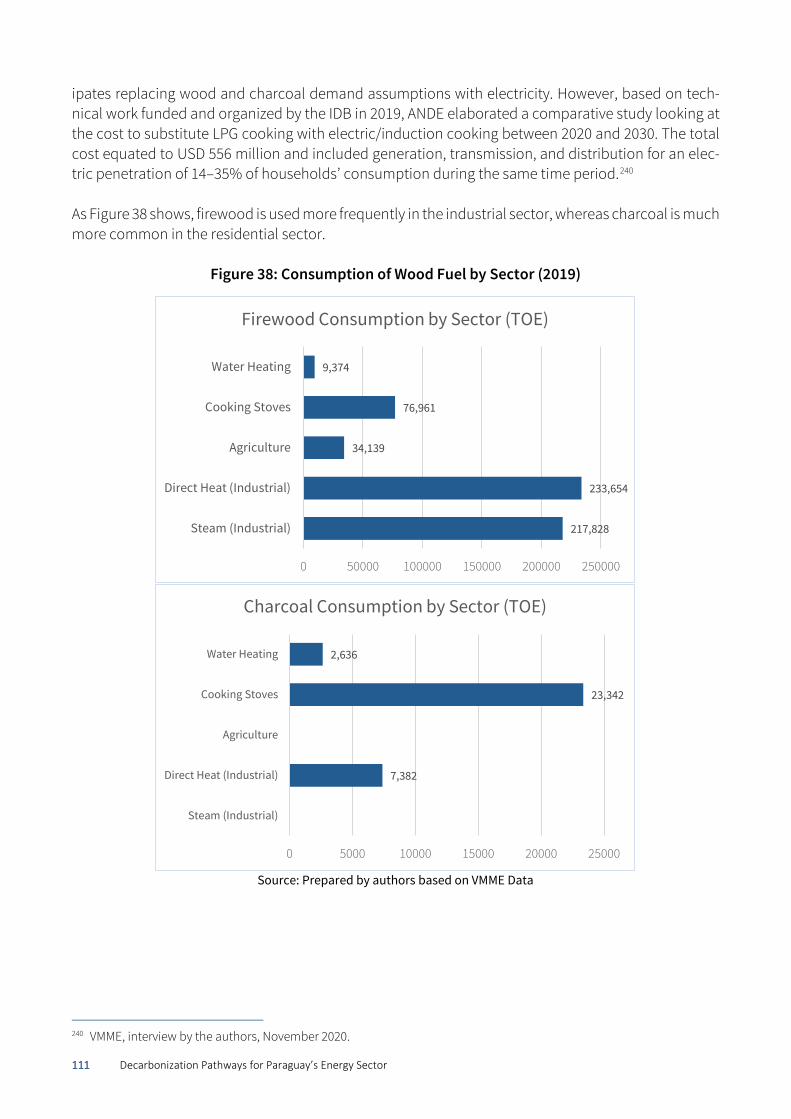
111 Decarbonization Pathways for Paraguay’s Energy Sector
ipates replacing wood and charcoal demand assumptions with electricity. However, based on tech-nical work funded and organized by the IDB in 2019, ANDE elaborated a comparative study looking at the cost to substitute LPG cooking with electric/induction cooking between 2020 and 2030. The total cost equated to USD 556 million and included generation, transmission, and distribution for an elec-tric penetration of 14–35% of households’ consumption during the same time period.240 As Figure 38 shows, firewood is used more frequently in the industrial sector, whereas charcoal is much more common in the residential sector.
Figure 38: Consumption of Wood Fuel by Sector (2019)
Source: Prepared by authors based on VMME Data
240 VMME, interview by the authors, November 2020.
217,828
233,654
34,139
76,961
9,374
0 50000 100000 150000 200000 250000
Steam (Industrial)
Direct Heat (Industrial)
Agriculture
Cooking Stoves
Water Heating
Firewood Consumption by Sector (TOE)
7,382
23,342
2,636
0 5000 10000 15000 20000 25000
Steam (Industrial)
Direct Heat (Industrial)
Agriculture
Cooking Stoves
Water Heating
Charcoal Consumption by Sector (TOE)
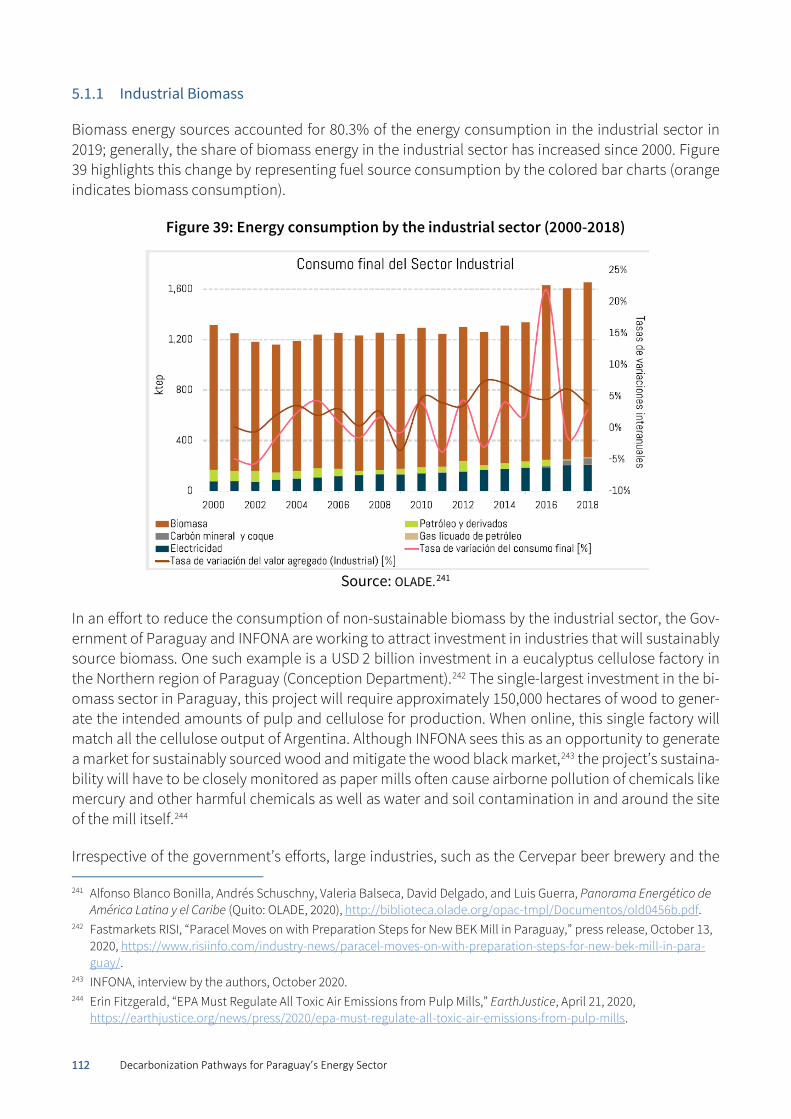
112 Decarbonization Pathways for Paraguay’s Energy Sector
5.1.1 Industrial Biomass
Biomass energy sources accounted for 80.3% of the energy consumption in the industrial sector in 2019; generally, the share of biomass energy in the industrial sector has increased since 2000. Figure 39 highlights this change by representing fuel source consumption by the colored bar charts (orange indicates biomass consumption).
Figure 39: Energy consumption by the industrial sector (2000-2018)
Source: OLADE.241
In an effort to reduce the consumption of non-sustainable biomass by the industrial sector, the Gov-ernment of Paraguay and INFONA are working to attract investment in industries that will sustainably source biomass. One such example is a USD 2 billion investment in a eucalyptus cellulose factory in the Northern region of Paraguay (Conception Department).242 The single-largest investment in the bi-omass sector in Paraguay, this project will require approximately 150,000 hectares of wood to gener-ate the intended amounts of pulp and cellulose for production. When online, this single factory will match all the cellulose output of Argentina. Although INFONA sees this as an opportunity to generate a market for sustainably sourced wood and mitigate the wood black market,243 the project’s sustaina-bility will have to be closely monitored as paper mills often cause airborne pollution of chemicals like mercury and other harmful chemicals as well as water and soil contamination in and around the site of the mill itself.244
Irrespective of the government’s efforts, large industries, such as the Cervepar beer brewery and the 241 Alfonso Blanco Bonilla, Andrés Schuschny, Valeria Balseca, David Delgado, and Luis Guerra, Panorama Energético de
América Latina y el Caribe (Quito: OLADE, 2020), http://biblioteca.olade.org/opac-tmpl/Documentos/old0456b.pdf. 242 Fastmarkets RISI, “Paracel Moves on with Preparation Steps for New BEK Mill in Paraguay,” press release, October 13,
2020, https://www.risiinfo.com/industry-news/paracel-moves-on-with-preparation-steps-for-new-bek-mill-in-para-guay/.
243 INFONA, interview by the authors, October 2020. 244 Erin Fitzgerald, “EPA Must Regulate All Toxic Air Emissions from Pulp Mills,” EarthJustice, April 21, 2020,
https://earthjustice.org/news/press/2020/epa-must-regulate-all-toxic-air-emissions-from-pulp-mills.
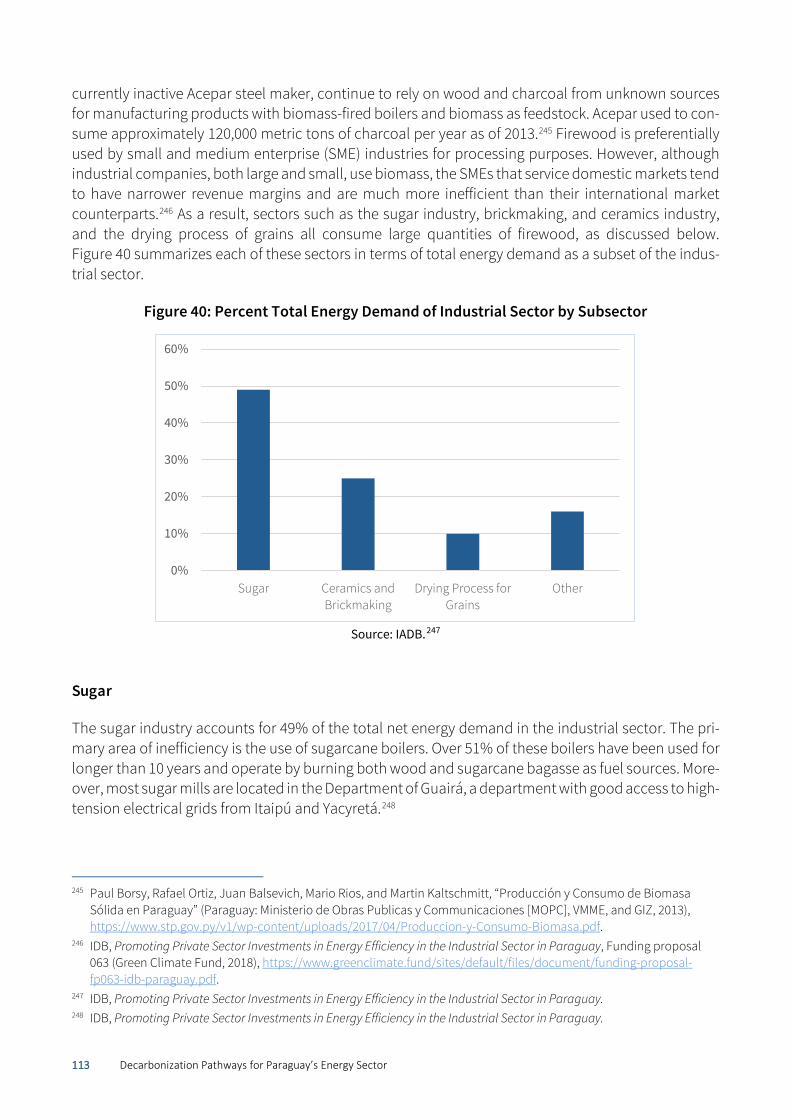
113 Decarbonization Pathways for Paraguay’s Energy Sector
currently inactive Acepar steel maker, continue to rely on wood and charcoal from unknown sources for manufacturing products with biomass-fired boilers and biomass as feedstock. Acepar used to con-sume approximately 120,000 metric tons of charcoal per year as of 2013.245 Firewood is preferentially used by small and medium enterprise (SME) industries for processing purposes. However, although industrial companies, both large and small, use biomass, the SMEs that service domestic markets tend to have narrower revenue margins and are much more inefficient than their international market counterparts.246 As a result, sectors such as the sugar industry, brickmaking, and ceramics industry, and the drying process of grains all consume large quantities of firewood, as discussed below. Figure 40 summarizes each of these sectors in terms of total energy demand as a subset of the indus-trial sector.
Figure 40: Percent Total Energy Demand of Industrial Sector by Subsector
Source: IADB.247
Sugar
The sugar industry accounts for 49% of the total net energy demand in the industrial sector. The pri-mary area of inefficiency is the use of sugarcane boilers. Over 51% of these boilers have been used for longer than 10 years and operate by burning both wood and sugarcane bagasse as fuel sources. More-over, most sugar mills are located in the Department of Guairá, a department with good access to high-tension electrical grids from Itaipú and Yacyretá.248
245 Paul Borsy, Rafael Ortiz, Juan Balsevich, Mario Rios, and Martin Kaltschmitt, “Producción y Consumo de Biomasa
Sólida en Paraguay” (Paraguay: Ministerio de Obras Publicas y Communicaciones [MOPC], VMME, and GIZ, 2013), https://www.stp.gov.py/v1/wp-content/uploads/2017/04/Produccion-y-Consumo-Biomasa.pdf.
246 IDB, Promoting Private Sector Investments in Energy Efficiency in the Industrial Sector in Paraguay, Funding proposal 063 (Green Climate Fund, 2018), https://www.greenclimate.fund/sites/default/files/document/funding-proposal-fp063-idb-paraguay.pdf.
247 IDB, Promoting Private Sector Investments in Energy Efficiency in the Industrial Sector in Paraguay. 248 IDB, Promoting Private Sector Investments in Energy Efficiency in the Industrial Sector in Paraguay.
0%
10%
20%
30%
40%
50%
60%
Sugar Ceramics andBrickmaking
Drying Process forGrains
Other
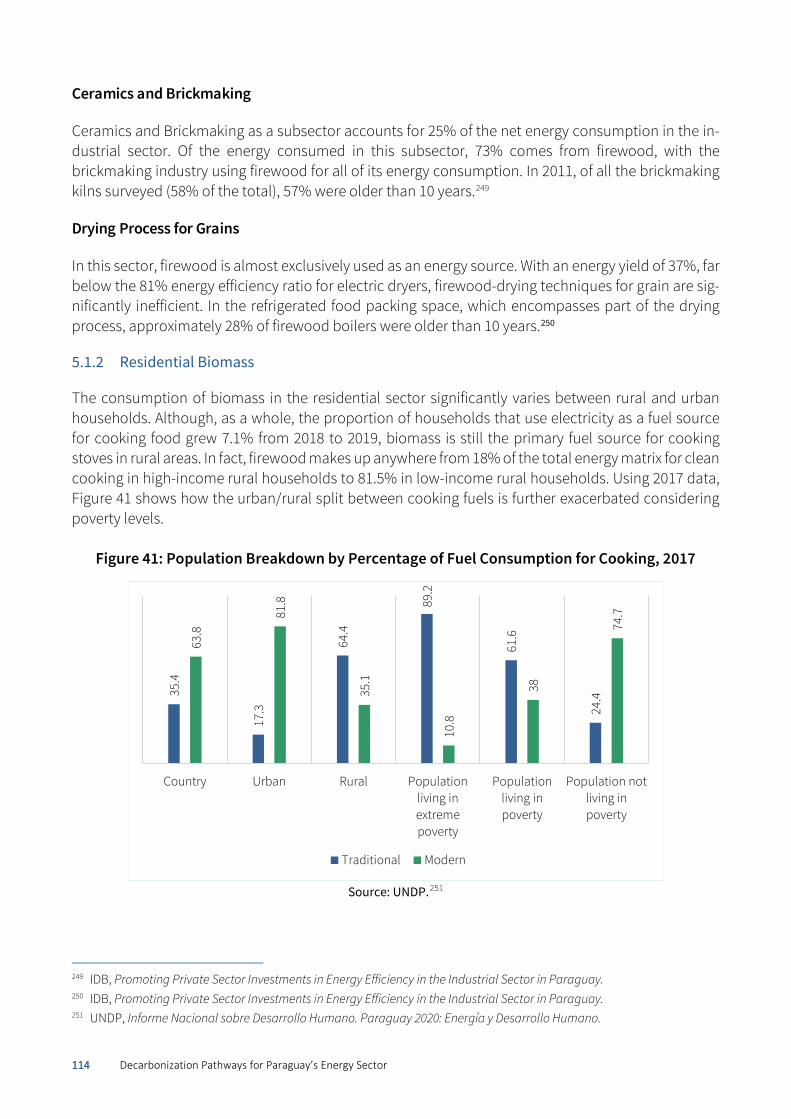
114 Decarbonization Pathways for Paraguay’s Energy Sector
Ceramics and Brickmaking
Ceramics and Brickmaking as a subsector accounts for 25% of the net energy consumption in the in-dustrial sector. Of the energy consumed in this subsector, 73% comes from firewood, with the brickmaking industry using firewood for all of its energy consumption. In 2011, of all the brickmaking kilns surveyed (58% of the total), 57% were older than 10 years.249
Drying Process for Grains
In this sector, firewood is almost exclusively used as an energy source. With an energy yield of 37%, far below the 81% energy efficiency ratio for electric dryers, firewood-drying techniques for grain are sig-nificantly inefficient. In the refrigerated food packing space, which encompasses part of the drying process, approximately 28% of firewood boilers were older than 10 years.250
5.1.2 Residential Biomass
The consumption of biomass in the residential sector significantly varies between rural and urban households. Although, as a whole, the proportion of households that use electricity as a fuel source for cooking food grew 7.1% from 2018 to 2019, biomass is still the primary fuel source for cooking stoves in rural areas. In fact, firewood makes up anywhere from 18% of the total energy matrix for clean cooking in high-income rural households to 81.5% in low-income rural households. Using 2017 data, Figure 41 shows how the urban/rural split between cooking fuels is further exacerbated considering poverty levels.
Figure 41: Population Breakdown by Percentage of Fuel Consumption for Cooking, 2017
Source: UNDP.251
249 IDB, Promoting Private Sector Investments in Energy Efficiency in the Industrial Sector in Paraguay. 250 IDB, Promoting Private Sector Investments in Energy Efficiency in the Industrial Sector in Paraguay. 251 UNDP, Informe Nacional sobre Desarrollo Humano. Paraguay 2020: Energía y Desarrollo Humano.
35.4
17.3
64.4
89.2
61.6
24.4
63.8
81.8
35.1
10.8
38
74.7
Country Urban Rural Populationliving inextremepoverty
Populationliving inpoverty
Population notliving inpoverty
Traditional Modern
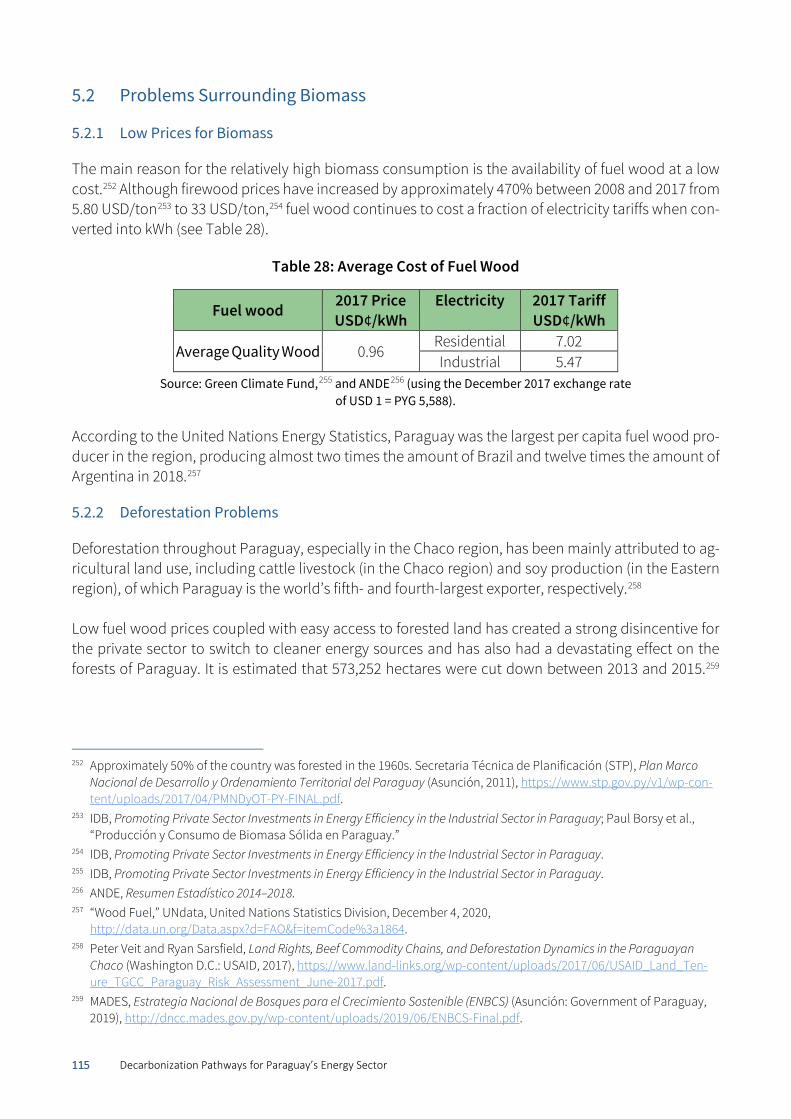
115 Decarbonization Pathways for Paraguay’s Energy Sector
Problems Surrounding Biomass
5.2.1 Low Prices for Biomass
The main reason for the relatively high biomass consumption is the availability of fuel wood at a low cost.252 Although firewood prices have increased by approximately 470% between 2008 and 2017 from 5.80 USD/ton253 to 33 USD/ton,254 fuel wood continues to cost a fraction of electricity tariffs when con-verted into kWh (see Table 28).
Table 28: Average Cost of Fuel Wood
Fuel wood 2017 Price USD¢/kWh
Electricity 2017 Tariff USD¢/kWh
Average Quality Wood 0.96 Residential 7.02 Industrial 5.47
Source: Green Climate Fund,255 and ANDE256 (using the December 2017 exchange rate of USD 1 = PYG 5,588).
According to the United Nations Energy Statistics, Paraguay was the largest per capita fuel wood pro-ducer in the region, producing almost two times the amount of Brazil and twelve times the amount of Argentina in 2018.257
5.2.2 Deforestation Problems
Deforestation throughout Paraguay, especially in the Chaco region, has been mainly attributed to ag-ricultural land use, including cattle livestock (in the Chaco region) and soy production (in the Eastern region), of which Paraguay is the world’s fifth- and fourth-largest exporter, respectively.258 Low fuel wood prices coupled with easy access to forested land has created a strong disincentive for the private sector to switch to cleaner energy sources and has also had a devastating effect on the forests of Paraguay. It is estimated that 573,252 hectares were cut down between 2013 and 2015.259
252 Approximately 50% of the country was forested in the 1960s. Secretaria Técnica de Planificación (STP), Plan Marco
Nacional de Desarrollo y Ordenamiento Territorial del Paraguay (Asunción, 2011), https://www.stp.gov.py/v1/wp-con-tent/uploads/2017/04/PMNDyOT-PY-FINAL.pdf.
253 IDB, Promoting Private Sector Investments in Energy Efficiency in the Industrial Sector in Paraguay; Paul Borsy et al., “Producción y Consumo de Biomasa Sólida en Paraguay.”
254 IDB, Promoting Private Sector Investments in Energy Efficiency in the Industrial Sector in Paraguay. 255 IDB, Promoting Private Sector Investments in Energy Efficiency in the Industrial Sector in Paraguay. 256 ANDE, Resumen Estadístico 2014–2018. 257 “Wood Fuel,” UNdata, United Nations Statistics Division, December 4, 2020,
http://data.un.org/Data.aspx?d=FAO&f=itemCode%3a1864. 258 Peter Veit and Ryan Sarsfield, Land Rights, Beef Commodity Chains, and Deforestation Dynamics in the Paraguayan
Chaco (Washington D.C.: USAID, 2017), https://www.land-links.org/wp-content/uploads/2017/06/USAID_Land_Ten-ure_TGCC_Paraguay_Risk_Assessment_June-2017.pdf.
259 MADES, Estrategia Nacional de Bosques para el Crecimiento Sostenible (ENBCS) (Asunción: Government of Paraguay, 2019), http://dncc.mades.gov.py/wp-content/uploads/2019/06/ENBCS-Final.pdf.
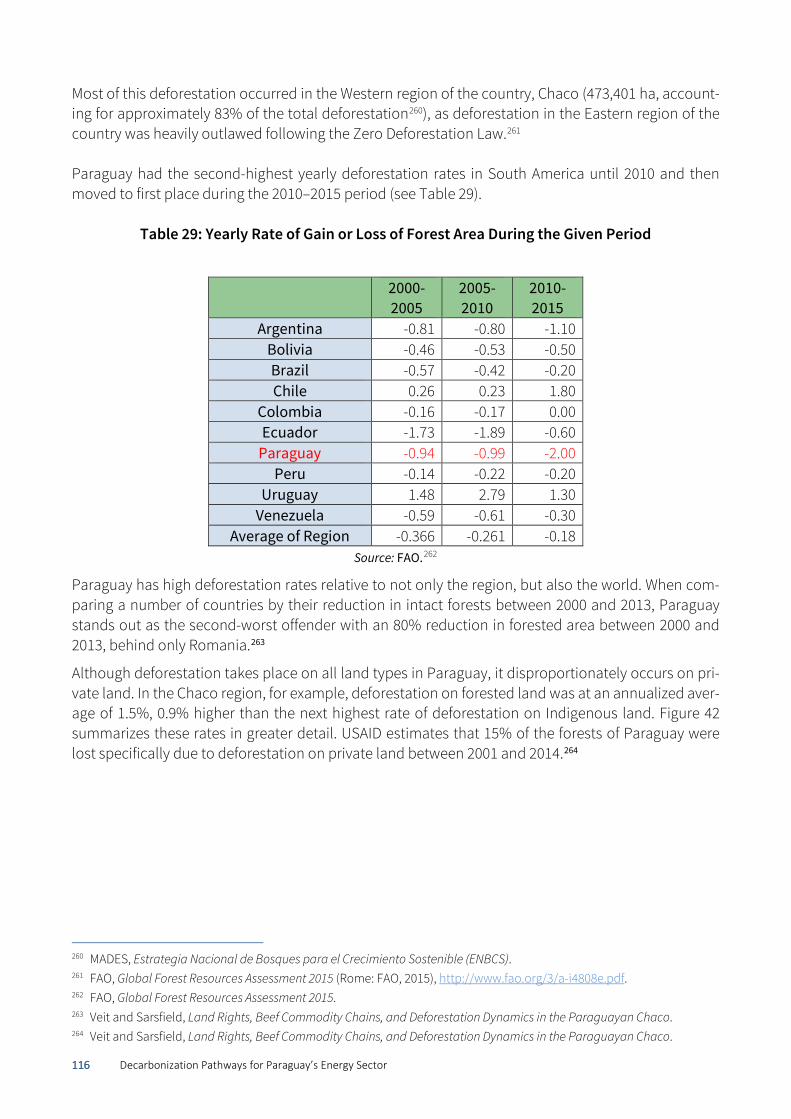
116 Decarbonization Pathways for Paraguay’s Energy Sector
Most of this deforestation occurred in the Western region of the country, Chaco (473,401 ha, account-ing for approximately 83% of the total deforestation260), as deforestation in the Eastern region of the country was heavily outlawed following the Zero Deforestation Law.261 Paraguay had the second-highest yearly deforestation rates in South America until 2010 and then moved to first place during the 2010–2015 period (see Table 29).
Table 29: Yearly Rate of Gain or Loss of Forest Area During the Given Period
2000-2005
2005-2010
2010-2015
Argentina -0.81 -0.80 -1.10 Bolivia -0.46 -0.53 -0.50 Brazil -0.57 -0.42 -0.20 Chile 0.26 0.23 1.80
Colombia -0.16 -0.17 0.00 Ecuador -1.73 -1.89 -0.60
Paraguay -0.94 -0.99 -2.00 Peru -0.14 -0.22 -0.20
Uruguay 1.48 2.79 1.30 Venezuela -0.59 -0.61 -0.30
Average of Region -0.366 -0.261 -0.18 Source: FAO.262
Paraguay has high deforestation rates relative to not only the region, but also the world. When com-paring a number of countries by their reduction in intact forests between 2000 and 2013, Paraguay stands out as the second-worst offender with an 80% reduction in forested area between 2000 and 2013, behind only Romania.263
Although deforestation takes place on all land types in Paraguay, it disproportionately occurs on pri-vate land. In the Chaco region, for example, deforestation on forested land was at an annualized aver-age of 1.5%, 0.9% higher than the next highest rate of deforestation on Indigenous land. Figure 42 summarizes these rates in greater detail. USAID estimates that 15% of the forests of Paraguay were lost specifically due to deforestation on private land between 2001 and 2014.264
260 MADES, Estrategia Nacional de Bosques para el Crecimiento Sostenible (ENBCS). 261 FAO, Global Forest Resources Assessment 2015 (Rome: FAO, 2015), http://www.fao.org/3/a-i4808e.pdf. 262 FAO, Global Forest Resources Assessment 2015. 263 Veit and Sarsfield, Land Rights, Beef Commodity Chains, and Deforestation Dynamics in the Paraguayan Chaco. 264 Veit and Sarsfield, Land Rights, Beef Commodity Chains, and Deforestation Dynamics in the Paraguayan Chaco.
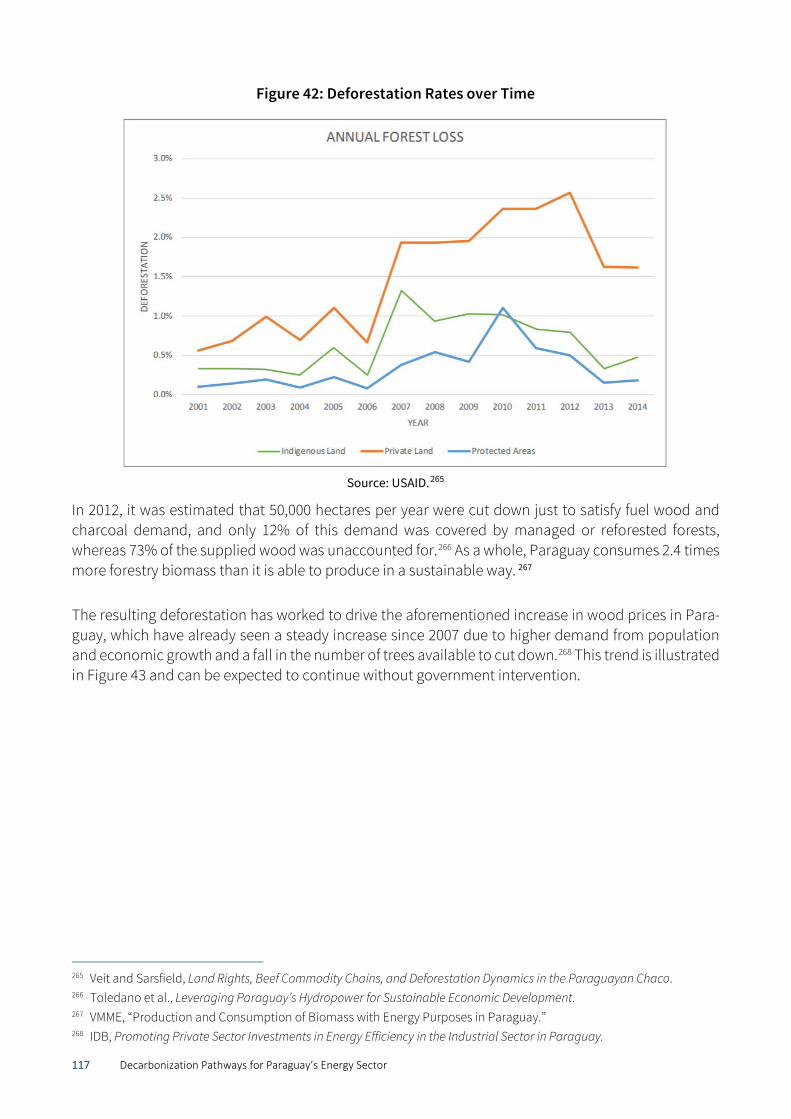
117 Decarbonization Pathways for Paraguay’s Energy Sector
Figure 42: Deforestation Rates over Time
Source: USAID.265
In 2012, it was estimated that 50,000 hectares per year were cut down just to satisfy fuel wood and charcoal demand, and only 12% of this demand was covered by managed or reforested forests, whereas 73% of the supplied wood was unaccounted for.266 As a whole, Paraguay consumes 2.4 times more forestry biomass than it is able to produce in a sustainable way. 267
The resulting deforestation has worked to drive the aforementioned increase in wood prices in Para-guay, which have already seen a steady increase since 2007 due to higher demand from population and economic growth and a fall in the number of trees available to cut down.268 This trend is illustrated in Figure 43 and can be expected to continue without government intervention.
265 Veit and Sarsfield, Land Rights, Beef Commodity Chains, and Deforestation Dynamics in the Paraguayan Chaco. 266 Toledano et al., Leveraging Paraguay’s Hydropower for Sustainable Economic Development. 267 VMME, “Production and Consumption of Biomass with Energy Purposes in Paraguay.” 268 IDB, Promoting Private Sector Investments in Energy Efficiency in the Industrial Sector in Paraguay.
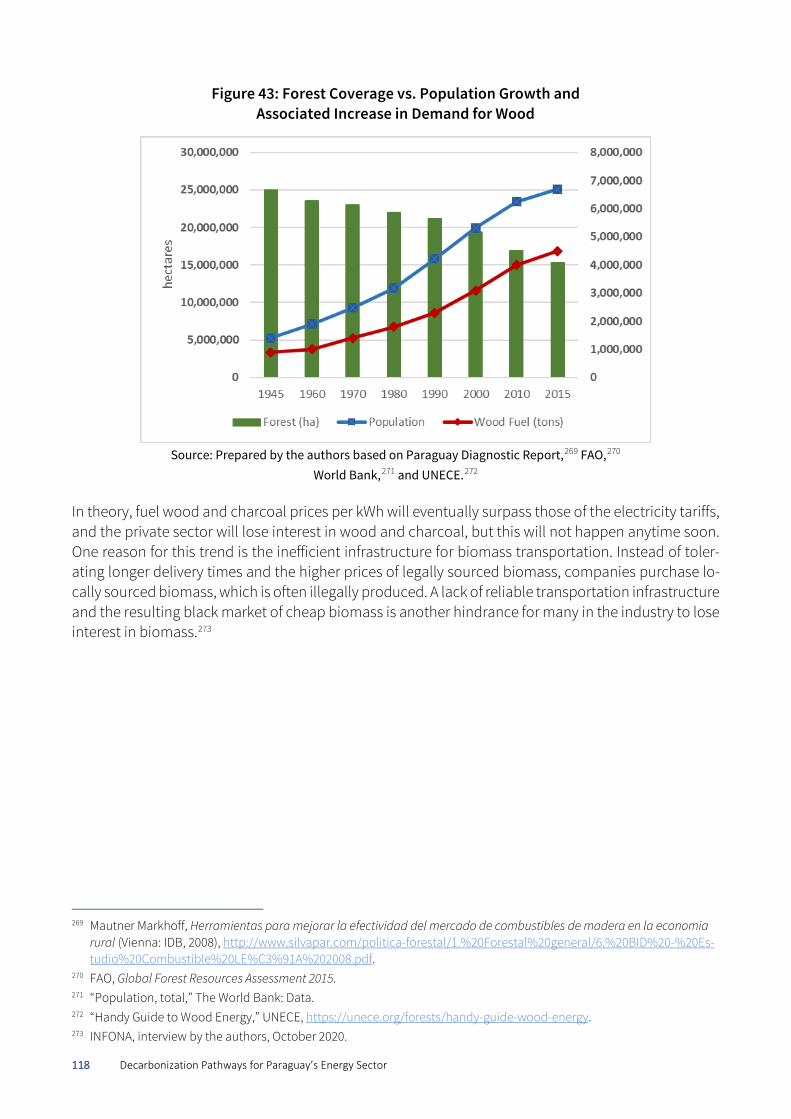
118 Decarbonization Pathways for Paraguay’s Energy Sector
Figure 43: Forest Coverage vs. Population Growth and Associated Increase in Demand for Wood
Source: Prepared by the authors based on Paraguay Diagnostic Report,269 FAO,270
World Bank,271 and UNECE.272
In theory, fuel wood and charcoal prices per kWh will eventually surpass those of the electricity tariffs, and the private sector will lose interest in wood and charcoal, but this will not happen anytime soon. One reason for this trend is the inefficient infrastructure for biomass transportation. Instead of toler-ating longer delivery times and the higher prices of legally sourced biomass, companies purchase lo-cally sourced biomass, which is often illegally produced. A lack of reliable transportation infrastructure and the resulting black market of cheap biomass is another hindrance for many in the industry to lose interest in biomass.273
269 Mautner Markhoff, Herramientas para mejorar la efectividad del mercado de combustibles de madera en la economia
rural (Vienna: IDB, 2008), http://www.silvapar.com/politica-forestal/1.%20Forestal%20general/6.%20BID%20-%20Es-tudio%20Combustible%20LE%C3%91A%202008.pdf.
270 FAO, Global Forest Resources Assessment 2015. 271 “Population, total,” The World Bank: Data. 272 “Handy Guide to Wood Energy,” UNECE, https://unece.org/forests/handy-guide-wood-energy. 273 INFONA, interview by the authors, October 2020.
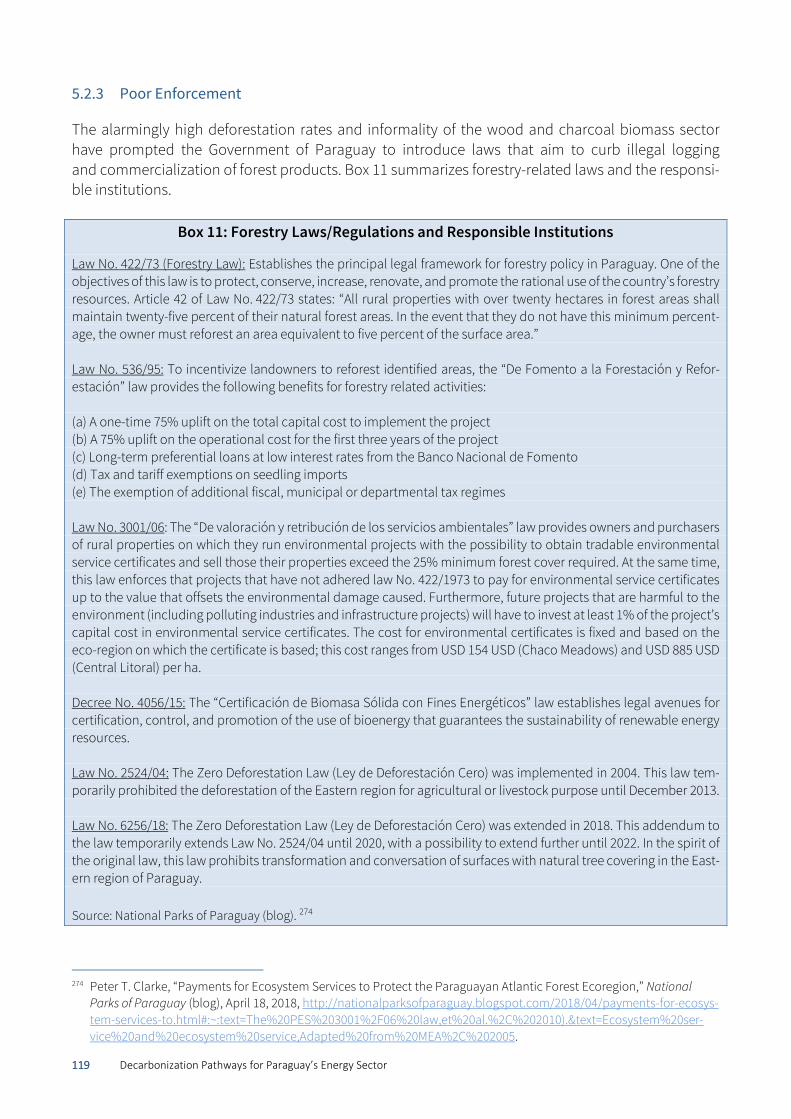
119 Decarbonization Pathways for Paraguay’s Energy Sector
5.2.3 Poor Enforcement
The alarmingly high deforestation rates and informality of the wood and charcoal biomass sector have prompted the Government of Paraguay to introduce laws that aim to curb illegal logging and commercialization of forest products. Box 11 summarizes forestry-related laws and the responsi-ble institutions.
Box 11: Forestry Laws/Regulations and Responsible Institutions
Law No. 422/73 (Forestry Law): Establishes the principal legal framework for forestry policy in Paraguay. One of the objectives of this law is to protect, conserve, increase, renovate, and promote the rational use of the country’s forestry resources. Article 42 of Law No. 422/73 states: “All rural properties with over twenty hectares in forest areas shall maintain twenty-five percent of their natural forest areas. In the event that they do not have this minimum percent-age, the owner must reforest an area equivalent to five percent of the surface area.” Law No. 536/95: To incentivize landowners to reforest identified areas, the “De Fomento a la Forestación y Refor-estación” law provides the following benefits for forestry related activities: (a) A one-time 75% uplift on the total capital cost to implement the project (b) A 75% uplift on the operational cost for the first three years of the project (c) Long-term preferential loans at low interest rates from the Banco Nacional de Fomento (d) Tax and tariff exemptions on seedling imports (e) The exemption of additional fiscal, municipal or departmental tax regimes Law No. 3001/06: The “De valoración y retribución de los servicios ambientales” law provides owners and purchasers of rural properties on which they run environmental projects with the possibility to obtain tradable environmental service certificates and sell those their properties exceed the 25% minimum forest cover required. At the same time, this law enforces that projects that have not adhered law No. 422/1973 to pay for environmental service certificates up to the value that offsets the environmental damage caused. Furthermore, future projects that are harmful to the environment (including polluting industries and infrastructure projects) will have to invest at least 1% of the project’s capital cost in environmental service certificates. The cost for environmental certificates is fixed and based on the eco-region on which the certificate is based; this cost ranges from USD 154 USD (Chaco Meadows) and USD 885 USD (Central Litoral) per ha. Decree No. 4056/15: The “Certificación de Biomasa Sólida con Fines Energéticos” law establishes legal avenues for certification, control, and promotion of the use of bioenergy that guarantees the sustainability of renewable energy resources. Law No. 2524/04: The Zero Deforestation Law (Ley de Deforestación Cero) was implemented in 2004. This law tem-porarily prohibited the deforestation of the Eastern region for agricultural or livestock purpose until December 2013. Law No. 6256/18: The Zero Deforestation Law (Ley de Deforestación Cero) was extended in 2018. This addendum to the law temporarily extends Law No. 2524/04 until 2020, with a possibility to extend further until 2022. In the spirit of the original law, this law prohibits transformation and conversation of surfaces with natural tree covering in the East-ern region of Paraguay. Source: National Parks of Paraguay (blog). 274
274 Peter T. Clarke, “Payments for Ecosystem Services to Protect the Paraguayan Atlantic Forest Ecoregion,” National
Parks of Paraguay (blog), April 18, 2018, http://nationalparksofparaguay.blogspot.com/2018/04/payments-for-ecosys-tem-services-to.html#:~:text=The%20PES%203001%2F06%20law,et%20al.%2C%202010).&text=Ecosystem%20ser-vice%20and%20ecosystem%20service,Adapted%20from%20MEA%2C%202005.
120 Decarbonization Pathways for Paraguay’s Energy Sector
INFONA is the enforcement authority of Forestry Law No. 422/73, Law No. 536/95, and all other forestry-related guidelines. It is a decentralized entity with administrative autonomy that succeeded the Ser-vicio Forestal Nacional, an agency under the MAG. INFONA is also in charge of approving the forest management plans, which need to be submitted before exploitation. For projects with a surface area of more than 50 hectares, these plans can only be approved by MADES, who issues an environmental impact declaration. Furthermore, INFONA issues forest transport permits that allow the transportation and commercialization of wood and other forestry products. This permit identifies the amount, spe-cies, weight or volume, origin, and destination of the load. Non-compliance with these regulations means that property can be considered unproductive land holding subject to expropriation.275 Paraguay’s forestry laws provide a good basis to reduce deforestation, and there is increased interna-tional involvement in deforestation mitigation. However, there are problems with insufficient internal government oversight and operating procedures for both implementation and compliance. Although the loopholes of the forestry law were finally closed in 2008276, the environmental permitting process continues to lack rigor, and judicial revocations of permits are still not well respected. Furthermore, regulatory norms do not require INFONA to perform a prior audit before granting trans-portation permits, which makes it difficult to ensure that forest products covered by the forest transport permits actually come from properties that have an approved forest management plan. Law No. 515/94 prohibits INFONA from issuing forest transport permits for exportation. In addition, INFONA does not have the funding to administer the cap-and-trade system of environmental certificates un-derpinned by Law No. 3001/2006 (mentioned above), so the law remains ineffective, which in turn re-duces the demand for certificates.277 For instance, the costs of obtaining the certificates and the trans-action costs can start at USD 5,000 and go higher depending on whether there are delays in the pro-cess, honoraria must be paid to consultants, or the applicant lives outside Asunción. There is no cen-tralized trading platform for these certificates, which increases the transaction costs for participants. The list of activities defined as having a high environmental impact, which is associated with the obli-gation to purchase certificates, is limited.278 As a result, as of early 2019, only 182,000 hectares were offered in the market and only 10.6% were actually traded.279 The Green Climate Fund has conceived a project to address these deficiencies, but it has not been approved yet.280
Lastly, there are fines provided by law for those caught with illegally obtained biomass (such as fire-wood), but there is no way to know where the biomass is sourced.
275 Veit and Sarsfield, Land Rights, Beef Commodity Chains, and Deforestation Dynamics in the Paraguayan Chaco. 276 Until Resolution 531/2008, the forestry law was plagued with loopholes, including one in which a landowner would
sell the 25% forested land to a buyer who would then be able to deforest up to 75% of the new “purchased land” and “only required that five percent of improperly cleared land be reforested.” Veit and Sarsfield, Land Rights, Beef Com-modity Chains, and Deforestation Dynamics in the Paraguayan Chaco.
277 INFONA, interview by the authors, October 2020. 278 United Nations Environment Programme (UNEP), Concept Note: Market-Based Mechanism - Implementation of Law
3001/06 in Paraguay (Green Climate Fund, 2019), https://www.greenclimate.fund/sites/default/files/document/21590-market-based-mechanism-implementation-law-3001-06-paraguay.pdf.
279 United Nations Environment Programme (UNEP), Concept Note: Market-Based Mechanism - Implementation of Law 3001/06 in Paraguay.
280 United Nations Environment Programme (UNEP), Concept Note: Market-Based Mechanism - Implementation of Law 3001/06 in Paraguay.
121 Decarbonization Pathways for Paraguay’s Energy Sector
These problems are further aggravated by the shared managerial responsibilities between INFONA, the Ministry of the Environment, and the Ministry of Agriculture, leading to bureaucratic roadblocks to important strategies to deter deforestation.
Solutions for the Biomass Sector
5.3.1 Current initiatives to slow down deforestation and accelerate reforestation
National Reforestation Plan The National Reforestation Plan, declared by Decree No. 10,174/2012 in 2012, sets the national goal of Paraguay to plant 450,000 ha of trees and forest land between 2013 and 2027.281 The general scope of the plan includes 390,000 ha planted in multiple-use plantations (solid wood and energy mixed use) and 60,000 ha planted in forest-based plantations. With the hope of reducing the pressures on native forests in Paraguay from biomass demand from the energy sector, this bill was introduced to specifi-cally target biomass for energy production reforestation.282 However, progress towards the plan’s goal has been slow. The FAO suggests that combining both na-tive and exotic species in the reforestation process and planting on both multi- and single-use planta-tions will help to accelerate development. In particular, the use of the Eucalyptus tree as an exotic species will help to accelerate reforestation, as this particular species yields minimal GHG emissions through the production of Eucalyptus chips (shredded wood biomass) and is already widely available in Paraguay.283 Certification Program for Sustainable Biomass There is an attempt to regulate and gain control of the biomass black market within the country. By establishing a certification program within the government, which could be enforced by INFONA and the VMME, INFONA is hoping to distinguish between legal and illegal biomass. Launched by Decree No. 4056/2015 and regulated by Resolution MOPC No. 933/2020, this certification program will allow these government agencies to verify the sourcing of biomass in the industrial and residential sectors and impose fines on companies purchasing illegal wood, charcoal, and other types of biomass.284 The implementation phase of the certification program began in July 2021, mandating all biomass con-sumers to consume certified biomass as a percentage of the total biomass consumption. By 2025, the percentage of biomass consumed that must be certified will reach 100% (30% in year 1, 50% in year 2, 70% in year 3, 90% in year 4, and 100% in year 5).285
281 Tiziana Pirelli and Andrea Rossi, “Sostenibilidad de la Biomasa Forestal para Energía y del Etanol de Maíz y Caña de
Azúcar en Paraguay,” (Environmental and Natural Resources Management Working Paper 70, Rome: FAO, 2018), http://www.fao.org/3/i9576es/I9576ES.pdf.
282 ABC Rural, “Plan Nacional de Reforestación,” ABC, January 16, 2013, https://www.abc.com.py/edicion-impresa/suple-mentos/abc-rural/plan-nacional-de-reforestacion-527578.html.
283 Pirelli and Rossi, “Sostenibilidad de la Biomasa Forestal para Energía y del Etanol de Maíz y Cana de Azúcar en Para-guay.”
284 INFONA, interview by the authors, October 2020. 285 Decree No. 4056/2015; Resolution MOPC No. 933/2020.
122 Decarbonization Pathways for Paraguay’s Energy Sector
Green Climate Fund Projects Paraguay is currently involved with three separate GCF projects in collaboration with the United Na-tions. The first project, FP062, is known as the Poverty, Reforestation, Energy, and Climate Change Pro-ject (PROEZA). This effort involves promoting reforestation in Eastern Paraguay to achieve natural car-bon sequestration and diversified agricultural production. To achieve this, environmental cash trans-fers (E-CCT) will be given in exchange for community-based climate-sensitive agroforestry until sus-tainable farming models can be introduced in the area.286 An example effort of this project is high-lighted in Section 5.3.3. The second project, FP063, is a program intended to promote energy efficiency improvements in the industrial sector. This project works to retrofit existing technologies with more energy-efficient and electric options and provide investment to achieve this. 287 This project is discussed in greater detail in Section 5.3.2. The third project, FP121, is known as the REDD+ Results-based payments in Paraguay.288 Paraguay joined the REDD+ program,289 a voluntary process under the United Nations Framework Convention on Climate Change (UNFCCC) that provides oversight and deforestation mitigation strategies interna-tionally, to catalyze investment in forest stocks. Because of and in addition to its involvement in the REDD+ program, the Government of Paraguay received a USD 25 million grant to support mitigating deforestation efforts in areas with Indigenous and marginalized peoples. Combined with USD 65 mil-lion from the Government of Paraguay, this project is working to combat climate change in the coun-try. However, the terms of the agreement for the grant are still in discussion.290 Other International Projects One of the most efficient tools to monitor deforestation is the use of international satellite monitoring. Such monitoring by the World Wildlife Fund (WWF) has led to the observation of small-plot deforesta-tion in many remote regions of the country, areas where farmers and organized groups fell trees to take advantage of the fertile soil underneath to grow illegal crops such as marijuana for international export.291 Increasing budgetary policy for monitoring and evaluation systems with satellites could help deter illegal deforestation in the coming years. Paraguay has also engaged in international efforts to replace lost forest cover within its borders. In 2019, Paraguay joined 16 other countries in Latin America as part of Initiative 2020, a movement to
286 “FP062: Poverty, Reforestation, Energy and Climate Change Project (PROEZA),” Green Climate Fund 2018,
https://www.greenclimate.fund/project/fp062. 287 “FP063: Promoting private sector investments in energy efficiency in the industrial sector and in Paraguay,” Green Cli-
mate Fund, 2018, https://www.greenclimate.fund/project/fp063. 288 “FP121: REDD+ Results-based payments in Paraguay for the period 2015-2017,” Green Climate Fund, 2019,
https://www.greenclimate.fund/project/fp121. 289 Achim Steiner, Inger Andersen, and Qu Dongyu, “Paraguay Demonstrates Benefits of Forests as a Nature-Based Solu-
tion to Climate Change,” FAO, February 17, 2020, http://www.fao.org/redd/news/detail/en/c/1262457. 290 “The Green Climate Fund Allocates $25 Million to Support FAO Climate Resilience Project in Paraguay,” FAO, April 12,
2019, http://www.fao.org/news/story/en/item/1190331/icode. 291 Emelin Gasparrini, “Forest Monitoring Strong Deterrent to Illegal Deforestation,” World Wildlife Fund (blog), May 19,
2016, https://wwf.panda.org/wwf_news/?268151/Forest-monitoring-strong-deterrent.
123 Decarbonization Pathways for Paraguay’s Energy Sector
restore degraded land and forests. Paraguay also partnered with the World Resources Institute to cre-ate the first national Forest Atlas in Latin America. The Forest Atlas project will combine government data on deforestation with the latest monitoring and information and communication technology (ICT) data to modulate and update deforestation and recovery in an online platform.292 Additionally, Paraguay released a National Strategy of the Forests for Sustainable Growth plan in May 2019. Among other things, this plan uses UN Food and Agriculture Organization (FAO) data on defor-estation to map a series of goals and steps to achieving these goals. With a total reduction in forest cover of 573,252 hectares between 2013 and 2015, this strategy prioritizes the coordination of organi-zations between the Ministry of the Environment, REDD+, and the National Commission on Climate Change (CNCC), with the CNCC as mediator organization. Among other goals, this strategy recognizes the role of gender, socioeconomics, and the reduction of GHG emissions as critical pathways to suc-cess, mirroring the country’s plan for Sustainable Development to 2030.293
5.3.2 Improvements in Industrial Consumption
As part of a successful loan obtained from the GCF FP063 project and the Inter-American Development Bank totaling USD 57.05 million, the Government of Paraguay has actively worked to lower the rate of biomass consumption in certain areas of the industrial sector. 294 The electric variants of the grinder machinery used in sugar production have net efficiency yields of 87%, a significant boost over their firewood counterparts, which could reallocate carbon-neutral ba-gasse as a fuel source instead of firewood. In total, the savings potential from these and similar im-provements to equipment would amount to 56.5 kTOE of energy. The greatest savings come from the brickmaking industry (25.5 kTOE) and co-generation power production from the sugar industry (12.3 kTOE), the latter of which allows for steam to also generate electricity surplus that can be sold back to the grid.295 This investment’s potential benefit was estimated to yield savings of at least 10% of the net energy demand in Paraguay’s industrial sector. To date, the project has seen a return on investment of 11%.296 Continued savings from biomass could drastically reduce the need for deforestation and biomass con-sumption in the near future.297 However, investments in energy efficiency improvements in the indus-trial sector must continue to completely modernize the industry as a whole, not just SMEs and volun-tary large industrial companies. Charcoal is also used in direct heating in the steel industry, whereas fuelwood has been used in the cement industry both as a fuel and feedstock. Although efficiency gains are also necessary, a change
292 World Resources Institute (WRI), “Release: Paraguay and WRI to Build First Publicly Accessible Forest Atlas in South
America,” press release, March 29, 2019, https://www.wri.org/news/2019/03/release-paraguay-and-wri-build-first-publicly-accessible-forest-atlas-south-america.
293 MADES, “Estrategia Nacional de Bosques para el Crecimiento Sostenible (ENBCS)” (presented at Webinar: Acción Climática en Paraguay: Government of Paraguay, 2019), http://dncc.mades.gov.py/wp-content/uploads/2020/06/Es-trategia-Nacional-de-Bosques-para-el-Crecimiento-Sostenible.pdf.
294 IDB, Promoting Private Sector Investments in Energy Efficiency in the Industrial Sector in Paraguay. 295 IDB, Promoting Private Sector Investments in Energy Efficiency in the Industrial Sector in Paraguay. 296 INFONA, interview by the authors, October 2020. 297 IDB, Promoting Private Sector Investments in Energy Efficiency in the Industrial Sector in Paraguay.
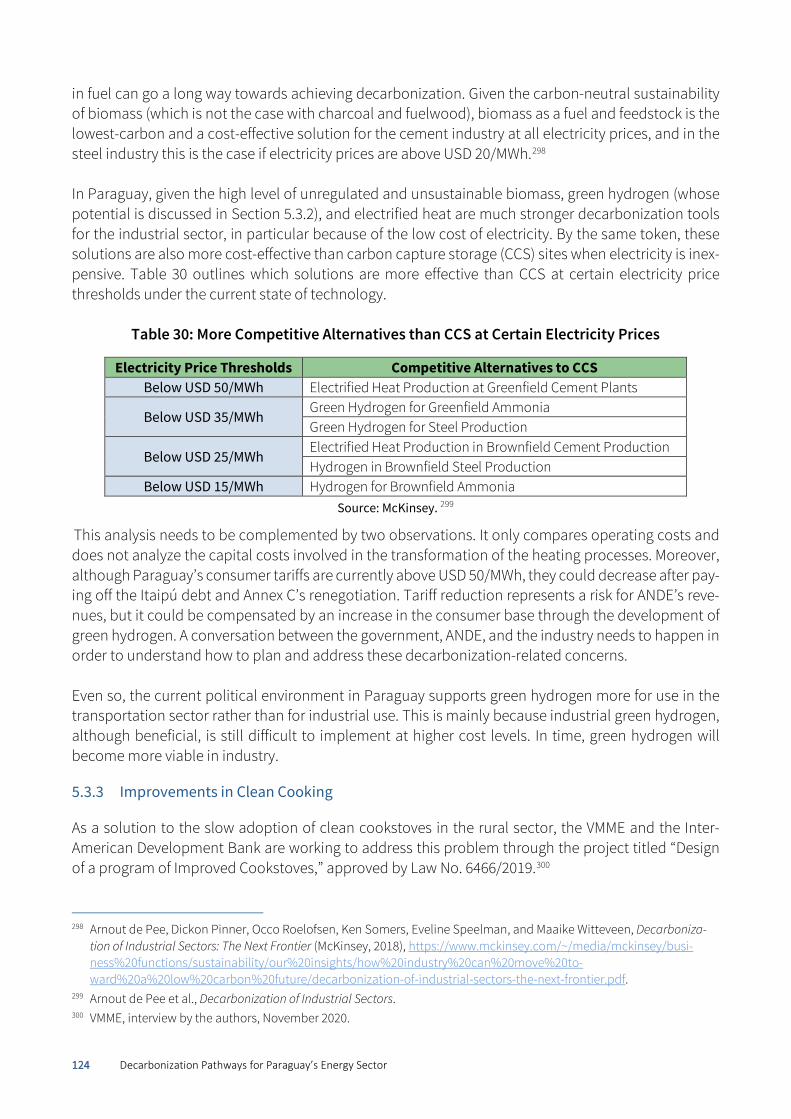
124 Decarbonization Pathways for Paraguay’s Energy Sector
in fuel can go a long way towards achieving decarbonization. Given the carbon-neutral sustainability of biomass (which is not the case with charcoal and fuelwood), biomass as a fuel and feedstock is the lowest-carbon and a cost-effective solution for the cement industry at all electricity prices, and in the steel industry this is the case if electricity prices are above USD 20/MWh.298 In Paraguay, given the high level of unregulated and unsustainable biomass, green hydrogen (whose potential is discussed in Section 5.3.2), and electrified heat are much stronger decarbonization tools for the industrial sector, in particular because of the low cost of electricity. By the same token, these solutions are also more cost-effective than carbon capture storage (CCS) sites when electricity is inex-pensive. Table 30 outlines which solutions are more effective than CCS at certain electricity price thresholds under the current state of technology.
Table 30: More Competitive Alternatives than CCS at Certain Electricity Prices
Electricity Price Thresholds Competitive Alternatives to CCS Below USD 50/MWh Electrified Heat Production at Greenfield Cement Plants
Below USD 35/MWh Green Hydrogen for Greenfield Ammonia Green Hydrogen for Steel Production
Below USD 25/MWh Electrified Heat Production in Brownfield Cement Production Hydrogen in Brownfield Steel Production
Below USD 15/MWh Hydrogen for Brownfield Ammonia Source: McKinsey. 299
This analysis needs to be complemented by two observations. It only compares operating costs and does not analyze the capital costs involved in the transformation of the heating processes. Moreover, although Paraguay’s consumer tariffs are currently above USD 50/MWh, they could decrease after pay-ing off the Itaipú debt and Annex C’s renegotiation. Tariff reduction represents a risk for ANDE’s reve-nues, but it could be compensated by an increase in the consumer base through the development of green hydrogen. A conversation between the government, ANDE, and the industry needs to happen in order to understand how to plan and address these decarbonization-related concerns. Even so, the current political environment in Paraguay supports green hydrogen more for use in the transportation sector rather than for industrial use. This is mainly because industrial green hydrogen, although beneficial, is still difficult to implement at higher cost levels. In time, green hydrogen will become more viable in industry.
5.3.3 Improvements in Clean Cooking
As a solution to the slow adoption of clean cookstoves in the rural sector, the VMME and the Inter-American Development Bank are working to address this problem through the project titled “Design of a program of Improved Cookstoves,” approved by Law No. 6466/2019.300 298 Arnout de Pee, Dickon Pinner, Occo Roelofsen, Ken Somers, Eveline Speelman, and Maaike Witteveen, Decarboniza-
tion of Industrial Sectors: The Next Frontier (McKinsey, 2018), https://www.mckinsey.com/~/media/mckinsey/busi-ness%20functions/sustainability/our%20insights/how%20industry%20can%20move%20to-ward%20a%20low%20carbon%20future/decarbonization-of-industrial-sectors-the-next-frontier.pdf.
299 Arnout de Pee et al., Decarbonization of Industrial Sectors. 300 VMME, interview by the authors, November 2020.
125 Decarbonization Pathways for Paraguay’s Energy Sector
As part of this initiative, the VMME has begun to host meetings at their offices with members of the community, government ministries, and international partners to build a framework for project imple-mentation.301 The program plans to install 7,500 improved cookstoves in poor rural households in the departments of Caaguazu, Canindeyu, and San Pedro in Eastern Paraguay. Designed in the center of the household to avoid smoke inhalation, these improved cookstoves consume less wood fuel.302 These efforts are in conjunction with the GCF Proeza project to support municipal reforestation and sustainability initiatives. In addition to this project, the VMME has also asked for assistance to work with the International Solar Alliance.303 Seeking technical cooperation and provisions for the fabrication of eco-cookstoves, which use 70% less wood fuel, the VMME hopes to take this technology and incorporate it throughout Para-guay in the coming years. In the meantime, the Ministry of the Woman, in collaboration with Itaipú and the VMME, is working with 250 families in the communities of La Esperanza and San José in the Caa-guazú department. In this project, titled “Indigenous women and the use of alternative technologies in the communities, Eco-cookstoves,” these stakeholders are developing a pilot project to incorporate a type of cookstove that has LED lights, a battery recharge port for cell phones, and a USB port for a solar panel. The hope is that with feedback from the community, these cookstoves can be improved and the project can move past the pilot phase.304 In addition, there is a program sponsored by both INFONA and Paraguay’s Central Bank that seeks to allow forest plantations as guarantees for loans. This means that the 80% of Paraguay’s forests (95% in the Chaco region) that are on private land can be used as collateral for loans accepted by the Central Bank of Paraguay. This effort helps incentivize landowners to maintain native forest land for future economic collateral. 305
Recommendations for the Biomass Sector
1. Replacement of biomass consumption by electricity when possible is imperative to both minimize deforestation and to use electricity domestically and is considered in the Zero-Emissions Scenario of the LEAP and SimSEE models (see Chapters 1 and 3). ANDE considers this need to some extent in the new master plan when it comes to medium-voltage intensity industry, and the Government of Paraguay should take this factor into account when renegotiating Annex C. However, electrifi-cation by itself will not solve the problem, and the following steps should also be taken.
2. The current regulatory framework for forestry is deficient and non-enforceable. The problem is compounded by the institutional confusion around the management of the deforestation issue. The regulatory framework should be critically reviewed and restructured around the climate–land–energy nexus, considering the need for land for biomass as well as other uses, such as carbon sinks and the siting of zero-carbon energy infrastructure. INFONA should be provided with the ad-ministrative capacity to monitor the enforcement of laws and penalties as well as the direct use of
301 “Diseño de un Programa de Cocinas Mejoradas – Apoyo a PROEZA,” Viceministerio de Minas y Energía, October 8, 2019,
https://www.ssme.gov.py/vmme/index.php?option=com_content&view=article&id=1980:diseno-de-un-programa-de-cocinas-mejoradas-apoyo-a-proeza&catid=96:sample-news&Itemid=552.
302 FAO, Gestión Social y Ambiental del Proyecto PROEZA (Asunción: FAO), http://www.fao.org/3/CA0244ES/ca0244es.pdf. 303 “International Solar Alliance,” International Solar Alliance (ISA), https://isolaralliance.org. 304 VMME, interview by the authors, November 2020. 305 INFONA, interview by the authors, October 2020.
126 Decarbonization Pathways for Paraguay’s Energy Sector
funding to achieve these ends. Transfering funds directly to the Ministry of the Environment dimin-ishes INFONA’s ability to quickly act on regulatory measures.
3. In addition, expanding a formal biomass certification system to regulate and control illegal and
legal biomass sales and consumption for the industrial and commercial sectors is of critical im-portance. With the successful passing of Resolution MOPC No. 933/2020, INFONA should be able to more impactfully mitigate overall consumption and push industry to transition to electricity as an alternative to biomass fuels. This certification program could be a joint collaboration between the Ministry of Finance and INFONA and overseen by international organizations such as the REDD+ program, entities with which Paraguay already has a working relationship. Investing in monitoring technologies would help government officials to track where deforestation takes place and to control it better. The National Reforestation strategy should be reviewed and followed through in light of the latest international initiatives in which Paraguay participates.
4. In addition to weak enforcement, an inefficient transportation and supply chain infrastructure net-
work is to blame for many end-users opting for locally obtained illegal biomass instead of legal biomass due to delays and high costs. Talks with international entities for projects focused on im-proving the supply chain for legal biomass between the Chaco region, from where most legal bio-mass derives, and the industry-heavy Eastern region of Paraguay, where most demand for biomass lies, would help to incentivize legal biomass by reducing prices and wait times.
5. Working to bring regulation that requires minimum efficiency levels in equipment and quotas on biomass consumption for energy use would force large industrial companies to acknowledge their negative impact on the environment. Creating advisory boards within INFONA to verify compliance with the threat of fines will help keep industry accountable. To this end, the VMME’s efficiency pro-grams for rural cooking stoves should receive full backing from the government and be deployed quickly. Work should be undertaken with ANDE and possibly with the local distribution company in the Central Chaco to assess the cost of electrification of cooking stoves in rural areas. Consump-tion of biomass in cooking stoves in urban areas should be prohibited by the year 2025.
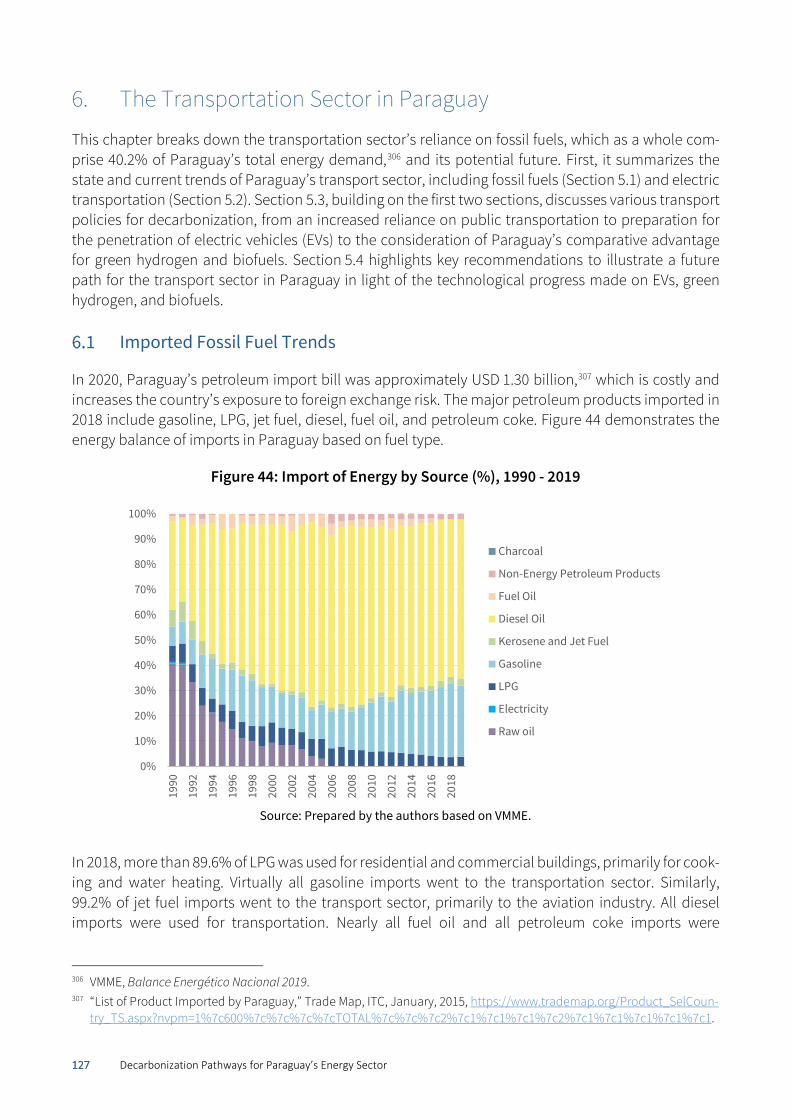
127 Decarbonization Pathways for Paraguay’s Energy Sector
6. The Transportation Sector in Paraguay
This chapter breaks down the transportation sector’s reliance on fossil fuels, which as a whole com-prise 40.2% of Paraguay’s total energy demand,306 and its potential future. First, it summarizes the state and current trends of Paraguay’s transport sector, including fossil fuels (Section 5.1) and electric transportation (Section 5.2). Section 5.3, building on the first two sections, discusses various transport policies for decarbonization, from an increased reliance on public transportation to preparation for the penetration of electric vehicles (EVs) to the consideration of Paraguay’s comparative advantage for green hydrogen and biofuels. Section 5.4 highlights key recommendations to illustrate a future path for the transport sector in Paraguay in light of the technological progress made on EVs, green hydrogen, and biofuels.
Imported Fossil Fuel Trends
In 2020, Paraguay’s petroleum import bill was approximately USD 1.30 billion,307 which is costly and increases the country’s exposure to foreign exchange risk. The major petroleum products imported in 2018 include gasoline, LPG, jet fuel, diesel, fuel oil, and petroleum coke. Figure 44 demonstrates the energy balance of imports in Paraguay based on fuel type.
Figure 44: Import of Energy by Source (%), 1990 - 2019
Source: Prepared by the authors based on VMME.
In 2018, more than 89.6% of LPG was used for residential and commercial buildings, primarily for cook-ing and water heating. Virtually all gasoline imports went to the transportation sector. Similarly, 99.2% of jet fuel imports went to the transport sector, primarily to the aviation industry. All diesel imports were used for transportation. Nearly all fuel oil and all petroleum coke imports were
306 VMME, Balance Energético Nacional 2019. 307 “List of Product Imported by Paraguay,” Trade Map, ITC, January, 2015, https://www.trademap.org/Product_SelCoun-
try_TS.aspx?nvpm=1%7c600%7c%7c%7c%7cTOTAL%7c%7c%7c2%7c1%7c1%7c1%7c2%7c1%7c1%7c1%7c1%7c1.
0%
10%
20%
30%
40%
50%
60%
70%
80%
90%
100%
1990
1992
1994
1996
1998
2000
2002
2004
2006
2008
2010
2012
2014
2016
2018
Charcoal
Non-Energy Petroleum Products
Fuel Oil
Diesel Oil
Kerosene and Jet Fuel
Gasoline
LPG
Electricity
Raw oil
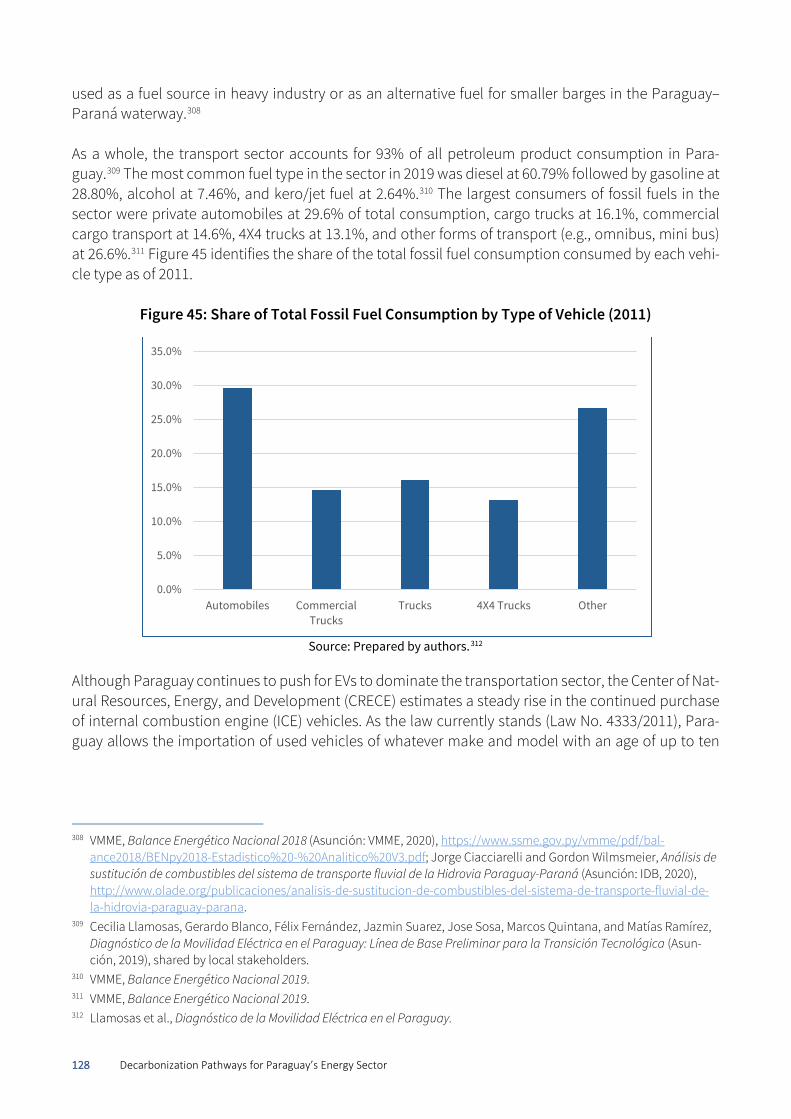
128 Decarbonization Pathways for Paraguay’s Energy Sector
used as a fuel source in heavy industry or as an alternative fuel for smaller barges in the Paraguay–Paraná waterway.308 As a whole, the transport sector accounts for 93% of all petroleum product consumption in Para-guay.309 The most common fuel type in the sector in 2019 was diesel at 60.79% followed by gasoline at 28.80%, alcohol at 7.46%, and kero/jet fuel at 2.64%.310 The largest consumers of fossil fuels in the sector were private automobiles at 29.6% of total consumption, cargo trucks at 16.1%, commercial cargo transport at 14.6%, 4X4 trucks at 13.1%, and other forms of transport (e.g., omnibus, mini bus) at 26.6%.311 Figure 45 identifies the share of the total fossil fuel consumption consumed by each vehi-cle type as of 2011.
Figure 45: Share of Total Fossil Fuel Consumption by Type of Vehicle (2011)
Source: Prepared by authors.312
Although Paraguay continues to push for EVs to dominate the transportation sector, the Center of Nat-ural Resources, Energy, and Development (CRECE) estimates a steady rise in the continued purchase of internal combustion engine (ICE) vehicles. As the law currently stands (Law No. 4333/2011), Para-guay allows the importation of used vehicles of whatever make and model with an age of up to ten
308 VMME, Balance Energético Nacional 2018 (Asunción: VMME, 2020), https://www.ssme.gov.py/vmme/pdf/bal-
ance2018/BENpy2018-Estadistico%20-%20Analitico%20V3.pdf; Jorge Ciacciarelli and Gordon Wilmsmeier, Análisis de sustitución de combustibles del sistema de transporte fluvial de la Hidrovia Paraguay-Paraná (Asunción: IDB, 2020), http://www.olade.org/publicaciones/analisis-de-sustitucion-de-combustibles-del-sistema-de-transporte-fluvial-de-la-hidrovia-paraguay-parana.
309 Cecilia Llamosas, Gerardo Blanco, Félix Fernández, Jazmin Suarez, Jose Sosa, Marcos Quintana, and Matías Ramírez, Diagnóstico de la Movilidad Eléctrica en el Paraguay: Línea de Base Preliminar para la Transición Tecnológica (Asun-ción, 2019), shared by local stakeholders.
310 VMME, Balance Energético Nacional 2019. 311 VMME, Balance Energético Nacional 2019. 312 Llamosas et al., Diagnóstico de la Movilidad Eléctrica en el Paraguay.
0.0%
5.0%
10.0%
15.0%
20.0%
25.0%
30.0%
35.0%
Automobiles CommercialTrucks
Trucks 4X4 Trucks Other
129 Decarbonization Pathways for Paraguay’s Energy Sector
years. Moreover, the Supreme Court has ruled the limit as unconstitutional on several occasions,313 effectively eliminating the age limit for imports. As a result, 17.3% of Paraguay fleet is ‘new,’ meaning less than five years old. The remaining fleet is comprised of used vehicles. 314 In Latin America, Paraguay is the most lenient country with regard to the age of imported used vehicles.315 For instance, Peru has a five-year age limit, whereas used vehicle imports are banned in Argentina, Brazil, Chile, Colombia, Ecuador, Uruguay, and Venezuela.316 In 2020, the total number of vehicles registered in Paraguay was approximately 2,540,294.317 Figure 46 illustrates vehicle ownership by type of vehicle and shows the increased use of personal automotive vehicles in urban areas (such as in the Capital and Central departments) versus rural areas (such as Alto Paraguay and Concepción departments).
313 Corte Suprema de Justicia, Jurisprudencia destacada: Acción de Inconstitucionalidad: Patricia Carolina Rivas Guerin
c/ Artículo No. 1 de la Ley No. 4333/2011, Acuerdo y Sentencia No. 34, February 26, 2013, https://www.pj.gov.py/no-tas/8274-jurisprudencia-destacada.
314 José Sosa, Entregable 1, Línea de base nacional y evaluación de oportunidades, desafíos y necesidades de tecnología de la movilidad eléctrica, parte del proyecto Avanzando con un enfoque regional hacia la movilidad eléctrica en Amé-rica Latina, financiado por el Fondo Verde del Clima (GCF, por sus siglas en inglés) e implementado por el Programa de Medio Ambiente de las Naciones Unidas (PNUMA) (Asunción, 2020).
315 UNDP, Informe Nacional sobre Desarrollo Humano. Paraguay 2020: Energía y Desarrollo Humano. 316 UN Environment and UNECE, “Used Vehicles: A Global Overview” (UNECE, 2017), https://www.unece.org/filead-
min/DAM/trans/doc/2017/itc/UNEP-ITC_Background_Paper-Used_Vehicle_Global_Overview.pdf. 317 Corte Suprema de Justicia, Dirección del Registro de Automotores, and Compromiso con la gente, “Dirrecion
Nacional del registro de Automotores Datos Estadísticos” (Departamento de Informatica, 2020), https://www.pj.gov.py/images/contenido/dnra/grafico_por_tipo_2020.jpg.
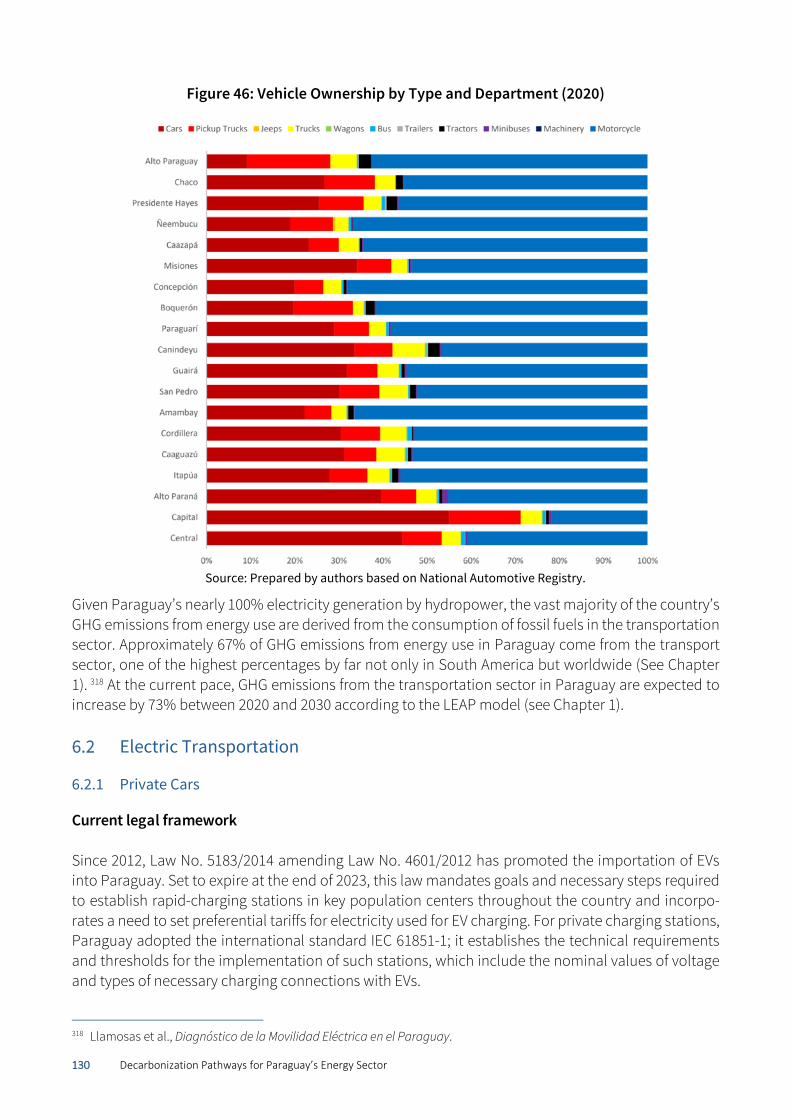
130 Decarbonization Pathways for Paraguay’s Energy Sector
Figure 46: Vehicle Ownership by Type and Department (2020)
Source: Prepared by authors based on National Automotive Registry.
Given Paraguay’s nearly 100% electricity generation by hydropower, the vast majority of the country’s GHG emissions from energy use are derived from the consumption of fossil fuels in the transportation sector. Approximately 67% of GHG emissions from energy use in Paraguay come from the transport sector, one of the highest percentages by far not only in South America but worldwide (See Chapter 1). 318 At the current pace, GHG emissions from the transportation sector in Paraguay are expected to increase by 73% between 2020 and 2030 according to the LEAP model (see Chapter 1).
Electric Transportation
6.2.1 Private Cars
Current legal framework Since 2012, Law No. 5183/2014 amending Law No. 4601/2012 has promoted the importation of EVs into Paraguay. Set to expire at the end of 2023, this law mandates goals and necessary steps required to establish rapid-charging stations in key population centers throughout the country and incorpo-rates a need to set preferential tariffs for electricity used for EV charging. For private charging stations, Paraguay adopted the international standard IEC 61851-1; it establishes the technical requirements and thresholds for the implementation of such stations, which include the nominal values of voltage and types of necessary charging connections with EVs.
318 Llamosas et al., Diagnóstico de la Movilidad Eléctrica en el Paraguay.
131 Decarbonization Pathways for Paraguay’s Energy Sector
Additionally, the Mesa Intersectorial de Movilidad Eléctrica, an entity started under the auspices of the IDB and the International Federation of Automobiles, began its operations in late 2018 and aims to contribute to the participatory construction of a strategic agenda for the sector. The entity is coordi-nated by the Technical Secretary of Planning of Economic and Social Development (STP), the spend-ing entity of the Office of the President, and the Vice Ministry of Transport.319 It comprises representa-tives of the public and private sectors, academia, and other organizations related to the field of electric transport.320 The organization helped push through the first draft of the Electric Mobility Strategy in 2018, which is composed of four main Sections:321 1) Norms, Regulations, and Standards: This section summarizes the need for incentives to promote
the expansion of the EV industry in Paraguay without drawing distinctions between hybrid vehicles and 100% EVs. Additionally, this section highlights the need to expand the definitions and uses of EV charging stations and perform studies on acceptable electric tariffs for EVs in the future.
2) Infrastructure: This section highlights the significance of binational entities to promote the devel-
opment of EV charging infrastructure in Paraguay, but also notes that the largest growth will be in domestic charging stations. It also underscores the lack of data collection on the part of ANDE to understand the required spatial distribution of the charging stations.
3) Demand and Supply: This section points out a lack of existing demand for EVs, promotes the use of subsidies, and suggests the conversion of the government’s fleet to 100% EVs.
4) Information, Financing, and Promotion: The final section highlights the need for electromobility to be implemented through policy in tandem with other mobility and transportation policies so as to promote a commonality of the sector with transportation in general, as discussed in Section 5.3.1 above.
Possibly as a result, in 2019, the government issued a “Program on electro-mobility in the public sec-tor.” In particular, it promotes the adoption of 10% of EVs in the public sector fleet in the short term, 20% in the medium term, and 50% in the long term (with no specific dates). It also suggests goals for ANDE’s fleet: 10% in the short term, 50% in the medium term, and 100% in the long term.322 The Central Bank of Paraguay has committed to replacing over 50% of its fleet with EVs by 2022.323 Decree No. 1269/2019 promotes the monitoring of exhaust levels of air contaminants from motor ve-hicles by municipalities and establishes cross-ministerial coordination around this issue. The decree
319 “Buscan conformar mesa Estratégica sobre Movilidad Eléctrica,” La Secretaría Técnica de Planificación del Desarrollo
Económico y Social (STP), STP, November 4, 2020, https://www.stp.gov.py/v1/buscan-conformar-mesa-estrategica-sobre-movilidad-electrica/.
320 Llamosas et al., Diagnóstico de la Movilidad Eléctrica en el Paraguay. 321 Llamosas et al., Diagnóstico de la Movilidad Eléctrica en el Paraguay. 322 “Paraguay presentó oficialmente programa para electromovilidad en Cumbre Mundial,” La Secretaría Técnica de Pla-
nificación del Desarrollo Económico y Social (STP), STP, December 9, 2019, https://www.stp.gov.py/v1/paraguay-presento-oficialmente-programa-para-electromovilidad-en-cumbre-mundial/.
323 Llamosas et al., Diagnóstico de la Movilidad Eléctrica en el Paraguay.
132 Decarbonization Pathways for Paraguay’s Energy Sector
also foresees that within a year, the customs authorities put in place emission controls at vehicle im-port terminals and order returns to the place of origin for vehicles that do not pass the minimum emis-sion efficiency threshold. Current uptake of EVs According to the latest data compiled by UNEP, 727 EVs had been imported into the country as of 2020, which is much higher than what was anticipated in some studies.324 Of these, 256 are 100% electric and the remainder are hybrid vehicles. Two companies are known to sell 100% EVs in Paraguay. These are Grupo Timbo, which exclusively sells vehicles produced by the Beijing Automotive Industry Corpo-ration, and Grupo Diesa, a holding company with rights to sell BYD vehicles in Paraguay. Grupo Timbo currently offers two different fully electric vehicles, the EX 360 and the EC 200, whereas Grupo Diesa sells four different fully electric models (two SUVs and two minivans).325 Another company, GreenTech, imports used EVs into Paraguayan markets, including models such as the Chevrolet Volt, Nissan Leaf, and Ford Fusion.326 As of late 2020, Paraguay had 19 free-to-use charge points for EVs, six of which are either rapid or ul-trarapid charging stations. 327 Seeing the potential benefit of public charging stations, the Itaipú Tech-nology Park proposed the “Ruta Verde” project, which consisted of installing a series of public charging stations connecting Asunción and Ciudad del Este, a distance of 330 km. With four charging stations sectioned 70 km apart from one another, this project was completed in 2020.328 A similar project was started in November 2018 by EBY (Yacyretá), with the goal of installing 20 charging stations along 370 km of Route 1, extending from Asunción to Encarnación. The initial funding of USD 600,000 was planned to go toward project implementation during the second half of 2019; how-ever, the project has been suspended indefinitely.329
6.2.2 Electric Trains
Paraguay has two large-scale infrastructure projects that have been planned in the past few years. Both projects, known as Bioceánica, are intended to traverse the northern regions of Paraguay and connect the area with regional neighbors for trade and transportation. The first part of this initiative is a 277-km highway between Loma Plata (Boquerón) and Carmel Peralta (Alto Paraguay),330 whereas the second project is the construction of the 533-km Paraguayan branch of the Bioceánica railroad,
324 See for instance: Matias Ramirez and Marco Quintana, Impacto de la Inserción de Vehículos Eléctricos en la Matriz Ener-
gética Nacional – Análisis con base en los Objetivos del Plan Nacional de Desarrollo 2030 (Asunción: La Universidad Nacional de Asunción, 2019), shared by local stakeholders.
325 José Sosa, Entregable 1. 326 Llamosas et al., Diagnóstico de la Movilidad Eléctrica en el Paraguay. 327 José Sosa, Entregable 1. 328 Marcelo Barboza, Enrique Buzarquis, and Juan Domaniczky, Estado del Arte de Cargadores de Vehículos Eléctricos en
la República del Paraguay (CIGRÉ, XIII Seminario del Sector Eléctrico Paraguayo, 2018); local stakeholders, interview by the authors, February 2021.
329 Llamosas et al., Diagnóstico de la Movilidad Eléctrica en el Paraguay. 330 Ministry of Public Works and Communication, “Cooredor Vial Bioceanico” (Government of Paraguay, 2020),
https://www.mopc.gov.py/index.php/corredor-bioceanico.
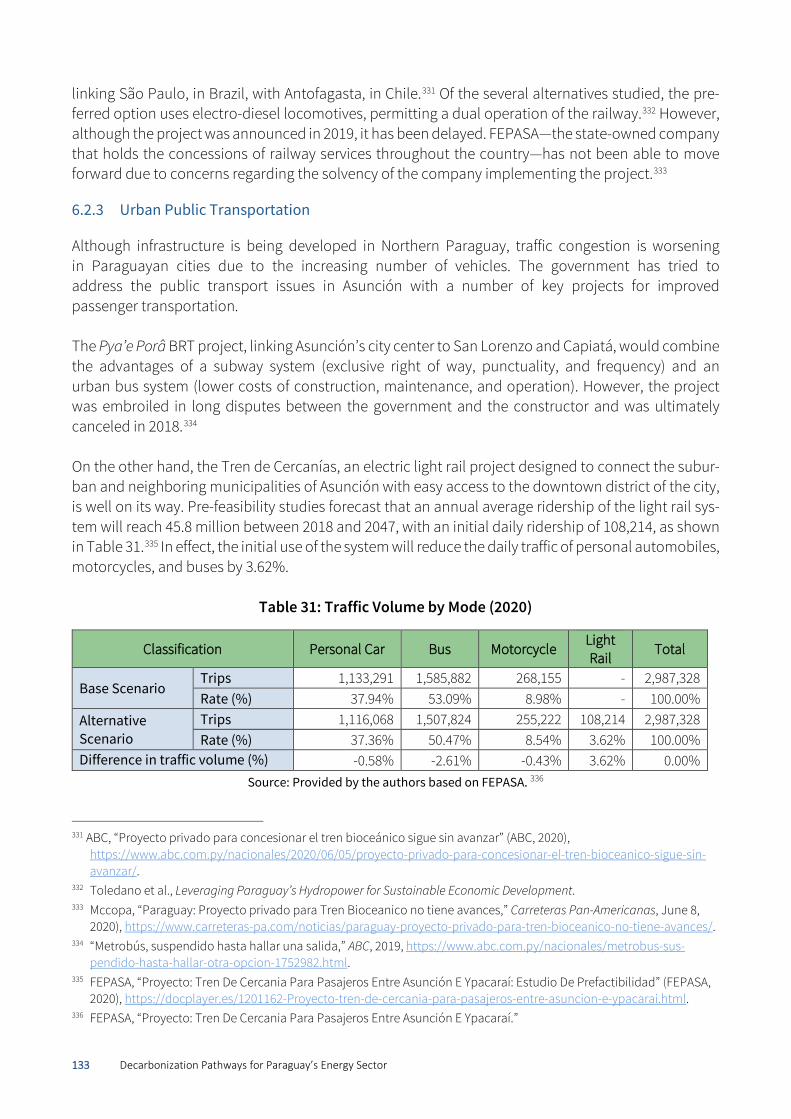
133 Decarbonization Pathways for Paraguay’s Energy Sector
linking São Paulo, in Brazil, with Antofagasta, in Chile.331 Of the several alternatives studied, the pre-ferred option uses electro-diesel locomotives, permitting a dual operation of the railway.332 However, although the project was announced in 2019, it has been delayed. FEPASA—the state-owned company that holds the concessions of railway services throughout the country—has not been able to move forward due to concerns regarding the solvency of the company implementing the project.333
6.2.3 Urban Public Transportation
Although infrastructure is being developed in Northern Paraguay, traffic congestion is worsening in Paraguayan cities due to the increasing number of vehicles. The government has tried to address the public transport issues in Asunción with a number of key projects for improved passenger transportation. The Pya’e Porâ BRT project, linking Asunción’s city center to San Lorenzo and Capiatá, would combine the advantages of a subway system (exclusive right of way, punctuality, and frequency) and an urban bus system (lower costs of construction, maintenance, and operation). However, the project was embroiled in long disputes between the government and the constructor and was ultimately canceled in 2018.334 On the other hand, the Tren de Cercanías, an electric light rail project designed to connect the subur-ban and neighboring municipalities of Asunción with easy access to the downtown district of the city, is well on its way. Pre-feasibility studies forecast that an annual average ridership of the light rail sys-tem will reach 45.8 million between 2018 and 2047, with an initial daily ridership of 108,214, as shown in Table 31.335 In effect, the initial use of the system will reduce the daily traffic of personal automobiles, motorcycles, and buses by 3.62%.
Table 31: Traffic Volume by Mode (2020)
Classification Personal Car Bus Motorcycle Light Rail
Total
Base Scenario Trips 1,133,291 1,585,882 268,155 - 2,987,328 Rate (%) 37.94% 53.09% 8.98% - 100.00%
Alternative Scenario
Trips 1,116,068 1,507,824 255,222 108,214 2,987,328 Rate (%) 37.36% 50.47% 8.54% 3.62% 100.00%
Difference in traffic volume (%) -0.58% -2.61% -0.43% 3.62% 0.00% Source: Provided by the authors based on FEPASA. 336
331 ABC, “Proyecto privado para concesionar el tren bioceánico sigue sin avanzar” (ABC, 2020),
https://www.abc.com.py/nacionales/2020/06/05/proyecto-privado-para-concesionar-el-tren-bioceanico-sigue-sin-avanzar/.
332 Toledano et al., Leveraging Paraguay’s Hydropower for Sustainable Economic Development. 333 Mccopa, “Paraguay: Proyecto privado para Tren Bioceanico no tiene avances,” Carreteras Pan-Americanas, June 8,
2020), https://www.carreteras-pa.com/noticias/paraguay-proyecto-privado-para-tren-bioceanico-no-tiene-avances/. 334 “Metrobús, suspendido hasta hallar una salida,” ABC, 2019, https://www.abc.com.py/nacionales/metrobus-sus-
pendido-hasta-hallar-otra-opcion-1752982.html. 335 FEPASA, “Proyecto: Tren De Cercania Para Pasajeros Entre Asunción E Ypacaraí: Estudio De Prefactibilidad” (FEPASA,
2020), https://docplayer.es/1201162-Proyecto-tren-de-cercania-para-pasajeros-entre-asuncion-e-ypacarai.html. 336 FEPASA, “Proyecto: Tren De Cercania Para Pasajeros Entre Asunción E Ypacaraí.”
134 Decarbonization Pathways for Paraguay’s Energy Sector
As a public–private partnership, the project currently has six interested groups of private companies. The project is anticipated to cost USD 380 million and is being finalized with the help of technical ad-visors and consultants from South Korea.337 In addition, the government has begun updating its aging bus fleet. In 2014, a Presidential Decree re-quired buses older than 20 years to be decommissioned. In turn, the government granted USD 11 mil-lion (USD 30,000 per bus) for bus owners to buy new buses.338 In total approximately 367 buses were bought through this subsidy. Another 2014 decree made it mandatory for all bus owners to renovate 10% of their fleet on an annual basis.339 Currently, the average age of the public bus fleet is 8.1 years, down from an average of 13 years in 2014. Approximately 740 buses have been retired since 2014.340 However, the decree that enacted this one-time investment was not renewed, and no subsidies are currently available for fleet upgrades.341
Pathways for Decarbonized Transportation
After introducing the principle of vehicle miles traveled (VMT),342 this section discusses the various cur-rent and future policies that Paraguay could leverage to embark on achieving fuel type targets through extensive decarbonization of its transportation sector (through electric vehicles (6.3.2), green hydro-gen (6.3.3) and biofuels (6.3.4)). The section also discusses decarbonization with an eye on co-benefits in industrialization.
6.3.1 Reducing Reliance on Private Cars and Augmenting Reliance on Public Transportation
In addition to GHG mitigation strategies for private cars and light vehicles, considering vehicle miles traveled (VMT) can also help achieve decarbonization goals. With the VMT argument, modes of transport such as bicycles, walking, and public transportation are much more widely valued for a higher passenger capacity, a zero-emission trip, or both. For instance, decarbonization experts recom-mend a reduction of VMT of 25% by 2050 in the United States. To achieve this, expansion of rapid bus transit and local rail lines within cities is strongly recommended. For other transportation means, a distance of 400 miles (644 km) is recommended as the threshold; if the trip is less than 400 miles, an electric-powered surface vehicle must be used, whereas trips greater than 400 miles can use a biofuel-
337 “Tren de cercanía sigue siendo un sueño: Estamos más cerca que nunca, promete Fepasa,’” Hoy, November 20, 2020,
https://www.hoy.com.py/nacionales/tren-de-cercania-sigue-siendo-un-sueno-estamos-mas-cerca-que-nunca-promete-fepasa.
338 María Gabriela González, “Transportistas de Asuncion desean subsidios y bonos para renovar flota,” ABC, January 4, 2020, https://www.abc.com.py/edicion-impresa/economia/2020/01/04/transportistas-de-asuncion-desean-subsid-ios-y-bonos-para-renovar-flota.
339 UNEP, “Air Qualitiy Policies” (UNEP, 2015), https://wedocs.unep.org/bitstream/handle/20.500.11822/17081/1/Para-guay.pdf.
340 “Reducen a ocho años el promedio de edad de buses,” ADN Paraguayo, June 1, 2018, https://www.adndig-ital.com.py/reducen-ocho-anos-promedio-edad-buses.
341 ADN Paraguayo, “Reducen a ocho años el promedio de edad de buses.” 342 Vehicle Miles Traveled (VMT) is a quantity that measures the distance covered by a form of transport, incentivizing a
reliance on more fuel-efficient modes of transport.
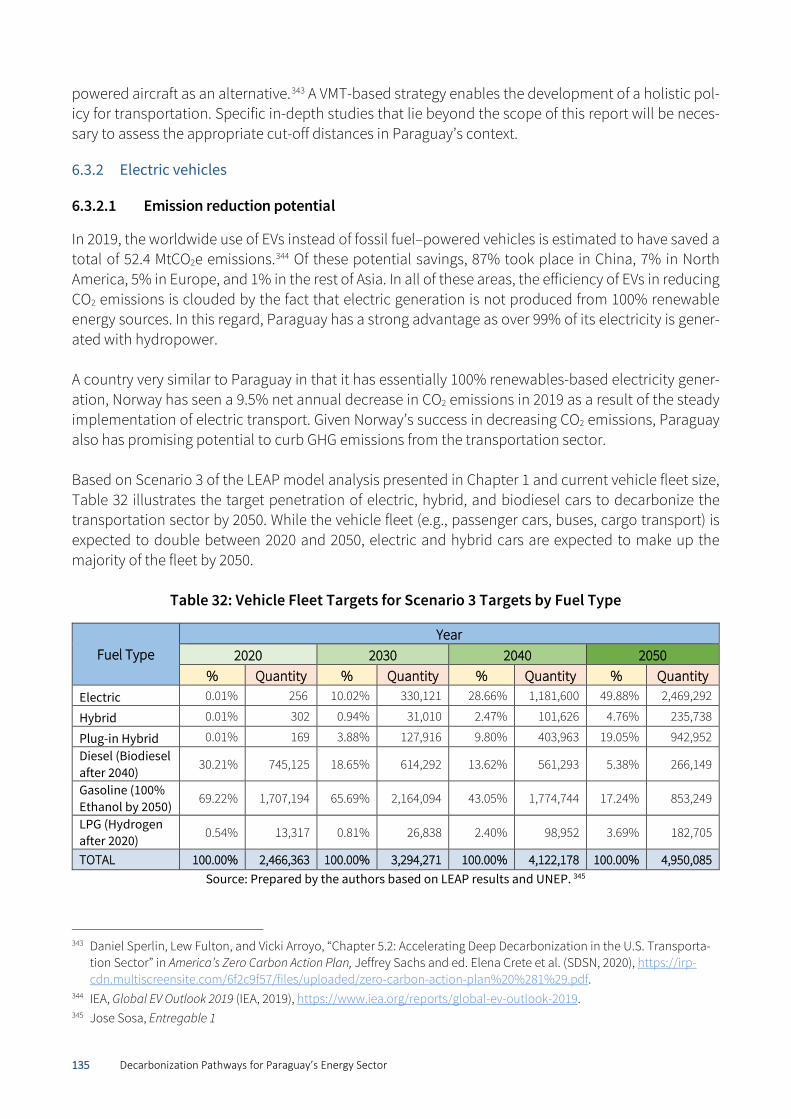
135 Decarbonization Pathways for Paraguay’s Energy Sector
powered aircraft as an alternative.343 A VMT-based strategy enables the development of a holistic pol-icy for transportation. Specific in-depth studies that lie beyond the scope of this report will be neces-sary to assess the appropriate cut-off distances in Paraguay’s context.
6.3.2 Electric vehicles
6.3.2.1 Emission reduction potential
In 2019, the worldwide use of EVs instead of fossil fuel–powered vehicles is estimated to have saved a total of 52.4 MtCO2e emissions.344 Of these potential savings, 87% took place in China, 7% in North America, 5% in Europe, and 1% in the rest of Asia. In all of these areas, the efficiency of EVs in reducing CO2 emissions is clouded by the fact that electric generation is not produced from 100% renewable energy sources. In this regard, Paraguay has a strong advantage as over 99% of its electricity is gener-ated with hydropower. A country very similar to Paraguay in that it has essentially 100% renewables-based electricity gener-ation, Norway has seen a 9.5% net annual decrease in CO2 emissions in 2019 as a result of the steady implementation of electric transport. Given Norway’s success in decreasing CO2 emissions, Paraguay also has promising potential to curb GHG emissions from the transportation sector. Based on Scenario 3 of the LEAP model analysis presented in Chapter 1 and current vehicle fleet size, Table 32 illustrates the target penetration of electric, hybrid, and biodiesel cars to decarbonize the transportation sector by 2050. While the vehicle fleet (e.g., passenger cars, buses, cargo transport) is expected to double between 2020 and 2050, electric and hybrid cars are expected to make up the majority of the fleet by 2050.
Table 32: Vehicle Fleet Targets for Scenario 3 Targets by Fuel Type
Fuel Type Year
2020 2030 2040 2050 % Quantity % Quantity % Quantity % Quantity
Electric 0.01% 256 10.02% 330,121 28.66% 1,181,600 49.88% 2,469,292
Hybrid 0.01% 302 0.94% 31,010 2.47% 101,626 4.76% 235,738
Plug-in Hybrid 0.01% 169 3.88% 127,916 9.80% 403,963 19.05% 942,952 Diesel (Biodiesel after 2040) 30.21% 745,125 18.65% 614,292 13.62% 561,293 5.38% 266,149
Gasoline (100% Ethanol by 2050)
69.22% 1,707,194 65.69% 2,164,094 43.05% 1,774,744 17.24% 853,249
LPG (Hydrogen after 2020) 0.54% 13,317 0.81% 26,838 2.40% 98,952 3.69% 182,705
TOTAL 100.00% 2,466,363 100.00% 3,294,271 100.00% 4,122,178 100.00% 4,950,085 Source: Prepared by the authors based on LEAP results and UNEP. 345
343 Daniel Sperlin, Lew Fulton, and Vicki Arroyo, “Chapter 5.2: Accelerating Deep Decarbonization in the U.S. Transporta-
tion Sector” in America’s Zero Carbon Action Plan, Jeffrey Sachs and ed. Elena Crete et al. (SDSN, 2020), https://irp-cdn.multiscreensite.com/6f2c9f57/files/uploaded/zero-carbon-action-plan%20%281%29.pdf.
344 IEA, Global EV Outlook 2019 (IEA, 2019), https://www.iea.org/reports/global-ev-outlook-2019. 345 Jose Sosa, Entregable 1
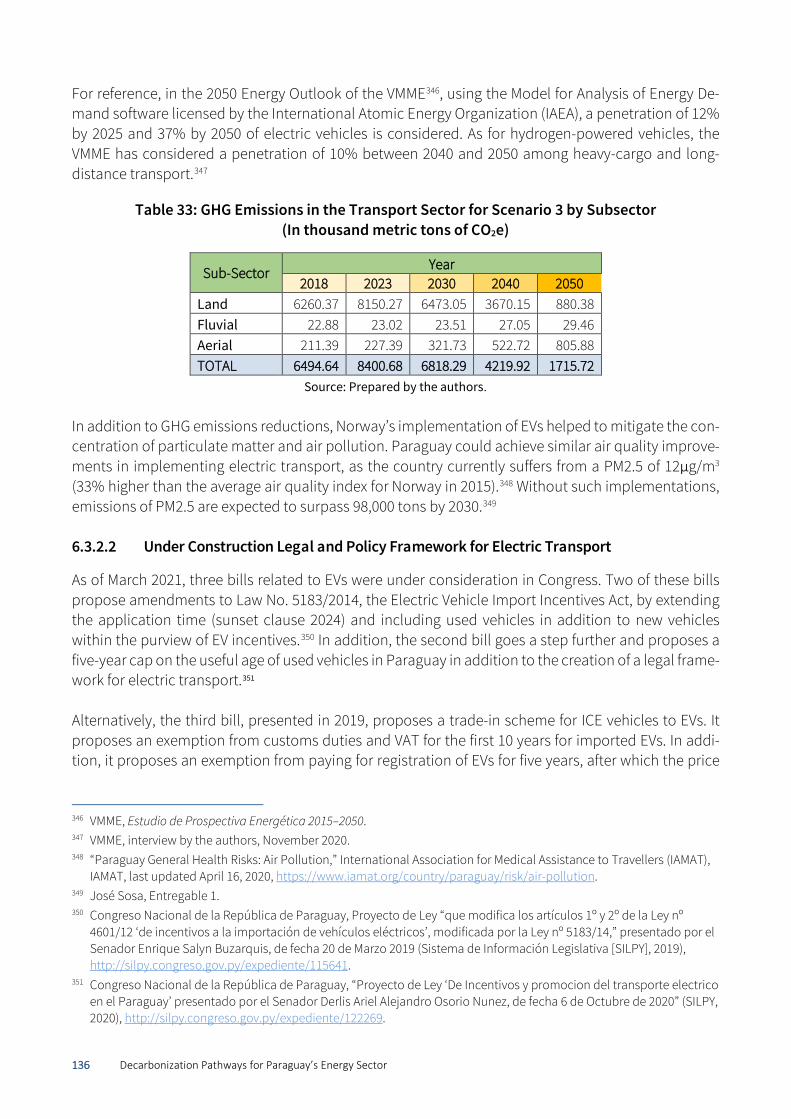
136 Decarbonization Pathways for Paraguay’s Energy Sector
For reference, in the 2050 Energy Outlook of the VMME346, using the Model for Analysis of Energy De-mand software licensed by the International Atomic Energy Organization (IAEA), a penetration of 12% by 2025 and 37% by 2050 of electric vehicles is considered. As for hydrogen-powered vehicles, the VMME has considered a penetration of 10% between 2040 and 2050 among heavy-cargo and long-distance transport.347
Table 33: GHG Emissions in the Transport Sector for Scenario 3 by Subsector (In thousand metric tons of CO2e)
Sub-Sector Year 2018 2023 2030 2040 2050
Land 6260.37 8150.27 6473.05 3670.15 880.38 Fluvial 22.88 23.02 23.51 27.05 29.46 Aerial 211.39 227.39 321.73 522.72 805.88 TOTAL 6494.64 8400.68 6818.29 4219.92 1715.72
Source: Prepared by the authors.
In addition to GHG emissions reductions, Norway’s implementation of EVs helped to mitigate the con-centration of particulate matter and air pollution. Paraguay could achieve similar air quality improve-ments in implementing electric transport, as the country currently suffers from a PM2.5 of 12μg/m3 (33% higher than the average air quality index for Norway in 2015).348 Without such implementations, emissions of PM2.5 are expected to surpass 98,000 tons by 2030.349 6.3.2.2 Under Construction Legal and Policy Framework for Electric Transport
As of March 2021, three bills related to EVs were under consideration in Congress. Two of these bills propose amendments to Law No. 5183/2014, the Electric Vehicle Import Incentives Act, by extending the application time (sunset clause 2024) and including used vehicles in addition to new vehicles within the purview of EV incentives.350 In addition, the second bill goes a step further and proposes a five-year cap on the useful age of used vehicles in Paraguay in addition to the creation of a legal frame-work for electric transport.351 Alternatively, the third bill, presented in 2019, proposes a trade-in scheme for ICE vehicles to EVs. It proposes an exemption from customs duties and VAT for the first 10 years for imported EVs. In addi-tion, it proposes an exemption from paying for registration of EVs for five years, after which the price
346 VMME, Estudio de Prospectiva Energética 2015–2050. 347 VMME, interview by the authors, November 2020. 348 “Paraguay General Health Risks: Air Pollution,” International Association for Medical Assistance to Travellers (IAMAT),
IAMAT, last updated April 16, 2020, https://www.iamat.org/country/paraguay/risk/air-pollution. 349 José Sosa, Entregable 1. 350 Congreso Nacional de la República de Paraguay, Proyecto de Ley “que modifica los artículos 1º y 2º de la Ley nº
4601/12 ‘de incentivos a la importación de vehículos eléctricos’, modificada por la Ley nº 5183/14,” presentado por el Senador Enrique Salyn Buzarquis, de fecha 20 de Marzo 2019 (Sistema de Información Legislativa [SILPY], 2019), http://silpy.congreso.gov.py/expediente/115641.
351 Congreso Nacional de la República de Paraguay, “Proyecto de Ley ‘De Incentivos y promocion del transporte electrico en el Paraguay’ presentado por el Senador Derlis Ariel Alejandro Osorio Nunez, de fecha 6 de Octubre de 2020” (SILPY, 2020), http://silpy.congreso.gov.py/expediente/122269.
137 Decarbonization Pathways for Paraguay’s Energy Sector
would progressively increase. Users of these EVs would not have to pay for parking in the municipali-ties in which they are registered. By 2030, the bill plans to have all ICE vehicles of consumers that par-ticipate in the program traded in and exchanged for EVs. By 2040, ICE vehicle circulation would cease in Paraguay.352 The bill proposes a requirement of at least two charging stations in each city with a minimum of 60,000 inhabitants, with at least 20 stations in Asunción.353 6.3.2.3 The Economic Case
Electric car analysis A 2018 study354 states that the current cost of EVs is too high to warrant wide acceptance and adoption into the Paraguayan economy. The study found that the price ceiling of an EV on the international market would have to drop to USD 4,000 above the cost of comparable ICE vehicles to be considered economically viable. However, this price difference depends on the distance driven each year. For ex-ample, the study found that when driving the ICE version of the Kia Soul an average of 10,000 km per year, the EV version of the Kia Soul becomes cost equivalent after 16.9 years of driving. Driving the same vehicle 60,000 km per year provides cost equivalency after just one year, which means that for intensive driving such as that of taxis, it is already economical to use EVs.355 At the same time, another study356 assessed that by 2030 the purchase of a fully electric government automotive fleet would pro-vide a recuperation of the initial cost of the fleet in as little as 2.4 years. Using the Total Cost of Ownership tool, CRECE compared the real price of an ICE and an EV in the Paraguayan market. Using a BAIC EC200 (BAIC is an official brand used for commercialized vehicles in Paraguay) EV and an ICE car, both of which are 2019 hatchback vehicles, CRECE estimated a rate of depreciation of 9%, a useful life of 10 years, and an average of 15,400 km distance traveled annually. For the fuel estimations, CRECE used PETROPAR data for fossil fuel pricing and constant electric prices based on the greater than 1,000 kWh consumption category as per Pliego Tarifas No. 21 from March 2017.357 One caveat of this study is that salvage values for both ICE and EV vehicles were not consid-ered.358
352 Congreso Nacional de la República de Paraguay, “Proyecto de Ley ‘De Sustitucion de los automóviles movidos a com-
bustibles fosiles por automóviles eléctricos’ presentado por el Senador Martin Arevalo” (SILPY, 2019), http://silpy.con-greso.gov.py/expediente/115558.
353 ABC Color, “Buscan incentivar por ley uso de transporte eléctrico,” ABC, November 30, 2020, https://www.abc.com.py/nacionales/2020/11/30/buscan-incentivar-por-ley-uso-de-transporte-electrico.
354 Romina Bertoni and Carlos Ayala, “Análisis Financiero Comparativo entre Adquirir un Vehículo Eléctrico y uno de Combustión para el Usuario en Paraguay” (San Pablo: ANDE and Unversidad Paraguayo Alemana, 2019), https://www.scribd.com/document/474893444/ANALISIS-FINANCIERO-COMPARATIVO-ENTRE-ADQUIRIR-UN-VEHIC-ULO-ELECTRICO-Y-UNO-DE-COMBUSTION-PARA-EL-USUARIO-EN-PARAGUAY.
355 Bertoni and Ayala, “Análisis Financiero Comparativo entre Adquirir un Vehículo Eléctrico y uno de Combustión para el Usuario en Paraguay.”
356 Matias Ramirez and Marco Quintana, Impacto de la Inserción de Vehículos Eléctricos en la Matriz Energética Nacional – Análisis con base en los Objetivos del Plan Nacional de Desarrollo 2030 (Asunción: La Universidad Nacional de Asun-ción, 2019), shared by local stakeholders.
357 UNDP, Informe Nacional sobre Desarrollo Humano. Paraguay 2020. 358 In fact, electric vehicles do have a salvage value, albeit less than the average ICE vehicle salvage value. For example,
after 5 years of ownership, the average ICE vehicle resells for 37.1% of its original manufacturer suggested retail price (MSRP) while a battery EV on average resells for 30.5% of MSRP. Brandon Schoettle and Michael Sivak, “Resale Values
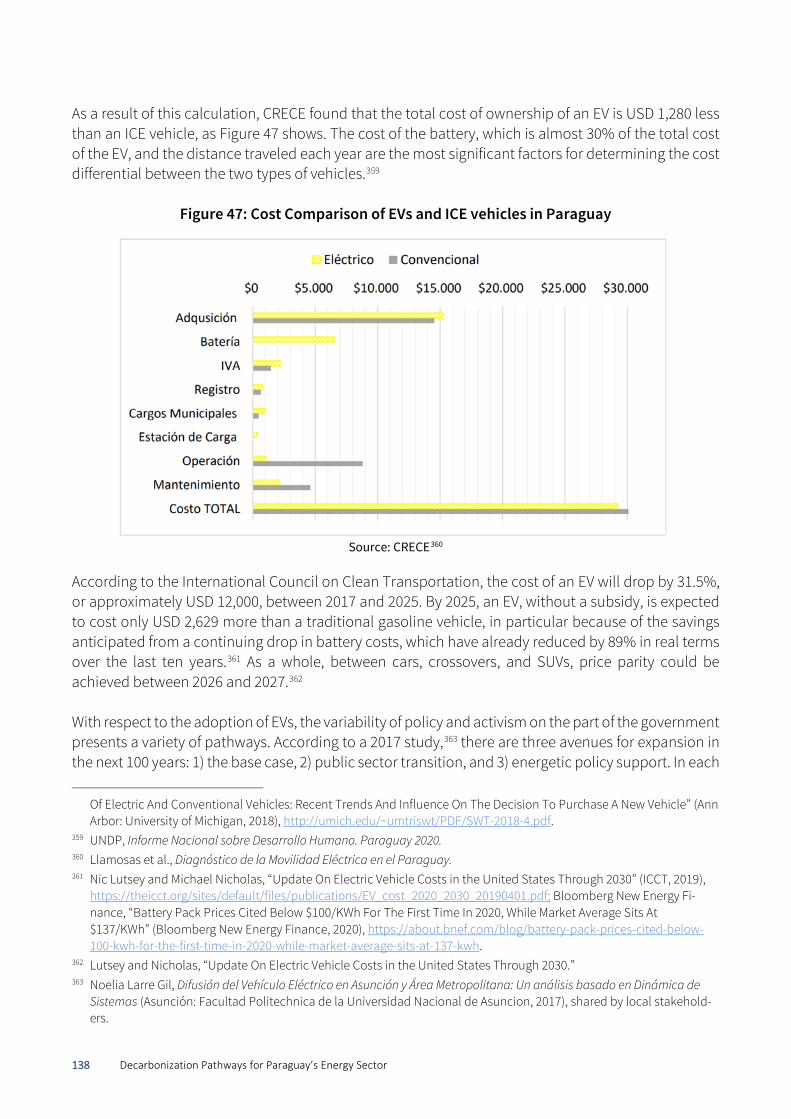
138 Decarbonization Pathways for Paraguay’s Energy Sector
As a result of this calculation, CRECE found that the total cost of ownership of an EV is USD 1,280 less than an ICE vehicle, as Figure 47 shows. The cost of the battery, which is almost 30% of the total cost of the EV, and the distance traveled each year are the most significant factors for determining the cost differential between the two types of vehicles.359
Figure 47: Cost Comparison of EVs and ICE vehicles in Paraguay
Source: CRECE360
According to the International Council on Clean Transportation, the cost of an EV will drop by 31.5%, or approximately USD 12,000, between 2017 and 2025. By 2025, an EV, without a subsidy, is expected to cost only USD 2,629 more than a traditional gasoline vehicle, in particular because of the savings anticipated from a continuing drop in battery costs, which have already reduced by 89% in real terms over the last ten years.361 As a whole, between cars, crossovers, and SUVs, price parity could be achieved between 2026 and 2027.362 With respect to the adoption of EVs, the variability of policy and activism on the part of the government presents a variety of pathways. According to a 2017 study,363 there are three avenues for expansion in the next 100 years: 1) the base case, 2) public sector transition, and 3) energetic policy support. In each
Of Electric And Conventional Vehicles: Recent Trends And Influence On The Decision To Purchase A New Vehicle” (Ann Arbor: University of Michigan, 2018), http://umich.edu/~umtriswt/PDF/SWT-2018-4.pdf.
359 UNDP, Informe Nacional sobre Desarrollo Humano. Paraguay 2020. 360 Llamosas et al., Diagnóstico de la Movilidad Eléctrica en el Paraguay. 361 Nic Lutsey and Michael Nicholas, “Update On Electric Vehicle Costs in the United States Through 2030” (ICCT, 2019),
https://theicct.org/sites/default/files/publications/EV_cost_2020_2030_20190401.pdf; Bloomberg New Energy Fi-nance, “Battery Pack Prices Cited Below $100/KWh For The First Time In 2020, While Market Average Sits At $137/KWh” (Bloomberg New Energy Finance, 2020), https://about.bnef.com/blog/battery-pack-prices-cited-below-100-kwh-for-the-first-time-in-2020-while-market-average-sits-at-137-kwh.
362 Lutsey and Nicholas, “Update On Electric Vehicle Costs in the United States Through 2030.” 363 Noelia Larre Gil, Difusión del Vehículo Eléctrico en Asunción y Área Metropolitana: Un análisis basado en Dinámica de
Sistemas (Asunción: Facultad Politechnica de la Universidad Nacional de Asuncion, 2017), shared by local stakehold-ers.
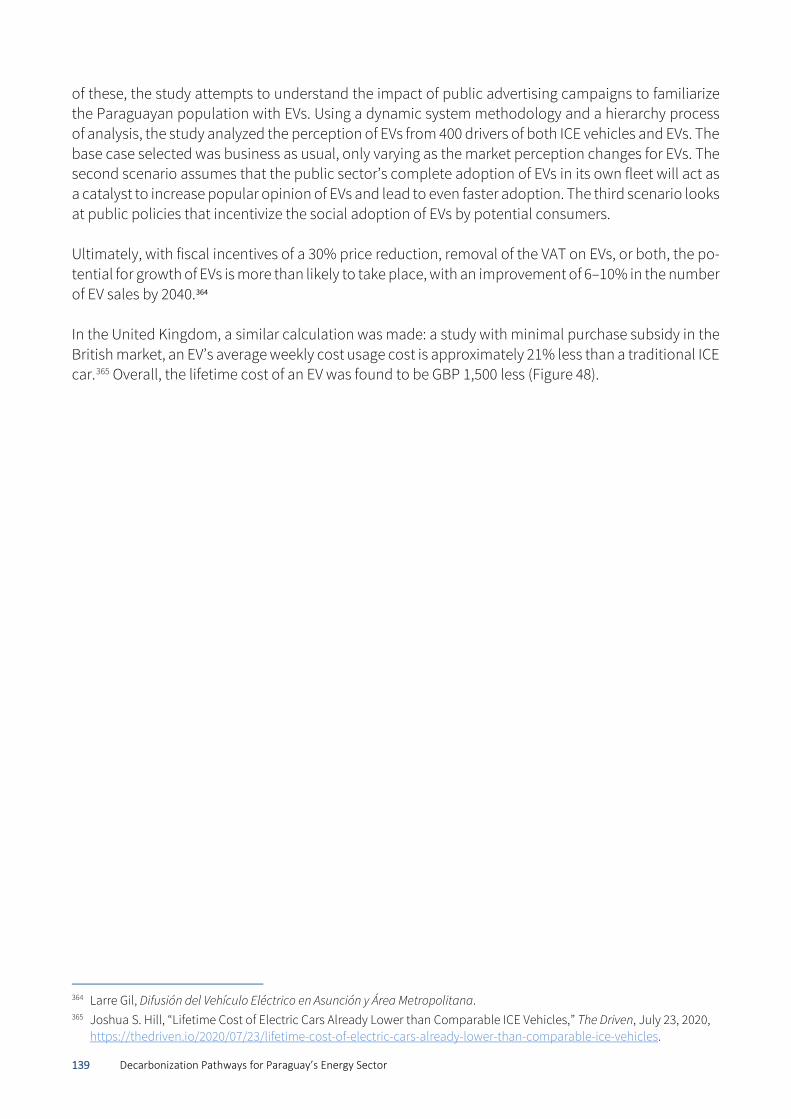
139 Decarbonization Pathways for Paraguay’s Energy Sector
of these, the study attempts to understand the impact of public advertising campaigns to familiarize the Paraguayan population with EVs. Using a dynamic system methodology and a hierarchy process of analysis, the study analyzed the perception of EVs from 400 drivers of both ICE vehicles and EVs. The base case selected was business as usual, only varying as the market perception changes for EVs. The second scenario assumes that the public sector’s complete adoption of EVs in its own fleet will act as a catalyst to increase popular opinion of EVs and lead to even faster adoption. The third scenario looks at public policies that incentivize the social adoption of EVs by potential consumers. Ultimately, with fiscal incentives of a 30% price reduction, removal of the VAT on EVs, or both, the po-tential for growth of EVs is more than likely to take place, with an improvement of 6–10% in the number of EV sales by 2040.364 In the United Kingdom, a similar calculation was made: a study with minimal purchase subsidy in the British market, an EV’s average weekly cost usage cost is approximately 21% less than a traditional ICE car.365 Overall, the lifetime cost of an EV was found to be GBP 1,500 less (Figure 48).
364 Larre Gil, Difusión del Vehículo Eléctrico en Asunción y Área Metropolitana. 365 Joshua S. Hill, “Lifetime Cost of Electric Cars Already Lower than Comparable ICE Vehicles,” The Driven, July 23, 2020,
https://thedriven.io/2020/07/23/lifetime-cost-of-electric-cars-already-lower-than-comparable-ice-vehicles.
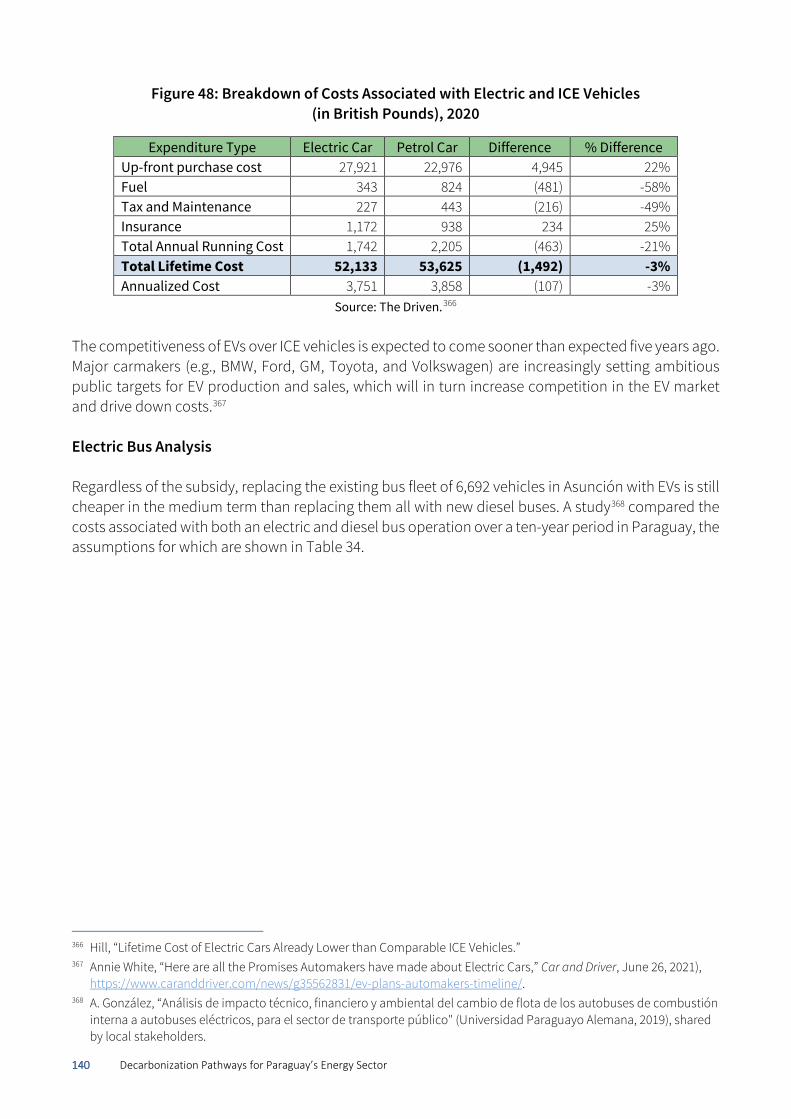
140 Decarbonization Pathways for Paraguay’s Energy Sector
Figure 48: Breakdown of Costs Associated with Electric and ICE Vehicles (in British Pounds), 2020
Expenditure Type Electric Car Petrol Car Difference % Difference Up-front purchase cost 27,921 22,976 4,945 22% Fuel 343 824 (481) -58% Tax and Maintenance 227 443 (216) -49% Insurance 1,172 938 234 25% Total Annual Running Cost 1,742 2,205 (463) -21% Total Lifetime Cost 52,133 53,625 (1,492) -3% Annualized Cost 3,751 3,858 (107) -3%
Source: The Driven.366 The competitiveness of EVs over ICE vehicles is expected to come sooner than expected five years ago. Major carmakers (e.g., BMW, Ford, GM, Toyota, and Volkswagen) are increasingly setting ambitious public targets for EV production and sales, which will in turn increase competition in the EV market and drive down costs.367 Electric Bus Analysis Regardless of the subsidy, replacing the existing bus fleet of 6,692 vehicles in Asunción with EVs is still cheaper in the medium term than replacing them all with new diesel buses. A study368 compared the costs associated with both an electric and diesel bus operation over a ten-year period in Paraguay, the assumptions for which are shown in Table 34.
366 Hill, “Lifetime Cost of Electric Cars Already Lower than Comparable ICE Vehicles.” 367 Annie White, “Here are all the Promises Automakers have made about Electric Cars,” Car and Driver, June 26, 2021),
https://www.caranddriver.com/news/g35562831/ev-plans-automakers-timeline/. 368 A. González, “Análisis de impacto técnico, financiero y ambiental del cambio de flota de los autobuses de combustión
interna a autobuses eléctricos, para el sector de transporte público" (Universidad Paraguayo Alemana, 2019), shared by local stakeholders.
141 Decarbonization Pathways for Paraguay’s Energy Sector
Table 34: Original ICE vs. EV Bus Analysis Assumptions
Item Paraguay EV Unit ICE Unit
Bus Cost 325000 USD 110000 Efficiency 1.74 kWh/mile 5.22 Battery Life 5 years New Battery 77378 USD Annual Battery Cost % 5% Bater Salvage Value 19500 USD Maintenance Costs 0.048 USD/mile 0.216 USD/mile Diesel Fuel Cost 2.80 USD/mile Electricity Cost 0.021 USD/kWh Charging Station USD USD Bus Yard Improvement USD USD Cost of Guaranteed Power USD USD Registration 5099 USD 1895 USD Insurance and City Taxes 8273 USD/year 3890 USD/year Useful Life 10
Source: TCO Analysis of Buses in the Metropolitan Area.369 The initial results of this research suggest that EV buses are more expensive than diesel buses (when looking at the net present value). After a 10-year period, the study showed that a typical EV electric bus would have a net present value of USD 494,191 compared with a typical ICE bus with a net present value of USD 437,791. However, a number of specific changes in the assumptions of the study (adjustments to battery life, registration, and insurance and city taxes) are sufficient to make EV buses cheaper than ICE buses over a 10-year period in Asunción. Reanalysis of the data after accounting for these changes indicated that an EV bus becomes more economically viable than an ICE bus after ten years. As it stands, registration costs and insurance and city taxes for vehicles in Paraguay are determined as a percentage of the ini-tial value of the vehicle itself, which makes them more expensive for EVs. The revised analysis adjusts these to flat rates comparable to the fees of an ICE bus. The other major adjustment was prolonging the life of electric batteries in the study. The original lifetime of a battery for an EV bus was assumed to be five years, but this was a very conservative short life because the bus manufacturer used for cost comparison, Zhong Tong, provides an eight-year warranty on its batteries.370 Therefore, battery life was adjusted to eight years. The resulting annual cost comparison is shown in Figure 49.
369 González, “Análisis de impacto técnico, financiero y ambiental del cambio de flota de los autobuses de combustión
interna a autobuses eléctricos, para el sector de transporte público.” 370 Zebra, “Medellin – Business Roundtable – Summary” (Medellin: Zebra, 2019), https://theicct.org/sites/de-
fault/files/publications/ZEBRA%20Medellin%20Workshop%20Report.pdf.
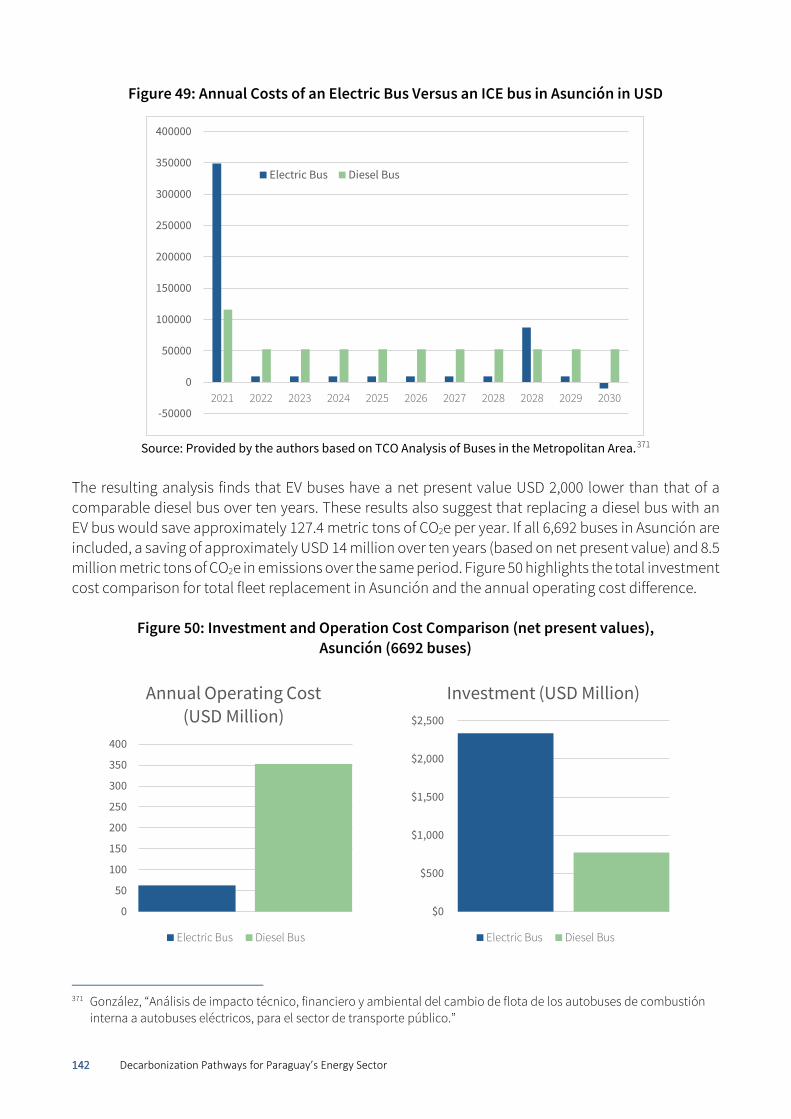
142 Decarbonization Pathways for Paraguay’s Energy Sector
Figure 49: Annual Costs of an Electric Bus Versus an ICE bus in Asunción in USD
Source: Provided by the authors based on TCO Analysis of Buses in the Metropolitan Area.371
The resulting analysis finds that EV buses have a net present value USD 2,000 lower than that of a comparable diesel bus over ten years. These results also suggest that replacing a diesel bus with an EV bus would save approximately 127.4 metric tons of CO2e per year. If all 6,692 buses in Asunción are included, a saving of approximately USD 14 million over ten years (based on net present value) and 8.5 million metric tons of CO2e in emissions over the same period. Figure 50 highlights the total investment cost comparison for total fleet replacement in Asunción and the annual operating cost difference.
Figure 50: Investment and Operation Cost Comparison (net present values), Asunción (6692 buses)
371 González, “Análisis de impacto técnico, financiero y ambiental del cambio de flota de los autobuses de combustión
interna a autobuses eléctricos, para el sector de transporte público.”
-50000
0
50000
100000
150000
200000
250000
300000
350000
400000
2021 2022 2023 2024 2025 2026 2027 2028 2028 2029 2030
Electric Bus Diesel Bus
0
50
100
150
200
250
300
350
400
Annual Operating Cost (USD Million)
Electric Bus Diesel Bus
$0
$500
$1,000
$1,500
$2,000
$2,500
Investment (USD Million)
Electric Bus Diesel Bus
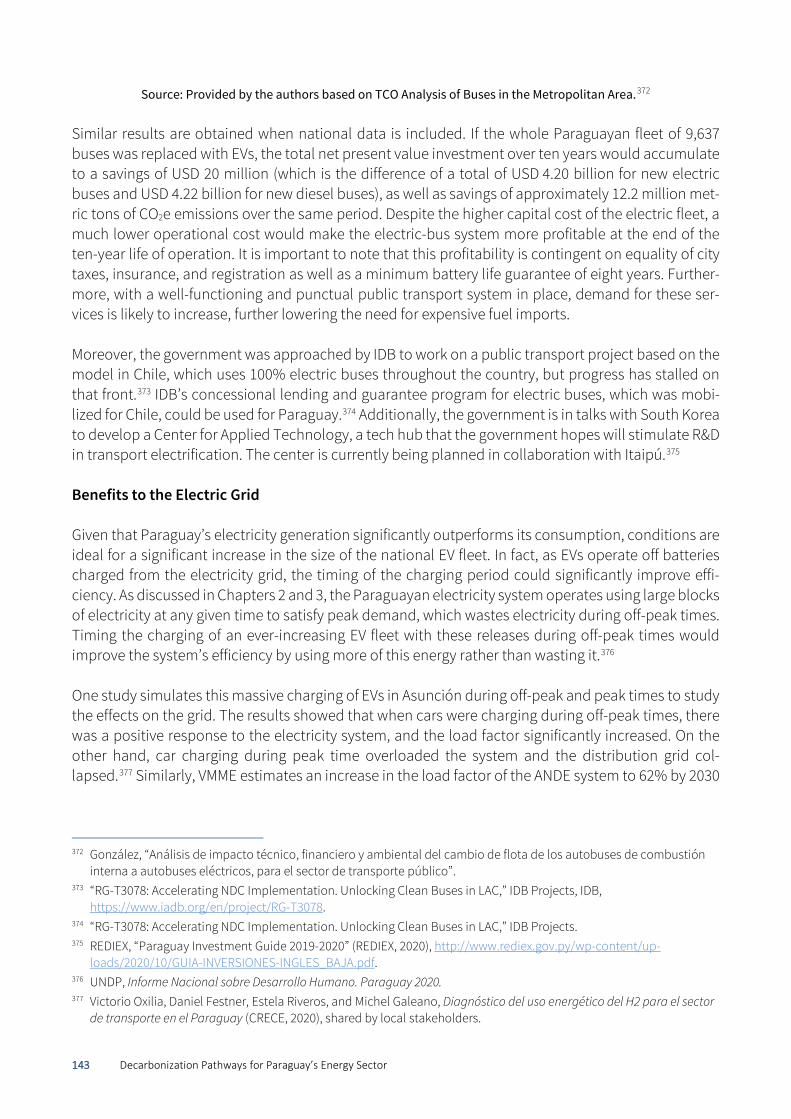
143 Decarbonization Pathways for Paraguay’s Energy Sector
Source: Provided by the authors based on TCO Analysis of Buses in the Metropolitan Area.372 Similar results are obtained when national data is included. If the whole Paraguayan fleet of 9,637 buses was replaced with EVs, the total net present value investment over ten years would accumulate to a savings of USD 20 million (which is the difference of a total of USD 4.20 billion for new electric buses and USD 4.22 billion for new diesel buses), as well as savings of approximately 12.2 million met-ric tons of CO2e emissions over the same period. Despite the higher capital cost of the electric fleet, a much lower operational cost would make the electric-bus system more profitable at the end of the ten-year life of operation. It is important to note that this profitability is contingent on equality of city taxes, insurance, and registration as well as a minimum battery life guarantee of eight years. Further-more, with a well-functioning and punctual public transport system in place, demand for these ser-vices is likely to increase, further lowering the need for expensive fuel imports. Moreover, the government was approached by IDB to work on a public transport project based on the model in Chile, which uses 100% electric buses throughout the country, but progress has stalled on that front.373 IDB’s concessional lending and guarantee program for electric buses, which was mobi-lized for Chile, could be used for Paraguay.374 Additionally, the government is in talks with South Korea to develop a Center for Applied Technology, a tech hub that the government hopes will stimulate R&D in transport electrification. The center is currently being planned in collaboration with Itaipú.375 Benefits to the Electric Grid Given that Paraguay’s electricity generation significantly outperforms its consumption, conditions are ideal for a significant increase in the size of the national EV fleet. In fact, as EVs operate off batteries charged from the electricity grid, the timing of the charging period could significantly improve effi-ciency. As discussed in Chapters 2 and 3, the Paraguayan electricity system operates using large blocks of electricity at any given time to satisfy peak demand, which wastes electricity during off-peak times. Timing the charging of an ever-increasing EV fleet with these releases during off-peak times would improve the system’s efficiency by using more of this energy rather than wasting it.376 One study simulates this massive charging of EVs in Asunción during off-peak and peak times to study the effects on the grid. The results showed that when cars were charging during off-peak times, there was a positive response to the electricity system, and the load factor significantly increased. On the other hand, car charging during peak time overloaded the system and the distribution grid col-lapsed.377 Similarly, VMME estimates an increase in the load factor of the ANDE system to 62% by 2030
372 González, “Análisis de impacto técnico, financiero y ambiental del cambio de flota de los autobuses de combustión
interna a autobuses eléctricos, para el sector de transporte público”. 373 “RG-T3078: Accelerating NDC Implementation. Unlocking Clean Buses in LAC,” IDB Projects, IDB,
https://www.iadb.org/en/project/RG-T3078. 374 “RG-T3078: Accelerating NDC Implementation. Unlocking Clean Buses in LAC,” IDB Projects. 375 REDIEX, “Paraguay Investment Guide 2019-2020” (REDIEX, 2020), http://www.rediex.gov.py/wp-content/up-
loads/2020/10/GUIA-INVERSIONES-INGLES_BAJA.pdf. 376 UNDP, Informe Nacional sobre Desarrollo Humano. Paraguay 2020. 377 Victorio Oxilia, Daniel Festner, Estela Riveros, and Michel Galeano, Diagnóstico del uso energético del H2 para el sector
de transporte en el Paraguay (CRECE, 2020), shared by local stakeholders.
144 Decarbonization Pathways for Paraguay’s Energy Sector
from 56% today as a result of the growth in EV charging. 378 To avoid this, ANDE should consider sched-uling for EV charging periods throughout the day to optimize the electricity grid.379 This thinking should also lead ANDE to envision Vehicle-to-Grid (V2G) systems that would enable EV batteries to “play a major role in balancing energy demand and supply and leads to a two-way power flow between an EV and the electricity grid.”380,381 6.3.2.4 Industrialization around Electric Transportation
Law No. 5882/2017 provides a framework for the disposal and reuse of domestically used batteries, containing restrictions and obligations for battery producers in industry and the commercial sector, restrictions on battery removal and waste for consumers, and policy enforcement of safe battery col-lection and use for municipalities. This law could be enlarged to include EV batteries, which could enable Paraguay to be at the forefront of the circular economy of EV batteries. A growing argument is being made to leverage Paraguay’s vast and inexpensive clean energy to de-velop a battery-making industry. According to Sauer et al., Bolivia and Paraguay are the perfect cata-lyzing economies for the development of the electric transport sector due to Bolivia’s large reserves of lithium, an element critical to the modern lithium-ion battery technology, and Paraguay’s vast quan-tities of relatively inexpensive hydropower. Given the availability of such resources in each country, Sauer et al. propose creating a domestic lithium-ion battery industry in Bolivia to capitalize on the natural resources. In turn, the development of a domestic automotive EV industry within Paraguay would capitalize on the excess electricity from the grid. From this study, it was estimated that 40,000 EVs could eventually be manufactured annually. Over a ten-year period, the production of 400,000 EVs would offset 250,000 diesel vehicles and 150,000 gasoline vehicles. The direct benefit of this transition is a savings of USD 995.7 million from the importation of fossil fuels for Paraguay and USD 1.37 billion for Bolivia (measured in net present value over ten years).382 Another report on the potential for lithium-ion battery production proposes that Paraguay integrate the natural resources of lithium, graphite, and aluminum into batteries. In this scenario, Paraguay’s inexpensive electricity pricing would drive electric battery production cost to USD 150/kWh, a level competitive with ICEs. The supply proposed in this report sees Paraguay using copper and lithium re-sources from Bolivia and Chile, and graphite and aluminum resources from Brazil in Paraguay’s own domestic production facilities. Once complete, batteries would then be sent for integration into the
378 VMME, interview by the authors, October 2020. 379 UNDP, Informe Nacional sobre Desarrollo Humano. Paraguay 2020. 380 GlobalData Energy, “Energy Suppliers Are Asking, What Can EV Schemes Do For Us?” Power Technology, October 25,
2019, https://www.power-technology.com/comment/energy-suppliers-are-asking-what-can-ev-schemes-do-for-us. 381 “Iberdola will Sign a Global Agreement with Nissan to Promote Electric Cars,” The Corner, January 3, 2019,
https://thecorner.eu/financial-markets/iberdrola-will-sign-a-global-agreement-with-nissan-to-promote-electric-cars/77533/.
382 Ildo L. Sauer, Javier F. Escobar, Mauro F.P. da Silva, Carlos G. Meza, Carlos Centurion, and José Goldemberg, “Bolivia And Paraguay: A Beacon For Sustainable Electric Mobility?” Renewable and Sustainable Energy Reviews 51 (July 2015): 910–925, https://doi.org/10.1016/j.rser.2015.06.038.
145 Decarbonization Pathways for Paraguay’s Energy Sector
automobile industry in Brazil. Paraguay might then be in a unique position to participate in a growing industry.383 On February 11, 2020, this opportunity to create a regional hub for automotive manufacturing came one step closer to becoming a reality. Brazil and Paraguay signed an agreement “allowing for the free trade of auto-parts between the two countries and preferential access to the Brazilian market for Par-aguayan manufacturers, including maquilas.”384 The agreement also promotes the development of vehicles with alternative fuel engines, including electric, hybrid, and hydrogen. 385
6.3.3 Green Hydrogen Production
The Case for Green Hydrogen There is growing potential for producing green hydrogen in Paraguay, which could serve the decar-bonization transportation needs after 2030, as demonstrated by the LEAP model in Chapter 1. Glob-ally, 70 million metric tons of hydrogen were produced in 2019.386 Production in Central and South America amounted to 4 million metric tons in 2016, approximately 7.7% of global production. Projec-tions anticipate an increase to 11 million by 2025 with a compounded annual growth rate of 11%.387 Hydrogen can be derived from a variety of sources. Natural gas (methane) reforming using steam ac-counts for the majority of hydrogen produced worldwide. For decarbonization purposes, green hydro-gen—that is, hydrogen sourced from renewables—is the optimal choice for an alternative fuel type. Electrolysis (the separation of water molecules into hydrogen and oxygen) is the most common pro-cess for obtaining green hydrogen. Therefore, any country that is a supplier of renewables-based elec-tric power has the advantage of being able to utilize excess energy to create green hydrogen for the transport sector, a relationship that is highlighted in green in Figure 51.
383 Emily Davenport, Christine Folch, and Connor Vasu, “Itaipú Dam: Paraguay’s Growth Potential,” Duke Energy Initiative,
June 19, 2018, https://itaipupost2023.files.wordpress.com/2018/06/white-paper-final-draft-itaipu-paraguays-growth-potential2.pdf.
384 “LatinNews Daily - 12 February 2020: In brief: Paraguay and Brazil sign automotive deal,” Latin News, February 12, 2020, https://www.latinnews.com/component/k2/item/83188-in-brief-paraguay-and-brazil-sign-automotive-deal.html.
385 REDIEX, “Paraguay Investment Guide 2019-2020.” 386 IEA, The Future of Hydrogen (IEA, 2019), https://www.iea.org/reports/the-future-of-hydrogen. 387 Oxilia et al., Propuesta de Innovacion “Hacia la Ruta del Hidrogeno Verde en Paraguay.”
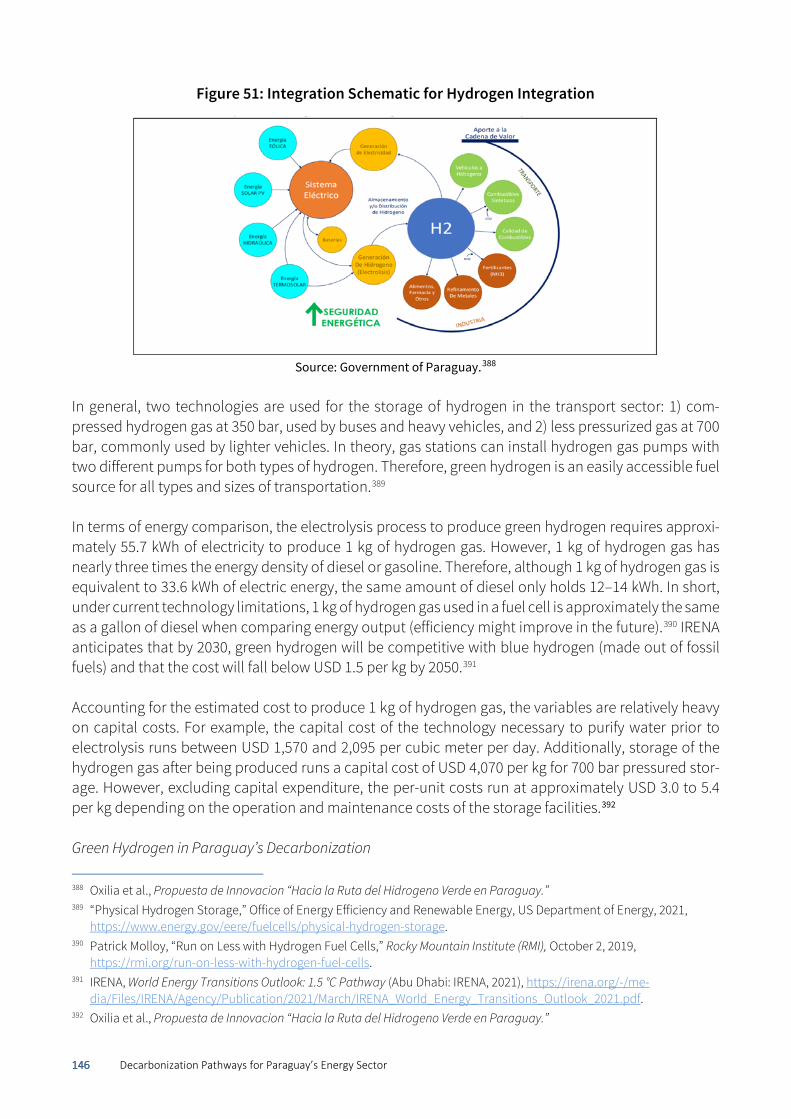
146 Decarbonization Pathways for Paraguay’s Energy Sector
Figure 51: Integration Schematic for Hydrogen Integration
Source: Government of Paraguay.388
In general, two technologies are used for the storage of hydrogen in the transport sector: 1) com-pressed hydrogen gas at 350 bar, used by buses and heavy vehicles, and 2) less pressurized gas at 700 bar, commonly used by lighter vehicles. In theory, gas stations can install hydrogen gas pumps with two different pumps for both types of hydrogen. Therefore, green hydrogen is an easily accessible fuel source for all types and sizes of transportation.389 In terms of energy comparison, the electrolysis process to produce green hydrogen requires approxi-mately 55.7 kWh of electricity to produce 1 kg of hydrogen gas. However, 1 kg of hydrogen gas has nearly three times the energy density of diesel or gasoline. Therefore, although 1 kg of hydrogen gas is equivalent to 33.6 kWh of electric energy, the same amount of diesel only holds 12–14 kWh. In short, under current technology limitations, 1 kg of hydrogen gas used in a fuel cell is approximately the same as a gallon of diesel when comparing energy output (efficiency might improve in the future).390 IRENA anticipates that by 2030, green hydrogen will be competitive with blue hydrogen (made out of fossil fuels) and that the cost will fall below USD 1.5 per kg by 2050.391 Accounting for the estimated cost to produce 1 kg of hydrogen gas, the variables are relatively heavy on capital costs. For example, the capital cost of the technology necessary to purify water prior to electrolysis runs between USD 1,570 and 2,095 per cubic meter per day. Additionally, storage of the hydrogen gas after being produced runs a capital cost of USD 4,070 per kg for 700 bar pressured stor-age. However, excluding capital expenditure, the per-unit costs run at approximately USD 3.0 to 5.4 per kg depending on the operation and maintenance costs of the storage facilities.392 Green Hydrogen in Paraguay’s Decarbonization
388 Oxilia et al., Propuesta de Innovacion “Hacia la Ruta del Hidrogeno Verde en Paraguay.” 389 “Physical Hydrogen Storage,” Office of Energy Efficiency and Renewable Energy, US Department of Energy, 2021,
https://www.energy.gov/eere/fuelcells/physical-hydrogen-storage. 390 Patrick Molloy, “Run on Less with Hydrogen Fuel Cells,” Rocky Mountain Institute (RMI), October 2, 2019,
https://rmi.org/run-on-less-with-hydrogen-fuel-cells. 391 IRENA, World Energy Transitions Outlook: 1.5 °C Pathway (Abu Dhabi: IRENA, 2021), https://irena.org/-/me-
dia/Files/IRENA/Agency/Publication/2021/March/IRENA_World_Energy_Transitions_Outlook_2021.pdf. 392 Oxilia et al., Propuesta de Innovacion “Hacia la Ruta del Hidrogeno Verde en Paraguay.”
147 Decarbonization Pathways for Paraguay’s Energy Sector
With the current lack of infrastructure available for hydrogen transport in Paraguay, the advancement of hydrogen as a fuel source in the country will require much greater investment in the near future. Additionally, there is no legal framework that could facilitate the introduction of hydrogen. However, the Government of Paraguay, in collaboration with the IDB, is working to change this. Releasing a roadmap plan to incorporate hydrogen gas into the country, the Government of Paraguay has de-signed a two-step plan.393 The first step involves raising awareness of the potential for hydrogen, modernizing land transport infrastructure for supply chain development, and improving the balance of payments so that Paraguay can use its own energy resources. To accomplish these tasks, the plan proposes the creation of a fo-rum of experts and leaders to discuss the specific ways to accomplish these goals. In line with the country’s 2040 National Energy Policy, this forum and its agenda would push for establishing the reg-ulatory framework necessary for the development and growth of the green hydrogen industry in Par-aguay.394 The proposed executive agency, the Itaipú Technology Park, would have the direct ability to work in tandem with VMME to oversee the creation of a steering committee. This steering committee, the evo-lution of the aforementioned forum, would unite key stakeholders such as PETROPAR and ANDE to oversee the creation and eventual passing of green hydrogen–specific laws.395 The second step of the plan involves a pilot project to demonstrate the potential of green hydrogen in Paraguay. Using the frequently traveled routes between Asunción and Ciudad del Este, Ciudad del Este and Encarnación, and Asunción and Encarnación, the pilot program would build the infrastructure necessary for green hydrogen on a small scale. In phase 1, the project would establish both a medium-size and a small-size port from which a vehicle fleet could fill up on hydrogen. This fleet would include both light-duty vehicles as well as heavy-duty vehicle pump stations. This first pilot showcase is planned to take place near a PETROPAR industrial plant in Villa Elisa given its proximity to both major land routes and a waterway port. Phase 2 would involve expanding from the initial two facilities to one in each of the cities along the frequently traveled routes above and increasing the number of hydro-gen-powered vehicles. Phase 3 would involve the modular increase of hydrogen production and the number of hydrogen-powered vehicles in Paraguay.396 In total, this pilot study is expected to cost USD 12 million in terms of material cost, with USD 7.8 mil-lion allocated for the first step of the project related to economic expansion, and general infrastructure and supply chain investment.397 As it stands, the implementation of green hydrogen in Paraguay will be prioritized for the transportation sector rather than in the industrial space. Advantages of Hydrogen in Paraguay The development of green hydrogen in Paraguay is supported by four principal advantages.
393 Oxilia et al., Propuesta de Innovacion “Hacia la Ruta del Hidrogeno Verde en Paraguay.” 394 Oxilia et al., Propuesta de Innovacion “Hacia la Ruta del Hidrogeno Verde en Paraguay.” 395 Oxilia et al., Propuesta de Innovacion “Hacia la Ruta del Hidrogeno Verde en Paraguay.” 396 Oxilia et al., Propuesta de Innovacion “Hacia la Ruta del Hidrogeno Verde en Paraguay.” 397 Oxilia et al., Propuesta de Innovacion “Hacia la Ruta del Hidrogeno Verde en Paraguay.”
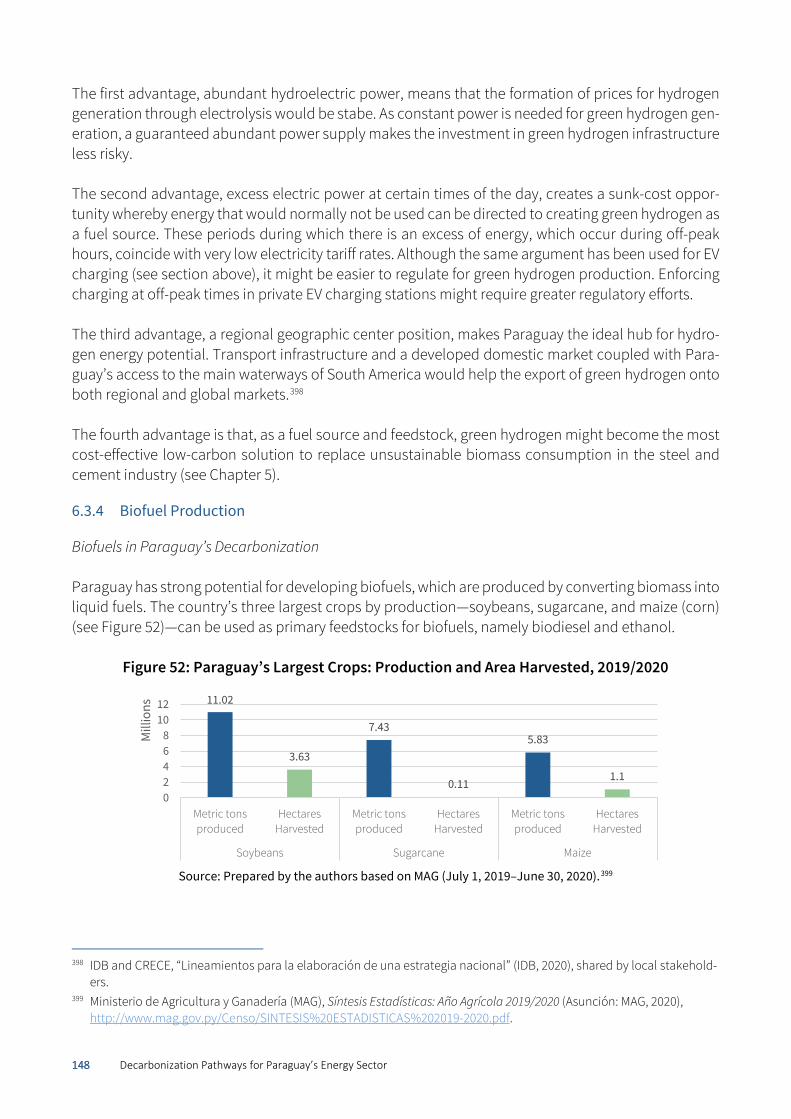
148 Decarbonization Pathways for Paraguay’s Energy Sector
The first advantage, abundant hydroelectric power, means that the formation of prices for hydrogen generation through electrolysis would be stabe. As constant power is needed for green hydrogen gen-eration, a guaranteed abundant power supply makes the investment in green hydrogen infrastructure less risky. The second advantage, excess electric power at certain times of the day, creates a sunk-cost oppor-tunity whereby energy that would normally not be used can be directed to creating green hydrogen as a fuel source. These periods during which there is an excess of energy, which occur during off-peak hours, coincide with very low electricity tariff rates. Although the same argument has been used for EV charging (see section above), it might be easier to regulate for green hydrogen production. Enforcing charging at off-peak times in private EV charging stations might require greater regulatory efforts. The third advantage, a regional geographic center position, makes Paraguay the ideal hub for hydro-gen energy potential. Transport infrastructure and a developed domestic market coupled with Para-guay’s access to the main waterways of South America would help the export of green hydrogen onto both regional and global markets.398 The fourth advantage is that, as a fuel source and feedstock, green hydrogen might become the most cost-effective low-carbon solution to replace unsustainable biomass consumption in the steel and cement industry (see Chapter 5).
6.3.4 Biofuel Production
Biofuels in Paraguay’s Decarbonization Paraguay has strong potential for developing biofuels, which are produced by converting biomass into liquid fuels. The country’s three largest crops by production—soybeans, sugarcane, and maize (corn) (see Figure 52)—can be used as primary feedstocks for biofuels, namely biodiesel and ethanol.
Figure 52: Paraguay’s Largest Crops: Production and Area Harvested, 2019/2020
Source: Prepared by the authors based on MAG (July 1, 2019–June 30, 2020).399
398 IDB and CRECE, “Lineamientos para la elaboración de una estrategia nacional” (IDB, 2020), shared by local stakehold-
ers. 399 Ministerio de Agricultura y Ganadería (MAG), Síntesis Estadísticas: Año Agrícola 2019/2020 (Asunción: MAG, 2020),
http://www.mag.gov.py/Censo/SINTESIS%20ESTADISTICAS%202019-2020.pdf.
11.02
3.63
7.43
0.11
5.83
1.1
02468
1012
Metric tonsproduced
HectaresHarvested
Metric tonsproduced
HectaresHarvested
Metric tonsproduced
HectaresHarvested
Soybeans Sugarcane Maize
Mill
ions
149 Decarbonization Pathways for Paraguay’s Energy Sector
Globally, Paraguay is the sixth-largest producer of soybeans,400 with a production of approximately 11.02 million metric tons in the 2019/2020 crop year from a harvested area of 3.63 million hectares.401 For illustrative purposes, if all the soy produced in Paraguay in that crop year was used to produce biodiesel—the biofuel product of soybean oil—the country could have produced approximately 2.29 billion liters of biodiesel.402 However, most of Paraguay’s soy production is exported—more than 63% in the 2019/2020 crop year403—making the country the fourth largest exporter of soybean oil,404 but not a large producer of biodiesel from soybean oil. In 2015, biodiesel produced from vegetable or other sources represented only 0.2% of Paraguay’s primary energy consumption.405 The Government of Par-aguay could consider putting in place policies to encourage the use of more soybean oil for the pro-duction of biodiesel in lieu of exporting most of the country’s production of soybeans and soybean oil. Paraguay’s second largest crop is sugarcane, with 7.43 million metric tons produced in 2019/2020, and the third is corn, with 5.83 million metric tons produced in the same period.406 Both sugarcane and corn are used at large scale to produce bioethanol in Paraguay. From 56.76 million liters of bioethanol produced in 2005, Paraguay’s production increased five-fold to 277.76 million liters in 2016 (see Figure 53), of which it is estimated that 122.55 million liters (44.12%) were produced from approximately 1.88 million metric tons of sugarcane, and 155.2 million liters (55.88%) from approximately 0.44 million metric tons of corn.407 The most recent data made available by Paraguay’s Ministry of Industry and Commerce indicates that bioethanol production continues to increase, with corn gaining importance as the dominant feed-stock. More than 461.17 million liters of bioethanol was sold in Paraguay from January to November 2020, of which 19% was produced from sugarcane and 81% from corn. Approximately one-third of the bioethanol sold in the period was exported, and two-thirds was sold within the country.408 The corn used for bioethanol (maíz entre zafra) is produced in a rotation system with soybeans and wheat; the use of corn as a complement to sugarcane, traditionally the principal feedstock, allows
400 “Crops and Livestock Products,” FAOSTAT, FAO, last updated September 15, 2021, http://www.fao.org/faostat/en/?#data/QCL. 401 MAG, Síntesis Estadísticas: Año Agrícola 2019/2020. 402 There are 36.74 bushels of soybeans per metric ton and one bushel of soybeans can produce 1.5 gallons of biodiesel.
“Soybeans,” University of Nebraska–Lincoln: Institute of Agriculture and Natural Resources, University of Nebraska–Lincoln, https://cropwatch.unl.edu/bioenergy/soybeans#:~:text=One%20bushel%20of%20soybeans%20can,pro-duce%205.1%20billion%20gallons%20biofuel.
403 “Uso de la Soja,” CAPECO, CAPECO, https://capeco.org.py/uso-de-la-soja-es. 404 Laura Villadiego and Nazaret Castro, “Soja: ¿la nueva palma de los biocombustibles?” (Ecologistas en Accion, 2020),
https://www.ecologistasenaccion.org/wp-content/uploads/2020/06/informe-soja.pdf. 405 Pirelli and Rossi, “Sostenibilidad de la Biomasa Forestal para Energía y del Etanol de Maíz y Caña de Azúcar en Para-
guay,” 266. 406 MAG, Síntesis Estadísticas: Año Agrícola 2019/2020. 407 One metric ton of sugarcane can produce 65 liters of bioethanol, and one metric ton of maize can produce 350 liters
of bioethanol. Pirelli and Rossi, “Sostenibilidad de la Biomasa Forestal para Energía y del Etanol de Maíz y Caña de Azúcar en Paraguay,” 147, 149, 150, 154.
408 Ministerio de Industria y Comercio (MIC), Boletín Semanal, edición 41 (MIC, 2020), 12, https://www.mic.gov.py/mic/w/pdf/boletines_mic/Boletin_MIC_N41-2020.pdf.
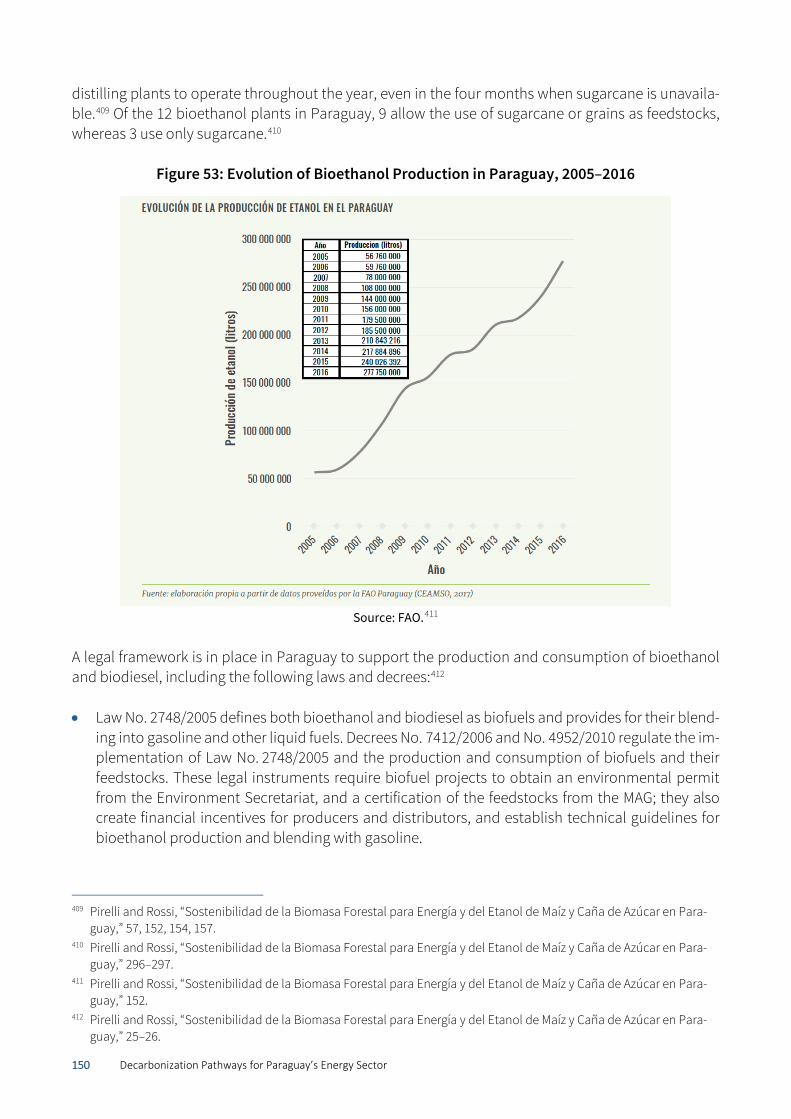
150 Decarbonization Pathways for Paraguay’s Energy Sector
distilling plants to operate throughout the year, even in the four months when sugarcane is unavaila-ble.409 Of the 12 bioethanol plants in Paraguay, 9 allow the use of sugarcane or grains as feedstocks, whereas 3 use only sugarcane.410
Figure 53: Evolution of Bioethanol Production in Paraguay, 2005–2016
Source: FAO.411
A legal framework is in place in Paraguay to support the production and consumption of bioethanol and biodiesel, including the following laws and decrees:412 • Law No. 2748/2005 defines both bioethanol and biodiesel as biofuels and provides for their blend-
ing into gasoline and other liquid fuels. Decrees No. 7412/2006 and No. 4952/2010 regulate the im-plementation of Law No. 2748/2005 and the production and consumption of biofuels and their feedstocks. These legal instruments require biofuel projects to obtain an environmental permit from the Environment Secretariat, and a certification of the feedstocks from the MAG; they also create financial incentives for producers and distributors, and establish technical guidelines for bioethanol production and blending with gasoline.
409 Pirelli and Rossi, “Sostenibilidad de la Biomasa Forestal para Energía y del Etanol de Maíz y Caña de Azúcar en Para-
guay,” 57, 152, 154, 157. 410 Pirelli and Rossi, “Sostenibilidad de la Biomasa Forestal para Energía y del Etanol de Maíz y Caña de Azúcar en Para-
guay,” 296–297. 411 Pirelli and Rossi, “Sostenibilidad de la Biomasa Forestal para Energía y del Etanol de Maíz y Caña de Azúcar en Para-
guay,” 152. 412 Pirelli and Rossi, “Sostenibilidad de la Biomasa Forestal para Energía y del Etanol de Maíz y Caña de Azúcar en Para-
guay,” 25–26.
151 Decarbonization Pathways for Paraguay’s Energy Sector
• Decree No. 12,240/2008 reduced both the rate of the selective consumption tax (Impuesto Selec-tivo al Consumo) on bioethanol and the import duties on Flex Fuel vehicles to 0%, and Resolution 280/2008 requires automakers to present a technical certificate for those vehicles before their ex-portation to Paraguay.
• Under Decree No. 3667/2009, bioethanol and biodiesel are subject to a 2% rate of VAT (Impuesto
al Valor Agregado), but Dictamen DEINT 34/2018 currently exempts bioethanol from the tax.
• Decree No. 10703/2013 regulates Law No. 2748/2005, reconfirming the minimum percentage of blending of 1% biodiesel in fossil diesel and creating an institutional unit to monitor biodiesel prices and establish a reference price.
• Law No. 5444/2015 promotes bioethanol consumption, determining that sugarcane be used as the priority feedstock for its production.
• Law No. 4729/2015 declared Jatropha, a family of nut-bearing flowering trees, to be of national interest. The plant has a very significant biofuel production capacity and grows on degraded lands. However, decade-long studies into the cultivation of Jatropha remain inconclusive and it would be beneficial to renew the investigation.
Increased production of feedstocks driven by growing demand for biofuels could add to pressures on the environment and raise sustainability issues, including food security concerns.413 Since the 1960s, natural landscapes in Paraguay have increasingly been converted into areas for subsistence agricul-ture, large-scale mechanized grain production, and pastures for livestock, loss of native vegetation, reducing biodiversity, and damaging soils.414 For example, studies indicate that removing natural veg-etation for producing biofuels could release as much as 17 times more CO2 than the emissions from fossil fuels avoided by those biofuels, and that decarbonization goals would be better served by car-bon sequestration through forest conservation and restoration than biofuel production.415 Although the expansion of the agricultural frontier—including, in great part, the production of soybeans—is a driver of deforestation and environmental degradation in Paraguay, more detailed field studies are needed to better understand the root causes of land-use changes and the current and potential role of sugarcane and corn production for biofuels in these changes.416 Current Biofuel Development Two developments are underway in the biofuel sector in Paraguay. The first major development is the Omega Green Biofuel Plant, which will become one of the most advanced biofuel facilities in the Southern hemisphere built by the Brazilian ECB group. In early 2020, the Government of Paraguay
413 Yogeeswari Subramaniam, Tajul Ariffin Masron, and Nik Hadiyan Nik Azman, “The Impact of Biofuels on Food Secu-
rity,” International Economics 160, (December 2019): 72–83, http://doi.org/10.1016/j.inteco.2019.10.003. 414 Pirelli and Rossi, “Sostenibilidad de la Biomasa Forestal para Energía y del Etanol de Maíz y Caña de Azúcar en Para-
guay,” 147. 415 FAO, The State Of Food And Agriculture 2008: Biofuels: Prospects, Risks, And Opportunities (Rome: FAO, 2008), 57–58,
http://www.fao.org/3/i0100e/i0100e.pdf. 416 Pirelli and Rossi, “Sostenibilidad de la Biomasa Forestal para Energía y del Etanol de Maíz y Caña de Azúcar en Para-
guay,” 165–166.
152 Decarbonization Pathways for Paraguay’s Energy Sector
granted a “free-zone regime” for the project, which stabilizes the maintenance of the legal conditions for the project for 30 years417 and reduces construction costs for the new plant. With an estimated cost of USD 800 million, the Omega Green plant is expected to generate 20,000 barrels a day of biodiesel and kerosene biofuels to be used in airplanes and other forms of transportation and reportedly bring USD 8 billion in net economic gains to Paraguay over ten years.418 The project, which began in 2020, is expected to be completed by 2023 and will reportedly provide 3,000 direct jobs, 2,400 direct and indirect jobs once operational, and 20,000 smallholder farmers with direct benefits from providing raw agricultural feedstock such as non-edible natural oils and animal fats.419 In preparation, the ECB has already purchased 70 hectares of relatively barren land in the Villeta region of Paraguay adjacent to the ADM PY – Puerto Sara Agroindustrial complex on the Paraguay river,420 and it is leveraging an existing technology called UOP Renewable Jet Fuel Process™ to treat the aforementioned organic feedstock for the production of advanced biofuels that are chemically identical to petroleum-derived diesel and provide similar or better performance.421 Key stakeholders involved in this project include Barclays and UBS as financial supporters, Crown Iron Works and Hon-eywell as the technology suppliers, and ACCIONA as the main construction contractor. 422 So far, the project has signed two sales contracts with a commitment for British Petroleum to purchase 1 billion liters and Shell to purchase 2.5 billion liters of biofuel.423 The second major development in the country is the private development of silvopastoral systems. Using livestock farmland as open space to plant specific oil-rich trees, companies are able to use idle land to return a profit on biofuel production while mitigating the challenges of deforestation. Two companies, Canopy Energy and Investancia, a Paraguayan company, have combined to produce veg-etable oils for biodiesel production from the pongamia tree. As a nitrogen-fixing tree, the pongamia helps revitalize soil for native species to grow and develop.424
417 On the significant risks arising from legal stabilization clauses and best practices in addressing them, see, for example:
Lorenzo Cotula, “Reconciling Regulatory Stability and Evolution of Environmental Standards in Investment Contracts: Towards a Rethink of Stabilization Clauses,” The Journal of World Energy Law & Business 1, No. 2 (July 2008): 158–179, https://doi.org/10.1093/jwelb/jwn003.
418 “Paraguayan Government Grants ‘Free Zone Regime’ For Omega Green Biofuel Plant,” Biofuels International, January 27, 2020, https://biofuels-news.com/news/paraguayan-government-grants-free-zone-regime-for-omega-green-bio-fuel-plant/.
419 Biofuels International, “Paraguayan Government Grants ‘Free Zone Regime’ For Omega Green Biofuel Plant.” 420 ABC Color, “Destacan avances para la instalación de fábrica de biocombustibles ‘Omega Green,’” ABC, September 19,
2020, https://www.abc.com.py/nacionales/2020/09/19/destacan-avances-para-la-instalacion-de-fabrica-de-biocom-bustibles-omega-green/.
421 Honeywell UOP, “Honeywell Renewable Fuels Technology Chosen For First Advanced Biofuels Plant In Paraguay For ECB Group,” news release, April 5, 2021, https://uop.honeywell.com/en/news-events/2021/april/honeywell-renewa-ble-fuels-technology-chosen-for-first-advanced-biofuels-plant-in-paraguay-for-ecb-group.
422 ABC Color, “Destacan avances para la instalación de fábrica de biocombustibles ‘Omega Green.’” 423 “Paraguay: Shell Comprará a Omega Green 2.500 Mm de litros de Biocombustible, BP 1.000 Mm,” BioEconomia, Febru-
ary 19, 2021, https ://www.bioeconomia.info/2021/02/19/en-paraguay-shell-comprara-2-500-mm-de-litros-de-bio-combustible-bp-1-000-mm/.
424 Aloisia Beaujour, “Improving Tree Cover and Producing Biofuel: An Innovative Silvo-Pasture System an Paraguay,” Initiative 20X20, October 18, 2018, https://initiative20x20.org/news/improving-tree-cover-and-producing-biofuel-inno-vative-silvopasture-system-paraguay.
153 Decarbonization Pathways for Paraguay’s Energy Sector
These two companies are only planting pongamia on land that has been deforested for at least 10 years in order to reduce the effects of deforestation of primary forests and mitigate the prevalence of pongamia as an invasive species. Additionally, the group is interested in planting these trees to cover only 20% of livestock pastoral land.425 As a whole, the combined silvopastoral technique ultimately reduces the carbon footprint of land-use and forestry change, the largest contributor to GHG emis-sions in Paraguay, while providing an additional feedstock for biofuel production.426
Summary of Findings and Recommendations
1. The government should evaluate a modern transport system from the VMT perspective, which op-timizes the mode of transport according to passenger capacity and distance traveled in addition to fuel efficiency. As a result, abandoned plans around the BRT should be revisited, the Bioceánico and Tren de Cercanías railway projects should be pushed forward, the renovation of bus fleets should be reopened, and EV technology should be used. Although the initial cost to upgrade Par-aguay’s bus fleet from diesel to electric would be higher, under current technology, this amount would be offset after ten years of operation, including maintenance and fuel. Electric buses have a much more profitable lifetime cost and should be considered for adoption in the Metropolitan area. Multilateral banks could help support this cost just as the IDB did in Chile.
2. Finalizing a policy and legal framework for electric transport and an electric fleet more generally, building on existing proposals by the Mesa Intersectorial de Movilidad Eléctrica and current bills is urgently needed as EVs are approaching price parity with ICEs and the country needs to be ready to seize the opportunity. For example, Decree No. 1269/2019 requiring control of emission effi-ciency at customs should be enforced, and the bill forbidding the imports of vehicles older than five years should be passed. It will progressively modernize the fleet in circulation and bring Para-guay closer to the Latin American standard. The city taxes, registration fees, and insurance that are proportional to the value of vehicle should be made flat not to disadvantage electric buses.
3. The government’s promotion of adoption targets in the public sector should be followed by im-
plementation. It will serve several goals such as prompting the development of charging stations, familiarizing the public with EVs, and opening up the market. Similarly, the policy planning effort should set adoption targets for the private sector and households and consider any fiscal incen-tives needed to accelerate the uptake. The market should be closely followed as EVs will soon be more competitive than ICE cars, and at this time, incentives will no longer be needed.
4. In close collaboration with this planning effort, ANDE should be enabled to prepare for a fast de-ployment of charging stations by collecting data on siting, performing studies on acceptable elec-tricity rates, and adopting targets for the installation of charging stations. ANDE should consider adopting the Vehicle-to-Grid (V2G) technology to capitalize on the idle charging capacity of EVs to stabilize the grid as well as a time schedule for EV charging periods to improve the efficiency of the electricity grid, which wastes energy in off-peak times. Load factor improvement can be achieved by regulating both EV charging, green hydrogen production, or both during off-peak hours. Coor-dinating regulation to require industry and citizens to consume electricity during the early hours of the day instead of peak times in the afternoon can work to round out the success of the electric-ity sector in Paraguay and improve the overall system efficiency.
425 Beaujour, “Improving Tree Cover and Producing Biofuel: An Innovative Silvo-Pasture System in Paraguay.” 426 “Reforestation Oil &Protein,” Investancia, http://investancia.com/.
154 Decarbonization Pathways for Paraguay’s Energy Sector
5. The creation of an industrial sector devoted to the development and implementation of both lith-
ium-ion batteries and EVs with domestic and regional production means would help to both cat-alyze domestic economic development and promote favorable public opinion toward the adop-tion of EVs in Paraguay. Working to expand the supply chain potential for such industrialization through feasibility studies of resource accessibility and trade with neighboring countries would be a first step in this direction. To this end, the expansion of a green hydrogen market has real poten-tial in Paraguay given its abundance of low-cost clean energy, as long as a certification process is implemented to help regulate the potential market. Although ascertaining its potential will de-pend on the success of a pilot, hydrogen’s higher energy density makes it a perfect candidate for bus or public transport fuel. Green hydrogen production can also help improve the load factor while becoming a new source of exports.
6. To support the decarbonization of end-use sectors such as heavy-duty trucking, shipping, and avi-ation, the Government of Paraguay should foster an increase in productivity and domestic capac-ity to produce biofuels from soybean oil, sugarcane, corn, and other promising food crops, includ-ing in short rotation on marginal and pasture lands. It should also study the potential to produce second-generation or advanced biofuels from non-food sustainable feedstocks, wastes, and resi-dues.427 Among other policy mechanisms to promote biofuels, Paraguay could also consider zero-carbon fuel standards, mandates for biofuel development , and the integration of credits for CO2 removal into a reformed cap-and-trade system (see Section 5.2.3 on reforming environmental cer-tificates and Section 7.3.4 on establishing carbon pricing).428 These policies must account for all other possible uses of land, such as preserved native forests and carbon land sinks. Paraguay should also start creating demand in the domestic market to avoid exporting all domestic produc-tion. In doing so, the government should closely follow the recommendations and guidelines by the FAO and other relevant organizations to monitor the environmental performance and carbon emissions savings of biofuels produced and to ensure their social and environmental sustainabil-ity. Among the recommendations highlighted are increasing the productivity of feedstocks (in par-ticular, sugarcane produced at a small scale) through the adoption of varieties with higher produc-tivity and better management practices; reducing and, to the extent possible, avoiding land-use changes; monitoring surface water and groundwater for contamination; addressing land tenure and land value issues in areas used to produce feedstocks; monitoring the impact of the biofuels market on food security and costs; planning for the reskilling of workers displaced by increased automation; and establishing incentives for biofuel producers with sustainability certifications.429
427 Eduardo Bohn, “Tablero de comando” para la producción de los biocombustibles en Paraguay (Santiago: CEPAL, 2009),
https://repositorio.cepal.org/bitstream/handle/11362/3694/1/S2009095_es.pdf; Alexandra Friedmann and Reinaldo Penner, Biocombustibles: Alternativa de Negocios Verdes (Asunción: USAID and Paraguay Vende, 2009), https://www.usaid.gov/sites/default/files/documents/1862/biocombustibles.pdf.
428 IEA, Net Zero by 2050, 92. 429 Pirelli and Rossi, “Sostenibilidad de la Biomasa Forestal para Energía y del Etanol de Maíz y Caña de Azúcar en Para-
guay,” 297–298.
155 Decarbonization Pathways for Paraguay’s Energy Sector
7. How to Finance Decarbonization
Paraguay has a number of means at its disposal to finance its decarbonization program for a sustain-able future. This chapter is divided into five sections. The first summarizes the legal framework for public financial management in Paraguay. The second identifies the main problems with Paraguay’s public financial management. The third highlights the COVID-19 pandemic and its acute macroeco-nomic impact on Paraguay. The fourth presents potential solutions to finance decarbonization. Fi-nally, the fifth section provides key recommendations and next steps the government can take to align Paraguay’s financial system toward decarbonization by 2050.
Public Financial Management: Legal Framework
Electricity Revenue Allocation In September 2012, Law No. 4758/2012 created the National Fund for Public Investment and Develop-ment (FONACIDE) to manage compensation revenue (paid by Brazil for the purchase of Paraguay’s capacity allocation that is not used by the country) from the binational entity Itaipú. The law earmarks the resources of the fund for education and research (30%), infrastructure (28%), departments and municipalities (25%), health (10%), and the capitalization of the Financial Agency for Development (7%). To give a range of orders from 2012 to 2020, FONACIDE transferred a yearly average of PYG 404 billion430 (approximately USD 61 million431) to national, department, and municipality governments. However, as soon as ANDE uses the totality of its share as anticipated by this report, the compensation will be reduced to zero, which will significantly reduce FONACIDE’s financing capacity. In addition to FONACIDE’s funds, as per Law No. 3984/2010, the subnational level (departments and municipalities) receive 50% of the royalties paid by the binational hydropower dams. Moreover, Itaipú must dedicate part of its financial resources to capital, social, and environmental issues as per the RDE-109/2003 administrative resolution of Itaipú’s Board of Directors.432 A similar scheme exists for Yacyretá.433 The idea to earmark some of Itaipú’s and Yacyretá’s financial resources for capital, social, and envi-ronmental expenditure is forward-looking and instrumental in achieving inclusive growth in Argentina, Brazil, and Paraguay. Article 281 of Law No. 6672/2021 (the budget law for 2021) authorizes the Gov-ernment of Paraguay to conclude cooperation agreements with the binational entities regarding these expenditures. Even though any expenditures made under these agreements would be subject to con-trol by the competent authorities and reporting and accountability obligations on the part of the bi-national hydropower entities, the process established by Law No. 6672/2021 is extra-budgetary and might loosen transparency and accountability mechanisms usually associated with budgetary pro-cesses. In an effort to increase the budget for public health expenses to respond to the COVID-19 crisis,
430 “Transferencias bancarias de FONACIDE,” Ministerio de Hacienda, last updated September 14, 2021, https://da-
tos.hacienda.gov.py/grafico/fonacide-transferencia. 431 1 USD = 6620 PYG as of March 11, 2021. 432 Ernesto Ayala Báez, “Gastos Socioambientales de la Entidad Paraguayo-Brasilena,” ABC, December 6, 2020,
https://www.abc.com.py/edicion-impresa/suplementos/economico/2020/12/06/gastos-socioambientales-de-la-entidad-paraguayo-brasilena/.
433 Local stakeholders, interview by the authors, October 2020.
156 Decarbonization Pathways for Paraguay’s Energy Sector
Congress passed Law No. 6729/2021 to transfer the social and environmental funds of binational hy-dropower dams to the purview of the Ministry of Finance during pandemic times. The renegotiation of Annex C of the Itaipú treaty could provide an opportunity to review the effectiveness of all of these processes to make sure that all revenue is spent effectively. Local Accountability, Planning, and Participation Before the policy and legal developments in 2014 and 2016 (see below), the aforementioned subna-tional distribution mechanism did not account for the fiscal capacity of the municipalities or the effi-ciency of past spending. The reliance on guaranteed revenues from FONACIDE and other sources dis-couraged improving tax collection rates or tax efficiency at the local level. Some municipalities did not even report on the use of the resources.434 This issue led to an increasing misalignment between public spending at the municipal level and national development priorities.435 The National Development Plan of 2014 introduced Local Development Councils, entities tasked with coordinating both national and local priorities and expenditures. However, the system was rife with challenges. Although the idea that local property tax can fund local expenditures is fiscally sound, the political pressures of large landowners made collection rates abysmal. Additionally, cadastral maps of areas outside of Asunción were either nonexistent or outdated. As a result, local governments in these ‘dead zones’ depended on central government funding transfers for local expenditures, a cir-cumstance that the national plan did not improve.436 Realizing these problems with the process, Reg-ulatory Decree No. 4774/2016 established the Municipal Sustainable Development Plan as the basis on which the Ministry of Finance audits local expenditures and approves funding transfers, including from FONACIDE, to subnational entities. With the newfound ability to deny central government fund-ing transfers to local governments, the Ministry of Finance was able to successfully curtail non-com-pliance in different regions of Paraguay. 437
Fiscal Responsibility Law
Law No. 5098/2013, the Fiscal Responsibility Law (FRL), set a deficit limit of 1.5% of the country’s GDP, and real growth in current expenditures at 4% of the national GDP. This type of fiscal control on the country’s spending limited the scope of financial investments the country could make and set a con-servative safeguard against financial shocks at the macroeconomic level (see Table 35 for the features of the FRL).
434 Local stakeholders, interview by the authors, October 2020. 435 Ministry of Finance of Paraguay, Royalties and compensation: Municipal performance report, third quarter - fiscal 2009
(Asunción: 2010); Controller General of the Republic, “Special Consideration to the Budget Execution of Operations [different municipalities]” (Asunción: 2010).
436 Gustavo Setrini and Liliana Rocío Duarte-Recalde, “The Development of Participatory Institutions in Paraguay: A Tool for Democratization or State Control?” Cahiers des Amériques Latines 90 (2019): 39-57, https://pa-pers.ssrn.com/sol3/papers.cfm?abstract_id=3388134.
437 Setrini and Duarte-Recalde, “The Development of Participatory Institutions in Paraguay.”
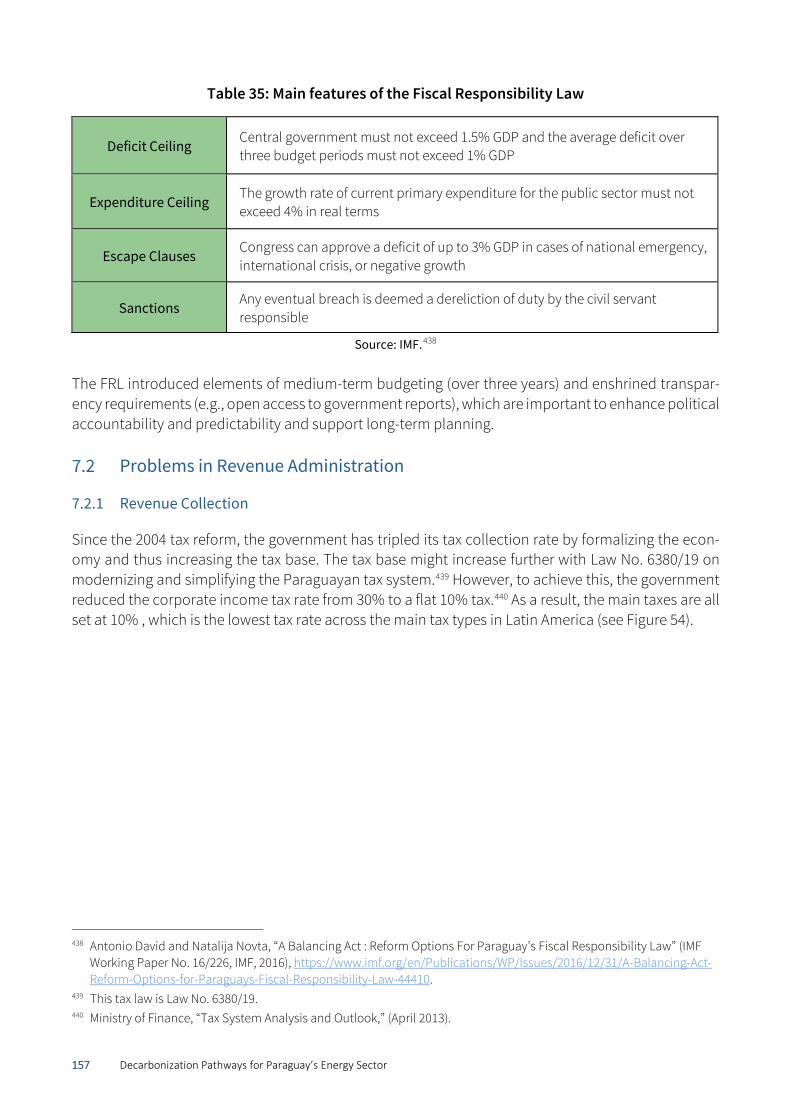
157 Decarbonization Pathways for Paraguay’s Energy Sector
Table 35: Main features of the Fiscal Responsibility Law
Deficit Ceiling Central government must not exceed 1.5% GDP and the average deficit over three budget periods must not exceed 1% GDP
Expenditure Ceiling The growth rate of current primary expenditure for the public sector must not exceed 4% in real terms
Escape Clauses Congress can approve a deficit of up to 3% GDP in cases of national emergency, international crisis, or negative growth
Sanctions Any eventual breach is deemed a dereliction of duty by the civil servant responsible
Source: IMF.438 The FRL introduced elements of medium-term budgeting (over three years) and enshrined transpar-ency requirements (e.g., open access to government reports), which are important to enhance political accountability and predictability and support long-term planning.
Problems in Revenue Administration
7.2.1 Revenue Collection
Since the 2004 tax reform, the government has tripled its tax collection rate by formalizing the econ-omy and thus increasing the tax base. The tax base might increase further with Law No. 6380/19 on modernizing and simplifying the Paraguayan tax system.439 However, to achieve this, the government reduced the corporate income tax rate from 30% to a flat 10% tax.440 As a result, the main taxes are all set at 10% , which is the lowest tax rate across the main tax types in Latin America (see Figure 54).
438 Antonio David and Natalija Novta, “A Balancing Act : Reform Options For Paraguay’s Fiscal Responsibility Law” (IMF
Working Paper No. 16/226, IMF, 2016), https://www.imf.org/en/Publications/WP/Issues/2016/12/31/A-Balancing-Act-Reform-Options-for-Paraguays-Fiscal-Responsibility-Law-44410.
439 This tax law is Law No. 6380/19. 440 Ministry of Finance, “Tax System Analysis and Outlook,” (April 2013).
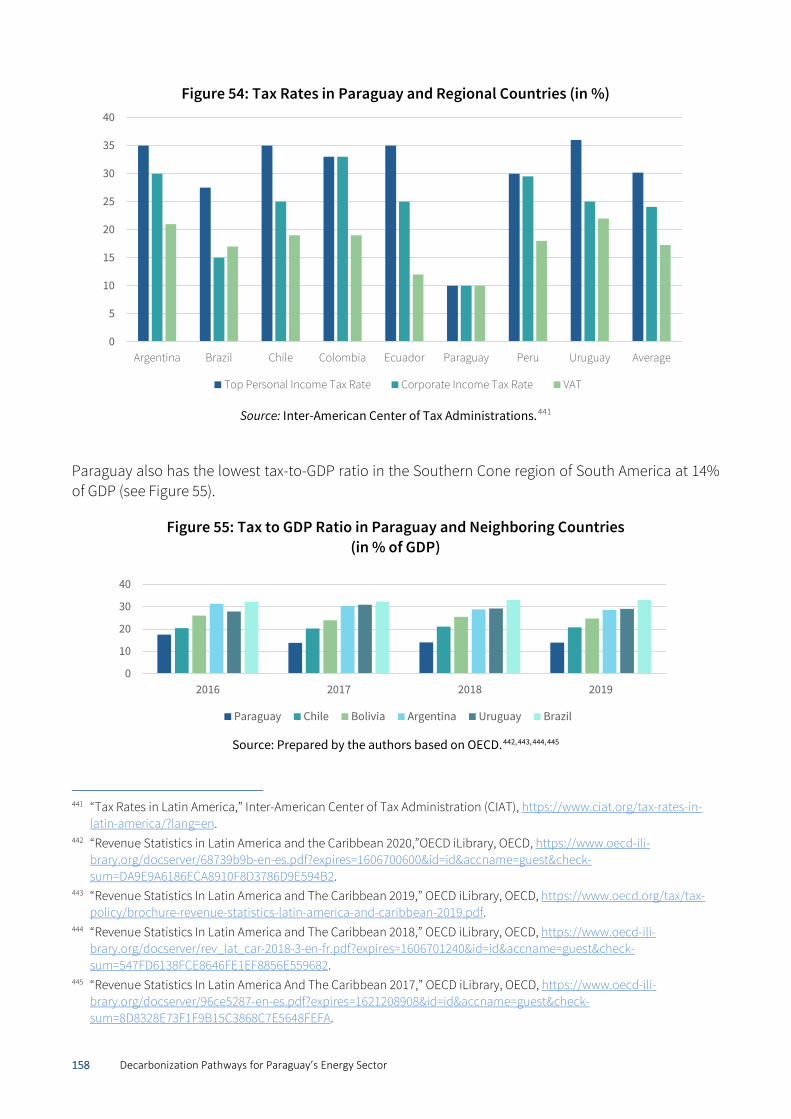
158 Decarbonization Pathways for Paraguay’s Energy Sector
Figure 54: Tax Rates in Paraguay and Regional Countries (in %)
Source: Inter-American Center of Tax Administrations.441
Paraguay also has the lowest tax-to-GDP ratio in the Southern Cone region of South America at 14% of GDP (see Figure 55).
Figure 55: Tax to GDP Ratio in Paraguay and Neighboring Countries (in % of GDP)
Source: Prepared by the authors based on OECD.442,443,444,445
441 “Tax Rates in Latin America,” Inter-American Center of Tax Administration (CIAT), https://www.ciat.org/tax-rates-in-
latin-america/?lang=en. 442 “Revenue Statistics in Latin America and the Caribbean 2020,”OECD iLibrary, OECD, https://www.oecd-ili-
brary.org/docserver/68739b9b-en-es.pdf?expires=1606700600&id=id&accname=guest&check-sum=DA9E9A6186ECA8910F8D3786D9E594B2.
443 “Revenue Statistics In Latin America and The Caribbean 2019,” OECD iLibrary, OECD, https://www.oecd.org/tax/tax-policy/brochure-revenue-statistics-latin-america-and-caribbean-2019.pdf.
444 “Revenue Statistics In Latin America and The Caribbean 2018,” OECD iLibrary, OECD, https://www.oecd-ili-brary.org/docserver/rev_lat_car-2018-3-en-fr.pdf?expires=1606701240&id=id&accname=guest&check-sum=547FD6138FCE8646FE1EF8856E559682.
445 “Revenue Statistics In Latin America And The Caribbean 2017,” OECD iLibrary, OECD, https://www.oecd-ili-brary.org/docserver/96ce5287-en-es.pdf?expires=1621208908&id=id&accname=guest&check-sum=8D8328E73F1F9B15C3868C7E5648FEFA.
0
5
10
15
20
25
30
35
40
Argentina Brazil Chile Colombia Ecuador Paraguay Peru Uruguay Average
Top Personal Income Tax Rate Corporate Income Tax Rate VAT
0
10
20
30
40
2016 2017 2018 2019
Paraguay Chile Bolivia Argentina Uruguay Brazil
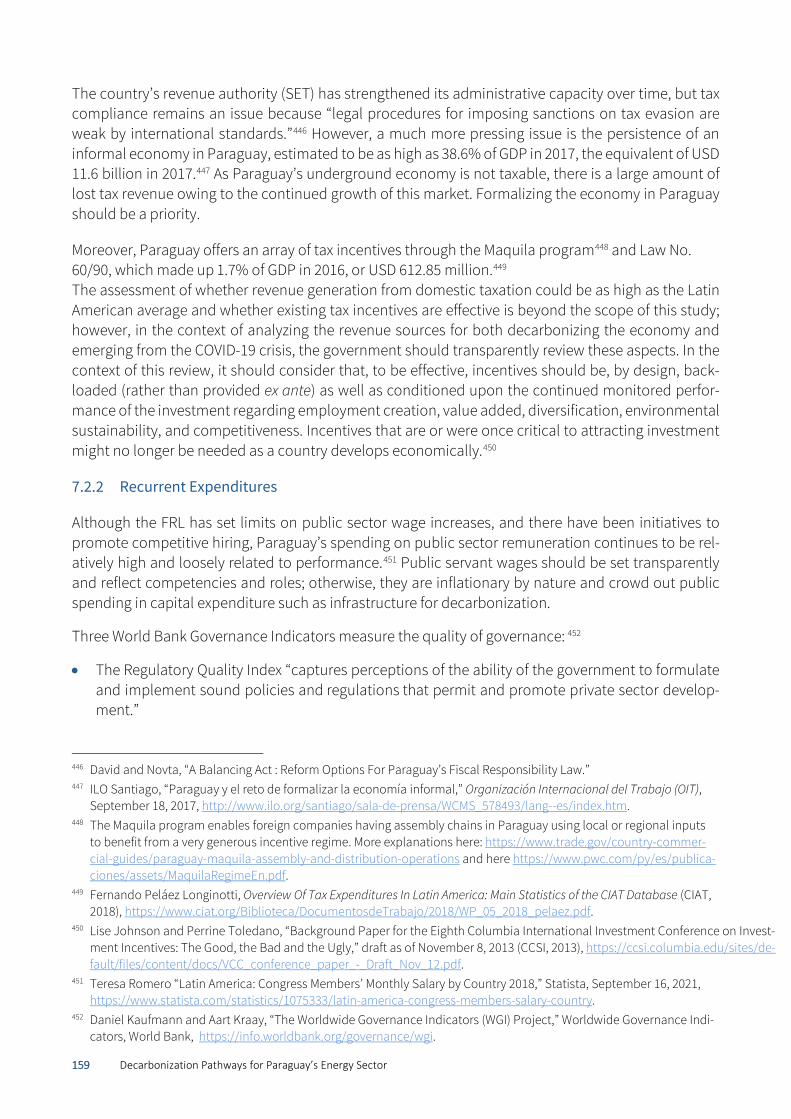
159 Decarbonization Pathways for Paraguay’s Energy Sector
The country’s revenue authority (SET) has strengthened its administrative capacity over time, but tax compliance remains an issue because “legal procedures for imposing sanctions on tax evasion are weak by international standards.”446 However, a much more pressing issue is the persistence of an informal economy in Paraguay, estimated to be as high as 38.6% of GDP in 2017, the equivalent of USD 11.6 billion in 2017.447 As Paraguay’s underground economy is not taxable, there is a large amount of lost tax revenue owing to the continued growth of this market. Formalizing the economy in Paraguay should be a priority.
Moreover, Paraguay offers an array of tax incentives through the Maquila program448 and Law No. 60/90, which made up 1.7% of GDP in 2016, or USD 612.85 million.449 The assessment of whether revenue generation from domestic taxation could be as high as the Latin American average and whether existing tax incentives are effective is beyond the scope of this study; however, in the context of analyzing the revenue sources for both decarbonizing the economy and emerging from the COVID-19 crisis, the government should transparently review these aspects. In the context of this review, it should consider that, to be effective, incentives should be, by design, back-loaded (rather than provided ex ante) as well as conditioned upon the continued monitored perfor-mance of the investment regarding employment creation, value added, diversification, environmental sustainability, and competitiveness. Incentives that are or were once critical to attracting investment might no longer be needed as a country develops economically.450
7.2.2 Recurrent Expenditures
Although the FRL has set limits on public sector wage increases, and there have been initiatives to promote competitive hiring, Paraguay’s spending on public sector remuneration continues to be rel-atively high and loosely related to performance.451 Public servant wages should be set transparently and reflect competencies and roles; otherwise, they are inflationary by nature and crowd out public spending in capital expenditure such as infrastructure for decarbonization.
Three World Bank Governance Indicators measure the quality of governance: 452
• The Regulatory Quality Index “captures perceptions of the ability of the government to formulate and implement sound policies and regulations that permit and promote private sector develop-ment.”
446 David and Novta, “A Balancing Act : Reform Options For Paraguay’s Fiscal Responsibility Law.” 447 ILO Santiago, “Paraguay y el reto de formalizar la economía informal,” Organización Internacional del Trabajo (OIT),
September 18, 2017, http://www.ilo.org/santiago/sala-de-prensa/WCMS_578493/lang--es/index.htm. 448 The Maquila program enables foreign companies having assembly chains in Paraguay using local or regional inputs
to benefit from a very generous incentive regime. More explanations here: https://www.trade.gov/country-commer-cial-guides/paraguay-maquila-assembly-and-distribution-operations and here https://www.pwc.com/py/es/publica-ciones/assets/MaquilaRegimeEn.pdf.
449 Fernando Peláez Longinotti, Overview Of Tax Expenditures In Latin America: Main Statistics of the CIAT Database (CIAT, 2018), https://www.ciat.org/Biblioteca/DocumentosdeTrabajo/2018/WP_05_2018_pelaez.pdf.
450 Lise Johnson and Perrine Toledano, “Background Paper for the Eighth Columbia International Investment Conference on Invest-ment Incentives: The Good, the Bad and the Ugly,” draft as of November 8, 2013 (CCSI, 2013), https://ccsi.columbia.edu/sites/de-fault/files/content/docs/VCC_conference_paper_-_Draft_Nov_12.pdf.
451 Teresa Romero “Latin America: Congress Members’ Monthly Salary by Country 2018,” Statista, September 16, 2021, https://www.statista.com/statistics/1075333/latin-america-congress-members-salary-country.
452 Daniel Kaufmann and Aart Kraay, “The Worldwide Governance Indicators (WGI) Project,” Worldwide Governance Indi-cators, World Bank, https://info.worldbank.org/governance/wgi.
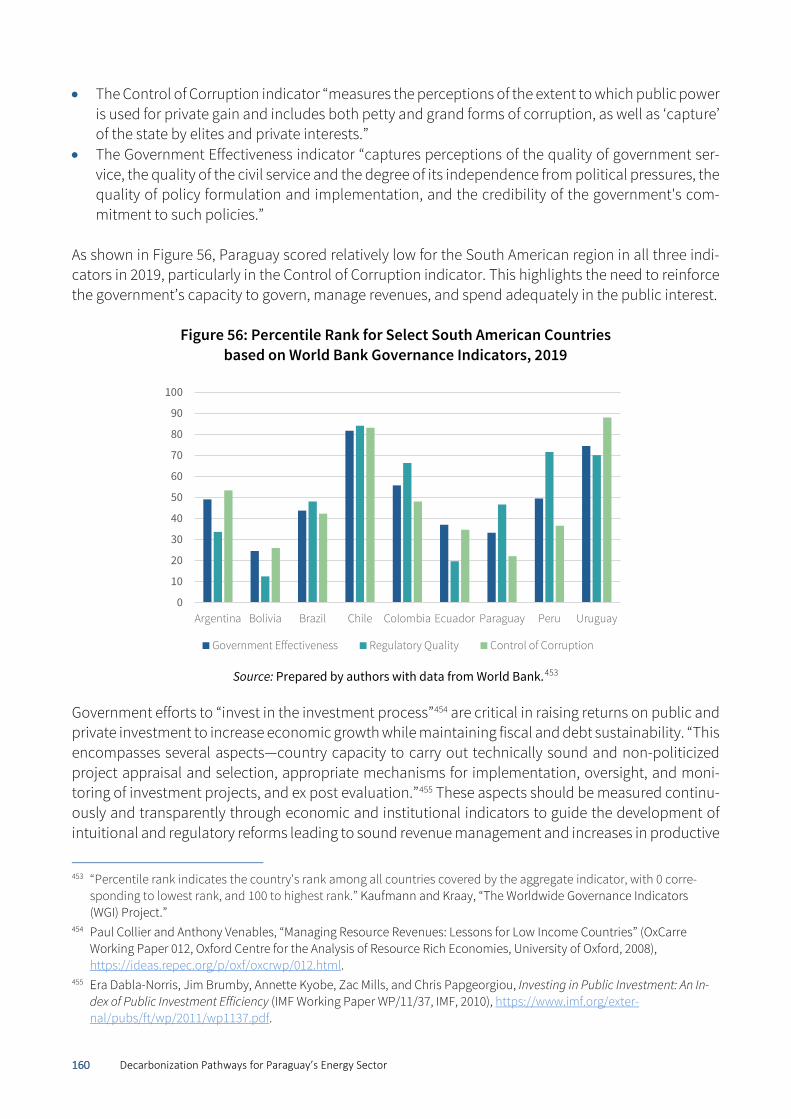
160 Decarbonization Pathways for Paraguay’s Energy Sector
• The Control of Corruption indicator “measures the perceptions of the extent to which public power is used for private gain and includes both petty and grand forms of corruption, as well as ‘capture’ of the state by elites and private interests.”
• The Government Effectiveness indicator “captures perceptions of the quality of government ser-vice, the quality of the civil service and the degree of its independence from political pressures, the quality of policy formulation and implementation, and the credibility of the government's com-mitment to such policies.”
As shown in Figure 56, Paraguay scored relatively low for the South American region in all three indi-cators in 2019, particularly in the Control of Corruption indicator. This highlights the need to reinforce the government’s capacity to govern, manage revenues, and spend adequately in the public interest.
Figure 56: Percentile Rank for Select South American Countries based on World Bank Governance Indicators, 2019
Source: Prepared by authors with data from World Bank.453
Government efforts to “invest in the investment process”454 are critical in raising returns on public and private investment to increase economic growth while maintaining fiscal and debt sustainability. “This encompasses several aspects―country capacity to carry out technically sound and non-politicized project appraisal and selection, appropriate mechanisms for implementation, oversight, and moni-toring of investment projects, and ex post evaluation.”455 These aspects should be measured continu-ously and transparently through economic and institutional indicators to guide the development of intuitional and regulatory reforms leading to sound revenue management and increases in productive
453 “Percentile rank indicates the country's rank among all countries covered by the aggregate indicator, with 0 corre-
sponding to lowest rank, and 100 to highest rank.” Kaufmann and Kraay, “The Worldwide Governance Indicators (WGI) Project.”
454 Paul Collier and Anthony Venables, “Managing Resource Revenues: Lessons for Low Income Countries” (OxCarre Working Paper 012, Oxford Centre for the Analysis of Resource Rich Economies, University of Oxford, 2008), https://ideas.repec.org/p/oxf/oxcrwp/012.html.
455 Era Dabla-Norris, Jim Brumby, Annette Kyobe, Zac Mills, and Chris Papgeorgiou, Investing in Public Investment: An In-dex of Public Investment Efficiency (IMF Working Paper WP/11/37, IMF, 2010), https://www.imf.org/exter-nal/pubs/ft/wp/2011/wp1137.pdf.
0
10
20
30
40
50
60
70
80
90
100
Argentina Bolivia Brazil Chile Colombia Ecuador Paraguay Peru Uruguay
Government Effectiveness Regulatory Quality Control of Corruption
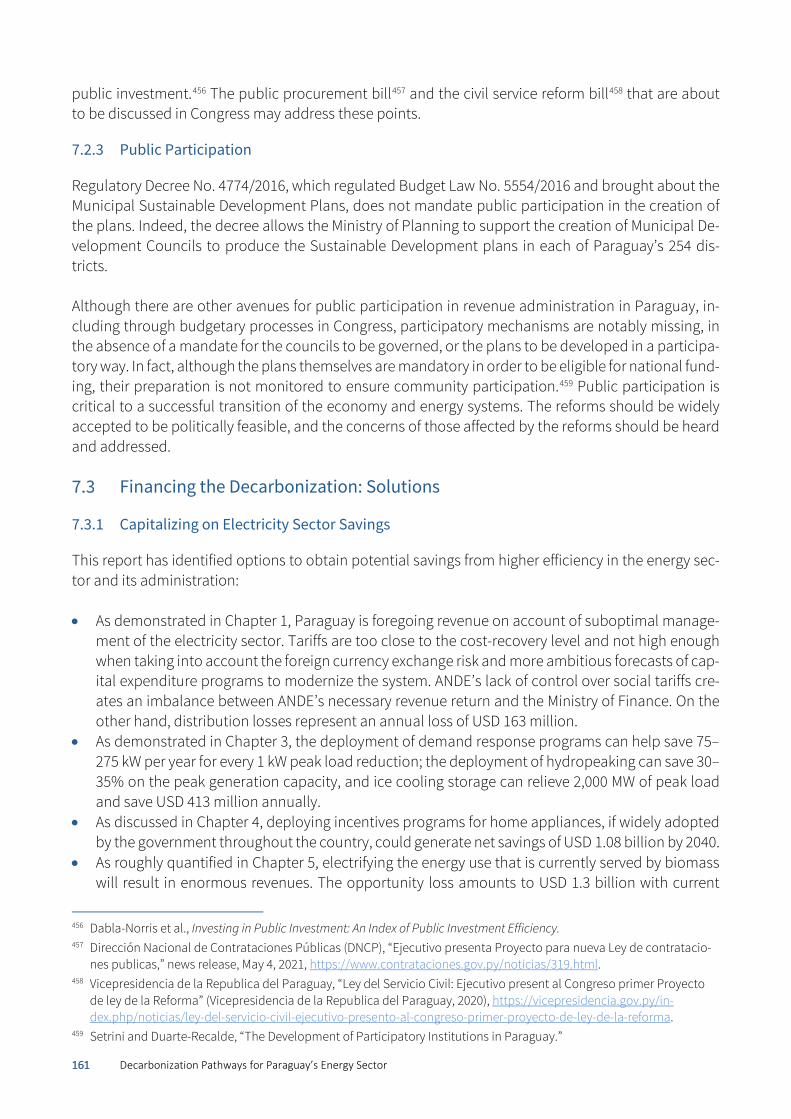
161 Decarbonization Pathways for Paraguay’s Energy Sector
public investment.456 The public procurement bill457 and the civil service reform bill458 that are about to be discussed in Congress may address these points.
7.2.3 Public Participation
Regulatory Decree No. 4774/2016, which regulated Budget Law No. 5554/2016 and brought about the Municipal Sustainable Development Plans, does not mandate public participation in the creation of the plans. Indeed, the decree allows the Ministry of Planning to support the creation of Municipal De-velopment Councils to produce the Sustainable Development plans in each of Paraguay’s 254 dis-tricts. Although there are other avenues for public participation in revenue administration in Paraguay, in-cluding through budgetary processes in Congress, participatory mechanisms are notably missing, in the absence of a mandate for the councils to be governed, or the plans to be developed in a participa-tory way. In fact, although the plans themselves are mandatory in order to be eligible for national fund-ing, their preparation is not monitored to ensure community participation.459 Public participation is critical to a successful transition of the economy and energy systems. The reforms should be widely accepted to be politically feasible, and the concerns of those affected by the reforms should be heard and addressed.
Financing the Decarbonization: Solutions
7.3.1 Capitalizing on Electricity Sector Savings
This report has identified options to obtain potential savings from higher efficiency in the energy sec-tor and its administration: • As demonstrated in Chapter 1, Paraguay is foregoing revenue on account of suboptimal manage-
ment of the electricity sector. Tariffs are too close to the cost-recovery level and not high enough when taking into account the foreign currency exchange risk and more ambitious forecasts of cap-ital expenditure programs to modernize the system. ANDE’s lack of control over social tariffs cre-ates an imbalance between ANDE’s necessary revenue return and the Ministry of Finance. On the other hand, distribution losses represent an annual loss of USD 163 million.
• As demonstrated in Chapter 3, the deployment of demand response programs can help save 75–275 kW per year for every 1 kW peak load reduction; the deployment of hydropeaking can save 30–35% on the peak generation capacity, and ice cooling storage can relieve 2,000 MW of peak load and save USD 413 million annually.
• As discussed in Chapter 4, deploying incentives programs for home appliances, if widely adopted by the government throughout the country, could generate net savings of USD 1.08 billion by 2040.
• As roughly quantified in Chapter 5, electrifying the energy use that is currently served by biomass will result in enormous revenues. The opportunity loss amounts to USD 1.3 billion with current
456 Dabla-Norris et al., Investing in Public Investment: An Index of Public Investment Efficiency. 457 Dirección Nacional de Contrataciones Públicas (DNCP), “Ejecutivo presenta Proyecto para nueva Ley de contratacio-
nes publicas,” news release, May 4, 2021, https://www.contrataciones.gov.py/noticias/319.html. 458 Vicepresidencia de la Republica del Paraguay, “Ley del Servicio Civil: Ejecutivo present al Congreso primer Proyecto
de ley de la Reforma” (Vicepresidencia de la Republica del Paraguay, 2020), https://vicepresidencia.gov.py/in-dex.php/noticias/ley-del-servicio-civil-ejecutivo-presento-al-congreso-primer-proyecto-de-ley-de-la-reforma.
459 Setrini and Duarte-Recalde, “The Development of Participatory Institutions in Paraguay.”
162 Decarbonization Pathways for Paraguay’s Energy Sector
tariff, not accounting for the higher efficiency of electricity as opposed to biomass or additional investment in the electricity system to bring electricity to these users, as well as making the bold assumption that electricity could serve all uses.
• The same is true for the electrification of transportation. As shown in Chapter 6, by completely electrifying public bus transportation in the country, Paraguay could save up to USD 20 million in net present value after ten years of implementation.
Furthermore, following the payoff of its debt in 2022–2023, Itaipú will be able to operate at a much lower cost. Considering that in 2019, the debt amortization cost of Itaipú was approximately USD 2 billion, this could have windfall revenue implications for Brazil and Paraguay if the governments agree to create new sources of payments by maintaining the tariff at or approximately current levels. The IMF anticipates that if, during the renegotiation of Annex C, both countries ratify to exclusively distrib-ute this windfall as royalty payments to each country (between USD 800 million and USD 1 billion per year), “it would more than quadruple the amount of royalty payments in 2019” and “translate into almost 10 percent increase in Paraguay’s projected fiscal revenue for 2024 (2.2 percent of projected 2024 GDP)”.460 The government could set up a fund to collect this money and earmark it for decarbon-ization, building on the idea contained in Decree No. 6092/16 on National Energy Policy, which refers to the creation of a national infrastructure bank for economic and social development (‘BNIDES’). However, if no agreement is reached to amend Annex C or ratified by the end of 2021 or by the end of the debt payment in mid-2023, the continued application of Annex C will mean decreasing the tariff to the new cost, representing a large reduction in capacity payments from ANDE and Eletrobras. In this more probable scenario, ANDE could benefit from a tariff reduction and invest these savings in its mas-ter plan, if the tariff is not reduced proportionally to the consumers. A third possibility is a combination of both. It is noteworthy that according to ANDE’s 2021-2030 cashflow analysis,461 a reduction in Itaipú’s tariff will not prevent ANDE from having a growing deficit by 2030.
Passing this type of measure will be politically challenging, as it will require political alignment be-tween Brazil and Paraguay as well as ratification by both Congresses. As an example, the 2009 agree-ment between Brazil and Paraguay took more than two years to be ratified by the Brazilian Congress and come into effect.462 It will require strong confidence in the government’s ability to spend in the public interest. To this end, there is a need for higher transparency and accountability in policymaking, as mentioned above. However, the bilateral decision not to lower the 2021 and 2022 tariffs463 while increasing ANDE’s investment budget raises the probability of political feasibility, even though this decision will require the anticipation of the review of Annex C before August 2023, which seems to be a more distant possibility.
A fourth possibility is to lower the tariff to consumers to promote electricity to the productive sector that currently consumes biomass. However, the tariff is already low by international standards, and
460 Natasha X Che, “Macroeconomic Impact of the Itaipú Treaty Review For Paraguay” (IMF Working Paper No. 2021/229,
IMF, 2021), https://www.imf.org/en/Publications/WP/Issues/2021/05/05/Macroeconomic-Impact-of-the-Itaip-Treaty-Review-for-Paraguay-50248.
461 ANDE, “Flujo de Caja a Largo Plazo.” 462 Local stakeholders, interview by authors, July 2020. 463 Itaipú Binacional, “Itaipú otorga USD 203 milliones a la ANDE para fortalecer el sistema eléctrico paraguayo,” news
release, February 26, 2021, https://www.Itaipú.gov.py/es/sala-de-prensa/noticia/Itaipú-otorga-usd-203-millones-la-ande-para-fortalecer-el-sistema-electrico-p.
163 Decarbonization Pathways for Paraguay’s Energy Sector
enforcing strong regulation on unsustainable biomass (see Chapter 5) should help promote electrifi-cation. The model PY-RAM discussed in Chapter 3 actually shows that reducing the tariff further has no impact on the system cost in the medium to long term.464
With the reduction of tariffs to consumers, ANDE could eventually find itself facing difficulties in cash flow and covering its much-needed investment plan. A further consideration not accounted for is that the 2007 agreement on operations ends in 2023 and, if not renewed, ANDE will probably have to con-tract higher power requirements as it might lose priority in the use of the additional energy generated above the hired capacity of Itaipú.
7.3.2 Incentivizing Private Sector Participation in the Electricity Sector
Creation of a private-facing interface In addition to creating a dedicated Ministry of Energy, developing an autonomous entity responsible for all interactions with potential private investors would modernize ANDE’s involvement with the gov-ernment. Designed in collaboration with global partners and international institutions, this interface—an independent body within the Ministry of Finance specifically for private financing of electric infra-structure projects—would help streamline interactions with private investors.465 With a clear approach, the Government of Paraguay can:
1. Identify deals that benefit private-capital financing as part of a national portfolio; 2. Build and publish the deal pipeline to create transparency; 3. Build an early perspective on project viability to focus resources; 4. Provide funding to select projects with external expertise to structure projects; and 5. Design and implement a staged approach, so course corrections and stakeholder alignments
can be made.466 Improving incentives for private participation in developing the electricity sector This private-facing interface would also work with the Ministry of Energy to further incentivize the par-ticipation of the private sector beyond existing laws, which might prove insufficient. For instance, there is a need to create opportunities for IPPs in the electricity sector in the long term. Because electricity tariffs are relatively low and most of the power generation comes from low-cost hydropower sources, supplying the total consumption of the metropolitan area of Asunción—which accounts for 38.8% of national consumption467—IPPs have few incentives to enter the generation market. Law No. 3009/2006 sets a regulatory framework for IPPs in the electricity sector, granting ANDE a preferential position for all generation sources above 2 MW, and requiring public bidding and partnership with ANDE.
464 Vijay Modi, Yinbo Hu, and Yuezi Wu, Modeling: Understanding the Potential Cost-Effectiveness of Options for Paraguay
to Meet Both Future Energy and Peak Power Needs, A Technical Report for the Government of Paraguay (New York City: Columbia University, 2021, forthcoming).
465 Ali Abid Hussain, Selim Jeddi, Kannan Lakmeeharan, and Hasan Muzaffar, “Unlocking Private-Sector Financing in Emerging-Markets Infrastructure,” McKinsey and Company, October 10, 2019, https://www.mckinsey.com/indus-tries/capital-projects-and-infrastructure/our-insights/unlocking-private-sector-financing-in-emerging-markets-infra-structure.
466 Hussain et al., “Unlocking Private-Sector Financing in Emerging-Markets Infrastructure.” 467 ANDE, Memoria Anual 2019.
164 Decarbonization Pathways for Paraguay’s Energy Sector
Decree No. 6092/2016 setting up the 2040 National Energy Policy provided an action plan that pro-poses the adoption of a law to regulate independent electricity generation. The goal of this new law would be to remove current restrictions on the distribution of surplus energy generated by solar pan-els to the network.468 The new law would also help address the requirement that IPPs charge ANDE tariff amounts that are much lower than standard IPPs’ cost of production. Additionally, Law No. 6324/2019 grants a sovereign guarantee to investors related to particular pro-jects for electricity transmission and distribution for ANDE. The maximum total amount of guarantees granted to projects under the law is USD 300 million, and the national government may approve the allocation of additional funding for projects if necessary. By allowing sovereign guarantees, this law expedites and promotes private funding for electricity infrastructure projects. This law works together with Law No. 5074/2013, the “turnkey” law, which ensures that private investors are paid for publicly procured infrastructure projects only after the work is completed. Combining these two laws, the risk is ultimately borne by the supplier, and the price is set at the beginning of the contract, two benefits for ANDE moving forward with private capital.469 Although these laws are promising, they require the country to build up its capacity in public procurement, and the government should note that the law on guarantees does not grant it sovereign immunity in the case of default. Despite these laws, private participation in the development of the electricity sector is minimal. For instance, no IPP projects for electricity generation have been approved to date. Although there is no immediate need for IPPs to enter the market because of the current excess in supply, Paraguay ought to consider IPPs for two main reasons. First, as the country’s demand approaches supply, public fund-ing for generation projects might take time or be too expensive to secure given ANDE’s growing debt (USD 1.4 billion as of April 2021).470 Second, IPPs can enable Paraguay to continue exporting electricity, which, if done at competitive prices, can provide another source of revenue for decarbonization. Green Bond Financing To assist in overcoming financial barriers, ANDE could issue green bonds as a financing mechanism. Unlike vanilla bonds, green bonds are usually asset-linked to environmentally friendly projects. For ANDE, financing renewable energy generation, transmission, and distribution with green bonds could provide an incentive for international investment in Paraguay’s green future. To this end, ANDE could usefully be audited and receive a credit rating, which does not currently exist because ANDE is financed to a large part by sovereign bonds. As a whole, the number of green bonds in Latin America has significantly increased in recent years.471 In particular, a number of utility companies throughout South America have adopted green bonds as
468 “Paraguay: Pioneer in Renewable and Hydroelectric Energy Supply,” Leading Edge, March 16, 2018,
https://www.leadingedgeguides.com/guide-paraguay-2018-hydroelectric-energy-supply/. 469 “Financiamiento Alternativo de Inversión Pública,” Sistema Nacional de Inversión Pública de Paraguay,
http://snip.hacienda.gov.py/Snip_Web/portal/financiamiento.html#:~:text=En%20este%20contexto%2C%20Para-guay%20ha%20promulgado%20dos%20leyes%3A&text=%2D%20Ley%20N%C2%BA%205074%2F13%3A,%22Pro-yectos%20Llave%20en%20Mano%22.
470 ABC Color, “Deuda de la ANDE asciende a US$ 1.402 millones.” 471 Climate Bonds Initiative, “Latin America & Caribbean: Green Finance State of the Market 2019” (Climate Bonds Initia-
tive, UNDP, and IDB, 2019), https://www.climatebonds.net/files/reports/cbi_lac_sotm_19_web_02.pdf.
165 Decarbonization Pathways for Paraguay’s Energy Sector
an additional financial mechanism. AES Gener, a Chilean electric utility company, issued USD 450 mil-lion in green bonds in 2019, using a portion of the proceeds to partially refinance the debt of its out-standing projects and to fund the acquisition of a 110 MW wind farm. Similar green bonds have been issued in Peru and Brazil, with interest increasing in Colombia as well.472 Although green bonds can be effective instruments for promoting sustainable infrastructural financ-ing,473 their rates might not be attractive to middle-income countries such as Paraguay compared with concessional loans from multilateral banks. However, evidence shows that green bonds are trading at lower yields (by 20–30 basis points) than conventional bonds on the primary market.474 Local currency bonds Local pension funds can also become actors of local financing for infrastructure and enable the reduc-tion of foreign exchange risk. However, local pension funds such as Caja Fiscal, dependent on the Min-istry of Finance for its investment strategy, are not leveraged for this purpose.475 The participation of pension funds and institutional investments in capital finance can enable the development of infra-structure project bonds, issued by a special-purpose vehicle for a stand-alone project and repaid from the cash flows of that project. In a number of countries, these bonds are tax-free and present a more attractive opportunity than bank deposits, in which institutional investors are usually invested.476 For ANDE, access to the domestic capital market will mitigate foreign exchange risk and probably lower the capital cost. Donors have facilities to assist governments in creating a liquid local government bond market, which would create higher confidence in the bond market for corporate bonds and pro-ject bonds to be issued.477
472 Fitch Wire, “Chilean Utility Green Bond Emerges With Focus On Climate Change,” FitchRatings, October 10, 2019,
https://www.fitchratings.com/research/corporate-finance/chilean-utility-green-bond-emerges-with-focus-on-cli-mate-change-10-10-2019.
473 Provided the green bonds are issued according to the Green Bond Principles, referenced here: “Green Bond Principles (GBP),” International Capital Market Association, https://www.icmagroup.org/sustainable-finance/the-principles-guidelines-and-handbooks/green-bond-principles-gbp/#:~:text=The%20Green%20Bond%20Principles%20(GBP,issu-ance%20of%20a%20green%20bond.
474 Julia Kapraun and Christopher Scheins, (In)-Credibly Green: Which Bonds Trade at a Green Bond Premium? (European Commission, 2019), https://ec.europa.eu/jrc/sites/jrcsh/files/4_2_kapraun_paper.pdf.
475 “Institutional Strengthening of the Pension Systems Under the Ministry of Finance,” Germany Trade and Invest (GTAI), 2020, https://www.gtai.de/resource/blob/220276/30da3d36b94ea537d1842c2d326ceb23/pro202002175011-data.pdf.
476 IMF and World Bank Group, “Staff Note for the G20 International Financial Architecture Working Group (IFAWG): Re-cent Developments on Local Currency Bond Markets in Emerging Economies” (Riyadh: World Bank Group, 2020), http://documents1.worldbank.org/curated/en/129961580334830825/pdf/Staff-Note-for-the-G20-International-Finan-cial-Architecture-Working-Group-IFAWG-Recent-Developments-On-Local-Currency-Bond-Markets-In-Emerging-Econ-omies.pdf.
477 Existing initiatives including the World Bank Group J-CAP Program, the Financial Sector Reform and Strengthening Initiative (FIRST), the IMF/World Bank’s Debt Management Facility II and III, and Switzerland’s Government Debt and Risk Management Program have recently bolstered technical assistance efforts in building government bond market in emerging or low-income countries. MDBs have even issued bonds in local currencies to catalyze the development of capital markets. Since 2005, the IADB has supported 175 transactions in a number of local currencies (Mexico, Co-lombia, Peru, Brazil, Chile, Uruguay, Costa Rica, Jamaica, Dominican Republic, Trinidad and Tobago), worth over USD 7.2 billion. IMF and World Bank Group, “Staff Note for the G20 International Financial Architecture Working Group (IFAWG).”
166 Decarbonization Pathways for Paraguay’s Energy Sector
7.3.3 Improving Regulatory Framework for Sustainable Finance
Paraguay has recently seen a strong resurgence in economic productivity, slightly stifled in 2019 due to spillover effects from Argentina that led to near-zero GDP growth. In the relatively riskier era be-tween 2003 and 2008, Paraguay consolidated its banking sector, forcing problematic banks to either close or significantly scale down. As a result, confidence in local financial markets has allowed for a significant deepening of financial mechanisms, as evidenced by an increase in the credit-to-GDP ratio by nearly 20% between 2010 and 2020.478 As a result of this consolidation, the loan delinquency rate significantly dropped in mid-2004 and has since remained relatively low (up to 3%). Paraguay maintains a fairly stable domestic market for in-vestment and the use of local bank funding for projects such as infrastructure development.479 For Paraguay to achieve net decarbonization by 2050, both financial stability and a strong market for private investment will be critical. However, without a well-regulated financial structure attuned to sustainability, Paraguay will have a difficult time bending the private sector toward compliance. Finan-cial regulation can play a role in assisting the transition to decarbonization. Six key categories of reg-ulatory instruments provide the expected impacts of promoting this decarbonization, highlighted in Table 36 below.
478 Bas Bakker, Natasha Che, and Alex Ho, Paraguay: Selected Issues (Washington D.C.: IMF, 2019),
https://www.imf.org/en/Publications/CR/Issues/2019/04/30/Paraguay-Selected-Issues-46839. 479 Bakker et al., Paraguay: Selected Issues.
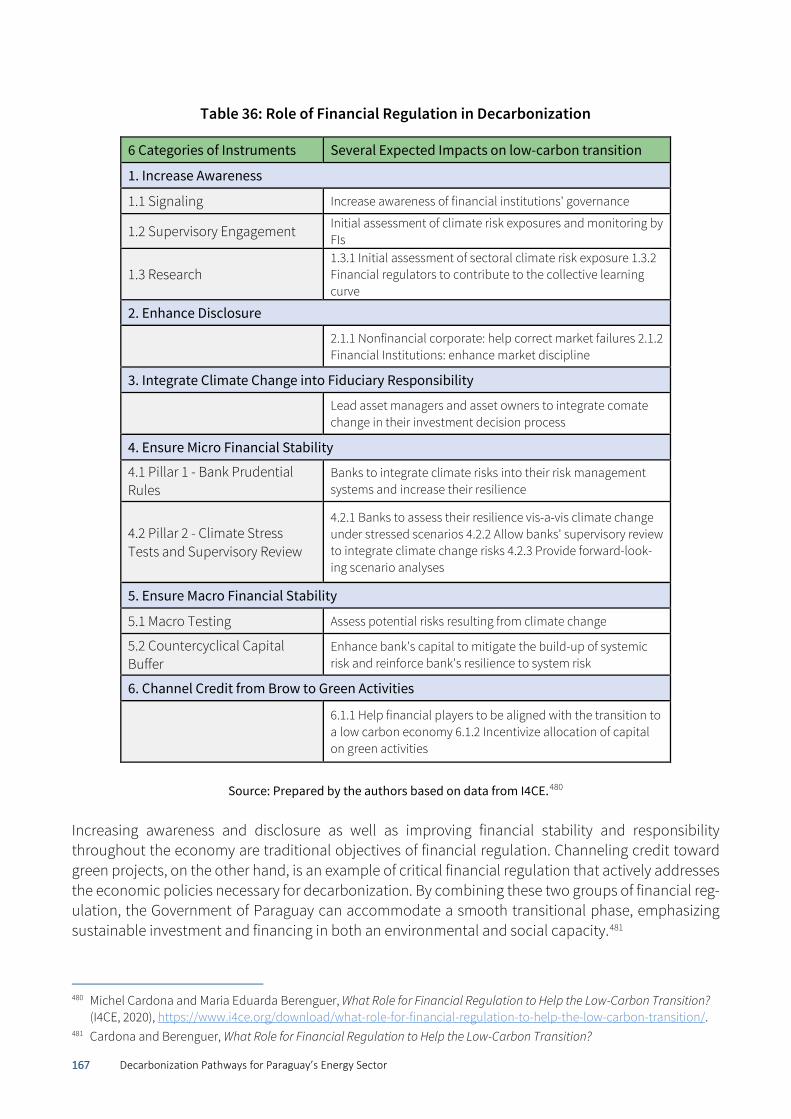
167 Decarbonization Pathways for Paraguay’s Energy Sector
Table 36: Role of Financial Regulation in Decarbonization
6 Categories of Instruments Several Expected Impacts on low-carbon transition
1. Increase Awareness
1.1 Signaling Increase awareness of financial institutions' governance
1.2 Supervisory Engagement Initial assessment of climate risk exposures and monitoring by FIs
1.3 Research 1.3.1 Initial assessment of sectoral climate risk exposure 1.3.2 Financial regulators to contribute to the collective learning curve
2. Enhance Disclosure
2.1.1 Nonfinancial corporate: help correct market failures 2.1.2 Financial Institutions: enhance market discipline
3. Integrate Climate Change into Fiduciary Responsibility
Lead asset managers and asset owners to integrate comate change in their investment decision process
4. Ensure Micro Financial Stability
4.1 Pillar 1 - Bank Prudential Rules
Banks to integrate climate risks into their risk management systems and increase their resilience
4.2 Pillar 2 - Climate Stress Tests and Supervisory Review
4.2.1 Banks to assess their resilience vis-a-vis climate change under stressed scenarios 4.2.2 Allow banks' supervisory review to integrate climate change risks 4.2.3 Provide forward-look-ing scenario analyses
5. Ensure Macro Financial Stability
5.1 Macro Testing Assess potential risks resulting from climate change
5.2 Countercyclical Capital Buffer
Enhance bank's capital to mitigate the build-up of systemic risk and reinforce bank's resilience to system risk
6. Channel Credit from Brow to Green Activities
6.1.1 Help financial players to be aligned with the transition to a low carbon economy 6.1.2 Incentivize allocation of capital on green activities
Source: Prepared by the authors based on data from I4CE.480
Increasing awareness and disclosure as well as improving financial stability and responsibility throughout the economy are traditional objectives of financial regulation. Channeling credit toward green projects, on the other hand, is an example of critical financial regulation that actively addresses the economic policies necessary for decarbonization. By combining these two groups of financial reg-ulation, the Government of Paraguay can accommodate a smooth transitional phase, emphasizing sustainable investment and financing in both an environmental and social capacity.481
480 Michel Cardona and Maria Eduarda Berenguer, What Role for Financial Regulation to Help the Low-Carbon Transition?
(I4CE, 2020), https://www.i4ce.org/download/what-role-for-financial-regulation-to-help-the-low-carbon-transition/. 481 Cardona and Berenguer, What Role for Financial Regulation to Help the Low-Carbon Transition?
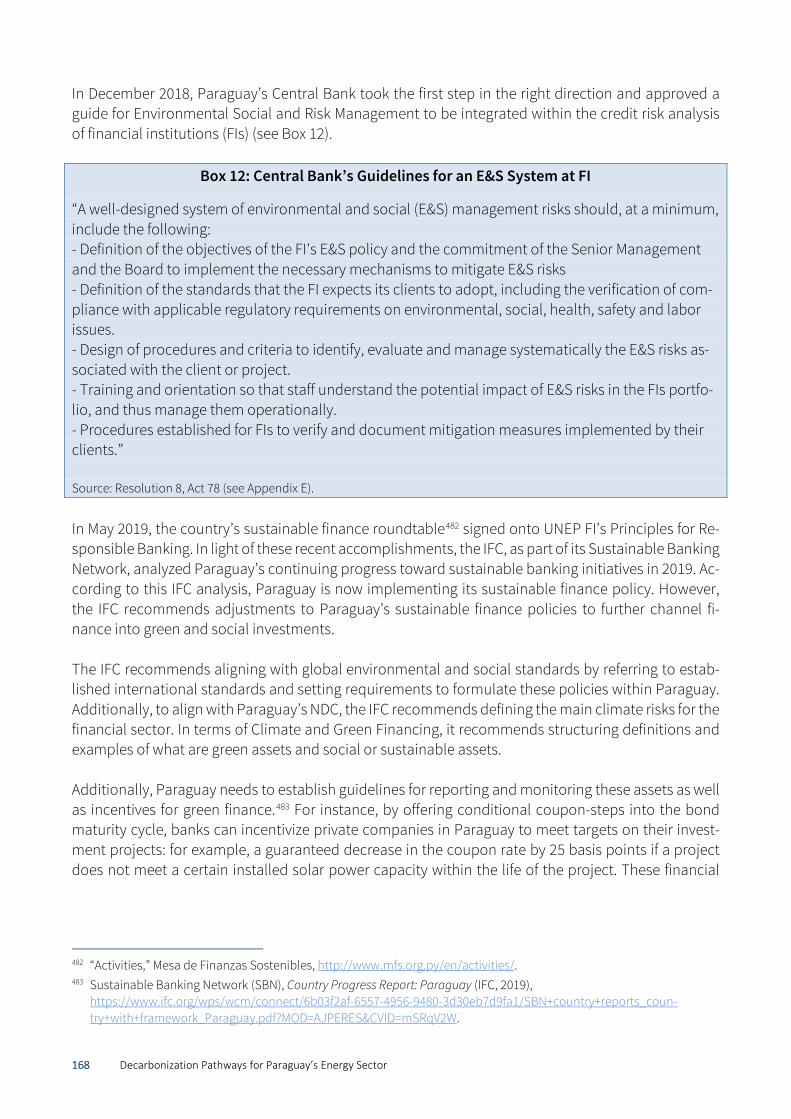
168 Decarbonization Pathways for Paraguay’s Energy Sector
In December 2018, Paraguay’s Central Bank took the first step in the right direction and approved a guide for Environmental Social and Risk Management to be integrated within the credit risk analysis of financial institutions (FIs) (see Box 12).
Box 12: Central Bank’s Guidelines for an E&S System at FI
“A well-designed system of environmental and social (E&S) management risks should, at a minimum, include the following: - Definition of the objectives of the FI's E&S policy and the commitment of the Senior Management and the Board to implement the necessary mechanisms to mitigate E&S risks - Definition of the standards that the FI expects its clients to adopt, including the verification of com-pliance with applicable regulatory requirements on environmental, social, health, safety and labor issues. - Design of procedures and criteria to identify, evaluate and manage systematically the E&S risks as-sociated with the client or project. - Training and orientation so that staff understand the potential impact of E&S risks in the FIs portfo-lio, and thus manage them operationally. - Procedures established for FIs to verify and document mitigation measures implemented by their clients.” Source: Resolution 8, Act 78 (see Appendix E).
In May 2019, the country’s sustainable finance roundtable482 signed onto UNEP FI’s Principles for Re-sponsible Banking. In light of these recent accomplishments, the IFC, as part of its Sustainable Banking Network, analyzed Paraguay’s continuing progress toward sustainable banking initiatives in 2019. Ac-cording to this IFC analysis, Paraguay is now implementing its sustainable finance policy. However, the IFC recommends adjustments to Paraguay’s sustainable finance policies to further channel fi-nance into green and social investments. The IFC recommends aligning with global environmental and social standards by referring to estab-lished international standards and setting requirements to formulate these policies within Paraguay. Additionally, to align with Paraguay’s NDC, the IFC recommends defining the main climate risks for the financial sector. In terms of Climate and Green Financing, it recommends structuring definitions and examples of what are green assets and social or sustainable assets. Additionally, Paraguay needs to establish guidelines for reporting and monitoring these assets as well as incentives for green finance.483 For instance, by offering conditional coupon-steps into the bond maturity cycle, banks can incentivize private companies in Paraguay to meet targets on their invest-ment projects: for example, a guaranteed decrease in the coupon rate by 25 basis points if a project does not meet a certain installed solar power capacity within the life of the project. These financial
482 “Activities,” Mesa de Finanzas Sostenibles, http://www.mfs.org.py/en/activities/. 483 Sustainable Banking Network (SBN), Country Progress Report: Paraguay (IFC, 2019),
https://www.ifc.org/wps/wcm/connect/6b03f2af-6557-4956-9480-3d30eb7d9fa1/SBN+country+reports_coun-try+with+framework_Paraguay.pdf?MOD=AJPERES&CVID=mSRqV2W.
169 Decarbonization Pathways for Paraguay’s Energy Sector
incentives from a burgeoning private sector in Paraguay will help to move toward a higher level of sustainability.484 The IFC also recommends establishing strong centralized governance to oversee ESG integration and disclosure.485
7.3.4 Deploying Paraguay-tailored Carbon Pricing
Fuel Tax Worldwide, there are now 64 carbon pricing initiatives (three times more than ten years ago) that are either implemented or scheduled, covering 22% of global GHG emissions (nearly 5 times more than ten years ago).486 In Latin America, five countries have developed carbon fuel taxes: Argentina, Chile, Co-lombia, Costa Rica, and Mexico. Although Chile’s carbon tax does not apply to liquid fuels, Argentina, Colombia, Costa Rica, and Mexico all have liquid fuel taxes that constitute a portion of their carbon pricing policies. These fuel taxes, which are added onto the cost of fuel at the pump per liter, are in-tended to provide an incentive to decrease fuel consumption. Prices vary based on the country: a tax of approximately USD 0.33 per liter in Costa Rica,487 USD 0.12 per liter in Argentina,488 USD 0.05 per liter in Colombia,489 and USD 0.02 per liter in Mexico.490 Should Paraguay pursue a fuel tax to mitigate GHG emissions, considerable analysis is required to set an appropriate fuel tax rate that is high enough to provoke behavioral change and low enough to be politically feasible.491 Cap and Trade Cap-and-trade systems limit the total amount of GHG emissions available. Consequently, for private entities to emit GHG, they must obtain (whether by auction, free allocation, or trade) emission certifi-cates. Paraguay’s current cap-and-trade system allows for environmental-based certificates but does not set a cap; there is no real incentive to trade certificates, nor is there a means by which the Govern-ment of Paraguay can recoup revenue from the auction and sale of certificates. If the cap-and-trade system for environmental certificates is reformed (see Chapter 5) to be made more effective, the cer-tificates could be distributed through auctions, which could raise state revenues.
484 Mauricio Cárdenas and Juan José Guzmán Ayala, Planning A Sustainable Post-Pandemic Recovery In Latin America And
The Caribbean (UNDP, 2020), https://www.latinamerica.undp.org/content/rblac/en/home/library/crisis_preven-tion_and_recovery/planeando-una-recuperacion-sostenible-para-la-pospandemia-en-ame.html.
485 Sustainable Banking Network, Country Progress Report: Paraguay. 486 Marissa Santikarn, Angela Kallhauge, Suneira Rana, Daniel Besley, Joseph Pryor, Maurice Quant, Long Lam, Jialiang
Zhang, Louis Mark, Cara Merusi, and Ian Trim, State and Trends of Carbon Pricing 2020 (Washington D.C.: World Bank, 2020), https://openknowledge.worldbank.org/bitstream/handle/10986/33809/9781464815867.pdf?sequence=4&isAl-lowed=y.
487 The average diesel and gasoline using July 13, 2021 exchange rate can be found here: http://www.pgrweb.go.cr/SCIJ/Busqueda/Normativa/Normas/nrm_texto_com-pleto.aspx?param1=NRTC&nValor1=1&nValor2=46631&nValor3=99456&strTipM=TC.
488 OECD, “Taxing Energy Use 2019: Country Note – Argentina” (OECD, 2019), https://www.oecd.org/countries/argen-tina/taxing-energy-use-argentina.pdf.
489 OECD, “Taxing Energy Use 2019: Country Note – Colombia” (OECD, 2019), https://www.oecd.org/countries/argen-tina/taxing-energy-use-colombia.pdf.
490 OECD, “Taxing Energy Use 2019: Country Note – Mexico” (OECD, 2019), https://www.oecd.org/countries/argen-tina/taxing-energy-use-mexico.pdf.
491 As discussed in Conference on “Recuperaction Verde - Apertura,” June 24, 2021, Panel: Como financiar cuando no hay espacio fiscal.
170 Decarbonization Pathways for Paraguay’s Energy Sector
Colombia is the only known country to conduct the process in Latin America. The power utility, EPM, auctioned 20 blocks of 100,000 emissions reduction certificates for a total of 2 million tons of CO2e in late March 2021. The resulting proceeds will help to offset the infrastructure and maintenance costs associated with the new 2,400 MW Ituango hydroelectric facility. A similar structure would help source revenue for further infrastructure development in Paraguay.492
To make a fuel tax and a stricter auctionable cap-and-trade system of environmental certificates po-litically feasible, the proceeds should be redistributed to households, as is already implemented in Canada493 or Costa Rica.494 The redistribution could incentivize the purchase of efficient home appli-ances or encourage landowners to protect forests (see Box 13).
Box 13: Costa Rica: Recycling Fuel Tax into Fiscal Allocation to Protect Forests
Costa Rica created the National Forest Fund (FONAFIFO)495 to invest the money raised by the fossil fuel tax into mature forest conservation efforts, reforestation using native or exotic species, and agrofor-estry systems that use a mix of trees and crops or grasslands. As of 2020, annual funds generated from fossil fuel taxes amount to USD 26.5 million and are disbursed to roughly 18,000 people, including Indigenous populations.496 From having the highest deforestation rate in the world in the 1980s, Costa Rica managed to double the forest cover between 1986 and 2013.497 Paraguay could also leverage the World Bank’s Climate Auctions Programs to incentivize Paraguay-based companies to reduce emissions. The World Bank’s Climate Auctions Program provides a Cli-mate Auction Model as a framework component of its Pilot Auction Facility (PAF), a suite of pilot tools and techniques for emerging countries interested in incentivizing companies to adopt climate action–oriented practices. The model consists of three main elements: 498 1. A set of price guarantees for future climate results to be determined by auction. In essence, this
allows private companies to sell certificates that were purchased at auction back to the PAF at a predetermined price so as to maintain certificate liquidity.
492 Bnamericas, “EPM will contribute to Offset 2 million tons of CO2 with the Auction of Emission Reduction Certificates,”
press release, March 11, 2021, https://www.bnamericas.com/en/news/epm-will-contribute-to-offset-2-million-tons-of-co2-with-the-auction-of-emission-reduction-certificates.
493 United States Environmental Protection Agency Office of Air and Radiation, Tools of the Trade: A Guide to Designing and Operating a Cap and Trade Program for Pollution Control (EPA, 2003), https://www.epa.gov/sites/produc-tion/files/2016-03/documents/tools.pdf; Dana Krechowicz, “The Effect of Carbon Pricing on Low-Income Households, and Its Potential Contribution to Poverty Reduction” (Sustainable Prosperity, 2011), https://institut.intellipros-perite.ca/sites/default/files/effect-carbon-pricing-low-income-households-and-its-potential-contribution-poverty-reduction.pdf.
494 Edward B. Barbier, Ricardo Lozano, Carlos Manuel Rodríguez, and Sebastian Troeng, “Adopt a Carbon Tax to Protect Tropical Forests,” Nature (February 12, 2020), https://www.nature.com/articles/d41586-020-00324-w.
495 “FONAFIFO,” Fonafio, http://www.fonafifo.go.cr. 496 Kiley Price, “Time for a Tropical Carbon Tax, Experts Say,” Conservation.org, February 12, 2020, https://www.conserva-
tion.org/blog/time-for-a-tropical-carbon-tax-experts-say#:~:text=Driven%20by%20agriculture%20and%20log-ging,have%20charted%20a%20different%20course.
497 Barbier et al., “Adopt a Carbon Tax to Protect Tropical Forests.” 498 World Bank, “Climate Auctions Program,” The World Bank, 2021, https://www.worldbank.org/en/programs/climate-
auctions-program.
171 Decarbonization Pathways for Paraguay’s Energy Sector
2. Funds are only disbursed once the climate results are independently verified. 3. Risk is shared between the public and private sectors in such a way that private sector certificate
buyers must pay upfront for certificates before the price guarantee is set. This provides a greater incentive to follow through on emissions reductions and climate results.
7.3.5 Assessing the Fiscal Space for Bond Issuance in Post-COVID-19
In response to the COVID-19 pandemic, the Government of Paraguay suspended the application of some provisions of the FRL, instead supporting a fiscal package equivalent to 4% of the country’s GDP. In doing so, the country allocated emergency funding for fiscal relief from the economic distress re-sulting from the COVID-induced shutdowns. The distribution was done according to Law No. 6524/2020 and includes a budget of USD 1.6 billion (PYG 10.211 billion).499 The recovery package does not include any provision to promote green growth, which is a missed opportunity for decarbon-ization.500 The effects of the COVID-19 pandemic have caused the fiscal deficit to increase from 2.8% in 2019501 to 6.5% of GDP in 2020, according to the IMF.502 Authorities plan to reduce this number to below the 1.5% of GDP ceiling after the pandemic is over. Specifically, authorities intend to return to 3% of GDP by 2021, 2% by 2022, and 1.5% by 2023. Although the Economic Emergency law of March 16, 2020, re-quires a return to the 1.5% threshold by 2024, the Government of Paraguay is heavily investing in re-turning the fiscal deficit to 1.5% by 2023, one year sooner.503 To accomplish this, the IMF and other international development finance institutions (World Bank, IADB, and CAF) are pledging emergency support to counteract the deficit incurred as a result of the pandemic. For example, the IMF is pledging SDR 201.4 million to this effort, 23% of the anticipated and experienced deficit.504 In the short term, to adjust budgets and minimize the COVID-induced deficit, the Government of Par-aguay temporarily capped wages to all public sector members at PYG 37 million (approximately USD 5,700 per month) and implemented wage cuts of 10% and 20% for public employees who have salaries higher than five and ten times the minimum wage, respectively. In total, these measures are
499 “Los recursos publicos son del pueblo paraguayo,” Rindiendo Cuentas al pueblo paraguayo, https://www.rindien-
docuentas.gov.py. 500 As discussed in Conference on “Recuperaction Verde – Apertura,” June 24, 2021, Panel: En qué enfocarse en la recu-
peración: Experiencia regional. 501 Fitch Wire, “Paraguay Fiscal Rule Suspension May Herald Permanent Changes,” FitchRatings, April 22, 2020,
https://www.fitchratings.com/research/sovereigns/paraguay-fiscal-rule-suspension-may-herald-permanent-changes-22-04-2020#:~:text=A%20severe%20drought%20as%20well,5.9%25%20of%20GDP%20in%202020.
502 IMF Staff, “Paraguay: Staff Concluding Statement of the 2020 Article IV Mission,” IMF, news release, November 17, 2020, https://www.imf.org/en/News/Articles/2020/11/17/mcs111720-paraguay-staff-concluding-statement-of-the-2020-article-iv-mission.
503 IMF, Paraguay: Request for Purchase Under the Rapid Financing Instrument—Press Release; Staff Report; and Statement by the Executive Director for Paraguay, Country Report No. 20/127 (Washington D.C.: IMF, 2020), https://www.imf.org/en/Publications/CR/Issues/2020/04/22/Paraguay-Request-for-Purchase-Under-the-Rapid-Fi-nancing-Instrument-Press-Release-Staff-49359.
504 IMF, Paraguay: Request for Purchase Under the Rapid Financing Instrument.
172 Decarbonization Pathways for Paraguay’s Energy Sector
expected to save USD 52 million.505 In addition, the government expects to boost tax revenue by 0.1% of GDP in 2020 and 0.7% of GDP by 2023, but the IMF suggests that this might not be enough.506
Although an increasing fiscal deficit may be undesirable, the pandemic has also helped to highlight the strength of Paraguay on the bond market. In April 2020, Paraguay sold USD 1 billion in sovereign bonds. At a 10-year maturity and a yield of 4.95%, these bonds were oversubscribed seven times.507 This marked the second time in 2020 that Paraguay successfully entertained the bond market, the first time in January 2020 obtaining USD 450 million in financing.508 Paraguay’s strength in the bond market is critical to contemplating issuing more bonds to finance decarbonization and ensure a green recov-ery from COVID-19. Although ANDE could issue green bonds to generate additional financing for the electrification of the economy, as mentioned above, concessional financing from DFIs (e.g., CAF and IBD) should continue to be prioritized. Enabling Paraguay to borrow “at the same scale relative to GDP and on approximately the same interest rate terms as the rich countries” will require MDBs such as CAF and IDB to support long-term development finance, by taking advantage of their highly favorable market term (such as long maturities and low interest rates) and passing them on to Paraguay as a recipient country.509
To stimulate the post-COVID-19 global recovery, high-income countries have been able to finance enormous budget deficits (in the United States, approximately 15% of GDP in 2020 and 2021) at very low interest rates, which has not been possible for developing countries. Extending the creditworthi-ness of the high-income countries to the developing countries will mainly involve strengthening the balance sheets of the MDBs so that they can substantially increase their flow of financing for green and digital recovery. To be clear, it means that Paraguay’s partners, including the United States, the Euro-pean Union, China, Japan, and others, should substantially increase their paid-in capital to CAF and IDB so that they can spearhead a massive increase of financing for renewable energy and digitalization in Latin America in general and Paraguay in particular. Other means—SDG-linked bonds (see below), debt relief, debt-for-SDG swaps, bilateral development aid, impact investing, foreign direct invest-ment, public-private partnerships, blended project financing, and other kinds of risk-sharing—should be deployed alongside the higher flows from CAF and IDB.510
505 Laura Gamba, “Paraguay to Cut Public Sector Wages over COVID-19,” AA, March 31, 2020,
https://www.aa.com.tr/en/americas/paraguay-to-cut-public-sector-wages-over-covid-19/1785779. 506 IMF, Paraguay: Request for Purchase Under the Rapid Financing Instrument. 507 Jo Bruni and Charles Newbery, “Paraguay Comes to Bond Market for Coronavirus Funding,” LatinFinance, April 24,
2020, https://www.latinfinance.com/daily-briefs/2020/4/24/paraguay-comes-to-bond-market-for-coronavirus-fund-ing.
508 Bruni and s Newbery, “Paraguay Comes to Bond Market for Coronavirus Funding.” 509 Jeffrey Sachs, Christian Kroll, Guillaume Lafortune, Grayson Fuller, and Finn Woelm, Sustainable Development Report
2021: The Decade of Action for the Sustainable Development Goals (Cambridge: Cambridge University Press, June 2021), 6–7, https://www.sustainabledevelopment.report/reports/sustainable-development-report-2021.
510 Adapted from Jeffrey Sachs, Perrine Toledano, Martin Dietrich Brauch, Tehtena Mebratu-Tsegaye, Efosa Uwaifo, Roadmap to Zero-Carbon Electrification of Africa by 2050: The Green Energy Transition and the Role of the Natural Re-source Sector (minerals, fossil fuels, and land), prepared for the African Natural Resources Center of the African Devel-opment Bank, forthcoming 2021.
173 Decarbonization Pathways for Paraguay’s Energy Sector
SDG-Linked Bonds One alternative to standard or green bonds are SDG-linked bonds, which are linked to particular Sus-tainable Development Goals and targets approved by the United Nations. Multilateral and regional development banks would contribute concessional capital to buy the bonds and offer partial guaran-tees to private investors511 to reduce the risk associated with the bonds.512 The SDG bond package could also include technical assistance to ensure capacity to identify the coun-try’s alignment with the SDGs and methodologies for measuring progress.513 The Government of Mexico issued seven-year SDG bonds for USD 890 million in September 2020. SDG bond issuances will finance projects located in 1,345 vulnerable municipalities in the country selected because of their low literacy and school attendance rates, high level of health services deprivation, lack of toilets, drainage or piped water in houses, and absence of electricity access or basic equipment such as refrigerators. It will involve the UN Development Program (UNDP), which worked with Mexico on its SDG budget mapping.514
7.3.6 Preparing the Economy to Seize the Windfall of the Green Economy Growth Potential
Although financially preparing for the arrival and establishment of the decarbonization energy transi-tion in Paraguay is important, the transition itself has significant potential to improve the economy at large if the workforce is prepared to seize the opportunity. In a 2018 report, IRENA identified Latin America (excluding Brazil) as the fifth-highest region in the world for GDP growth from a decarboniza-tion-based energy transition. By 2050, IRENA estimates that Latin American countries could experience additional growth in GDP of up to 1.7% when targeting carbon neutrality by 2050 as compared with a business-as-usual scenario based on the implementation of current energy policies. In addition, com-pared with this business-as-usual scenario, Latin American countries can expect a 14% increase in welfare impact515 and a 0.7% increase in total employment.516 This growth will naturally provide new government revenues through higher taxes to finance the decarbonization. To ensure inclusive green growth, Paraguay should enact labor and education policies for retraining and upskilling and provide financial assistance to support those who stand to lose because of the transition, particularly in fossil fuel–dependent sectors. 511 As discussed in Conference on “Integración Energética Regional,” June 23, 2021, Panel: Financiando la integración
regional. 512 Cardenas and Ayala, Planning a Sustainable Post-Pandemic Recovery in Latin America and the Caribbean. 513 Cardenas and Ayala, Planning a Sustainable Post-Pandemic Recovery in Latin America and the Caribbean. 514 International Institute for Sustainable Development (IISD), “Mexico Issues Sovereign SDG Bond for Most Vulnerable
Municipalities,” IISD: SDG Knowledge Hub, September 22, 2020, https://sdg.iisd.org/news/mexico-issues-sovereign-sdg-bond-for-most-vulnerable-municipalities.
515 As measured by the economic indicators—total employment (direct, indirect and induced), consumption and invest-ment (i.e., current expenditure plus the future benefits of improved capital stock)—the social indicators—total (public and private) expenditure in education, and (reduction of) health impacts from air pollution—the environmental indi-cators—(reduction of) GHG emissions and the depletion of natural resources through consumption of materials (measured in direct material consumption of minerals and biomass for food and feed, excluding fossil fuel energy resources). IRENA, Global Energy Transformation: A Roadmap to 2050 (Abu Dhabi: IRENA, 2018), https://www.irena.org/-/media/Files/IRENA/Agency/Publication/2018/Apr/IRENA_Report_GET_2018.pdf.
516 IRENA, Global Energy Transformation: A Roadmap to 2050.
174 Decarbonization Pathways for Paraguay’s Energy Sector
Summary of Findings and Recommendations
1. Better revenue management systems, including improved revenue spending and procurement mechanisms and an enhanced capacity to invest, need to be established to guarantee transpar-ency and provide monitoring opportunities at national and subnational levels to avoid both public money leakages and reestablish trust in government institutions. Initiatives to earmark infrastruc-ture and human capital spending from electricity exports are commendable, but they need to be executed in a transparent way to guarantee checks and balances.
2. In building a financing program for decarbonization, the government should conduct a complete
review of revenue collection avenues: a. Accounting for the additional revenue resulting from increased electrification associated with
electrification as well as the savings from energy efficiency measures (e.g., reducing distribu-tion losses and mainstreaming adoption of efficient home appliances).
b. Conducting a fiscal review involving the analysis of 1) the necessity of current tax incentives to attract investment, 2) the feasibility to increase domestic taxation in a targeted manner (in-cluding through a fuel tax and a cap-and-trade system of environmental certificates with an auctioning mechanism), and 3) the additional regulatory reforms necessary to both formalize the economy and improve tax compliance.
c. Building on its financial credibility in the bond market to carefully consider issuing more bonds
and prioritize additional concessional lending from Paraguay’s donors and partners (CAF, IDB, World Bank) in the COVID-19 recovery phase. Issuing sustainability and green bonds might drain additional financing from multilaterals. This measure will involve working with Para-guay’s high-income country partners to ensure that MDBs such as CAF and IDB support long-term development finance by taking advantage of their highly favorable market terms (such as long maturities and low interest rates) and passing them on to Paraguay as a recipient country, thereby enabling Paraguay to borrow at a scale and terms similar to those enjoyed by devel-oped countries.
d. Having a clear financing strategy for the decarbonization could also help the government nav-igate political dynamics and ensure that the full amortization of Itaipú’s debt is not translated into lower consumer tariffs to the domestic economy. Reaping fiscal benefits (over 2% of GDP according to the IMF) or increasing the budget of ANDE would be a better avenue to support the domestic economy as these funds could be allocated to decarbonization.
3. Reviewing the institutional and legal frameworks to effectively attract and reduce risk for private
sector investment in the electricity and green energy sector as well as implementing and expand-ing the central bank’s guideline for sustainable finance to orient private sector investment would also be a necessary effort. In particular, the use of green and SDG bonds will help direct private funding into more sustainability-focused infrastructure investment projects. Emphasizing contin-gent coupon rates based on sustainability thresholds will force compliance on private sector in-dustries within Paraguay. As the latest IEA report on the energy transition explains, “mobilizing the
175 Decarbonization Pathways for Paraguay’s Energy Sector
capital for large‐scale infrastructure calls for closer co‐operation between developers, investors, public financial institutions and governments.”517
4. To guide government spending, this report recommends that Paraguay adopt a 30-year strategic
financing plan for the decarbonization of the country, proceeding from a macro-economic exercise seeking to prioritize investment and devising associated fiscal policies. All communities of Para-guay, both urban and rural, should be consulted and have their concerns appropriately addressed. Targets should be set in increments of 10 years. The Medium-Term Expenditure Framework pro-moted by the FRL should be used to guide coherent planning with the budgeting process and make budget allocation decisions more accountable, transparent, and predictable. The plan should put education and development of the energy transition–related skills at its core.
517 IEA, Net Zero by 2050, 21.
11
ccsi.columbia.edu
Columbia Center on Sustainable Investment
Jerome Greene Hall435 West 116th StreetNew York, NY 10027Phone: +1 (212) 854-1830Email: [email protected]
Please cite as:
Columbia Center on Sustainable Investment (CCSI), Quadracci Sustainable Engineering Lab at Columbia University, and Centro de Recursos Naturales, Energía y Desarrollo (CRECE). Decarbonization Pathways for Paraguay’s Energy Sector. New York: CCSI, November 2021, http://ccsi.columbia.edu/content/paraguay-energy.
Published by the Columbia Center on Sustainable Investment, a leading applied research center and forum dedicated to the study, discussion and practice of sustainable international investment.