debugging with gdb - vancouver island university
TRANSCRIPT
Debugging with GDB
Humayun KabirProfessor, CS, Vancouver Island University, BC, Canada
GDB
GDB is the GNU Project debugger
GDB provides some helpful functionality Run programs
Make the program stops on specified places or on specified conditions
Give information about current variables’ values, the memory and the stack
Let you examine the program execution step by step -stepping
Let you examine the change of program variables’ values -tracing
GDB is a command-line program
GDB
To be able to debug your program, you must compile it with the -g option (creates the symbol table) !
g++ -Wall –g –o my_prog my_prog.c
g++ -Wall –ggdb –o my_prog my_prog.c
To start gdb with your program type:
>gdb my_prog
You can also start GDB without your program and then load it later using gdb file command >gdb
(gdb) file my_prog
You can quit from GDB using its quit command (gdb) quit
GDB
When gdb starts, your program is not actually running.
You have to use the run command to start execution.
Before you do that, you should place some break points.
Once you hit a break point, you can examine any variable.
GDB – Running Programs
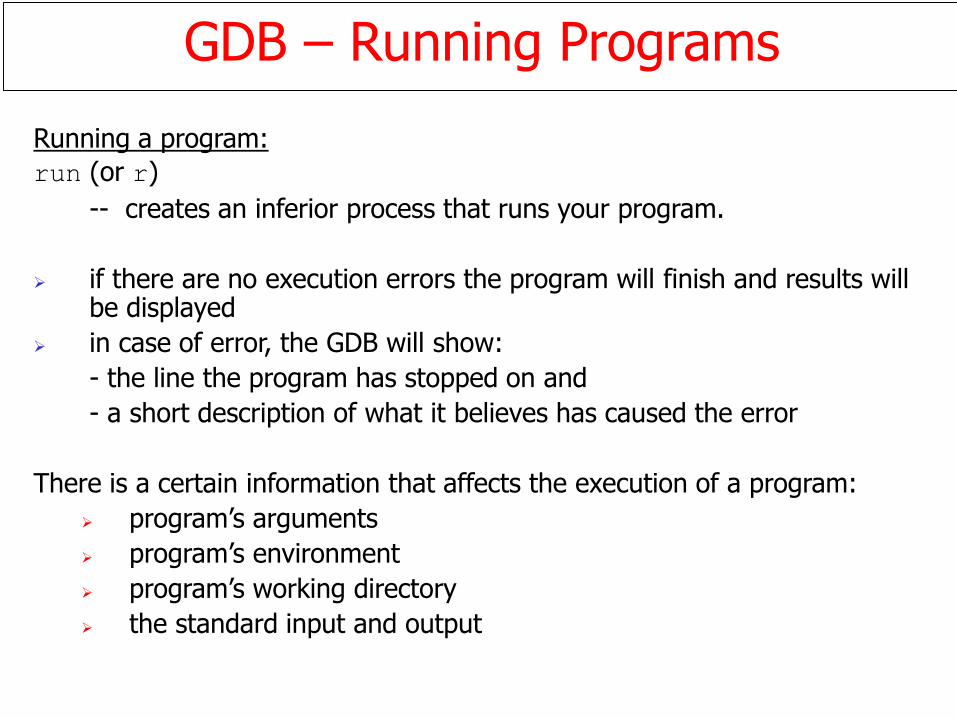
Running a program:
run (or r)
-- creates an inferior process that runs your program.
if there are no execution errors the program will finish and results will be displayed
in case of error, the GDB will show:
- the line the program has stopped on and
- a short description of what it believes has caused the error
There is a certain information that affects the execution of a program:
program’s arguments
program’s environment
program’s working directory
the standard input and output
GDB – Program’s arguments
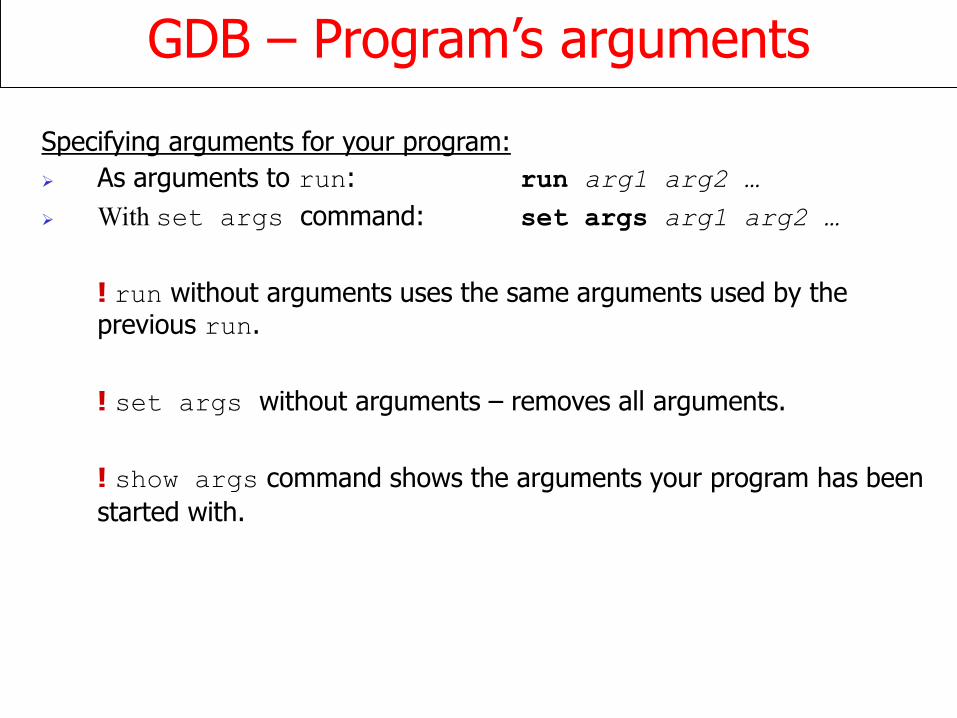
Specifying arguments for your program:
As arguments to run: run arg1 arg2 …
With set args command: set args arg1 arg2 …
! run without arguments uses the same arguments used by the previous run.
! set args without arguments – removes all arguments.
! show args command shows the arguments your program has been
started with.
GDB – Program’s environment
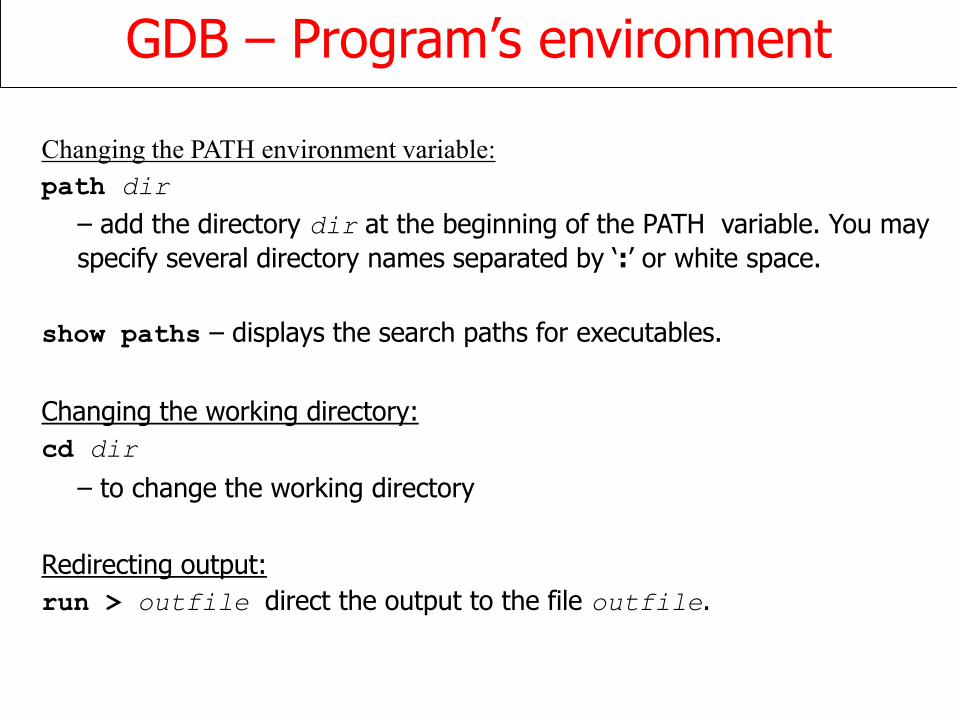
Changing the PATH environment variable:
path dir
– add the directory dir at the beginning of the PATH variable. You may
specify several directory names separated by ‘:’ or white space.
show paths – displays the search paths for executables.
Changing the working directory:
cd dir
– to change the working directory
Redirecting output:
run > outfile direct the output to the file outfile.
Debugging an already-running process
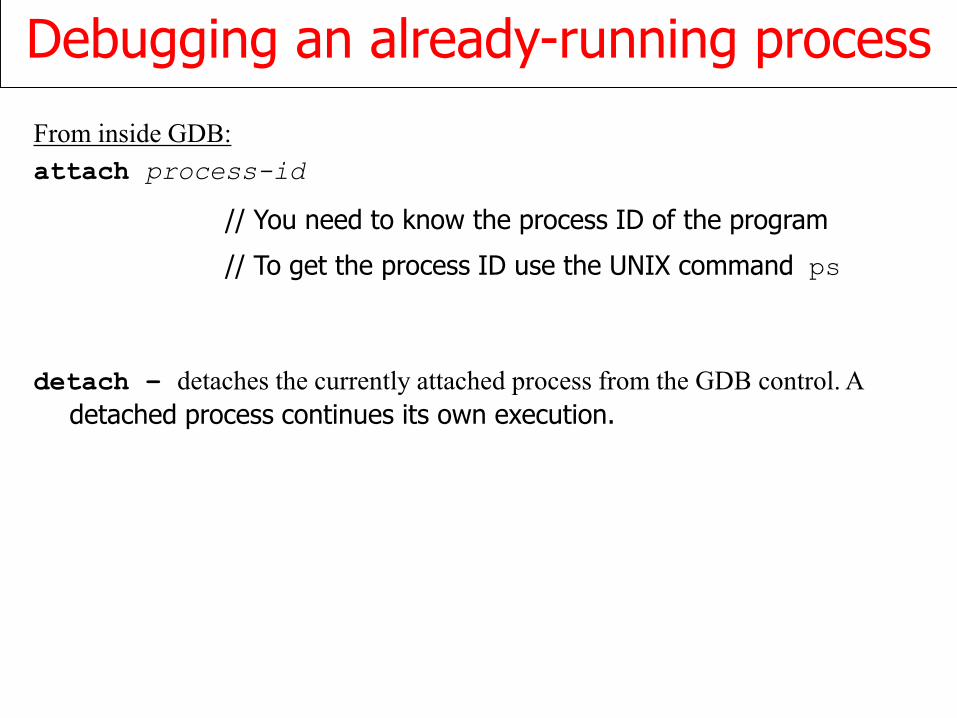
From inside GDB:
attach process-id
// You need to know the process ID of the program
// To get the process ID use the UNIX command ps
detach – detaches the currently attached process from the GDB control. A
detached process continues its own execution.
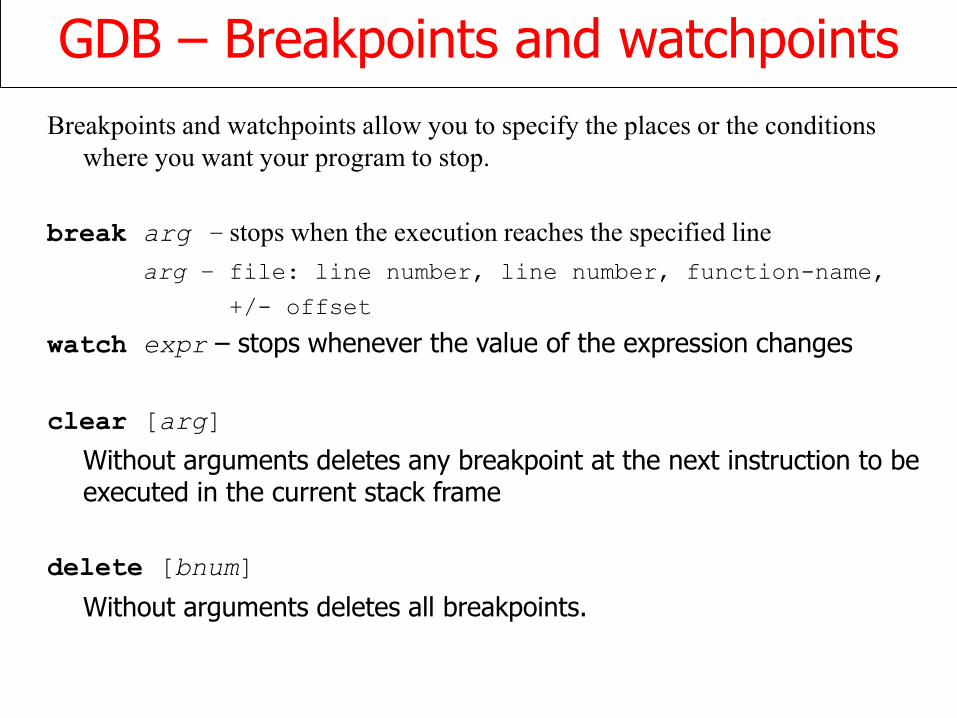
GDB – Breakpoints and watchpoints
Breakpoints and watchpoints allow you to specify the places or the conditions
where you want your program to stop.
break arg – stops when the execution reaches the specified line
arg – file: line number, line number, function-name,
+/- offset
watch expr – stops whenever the value of the expression changes
clear [arg]
Without arguments deletes any breakpoint at the next instruction to be executed in the current stack frame
delete [bnum]
Without arguments deletes all breakpoints.
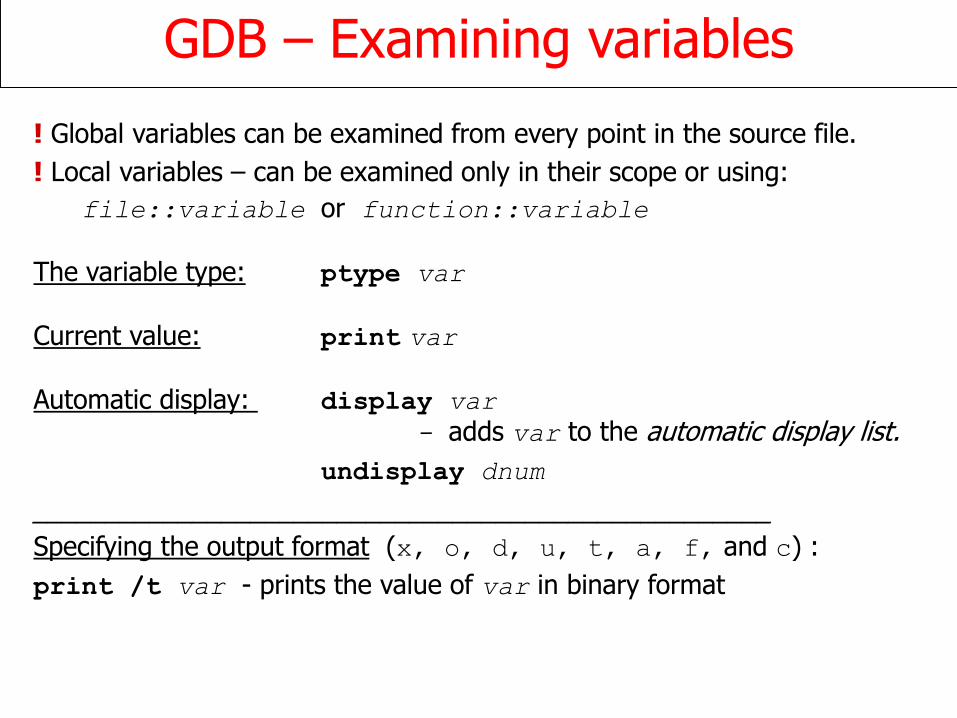
GDB – Examining variables
! Global variables can be examined from every point in the source file.
! Local variables – can be examined only in their scope or using:
file::variable or function::variable
The variable type: ptype var
Current value: print var
Automatic display: display var
- adds var to the automatic display list.
undisplay dnum
___________________________________________________
Specifying the output format (x, o, d, u, t, a, f, and c) :
print /t var - prints the value of var in binary format
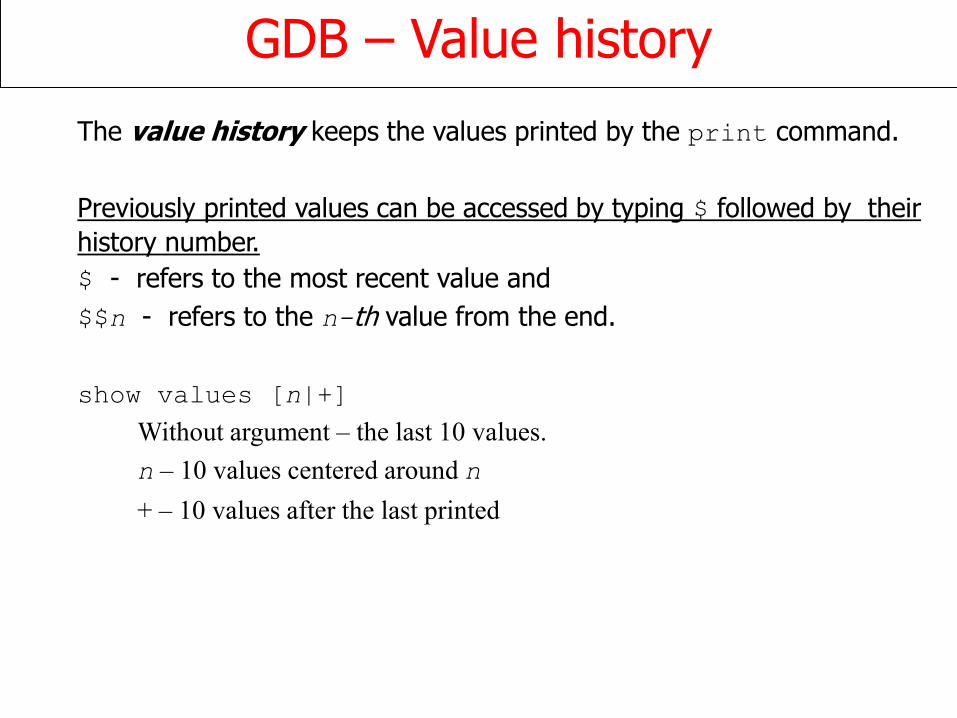
GDB – Value history
The value history keeps the values printed by the print command.
Previously printed values can be accessed by typing $ followed by their
history number.
$ - refers to the most recent value and
$$n - refers to the n-th value from the end.
show values [n|+]
Without argument – the last 10 values.
n – 10 values centered around n
+ – 10 values after the last printed
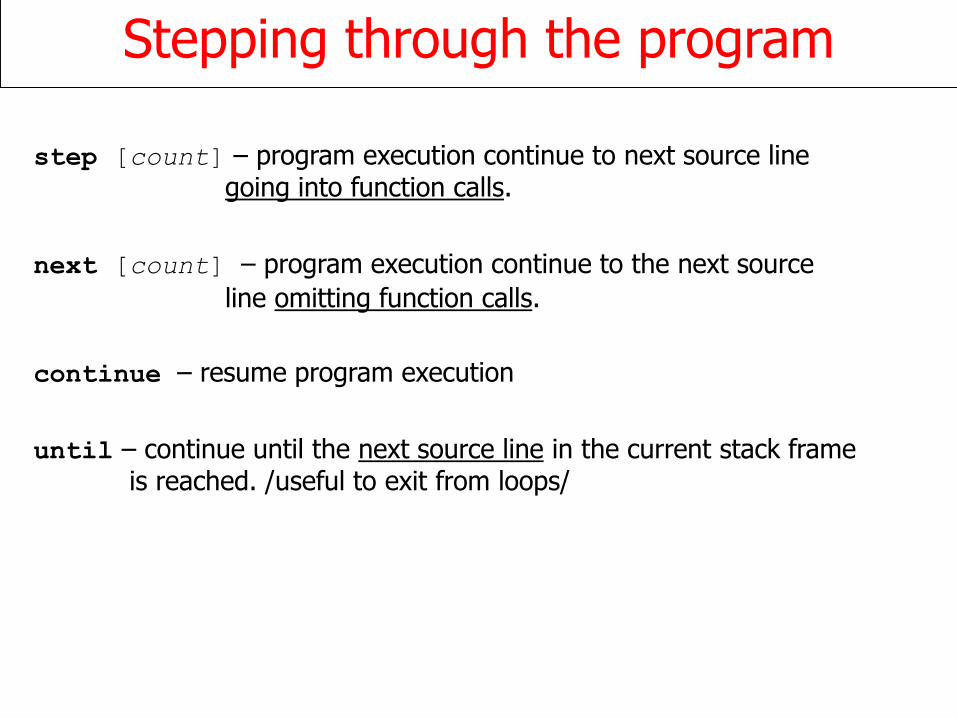
Stepping through the program
step [count] – program execution continue to next source line going into function calls.
next [count] – program execution continue to the next source
line omitting function calls.
continue – resume program execution
until – continue until the next source line in the current stack frame is reached. /useful to exit from loops/
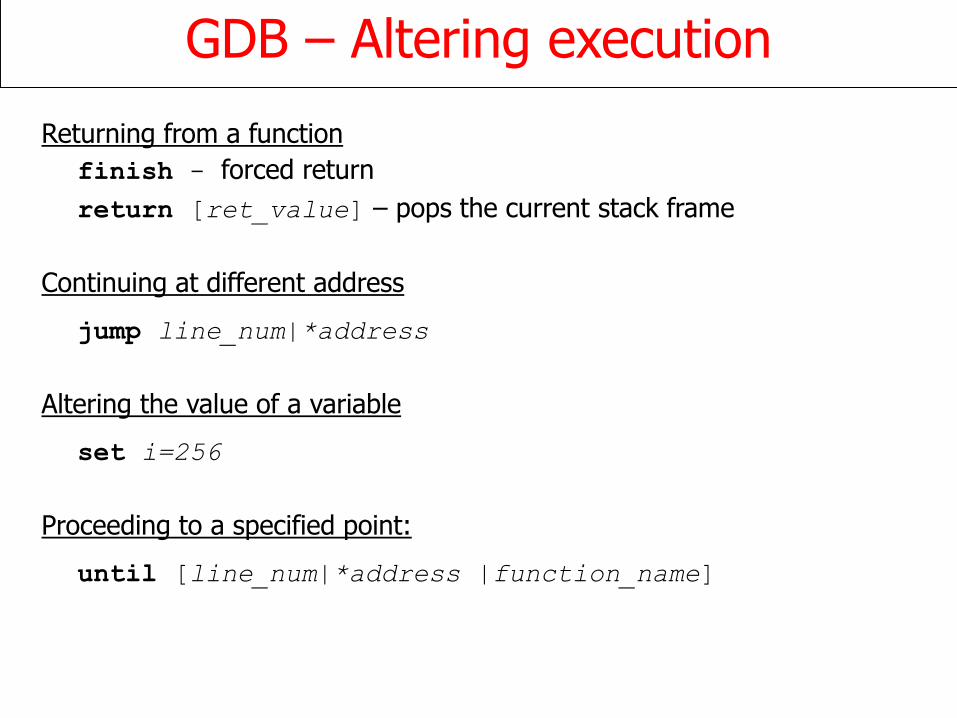
GDB – Altering execution
Returning from a function
finish - forced return
return [ret_value] – pops the current stack frame
Continuing at different address
jump line_num|*address
Altering the value of a variable
set i=256
Proceeding to a specified point:
until [line_num|*address |function_name]
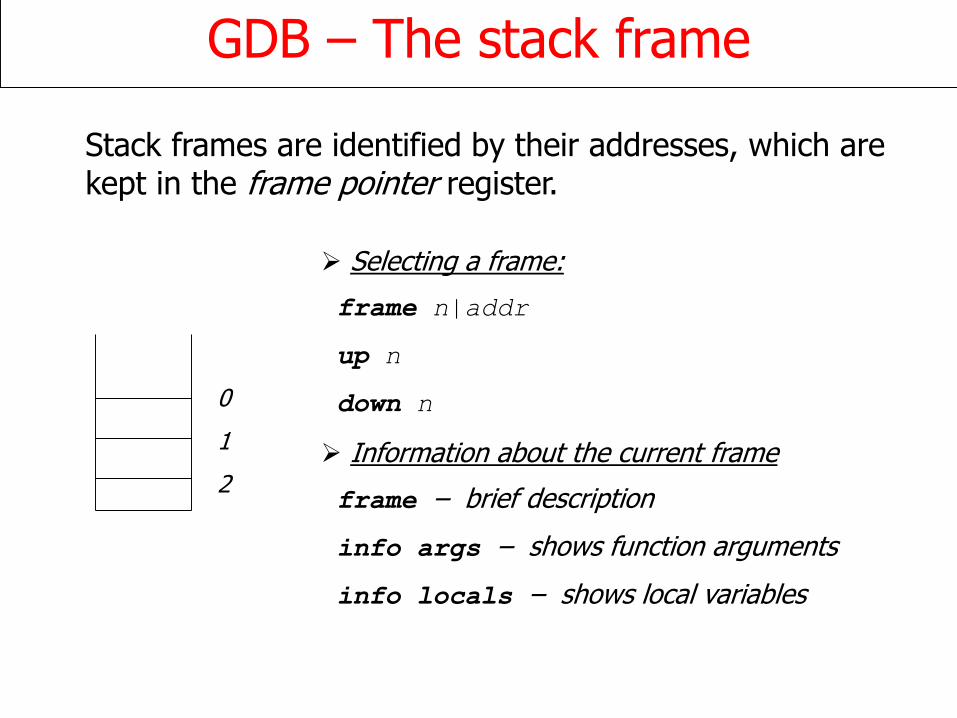
GDB – The stack frame
Stack frames are identified by their addresses, which are kept in the frame pointer register.
0
1
2
Selecting a frame:
frame n|addr
up n
down n
Information about the current frame
frame – brief description
info args – shows function arguments
info locals – shows local variables
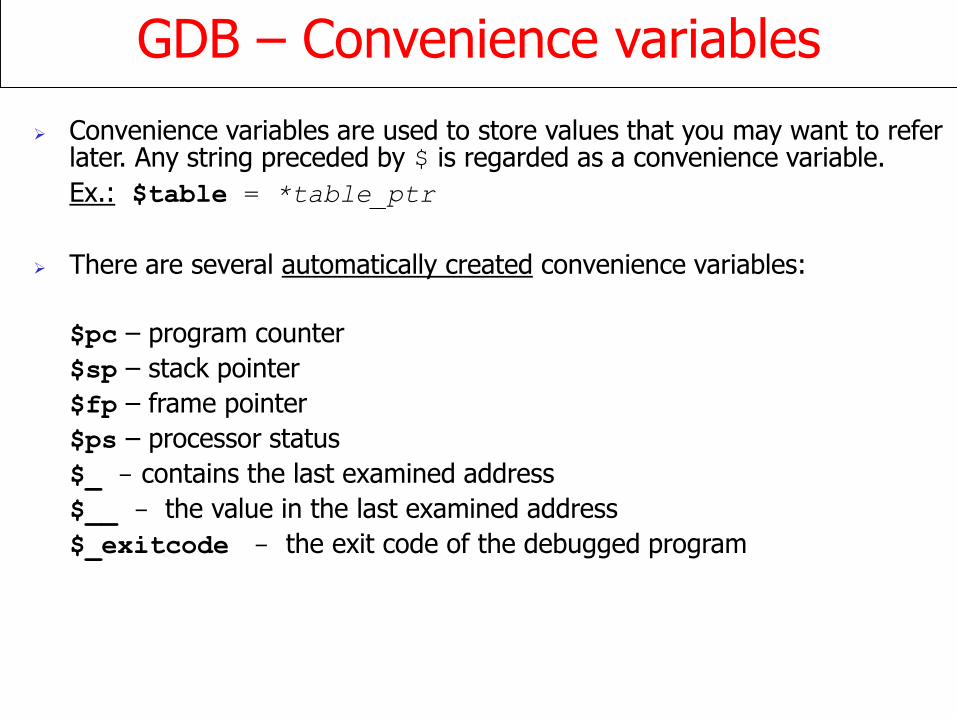
GDB – Convenience variables
Convenience variables are used to store values that you may want to refer later. Any string preceded by $ is regarded as a convenience variable.
Ex.: $table = *table_ptr
There are several automatically created convenience variables:
$pc – program counter
$sp – stack pointer
$fp – frame pointer
$ps – processor status
$_ - contains the last examined address
$__ - the value in the last examined address
$_exitcode - the exit code of the debugged program
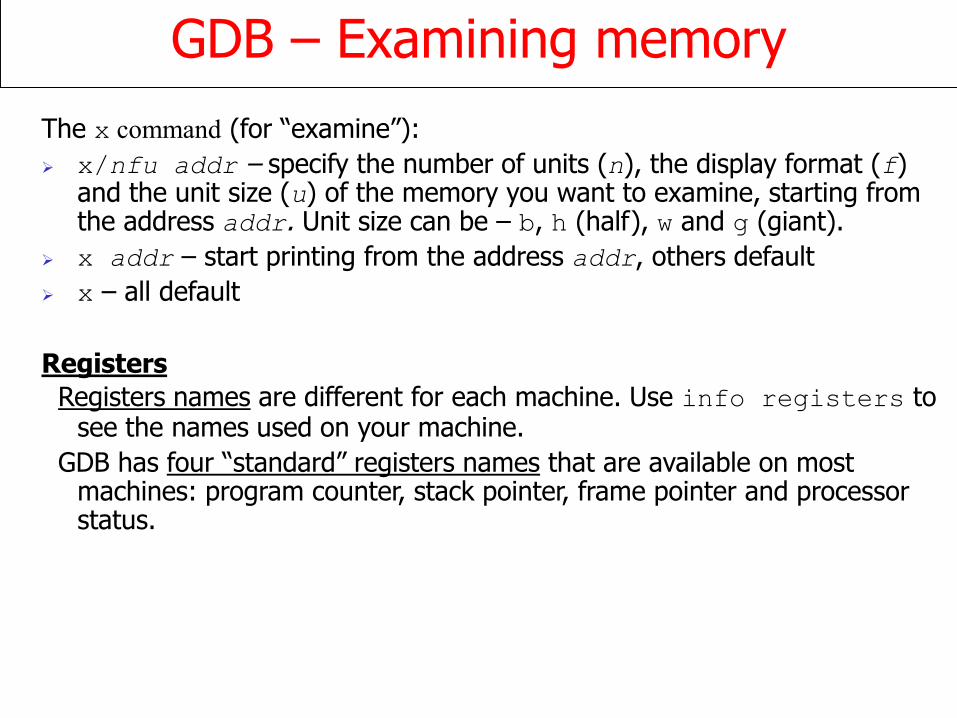
GDB – Examining memory
The x command (for “examine”):
x/nfu addr – specify the number of units (n), the display format (f) and the unit size (u) of the memory you want to examine, starting from the address addr. Unit size can be – b, h (half), w and g (giant).
x addr – start printing from the address addr, others default
x – all default
Registers
Registers names are different for each machine. Use info registers to see the names used on your machine.
GDB has four “standard” registers names that are available on most machines: program counter, stack pointer, frame pointer and processor status.
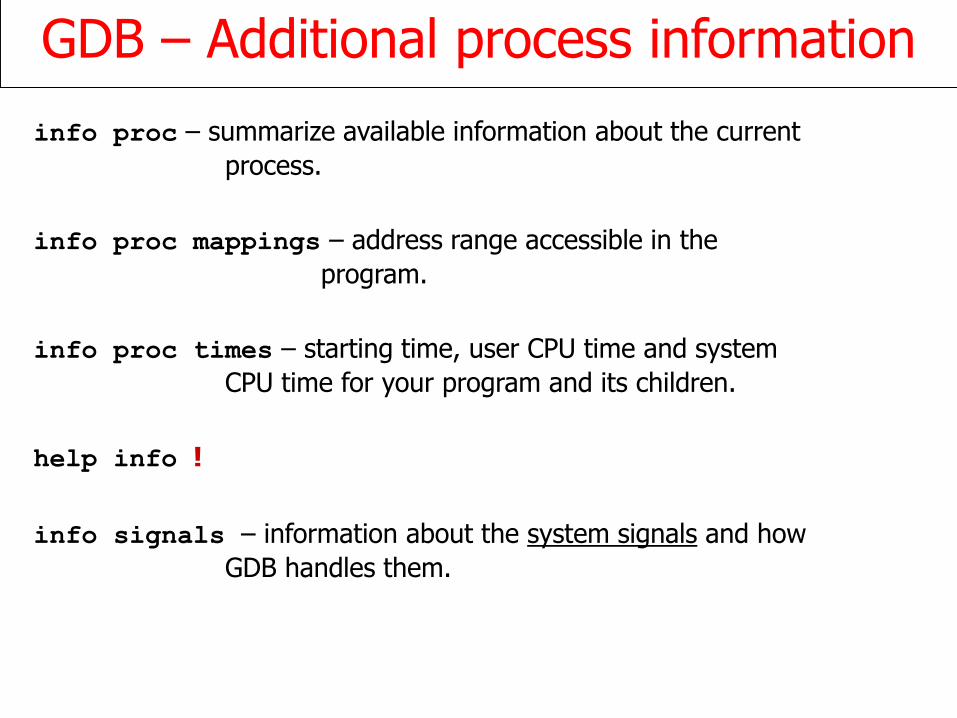
GDB – Additional process information
info proc – summarize available information about the current
process.
info proc mappings – address range accessible in the
program.
info proc times – starting time, user CPU time and system
CPU time for your program and its children.
help info !
info signals – information about the system signals and how
GDB handles them.
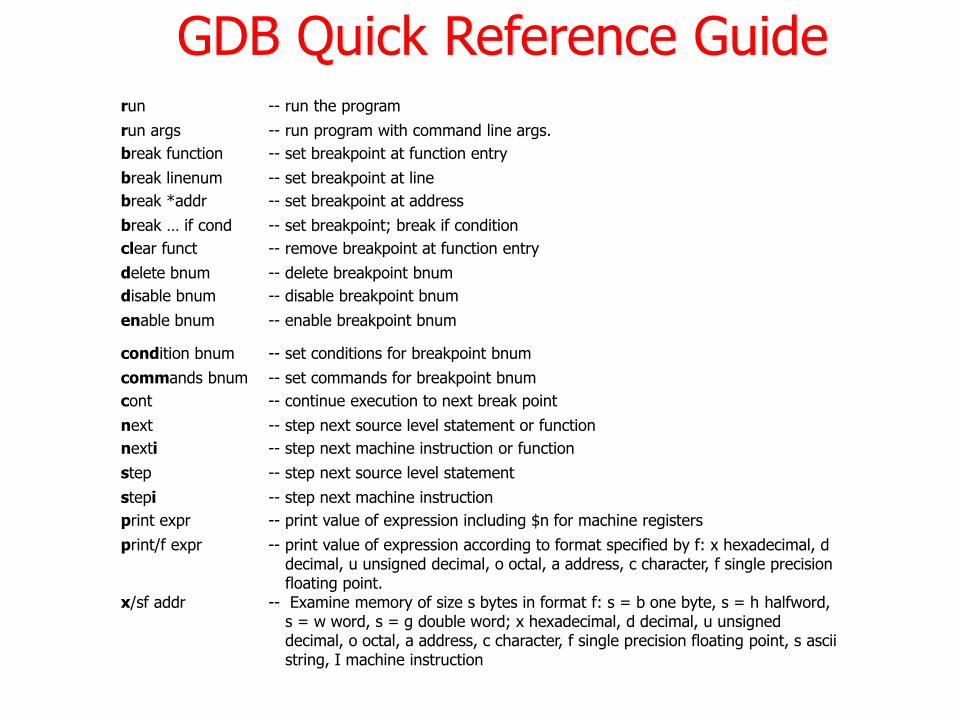
GDB Quick Reference Guiderun -- run the program
run args -- run program with command line args.
break function -- set breakpoint at function entry
break linenum -- set breakpoint at line
break *addr -- set breakpoint at address
break … if cond -- set breakpoint; break if condition
clear funct -- remove breakpoint at function entry
delete bnum -- delete breakpoint bnum
disable bnum -- disable breakpoint bnum
enable bnum -- enable breakpoint bnum
condition bnum -- set conditions for breakpoint bnum
commands bnum -- set commands for breakpoint bnum
cont -- continue execution to next break point
next -- step next source level statement or function
nexti -- step next machine instruction or function
step -- step next source level statement
stepi -- step next machine instruction
print expr -- print value of expression including $n for machine registers
print/f expr -- print value of expression according to format specified by f: x hexadecimal, d decimal, u unsigned decimal, o octal, a address, c character, f single precision floating point.
x/sf addr -- Examine memory of size s bytes in format f: s = b one byte, s = h halfword, s = w word, s = g double word; x hexadecimal, d decimal, u unsigned decimal, o octal, a address, c character, f single precision floating point, s asciistring, I machine instruction
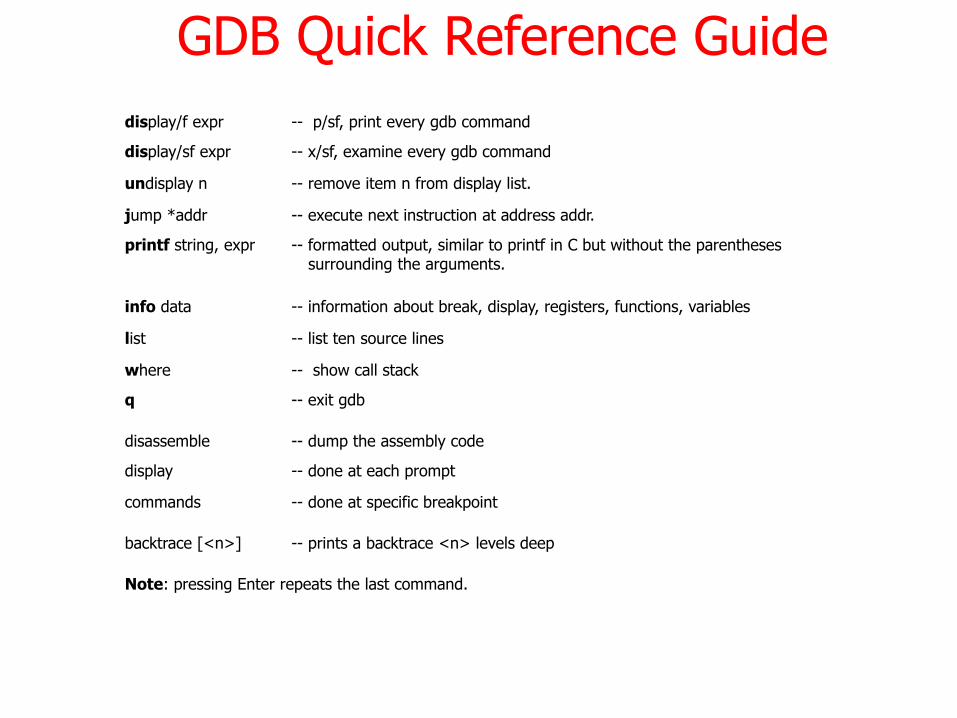
display/f expr -- p/sf, print every gdb command
display/sf expr -- x/sf, examine every gdb command
undisplay n -- remove item n from display list.
jump *addr -- execute next instruction at address addr.
printf string, expr -- formatted output, similar to printf in C but without the parentheses surrounding the arguments.
info data -- information about break, display, registers, functions, variables
list -- list ten source lines
where -- show call stack
q -- exit gdb
disassemble -- dump the assembly code
display -- done at each prompt
commands -- done at specific breakpoint
backtrace [<n>] -- prints a backtrace <n> levels deep
Note: pressing Enter repeats the last command.
GDB Quick Reference Guide
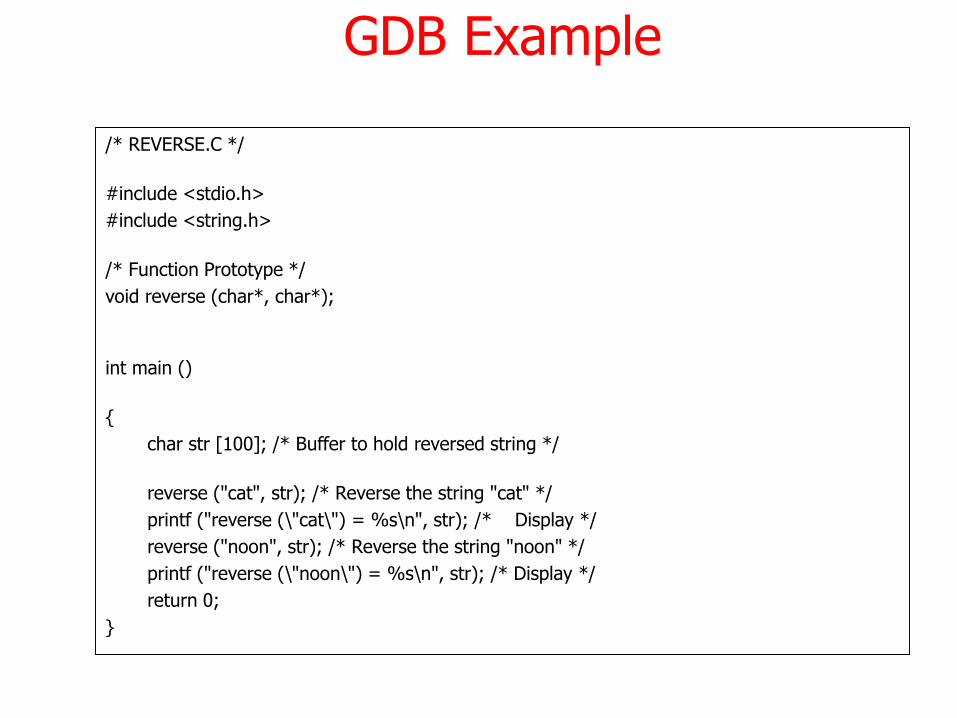
GDB Example
/* REVERSE.C */
#include <stdio.h>
#include <string.h>
/* Function Prototype */
void reverse (char*, char*);
int main ()
{
char str [100]; /* Buffer to hold reversed string */
reverse ("cat", str); /* Reverse the string "cat" */
printf ("reverse (\"cat\") = %s\n", str); /* Display */
reverse ("noon", str); /* Reverse the string "noon" */
printf ("reverse (\"noon\") = %s\n", str); /* Display */
return 0;
}
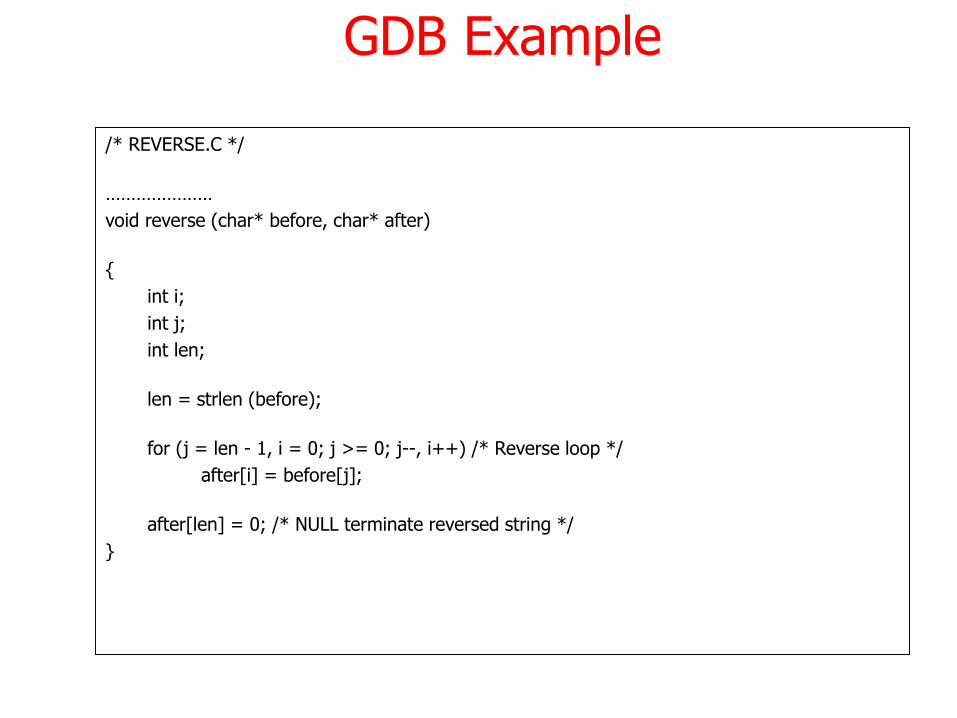
GDB Example
/* REVERSE.C */
…………………
void reverse (char* before, char* after)
{
int i;
int j;
int len;
len = strlen (before);
for (j = len - 1, i = 0; j >= 0; j--, i++) /* Reverse loop */
after[i] = before[j];
after[len] = 0; /* NULL terminate reversed string */
}
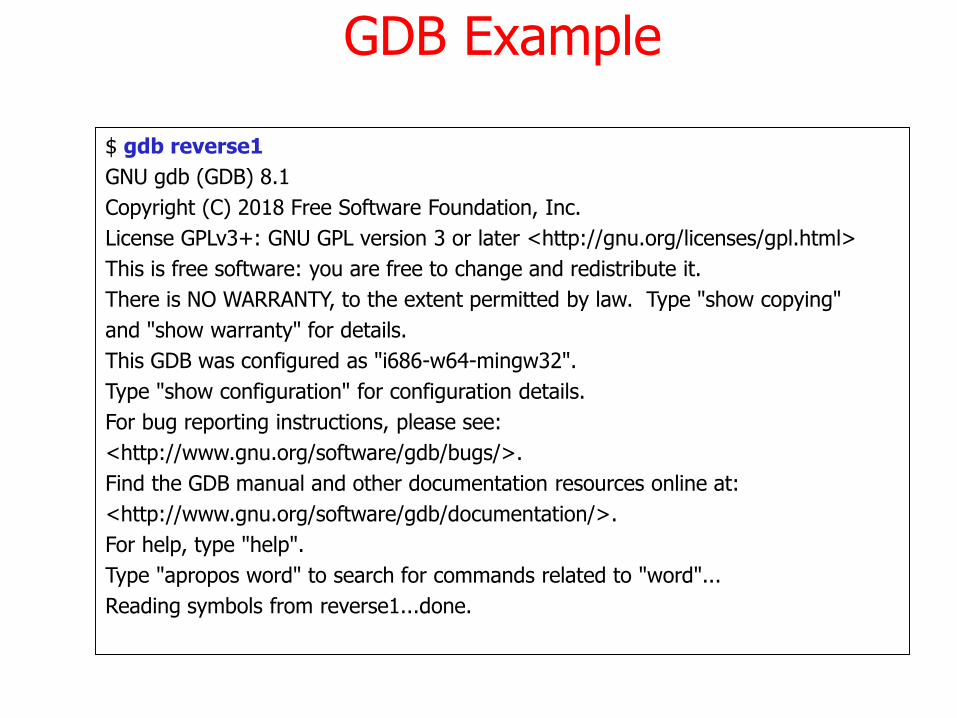
GDB Example
$ gdb reverse1
GNU gdb (GDB) 8.1
Copyright (C) 2018 Free Software Foundation, Inc.
License GPLv3+: GNU GPL version 3 or later <http://gnu.org/licenses/gpl.html>
This is free software: you are free to change and redistribute it.
There is NO WARRANTY, to the extent permitted by law. Type "show copying"
and "show warranty" for details.
This GDB was configured as "i686-w64-mingw32".
Type "show configuration" for configuration details.
For bug reporting instructions, please see:
<http://www.gnu.org/software/gdb/bugs/>.
Find the GDB manual and other documentation resources online at:
<http://www.gnu.org/software/gdb/documentation/>.
For help, type "help".
Type "apropos word" to search for commands related to "word"...
Reading symbols from reverse1...done.
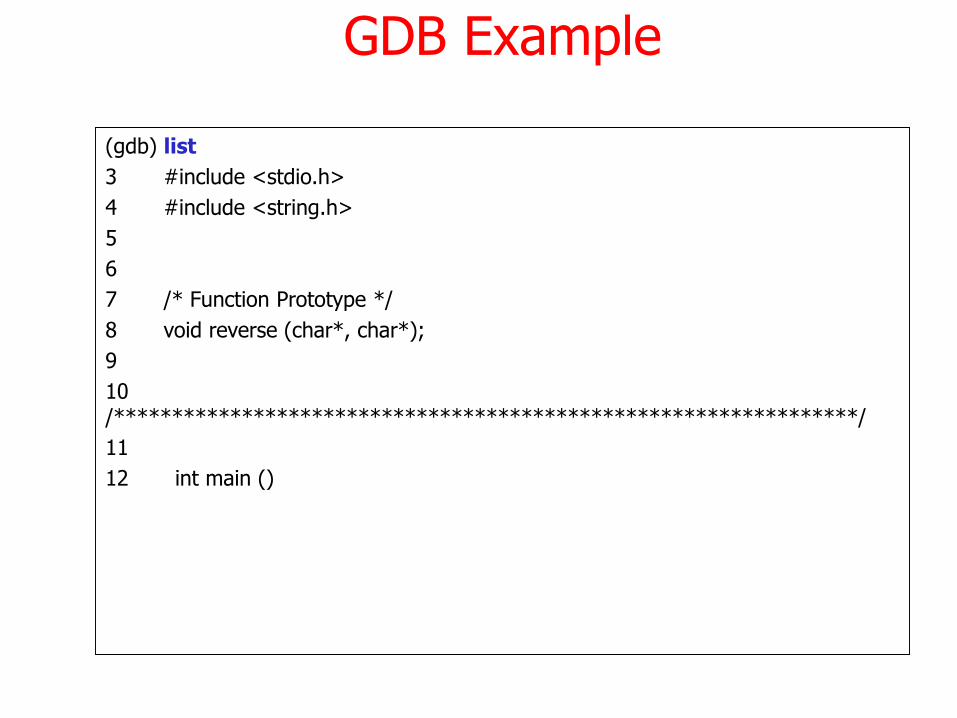
GDB Example
(gdb) list
3 #include <stdio.h>
4 #include <string.h>
5
6
7 /* Function Prototype */
8 void reverse (char*, char*);
9
10 /****************************************************************/
11
12 int main ()
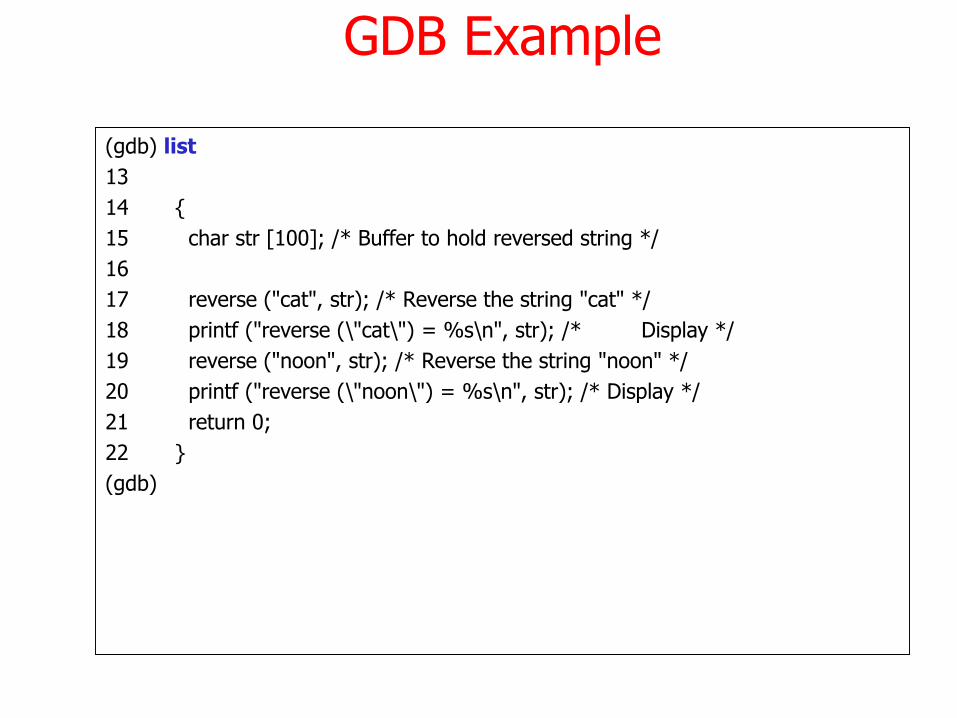
GDB Example
(gdb) list
13
14 {
15 char str [100]; /* Buffer to hold reversed string */
16
17 reverse ("cat", str); /* Reverse the string "cat" */
18 printf ("reverse (\"cat\") = %s\n", str); /* Display */
19 reverse ("noon", str); /* Reverse the string "noon" */
20 printf ("reverse (\"noon\") = %s\n", str); /* Display */
21 return 0;
22 }
(gdb)
GDB Example
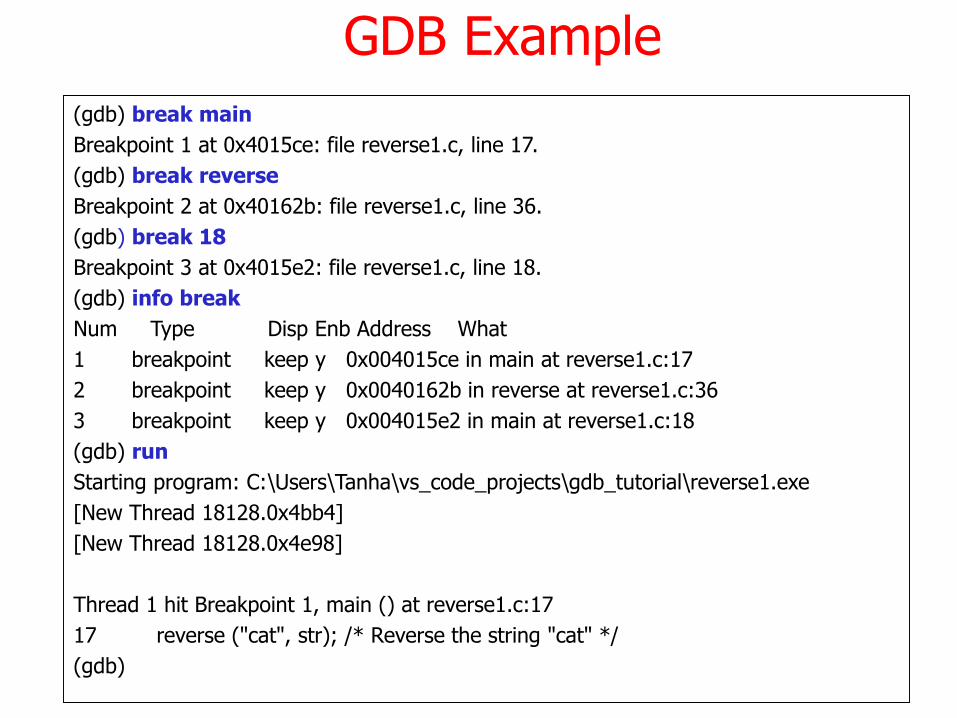
(gdb) break main
Breakpoint 1 at 0x4015ce: file reverse1.c, line 17.
(gdb) break reverse
Breakpoint 2 at 0x40162b: file reverse1.c, line 36.
(gdb) break 18
Breakpoint 3 at 0x4015e2: file reverse1.c, line 18.
(gdb) info break
Num Type Disp Enb Address What
1 breakpoint keep y 0x004015ce in main at reverse1.c:17
2 breakpoint keep y 0x0040162b in reverse at reverse1.c:36
3 breakpoint keep y 0x004015e2 in main at reverse1.c:18
(gdb) run
Starting program: C:\Users\Tanha\vs_code_projects\gdb_tutorial\reverse1.exe
[New Thread 18128.0x4bb4]
[New Thread 18128.0x4e98]
Thread 1 hit Breakpoint 1, main () at reverse1.c:17
17 reverse ("cat", str); /* Reverse the string "cat" */
(gdb)
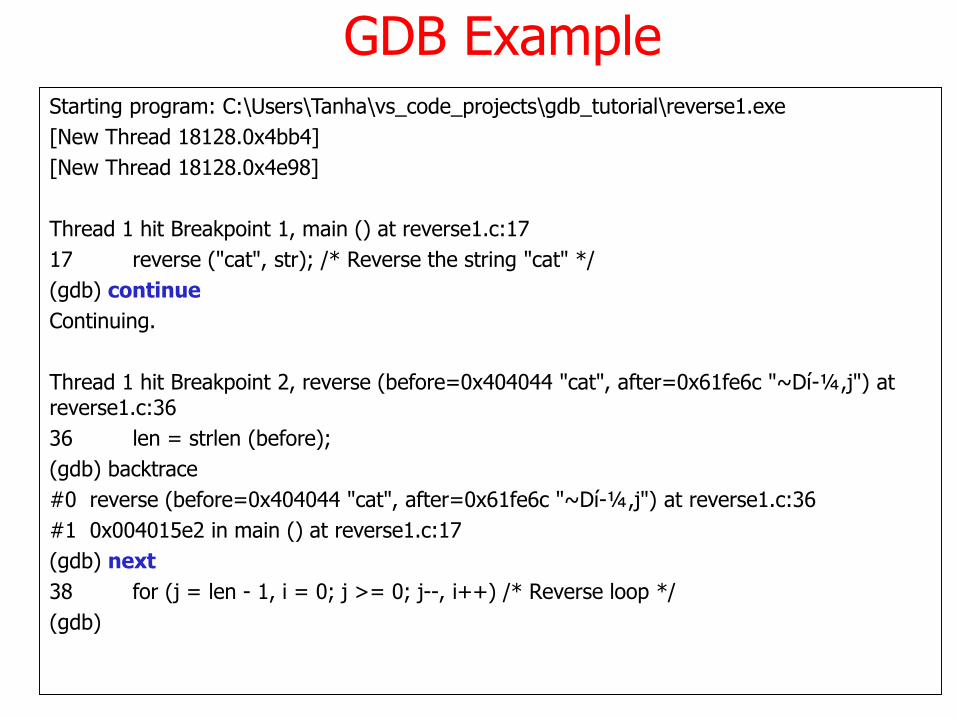
GDB ExampleStarting program: C:\Users\Tanha\vs_code_projects\gdb_tutorial\reverse1.exe
[New Thread 18128.0x4bb4]
[New Thread 18128.0x4e98]
Thread 1 hit Breakpoint 1, main () at reverse1.c:17
17 reverse ("cat", str); /* Reverse the string "cat" */
(gdb) continue
Continuing.
Thread 1 hit Breakpoint 2, reverse (before=0x404044 "cat", after=0x61fe6c "~Dí-¼,j") at reverse1.c:36
36 len = strlen (before);
(gdb) backtrace
#0 reverse (before=0x404044 "cat", after=0x61fe6c "~Dí-¼,j") at reverse1.c:36
#1 0x004015e2 in main () at reverse1.c:17
(gdb) next
38 for (j = len - 1, i = 0; j >= 0; j--, i++) /* Reverse loop */
(gdb)
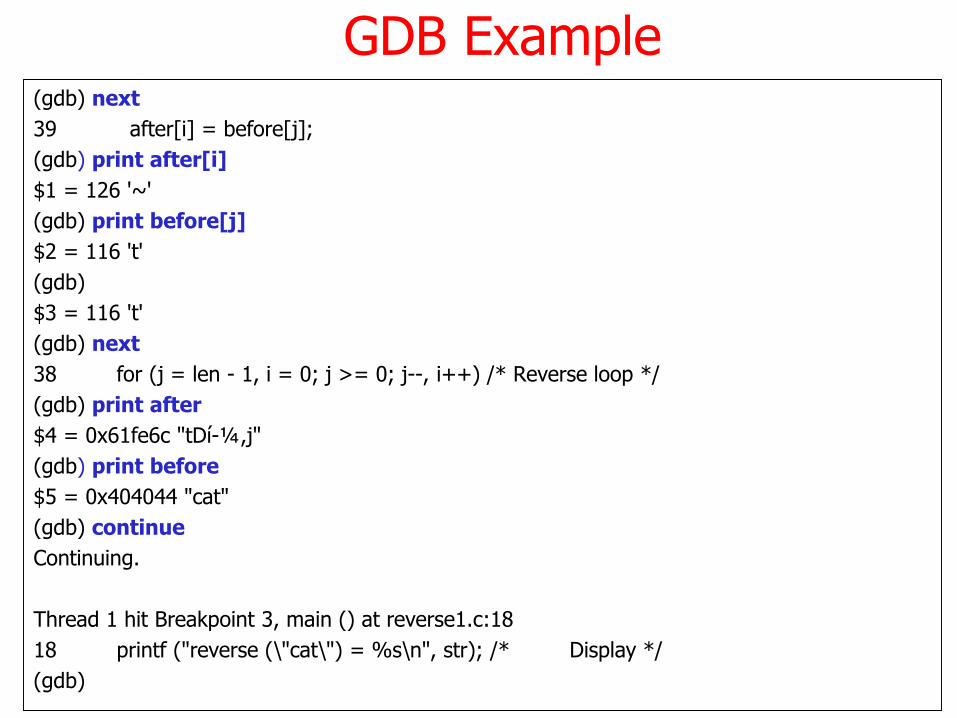
GDB Example(gdb) next
39 after[i] = before[j];
(gdb) print after[i]
$1 = 126 '~'
(gdb) print before[j]
$2 = 116 't'
(gdb)
$3 = 116 't'
(gdb) next
38 for (j = len - 1, i = 0; j >= 0; j--, i++) /* Reverse loop */
(gdb) print after
$4 = 0x61fe6c "tDí-¼,j"
(gdb) print before
$5 = 0x404044 "cat"
(gdb) continue
Continuing.
Thread 1 hit Breakpoint 3, main () at reverse1.c:18
18 printf ("reverse (\"cat\") = %s\n", str); /* Display */
(gdb)
GDB Example
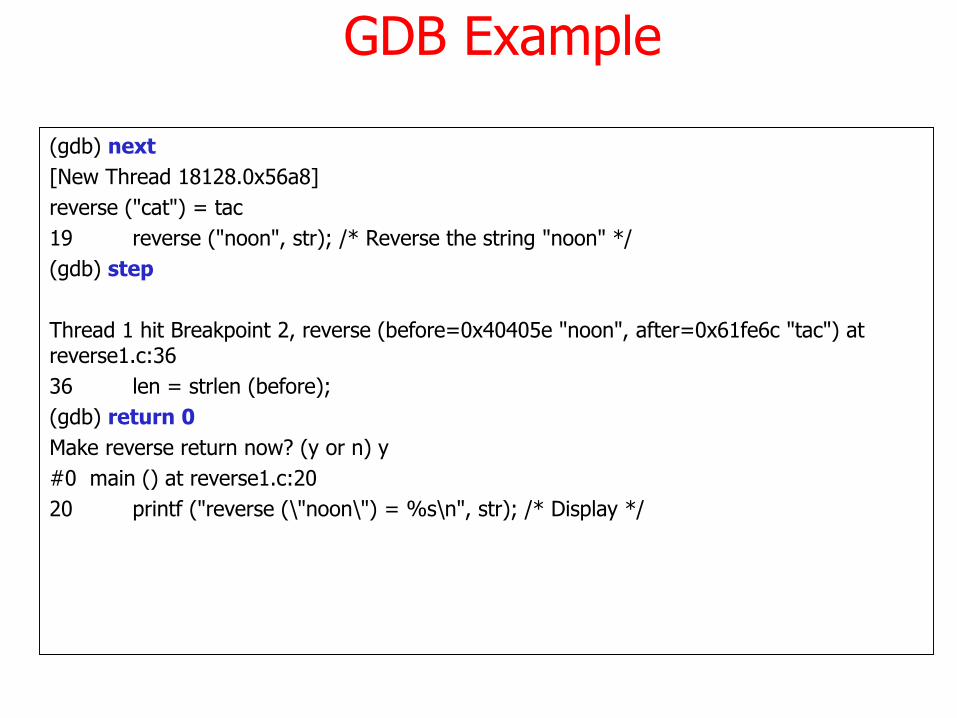
(gdb) next
[New Thread 18128.0x56a8]
reverse ("cat") = tac
19 reverse ("noon", str); /* Reverse the string "noon" */
(gdb) step
Thread 1 hit Breakpoint 2, reverse (before=0x40405e "noon", after=0x61fe6c "tac") at reverse1.c:36
36 len = strlen (before);
(gdb) return 0
Make reverse return now? (y or n) y
#0 main () at reverse1.c:20
20 printf ("reverse (\"noon\") = %s\n", str); /* Display */
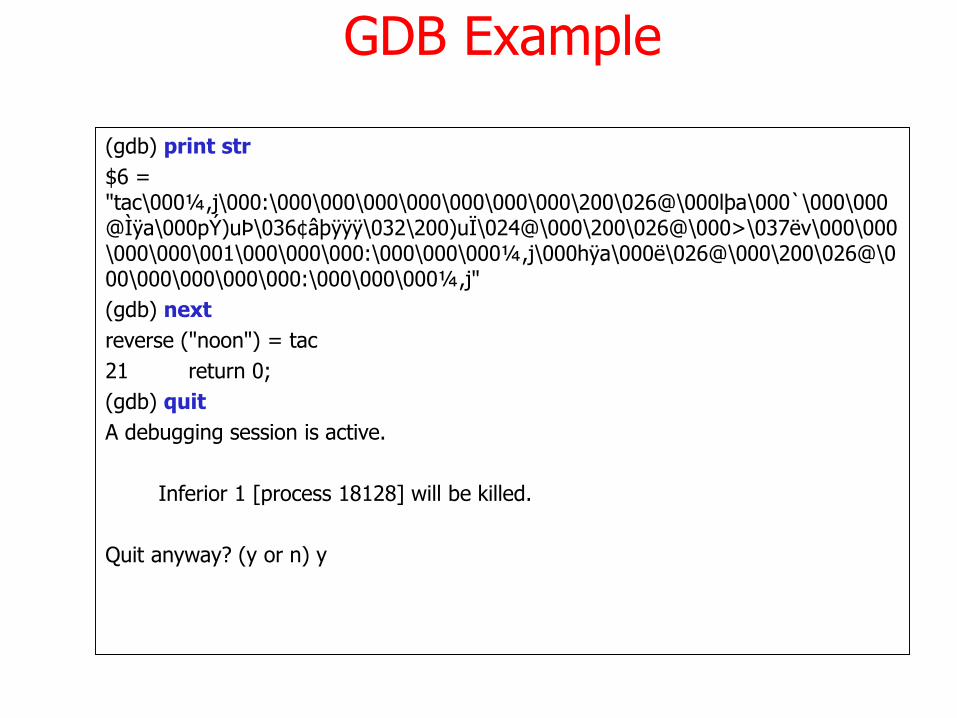
GDB Example
(gdb) print str
$6 = "tac\000¼,j\000:\000\000\000\000\000\000\000\200\026@\000lþa\000`\000\000@Ìÿa\000pÝ)uÞ\036¢âþÿÿÿ\032\200)uÏ\024@\000\200\026@\000>\037ëv\000\000\000\000\001\000\000\000:\000\000\000¼,j\000hÿa\000ë\026@\000\200\026@\000\000\000\000\000:\000\000\000¼,j"
(gdb) next
reverse ("noon") = tac
21 return 0;
(gdb) quit
A debugging session is active.
Inferior 1 [process 18128] will be killed.
Quit anyway? (y or n) y
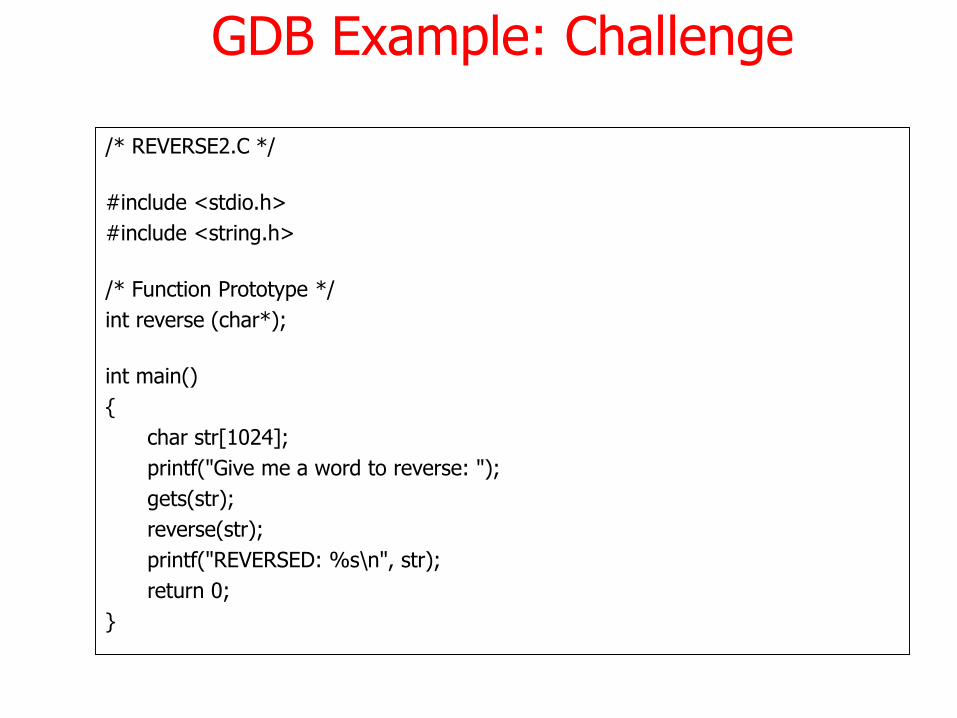
GDB Example: Challenge
/* REVERSE2.C */
#include <stdio.h>
#include <string.h>
/* Function Prototype */
int reverse (char*);
int main()
{
char str[1024];
printf("Give me a word to reverse: ");
gets(str);
reverse(str);
printf("REVERSED: %s\n", str);
return 0;
}
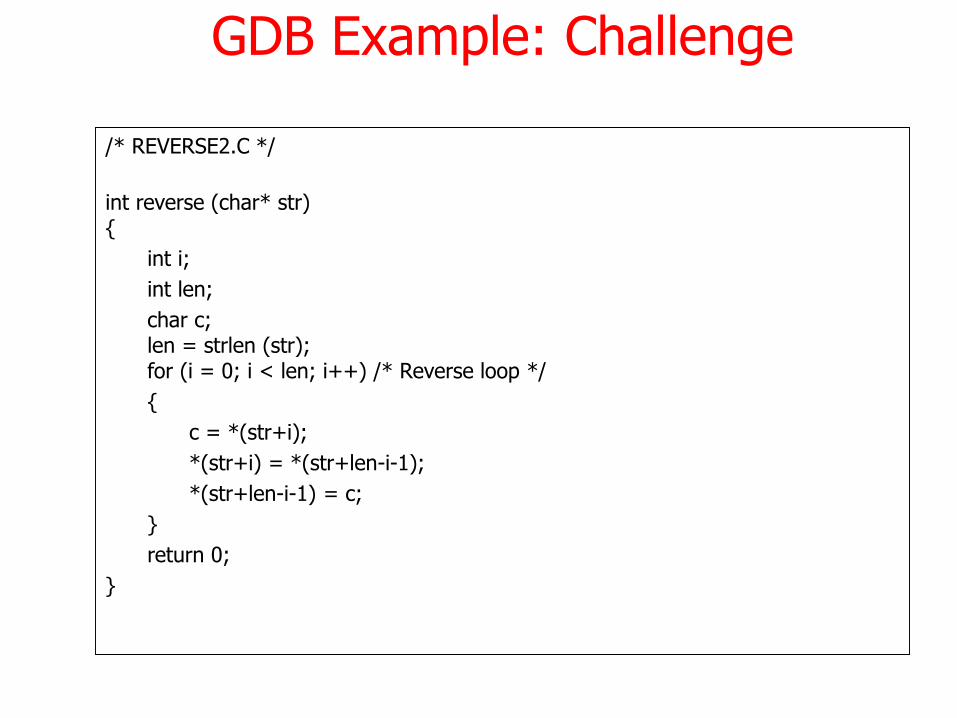
GDB Example: Challenge
/* REVERSE2.C */
int reverse (char* str){
int i;
int len;
char c;len = strlen (str); for (i = 0; i < len; i++) /* Reverse loop */
{
c = *(str+i);
*(str+i) = *(str+len-i-1);
*(str+len-i-1) = c;
}
return 0;
}