d count eesube ilentifers - eric
TRANSCRIPT
D COUNT EESUBE
D 200 437 SE 034 583
AUTHOR Novak,-Joseph D.; And OthersTITLE The Use of Concept Mapping and Gowin's "V" Mapping
Instr4ctional Strategies in Junior High SchoolScience. The Cornell University "Learning How ToLearn" Projectt,
INSTITUTION Cornell Univ., Ithaca, N.Y. Dept. of Education.;State Univ. of New York, Ithaca. Coll. of Agricultureand Life Sciences at Cornell Univ.
SPCNS AGENCY National Science Foundation, Washington, D.C.; ShellCompanies Foundation, New York, N.Y.81NSF-SED-78-16762342p.; Contains occasional small, light and brokentype. Appendices marginally legible.
EDES PRICE 11F01/PC14 Plus Postage.DESCRIPTORS Cognitive Heasurement; Cognitive Processes; *Concept
Formation; *Instructional Development; Junior HighSchools: *Learning Processes: Learning Theories:*Science Education; *Science Instruction; SecondarySchool Science
ILENTIFERS Ausubel (David P); *Concept Napping; *Gowins vMapping
.PUB DATEGRANT.MOTE
ABSTRACTReported is a research project which investigated
,whether junior high students ip the Ithaca, New York, area can-,-_-acquire and use the "concept mapping" and "Gowin's 'V' mapping""fstrategies to facilitate meaningful learning. Concept mapping .
evolves the identification, hierarchical organization, and graphic_
depiction of relationships among concepts in a body of study=-material. These procedures are consistent with KUsubel's,,theory ofmeaningful learning. The second learning strategy involvesretognizing that all knowledge in the sciences is constructed byusing records and record transforming procedures which are guided by
concepts,_principles and theories that people employ. Gowin's "V"heuristic device .that students use to graphically illustrate the
5-imterPlay between the methodological and conceptual elements of eachde of knowledge-making, such as a laboratory investigation.hough many project activities centered on implementation of theo learning strategies, the positive cognitive and affective datad support to the effectiveness of this "learning how to learn"
eject.- Included in the appendix are the teacher's handbook andsiaples of student-constructed concept zaps and "V" maps.
thar/WE)
*********************** ******* ** **** * ****** **********Reproductions supplied by MILS are the best that can be made *
from the original document. *
****************************************** ** *******
Nfel
U S DA AILA TATENT OF HEALTH.EOUC.1IOP& *ELMNATIONAL INSTITUT OF
EOUC4 f ION
00:::,4N.E .IAS SEEN REPQ0-)CE D slc.,"ct AS siE (E'VED .A00
pr OW (IQ zaY,0N DN7.1
OWN iONS
IZ NV ssA4L,F A-,A/
`,7,.11, IF c
"PERMISSION TO REPRODUCE THISMATERIAL HAS BEEN GRANTED BY
TO THE EDUCATIONAL RESOURCESINFORMATION CEN rER tERic).-
THE USE OF CONCEPT MAPPING AND GOWIN'S "V" MAPPING
INSTRUCTIONAL STRATEGIES IN JUNIOR HIGH SCHOOL SCIENCEc
THE CORNELL UNIVERSITY "LEARNING HOW TO LEARN" PROJECT
Supported in part by grants from the National Science Foundation
(SED 78-16762) and Shell Companies Foundation
Opinions expressed and conclusions reached represent the views of the Project
Director and staff and are not necessarily those of the National Science Fowl"
d-ation or Shell Companies Foundation.
NATIONAL SCIENCE FOUNDATWashington. D.C. 20550
I. Ins tion and A
Cornell UniversityIthaca, New York 14853
Pro -'t Title
FINAL PROJECT REPORTNSF FORM ONA
:VSTRUCTIONS R 'RS BE OREPROJECT IDENTIFICATION INFORMATION
ram
RISENumb,:
SED 78-16762rtik
$126,600Av.ardPoriodFiom9/15/78 Tv 12/3
OUTU
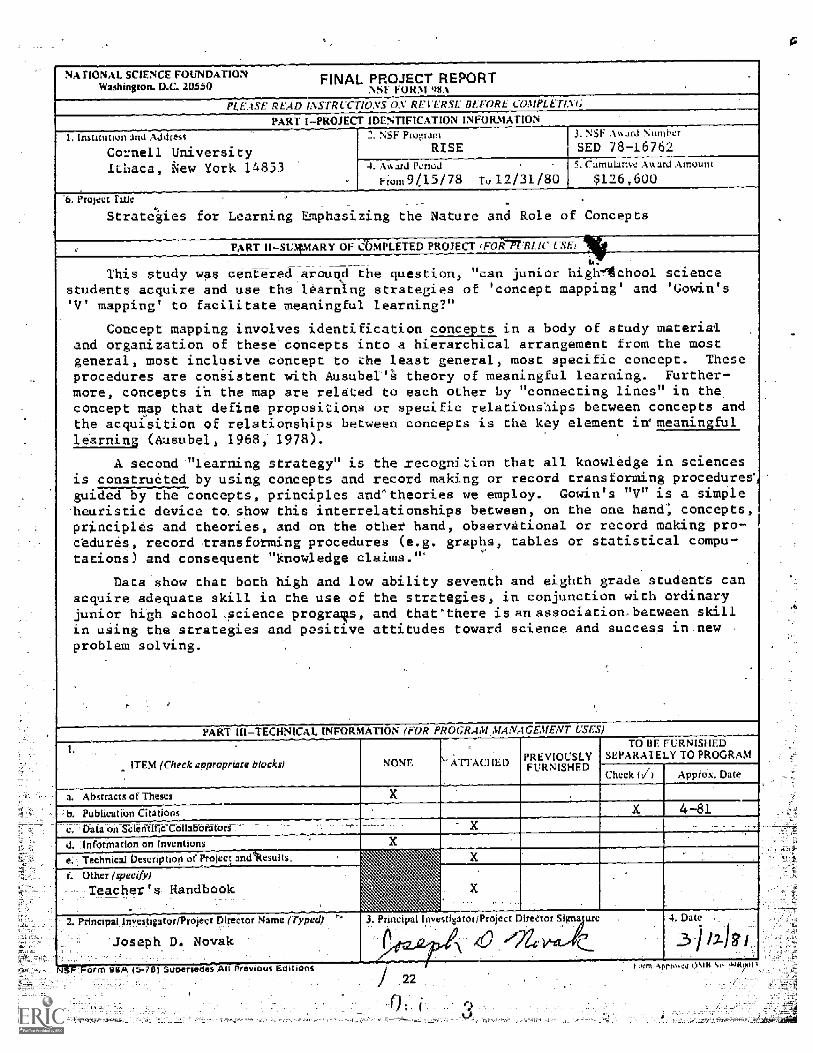
Strategies for Learning Emphasizing the Nature and Role of Concepts
PART II-SC IARY OF LETED PROJECT !TOR L
This study was centiredaround the question, "can juniorstudents acquire and use the learning strategies of 'concept mapping' and 'Gowin's'V' mapping' to facilitate meaningful learning?"
Concept mapping involves identification concepts in a body of study materialand organization of these concepts into a hierarchical arrangement from the mostgeneral, most inclusive concept to the least general, most specific concept. Theseprocedures are consistent with Ausubet'a theory of meaningful learning. Further-more, concepts in the map are related to each other by "connecting lines" in theconcept map that define propositions or specific relatibnships between concepts andthe acquisition of relationships between concepts is the key element ful
learninz (Ausubel, 1968; 1978).
A second -"learning strategy" is the .recognition that all knowledge in sciencesis constructed by using concepts and record making or record transforming procedures`,-------guided by the concepts, principles anetheories we employ. Gowin's "V" is a simpleheuristic device to, show this interrelationships between, on the one hand; concepts,principles and theories, and on the other hand, observational or record making pro-bedures, record transforming procedures (e.g. graphs, tables or statistical compu-'tations) and consequent "knowledge claims."'
Data show that both high and low ability seventh and eighth grade students canacquire adequate skill in the use of the strategies, conjunction with ordinaryjunior high schoolacience prograTs, and that'there isanassociationbetween skillin using the strategies and positive attitudes toward science and success in.newproblem solving.
high4chool science
PART IIITECH
ITEM (Check appropriate blocks)
a_ Abstracts of Theses
Publication Citations
Data on 'entitle Collabbrators
d Inforina on on InventionsDescription of Project ande. Technical
Other (specify)
Teacher's Handbook
CAL INFORMATION (FOR PROGRA ANAG MEN L ES)
PREVIOUSLYFURNISHED
TO BE FURNISHEDSEPARATELY TO PROGRAM
Check Approx. Date
sults.
1 PmicipMiriye or Project Director Name (Type
Joseph D. Novak
98A 7 -rserieS All Previous Eultions
rincipal Investigator Project Dire Signature 4. Date
kpri
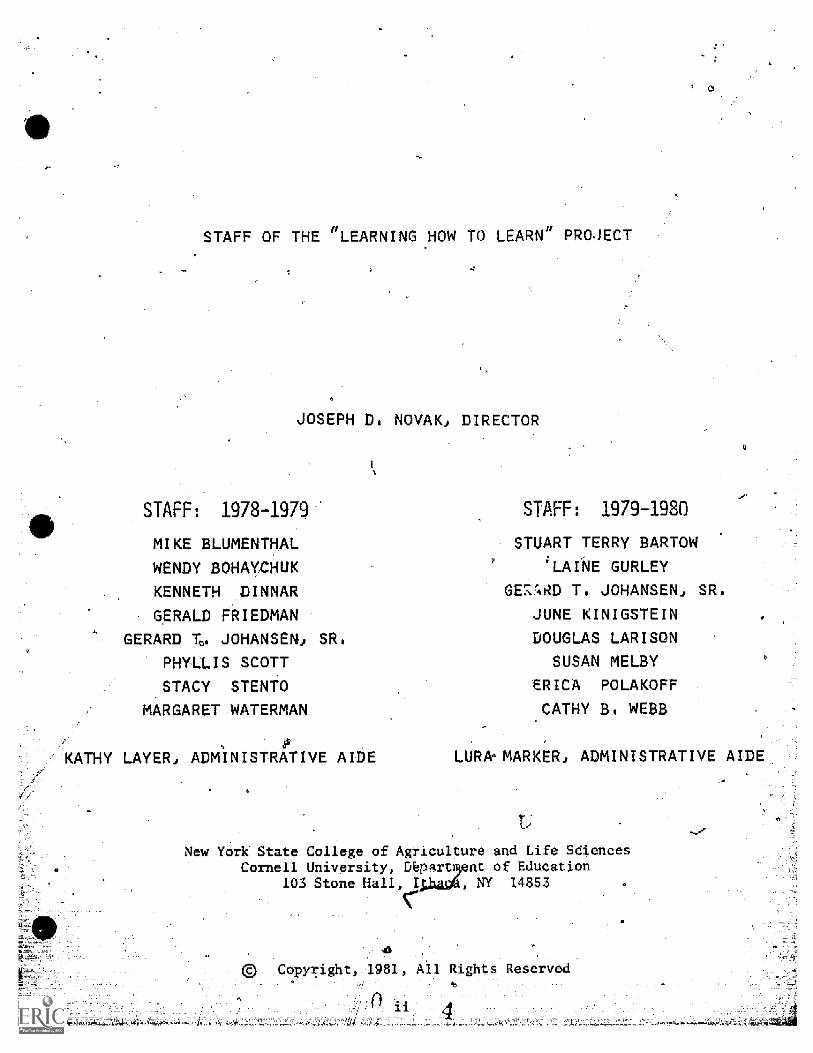
STAFF OF THE "LEARNING HOW TO LEARN" PROJECT
JOSEPH Ds NOVAK, DIRECTOR
STAFF: 1978-1979-r
MIKE BLUMENTHAL
WENDY BOHAYCHUK
KENNETH DINNAR
GERALD FRIEDMAN
GERARD T. JOHANSEN, SR.
PHYLLIS SCOTT
STACY STENTO
MARGARET WATERMAN
-KATHY LAYER, ADMINISTRATIVE AIDE
STAFF: 1979-1980
STUART TERRY BARTOW
'LAINE GURLEY
AI T. JOHANSENA SR.
JUNE KINIGSTEIN
DOUGLAS LARISON
SUSAN MELBY
ERICA POLAKOFF
CATHY Bs WEBB
LURk MARKER, ADMINISTRATIVE AIDE
Tr
New York State College of Agriculture and Life SciencesCornell University, Depart nt of Education
103 Stone Hall, NY 14853
Cop ight 1981, All Rights Reserved
ABSTRACT
This study was centered around the question, "can junior high schoolscience students acquire and use the learning strategies of 'concept mapping'and 'Gowin's 'V' mapping' to facilitate meaningful learning?"
D
Concept mapping involves the identification of concepts in a body ofstudy material and the organization of those concepts into e hierarchicalarrangement from the Most general, most inclusive concept to the leastgeneral, most specific concept. These procedures are consistent withAusubel's theory: of meaningful learning. Furthermore, concepts in the maprelate to each other by "connecting lihes" that define propositions orspecific relationships between concepts, for example that "Arthropods havejointed appendages." We define concepts as "regularities in events orobjects designated by asign,or symbol," and in our example "Arthropods"and:"Jointed appendages" represent.two concepts. Propositions, in turn,are relationshipsbetween concepts (as in our example) and the acquisitionof relationships between concepts is the key element-in meaningful learniu.(Ausubel, 1968, 1978).
A second "learning strategy" or "meta-learning" activity (i.e., learn-ing about learning) is the recognition that all knowledge in the sciencesis constructed about events and objects by using concepts and record makingor record transforming procedures, guided by the concepts, principles, and-theories we 'employ. Gowin's "V" is a simple heuristic device to show thisinterrelationship between, on one hand,, concepts, principles, and theories,and on the other hand; observational or record making procedures, recordtransforming procedures (e.g. graphs, tables, statistical computations),and consequent "knowledge claims." Students learn to recongize that-our"knowledge claims" in science are dependent on the concepts and theoriesthat guide our inquiry, and also on our record making and record trans--forming procedures.
Thy study was conducted with seventh and eighth grade science studintsin the Ithaca, New York area Data show that both high and low abilityseventh.-and eighth grade students (as measured by standardized achievementtests) can acquire adequate skill in the use of the strategies in corjunc-tion with ordinary junior high school science programs, and that there is
an association between skill in using the strategies and positive attitudes,
toward science and success in new problem solving. Although this research
is in the category of a "preliminary investigation," with much of theproject activities centered on procedural problems for classroom instruc-tion in the strategies (including preparation of a "Teachers Handbook"),
the cognitive and affective aaievement data are positive and favor furtherresearch and implementation of the "learning how to learn" strategies.
iii
ACKNOWLEDGEMENTS
The staff of the "Learning How to Learn" Project would like, to 4
express their appreciation to the many people who have given their timeand energy so that th project and the final report could come about.
First, to the National Science Foundation that provided principalfunding for tho project through the years 1978-1980, and also to theShell Companies Foundation.
To the teachers, Sarah DeFranco of the Trumansburg Middle School,Mary Bente.and Jay Decatur.of the African Road School in Vestal, DougLarison of the Lansing Middle School. and Denny Wright of the HomerJunior High ,School. A special thanks goes to Chuck Shrnka of the Boyn-ton Junior High School in Ithaca for some initial trials with our ideas.Also, to Ron Armstrong of South Glen Falls, New York, who quite indepen-dently worked withtheSe strategies and ^raciously shared those experiencesand suggestions with us. All these teachers have expended great effortto try these ideas in their classes, and have provided honest and clear
criticism of the program. Given' all the constraints that classroomteachers work under, it is remarkable that they tolerated all the visits,
revisions, re-writes, and re-definitions with smiles and understanding.
To the students of Trumansburg, Vestal, Lansing, Homer, and'Ithada
for all their work on our behalf. Anyone involved with education known
that the student is our most severe critic. We hope that we have given
them as much as they have helped us.
To the administrators, Joseph Meskill in Trumansburg, Thomas Jones
in Lansing, Albert.Guzzi and Jack Highamin Vestal, and Harley Albro in
Homer. Their interest and support are much appreciated.
To those graduate students at Cornell who offered their time without
remuneration to work on ideas that they thought important: Susan Melby,
Erica Polakoff, and June Kinigstein. And to Kip Ault for his many ideas
and suggestions for the project.
To our consultants at Cornell, Professors D Bob Cowin, Emil Haller,
Donald Holcomb, Jason Millman, and Dom Paolillo. Their constant pressing
for the right questions to be asked forced us finally to ask them. To
Professors Robert Howe (Ohio State), Leo Klopfer and Audrey Champagne
(Univeristy.of Pittsburg), Jane Kahle (Purdue Univerity), and Jill. Lar-
kin (Carnegie'MeIlon University) for all their help and useful suggestions.
Several drafts of this final report. were prepared by Gerry Johansen
who also coordinated staff efforts during the 1979-1980 school year
iv
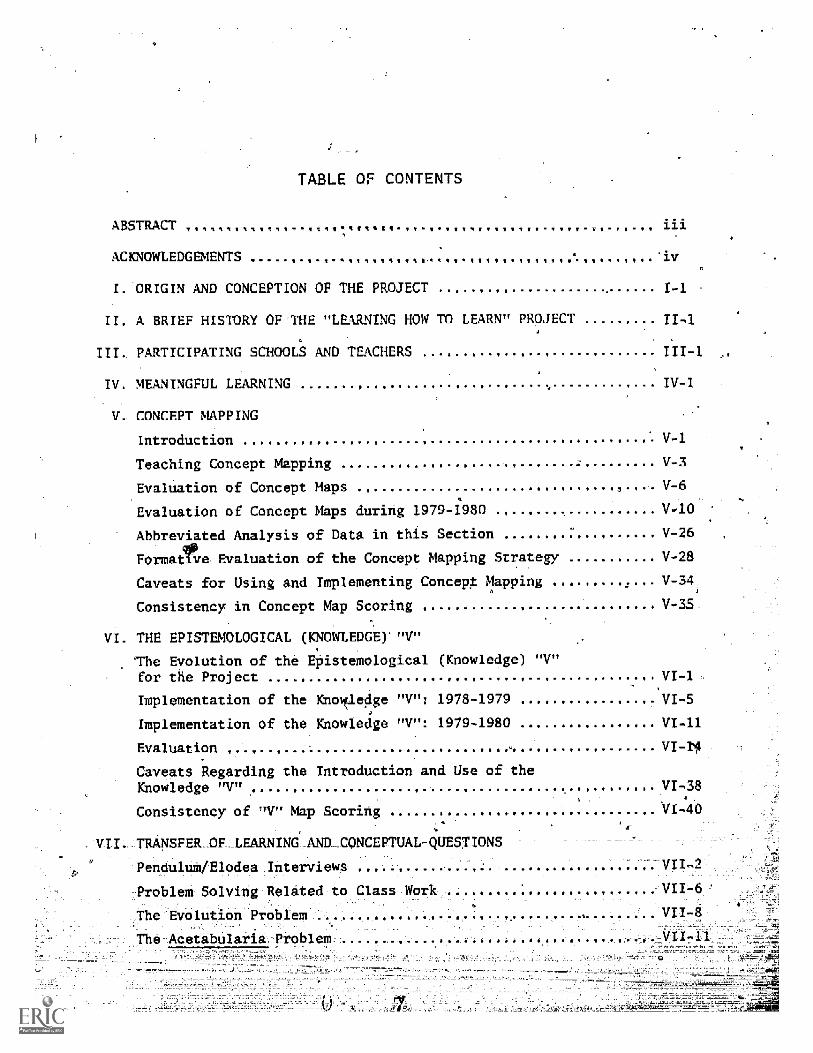
TABLE OF CONTENTS
ABSTRACT vtqt,q,lqlwoV.!41,111140.119VAI*110*!...**I.V1.# 4.* iii
ACKNOWLEDGEMENTS I t WI iv
I. ORIGIN AND CONCEPTION OF THE PROJECT
A BRIEF HISTORY OF THE "LEARNING HOW TO LEARN" PROJECT ... II-1
III. PARTICIPATING SCHOOLS AND TEACHERS III-1
IV. MEANINGFUL LEARNING IV-1
V. CONCEPT MAPPING
Introduction V-1
Teaching Concept Mapping f V-3
Evaluation of Concept Maps ... V-6
Evaluation of Concept Maps during 1979-1980 . . . ... .,........... V-10
Abbreviated Analysis of Data in this Section .. ......:.......... V-26IP
Formative Evaluation of the Concept Mapping Strategy V-28
Caveats for Using and Implementing Concept Mapping a V-34
Consistency in Concept Map Scoring V-35
VI. THE EPISTEMOLOGICAL (KNOWLEDGE)` "V"
The Evolution of the Epistemologicalfor the Project
Implementation of the Knox edge "V":
Implementation of the Knowledge "V":
Evaluation . ... ... ..
(Knowledge) "V"VI-1 ,
1978-1979 VI-S
1979-1980 . VI.11
..... . .. . .... . VI-14
Caveats Regarding the Introduction and Use of theKnowledge "V" _ _ _ VI-38
Consistency of "V" Map Scoring ................. . .. . . . . . . VI-40
VI TRANSFER_OF_LEARNIN6_AND_CONCEPTUAL-QUESTIONS-
Pendulut/Elodea Interviews .e. -VII,2
Problem Solving Related to Class Work VII-6
VII-8
.=VII-11-
The -Evolution Problem .
The-Acetabularia
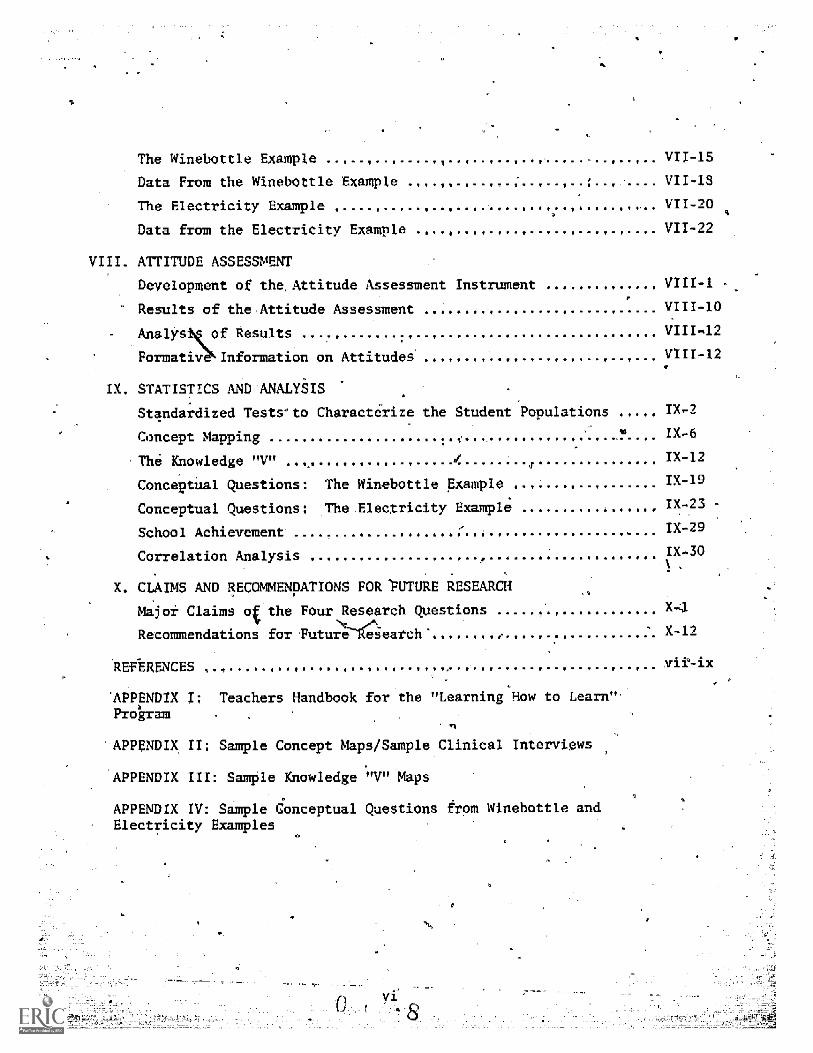
The Winebottle Example .
Data From the Winebottle Example .,..,..
The Electricity Example , , .
Data from the Electricity Example ,
-V--1
VII -.15
VII-1S
VII-20
VII-22
VIII. ATTITUDE ASSESSMENT
Development of the, Attitude Assessment Instrument VIII -1
Results of the Attitude Assessment .VIII-10
Analys Resultsofk ,VIII-12
Formati4Information on Attitudes . . . . ... .. . ...... VIII -12
IX. STATISTICS AND ANALYSIS
Standardized Teststo Characterize the Student Populations IX-7
Concept Mapping IX-6
The Knowledge "V" ... ..4........1.... ..... . IX-12
Conceptual Questions: The Winebottle Example =IX-19
Conceptual Questions: The.Electricity Example IX-23
School Achievement ......... . . . ..... IX-29
Correlation Analysis . ... IX-
X. CLAIMS AND RECOMMENDATIONS FOR "FUTURE RESEARCH
Major Claims o the Four Research Questions ., X4
Recommendations for FuturI7-gaearch*.. . ... . .. .
REFERENCES V, -1._v_.* P
"APPENDIX I; Teachers Handbook for the "Learning How to Learn ".Prokram
APPENDIX . Sample Concept Maps/Sample Clinical Interviews
APPENDIX III: Sample Knowledge "V"- Maps
APPENDIX IV: Sample Conceptual Questions from Winebottle andElectricity Examples
X-12
ORIGIN AND CONCEPTION 1F THE PROJECT
During the 1950's and early 1960's, Novak and his students conducted
research on factors influencing problem solving. This early work way one
employing a cybernetic model (Weiner, 1948; Estes, 1950; Novak, 1965) that
emphasized the ,Altinction between storage of information and processing of
information. By 1965, our research group became familiar with David:
°Ausubel's (1963) cognitive learning theory that emphasized the central role
that concepts play in the acquisition and use of knowledge, and Ausubel's
theory became the psychological foundation for our research from this time
foward (Novak, 1966, 1.977a).
Another factor contributing importantly to the conception of the
project were changes occuring in views on the history and nature of science.
Conant (1947) and later his protege Kuhn (1962) emphasized that inquiry
science is guided (and sometimes constrained) by the "conceptual schemes!'
or "paradigms" scientists invent. This epistemological shift away from
Baconian-_Pears ,mian.tradition that dominated philesophyof science for 300
_
-years led to an emphasis on the mutable, evolving nature of scientific
concepts, best characterized by ToulTin,(1972). This epistemOlogical shift.%
from a. -view cif science as an enterprise in search of "laws",of nature to
an enterprise seen as much more served by evolving conceptual schemes or
xplanatory mode 1 ,provides a view of knowledge complementary to a psycho-
logy of learning centering on the acquisition and use of concept
Over the past two decades, our research work and curriculum development
activities led in the direction that suggested that students can be aided in
Although many variations exist in the definition of "concept," we have defined
it as a regularity in events or, objects designated by a sign or symbol.
1-2
lear:ning not only through b'etter specification of learning objectives and
organization of subject matter, but also through explicit guidance to
students learning strategies. Although much of our research and related
work of Reif (1976) and his colleagues at Berkeley was conducted with college
students, our research with children (Hibbard and Novak, 197S ; Nussbaum and
Novak, 1976) and the work of Karplus (1979) and others suggested that' junior
high students should be successful in acquiring specifics strategies in
learning to aid there in learning and understanding science.
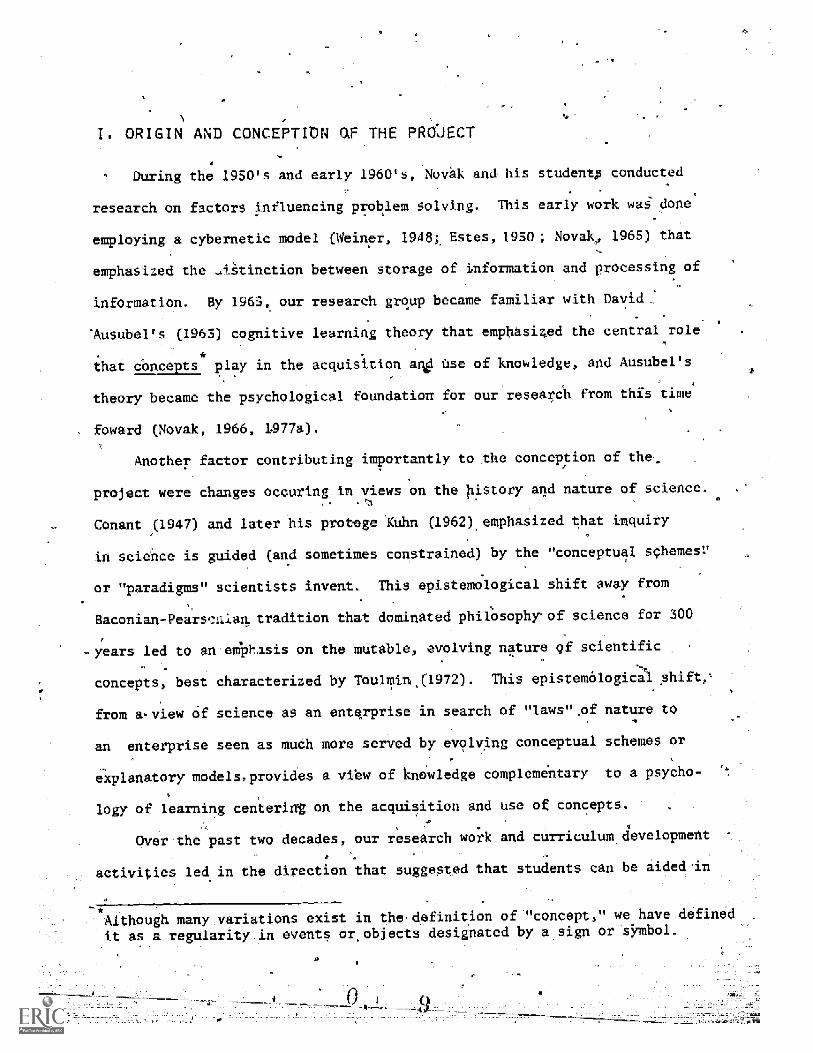
wq,From our research program and theory development, two specific peda-
gogical techniques emerged as useful learning strategies: concept mapping_
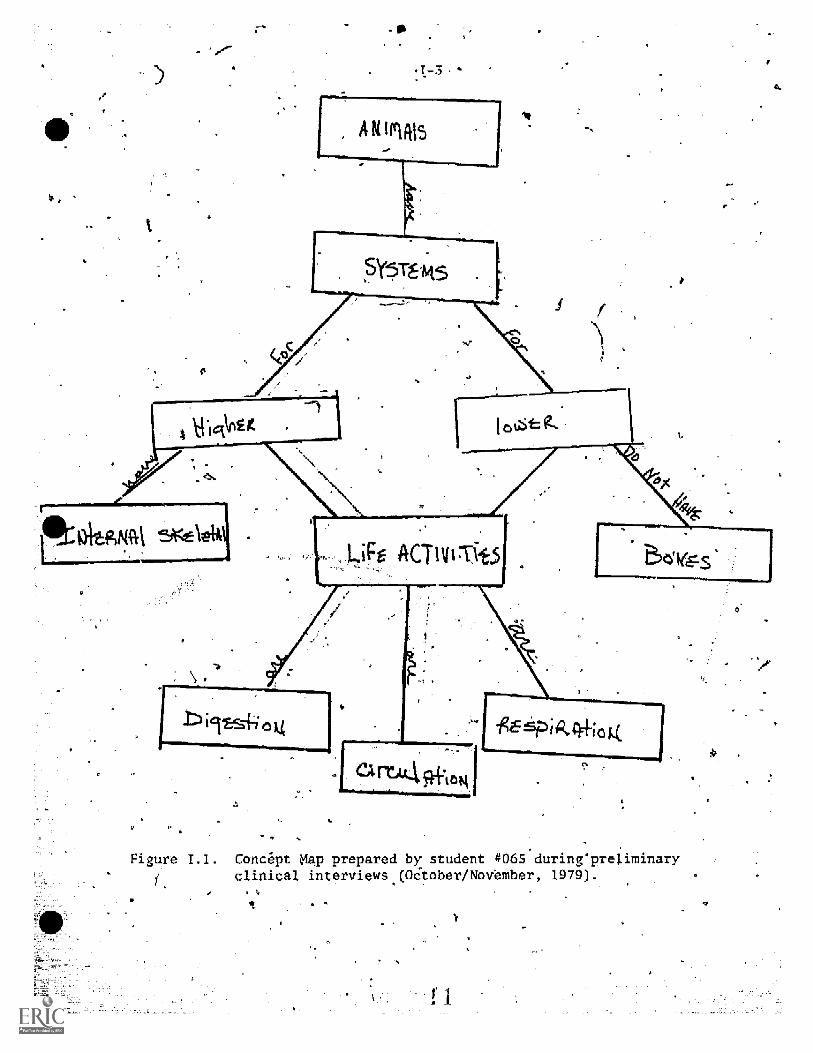
(see Figure 1.1) provides a tool for aiding students t 'Understand the
salient r9le that concepts play in learning And interpreations of events
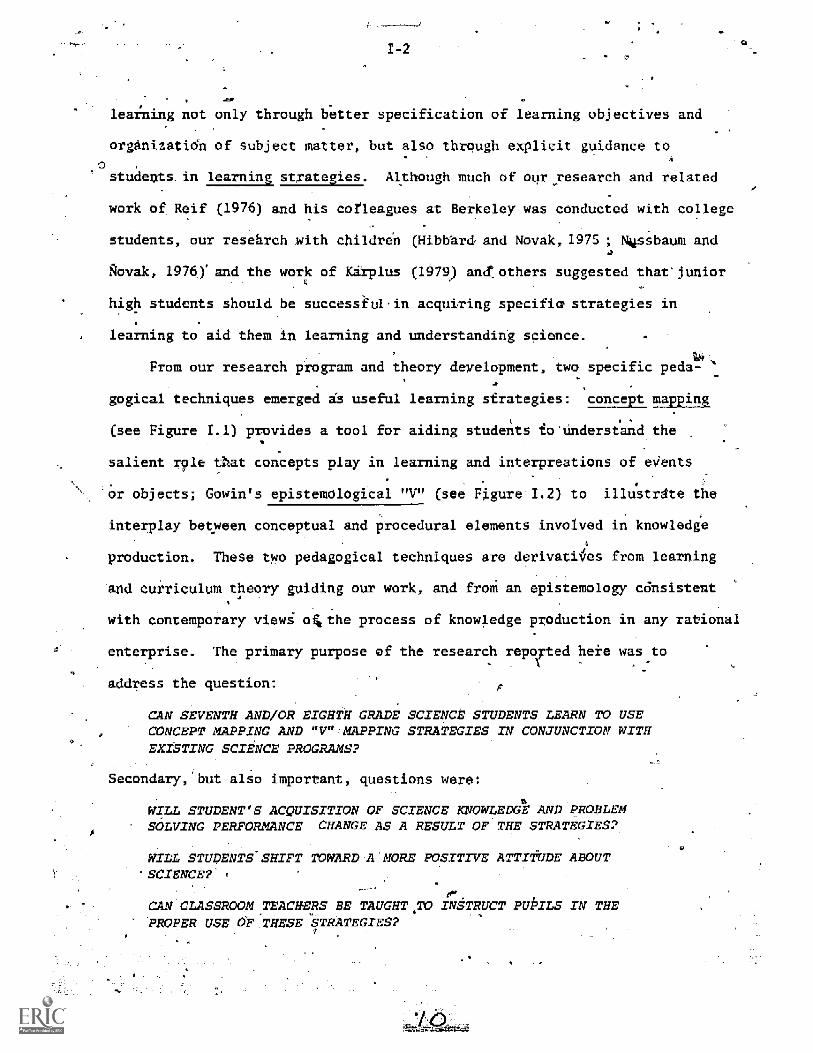
or objects; Gowin's epistemological "V" (see Figure 1.2) to illustrdte the
interplay between conceptual and procedural elements involved in knowledge4
production. These two pedagogical techniques are derivatiAs from learning
and curriculum theory guiding our work, and from an epistemology cdnsistent
with contemporary view i o the process of knowledge production in any rational
enterprise. The primary purpose of the research reported heie was to.
address the question:
CAN SEVENTH AND/OR EIGHTH GRADE SCIENCE STUDENTS LEARN TO USECONCEPT MAPPING AND "V" MAPPING STRATEGIES IN CONJUNCTION WITHEXISTING SCIENCE PROGRAMS?
Secondary, but also important, questions were:
WILL STUDENT'S ACQUISITION OF SCIENCE KNOWLEDGE AND PROBLEMSOLVING PERFORMANCE CHANGE AS A RESULT OF THE STRATEGIM52,
WILE STUDENTS SHIFT TOWARD A MORE POSITIVE ATTITUDE ABOUT'SCIENCE? *
CAN CLASSROOM TEACHERS BE TAUGHT TO INSTRUCT PUPILS N THEPROPER USE OF. THESE STRATEGIES?
g
-0
ANA'
Figure Concept Map prepared by student #065 during'preliminaryclinical interviews.(October/November, 1979).
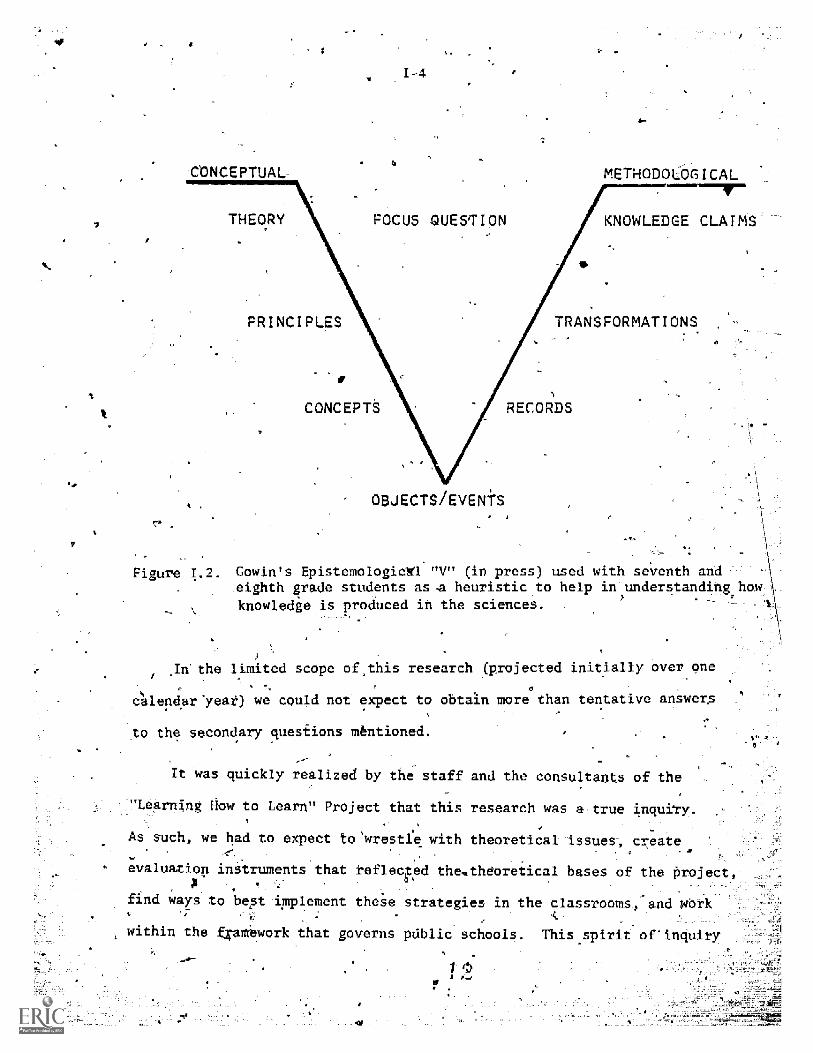
CONCEPTUAL-
THEORY
Figure 1.
1-4
FOCUS -QUEST I ON
6.
METHODOLOGICAL
KNOWLEDGE CLAIMS
PRINCIPLES TRANSFORMATIONS
CONCEPTS RECORDS
OBJECTS! EVENTS
Gowin's EpistemologicX1 "V" (in press) used with seventh and.eighth grade students as .a heuristic to help in'understanding hot
knowledge is produced in the sciences.
.11n- the limited scope of_this research (projected initially over one
G
calendar'year) we could not expect to obtain more than tentative answers
the secondary questions mentioned.
was quickly realized by the staff and the consultants of the
" earning Row to Learn" Project that this research was a=true inquiry.
As such, we had to expect to'wtestie with theoretical- issues, create-- ..
evaluation instruments that reflected the.theoretical bases of the project,A
find ways to best -implement these strategies in the and work. -4.-
within the ramework that governs public schools. This spirit of inquiry
rb
% red ecte i eport that=lollow,--not.only-in-,,,-
-
----------mr--- p..------_- - -
deSet4tionS:4fid examinations of what worked_ the-researeh,-but also with
-ne work. In Some respectsthis,latter-doncernt ettriptient==o
-since_it provide ther.5researchers with standards of
_net piarsue what has already been shown to-be ineffective.
nitially,-our plan was to have research project 'staff members teach
:404earning Strategies, using the subject matter ordinarily presented in
#classroom, However, the teachers who chose to work with us were
-intrigued by the strategies and preferred to incorporate them into their
wnlinstruction. This, of course, was more desirable, not only becauseff
tpleaSed;staff time for evaluation and other &ties, but also because
[*we prodise for eventual wide-scale dissemination of the learning
5 Sttategiesw
- -ere. hopeful, that some `explicit instruction in learn figl3Sychology,
eSpeCally on:the'rele that concepts, play in meaningful-learning,=would
n readee and permeateIinstraction in the program. While allteachers were. _
4
to ntroductory'materials on'the.psychology ofdearning (see
peddix Isecticin II),'there was 'an apparent lack efenthusiasm on the
a :tof-the.teachers to continue-to stress the psychological basis for
ngful,learning. .This issue will be., important to ,future research studies'
-Toying thestrAtegiesi some of which are now in progress.
w-
iiti ,previous weriel4th _college students, we expected acceptance
Fe,on the part of the students, but wemere surpised
_
enthusiasm with which students engaged in the strategies,
espickal Yekthe,use 'Of concept-mapping. The remaiAder-of the report
hif .-
learning strategies'as__
to the .questions" cited
revidegriateriiietail on' the utilizatien or the*4gx-7.74g
o_iginaalyxaiiieeivedandvempirital data relative
Ft',:
BRIER HISTORY OF THE "LEARNING HOW TO LEARN PROJECT
ApptcivAL cif funding for the- project 4aa- reCeived it=0Ctober,:1978. We_
hid'made preliminary arrangements with the Ithaca:CitYSchools to conduct
the research_in-the-
=-
ltwo junior high schools that district. A meeting:-
with administrators, principals, and science chairpersons of the two junior
high schools and project staff was heldin early November. Project staff
had been recruited from the pool of graduate students-with ekperience at
various levels of science education. A research associate who was familiar
with the theoretical foundations and activities of the planned work was
employed full-time.
The administrative staff was receptive and enthusiastic
the project commence but we were somewhat, surprised' to find-many-of the
science teachers relatively cool to the prospects of a "new thing to
dealt with". This may have been due in part to the teacher,contract
negotiations underway and/or other teacher-admi istration problems extant
in Ithaca at that time. -We found later that similar problems' would be
evident in the Vestal City Schools; once again we witnessed some of the
problems associated with educational-research in "real world" settings.
Nevertheless,tWo junior high {teachers from-Ithaca did volunteer to begin
work with use and preliminary instructional work began in November,
We Segan working, with groups'of 10 to 20 seventh grade, students who
volunteered to participate in "8th period," an aftgr-school period for
:special activities prior to final school bus departures. or.the- Most part,
these_students Were highly enthusiastic and cooperative,.and helpful to%
us.`-. They sought examples of concepts and other items on Gowin's "V", relative
to their classwork, indicating that the educational concepts we were presenting
11-2
could -be best understood inthe context of the regular science classwork.-
Confident that we could begin in regular classes, we began with one clas
and: later proceeded to work with :all but one " "special class of Seventh',
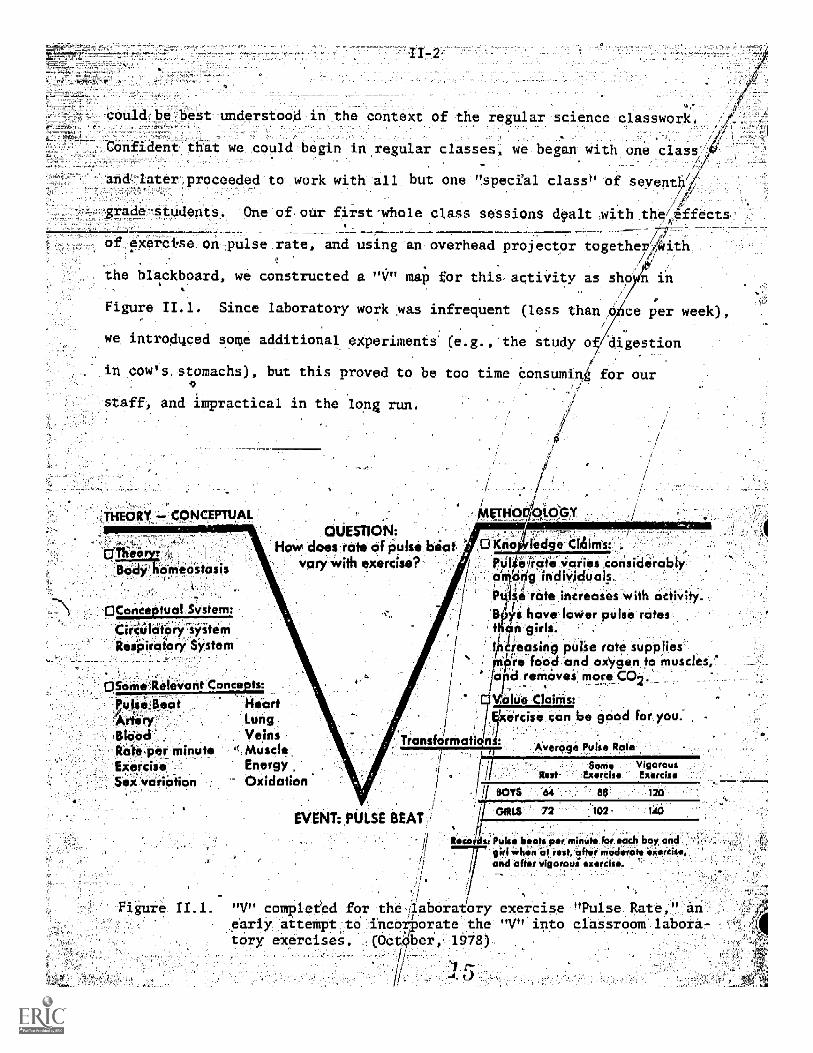
-g7a4e-students. Ont our first-whole class sessions d9alt with theAffects
of exercise on pulse rate, and using an overhead projector together/with. e
the blackboard, we constructed a "V" map for this activity as shoin In
Figure 11.1. Since laboratory work :as infrequent (less than ,ace per week),
we introduced some additional experiments' (e.g.,'the study g, digestion1.
in covets. stomachs), but this proved to be too time Consuming for our.1;
staff, and impractical in the long run.
THEORY, CONCEMAL
Thierc:Body homeostasis
OConceptual System:
irCuIatory systemaspiratory System
QUESTION:.'How does:: rate of Puisii:bio
4ory:With:exercise?-
°Some Itelevani Concepts,Pulse,Beat HeartArtery,BloodRate-per minuteExerciseSex'variation
LungVeinsMuscleEnergyOxidation
Figure II
Tr nsforma
METHO 010-GY
Cl Kno ledge Cl irrts
n
Pul irate varies considerably'among individual!.P tse rate increases with activilR}ys have. lover pulse rates
n girls.teasing pulse rate suppliesre food and oxygen to muscles,'d !emdvei more CO2.
lux- Claims:
EVENT: PULSE BEAT;'
ercise can be good for you:
Average Pulse Rafeson,. Vigorous
Rant- Exercise Exercise
BOYS 64 120
GIRLS 72 2 140
Pulse beats per minute for,ea ch boy andichen at rest, -after
and afterinaaarate'exercise
Botous-exercisti.
"V" complet9d for the laboraiory exercise "Pulse Rate," anearly attempt to :incorporate the "V" into, classroom labora-tory exercises. (October, 1978)
class sessions in which our project staff led instruction
'"1."- maps, the regular classroom :teacher exprestedAnteres
he proCedures as part of this teaching, so the staff.
began-to shift to focussing on providing suggestions for class activities
and preliminary efforts at evaluation procedures for the use with the "V'
Unfortunately the teacher decided to resign from teaching at the end of
the school year and did not wish to continue his initiative in, using the
strategies. We sought other teachers during Decemberand January. Contacts
had been made with an eighth grade teacher in the Lansing Schools.
expressed an interest in our work and we commenced classroom instruction
in. January. Further information about participating schools is provided
Section' III.
At-the Lansing-Middle e made rapid progress in
the "V" with the much iore extensfve use of laboratory work associated with. ....
the INTRODUCTORY PHYSICAL SCIENCE (IPS) Program in use with eighth grade
classe Evaluation strategies e developed and evidence was obtained
indicating most of the eighth grade students were highly successful in con-
strut g "V's" and in interpreting them '(in ciinfcal interview sessions:
Condept,thapping was initiated-in March, 1979 and this also iiroceeded well,
and was ell received by the students. We began work with concept mapping,
with aseventh grade science teacher in Trumansburt and made arrangements to
'.,begin ,work. in seventh and eighth grades in Vestal New York, At both
'Trumansburg and Vestal we first introduced students -to some activities
illustrating meaningfu learning (Appendix Section and then-instructed,s
learning activities, (2) concept
d (3) "v" mapping, proved to be procedurally more appropriate
e in concept mapping. The sequence,
mapping,
and easier than the sequence beginning.with V" mapping eMployedin Ithaca
8y:the-end of the. 197871979.-school year, we lad--suceeeded.'in,Treparing,
s
/ / :-
-Handbook" for- -use with teacherS Wishing-to- use the:a-preliminary- "Teacher'
strategies and had developed evaluation approaches asseising students'
success with concept maps, "V" maps,and science problem solving. Although
all of these materials and procedures underwent extensive modification and
refinement during the 1979-1980 school year, we were prepared to begin the
fall semester at Trumansburg and Vestal (the J.,ansing teacher returned to
Cornell for graduate study and became a project staff member). The turnovera
of participating teachers and school districts necessarily delayed progress
on, the project and' the original twelvemonth schedule for the research was
necessarily extended. However, the. change in procedures (from staff-led in-/
struction to teacher-led instruction ) -and the wide array of participating
Schools involVed added to the promise for wider 'dissemination of.the program,
should evaluation data indicate me to the program.
September, 1979 found Vestal in a contract dispute resulting in a "work
tovrule" pressure on participating teachers and slowed progress in the intro-
duction of the strategies. At Trumansburg however, work began in
,
in the,Fall semester and continued smoothly throughout the academic year.
A'ninth,grade science teacherlat South Glen Fails New York and a seventh- -1
_grade teacher in-Homer,'Ne0ork.expressed interest in out project
ediately
the.preliminary Teacher
Using
andbook and minimum guidance from our project
staff-(two-or three conversations), these teacher's reported-Success and
enthusiasm in implement,ilig the strategies. -Although we were slow to begin
use of-the earning strftegiesAn-Yestal, concept Mappinginstructioh.pro,
seeded well iii both seventh and eighth grade science class,"while.IP mapping
was extensively used 'n the 'eighth grade class. 'Procedures, for instruction,
were further refined as the theoretical eoundation of the project was more
extensively articulated ,h This resulted in a corresponding growth in the
would be employed throughout the school, year.
Data ,collection proceeded-throughout the year, largely for formative'eva ua-
t n purposes in the fall semester, but increasingly to serve as a basis for4
summative evaluation claims, especially friom March-June, 1980. Detailed
descriptions of instructional procedures and evaluation follow in later
sections:
DATING SCHOOLS AND TEACHERS
In Order to charac erize -the schools ith which we-worked during the
two years of our study, the following is given. In addition to information
about the schools, the professional preparations and backgrounds of t e
four teachers involved in the project are also described. Although we
began our study in the Ithaca City Schools in November, 1978, and contin-
ued some work into the Spring semeter, 1979, this was essentially "pilot
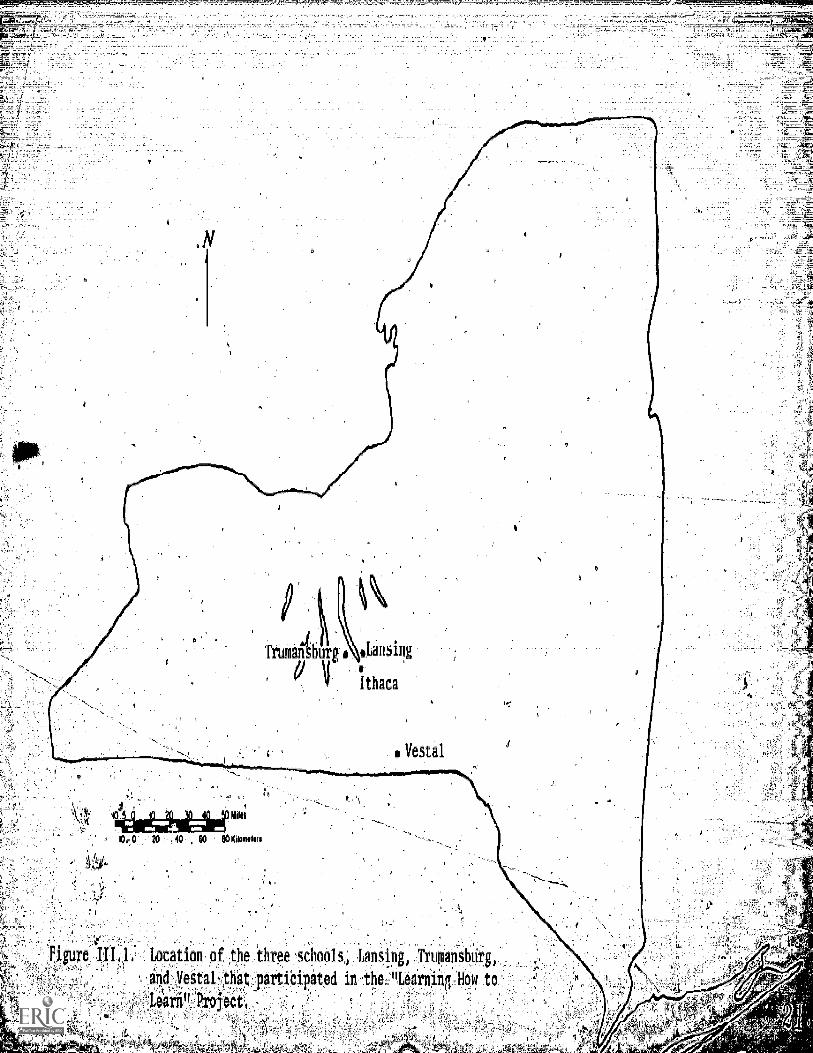
program work and did not involve later performance comparisons. Figure
III.1 is provided to show the relative positions of these schools toV
Ithaca.
Lansing is a town with a population of six thousand and isi cated-
about ten.m es.north of Ithaca New York. It is a iddle class
community, and is 'classified y, self admission as 'Turban," that is,
,composed of rural d urban-factions. There are three schools in the
district: one elementary serving,grades K through 4; one middle school
for' grades five throu eight;-and'a high school for nine through
elve. Our,project was.-involved with the eighth grade science. teacher
at the middle school which had a total student population of 375 _in
1978 -1979 with eighty -eight .in the eighth grade. A formal seen
curriculum exists for the middle school, and high:s
sburg is located abont ten miles from Ithaca on the -west side
of Cayuga Lake`. Itchas a population of about thyee thoniand, and is =
classified as. suburban. Like Lansing, there are-three;,Schools in Trumans-
bnrg:- one elementary serving grades K through fouria middle school for
grades ive through eight
PAEOLIVer-,
Truman burg Lansing
Ithaca
Vestal
lidiLmitiTz Mitt10.-0 20 :40 0 00 444mthri
rF
inure HU rat an of the three schools, Lansing, TrumansbUrg,
and Vestal that participated in the-"Leaining-How to
2.4612411401i..,ff
ir
wel-Ve. The student population in the middle school is slightly higher
atC:CanaingWith 393, and abouVone hundred: of theie students are
-seventh graders. A formal science curriculum exists for
hrough twelve.
Compared to Trumansburg and Lansing; Vestal is a very large school
district, serving a community of 26,000. Vestal is located along the
Sourhern Tier of"New York state, about ten miles west of Binghamton.
assified as suburban and is middle class. Vestal -has five
elementary schools, a junior high school composed of seventh and eighth
grades ninth grade school, ,and one high school for grades ten throUgh.
twelve.
-Twelve,
Road. Jun
science curriculum exists for grades-seven through
superviaed by .a district science coordinator. .Africa
Fifth School, the school in which we worked,,enrolled3 almost
eleven hundred students evenly divided between the seventh and eighth
grades. The Project worked with two, teachers there, Mary Bente in
___,the_aeventh grade, Jay Decatur in the-eighth.
Doug Lariaon,',:LansingMiddle School, had:been teaching for four
and one-half years when he volunteered to work, with our project. He .-
. .
earned7t BS degree from Cornell University, and had been teaching physical
'science for four years, 'the last -two involved with then. IPS Program in
Lansing. After the first yearli'invoTvement with our project,
larison,returned to graduate school at 'Cornell to pursue his permanent
.ceitification from New York-Statb and a Masters d
edUcation. As a student during the 1979-1980 school year, Mr. Larison
corked as a research assistant on the staff of the "Learning How tofig=
e in science
-Sarah DeFranco rUmansburg Middle School, wa s an ,eight
when she signedeniro--work -.-with, our projectrin the Spring of 1979,. She
received an Associates degree from Auburn Community College, her BS
from Cornell University, and her Masters degree. from Elmira College.
During her eight years atTrusburg-,--Mrs DeEranco was an elementary
common branch teacher for one year, taught ISCS in eighth grade science
for three years, and junior high biological science for seven years.
Mts. DeFranco continued with our project through its completion in
June,-1980.
Jay Decatur.had been teaching in Vestal for the twelve years 'of
his career. He had attended Elmira College, 'SUNYL at Binghamton, and
h_gexas and possessed thirty-eight credits beyond his BS.
degree. He has taught Science 7 for four years, Science 8 for nine
years, and Science 9 for two years.
Mary Bente had taught for-six years in the African Road Junior-
Htgh School when she volunteered for our.project. She majored'in
elementary and secondary science education at SUNY at Oneonta, and
possessed-thirty credits ,mostlyin special education, beyond her BS.
Miss Bente has taught Science 8 in Vestal for three years and has been
teaching Science 7 for the past three years.
Vi MEANINGFUL LEARNING
_arst work with students was with a group of volunteer in ithata's
'Boynton Junior High School after regular classes. We offgred-a definition
f concept* and,asked the studentt to name other concepts and to designate
the objects and/or events relevant to those concepts'. The students respond-.
ed to questions rapidly and were eager to get on to !the discussion of
"how to learn better," WhiCh we said would be the subject of the after-
class Sessions. They thought the distinction we made between rote lea
ing (simple memorisation of statements or definitions) and meaningful,
.learning (relating new knowledge to know1Pdge previously learned)'was
.rather obvious. They persisted: "But how do' we'learn to learn'better?";,
_
"HoW willthii help me to learn science?" It became clear to ut that
we needed to apply one of our. key principles of learning to relate
new knowledge to thinks the students already knew about science,*and to
things they were currently learning in class.
We proceeded to introduce 6owan's "V" and the terms associated with
this device, relating this to work they were doing .in class; i.e., frog)
dissection. We also introduced-someYkames" as motivational devices;
e.g. "see, how many events you can write down in three minutes." (Most
studenti could. correctly identify six to ten events.) Although we were
successful in familiarizing students with the elements of Gowin.,,s 111,111,
we felt-that students:were largely uncertain,as to how the "V" related
as no e l earlier, we define concepts as regularities in events and objects
designated by a sign or symbol.
to the study of biology. This impression persisted until' the Christmas
break .as we continued work with laboratory activities and use of the
"V" (see Section VI of this report
As a result of our_experiences at Ithaca's Boynton Juhior High
_School, we decided to use-some activities at Lansing Middle School
specifically intended to illustrate concepts of learning. When we
-commenced work W.Sh students: there in February' 1979, we begaw.with
A
activities illustrating sensory memory, short term memory, and long
term memory. Modified versions of these.activities are Included in
the Teachef's Handbook (Appendix 1, Section III).
Spidents were highly responsive to the learning activities, and
we have foUnd this to be true with college students also. Although no
formal native evaluation of-these activities was-done:we found that
virtually allfatudents could distinguish between- sensory;,short-tbrm,
and long-term learning events. They were also successful in labeling
instances of learning as essentially rote or Meaningful in char4cter.P
Our judgment-. was that these activities were successful, so we did not
eipend effort on evaluating this phaseLef-the project, retrospect,
however, both teachers and students may have gained superficial knowledge
of the various types'of learning, and this may have limited Some of the
intential value in later concept mapping and "V" mai:Tang. We would
recommend further-research on levels of achievement of understanding
of these forms of learning, and possible relationships to sUccessin
concept' mapping and "V" mapping.
IV-3
pite of the li9ited evaluation, both tea-hers and stetents
reported satisfaction and success with the "learning activities." ,We'
also found that the introduction of concept mapping went much more smoothly
when these learning activities preceded concept mapping Since.only a
portion of two or thrpe class periods is needed for these activities,
teachers have all regarded them as worthy of the time involvement.
An unusual number of-Ipositive responses are also being received from-A
% publishea'paper (Novak,:t980}^ in which these learning activities wore.
presented. Unless further research should cast some doubt on the use of
these activities, we recommend that they he used*as fihtroductions to the, -
learning strategies of concept mapping ane"V" Mapping.S
V. -CONCEPT MAPPING
Introduction:
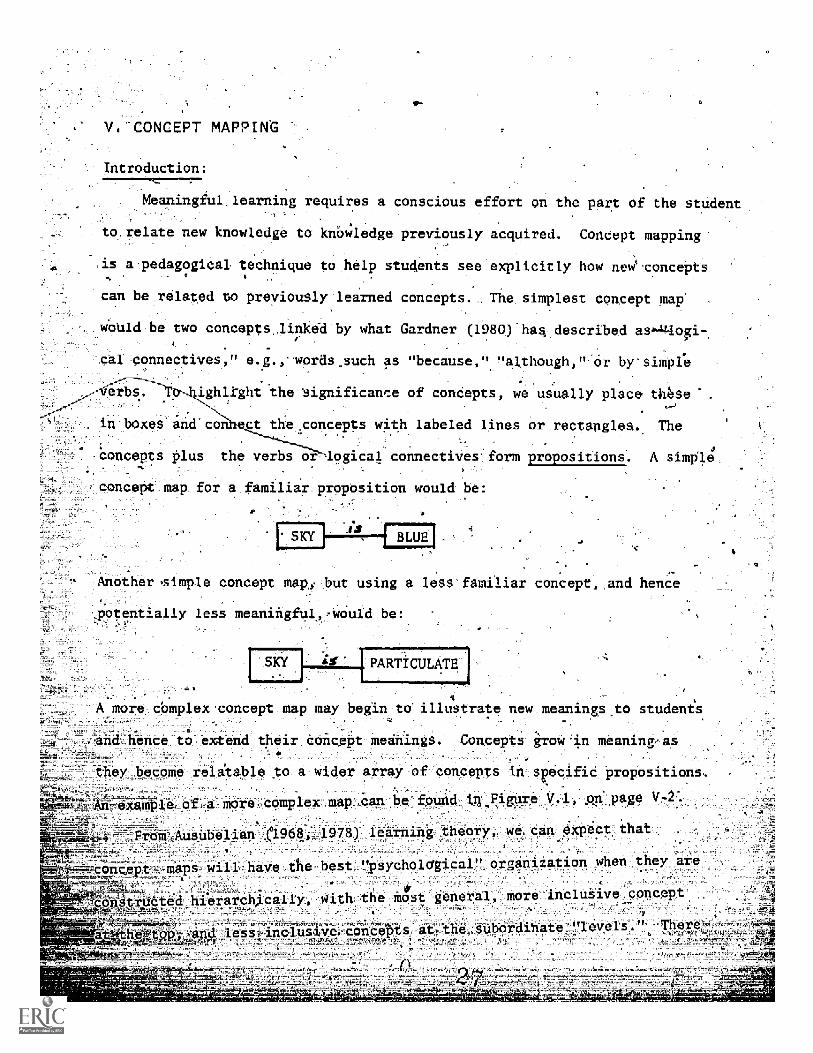
Meaningful learning requires a conscious effort on the part of the student
to relate new knowledge to knbrhedge previously acquired. Concept mapping
15 a.pedagogical technique -to help stu ents see explicitly how ne i concepts
can be related to previously learned concepts... The simplest concept map
would be two conceptsJinked by what Gardner (1980) has described asP-4--loi
'cal connectives," e.g. ,..words such as "because," "a ough," or by-simple
erbs. igh1ight the significance of concepts, we usually place these
in boxes' and~ co ct the ,concepts with labeled lines or rectangles. The_
concepts plus the verbs or-logical connectives form upositions. A simple
=concept map for a familiar propOsition would be:
SKY.8 5
BLUE
Anothe -simple concept map. but using a less fami
potentially less meaningful,_ -would be
PARTICULATE
_a_ concept, and hence
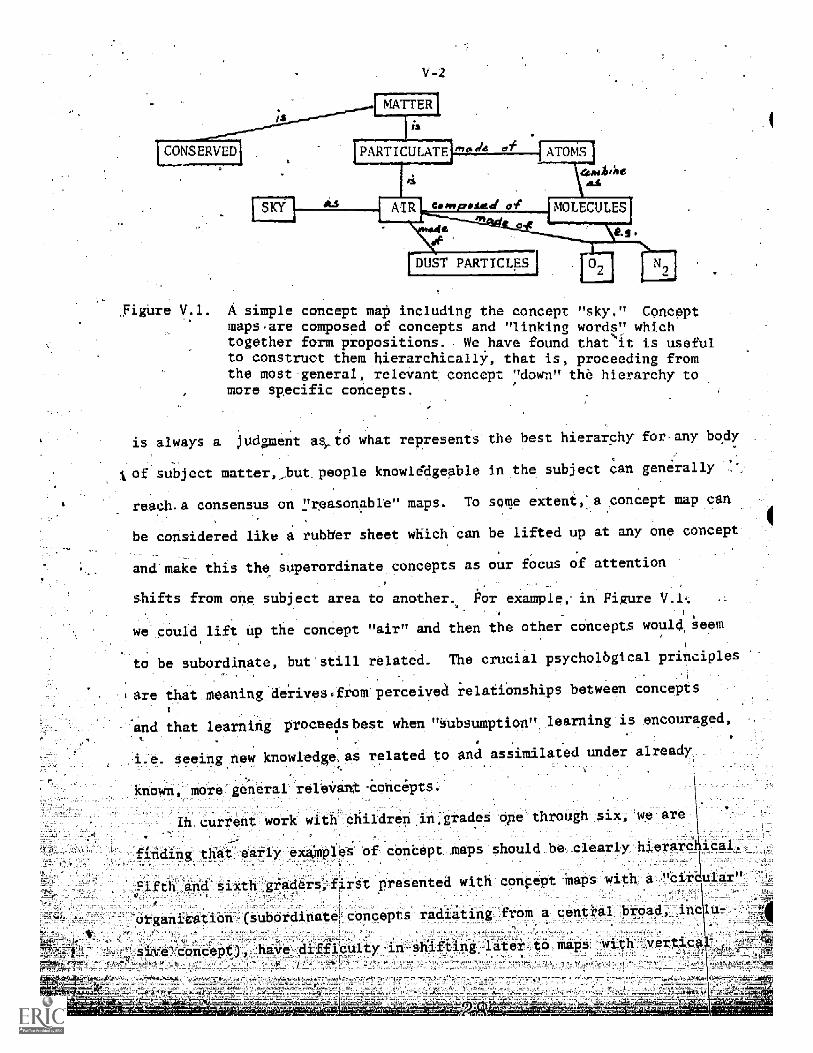
Amre-cUmplex-concept map may begin to-illustrate new.
..and hence to extend their concept meanings. Concepts grow
= =
-ings.to studen
in meaning,as
s
they become relAable to a wider array of concepts in specific propositions.
example o a more complex map can be found in,Figure V.1, on' page
once
om Ausuelian 1968, 1978) learning theory; we can expect that
.Emapswill have the best "psycholdgical" organization when they are.
' --,
con Stiiktedlhie r a Tchically, with th e most g-- e n e- ral,-more inclusive concepti. . ,
a e 6 A- --And-lessneAUSIV-6.-tOntel5ts at the tubOrdinate T"levels . iv There ,.
F
V-2
PARTICULATE
DUST PARTICLES J
re V.1. A simple concept map including the concept "sky." Conceptmapsare composed of concepts and "linking words" whichtogether form propositions. We have found thatit is usefulto construct them hierarchically, that is, proceeding froMthe most general, relevant concept "down" the hierarchy tomore specific concepts.
is always a judgment asto what represents the best hierarchy for any body
of subject matter,_but.people knowlddgeable in the subject can generally
reach. a. consensus on "reasonabre" maps. To some extent, a concept map can
be considered like a rubber sheet which can be lifted up at any one concept
and make this the super-ordinate concepts as our focus of attention
shifts from one subject area to another. For example, in Figure V.1
we could lift up the concept "air" and then the other concepts wouldee
to be subordinate, but still related. The crucial psychological principles
are that meaning derives.from perceived relationships between concepts
and that learning proceeiisbest when "subsumption" learning is encouraged,
i.e. seeing new knowledge.as related to and assimilated under already,
known, more general releVartt-cohcepts.
current work with' children ilLgrades one through six, we are
finding that, early examples of contept maps, should be clearly hierarc
Fifth and sixth graders,first presented with colvept maps with a "circular"
organization (subordinate; concepts radiating from a central broad,inclu-- s _
s ive dondept), 'have difficulty in shafting_ later to maps 'with vertica
V- 3
hierarchy. On the other hand, first grade children presented initial
examples with a vertical hierarchy could construct, good concept maps
given a List of familiar words selected to have potentially "top - down"
hierarchical order.
From a brief introduction to concept mapping, students can quickly
see that the 'structure" of knowledge can be very complex, that almost any
concept can be related to many other concepts, and that there is no one
"best way" to represent knowledge or to draw a concept map. We have found
these facts to have motivational value; since constructing a concept map
.proves, to be something like puzzle solVing and students can compare,
contrast, and.criticize others' concept maps, even those made by the
teacher! Furthermore, students recognize that they do know conceptsthat
are relevant to new learning and that they can, if they try, learn new
material meaningfully. Concept mapping is a natural extension of the
learning activities discussed above,for it is the framework of concepts and
propositions a student knows that will determine whether s/he sees meaning
in a new learning task, or must resort to rote learning. Concept maps are
also a way of representing externally the web of concepts and,propositions
in long term memory that comprises the individual's cognitive structure.
Teac ng Concept Mapping
-Early in our work we found that a good ay to begin concept mapping was
to_have students identify alkof the science concepts in a segment of their
textbook or laboratory study guide. This
to a teacher, for a single page may contain as many as twenty or thirty,
task alone often brings surprises
'science, concepts or other English words that have special meaning, in the
=
V.4
context of the science lesson. For ex Aple, words such as "greater" or
"less than" may represent speci c-qOantitative regularities, rather than a
more general notion of "larger".dir s eller."
Next we asked the studentto order or rank these-concepts in a list
so that the most "important" or most general concept is first and the less
important, more specific concepts come later. While the first step (identi-
Lying concepts) requires some thought and careful reading, the second step"'
really bedomes challenging. Students need to,evaluate ,what the reading
passage is all about; what the most important:idea of the concepts-
being discussed, and, what is elatively less important. But in spite of
this challenge (or is it because of t?), students generally give positive
reports on their reactions to concept mapping. (Some quotesfrom
will be given below.)ft
We have also tried having students prepare concept maps in small groups';
(two to four stud n ), and to reach a consensus on their map. Much
lively discussion commonly ensues. Another strategy employed has been to
students
have individuals or groups draw their maps on the blackboard or prepare their
maps on transparencies to be shown on the overhead projector. The discussions
that follOws usually challenges the construction ofthe map -- what concepts
are-at 'the top or at the bottom and what kinds of linkages are illustrated'
n the concept map.
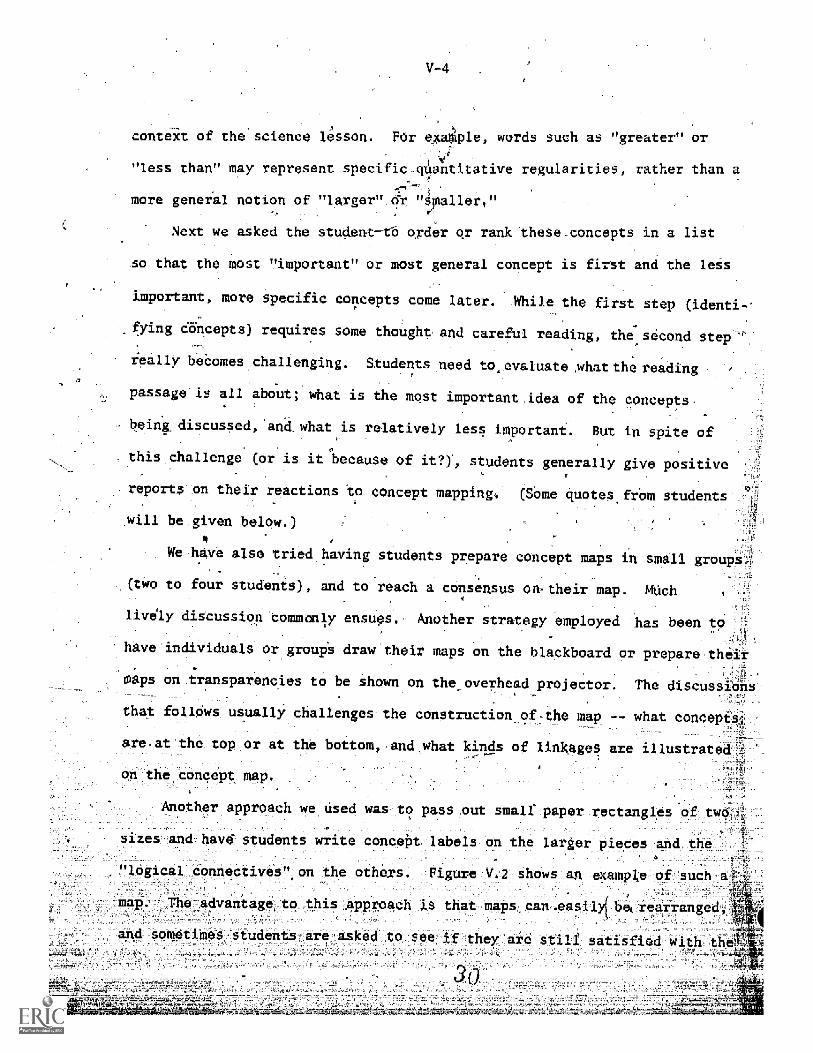
Another approach we used was to pass. ut small- paper rectangles of t
sizes and havd students write concet labels on the larger pieces and the
"logical connectives on the others. Figure V 2 shows an example of such
map. The advantage to this Approach is that maps can.easily4 bei rearranged,
and sometimes-students are asked-to see if they are still satisfied with the*-
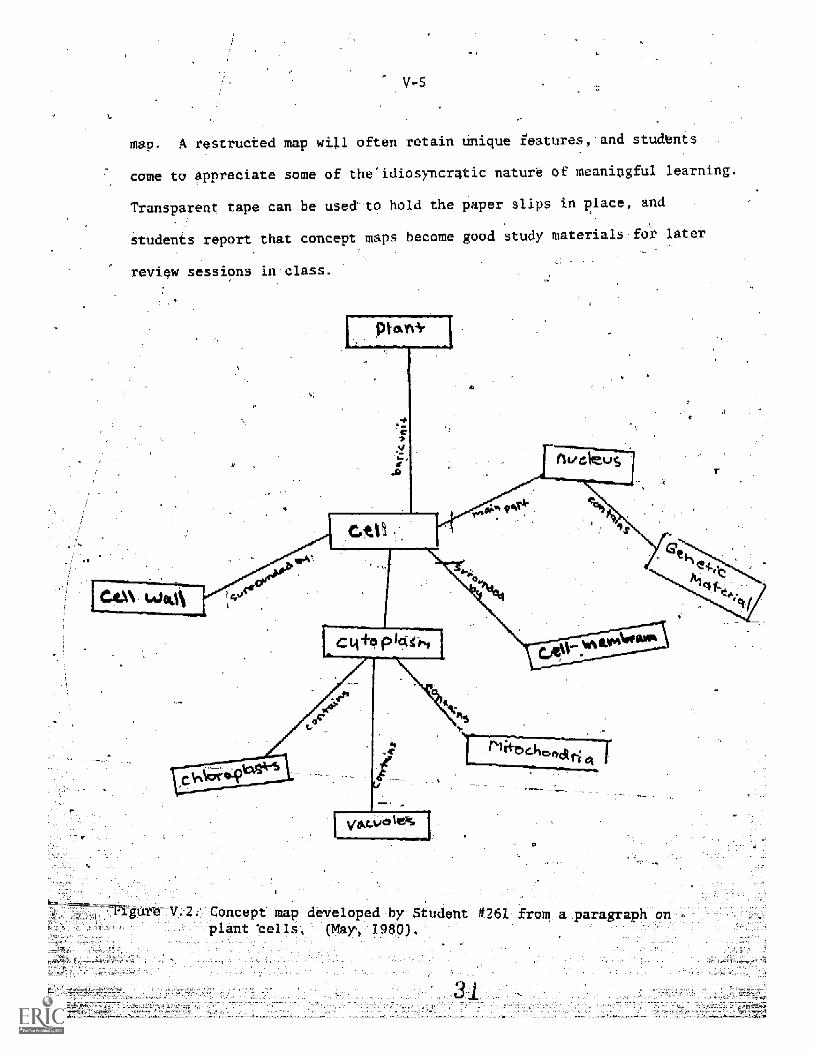
map, A restructed map will often retain unique features, and students
Come to appreciate some of the idiosyncratic nature of meaningful learning.
Transparent tape can be usedto hold the paper slips in place, and
students report that concept maps beCome goad study materials fo later
rev]. ew sessions in class.
V
igUre V Concept map developed by Studentplant tells Nay, 1980)
- Evaluation of Concept,Maps:
'V-6
Previous research employing concept mapping (Stewart, VanKirk, and
Rowell, 1979; Morels, 1979) nad provided some foundation for our evalua--
tion program. Hbwever, we found it necessary to construct much more
explicit criteria for evaluation, and also criteria:simple -enough to be
used by the busy-classroom teacher. In order to refine our evaluation
criteria, we began by using a clinical interview approach (Pines, et al.,
1978) with students constructing a map from a specially written paragraph
(see pages V-Il through V-24 for the paragraphs and then explaining to
the interviewer why they constructed the map as they did. Appendix II
gives complete transcripts from two clinical interviews.
The clinical- irate yew protocol included the follOwing dleMents.
First, we would ask the student ,to read a paragraph that was based on
material that the _student had already had in class. The paragraph was
purposefully short, not more than fifty words, with usually no more than
ten relevant concepts. After'thestudent had read the paragraph we
asked him/her to write the major concepts on small pieces of 1"
green paper, and to,use other slips of paper (1/4" x 2" yellow) to repre-
sent the lines between the concepts. Students were not told to write on the
lines, but only that these yellow slips represented the.lines. We wanted
to determine'if the students knew what they should write on these_ lines,
ental -element of
use of pieces and slips
-oncept mapping. The reason that we adopted the
of paper, rather than having the interviewee
.write directly on sheets of paper, as to facilitate any changes of the
map during the -intervi
Once the concept map was completed, we asked the interviewee, several
questions relative to the construction of the map why that one ,concept:
V-7
was on top, explain the relationships represented by the yellow lines,
why are certain concepts were lower on the map, and we probed generally
the structure and content of the map. Of course, tape recordings were made
of each of these initial interviews, and the,concept maps were Scotch-taped
down into a more permanent form of records. transcripts of each of
the audiotapes for these and subsequent interviews were also made.
These initial interviews were conducted with approximately eight students
from Trumansburg during late May and early June, 1979. With the end of
the school year quickly_ approaching, we decided that this small.number was
enough to begin-developing the criteria for assessing the concept mapping
.strategy (see the next part of this section.)
During the early pail; 1979, the staff again turned to the interviews
to revise them. It was felt that the interviews should also probe how the
students feel about concept mapping, and in addition to determining whether
students could actuall
interview protocol.
Trumansburg again in October, 1979.
to test the adequacy of the protocol
y construct them. This, then, was included in the
A preliminary set of interviews was conducted in
who had joined us that semester
these initial intervie
The intention of this set was
and to acquaint new staff members
ith the.interviewing technique. From
s in October, the staff revised the paragraph that
was to be presented to the students du
During the course oUseveral se
g-subSequent interviews.
es of interviews over the,year, the.
decided to use a larger piece of paper (18" x 12") asthe base for the
students maps. The small size of the 8-1/2" x 11" sheets, of paper caused
cramping of the concept map. The larger sheets were less confining and
less confusing. Our Xerox machine could reduce these larger maps to a more_
manageable ,size for th transcripts o the 'interview
V-8
Throughout the Summer, 1979, the staff, using-the preliminary inter-
views from the previous Spring in TrUmansburg, tried to devise adequate
criteria for assessing the concept maps that students would construct during
the clinical interviews. Finally, in the Fall, new staff members provided
a much-needed injection of new ideas, and facilitated the creation of the
desired criteria. aievery fruitful session in late September resulted in
several characteristics which would become the- core of the evaluation
criteria. Essentially, the staff asked what characterized a concept map,
identified those elements (Stewart, et al., 1979) and then developed a scoring
scale that would indicate students' performances relative to those element
Figure V.3 is a. description of the "final" criteria developed for
scoring Concept maps. These criteria were used to assess all the concept
maps that were collected during the school year 1979-1980: and form the basis
pf the reported data in the following pages.
These criteria were used to construct a less rigorous form for
assessing student-constructed concept maps. Essentially, this other
form was developed to provide the teacher who intends to implement, this
strategy in the classroom with an alternative which might be more manageable
than the more comprehensive form. This more general form is reported in
the Teacher's Handbook, page V-3 (Appendix 1
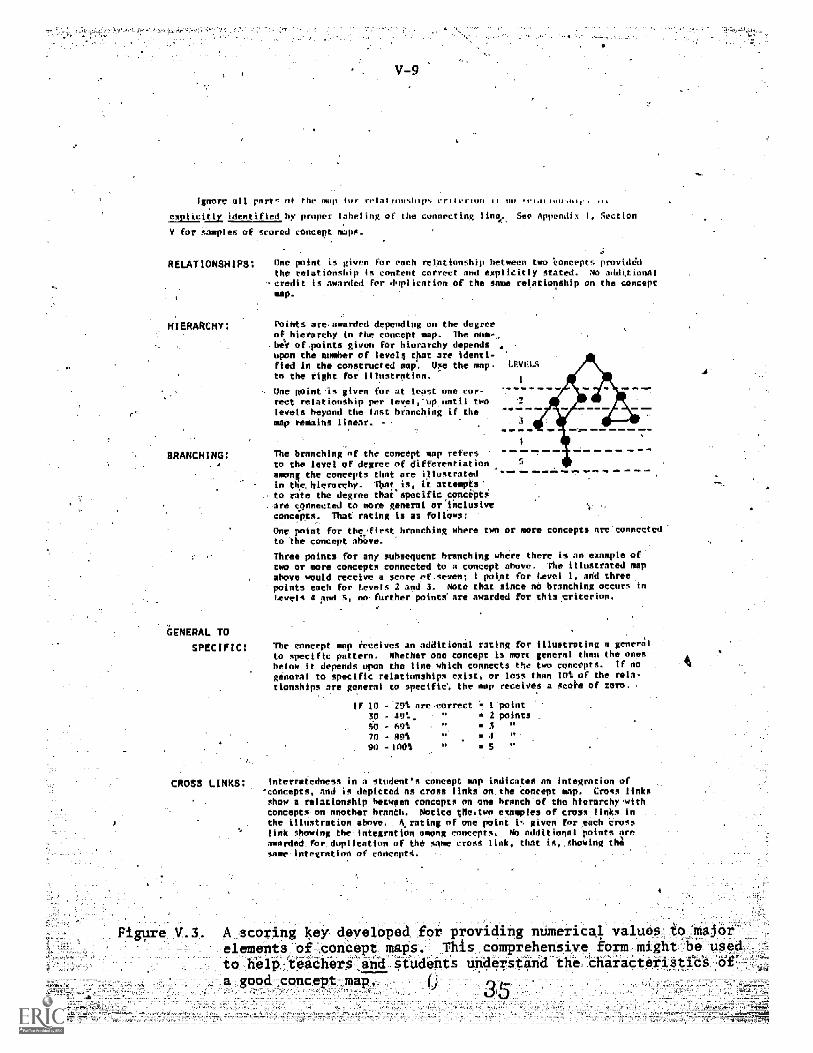
Ignore all parts of the mall hlr relatimr-ihtp% criter tun 11 .lk
explicitly identified hv proper labeling of the connecting liner. See Appendix 1, Section
V for Samples of scored concept maps.
RELATIONSHIPS:
HIERARCHY:
BRANCHING:
GENERAL TO
SPECIFIC
CROSS LINKS:
One point is given for each relationship between two koncepts providedthe relationship is content correct and explicitly stated. No additionalcredit is awarded for deellcatban of the same relationship on the conceptmop.
ets are awarded depending on the degreeof hierarchy in the concept map. The num-ho of-points given for hierarchy dependsupon the nember of levels that are identi-fied in the constructed map. Use the map. LEVELS
to the right for illustration.1
One pointls given for at least one cor-rect relationship per level.'upentil twolevels beyond the lest branching if themap remains linear.
The branching of the concept map refers -
to the level of degree of differentiationamong the concepts that are illustratedIn the,hlerarthy. That is, it attempts'to rate the degree thatispecific conceptsare connected to more general or"ificlusiveconcepts. That rating is as folloes:
One point for the first branching whereto the concept abeve.
Three points for any subsequent branching where there is an example oftwo or more concepts connected to a concept above. The illustrated menabove would receive a score of seven; l point for level I. OM threepoints each for Levels 2 and S. Note that since no branching occurs inLevels 4 and S. no-further points' are awarded for this criterion.
concepts are'connected
The concept map receives an additional rating for illustrating a generalto specific pattern. Whether one concept is more general then the onesbelow it depends upon the line which connects the two concepts, If no
general to specific relationships exist. or less than 10% of the rela-tionships are general to specific, the map receives a score of zero.
IF 10 - 29% are-correct l'point30 r- 49%,
SO - 69i70 - 99%90 -Ina%
w 2 pointse 3 w
4 "
5 0
Interre edness in a student's concept map indicates an Integration of-concepts, and is depicted as cross links on the concept map. Cross linksshow a relationship between concepts on one branch of the hiererchylvithconcepts on another prone'. Notice teeitwe e7amples of cross links inthe illustration above. A rating of one point is given for each Crosslink shoiang the Integration among concepts. No additional points areawarded for depllcation of the slue cress link. that 1%showing thesame integration of concepts.
figure V.3. A scoring key developed for providing numerical values to ..majorelements of :concept maps. This comprehensive form might be usedto help-teachers and underderstandthe cif
M
a good concept map.
V-10,
A word of caution is in order. 'While the criteria for the assessment
of student-constructed concept maps do consider 'Structure as ,well as content,
the maps are an externalization of the student's cognitive structure: While
we believe that 'the concept maps reflect, in some degree, the cognitive
structure of the individuals we do not know what systematic errors are
introduced in this representation. Thus, scores that the students -receive
on their maps may not be as valid as more probing and more time-consuming
clinical interviews would offer. However, in the two years of the project's
work, we were unable to devise an instrument that would consider all three
of the elements that impinge on the construction of concept maps: ability
to construct the map, the content correctness as represented on the maps,
and the map as a reflection of the cognitive structure. Further research
with this strategy and assessment criteria may result in amore accurate,
and thus, more valid use_of the instrument.
Evaluation of Concept Maps during 1979-1980:
Evaluation of the concept mapping strategy began with the clinical
interviews in Trumansburg in November, 1979. A paragraph was designed from
the initial paragraph used in the preliminary October interviews. (The results
of these October interviews will not be reported since their major intention
to familiarizethe staff,with the clinicakinterviowing strategy.) A
baseline concept map was constructed from the paragraph. The function of
the paragraphs that were used in this phasethis baseline hap and a
of the;evaluatAn, was to.provid- a meterstick to evaluate the students'
performances. This teseline map was not an "ideal map" (although we, did
but only provid a guideline for -assessment,_use that term fo
In fact, many of'the maps constructed by the students reflected higher
'scores on certain criteria than our own baseline maps represented.
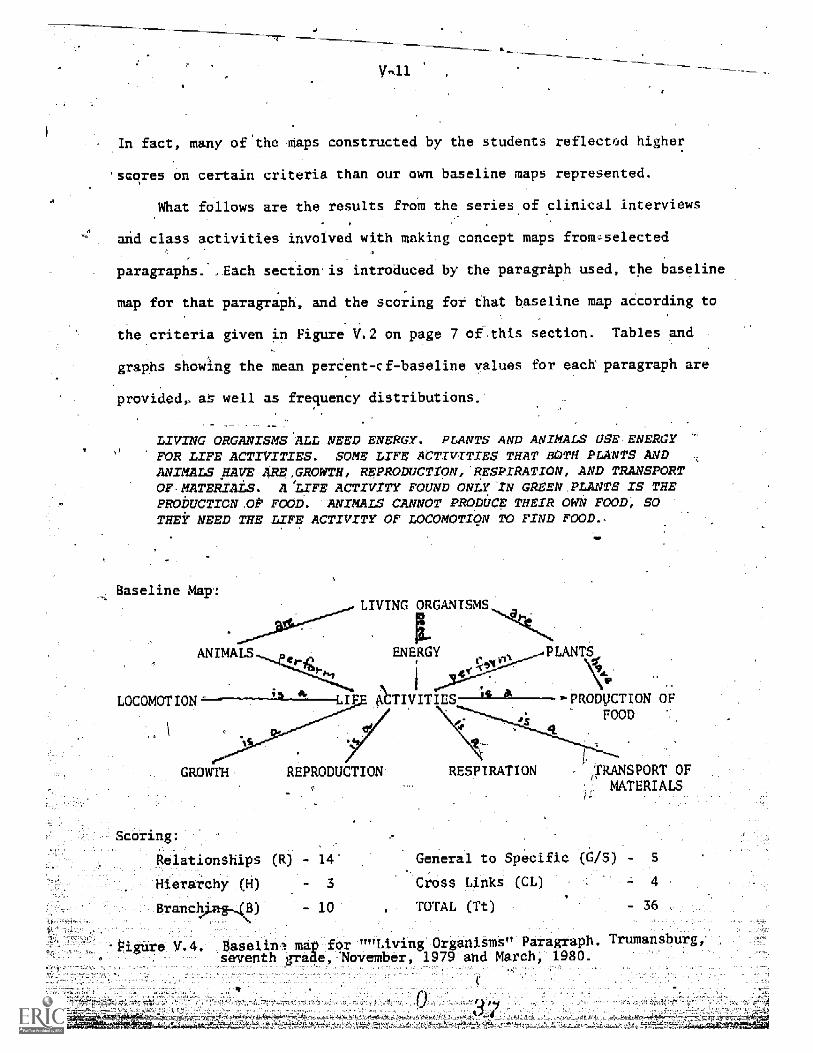
what follows are the results from the series of clinical interviews
and class activities involved with making concept maps from - selected
paragraphs. .Each section is introduced by the paragraph used, the baseline
map for that paragraph, and the scoring for that baseline map according to
the criteria given in Figure V.2 on page 7 of this section. Tables and
graphs showing the mean percent-cf-baseline values for each paragraph are
provided, as well as frequency distributions.
LIVING ORGANISMS ALL NEED ENERGY. PLANTS AND ANIMALS USE ENERGYFOR LIFE ACTIVITIES. SOME LIFE ACTIVITIES THAT BOTH PLANTS ANDANIMALS HAVE ARE .GROWTH, REPRODUCTION, RESPIRATION, AND TRANSPORTOF MATERIALS. A 'LIFE ACTIVITY FOUND ONLY IN GREEN PLANTS IS THEPRODUCTION OP FOOD. ANIMALS CANNOT PRODUCE THEIR OWN FOOD, SOTHEY NEED THE LIFE ACTIVITY OF LOCOMOTION TO FIND FOOD.
Baseline Map:LIVING ORGANISMS
ANIMALS.
LOCOMOTION
Scoring:
Relationships R) - 14- General to Specific
Hierarchy (H) 3 Cross Links (CL)
Branch - 10 TOTAL (Tt)
GROWTH REPRODUCTION
ENERGY NTS
TIVITIESJIL------PRODUCTION OFFOOD
RESPIRATION _TRANSPORT OFMATERIALS
Baseline ma for ""Living Organisms" Paragraph. Trumansburg,
seventh gra e, November, 1979 and March, 1980.
y-J. 2
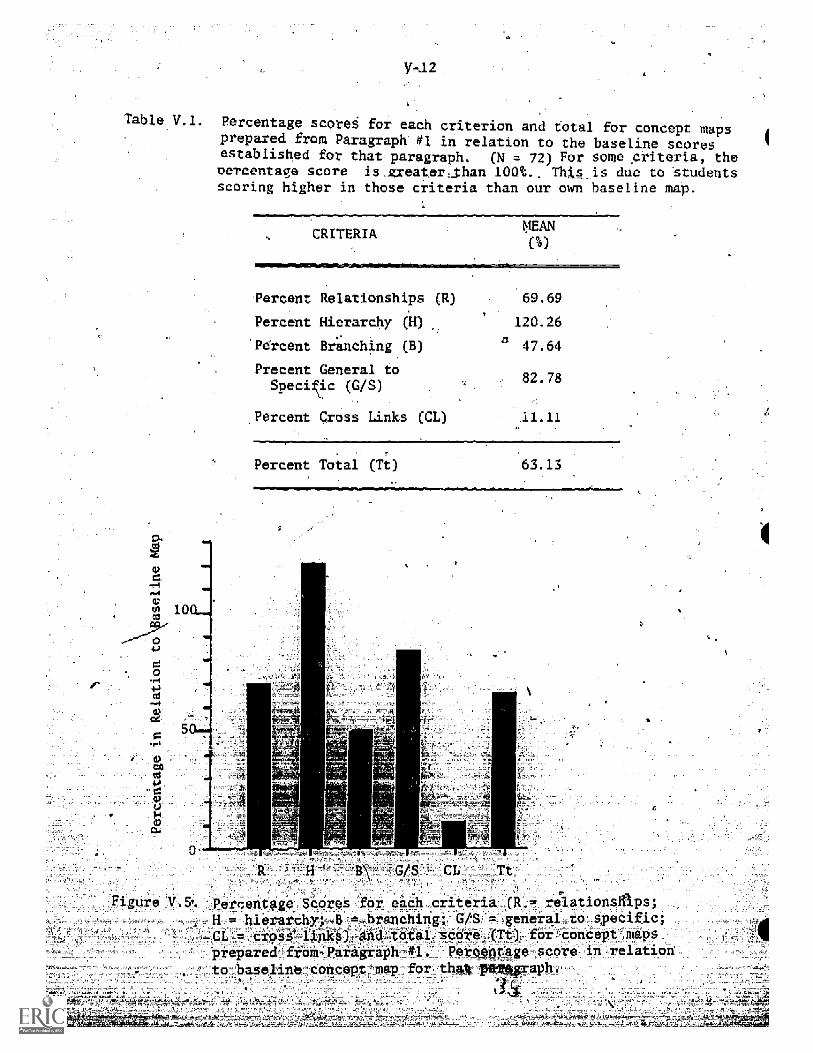
Table V.1. Percentage scores for each criterion and total for concept mapsprepared from Paragraph #1 in relation to the baseline scoresestablished for that paragraph. (N = 72) For some ,criteria, thePercentage score is.greater:_than 100%.. This_is due to Studentsscoring higher in those criteria than our own baseline map.
CRITERIAMEAN
(%)
Percent Relationships (R) 69.69
Percent Hierarchy (H) 120.26
Percent Branching (B) 47.64
Precent General toSpecific (G/S)
82.78
Percent Cross Links (CL) 11.11
Percent Total (T t) 63.13
Figure V.S. Percentage Scores for each criteria_.( rAationsilips-,H = hierarchy;-8,=-branching; G/S = general to specific;
crosi.-iii ikSrand.total,score(Tt)-fror concept maps
prepareafrom-Paragraphi#1. Peroentage score in relationto baseline-concept, map for that aph.
20
V-13
10-19 20 =29 (30 `39 -;4th 49404Wa- J =70 797700149'90-99 100- 110-
Percent-of iTetal'SCd;e'bf concept Maps1 09 .120
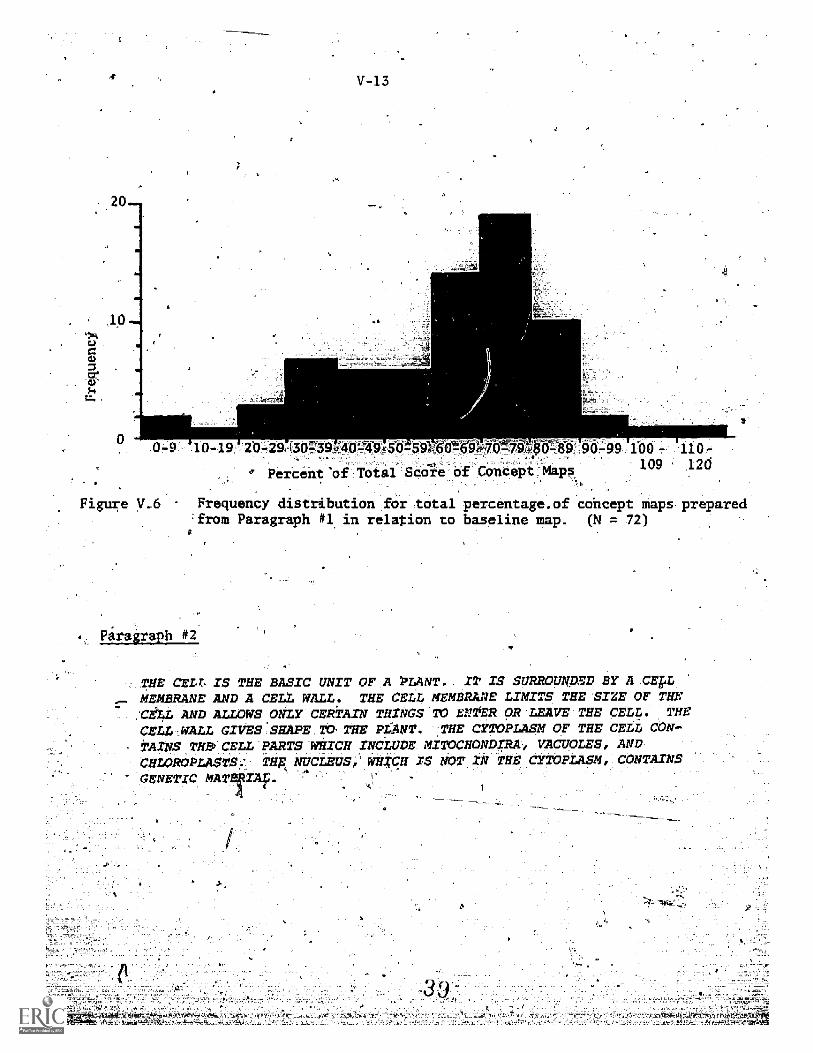
Figure V..6 Frequency distribution for :total percentage. of concept Maps-p eparedfrom Paragraph #1.in relation to baseline map. (N = 72)
Paragraph
THE CELT. IS THE BASIC UNIT OF A PLANT. IT IS SURROUNDED BY A cEpz,
MEMBRANE AND A CELL WAZL. THE CELL MEMBRANE LIMITS THE SIZE OF THECELL AND ALLOWS ONLY CERTAIN THINGS Z) ENTER OR LEAVE THE CELL. THE
CELL WALL GIVES SHAPE TO THE PLANT. THE CYTOPLASM OF THE CELL CON-
TAINS TH. CELL PARTS WHICH INCLUDE. MITOCHONDIRA, VACUOLES, AND
CHLOROPLASTS. THE NUCLEUS, WHICH XS NOT IN THE CYTOPLASM, CONTAINS
GENETIC MATIA.
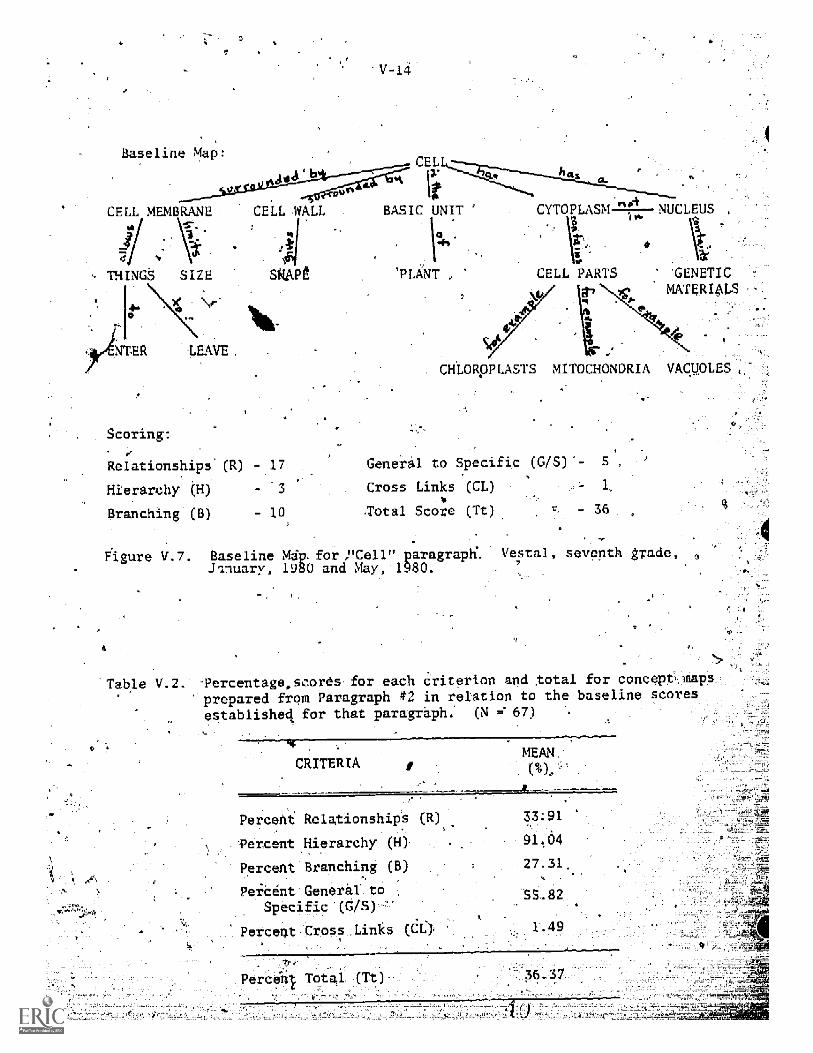
Base e Map:
V-14
CEL
BASIC UNIT
214" in
CELL E BRANE CELL WALL
THINGS SIZE
CYTOPLASM!' 1.47.
NUCLEUS
GENETICMATERIALS
'to
PLAITPE CELL PARTS
-ER LEAVE
Scoring:
CHLORpP -S S MITOCHONDRIA VACUOLES,
Relationships R - 17 General to Specific G SY-
Hierarchy (H) - 3 Cross Links (CL)
Branching (B) - 10 -Total Score (Tt) - 36
e V.7. BaselineJqnuary,
Table V.
for ,"Cel0 and May,
'I aragraph festal, seventh grade,_O.
-Percentage.scores-for each criterion and total for concept, mapsprepared from Paragraph #2 in relation to the baseline scores
established for that paragraph. (N ="67)
CRITERIA
Percent Relationships
Percent Hierarchy (H)
Percent Branching (B)
Peicent General to
Specific (G/S)
Percent Cross Links (d'
MEAN
Percent Total

.a
*give
e
00
R B G/S
Percent Scores for each crireri:a seecpdp and total ep suus fo
preps. ed -CNTParagr& 2. Erpoenedieat-ion- o bas line concept -map yI
tdbre4n4zaiggfhPly.'
0-79,80-89 90t9,"x5.77'
Pe en t _co e o eo'c Map
equency istribu "on t tal e cen age of concept
_e a ed ram Pa graph 2 re aion to haSelmne,,map 67j)
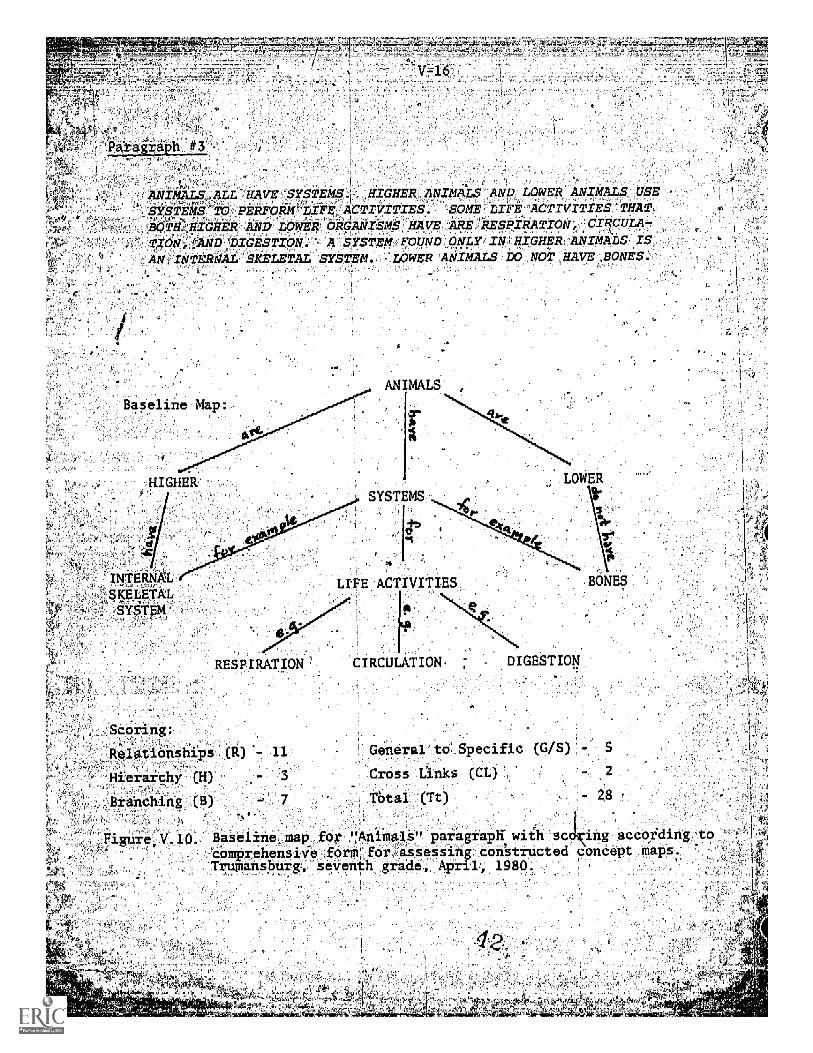
aragraph, #3
ALL HAVE-SySTEMS: HIGHER ANIMAS AND LOWER ANIMALS USE','SYSTEMS'IOJJERFOWLXFE,ACTIVITIES. SOME LIFE ACTIVITIES'THATEQTN4IGHER AND DOWER ORGANISMS HAVE, ARE :RESPIRATION, CI1FULA7
TION;ItAND:DIGESTION. A SYSTEM,-FOUND ONLY'INIHIGHER ANIMALS IS
', 'AN_ INTERNAL-SKELETAL SYSTEM. =LOWER ANIMALS D© NOT HAVE ,HONES.
ANIMALS
Basel-ins
HIGHER LOWER
Scoring:
Relationships (R
Hierarchy (H)_ -
-Branching (B)
General to, Specific (O/S)
Cross Links (CL)
Tbtal ('fit) 28
Figure V.I0. Saseline_map for "Animals" paragraph' with sc ng accordingccording to
comprehensive form' for assessing constructed concept maps.Trumanshurg, seventh grade, April:, 1980.
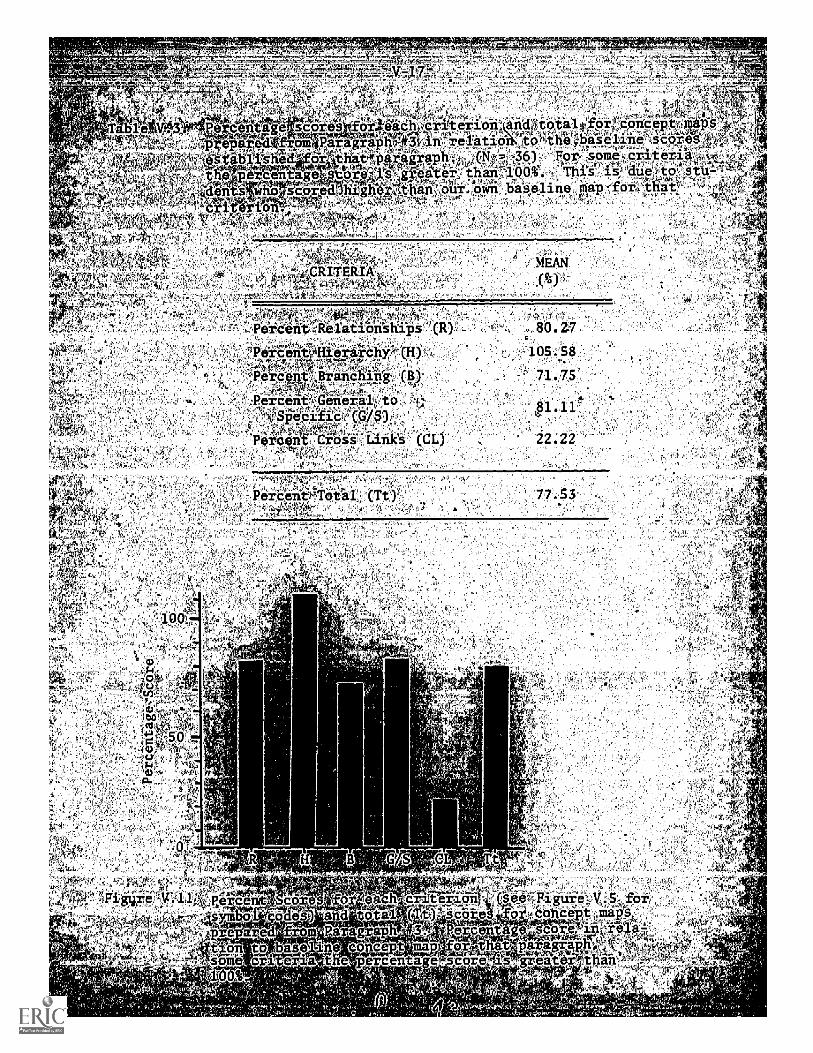
' a it V. cepPattentage scores orbahep,r 4iOn4indfit6tal-4,1"17C9
teiril4,0from Paragraplir#3ilh 0.-atio-A::to*tWh4011.ni-,Segfes:
gitatiTighu -154.e'ihAi7q1aiiiia 4(=r56) 'tor some,6iiteiii4-ar, .tm.,-,, -pi 4_ 4. .---A4,, _...---- , -,-
Thisel, ,,, ',T
L4s d ' = ,Vlpocentagq st9wsr- =eater_ aw-,100.-°This is_chl!tp,,At.-
-,en s hCs corqdliigheraniput.,:qwn'-,ba'sdline map-forlthat!.. ":,-
..----
,;'..,,,,F..ft,,;-5; .'..-..-,-.--,
c e
MEAN
(t)
reinikerations
105.58
`'.:Percent%Branching _(B) 71.75
Percene;Genera1 to "
5-epxfic G/S
Percqii ots-Eil CL 22.22
,06r4n (Tt) 77.53
ercent Sco es for each co °lies) and tam
e a e - a a apo to ase conce t map fo
o e cr e is t e ercentage score00
pa agat
- 91'ZTY§ 30V39., 40-4 9, 049 ,00-109
r -,.: =-1,-.!:,
Percent' of: Tata Score o cConept 'MaPs l'71--
.
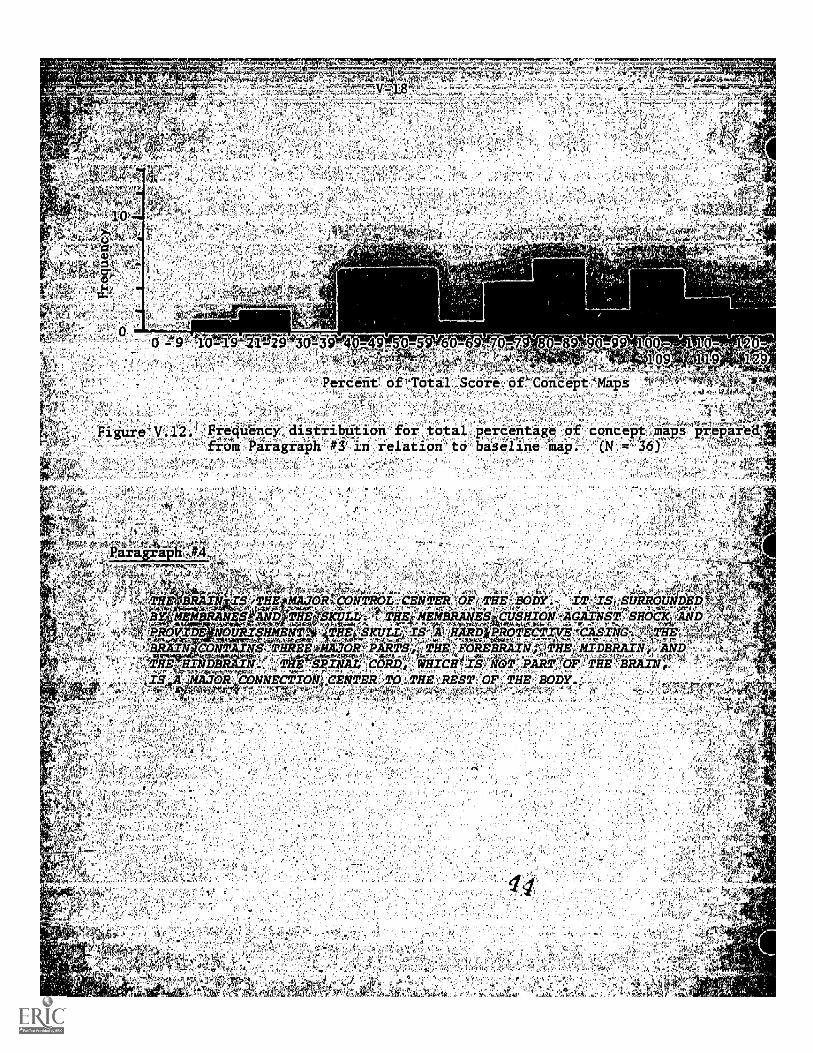
re= V:12 = FtpcliOn0 distributi ©n for totali percentage .oft concept , rnap preparefrOrn Pa'ragriplx it.i in re1ationto-bisfine inaP:' AN =- 36) ,gztrV,
A.ra ap
l A ,e" iith 0 TER:OF-,THE,..- , '.IT; I5 SURitoUNDED ,."
.;,k- ,,, ,-..-Y ,E D S D.. TH ENE E HIONUAGAT-- N5VSH-0Clyi`
La.. ..,**,,AT T Ts47: p 'PROTECTIIM VASIN_G-'
L-:.VIDE NO
_ COW_ Si T E OR-i.E T HE THE;14-1DBRAIE ANN,THEIHIN DB IN ';eo =leis.' NOT: PART, Or': THE 'BRAIN
_YE= IL*701titrwsECTION4. C4srEi-TO., THE ', R.SST --Or, THE BODY .,---,,,=7.;,-4- `.1w-:,1.'"-A""--i--- ,_;,-;-,'-i -::, '0 ' ,,-.:,';'---- _.
- 4
,":; ";,,," -- k
Baseline Map:
_ MEMBRANES
°
SHOCK
-V19 _
NOURISHMENT
PROTECTIVECASING
Nrs
MAJOR CONTROL SPINALCENTER CORD
BODY
R PARTS
FOREBRAIN MIDBRAIN HINDBRAIN
Scoring:
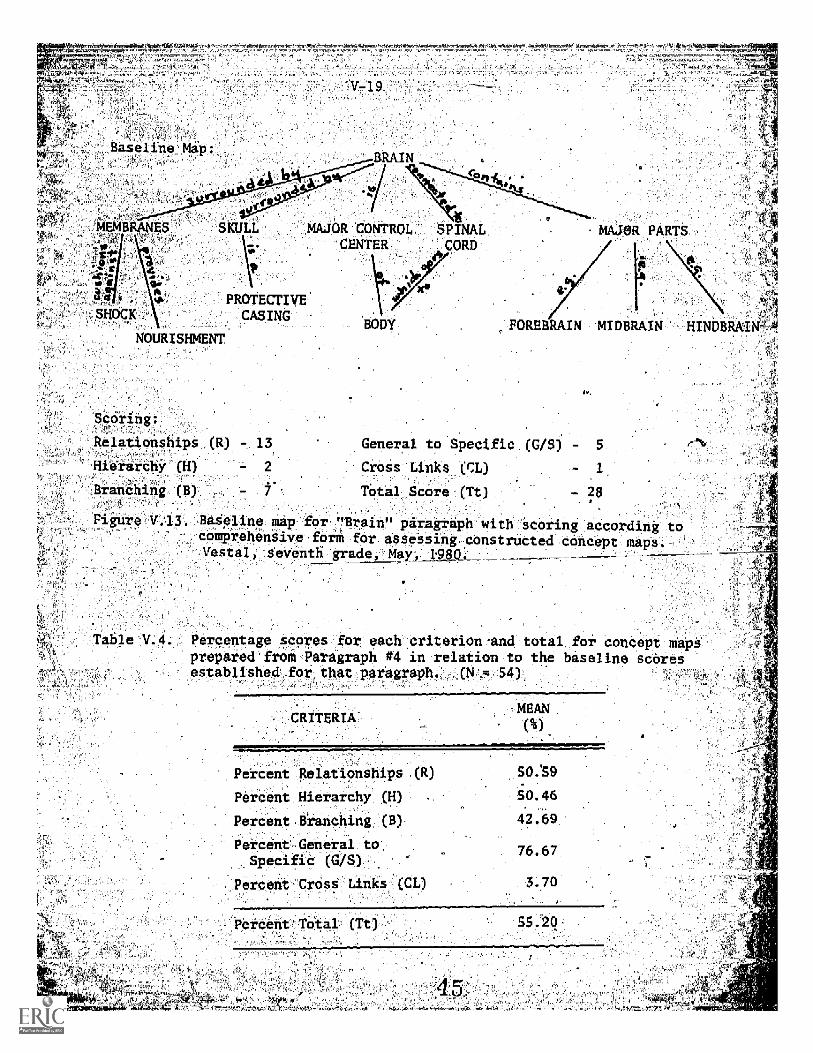
Relationships. (R)
Hierarchy-(H)
Branching (B) _
13
- 2
- 7 -.
General to Specific (GIS)
Cross Links (CL)
Total Score
1
- 28, ...
.
-.'"----_ FigureTV.13. Baseline map- for, "Brain" paragraph with scoring according to_ ..
C comprehensive form for assessing constructed concept maps.Vestal,-.Seventh grade; Mar; 1980.....
P--
- 4Table V.4. Percentage scores for each'criterion'and total for concept mapsprepared from Paragraph #4 in relation to the baseline scoresestablished for that paragraph.,,(,S4)
L.
, !_(`'
_
MEAN
Percent Relationships (R)
Percent Hierarchy (H)
Percent Branching (S)
Percent ,General toSpecific (G/S)
Percent Cross Links (CL)
Percent Total (Tt)
50:59
50.46
42.69
76.67
3.70
ss.r2q-
WW-7-' WA, 'W.
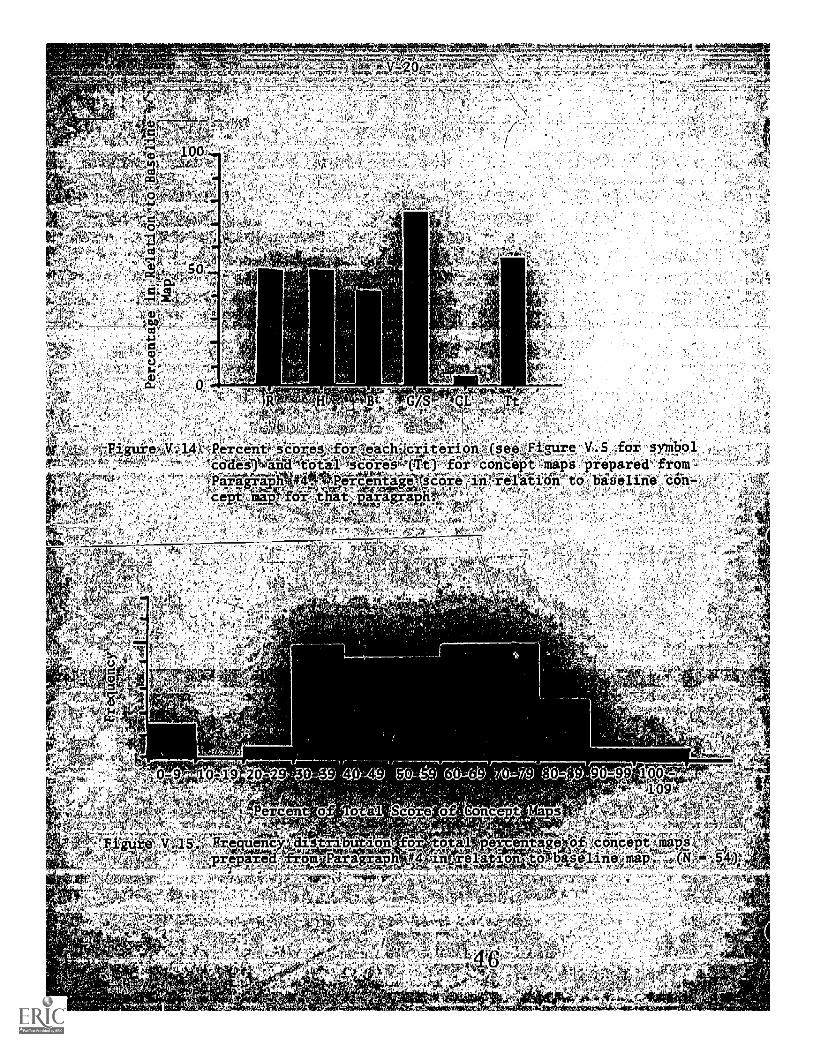
re , V:14 -' '< Percentl-' s core orAaach,;:ktri erion(Aeaji.vra: V-. 5_ -for )rnAo 1,_ .
4 ,,,, _ -1-,-,,,, '0,-,.- -.!,, --,,,,-rCo'cre0-4aifdnbiliil -Iiiis-A ----fcir,,coneetit'.'mitgi_'prepared- from"
7L.E:s....W.k.vi41, ,1 Of 1..'''''''' '''4,Paragriplii#41.41-Arai_centieitritarelarireratji:itieto', baseline _ con--, .-,Art 3' 4C,PIPAs...0-*.'N ' -''' `'i \ ' ;'c 0, .' +-4= ,'
'1'"' Ve' h-t-'-- aph...: 'ceti,t,.,: alp,: oi7,-, a , paragr,, ._,, ,
4. 4o g
0-1'9 20 - -9
Percent o Tote Scoi.A-o .concept MA-
e_iquenc9. ion' or jta. 'p$,rce-ntage cppt tmaa red r om. aph #_4 elat-- on o basal nA;mlip,'.;..,
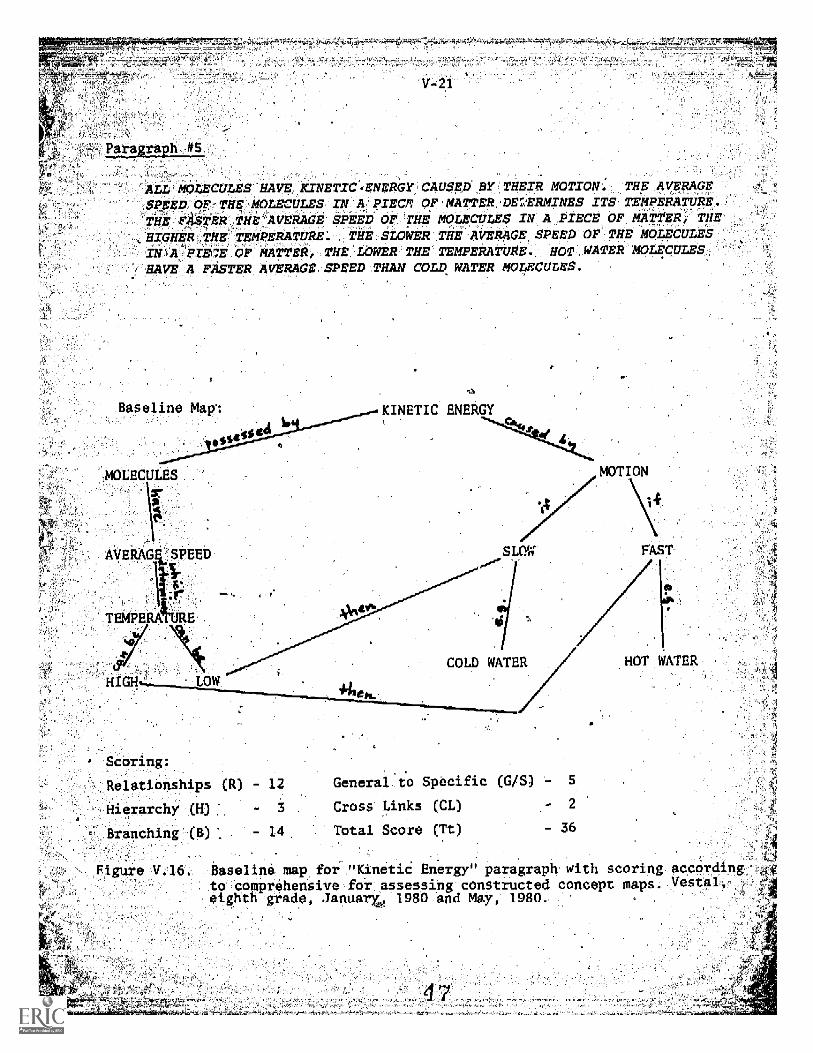
;Paragraph #5
ALL MOLECULES HAVE KINETIC-ENERGTCALISED,BY.THEIR MOTION THE AVERAGE
SPEED OF_ THE MOLECULES. IN. A PIECE; OF DMERMINES ITS TEMPERATURE.THE EASTER THE AVERAGE` SPEED OF HE MOLECULES IN A ;PIECE OF MATTER; TEE
HIGHER THE'TEMPERATURE. TEE SLOWER TEE.AVERAGE SPEED OF THE MOLECULESIN4-PIECE OF MATTER, THE. LOWER THE TEMPERATURE.. HOT WATER MOLECULESHAVE A FASTER AVERAGE SPEED THAN COLD WATER MOLECULES.
BaSeline Map
MOLECULES
EVE SPEED
0
KINETIC ENERGY
Scoring:
Relationships (R) - 12 General, to Specific (G /S) - 5
Hierarchy (H) - 3 Cross Links (CL) - 2
Branching (B) - 14 Total Score (Tt) - 36
Figure V.16. Baseline map for- "Kinetic Energy paragraph with scoring according'to comprehensive for assessing constructed concept maps. Vestal,eighth grade, January, 1980 and May, 1980.
_,,
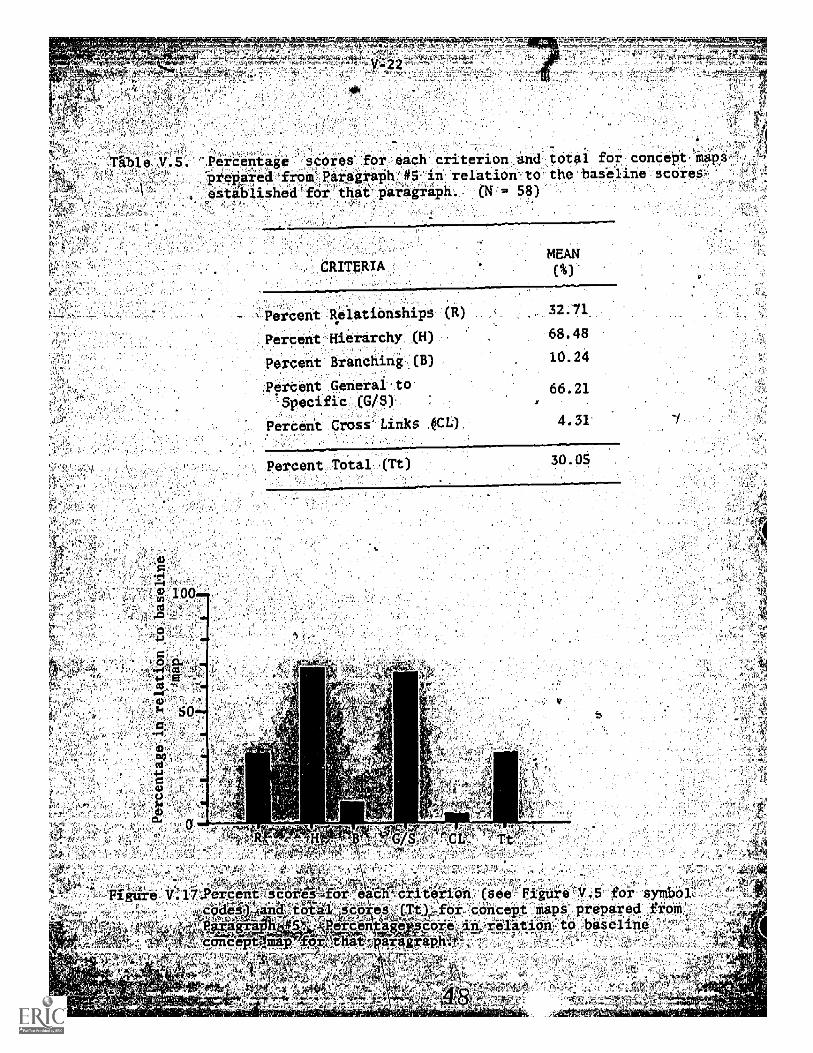
Table V. S . Percentage scores for each' criterion and total for concept maps. ,
prepared, from- Paragraph #S- in relation to the baseline scores,.,
established for that paragraph. (N = 58)
Percent Relationships R
Percent Hierarchy (H)
Percent Branching (B)
Percent General toSpecific (G/5)
Percent Cross Links
Percent Total (Tt)
32.71
68.48
10.24
66.21
4.31
30.05
_:fie V 17 eicentstprei'4for ea :41- c
_ n cagra- S l rcen age
9IncePtt4144P",_10
email (see gure TiS for symbol:concept -maps, prepared from'
sabie, in, 'relation,- to, baseline .=
that:4gragra ,
9
Percent of o
-aTtlag2 2
9 -. 9769.--70z794&89 90-99
al. Scare' 'Concept Maps
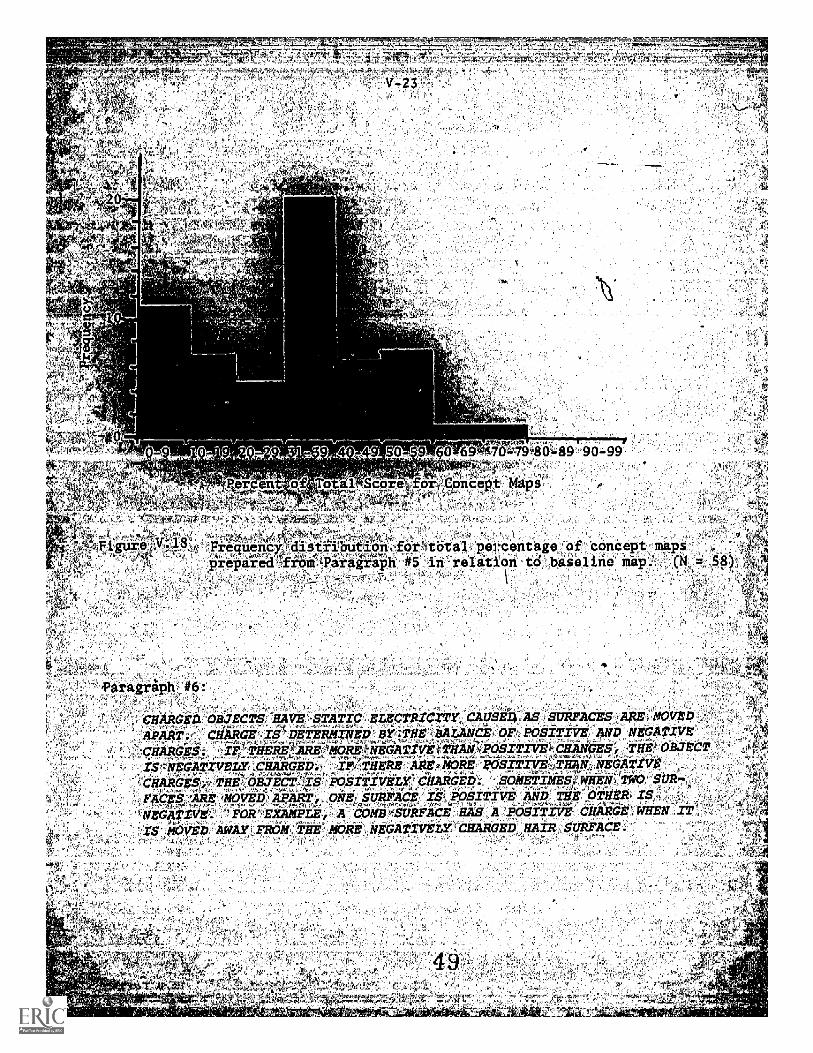
putiopo orctotal percentage of concept:'tPirigiipti #5 in relation to ,baseline map.
4'aragraph #6:
CHARGED' OBJECTS HAVE STATIC ELECTRICITY CAUSE E1 AS _SURFACES 'A-RE MOVEDlei;THk4tALANCEi OF POSITIVE AND NEGATIVE
CHARGES THERE &ARV MORE;tNEGATivr THAN -4fPC7SZTIVEWCWANGES OBJECTii,;;NSdATIVELY CHARGED., IF THERE. ARE;MORE- ws--.4itti-R4:2704, NEGATIVECHARGES E '!ORJECT :. *IS sagivivErx: CHARGED'', SOMETIMES WEENi'TRO SURDFACES 'ARE' <MOVEp:. APART, ONE SURFACE l& POSITIVE AND TEE OTHER,
`':NEGATIVR.' .'-FOR'"EXAMPLE, A" COMB ,SURFACE HAS A POSITIVE CAGE, WHENZS MOVED AWAY' FROM, iwk-?, MORE ; NEGATIVELY CHARGED HAIR SURFACE;
.
+fr1,,":"N i!Tr r=1
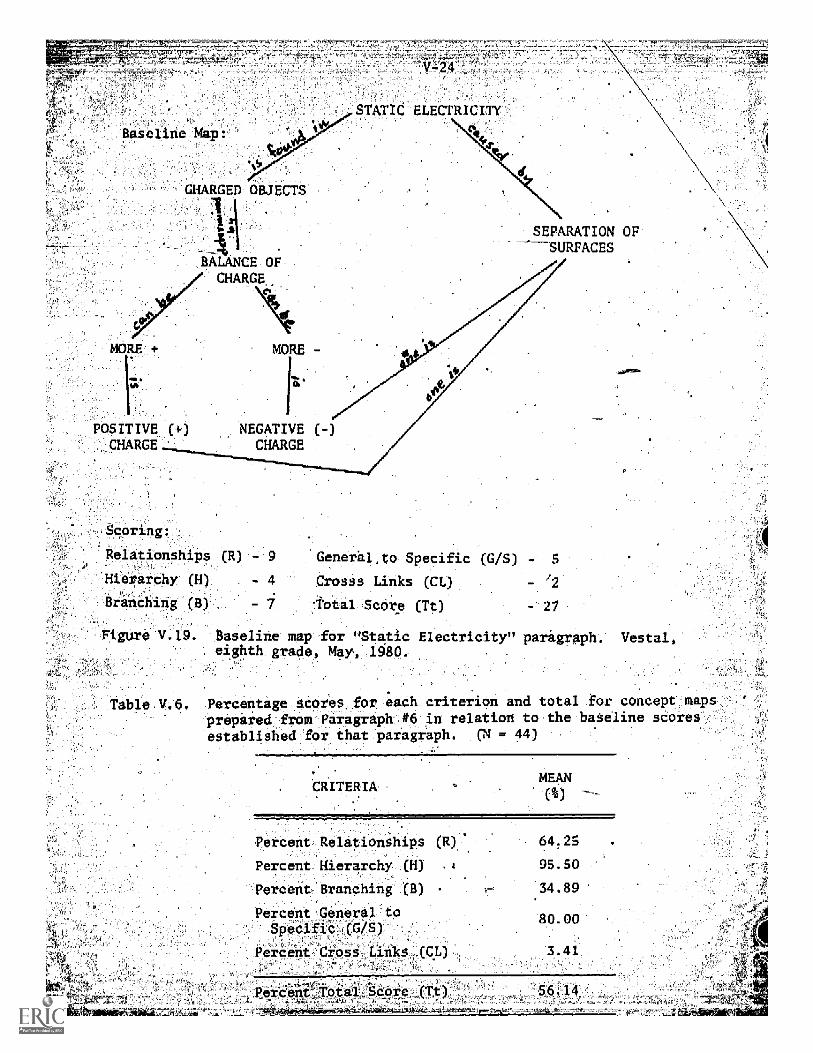
Baseline Map:
HARGEp OBJECTS
ALANCE OF-GE
STATIC ELECTRICITY
SEPARATION OFSURFACES
MORE -
NEGATIVE (-)CHARGE
Scoring:
Relationships (R) - 9 General to Specific (G1S) - 5
Hierarchy (14) - 4 Crosss Links (CL) - /2
Branching (8) - 7 -Total Score (Tt) - 27
Figure V.19. Baseline map for "Static Electricity" paragraph. Vestal,eighth grade, May, 1980.-
Table V.6. Percentage scores for each criterion and total for concept mapsprepared from Paragraph #6 in relation to the baseline scoresestablished for that paragraph. (N = 44)
CRITERIAMEAN(%)
Percent Relationships (R)
Percent Hierarchy (H)
Percent Branching .(8)
Percent General toSpecific (G/S)
Percent Cross Links , (C-1 1`, _ -"PPerdentrotTalSebte,;,(T
1' !Pl. Ada
64.25
95.50
34.89
80.00
3.41
56 14-_---
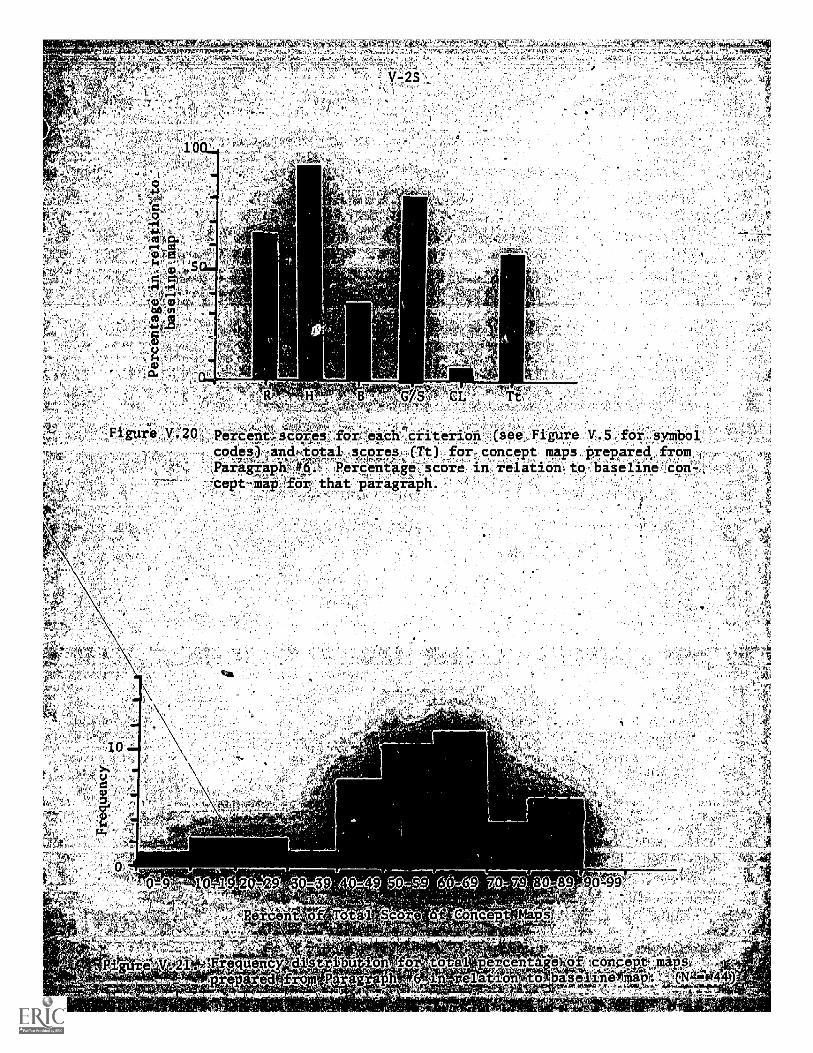
1Figure V.20 Perdent;:icorea for-each .criterion. (see Figure V.5 for syrnboilcodes),7and,total;.Kpres ,,(Tt),for, concept maps prepared. from ,
ParigraPhWY 'Percentagescore in relation. to 'baseline con-cept-map for, that Paragraph.
ercen, o Total Sco_ e of Goncep
equency distribution_ or ,tota= percentage 'aft looppre ed from Paragra If in relation tb baseline
'A dank
b viated of Data in this 'Section:
Although a comprehensive ical analysis of the data is
_reserved for Section IX, some preliminary remarks are in.order at
tliis state of the report.
At first gianee t can be noted, that students' performances on.
some paragraphs were better than on others. This is due, in large
part, to the groups of students that we were testing. For instance,
_Paragraph #1 was administered to the Trumansburg group who had received
extensive training in the'use of concept maps. Generally, their
scores are higher than the Vestal students (Paragraph'#2 for seventh
grade, Paragraph #S for the eighth grade). As was mentioned earlier,
the Vestal teachers began to use our strategies comparatively late
in the year.(November-pecember1979) while the Trumansburg teacher
began at the tart of the academic YO,
Comparison of Figures V..6 and. V.9 illustrates another point about the
instruction in the use of the concept mapping strategy. Very few
students from the Trumansburg/group (as represented by Figure V 6 'received
a score ofzero through nine for their total_ score. Generally, students
received that score if they did not explicitly identify the relationship
between concepts connected by lines. This exercise was considered
.very important in Trumansburg but less so in Vestal. Thus, the high
incidence of zero to nine sco
in instruction and emphasis.
Figure .V.9 illustrates the difference
Generally, the criterion of hierarchy faired better than any of the
tthir, criteria for assessing concept maps. Since hierarchy is a fundamental
V727
element of concept map; and w'as. stressed by-all the. teachers
.students qiredbeiter on that ori erion than all the others.I
Cross links, the estabAshemdnt of interrelationships among concepts on
concept.map, was not stressecl.lduring instruction of the concept mapping strategy.
Thus,-the scores for this criterion are generally low. Further, the baseline
concept mapi rarely contained more than one or two of'these cross links. The
:he study, the
opportunity to illustrate one by the student was limited to a kind of "all or
nothing" situation.
-53
_sr- 7 ," 9°2,
4,-. 2,4-V-28
Formative Evaluation -Of the Concept Mapping Strategy:
As party of the clinical interview conducted with students during 1979zi1.98a,c
interviewees were asled to discuss the structure of ;heir concept maps. Throtigh_
probing, the interviewers were able to solicit some information regarding-the.
students' -understanding of the concept mapping strategy. During these inti
theirpttitudeg about th-i\sirategy were also solicited However, these remarks
are_rerior_t_ed in the section on attitudes (Section VIII). _
Nkr 1il,..-.
Another:source for the .following comments came from several
more informal interviews conducted with grotips -of student. These interviews',""--
were conauctd during' the last part of the project (March-April, 1980) a-fter7,,iy,--,--
the students had had aimoSt a full Year of exposure to the strategies. ,,
I1'
Several- areas were probed and they wIll be described prior to each set,
of excerpts. The interviewer' s'questioits are in caps; interviewee' 5 respons&-,-.
are in lower otise: If more than one student is answering the samequestion;',.
the.differelit. responses, are separated by a space between .the responses._ars,s
WHAT IS 4, CONCEPT MAP?*
It gives information from "what we read, like it hag, it's rani organized wayof Writing it c6t-Well, it 6 a map where you have most of the important facts of a par6grapkor4 ,.
whatevei- you jet read, and you make a map out of them to help you understandwhat,..it is.Like a chart of what -you 've read.
. ,
MIT IS A CONCEPT MAP, IN YOUR OWN. WORDS?.
'Well, it's a way of helping you understand what youiy,,,e been reading, orstndving. It's [am] easier way instead of .reading.YOU DON'T HAVE TO READ IF YOU USE CONCEPT MAPS? *1-,
Oh, you have to read, but it makes the reading more interesting, 'cause you've,
got to know',what you're reading to understand our labs.; - So it's easier to?.understand the labs if you do 'a-concept map after one.!MAT' IS A CORCEPT MAP?
Hard Work!
-Brackets'are--.Used in these and foll' ng.exceii.to either-to produOre._.a.-s-aiopt,--T..rt readings#tto. clarify the context .i.-1 wY.-:.Ch the., qiuiot e; tyas made.,
,
A-,-At'r? `-'-' ,-
V-29
Each of these excerpts seem to indicate that the interviewees had some
difficulty interpfeting the question asked All see o have some idea of what-
a concept map is, but find it difficult to articulate its purpose. In regard
to the responses relating concept maps and laboratory exercises, the teacher
student often had the-Students construct concept maps prior to or
immediately after doing a laboratory experiment. The concept map then became
the left-hand side of the "V".
In the next question, relating to structure, the problem of vagueness'
in the answers-, seems to disappea TheY are more on target when it comes
to describing the structure of- a concept map... The first student draws upon
the analogy-to_describe a concept map..
LOW -WOULD A CONCEPT MAP1
.2"es sort of juSt a pyramid and with things branching off from one,another,
-A PYRAMID RAS AA CONCEPT MAP?
T AT THE TOP .. IS THERE A POINT AT THE TOP OF
Not really, but the major', thespeaific things breaking down.
eneral thing is on the top and the more
As this student indicates, the children in our study all seem to know
he rule for hierarchy and general to specific.
the next interviewee reflect this.
YOU_ MAKE A [CONCEPT] MAP.
-t- subdividing_ main subject-.Iles* group.
YOU,MEANI"SMALLER GROUP'S " ?,
The. pyramid user above and
of smaller oups until you get to-
cific ... like one subject you'd get somethings thit's different in
ct for or shalle_ or size. ,[Students were :involved with classification of shapes
,which- is, the- prpbable reason .for-..this,response.P,
V-30
Related to the structure of the concept map, we wanted to determine.if
the students understbod the function of the lines bet een the represented
concepts. Here are some responses from interviews that have asked for the
function of the lines and what ;they. represent..
ARE.THERE THINGS THAT HOLD T
I don't know ... just lines.
WILT DO THE LINES BOP
Well they join -- they conne
D OF THE CONCEPT MAP TOGETHER?
connect the two -ideas together.
WHY DO YOU HAVE A LINE BETWEEN "KINETIC ENERGY " .AND "AVERAGE SPEED OF
MOLECULES"?
That's what .. that's what it is what it mea
DO YOU EVER WRITE ON THE LINES?
Yeah. [Student then writes "is" on the line between two concepts.1
WHAT DO-THESE DO -- THE LINES?.
They connect it with the important [concepts]._. like "kinetic enez
has to do with "molecules," so that connects with that
WHAT!S THE PURPOSE OF THE LINES?
'Cause if you just put "plants" and "aniMals" and stuck"living organisms" and "energy" you would never know wha
was about.
hem right underneaththe whole thing
WHAT GOES INTO MAKING A CONCEPT MAP?
You make up at the top ... you put the main idea of the chapter and, like,
Pay it was "moleculesforsdifiWthing,:and then you'd write down, like, what---
into making molecules and branch off. Like a tree, roots.
WHEN YOU SAY "BRANCH OFF," WHAT ARE THOSE-BRANCHES?
They show relationships
BETWEEN WH41
Between two , concepts.
These next several excerpts are
students could use, or had used
attempt to -probe- whether-the±- _
rategy of concept mapping in some oth
class,other_than science. Rem mhating that this project was specficlbr
_targeted-to junior ,high science, it was interegting_to record some of the_
V-31
students' perception of using concept mapping in other classes.
HAVE YOU EVER TRIED USING CONCEPT MAPPING IN SOME OTHER CLASS, OTHER THANCIENCE?
/40t reafly. I haven't really thought about it'.
DO YOU THINK IT WOULD,WORK-IN,SOME OTHER CLASS?
Yeah. It would work in a lot of classes.
Irfr?Like, okay, work in like' math. ,You have a lot of steps tc ica n and it wouldhelp to remember basic steps and all that stuff. Work in English 'cause yougot stuff like your nouns, pronouns, and stuff. Let's see, what else? Socialstudies 'cause you got all those dates to remember.
Although thi4 next student has.quite,a different philosophy of mathematics
than most students the recurring theme that concept. maps show relationships
among ideas is very evident.
DO YOU THINK IT [CONCEFT MAPPING] COULD BE USED IN ANI OTHER WAYS BESIDES WHATYOU ARE DOING NOW?
In some classes, yeah.' Like,social studies, or, I donused in math.
RAT MAKES MATH SO. DIFFERENT?
ell, ,I guess relationshipswo plus two..
WHAT WOULD MAKE SOCIAL STUDIES MORE PRONE TO USING MAPPING?
it-could be.
You kno [it] doesn't take much e out
Well, say we were studying something like the s k- market-.. Which we are Yeah.
You could make a map of that, like, "stock mark and .what goes into it, like,
"stocks." Use it to explain corportation. th-e-different things that go
into _king that.... You'd see the relationshipbetween them f. alot better.
La addition to determining what students thoUght-of.concept mapping, and
e also sought- reactions of the-teachershow they would use the.-strafe
involved with the project. These teachers were nterviewed in informal
sessions, a in their homes or in school fter classes were fin ished f r
the day. This was done to i n. - eled atmosphere with no othe
V-32
pressures or distractions imp..sing on the. interview,
Although several areas, impleiientation, use, and philosophy behind the
concept mapping and 4V" strategies were discussed, only the former is reported
here. Impressions on the "V" strategy are reported in the next section.
Other comments, regarding other facets of the project, Are reported in
appropriate sections.of this report.
this series of questions, teachers were asked to discuss if concept
lapping had any advantages and disadvantages, how difficult it was to
impletent the strategy .into their classroom.curriculumi and whether they
-saw any-imprOvement in students' ability to use the strategy..
WHAT DO YOU= FEEL ARE THE OF USING CONCEPT MAPPING?
With the concept mapping, it kind of held the kids responsible for .certainvocabulary. They all of a sudden knew that they were looking up words, notonly as .a definition, but to show (the] relationships between words thatthey already knew.
they can explain .how a couple of words are related and then, not only'docm that thdy know the meaning of that word, but they also know-thesmeaning
of two other words, or at least one other word.
To have them do a paragraph and to make A concept map, to me, is a lot easierand a lot more enjoyable than reading a page full of definitions becauseyou're already trying to figure out why they're doing it. For the kids, thera certain perceniage of them that still find them very hard, and it-Might bebecause their vocabulary is just very weak.. ,.He might be frustrated, but I
don't think that's a'diaadvantage.
I just started-tutoring fa girl] . I'm using the concept map for her as a studyskill because she fiPds vocabulary pretty easy, .but she doesn't go beyond thatShe can't relate anything to anything. So we-took A paragraph in a science
k, we took a couple of pages actually in a science book, andI told here.,ell, what's the main vocabulary that You see time and time and time again .in
reading?" We made a.concept,map from that, and eventually we got her toderstand-motion and speed-and distance and time, and how to graph ---
alot of students at the lower level can either not read fa paragraPh] and
.get absolutely no.relationships [from] the words in a paragraph.... . [Concept .
mapping] tends to make -them.look for relationships, even if they don't reallyunderstand the idea of concept napping.
V-33
It piould be an advantage for me.... The first few we did, I looked over andgot some ideas of what the relationships that the kids do see are.
Well, first of all, to gat the kids to think about what they're read.... That
lets them pick up what they fee/ are the main ideas, or the main concepts. Itlets them tie the concepts together ...
They like to do concept mapping
Tieing things together, seeing how they relate to each other, most importantly.But if they have fun doingt, that's good too.
WHAT ARE THE DISADVANTAGES OF CONCEPT MAPPING?
(Ilf it becomes busywork where they have to read five pages and make a conceptmap, when they could [just] read the-five pages and pick up most of it. Ithink if you use it correctly, it a good tool. I don't think you have toconcept map everything.: I think you have to be somewhat selective.
I think it should be used at the teacher's discretion, and when needed; notdverdone where the .ids think of it as busywork and just something theteacher is making them write out and hand in
HOW,DIFFICULT WAS IT FOR YOU TO IMPLEMENT CONCEPT MAPPING INTO YOURCURRICULUM?
At first, I had a real 'hard time finding a paragraph or two that would be' ,_
appropriate fOr it. So I went throughalot of paragraphs and I realized thatI couldn't even make a concep map out of them.... There's slot of deficiencies
in the text.
And I think that's also something that any teacher's going to have to bewilling to take' the time to find out for themselves. Before you give theconcept map assignment, read over the paragraph and make sure that you can,come up with somattdpg, strictly from the paragraph, that even the weakest
tAid could pall sow- information together.
I think I would have to become slot more comfOrtable in myself laboutconcept mapping]. I don'tknow why, not afraid, but a little bit hesitantto really get into them, because I'm not that good and comfortable with
[the strategy].
think that concept mapping is a hard thing to teach kids. ;I really do.
At this aye especially. When they-are sort of set in how they read something'and how they go about learping i t, or outlining I think it is diffi
to teach th
Sometimes, when I'll look at a concept map [that a student has done] , and.-
I'll want to change it I'll want to draw it the way I feel it-should be
(lone. Taut] if I go to the child and say, "Can you explain why you did this
and this and this" If they can, okay; if they can't, then I'll ask them"Whythey did it that way, and wouldn't it be better if, and does at make
ire sense"
V-34
SAVE YOU SEEN STUDENTS GETTING:EETTER AT MAKING AND USING CONCEPT MAPS?
Yes, I've seen an improvement. A lot of kids don't have the real ideas. Alot
of them are just putting the title as they read, as they come across topics,
they will put them down. But even that helps if they are drawing lines.
Their reading assignments- are better. Especially when I have them do a concept
map of what they're read. If I give them definitions to do from a reading
assignment, and then I give them a concept map to do on that reading assignment,
they always can remember what they read and tie it to the other [parts] better
when they've done a concept map.
Caveats for Usin ementing Concept. Mapping:
The following are provided in this report so-that any attempt to replicate
.this project may noefall prey to,the same mistakes that we had/encountered,
while trying to implement these strategies.
Using the criteria for assessing concept maps (1/9 ), the teacher should
identify for the student* the major elements which character_te a concept
map. While the teacher may opt to use the less rigorous form of evalua-
tion (see Appendix I, page V-3) of the concept maps, these characteristics
still should be taught to the students.
2. Have students identify the major.concept and somehow distinguish that
concept from all the other concepts represented on the map. The students
could write that concept in capital letters, put a double circle around--
t, or write in different colors. The reason for this recommendation is
specify for the students. and teacher which concept in the students
is the most general ost incluSive of the concepts-represented.
minds,
reading Materials are candidates for concept maps. Often, we
have founktext=desc
-concepts and/erthei
iptions inadequate in their relationships among
ability to show a hiera
V-35
fore, the teacher should prepare concept maps of any material prior_
to Assigning the task to the students.- This way, the teacher can use
the concept map as a means of judging the general worth of the reading
in the text and its capacity to be concept mapped.
-4. Teacheriahould stress the integrative aspects of.concept mapping.
That .s, the concept map represents the relationships of meanings among
concepts. We did not find teachers placing sufficient stress on
this idea. We feel that if this was done more regularly, the power of
the concept mapping strategy would increase for the teacher, and thus
for the student.
Consistency .in Concept Map Scoriu:
We have noted, earlier that scoring procedures- for concept maps, have
undergone continuous revision. As we continue to use concept maps in
teaching and research, new forms of scoring keys will undoubtedly result;.
and we would encourage continued exploration of alternative scoring pro-
cedures: For the purposes of summative evaluation, however, was neces-
sary to settle on a map scoring procedure and to apply it with the various
classes involved in our study. The key shown in Figure V.5 of this report
was used for all the concept map scores given in this report. To test
the consistency with which different persons rate the same concept maps,
five raters scored eighteen different concept maps applying the criteria
established,
Table. V.7 shows the mean map scores computed for each of the Ave
and describes the raters' relevant experienc with the projedt7.
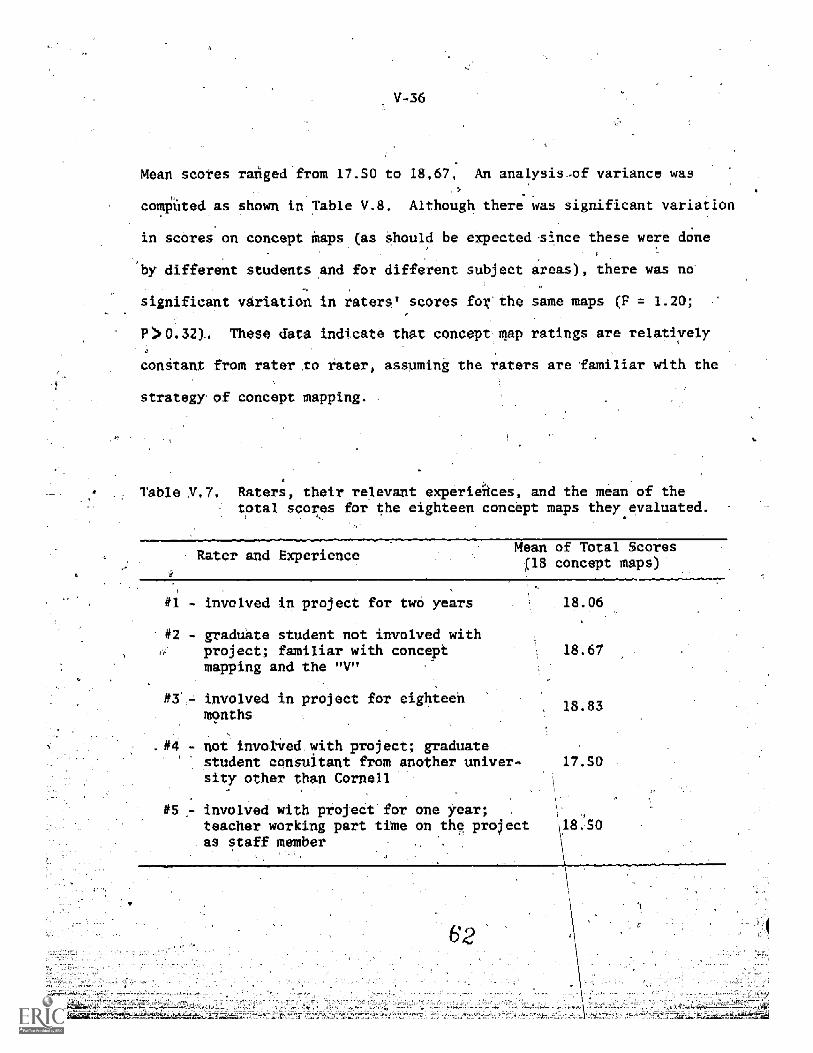
V-36
Mean scores raked from 17.50 to 18,67. An analysis-of variance was
computed as shown in Table V.8. Although there was significant variation
in scores on concept Maps (as should be expected-since these were done
by different students and for different subject areas), there was
significant variation in raters' scores for the same maps (F 1.20;
F >0.32):. These data indicate that concept map ratings are relatively
constant from rater, to rater, assuming the raters are familiar with the
strategy of concept mapping.
Table V.7. Raters, their relevant experiAces, and the mean of thetotal scores for the eighteen concept maps they evaluated.
Rater and ExperienceMean of Total Scoresf18 concept maps)
involved in project for two years
#2 - graduate student not involved withproject; familiar with conceptmapping and the "V"
involved in project for eighteenmonths
4 - not invokved with project; graduatestudent consultant from another univer-sity other than Cornell
18.06
18.67
18.83
17.50
#5 .- involved with project for one year;teacher working part time on the projectas staff member
_0
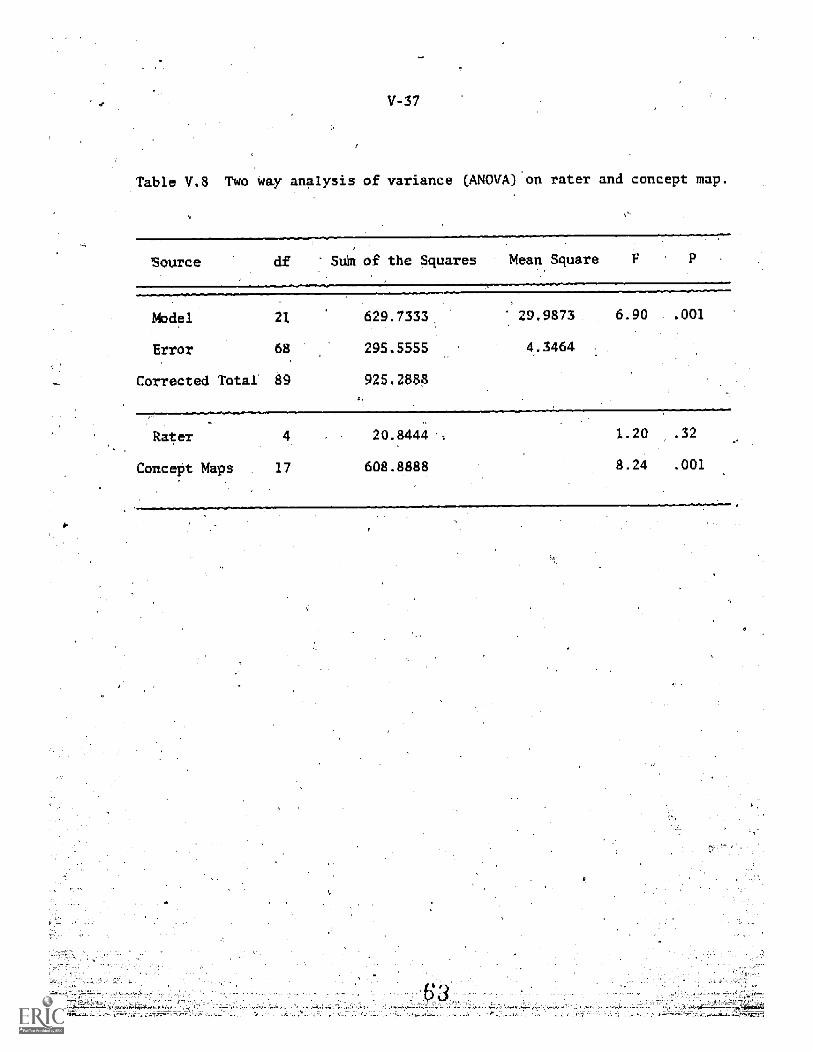
V-37
Table V.8 Two way analysis of variance (ANOVA) on rater and concept map.
source df Sun of the Squares Mean Square
Model
Error
Corrected Total
21
68
89
629.7333
295.5555
925.2888
29.9873
4.3464
6.90 .001
Rater
Concept Maps 17
20.8444
608.8888
1.20
8.24
.32
.001
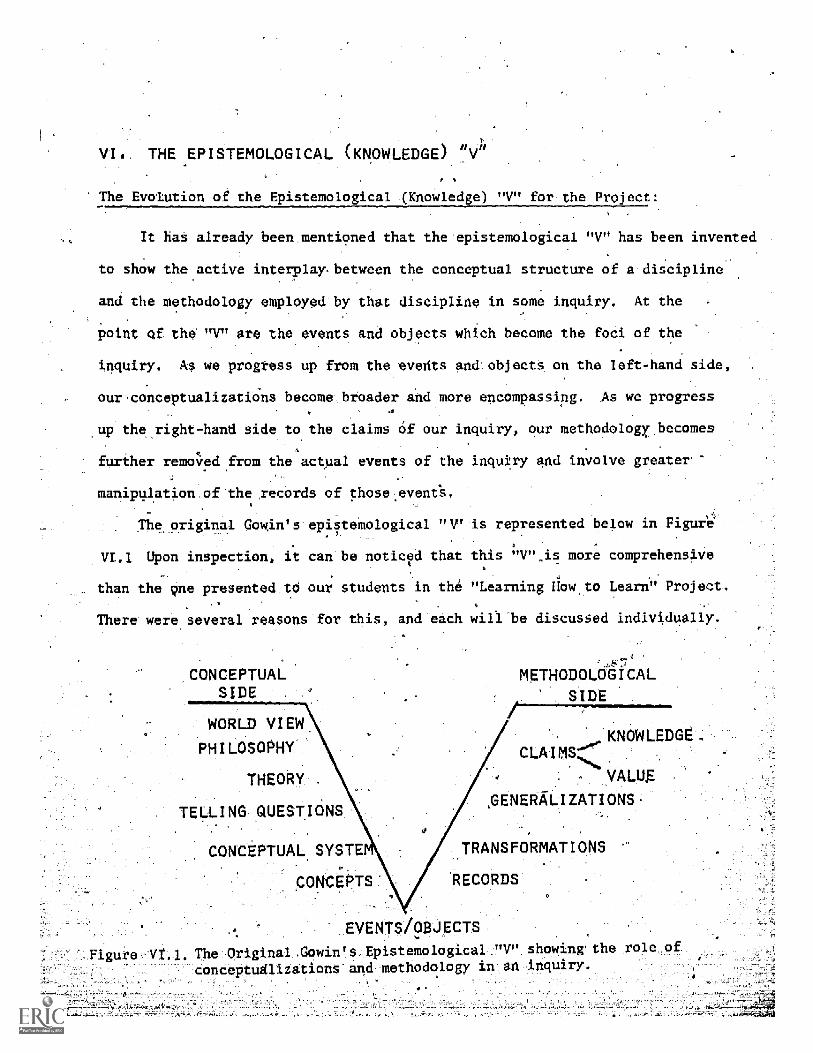
VII. THE EPISTEMOLOGICAL (KNOWLEDGE
The Evolution of the Epistemological 0 ledge) "V" for the Project:
It has already been,mentioned that the'epistemological "V" has been invented
to show the active interplay- between the conceptual structure of a'd scipline
and the methodology employed by that discipline in some inquiry. At the
point of the ,nr, are the events and objects which become the foci of the
inquiry. As we progress up from the events and objects on the left-hand side,
our.conceptualizatidns become broader and more encompassing. As we progress
up the right-hand side to the claims 0f our inquiry, our methodology. becomes
further removed from the actual events of the inquiry and involve greater.
manipqlation of the records of those events.
The original Gowin's epistemological "V' is represented below in Figure
VL.1 Upon inspection, it can be noticed that this "V"Js more comprehensive
than the gine presented to our students in the "Learning How to Learn" Project.
There were several reasons for this, and each will be discussed individually.
_CONCEPTUALSIDE .
METHODOLOGICALSIDE
WORLD VIEW
. PH I LOSOPHY...
THEORY..
KNOWLEDGE-.:
TELLING QUESTIONS.
VALUE
.GENERA LI ZATI ON
CONCEPTUAL SYSTE TRANSFORMATIONS
CONCEPTS RECORDS
EVENTS/OBJECTS
Figure Vt.1 The Original Gowin's Epistemological "V" showing' the role of
conceptudlizations and methodology in an inquiry.
VI
First, the left-hand side contained more terms - world view, philosophy,
theory, telling questions, conceptual systems, concepts -- than we were prepared
to introduce to junior high students. It was felt that the use of only four
of these terms with the exclusion: of "world view" and "philosophy" would be
appropriate for the junior high level. Since these students were rarely, if-ever,
exposed -to an examination of several philosophical perspectives of science or
to.metaphysical principles that form the bases of world views, these aspects of
the "V" were eliminated.
"Telling question" Also posed-a problem. Cowin (in press) defines- a telling
question in science as "posing a causal connection" within some phenomena of
interest. To ask, and to answer, a telling question requires an elaborate
conceptual framework to guide inquiries and to set those inquiries within the
context'of some field of study. Now, since junior high students do not encounter,
such far-reaching questions, and do not delve deeply within the conceptual
framework of the scientific disciplines, the use of "telling question" was
considered, inappropriate. to our needs for the project. For some tithe the
staff considered several other terms to 'identify the. kind of question that
askedin laboratory exercises at the junior high level. At first, we thought
that the term "good question" might accommodate our needs since it could distin-
.
,guish between a question, that led to a comprehensive inquiry and one that did not
(a "bad qupstion") However, this was discarded when wejealized that to use
the term "good" was value.rladen',_ and,may beinappropriate: for a- knOwledge
inquiry
Finally, the staff decided that focds questixin" would be more specific.
in identifying the function of the inquiry. Our early work with students atP
unior High School and-Lansing'Middle School suggested that the question
VI-3
should focus upon the events.or objects thht'were to be observed in the
0 k.
inquiry, and also identify, either explicitly.or implicitly, the concepts
relevant to the laboratOry exercise. We found it helpful, also, to move
the focus question from the left-hand side into the center of'the
since it was "central" to the inquiry and played a role in tying together
the conceptual and methodological elements of the investigation.
Another problem arose when considering the terms "conceptual system"
hnd "concepts." In our early attempts in the Ithaca junior high school,
we discovered that students had a great deal of difficulty distinguishing
between the two 'Again, we tried several alternative terms, until we decided
to adopt "principles" as the term that would occupy the space above concepts
and below theory. As noted in the previous section, principles are proposi-
tionscomposedof two or more concepts, although not all propositions are
principles.
Three sources of principles were also identified. Principles could come
from the prior knowledge claims of some previous inquiry (empirical principles).
Principles could also come from some theoretical model in the form of proposi-
-
tions (theoretical principles). These two types were grouped under the heading
Of "conceptual principle's ' The final type of principle was derived from the
of instrumentation and. other record-making devices that are used in the.
These were called 'methodological principles, and they serve toratory.
guide record-making and record transformations.
ing to the right-hand side of the 'V", fewer modifications occurred0
as a result of our work with students and teachers. We felt that records
and transformation-would suffice for the kinds of investigations that students'
-engaged in at the junior high'..Ievel ,althouhl_ we did find evidence that students
-did have difficulty knowing where these two terms fit along the "V".
IV-4
Under "claims, we soon restricted ourselves to using only "knowledge
claim." There were two, reasons for eliminating "value claims." First, we
were having (at that stage of the project) enough difficulty with teaching
the "V" to junior high students, and thought that the introduction of a new
set of ideas needed to clarify the meaning of "v,iiue claim" would only make
matters more difficult. Second, and probably more important, at the
beginning of the project there was a dispute about values slarification in a
school district nearby.- Now, although we recognized that there was a vast'
difference between our definition of "value claim" d ho "values clarifica-
tiOn" has been used (Raths, Uarmin, and Simon, 1966), we felt that there might
be some sort of backlash a backlash that the project could ill-afford to
encounter. Thus, for political reasons, this aspect of the "V" was deleted.
' Considering in retrospect the important aspects of value claims it
the sciencqs -- truth, elegance, practical application, and such --
is regretible that this facet of the project could not be pursued. It
is encouraged that, now having a firm basis for implementing the 'know-
ledge "VP in the classroom, this aspect of the "V" might be investigated
in the future. It is considered an important and rich source of informa--w
tion about the sciences, though different than the contentrorientation
that so often occupie's teachers and students.
The term "epistemology" was also dropped in favor the term "know.
ledge." Giving students and teachers such an unfamiliar work was not in
keeping with the learning theory that formed the basis of the project.
The concept label was inhibitin the learning of the meaning of that
oncept.
-FinallY, although we foOnd no problem with using "conceptual and-.
!!methodological Side," e offered the teachers the-option of-using the "think.,-'f0
de" and.the-"doing sidei"-respettiyely. Most teachers, though,--used
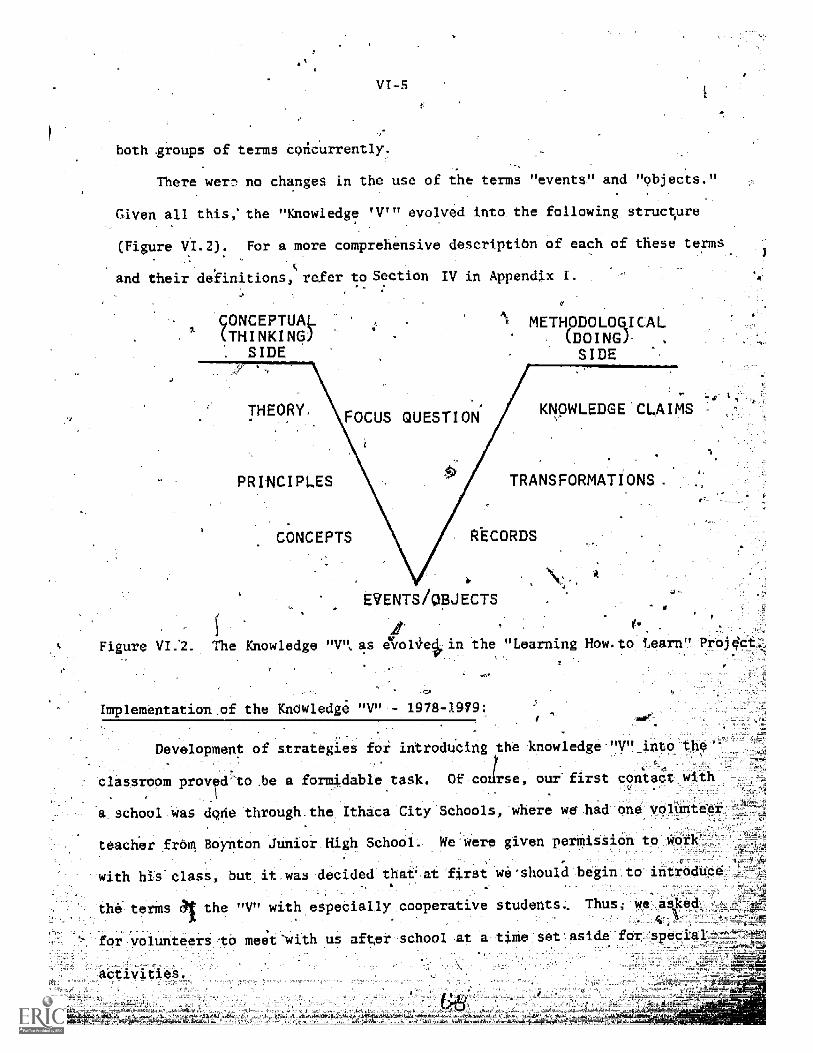
VI-5
both groups of terms concurrently.
There wer,_ no changes in the use of the terms "events!' and "objects."
Given all this,' the "Knowledge 'V" evolved into the following structure
(Figure VI.2). For a more comprehensive descriptiOn of each of these terms
c
and their definitions, refer to Section IV in Appendix I.
ONCEPTUALTHINKING)
SIDE
METHODO LOG I CAL(DOING)I NG )
SIDE.44
THEORY, FOCUS QUESTION
PRINCIPLES TRANSFORMATIONS
CONCEPTS RtCORDS
EVENTS/OBJECTS
ItFigure The Kmawledge "V", as 4C.r.ol*e in th_
Implementation,of the KnOwledge "V" 1978-1979:
'Learning How, to Learn" Project,
Development of strategies for introducing the knowledge "V" into the
7g
classroom prow d to be a formidable task. Of course, our first contact with
a school was done through the Ithaca City Schools, where we' had one voluntee
teacher frOm Boynton Junior High School, We were given permission to work
with his class but it was decided tharat first we-should begin to introduce
the terms the "V" with especially cooperative students, Thus we asked- 4,1
volunteers tO meet 'with us after school at a time set aside for special
activities.
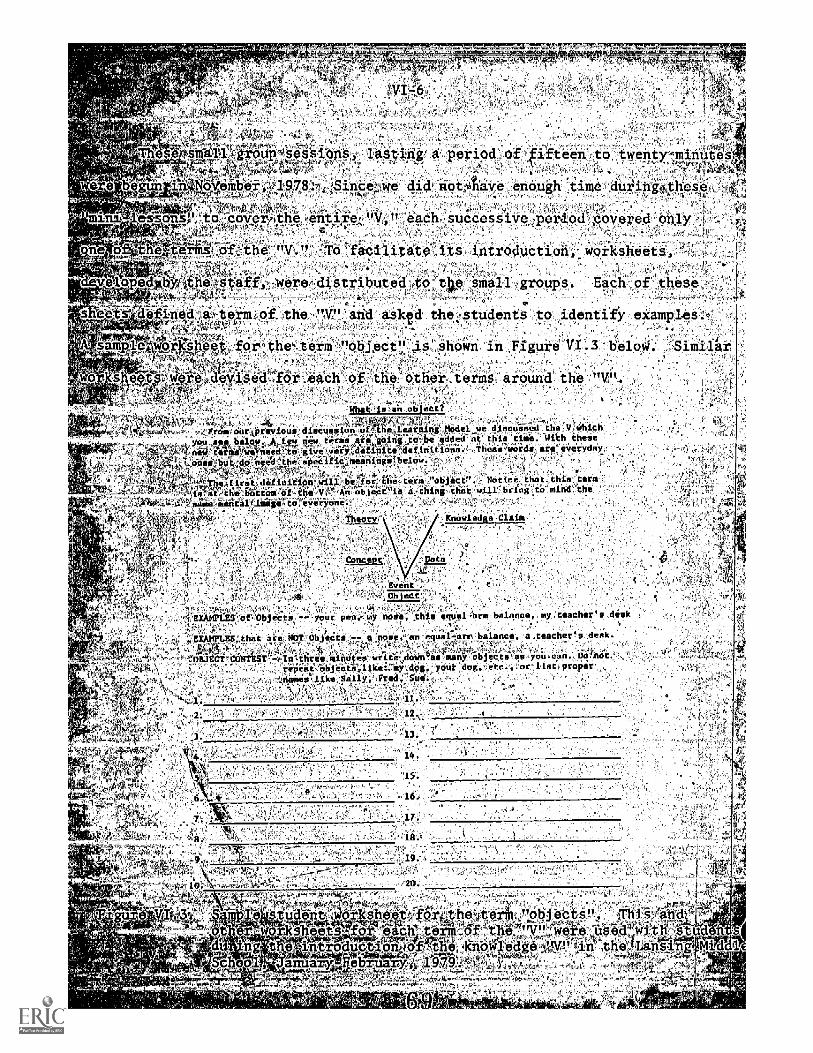
The_ eEA-70 =sesslons-,- lasting` a period ,
f fifteen to twentrminutes
e e begun 71 No mber,,, 978`1/2- 4-,Since;kwe not;6have enough time, during4these,
ne
essons o -cover, tne ,entire,"V -each successive pada. °
o the
she-ate-de
od ,a6vered oily !
e :"V." 'To 'facilitate' its ntroduction; worksheets,
;weredistributed to tie small groups. Each of these.
of the "VP and asked the students to identify examples.
A sample worksheet, forithe'term "object is shown in Figure 'Similar
wor_.sheet 07' evise.
each of the 'other- .terms around the -"V"
is_an otdjmLf
omfoorAprevions,discussion cif,4th_ earn's* Model. ve_discuiied the V which
frOsylw.Actew,niiiteims,r-gi s to-be Waded at this time. with these
OS'4et:need4:.Wilve.veliAef- jefinitiOnS. Theseyords,are-everyday'
7:Tha,firattdefin on-Wili-Ae:ioti the tire ."obJect".L Notice that this term
tlimsbdt6m h'Oji:""Jin'objectis i-ehihi,that will bring to mind-the
SeneWIMas-di _
.1.-2114mm Knowledse
are Ob
vent
nose; this equel-ars balance my teacher's desk
an equallarr balance, a_tescher's desk."L
__ 'Minute's write ny'objects-aa,you-can. Dolnot_'Objecti,likez-my_dog, your dos;_etc., or=list properlike,Nally, Fred. Sue: -,
'1Z.
s Udent, arkshee or,Ih e ,A t
hee ,fdr* -term ,
a n o due ta o *-,,ffi0-;the ,k no
-Janus -gb 97
or.ng
Sch a
obj IThislYarq.e-sgs:i_it.h7studen
Mid_ 1
,t6
VI-7 =
'At
-'After ,these initial trials with after-school groups we found these
apptoches inadequate for two reasonS. First, the terms of the "y" were/
_.:AataY
-being presented abstractly, . i.e., out of context to the subject matter that
the students were learning in class: No relation to their classwork or an .
was:being established. Second, since the after7school sessions were
on a ,volunteer basis, not all:students showed up throughout the entire group of
lessons. Thus, a problem of continuity arose.. -We asked the teacher to allow
,
us class time to introduce the "V" in its entirety /using a laboratory exercise
involving breathing and pulse rate (see page II-2 . of this report).
The staff designed a "V" for the exercise based on how it was .presented inI.
41 the text, and'rproceeded td lay it out for the students After the exercise ,..
1
- ,was 'cOmpieted. Although this was more in keeping with the trend that was to ,
-develop over the rest of !the.project, this particular laboratory exercise was
,seriously deficient in the conceptualizations about breathing and pulse rate.'I
The students wondered why the large emphasis 'on the conceptual, side of the "V1' :
when,_ for_ this, exercise. they recognized only /a few concepts as relevant. -,
Now,, this of Course was not true: there are /a staggering number of concepts
involved in--the _description of the breathing/pulse rate experiment, but Most 4
'students --YneW so few of -,theill that the use of the fty" seemed almost triVial.
Through class discussions other concepts were introduced_and a variety of
knowledge claiMs-were constru'cted.
Nr:
Part pf the difficulty ,experienced as that the "pulse -rate" exercise
-was not Written- to highlight the relevant concepts and principles of the inquiry
was decided that we ,should begin to design_a laboratory exercise that wetila-4`1'
: 1'__,..-.:,--inecessitate the inclUsionof a nimiber of i-concepts, ,shown refation to ei'd
Uf ciently.difficult to warrant close
i' --Sza4-1/1.4A4,77L,g4,1,vkr,":1-4e--=
' Vt.
ation of those concepts as precursors to the inquiry. We have
din,reiearch studies with college students (Chen, 1980; Buchweitz,
.1981) °that deficiencies in laboratoryinstructionsleeo corresponding,'
-deficienieS in learning. Applying t e ,,,V'IlieUristictoanalysis of
laborktory instructions
the problems.
can detect deficiencies and can be used to remedy
We proceeded to design a laboratory expe
on using an alternative. With the
ent lising the concept of
difficult to examine in vivo, we planned$
cooperation of the Cornell Food Science
samples of food from a slaughtered cow's
With these samples from the esophagus first stomach, small
intestine, and = large intestine, a lab - exercise was designed with the focus
ques on, "What happens to the starch in grain as it is digested in the cow,
digestive system?"
Using the iodine arch test and the Benedic s.sOlution-sugar test, w
divided each class into four groups with each,=
responsible for testing the
contents of one part of the digestive system for starch and sugar. The experi-,
2 periods to run, and the discussion where the "V" was used
"unpack" the exercise took almost one-half period. -GiveR,the unfavorable time
that the expermtent was run (two days before the Christias vacation ) , and -th
4
limited exposCre to the "V ", the staff decided that"this trial shoWed'
derate success. 1t was realized, though, as a result of this attempt, that
our staff could not become a substitute for the teacher and teach the learning
strategies directly to the students. It was clear that we needed to use the
existing curriculum and work with the teachers who would, in turn, introduce
the-strdiegies to the students
Directly'after,the winter Vacation, the
tunced'that be would'not be-tetUthing,to:the,
unteer teacher in- Boyntonr
classroom after-that year-
V
SinCe, by that time, was clear that Our project would continue into
" the next school year, and given that norther teachers in the Ithacecity
school's had expressed interest in our p ect, we decided to pursue coopera-:
on with other school districts'
ortunatel around that time, contacts had already been established with-
; -eighth "grada'science teacher in the ansing Middle School. He was teaching
h laboratory-oriented IPS Programand we felt that this might be the optimal,
ion for introducinglthe "V". We scheduled some informal meetings with
eacher to instruct him as to the nature and use of the'"V". After ,a few
hours which included discussion, f the nature of our project and its objectives,
this teacher introduced the "V" to his IFS class. This class was composed of
about: twenty -two students who were considered above average in reading and
mathematics, and for this reason were selected to. take part the IPS Program
Again, we uSed-the'Worksheets to introduce the terms. of the V''. Students
Completed the wOrkshiets for-homework,' and theh discussed them in class the-._
next :day
that they had been working on in clas
often relating the meaningsof the terms to the laboratory exercises
The "scientific method"'votabulary that-had operated in the IPS Program --
was substituted with-the terms of the-knowledge This.reinforced the atten-
ion of the program away from the more methodological aspects of IFS. toward
the conceptual side of the "V" and the-knowledge claims that had been accumulated
e year. In fact, at one point the participating,-
e assigned individual students to review one Or more of all the previous
a atory'exercises, and to compile all the knowledge claims that were derived,
--from them. The students were highly successful with this assignment, accumulk;;,
ing nearly forty claims. Now it was felt, the students had a working list,o
"empirical,principles" that could be functional in any subsequent -1 aberato
_
a:, StudentsAbeian, reconlze.,-Ithat- owledgaclaims,.!.from on-.."`rt
I-6
could become principles that guided future inquiries. They also recognized
that little or no theory level had been utilized. This was encouraging to f
e staff, since it Rointed out one of the major strengths of the "V" (and
-esses of'the.-IPS-Program ) :. the recognize
'V" elements operates in an inquiry and how new knowledge
on prior knowledge. This experience led in part to the section
the Teacher's Handbook which discusses sequencing of "V's (See page
8 in. Appendix I.)
Another consequence of the "V" activitief of the students was _the clarity
with which both they and the teacher saw the need for the broader explanatory
power of a. theory. As a'result, the teacher's instructional plan was modified
so that, the theory unit' (Chapter 8) was taught directly after unit five.
was done because the IPS Program reserves discussion of the major theoretical
model (molecular kinetics ) until after the empirical research has been com-
pleted. IFS exemplifies the Piagetian developmental psychology and the.
induCtivistiephilosophy of science which underliesthe program, in-
contrast to"our Ausubelian approach that places central focus on the acquisi-
,
of relevant concepts and a Toulmi philosophy that stresses
evolution' of concepts (Novak, 1977b).
We continued in the Lansing Middle School throughout the Spring, 1979.
As that teaCher became morecbmfortable with the "V" strategy, the attention-. - .
of,the staff was ddrected toward the other two schools that:were just then
e'intereit in our project. The -one seventh grade teacher in
sburg was willing to.adopt"our ideas in one of her classes and the
one seventh grade.teacher and one eighth grade teacher in the African Road
Junior High School (Vestal) also were willing to explore incorporating the
strategies into their respective curriculums.
ain, these three teachers wer
used them in their classes, but expressed confusion and lack of
en the workshee on the IP%
n about the implementation of the "V" strategy: It was realizeci
o mplement this kind of program within the Conventional
setting, given all the other pressures that accompany the teacher'sschool
day, more intensive training would be necessary=.; The staff soon recognized
that we could not just hand the teadher the materials and "let them loose
in the classroom." Rather, a firm and more complete orientation to the
philosophical and psychological foundations of the project must beTlanned
prior to the introduction of the materials into the classroom.
Not much progress was made with the "V" in Vestal in those few months
he 1978-1979 school year Trumansburg did better, partly as a
of closer staff and teacher communication and geography. With the small,
but encouraging,' 'successes in Trudensburg aid the information we-obtained
through the introductien of the IP' strategy in Lansing, plans we."
work in 19791980 to acquaiT!t the. teachers with the concepts underlying'
the knowledge "V".
ITplemencation 1979-1980:
With -the beginning of the:new school year and the second year, ef the
the staff geared up to implement the "V" is Tramansburg, and Vestal.
The teacher with whom we were working in Lan sing decided to return to Cornell
to pursue a MaSters-degree,and to become. part of theA3reject!s research tears:
Luring thee: of:1979, the staff= devised knowledge, "V's":for the Standard
laboratory exercises from the- texts and laboratoryManuals-thatthe teachets;
would be using. It was also-desided that classes would first be introduced
to the learning activities (Appendix I, Section II) and then to concept
zapping :-4 n'?7ruMansburg,.theteacher4decided=no eintroduce. , P-44 A9 d -°
e Structufe
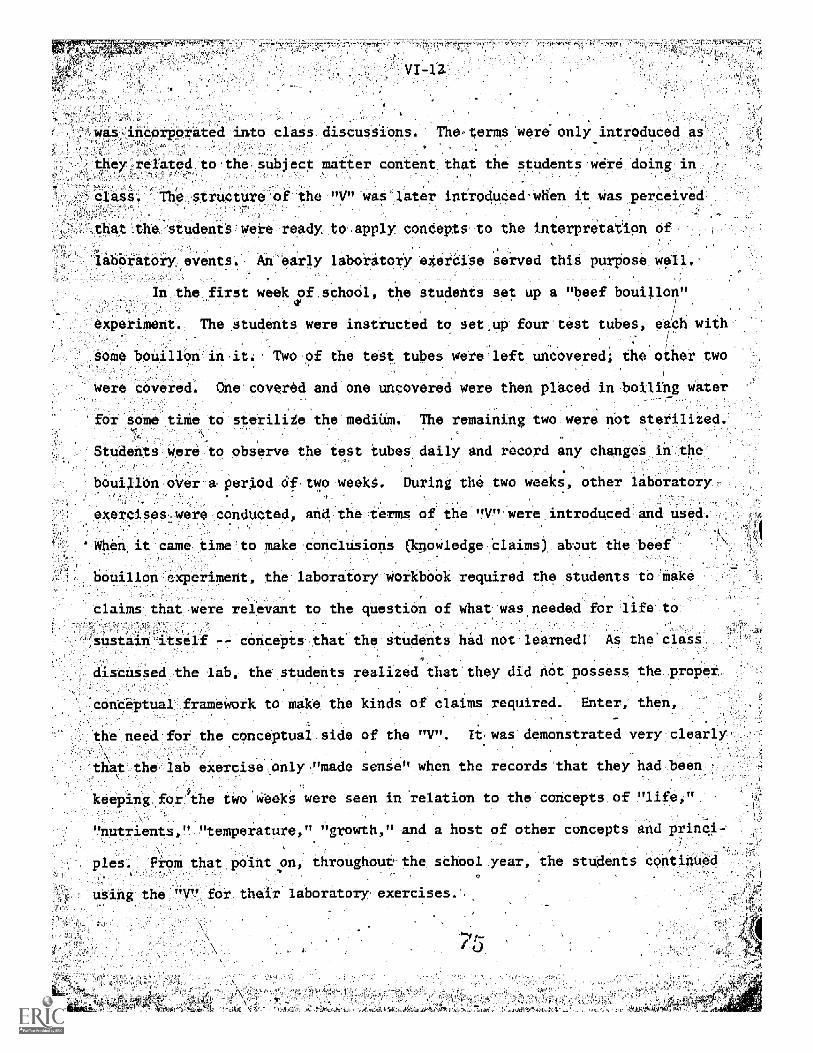
was, incorporated into class discussions. Then terms 'were- only introduced a
ere doing incrated to-the subject matter content that the students
class. The structure of the "V' was later introduced-when it was perceived
that the students were ready to apply condepts to the interpretation of
laboratory events. An early laboratory exercise served this purpose wall.
In the first week of school, the students set up a "beef bouillon"
experiment.. The students were instructed to set up four test tubes, each with
.some-.boUillon-An
were covered. One
'for some time
Students were
bouillon over
Two-pf the test tubes were left uncovered; the other two
covered and .one uncovered were then placed in boiling water
to sterilize the medium. The remaining two were not sterilized
to observe the test tubes daily and record any changes in the
a-period of. two weekS.
exercises-were conducted, and the tern of the "V" were ntroduced and used.
se to make conclusions k owledgeOlaims shout the beef'
During the two weeks other lihoratory
it came t
bouillon xperiment, the laboratory workbook required the students to make
claims that
sustain itself
were relevant to the question of what was needed for life to
discussed
. .
concepts that them students had net learned!' As the class
the lab, the students realized that they did net possess the proper.
conceptual;framework to make the kinds of claims required. Enter; then,
the need for the conceptual side of the "V". It was demonstrated very clearly .
that the lab exercise.only,"made sense" when the records'that they had been
keeping for the two weeks were seen in relation to the concepts. of "life
' "temperature," "growth," and a host of other concepts and princi-
ples. From that point on, throughouv the school year, the students continued
using the "V" for their laboratory exercises..
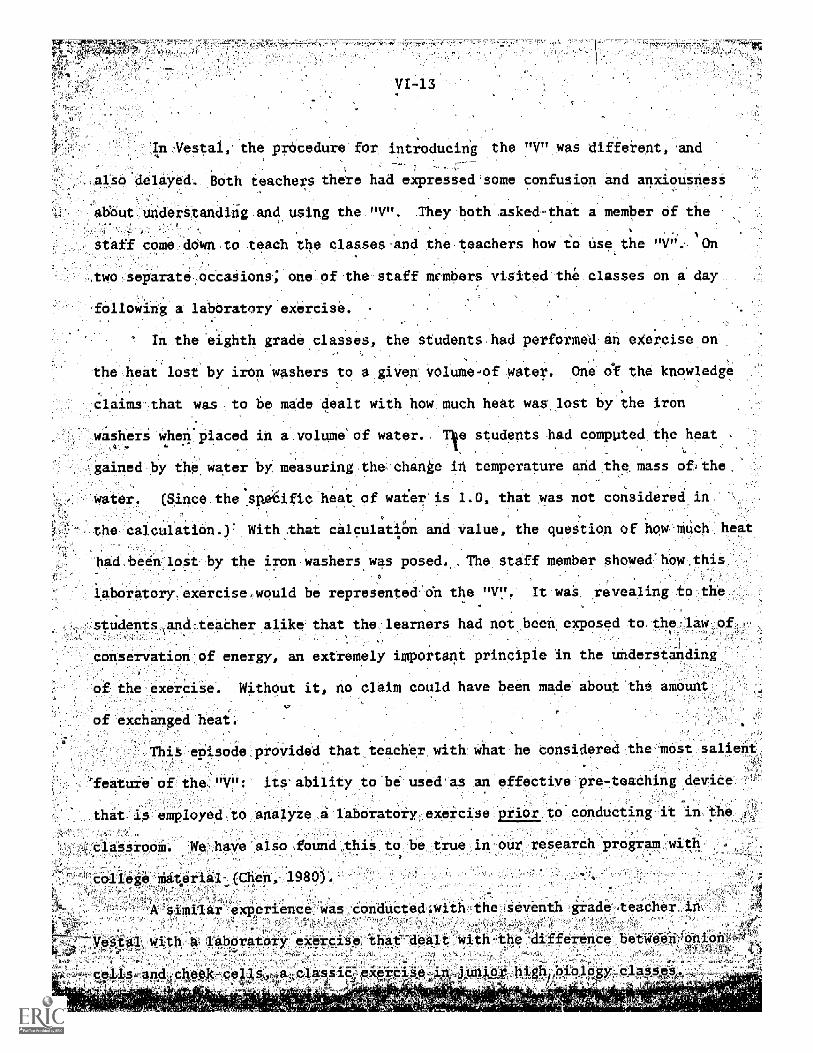
In Vestal, the procedure for introducing the "V" was different, an
Both teachers there had expressed some confusion and anxiousness
abbut:uhderstanding-and using the "V". They both asked-that a member of the
staff come down to teach the classes -and the teachers how to use the 9/":-
wo separate occasions; one of the staff members visited -the classes on a day
owing a laboratory exercise.
In_the eighth grade classes the students .had performed- an exercise on
the heat lost by iron washers to a given volume-of water. One of the knowledge
claims that -was to be made dealt with how much heat was lost by the iron
washer -Whenplaced ih a volume of water-- e students .had computed the heat ,
-'_gained by the water by measuring-the-chanke in temperature ancithe-mass,ofIthe
(Since the spEific heat of water is 1.0, that was not considered in
With that calculation and value, the question of how much
had been lost by the iron washers was posed, The staff member showed how this
the calculation
laboratory.exercise.would be represented cih the "V ". It was revealing to the
tudentsand teacher alike that the, learners had not been exposed to the law of
conservation of energy, an extremely important principle in the understanding
of the exercise. Without it, no claim could have been made about th
of exchanged heat;
This episode p vided that teacher with what he considered the most salient
eature of the "V": its ability to be used as an effective pre-teaching device
that employed to analyze a laboratory exercise prior to conducting it in the
We have also found this to be true in our research program withclaSsrooi.
college matarial_.(Chen, 1980)..
r experience was conducted.with the seventh grade teacher in
- ,
'--7Vestal. with klahoratoryexercise that with-the difference betWe-entiniOh
,
..
,callsKand,,cheek-cella ',.,.alclasSie-,,eXercise-,_in-Jmnioz!__high ato_lpgy,c_laitse*,__ , ..., .,, . . , . _ .. _,
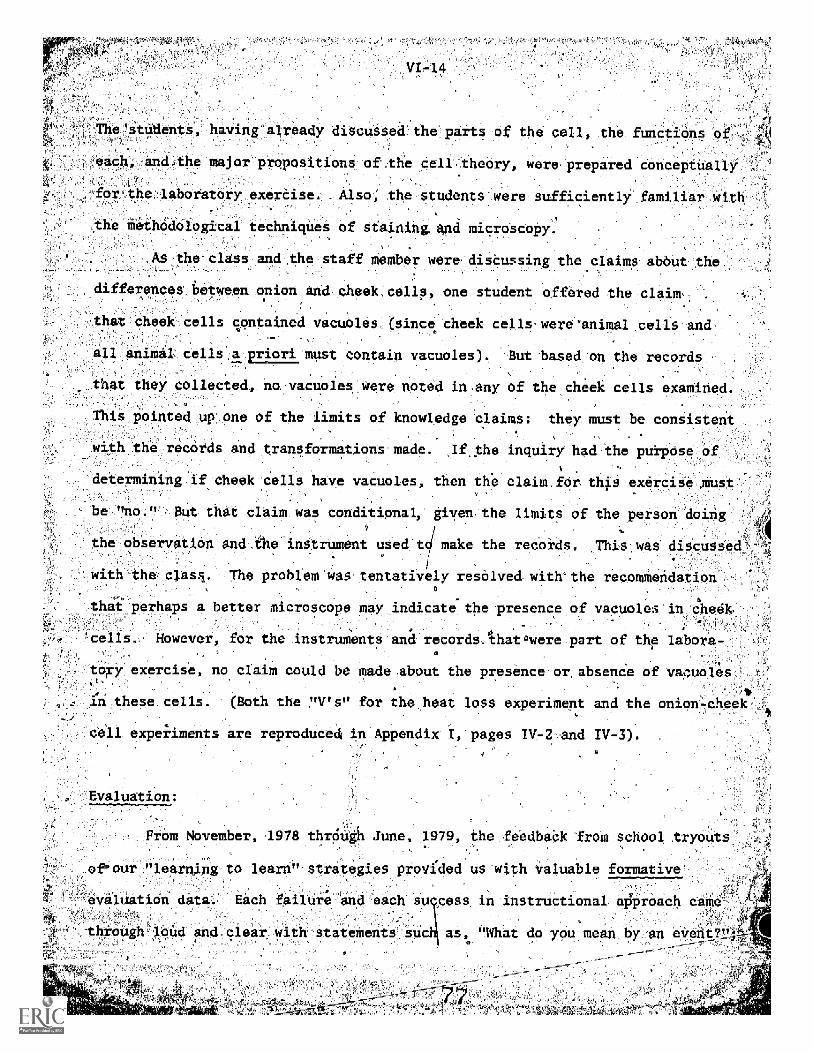
Theitudents, having already discussed'the parts o the cell, the functions of
each,- and major propositions of.the cell theory, were prepared conceptually
for therlaboratory exe se. _ Also; the students ".were sufficiently. familiar with
the methodological techniques cf staining and microscopy.
.the-class-and the staff member
ti
discussing the claims about the.
differences between onion and cheek cells, one student offered the claim
cheek cells contained vacuoles since cheek cells were-animal cells and
all animal cells
at
is
a priori must contain vacuoles) But based on the records
they collected; no vacuoles were noted in,any of the cheek cellS examined.
pointed up; one of the limits-of knowledge claims: they must be consistent
the records and transformations made. If the inquiry had.the purpose of
determining if cheek cells have vacuoles, then thP claim.fer this exercise .must
But that claim was conditional, given the limits of the person doing
instrument used make the records. This was discussed
with the class. The problem as tentatively resolved with'the recommendation0
that perhaps a better microscope may indicate the presence of vacuoles in dhedk
'cells However, for the = instruments and ecords,%hatowere part of the labora-
tory exercise, no claim could be made .about the presenceor.absence of vacuoles
im,these.cells. -path the "V's" for the.heat loss experiment and the onien'acheek
cell experiments are reproduced in Appendix I, pages IV-2 and IV-3).
Fro November, 1978 thrO4 e, 1979, the feedbaCk from school tryouts
of-our "learning to learn" strategies provided us with valuable formative
evaluation data.- Each failure and each sucess in inst ctional Oproach came
.t_rough-loud and clear with statements scu aSWhat do you sleanby.an eVent"-'-_
,W-7:41takJa ae,
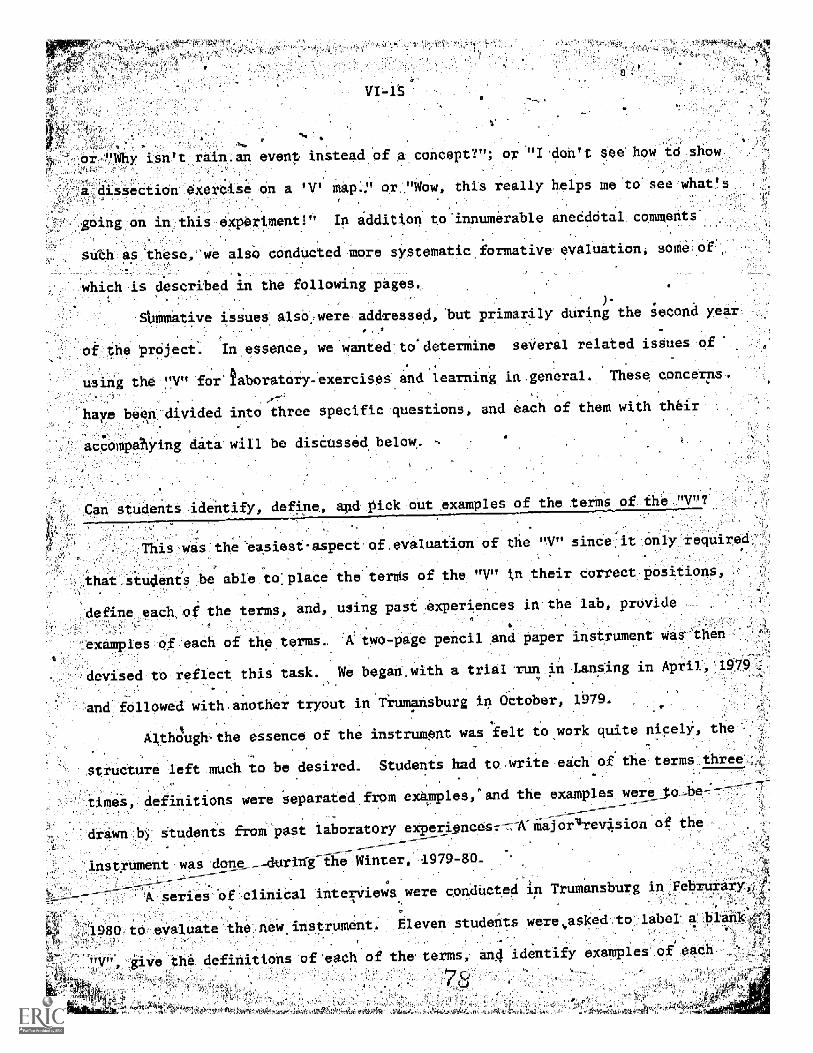
'Why rain.an event instead of
dissection exercise on a 'V
experiment!" In addition to innumerable anecatal comments
we also conducted more systematic formative evaluation, some o
mAp.21
A concept?"; or "I-don't see how td show
"Wow, this really helps me to see what's
which is described in the following pages,)-
Shmmative issues also,were addressed, but primarily during the second year
the preject. In essence, we wanted to determine several related issues of
using the vs for taboratory-exercises and learning in general. These concerns.
,,-
Kaye been-divided into three specific questions, and each of them with their
acc mpaying:data. will be disenssedbelow.
d pick but examples of the terms o
This was the e pect of, evaluation of the "V" since it only required
-
that students be able to place the terms of the "V" in their correct positions,
define each,of the terms, and, using past experiences inthe lab, provide
examples of each of the terms. A two-page pencil and paper in
devised to reflect this task. We began with a trial run in Lansing in April,
trument was-then
and followed with another tryout in Trumansburg in October, 1979.
Althdugh the essence of the instrument was felt to work quite nicely, the
cture left much to be desired. Students had to write each of the terms three
es, definitions were separated from examples, and the examples were tobe-_-- -----
drawn b) students from past laboratory experiences: A majorrevsion of the
rig the_
Winter 1979-80-instrument was done_
A series of clinical inteTviews were conducted
1980 to evaluate the new instrument. Eleven students were asked to label a blank='n Trumansburg in_Februrary
"V", give the definitions of'each of the terms, an4
78
dentify examples of each
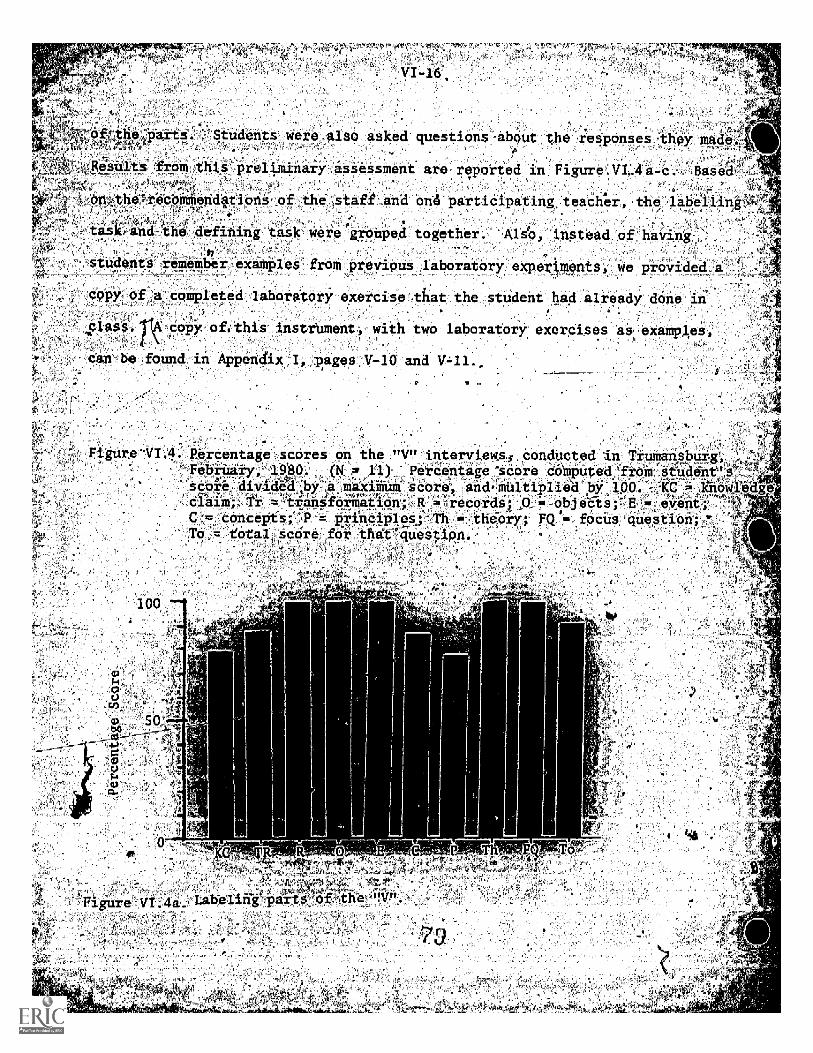
,-VI -l6
Students were also asked questions -about the responses -they made
esuitsfroM this preliminary = assessment are reported in Figure.VI-4a-c.- Base
pinthe,r0OMMendationa of the staff-and one participating teadier, the labelling-- -- :a- vv_` ,- '
.,participating
.
-4: i'',.+ , " ,j. i.,1 At- : " _ _ --. , 2 ,
-k=andLthe.defining'task werea
grouped together. Aldo instead_ of havingri
tudents remember examples_ from previous laboratory experiments, we provided, a
copy of a completed laboratory exercise that the student ha4 already done in= .
,Elass. copy of.thiS instrument, with two laboratory exercises aa, examp1es
can be found in Appendix I, pages V-10 and V-11.,
re-VI.4. Percentage,scores on the "V" interviews- Conducted-in Trumansburg,Febi:Uary,1980:. (N = 11) -Percentage-score computed from st4c16,t'Sscore. divided by a maximum score, and=multiplie'd by 1130,-;kc:.4 khowlidgeclaim;; Tr ...:tranifoTiPaon; R records; 0 =-objeas;-E = evenf_zC concepts; :p = p#nciples;-:Th =-thebry; *= focus question;To =- total score, for that 'question.
4 :
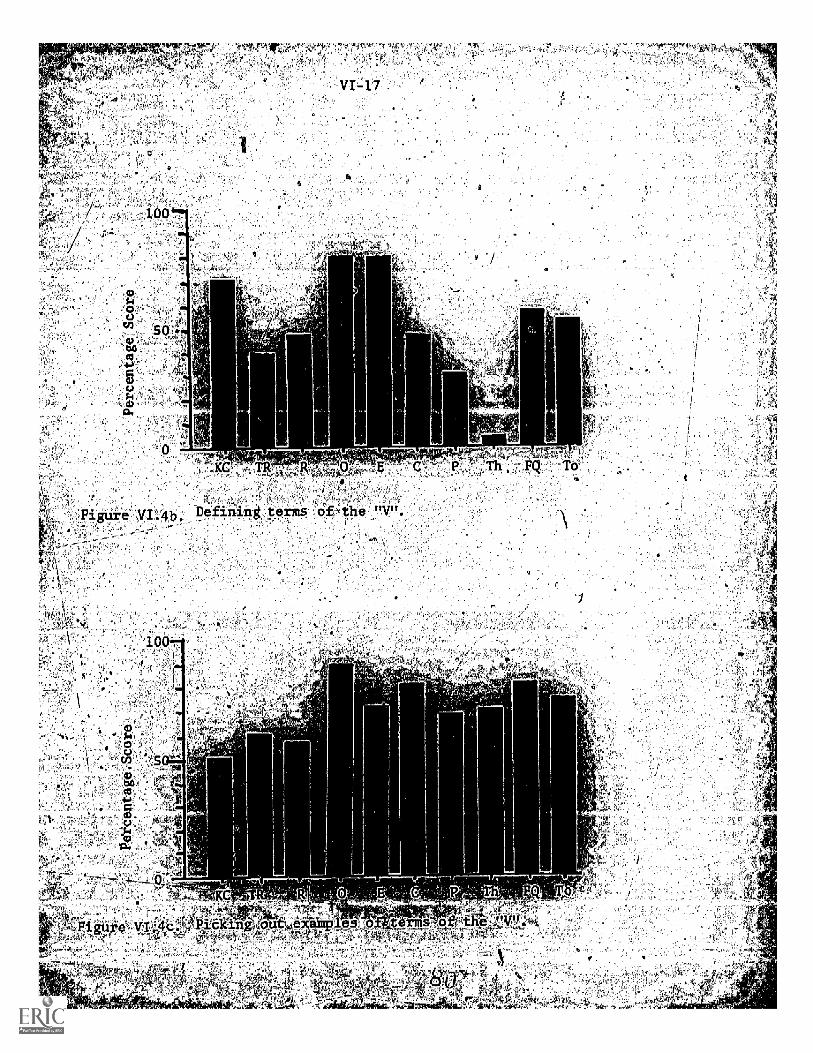
Examination
VI-18
f even these very, preliminary results proyide some clues
familiarity of the student with the "V" and Where.the-emphaSis
relative:to
students- ea
truction about the "V". First, Figure VI.4a indicates that
position most of the terms in their correct places,arbuna the "V",-
but as indicateokby Figure VI.4b, their ability to define each term 'of_ the 'V" wa
enceuragingr-' 'Indeed, a Very small percentage of:students could Ove an.
.
adeqUate definition-of "theory." This could:be due to ,the fadt'that the
teacher in Trumansburg had not taught-the students a variety of theoritS,
but concentrated mainly-on:the cell theory and the theory of natural'selec-
tion. Thus; the students were not privy to the range, function and
.Structure of a theoretical modeL. On picking out .examples (Figure VI.4c) the
students did much better There are indications that, although tents
could not provide comprehensive definitions of the terms as shown in Figure VI 4b11
they did haVe encugh operating definitions for severa -of the terms to-be
.able to recognize examples of,-most of these terms within the context of a
given laboratory exercise. Only "knowledge claim ' "transformation ' and0
"record" provided some diffidulty. But that' might have been the fault of
ith- instrument.used:' examination of the instrument on page V-11 in Appendix I
n pod experiment) sho s that the records are embedded in two )rpes of
transformations, the table and the graph. Students did have som trouble
distinguishing the records (the actual number of bean in each of the pods
from the transfo0 rmatlons (table and figure- fo frequencydistribution
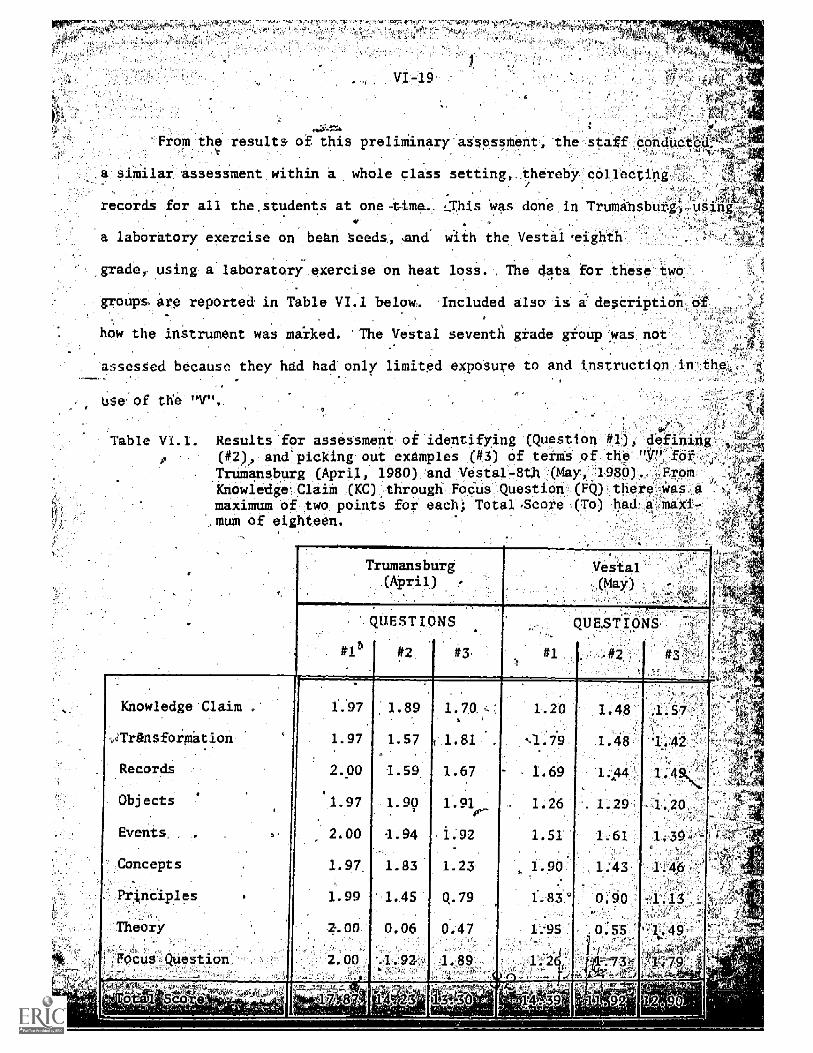
- ,re "".- -r.=" pyr,
VI -l9
'From, the results of this preliminary assesstent the staff conducte
a similar assessment within a. whole class setting, thereby collecting
records for all the students at one-time-L is was done in Trumansburg.,,usin
a laboratory exercise on bean seeds, and with the Vestal .eighth
grade using a laboratory exercise on heat loss. . The data for these
groups- are reported in Table VI.1 below. Included also is a' description of
two
how. the instrument was marked. The Vestal seventh grade grOupwas not
`assessed because they had had only limited rxposure to and instruction inthe
use:'of-the Milt
Table V1.1. Results for assessment of identifying (Question #1), defining
0 (#2), and picking out examples (#3) of terms of the "V" fot,Trumansburg (April, 1980) and Vestal-8th (May, 1980). YromKnowledge Claith (KC) through Focus Question (FQ) there was_amaximum of two points for each; Tota1,5core (To) had a maxi-mum of eighteen.
Trumansburg(April)
QUESTIONS
#2
Vestal(May)
QUESTIONS
#1 ,#2
Knowledge Claim
-.Transformation
Records
Objects
Events.
Concepts
Principles
1.97
1.97
2.00
Focus ,Question
2.00
1.97
1.99
2-.00
2.00
1.89
1.57
1.89
1.99
4.94
1.83
1.45
0.06
1.20 1.48 .1.57
1.48 1.42-
- 1.69 1.44 1.4
1.26 . 1.29 1.20
1.51 1.61 1.396
1.90 1.43 1.46
1.83' 0.90 3,
1;95 0:55 ,1.49u.
VI-20
In essence, each of the three questions of this assessment constituted
a separate instrument, each with its own objective of determinin how. familiar
the students were with the knowledge "V".
The assessment was graded on the basis of two points maximum for each
par., of the question. Thus, the proper definition of "theory" was, awarded
two pbints. If the student in writing a definition or example of a particular
term did not have a totally correct answer, but one that provided an indication
that the student "was on the right track," one point was given. If the answer
was totally wrong-, no points were ahardel.
A comparisork,of the performances of the Trumansburg group and the Vestal
group should be done:with the7utmost cauiion. There were several factors'9-
present that might affect the validity of anY generalization between the
two groups. First, the Trumansburg group received a greater amount of instruct
in the " having used it since the beginning of the year. The Vestal grout)
had only been using it for five months. Secznd, although the instruments were
identical .for Questions #1 and #2, the laboratory exercises used from which the
students picked out examples. ( ( uestion #3) were different. There is no
way, that we know, of comparing.the relative difficulties of these two, laboratory
exercises, Thifd, the assessments at bath schools were administered by staff
members. Although-we had made severaf-til.pao Vestal to'observe-classes and
interview students, the amount of time directlyan contact with the students
-Trumansburg far exceeded the time directly involved with the students in-us the Vestal students might. have been a little nervous being_ -
==the--"Cornell.Tpople."-.The Trumansburg group, that=time =were
mfortable_With---the-:cohstant-visitations eir.classroom.7-
;,eighth'1:grnde students oft
a sbu
VI-i
light of these cautions, however, there are some interesting comparisons
that can be established between the two groups. Trumansburg preformed better
on the average for the total scores for each question. This might indicate
that there is a factor of "time on task" which is important to the mastery-
.of the knowledge 'V". To individual questions, although both - groups were
comparable in identifying "theory" on the "V" (2.00 for Trumansburg; 1.95
for Vestal ),Nettal did much better at defining and picking out examples of
the theory in the given laboratory exercise (0.55 and 1.49 for'questions #2
and 13- for Vestal;-0.06 and 0.47 for/Trumansbur0. -Since the eighth grade
,teacher in Vestal stressed to a great degree:the importance of the theory4V
in scientific inquiry, we would expect this finding. As mentioned earlier,
the teacher in Trumansburg did not, stress theory as much. Further; in the
laboratory exercise given the Trumansburg students the theory that was provided
'zt
was written as "natural selection." The students-should have known that,
.but_wereprobably more familiar with the term "theory of evolution." This
may account fOr,i116.comparatively-low score in that qUeStion.
-1.01 for labdratory exercises they perform
To answer this question required two separate activities during the course
of the second year of the project. First, arrangements had to be_made to
-'_acquire and accumulate a large sampling of laboratory exercises put -on the
ttcrii =was-easiest-for our group -in= Trumansburg sincl-they hacrused-,..-
(
the? tginh t yingofhe-ear and._because a staff: member worked
orsely-iaththat,,teacher_which_took' some responsibility, off theteacher.
;V1,22
The second major activity involved with answering this question dealt
with the creation of a scaling device to measure students' ability to
put a laboratory, exercise on the "V". During the second of of consultants'
meetings (July, 1979), it was recommended that we identify some sort of
ordinal scaling procedure for assessing the "V's" that students turn- in.-
A preliminary scaling procedure, based on analysis -of previously constructed-
"V's", was developed .in August, 1979.
The nine. terms of the -"V" were grouped into five general categories.
since some of the terms depended closely upon.related terms. Thus, "theory,"
"principles," and "concepts" wereIrouned together* "objects"- and "events"-.-
were-grouped together- d ."recotds" and "transformations" were grouped toget-..
her. "Focus question and "knowledge claim" were thought to stand independent
at least for assessment purposes the other parts of jhe "V".
The scaling for each general category began with zero indicating that
nothing ifi that group was identified by the student. Next,- an optimum
reptesentation of that category was constructed,:specifying the criteria
needed, to represent that optimum. Thee were not immediately assigned a
numerical value 'For instance, the focus. question was identified to be
optimum if. it contained.the key concepts. to-b_ used- in the inquiry:and-
suggetted,themajor event and/or relevant objects. From that optimum c.se,
varying of- "completeness" were then added into-`the scale for focus
question,. The number...value for the optimum case would thus depend upon the
hup,er of specifically.identified-levels for that category, 'beginning with
-zero- ascending to. the optimum value.,
Scoring procedures- for'the "focus question" are shown in Table V1.2.
es of two labo atory exercises, marked- 'th-the criteria, are shown in--
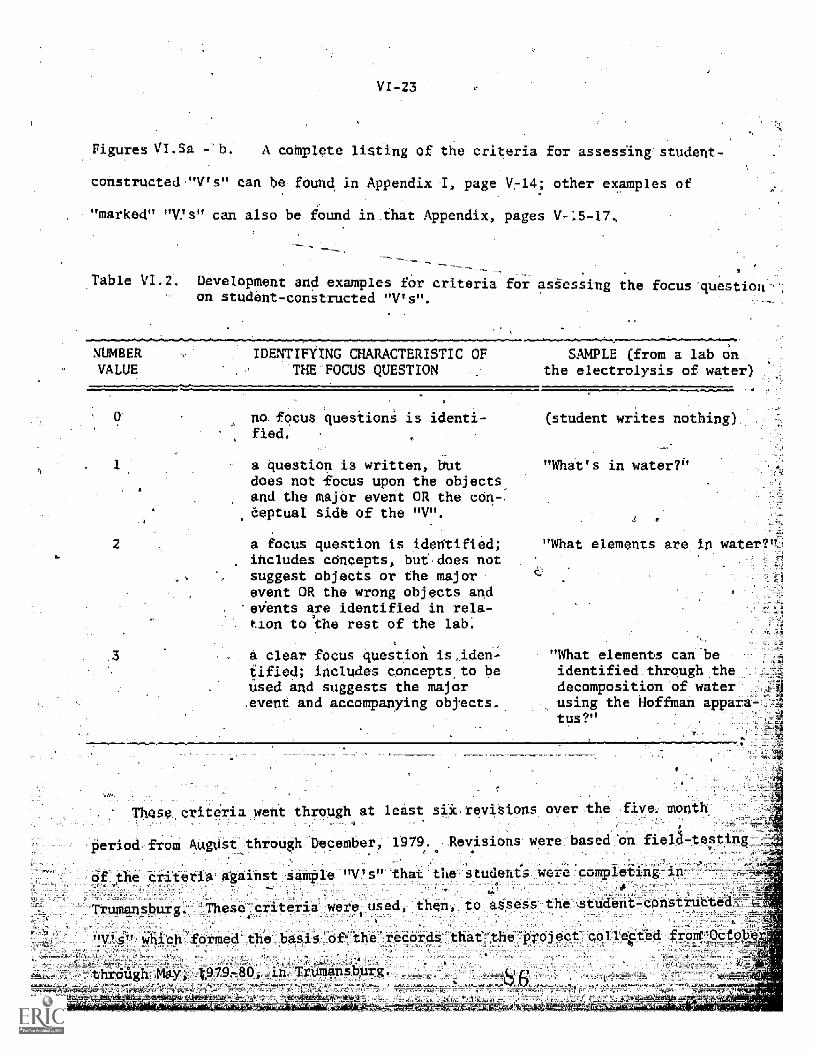
VI-23
Figures VI.Sa -'1): A cohplete listing of the criteria for assessing' studen
constructed-"V's" can be- found in Appendix 1- page V714; other examples of
"marked" "V.'s" can also be found in .that Appendix, pages V-15-17,
Table VI.2. Development and examples for criteria for asiession student-constructed "V's".
g the focus question
NUMBERVALUE
IDENTIFYING CHARACTERISTIC OFTHE -FOCUS QUESTION
SAMPLE (from a lab onthe electrolysis of water
2
no focus questions is identi-fied.
a question is written, butdoes not focus upon the objects,and the major event OR the con-Ceptual side of the "V".
a focus question is identified;includes concepts, but does notsuggest objects or the majorevent OR the wrong objects andevents are identified in rela-tion to the rest of the lab.
a clear focus question is,iden-tified; includes conceptato beused and suggests the majorevent-and accompanying objects.
(student writes nothing)
"What's in water?"
"What elements are in
"What elements can 'beidentified through thedecomposition of waterusing the Hoffman appara-tus?"
_0 criteria went through at least
iod-from August through December, 1979.
i revisions over the 'five; month'
%,Revisions were based on field -testing
e criteria against sample 1/ s that to tudents wer g in
Trumansburg. 'These criteria were used, then, to1
"V's!' which
assess- the-atudent-construtte_
-rmed-the basis of' the:records_that the-project:collected frOd-lOctob:
979.8Q.,_.4n7-rumansburg._
v$*,-,,+-1AMAWC-m-
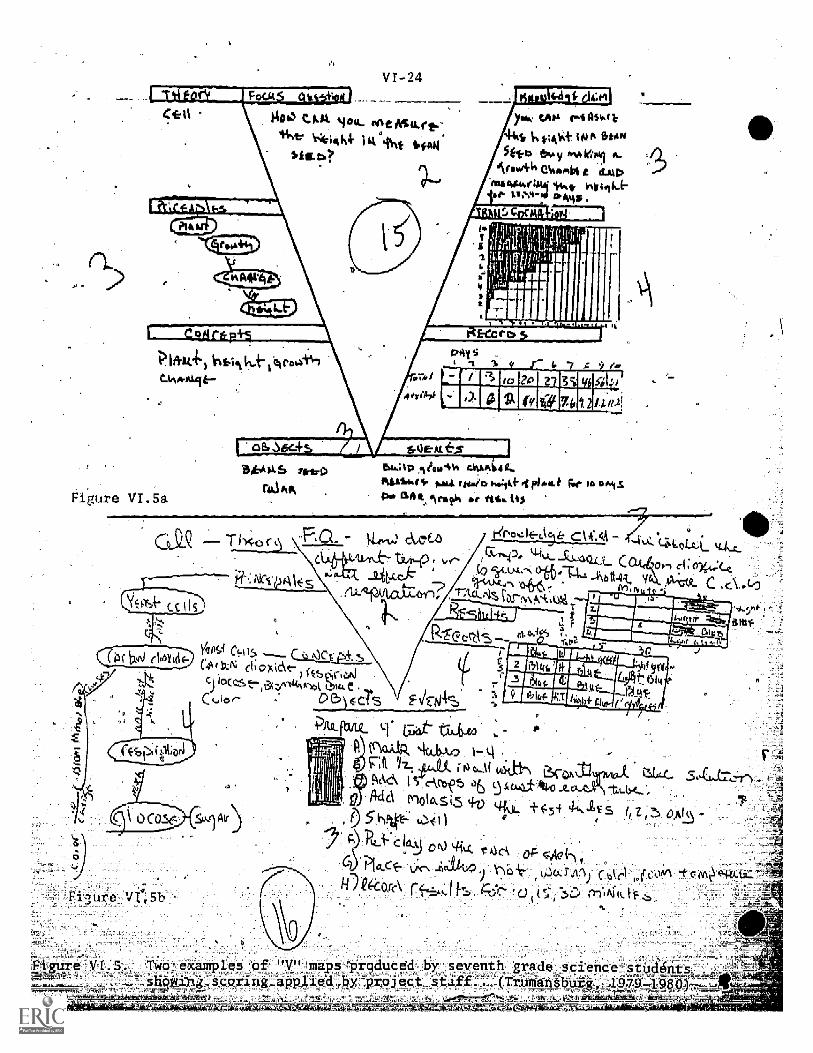
VI-24
Figure VI.SaWAR
Rim 144 ME. Ii a(D frubIki" tCie SAL, Aroe% or stsk ltS
-CO, 4-i
_2!_CipikkS
Yana(1,0fICI
C ttN ci+07.'dr(kbocieA1
tect?-03(:.""u,ftlok°I05'
cf\GAIR Ica_ko I-cl tudi ;14 e.._1ptLre. IS c&ctreb 66 91
g Ada fnolksis +V tf51ipkift-- 00)
pro
/4
Filture
E. -WI 1I4e,,e-xelriple -of, "V" maps'.,preducdcl,_ by seventh grade _:sqlence,'stud6nts,;-:
: ihewir!,-- 1-4corirkg:appliid :by 'pteject _pi t.i_ umaribfitg,:.19Yo--i §-8.-Q) ,:-.,
VI-25
An analysis of the rating scale for assessing student-constructed "V
was completed and is reported in the final part of this section.
Student-constructed "V's" were collected and assessed for ten represpnta-
tive laboratory exercises from October, 1979 through May, 1980 in Trumansburg,
The results of the analysis of these "V's" are given below in Table.VI.3 and
Figures V1.'6 and V1.7.
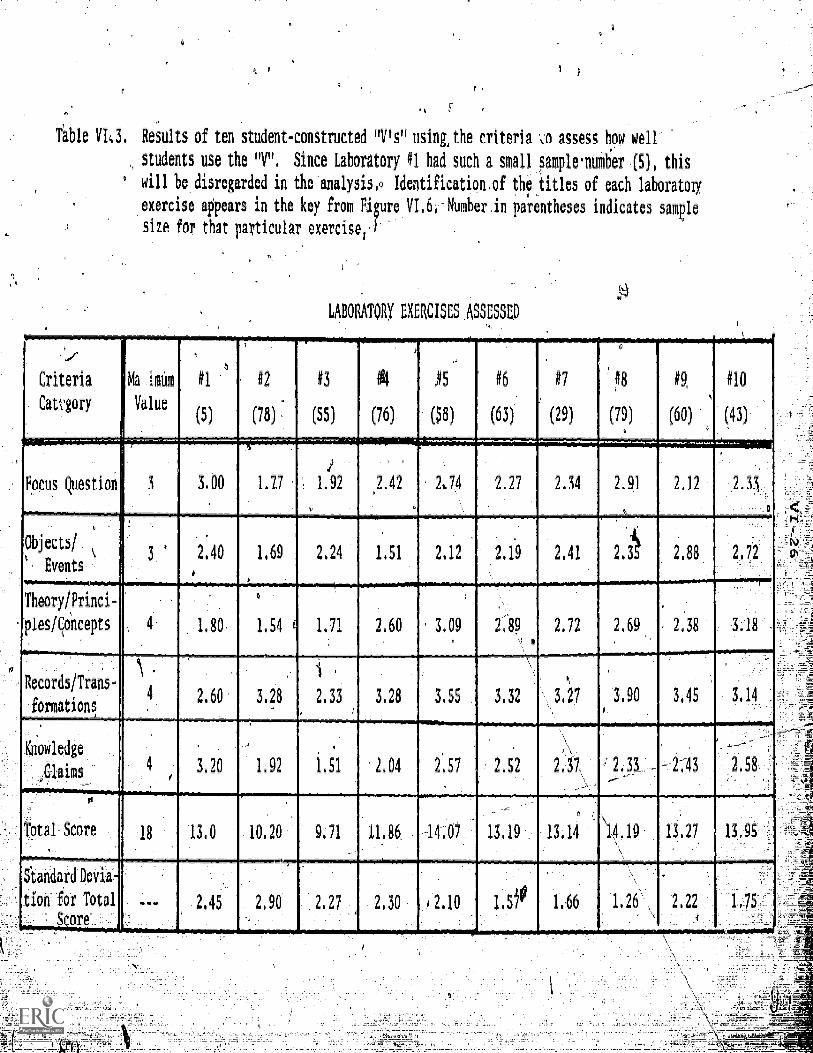
Tible Vla Results of ten student-constructed "V's" using, the criteria assess how well
students use the "V". Since Laboratory #1 had such a small pmple.number (5), this
will be disregarded in the analysis, Identification of the titles of each laboratory
exercise appears in the key from Figure V1.6. Number in parentheses indicates sample
size for that particular exercise,
LABORATORY EXERCISES ASSESSED.
Focus Question
Objects/
Events
TheorOrinci-
pies/concepts
Records/Trans-
formations
2169 2.38
3.90 3.45
andard Devia-
ton for Total
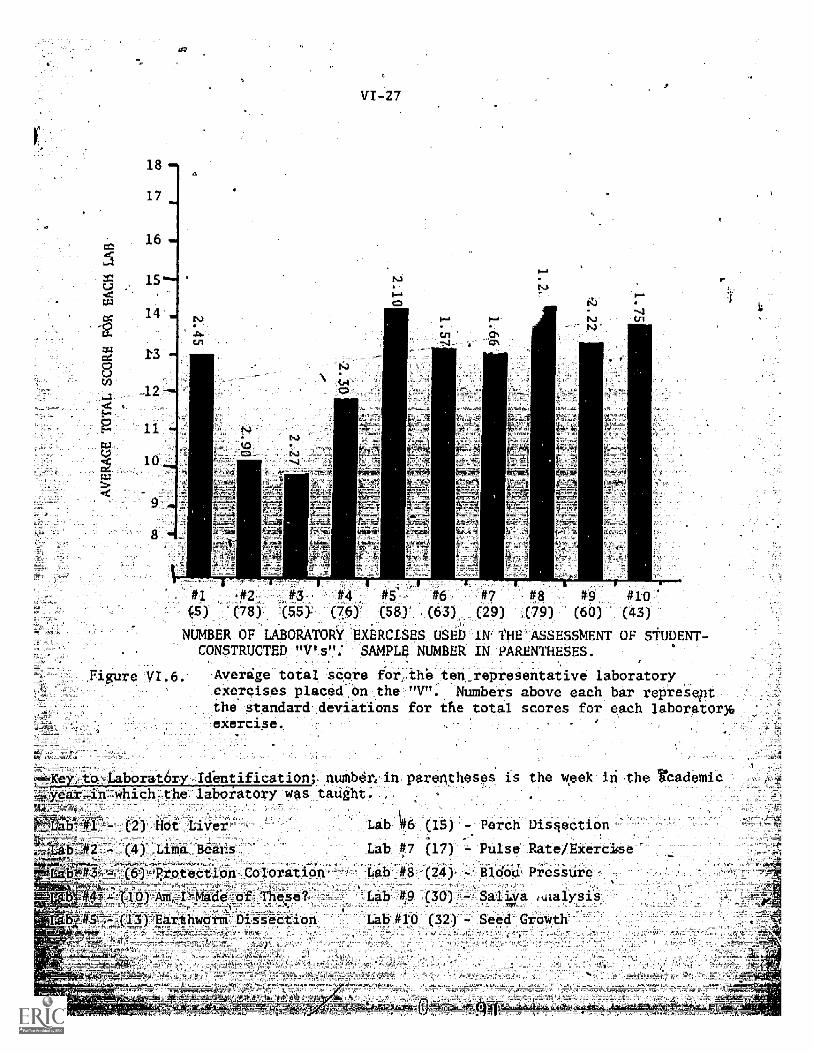
1817
14
VI 27
r
#2 #3 #57--- #6 #7 #8 #9 #1_
-(66)- (7) ,(58),(63) :,.(79)- (60). . . .
NUMBER.. OF LABORATORT 'EXERCISES: USED -.IWTHEl,--ASSESSMENT OF STUDENT-CONSTRUCTED "V, su.' SAMPLE NUMBER IN PARENTHESES.
VI 6. Average total score for,.the ten _representative laboratoryexercises placed on the "V". Numbers above each bar represeintthe standard deviations for tile total scores for each laboratorN,exercise.
Key! oratory Identification; number. in parenthesesar -in which the laboratory was taught.
(4) Lima BeansP.rotection Coloration
0 Am,_ de = o Thete?EarthworieDiSieCtion
b ft6 (
s the week
Perch Dis§ectionLab #7 (17) Pulse Rate/ExercilseLab #8 (24) - Bldod Pressur
- -
Lab #9 (30) - Salida iuialysisLab #10 (32) T Seed Growth
A-
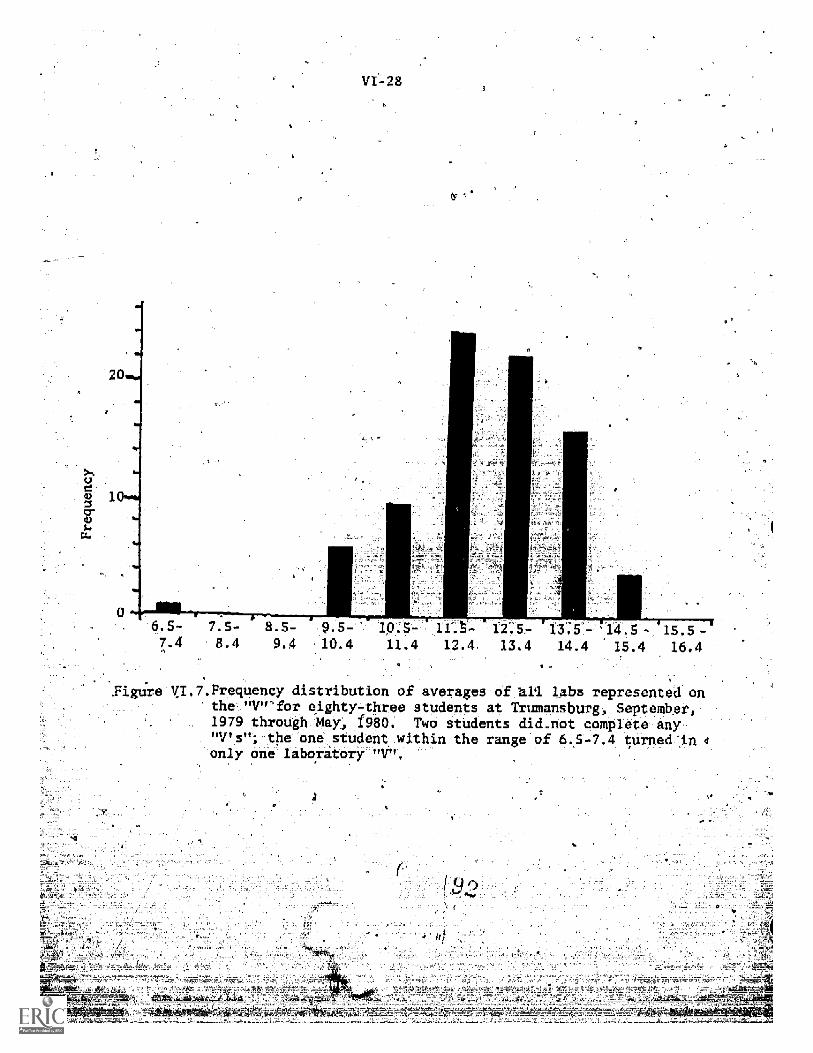
20
6.5- 7.57.4 8.4 9.4
11.
4 12.4:14.5 -21S.!
14.4 15.4 16.4
`Figure M .7.Frequency distribution of averages of it labs represented onthe "V"'for eighty-three students at Trumansburg, September,1979 through May, ,f9go. Two students did.not complete-any"V's"; the one student within the range
aof 6.5-7.4 turned in 4
only one lborat ory "V"'.
VI-29
Although a more thorough quantitative analysis appears in Section IX,
some analysis of thesdata should be done prior to moving on in this
report. From the information gathered thus far, it is reasonable to conclude
that junior high students can use the "V" to represent what is occurring in
their' laboratory expe ments. From Figure VI.3, we can see that the students
appear to get better as their exposure and familiarity with the strategy
increases. But,again, the use of this -kind of comparison is'clone with a
certain impunt of caution. The laboratory exercises represented in Figure VI.6
may not all be of equal difficulty, and therefore there is a problem -f*va idity
-
of stating that students did improve.over time. Perhaps only their-lab
exercises became easier or they finally got used to junior high science.
However, if the standard deviations among all those labs depicted in. the graph
are examined) a trend from a large standard deviation to 'a small standard
deviation occurs. This might indicate that the students are becoming amore
familiar with the strategy and are able, generally, to use the strategy effictive y
enough to place compar.atively h on the scale. Examination of Table V1.3
furthers demonstrates this "levelling off" of students' grades in each of
0
It should be noted that Laboratory Exercise #1 shdws a strikingly high
the five general criteria categories.
average.total score in comparison to the other initial laboratories. But
because the N-number.(S) is so small that can be attributed VOW() small a
sample to make any conclusive Statement.
scores 'around -twelve.
mica ediln Figure VI.7 shows a clustering of "V'-mape
. 1
Using a bateline of eighteen, this would represent
n average perform!pce of around 67%. Howeve_
that.students are limited in their success
and this may be more a curriculum failure:
he data in Table VI.3 show
on "theories and principle
little theory or basic pr ciples -
V1-30
are presented in junior high school science. Therefore, amore real' stic
baseline score would be 15 or 16, and theaverage student would thus
show a "mastery" level (3f some 75-80%. Furthermore, students would
often write the proper concepts, but be unable to extract from those
concepts the proper princ...iples al.d theory. Indeed, students' often
mistakenly identified the "cell theory" when "natural selection" was
the theory in operation. Also, f cell !theory
Rrinciples were written that es bled the propo
theory.
-used,-no,conceptual
ions of the cell
VI-31
Our experience- over the entire year with these "V's" and their use in
Trumansburg has led to some modification of the criteria that should be
mentioned./ In addition to having the comprehensive form of the criteria
gqing through at least six revisions over the tour e of six months, the
staff thought it fruitf as well to devise a list of care` general, less
rigor° criteria which could be used as an alternatiye by the classroom
teacher. The simplified rating scale provides the teacher with a "ballpark"A
view of the "IP' maps that students complete. It bind _be used at the early
stages of using the "V" while students are just beginning to become familiar
with the new terminology, they could replace altogether the more compre-.
-
hasiVt,form? This, of course, would depend upon the needs of the class
as assessed by the individual teacher. Both studentnd teachers find0that the scoring criteria are also instructive as to how to construct
good V's", so these. should be made available to.all patties involved.
This More general list of criteria for.islessing student-constructed "V's"
can be found in'Appendix I, page V:13.
Another modification of these criteria actually came from some students
who sow that there-was a great.similarity between the left-hand side of
the -".4" with its hierarchy and general to specifix rule and the concept maps
_
that they had been preparing from their textbooks. The studtnts' suggestion
that hey substitute a concept map for that left-hand sidewas thought to
be akable insight for these students! The criteria for assessing
h c neeptual side of the "V" did not change in any way, butt' we were
aware that there as more than-one way to represent that left-hand-side.
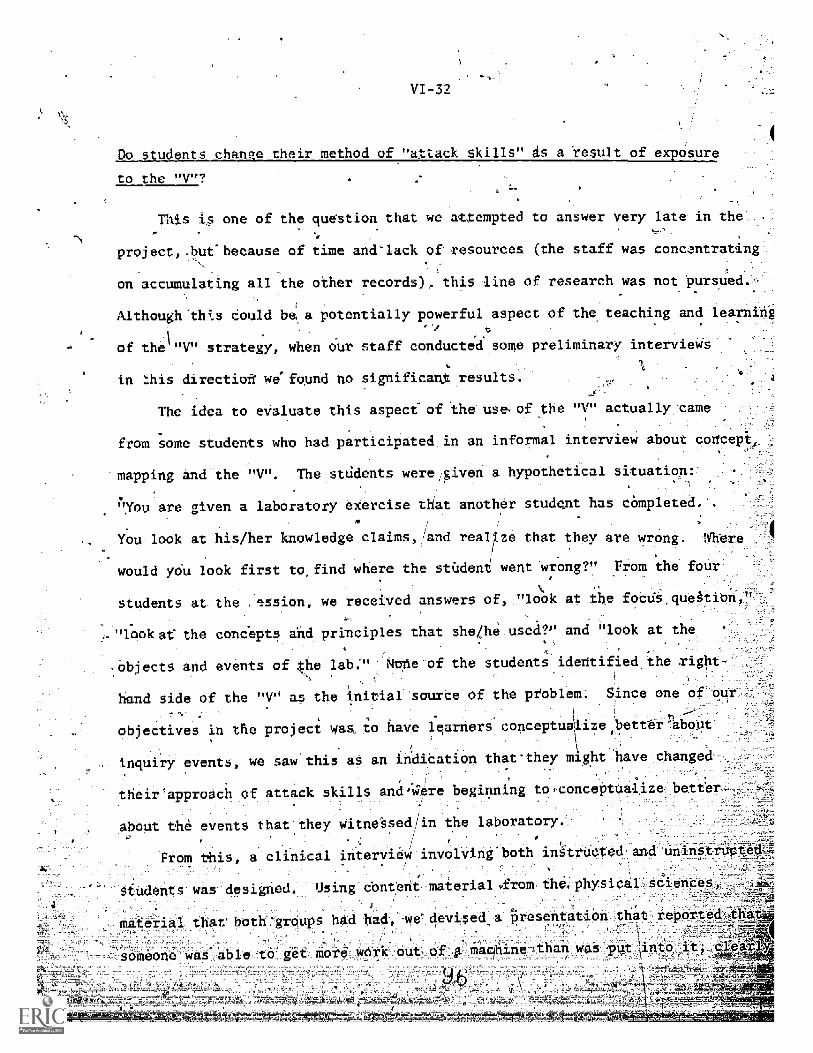
o students chance their method o
to the "V"?
;kills" is a -suit of exposure
This is one of the question that we attempted to answer very late in the
project,, but` because of time and-lack of resources (the staff was concentrating
on accumulating all the other records)._ this line of research was not pursued.-
Although-this could be, a potentially powerful aspect of the teaching and learning,
of thel"V" strategy when Our staff conducted' some p eliminary interviews
in his directioft we'found no significant results.
The idea to evaluate this aspect-of the use of the "V" actually came
from some students who had participated in an informal interview about concept#
mapping and the "V ". The stddents were/given a hypothetical situation::
"You are given a laboratory exercise that another student has cOmpleted. .
You look at his/her knowledge claims, .d realize that they are wrong. Where
would yoU look first to, find where the student went wrong ?" From the four
students at the -ession, we received answers of "look at the focds,quegtibn,
"look at- the concepts and principles that she/he used?" and "look at the
objects and events of the lab."' Node of the students identified the right-
hand side of the "V" as the initial source of the problem. Since one of our
objectives in the project was to have learners conceptualize better'about
inquiry events, we saw this as an indication that the- might have changed
their'approach of attack skills and.Were beginning t conceptualize better
about the even that they witne§sediin the laboratory.
From this, a clinical intervidW involving*both instructed and uninitructe
-students was designed. Using content material -from thophysic,
material thatboth-groups had had, -wedevised a presentation that tha
-- someone was able to get more_weirk out of A macihine-Ahan wa
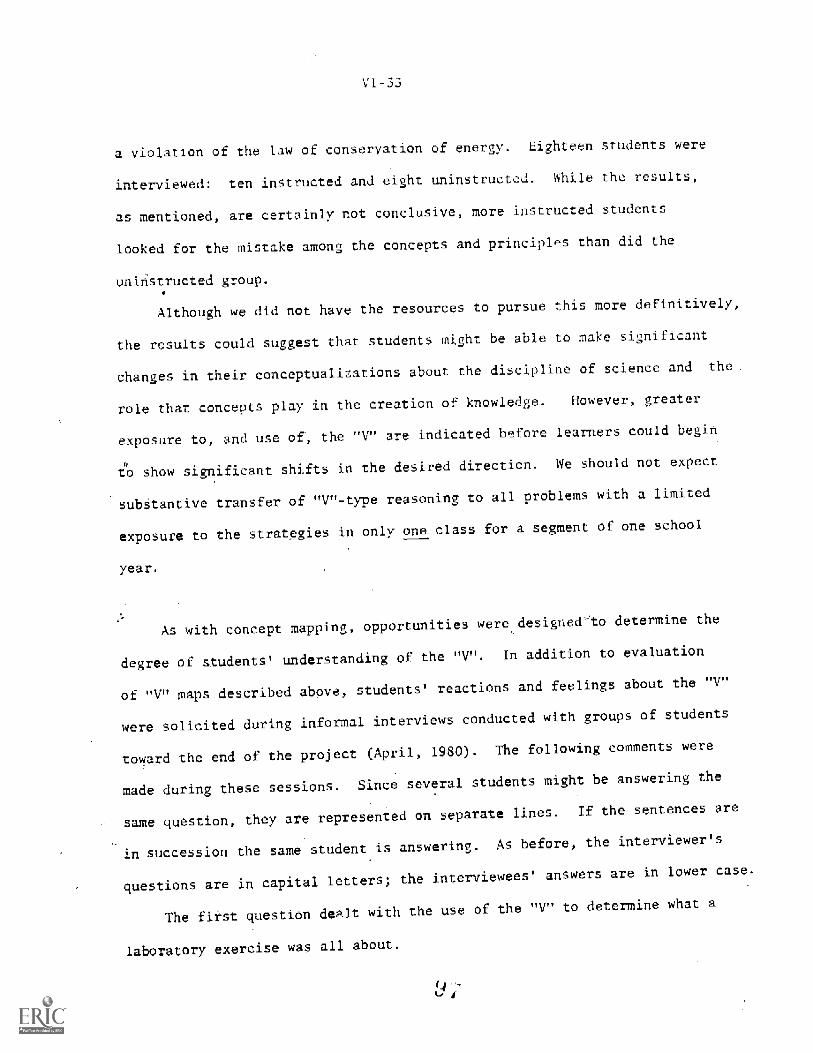
a violat
Vi -33
E the law of conservation of energy. Eighteen students were
interviewed: ten instructed and eight uninstructed. While the results,
as mentioned, are certainly not conclusive, more instructed students
looked for the mistake among the concepts and principles than did the
uninstructed group.
Although we did not have the resources to pursue this more definitively,
the results could suggest that students might be able to make significant
changes in their conceptualizations about the discipline of science and the
role that concepts play in the creation of knowledge. However, greater
exposure to, and use of-, the "V" are indicated before learners could begin
to show significant shifts in the desired direction. We should not expect
subStantive transfer of "V"-type reasoning to all problems with a limited
exposure to the strategies in only one class for a segment of one school
year.
As with concept mapping, opportunities weredesigned'to determine the
degree of students' understanding of the "V". In addition to evaluation
of "V" maps described above, students' reactions and feelings about the "V"
were solicited during informal interviews conducted with groups of students
toward the end of the project (April, 1980). The following comments were
made during these sessions. Since several students might be answering the
same question, they are represented on separate lines. If the sentences are
in succession the same student is answering. As before, the interviewer's
questions are in capital letters; the interviewees' answers are in lower case.
The first question dealt with the use of the "V" to determine what a
laboratory exercise was all about.
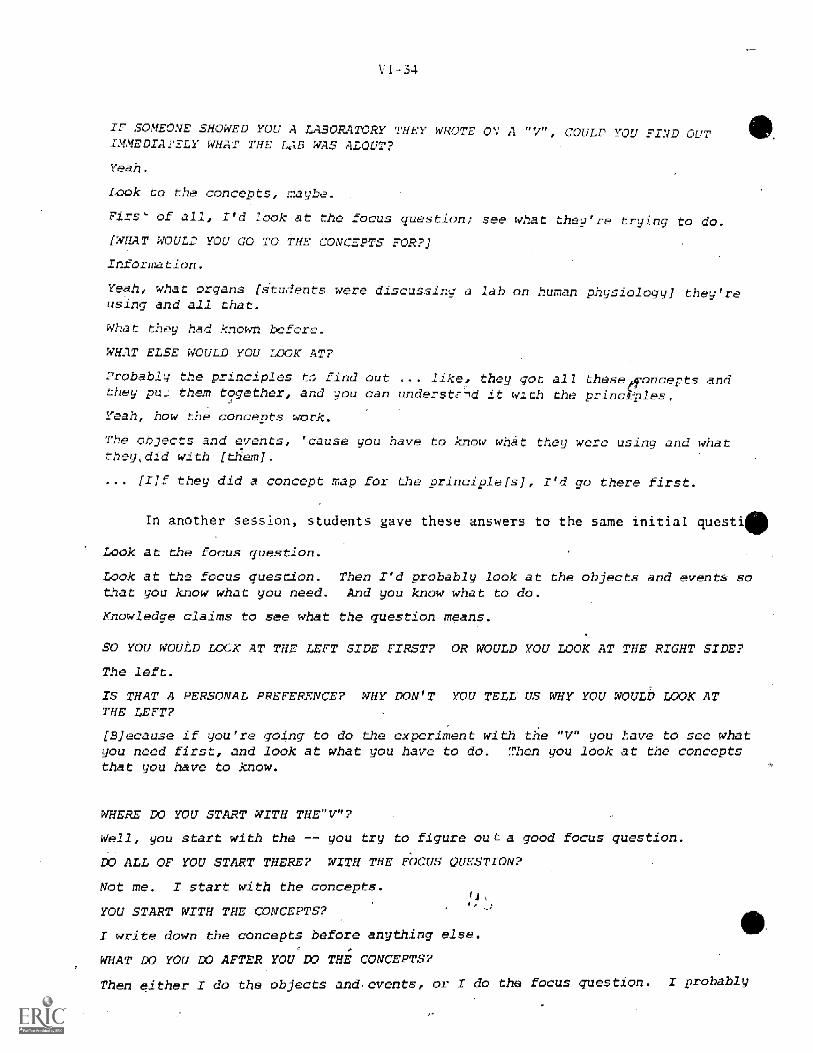
1-34
SOMEONE SHOWED YOU A LABORATORY THEE' WROTE OV A "V", COULD YOU FIND OUTMMEDIArELY WHAT THE LaB WAS ALOUT?
Yeah.
look to the concepts, maybe.
Firs' of all, I'd icok at the focus ques ti-n; see what theu're trying to do.
[WHAT WOULD. YOU GO TO THE CONCEPTS FOR?]
Information.
Yeah, what organs [students were discussing; a lab on human physiology] they'-using and all that.
What they had known before.
WHAT ELSE WOULD YOU LOOK AT?
Probably the principles t5 find out like, they got all concepts andthese__. __they pug them together, and you can understid it with the principles.
Yeah, how the concepts work.
The object and events, 'cause you have n
they, did with [them].
['If they did a concept map for the principle[s], I'd go there first.
using and what
In another session, students gave these answers to the same initial questi
Look at the focus question.
Look at the focus question. Then I'd probably look at the objects and events sothat you know what you need. And you know what to do.
Knowledge claims to see what the question means.
SO YOU WOULD LOCK AT THE LEFT SIDE FIRST? OR WOULD YOU LOOK AT THE RIGHT SIDE?
The left.
IS THAT A PERSONAL P. FE NCE? WHY DON'T YOU TELL US WHY YOU WOULD LOOK ATTHE LEFT?
[Blecause if you're going to do the experiment with the "V" you have to see whatyou need first, and look at what you have to do. Then you look at the conceptsthat you have to know.
WHERE DO YOU START WITH THE"V"?
We21, you start with the -- you try to figure out a good focus clues
DO ALL OF YOU START THERE? WITH THE FOCUS QUESTION?
Not me. I start with the concepts.
YOU START WITH THE CONCEPTS?
write down the concepts before anything else.
WHAT DO YOU DO AFTER YOU DO THE CONCEPTS?
Then either I do the objects and-events, or: I do the focus question. I probably
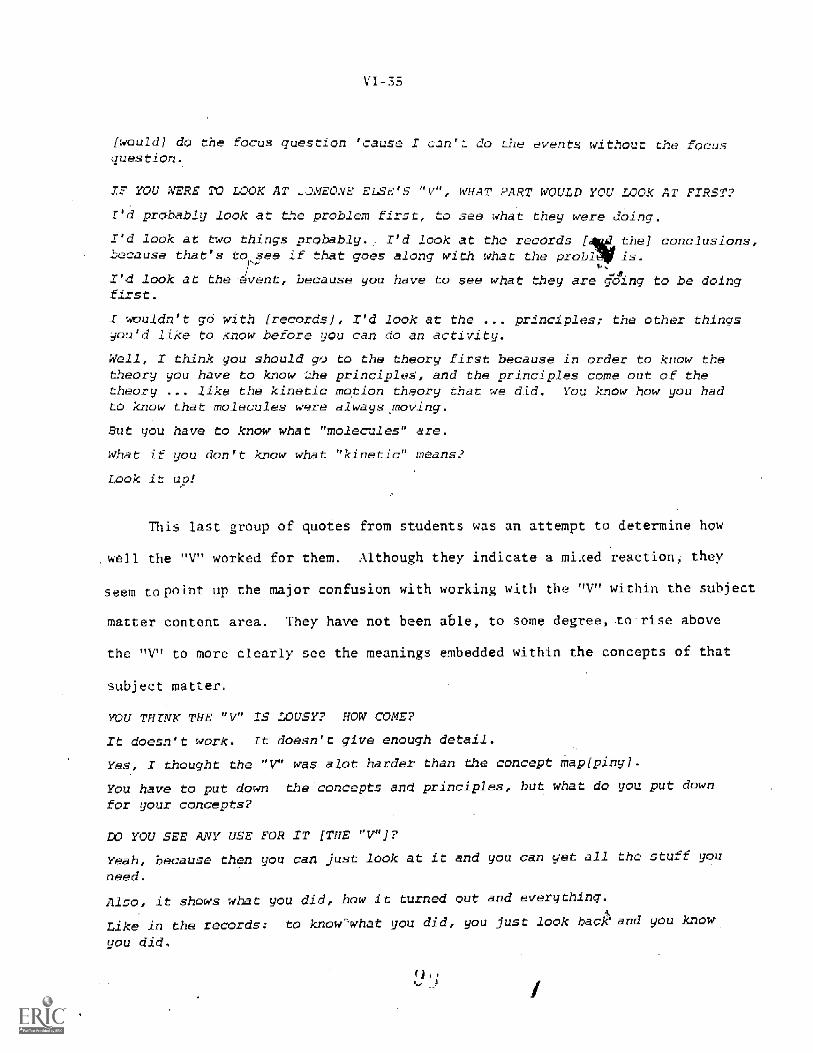
VI-33
would] do the focus question 'cause I can'L do the events without the focusuestion.
IF YOU WERE 213 WOK AT .)MFONE
I'd probably look at the problem
"r/" WHAT PART WOULD YOU LOOK AT FIRST?
, to see what they were doing.
I'd look at two things probably.: I'd look at the records the] conclusions,because that's to see if that goes along with what the probl
I'd look at the-vent, because you have to see what they are Gina to be doingfirst.
I wouldn't Di with [records], I'd look at the ... principles; the other thingsyou'd like to Know before you can do an activity.
Well, I think you should go to the theory first because in order to know thetheory you have to know she principles, and the principles come out of thetheory ... like the kinetic motion theory that we did. You know how you hadto know that molecules were always moving.
But you have to know what "molecules" are.
What
Look
u don't know what "kinetic" means?
P!
This last group of quotes from students was an attempt to determine how
well the "V" worked for them. Although they indicate a mi.ced reaction, they
seem to point up the major confusion with working with the "V" within the subject
matter content area. They have not been able, to some degree, to rise above
the "V" to more clearly see the meanings embedded within the concepts of that
subject matter.
YOU THINK THE "V" IS LOUSY? HOW COME?
It doesn't work. It doesn't give enough detail.
Yes, I thought the "V" was clot harder than the concept map[ping].
You have to put down the concepts and principles, but what do you put down
for your concepts?
DO YOU SEE ANY USE FOR IT [THE "V"]?
Yeah, because then you can just look at it and you can yet all the stuff you
need.
Also, it shows ha you did, how it turned out and everything.
Like in the record know'what you did, you just look backand you
you did.
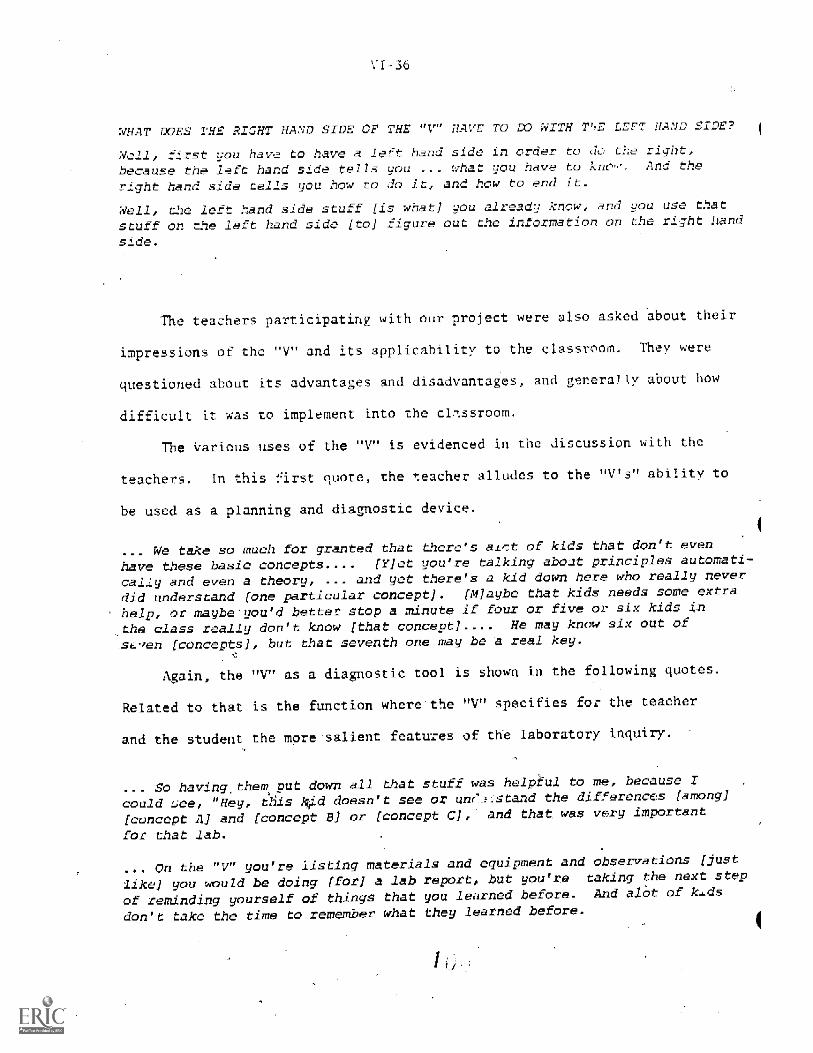
VI-
WHAT DOES THE RIGHT HAND SIDE OF THE "V" HAVE TO DO WITH T"E LEFT HA D SIDE
Well, first you have to have a left hand side in order to do t2-;_e right,
because the left hand side tells you ... -zhat you have to kno,, And the
right hand side cells you how to do it, and how to end it.
Well, the lert hand side stuff [is what] you already know, and qou use that
stuff on the left hand side [to] figure out the information on the right 'land
side.
eachers participativ with our project were also asked about their
impressions of the "V" and its applicability to the classroom. They were
questioned about its advantages arid disadvantages, and gene__Ily about how
difficult it was to implement into the clr'.ssroom.
The various uses of the "V" is evidenced in the discussion with the
teachers. In this first quote, the -teacher alludes to the "V's" ability to
be used as a planning and diagnostic device.
We take so much for granted that there's al,st of kids that don't even
have these basic concepts.... [Y]et uou're talking about principles automa
cally and even a theory, ... and yet there's a kid down here who really never
did understand [one particular concept] - [M]aybe that kids needs some extra
help, or maybe'you'd better stop a minute if four or five or six kids in
the class really don't know [that concept].... He may know six out of
-54-7en [concepts], but that seventh one may be a real key.
Aga n, the "V" as a diagnostic tool is shown in the following quotes.
Related to that is the function where the "V" specifies for the teacher
and the student the more salient features of the laboratory inquiry.
... So havingthem put down all that stuff was helpful to me, because I
could :gee, "Hey, this kid doesn't see or un(7jfstand the differences [among]
[concept A] and [concept B] or [concept C], and that was very important
for that lab.
... On the "V" you're listing materials and equipment and observations [just
like] you would be doing [for] a lab report, but you're taking the next step
of reminding yourself of things that you learned before. And alCt of luds
don't take the time to remember what they learned before.
I
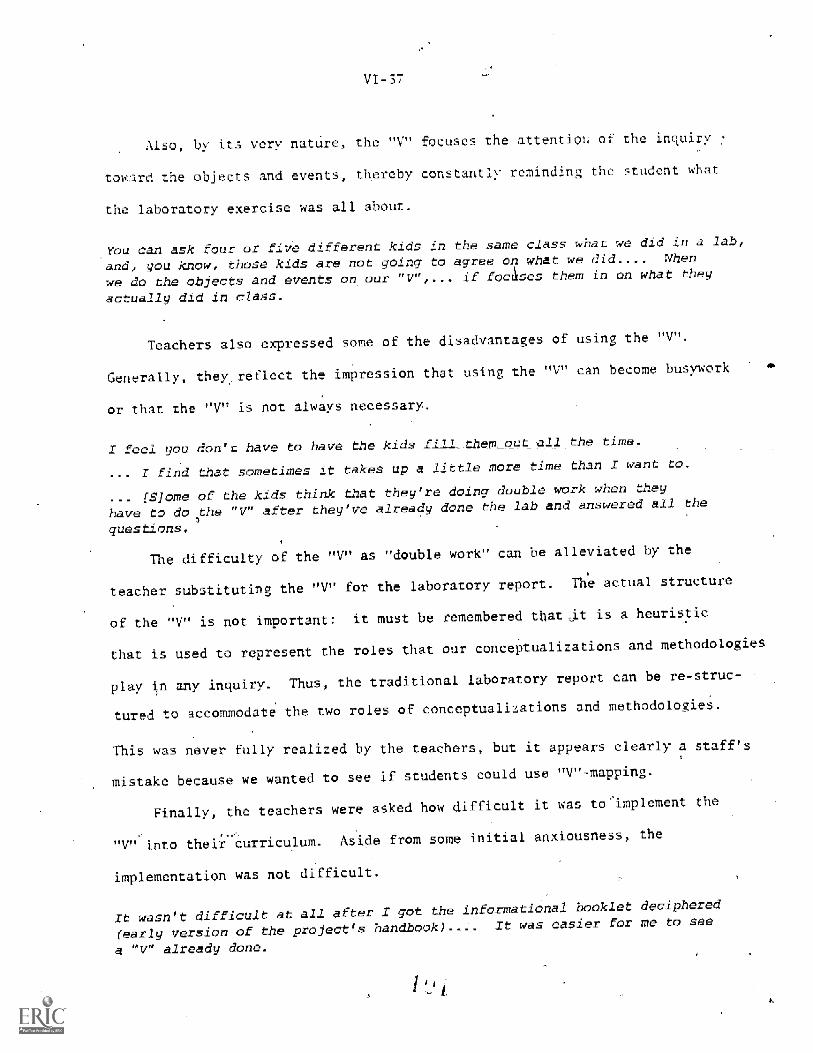
VI-
Also, by its eery nature, the s the attentio of the inquiry
toward the objects and events, thereby constantly reminding the student what
the laboratory exercise was all about.
can ask four or five different kids in the same class what we did in a lab,
and, you know, those kids are not going to agree on what we did.... When
we do the objects and events on our "V",... if foctses them in on what they
actually did in class.
Teachers also expressed some of the disadvantages of using the "V".
Generally, they_ reflect the impression that using the "V" can become busywork
or that the "V" is not always necessary.
feel you don't have to have the kids fili_them out al/ the time.
find that sometimes it takes up a little more time than l want to
[S]ome of the kids think that they're doing double work when they
have to do the "V" after they've already done the lab and answered all the
questions.
The difficulty of the "V" as "double work" can be alleviated by the
teacher substituting the "V" for the laboratory report. The actual structure
of the "V" is not important: must be remembered thatjt is a heuristic
that is used to represent the roles that our conceptualizations and methodologies
play in any inquiry. Thus, the traditional laboratory report can be re-struc-
tured to accommodate the two roles of conceptualizations and methodologies.
This was never fully realized by the teachers, but it appears clearly a staff'
mistake because we wanted to see if students could use "V"-mapping.
Finally, the teachers were asked how difficult it was to implement the
"V" into their curriculum. Aside from some initial anxiousness, the
implementation was not difficult.
It wasn't diffioult at all after I got the informational booklet deciphered
(early version of the project's handbook)..;. It vas easier for me to see
a "V" already done.
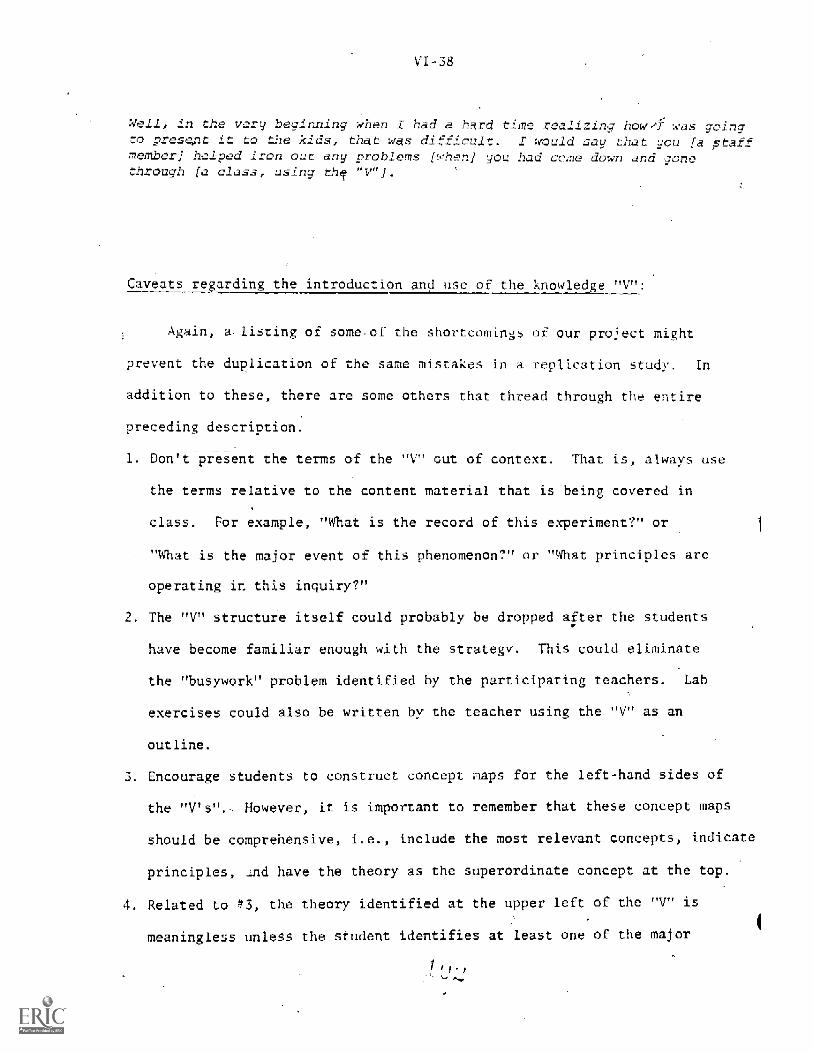
V1 -38
Well, in the very heyinning w' n I had a hard tine realizing hcw'T was goingto urese,nt it to the was difficult. I would say that you [a staffember; helped iron out any problems [!ehen] you had come down and gonethrough [a class, using ttT "WI].
Caveats recording the introduction and use of the knowledge "V":
Again, a listing of someof the shortcomings of our project might
prevent the duplication of the same mistakes in a replication study. In
addition to these, there are some others that thread through the entire
preceding description.
1. Don't present the terms of the "V" out of context. That always use
the terms relative to the content material that is being covered in
class. For example, "What is the record of this experiment?"
" What is the major event of this phenomenon?" or "What principles are
operating in this inquiry?"
The "V" structure itself could probably be dropped after the students
have become familiar enough with the strategy. This could eliminate
the "busywork" problem identified by the participating teachers. Lab
exercises could also be written by the teacher using the "V" as an
outline.
Encourage students to construct concept naps for the left-hand sides of
the "V's". However, it is important to remember that these concept maps
should be comprehensive, i.e., include the most relevant concepts, indicate
principles, Lnd have the theory as the superordinate concept at the top.
Related to #3, the theory identified at the upper left of the "V" is
meaningless unless the student identifies at least one of the major
I I
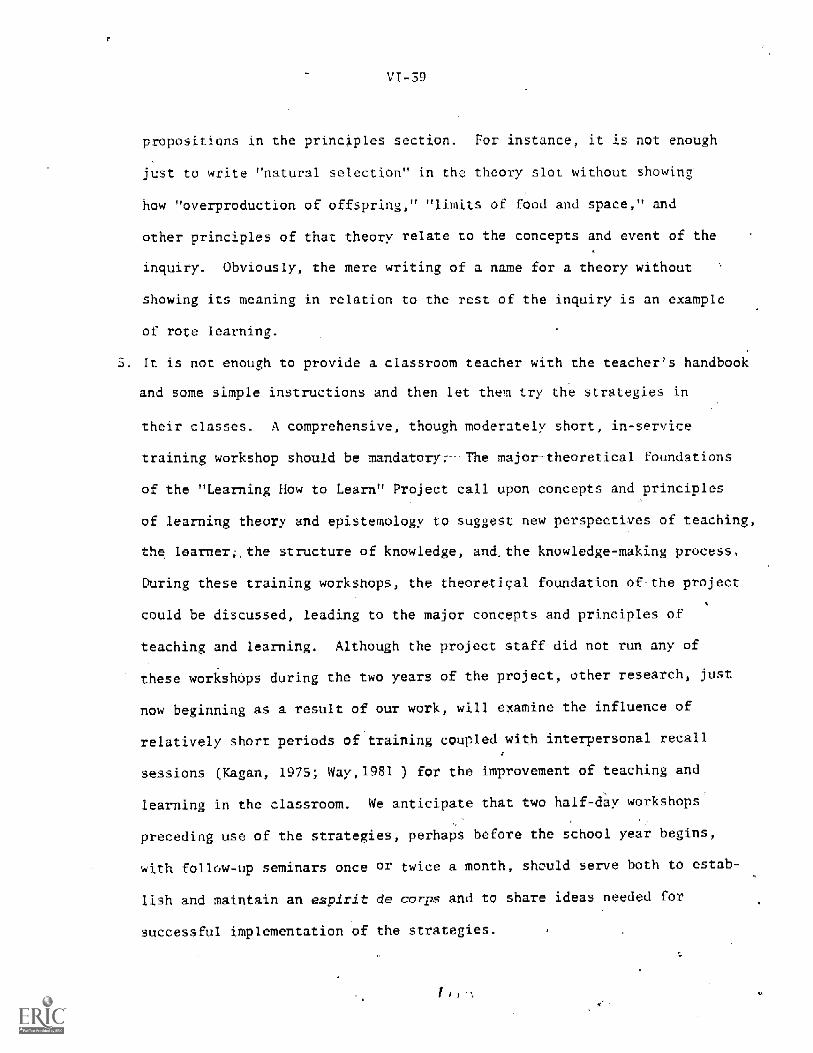
VI-39
propositions in the principles section. For instance, it is not enough
just to write -'natural selection" in the theory slot without showing'
how "overproduction of offspring," "limits of food and space,"
other principles of that theory relate to the concepts and event of the
inquiry. Obviously, the mere writing of a name for a theory without
showing its meaning in relation to the rest of the inquiry is an example
of rote learning.
It is not enough to provide a classroom teacher with the teacher's handbook
and some simple instructions and then let them _ y the strategies in
their classes. A comprehensive, though moderately short, in-service
training workshop should be- mandator)%-- The major-theoretical foundations--
of the "Learning How to Learn "" Project call upon concepts and principles
of learning theory and epistemology to suggest new perspectives of teaching,
the learneri.the structure of knowledge, and. the knowledge-making process.
During these training workshops, the theoretical foundation of-the project
could be discussed, leading to the major concepts and principles of
teaching and learning. Although the project staff did not run any of
these workshOps during the two years of the project, other research, just
now beginning as a result of our work, will examine the influence of
relatively short periods of training coupled with interpersonal recall
sessions (Kagan, 1975; Way,1981 ) for the improvement of teaching and
learning in the classroom, We anticipate that two half-day workshops
preceding use of the strategies, perhaps before the school year begins,
with follow -up seminars once or twice a month, should serve both to estab-
lish and maintain an espirit de corps and to share ideas needed for
successful implementation of the strategies.
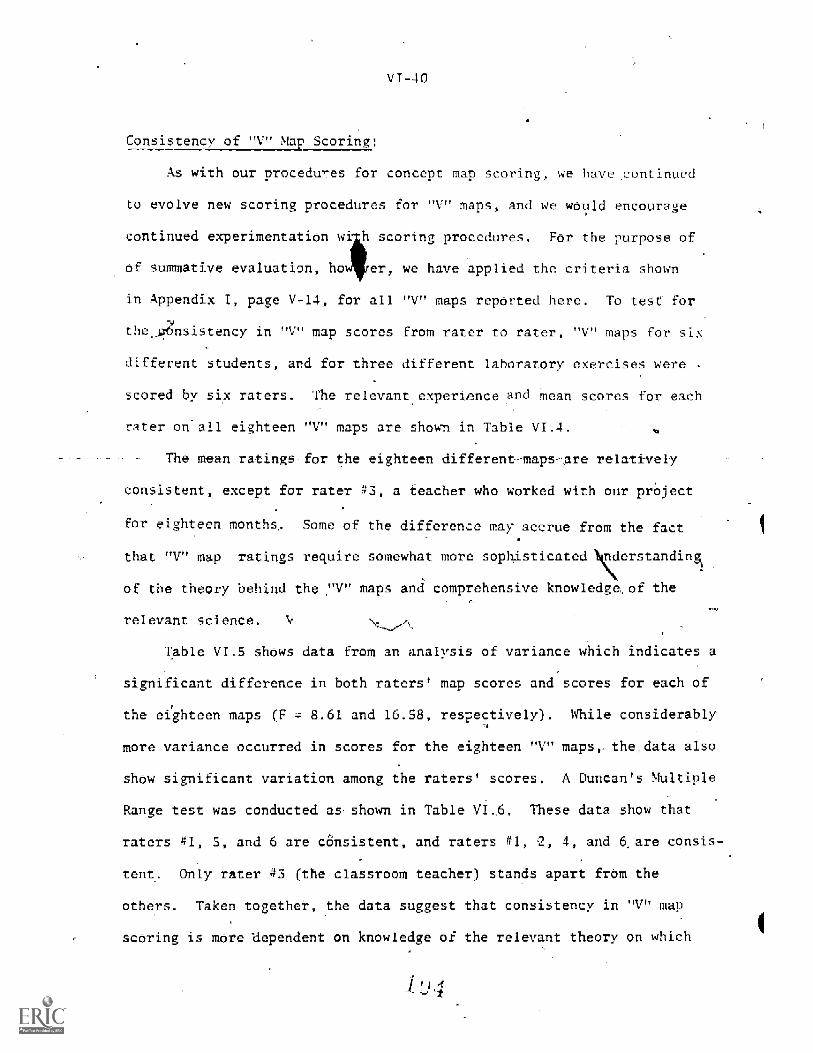
Consistency of "V" Ma Scoring:
VI-40
As with our procedures for concept map scoring, we have continued
to evolve new scoring procedures for "V" maps, and we would encourage
continued experimentation with scoring procedures. For the purpose of
of summative evaluation, how have applied the criteria shown
in Appendix I, page V-14, for all "V" maps reported here. To test for
the nsistency in "V" map scores from rater to rater, "V" maps for six
different students, and for three different laboratory exercises were -
scored by six raters. The relevant experience and mean scores for each
ter on all eighteen "V" maps are shown in Table VT.4.
The mean ratings for the eighteen-different-maps-are relatively
consistent, except for rater #3, a teacher who worked with our project
for eighte en months, Some of the difference may accrue from the fact
that "V" map ratings require somewhat more sophisticated Nic-I erstanding.,
i%.
of the theory behind the ,"V' maps and comprehensive knowledge.. of the
relevant science. Ne--,..
Table VI.5 shows data from an analysis of variance which indicates a
significant difference in both raters' map scores and scores for each of
the eighteen maps (F = 8.61 and 16.58, respectively). While considerably,
more variance occurred in scores for the eighteen "V" maps,. herdata also
show significant variation among the raters' scores. A Duncan's Multiple
Range test was conducted as shown in Table V ,6. These data show that
raters #1, 5, and 6 are consistent, and raters #1, 2, 4, and 6. are consis-
tent. Only rater #3 (the classroom teacher) stands apart from the
others. Taken together, the data suggest that consistency in "V" map
scoring is more dependent on knowledge of the relevant theory on which
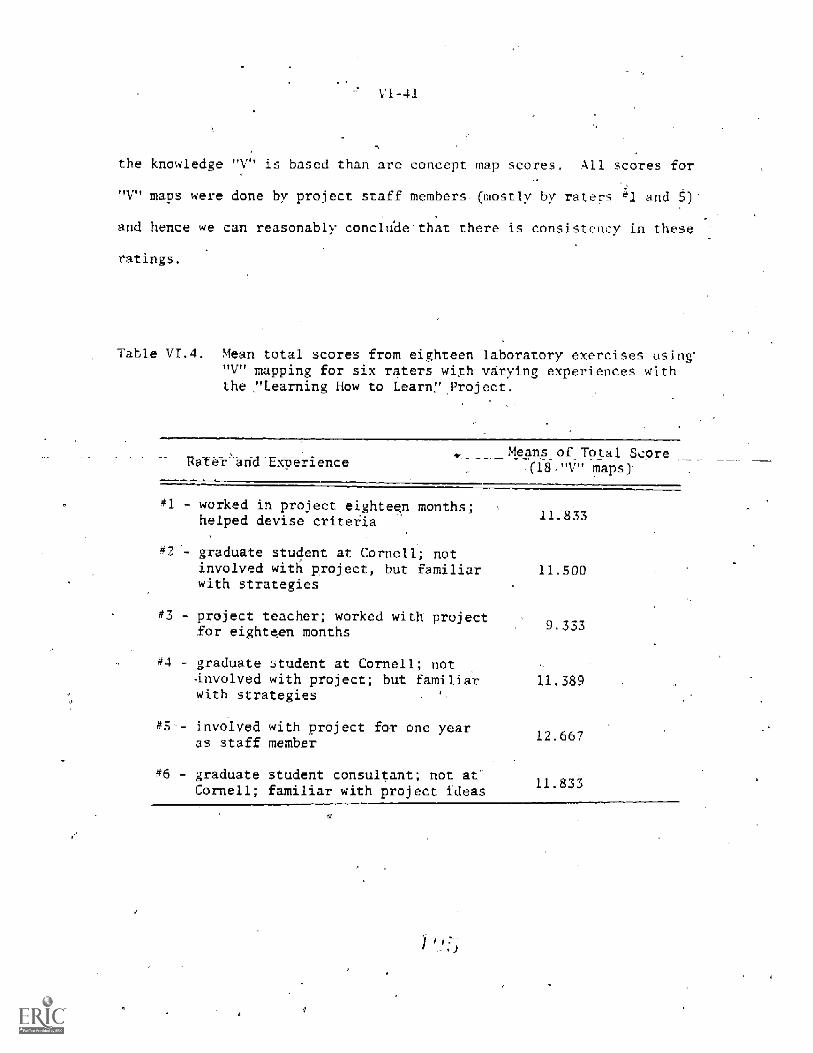
VI-41
the knowledge "V" is based than are concept map scores. 1 scores for
"V" maps were done by project staff members (mostly by raters l and
and hence we can reasonably conclude that there is consistency n these
ratings.
Table VI.4. Mean total scores from eighteen laboratory exercises using'"V" mapping for six raters with varying experiences withthe "Learning How to Learn" Project.
Rater and-EkberienceMeans of Total Score*
(18."V" maps)
- worked in project eighteen months;helped devise criteria
- graduate student at Cornell; notinvolved with project, but familiarwith strategies
- project teacher; worked with projectfor eighteen months
#4 - graduate student at Cornell; not- involved with project; but familiarwith strategies
#5 involved with project for one yearas staff member
#6 - graduate student consultant; not atCornell; familiar with project ideas
11.833
11.500
9.333
11.389
12.667
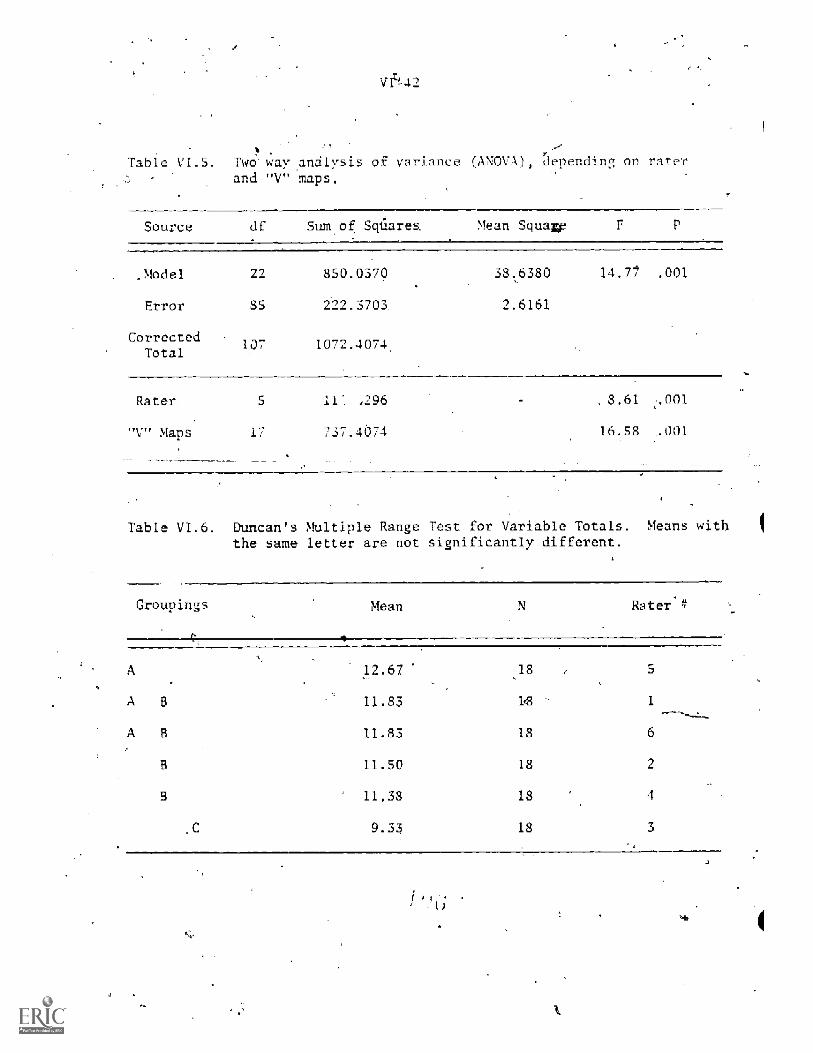
VlL42
Tab '1.5. Two way analysis of variance 'OVA) depending on raterand "V" maps,
Source df _urn of Squares. Mean Squaw F
Model
Error
CorrectedTotal
22
85 223.3703
850.0370
1-07 1072.4074
6380 14.77 .001
2.6161
Rater. ,296
-v" Maps 17 737.4074
.8.61 .001
16,58 .001
Table V1.6. Duncan's Multiple Range Test for Variable Totals. Means withthe same letter are not significantly different.
Groupings Mean N Rater
A 12.67 18
A B 11.83 16 1
A 11.83 18 6
B 11.50 18
11,38 18 4
9.33 18
TRANS ER OF LEARNING AND CONCONCEPTUAL QUEST ONS
One of the most difficult evaluation problems educators have faced over-
the pist half century of formal test development has been how to assess
gains in knowledge that can be evidenced in enhanced ability to solve
problems -or to transfer learning to new areas of application. A pioneer
ij-t this work, Ralph W. Tyler (1930, 1934), devised some ingenious tests to
measure abilities to apply Ahd use.knowledge, but this -evaluation problem
persists tbdav ,!tore recent efforts such as 'Bloom's (1956) "Taxonomy,"
Novak's (1961) "problem solving test" and Nedel ky (1965) and Hodges 61
suggestions must be considered. ,Nevertheless, these evaluation works have not
led to evaluation instruments that are at once valid, reliable and practiCal.
Many educators have resorted to-modified Piagetian clinical interview as the
only valid alternative to this evaluation problem (see Pines, et al., 1978).
Although we have also employed the clinical Interview strategy for evaluation
purposes, we sought to develop alternative evaluation Approaches for assess-
ment of meaningful learning that could bear on the issue of whether or not
the "learning to lea__" rategies in this program were. effective. This, in
some ways, has been our eatest challenge.
We have already presented arguments to indicate that "concept mapping"
and "V mapping" can be effective strategies for assessment of meaningful
learning. However, educators cannot use these evaluation strategies unless
students are first instructed to understand and construct concept maps and
"V" maps. While the most significant outcomes of our recent theoretical
work may be the development of strategies for teaching concept mapping and
"V" mapping, and thus simultaneously to provide better pedagogical tools for
assessment of educationalaohieVements, these, strategies cannot be employed
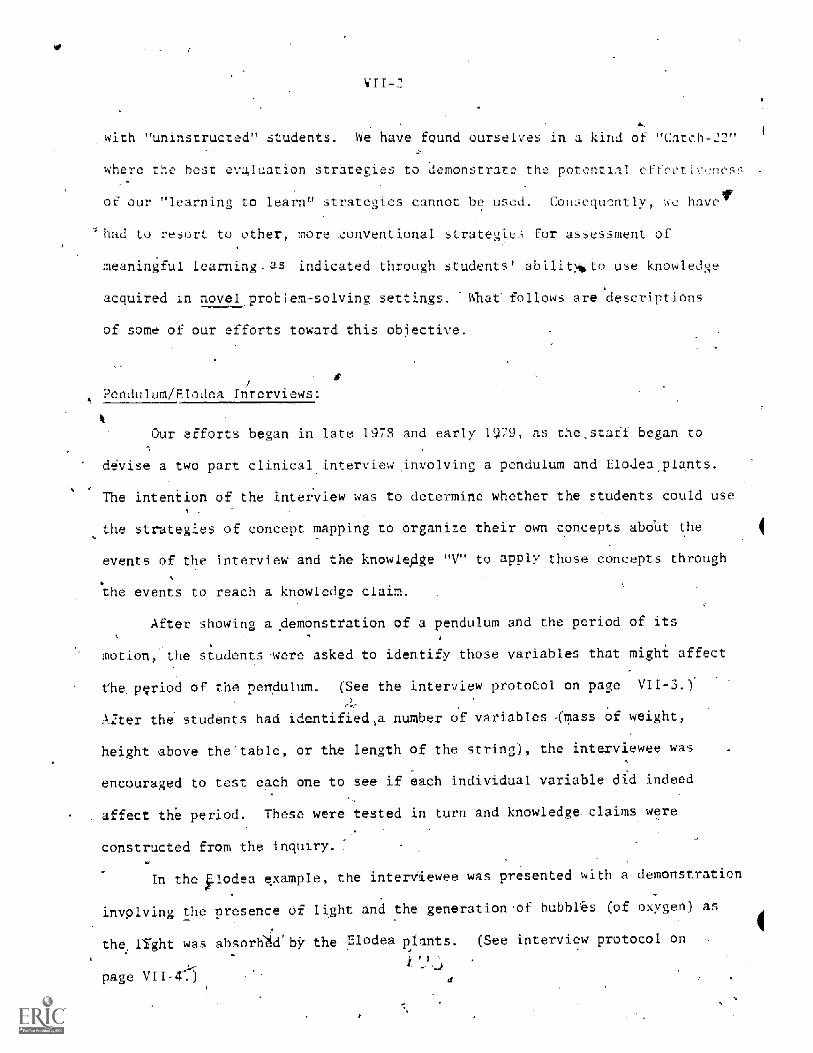
with "uninstructed" students. We have found ourselves in a kind of "Catch-
where the best evaluation strat demonstrate potenti.
of our "learning to learn" strategies cannot be used. Con.,;equentl have
'had to resort other, more conventional strategies for assessment of
meaningful learning -as indicated through students' abilitmito use knowledge
acquired in novel problem-solving settings. irat follows are -escriptions
of some of our efforts toward this objective.
pendulum /Elodea Interviews:
efforts began in late 1973 and early 1 as t staff began1
ddvise a two part clinical interview ,involving a pendulum and Elodeaplants,
The intention of the interview was to determine whether the students could use
the strategies of concept mapping to organize their own concepts aboUt the
events of the interview and the knowledge "V" to apply those concepts through
the events to reach a knowledge claim.
After showing a demonstration of a pendulum and the period of its
motion, the students were asked to identify those variables that might affect
the period- of the pendulum. (See the interview protocol on page VII-
Alter the students had identified,a number of variables ass of weight,
height above the"table, or the length of the string), the interviewee was
encouraged to test each one to see if each individual variable did indeed
affect the period. These were tested in turn and knowledge- claims were
constructed from the inquiry.
In the lodea example, the interviewee was presented with a demonstration
involving the presence of light and the generation'of bubbles (of oxygen
the light was absor66d bk the Elodea plants. (See interview protocol on
page
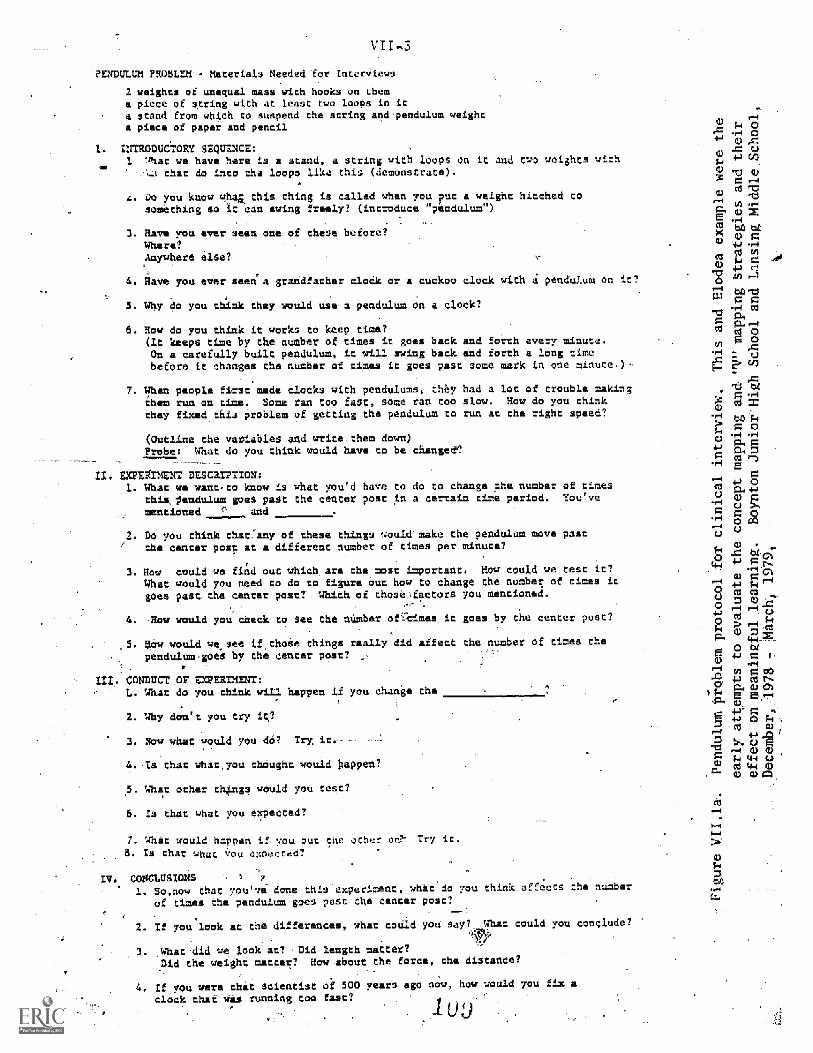
PENDULUM PROBLEM - Materials Needed ior Interviews
weights of unequal sass with hooks on thema piece of string with at least two loops in ita stand from which to suspend the string and pendulum weighta piece of paper and pencil
INTRODUCTORY SEQUENCE:1 'hat we have here is a stand, a string with loops on it and two woights with
that do into the loops like this (demonstrate).
4. 0o you know whak this thing is called when you put a weight hitched tosomething so it can swing freely? (introduce "pendulum")
3. Have you ever seen one of these before?Where?Anywhere else?
4. Have you aver seen a grandfather cloCk or a cuckoo clock _th a pendulum on it?
5. Why do you think they would use a pendulum on a clock?
6. How do you think it works to keep time?(It keeps time by the number of times it goes back and forth every minute.On a carefully built pendulum, it will swing back and forth a long timebefore it changes the number of times it goes past some mark in one minute .)
7. When people first made clocks with pendulums, they had a lot of trouble makingthem run on time. Some ran too fast, some ran too slow. How do you thinkthey fixed this problem of getting the pendulum to run at the right speed?
(Outline the variables and write them down)Probe: What do you think would have to be changed?
IT. DESCRIPTION;1. What we want-co know is what you'd have to do to change the number of times
this, gendulue goes past the center post in a certain tine period. You've
mentioned and
Do you think that:any of these things could` make the pendulum move pastthe canter post at a different number of times per minute?
3. How could we find out which are the most important. How could we test it?What would you need to do to figure Out how to change the number of times itgoes past, the center post kith of thosi%factors you mentioned.
-How would you check to see the number of- times it goes by the center post?
HEN would we see if tho things really did affect the number of times the
pendulumgoes by the center post?
CONDUCT OF EXPERIMENT:L. What do you think will happen if you change the
2. Why don't you try it?
3. Nov whacwould you de? Try it,
4. Is that what,you ught would bappen?
What other th4.ngs would you test?
=6. Is that what you eXpeCced?
7. What would happen if you ?uc tie ocher os Try it.
a. Is that whuc 'ou expecceo.
IV. CONCLUSIONS 2
1. So,now chat ou'd done this experiment, what in you think affec =s the number
of times the pendulum goes past the center post?
2. If you look at the differences, what could yOU..Say? t. iat could you conclude?
did we look at? Did length matter?d the weight matter? How about the force, the distance?
4. If you were that scientist of 500 years ago a_
clock that was running too aet?
F.
0
Cs
a)
0+-4
aCd
E-
cis ft;
0 01=W CO
44 Ca T'.0. 0 alE
a),
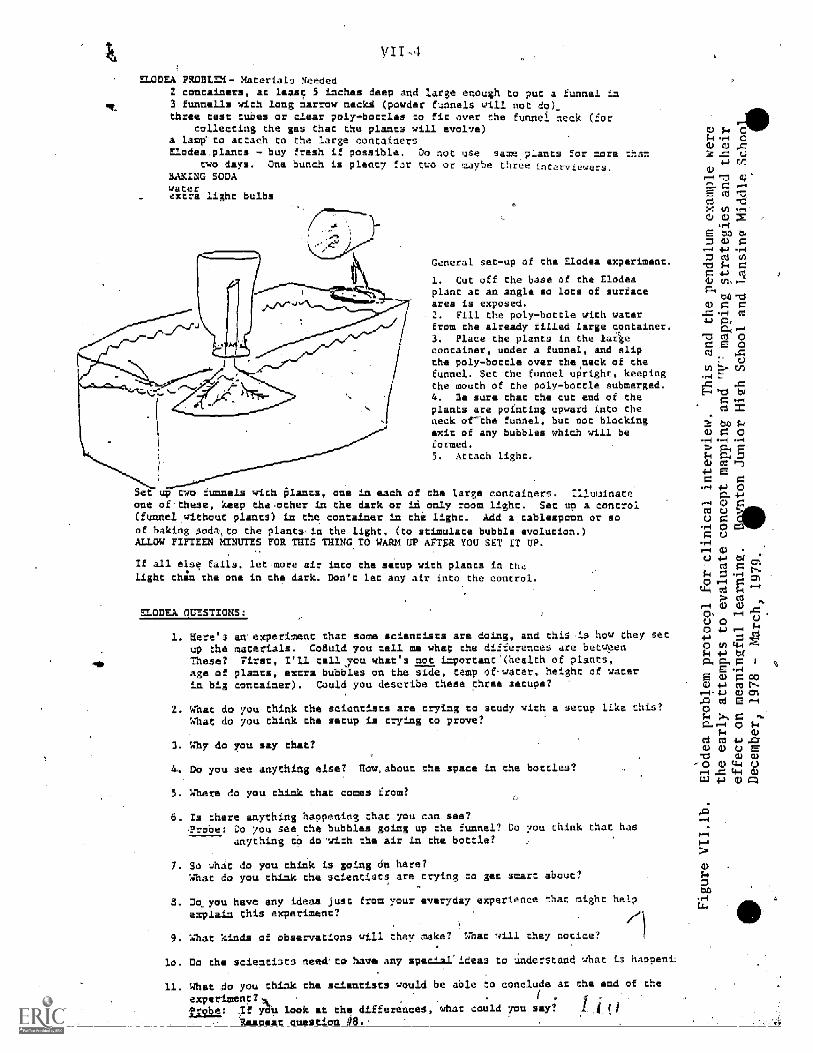
VII
ELODEX PROBLEM- Materials Needed2 containers, at least 5 inches deep and large enough to put a funnel in3 funnelle with long narrow neckd (powder funnels will not do)-three test tubee or clear poly-bottles to fit over the funnel neck (for
collecting the gas that the plants will evolve)a lamp' to attach to the large containersElodea,plants - buy fresh if possible. Do not use same pants far more
two days, One bunch is plenty for two or maybe three interviewers.BAKING SODAwaterextra light bulbs
General set-up of the Elodea experiment.
1. Cut off the base of the Elodeaplant at an angle so Iota of surfacearea is exposed.2. Fill the poly-bottle with waterfrom the already filled large container.3. Place the plants in the la4econtainer, under a funnel, and slipthe poly-bottle over the neck of thefunnel. Set the funnel upright, keepingthe mouth of the poly-bottle submerged.4. 3e sure that the cut end of theplants are pointing upward into theneck of-the funnel, but not blockingexit of any bubbles which will beformed.5. Attach light.
up Vdti funnels with Plants, one in each of the large containers. Illuainateone oftheSe, keep theether in the dark or id only room light. Sec up a control(funnel without plants) in the container in the light. Add a tablespoon or soof baking aodeto the plantein the light, (to stimulate bubble evolution.)ALLOW FIFTEEN MINUTES FOR THIS 'THING TO WARM UP AFTER YOU SET IT UP.
all else fails, let more air into the setup with plants in th,;
ht thin the one in the dark. Don't let any air into the control.
BODE SST
1. Here's an experiment that some scientists are doing, and this is how they setup the materials. Co8uld you tell me what the differences are betweenThese? First, I'll tell you what's not important (health of plants,age of plants, extra bubbles an the side, tamp of-water, height of wateris big container). Could you describe these three setups?
2. What do you think the scientists are trying to study with a setup like this?What do you think the setup is trying to prove?
3. Why de you say that?
44 Do you see anything else? How. about the space in the bottles?
5. Where do you think that comes from?
6. Is there anything happening chat you can sae?Probe: Do you seethe bubbles going up the funnel? Do you think that has
anything to do 'with the air in the bottle?
7. So whet do you think is going an here?What do you think the stienciats are trying to get smart about?
B. Do you have any ideas just from your everyday experience that might helpexplain this experiment?
9. kinds of observations will they make? What will they notice?
10. Do the scientists need.to have any specil'ideas to understand what ha eni:
11. What do you chink the scientists would be able to conclude at the end of the
experteant?* . (
?robe: If yqu look at the differences, what could you say?- Rearmas aueation $8.'
0 CC-4 CC) 0X -c. c.;
Oa -0CD C
cn
-TC gm "-0a
0
. Fq
`0C !.1
r d4=$g 0.-
gm, ga)4, a
,P 0P.
Ug
O g1-4
a) a te)
u04Jpio 4..1111 4-itv
qEE 0) C CO
4..)
c0 E4J 0 01
. 00/.4 acC 1.404 .J=c63)
0) 0) c.) E-0 0 0)
(414 a.)ca
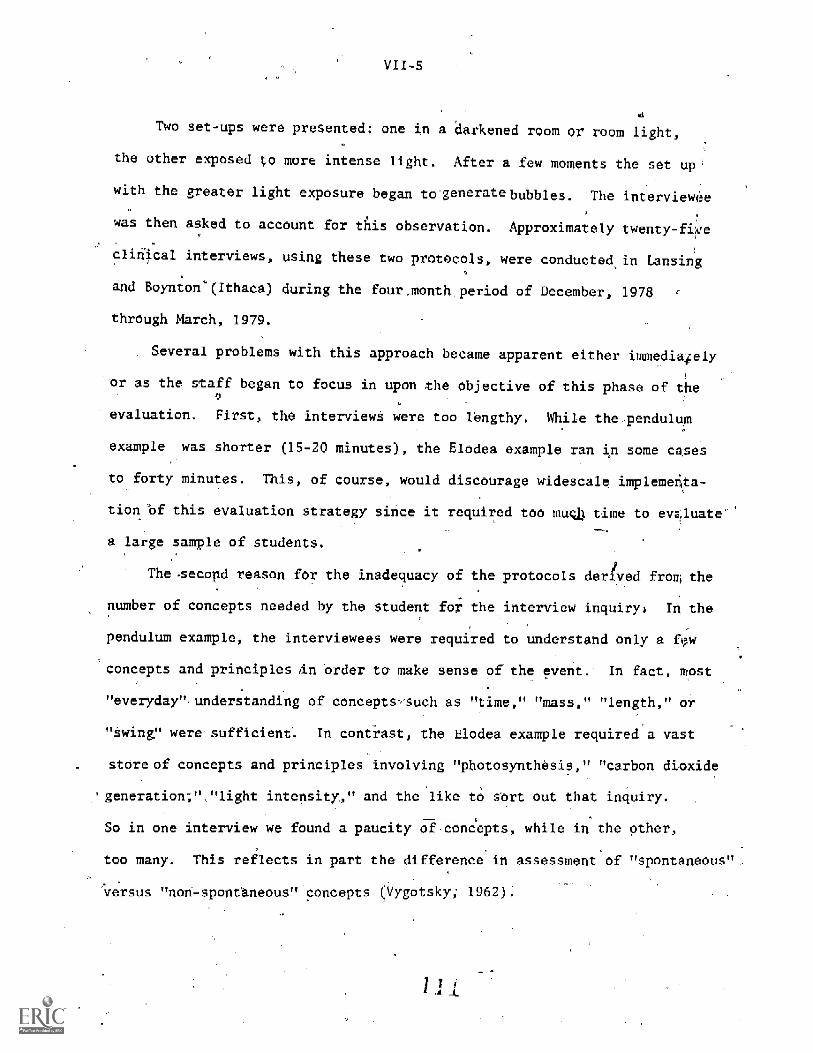
V11-5
Two set-ups were presented: one in a darkened room or room light,
the other exposed to more intense light. After a few moments the set up
with the greater light exposure began to.generatebubbles. The interviewee
was then asked to account for this observation. Approximately twenty-fie
clinical interviews, using these two protocols, were conducted, in Lansing
and Boynton'(Ithaca) during the four month, period of December, 1978
through March, 1979.
Several problems with this approach became apparent either immediaiely
or as the staff began to focus in upon the objective of this phase of the
evaluation. First, the interviews were too lengthy. While the pendulum
example was shorter (15-20 minutes), the Elodea example ran in some cases
to forty minutes. This, of course, would discourage widescale implemerita-,
tion of this evaluation strategy since it required too much time to evzjuate'
a large sample of students.
The second reason for the inadequacy of the protocols derived front the
number of concepts needed by the student for the interview inquiry> In the
pendulum example, the interviewees were required to understand only a ftpw
concepts and principles tin order to make sense ofthe event.' In fact, most
"everyday" understanding of concepts-such as "time," "mass," "length," or
"Swing" were sufficient ". In contrast, the Elodea example required a vast
StOre of concepts and principles involving "photosynthesis," "carbon dioxide
'generation;""light intensity," and the like to sort out that inquiry.
So in one interview we found a paucity of-conc'epts, while in he pth-
too many. This reflects in part the difference in assessment of "spontaneolis"
versus "non-spontaneous' concepts (Vygotskyi 1962)
V11-6
The experience with the pendulum and Tlodea interviews led us to
reevaluate again the project objectives regarding assessment of transfer
of learning. It was clear that problem solving tasks unrelated to class-
room instruction, or only remotely related, were too often tests of general
reasoning ability (use of "if...then" propositions) or willingness to
perse- vere with an obscure task. Once again we were brought back to our
basic .theoretical premise that problem solving ability is largely dependent
on the adequacy of relevant concepts that.the student has, and we wore
failing to provide appropriate problem solving tasks for this fact.
Problem Solving Related to Class Work:
Lansing Mi'ddle School was working with the laboratory- oriented
Introductory Physical Science Program (IFS). Therefore, ,the staff
decided tweivploy a problem solving situation 'involving phases of matter,
and boiling and melting points. Further, it was decided that the protocol
should he a Pencil and paper test so that a large sample could be evaluated
with a corresponding reduction in the amount of time necessary to perform
the evaluation. See Figure .VII.2 for a copy of this task.
, While the approach eliminated the difficulties inherent'in the clinical
interview protoeOls used earlier, our first effort in this class-content-
related problem was less than satisfactory. First, the approach required
too few conceptS to .answer the'questions. Upon inspection of the questions,
it should be evident that only the concepts of "solid," "liquid," "gas,
and "phase change" would be required to answer the majority of the questions.
In other words, we had failed to delve deeply enough into the relationships.
among the concepts to prod'the student into revealing their understanding
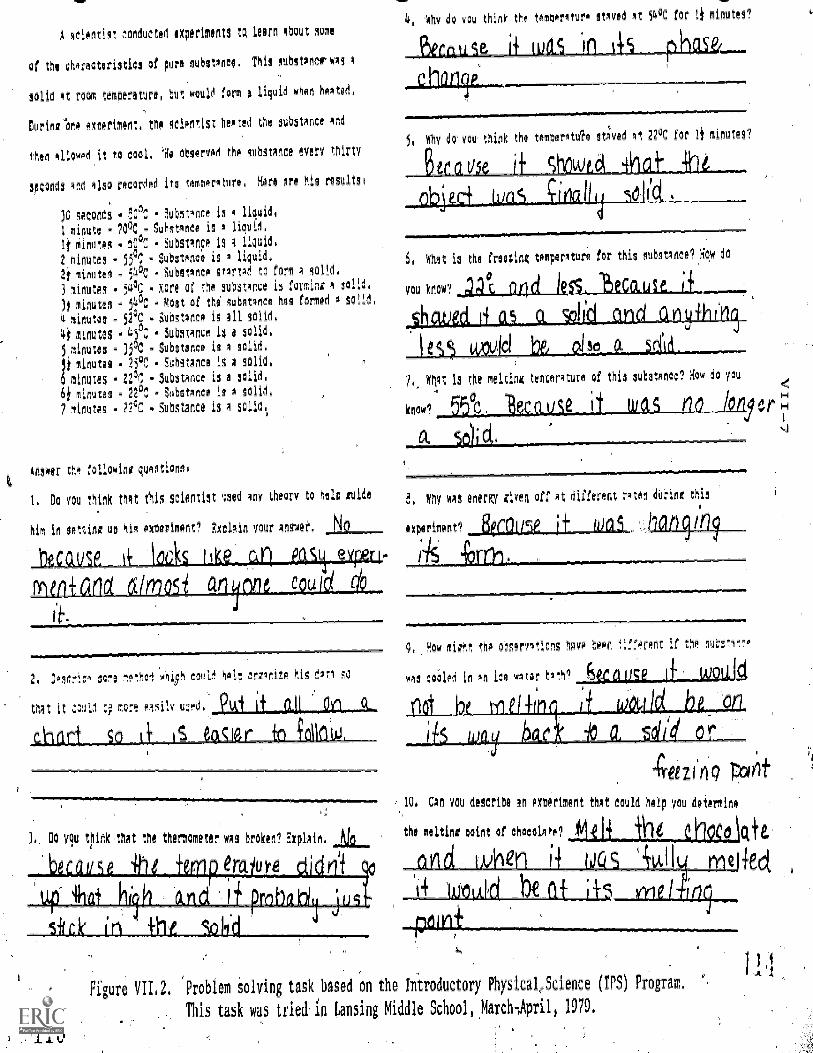
A scientist conducted experimentS to learn 4bOlit some
of the characteristics of pure substance, This AUOltAnor w41 4
30114 At roam temperature, but would form a liquid when heated.
During One 04oefitot, the scientist heeted the substance and
then allowed it to cool, 'He observed the iubstAnCe every thirty
wands and 410 recorded its tomnersture, Here Are his results'
)C seconds = Co"i substance is 4 liquid,minute 700C.. Substance is a liquid.
II minutes tO°: Substance is 4 liquid.2 minutes $5°5 - Substance is a liquid.2 minutes - 540C Substance stArtad to forma 3011d.
3 minutes 540c = !We of the substance is forming a solid:
3!minutes = 54°C - Most or no Substance has formed 0 solidi
4.minutas - 520C Substance is all solid:41 minutes - L5°C Substance 13 a solid.5minutes 35°C - Substance is A solid,
minutes 25°C Substance is A solid,
0 minutes 2.917 Substance is a solid,61 minutes . Substance is A solid,
7 linotes 22cC - Substance is I solid.
Answer the following ques_ Onsi
I. Do voo think that scientist any theory to help nide
him in Setting op his exnerimnnt7 FAciA,in vour nnewei%
'.12eELOA?
2. coser1:4 scre p!o1 'Ai, h ccul hale CrZirize his d474 40
thAt it O:qL f fO:A 045EY ua0d.
DO you think ths he theisometep was broken? Zxplain.
Ur
.Whv do 1.(011 think the ten -4 Ur4 eta ed It 5400 for 1i minutes?
5, Why do. You think the emperatuh staved at 22°C for i1 minutes?
6, whet is the freezing temperature for this StiOstAnCeiiOw do
you know? .122Ladit.isae22.1.12"_.
7,, WIrt is the melting temperature of this substance? Aoki do you
know? 21 jgCS11611LiggiMLIMtli .
!, Why was enemy ziven off At different rote!, dbrine this
experiment? Bern !ix hary9/6
9 'low might the Merl ns hove hewn, .1.rferent if the suts!s','!a
was coolei in en ice WA jg
10, Can ,vou describe an eerie
the melting Nine of chinning?
::1)1 c? TDCOlt
that ould help you determine
Figure V11.2. Problem solving task based on the Introductory Physical,Science (1PS) Program.
This task was tried in Lansing Middle School, March- .April, 1979.
H
VII -8
of the conceptual structure surrounding the event. Second, which is
a corollary to the first objection, since the task required too few concepts,
it was reduced to a logic problem, involving mostly "if...then" kinds of answers.
These shortcomings were clearly evident from the records we collected.
A similar problem format was tried with seventh grade, students at Trumans---k
burg. This problem dealt with a paragraph describing mosses and liverworts,
followed by a series of multiple choice questions. Upon further analysis
of responses and test items, it was concluded that there were serious objec
tions to the validity of this problem as designed. The 1978-1979 school
year ended with much work remaining to be done in our efforts to assess
transfer of learning.
With several new staff members joining the project in August, 1979, we
-.resumed our efforts to evaluate transfer of Idarning with general discussion
of the purposes and goals, and a review of previous problems and progress.
Out of these discussionsemerged,a guiding protocol that was subsequently
employed to develop our "evolution problem." The protocol for this example
is shown on page VII-9.
The Evolution Problem:
It was decided early that perhaps -the best way for Students to demon-
strata their understanding of the conceptual structure of the discipline
was to have them write an essay- type 'answer, rather than depending on their
ability to identify the conceptual relationships among several relationships
given in a multiple-Choice questions. The "evolution problem" was con-
structed and administered to seventh grade biology students at Trumansbui.g.
Scoring was done by checking students' answers to identify concept relation-
ships shown in the concept map (Figure VII.3) and any other relevant statements.
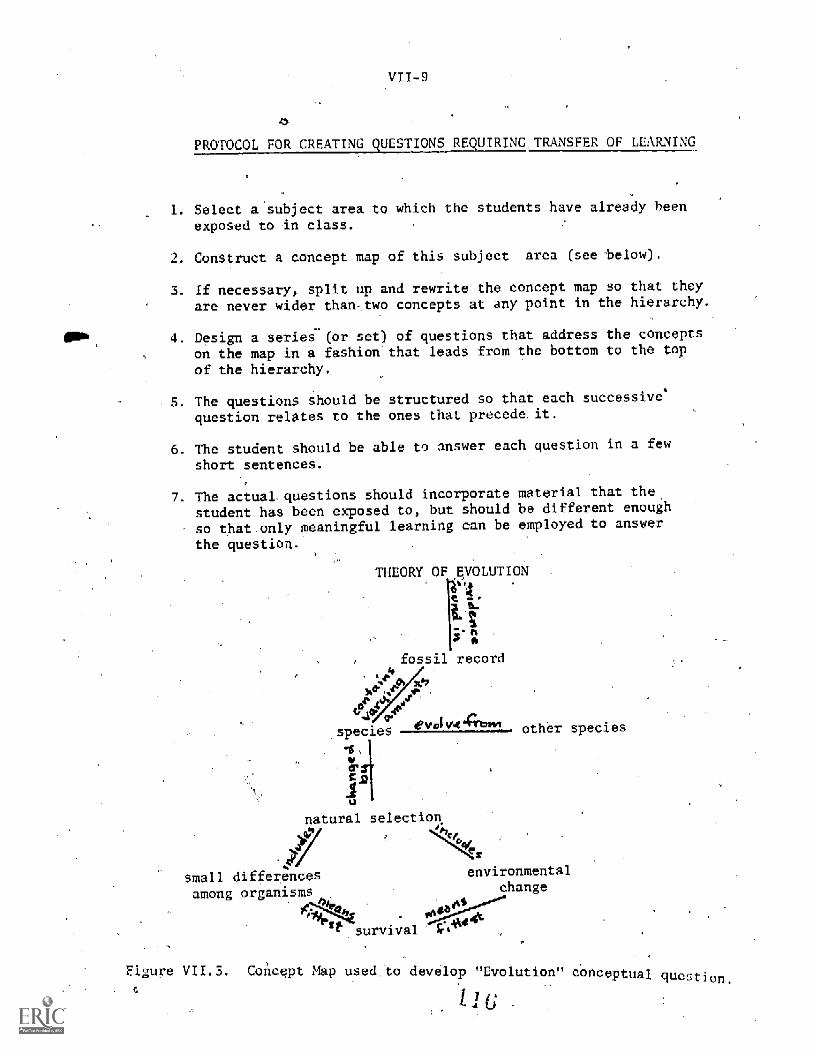
VII-9
PROTOCOL FOR CREATINGQUESTIONS REQUIRINGRE UIRIi G TRAM SFE OF LEA
1. Select a subject area to which the students have already beenexposed to in class.
Construct a concept map of this subject area (see below).
3. If necessary, split up and rewrite the concept map so that they
are never wider than-.two concepts at any point in the hierarchy.
4. Design a series- (or set) of questions that address the concepts
on the map in a fashion that leads from the bottom to the top
of the hierarchy.
The questions should be structured so that each successive*
question relates to the ones that pre-cede, it.
The student should be able to answer each question in a few
short sentences.
7. The actual- questions should incorporate material that the
student has been exposed to, but should be different enough
so that,only meaningful learning can be employed to answer
the question.
THEORY OF EVOLUTION
fossil record
natura
small differencesamong organisms
survival
other species
environmentalchange
Figure VII-3. Concept p used to develop "Evolution" conceptual question.
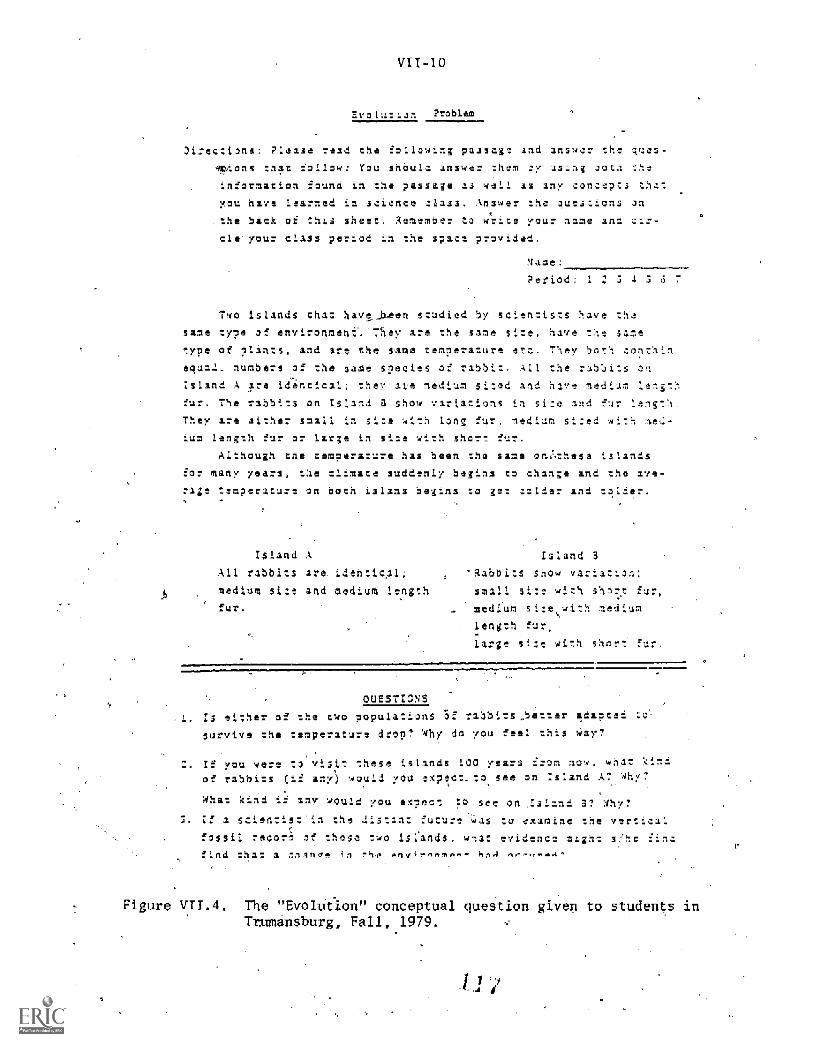
VII-10
Evolutiun Problem
Zarections: ?lease read the following passage and answer the :ues-
lzions that follow: You shauld answer them Z.y '13; Oath :he
information found in the passage as well as any con:epts that
You have Learned in science :lass. Answer the duestions on
the baqk.Of this sheet. Remember to $.'-fite your name and air-
aid- your class period in the space provided.
Name:
Period: 1 : 3 4 3 6 7
Two islands that havi_b4en studied by scientists have the
same type of environmeniThey are the same size, have :he same
type of ?Lints, and are the S-Ime temperature ett. They both contain
equa1_ numbers of the same species of rabbi: . All the rabbits on
:stand A are identical; they are medium sized and have medium length
fur. The rabbits on island a show variations in slaU end fur length_
They are either small in site with long fur, medium sized with 30-
ium length fur az large in site with sham jur.
Although the eempersture has been the same orJ,these islands
for many years, the climate suddenly begins to change and the ave-
rage temperature on both islans begins to get :older and :older.
Island A island 3
All rabbits aro.'identical; 'Rabbits show variation;
medium site and medium tength small site with shor_t fur,
fur. medium si=e,with medium
length fur,
large site with ahmrt fur.
OUgSTIONS
1. is either of the two populations 5e- riots et.ir adapted to',
survive the temperature drop? Why do you !eel this Way?
If you were to visit these islands 130 years from now, what kindof rabbits (if zny) would you axpeat_tdsee on :sand A' Why7
what kind if any would you exec: :0 see on Ist-n 3? lhv?
3. 1 scientist in the distant future was to examine the vertiza:
fossil :sear: of these two wtzt evidence might s'he fina
find :ha: a cline, ii
Figure vri. . The "Evolution" conceptual question giver to students InTrumansburg, Fall, 1979.
11/
VII-11
While the "evolution problem",did require students to use the concepts
of evolution preiented in class to answer the questions,po§ed, some short-
comings were found. First, the items were too difficult for most of the
students to answer. It required the student to draw upon a large group of
concepts that were related, but not explicitly discussed in class. Also,
there was not enough structure to the questions to focus the students',
ttention to theproblem,i.e., trying to reach a claim about an event
using the conceptualizations of the theory of natural selection. (See Figure
VII.4 for the actual question.) Some insights did emerge from this attempt. First,
the task did concentrate on and required the use of concepts to explain
an event. Second; the-event was a true inquiry event, even if it was
a contrived example, -A scientist could theoretically come upon such a
pair of islands, and could make projections as to which population would
survive bettOr given certain environmental changes. Third, it required
the studeAts to write and express their understanding of the relationships
among the concepts. This attempt helped to define the general format
for the construction of these kinds of questions during the last six
months of the year. Although the format did indeed change as new examples
were tried, all these changes came as a result of necessary reconceptualiza-
tions about the evaluation task.
The Acetabularia Example;
Encouraged by the <dings about the construction of this kind of
-
"conceptual question" (the label used after November, 1979)., the staff began to
develop'another example based on'a piece of primary research. Reported
. -
in SCIENTIFIC AMERICAN, the example dealt with Acetabularia (Mermaid's
Wineglass), a large o_ celled algae.that is especially- conducive to
cytology studies.
A description of the organism and the questions administered to the
students is illustrated in Figure VII.5.
A report of basic research was selected for the cite =n o again
provide-the students with a true example of inquiry. vious h9ugh,
the reporting of the research was necessarily "scaled down" to accommoda
the j.mior high science student. Concept maps were prepared from the
cle (see page VII-I4), and the subject matter of.the cell and -the
cell theory were presented to the students in their classes. The funct
of the two concept maps'was to guide in-the construction of the questions
n
which were then devised for each of the experiments reported in the original
SCIENTIFIC AMERICAN article.
In our first attempt with this instrument, we worked with small groups
of students 6) in Trumansburg to "walk them through" the example. From
this initial experience, we deterMined that the task was too difficult
in itsoriginal fo since students were unable to relate what-they.knew
about -the structure of the cell to this example. Also Acetabularia was
too exotic to the students; they had only worked with the more common
P
,classroom examples of cells: onion, Elodea, and cheek cells.
From our experience with this question, the staff decided to pursue
a problem more conceptually relatable to what the student could ordinarily
be expected to encounter in the course of conventional classwork. This
.
,
was the impetus to the development of the "winebottle example.-"
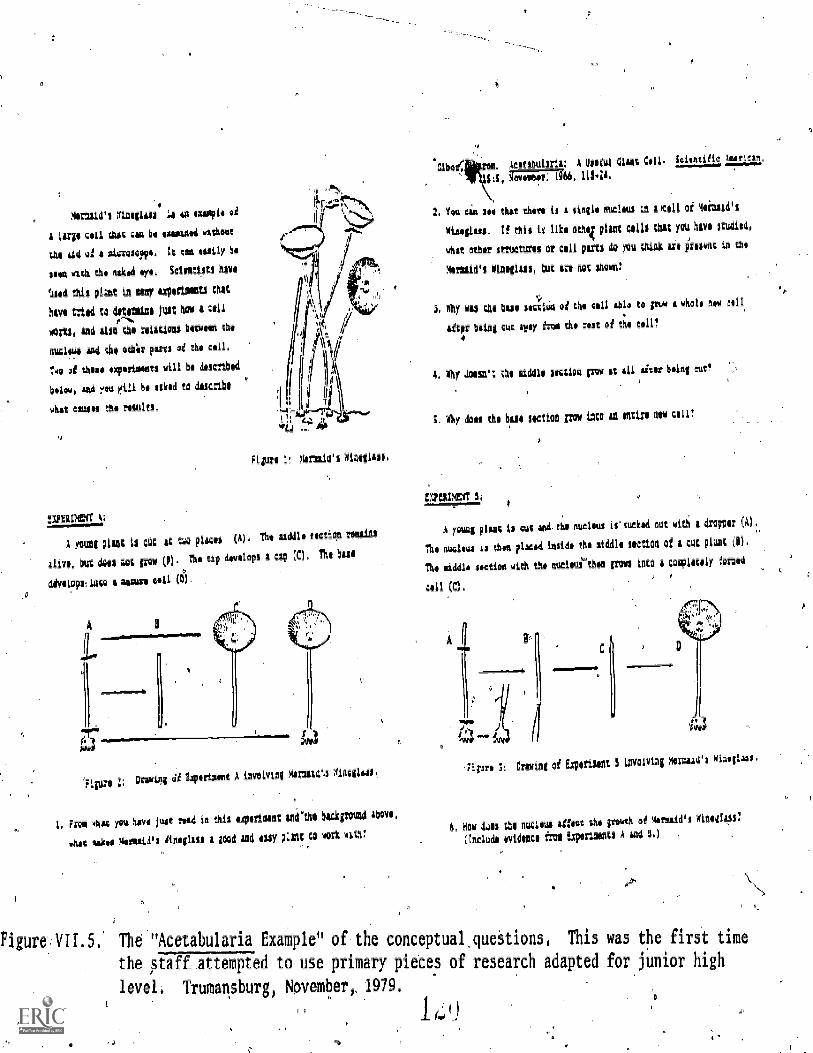
Narzsa's naeglees Le On ahpir
1 lop cell dist ca bo Osaien without
the sie Of a himegepe: :t Call 'WAY he
len with gbo moh$4 Aye. Scintien hove
tan this AZ: in tear oolonmontS that
heYe Cnea co 4001Ln Juan boy 4 cell
oaths, aá 41S0 the telstins haters the
JA4 414 othie parts 3f the coil.
NO of theme xpertments will be 4ncribed
holOw, use :004 eta be Mid to encribe
whet d11441 the results,
-4. Aeltahultria: A Uniut Giant Cell= Scientific ljeetie,
5;00ist. 1154.4..
. tat cis :so that chore is a Mee eutleue to eicell of IloCuaid'i
1i490.20. If this le like Othll plant 0111 chic yea hie, ieuhiee#
An ether onucturos at colt pens do )Ou U ZI 6$4flt th the
=i Morseie't Mineglese, it sr, not Sheen:
Fitaxe I.! )4=441 eleotless,
IXPE41411[A.,
A yoUnt ping is hitt et tal plum (4). Vie riddle tong* magi
alive, but dose nag on (11).The tip eovolops a Csp (E), The hese
diallopelince a Woe cell (
'Fitio# 2: Dtoming di liworneeng AilIVOLVial MirMile4 h4g6441.
1, FrON 44st you have Just Feld la la egotism; Meth, ham* Abeve,
what soli !gorcii411 einglass a plod And noy ?lent C4 work nth!
ia
3. shy wee the bus SOttia at the tell ahlo Co pow whole new all
after betas cut aelY five the rest of the tell
4
4. 1hr doesn't the middlesection row at all air both' cut'
ehr doom the bus section pow into xaretire how celi 1
A yang pisss is pig 44.611 nucleus Li itialti out with a dropper (Al.
rhe nualitis is then ?LILO Wide themiddle section of a cut pleat Oi) :
nu' oiddlo Sett* with theoueleaitheo from into A coaniettly forosti
cell K1.
lloro 3: Arnim of Exponent 5 thvolvtoa Mraid einelleee.
6. How 441.1 the RUt1414 effectthe Imo of Mormid's einetleall
include evidoci five Isponhente A uld 5.)
FiguraNII.S. The "Acetabularia Example" of the conceptuallueStions. This was the first time
the 5-tiff_atIgFed to use primary pieces of research adapted for junior high
level. Trumansburg, November,. 1979.
1 i;)
0
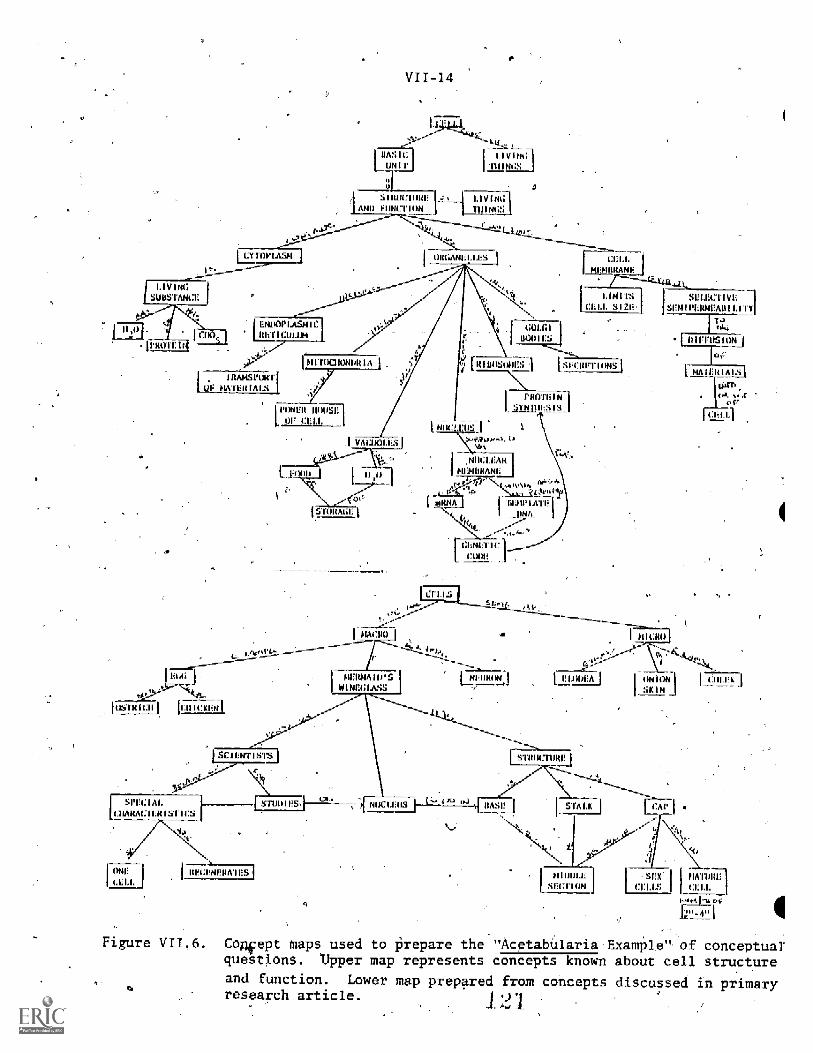
VII-14
IL
S.1 R11171'11111:
Ellucuto-I IVINC'Ell I NCN
LETO!' LAM I _A Re;LUIS CIILH ',MIKAN!
I ITS
I
umcri Y
SEIME
PERMEAIM L I TY_
_Amsi,tht-r01, m IA IS
|N I Too ION ©@&®.IIA" m IAI
PIX4121( I I( 1tir a&-
NI I( IS
is
NI IC LEA I
FIE,' MIAMI
IPIATEr
CENCI
SPEC I ALIARACI ER I YE ICS
211_ I
e VII 6. Co -ept maps Used to prepare the "Acetabularia Example" of conceptual'questions. Upper map represents concepts known about cell structureand function. Lower map prepared from concepts discussed in primary
19]research article.
The Winebottle Example:
The 'linebottle example" described below waS,essentially the culmina-
tion of several months o theoreticaldiscussion on the content and con-
text of a conceptual question. From the valuable experiences of prexious
attempts, the staff devised this example. One departure, however, frt
the previous attempts was included in'this example. In addition to the
posing of an inquiry event and a description of some record, we also
included the concepts that we,wished the students to use in the explanation
f the event. This was done to prescribe limits and de .re the parameters
that would form the bases of the students' answers. The important idea
to keep in mind here is that to identify the concepts that could be used
to sort out the event, these concepts must necessarily be learned meaning-
fully or the students would.not be able to use those concepts in their
answers. In other words, if the students were unable to relate the concepts
to the event or to each other, it would become very evident in the
explanations offered in the answers.
Upon examination of-the "Winebottle example" on page the
elements described above should be clear. First, an event is identified:
-the bottle has been rioved from the. refrigerator to the windowsill where
the warm rays of thG Sun shine upon it. Second, a record-of the key event
also indicated: the cork pops Off the bottle. Thitd, the major concepts
necessary for the explanation are included in a non-conceptual manner,
(in this ease) alphabetically.
To facilitate the discussion -of the construction and use of this
example, a diagrammatical illustration of the winebottle_example is
provided on page VII-17. This is accompanied with an actual,answer by
of the, students in our study.
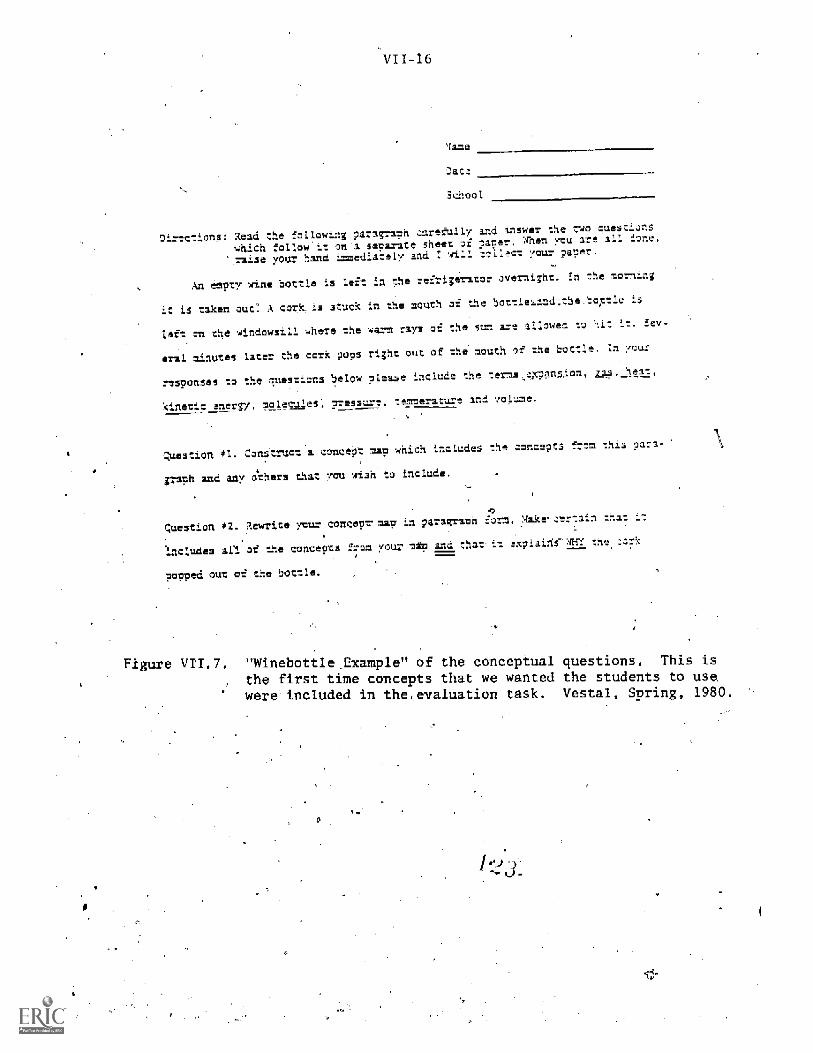
V11-16
7rame
Date
School
Directions: Read the following naragraphcarefully and answer the rwo cueszions
which follow-it on a separate sheet of pacer. When you are all lone,
raise VOuyour hand impedia:ely and ":l collect your ;suer.
fl empty wine bottle i3 Left in the refrigerator overnight. In :he morning
it is taken out: A cork, is stuck in the mouth of the bottleland':the.boAttle is
left on the windowsill where the warn rays of the sun are alIowed to hi: it. Sev-
eral minutes later the cork as right out of the mouth of the bottle. :n your
responses to the queStions below please include the terms,expnns.ion,
kinetic energy, molecu_les; pressure.:emterature and volume.
question *1. Construct a concept an which includes the concepts frnp :his
graph and any other3 that you wish to include.
question *2. Rewrite your conceutmap in paragraph fort. Make.otr.ain :ha:
"inCludes all of the cc from your =Au and ,nari= explains tn. e cork
popped out of the bottle.
Figure VII.7. "Winebottle Example" of the conceptual questions. This is
the first time concepts that we wanted the students to use,were included in the,evaluation task. Vestal, Spring, 1980.
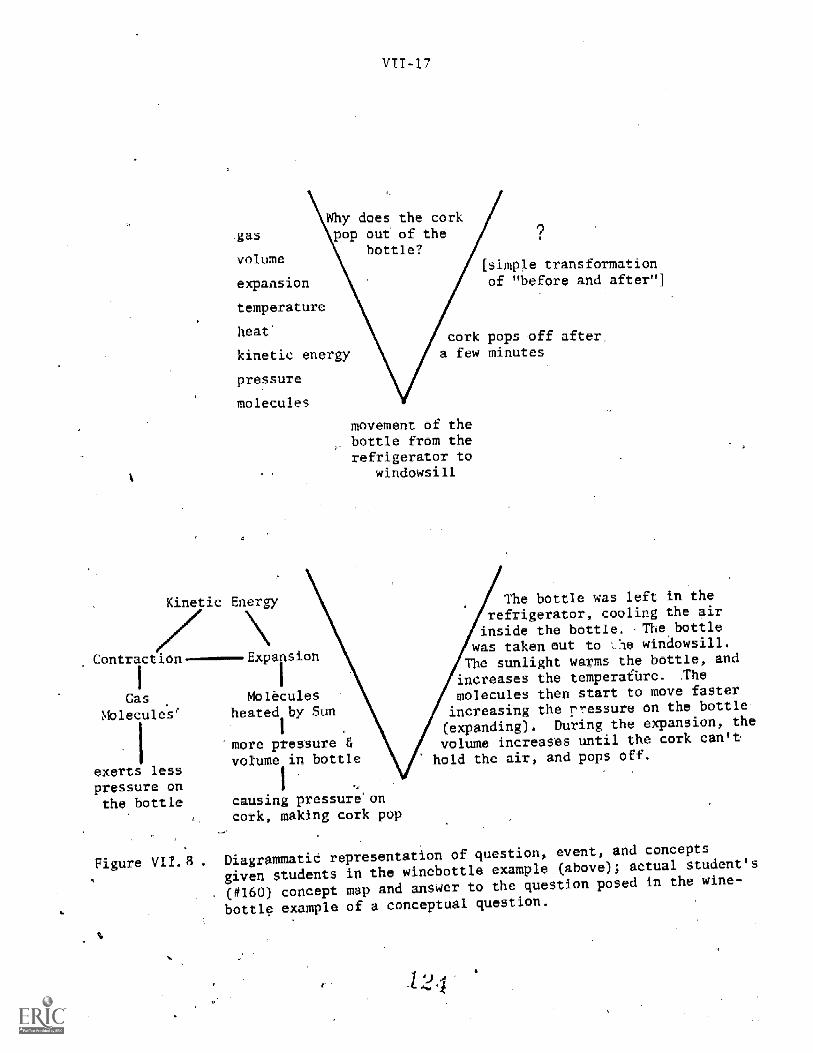
_gas
volume
expansion
temperature
heat'
kinetic energy
pressure
molecules
VII-17
Why does the corkpop out of the
bottle?
Kinetic Energy
simple transformationof "before and after "]
cork pops off aftera few minutes
movement of thebottle from therefrigerator to
windowsill
Contraction -Expansion
Moleculesheated by Sun
more pressure &volume in bottle
Gas
Molecul
exerts lesspressure onthe bottle causing pressure'on
cork, making cork pop
The bottle was left in therefrigerator, cooling the airnside the bottle. -Thebottle
was taken out to '-te windowsill.
The sunlight warms the bottle, and
increases the temperafbre. Themolecules then start to move faster
increasing the rressure on the bottle.
(expanding). During the expansion, the
volume increases until the cork can't
hold the air, and pops off.
Figure VIr.8 Diagrammatic representation of question, event, and concepts
given students in the winebottle example.(above); actual student's
(#160) concept map and answer to the question posed in the wine-
bottle example of a conceptual question.
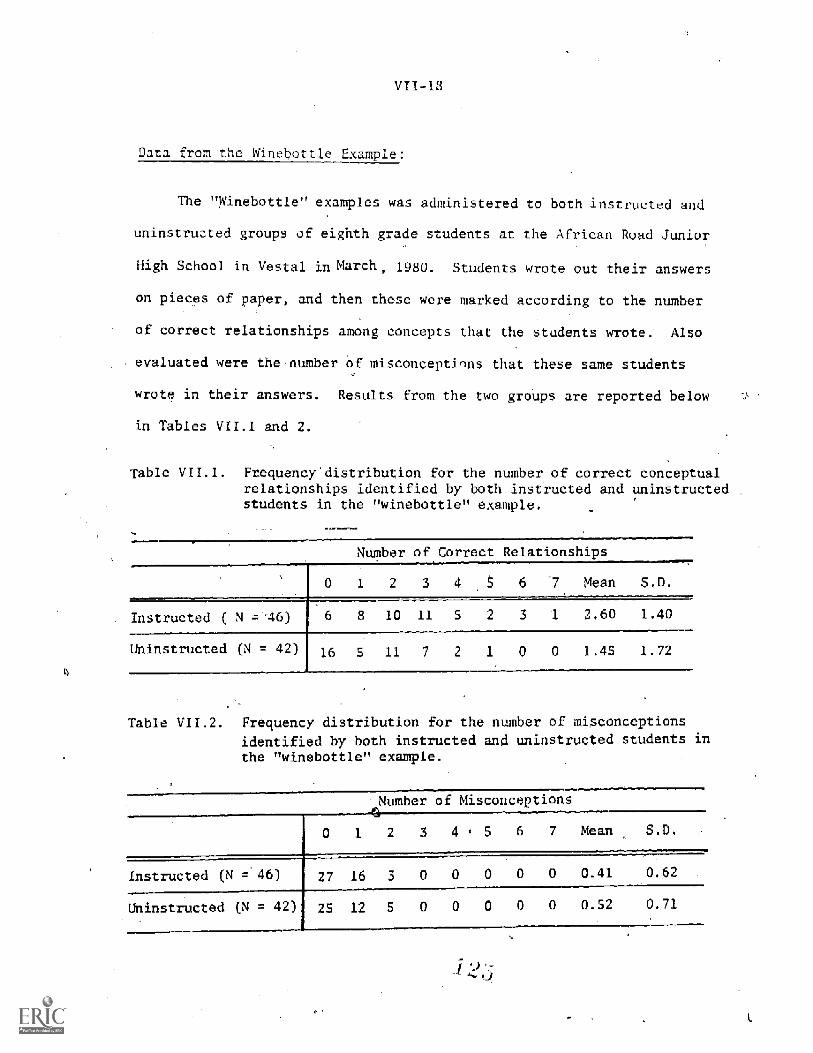
Data from
VII-18
he hinebottle p e7
The "Winebottle" examples was administered to both instructed and
uninstructed groups of eighth grade students at the African Road Junior
High School in Vestal in March, 1980. Students wrote out their answers
on pieces of paper, and then these were marked according to the number
f correct relationships among concepts that the students wrote. Also
evaluated were the-number of misconceptions that these same students
wrote in their answers. Results from the two groups are reported below
in Tables VII.1 and 2.
Table VII.1. Frequency'distribution for the number of correct conceptualrelationships identified by both instructed and uninstructedstudents in the "winebottle" example.
Number of Correct Relationships
0 2 3 6 '7 Mean S.D.
Instructed ( N ='46) 8 10 11
7
2 3
0
1 2.60 1.40
Uninstructed (N = 42) 16 5 11 2 1 0 1.45 1.72
Table VII.2.- Frequency distribution for the number of misconceptions
identified by both instructed and uninstructed students inthe "winebottle" example.
Instructed (N = 46)
Uninstructed (N = 42)
Number of
0
27 16
25 12
-conceptions
2 3 4 , 5 6 7 Mean S.D.
0 0 0 0 0.41 0.62
0 0 0 0 0 0.52 0.71
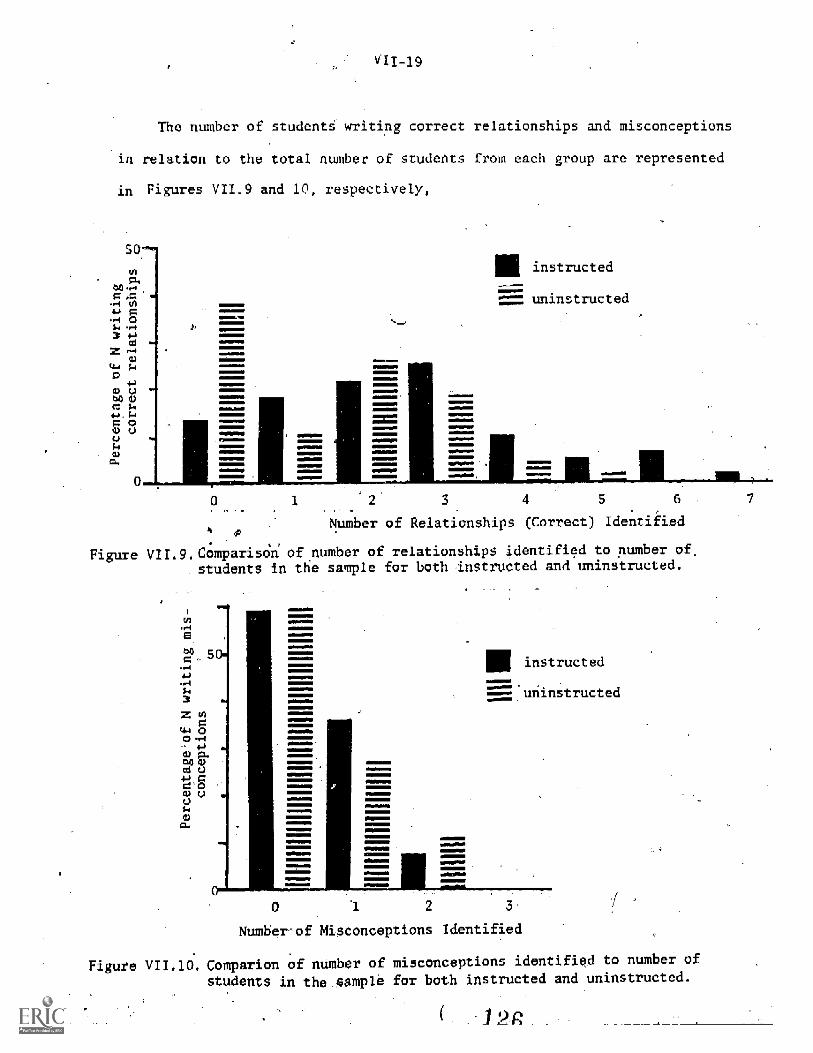
VIT-19
The number of studentS writing correct relationships and misconceptions
in relation to the total number of students from each group are represented
Figures VII.9 and 10, respectively,
MMmMMMmmMa11mMIMM MMMmMM MMMmmM !MMM=M MMM
MMMMMM mmm!M! IMMM MM!
mmm MUM mWEN2iMM mmmMM WMmWEW1, SS
instructed
uninstructed
3 4 5 6
Number of Relationships (Correct) identified
Figure VII COmparisdn of number of relationships identified to number of,students in the sample for both instructed and uninstructed.
0E
3Z M44 0
4.4
mo mm u=
o=0
Uit
0
aaaS
SaaaaaaaS
SmMMSMMMSMMM
instructedSuninstructed
0 1 2
Number-of Misconceptions Identified
III
Figure VII.10. Comparion of number of misconceptions identified to number of
students in the sample for both instructed and uninstructed.
12c
7
VII =1p
The Electricity Example;
With growing confidence that our "winebo le" example had laid the
foundation for the evaluation of student use of the strategies of con-
cept mapping and the knowledge'"V" for meaningful learning, our next
attempt tried to enhance our understanding by providing variation in
the type of evaluation strategy used. In this problem we sought not only
to determine if students could relate a theoretical structure to an
inquiry event, but a theoretical structure that the student had not
previously used in classroom for similar events. The event of the ques-
tion dealt with electrical conductance: two bars, each in turn, are used
to complete a circuit. One bar produces a-brighter light than the other.
Rather than have the students explain that event in terms of "conduction
"resistance," and "current" alone, they were asked to explain the event
in terms of atomic theory. (See Figure VII.11 for "electricity exampl
including event and concepts provided to the students.)
Another departure from the "winebottle" example dealt with the con-
struction of concept maps by the instructed groups prior to the answering
of the question. In keeping with the notion that concept mapping is only
a heuristic device that functions to facilitate meaningful learning, one
sample of-students who had been exposed to the mapping strategy in class
were not asked to construct a concept map before answering the question.
One half of that same sample were asked to construct the concept map.
null hypothesis, then, was that the construction of a concept map
immediately prior to the evaluation task has no effect-on the quality
of the constructed explanation. Of Course, the uninstructed group was
not asked_to make a concept map to answer the question.
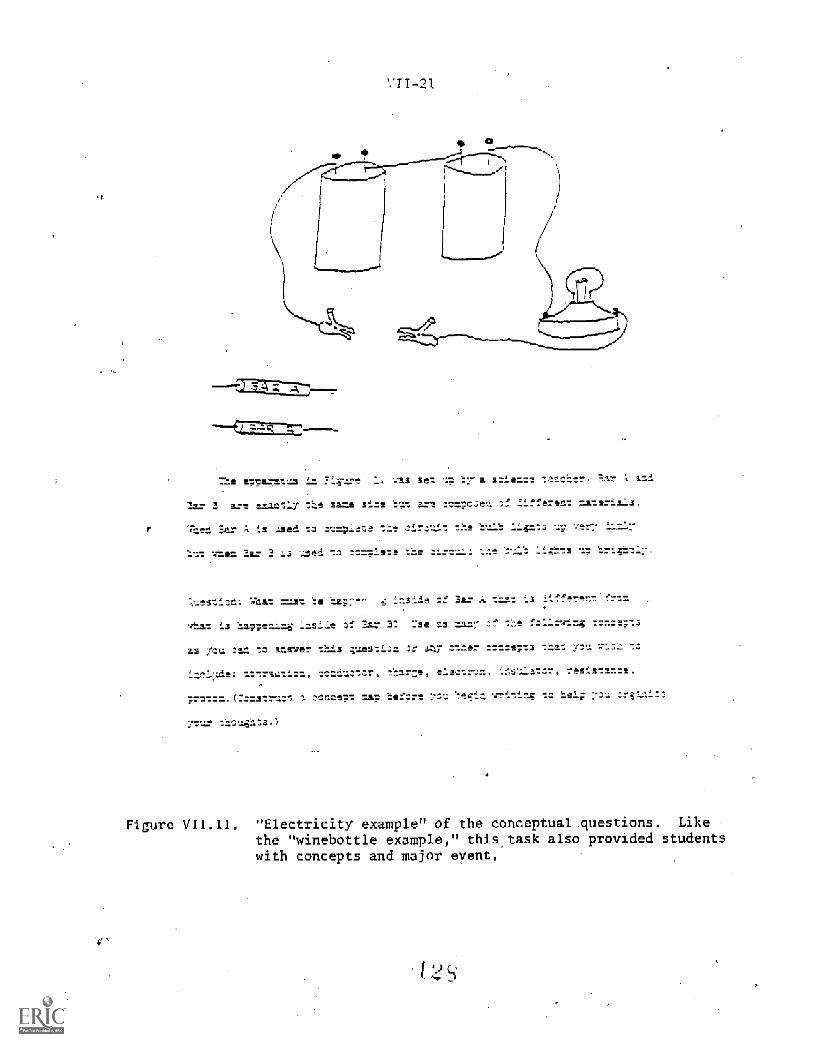
VII-21
=he 17paramta =1.F.:re val sem m; My-a szte==e teacher. 33
St= 3 are e zmly the 3A=A SiAA Ire :c7csee :f Lifferetm materla_s.
7P..r! Bar A ts tz :=;:eme th* zirv:Lt the Ights 7er7 i==7
Irmsr, Bar 2 ts 1z :t=;ete tte zee Ltztts
What =at .ne Itaz7A- itsite ne 3a. A th1t ta
3 haplset..&z.g itaiie tf 2a-: 3? l!se zae7 .1f tr.t fzIt;
as 7zu =az tz amsver =t3 :7..tesmtnt nr 4:17 ztee7 7'11:t3 =A: ytu wtah m:
Ltc4a: ttrtcmt, ;zer;ucttr, C,eztrzr., resistan:e
;r1,;Zr..(smrt=t & teezem =a; beenre tegit IA 7= zrethit:
77.1r thv.:4tts.)
4
Figure VII.11. "Electricity example" of the conceptual .questions. Like
the "winebottle example," this task also provided studentswith concepts and major event.
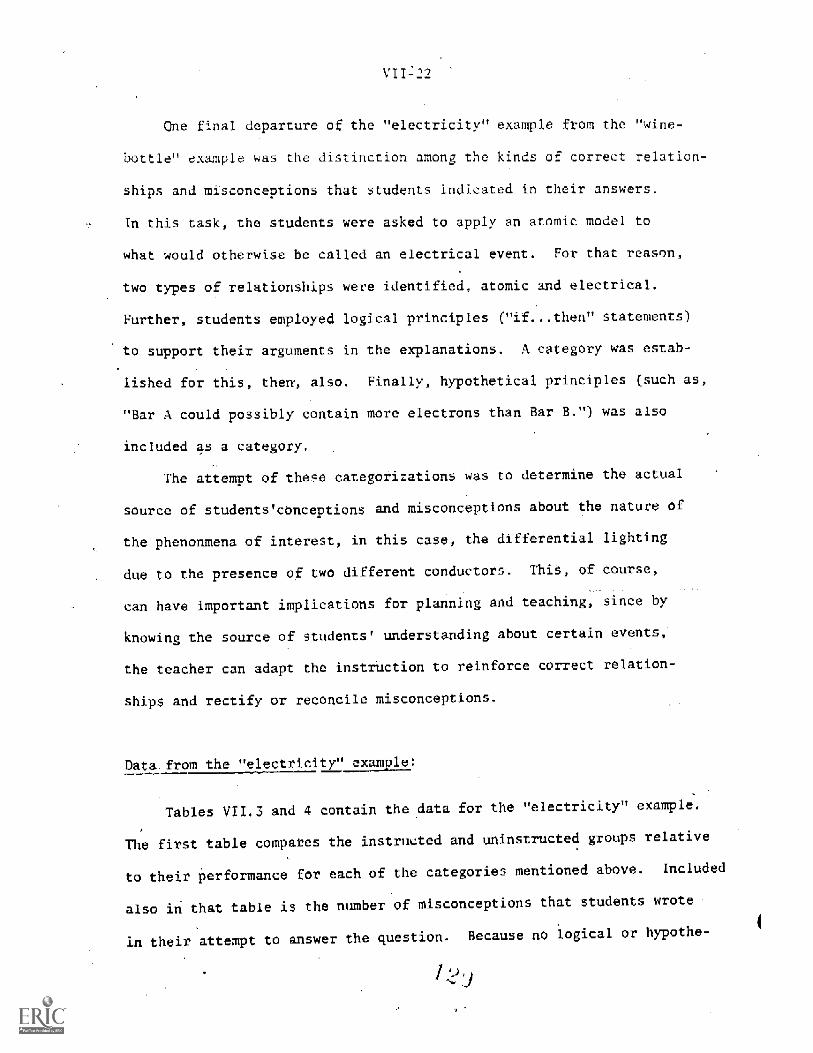
One final departure of the "electricity" example from the "wine-
bi-tie" example was the distinction among the kinds of correct relation-
ships and misconceptions that students indicated in their answers.
In this task, the students were asked to apply an atomic model to
what would otherwise be called an electrical event. For that reason,
two types of relationships were identified, atomic and electrical.
Further, students employed logical principles ("if...then" statements)
support their arguments i.n the explanations. A category was estab-
lished for this, then, also. Finally, hypothetical principles (such as,
"Bar A could possibly contain more electrons than Bar B.") was also
included as a category.
The attempt of these categori,ations was to determine the actual
source of students'conceptions and misconceptions about the nature of
the phenonmena of interest, in this case, the differential lighting
due to the presence of two different conductors. Thi8, of course,
can have important implications for planning and teaching, since by
knowing the source of students' understanding about certain events,
the teacher can adapt the instruction to reinforce correct relation-
ships and rectify or reconcile misconceptions.
Data. from the "electricity" example:
Tables VII.3 and 4 contain the data for the "electricity" example.
The first table compares the instructed and uninstructed groups relative
to their performance for each of the categories mentioned above. Included
also in that table is the number of misconceptions that students wrote
in their attempt to answer the question. Because no logical or hypothe-
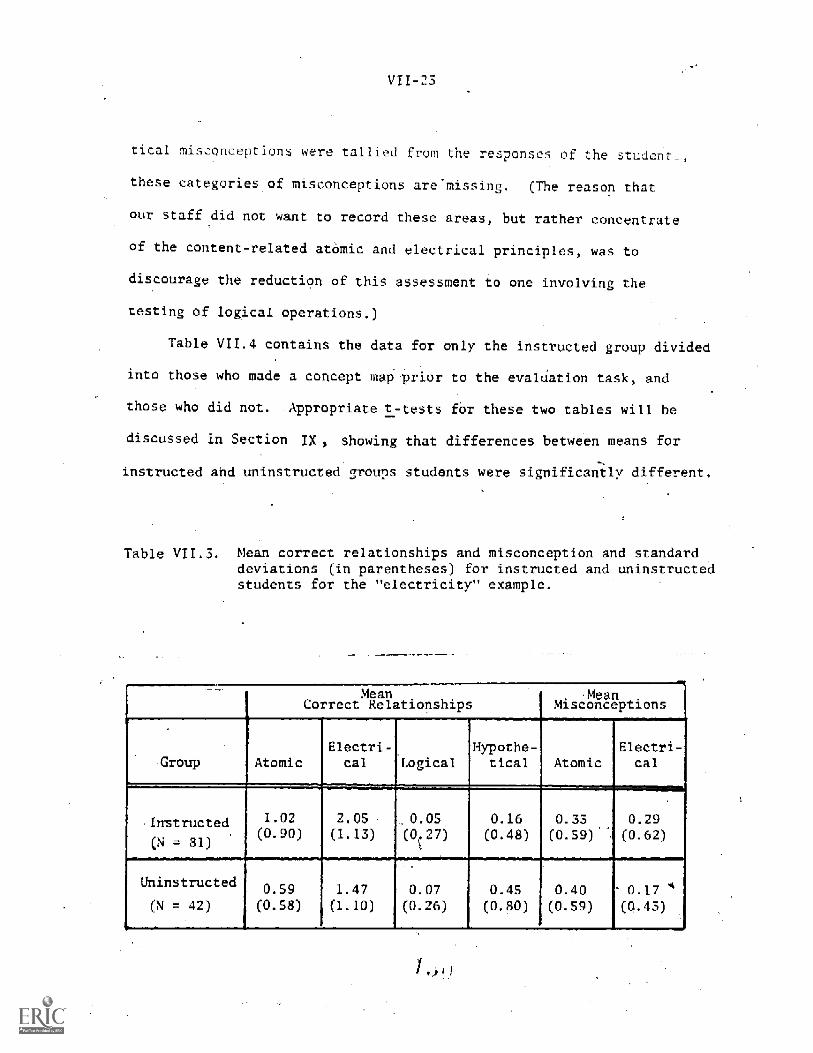
VII-
tical misconceptions were tallied from the responses the s
these categoriesof misconceptions are'missing. (The reason that
our staff did not want to record these areas, but rather concentrate
of the content-related atomic and electrical principles, was to
discourage the reduction of this assessment to one involving the
testing of logical operations.)
Table VII.4 contains the data for only the instructed group divided
into those who made a concept map prior to the evalUation task, and
those who did not. .Appropriate t -tests fbr these two tables will be
discussed in Section IX , showing that differences between means for
instructed and uninstructed groups students were significantly different.
Table VII.3. Mean correct relationships and misconception and standarddeviations (in parentheses) for instructed and uninstructedstudents for the "electricity" example.
MeanCorrect Relationships
MeanMisconceptions
Electri- ypothe- Electri-Group Atomic cal Logical tical Atomic cal
-----
Instructed 1.02 2.05 0.05 0.16 0.33 0.29
(N 31)(0.90) (1.13) 0.27) (0.48) (0.59) (0.62)
Uninstructed1.47 0.07 0.45 0.40 0.17
N = 42) (0.58) (1.10) (0.26) (0.80) (0.59) (0.43)
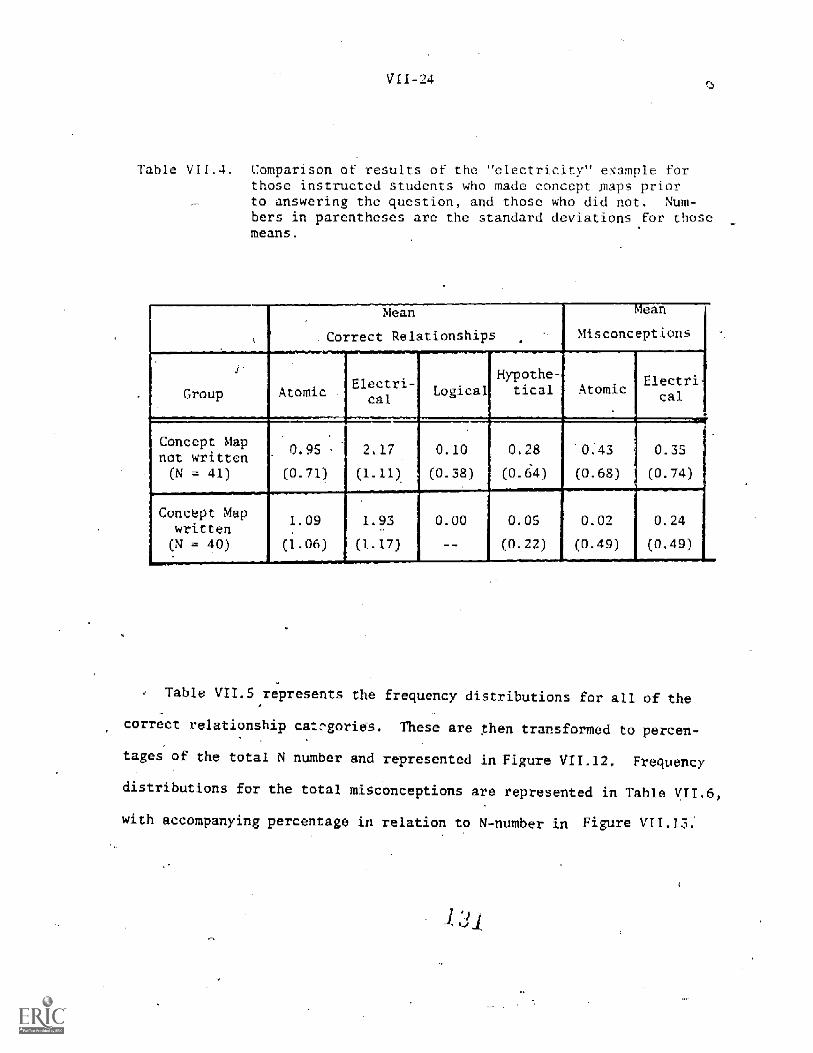
VII -24
Table VII.4. Comparison of results of the "electricity'" example forthose instructed students who made concept maps priorto answering the question, and those who did not. Num-bers in parentheses are the standard deviations for thosemeans.
fi
Mean
Correct Relationships
can
Misconceptions
Group AtomicElectri-
calLogica
H ypothe-
tical Atomicplectrical
Conceptiapnot written
Concept Mapwritten(N = 40)
0.95
(0.71)
1.09
(1.06)
2.17
(1.11)
1.93
(1.17)
0.10
(0.38)
0.00
0.28
(0.64)
0.05
(0.22)
0.43
(0.68)
0.02
(0.49)
0.35
(0.74)
0.24
(0.49)
Table VII.5 represents the frequency distributions for all of the
correct relationship catc'gories. These are then transformed to percen-
tages of the total N number and represented in Figure VII.12. Frequency
distributions for the total misconceptions are represented in Table VII.6,
with accompanying percentage in relation to N-number in Figure VIT.15:
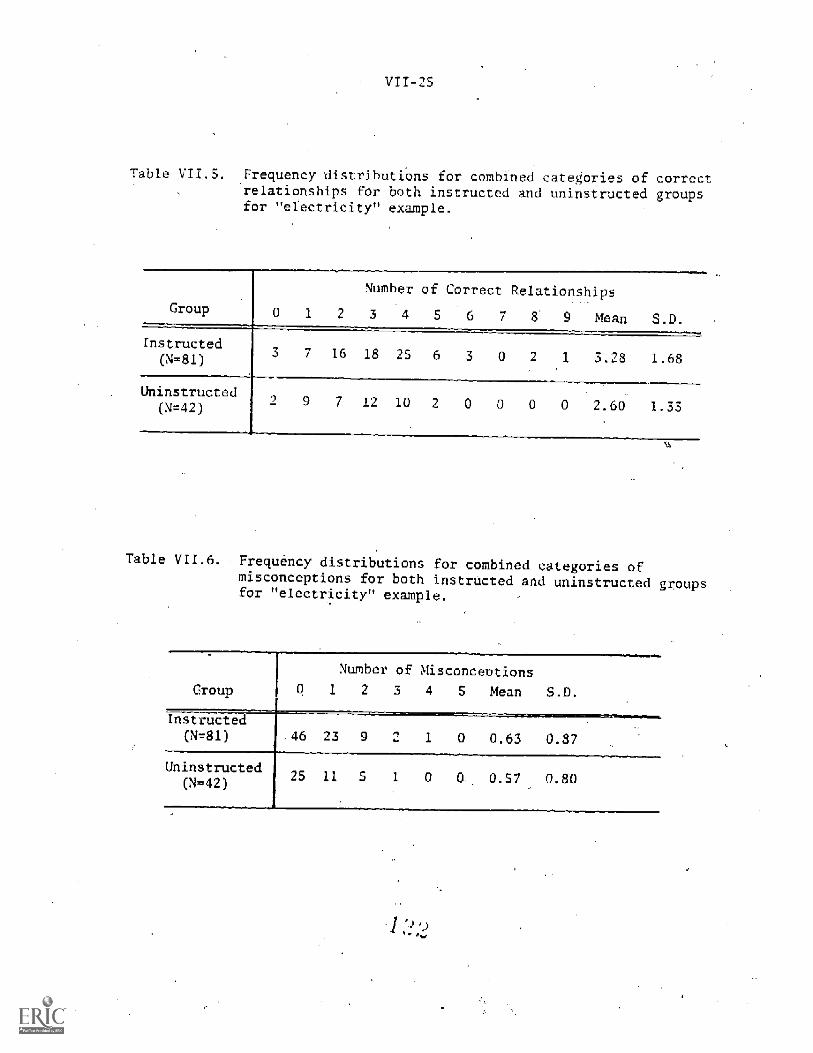
VII -2
Table V11.5. Frequency distributions for combined categories of correctrelationships for both instructed and uninstructed groupsfor "electricity" example.
Group
Instructed(N=81)
Number of Correct Relationships
2 3 4 5 6 7 8 9 Mean S.D.
7 16 18 25 6
Uninstructed(N42)
0 1.68
7 12 10 2 0 0 0 0 2.60 1.33
Table VII.6. Frequency distributions for combined categories ofmisconceptions for both instructed and uninstructed groupsfor "electricity" example.
Group
Number of Misconcet'tions
1 2 3 4 5 Mean S.D.
Uninstructed(N=42)
25 11
0.63 0.87
0 0. 0.57 0.80
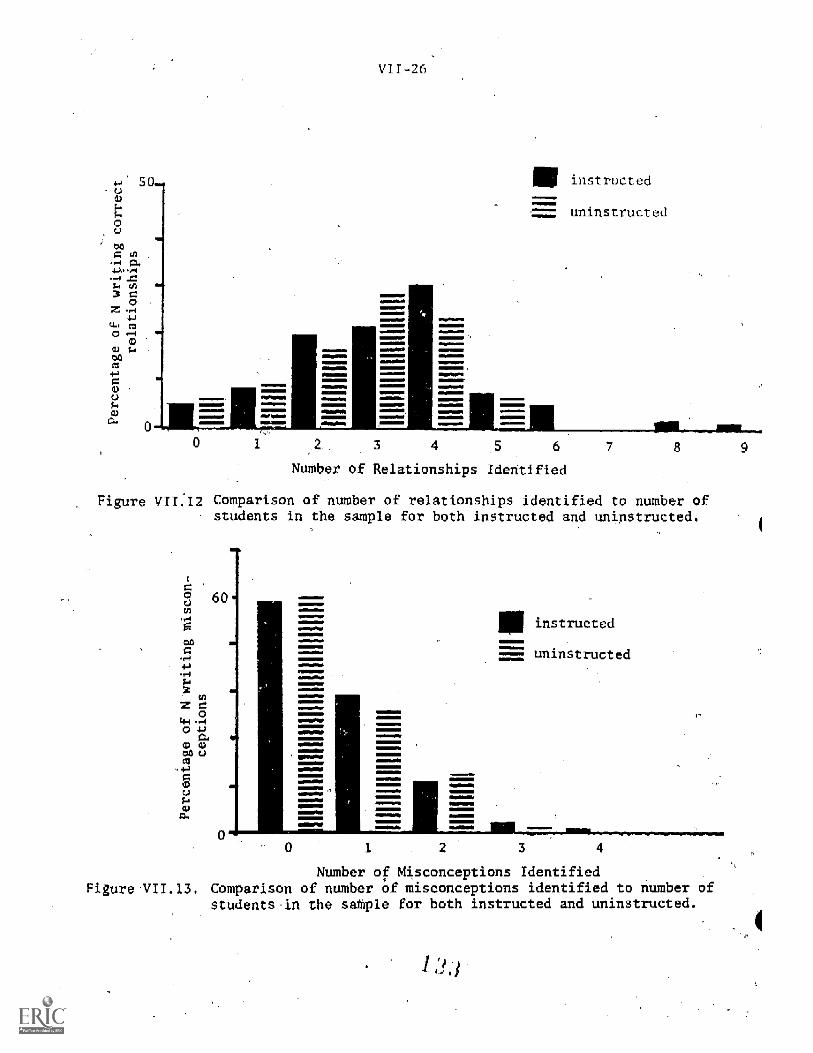
SO
0
VII-26
ilM ii!IBM Mii.iW, i!.i.. .11==i!Mwm! ii Mi.!NM ii iii= MW -
MMM - iMiW. Mi iiWWWW iii MM! a!WM Mi ii iiaimdW ii =ii Mi Mili!MM !if i iM Wni~ a S i!!NEM !M. i! Min
_ructed
uninstructed
0 1 2 3 4 3 6
Number of Relationships Identified
Figure VII. 2 Comparison of number of relationships identified to number ofstudents in the sample for both instructed and uninstructed.
60
MMi!NNWMiM!M.!WMSSSaS
!MN.
!M.SaaS
in!
aaiMMSaMM a
MMMMBE! SMMM
instructed
--- uninstructed
0 1 2 3 4
Number of Misconceptions Identified_e-VIT.13. Comparison of number of misconceptions identified to number of
students-in the sample for both instructed and uninstructed.
VIII. ATTITUDE ASSESSMENT
ithough the "Learning How to Learn" was primarily concern-
ed with c ,e learning, the staff gas also interested in determining
if any changes in attitudes would accrue as a result of exposure to the
strategies of concept mapping and the knowledge "V". We did not expect,
nor did we observe,substantial changes in attitudes toward science for
several reasons. First, the attitudes, as reflected en questionnaires
by students, may indicate how they feel about their teachers or other
factors related to school, rather than feelings related to use or non-
use of the strategies. Second, the assessment instrument used, which
described in detail below, was limited in the numberof items
representing each of the four attitude areas surveyed. Third, the
attitude effects of introdUction of the "V" and concept mapping strategies
perhaps may need much more time to develop'in the students than the
six to eight Month duration of exposure to the strategies in this pro-
ject. Furthermore, even in the "best case," only limited time on task
(estimated to be 10-15%) may fall short of the time needed to effect
significant changes in attitudes about science, learning, and knowledge.
This section reports on the attitude instrument's development,
administration, and observed results.
Development the attitude Assessment trum<:
The staff identified four general areas that might be affected -by
the introduction and use o these strategies in the classroom. It was
felt that concept mapping might have some effect on hOw students felt
about reading in science class. A section on attitudes about reading
in science was included. The knowledge "V" was though- to affect how
students perceived the laboratory experiences as a means of carrying
on inquiry, so this subject also was addressed. The combination of
these two strategies might provide a changed perspective on how
knowledge is created in science, and a section on this issue was
developed. Finally, all these areas should provide a general effect
on students' attitudes about science class, and thus a fourth area
6
of .concern was identified.
With these-four areas -- attitude about reading in science, atti-
tude about laboratory work, attitude out the nature of knowledge,
and general attitude about science class -- a preliminary forty-eight
'item questionnaire was devised in August, 1979, and was based on the
work of Russell and Hollander (1975). Each item consisted of a pair
of positive and negative statements. For instance, a positive item
could state, "I like to read about science in the newspapers And maga-
:Ines that we
don't read
For each
and negative
get at home," while its negative counterpart would read,
any more science than I have to."
of the four general areas identified above, positive
tems were devised. A Likert-like scale of one through
five accompanied each statement, with numerical values indicating a
ge of feelings from "strongly agreee" to "strongly disagree."
During the marking of the questionnaires,,positive statements would
progress -from one being. "strongly disagree" through five being
"s rongly agree." If the statement was negative, the reversal was
In both kinds of statements,'a-three indicated no preference
either way, or "undecided."
VIII-3
--This initial questionnaire contained forty -eight items with the
ing breakdown into the four general areas:
GENERAL ATTITUDE ABOUT SCIENCE CLASS. = 14 items
ATTIT'IDE ABOUT READING SCIENCE = 12 items
ATTITUDE ABOUT LABORATORY WORK = 14 items
ATTITUDE ABOUT THE NATURE OF KNOWLEDGE= $ items
After some initial editing by the project staff, an editing that con-.
centrated on the reductibh of ambiguity in the wording of the statments;
the preliminary questioAna b Was administered to the entire eighth
grade class (N c 102) At one of the schools with which we were working.
The_ eighth grade was selected for this sample because it was representa-
tive of the type of student with whom we were working in the project,4
but was not directly part of the- project: the participating teache at
that school was the seventh grade teacher. However, twenty-three_of
these eighth graders were involved with our project materials during.1
the previous school year (1978-1979), and in the analysis that followed
this preliminary assessment, these 28 'students' scores were deleted
and the remaining responses, analyzed (N = 79).
The averages for each area werecomputed. Total scores for the
entire assessment were4lso calculated. Based on Russell and Hollander'
recommendations, the upper 25% and the lower 25% of these preliminary
assessments were used for the correlation analysis; the middle 50% were
'deleted. Each item was analyzed to find the correlation between the
.average score for the statement and the total score within the general
category. For example, the statement, "I usually do well on science tests
whenbJ have studied," was correlated to the total score forthe category
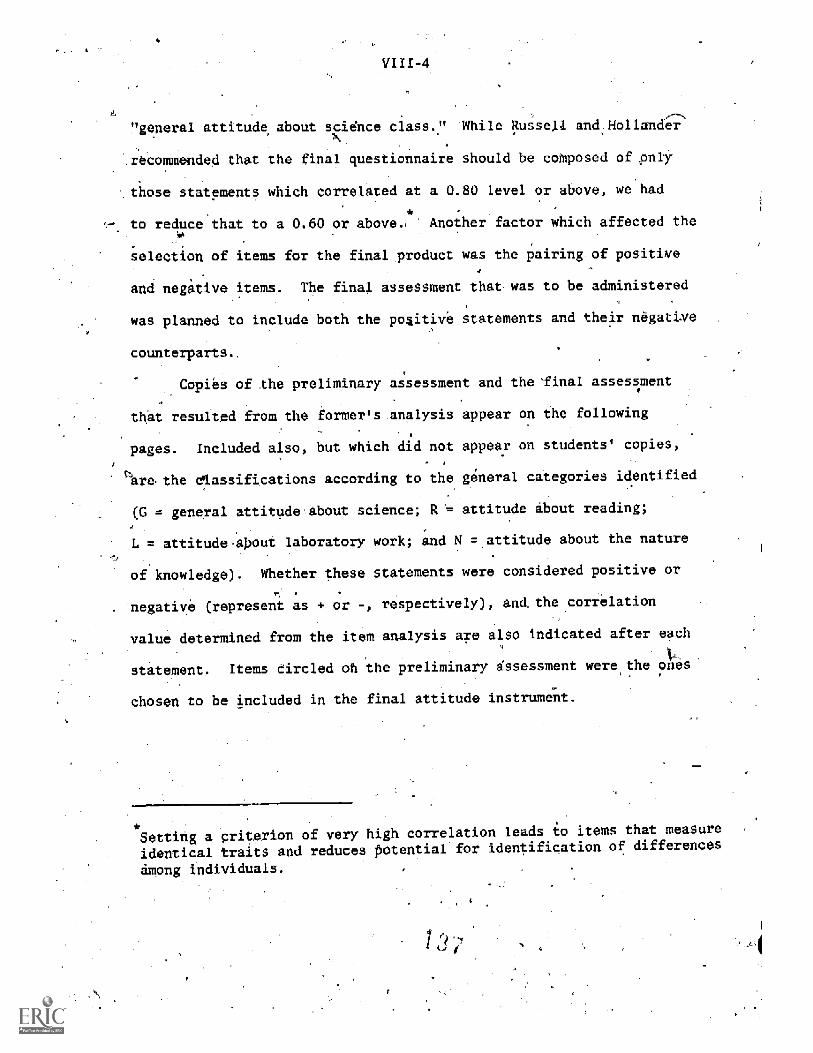
VIII -4
"general attitude about science class." While Russell and Hollander
recommended that the final questionnaire should be composed of pnly
those statements which correlated at a 0.80 level or above, we had
to reduce that to a 0.60 or above. Another factor which affected the
selection of items for the final product was the pairing of positiVe
and negative items. The final assessment that was to be administered
was planned to include both the po4itive statements and their negative
counterparts..
Copies of the preliminary assessment and the `final assessment
that resulted from the former's analysis appear on the following
pages. Included also, but which did not appear on students' copies,
are the classifications according to the g6neral categories identified
(G = general attitude about science; R = attitude about reading;
L = attitude about laboratory work; and N = attitude about the nature
of knowledge). Whether these statements were considered positive or
v.
negative (represent as or -, respectively), and. the correlation
value determined from the item analysis are also indicated after each
statement. Items Circled oh the preliminary assessment were the ones
chosen to be included in the final attitude instrument.
Setting a criterion of very high correlation leads to items that measure
identical traits and reduces potential for identification of differences
among individuals.
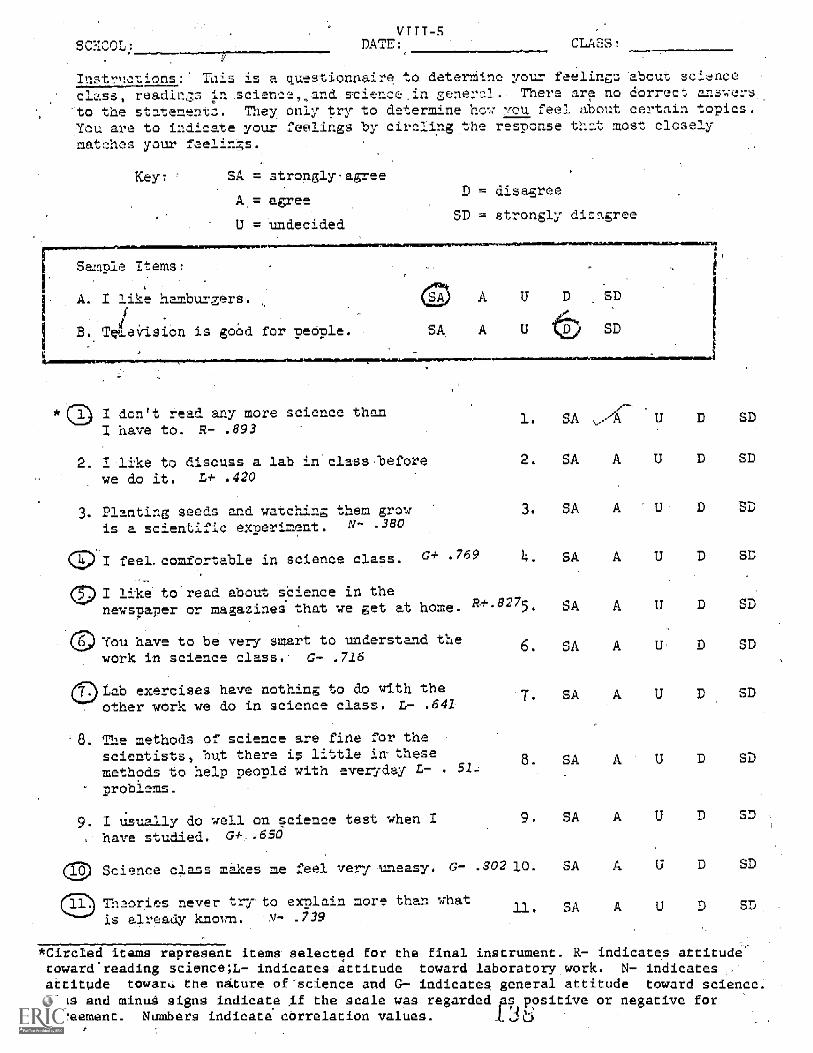
SC..
virT-sDATE: CLASS:
Instr -ions This 1s cuestio_ e to determine your feelings about scienceclass, readin;7o in acience,and science in general- There are no correct answersto the statements. They only try to determine hc*, 7011 feel about certain topics.You are to indicate your feelings by circling the response tnct most closelymatches your feelings.
Sample Items:
SA = strongly -a
A = agree
U = undecided
P = disagree
SD = strongly
I don't read any morescie--e thanI have to. R- .893
2. I like to discuss a lab in class beforewe do it. L# .420
Planting seeds and watching the growis a scientific ex-oeriment. N- .380
I feel co ortable in science class. .769 4.
0 I like to read about science in thenewspaper or magazines that we get at home. R. +.8275.
You have to be very smart to understand the 6.work in science class. G- .726
(E)Lab exercises have nothing to do with theother work we do in science class. L- .641
The methods of science are-fine for thescientists, but there is little in thesemethods to help people with everyday L- .
problems.
9. I usually do well on science test when I .
have studied. G+,.650
Science class m e feel very
les never ry to exnlai__ moreis already knotm. m- .739
G- .302 10.
what11.
SA VA U D SD
SA A U D SD
SA A U D
SA A U D SD
SA A U P SD
SA A U: D SD
SA A U D SD
SA A U D SD
SA A U D
SA A U P SD
SA A U P SD
*Circled items represent items selected for the final instrument. R- indicates attitudetoward'reading science;L- indicates attitude toward laboratory work. N- indicates ,-attitude towaru tne nature of science and C- indicates general attitude toward science.Plus and minus signs indicate if the scale was regarded aq positive or negative foragreement. Numbers indicate correlation values.
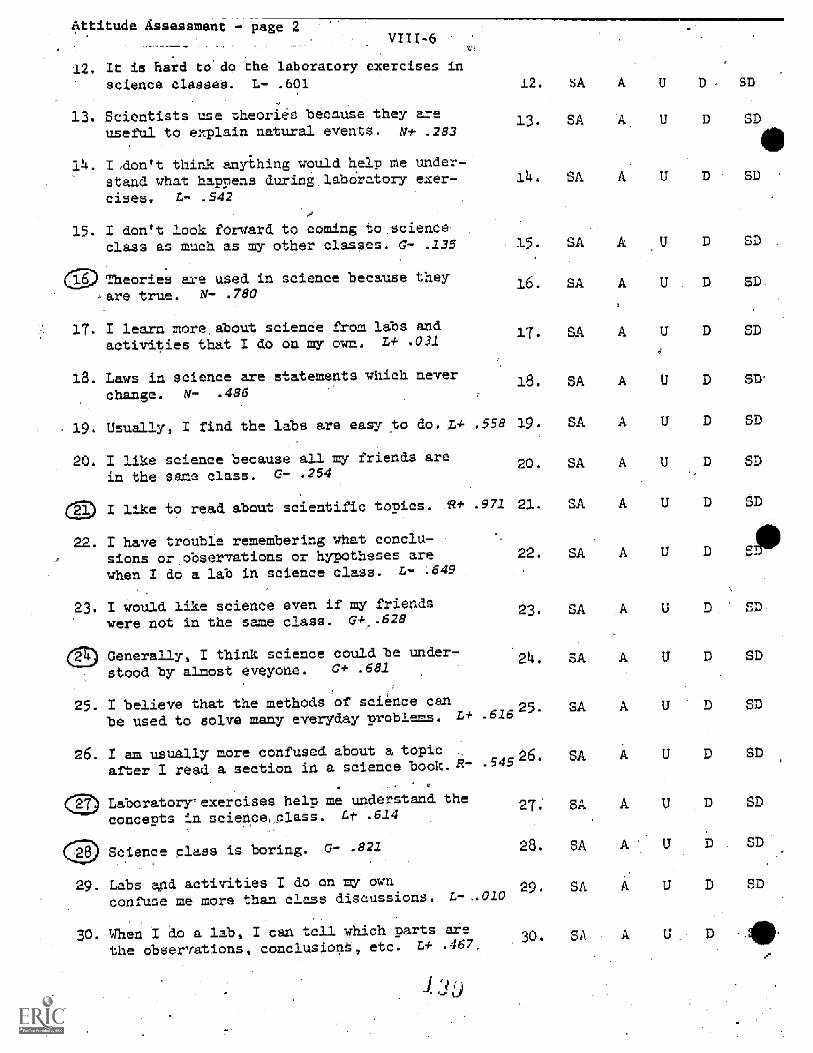
Attitude Assessment - page 2VIII-6
12. It is hard to do the laboratory exercises inscience classes. L- .601 12. SA. A U D - SD
13. Scientists use theories because they are 13. SA A U D SDuseful to explain natural events. NIL .283
14. I ALDn't think anything would help me under-stand what happens during laboratory exerts 14. SA. A U D SD
cises. L- .542
15. I don't look forward to coming to.scienceclass as much as my other classes. G- .135 15 SA A U D SD
conies are used in science because theyare true. N- .780
16. SA A U D SD
17. A U D SD
18. SA A U D SD'
19. Usually, I find the labs are easy to do. L# .558 19. SA A U D SD
20. I like science because all my friends are 20. SA A U D SD
I like to read about scientific topics. Rit .971 21. SA A U D SD
22. SA A
17. I learn more, about science from labs andactivities that I do on my own. L# .032
18. Laws in sciencechange. N- .486
e statements which never
in the same class. G. .254
22. I have trouble remembering what conclu-sions orobservations or hypotheses arewhen I do a lab in science class. L- ;649
23. I would like science even if my friends
were not in the same class. G#.628
Generally, I think science could be under-stood by almost eveyone. 0+ .681
25. I believe that the methods of science canbe used to solve many everyday problems. Li'
26. I am usually more confused about a topic .54526. SAafter I read a section in a science book
Laboratory' exercises help me understand the
concerts in science class. 1+ .61427. SA
23. SA
SA
.61625. SA
Science class is boring. G- .821 28. SA
confuse me more than class discussions. L- ..01029. SA
30. When I do a lab, I can tell which parts
the observations, conclusions, etc. L-1,- .467
29. Labs and activities I do on my own
SA
U D SD
U
U D SD
U D SD
SD
U D SD
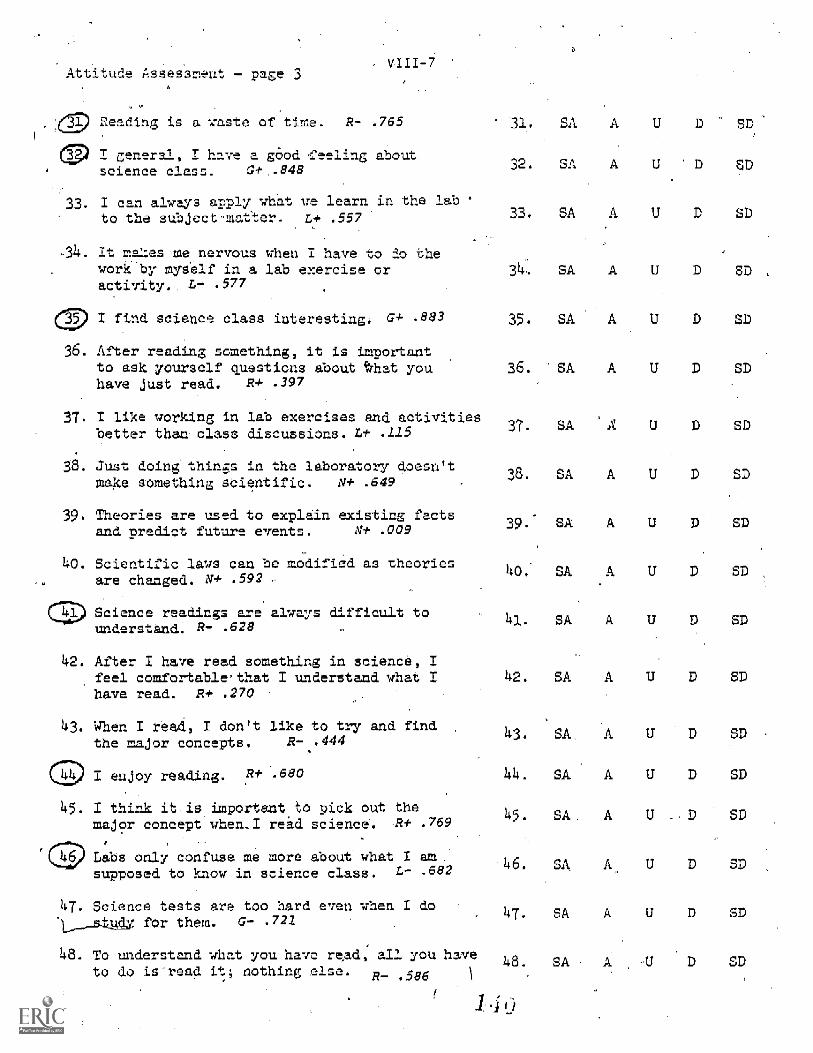
Attitude Assessment - Iaage 3VIII-7
Reading is a- waste of .-765
I general, I have a good . eeiin.g about.science class. 0+,.848
I can always apply what we learn in the labto the subject -matte L+ .557
-34. It maizes-M.enervous when I have to do thework by myself in a lab exercise oractivity., L- .577
I find science class interesting. G+
36. After reading something, it is import _tto ask yourself questions about tVhat youhave just read. R-1- .397
37. I like working in lab exercises and activitiesbetter than class discussions. .215
36. Just doing things in the laboratory domake something adientific. N+ .649
39. Theories are used to explain existing factsand Predict future events. NI, .009
40. Scientific laws can be modified as theoriesare changed. PI+ .592
Science readings are always difficultunderstand. R- .628
42. After I have read something in science,feel comfortable that I understand whathave read. R+ .270
I
43. When I read, I don't like to try findthe major concepts. R- .444
I enjoy reading. R+ .680
45. I think it ,isimportant to pick out themajor concept when,I read science. R+ .769
Labs only confuse me more about what I am.supposed to know in science class. L .682
47. Science tests are too hard even when I dofor them. G- .721
48. To understand what you havn read, all you haveto do is-read it; nothing else. R- .586
A U D SD
SA A
SA A U D SD
34. SA A U D SD
35. SA SD
36. SA A U D SD
T. SA U D SD
SA A U D SD
SA A U U SD
40. SA SD
41. SA A U D SD
42. SA A U D SD
43. SA SD
44. SA A U D SD
45. SA A U SD
46. SA A U D SD
47. SA A U D SD
48. SA A U SD
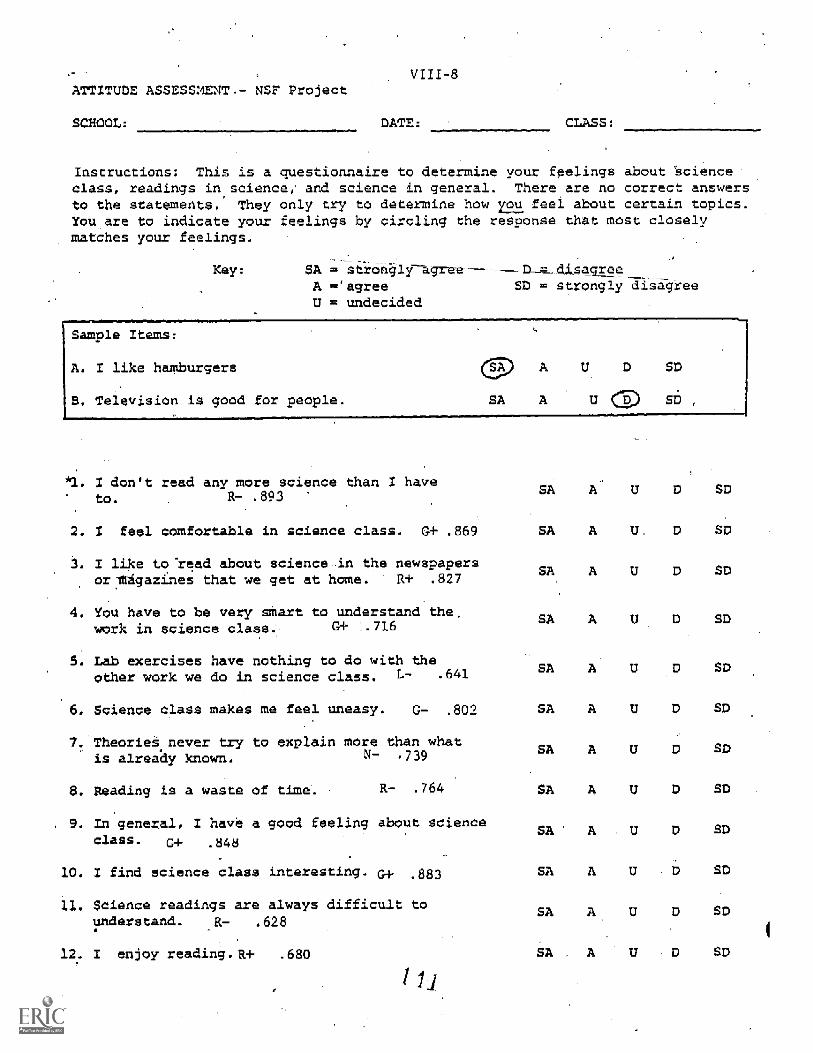
ATTITUDE ASSESS T.- NSF Project
SCHOOL: DATE: CLASS-
Instructions: This is a questionnaire to determine your feelings about scienceclass, readings in science,' and science in general. There are no correct answersto the statements. They only try to determine how you feel about certain topics.You are to indicate your feelings by circling the response that most closelymatches your feelings.
Key: SA = strongly agreer-A ='agreeU undecided
disagrfteSD strongly disagree
Sample Items:
A. I like hamburgers
B. Television is good for people..
*1. 1 don't read any more science than I haveto. R- .893
A
SA A
2. I feel comfortable in science class. G+ .869
I like to-read about science in the newspapersor magazines that we get at home. Ft+ .827
4. You have to be very smart to understand the_work in science class. G+ .716
Lab exercises have nothing to do withother work we do in science class. L- .641
6. Science class makes me feel uneasy. G- .802
7. Theoriet never try to explain more than whatis already known.
S. Reading s a waste of time.
N- .739
R- .764
9. In general, I have a good feeling about scienceclass. .848
10. I find science class interesting. .883
11. Science readings are always difficult tounderstand. R- .628
enjoy reading. R+ .680
D SD
SU
SA D SD
SA A D SD
SA A U SD
SA A SD
SA SD
SA A U D SD
SA A U D SD
SA A U D SD
SA A U D
SA SD
SA SD
SA D SD
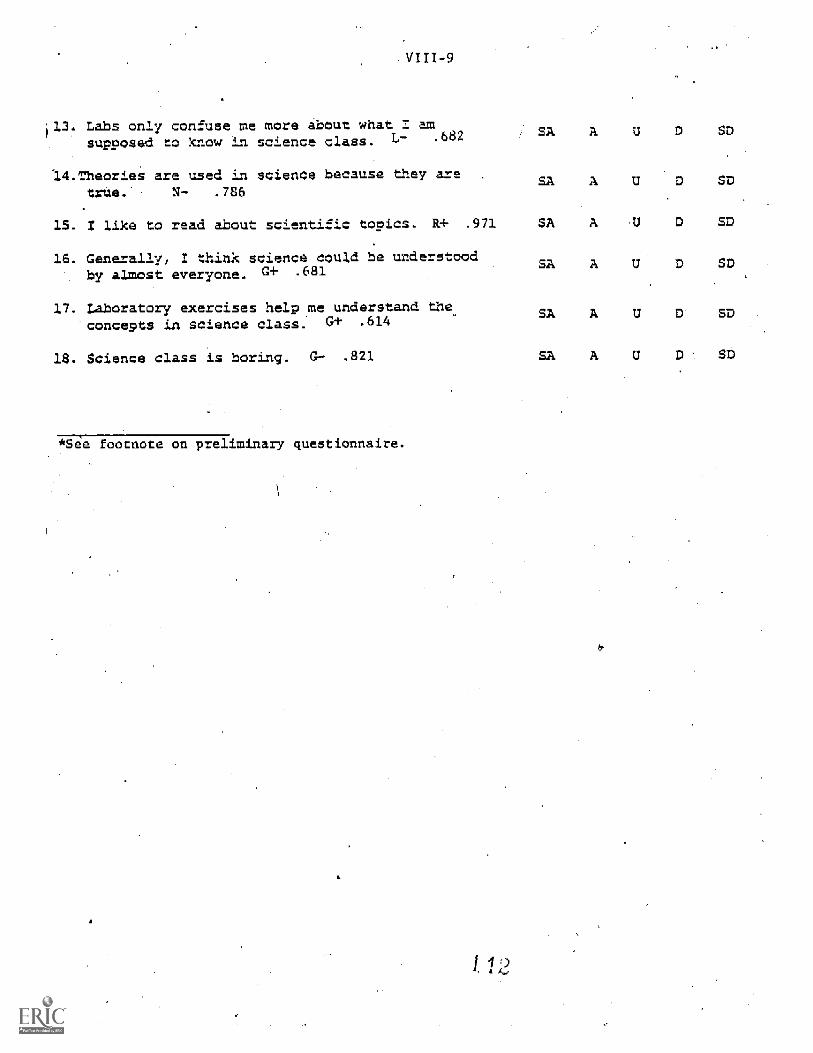
Labs only confuse me more about whasupoosed to know in science class.
14.Theories are usedtrue. N- .786
VI -9
L- 2
science because are
SA A U D SD
A U U SD
15. Z like to read about scientific topics. Rai- .971 SA A U D SD
18. Generally, I think science could be understoodby almost everyone. G .681
17. Laboratory exercises helpconcepts in science class.
e understand theG+ .614
Science class is boring. Ga .821
*See footnote on preliminary questionnaire.
SA A U D SD
SA A U D SD
A U D SD
Resit.
VIII-10
the Attitude Assessments:
Tho final form of the eighteen item attitude assessment was admin-
istered within the first ten days of the schobl year (1979-1980) in each
of the classes with which we were working; four in Trumansburg, the
five seventh grde classes in Vestal, and the four eighth grade classes
in Vestal. Since we were trying to determine if there had been any
change in attitudes relative to the areas that we defined, the first
administration would provide a baseline for subsequent assessments during
the school year. Three assessments (September, December, and March)
were conducted in Trumansburg. Only two assessments (in September
and March for the Vestal seventh grade, and September and April for
the Vestal eighth grade) were administered in Vestal since they were
delayed in.using the strategies.
Questionnaires were completed anonymously, thus only class averages
were computed. Since this instrument did not live up to the expectations
of the project staff, only totals for each entire group, that is, all the
students for each teacher, have been reported below. See Table VIIT.1 on
the next page.
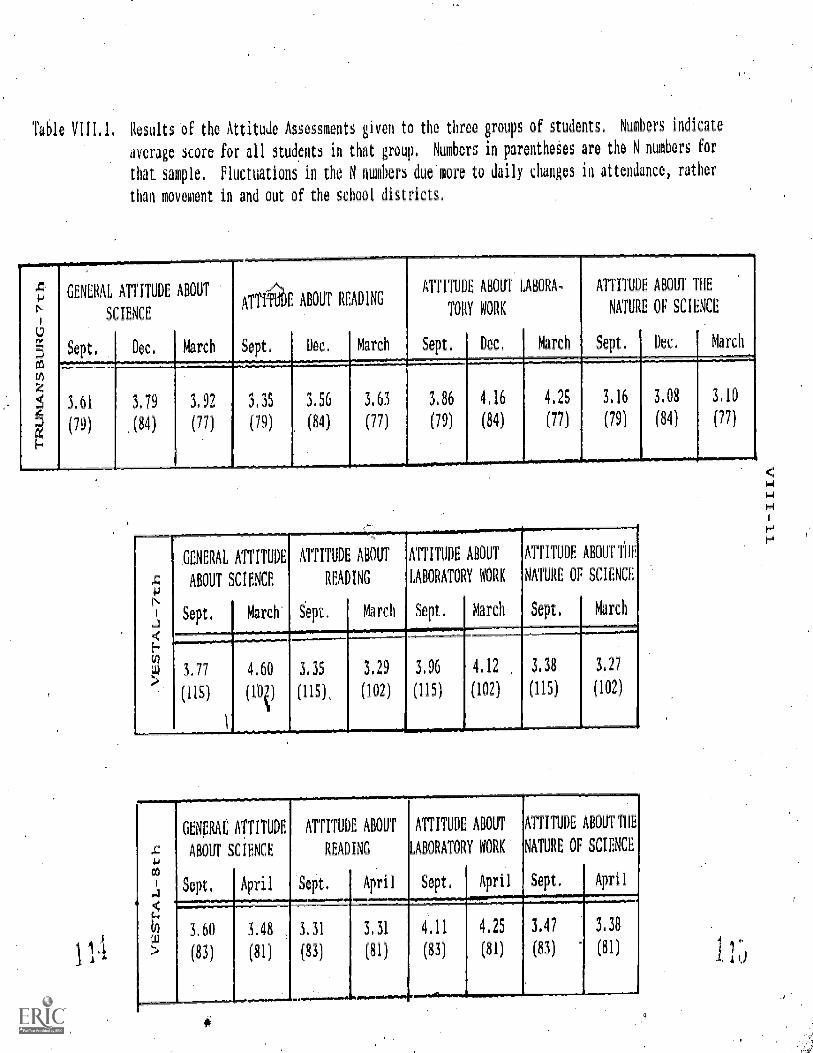
Table VIII.1. Results of the Attitude Assessments given to the three groups of students. Numbers indicate
average score for all students in that group. Numbers in parentheSes are the N numbers for
that sample. Fluctuations in the N numbers due more to daily changes in attendance, rather
than movement in and out of the school districts,
4[--
GENERAL ATTITUDE ABOUT
SCIENCE
.-_"^N
ATTITUDE ABOUT READING
ATTITUDE ABOUT LAHORA-
TORY WORK
ATTITUDE ABOUT THE
NATURE OF SCIENCE
L.,
S6
mSept. Dec. March Sept. Dec. March Sept. Dec. March Sept. Dec. March
_
3.61 3.79 3.92 3,35 3.56 3.63 3.86 4.16 4.25 3.16 3.08 3.10
(79) (84) (77) (79) (84) (77) (79) (84) (77) (79) (84) (77)
A0
GENERAL ATTITUDE
ABOUT SCIENCE
ATTITUDE ABOUT
READING
ATTITUDE ABOUT
LABORATORY WORK
ATTITUDE ABOUTTIIT
NATURE OP SCIENCE
Sept. March Sept. March Sept. March Sept, March
th
3,77 4.60 3.35 29 36 4.12 3.38 3.27
(115) (10i) 115), (102) (115) (102) (115) (102)
E-U)w
GENERAL ATTITUDE
ABOUT SCIENCE
ATTITUDE ABOUT
READING
ATTITUDE ABOUT
LABORATORY WORK
ATTITUDE ABOUT THE
NATURE OF SCIENCE
Sept, April Sept. April Sept. April Sept. April
3.60 3.48 3.31 3.31 4.11 4.25 3.47
(83) (81) (83) 1 (83) (81) (83) (81)
_
J 1,
VIII-12
Analysis of Results:
Although some of the classes and groups showed statistically
significant positive changes in attitudes in most of the categories,
no definite pat-ern or trend developed as a result of the introduction
f these strategies. Several reasons that could affect the validity
of this type of instrument should be discussed. While the students
showed some gains in attitudes, that does not preclude the influence
of other factors such as teacher personality, difficulty of the subjept
matter, or students' liking laboratory work (notice°the generally higher,
scores for attitude about laboratory work in each of the 'groups).
It is encouraging, however, to see that all the groups are generally
positive about their schooling (anything above a suggests "agreement"
frith the statements and categories). But, again, other factors can
influence that attitude level.
Formative Information on Attitudes:
During the course of clinical interviews and the more informal
interviews with the students of the proje.ct, impressions and feelings
weresolicited regarding the value of concept mapping and the "V"
strategies In addition, their attitude assessment questionnaires
provided space fontstudents to react to the class, the project, or
the questionnaire itself. Representative comments from the students
from all these sources are reported below. If a question.was asked,
shown in caps. Though many of the questi6ns and answers deal wifh
cognitive elements, attitudes and feelings a- also expressed in the
Students' remarks.
VIII-13:
Sometimes the "V" makes it easier to understand the labs we do in class.At first, I didn't enjoy them, but I do now because they help me to under-
stand the labs.
Generally, the?"V's"
help me understand what I'm doing better -- but at
times they get me more Confused. I get most confused on records and
transformations.... Concepts are pretty easy most of the time, butsometimes they're extremely difficult (tool.
IS THE "V" ANY GOOD?
Yeah, it gives you an answer to your question. It gives you a detailedanswer to what you want to know in a simpler form.
HOW IS IT DIFFERENT,TH6UGH, FROM A LAB WHERE YOU DON'T USE THE "V"?
Well, the lab where you don't use the "V" -- I don't know. I just'have
trouble rememberingthe basic thing in the investigation -- what the
investigation is all about.
The staff collected-many more comments about concept, mapping than
the "V" strategy. This is, of course, due to the fact that concept
mapping was assessed in part with clinical interview on a one to one
basis as indicated in the previous section on concept mapping (Section
V of this report).
IS CONCEPT MAPPING ANY GOOD?
Yeah... if you save those (concept maps), it's alot easier to review_
instead of reading all those chapters over again. And it takes longer
than just reading, but it's worth it if you want to review for a test
or something.
HOW DO YOU FEEL ABOUT CONCEPT MAPPING?
At first, it was confusing. We didn't know what to do, but then it got
easier and you could do it faster... [it got easier] after we did a
couple of them.
ARE THEY [CONCEPT APS] ANY GOOD FOR YOU?
Yeah, they help me alot.
WHEN DO THEY HELP YOU OUT?
Well, most of the time, when I read, I can read fast, but it's fun
when I go through it. It [concept mapping] gives me awhile to understand
what's going on in my reading. But concept maps help you, so you know
what-you- read, end you understand what you read.
VIII-14
asked students to compare the strategy Of concepe mapping to.
conventional note- taking. Although reactions were mixed, we did find
students thought concept mapping to be of value.
WHAT DO YOU THINK ABOUT PUTTING STUFF IN [CONCEPT] MAP FORM?
[It] helps me understand things-better.
It helps me understand things more than a bunch of notes and stuffall scrambled together.
MEAN THE NOTES YOU TAKE IN CLASS?
Yeah, 'cause you can put them right in order and then just sepa te
them from what you're doing.
,If you study for a test, you got all the right notes. All you gotta
read is,a word, a word right there.
IF YOU HAD A CHOICE BETWEEN NOTE-TAKING AND CONCEPT MAPPING, WHICH WOULDYOU USE?
Note-taking.
YOU LIKE THAT BETTER?
Well, it's easier for me to do.
TO MAKE A CONCEPT MAP IS HARD;
Sometimes, yeah ... to figure our what things branch off from others.
COULD YOU USE OUTLINING [NOTE-TAKING] THE SAME WAY YOU USE CONCEPT
MAPPING?
It would be easier to do the outline, but with a concept maptogether better. It makes a little. more sense.
WHAT DO YOU MEAN "IT MATCHES TOGETHER "?
Well, like you can tell of the different parts of the topic.
WHAT DO THE REST OF YOU THINK.
I think outlining is easier. You're not dealing with as much stuff.
You're not, like, drawing lines, [putting] lines on this side and
that side. .You're just putting them down under'certain categories
like A,.&;' and C. Stuff like that.
atches
IX, STATISTICS AND ANALYSIS
Although the preceding chapterS provided the major overview of the
introduction of the concept,mappieg and the "V" strategies in the classroom,
and, some. preliminary analysis, this'chapter 11 report a more comprehensive
statistical analysis of all the data. To character`ze the populations of
students with whom the project worked, scores from standa:Mized achievement
tests for each group of students are reported. These will then be followed
by an examination of the change of concept mapping scores over time. Further,
concept mapping performances will be related to the standardized scores
reported.
Since the "V" for laboratory exercises was only done with the seventh
grade. students. Trumansburg, there can be no comparison between that group
of students and the instructed seventh gran. in Vestal. The scores
for the laboratory exercises written on the "V" will be related to the
standardized scores for Trumansburg. One comparative study between the
Trumansburg group and the Vestal eighth grade group can be reported. Each
of these was evaluated on their performance to identify, define, and pick
out examples of parts of the "V".
The most comprehensive evaluation involved both instructed and unin-
structed st4dents and dealt with conceptual question's. Both the "winebottle"
and electricity- examples will be discussed in detail.
In addition to ,the evaluation strategies employed by the project
staff, we also examined the mean scores on classwork and final examinations
for the three groups.
The final aspect of the analysis reports correlations among thirteen
variables.
Standardized Tests to Characterize the Student Populations:
The three groups of students with whom we worked during the
1979-1980 school year had been administered some sort of standardized
test to assess progress-in the school program and to offer diagnostic
information regarding programs and placement during subsequent years.
The Scholastic Aptitude Test, (SAT) was administered to the students in
Trumansburg at the middle of their sixth grade (January, 1979). Similarly,
the SAT examination was administered to the (then) sixth grade of Vestal
during the :onth of:Japuary, 1978. These, were the eighth grade students,-
,of our stud . A School and College Ability Test (SCAT) was administered
to the Vestal, seventh grade in January, 1979.
Since.there exists a differencefn-time between,administration of
a standardized test and the participation in this project, some of the
information given below must be read relative to the time the students
were examined. The project had no control over what examinations were
,given, or when they were administered. We 'had to rely on only the infor-
mation that-the schools were kind enough=to provide to us.
Table IX.1 on the next page reports the mean averages for the SAT
and SCAT scores for the three samples of our study. Table 1X.2 reports
the analysis of these scores into quartiles for each samp
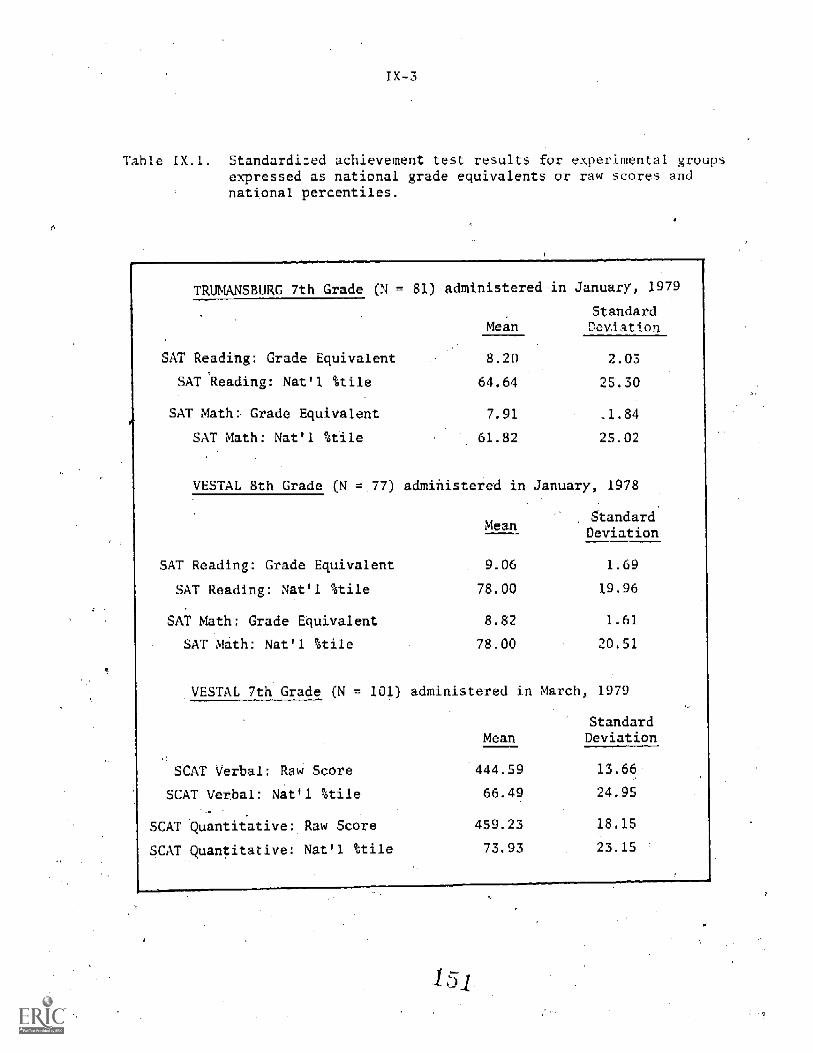
IX -3
Table Standardized achievement test results for experimental groupsexpressed as national grade equivalents or raw scores andnational percentiles.
TR. (SBURG 7th Grade (N = 81) administered-in January, 1979
MeanStandardDeviation
SAT Reading: Grade Equivalent 8.20 2.03
SAT 'Reading: Nat'l %tile 64.64 25.30
SAT Math: Grade Equivalent 7.91 _1.84
SAT Math: Nat'l %tile 61.82 25.02
VESTAL 8th Grade (N = 77) administered in January, 1978-
MeanStandardDeviation
SAT Reading: Grade Equivalent 9.06 1.69
SAT Reading: Nat'l %tile 78.00 19.96
SAT Math: Grade Equivalent 8.82 1.61
SAT Math: Nat'l %tile 78.00 20.51
VESTAL 7th Grade (N = administered in March, 1979
MeanStandardDeviation
SCAT Verbal: Raw Score 444.59 13.66
SCAT Verbal: Nat'l %tile 66.49 24.95".=
SCAT Quantitative: Raw Score 459.23 18.15
SCAT Quantitative: Nat'l %tile 73.93 23.15
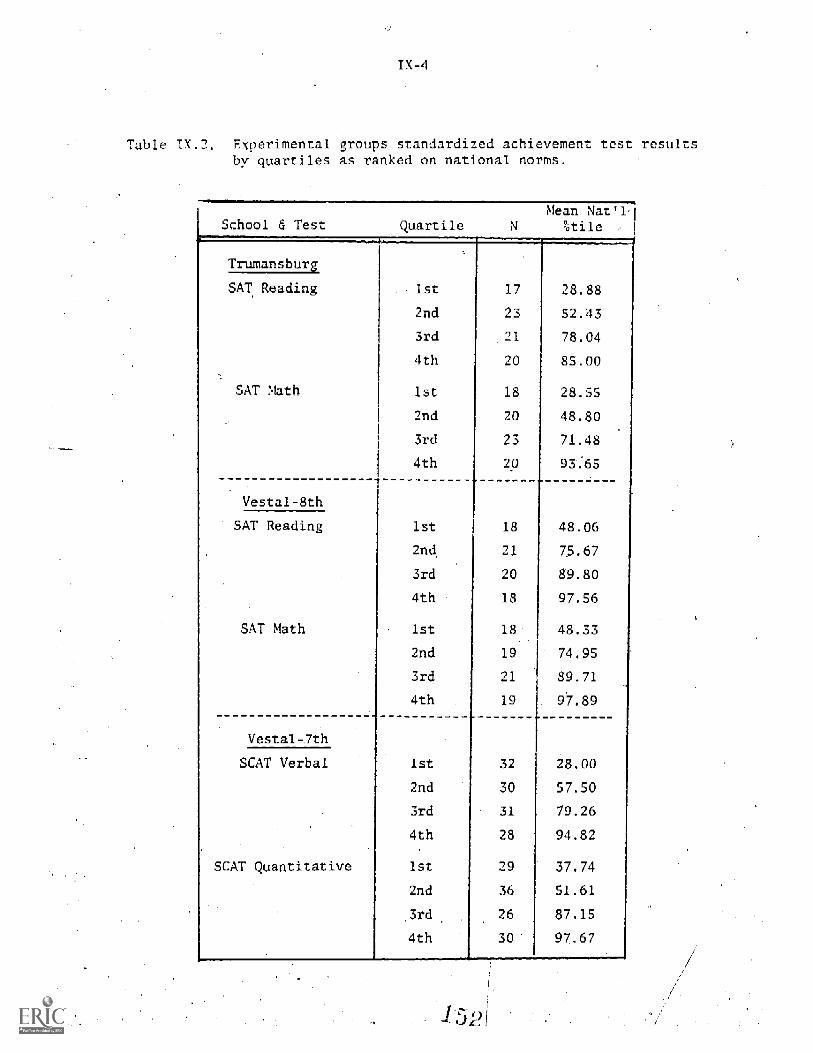
IX -4
Table 1X.2. Experimental groups standardized achievement test resultsby quartiles as ranked on national norms.
mean Nat 1School & Test Quartile %tile
Trumansburg
SAT Reading 1st 17 28.88
2nd 23 52.43
3rd 21 78.04
4th 20 85.00
SAT lath 1st 18 28.55
2nd 20 48.80
3rd 23 71.48
4th 20 93.65
Vestal-8th
SAT Reading 1st 18 48.06
2nd 21 75.67
3rd 20 89.80
4th 18 97.56
SAT Math 1st 18 48.33
2nd 19 74.95
3rd 21 89.71
4th 19 97.89
Vestal-7th
SCAT Verbal 1st 32 28.00
2nd 30 57.50
3rd 31 79.26
4th 28 94.82
SCAT Quantitative 1st 29 37.74
2nd 36 51.61
3rd 26 87.15
4th 30 97.67
IX-5
Examination of these two preceding tables show that the samples of
students in the project demonstrated higher mean scores than the national
norms. This can be expected, since the two school districts of the study
were either rural suburban and comprise populations with average or above
average secio-economic status. However, as the data are analyzed in
the following pages, it will be shown that students who measure compara-
tively low on standardized tests can perform adequately on the concept
mapping and "V" strategies.
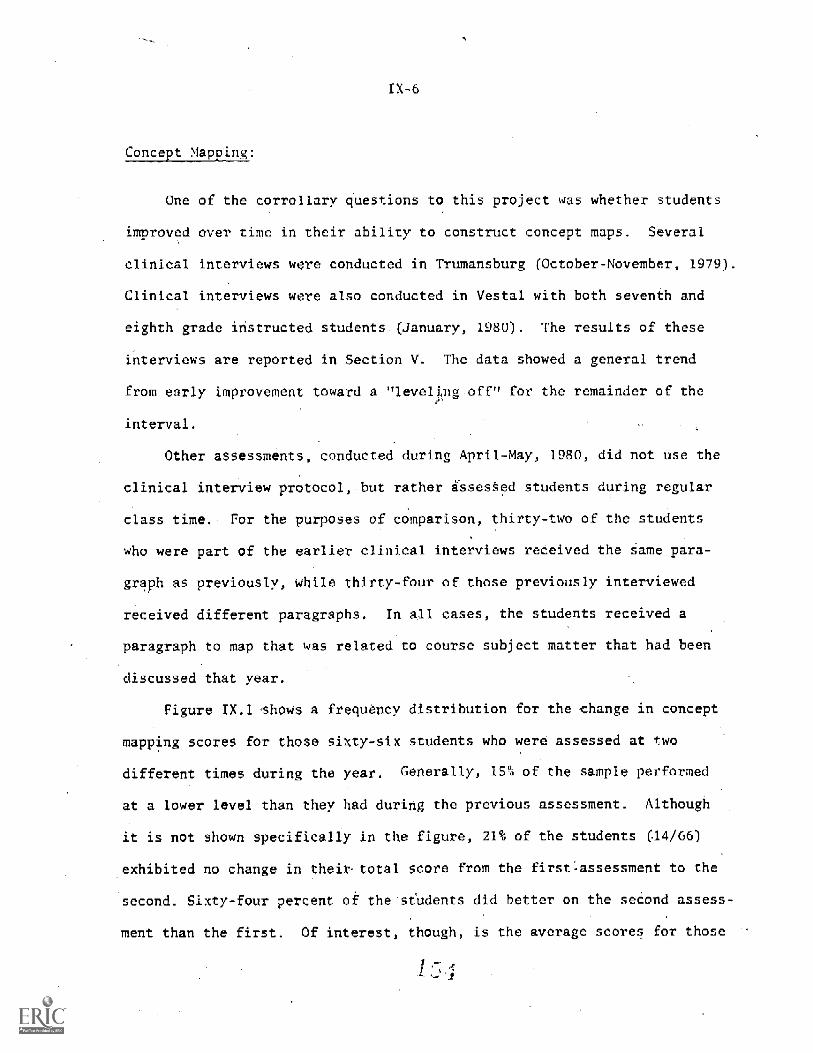
1X-6
Concept_ Mapping)
One of the corroilary questions to this project was whether students
improved over time in their ability to construct concept maps. Several
clinical interviews were conducted in Trumansburg (October-November, 1979).
Clinical interviews were also conducted in Vestal with both seventh and
eighth grade instructed students (January, 1980). The results of these
interviews are reported in Section V. The data showed a general trend
from early improvement toward a "leveling off" for the remainder of the
interval.
Other assessments, conducted during April-May, 1980, did not use the
clinical interview protocol, but rather assessed students during regular
class time. For the purposes of comparison, thirty-two of the students
who were part of the earlier clinical interviews received the same para-
graph as previously, while thirty-four of those previously interviewed
received different paragraphs. In all cases, the students received a
paragraph to map that was related to course subject matter that had been
discussed that year.
Figure IX.1 shows a frequency distribution for the change in concept
mapping scores for those sixty-six students who were assessed at two
different times during the year. Generally, 15% of the sample performed
at a lower level than they had during the previous assessment. Although
it is not shown specifically in the figure, 21% of the students (14/66)
exhibited no change in their total score from the first.assessment to the
second. Sixty-four percent of the students did better on the second assess-
ment than the first. Of interest, though, is the average scores for those
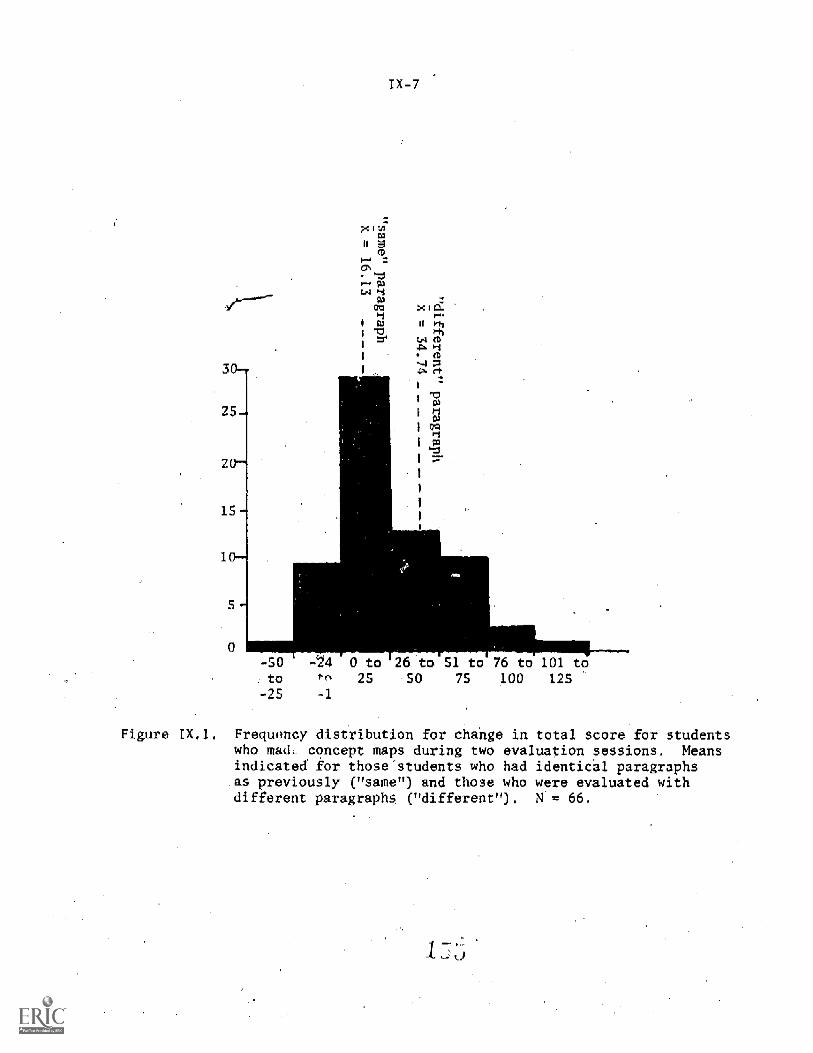
xiogCD
'VIvw4Iry X
I W II t-ry
Cd4 CD
CD
(4.
-50 -24 0 to 26 to 51 to 76 to 101 toto 25 50 75 100 125
-25
Figure IX.1. Frequency distribution for change in total score for students.who math. r.concept maps during two evaluation sessions. Meansindicated for those students who had identical paragraphsas previously ("same") and those who were evaluated withdifferent paragraphs ("different"), N = 66.
TX-8
students who hdd the same paragraph and those who did not. As indicated
in the figure, the mean score gain for those students who had the same
paragraph was while it was double that (34.74) f- those students
who did not have the same paragraph, suggesting either that the second
paragraph was easier to map or that students showed more motivation in,
this " "new "" paragraph.
From this eta, it can be suggested that the majority of students
improve in their ability to make concept. maps over a four month period.
Although we could not conduct further assessments, it seems reasonable
to assume that students, after a time, will begin to " "level off "" in
performance, as was the case in Trumansbu g where students had more
experience in concept mapping over a longer period of time. A factor
that might have also affected these results was that the first assessment
was in a clinical interviewing setting and the second in the classroom.
Admittedly, students are nervous during the clinical interviews, no
matter how comfortable the interviewer attempts to make them feel, and
thiS could account for the lower scores on the first assessment.
Another question that may be important to the implementation of
concept mapping is the performancefor each quartile of students as
measured on standardized achievement tests. Table IX.3 illustrates the
results of the seventh grade Vestal students-for percentage total of
.baseline map scores against the four quartiles for those students as
measured on the SCAT. Figures IX.2 and 3 .shown the general trend for studerts
in the highest quartiles to show higher performance-on the concept mapping
task. Nonetheless, there are clear indications that students in all
quartiles can -acquire and perform adequately on this strategy, -Thirty-one
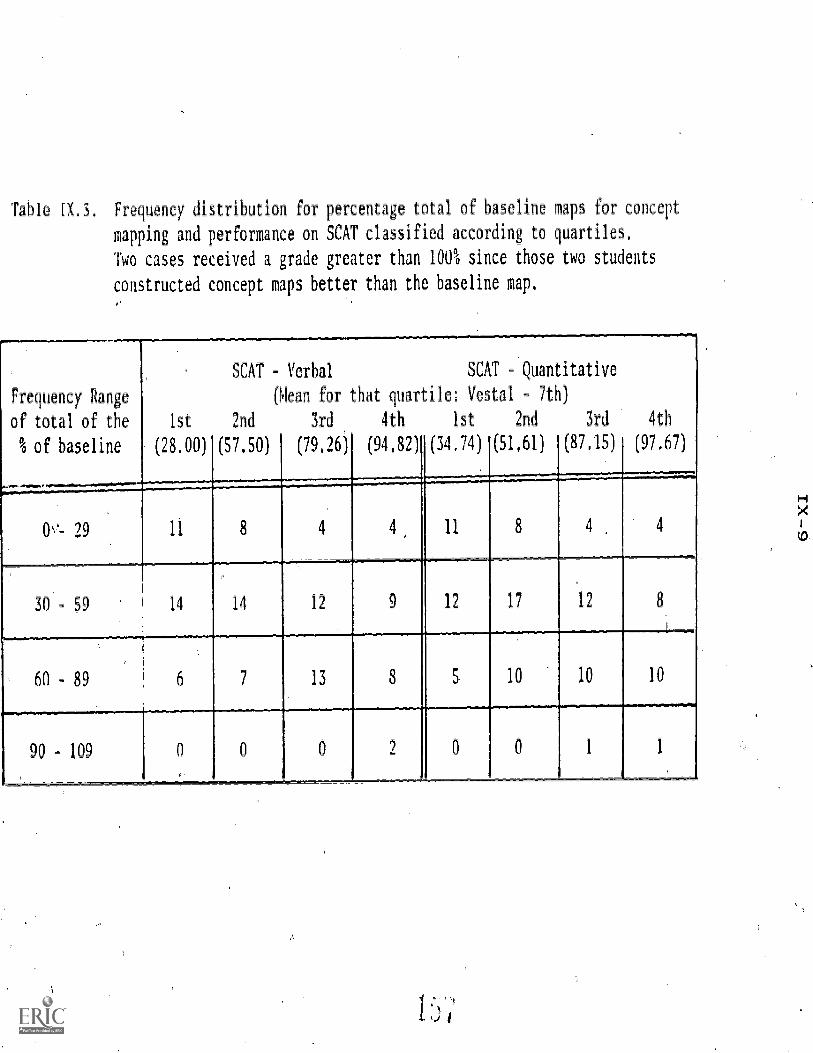
Table 1X.3. Frequency distribution for percentage total of baseline maps for concept
mapping and performance on SCAT classified according to quartiles.
Two cases received a grade greater than 100% since those two students
constructed concept maps better than the baseline map.
Frequency Range
of total of the
% of baseline
30-59
60-89
90 - 109
SCAT Verbal SCAT - Quantitative
(Mean for that quartile: Vestal - 7th)
1st 2nd 3rd 4th 1st 2nd 3rd 4th
(28.00) (57.50) (79,26) (94.82) (34,74) (51,61) (87,15) (97,67)
11 4 4 11 8 4 4
17 1214 14 12 12
6 7 13 3 5 10 10 10
0 00
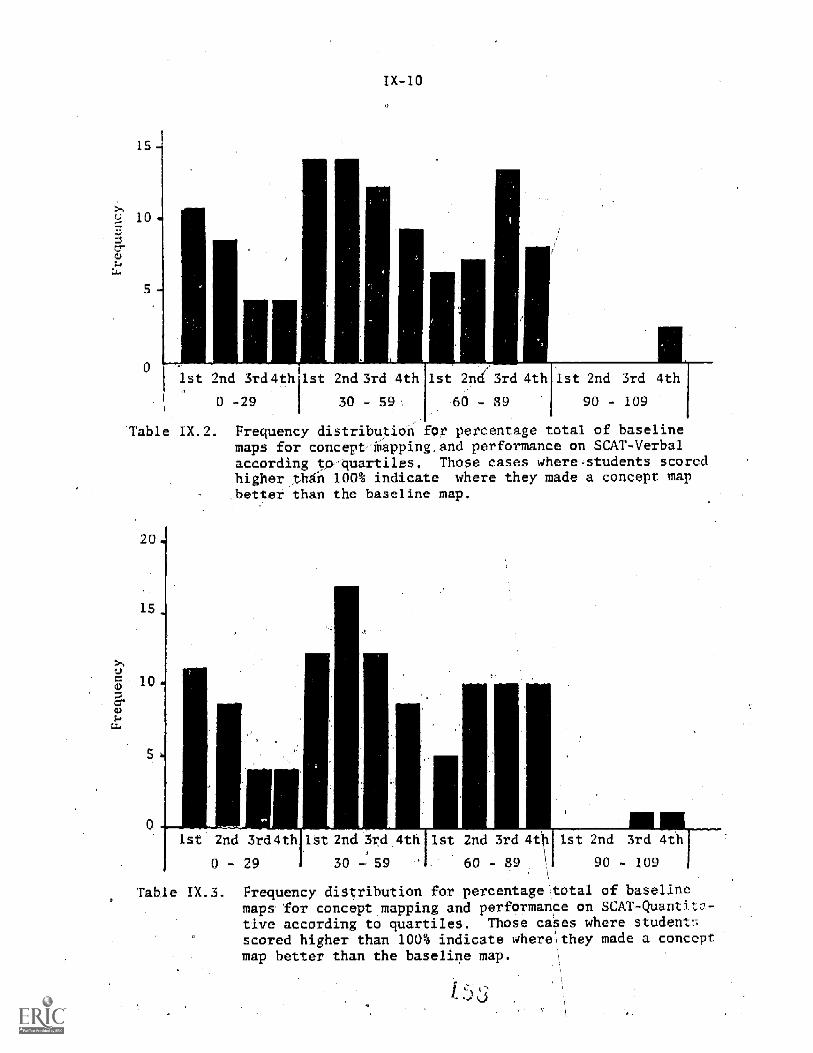
1X-10
Table
20
15
0
2nd 3rd4th 1st 2nd 3rd 4th 1st 2nd 3rd 4th 1st 2nd 3rd 4th
0-29 30 - 59 -60 - 89 90 - 109
1X.2. Frequency distribution for percentage total of baselinemaps for concept mapping. and performance on SCAT-Verbalaccording to `quartiles, Those cases wherestudents scoredhigher than 100% indicate where they made a concept map.better than the baseline map.
1st 2nd 3rd4th
0 - 29
1St 2nd .31.4 4th 1st 2nd 3rd 4
30 - 59 60 -89
1st 2nd 3rd 4th
90 - 109
Table IX.3. Frequency distribution for percentage, tot al of baselinemaps for concept mapping and performance on SCAT-Quantita-tive according to quartiles. Those cases where studentnscored higher than 100% indicate where they made a conceptmap better than the baseline map.
IX-11
percent of the students in the first quartile for SCAT-Verbal and 2S%
f SCAT- antitative first quartile have scores greater than 5W-, of the
baseline score. Again, it is believed that if students have been given
sufficient instruction in the criteria for making concept maps, the
general scores for these percentages would have been greater, further,
if the amount of time on task had been increased from its low rate
(S-15%) to a significantly higher percentage of time, students would
have increased in their proficiency with a tendency toward mastery learn-
ing.
It should be noted that significant numbers of students in the top
quartile on SAT tests were among the low scoring group on concept mapping
performance. In part, this was due to their lack of effort and/or mis-
understanding but at-least some of the lower performance could indicate
a lack of ability to perform the type of evaluation tasks demanded in
concept mapping. There is increasing evidence that students who perform
high on standardized achievement tests or objective classroom tests do
not necessarily understand the material they have studied. Concept mapping
may prove to be a more valid indicator of meaningful learning than commonly
used evaluation methods.
The Knowledge "V":
mentioned earlier, the "V" strategy was introduced too late in
the Vestal school to accumulate any records of students' pe_rfil+rxnances
on using the "V" for laboratory exercises. This, of course, caused a
loss of an important aspect of comparison between the Trurnansburg group
who had been using the strategy since the beginning of the school year
and the Vestal groups.-
What can be assessed, however. from the Trumansburg students was
how well they performed on laboratory exercises using the "V" over time
in comparison to their standardized sCores; this has already been
reported in Section VI. Examination of those data indicates that students
do appear to improve in their ability to use the strategy of the knowledge
v over,the course of a school year. The initial low scores in lab exercises
and (exercise #1 had a small sample number, and will be disregarded
in the analysis), might have been'due to the relative difficulty of the
exercises. But after several weeks, the. students did begin to perform
adequately on the subsequent exercis t is realized that fib compare
these laboratoryexercises together is inviting a criticism of invalidity
since we must assume that all the exercises be considered of equal. diffidUlty
and comparable
as other factors.
terms of time spent on each exercise in class, as well
There is another consideration that should be discussed concerning
the scores of students using the "V"-. The "ideal" s orefor each laboratory
exercise was eighteen, and most of the exercises written on the "V" clustered
around the range of twelve to sixteen 'indicating a percentage range from
68"'o
IX-13
The reason for these comparat ive low scores* may have
been due to the lack of effort on the project staff and the teacher to make
the criteria for assessing the "V's" explicit to the students, If the
students had been made aware of the range of sccring for each criterion,
and had been provided with clear cases of each marking, it is believed
tnat the average score would have been higher, Another factor is that
clear emphasis on theories and principles is generally lacking in junior
high school science programs, resulting in a "ceiling" of about sixteen
points. Thus, we might conclude that most students reached as high a
level for the "V" strategy as could be erected, given the circumstances
under which it was introduced and used.
For the purposes of comparing performances on using the "V" for
laboratory exercises against standardized scores, Tables IX.4 and S
are given below. Table IX.4 represents the quartile breakdown for all
the laboratory exercises completed on the rV" (N=446) during 1979-1980.
One-hundred and eleven laboratory exercises were completed by students
classified in,the first quartile for SAT Reading, Of those students,
44% scored in the high range (13-18), 44% scored in the middle range
(7 -12), and only.12% scored in the low range (0-_). For the SAT Math,
the percentages are not that different. For the one - hundred and fifteen
laboratory exercises completed on the "V" from students classified in
the first quartile of SAT Math, 51% scored in the hIgh range, 39% scored
the middle range, and only 10% scored in the loW range, Table IX.S
illbstrates the mean for all students who completed laboratory exercises
*Teachers often use scores around-901, to indicate mastery. Considering.
the limitations of the science curriculum, however, an 80% mastery criterion
might be high.
I
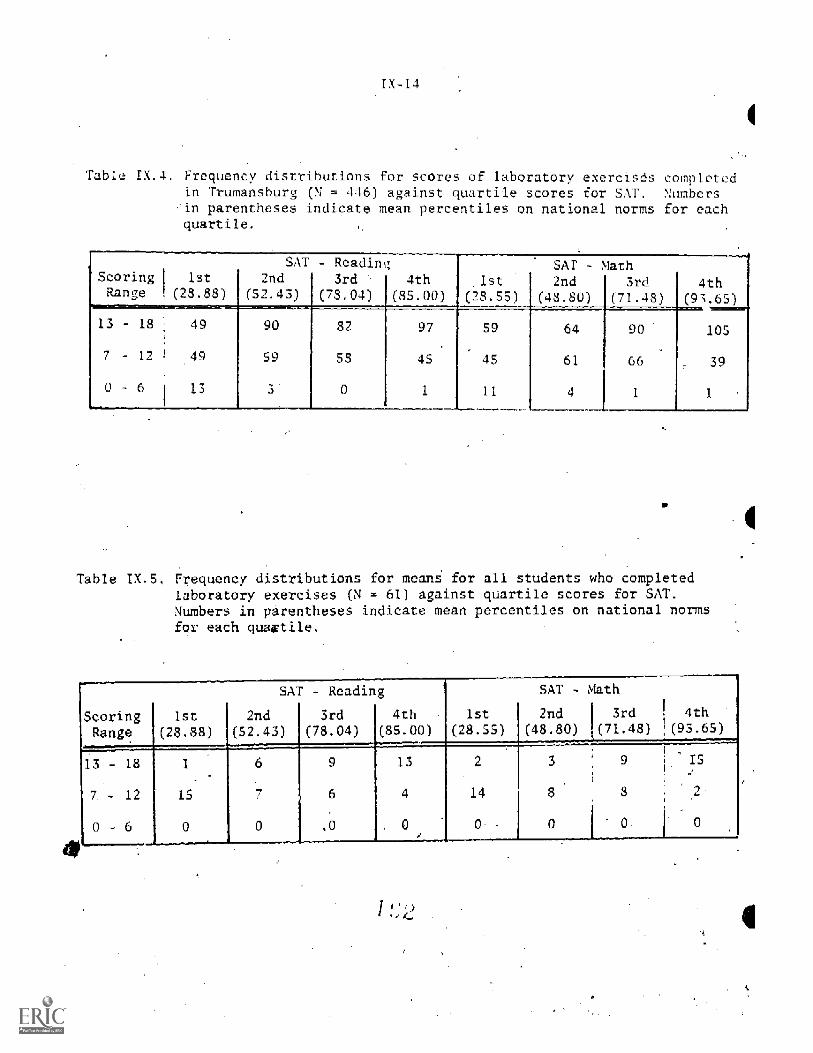
Table
Iy
Frequency distributions for scores of laboratory exercises completedin Trumansburg (N = 446) against quartile scores for SAT. Numbersin parentheses indicate mean percentiles on national norms for eachquartile.
'Scoring I 1st
AT2nd
- Readir;3rd 4th 1st
sAr -2nd
Math3rd 4th
Range , (28.33) (52.43) 3.04) (85.00) 28.55 48,30 71.48 (97,.65)
- l8 49 90 82 97 59 64 90 105
- 12 1 49 59 58 45 45 61 66 39
0 - 6 1 13 3 0 1 11 4 1
Tab Frequency distributions for means for all students who completedlaboratory exercises (N = 61) against quartile scores for SAT.Numbers in parentheses indicate mean percentiles on national normsfor each quartile.
SAT Reading SAT - Math
Scoring is 2nd 3rd 4th 1st 2nd 1 3rd 4th
Range 28.88 52.43 (78.04) 85.00) (28.55) (48.80) (71.48) 93.65)
9 t5- 1 1 2
- 12 15 6 4 14
0 0 .o 0 0 0
IX-15
using the "V". While 76% of the students classified in the fourth guartlle
for SAT Reading averaged in the higi range, 94 of those students classified
in the first quartile for T Reading were able to achieve an average within
the middle range. No students, from any of the four quartile for each
the parts of the SAT, averaged within the low (0-0) range,
The data from both these tables support the conchipioi; that udents
in all ability quartiles, as measured by SAT tests, can perform sa fac-
tor ly (7-12) or well (13-18) on "V" mapping. When we take into account
that a few students in the Trumansburg classes were doing next to nothing
in any of their science work (our strategies notwithstanding), the data
are indeed encouraging. This claim receives additional validity from the.
fact that some students in the top quartile perform poorly, suggesting that
the usual measures-of'ability do not necessari%
rnapp g-
indicate facility in
One opportunity did present itself to seek a comparison between two
instructed groups relative to the use of the "V". Both Trumansburg and
the eighth grade Vestal group were assessed to determine if the students
could identify, define, and give examples of terms of_the "V". Preliminary
data, o 'both these groups, are reported in Section VI..
As mentioned earlier, Trumansburg was assessed twice, once in October
and again in April (week 26). Because of the very different nature between
the first and second Trumansburg assessments, the results of the second
administration a-Nonly reported. Further, the question of whether the
the first assessment had any effect on the performance of second
assessment seems at least very minimal since the two instruments were very
different in structure and content. Vestal had the revised instrument
-administered in May (week
The instrument was corn
asked
proper po
6
of three guest_ Question #1
dent to place each of the nine terns of the 'V' in their
ions. Question R2 asked the student to define. in their own
words, each of the nine terms. Question #3 asked the student to pick out
examples of each Of the terms given in a laboratory exercise that was
completed in class during the school year. Since the Vestal eighth
grade and Trumansburg seventh grade were covering different material, we
ecessarily administered different com ieted laboratory exercises for
this third question. (The entire instrument with the two laboratory
_ exercises are illustrated on pages V-I0 and in-Appendix Both
groups of students, then, had identical Questions #1 and #2, but a different
Questions
Tables 1X.6 and 1X.7 report the t -tests comparing the performance for
the Vestal eighth grade and the Trumansburg seventh grade on the first
two questions on this task. The statistically significant difference
between the Trumansburg and Vestal groups seems to indicate that students
perform better on this type of evaluation the longer the exposure to the
strategy. Trumansburg had begun using the strategy at the beginni
the school year; there was a three month delay in its- implementation
in the Vestal eighth grade. While. we realize that there is a problem of
validity of comparing both groups on their performance in Question #3,
-Table 11(.8 shows no statistically ificant difference between the two.
While any claims that attempt to explain this result must necessarily be'
very cautious, it does seem to suggest that, even- after limited exposure.
to, the "V" strategy, students are able to idea ty parts of an'inquiry
I
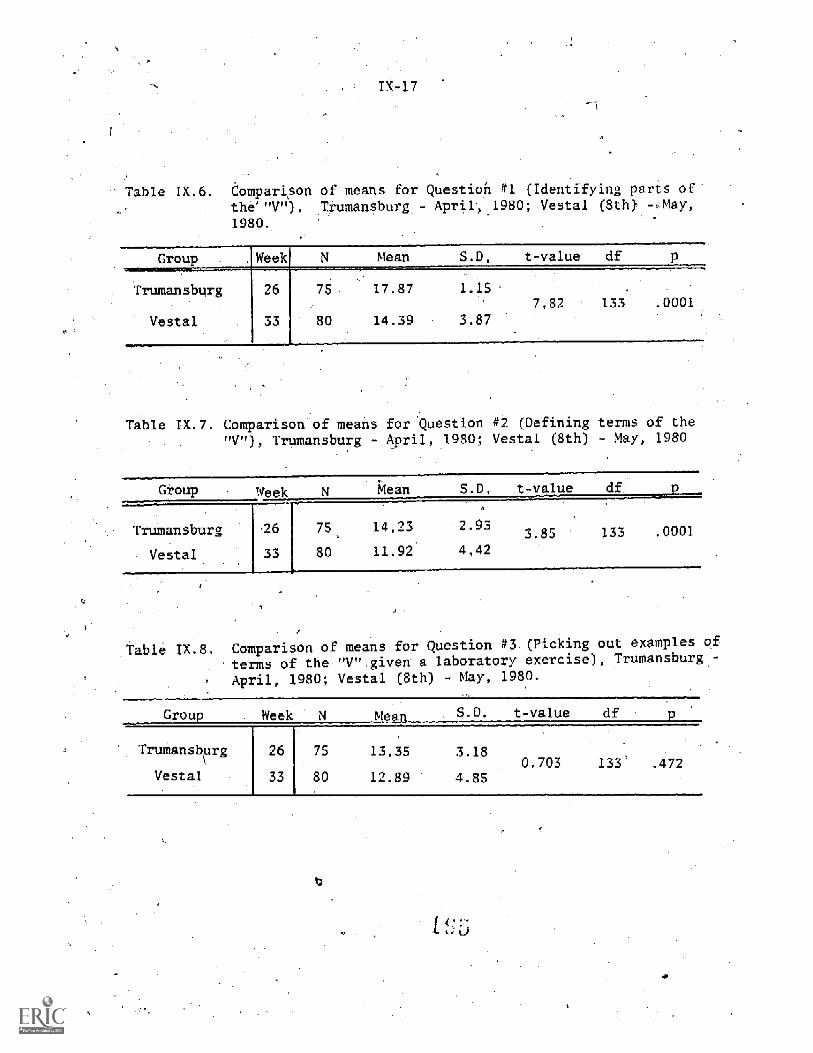
-17
Table 1X.6, Comparison of means for Question #1 (Identifying parts of
the""V"), Trumansburg - April, 1980; Vestal (8th), -,May,
1980.
Group Week Mean S._ -value df
Trumansburg
Vestal
26 75 17.87 1.15
80 14.39 3.87
7.82 133 .0001
Table 1X.7. Comparison of means for Question #2 (Defining terms of the"V"), Trumansburg April, 1980; Vestal (8th) - May, 1980
Group Week Mean S.D. t-value
Trumansburg .76 75 14,23 2.933.85 .0001
Vestal 80 11.92 4.42
Table 1X.8. Comparison of means for Question #3,(Picking out examples of
terms of the "V" given a laboratory exercise), Trumansburg
April, 1980; Vestal (8th) - May, 1980.
Grou
TrumansburgN
Vestal
Week
26
33
75 13,35
80 12.89
S.D. t-value
3.180.703
4.85
df
.472
IX -l8
according to "V" terms if they are familiar with the subject content.
While not reported in table form, a breakdown by individual terms
of the "V" (e.g., "theory, records," etc.) showed that the Trumansburg
group scored signficantly highe for "objects," "records," "events,"
"transformations," "knowledge claims," and "focus question." Vestal, on
the other hand, was significantly higher than-Ttumansburg for the one
term of "theory." This may reflect the stress placed on scientific theories
in that particular science program, and the generally greater emphasis on
theoretical models in junior high physical ,sciende curriculums. The
theoretical structure of the biological sciences was not stressed in the
Trumansburg classroom. This was due in part .to the descriptive nature
f junior high school biology programs that stress descriptions of plant
',and animal structures, and minimize discussion of broad explanatory
theories or principles
Considering that the Trumansburg seventh grade sample averaged at
the 65th percentile on national norms and the Vestal eighth grade group
averaged at the 78th percentile, we have further evidence that the "V"
mapping'strategy can be acquired by seventh grade students as well as
eighth grade students. In fact, both groups seemed so successful at this
kind of task, and the "V" in general, that there seems to be no reason
why the "V" mapping strategy cannot bedome part of those grade levels.
19
Conceptual Questions:"Winebottle" Example:
As mentioned earlier, the conceptual. questions provided our be_.
means of comparing instructed and uninstructed groups of students rela-
tive to their use of the strategies. The major theoretical issues and
the problems that had to be overcome are discussed in detail in Section
VII of 1-11.is report. The following is provided to demonstrate the
significance of this type of evaluation, and,the implications that can
be drawn from its administration with both instructed and uninstructed
students.
Both the "Winebottle" and "Electricity" examples were tested with
eighth grade students in Vestal. In this case, we worked only with
two of the four eighth grade instructed classes. For the uninstructed
grOup we solicited the help of another part-time eighth grade teacher
who taught two sections in the afternoon. In order to characterize
both populations for this, and thz "Electricity" example, we performed
a t-test to compare the means between the instructed and uninstructed
groups of their performance on the reading and math parts of their
SAT tests. Tables IX.9 and 10 represent the findings of this analy-
sis. With the low t-values for the reading (0.69) and the math
(0.82) with corresponding probabilities of 0.493 and 0.413 respec-
tively, we can state that there is no statistically significant differ-
ence between the two groups in their mean scores for both the reading
and math parts of the SAT.
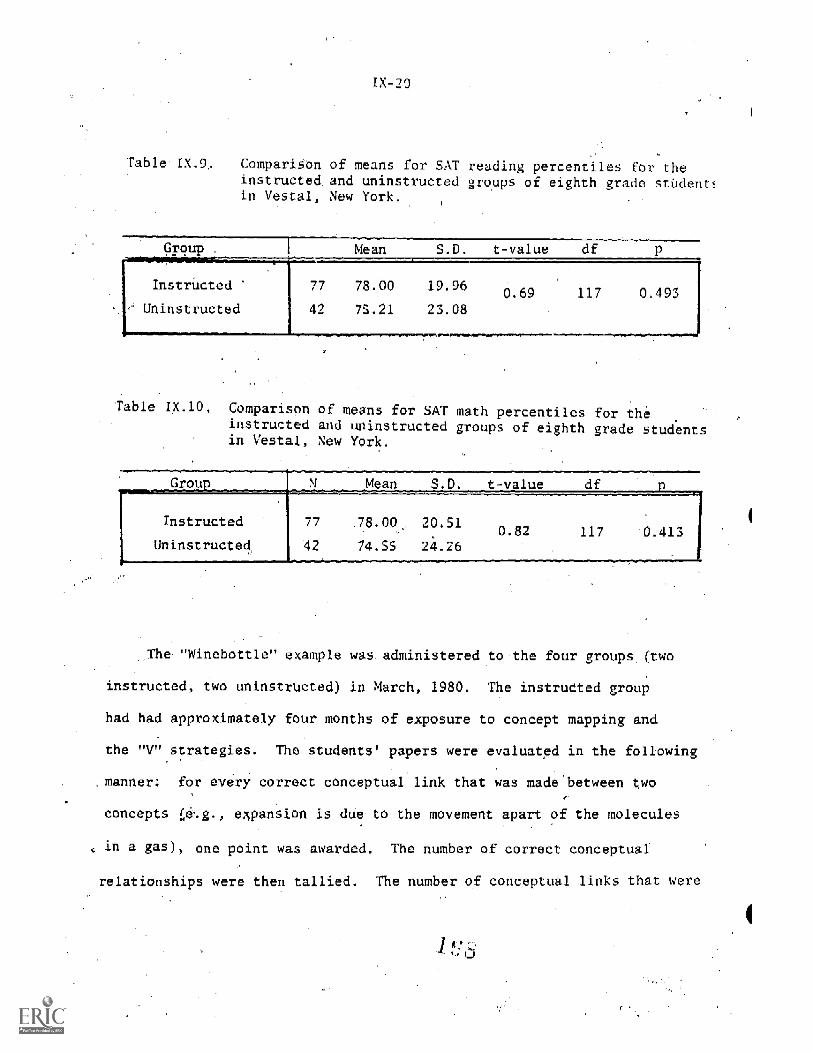
IX-20
Table 17(.9, CompariSon of means for SAT reading percentiles for theinstructed. and uninstructed groups of eighth grade studentsin Vestal, New York.
Grou Mean S.D. t-value d p
Instructed
Uninstructed
77 78.00 19.96
4? 75.21 23.080.69 117 0.493
Table IX.10. Comparison of means for SAT math percentiles for theinstructed and uninstructed groups of eighth grade studentsin Vestal, New York.
Crou e an -value d
Instructed
Uninstructed,
77 78.00 20.51
42 74.55 24.260.82 117 0.413
The inebottle" example was. ad nistered to-the four groups. (two
instructed, two uninstructed),in March, 1980. The instructed group
had had approximately four months of exposure to concept mapping and
the "V" strategies. The students' papers were evaluated in the following
:manner: for every correct conceptual link that was Made between two
concepts
in a gas),
expansion is due to the movement apart of the molecules
one point was awarded. The number of correct conceptual
relationships were then tallied. The number of conceptual links that were
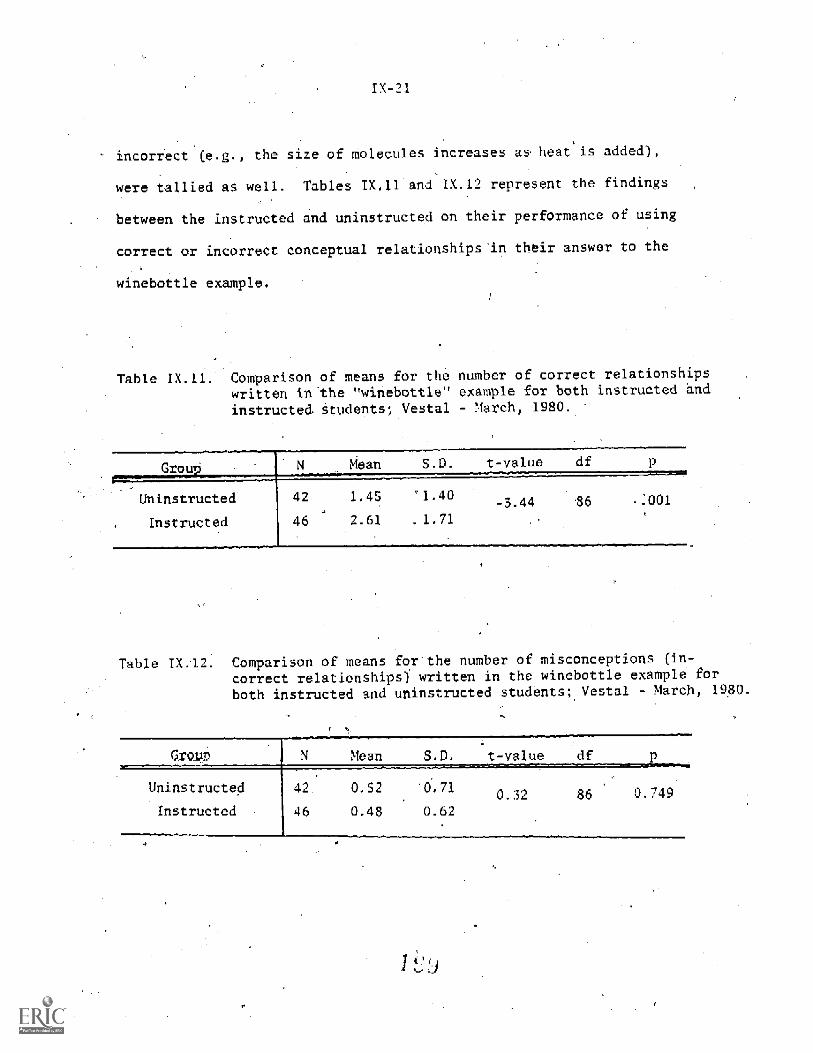
IX-21
incorrect (e.g., the size of molecules increases as heat is added),
were tallied as well. Tables IX.11 and 1X.12 represent the findings
between the instructed and uninstructed on their performance of using
correct or incorrect conceptual relationships` in their answer to the
winebottle example.
Table IX Comparison of means for the number of correct relationshipswritten in the "winebottle" example for both instructed andinstructed- Students; Vestal - March, 1980.
Uninstructed
Instructed
42 1.45 '1.40
46 2.61 _1.71-5.44 86 .001
Table IX.A.2. Comparison of means for the number of misconceptions (in-
correct relationships) written in the winebottle example for
both instructed and uninstructed students; Vestal - March, 198©.
Uninstructed
Instructed
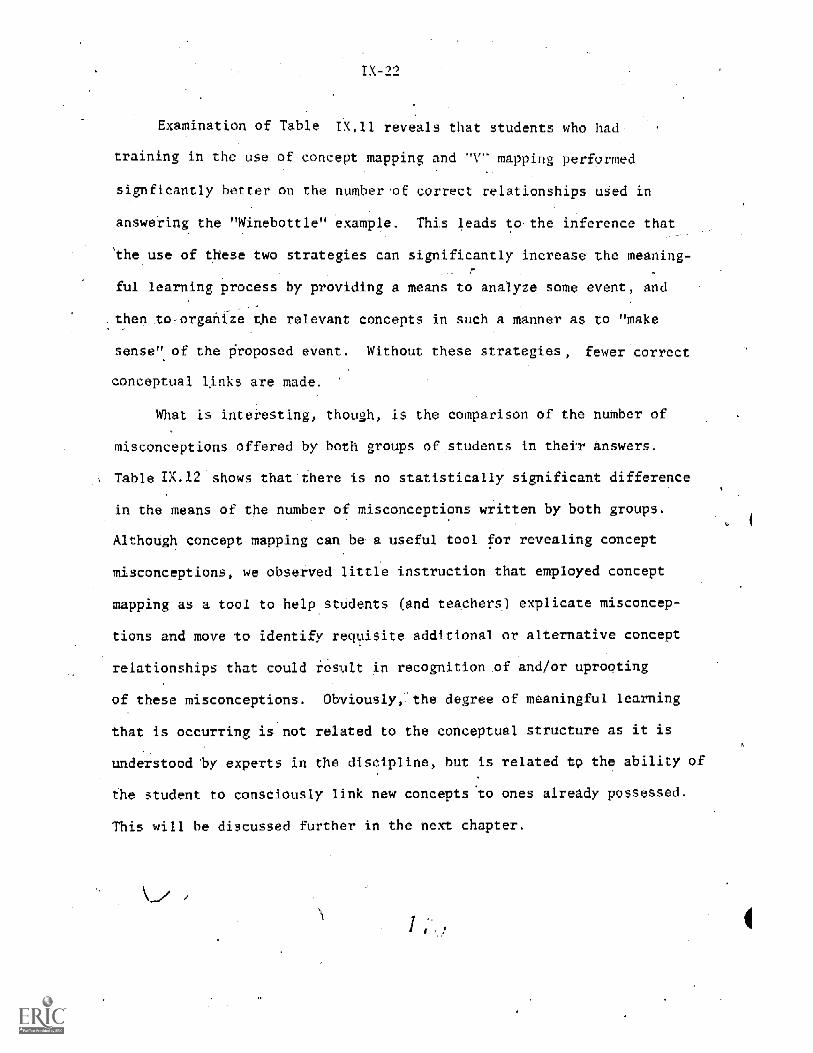
Examination of Table IX reveals that students who had
training in the use of concept mapping and "V" mapping performed
signficantly better on the number .of correct relationships used in
answering the "Winebottle" example. This leads to the inference that
the use of these two strategies can significantly increase-the meaning-
ful learning process by providing a means to analyze some event, and
then_to-organize the relevant concepts in such a manner as to "make
sense" of the Proposed event. Without these strategies, fewer correct
conceptual links are made.
What is interesting, though, is the comparison of the number of
misconceptions offered by both-groups of students in their answers.
Table 1X.12 shows that there is no statistically significant difference
in the means of the number of misconceptions written by both groups.
AlthoUgh concept mapping can be a useful tool for revealing concept
misconceptions, we observed little instruction that employed concept
mapping as a tool to help students and teachers) explicate misconcep-
tions and move to identify requisite additional or alternative concept
relationships that could result in recognition pf and/or upropting
of these misconceptions. Obviously,- the degree of meaningful learning
that is occurring is not related to the conceptual structure as it is
understood by experts in the discipline, butis related to the ability of
the student to consciously link new concepts to ones already possessed.
This will he discussed further in the next chapter.
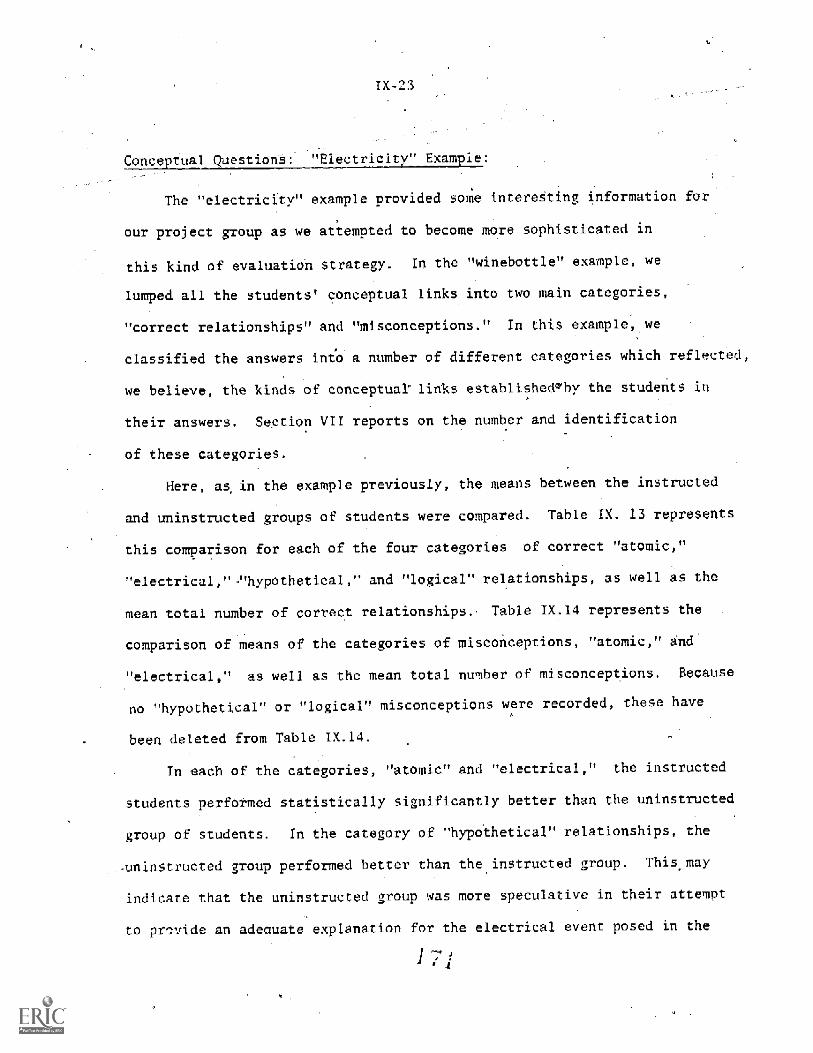
conceptual Questions
r
"Electricity" Examp e
The "electricity" example provided some interesting information for
our project group as we attempted to become more sophisticated in
this kind of evaluation strategy. In the "winebottle" example, we
lumped all the students' conceptual links into two main categories,
"correct relationships" and "misconceptions." In this example, we
classified the answers into a number of different categories which r lected,
we believe, the kinds of conoeptuar links e-tablishedTby the students in
their answers. Section VII reports on the number and identification
of these categories.
Here, as in the example previously, the means between the instructed
and uninstructed groups of students were compared. Table IX. 13 represents
this comparison for each of the four categories of correct "atomic,"
"electrical "hypothetical," and "logical" relationships, as well as the
mean total number of correct relationships. Table IX.14 represents the
comparison of means of the categories of misconceptions, "atomic," and
"electrical," as well as the mean total number of misconceptions. Because
no "hypothetical" or "logical" misconceptions were recorded, these have
been deleted from Table IX.14.
In each of the categories, "atomic" and "electrical," the instructed
students performed statistically significantly better than the uninstructed
group of students. In the category of "hypothetical" relationships, the
.Auninstructed group performed better than the instructed group. This may
indicate that the uninstructed group was more speculative in their attempt
to pr :vide an adequate explanation for the electrical event posed in the
] 7'
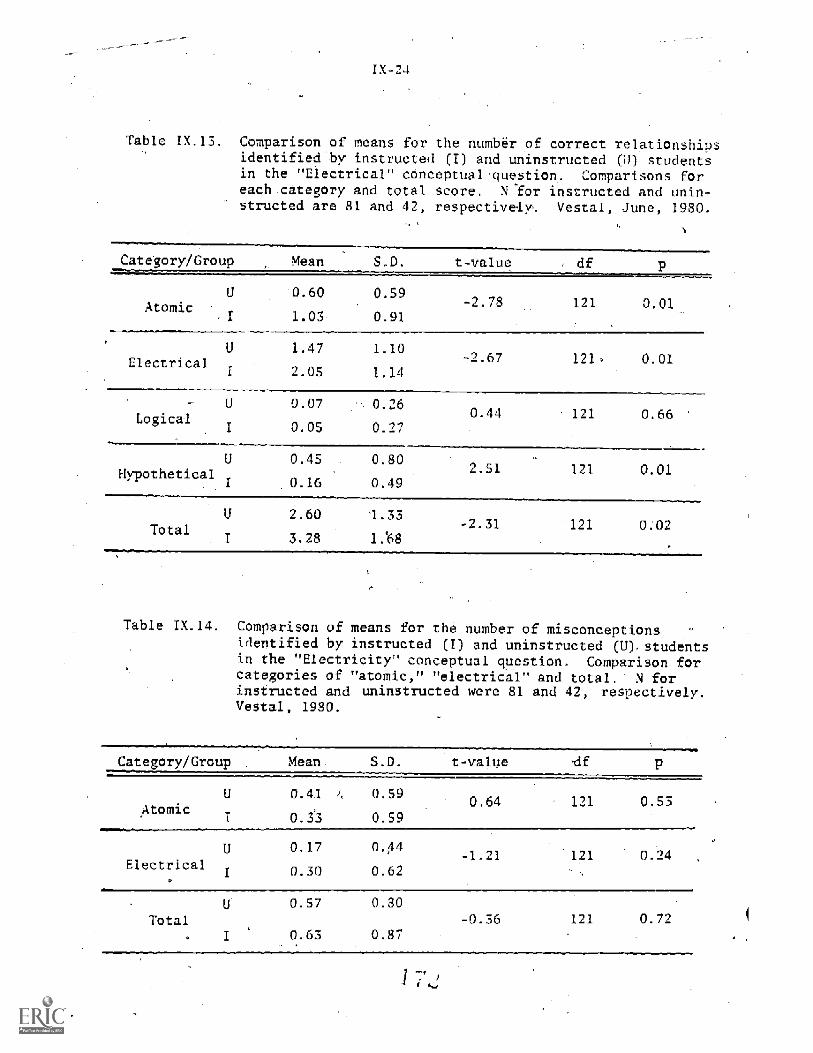
I
Table IX.13. Comparison of means for the number of correct relationshipsidentified by instructed (I) and uninstructed 01 studentsin the "Electrical" conceptual question. Comparisons foreach.category and total score. N for instructed and unin-structed are 81 and 42, respectively,. Vestal, June, 1980.
AtomicU 0.60 0.59
1.03 0.91
-2.73 121 0.01
ti
1.47 1.10Electrical
1 2.05 1.14
LogicalU
I
0.07 0.26
0.05 0.27
-2.67 121.. 0.01
0.44 l l 0.66
U
Hypothetical0.45 0.80
0.16 0.492.51 121 0.0
Total2.60
3.28 1.68-2.31 121 0. 2
Table I 4. Comparison of means for the number of misconceptionsidentified by instructed (I) and uninstructed (U),studen_sin the "Electricity" conceptual question. Comparison forcategories of "atomic," "electrical" and total. N forinstructed and uninstructed were 81 and 42, respectively.Vestal, 1980.
Category Group Mean S.D. t-value df
AtomicU
Ii
I
0.41
0.33
0.17
0.30
1. 0.59
0.59
0.44
0.62
0.64
-1.2
121 0.53
0.24Electrical
Total0.57
0.63
0.30
0.87-0.36 121 0.72
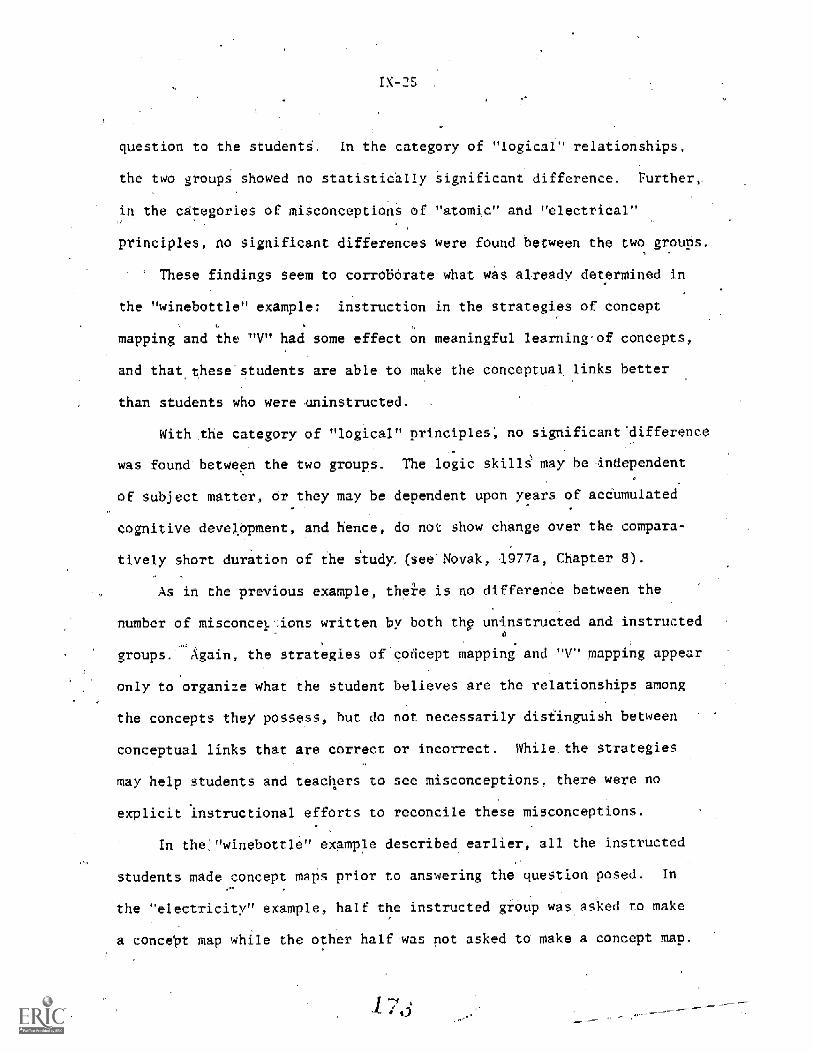
question to the studentS. In the category of "logical" relationships,
the two groups hawed no statistically significant difference. Further,
in the categories of misconceptions of "atomic" and "electrical"
P- nciples, no significant differences were found between the two groups.
' These findings seem to corroborate what was al -ready determined in
the " winebottle" example: instruction in the strategies of concept
mapping and the "V" had some effect on meaningful learning-of concepts,
and that these students are able to make the conceptual links better
than students who were, instructed.-
With the category of "logical" principles no significant' difference
was found between the two groups. The logic skills may be independent
of subject matter, or they may be dependent upon years of accumulated
cognitive development, and hence, do not show change over the compara-
tively short duration of the study. (see Novak, 1977a, Chapter 8).
As in the previous example, theie is no differenCe between the
number of misconcelions written by both thp uninstructed and instructed0
1
groups. Again,-the strategies of concept mapping and "V" mapping appear
only to organize what. the student believes are the relationships among
the concepts they possess, but do not necessarily distinguish between
conceptual links that are correct or incorrect. While, the strategies
may help students and teachers to see misconceptions, there were no
explicit instructional efforts to reconcile these misconceptions.
In the"winebottle" example described earlier, all the instructed
students made concept maps prior to answering the question posed. In
the "electricity" example, half the instructed group was asked to make
a concept map while the other half was not asked to make a concept map.
TX-26
The entird group bf instructed students
6
as composed of four classes/that
met with that teacher every day. These classes were selected at random
to prepare or not to prepare concept maps prior to constructing their
answers. There is-no reason to believe that'the classes were significantly
different from each other, since the policy of the Vestal schools was to
achieve heterogeneous classes.
The intention of this inquiry was to determine whether the task
f answering the question posed was related to the making of a concept
map immediately pridr to the task, or whether the strategy had "done its
job" already and would not be necessary for tha new talc,. In other words,
had Meaningful learning, facilitated by the use of the cocept mapping
and fT" mapping strategies, been accomplished before the administration
of this kind of evaluation instrument. Table IX.15 and IX-.16 represent
the analysis of the comparison of the means for those instructed students
who Madeconcept maps and those who did not for the number of correct
relaticinships in each of the four categories and for the two categories-
-f misconceptions.
Examination of the data reveals that in only one category (correct
"hypothetical" relationships, Table .15) is,there any statistically
significant difference between those students who made.a concept-map
as part of the evaluation task, and those who did not This seems to
indicate that the making of a concept map immediately prl.or to the
-evalmation task is of no substantial value. Rather, the importance of
using concept mapping comes during the regular instruction. This is6
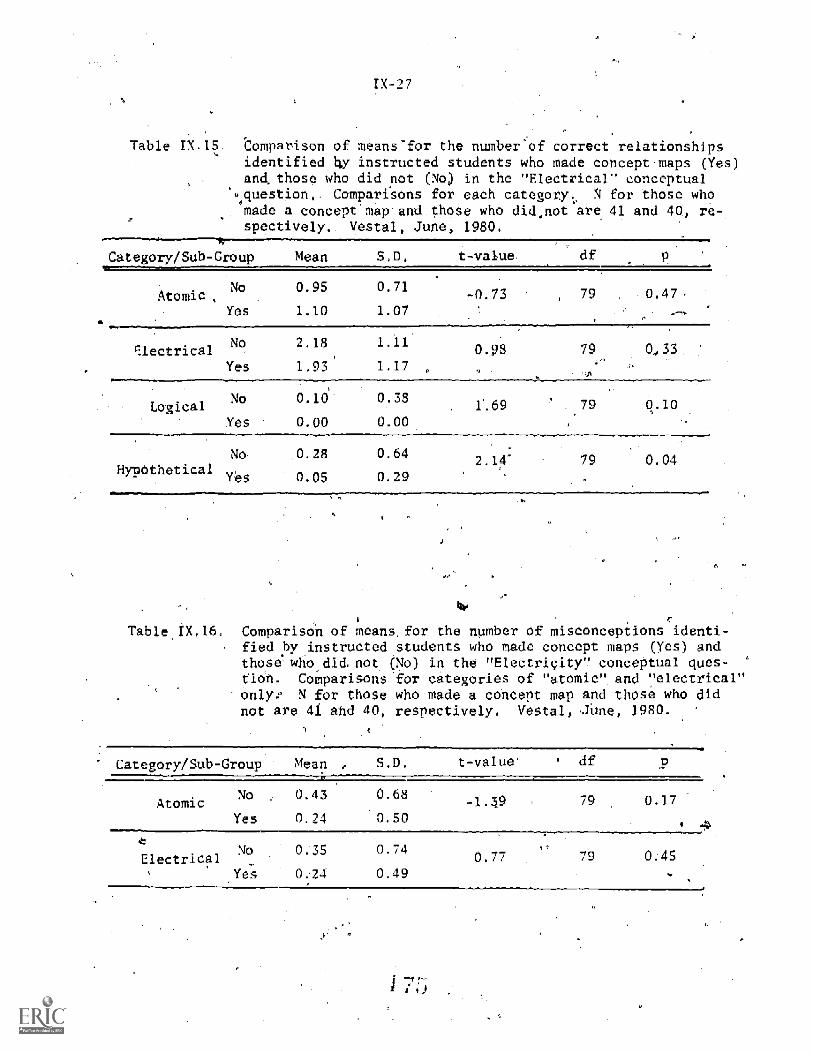
IX-27
Table I 'Comparison of means-for the number--of correct relationshipsidentifiedhy instructed students who made concept-mapsjYesand, those who did not (No) in the "Electrical" conceptual
%question.= Comparisons for each category., N for those whomade a concept map and those who did,not are 41 and 40, re-spectively.. Vestal, June, 1980.
Category/Sub-Group
AtomicNo
Yes
0.95
1.10
0.71
1.07-0.73 79 0.47
9lectricalNo
Yes
2.18
1.93
1.11
1.170.98 9 0,33
LogicalNo
Yes
0.10'
0.00
0.38
0.00
79 0.10
HypetheticalNo ,0.28
0.05
0.64
0.292.14- 79 0.04
Table IX.16. Comparison of means, for the number of misconceptions identi-fied by instructed students who made concept maps (Yes) andthose who,did.not (No) in the "Electricity" conceptual ques-tion. Comparisons for categories of "atomic". and "electrical"only: N for those who-made a concept map and those. who didnot are 41 and 40, respectively. Vestal, JiAne, 1980.
Electrical No
Yes
35 0.740.77
4
0.45
TX-25
consistent with our thesis that concept maps are heuristic devices,
,_needed only to facilitate meaningful learning. Once the meaningful.
learning has occurred, the -construction, or re- construction
concept map may not be necessary. Indeed,
effort and result in negative motivation.
may be a duplication of
School Measurement of Achievement:
Conventional science tests are, of course, used in blth Trumansburg
and Vestal to track stu -nts' progress. Since there-is-only one seventh
grade science teacher at Trumansburg, we sought to compare achievement
scores for students in seventh and eighth grade classes in the larger
Vestal school. Also, a comprehensive final examination test is
administered to each science grades and these scores could be Wised for
comparison purposes: This final examination requires almost exclusively
recall of specific knowledge, so the evaluation objective is substantially
differeht from what we were doing with concept maps and the "V" strategy.
Since we were working with only one of the four seventh grade teache
and one of the four eighth grade teachers in Vestal, some comparisons
can e made. The average of the final examination for the experimental
students in the seventh grade was 86.51%; for the entire seventh grade
is was 8.1.92%, showing a difference-of almost five points. For the
eighth grhde, the experimental students' average on this examination was
82.15 %; for the entire eighth grade, 82.-04%, indicating no large difference
between the two groups.
From this, we-can see that the introduction of the strategies of
_concept mapping and the'"V" appears to have no substantial effect on
the performance of students with respect to conventional classroom and/or
school -wide evaluation. We will show below that correlation analysis
supports-the claim that our evaluation strategies are measuring something
substantially different from school achievement test and typical standard-
ed achievement test.
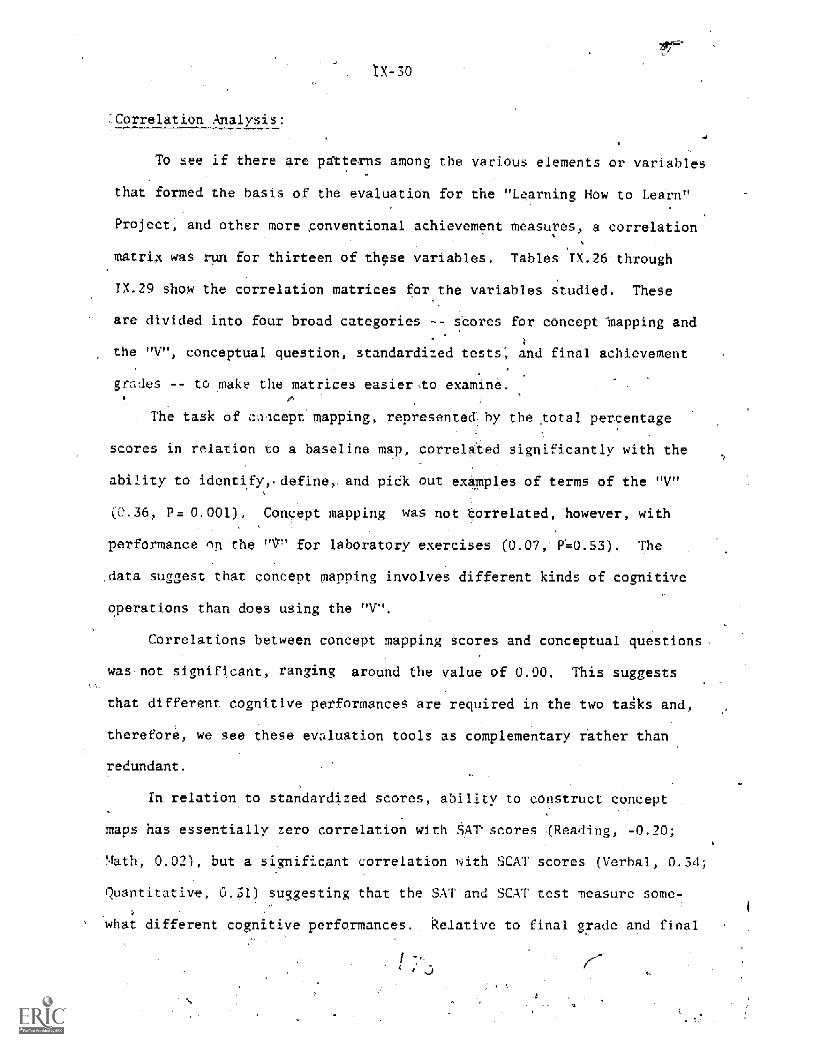
IX -30
Correlation Analysis:
To see if there are patterns among the various elements or variable
that formed the basis of the evaluation for the "Learning How to Leatn"
Project, and other more ,conventional achievement measures, a correlation
matrix was run for thirteen of these variables. Tables IX.26. through
IX.29 show the-correlation matrices for the variables studied. These
are divided into four broad categories -- scores for concept 'mapping and
the conceptual question, standardized tests; and final achievement
grades -- to make the matrices easier -to examine.N
The task of cnacept mapping, represented; by the total percentage
scores in relation to a baseline map, correlated significantly with the
ability to identify,. define and pidk out examples of terms of the "V"
P= 0.001). Concept mapping was not correlated, however, with
performance on the "V" for laboratory exercises. (0.07 FG053). The
data suggest that concept mapping involves different kinds of cognitive
operations than does using the "V".
Correlations between concept mapping scores and conceptual questions-
was-not significant, ranging around the value of 0.00, This suggests
that different cognitive performances are required in the two tasks and,
therefore, we see these evaluation tools as complementary rather than
redundant.
In relation to standardized scores, ability to construct concept
maps has essentially zero correlation with .5=wr scores -(Reading, -0.20;
!4ath, 0.02), but a si
Quantitative
ficant correlation with SCAT scores (Verbal, 0.34 ;
0.31) suggesting that the SAT'and SCAT test measure some-
what different cognitive performances. Relative to final grade and final
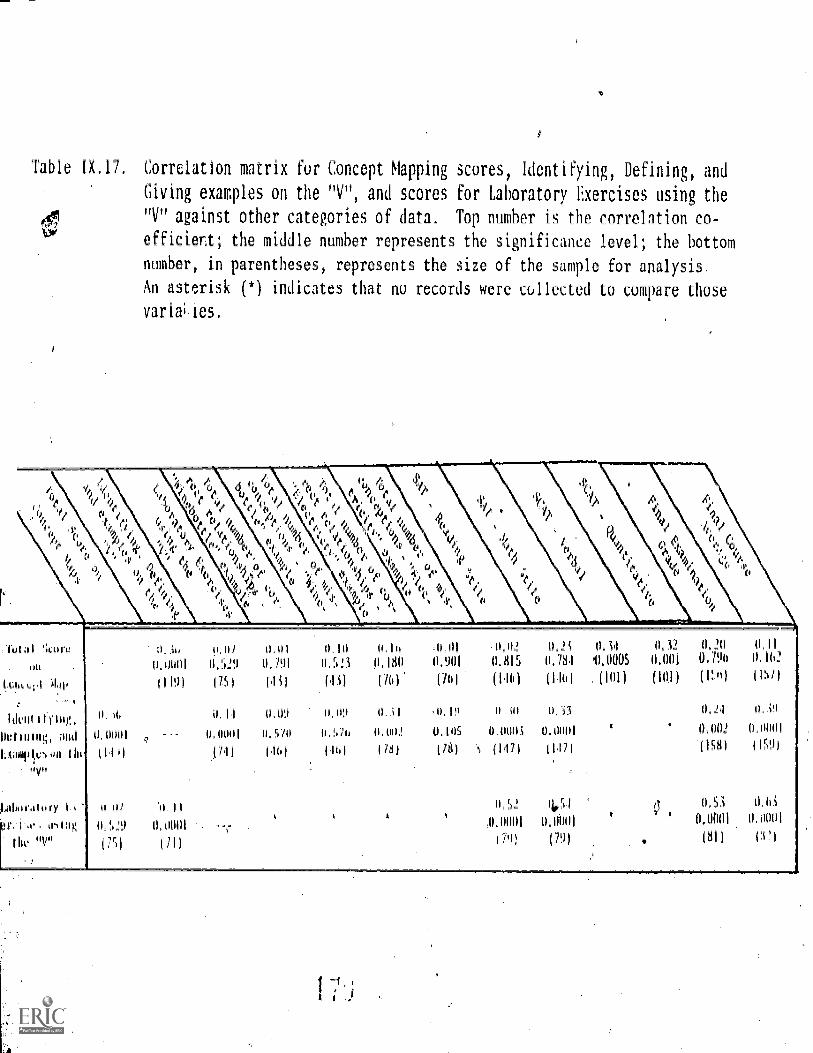
Table IX.17. Correlation matrix fur Concept Mapping scores, Identifying, Defining, and
Giving examples on the "V", and scores for Laboratory Exercises using the
"V" against other categories of data. Top number is the correlation co-
efficient; the middle number represents the significance level; the bottom
number, in parentheses, represents the size of the sample for analysis:
An asterisk (*) indicates that no records were collected to compare those
varia;,ies.
1( -4
'ti o i4
6Ij
,,
-,, 9.1 t, ,i 1
6I :
40.1
c(
b S i 1/-, 4 6
I. 1,, 4'
' .1* '
9. NV .14!.'
( ?fi-4,
14
0,34,0,001
0,0/0, S19
1751
It0Anwl
OM 0.0
0:0001 0,5)0
J74) 1161
0.0 I 0.10 0,111
0,79i 0,5 !i 0.180
(.1 i) (IS) (A)
.0.111
0.901
17h1
U. HIS
(HO
0.1i0.78-1
(HI) )
o, 011 0, 19 0 ill 0. 33
0:!,70 0,002 11.105 0.0003 0,0001
(MI ) (18) (78) ',I (147) 1147)
A
0. r,1 (5.0,0001 0.0001
17.1) (79)
O.
IMAMS
(101)
. *
0,32
0,001
(101)
0.20 0 , I I
79) 0.162
( Iit) (157)
0,14 0, i9
0.1)01 0,0001
(153) 11591
0,53 0,63
0.0001 0.0001
OH WI
1_
Jut al `kairc
oh
Lula%,1 AW
Jdii' ii f )vg
0etiniug, and
1...tampluN hi'
1,i0mr.t t ry
a-mn:
On!
0.
0410)
(I
1I i
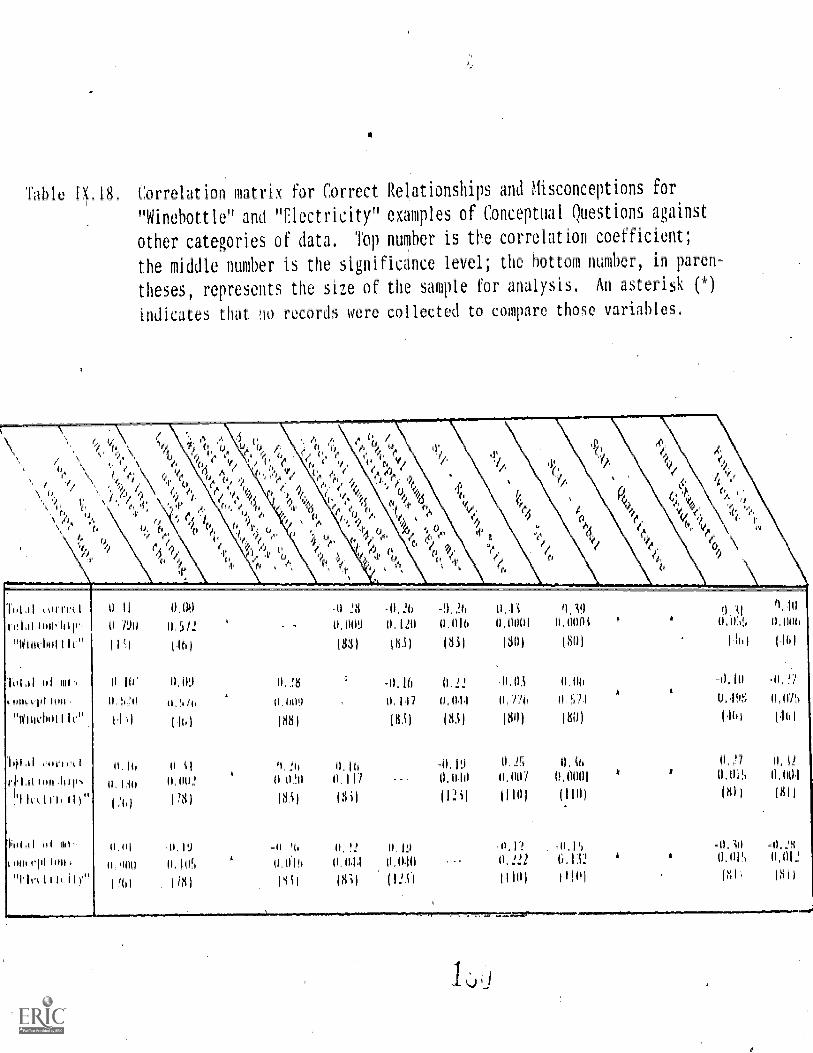
Table IA 18 Correlation matrix for Correct Relationships and Misconceptions for
"Winebottle" and "Electricity" examples of Conceptual Questions against
other categories of data. Top number is the correlation coefficient;
the middle number is the significance level; the bottom number, in paren-
theses, represents the size of the sample For analysis* Ai asterisk (*)
indicates that uo records were collected to compare those variables.
/ \ ebe \
( \ T\ 11,
0 ,t)
1.0
161,i1 nt:1 0 H OA/ -0 28 =0,26 -0,26 0,1i 0,19 9, (1,111
101.11 moduli.. 1911 0,5/2 0009 0,120 0.016 0,0001 0:0001 0,114 0,006
*1111111101 1 It 1I Ii (83) 1331 (331 (301 (311) (LI 00
161.11 01 III II 114' 0,09
0:1.06 II. WO
-9,16
0117
0.22
0,041
.0.0i
0776
0 06
0 Silk A
-0,10
1.1A9F,
.0. ni
0.0'6
"W11160111(." 11 9 1161 ($8) 031 031 WO 1801 1161 1461
11041 1116 0 11..!6 11.16 ALP) 0.25 U. 0,!7 0,i2
ri.14111011111),
lk,11111)"
0:110
Cid
0,110,!
1731
0 C0
18S1
0.117
PM0,010
(N)
0,001
11101
0,0001
(1101
k # 0,06
(811
0M04
($1)
TO(41 id MI' 0,01 -0,19 -0 0: !-) 0,19 .0.1? -0,i0
A 0,000 11, 111!i 0.014 0.011 0040 0,222 6,132A 0,0r1 0,012
"6.1vOilkliV"1.'61 1441 (12.0 11101 11111(
181i (8I)
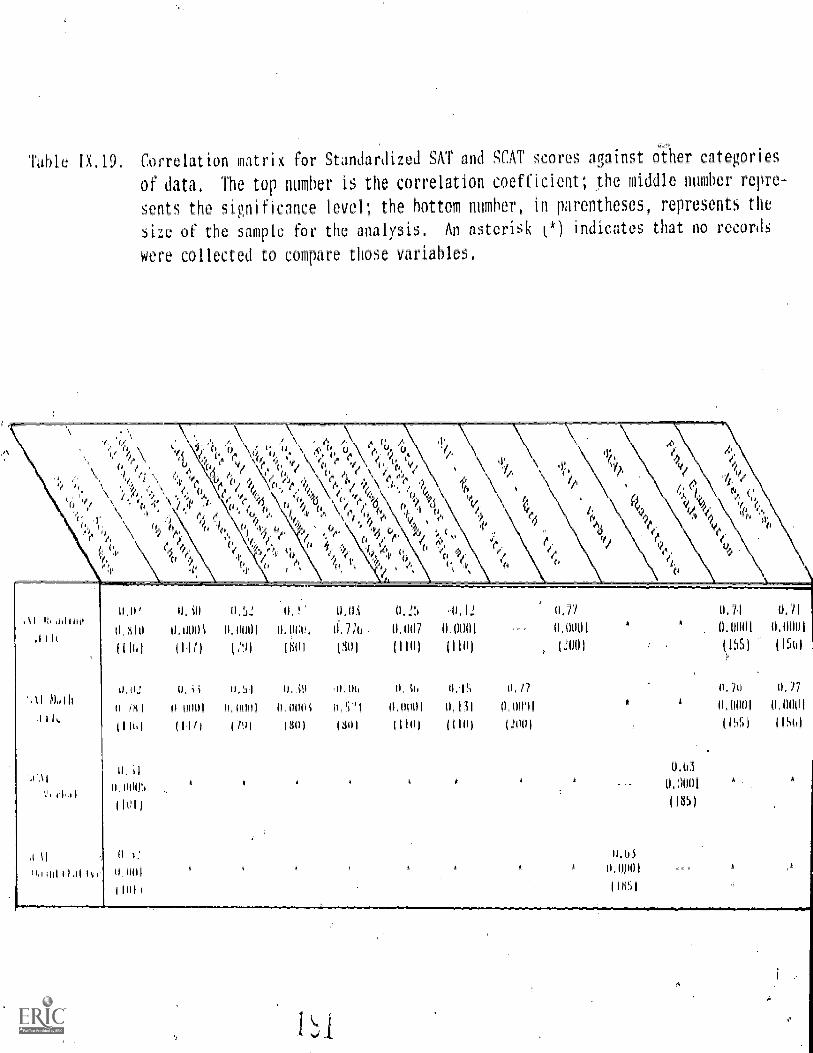
Table I. 1 Correlation matrix for Standardized SAT and SCAT scores against other categories
of data, The top number is the correlation coefficient; the middle number repre-
sents the significance level; the bottom number, in parentheses, represents the
size of the sample for the analysis. An asterisk (1 indicates that no records
were collected to compare those variables.
(. 0 '01--%
6,, 0 e Pu.i... -0 ..
Vt
0 1 ,, 0 f f -ii. v x 4 o , CI
1 ,'! ,. e"; 0 , , ; -6 v,
0 ei I- ,,,1:x
N ey b.li
4 or 4- ,,
(I0 ',,!. e f
ei 1... 1i .
Y,e e,
If 'I'
,
0, eti0 '61
ndh
II IL
0,5 11.11.1 0,77 11,71
II. 111! 0.01101 o,Occ, 4,776 0,007 0.0001 0,0001 0.0001 II. (hilt
11161 (111) (:91 1301 (M01 (1101 11101 (2001 (15) (1511
0:02 II.ii 0.S1 0,39 i1,06 0,U1 0,I5 0,/7 0.10 1),77
0 Iii! 0 0001 0,0001 0,000i 0,S1 0.000) 0,131 0,0001 0,0001 0,0140
1110 111/1 1A0 (n1)) (301 11101 (110) (200) (h5) 11Shl
0.63
0.0001
(1351
II 1: 0,6i
I1. old 0.0,001
iloil 11351
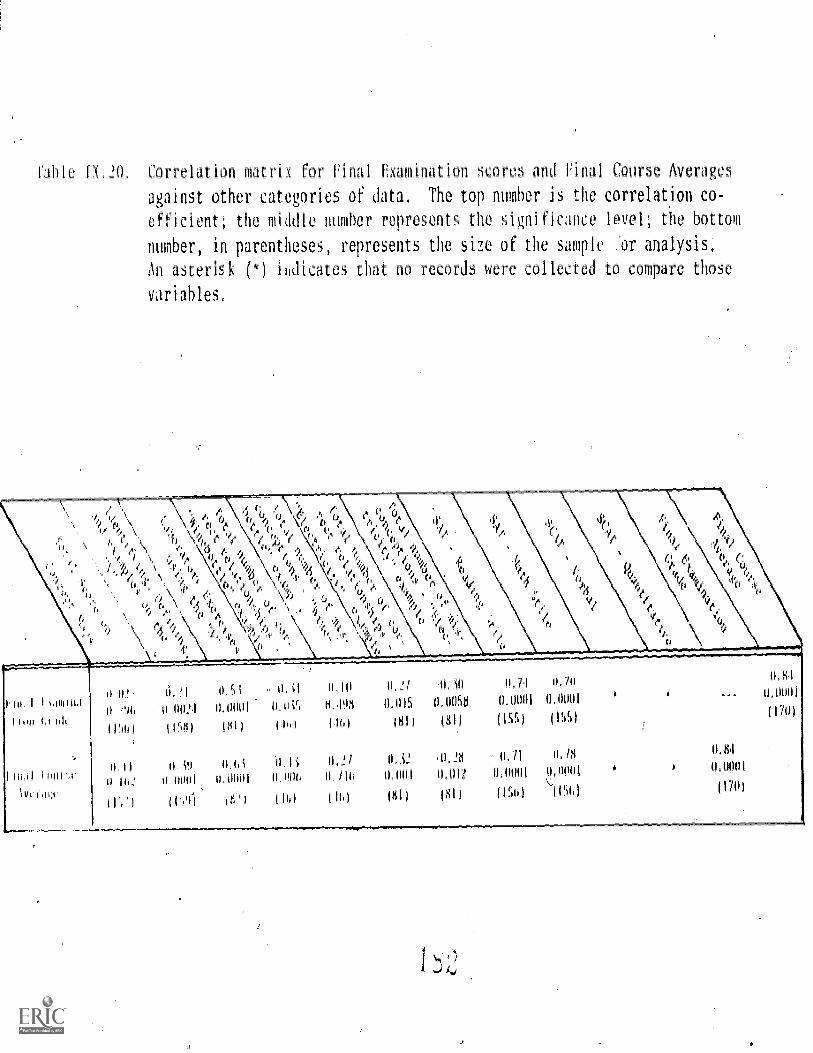
fable IX. 2(1. Correlation matrix for Final Examination scores and Final Course Averages
against other categories of data, The top number is the correlation co-
efficient; the middle number represents the sioificance level; the bottom
number, in parentheses, represents the size of the sample or analysis.
An asterisk (*) indicates that no records were collected to compare those
variables.
i ('
jij, I 1111111.
I i .1i1C
I do'
I) 6_10 II 0(1!1 0,0001 0.6C
11'161 11S8) (81) (1b)
II 11.6i
11 110111 11.011111
1 Ii '1
III 0,2/ 'll=in0, 71
0.198 HIS 0.00S$ IL 00111
1161 181) (81) (155)
0. 0,2 11111(i 11 1111
III)
u.s_i1). on! 1),012
116) pili
0,1 18
0,011111 0:0001;
(1!)
A
0,84
0001
I\-33
r concept low correlation (0.20, P=0.08;
0.11, P=0.1 repecrively
map7 g
Th e low correlations in that con-
ventional school achievement measures do not measure what we regard as
important aspects of science education that might be better assessed with
the use of concept maps and "V" maps.
Two forms of evaluation of the "V" were performed: identifying,
defining, and picking out examples of terms of the "V" and using the "V"
for laboratory exercises. The correlation coefficient and significance
level for these two are 0.44 and Pm0.0001, suggesting a strong relation-
ship. Unfortunately, the entire source of laboratory exercises using the
It I" came from Trumansburg, and the conceptual questions administered
there possessed enough difficulties to preclude their use in the analysis.
Thus, no correlations were computed between "V" mapping scores and concept-
ual questions. For both aspects of the "V", there is a h correlation
between each and performance on the SAT, both reading and math. Similarly
high correlations exist between both aspects of the "V" evaluation and
final e7:amination grades (0.24 and 0.53, respectively) and final average
grades for the year (0.39 and 0.65).
In general, the correlation tables support the conclusion that the
evaluatibn strategies used account for substantially different cognitive
performances than school achievement tests and standardized achievement
tests, with only some 4% to 38% of shared variance between these measures.
These data may account in part for the fact that school achievement does
not necessarily reflect future interest and success,in science careers.
X. CLAIMS AND RECOMMENDATIONS FOR FUTURE RESEARCH
Major Claims of the Pour Research uestions
The discussion of the major knowledge claims of the "Learning How
to Learn" Project will follow the format of the original four research
questions that were asked in Section 1 of this report. After these questions
have been answereda_list of recommendations for future research
be discussed. In addition to these recommendations it should be remem-
bered that Sect ns. V-and VI discussed Caveats concerning the introduction
of concept mapping and the knowledge "V" into the classfoom. These should
be consulted as well.
CAN SEVENTH AND/OR EIGHTH GRADE SCIENCE STUDENTS LEARN TO USE THE CONCEPT
MAPPING AND THE "V" MAPPING STRATEGIES IN CONJUNCTION WITH EXISTING SCIENCE
PROGRAMS.
There appeared to be enough accumulated evidence that supports the
claims that junior high science students can indeed acquire the strategies
of concept mapping and "V" mapping, and that they can utilize them for their
.
readings and their laboratory exercises. The introduction of these strategies
into the classroom takes little time away from the conventional curriculum
while potentially increasing the meaningful learning process, thereby making
the learning of the content material of the. course more efficient. Although
.students with higher ability, as assessed through standardized achievementI
tests and classroom evaluation, perform at a higher level of compentence with
these strategics, high performance was also demonstrated by significant
numbers of students in lower quartiles on standardized tests.
With respect to concept mapping, the students appeared to like to use
this strategy 7 cause it allowed them to "pick apart" -a piece of text reading
some other study material and to construct relationships among the concepts
presented. This was evidence that more leaningful learning was:occur ing,
ice there was a conscious effort on the part of the learner to find the
relationship of one concept to another. The mechanics of making a concept
map presented no major difficulties, to the stucints. They appeared to
understand well 'le ideas of "conceptual relations" and'"hierarchy," but had
more difficulty constructing "cross links." This may,be due in part to the
nature of the instructional materials, most of.which present information
in al.inear fashion with little effort to show interrelationships among concepts
and to refer back to relevant ideas presented earlier.
Generally, students improved over time in their ability to construct
concept maps. Sixty-four percent of the students tested twice during the
1979- 1980 school year were able to increase their total score by at least
2514. We believe that by making the rules for constructing concept maps more
explicit to the students, we can anticipate an increase in concept map scores,
probably approaching "mastery" after some period: of time for all students
who complete assignments. As with any school work, some students made little
effort to construct concept maps or "V" maps.
It shouldbe remembered also that the amount of time on task involving
concept mapping (and also th:: 'knowledge "V") was estimated to be only between
5 - 15% of class time. Differences that existed in performance measures for
the concept mapping strategy favored the Trumansburg group (7th grade), and
might'be due to their greater amount of time on task. In any event, it is
gratifying that most students performed at a high level of competence with
such limited exposure.
X-3
e Knowledge, "V" can be used by students to represent the laboratory
.exercises they perform in class, d t relate the conceptual and methodo-
logical sides of any inquir, . Generally, students found the "V" harder
to do than concept mapping, but that might be due to having to " "juggle ""
so many different terms in their inds: What is the event here? What
are the principles and concepts? How should I word the focus question?
Another possible reason for students having more difficulty with the
"V" mapping deals with teacher expectations from the students. The "V's"
that most of the students made were completed after they had already written
convntional-laboratory reports for the teacher. Since the laboratory
report was written twice, students saw this as a duplication of effort.
That is not a popular position with junior high students.
This notwithstanding, students did report, and the evidence seems
to support this, that the "V" helped them to determine what the lab was
all about, and helped them to separate what was needed to -beknowrn9from
the lab. We believe that even this is a significant step to understanding
the role that concepts play in any inquiry, and indicates that a more
meaningful learning of content material is occurring.
As with concept mapping, the criteria for assessing students' "V's"
should be made explicit to the Learners. We believe that this is the
_reason that students' " "V'' s "" began to hover around the tweleve to fourteen
range of scores during the latter part of the project, rather than moving
toward the maximum of eighteen on our scale.. If students had been told
what counts, for instance, as a good focus question, and had been given
clear cases for each of the levels from zero through three, students
probably Could have improved in each of the'five categories of criteria.
X-4
The scope of our study was limited; all the evidence that we have
acquired on using the "V" for laboratory exercises came from one school.
_\
Differences inteachers, students, and programs would have been a fruitful
medium for exploring the range of "V" mapping performances, and this
should be part of future research studies.
There must also be a consideration of the term "ex ting school
program" as identified in the research question. Alt- h no evidence
reported, there was a growing impression by the staff over the two year
period that many of the curriculums with which we became familiar were
seriously deficient in the conceptualizations of the subject matter.
All toL often, we found gapping "holes" in the laboratory exercises', or
where the text presumed that the learner knew more than what he/she actually
-did. Reading passages, which were identified as answering some question
often did not answer that question at all, but rather led the student
of on a descriptive tangent of some other event or experience._ So to
say that these strategies can be used in conjunction with conventional
curriculums warrants a qualification. Teachers who adopt these s_ attgies
and their theoretical foundations must be wary of the limitations of
text and curriculum.
WILL STUDENTS' ACQUISITION OF SCIENCE KNOWLEDGE AND PROBLEM SOLVING
FORMALVCE CHANGE AS A RESULT OF THE STRATEGIES?
We must be careful to identify what kinds of knowledge we are
discussing, and how students' performances are evaluated. If we discuss
the acquisition' of science knowledge noted in the qv tionl, that is,
the relationships among the conceptualizations of the fields of science
and their relevance for making sense of events, we can state that the_
X-5
introduction of the strategies has fa ated the meaningful learning
of those conceptualisations and their relations to events. If, hove
it is knowledge about -knowledge that is being discussed, our case
convincing. We are less confident that student and teachers, as well,
have acquired in any meaningful way these "meta-" concepts about knowledge
and the knowledge-making process. This is most likely due to a lack of
familiarity about the strategies and theepistemological and psychological
principles that formed the basis of the project.
But this does not imply that there is no evidence that "meta-"
concepts could have been acquired. While one of the most important aspects
of the strategies is that they caused student, to begin to understand the
subject matter in a more meaningful way, there seems to be some suggestion
that concept mapping and "V" mapping facilitated also the understanding
of the structure of knowledge in the science field. As students made con=
dept maps, they had to identify the most inclusive concept i of the reading,
illustrate its relationships to subordinate concepts, and then show theSe
relationships through, the lines drawn among them. Given that, students acquired
a deeper understanding of the relationships among the concepts in a subject
matter, even though it is doubtful whether they had actually articulated
any "meta-" concepts about the structure of knowledge.
When we turn to concepts about learning, that is, "meta-lea- ing,
we are even less confideitt. Although the project teachers did present
the activities from the Teacher's Handbook (Appendix I, Section II) to
the students, there is no clear evidence that the principles generated
from those activities became oper onal in the classroom. In all of the
clinical interviews and more informal interviews we condudted with students'
X-6
teachers, and ail the classroom visitation we made, no evide,ce
exists that the teachers were utilizing these learning principles in their
classes.
We must also,be careful when discussing student performance relative
to the type of evaluation instrument used to determine whether there has
been an acquisition of science knowledge. In terms of. conventional class-
room evaluation, we found no significant difference between the instructed
groups of students and the uninstructed in the same school and grade in
relation to performance on district-wide final examinations. But we
believe that these examinations attempted to ascess something very different
than our objectives in_this project. Inspection of these final examinations
led to the conclusion that they were seriously deficient in linking concepts
in the subject matter, and appeared to require only rote learning to perform
well. When we turn to student performance on.our own, conceptual questions,
wh6se design utilized the strategies of concept mapping and the "V", we found
ignificant differences between instructed and uninstructed students.
The strategies, is cliaimed, assisted the student's in organizinelheir
conceptual understanding of the subject matter, and utilized that organiza-
Lion to make sense of some new event. the evidence suggests that ,
conceptual questions haVe tapped the students' cognitive structures to
see the comparative degree of meaningful learning.
If we define problem solving as the ability to offer an explanation
to an'event using concepts that the student has learned in a meaningful
ev.
way:then our conceptual questions can become,an important aspect of the
problem solving evaluation of students. Although there is much research
to be conducted with thpse conceptdal questions, there is signficant know-
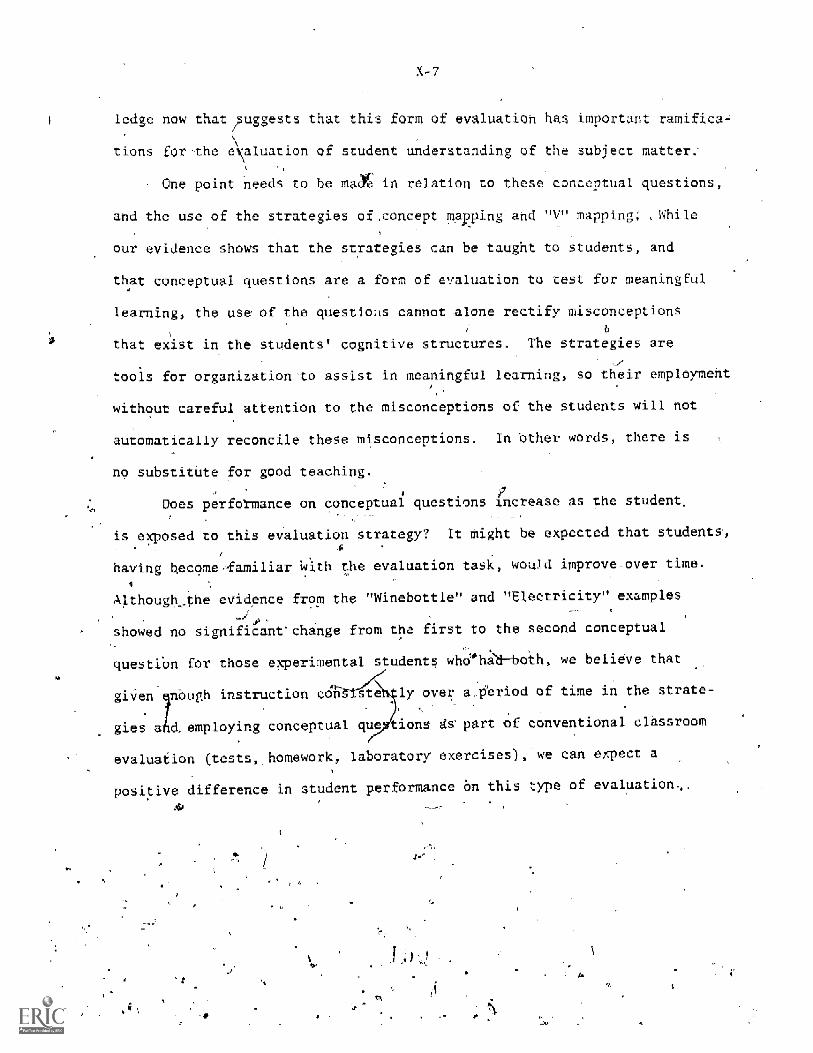
ledge now that uggests that this form of evaluation has important ramifica
tions for-the e aluation of student understanding of the subject matter:
One point needs to be may in relation to these conceptual questions,
and the use of the strategies of ,concept mapping and "V" mapping; :While
our evidence shows that the strategies can be taught to students, and
that conceptual questions are a form of evaluation to test for meaningful
learning, the use of the questions cannot alone rectify misconceptions
;
that exist in the students' cognitive structures. The strategies are
tools for organization to assist in meaningful learning, so their employment
without careful attention to the misconceptions of the students will not
automatically reconcile these misconceptions. In Other words, there is
no substitute for good teaching.
Uoes performance on conceptual questions increase as the student_
is exposed to this evaluation strategy? It might be expected that students,
having become-familiar With the evaluation task, woul d improve over time.
Although_the evidence from the "Winebottle" and "Electricity" examples
showed no 'ignificant'change from the first to the second conceptual
queston for those experimental students whehaboth, we believe that
giVen -nbugh instruction con s ly over a,tie iod of time in the strate
gies arid. employing conceptual quti,ons d part of conventional classroom
evaluation (tests, homework, laboratory exercises), we can expect a
positive difference in student performance bn this type of evaluation,.
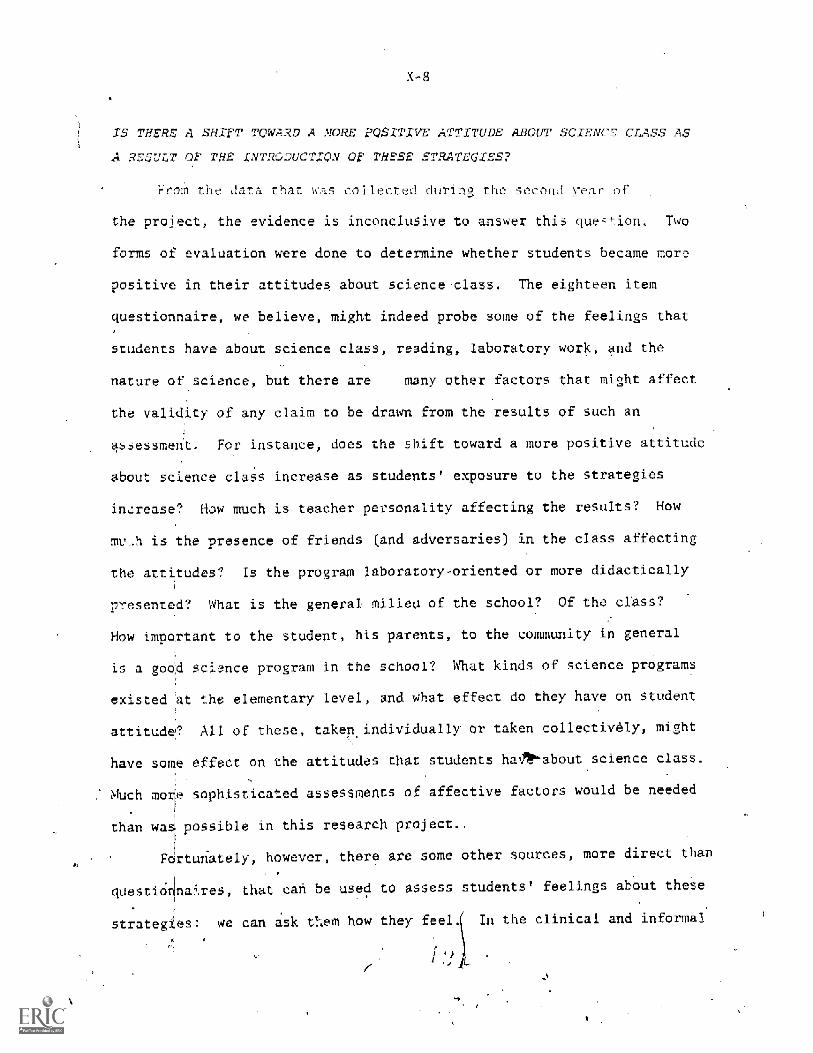
X-8
IS THERE S-IFT TOW D A MORE POSITIVE ATTITUDE ABOUT SCIENCE CLASS AS
RESULT OF THE INTRODUCTION QE THESE STRATEGIES?
From the data that t collected du- the second vear of
the project, the evidence is inconclusive to answer this clue = pion. Two
forms of evaluation were done to determine whether students became more
positive in their attitudes about science ciass. The eighteen item
questionnaire, we believe, might indeed probe some of the feelings that
students have about science class, reading, laboratory work, and the
nature of science, but there are many other factors that might affect
the validity of any claim to be drawn from the results of such an
assessment. For instance, does the shift toward a more positive attitude
about science class increase as students' exposure to the strategies
increase? How much is teacher personality affecting the results? How
;nt'h is the pr ence of friends (and adversaries) in the class affecting
the attitudes? Is the program laboratory-oriented or more didactically
presented? What is the general milieu of the school? Of the class?
How important to the student, his parents, to the community in general
d science program in the school? What kinds of science programs
existed at the elementary level, and what effect do they have on student
attitude? Al of these, taken individually or taken collectively, might
have some effect on the attitudes that students ha -about science class.
Much mone sophisticated assessments of affective factors would be needed
!
than wasi possible in this research project..
FOrtunately, however, there. are some other sources, more direct than
ques itirinasit.es, that can be used to assess students' feelings about these
rategies: can ask them how they feel.( In the clinical and informal
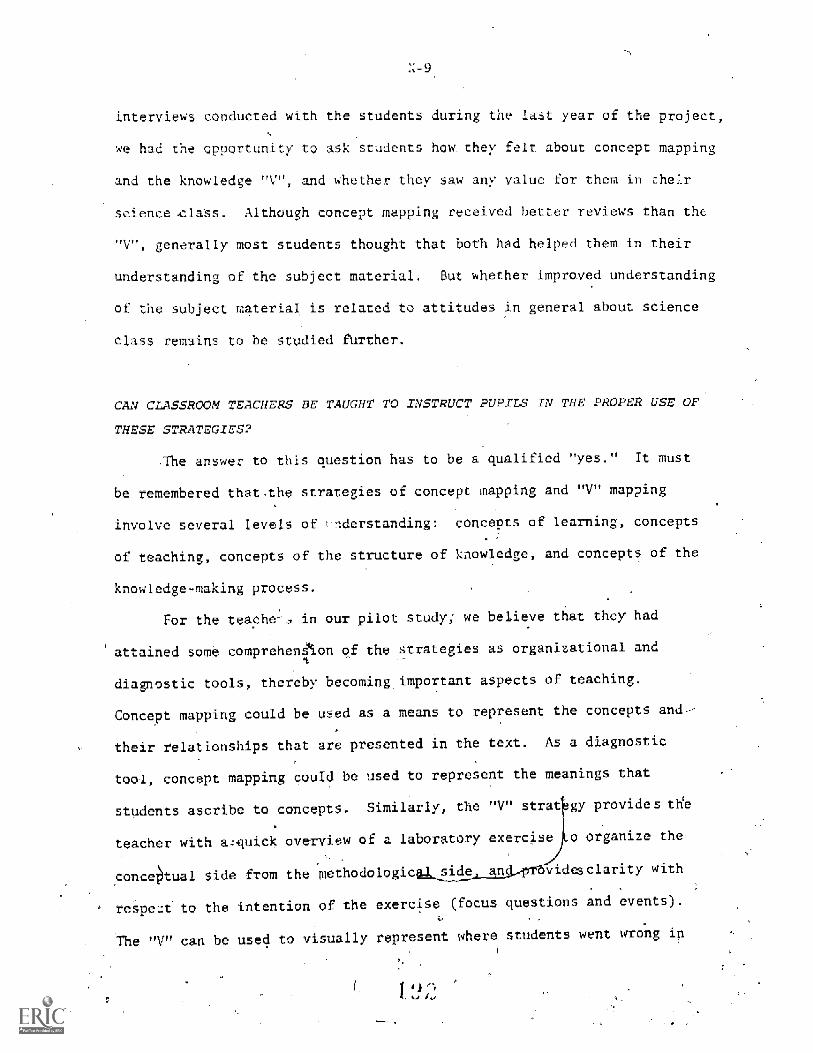
interviews conducted with the students during the last year of the project,
e had the opportunity to asl students hew they felt about concept mapping
and the knowledge "V", and whether they saw any value for them in zhe;.r
science class. Aitno ugh concept mapping received better reviews than the
,W1f, generally most students thought that both had helped them in their
understanding of the subject material. But whether improved understanding
of the subject material is related to attitudes in general about science
class remains to be studied further.
CAN CLASSROOM TEACHE S BE TAUGHT TO INSTRUCT PUPILS THE PROPER USE OF
THESE STRATEGIES?
The answer- to this question has to be a qualified "yes." It must
remembered that-the strategies of concept mapping and "V" mapping
involve several levels of 1 derstanding: concepts of learning, concepts
of teaching, concepts of the structure of knowledge, and concepts of the
knowledge-making process.
For the teache-, in our pilot study, we believe that they had
attained some comprehenAon of the strategies as organizational and
diagnostic tools, thereby becoming important aspects of teaching.
Concept mapping could be used as a means to represent the concepts and
their relationships that are presented in the text. As a diagnostic
tool, concept mapping could be used to represent the meanings that
students ascribe to concepts. Similarly, the "V" strat gy provides th'e
teacher with aquick overview of a laboratory exercise o organize the
conceptual side from the methodologic videsclarity with
respect to the intention of the exercise (focus and events).
The "V" can be used to visually represent where students went wrong in
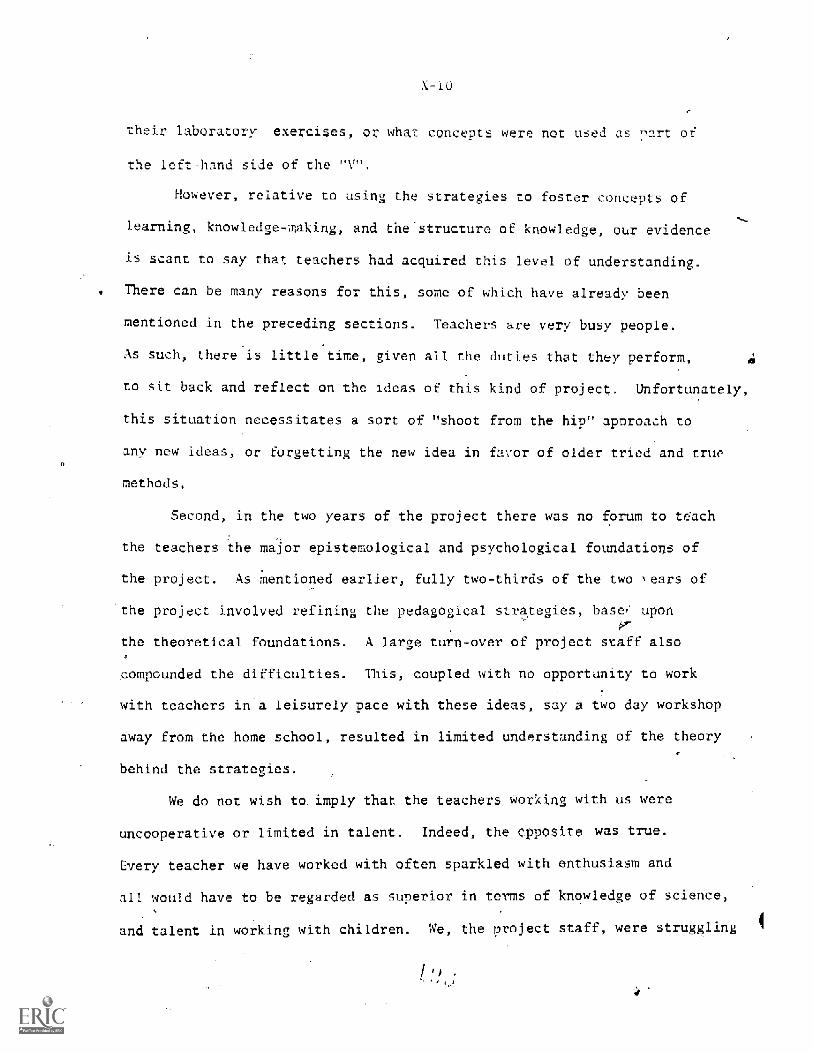
X -iO
laboratory exercises, or what concepts were not used as _ of
the left-hand side of the "V".
However, relative to using the strategies to foster concepts of
learning, knowledge-making, and the'structure of knowledge, our evidence
is scant to say that teachers had acquired this level of understanding.
There can be many reasons for this, some of which have already been
mentioned in the preceding sections. Teachers are very busy people.
As such, there is little time, given all the duties that they perform,
to sit back and reflect on the ideas of this kind of project, Unfortunately,
this situation necessitates a sort of "shoot from the hip" approach to
any new ideas, or forgetting _he new idea in favor of older tried and true
methods.
Second, in the two years of the project there was no forum to teach
the teachers the major epistemological and psychological foundations of
the project. As mentioned earlier, fully two-thirds of the two rears of
the project involved refining the pedagogical strategies, base,' upon
the theoretical foundations. A large turn-over of project staff also
compounded the difficulties. This, coupled with no opportunity to work
th teachers in a leisurely pace with these ideas, say a two day workshop
away from the home school, resulted in limited understanding of the theory
behind the strategies.
We do not wish to imply that the teachers Working with us were
uncooperative or limited in talent. Indeed, the opposite was true.
Every teacher we have worked with often sparkled with enthusiasm and
all would have to be regarded as superior in terms of knowledge of science,
and talent in working with children. We, the project staff, were struggling
th.finding pra al waysways t implement teachin. , strategies derived
from a psychology learning and a philosophy of knc Ledge that was
only marginally comprehended by many of us: we too were learners!
The remarkable fact is that the teachers were so good, so successful
in working with us when we were learning how to "get our act t ether.
We believe-our experiences, as reflected in this report and in the
Teacher's Handbook will make it possible for teachers with comparable
educational skills, or perhaps even less, to achieve a large met ire of
succes with these strategies.:
Thus, we are optimistic regarding the improvement of science
teaching. There can be significant changes in the levels of cnceptuali-
zations about teaching, learning, knowledge, and curriculum if only the
forum were provided for teachers. Recent work at Correll University
h a modification. of Kagan's (1975) Interpersonal Process Recall (IPR),
suggests that teachers can indeed change their conceptualizations about
teaching even with the very busy schedule and within a comparatively
small time committ e-- (Way,1951).
X-12
ec.o -r mend.a.tions 'utur-
Several recommendations for future research have already been men-
tioned in various sections of this repor sake of brevity and
conciseness, though, they ar.. included in this las section.
1. It was remarkable to the staff that studerru performed so well
with these strategies relative to the small amount of time on task.
Further, use of these strategies were limited to one teacher during
the course of one school year. It would be enlightening to determine
what effects woula. accrue with a horizontal introduction of these strate-
gies across subject areas, and longitudinally across grade levels. Per-
haps one yea one subject's exposure to the strategies is not enough.
Could a school using a team approach adopt these strategies in th
English, science, social studies, and math classes? Of course, the
nature of the knowledge in each of these areas would'necessarily be differ-
ent, but that does not dismiss the idea that each is a field that
conceptualizes about some events,- and that each field has a structure
of its own knowledge. Longitudinally, students could be introduced to
concept mapping as early as first grade. Work in progress in Australia
by the project director has demonstrated that is is feasible. While the .
!IVY' Aght be postponed until later, elementary students should be able
to grasp key epistemological ideas and later to use Cowin's Repeated.
exposure to these strategies over several years could lead to significant
changes in learning, and students' perception of the nature of knowledge
and the nature of rational thought (Novak, 1980).
A second recommendation deals with
curriculums and the adoption of these
Although we have found that the strategies can be incorporate' into existi
school science programs, we believe that a re-conceptualizations of the
ructure of "conventional"
to fit into that
curriculum is necessary to effect the full power of the concept mapping
and the "V" mapping strategies. Some work, involving the reorganization
of curriculums to a psychological organization, has already begun with
staff members who have returned to teaching during the 1980-1981 school
year. Research is now being conducted to psychologically and epistemologically
o-ient students in three separate areas: chem istry, the IPS Program,
high school biology, and an animal behavior course.
It should be evident that the teacher's knowledge is also important.
We cannot expect that students will be able to arri7e at higher levels of
conceptualization about learning, the stiucture of knowledge, and the
knowledge-making process if the teachers have not been taught to recognize
such order. Thus, the preparation of the teacher avast be improved substan-
tiallyc; Again, this year, preliminary research to determine if teachers
can be taught to restructure their previous knowledge, as well as to acquire
the techniques for teaching the learning strategics now being investigated;
This ista new set of challenges, requiring much extensive research, and
we need colleagues to join with us.
were
X-i4
. Students carticipating in the "Learning How to Learn" Project
ability , students than we had of gall cted. Correla
ns between ability, as measured by standardised achieveNent tests, and
performances with concept mapping and the "V" do indicate a strong
positive relationship between the two variables. However, the evidence
is also encouraging that-a significant number of lower ability students
can acquire and use then. strategies. Given this, a replication project
needs to be conducted to see how effective these strategies are with these
lower abili y students.
S. Concept mappin "V" mapping provide a powerful new evaluation
strategy, once students are taught to use these tools. The data from this
study indicates that these evaluation tools are reliable and valid and
that4ther tap substantially different abilities than conventional achieve-
ment tests.
o. We believe that the creation of conceptual questions can provide
a powerful means for .evaluation of meaningful learning, and which can be
adopted in any classroom. However, with only two examples for our evidence,
no matter how encouraging that evidence might be, further research should
e conducted which attempts to determine if there is any improvement over
e in students' ability to. answer this type of question. This can be
done over the course of a single year, or longitudinally where students
have been presented new material without the assistance of concept mapping
and the "V". Some research in this area is also being conducted this year.
1
As mentioned in Section VI of this report, the use of the -V" was
restricted to knowledge claims with no research relative to the value
claims of science. This we believe important aspect of science
education, but was beyond the resources of this present project. We
recommend, therefore, future studies, whenever possible, include
the idea of value claims together with the other concepts of Gowin's "V".
There is a need for ilesearch on classroom climate and the possible
effect of "learning how to learn "tstrategies on eacher-pupil relationship.s
The work begun.by Way (1981) with college students could serve as a model.
for elementary and secondary schools.
In conclusion, we believe the research reported here shows promise
for a brighter future in education. The practical strategies represented
in concept mapping and Gowin's "V" is derived from a theory of education,
and as such, the technology is both guided by and will serve to modify
and improve the theory. Theory-based educational strategies have not been
common in educational history, and therefore we have hope for progressive,
evolutionary development of both educational theory and derivative, practical
teaching strategies that may improve human understanding.
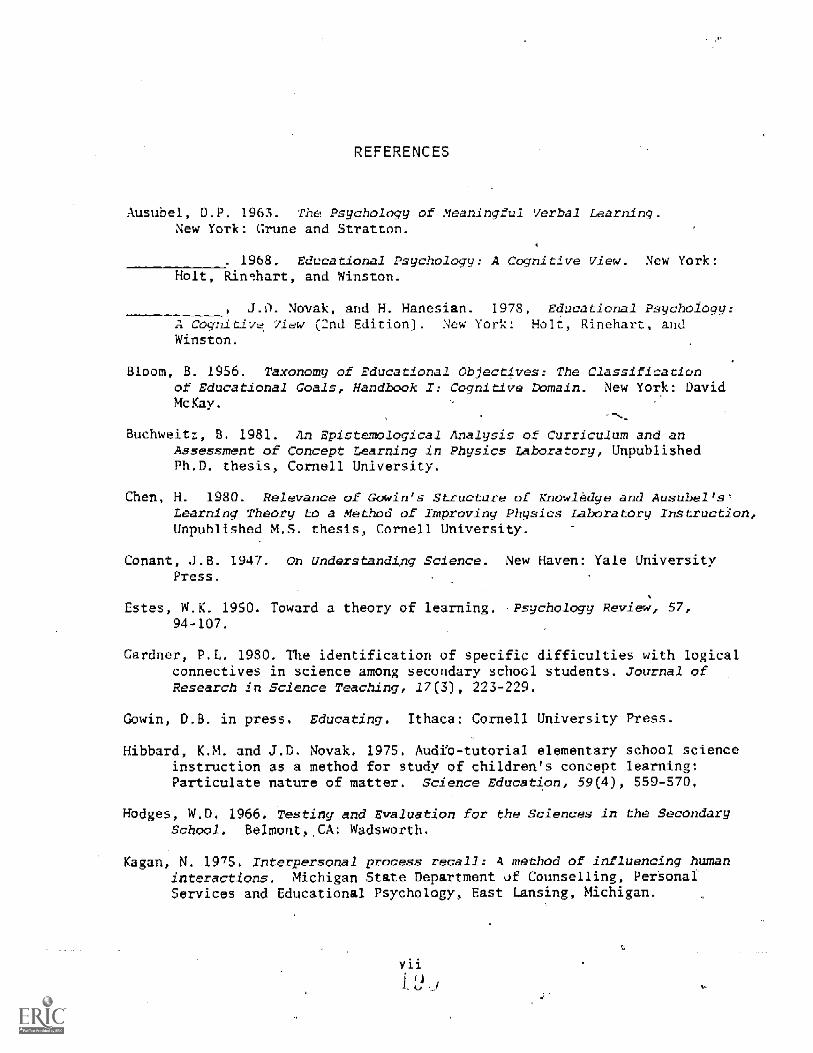
REFERENCES
Ausubel, D.P. 1963. The Psychology of Meaningful Verbal Learning.New York: Grupe and Stratton.
. 1968. Educational Psychology: A Cognitive View. New York:Holt, nc!bart, and Winston.
J.0. Novak, and H. Hanesian. 1978, Educational Psychology:Cognitive view C2nd Edition). New York: Holt, Rinehart, and
Winston.
Bloom, B. 1956. Taxonomy of Educational Objectives: The Classificationof Educational Goals, Handbook I: Cognitive Domain. New York: DavidMcKay.
Buchweitz, B. 1981. An Epistemological Analysis of Curriculum and anAssessment of Concept Learning in Physics Laboratory, UnpublishedPh.D. thesis, Cornell University.
Chen, H. 1980. Relevance of Gowin's Structure of Knowledge and Ausubel's'Learning Theory to a Method of Improving Physics Laboratory Instruction,Unpublished M.S. thesis, Cornell University.
Conant, J.B. 1947. on Understanding Science. New Haven: Yale UniversPress.
Estes, W.K. 1950. Toward a theory of learning, Psychology Review, 57,94-107.
Gardner, P.L. 1980. The identification of specific difficulties with logicalconnectives in science among secondary school students. Journal ofResearch in Science Teaching, /7(3), 223-229.
Cowin, D.B. in press. EduOating. Ithaca: Cornell University Press.
Hibbard, K.M. and J.D. Novak. 1975. Audib-tutorial elementary school scienceinstruction as a method for study of children's concept learning:Particulate nature of matter. Science Education, 59(4), 559 570.
Hodges, W.D. 1966. Testing and Evaluation for the Sciences in the SecondarySchool. Belmont, CA: Wadsworth.
Kagan, N. 1975. Interpersonal process recall: 4 method of influencing humaninteractions. Michigan State Department if Counselling, Personal.Services and Educational Psychology, East Lansing, Michigan.
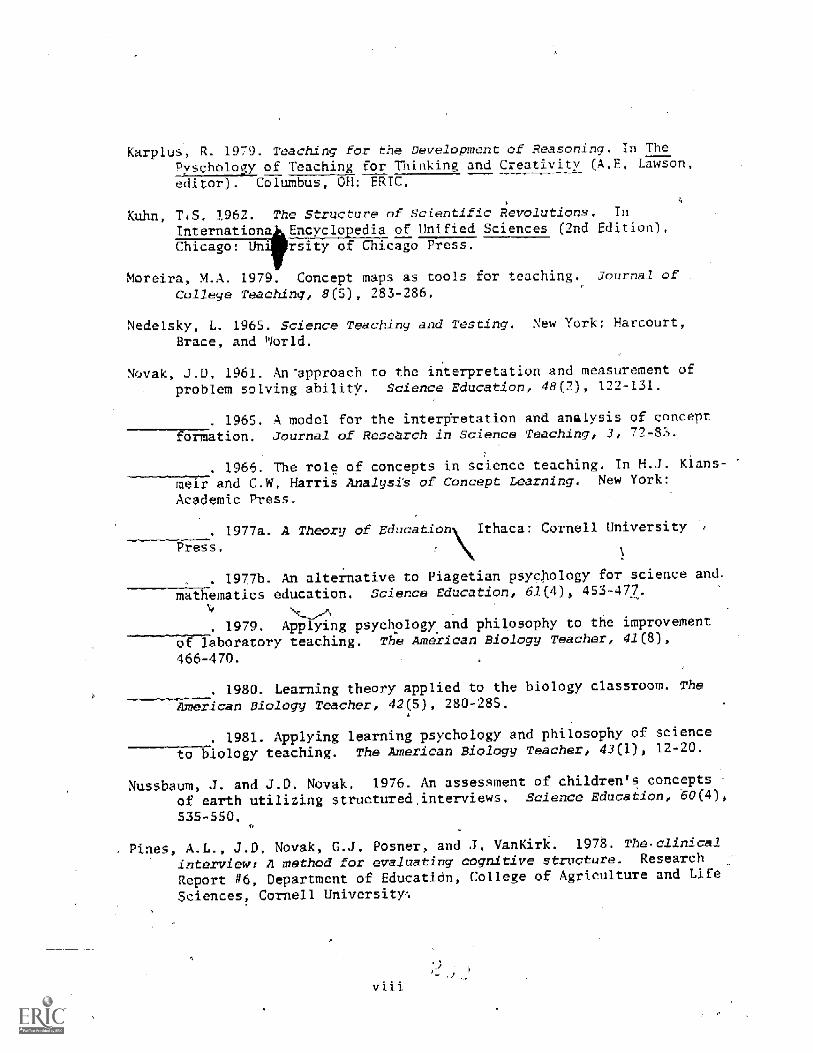
Karplus, R. 1979. Teaching for the Development of Reasoning. In The
Pyschology of Teaching for Thinking and Creativity (A Lawson,
editor Columbus, 011 ERIC,
TES. 1962. The Structure of Scientific Revolutions. In
International Encyclopedia of Unified Sciences (2nd Edition).rsity of Chicago Press.Chicago: Un
Moreira, M.A. 1979. Concept maps as tools for teaching. Journa
College Teaching, 8(5) 283-286.
Nedelsky, L. 1965. Science Teaching and Testing. New York: Harcourt,
Brace, and World.
Novak, J.0, 1961. An'approach to the interpretation and measurement of
problem solving ability. Science Education, 48(2 ), 122-131.
. 1965. A model for the interpretation and analysis of concept
formation. Journal of Research in Science Teaching, 77-83.
. 1966. The role of concepts in science teaching. In H.J. Klans-
meir and C.W. Harris Analysis of Concept Learning. New York:
Academic Press.
Press.
I977a. A Theory of Education Ithaca Cornell University
. 1977b. An alternative to Piagetian psychology for science and.
mathematics education. Science Education, 61(4), 453-477.
1979. Applying psychology and philosophy to the improvement
of laboratory teaching. The American Biology Teacher, 41(8),
466-470.
.1980. Learning theory applied to the biology classroom. The
American Biology Teacher, 42(S), 280-285.
. 1981. Applying learning psychology and philosophy of science
to biology teaching. The American Biology Teacher, 43(1), 12-20.
Nussbaum, J. and J.D. Novak, 1976. An assessment of children's concepts
of earth utilizing structured. interviews. Science Education, 60(4),
535-550,
Pines, A.L., J.D. Novak, G.J. Posner, and J. VanKirk. 1978. The.clinical
interview: A method for evaluating cognitive structure. Research
Report #6, Department of Education, College of Agriculture and Life
Sciences, Cornell University
viii
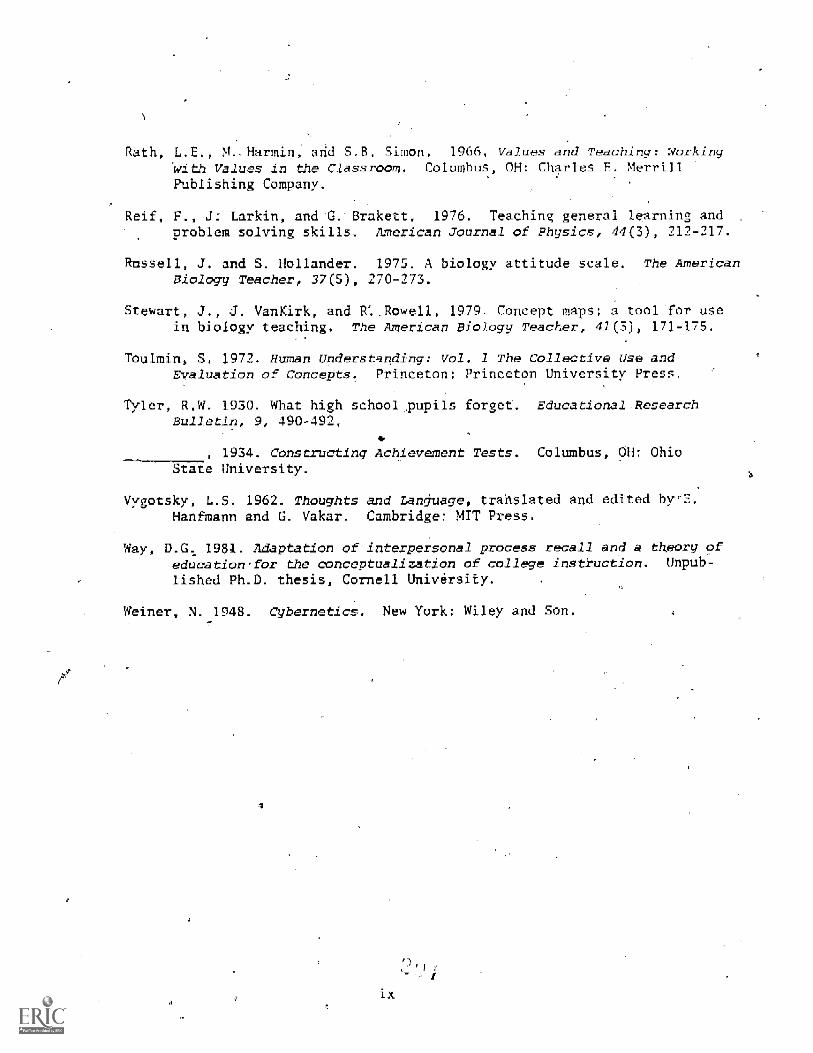
Rath, L.E., An, and S. B, Simon. 1966. Values and Teaching_ Workingwith Values in the Classroom. Columbus, OH: Charles E. MerrillPublishing Company.
Reif, F., J: Larkin, and -G.'Brakett, 1976. Teaching general learning andproblem solving skills. American Journal of Physics, 44(3), 212-217.
Russell, J. and S. Hollander. 197S. A biology attitude scale. The AmericanBiology Teacher, 37(5), 270-273.
Stewart, J., J. VanKirk, and R"..Rowell, 1979. Concept maps: a tool or usein biology teaching. The American Biology Teacher, 41(3), 171 -175.
Toulmin, S. 1972. Human Understanding: Vol. 1 The Collective Use andEvaluation of Concepts, Princeton: Princeton University Press.
Tyler, R.W. 1930. What high school pupils forget. Educational ResearchBulletin, 9, 490 -492.
41934. Constructing Achievement Tests. Columbus, OH: Ohio
State University.
Vyg_otsky, L.S. 1962. Thoughts and Language, trans a ed and edited byHamann and G. Vakar. Cambridge: MIT Press.
Way, O.G. 1981. Adaptation of interpersonal process recall and a theory ofeducaton'for the conceptualization of college instruction. Unpub-
lished Ph. p. thesis, Cornell University.
Weiner, N. 1948. Cybernetics, New York: Wiley and Son.
f
'APPENDIX I
a
Teacher Handbook for the
"Learn ing How to Learn" Project
a
TEACHERHANDBOOK
for the
=
LEARNING HOW TOLEARN PROGRAM
LYilvc.r-_,: f4.7)ar -Int if i;ducat Ion
HI! I. :rh Icz , 1 1A7, i
HANDBOOK FOR
IA NING HOMO [EARN !
THE
p;I
loTo2j :111,1 -.;11,2I I
SEPH D. NgVAK, DIRECT
STAFF: 1973-1979
MIKE DLUMENTHAL
WENDY BOHAYCHUK
KENNETH DINNAR
GERALD FREEDMAN
GERARD T. JOHANSEN, SR.
PHYLLIS SCOTT
STACY STENTO
MARGARET WATERMN
KATHY LAYER, ADMINISTRATIVE AIDE
Now York Collegcnell UrOversit
rttWr,
STAFF: 1979-192n
STUART TERRY BARTOW
'LAINE GURLEY
GERARD T. JOHANStN
JUNE KINIGSTEIN
BrOUGLAS LARISON
SUSANMELBY
ERICA POLAKOFF'
CATHY B.WEBB
LURA MARKER, ADMINISTRATIVE AIDE
and Liftrat' lAhicA
1, ltipLa.
)
All Ri Olt koscry I
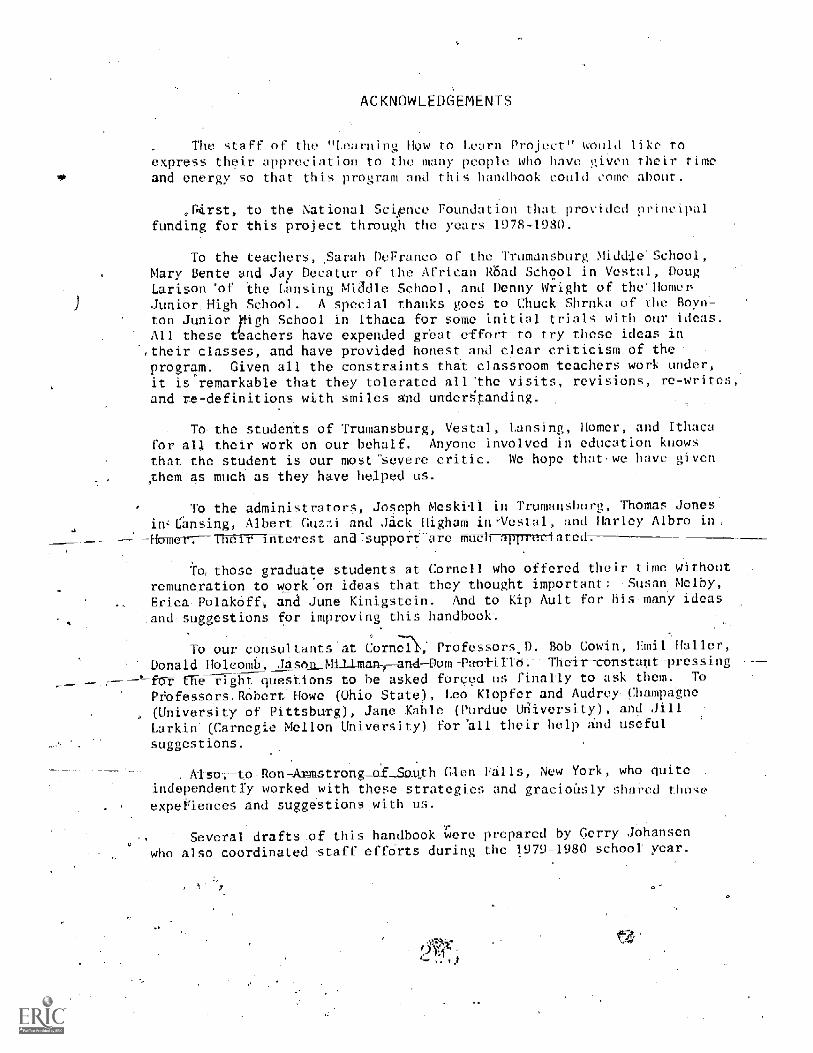
ACKNOWLEDGEMENTS
The staff of the "Learning How to Learn Project" would like toexpress their appreciation to the many people who have given their timeand energy so that this program and this handbook could come about
,Pirst, to the National Scip Foundation that provided principalfunding for this project through the years 1978-1980.
To the teachers, Sarah [)eFranco of the Trumanshurg Middle School ,Mary Bente and Jay Decatur of the African Woad School in Vestal, DougLarison of the Lansing Middle School, and Denny Wright of the'HomenJunior. High School. A special thanks goeS to Chuck Shrnka of the Boyn-ton Junior pigh School in Ithaca for some initial trials with our ideas.All these teachers have expended great effort to try these ideas intheir classes, and have provided honest and clear criticism of theprogram. Given all the constraints that classroom teachers work under,it is remarkable that they -tolerated all :the visits, revisions, re-writes,and re-definitions with smiles- and undertanding.
To the students of Trumansburg, Vestal, Lansing, Homer, and Ithacafor al4 their work on our behalf. Anyone involved in education knowsthat the student is our most'severe critic. We hope that we have given
them as much as they have helped us.
To the administrators, Joseph Meskill in Trumanshurg, Thomas Jonesin Lansing, Albert GUZ2i and Jack Higham in'Aiestal, and Harley Albro in
-Hamer. -Mir inte =rest and.support. arc mu
To those graduate students at Cornell who offered their time without
remuneration to work-on ideas that they thought important: Susan Mclby,
Erica Polakoff; and June Kinigstein. And to Kip Ault for -many ideas
.and- suggestions for improving this handbook.
To our consultants at Corn;Pt, Professors D. Bob Gowin, Emil Haller,
Donald Holcomb, Jasm.1111.1_man- andDomPaottEttiThui-r-const-t-int-pressing-----' far the right questions to be asked forced us finally to ask them. To
Professors. Robert Howe (Ohio State), Leo Klopfer and Audrey Champagne(University of Pittsburg), Jane Kahle (Purdue Wiversity), and Jill
Larkin (Carnegie Mellon University) for 'all their help and useful
suggestions.
Also, o-Ron-Armstrang=of___Sou,th Glen New York, who quite
independently worked with these strategies and graciously shared thoseexpediences and suggestions with us.
Several draftsof this handbook were prepared by Gerry .Johansen
who also coordinated staff efforts during the 1979-1980 school year.
TABLE OF CONTENTS
INTRODUCTION
Meaningful learning 1-1
The Knowledge "V" I-1
Concept Mapping 1-3
II LEARNING
Overview of Ausubel-Novak Theory 11-1
Activities in Meaningful Learning 11-4
Summary 11-12
111. CONCEPT MAPPING
Features of a Concept Map I J-1
Construction of a Concept Map T= III -2
Suggestions for Teaching Concept Mapping 111-7
IV. THE KNOWLEDGE "V"
Introduction to the Knowledge "V" 1V-1
Background Information and Definitions ofTerMs around the "V"- 1V-2
Use of the "V" as. a Pre-Teaching, Teaching,and Learning Tool IV-12
Suggestions for Introducing the Knowledge "V" IV-15
__integration of.the._"V" andConcept:N IV-1a
V. EVALUATION
Assessment of Student- ,Constructed Concept Maps V-2
Evaluation of Knowledge "V" - Identification,Definitions, and Examples of Terms V-9
Assessment of Siud6nt-Constructed "V's" V-12
Using the "V" in Sequence .. . .. ..=. . V-18
Integration of the "V" and Concept Mapping V -l9
Conceptual Questions: Use of the "V" and
Concept Mapping V-20
Cover Design by Fred Wendell
1
INTRODUCTION
MEANINGFUL LEARNING
THE KNOWLEDGE "V"
CONCEPT MAPPING
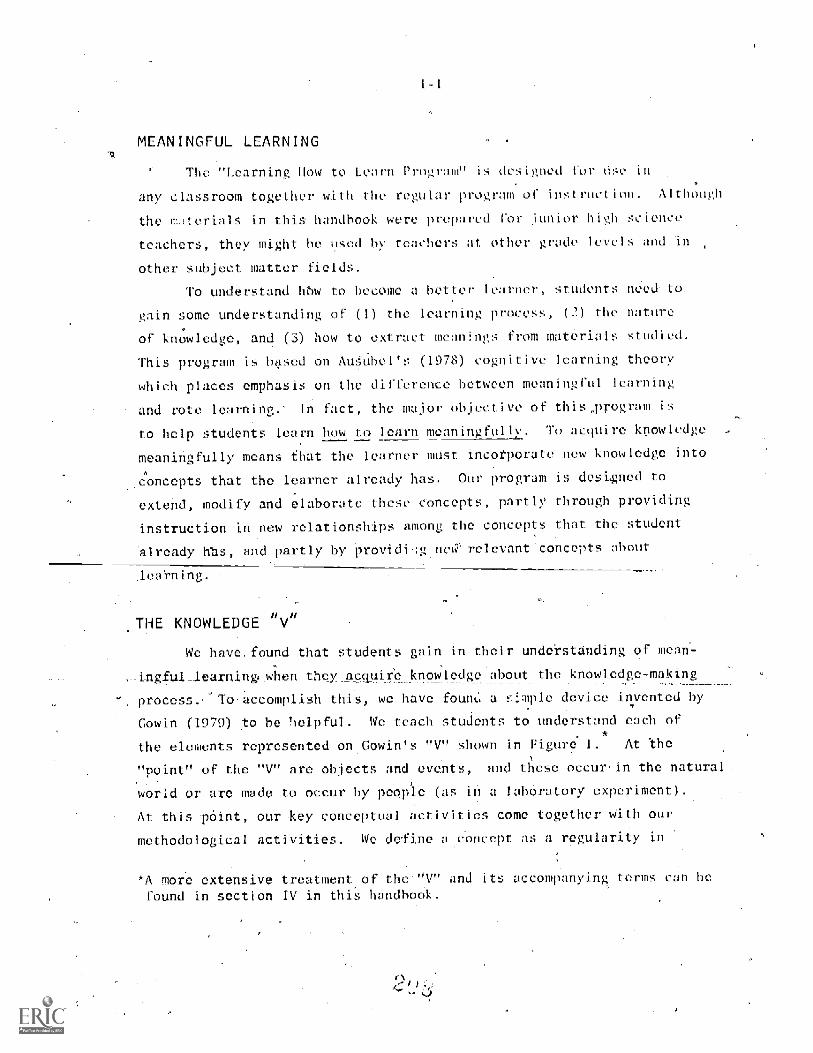
I =I
MEANINGFUL LEARNING
The "Learning How to Learn P- m" is designed fadr wise in
any classroom together with the regular pre gram _of instruction. lthough
the !!:.,.terials in this handbook were prepared for junior high science
teachers, they might he used by teachers at other grade levels and in
other subject matter tiel ds.
To understand 116w to become a better learner, students need- o
gain some understanding of (1) the heir-tin process, (2) the nature
of knowledge, and (3) how to extract meanings from materials studied.
This program is based on Au ibel's (1978) cognitive learning theory
which places emphasis on the difference between meaningful learning
and rote learning. In fact, the major objective of this program is
to help students ,learn how to learn meaninofullv. To acquire knowledge
meaningfully means that the learner must incot=por;ate anew knowledge into
concepts that the learner already has Our program is designed to
extend, modify and elaborate these concepts, Partly through providing
instruction in new relationships among the concepts that the student
already hhs, and partly by kovidi.rgnoW relevant concepts about
Jearning.
THE KNOWLEDGE "V"
We have. found that Students gain in their under_Landing of
,_ingful_learnin when they acquire knowledge about the knowledge-making
process- To accomplish this, we have founc'. a ::!mple device invented by
Gowin (1970) to be helpful. We teach students to understand each of
the elements represented enGowin's "V" shown in Figure 1. At the
"point" of the "V" are objects and events, and these occur in the natural
world or arc made to occur by people (as in a laboratory experiment).
At this point, our key conceptual activities come together With our
methodological -activities. We de -fine - concept as a regularity in
*A more extensive treatment of the "y" and its accompanying t -I can he
found-in section IV in this handbook.
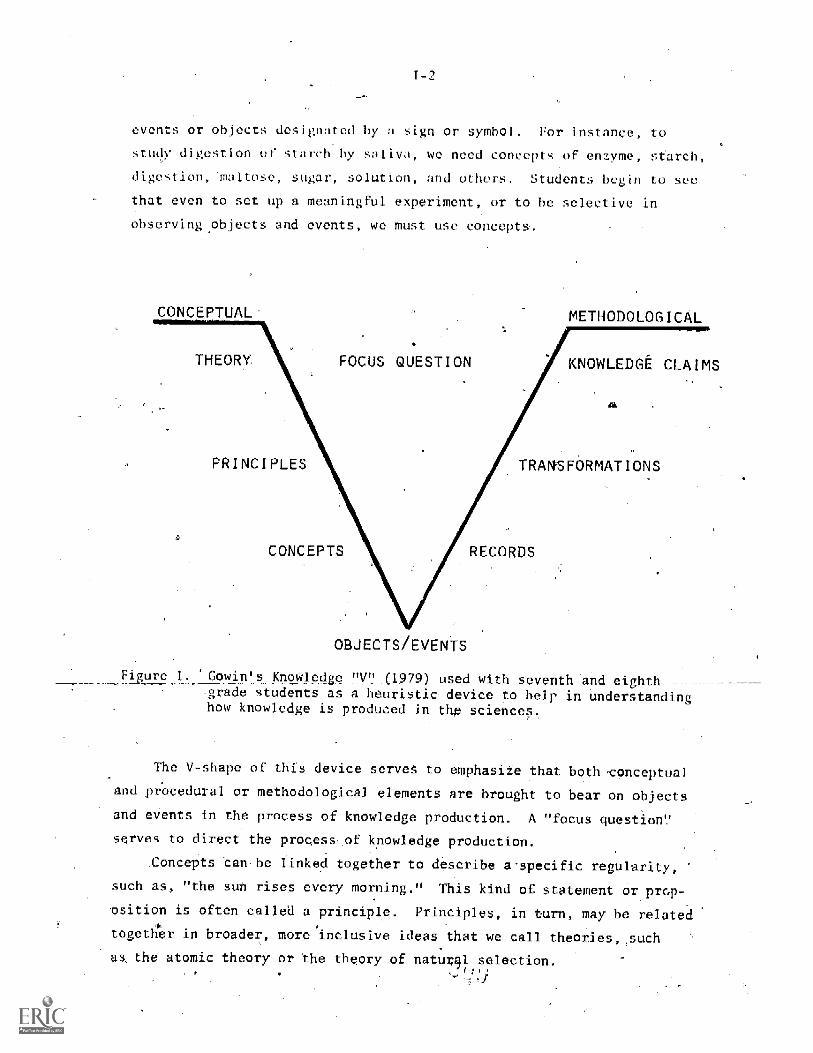
I -?
events or objects designated by a sign or symbol. for instance, to
study digestion of starch by saliva, we need concepts of enzyme,
digestion, maltose, sugar, solution, and others. Students begin to see
that even to set up a meaningful experiment, or to be selective
observing objects and events, we must use concepts.
CONCEPTUAL' METHODOLOGICAL
THEORY. FOCUS QUESTION KNOWLEDGE CLAIMS
PRINCIPLES TRANSFORMATIONS
CONCEPTS RECORDS
OBJECTS/EVENTS
Figure 1. Gowin's Knowledge_"V"_(i979) used with- seventh and eighthgrade students as a heuristic device to help in understandinghow knowledge is produced in 'dip sciences.
The V-shape of this device serves to emphasiie that both conceptual
and .procedural or methodological elements are brought to bear on objects
and events in the process of knowledge production. A "focus question'.'
serves to direct the process of knowledge production.
Concepts can be linked together to describe a-specific regularity,
such as, "the sun rises every morning." This kind of statement or prop-
osition is often called a principle. Principles, in turn, may be related
together in broader, more inclusive ideas that we call theories, such
as the atomic theory or the theory of natu99.1 selection./
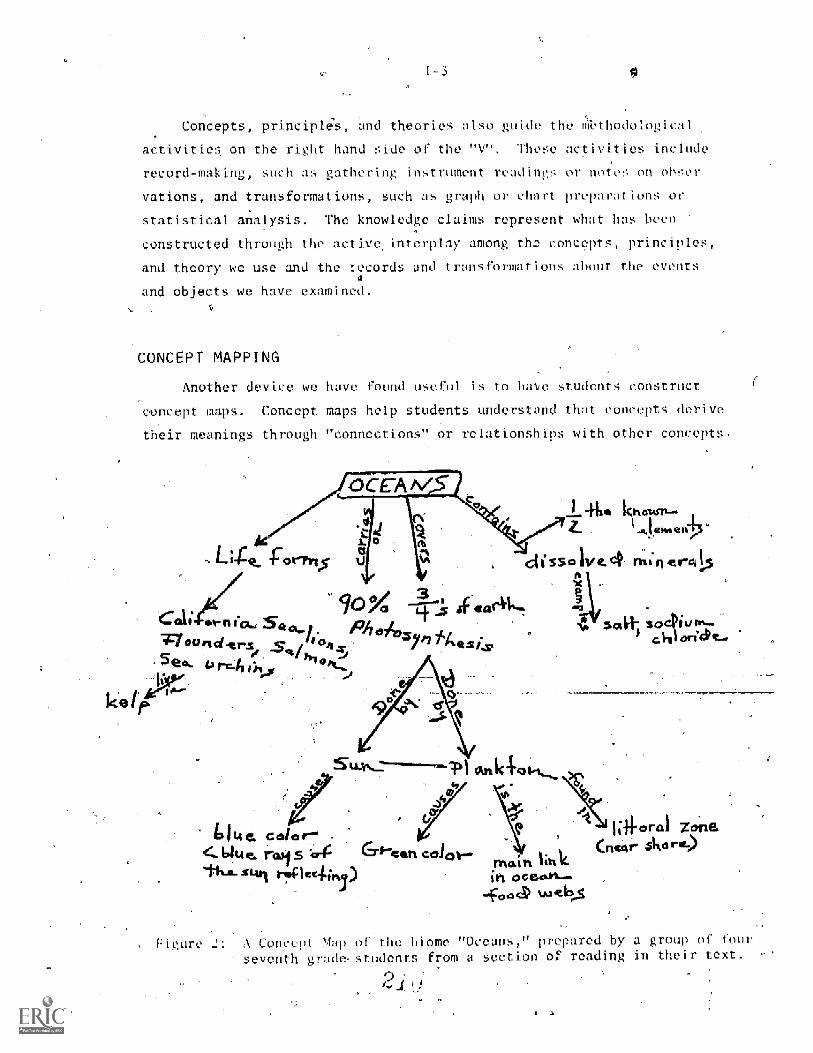
1-3
, k, ,
Concepts, principles, and theories also metn000iogIcat
activities, on the right-hand side of the "V". These activities include
record-making, such as gathering instrument readings or notes" on obser-
vations, and transformations, such as graph or chart cparations or
statistical analysis. The knowledge claims represent what has beef
constructed' through the active interplay among the concepts, principles,
and theory we use and the records and trmisforntions about the eventsa
and objects we have examined.
CONCEPT MAPPING
Another device we have found useful is to have students construct
concept maps. Concept maps help students understand that concepts derive
their meanings through "connections" or relationships with. other concepts.
I' i
ooeS? toe6.3
A Concept Map of the hi one "Oceans," prepared by a groupseventh grade. students from a section o reading in their text.
Il
I -4
To define a pen as a writing instrument is to relate the concept "pen"
to the conceits of- "writing "" and "instrument." Figure 2 shows a concept
map constructed by a group of seventh grade students from a textbook
reading on world biomes. We will discuss the procedure for teaching and
using concept maps in Section III of this handbook.
In summary, the "Learning How to Learn Program" is designed to be
used in classrooms to help students understand the nature of knoWledge
and the nature of cognitive learning.
LEARNING
OVERVIEW OF THE AUSUBEL-NOVAK THEORY
ACTIVITIES IN MEANINGFUL LEARNING
SUMMARY
OVERVIEW OF THE AUSUBEL-NOVAK THEORY
Throughout the elementary school pr gran, it is common for stud et
g the mean
ings of the words in the definitions or rules to ideas they 10roady
understand. In fact, students often come to believe that rote memoriza-
tion of school information is the only way to As teachers, we may.
want to reduce rote learning, but often find ourselves helpless to achieve
more meaningful learning in the classroom. Two major reasons for this
dilemma are: (1) thestudent is not aware that there is an alternat
to rote learning, and (2) concepts that are to be learned are presented
in such a-way as to encourage rote memorization.
The intention of this section of the "Learning How to Learn Hand-
book" is to provide the student with an alternative to'rote memoriza-.
tion by showing him/her that it is more .efficient to learn in a meaning-
ful way. -Further, this section and the, ones that follow will provide
the teacher with information about how instructiencan be organized
to facilitate meaningful learning and diScourage rote memorization.
The Ausubel-Novak learning theory attempts to provide a descrip-
to memorize definitions or procedural rules without
tion of how learning takes place in the learner, how the learner
processeS new information, and how that,information is stored. Already,
twp terms of the Ausubel-Novak theory have been introduced. The first
rote learning. Rote- learning occurs when information that is learned
stored arbitrarily within the cognitive structurekof the individual.
In other words, thd new information or concept has no psychological
connection to other concepts and their meanings. Activity 01 in this
section is an example of information that is learned rotely. If quizzed
en the meaning of the words (concepts) of the Pledge of Allegiance, how
many students would be able to give adequate answers?
The opposite of rote learning is meaningful learning. Meaningful
learning occurs when the learner is able to link new information to
concepts and meanings that s/he already has in his/her cognitive uc
*cognitive structure is the composite ,of stored knowledge representingthe concepts, propositions, and other information learned by an individ-
II-2
In other words, new information to be learned is not taught arbitrarily,
but alWays in relation te,what the learner already knows.
In the following'seetions, learning activities are suggested that
will help students understand the differences between rote and meaning-,'
fl learning. Activities #2 and #5 illuStrate the difference between
rote learning and meaningful learning. List #1, on page 11-4, requires
that the student memorize the terms in a rote fashion. List #2, although
the same instructions are given, has the concepts arranged in a more
meaningful way. That is, they are already organized according to ice
cream flavors, animals, furniture, and colors. While doing this acti-,
vity, the teacher should find that the group of students with List P2
is able to learn the list of items more quickly than those students with
List #1. Lists P3 and P4 on page II-5, demonstrate the distinction
between'rote learning and meaningful learning is not always a simple one.
List #3 gives the names of a group of flowers; List #4 gives the botan-
ical names for parts of a plant. Which one is more meaningful? Which
is more rote?
Activities #4, and #5 will demonstrate the use of prior ekpe
ences and knowledge to provide the organizing links that make new
information more meaningful. Activity #4 does this by giving one group-
of students-an organizing sentence which provides the meaningful link
between the prior knowledge and the new information in the paragraph.
Activity M3 introduces the idea of Concept -mapp: 1g as.a means of
organizing the information learned into a more meaningful fashion.. And
,Activity #6 illustrates the idiosyncratic nature of the concepts that
a learner possesses. Although each person stores information in an
idiosyncratic way, there are enough regularities among the meanings of
our 5 to ~ed concepts sothilt-communication can occur.
In the last activity, the distinction between -rote and meaningful
learning:is-considered more directly. In this one, the learner is asked
to identify those concepts that s/he considers meaningfully learned
and those s/he considers rotely -learned, The meanings,of the concepts,
indicated by the regularities werecognize for that concept and the
specific events and objects as example of each concept, demonstrate the
relative meaningfulness of these concepts to,students.
lI-
It is hoped that through the examination of the concepts of rot
learning and meanin fuI learning the student can roc gnir = what is
quired to move toward meaningful learning and k-.way,f owrote learnil
:Further, it is hoped that the teacher can begin to re-e xamine how infor-
mation _ presented to the learner, either in lessons or in textbooks.
And that the strategies presented inthe "Learning flow io Learn Program",
can facilitate this transition to the more meaningful, efficient
teaching and learning of concepts.
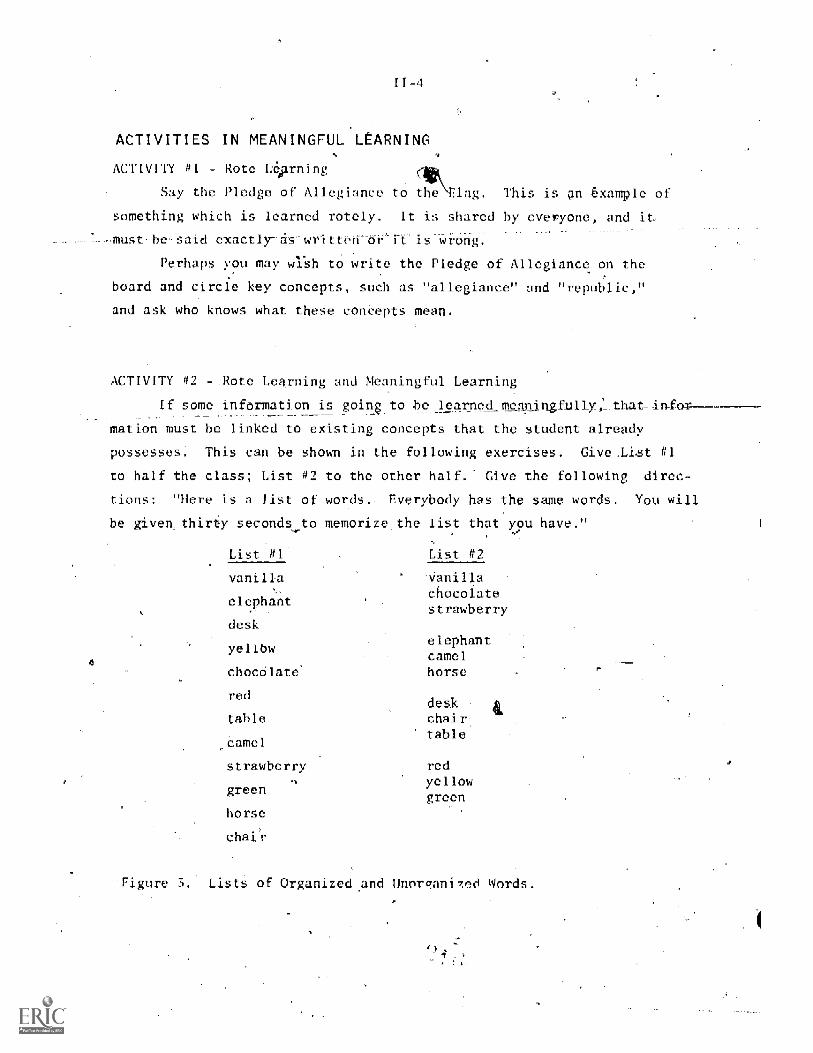
I
ACTIVITIES IN MEANINGFUL LEARNING
ACTIVITY itl - Rote Leprning
Say the Pledge of Allegiance to 1 g This is n exampl
something which is learned rotely. shared by everyone, and it
must be said exactly ds writtenor it is wrong.
Perhaps you may wish to write the Pledge of Allegiance on the
board and circle key concepts, such as "allegiance" and "republic,"
and ask who knows what these concepts mean.
ACTIVITY #2 -.Rote Learning and Meaningful Learning
If some information is going to be learned meaningfult--in-for
mation must be linked to existing concepts that the student already
possesses. This can be shown in the following exercises. Give ..List #1
to half the class; List to the other half.' Give the folloWing direc-
tions: "Here is a list of words. Everybody has the same words. You will
be given, thirty seconds to memorize the list that you have."
List #1
vanilla
elephant
desk
List #2
-Vanilla
chocolatestrawberry
yellbwelephantcamel
chocelate horse
reddesk
table chairtableable
strawberry redyellow
green green
horse
chair
Figure Lists of Organized and Hnorqnnized Words.
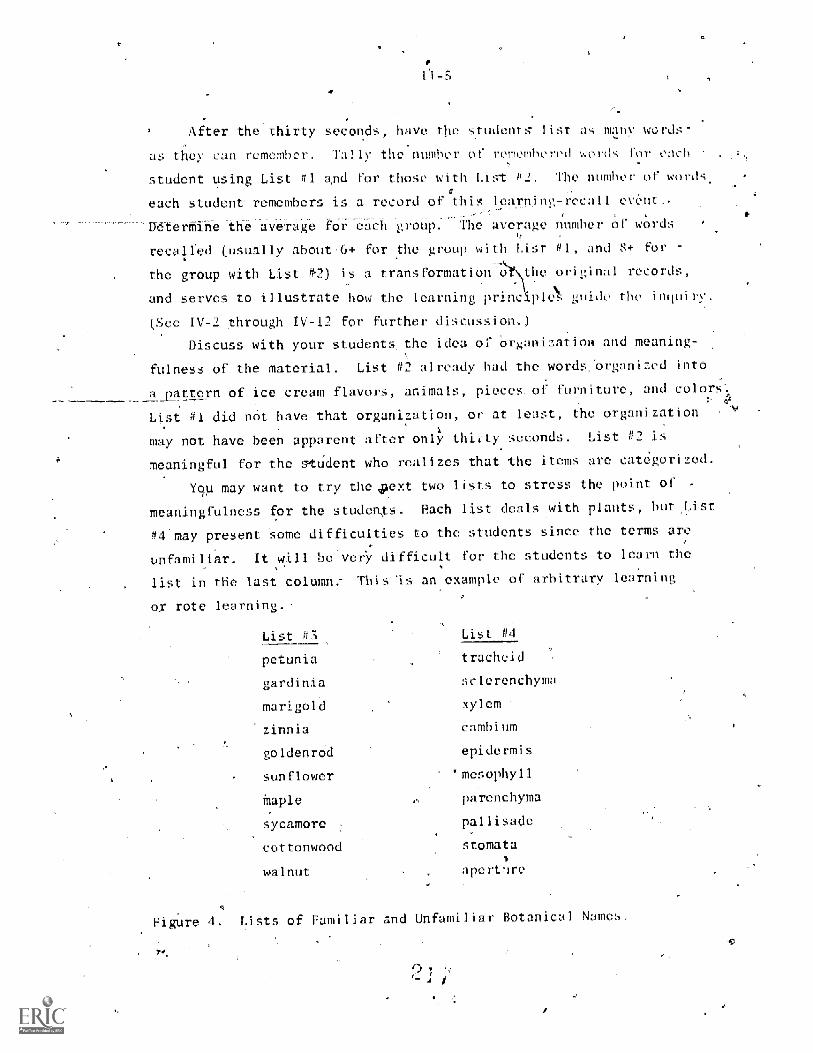
as S
r
er the thirty seconds, have the students lis
can remember. Ta ly the number cif remombe roil
many words-
. each
student using List NI ;:ind for those with List N2. The number of words.
each student- remembers is a record of tits learninv-iccall event... .-
Deterffiine the average for each group. The average number of words
recalfed (usually abou
the group with List P.?)
for the group with List NI, and 8+ for
tran he original records,
and serves to illustrate how the learning prin guide the inquiry.
(See IV -2 through IV -12 for further discussion,)
Discuss with your students the idea or Organization and meaning-
fulness of the material. List t12 already had the words 'organized into
a pattern of ice cream flavors, animals, pieces. of furniture, and colors.
List #1 did net have that organization, or at least, the organization
may not have been apparent after only thirty seconds. List 02 is
meaningful for the s=tudent who realizes that the items are eat.gorized.
Ygm may want to try the pext two lists to stress the point of
meaningfulness for the students. each list deals with plants, but List
#4'may present Some difficulties to the students since the terms arc
unfamiliar. It will be very difficult for the students to learn the
list in the last column. is an example of arbitrary learning
or rote learning.
List r<< List N4
petunia tracheid
gardinia sclerenehyma
marigold xylem
zinnia cambium
goldenrod epidermis
sunflower 'mesophyll
Maple parenchyma
sycamore pallisade
cottonwood stomata
walnut ape _nre
Figure 4. Lists of Familiar and Unfamiliar Botanical Names.
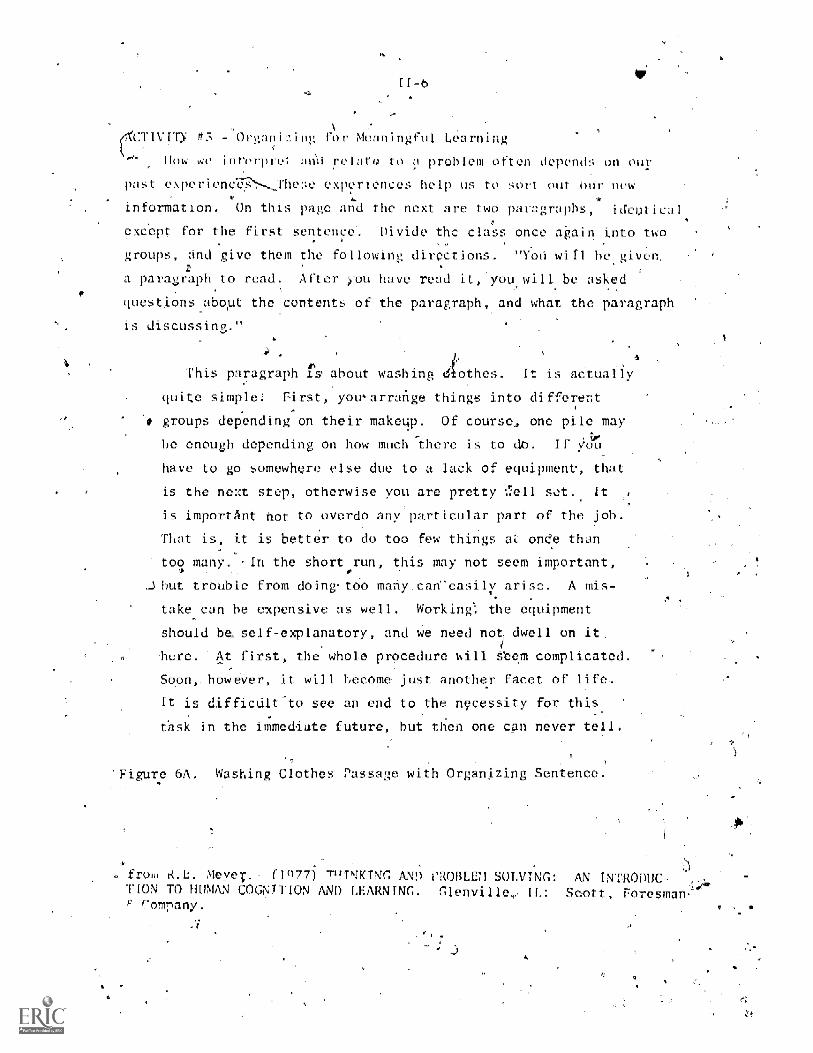
I1 -6
ft3 Organiz Meaningful Learning
Dow we interpret uni relro to problem often depends on i
past experienOT3>-Thew experICnces help us to sort out our new
information. On this pave and the next are two paragraphs, idcn
except for the first sentence. Divide the class once again into two
groups, and give them the following directions. "Yost will be
a paragraph to read. After you have read it, you will be asked
questions about the contents
is discussing."
the paragraph, and what the paragraph
This paragraph rs about washing irothes. It is actually
to simple-4 First, you arrange things into different
# groups depending on their makeup. Of course, one pile may
be enough depending on how much there is to do. If ycliti
have to go somewhere else due to a lack of equipment, that
is the next stop, otherwise you are pretty sot..
is important not to overdo any particular part of the job.
That is, it is better to do too few things a one than
too many. In the short. run, this may not seem important,4 0
__ trouble from doing' too many can-easily arise. A mis-
take can he expensive as well. Working: the equipment
should 1-.)e_ self-explanatory, and we need not: dwell on it
here. At first, the whole procedure kill stem complicated.
Soon,. howeAter, it will become just another facet of life.
It is difficiilt-to see an end to the necessity for this
task in the immed -iate -uture, but then one can never tell.
lure 6A. Washing Clothes Passage with Organizing Sentence.
from k.h. Mever. (1077) TI1INKING ANT) PROBLEM SOLVING: AN INTRODUC-TION TO HUMAN COGNITION AND LEARNING. Glenville IL: Scott, Foresman-c= (7ompany.
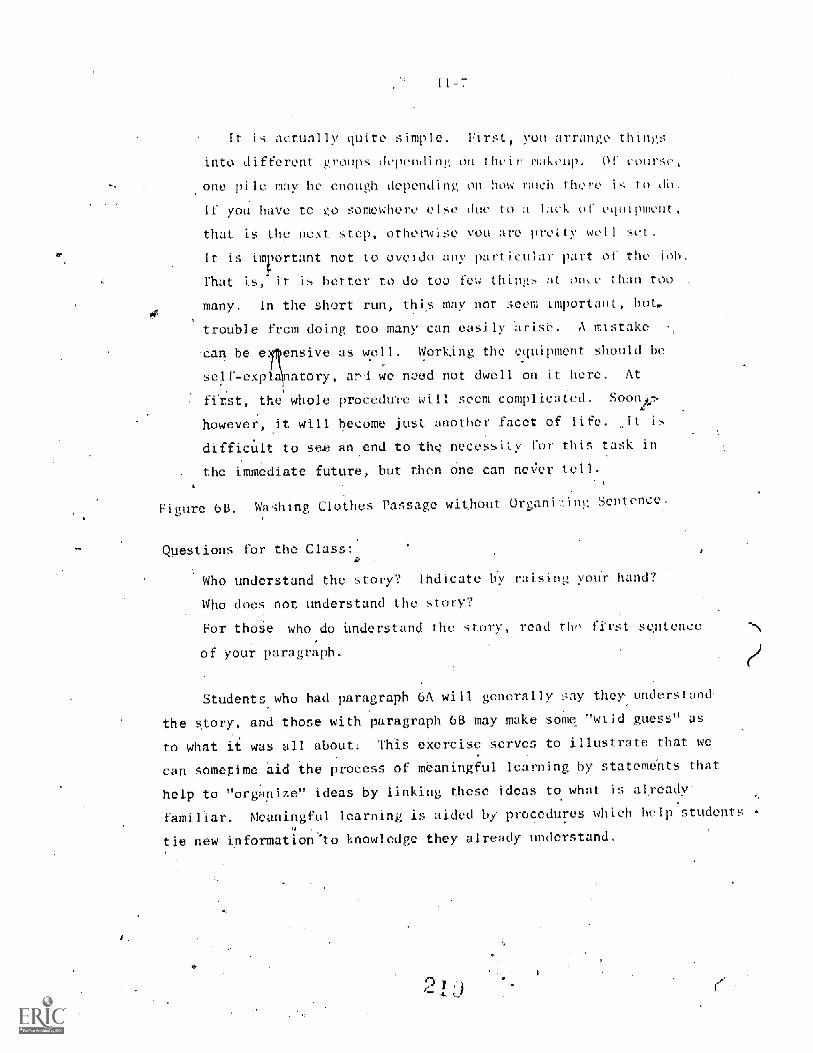
11=7
It is actual1 quite simple. Brut, you arrange things
course,
one pile may he enough depending on hot.; imich there (.16.
If you have to go somewhere else due to a kick equ ipment,
that is the next step, otherwise you are pretty wel 1 set.
It is hare'. it not to overdo any particular part c i the _ioh, .
That is, it is better to do toe few thins at once than too
many. In the short run, this may not seem important, but.
trouble frem doing too many can easily arise. A mistake
into di groups depending on their makeup.
can be e ensive
exp_a ate ry
first, the whole
however, it will
difficlt to see
as well. Working the equipment should be
art we need not dwell on it here. At
procedure will seem complicated.
become just another facet of lit
an end to thQ necessity for this task in
Soon,An,
the immediate future, but then one can never tell.
re 6B. Washing Clothes Passage without 0 ni7ing ence.
Questions for the Class:
Who understand the story" indicat by raising your hand?
Who does not understand the story?
For those who do Understand the story, react tlir f'i'rst sentence
of your paragraph.
Students who had paragraph 6A will generally say they understand,
the story, and those with paragraph 6B may make some id guess" as
to what it was all about. This exercise serves to illustrate that we
can sometime. aid the process of meaningful learning by statements that
help to "organize" ideas by linking these ideas to what is alreadv-
familiar. Meaningful learning is aided by procedures which help students
tie new information 'to knowledge they already understand.
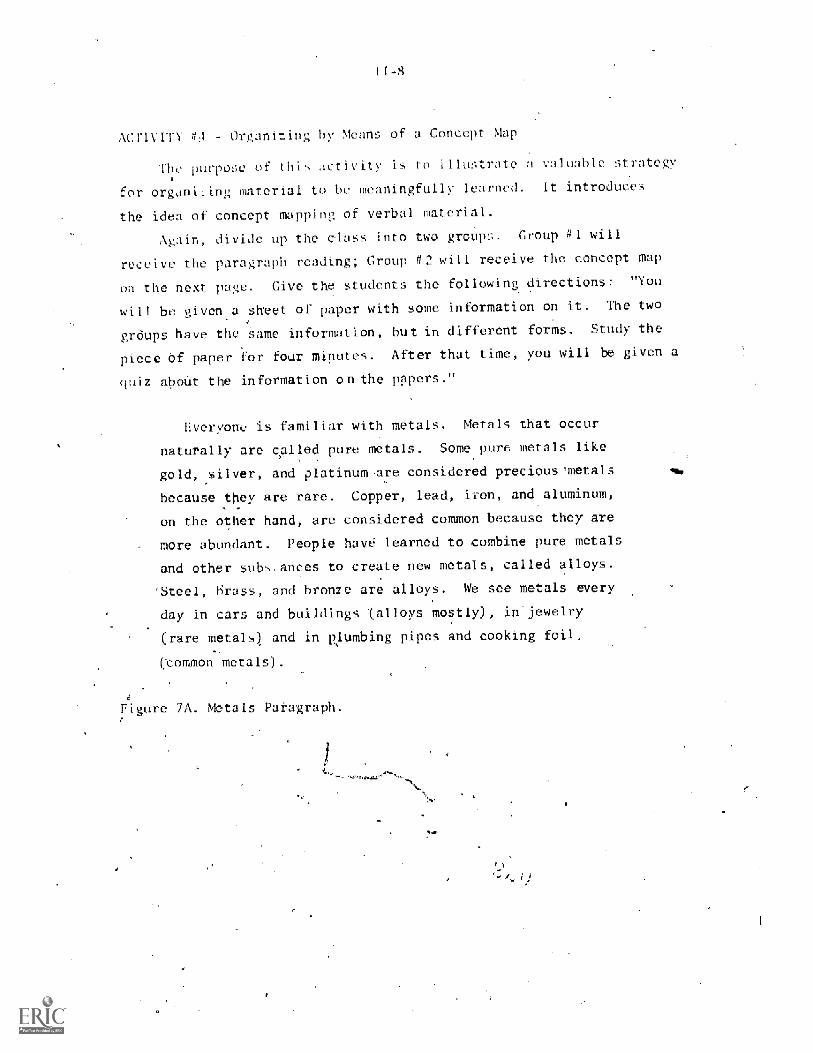
\CT1VITY Orpani: %ng, by Means of a Concept Map
The purpose of t h
for organLing material
aCtl to illustrate lua le strategy
he meaningfully learned It introduces
the idea of concept mapping of verbal mate
Aga divide up the class into two groups. Group #1 will
receive he paragraph reading; Group 01 will receive the concept,map
on the ext page. Give the students the following directions: "You
ll be given a sheet of paper with some information on it. The two
grdups have the Same information, but in different forms. Study the
piece of paper for four minutes. After that time, you will be given a
quiz about the in on the papers."
Lveryone is familiar with metals. Metals that occur
naturally are called pure metals. Some pure metals like
gold, silver, and platinum are considered precious metals
because they are rare. Copper, lead, iron, and aluminum,
on the other hand, are considered common because they are
more abundant. People have learned to combine pure metals
and other substances to create new metals, called alloys.
`Steel, brass, and bronze are alloys. We see metals every
day in cars and building.- (alloys mostly), in jewelry
(rare metals) and in plumbing pipes and cooking foil.
mon metals).
Figure 71. Metals Paragraph.
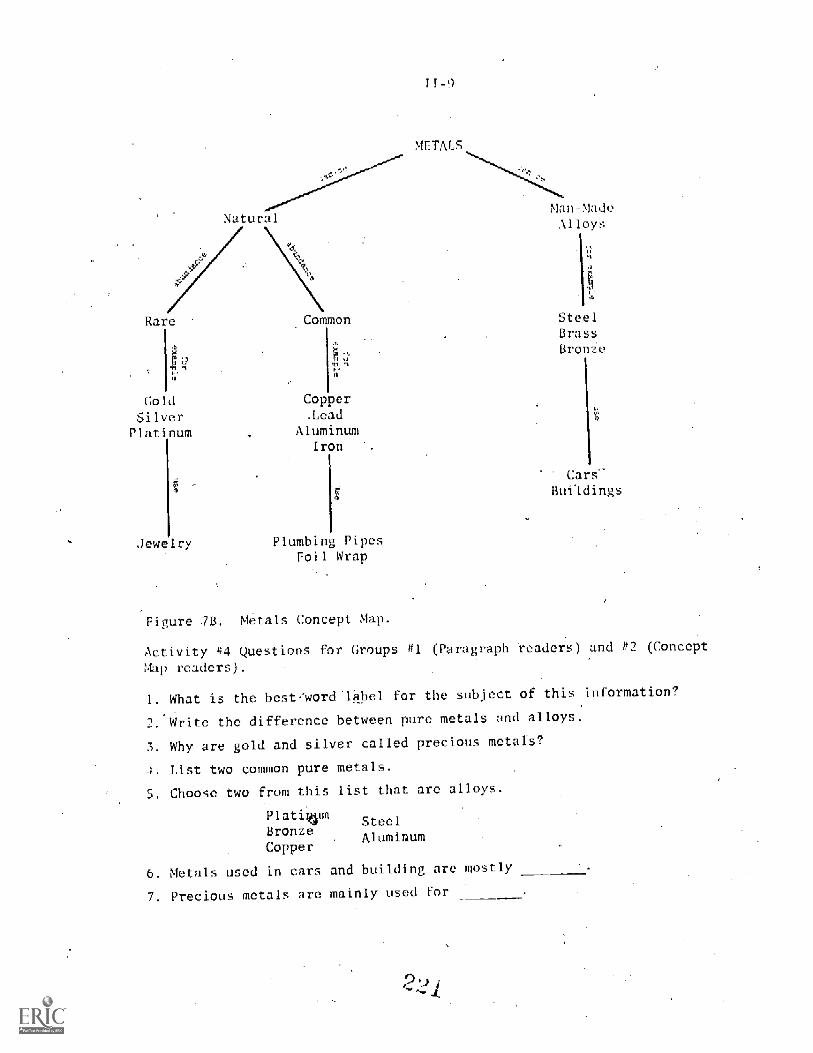
T-9
Rare
GoldSilverPlatinum
Common
g :=2-0 'I
Copper.Lead
AluminumIron
Jewelry Plumbing PipesFoil Wrap
Figure .79. Metals Concept Map.
Alloys
SteelBrassBronze
Car..
Buildings
Activity #4 Questions for. Groups al (Paragraph readers) and (Concept
',tap readers
1. What is the best-'word label for the subject of this information?
Write the difference between pure metals and alloys.
3. Why are gold and silver called precious metals?
List two common pure metals.
S. Choose two from this list that are alloys.
PlativmBronzeCopper
6. Metals used in cars and building are mostly
7. Precious metals are mainly used for
SteelAluminium
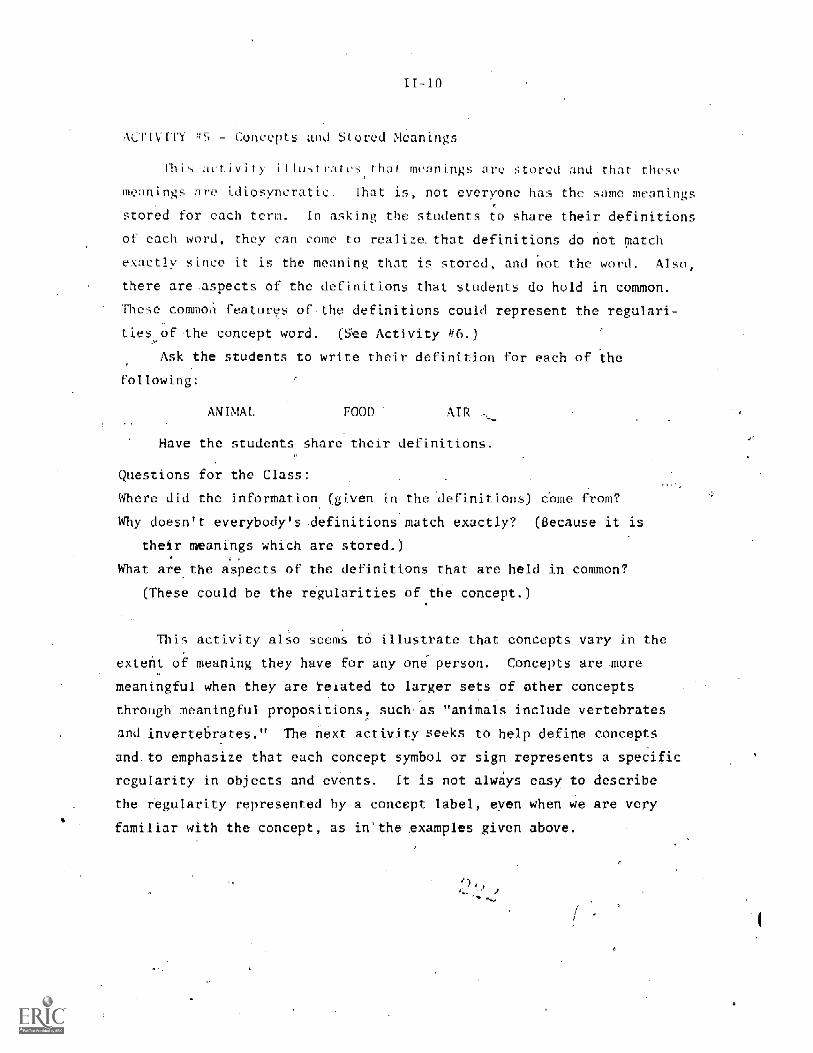
I
ACTIVITY 05 - Concepts and Stored Meanings
11 s ac t iv i t lostra os that meanings are stored and that these
meanings are idiosyncratic. That is, not everyone has the same meanings
stored for each term. In asking the students to share their definitions
of each word, they can come to realiza that definitions do not matchfi
exactly since it is the meaning that is stored, and not the word. Also,
there are.spects of the definitions that students do hold in common.
These common features of-the definitions could represent the regulari-
ties of the concept word. (See Activity #6.)
Ask the students to write their definition for each the
following:
ANIMAL FOOD AIR
Have the students share their definitions.
Questions for the Class:
Where did the informationi (given in the definitions) come from?
Why doesn't everybody's- definitions match exactly? (Because it is
their meanings which are stored.)
What are the aspects of the definitions that are held in common?
(These could be the regularities of the concept.)
This activity also seems to illustrate that concepts vary in the
extent of meaning they have for any one person. Concepts are nore
meaningful when they are related to larger sets of other concepts
through meaningful propositions, such as "animals include vertebrates
and invertebrates." The next activity seeks to help define concepts
and_to emphasize that each concept symbol or sign represents a specific
regularity in objects and events. It is not always easy to describe
the regularity represented by a concept label, even when we are very
familiar with the concept, as in'the examples given above.
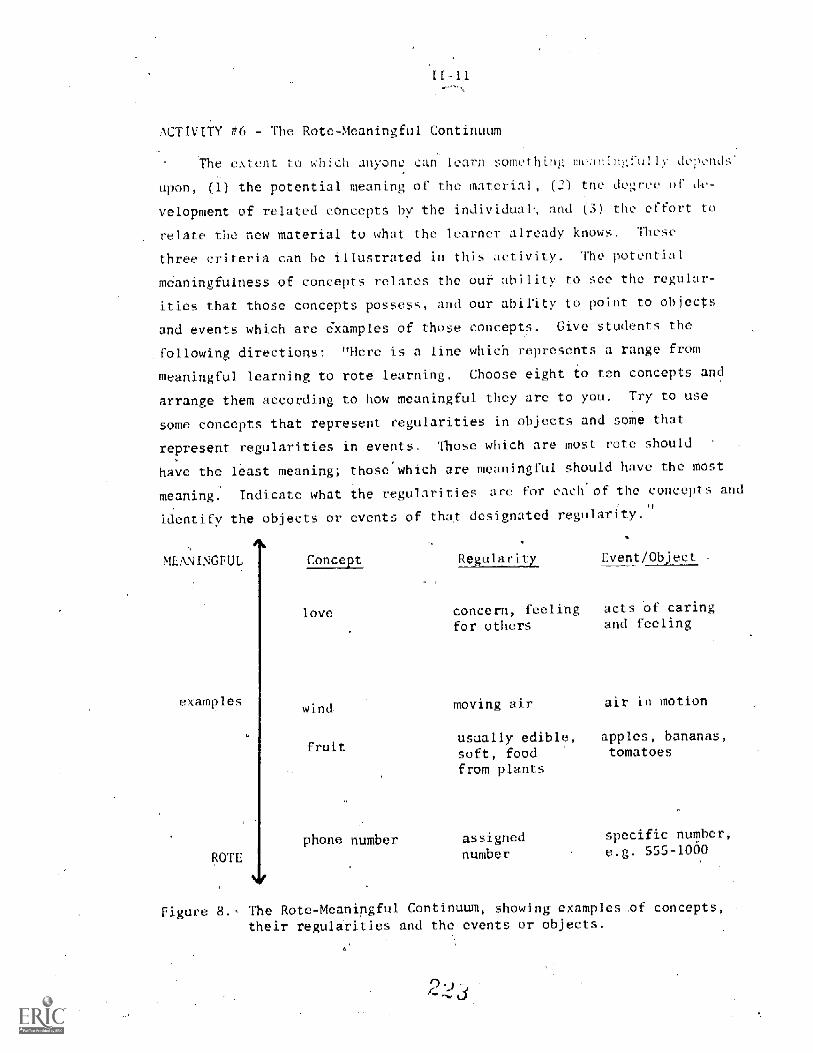
ACTIVITY #6 The Rote9Meanins ful Continuum
The exten h anyone can learn tiomething meaninglully uds.
upon, (1) the potential meaning of the material , (2) tne degree _ de-
velopment of related concepts by the individual', and the- effort to
relate the new material to what the learner already knows. These
three criteria can be illustrated in this activity. The potential
meaningfulness of concepts relates the our ability to see the regular-
ities that those concepts possess, and our ability to point to objects
and events which are examples of those concepts. Give students the
,following directions: "Here is a line which represents a range from
meaningful learning to rote learning. Choose eight to to concepts and
arrange them according to how meaningful they are to you. Try to use
some concepts that represent regularities in objects- and some that
represent regularities in events. Those which are most rote should
have the least meaning; those'which are meaningful should have the most
meaning. Indicate what the regularities are for each of the concepts
identify the objects or events cf that designated regularity.
MEANINGFUL
examples
ROTE
Re ularitT Event/Obiect
love concern, feeling acts of caringand feeling
wind
fruit
phone number
for others
moving air air in motion
usually edible, apples, bananas,
soft, food tomatoes
from plants
assignednumber
specific number,
e.g. 555-1060
Figure 8., The Rote-Meaningful Continuum, showing examples-.of concepts,
their regularities and the events or objects.
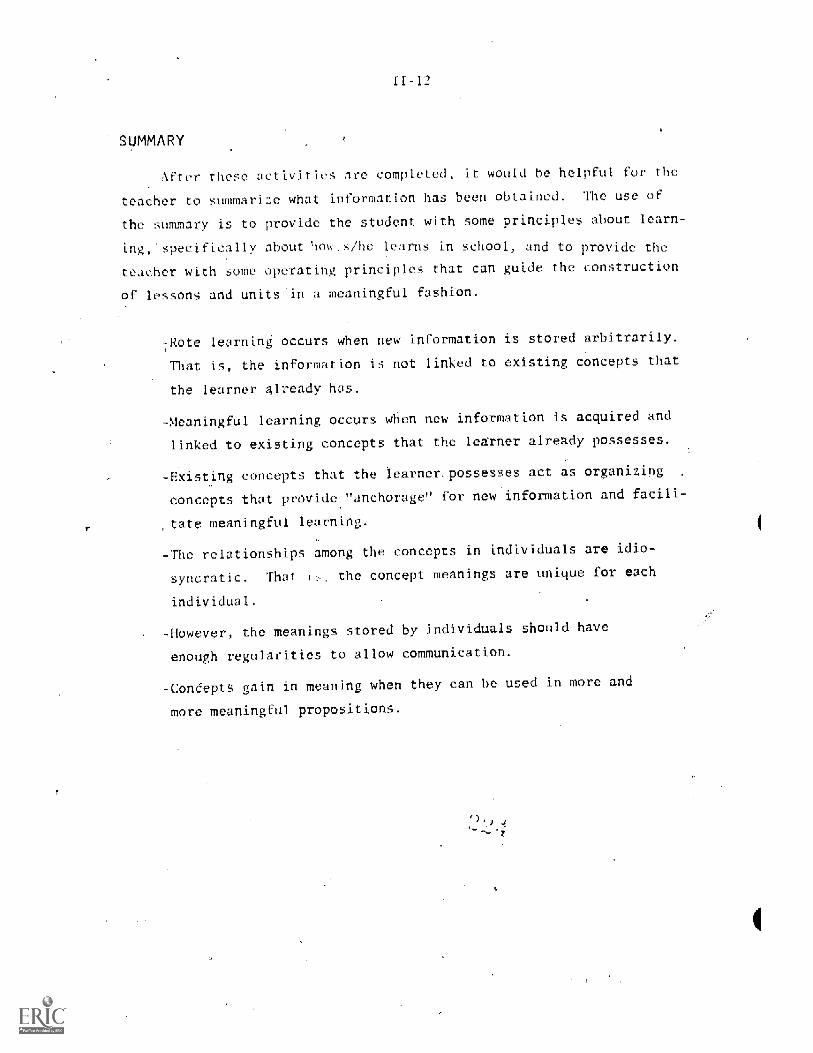
IT-12
SUMMARY
After tieso activities are completed, it would he helpful for the
teacher to summarize what information has been obtained. The use of
the summary is to provide the student with some principles about learn-
specifically about how .s/he learns in school, and to provide the
teacher with some operating principles that can guide the construction
of lessons and units in a meaningful fashion.
learning when new information is stored arbitrarily.
That is, the information is not linked to existing concepts that
the learner already has.
-Meaningful learning occurs when new information is acquired and
linked to existing concepts that the learner already posses
-Existing concepts that the learner. possesses act as organizing .
concepts that provide "anchorage" for new information and facili-
,tate meaningful learning.
-The relationships among the concepts in individuals are idio-
syncratic. That the concept meanings are unique for each
individual.
-However, the meanings stored by individuals should have
enough regularities to allow communication.
-CondeptS gain in meaning when they can be used in more and
more meaningful propositions.
CONCEPT MAPPING
FEATURES OF A CONCEPT MAP
CONSTRUCTION OF A CONCEPT MAP
SUGGESTIONS FOR TEACHING CONCEPT MAPPING
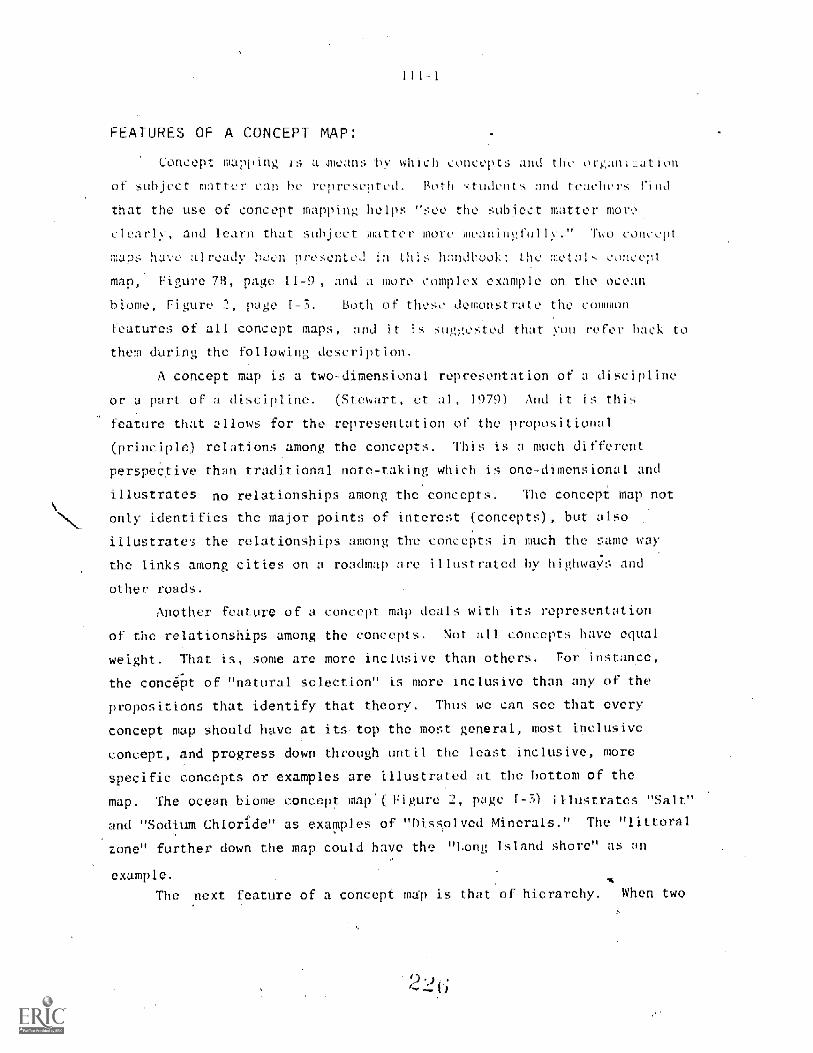
FEATURES OF A CONCEPT MAP:
Concept mapp a n al- which con and th organi:_at
lbjeCt Matter can he repro, 0 Both - tridents and teacher-; rind
that the use of concept mapping helps "see the subiect matter more
clearly, and-learn that subject matter more meaningfully." Two cone
maps have already been presented in this li:indFooki the- metals can e[;
map, Figure 7B, page II-9, and a inure complex example on the ocean
biome, Figure 2 page 1-3. Both of these demonstrate the common
features of all concept maps, and it
them during the following description.
A concept map is a two-dimensional representation of a discipline:
or a part of a discipline. (Stewart, et 1979) And it is this
feature that allows for the representation of the propositional
(principle) relations among the concepts. This is a much different
perspective than traditional note-taking which is one-dimensional and
illustrates no relationships among the concepts. The concept map not
only identifies the major points of interest (concepts), but also
illustrates the relationships among the concepts in much the same way
the links among cities on a roadmap
other roads.
Another feature of a concept map deals with its representati
of the relationships among the concepts. Not all concepts have equal
weight. That is, some are more inclusive than others. For instance,
'pt
ant eted that You refer hack to
illus ed by highwa;'s and
the concept of "natural selection" is more inclusive than any of the
propositions that identify that theory. Thus we can see that every
concept map- should have at its-top the most general, most inclusive
concept, and progress down through until the least inclusive, more
specific concepts or examples are illustrated at the bottom of the
map. The ocean biome concept map ( Figure 2, page l-5) illustrates "Salt"
and "Sodium Chloride" as examples of "Dissolved Minerals." The "littoral
zone" further down the map could have the "Long Island shore" as an
example. A
The next feature of a concept mil is that of hierarchy. When two
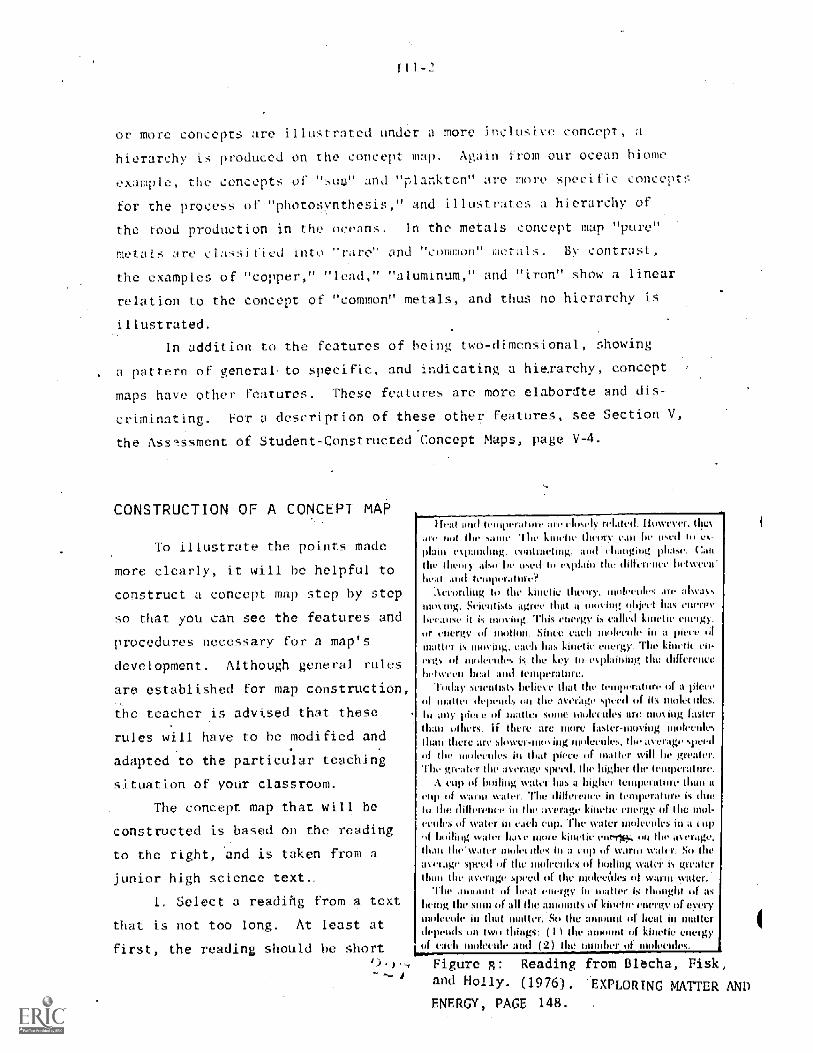
or more concepts are illustrated under a more inclusive concept, a
hies rchy i<s produced on the concept map. Again from our ocean hiom
more specific concepts
for the process of "photosvnthesis," and illustrate a hierarchy of
the food production in the oceans. In the metals concept map "pure"
metals are classified into "rare" and "common" metals. By contrast,
the examples of "copper," "lead," "aluminum," and "iron" show a linear
relation to the concept of "common" metals, and thus no hierarchy is
illustrated.
example, the concepts of "suu" and "plankton"
In addition to the features of hcin two- dimensional, showing
a pattern of general: to specific, and indicating a hierarchy, concept
maps have other f -uros. These features are more elabordte and dis-
criminating. For a description of these other features, see Section V,
the Assssment of Student-Constructed Concept Maps, page V-4.
CONSTRUCTION OF A CONCEPT MAP
To illustrate the points made
more clearly, it will be helpful to
construct a concept map step by step
so that you can see the features and
procedures necessary for a map's
development. Although general rules
are established for map construction
the teacher is advised that these,
rules will have to he modified and
adapted to the particular teaching
situation of your classroom.
The concept map that will be
constructed is based on the reading
to the right, and is taken from a
junior high science text..
1. Select a readifig from a text
that is not too long. At least at
first, the reading should be short
!feat :mil tenting-Attic are closely related, 111.ns-ever. the%itre not the '.,hilt'. lite LIttelie theory can lie used (ii ex-plain expanding. contracting. changing phase. CanIt theory also be used tti eNnlailt the difference between'
heat and teniperattire ?porthlig to the kinetic theory. molecules art. tilsvass
in ing. Stletinsts agree that it moving object hits Ciii.rirrit is moving. This energy is called kinetic energy,
or energy of mottint. Since each molecule in a were amailer is 'mixing, eacli has kinetic energy. The kint.ticergs if ittttictliles is. the key to esplaining the differencebetween heat and temperature,
Today scientists believe that the temperature of a 'neveif matter depends tat the avertige speed a Its molecules.lit any piece of utalte, some molecules are musing faster111311 others. if there are more faster-moving moleculesthan there are slower-mos mg molecules, the as erage slicedof the molecules itt that piece of matter will be greater.The greater the average speed, the higher the temperature.
A cop of boiling seater has a higher temperature than alip of Witter TIM! 111 temperature is dueii the difference ill the average kinetic energy of (Ile 111a-':tiles 441 xvater cup. The svater itiolecides it) a t
of boiling water have more kinetic eta-i-mA on the average,than the water inoleeitles iii a cup of warni 'water. So theaverage .speed of the intilecilles of boiling water is greaterthan the average speed of the molec4les itt warm sea_
he moonlit id heat energy m matter is 161011 of IISlieink the slnn iii 411 the or every
I ulct-tile in that matter. Sit the amount ml heat in matterdepends tni two things: (1 I the moonlit of kinetic energy
t.ach molecule and (2) the untidier of molecules.
., Figure 8: Reading from Blecha, Fisk,and Holly. (1976). EXPLORING MATTER AND
ENERGY, PAGE 148.
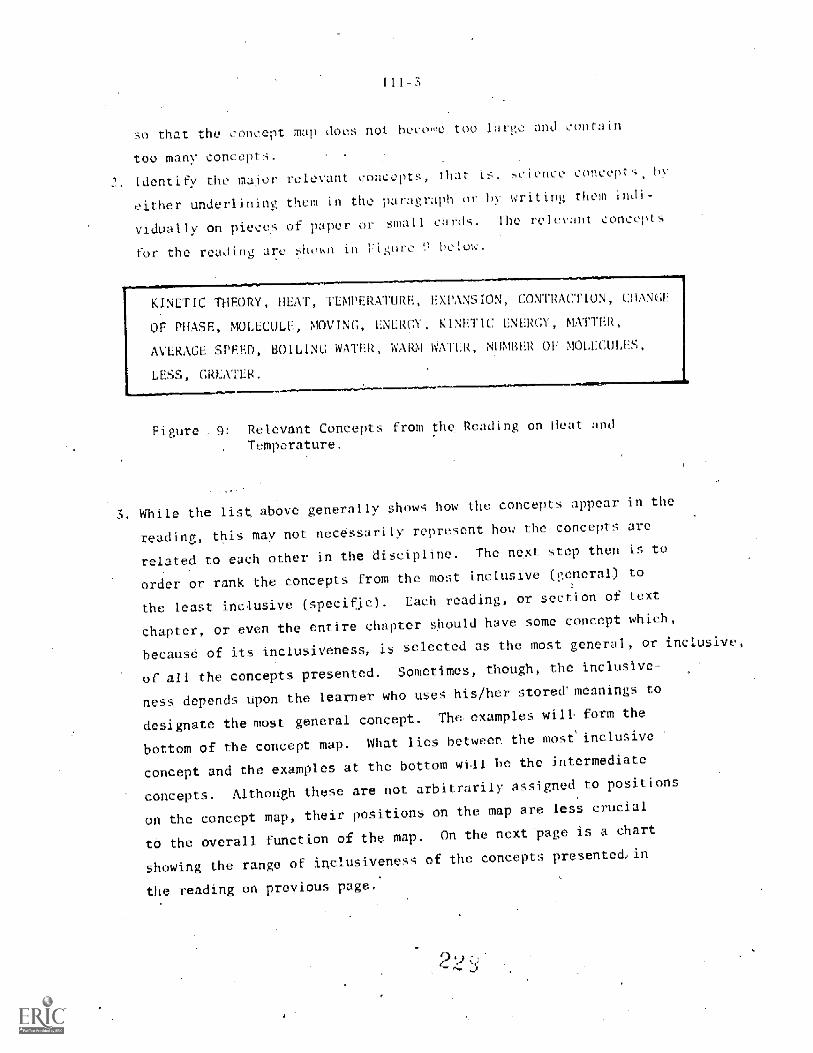
I I -3
so that the concept map does not beeorne too large and eontain
too many concepts.
Identify the major relevant concepts, that concept--;
either underlining them in the paragraph or by writwritin them indi
vidually on pieces of paper r small cards. The relevant conee,,
for the reading are shohn in F ore 9 I elow.
KINETIC THEORY, HEAT, TE_ IPERATURE,
OF PHASE, MOLECULE, MOVING, ENERGY,
'SION, CO, T :110N, CHANGE
TlC ENERGY, MATTER,
AVERAGE SPEED, BOILING WATER, WARM WATER, NUMBER OF MOLECULES,
LESS, GREATER.
Figure , 9: Relevant Concepts fromTemperature.
ding on Heat and
While the list, above generally shows how the concepts appear in the
reading, this may not necessarily represent how the concepts are
related to each other in the discipline. The next step then is to
order or rank the concepts from the most inclusive (general) to
the least inclusive (specific). Each reading, or section of text
chapter, or even the entire chapter should have some concept which,
because of its inclusiveness, is selected as the most general, or inclusive,
of all the concepts presented. Sometimes, though, the inclusive-
ness depends upon the learner who uses his/her storectmeanings to
designate the most general concept. The:examples will form the
bottom of the concept map. What lies between the most inclusive
concept and the examples at the bottom Will he the intermediate
concepts. Although these are not arbitrarily assigned to positions
on the concept map,their positions on the map are less crucial
to the overall function of the map. On the next page is a chart
showing the range of inclusiveness of the concepts presented,in
the reading on previous page.
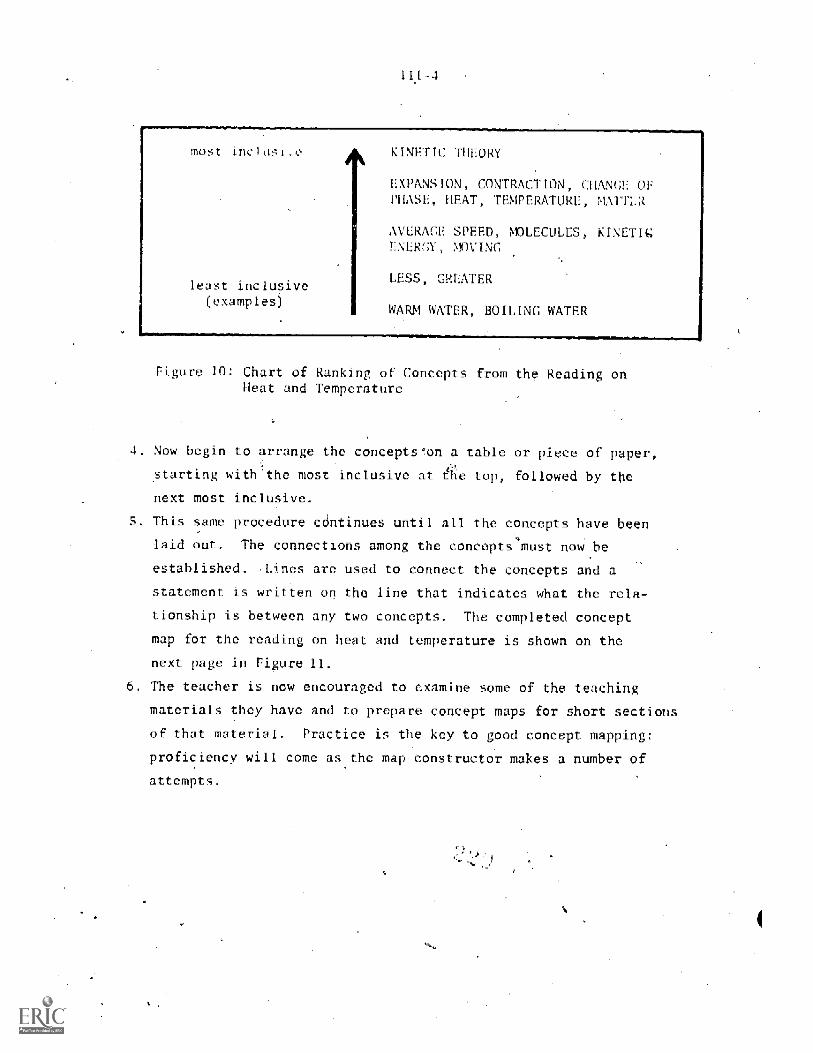
most inclusi.o
least inclusive(examples)
KINETIC THEORY
EXPANSION, CONTRACTION, :MANGE OFPHASE, HEAT, TEMPERATURE, MATTER
AVERAGE SPEED, MOLECULES, KINETIC;ENERGY, MOVING
LESS, CRIATER
WARM WATER, BOILING WATER
Figure 10: Chart of Ranking of Concepts from the Reading onHeat and Temperature
Now begin to arrange the conceptsWn a table or piece of paper,
starting with'the most inclusive at ate top, followed by the
next
This
laid
most inclusive.
same procedure cdntinues until all the concepts have been
out. The connections among the concepts must now .he
established. ..Lines are
statement is written on
tionship is between any
used to connect the concepts
the
two
map for the reading on heat
next page in Figure 11.
6. The teacher is now encouraged to examine some of the teaching
materials they have and to prepare concept maps for short sections
of that material. Practice is the key to good concept mapping:.
proficiency will come as the map constructor makes a number of
ine that indicates what
concepts. The completed
and temperature is shown
and a
the vela-
concept
on the
attempts.
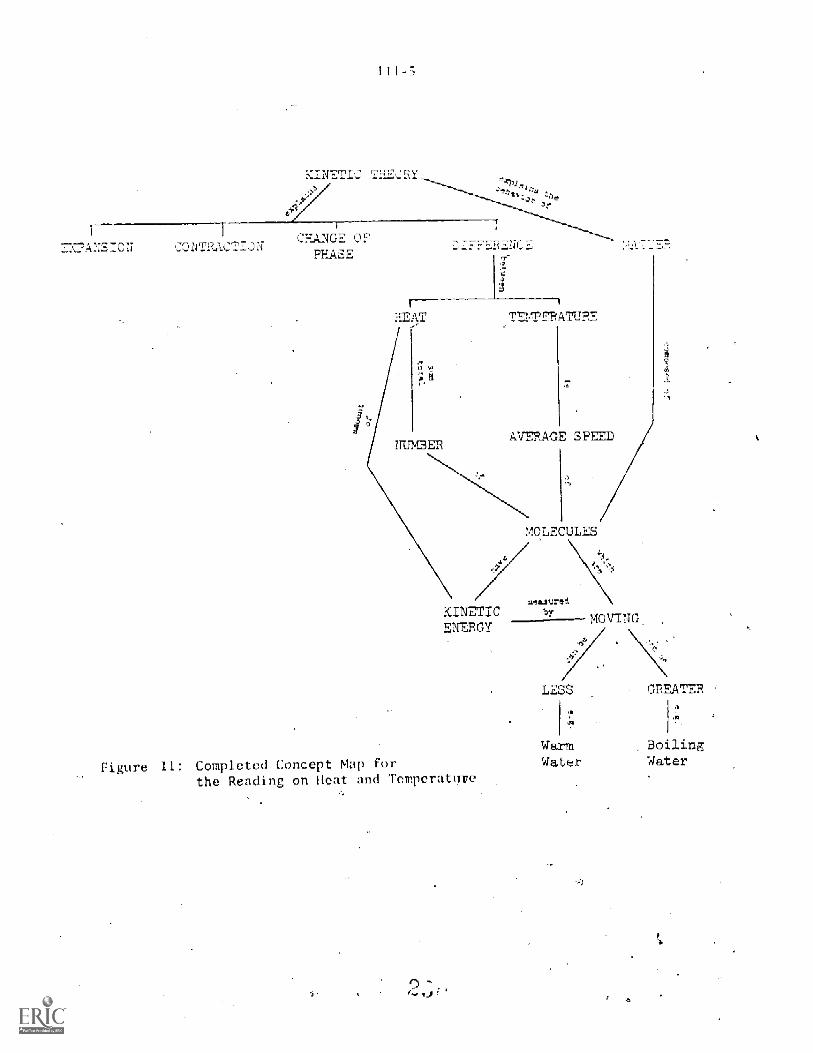
E:CPANSION CONTRACTION2s lGZ OF
PHASECIFFERENCE
NL11,MER
2E ?AT?
5z Sys 2
MGLECULES
=eurtdKINETIC
al
ENERGY
Figure 11: Completed Concept Map forthe Reading on Heat and Temperatnre
LESS
Warmmater
GRZUPER
1 .i.,
BollingWater
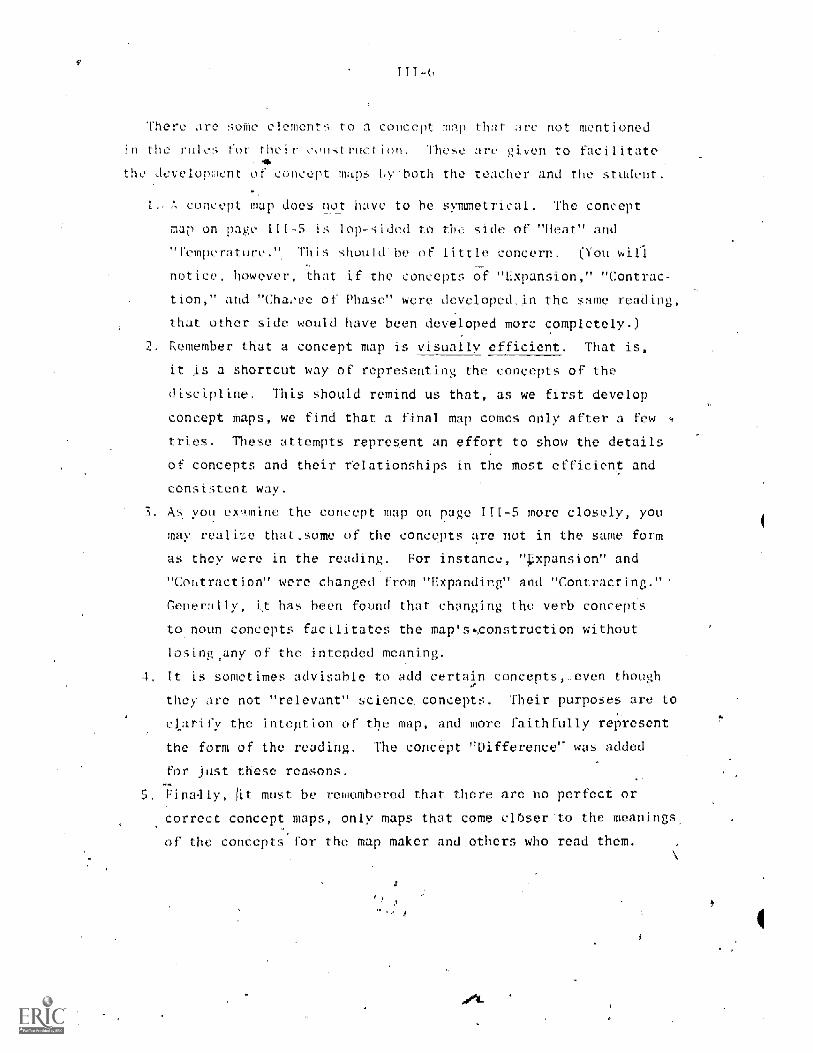
f
There are some elements to a concept map that arc not mentioned
in the rules ft t their construe_ n. These are given to facilitate
the development or cone pt maps both the= teacher and the student
map does not have to be symmetrical. Tht concept
on page 111-5 is lop-sided to the side of "Heat" and
"Temperature." This should be of little concern. (You will
notice, however, that if the concepts of "Expansion," "Contrac-
tion," and "Chaoge of Phase" were developed in the same reading,
that other side would have been developed more completely.)
Remember that a concept map is visually efficient. That is,
it is a shortcut way of representing the concepts of the
discipline. This should remind us that, as we first develop
concept maps, we find that a final map comes only after a few ,
s. These attempts represent an effort to show the details
concepts and their '-lationships in the most efficient and
consistent way.
As you ex arsine the concept map on page 111-5 more closely, you
may realize that.some of the concepts are not in the same form
as they were in the reading. For instance, "expansion" and
"CoNtraction" were changed from "Expanding and "Contracting.
Generally, i.t has been found that changing the verb concepts
to noun concepts facilitates the map'sconstruction without
losing any of the intended meaning.
It is sometimes advisable to add certain concepts,. en though
they re not "relevant" science, concepts. Their purpose- are to
clarify the intention of the map, and more faithfully represent
the form of the reading. The concept "Difference" was added
for just these reasons.
r Fin lly, it must be remembered that there are no perfect or
correct concept maps, only maps that come clOser to the meanings,
of the concepts for the map maker and others who read them.
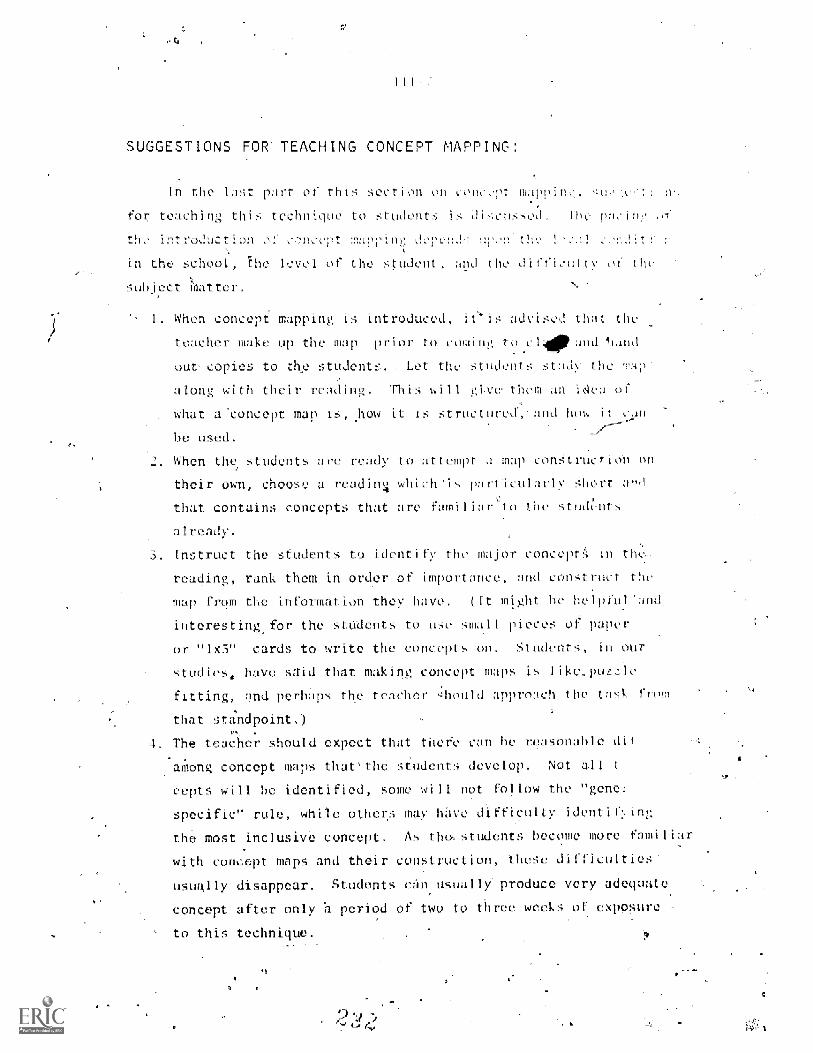
SUGGESTIONS FOR TEACHING CONCEPT MAPPING:
In the last part of this section on conc.,,pt mappin. He
for teaching this technique to students is di,-;cus!-.ed. Hc pricim 01.
the introduction o!' c,-mcept :napping derenin
in the school, Ehe level of the student. and the difficulty et the
subject :natter.
I When concept mapping is I nt rod cod i t i s advised that the
teacher make up the map prior to coming to clOand liand
out copies to tke students. . Let the students study the 'flAp
along with their reading. This will gvc, them an 14ea C
what a concept man is, .liow it is structured, and how it t.'kn
he used
When the students are ready to at a map conStruction On1
their own, choose a read in which is particularly short 0-1
that contains concepts that are familiar to the students
already.
3. Instruct the students to identify the major concept!-% in the:
reading, rank them in order of importance, and construct the
map from the information they have. (It might he helpful and
interesting for the students to use small pieces oC paper
or "I x3" cards to write the concepts on. Students, in Our
studies, have said that making concept maps is like_puzzlc
fitting, and perhaps the teacher should approach the task from
that standpoint.)
4. The teacher should expect that there' can be reasonable di
among concept maps tharthe students develop. Not all t
eepts will he identified, some will not follow the "gcnei
specific" rule, while others may have difficulty identif\ing
the most inclusive concept. As the, students become more familiar
with concept maps and their construction, these difficulties'
usually disappear. Students can usually produce very adequ4te
concept after only h period of two to three weeks of exposure
to this technique.
.5
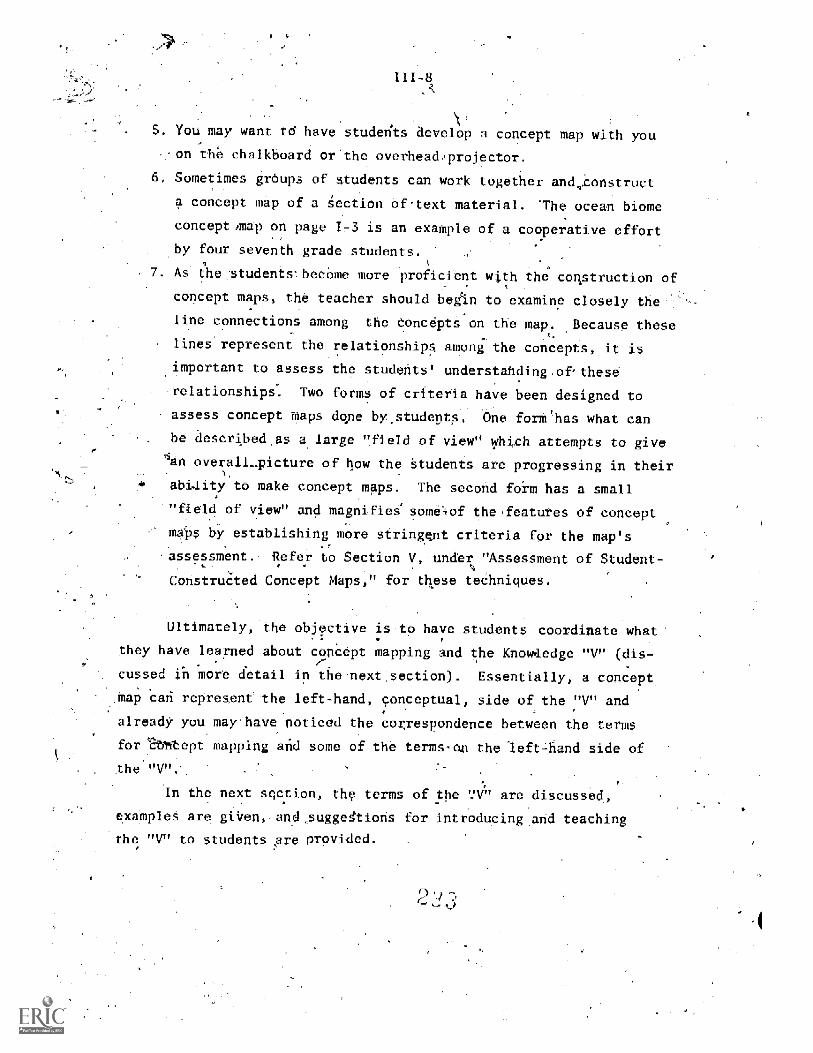
TII
'
You may want td have students develop a concept map with you
yon the chalkboard Or the overhead projector.
6, Sometimes groups of students can work together and,Construct
a concept mapof a Section Of.text material. The ocean biome-
concept map on page 13 is an example of a cooperative effort
by four seventh grade students.
7. As the studentsbeceme more proficient with the construction of1 .
concept maps, the teacher should begin to examine closely the--
line connections among the conceptS on the map. Because these
lines represent the relationships among the concepts, it is
.important to assess the students' understaildinvof these
relationships'. Two forms of criteria have been designed to
assess concept maps dope by_students. One forM'has- what can
be describedas a large "field of view" which attempts to give
an overall_picture of how the Students are progressing in their
ability to make concept maps. The second form has a small
"field of view" and magnifies somo=iof the .features of concept
mails by establishing more stringent criteria for the map's
assessment.- Refer to Section V. under "Assessment of Student-
Constructed Concept Maps," for these techniques.
Ultimately, the objective is to have students coordinate what
they have learned about concept mapping and the Knowledge "V"
cussed ih more detail in the nextSection). ESsentially, a concept.
Map can represent-the left-hand, conceptual, side of the "V and
already you mayhave noticed the correspondence between the terms
for aritept mapping and some of the terms -on the e-left4and side
the "V"
In the next section, the terms of the W" are discussed,
examples are giVen,andsuggetions for introducing and teaching
the "V" to students Are provided.
IV. THE KNOWLEDGE "V"
INTRODUCTION TO THE KNOWLEDGE "V"
BACKGROUND INFORMATION AND DEFINITIONS OFTERMS AROUND THE "V'
USE OF THE "V" AS A PRE-TEACHING) TEACHING,AND LEARNING TOOL
SUGGESTIONS FOR INTRODUCING THE KNOWLEDGE
INTEGRATION OF THE "V" AND CONCEPT MAPPING
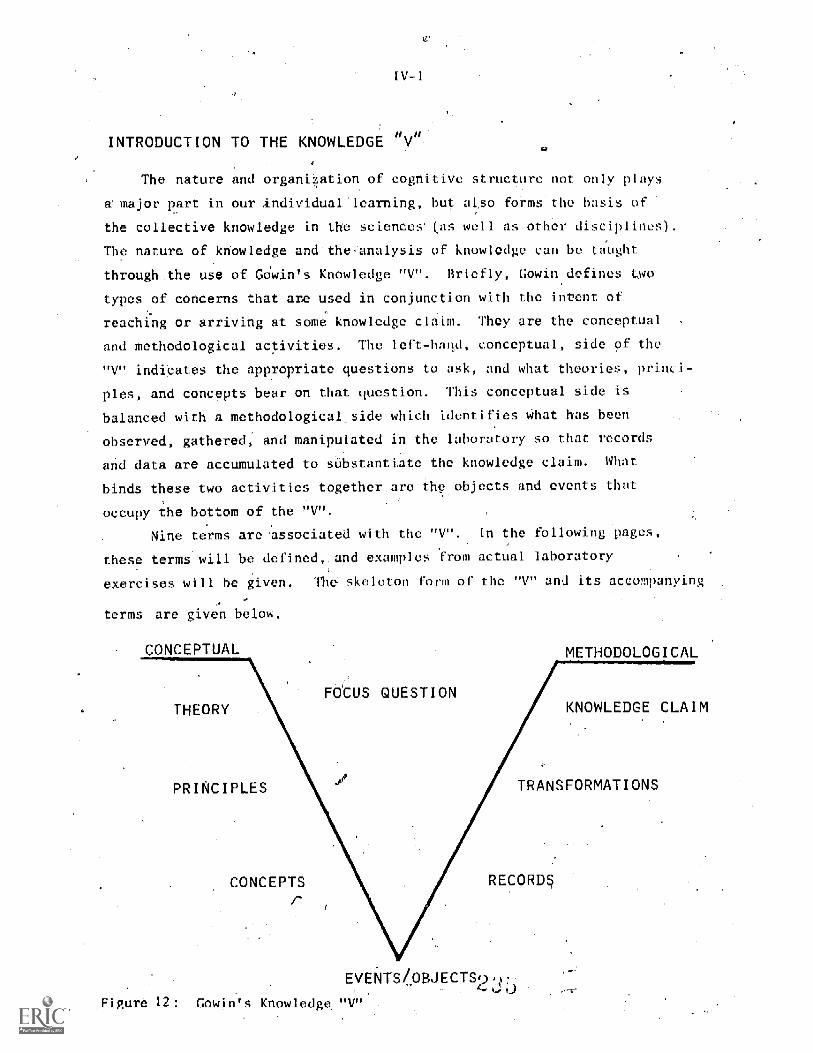
[V -1
INTRODUCTION TO THE KNOWLEDGE
The nature and organi;ation of cognitive structure net only plays
a- major part in our ,individual learning, but also forms the basis of
the collective knowledge in the sciences' as well as other disciplines
The nature of knowledge and of knowledge can be taught
through the use of Gewin's Knowledge "V". Briefly, Gowin defines two
types of concerns that are used in conjunction with the intent of
reaching or arriving at some knowledge claim. They are the conceptual
and methodological activities. The left-hand, conceptual, side of the
"V" indicates the appropriate questions to ask, and what theories, princi-
ples, and concepts bear on that question. This conceptual side is
balanced with a methodological_side which identifies what has been
observed, gathered, and manipulated in the laboratory so that records
and data are accumulated to substantiate the knowledge claim. What
binds these two activities together are the objects and events that
occupy the bottom of the "V".
Nine terms are associated with the "V". In the following pages,
these terms will be defined,, and examples from actual laboratory
exercises will be given. The skeleton form of the "V" and its accompanying
terms are given below.
CONCEPTUAL METHODOLOGICAL
FOCUS QUESTIONTHEORY KNOWLEDGE CLAIM
PRINCIPLES TRANSFORMATIONS
CONCEPTSp
EVENTS /OBJECTS
Figure 12: Gowin's Knowledge "V"
RECORDS
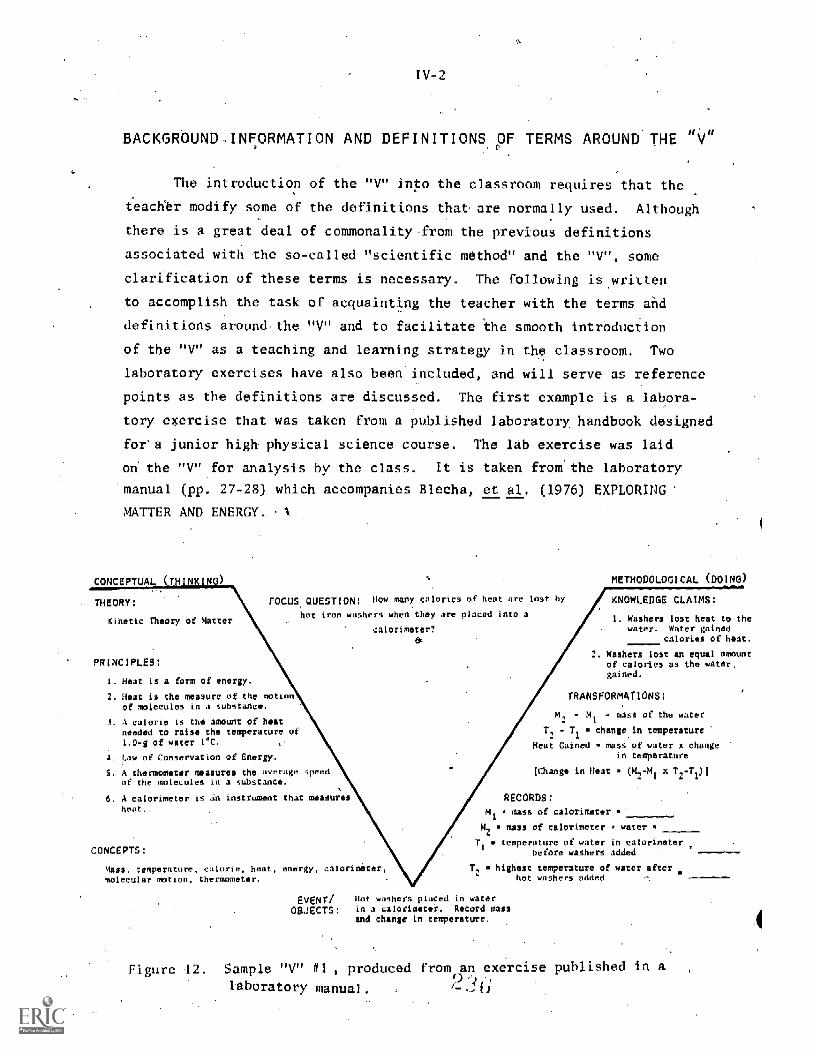
IV-2
BACKGROUND,INORMAT ON AND DEFINITIONS ©R TERMS AROUND THE
The introduction of the "V" inpo the classroom requires that the
teacher modify some of the definitions that are normally used. Although
there is a great deal of commonality-from the previous definitions
associated with the so-called "scientific method" and the "V", some
clarification of these terms is necessary. The following is written
to accomplish the task of acquainting the teacher with the terms and
definitions around he "V" and to facilitate the smooth introduction
II
of the "V" as a teaching and learning strategy in the classroom. Two
laboratory exercises have also been included, and will serve as reference
points as the definitions are discussed. The first example is a labora-
tory exercise that was taken from a published laboratory handbook designed
fora junior high physical science course. The lab exercise was laid
on the "V" for analysis by the class. It is taken from'the laboratory
manual (pp. 27-28) which accompanies Blecha, et al. (1976) EXPLORING
MATTER AND ENERGY.. A
CEPTUAL (THINK NK N
- THEORY;
Kihetic Theory of Matter
PRINCIPLES:
1 -. Heat is a form of energy.
1. Heat is the meaSure of the motion-lecules in a substance.
3. A calorie is the amount of heatneeded to raise the temperature of1.0-g of water l'C.
4. Law of Conservation of Energy.
5. A thermometer measures the averageof the molecules in a substance.
FOCUS QUESTION: How many calories of heat are lost by
hot iron washers when they are placed into a
METHODOLOGICAL (DOING)
KNOWLEDGE CLAIMS;
1. Washers lost heat to thecalorimeter' water. Water gained
calories of heaL
Washers lost an equal amountof calories as the water.gained.
p d
6. A calorimeter is an instrument that measuheat..
CONCEPTS;
TRANSFORMATIONS:
M2 - MI . mass of the water
T2 - T1 a change in temperature
Heat Gained . mass of water A changein temperature
in Heat . (M,-M1 x 1241)]
RECORDS:
mass of calorimeter
Taus of Calorimeter water
T temperature of water in calorimetertemperature water calorimeter _
before washers added
. highest mperature of water afterhot washers added
sass, temperature, calorie, heat, energy. calorimemolecular motion, thermometer,
EVENT/ Hot washers placed in water
OBJECTS: in a calorimeter. Record massand change in temperature.
Figure l2. Sample "V" #1 , produced from an exercise published in a
laboratory manual.,.._,
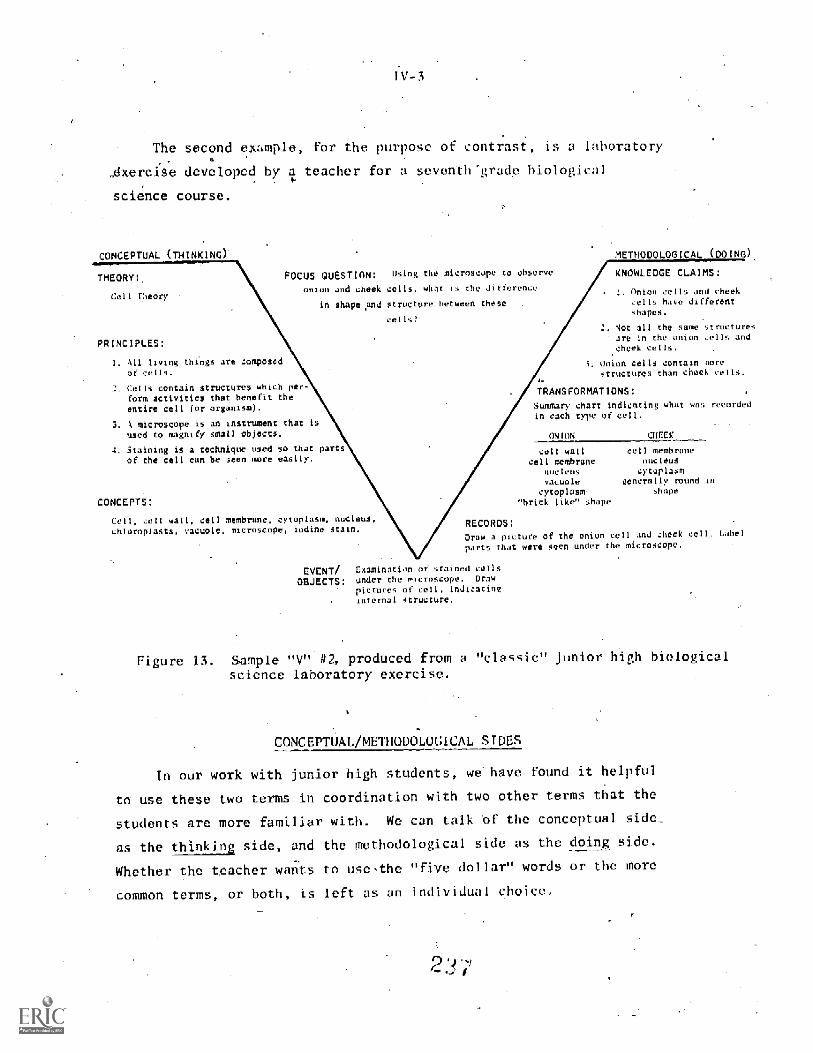
The second example, for the purpose of contrast, is a llborltory
.dxercise developed by a teacher for a seventirgrade biological, .
science course.
CONCEPTUAL (THINKING)
THEORY: FOCUS QUESTION: Using the 'croscope to observe
onion and cheek cells. what is the differenceCell Theory
PRINCIPLES:
All living things are composedof cells.
Cells contain structures which per-form activities that benefit theentire cell (or organism).
a. A microscope is an instrument that isused to magnify small objects.
a. 3taining is a technique used so that partsof the cell can be seen more easily.
in shape and structure between these
cells?
CONCEPTS:
Cell, cell wall, cell membrane, cytoplasm. nucleus.chloroplasts, vacuole, microscope, iodine stain.
EVENT/OBJECTS:
RECORDS:
Draw a pictuparts that w
Examination stained cellsunder the mi _ostope. Draw
pictures of cell, Indicatinginternal structure.
METHODOLOGICAL (DO IN
KNOWLEDGE CLAIMS:
1. Onion cells and cheekcells have differentshapes.
sot all the same structurese in the onion cells and
cheek cells.
3. Onion cells contain .sorestructures than check cells.
TRANSFORMATIONS:Summary chart indicating what was recordedin each type of cell.
owityq._ afEEK
cell wail ell membranecell membrane nucleus
nucleus cytoplasm
vacuole generally round in
cSqoplasm shaperick like" shape
of the onion cell and cheek cell. Labelseen under the microscope,
Figure 1 .Sample "V" #2, produced from a "classic "' junior high biological
science laboratory exercise.
CONCEPTUAL/METHODOLOGICAL SIDES
In our work with junior high students, we have found it helpful
to use these two terms in coordination with two other terms that the
students are more familiar with. We can talk of the conceptual side.,
as the thinking side, and the methodological side as the doing side.
Whether the teacher wants to use-the "five dollar" words or the more
common terms, or both, is left as an individual choice.
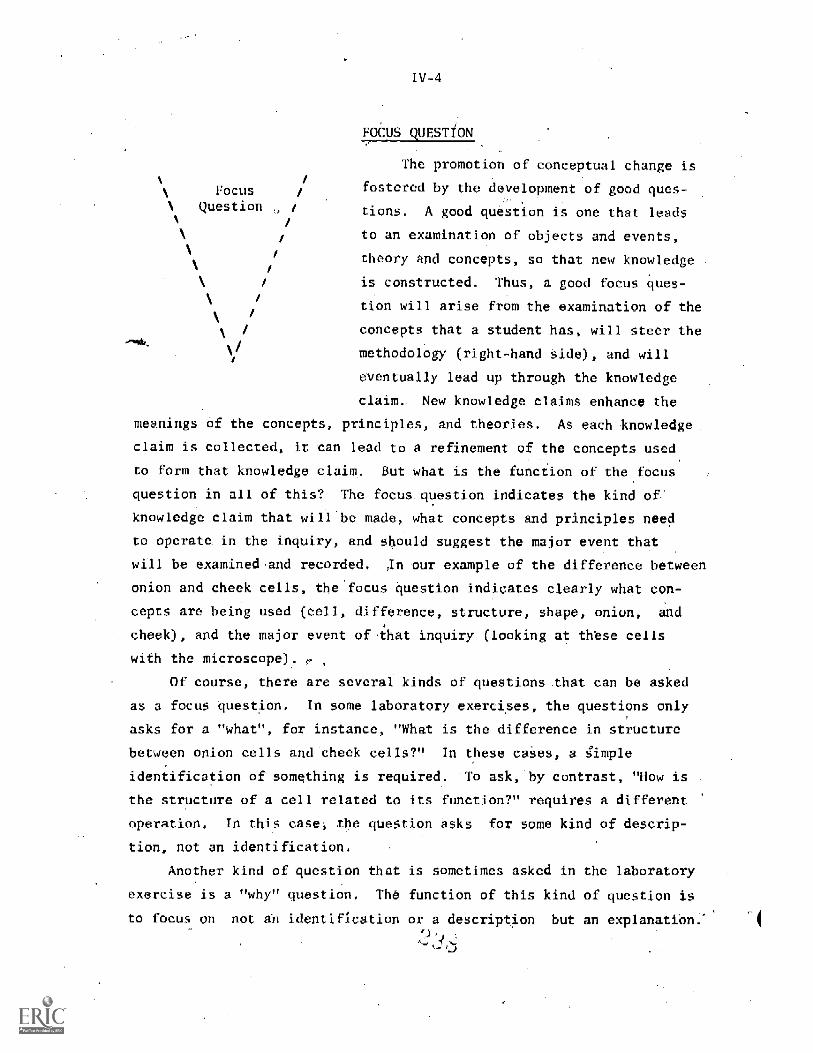
Focus
Question
IV-4
FOCUS wESTiON
The promotion of conceptual change is
fostered by the development of good ques-
tions. A good question is one that leads
to an examination of objects and events,
theory and concepts, so that new knowledge
is constructed. Thus, a good focus ques-
tion will arise from the examination of the
concepts that a student has, will steer the
methodology (right-hand side), and will
eventually lead up through the knowledge
claim. New knowledge claims enhance the
meanings of the concepts, principles, and theories. As each knowledge
claim is collected, it can lead to a refinement of =he concepts used
to form that knowledge claim. But what is the function of the focus
question in all of this? The focus. question indicates the kind of:
knowledge claim that will be made, what concepts and principles need
to operate in the inquiry, and should suggest the major event that
will be examined and recorded. our example of the difference between
onion and cheek cells, the focus question indicates clearly what con-
cepts are being used (cell, difference, structure, shape, onion, and
cheek), and the major event of that inquiry (looking at these cells
with the microscope).
Of course, there are several kinds of questions that can be asked
as a focus question. In some laboratory exercises, the questions only
asks for a "what", for instance, "What is the difference in structure
between onion cells and cheek cells?" In these cases, a simple
identification of something is required.
the structure of a cell related to
operation. In this case the
tion, not an identification.
Another kind of question
exercise is a "why" question.
to focus on not an identification
To ask,-.by contrast, "How is
its function?" requires -A different
question asks for some kind of descrip-
that is sometimes asked in the laboratory
The function of NIS kind of question is
or a description but an explanation.
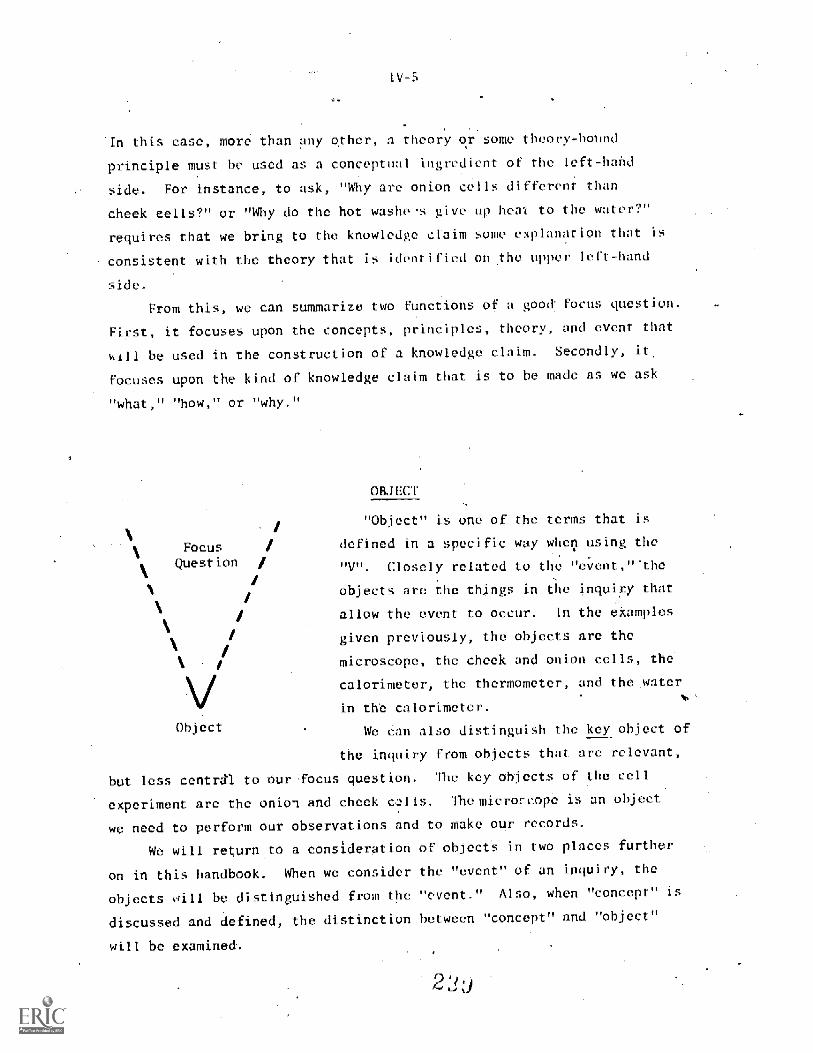
I V -5
In this case, more than any other, a theory or some theory-hound
principle must be used as a conceptual ingredient of the left-hand
side. For instance, to ask, "Why are onion cells different than
cheek cells?" or "Why do the hot washes give op heir( to the water?"
requires that we bring to the knowledge claim sonic explanation that is
consistent with the theory that is identified on the -upper left-hand
side.
From this, we can summarize two functions of a good focus question.
First, it focuses upon the concepts, principles, theory, and event that
be used in the construction of a knowledge claim. Secondly, it
focuses upon the kind of knowledge claim that is to he made as we ask
"what," "how," or "why."
OBJECT
"Object" is one of the terms that
1Focus defined in a specific way when using the
Question "V". Closely related to the "event," -the
N/
objects are the things in the inquiry that
allow the event to occur. In the examples1
1given previously, the objects are the
microscope, the cheek and onion cells, the
calorimeter, the thermometer, and the
in the calorimeter.
We Can also distinguish the key object of
the inquiry from objects that are relevant,
but less central to tur-focus question. The key objects of the cell
experiment are the onioa and cheek calls. The microscope is an object
we need to perform our observations and to make our records.
We will return to a consideration of objeetS in two places further
on in this handbook. When we consider the "event" of an inquiry, the
objects will be distinguished from the "event." Also, when "concept" is
discussed and defined, the distinction between "concept" and "object"
will be examined.
Object
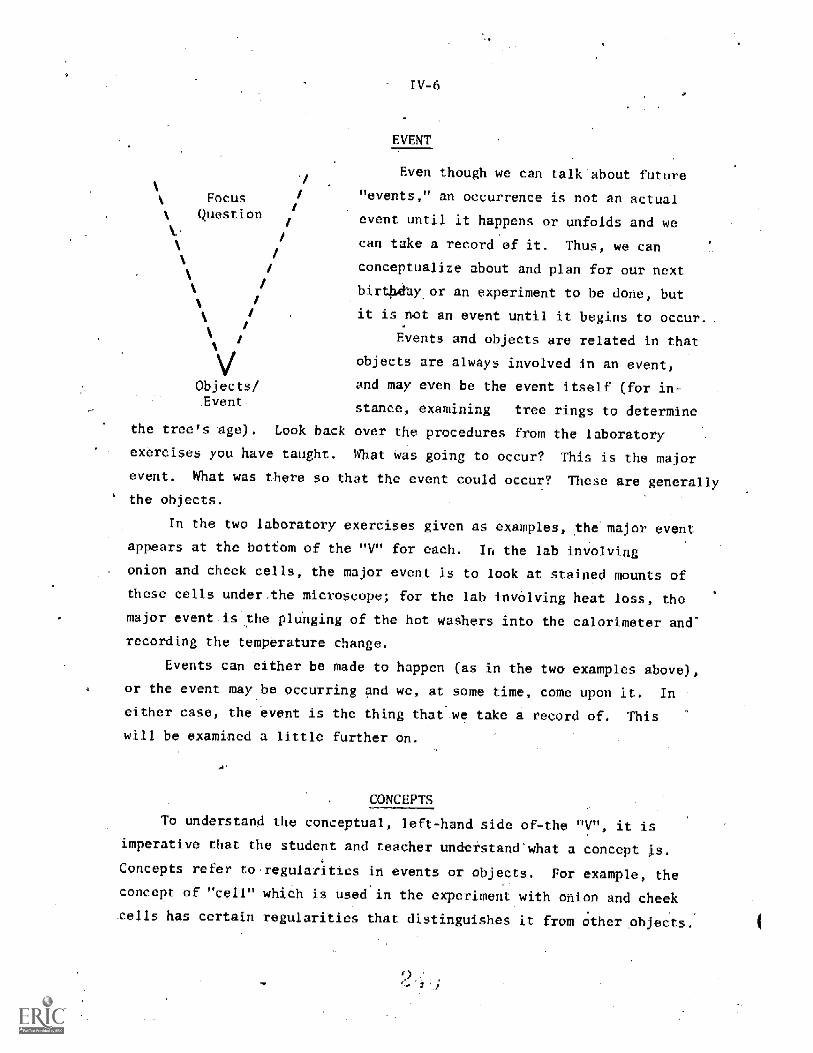
Focus
Question
Objects/Event
IV-6
EVENT
Even though we can talk about future
"events," an occurrence is not an actual
event until it happens or unfolds and we
can take a record of it, Thus, we can
conceptualize about and plan for our next
birt y or an experiment to be done, but
it is not an event until it begins to occur.
Events and objects are related in that
objects are always involved in an event,
and may even be the event itself (for in-
stance, examining tree rings to determine
the tree's age). Look back over the procedures from the laboratory
exercises you have taught. What was going to occur? This is the major
event. What was there so that the event could occur? These are genera
' the objects.
In the two laboratory exercises given as examples, the major event
appears at the bottom of the "V" for each. In the lab involving
onion and cheek cells, the major event is to look at stained mounts of
these cells under -the microscope; for the lab involving heat loss, the
major event is the plunging of the hot washers into the calorimeter and
recording the temperature change.
Events can either be made to happen (as in the two examples above),
or the event maybe occurring and we, at some time, come upon it. In
either case, the event is the thing that .we take a record of. This
will be examined a little further on.
CONCEPTS
To understand the conceptual, left-hand side of-the "V", it is
imperative that the student and teacher understand what a concept is.
Concepts refer to.regularities in events or objects. For example, the
concept of "cell" which is used in the experiment with onion and cheek
tells has certain regularities that distinguishes it from 6ther. object
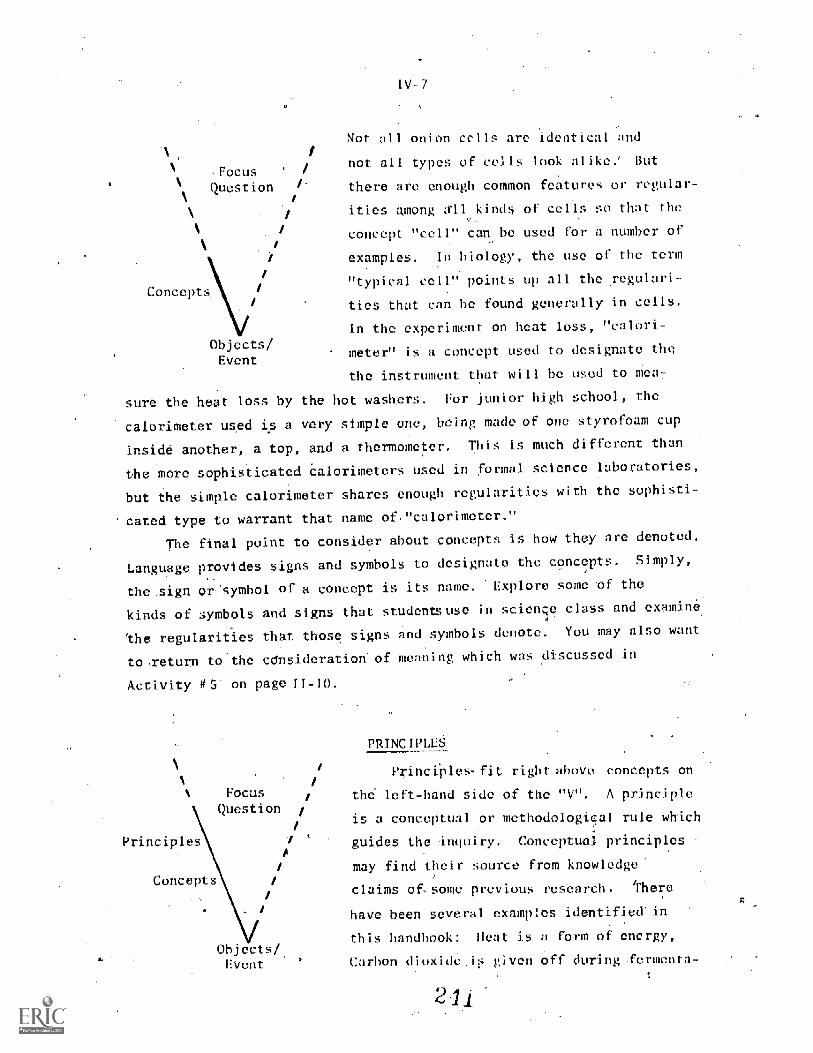
-FocusQuestion
Objects/Event
IV -7
Not all onion cells are identical and
not all types of cells look alike.' But
there nre enough common features or regular-
ities among all kinds of cells so that the
concept "cell"_can be used for a number of
examples. In biology, the use of the term
"typical cell" points up all the regu
ties that can be found generally in
In the experiment on heat loss, "calori-
meter" is a concept used to designate the
the instrument that will he used to me T
sure the heat loss by the hot washers. For junior high school, the
calorimeter used is a very simple one, being made of one styrofoam cup
inside another, a top, and a thermometer. This is much different than
the more sophisticated calorimeters used in formal science laboratories,
but the simple calorimeter shares enough regularit. ies with the sophisti-
cated type to warrant that name of "calorimeter."
The final point to consider about concepts is how they are denoted.
Language provides signs and symbols to designate the concepts. Simply,
the .sign or symbol of a concept is its name. Explore some of the
kinds of symbols and signs that students use in science class and-examine
'the regularities that those signs and symbols denote. You may also want
to-return to the calsideration of meaning which was discussed in
Activity #S. on page if-10.
FoCusQuestion /
Principle_
Concepts
Objects/EVent
PRINCIPLES
Principles- fit right above concepts on
the left-hand side of the "V". A principle
is a conceptual or methodological rule which
guides the inquiry. Conceptual principles
may find their source from knowledge
claims of-some previous research. There
have been several examples identified'in
this handbook: Heat is a form of energy,
Carbon dioxide i;-; given off during ferment-
2 1
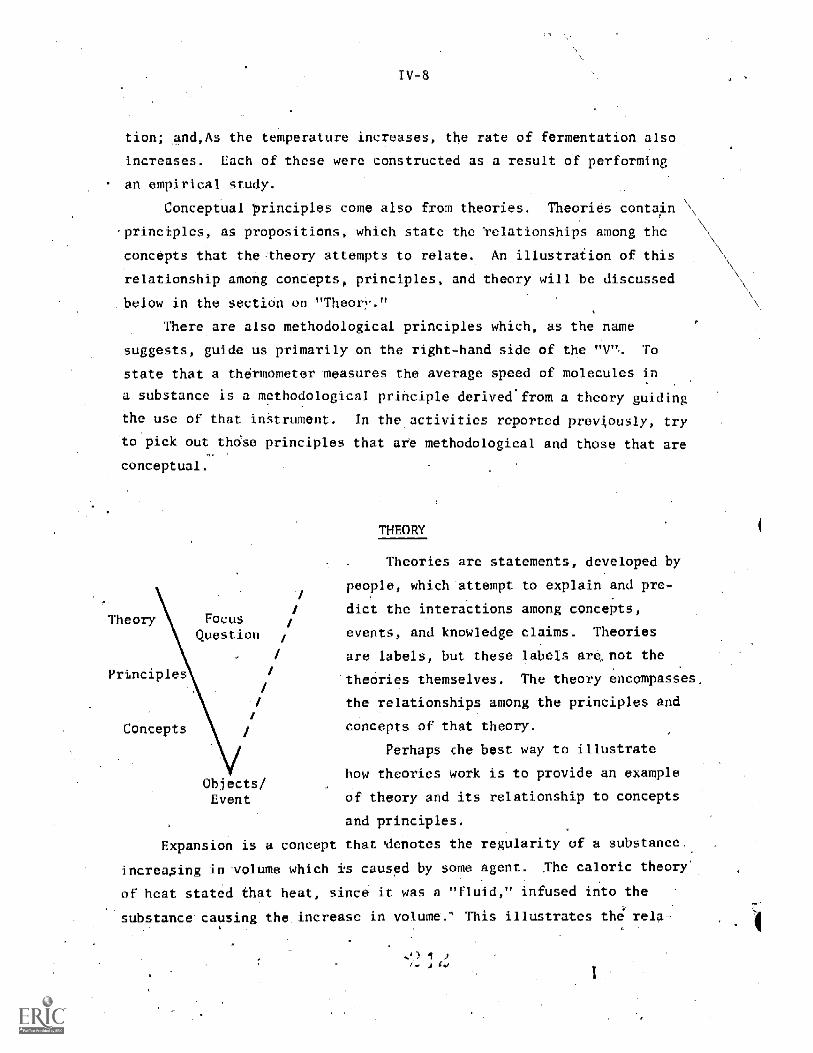
tion; and,As the temperature increases, the rate of fermentation also
.increases. Each of these -were constructed as a result of performing
an empirical study.
Conceptual principles come also from theories. Theories contain \\
principles, as propositions, which state the 'relationships among the
concepts that the theory attempts to relate. An illustration of this
relationship among concepts, principles, and theory will be discussed
below in the section on " Theor'-."
There are also methodological principles which, as the name
suggests, guide us primarily on the right-hand side of the "V"- To
state that a thermometer measures the average speed of molecules in
a substance is a methodological principle derived from a theory guiding
the use of that instrument. In the activities reported previously, try
to pick out thcise principles that are methodological and those that are
conceptual.
Theory Focus
Question
Principl
THEORY
Theories are statements, developed by
people, which attempt to explain and pre-
dict the interactions among concepts,
events, and knowledge claims. Theories
are labels, but these labels are, not the
theories themselves. The theory encompasses,
the relationships among the principles and
Concepts concepts of that theory.
Perhaps the best way ti) illustrate
how theories work is to provide an example
of theory and its relationship to concepts
and principles.
Expansion is a concept that denotes the regularity of a substance,
increa.sing in-volume which is caused by some agent. The caloric theory'.
of heat stated that heat, since it was a "fluid," infused into the
substance causing the. increase in volume." This illustrates the vela-
Objects/Event
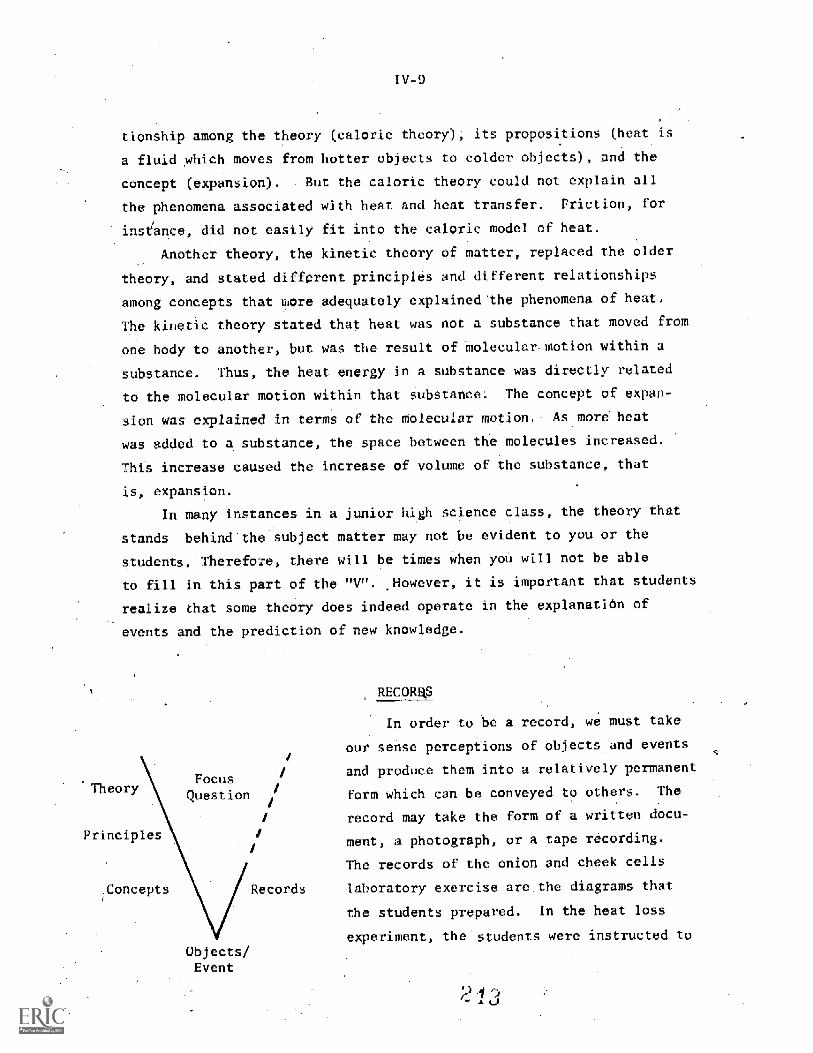
IV-9
tionship among the theory (caloric theory); its propositions (heat is
a fluid which moves .from hotter objects to colder objects), and the
concept (expansion). But the caloric theory could not explain all
the phenomena associated with heat and heat transfer.. Friction, for
instance, did not easily fit into the caloric model of heat.
Another theory, the kinetic theory of matter, replaced the older
theory, and stated different principles and different relationships
among concepts that bore adequately explained the phenomena of heat.
The kinetic theory stated that heat was not a substance that moved from
one body to another, but was the result of molecular motion within a
substance. Thus, the heat energy in a substance was directly related
to the molecular motion within that Substance The concept of expan-
sion was explained in terms of the Molecular motion . As more heat
was added to a substance, the space between the molecules increased.
This increase caused the increase of volume of the substance, that
is, expansion.
In many instances in a junior high science class, the theory that
stands behind the subject matter may not be evident to you or the
students. Therefore, there will be times when you will not be able
to fill in this part of the "V". .However, it is important that students
realize that some theory does indeed operate in the explanation of
events and the prediction of new knowledge.
'Theory
Principles
Concepts
FocusQuestion
Objects/Event
Records
RECORR5
In order. to be a record, we must take
our sense perceptions of objects and events
and produce them into a relatively permanent
form which can be conveyed to others. The
record may take the form of a written docu-
ment,,a photograph, or a tape recording.
The records of the onion and cheek cells
laboratory exercise are_the diagrams that
the students prepared. In the heat loss
experiment, the students were instructed to
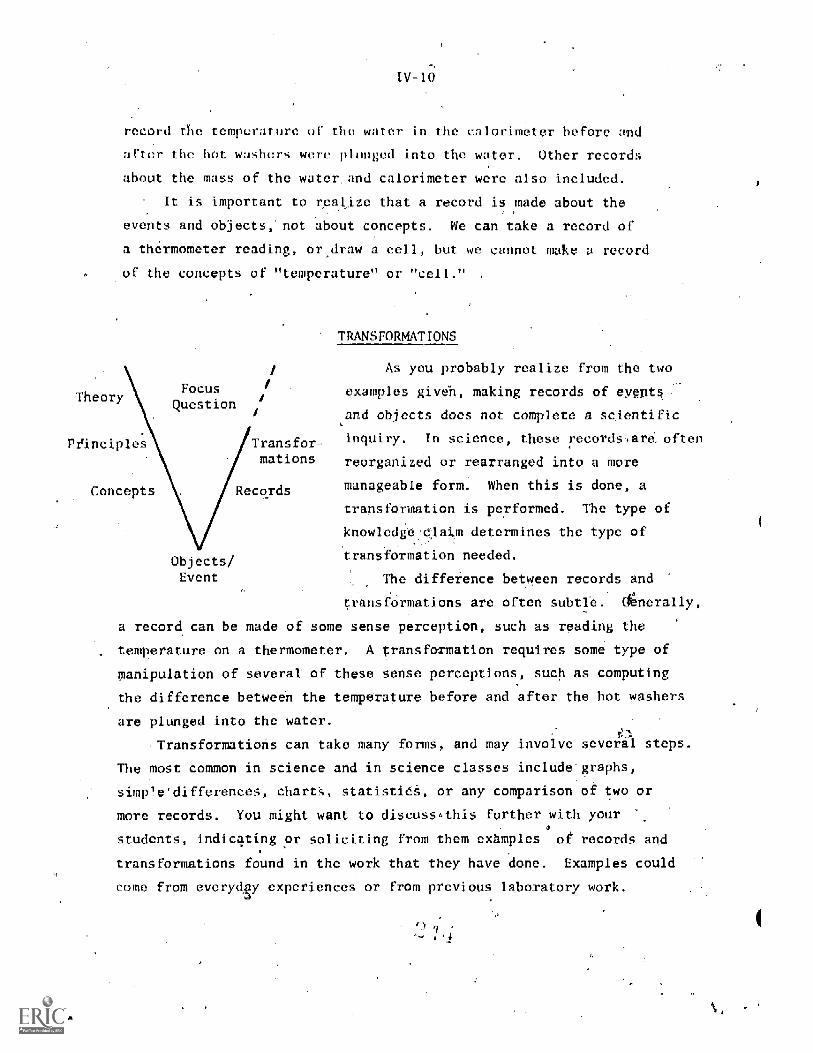
IV=
record the temperature of the water in the calorimeter before and
sifter the hot washers were plunged into the water. Other records
about the mass of the water and calorimeter were also included.
important to realize that a record is made about the
events and objects,' not about concepts. We can take a record of
a thermometer reading, or draw a cell, but we cannot make a record
of the concepts of "temperature" or "cell."
Theory
Pfinciples
Concepts
FocusQuestion
Objects/Event
Transfor-mations
Records
TRANSFORMATIONS
As you probably realize from the two
examples given, making records of events
and objects does not complete a scientific
inquiry. In science, these records.are often
reorganized or rearranged into a more
manageable form. When this is done, a
transformation is performed. The type of
knowledge claim determines the type of
transformation needed.
The difference between records and
ransformations are often subtle. dtnerally,
a record can be made of some sense perception, such as reading the
temperature on a thermometer. A transformation requires some type of
manipulation of several of these sense perceptions, such as computing
the difference between the temperature before and after the hot washers
are plunged into the water.
Transformations can take many forms, and may involve several steps.
The most common in science and in science classes include graphs,
simple'differences, charts, statistics, or any comparison of two or
more records. You might want to discuss this further with your
students, indicating or soliciting from them examples of records and
transformations found in the work that they have done. Examples could
come from everyday experiences or from previous laboratory work.
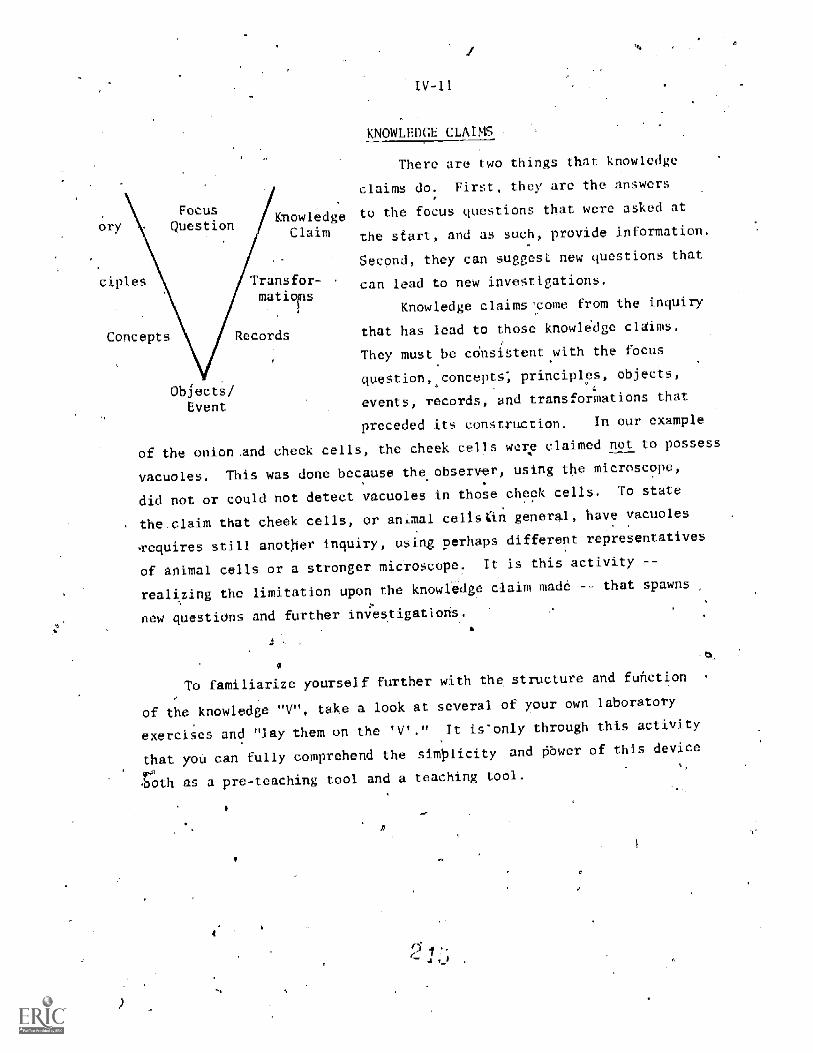
oryFocus
Questionnow ledge
Claim
IV-11
KNOWLEDGE CLAIM
There are two things that
claims do. First, they are the answers
to the focus questions that were asked at
the start, and as such, provide information.
Second, they can suggest new questions that
ciples Transfer- can lead to new investigations.matio
Knowledge claimscome from the inquiry
Concepts Records that has lead to those knowledge claims.
They must be consistent with the focus
question, concepts; principles, objects,4
events, records, and transformations that
preceded its construction. In our example
of the onion.and cheek cells, the cheek cells wer,p claimed not to possess
vacuoles. This was done because the observer, using the microscope,
did not or could not detect vacuoles in those cheek cells. To state
the.claim that cheek cells, or animal cellsin general, have vacuoles
requires still another inquiry, using Perhaps different representatives
of animal cells or a stronger microscope. It is this activity --
realizing the limitation upon the knowledge claim made -- that spawns
Objects/Event
new questions and further investigations.
To familiarize yourself further with the structure and function
of the knowledge "V", take a look at several of your own laboratory
exercises and "lay them on the 'V'." It only through this activity
that you can fully comprehend the simplicity and 'Sewer of this device
both as a pre-teaching tool and a teaching tool.
)
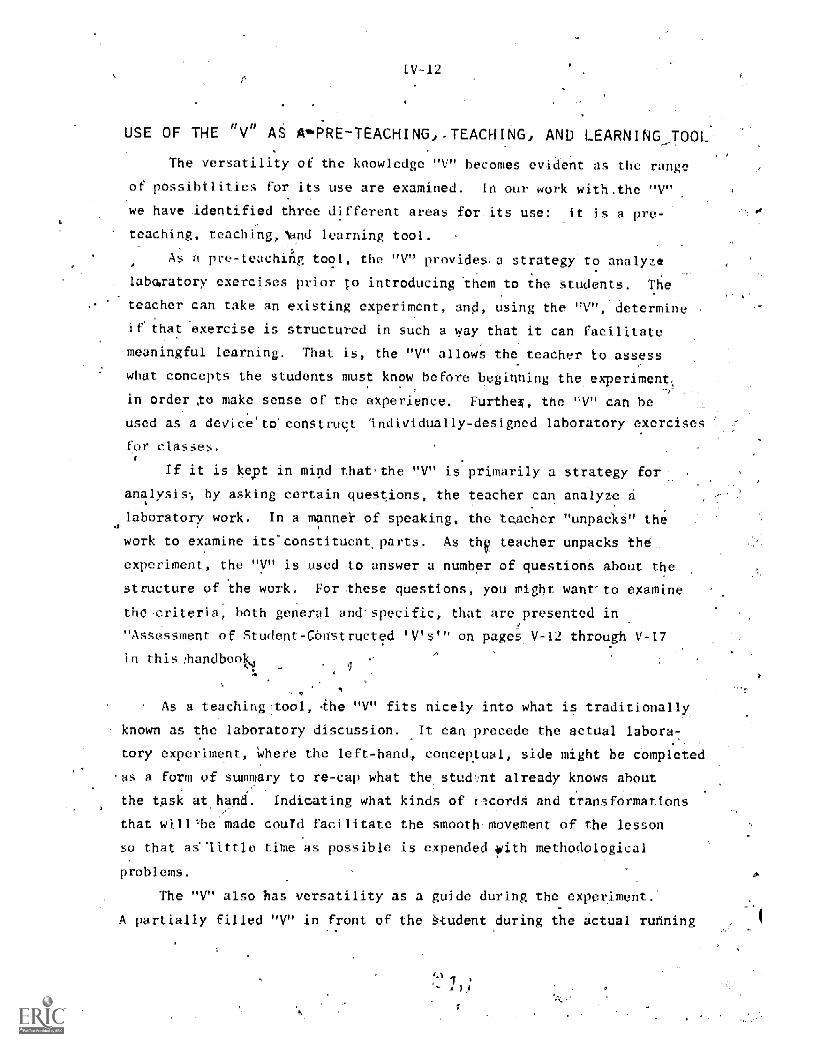
IV-12
USE OF THE "V" AS AwFRE-TEACHING,,TEACHING, AND LEARNINGJOOL-
The versatility of the knowledge "V" becomes evident as the range
of possibilities for its use are examined. In our work.with.the "V"
we have identified three different areas for its use: it is a pre-,
teaching, teaching, land learning tool.
As a pre-teaching tool, the "V" provides. a strategy to analyze
laboratory exercises prior to introducing them to the students. The
teacher can take an existing experiment, and, using the "V", determine
if that exercise is structured in such a way that it can facilitate
meaningful learning. That is, the "V" allows the teacher to assess
what concepts the students must know before beginning the experiment
in order to make sense of the experience. Further, the "V" can be
used as a device toconstruct Individually-designed laboratory exercis
for classes.
If it is kept in mind that the "V" is primarily a strategy for
analysis, by asking certain questions, the teacher can analyze
laboratory work. In a manner of speaking, the teacher "unpacks" the
work to examine its'constituen parts. As 0 teacher unpacks the::
experiment, the "V" is used to answer a number of question's about the
structure of the work. For these questions, you might want-to examine
the criteria, both general and.specific, that __- presented in
"Assessment of Student-cOnstructed 'V's'" on pages V-12 through V-17
in this 'handbook
As a teaching .the "V" fits nicely into what is traditionally.
known as the laboratory discussion. It can precede the actual labora,
tory experiment, Where the left-hand, conceptual, side might be completed
'as a form of summary to re-cap what the stud,Jit already knows about
the task at hand. Indicating what kinds of records and transformations
that will"be made could facilitate the smooth movement of the lesson
so that _-little time as possible is expended with methodological
problems.
The "V" also has versatility as a guide.during the experiment.
A partially filled "V" in front of the §tudent during the actual running
IV-13
of the lab and record collection can gib'
approach for determining what to do next.
And finally, the "V" has worth as a summary technique after the
experiment has been completed. As such, the student can see where
his/her knowledge claim came from, what basis it had in the concepts
that occupy the left-hand side, and the methodology on the right--hand
side. As a summary device the "V" can be discussed as a whole class
activity, where different groups of students compare results and
knowledge claims, and attempt to discuss any discrepancies in the
results.
Many teachers require written laboratory reports from the students.
These reports usually summarize the experiment and also indicate certain
inferences that follow from the work done in the experiment. The "V"
can represent the. short -hand form of that report, or the teacher can
()lit to have students prepare "V's" as the outline for an extended
laboratory write-up.
rd
.
a short-hand
Throughout this entire handbook, there have been two themes that
have been developed about the "V" and its relation to education. First,
than the "V" is a means of unpacking an inquiry, and is therefore a
method of analysis. Second, the "V" provides a piece of knowledge about
knowledge creation: If these two aspects of the "V" are kept in mind,
then the use of the "V" as a learning tool becomes apparent. By pro-
vidinva means of adalysis, the "V" separates and identifies the major
concepts and principles, that are used to sort out and create the know-
ledge. This identification of what is required to make sense of the
experiment provides the means by which the students can indicate-what
concepts they already know, how-those concepts are related to each
other, and how this linking of existing concepts can bring about new
knowledge and new concepts. This is tightly consistent with the theory
of learning developed in Sections I and if in this handbook. Thus, the
along with concept mapping, can provide strategies for meaningful
learning.
IV-14
however, the versatility of the "V" does not stop there. In essence,
as we teach the "V", not only are we teaching for meaningful learning
of concepts, but also teaching for the meaningful learning of how know-
ledge is made. While it important for.students to learn what the
accumulated knowledge of science is, another type of learning is going
on as the student uses these strategies -- that is, how science is
structed. Students learn what counts as a concept, how theories work,
in providing explanation, how concepts change over time, what are the
intellectual commitments for record-making and transformations, and the
limits of the constructed knowledge of the sciences. They come to
realise that knowledge is the product of inquiry. And that inquiry
comes about as a result of the interaction of the'conceptual structure
we possess and the methodologies we choose in the task of building
that knowledge.
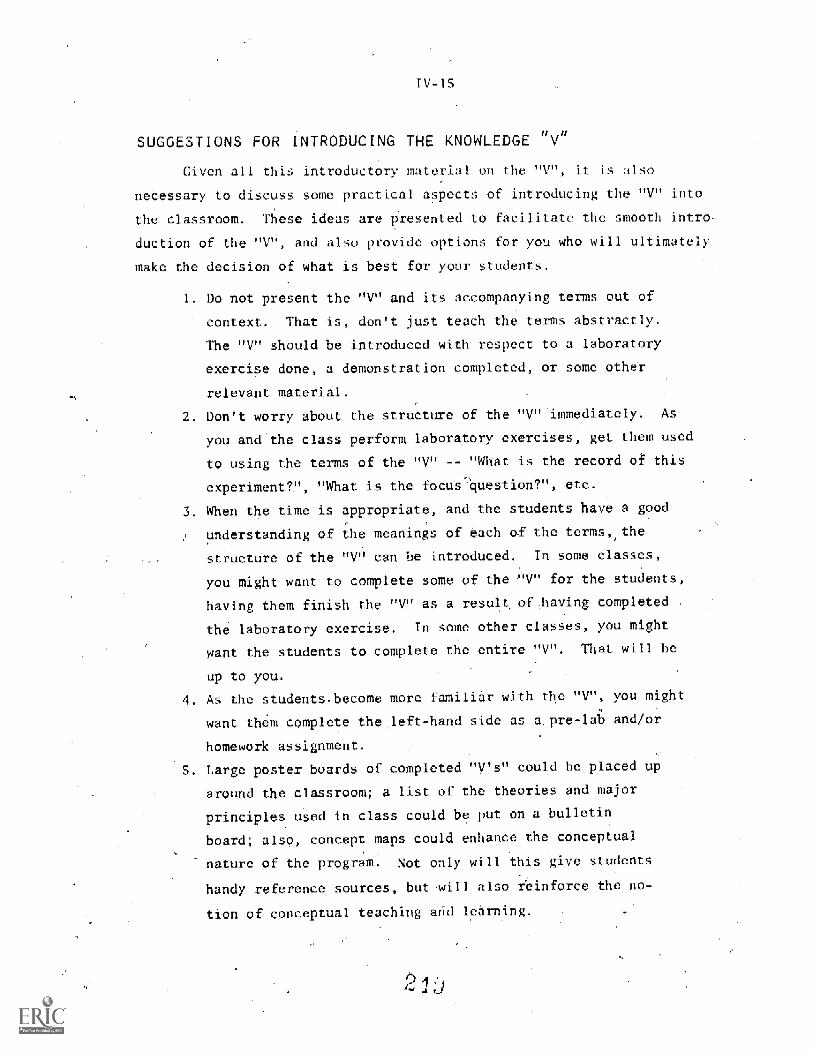
IV-1s
SUGGESTIONS FOR INTRODUINTRODUCING THE KNOWLEDGE "V"
Given all this introductory material on the "V", it is also
necessary to discuss some practical aspects of introducing the "V" into
the classroom. These ideas are presented to facilitate the smooth intro-
duction of the "V", and also provide options for you who will ultimately
make the decision of what is best for your students.
1. Do not present the "V" and its accompanying terms out of
context. That is, don't just teach the terms abstractly.
The "V" should be introduced with respect to a laboratory
exercise done, a demonstration completed, or some other
relevant material.
2. Don't worry about the structure of the "V" immediately. As
you and the class perform laboratory exercises, get them used
to using the terms of the "V" -- "What is the record of this
experimentZ", "What is the focus question?", etc.
3. When the time is appropriate, and the students have a good
understanding of the meanings of each af the terms, the
structure of the "V" can be introduced. In- some classes,
you might want to complete some of the "V" for the students,
having them finish the "V" as a result, of .,having completed
the laboratory exercise. In some other classes, you might
want the students to complete the entire "V". That will be
up to you
4. As the students. become more familiar with the "V", you might
want them complete the left-hand side as a,pre-lab and/or
homework assignment.
Large poster bOards of completed "V's" could be. placed up
around the clasSroom; a list of the theories and major
principles used in class could be put on a bulletin
board; also, concept maps could enhance the conceptual
nature of the program. Not only will this give students
handy reference sources, but will also reinforce the no-
tion of conceptual teaching and learning.
I J
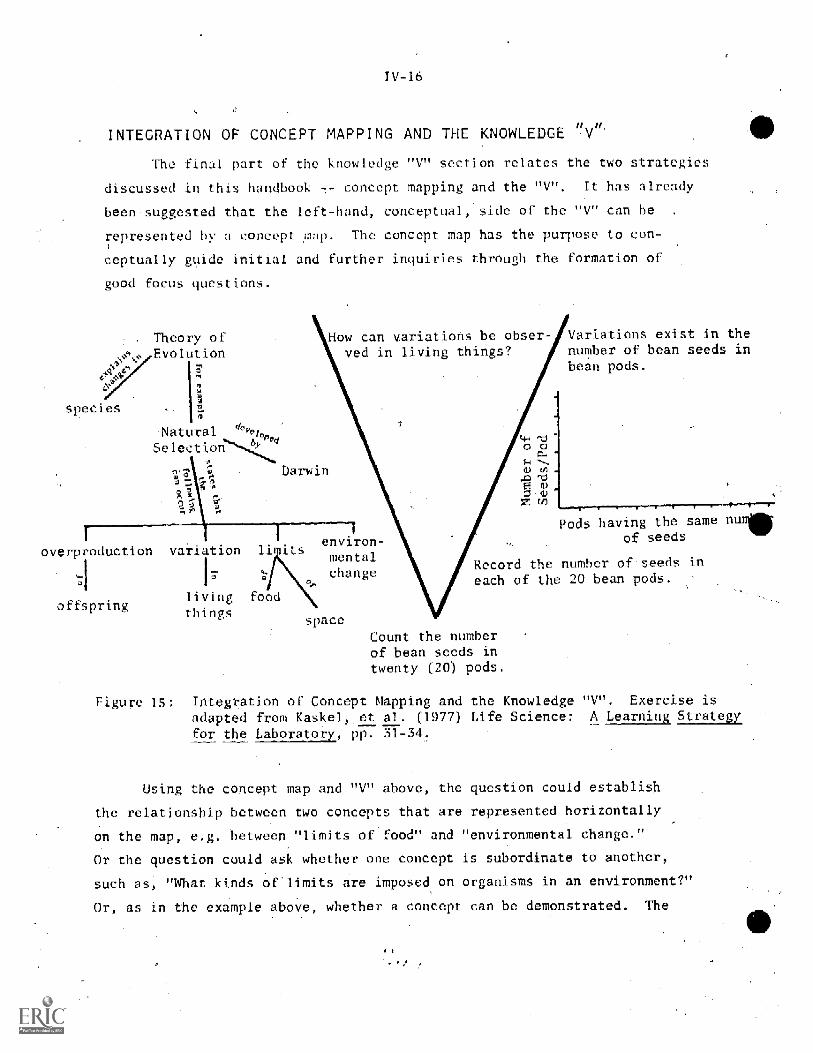
IV-16
INTEGRATION OF CONCEPT MAPPING AND THE KNOWLEDGE
The final part of the knowledge "V" section relates the two strategies
discussed in this handbook - concept mapping and the "V". It has already
been-suggested that the left -hand, conceptual, side of the "V" can be
represented by a concept map. The concept map has the purpose to con-
ceptually guide initial and further inquiries through the formation of
good focus questions.
Theory ofEvolution
How can variations be obser- Variations exist in the
ved in living things? number of bean seeds inbean pods.
species
NaturalSelection
pod
Da-
overproduction variation
offspring
gu re
limitenviron-mentalchange
living foodthings
space
Pods having the same nof seeds
Record the number of in
each of the 20 bean pods.
Count the numberof bean seeds intwenty (20) pods.
1S: Integration of Concept Mapping and the Knowledge "V". Exercise is
adapted from Kaskel,,er al. (1977) Life Science: A Learning Strategyfor the Laboratory, pp. 31-34.
Using the concept map and "V" above, the question could establish
the relationship between two concepts that are represented horizontally
on the map, e.g. between "limits of food" and "environmental change."
Or the question could ask whether-one concept is subordinate to another,
such as, "What kinds of limits are imposed on organisms in an environment?"
Or, as in the example above, whether a concept can be demonstrated. The
IV-17
focus question then sets the stage for the inquiry and provides the key
for meaningful learning. As each focus question is answered, the
conceptual structure of that part of the discipline grows for the student,
and his/her knowledge becomes more complete and more.comp
In the next and final section, issues of evaluation are discussed.
Given the psychological and nature of knowledge orientation of this
approach, the evaluative instruments are somewhat different than what
is usually used in science classes. Clear criteria for assessing students'
ability to use concept mapping and the knowledge "V" has been devised to
assist the teacher in determining how proficient the students are in each
of these areas.
40V. EVALUATION
ASSESSMENT OF STUDENT-CONSTRUCTED CONCEPT MAPS
EVALUATION OF KNOWLEDGE "V" IDENTIFICATION,DEFINITIONS, AND EXAMPLES OF TERMS
ASSESSMENT OF STUDENT-CONSTRUCTED '-"
USING THE "V" IN SEQUENCE
INTEGRATION OF THE "V" AND CONCEPT MAPPING
CONCEPTUAL QUESTIONS: USE OF THE "V" ANDCONCEPT MAPPING
V-1
Materials for evaluating concept maps and "V'S" have been devised
that are consistent with the information and background given in this
handbook. Although these materials have bcen divided into various
parts in this section, they actually work together to give the teacher
a broad spectrum of ways of seeing how well students arc performing
with the various strategies.
=Before each evaluation method is given, a description of what
that method is intended to do is discussed. These objectives should
be kept in mind as the teacher both reads the methods and uses them
in the classroom.
V -2
ASSESSMENT OF STUDENT-CONSTRUCTED CONCEPT MAPS
Several features that characterize concept maps have already been
d in Section Hi: they are two-dimensional, they proceed from
general to specific, they show the relationships among concepts, and
they illustrate some hierarchy among the concepts. Given these features,
it is not difficult to develop some forms for assessing the concept
maps that students complete.
Two forms for assessing concept maps are provided on the next
few pages.- The first form (A) is designed to give a "large field of
. view," providing the teacher with a quick overview of maps. The
second form (B) provides a more comprehensive scaling of the features
of a concept map, including some features .not already mentioned. Of
course, the second form requires a greater amount of time to use pro-
perly, but this is weighed against the advantage of thoroughness.
Further, the more comprehensive form indicates weaknesses in the maps,
and can thus suggest future instructional needs.
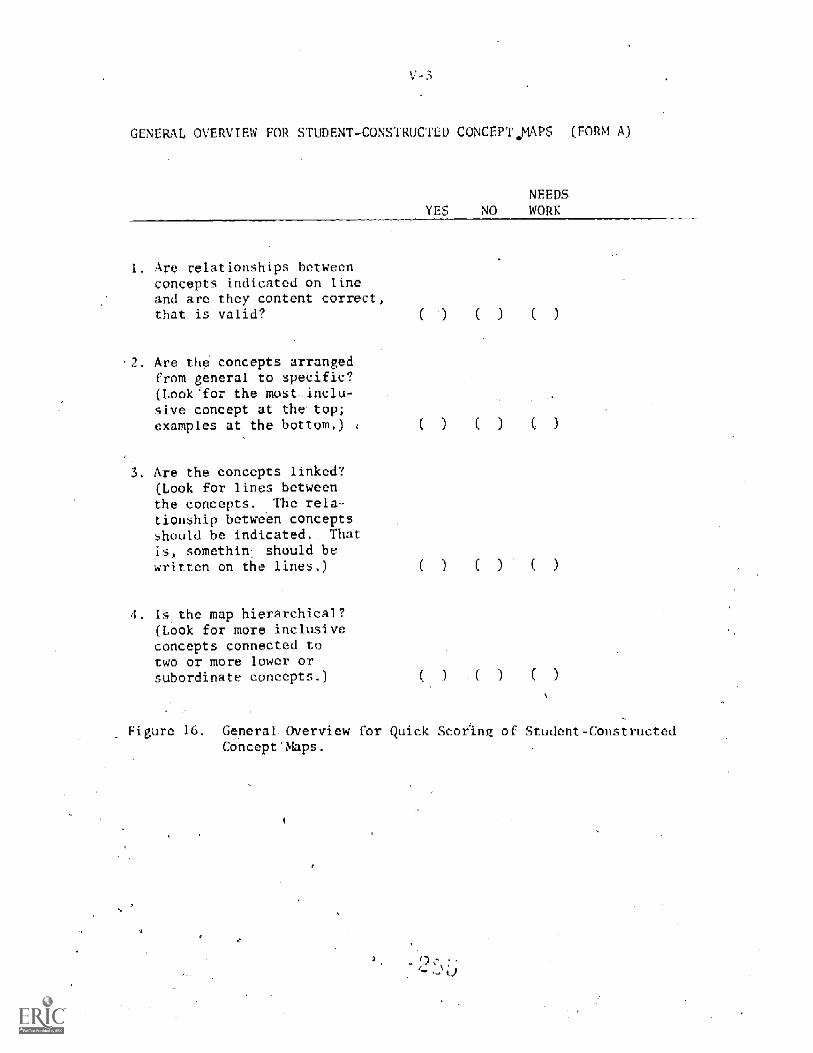
V-3
GENERAL OVERVIEW FOR STUDENT-CONSTRUCTED CONCEPT MAPS (FORM A)
YES NONEEDSWORK
Are relationships betweenconcepts indicated on lineand are they content correct,that is valid?
Are the concepts arrangedfrom general to specific?(Look for the most-inclu-sive concept at the top;examples at the bottom.)
Are the concepts linked?(Look for lines betweenthe concepts. The rela-tionship between conceptsshould be indicated.. Thatis, somethin: should bewritten on the lines.)
Is the map hierarchical?(Look for more inclusiveconcepts connected totwo or more lower orsubordinate concepts.)
Figure 16 General_ Overview for Quick ScorinQ of Student-ConstructedConcept Maps.
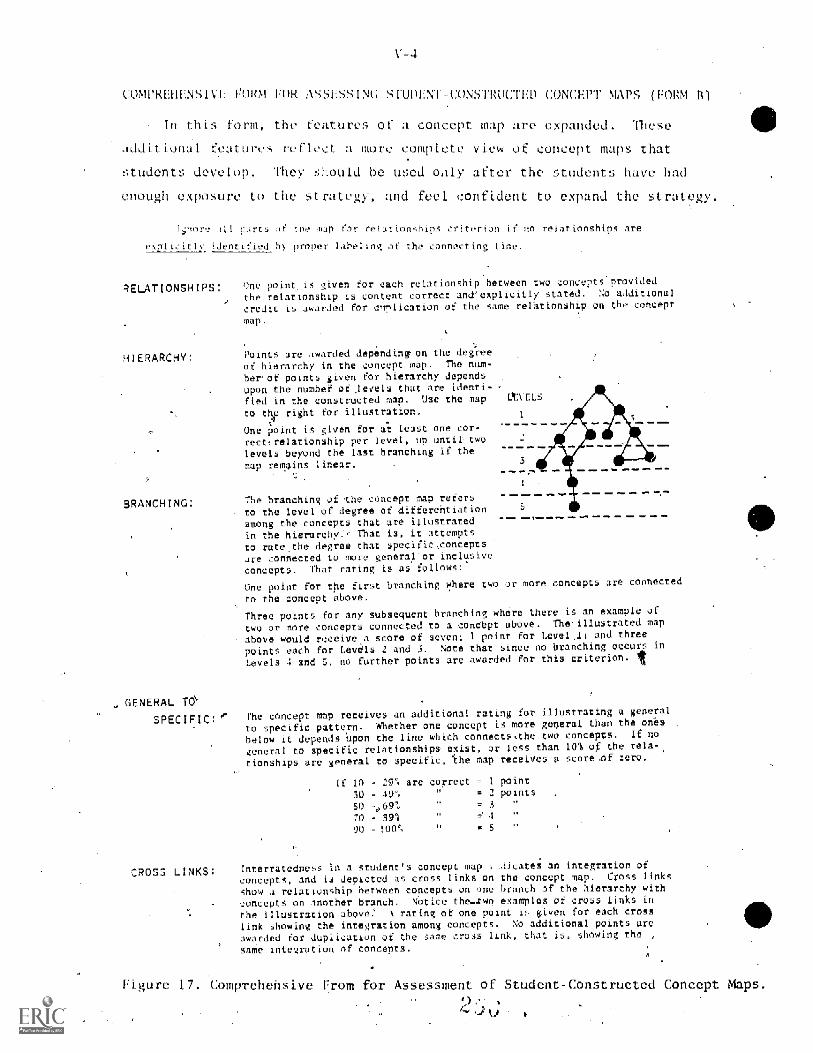
lllM pREIIEN S IVF. 14ARM 1uN STUPIAT- rRUCTO VLPT MAPS (FORM
In this
ditional f
students develop. They :lould be used on
rm, the features of a concept map ire expanded. These
Ire: let legit a inure complete view of concept maps that
enough exposure to the s
Ianore all arts of tne flap fo
Students have had
gY, and feel i onfident to expand
ionships criterion
eNplicitiv identified bG proper labeling the connecting line.
RELATIONSHIPS:
HIERARCHY:
BRANCHING:
GENERAL VISPECIFIC:
CROSS LINKS:
he strategy.
_ ionships are
one point is given for each relationship between two coneepts provided
.e relationship is content correct and'explicitly stated. do additional
credi- is awarded for Ottrlication of the same relationship on the concept
map.
Points are awarded depending on the degreeof hierarchy in the concept map. The num-
ber-of points given for hierarchy dependsupon the numbef of:levels that are identi-fied in the constructed map. Use the map
to the right for illustration.
One point is given for at least one cor-rect- relationship per level, up until twolevels beyond the last branching if themap remains linear.
The branching of The concept map refersto the level of degree of differentiationamong the concepts that are illustratedin the hierarchy:, That is, it attemptsto rate the degree that specific,concepts
are connected to more general-or inclusive
concepts. That rating is as follows:
One point for the first branching where two or more concepts are connected
to the concept above.
Three points for any subsequent branching where there is an example of
two or more concepts connected to a concept above. The illustrated map
above would receive a score of seven; 1 point for Level,li and three
points each for Levels 2 and 3. Note that since no branching occurs in
Levels 4 and S, no further points are awarded for this criterion.
The concept Map receives an additional rating for illustrating a general
to specific pattern. whether one concept is more general than the ones
below it depends upon the line which connects the two concepts: If no
.eneral to specific relationships exist, or less than 101 of the rela-
tionships are general to specific, 'the map receives a score of zero,
If 10 - are correct = 1 point
49% e 2 points
SO -069% = 3
.70 - ST'e m' 4
90 - 100'i a 5
Interratedness in a student's concept map i -licates an integration of
concepts, and is depicted as cross links on the concept map. Cross links
chain A relationship between concepts on one branch of the hierarchy withconcepts on inother branch. Notice the-4we examples of cross links in
the illustration above: A rating of one point i given for each cross
link showing the integration among concepts. No additional points are
awarded for duplication of the same cross link, that is, showing the ,
came integration of concepts.
Figure 17. Comprehensive From for Assessment of _dent-Constructed Concept Maps.
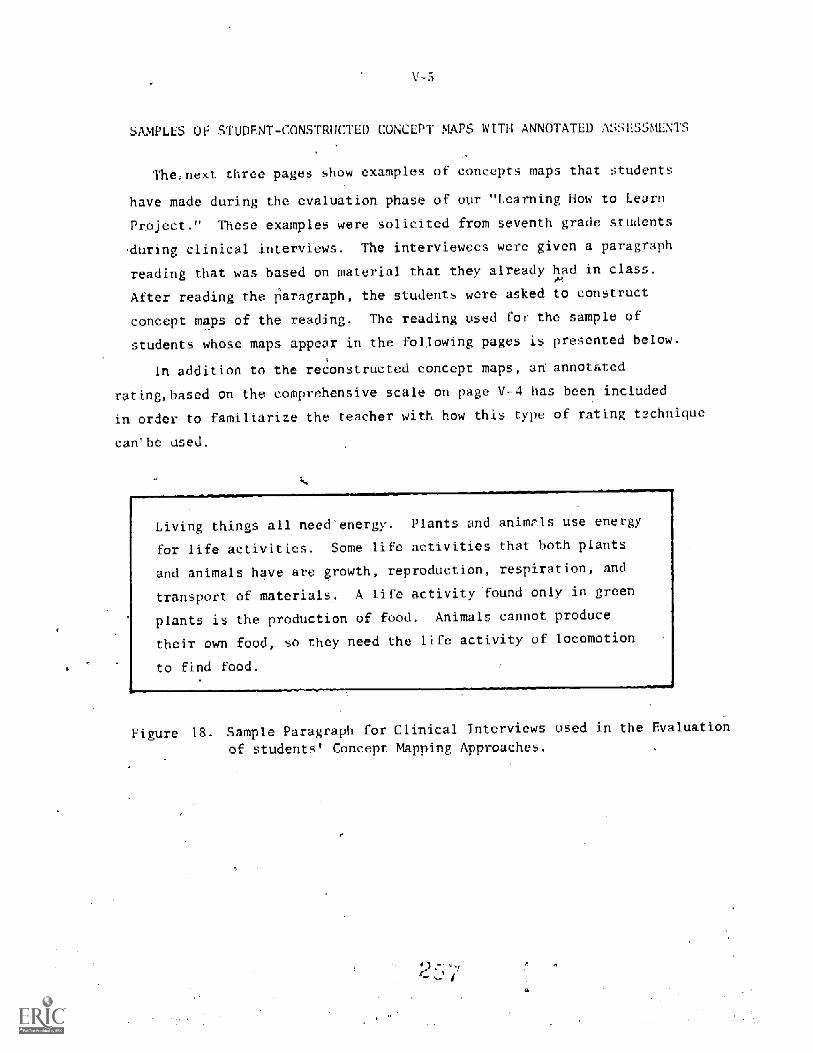
V-5
SAMPLES OF STUDENT-CONSTRUCTED CONCEPT MAPS WITH ANNOTATED ASSESSMENTS
The,ne._ tree pages show examples of concepts maps that students
have made during the evaluation phase of our "Learning How to Learn
Project." These examples were solicited from seventh grade students
during clinical interviews. The interviewees were given a paragraph
reading that was based on material that they already had in class.
After reading the fiaragraph, the students were asked to construct
concept maps of the,reading. The reading used for the sample of
students whose maps appear in the following pages is presented below.
In addition to the reconstructed concept maps, an annotated
rating, based on the comprehensive scale on page V-4 has been included
in order to familiarize the teacher with how this type of rating technique
can'toe used
Living things all need'energy. Plants and animals use energy
for life activities. Some life activities that both plants
and animals have are growth, reproduction, respiration, and
transport of materials,. A life activity found only in green
plants is the production of food. Animals cannot produce
their own food, so they need the life activity of locomotion
to find food.
Figure IS. Sample Paragraph for Clinical Interviews used in the Evaluation
of students' Concept Mapping Approaches.
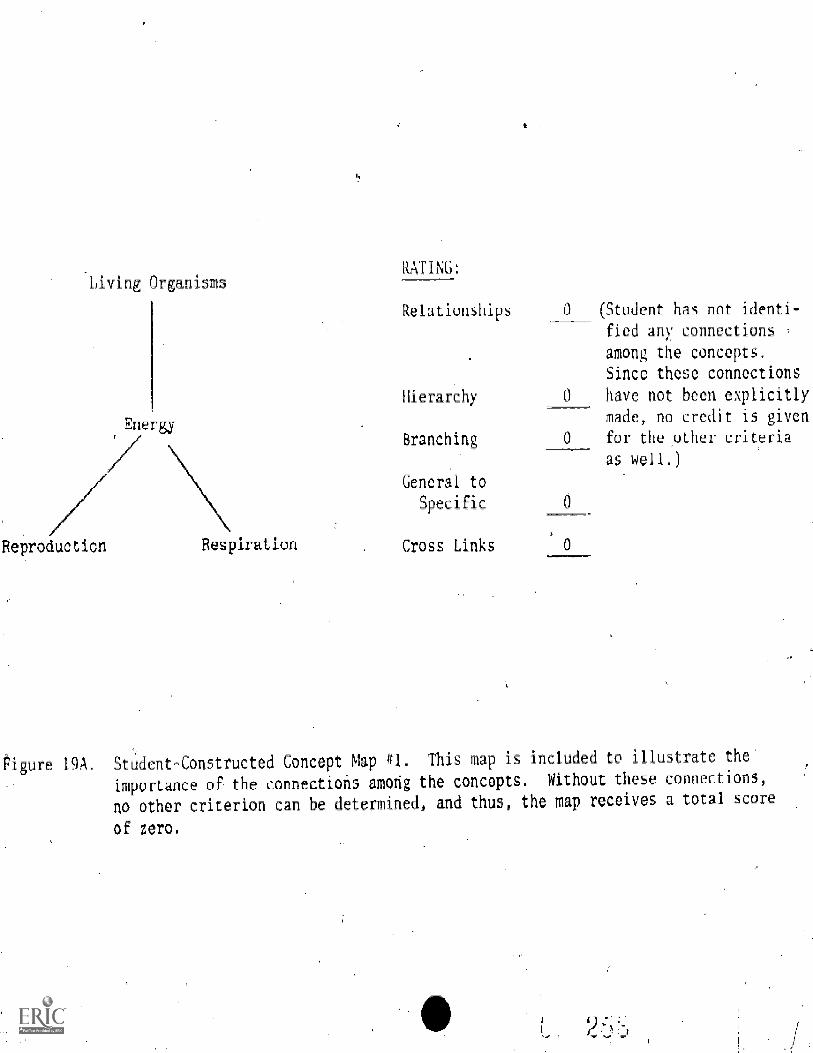
Living Organisms
Reproducticn
Energy
Respiration
RATING:
Relationships 0 (Student has not identi-
fied any connections
among the concepts.
Since these connections
Hierarchy 0 have not been explicitly
made, no credit is given
Branching 0 for the other criteria
as well.)
General to
Specific 0
Cross Links 0
Figure 19A. Student-Constructed Concept Map #1. This map is included to illustrate the
importance of the connections among the concepts. Without these connections,
no other criterion can be determined, and thus, the map receives a total score
of zero.
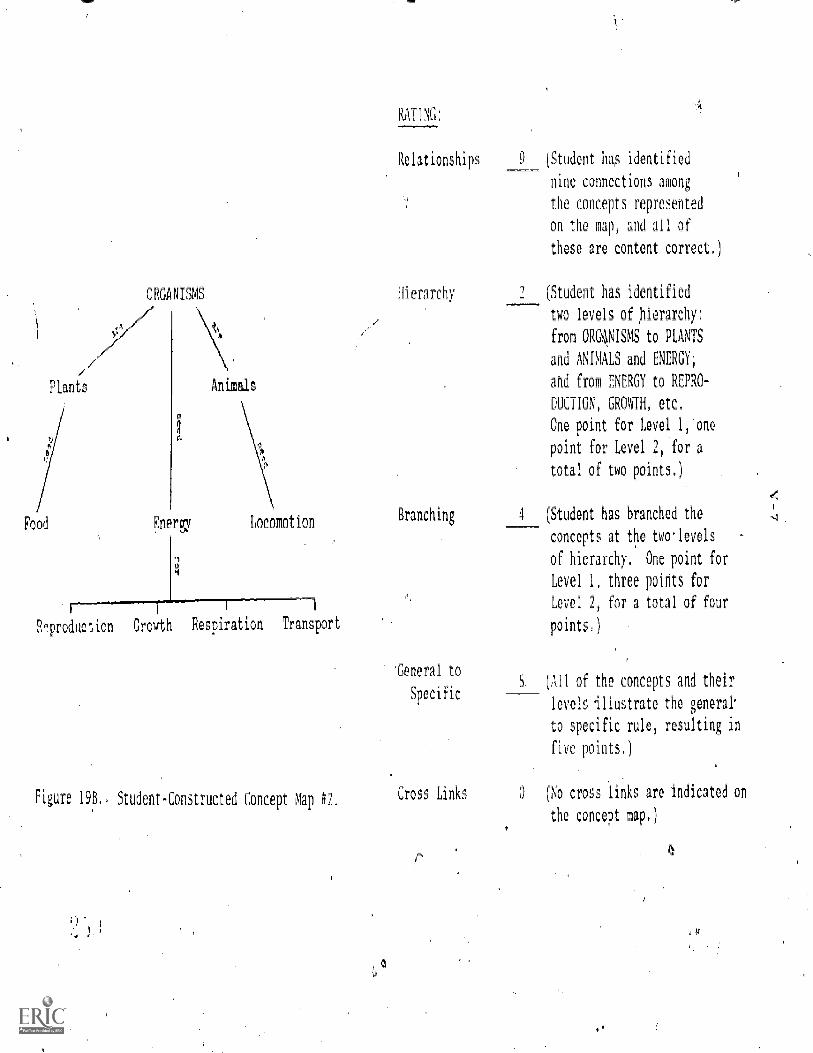
ORGANISMS
RATING:
Relationships
Hierarchy
9
Plants
Food
Fqroduction
Energy
0
30.
'c
Animals
LocomotionBranching
'General to
Specific
4
S:
Growth Respiration Transport
Figure 198 Student-Constructed Concept Map #2. Cross Links
(Student has identified
nine connections among
the concepts represented
On the map, and all of
these are content correct,)
(Student has identified
two levels of hierarchy:
from ORGOISMS to PLANTS
and ANIMALS and ENERGY;
and from ENERGY to REPRO-
DUCTION, GROWTH; etc.
One point for Level 1, one
point for Level 21 for a
total of two points,)
(Student has branched the
concepts at the twolevels
of hierarchy, One point for
Level 1, three points for
Level 2; for a total of four
points,)
(All of the concepts and their
levels illustrate the general
to specific rule, resulting in
five points,)
O (No cross links are indicated on
the concept map,)
4
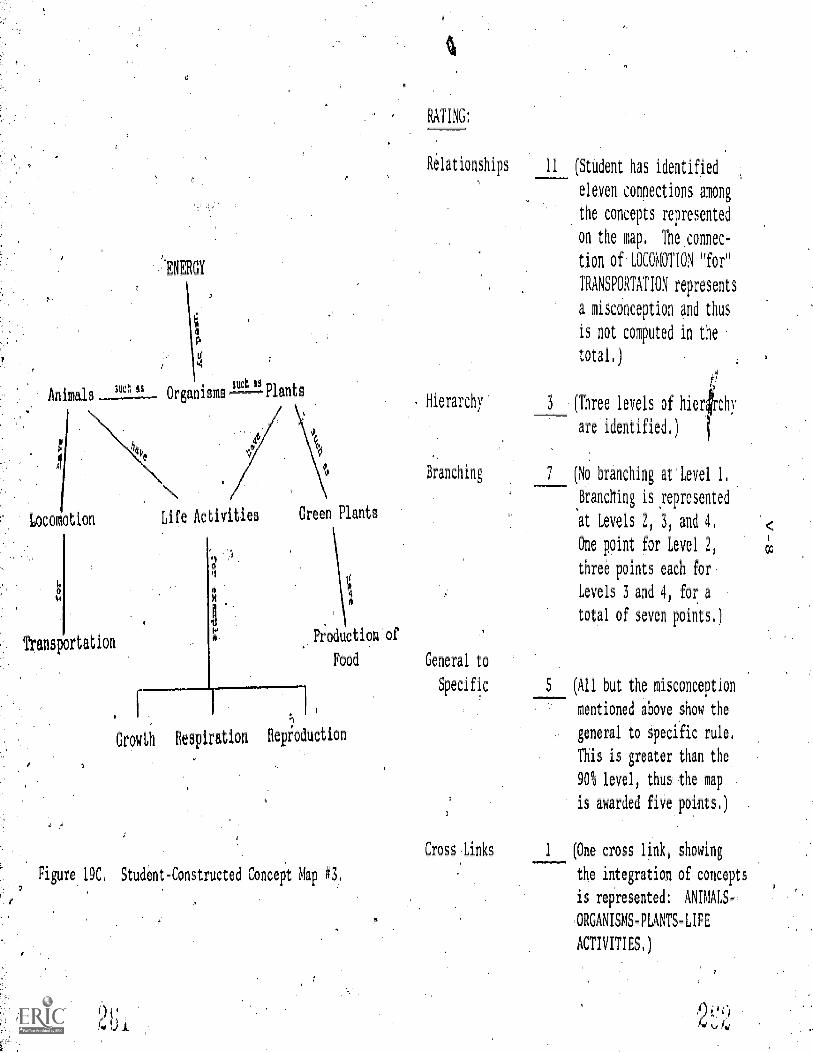
'ENERGY
Animals ''." Organisms2121Plants
Locomotion
6
'Transportation
Life Activities
0
Green Plants
Relationships 11 (Student has identified
eleven connections among,
the concepts represented
on the map. The connec-,
tion of LOCOMOTION 'Tor"
TRANSPORTATION represents
a misconception and thus
is not computed in the
total.)
Hierarchy 3 (Three levels of hi r'
are identified.)
Branching 7 (No branching at Level 1.
Branching is ,represented
at Levels 2, 3, and 4.
One point for Level 2,
three points each for
Levels 3 and 4, for a
total of seven points )
Produetion'or
Food General to
Specific
Growth Respiration Repioduction
Cross Links
Figure I9C. Student- Constructed Concept Map #3,
(All but the misconception
mentioned above show the
general to Specific rule,
This is greater than the
90% level, thus the map
is awarded fiVe points,)
(One cross link, showing
the integration of concepts
is represented: ANIMALS--
ORGANISMS-PLANTS-LIFE
ACTIVITIES.)
EVALUATION OF THE KNOWLEDGE
AND EXAMPLES OF TERMS
V-9
11 _ _
IDENTIFICATION, DEFINITION S,
This aspect of the evaluation of the-implementation of the
"Learning How to Learn Program" in your classroom is a simple, straight-
forward pencil-paper format. Ifs objective is to determine if students
can identify the parts.of the "V," define each of those.terms in their
(3.11 words, and, given an example of a laboratory exercise, identify
an example of "record," "concept," "knowledge claim," etc- in a laborar
tory exercise. The format is given on the next two pages.
Youyill notice that page V-1l contains two laboratory exercises.
These are examples that we have used in our research. For a test that
you would devise, one example from work previously done by your students
should be used.
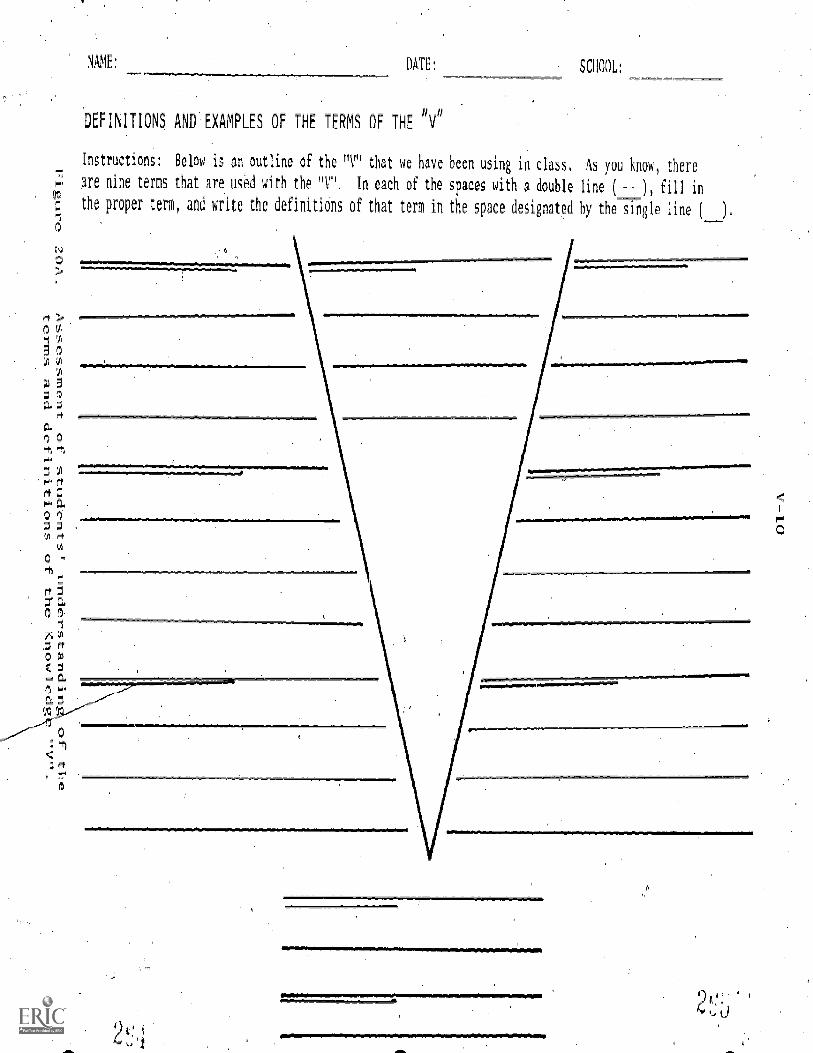
NAME: DATE: SCIR L
DEFINITIONS AND EXAMPLES OF THE TERMS OF THE "V'1
Instructions: Below is an outline of the "V" that we have been using in class. As you know, there
4re nine terms that are used with the "V", In each of the spaces with a double line (----), fill in
the proper temp and write the definitions of that term in the space designated by the single line
0
z
O Ul-
5 0al t.1)
: 0
0 0
1- rt
0 0J 0 .
0
0
rt 3
FD
9A in
ft0C
=10
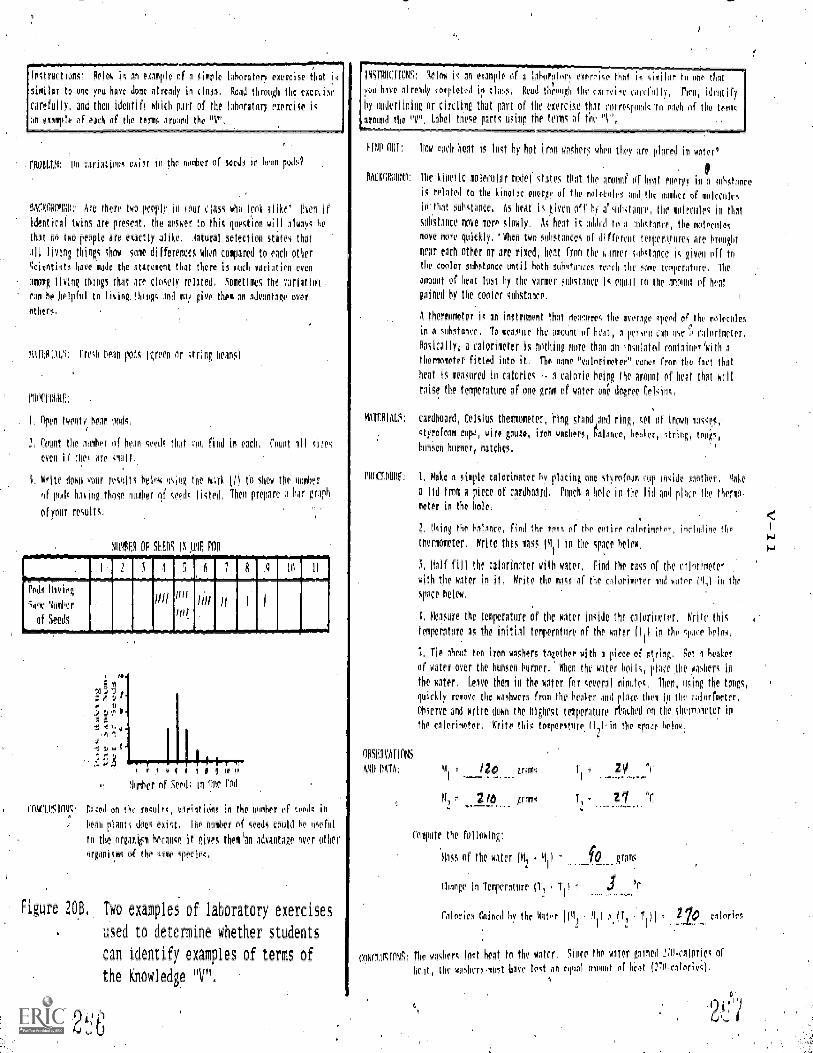
insttuctiow lidos+ is an example of a simple laboratory exercise that is
similar to one you have done already in clogs. Read through the exercise
carefully, and then identify which part of the laboratory exercise is
an OX101111e of each of the terms around the "V".
rRORLDI: Oh variations east in the numbtf of seeds in heat) puilki
BACIICIIOHNOv Are there two people in your class who look alike? liven if
identical twins are present, the lower to this question will always he
that no two people are meny alike, iatoral selection states that
111 living things chow some differences when compared to each other
Scientists have made the statement that there is much variation even
among living things that are closely related. Sometimes the variatioa
can he helpful to lisiog.things and may give them an Advantage over
others:
5111TRILS: !toll Pan pods lerven or acing beihsl
ritoffnultR,
I. Open twenty bean pods:
Count the manlier of bean seeds flirt :rift rind in each. Count all sirs
even if Mei Ate small..
5. Write down ciur results below hsing the kirk fil to chow the +lumber
of pods having those no,abec of seeds listed. Then pi-qu d hirr graph
olentir results.
MliMPFR OF 51-.Ens Mn
rods Having
5amv "thmber
of Stotts
A-
I la
E
:1. it0 D
ti 1.1
E.,
y IP IF
Number of Seeds in one rod
Iii 11
Of/ jtitcell 11
-e-
CONC1.61016: Raged on the results variations in the number of opedo in
lieu plants does exist, the holier of seeds could be aiccfail
to the organ fn because it gives them'an odvantage over other
organisms of the same gpOt1P5,
Figure 208. Two examples of laboratory exercises
used to determine whether students
can identify examples of terms of
the Knowledge "V".
9u
INSTRIICTIONS: Below is an ekample of a lib mire) exercise that is similar to one 0111
ou have already vDmpleted in class. Read Ill'rough the cm-like carefully, Hien, idehtify
l}y underlining or circling that part of the exercise that correstundsin each iif the terms
arouild the "V" Label these parts using the tells of the "I",
till) OHT: flow IAA heat 15 loot by hot iron washers when they are placed in water?
BACIMOUNO: The kinetic molecular model states that the moonf of heat energy in a substance
is related to the kinetic energy of the molechicl, and. tin' milker of molecule,
in that sohstance. As heat 15 given off by ii.mihstanae, the molecules in that
sulistanCe move more slowly, A5 heat is added to a iohstahce, the molecules
move more quickly. °When two sillistances of different temperatores are brought
near each other or are mixed, heat from the warmer substance is Om off to
the cooler substance until both oldiotiniees reach the game temperature, the
amount of heat lost by the warmer substance in canal in the amount of hem
goined by the cooler substance,
A thermometer is an in5tillont that measures the average spud of the molecules
in a suhstonee. To measule the amount or beat, a person can use a calorimeter.
pasicallyi d colorimeter is nothing more than an insulated conininerWith a
thermometer fitted into it. The name "calorimeter" comes from the fact that
heat 15 measured in calories a calorie being the amount of heat that will
raise the temperature of one gram or water o4 degree Celoiho,
MAFFRIAL5: cardboard, Celsius thermometer, king stand ond ring_ of known pmssys,
otyroroam cups, wire gauze, iron washers, Finliince, behIcr, string, tongs,
bonsen hurler, matches.
WOW: I. Make A simple calorimeter hv placing one otyrefoam cup inside another, mate
a lid frot a piece or cardboard. NO ar hole in the lid and place the thermo-
meter in the hole,
mrovATIONs
AMP ItATA;
2, lining the balance, find the mass of the entire calmrimeroc, inclodlop the
thermometer.WritetIlismass.lull in the space below,
Half rill the colorimeter with water, Find the OW of thc calorimeter
with the water in it Write time 1.1111.55 of the calorimeter and water ih1, in the
%pace below,
I. Measure the temperature of the water Wide the calor',rater, Ktitr thin
temperature as the initial temperature of the water ill) in the spots
1, Tie hoot ten iron washers together with a piece of string. Set 1 beaker
or water over the WWII hairnet When the water boils, piaci...Hie washers in
the water. heave them in the water for several minutes, Thep, using the tongs,
quickly remove the washwers from the beaker and place them in the colorimeter,
Nerve and write down the highrst temperature' elltheil on the thermometer in
the calorimeter. Write this temperature. 071-in thin grace below,
,_l,p gram
grams
iy
lninliiite the following'
floss or the water (M, M1
1 grams.
Change in Temperature (T,, fll
raories Coined by the Water IIM. - M.) IT, T2 1
P
70_ calorie
CONfLUS1OVI: fir washers lOct ICJ to the water. Since the water gained 27o -calories of
heat, the washers must have lost an equal aminnit of heat ('ii-calorie),
V-12
ASSESSMENT OF STUDENTCONSTRUCTED "V'S"
Although the title indicates that this evaluation method is
ended for use in assessing student-constructed "V's", it is impor--
tant to remember that the "V" is also a pre-teaching tool, and thus
has applicability there as well.
The objective of this part of the evaluation is to deterniine how
good are the "V'S" that studehts prepare. The first form of the _
evaluation gives an overall picture of the "V" and attempts to locate
large holes in the students' work. In other words, it gives the
teacher, a large field of view so that a more general picture can be
determined. The second form is more comprehenSivo. Its function is
to givethe teacher a closer look at each of the parts of the "V"
and to assess the students' performances .at developing a focus question,
at recognizing the major event, at checking the records and transforma-
tions, etc. For:each of these parts of the "V" a range of scores can
be assigned. The range is constructed from zero 0) which indicates
that there has been nothing written for that part of "V", through
an optimal score for that part,. This form can function in two ways.
First, it can help_ track the progress student over time in each
part of the "V". The "Progress Sheet" on page V -17 can be used to
follow individual student progress to see where major difficulties
stand out, and where the teacher should concentrate in subsequent
work with individual students. ;Second, the total of all the parts of
the "V" can be used to provide a single mark for laboratory exercises.
This rk is represented at the bottom of the "Progress Sheet."
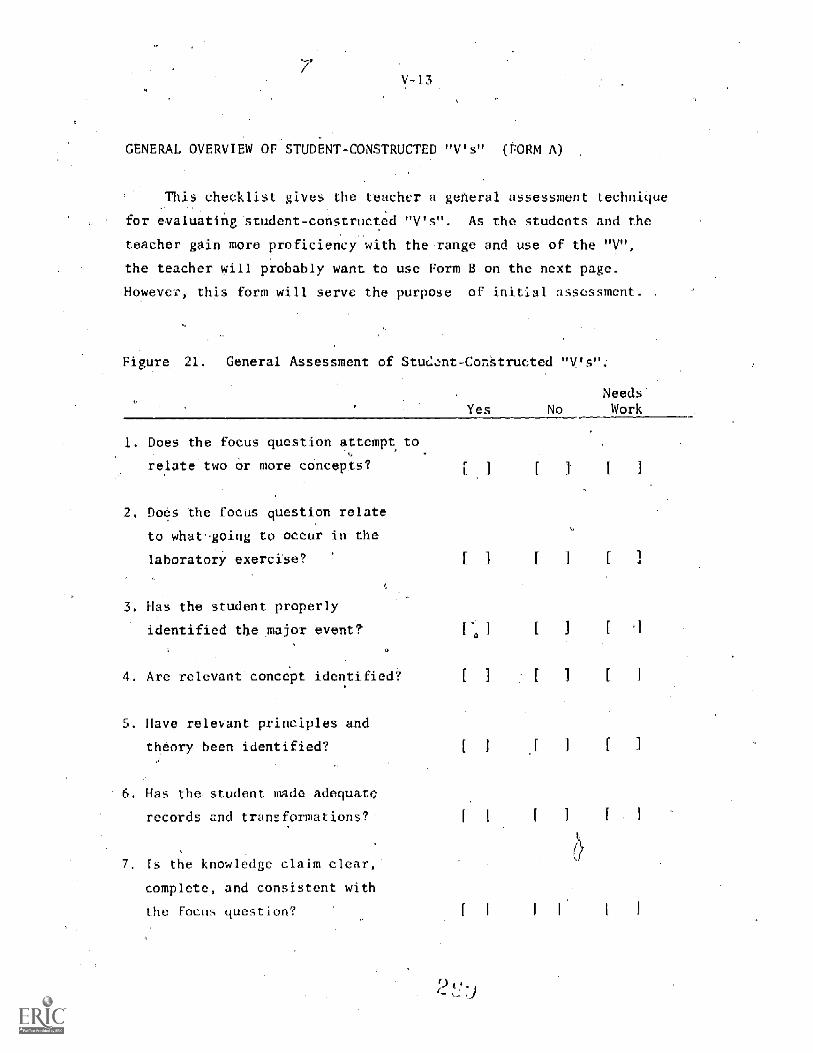
V-13
GENERAL OVERVIEW OF STUDENT-CONSTRUCTED "V's (FORM A)
This checklist gives the teacher a geheral assessment technique
for evaluating student-constructed "V's". As the students and the
teacher gain more proficiency with the range and use of the "V",
the teacher will probably want to use Form B on the next page.
However, this form will serve the purpose of initial assessment.
Figure 21. General Assessment of Student - Constructed "V's"
YesNeedsWork
1. Does the focus question attempt to
relate two or more cOncepts?
2. Does the focus question relate
to what-going to occur in the
laboratory exercise?
3. Has the student properly
identified the major event?
4. Are relevant concept identified?
Have relevant principles and
theory been identified?
6. Has the student made adequate
records and transformations?
7. Is the knowledge claim el
complete, and consistent with
the focus question?
[
1
[ [ I
I
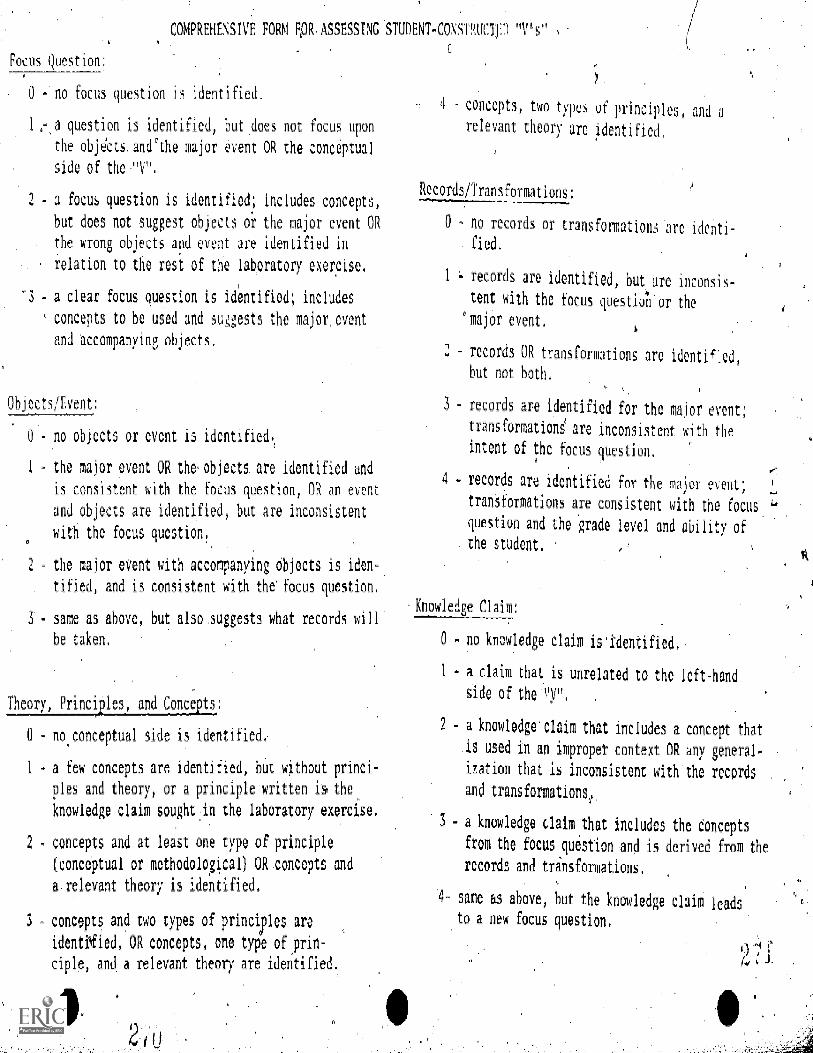
COMPREHENSIVE FORM F,OR ASSESSING STUDENT-CONsTMCIP "V's"
Focus tion:
0 - no focus question is identified.
1 - a question is identified, but does not focus upon
theobje'cts,.anethe major event OR the conceptual
side of the " "V ""
- a focus question is identified; includes concepts,
but does not suggest objects or the major event OR
the wrong objects and event are identified in
relation to the rest of the laboratory exercise,
- a clear focus question is identified; includes
concepts to be used and su4gests the major. event
and accompanying objects:
Objects/Event:
0 - no objects or event is identified.
I - the major event OR the objects are identified and
is consistent with-the focus question, OR an event
and objects are identified, but are inconsistent
with the focus question!
the major event with accompanying Objects is iden-
tified, and is consistent with the focus question,
same as above, but also.suggests what records will
be taken.
Theory, Princiles, and Conceits
0 no conceptual side is identified,
1 - a few concepts are identified, but without princi-
ples and theory, or a principle written is the
knowledge :claim sought n the laboratory exercise.
2 - concepts and at least one type of principle
(conceptual or methodological) O.R. concepts and
a relevant theory is identified.
3 - concepts and two types of princiyles are
identified, OR concepts, one type of prin-
ciple, and, a relevant theory are identified.'
4 concepts, two types of principles, and a
relevant theory arc identified,
Records /Transformations;
0 - no records or transformmations arc identi-
fied.
1 . records are identified, but are inconsis-
tent with the focus questioli'or the
°major event.
records OR transformations are 1denti ied,
but not both.
- records are identified for the major event;
transformations` are inconsistent with the
intent of the focus question,
4 - records are identified for the map_ event;
transformations are consistent with the focus
question and the grade level and ability of
the student.
Knowledge Claim
0 - no knowledge claim is'identified,
1 - a claim that is unrelated to the left-hand
side of thel"..
2 - a knowledge' claim that includes a concept that
is used in an improper context OR any general-
ization that is inconsistent with the records
and transformations,.
- a knowledge claim that includes the Concepts
from the focusquestion and is derived from the
records and transformations,
4- same as above, but the knowledge claim leads
to a new focus question.
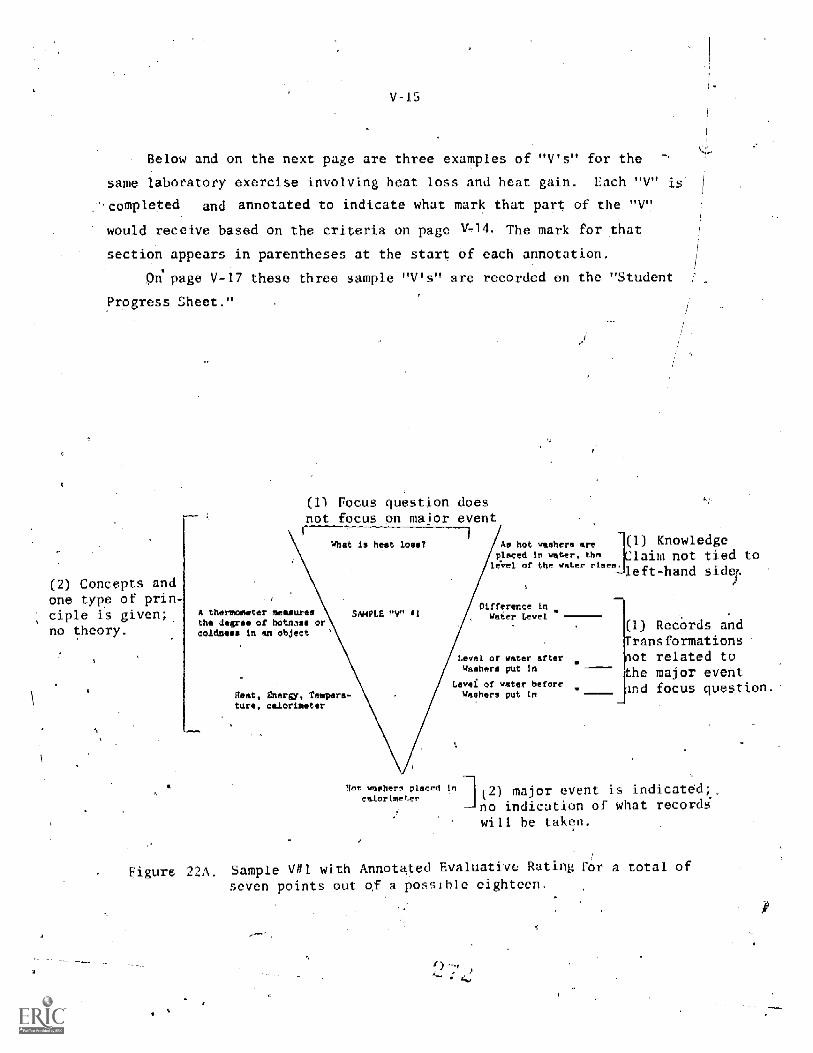
V-15
Below and on the next page are three examples of "V's" for the
same laboratory exercise involving heat loss and heat gain. Each "V"
completed and annotated to indicate what mark that part of the "V"
would receive based on the criteria on page V-14. The mark for that
section appears in parentheses at the start of each annotation.
P' page V -17 these three sample "V's" are recorded on the 'Student
Progress Sheet."
(2) Concepts andone type of prin-ciple is given;no theory.
(1) Focus question doesnot focus on major event
What is heat lose( An hot washers areplaced in eater, the
of the stater rises.
A thermometer measureSthe degree of hotnces ocoldneas in an object
SAMPLE "V" 81
Rest, Energy, Tempera=tore, calorimeter
erence inWater Level
eves or veter after!here put In
Level of water beforewashers put in
Rot washers placed Incalorimeter
(1) KnowledgeClaim not tied toleft-hand sides.
(1) Records andransformationslot related tohe major eventInd focus quest on.'
(2) major event is indicated;.no indication of what recordg
will he taken.
Figure 22A. Sample V#1 with Annotated Evaluative Rating for a total of
seven points out of a possible eighteen.
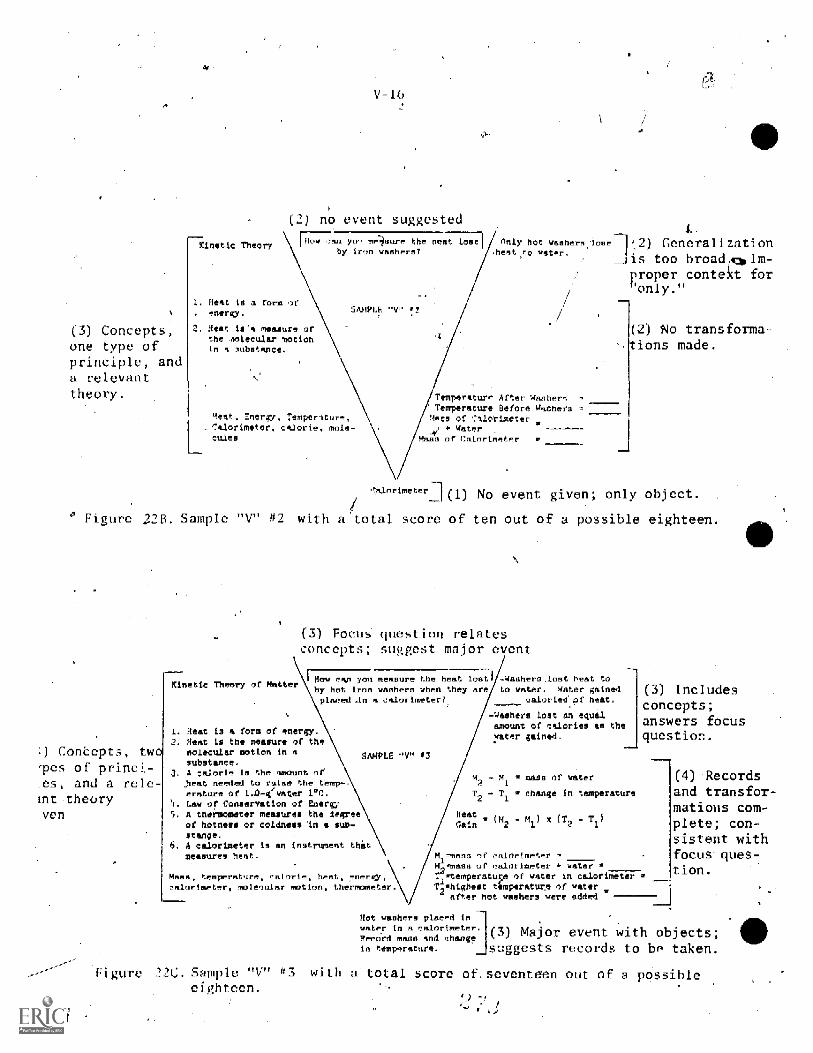
(3) Concepts,one type ofprinciple, anda relevanttheory.
Kanetio Theory
V-16
(2) no event suggested
How +!AS yo- meigure the neat loit7t1 only hot washersby iron washers? heat,to crater.
1, Heat is a form of. energy.
Heat is `a measure ofthe 4olecular motionin a substance.
SAMPLE "V" ,2
Wee,. FnerWY. Temperature,, Calorimeter. calorie, mole-cules
Figure 22R. Sample "V" 2 wi
ConCepts, twoapes of princi-.es, and a rele-tnt theoryven
lure 2
Kinetic Theory or Matter
h a
Temperature After WashersTemperature Before Washers e4 of '7alotimeter
* Waterof Calorimeter .
me
ae T2) Generalization_tis too broad.legoIm-
proper contet for"only."
(2) No transforma-tions made.
(1) No event given; only object.
otal score of ten out of a possible eighteen.
(3) Focus- question relatesconcepts; suggest major event
I. Heat is a form r energy
2. Heat LS the measure of themolecular motion in 4substance.
3. A calorie is the amount oreat needed to raise the tamp-.
erature of 1 -0-ewater 1 °c.G. Law of Conservation of Energy5. A thermometer measures the degree
of hotness or coldness In a sub-starve.
6. 4 calorimeter is en instrument thataaures heat.
How can you measure the heat lost'by hot iron washers when they areplaced _in 4 calorimeter?
SAMPLE "v" 03
Mass. temper-_ure, calorie, heat energY,alorimeter. molecular motion. thermometer.
Sample "V" it3eighteen.
-Was er _loot heat toto water. water gained
calories of heat.
Washers lost en equalamount of calories as the:rater gained.
m. z m_1
mass of water2
T, Ti . change in temperature
Heatgain. (M 2
malls of calorimeterrinses of calorimeter * waternemperatuce of water in ca-Lorihigheet temperature of water
Cr hot washers were added
Hot washers placed inwater in a calorimeter.Record masa and changein temperature.
r
(3) Includesconcepts;answers focusquestion.
(4) 4Zecords
and transfer-Mations com-plete; con-sistent withfocus ques-tion.
(3) Major event with objects;suggests records to be taken.
with a total score of. seventeen out of a possible
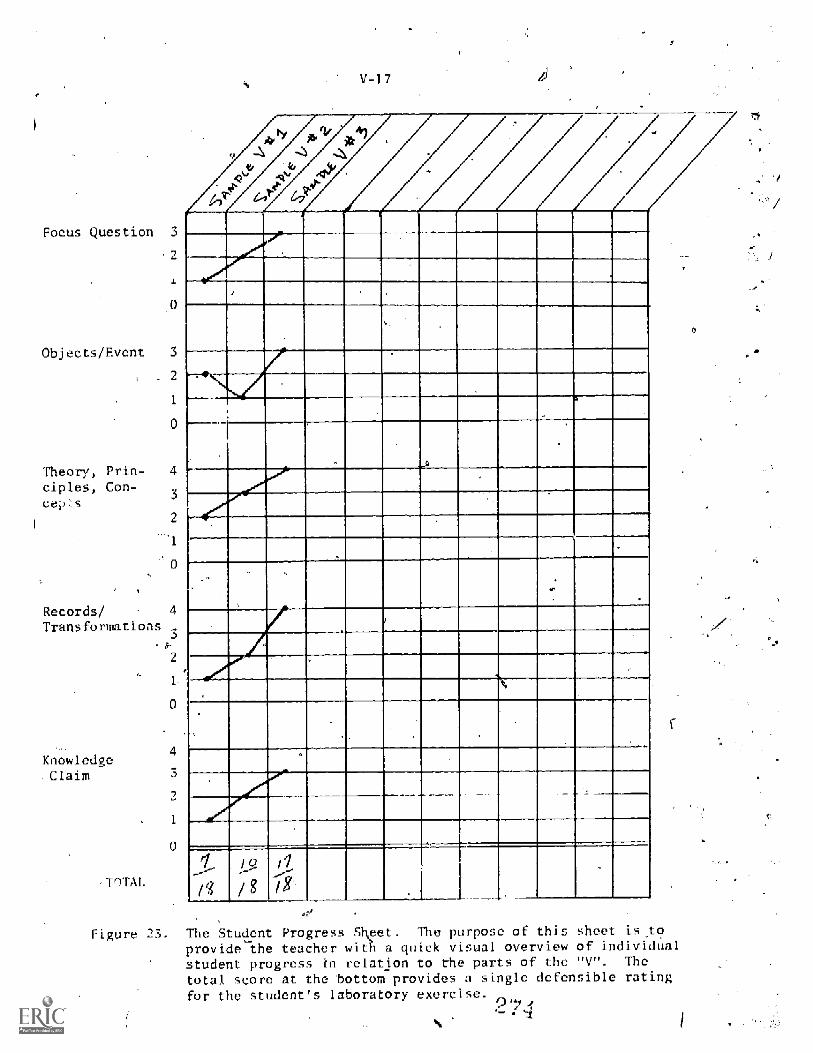
Focus Question
2
V-17
Objects/Event '3
.. 2
1
Theory, Prin- 4
ciples, Con-3ceps2
Records! 4
Trans formations
KnowledgeClaim
TnTAL
2
1
0
4
1-1
Figure The Student Progress Sheet. purpose of this sheet is, to
provide the teacher with a quick visual overview of individualstudent progress in relation to the parts of the "V". The
total score at the bottom provides a single defensible _rating
for the student's laboratory exercise.
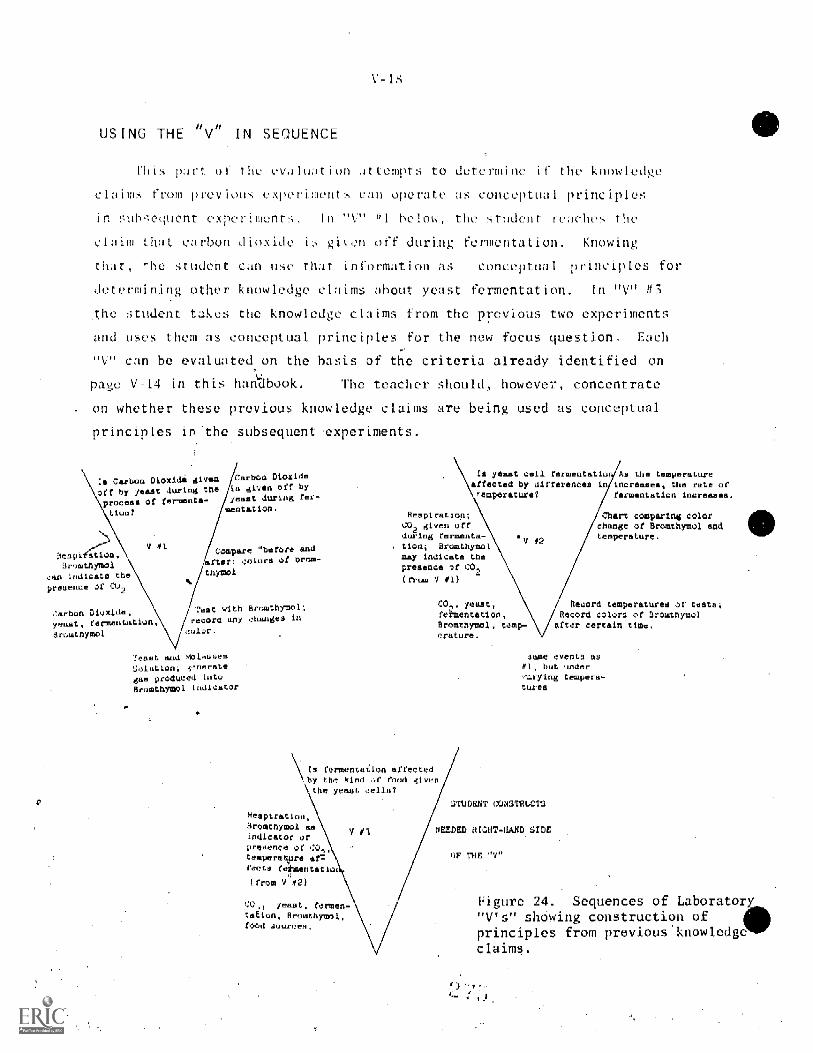
USING THE N SEQUENCE
V=18
Ihis part 01 the evaIiition attempts to determine if the knowledge
claims t -1'om previtru experiments can operate as conceptual principles
in suhsoquent experiments. In "V" nl below, the student reaches the
aim that carbon dioxide is Oven ()Cr during fermentation. Knowing
that, 'he student can use that information as conceptual principles for
determining other knowledge aims about yeast fermentation. In "V" n3
the student takes the knowledge claims from the previous two experiments
and uses them as conceptual principles for the new focus question. Each
"V" can be evaluated on the basis of the criteria already identified on
page V-14 in this haitbook. The teacher should, however, concentrate
on whether these previous knowledge claims are being used as conceptual
principles in the subsequent experiments.
Carbon Dioxide Ovenby yeast during the
process of fermenta-on?
tespifstionBromtnyM01
,:an indicatepresence o_
Carbon Dioxidegiven off by
east during ter-ntation.
COepare 'before andr: colurS of nrom-
t:erben 0 elan .yeeet, fermentsbroutnyM01
t with Broothrsord any ctuunges
ieaat and MOlua4ea
lolutiOOn generate
dad produced intoBroothymoi Indicator
Hespiratdromthymolindicator ofpresence or cu,tempera re sr-recta Cetmentatiot
from V #2)
I. yeast cell fermen at As the temperatureaffected by differences in increases, the rate of
emperature4 fgrmentatlon increases.
Respiration;divan off
u?Ing fermenta-tion; Bromthymolmay indicate thepresence it GO0
ram V #1)
ntntian__ affected
by the Sind rood giventhe yeast cella?
V #2
art comparing colorage of Bromthymoi exist
tore.
CO,, yeast, Record temperatures or Costa;fe entetion, Record colors of brOwthymolbremthymo certain time.erature.
same events as#1 but under.7..rying tempera-
tures
STUD T NS -
NEEDED RIGHT -RAND SIDE
OF THE "V"
yeast fermen=taEion, Droothymol.food sourced.
Figure 24. Sequences of Laboratory"V's" showing construction ofprinciples from previous knowledgeclaims.
V-19
INTEGRATION OF THE "V" AND CONCEPT MAPPING
this stage of the evaluation of the introduction of these
strategies into the classroom, student should have a firm grasp
of both techniques. What tme is appropriate to integrate concept
mapping and the "V" dep upon a number of conditions: ability of
the students, pacing of the class work, and how intense the exposure
to these strategies has been previous to this time. However, when
the
begin.
In our studies, one teacher eased into this integration by having
students construct small concept maps for the "background" information
of an experiment. This exercise was given for homework or in the
pre-lab discussion. After the experiment was completed, the students
feels that the students are ready, the integration can
proceeded to construct the VIVI! for the exercise. After a few trials
with this method, the students were asked to take this preliminary
concept map and make it the left-hand side of the "V".
Evaluation of the integration of both concept mapping and the "V"
involves taking certain aspects of the assessment techniques already
mentioned in this handbook. Here then are some general guidelines
suggestions for implementing the integration:
1. When assessing a student's "V" delete "Theory, Principles,
and Concepts" from the criteria for evaluating ae "V" (page V-1,
2. Substitute either the general format for assessing concept
maps (Form A), or the more comprehensive (Form (B). It is
recommended that the more oeneral form be used at first,
and then switch to the more comprehensive form as students
become more familiar with the integration.
3. If the students have already come this far with these
strategies, it i not recommended that the teacher use
Form A for assessing the "V". Form A is too general to
provide the kind of specificity that Form B prbvides.
V-2u
CONCEPTUAL QUESTIONS: USE OF THE "V" AND CONCEPT MAPPING
in the previous se
Fami i ar with the
This section
ategi
idho
student should be completely
concept mapping and the Knowledge "V".
attempts suggest techniques that crn
he used to determine if the strategic- have had any effect on meani
learning (Sect ian Ill.
How students learn is affe ~cted to some degree by the kinds of clues-
ions whfth they anticipate on tests and quizzes. If the students are
asked only questions that require rote memorization, and if they have
experienced success by learning that way, then there will be less
incentive for them to learn in a meaningful fashion,
The technique that we advocate involves the construction of what
can be called "conceptual questions." There are not what some may think
"thought questions" or "brain teasers." Answering a conceptual
question requires that students,empley meaningfully learned concepts,
facilitated through the use of the strategies of concept mapping and
the Knowledge "V".
Although it is highly improbable to devise- questions that totally
eliminate the rote mode of learning, it is possible and desirable to
devise questions that- minimize this factor and which are more conducive
to being answered by :the student who has learned meaningfully. These
kinds of questions can also he Used in a variety of situations, including
re_ w sessions, independent study, as well as test construction by the
teacher.
TWo examples of conceptual questions which were used in our research
are described in the next few pages. Both involved a description of an
experimental event which paralleled one that the students had previously,
done in class, and which contained concepts that the learners had already
encountered. The first example illustrates how a laboratory exercise
already completed can pave the way for the construction of a conceptual
quest icon. The second examplb relies on ,a different conceptual system
(atomic. theory, in this case) to offer an explanation for an event usually
associated with electricity. Following the description of each example,
the method for evaluation of the questionsJs given.
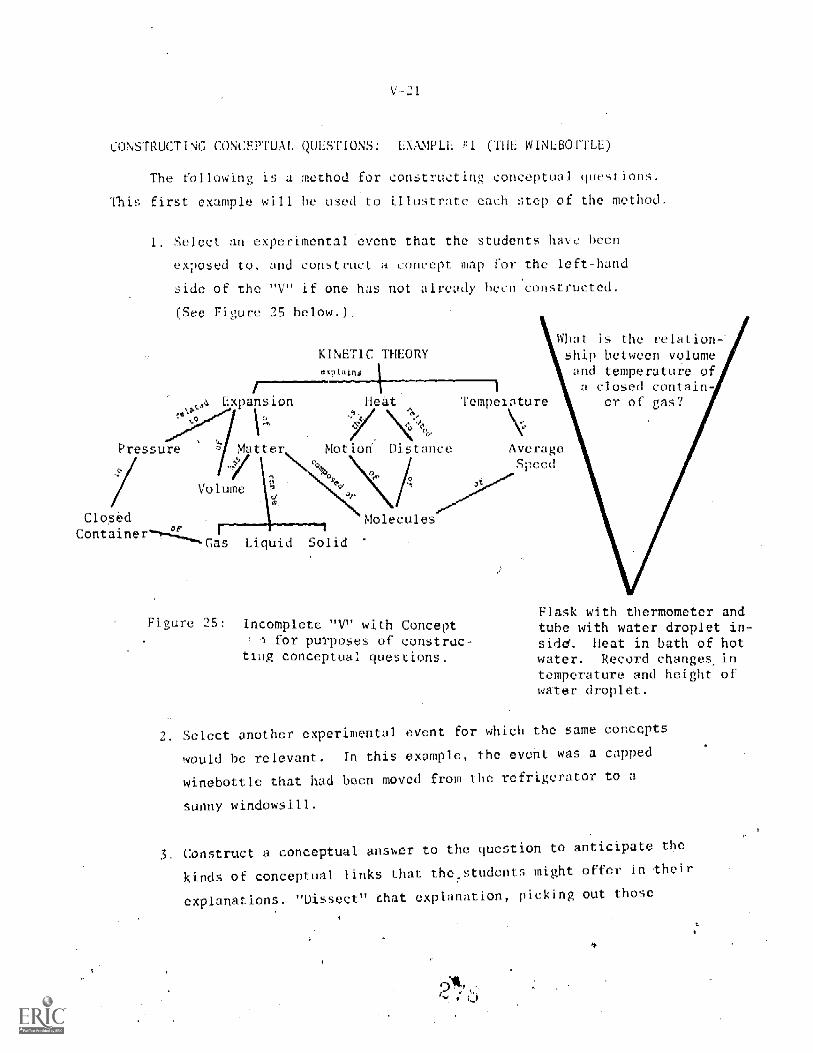
V-21
CONSTRUCTING CONCEPTUAL QUESTIONS: 1PLE 41 (THE
The following a method for
first example will he use
Select an experimenta
L_O ru)
construct 01 conceptual questions.
to illustrate each step of the method.
that the students have he
exposed to, and construct a concept map for
side of the "V" if one has not already been
(See Figure below.).
pansion
KINETIC THEORYeKplains
the left-ha--
constructed.
Heat Tempel ture
Pressure
ClosedContainer
Gas Liqu
att ion Distance
What is the relation-'ship between volumeand temperature oa closed contain-
er of gas?
AverageSpeed
Vroro
Figur
Molecul
d Solid
Incomplete "V" with Concept1 for purposes of construc-
ting conceptual questions.
Select another expe
would be relevant.
winebottle that had
sunny windowsill.
Flask with thermometer andtube with water droplet in-side. Heat in bath of hotwater. Record changes intemperature and height ofwater droplet.
mental event for which the same concepts
In this example, the event was a capped
been moved from the refrigerat
Construct a conceptual answer to the question to anticipate the
kinds of conceptual links that the, students might offer in their
explanations. "Dissect" that explanation, picking out those
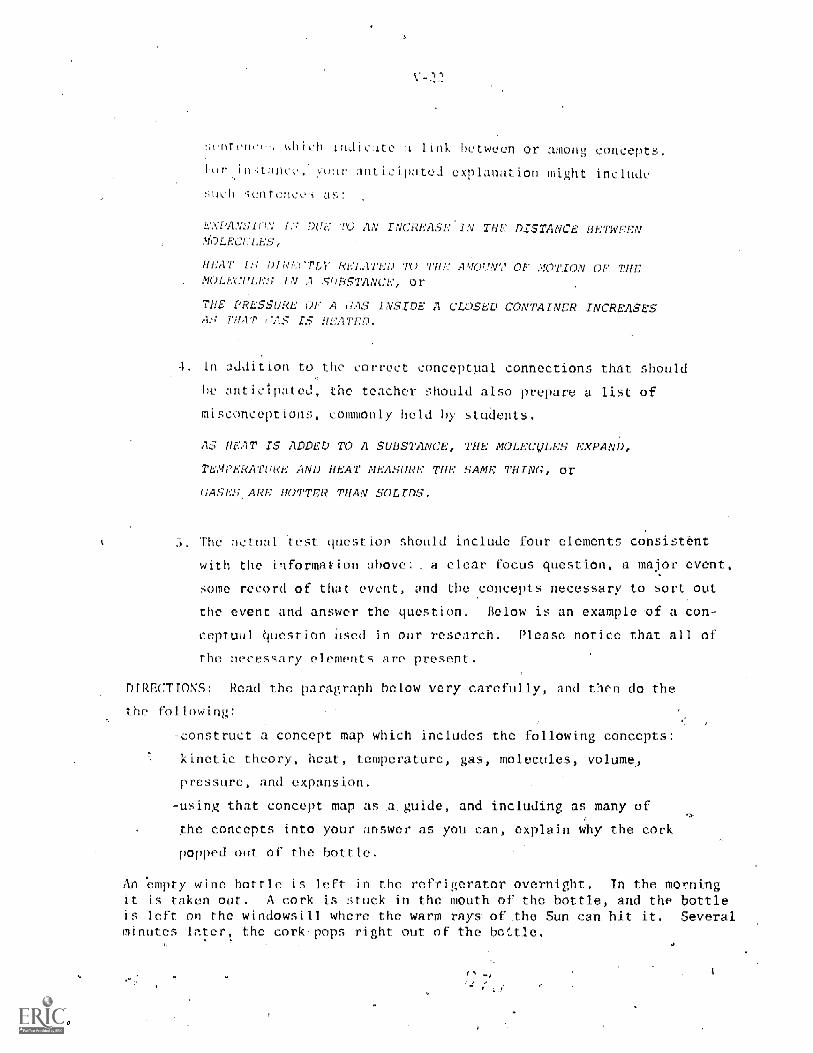
slitoniTh ndi Lt0 link between or among concepts.
ur anticipated explanation might include
!;Qatenco,-i as
EXPANSION IS Dui-: ICM6LECULES,
HEAT IS DINECPIMOLECULES rN A .
N THE DISTANCE BETWEEN
TED TO THE A VW° OF' NOTION OF THECE, or
TUE PRESSURE OF A CAS INSIDE A CLOSED CONTAI:A L'i/AT (;A:2; TS
-R 'CREASES
[n addition to the correct conceptual connections that should
be anticipated, the teacher should also prepare a list of
misconception, commonly held by students.
AS HEAT IS ADDED TO A SUBSTANCE, THE MOLECVLES EXPAND,
TEMPERATUE AND HEAT MEASURE THE SAME THING, or
CASES ARE HOTTER THAN SOLIDS.
The ion should include four elements consistent
with the information above : - a clear focus question, a major event,
some record of that event, and the concepts necessary to sort out
the event and answer the question. Below is an example of a con-
ceptual question Used in our research. Please notice that all of
the necessary elements are present.
DIRECTIONS: Read the paragraph below very carefully, and teen do the
the following:
-construct concept map which includes the following concepts:
kinetic theory, heat, temperature, gas, molecules, volume,
pressure, and expansion.
-using that concept map as guide, and including as many of
the concepts into your answer as you can, explain why the cork
popped out of the bottle.
An 'empty wine bottle ts left in the refrigerator overnight. In the morningit is taken out A cork is stuck in the mouth of the bottle, and the bottleis left on the windowsill. where the warm rays of the Sun can hit it Severalminutes later, the cork: pops right out of the bo'.tie.
Several varia
V-23
s of this kind of question of course,
possible, but the major elements mentioned already should he
included. You may, for instance, decide that you do not want
your students to construct a concept map as part of the answer.
Although the constructed concept map may he helpful in indicating
areas where misconceptions exist, our research seems to demon-
strate that the making of a concept map is i of necessarily*
imperative to answering the question.
One final feature that our research has shown to be important
should be considered. In our attempts to construct conceptual
questions, it has been foUnd that the list of concepts must
include one superordinate concept under which all the others
can be subsumed. In the example given above, that superordinate
concept was "kinetic theory." In the next example, it is the
"atomic theory," implied because of the presence of the concepts
"electron" and "proton."
CONSTRUCTION CONCEPTUAL QUESTIONS: EX ir,E #2 (ELECTRICITY)
Using the method described in this section, another example of conceptual
questions was designed during our research. Again, the major elementS are
present: a clear focus question, a major event, some record of that event,
and the concepts necessary for the student to answer the question. On the
next page the question that was given to the students ovided.
*
This is consistent with our thesis that oncept mapping isn heuristic
devic needed only to facilitate meaningful learning. Once the mean-
ingful learning has occurred, the construction, or re-construction,
of a concept map may not he necessary.
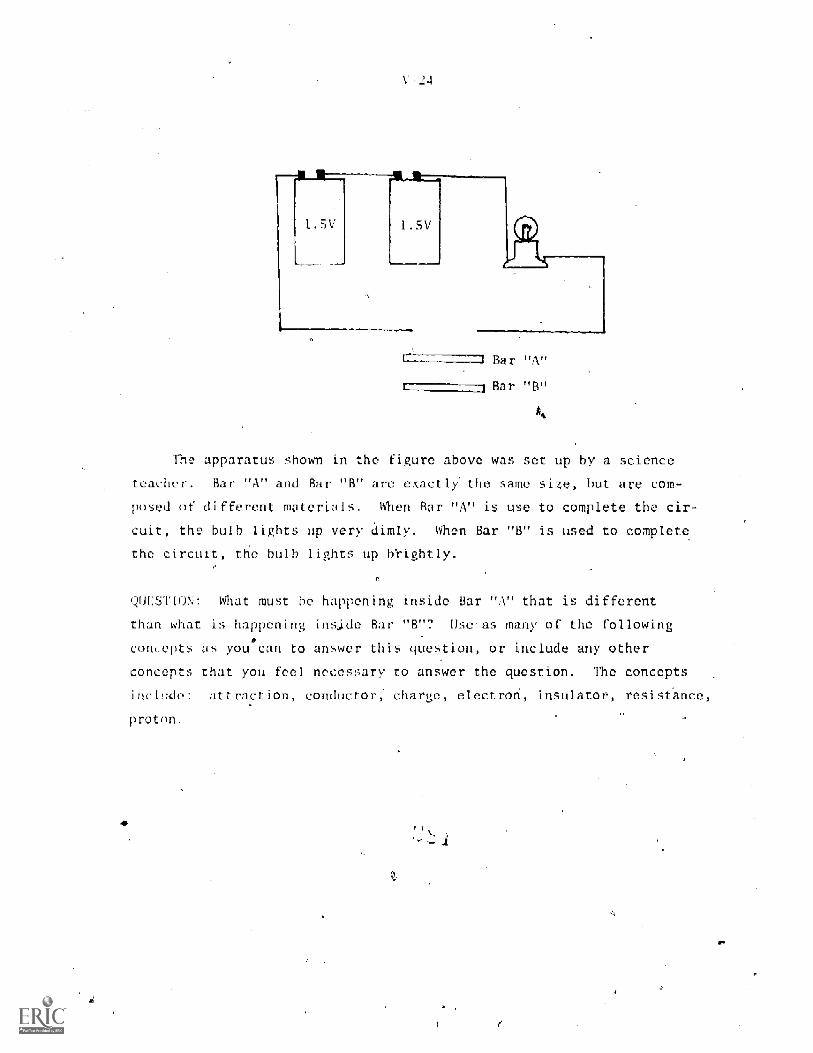
4-24
5V
Bar "A"
Bar "B"
The apparatus shown in the figure above was set up by a science
teacher. Bar "A" and Bar "B" are exactly the same size, but are com-
posed of different mater When Bar "A" is use to complete the cir-
suit, the bulb lights up very dimly. when Bar "B" is used to complete
the circuit, the bulb lights up brightly.
QUFSION: That must he happening inside Bar "A" that is different
than what is happening inside Bar "B"? Use-as many of the following
concepts as you can to answer this question, or include any other
concepts that you feel necessary to answer the question. The concepts
include: attraction, conductor, charge, electron, insulator, resistance,
proton.
REFERENCES
Aos bel Day d P., Novak, J.D., and Ilanesian, icnal Psychology:A Cognicive View. 2nd Edition. New York: Ilolt, Rinc,art and
WThston, 1975.
Cowin, D. Bob. "Edocatin " 19-9. (Unpuh! i !Ailed A nuscript).
Heimler, Charles H. and J. 1_);- id Lockard. Foctf; on Life Science.
Columbus, Oil: Charles E. Merrill Publishit4; Company, 1977.
Moyer R.E. Thinking and Problem Sol ing: An Introduction to HumanCognition and Learning. Glenville, IL: Scott, Foresman and Compan1977.y,
Moreira, Marco A. "Concept Maps as Tools for caching." Journal of Coll
Teaching, vol. 8, no..5, 1979, pp.
Novak., Joseph D. A Theory of Education, Ithaca, Cornell University
Press, 1977.
Novak, Joseph D. "Applying Psychology and Philosophy to Improvement of
lAboratory Teaching." The American Biology Teacher, vol. 41, no. 8,
November, 1979, pp. 4 6-470.
Novak, Joseph D. "Learning Theory Applied to the Biology Class-oom."
The American Biology Teacher, vol. 42, no. 5, May, 1980, pp. 280-285.
Novak, Joseph D. "Biology Teaching Practices Based on Application of
Learning Psychology and Philosophy of Scierwe." The American
Biology Teacher,(in press), 1980.
Novak, Joseph D. "PrOaress in Application of Learning Theory." Theorypp. 58-65.into Practice, vol. 19, no. 1, Winter, 1980,
Novak, 'Joseph D. "Effective Scien.._e Instruction: The Achievement of
Shared Meaning." submitted to Australian Science. Teachers Journal.
APPENDIX I I
Sample concept maps from clinical interviews and class assess-
ments (1979-19S0) in Trumansburg, and Vestal, Each map is
identified by the student number, and is rated according to
the criteria fur assessing concept maps (Appendix 1, Section
111-4). The following key is provided to identify each
criterion of the assessment instrument:
R = relationships identified
H = hierarchy
B = branching
GS = general to specific
CL = cross links
ical interviews involving the constructiorCofTwo sample
concept maps. Firtoine from a student in Trumansburg, the second
from a student in Vestal
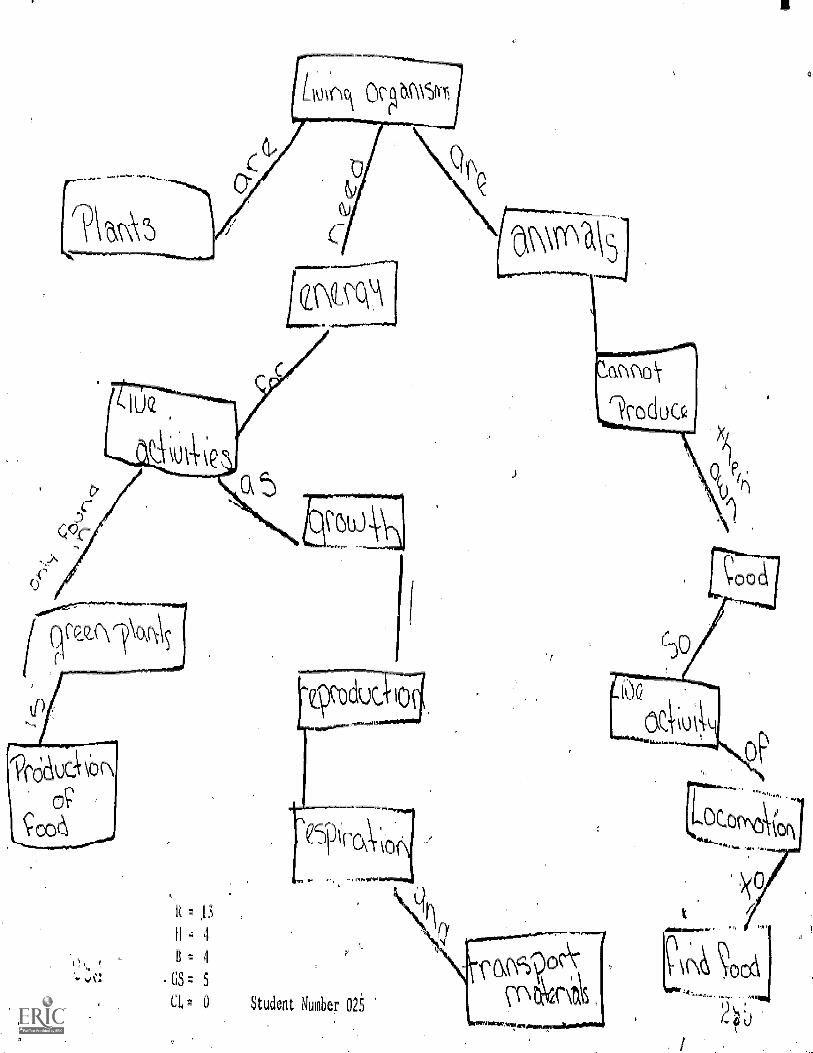
H ; 4
;
GS ; 5
CL 0 Student Number 025
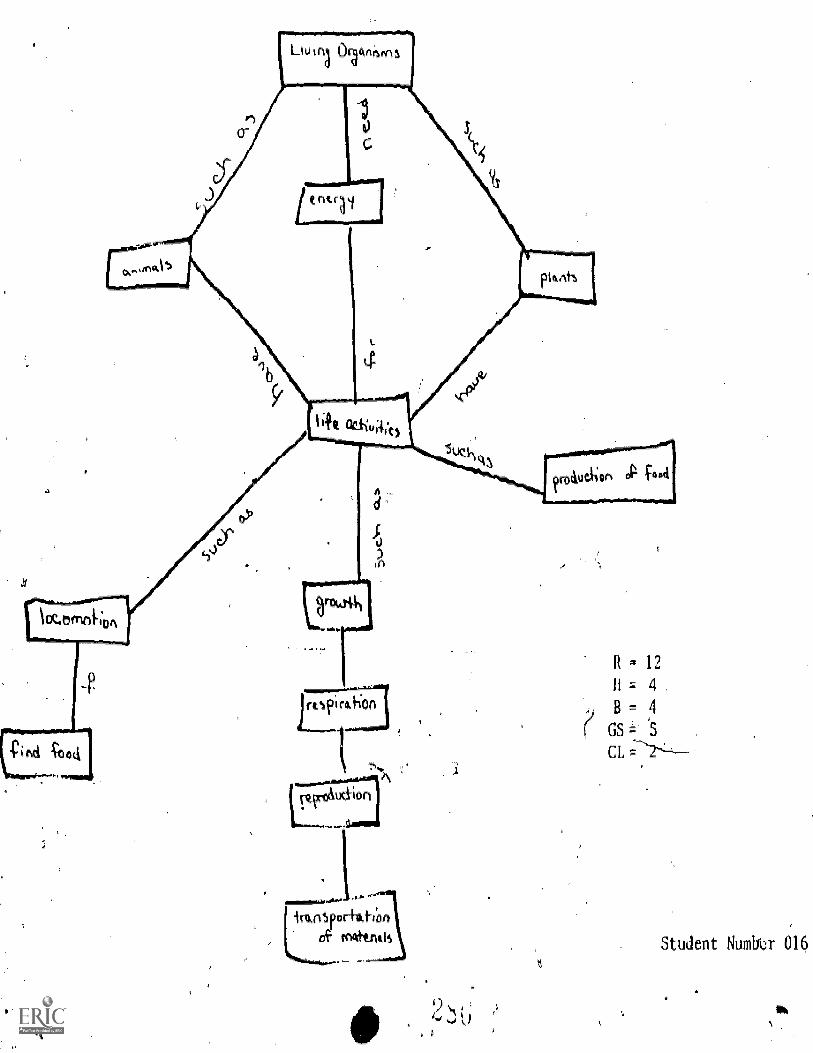
12
Ii g 4
B 4
GS
CL
Student Num00. 016
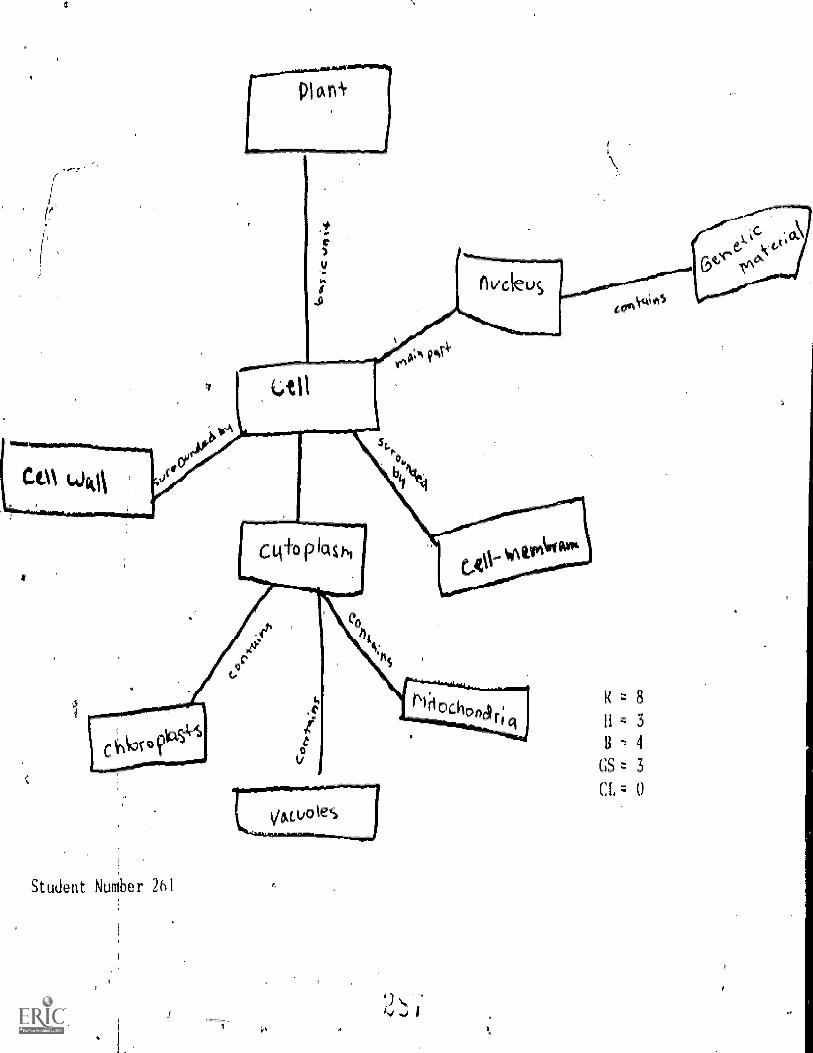
Student Number 261
z 811 t 3
t 4GS z 3
CI, z 0
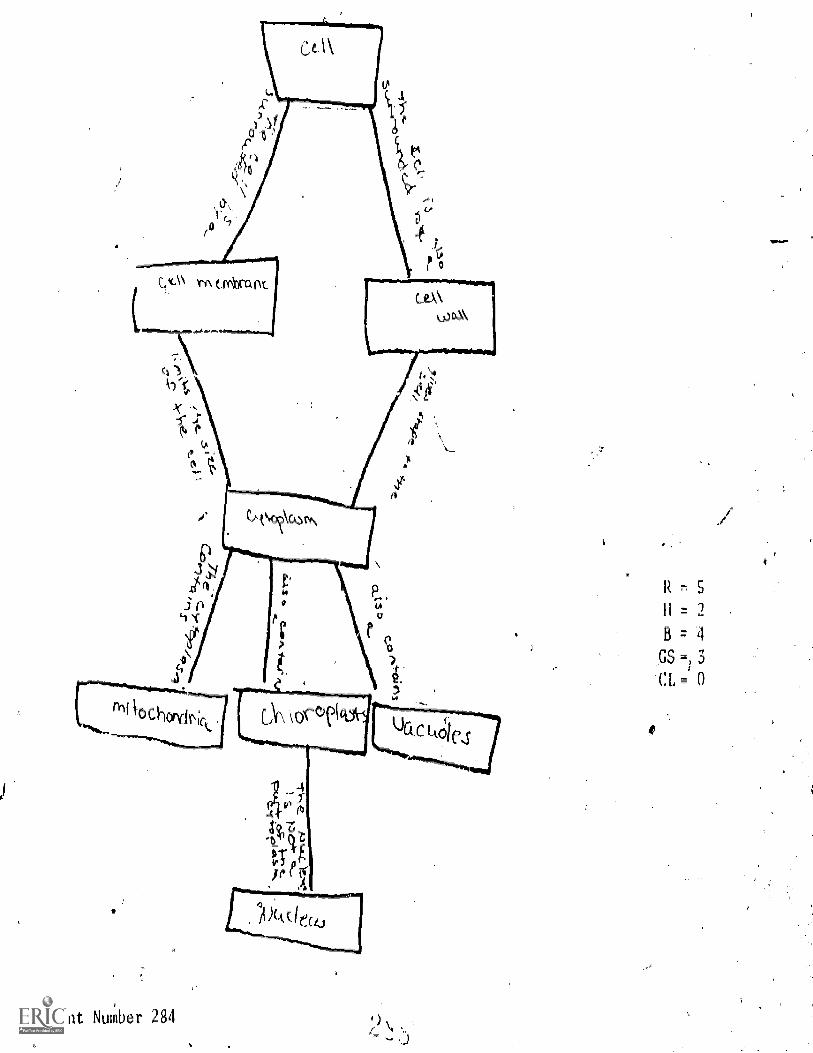
Student Number 284
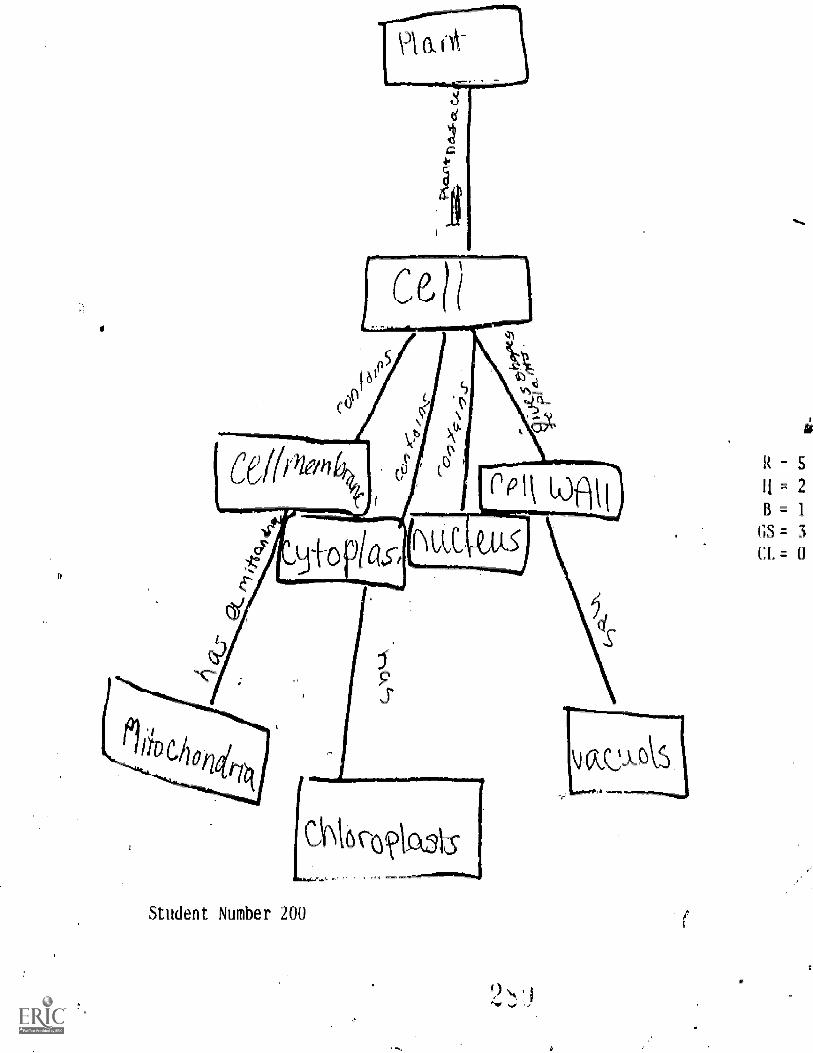
stole
lAober
2Q°
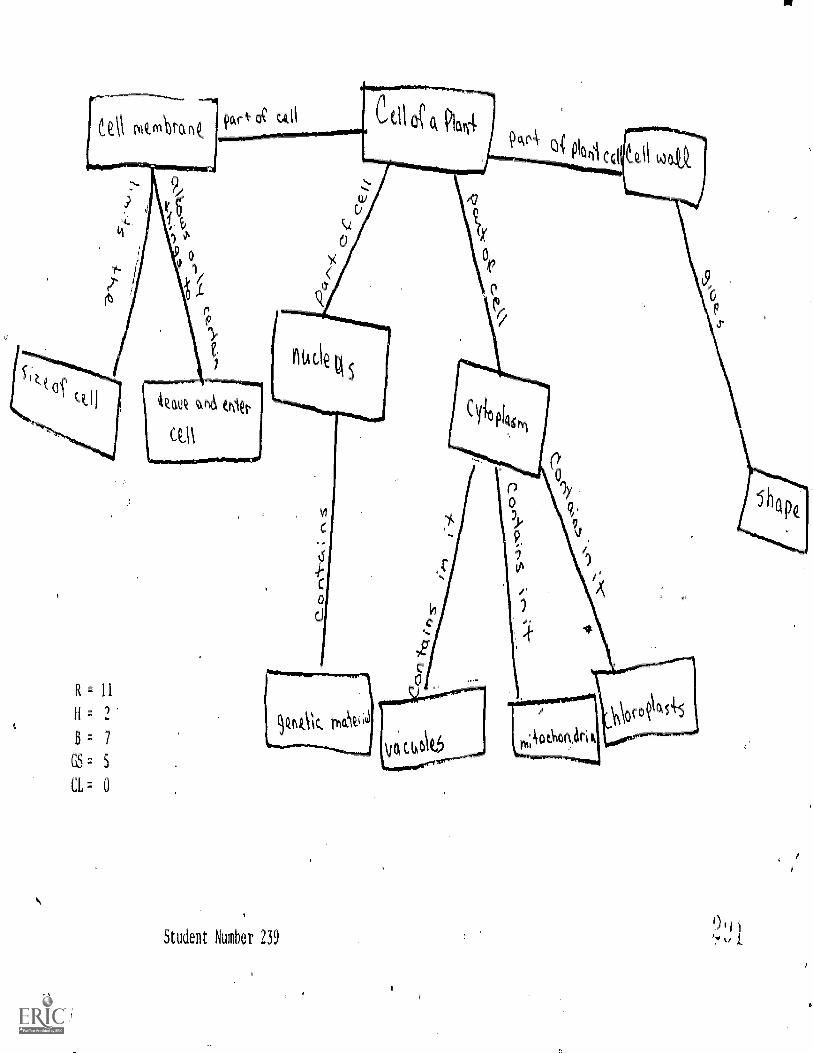
R 11
11 r. 2
-1 7
CS 5
0
Student Number 2390
t
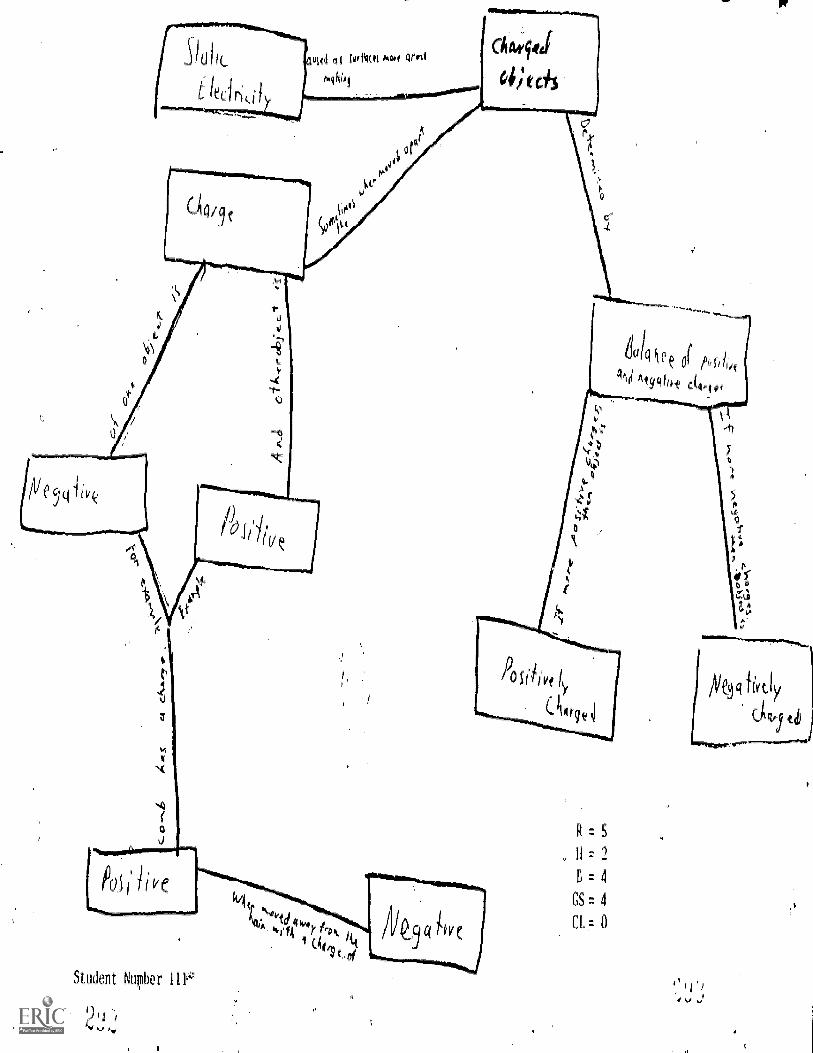
laqinN luoprils
Oidy
Y-191 JO 4,)libini
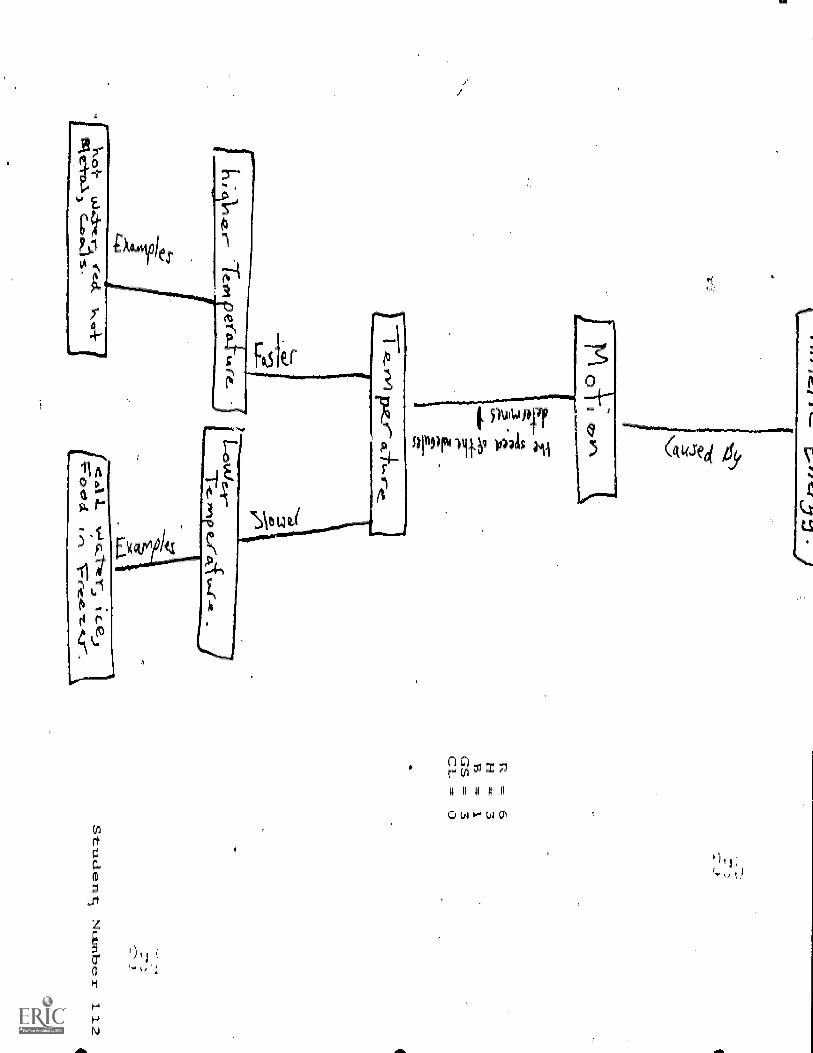
) j
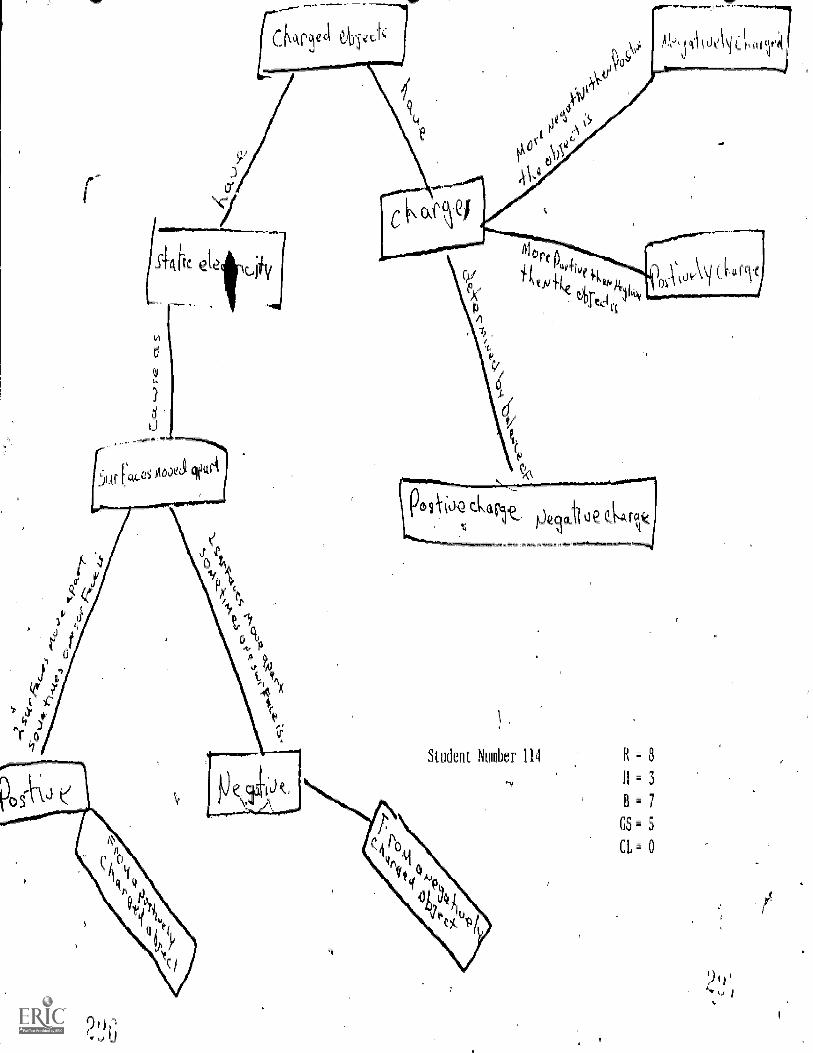
d
U
Student Nn:ber 114
qU-
j
R 8
II 2 3
Bm7
GS x 5
CL 0
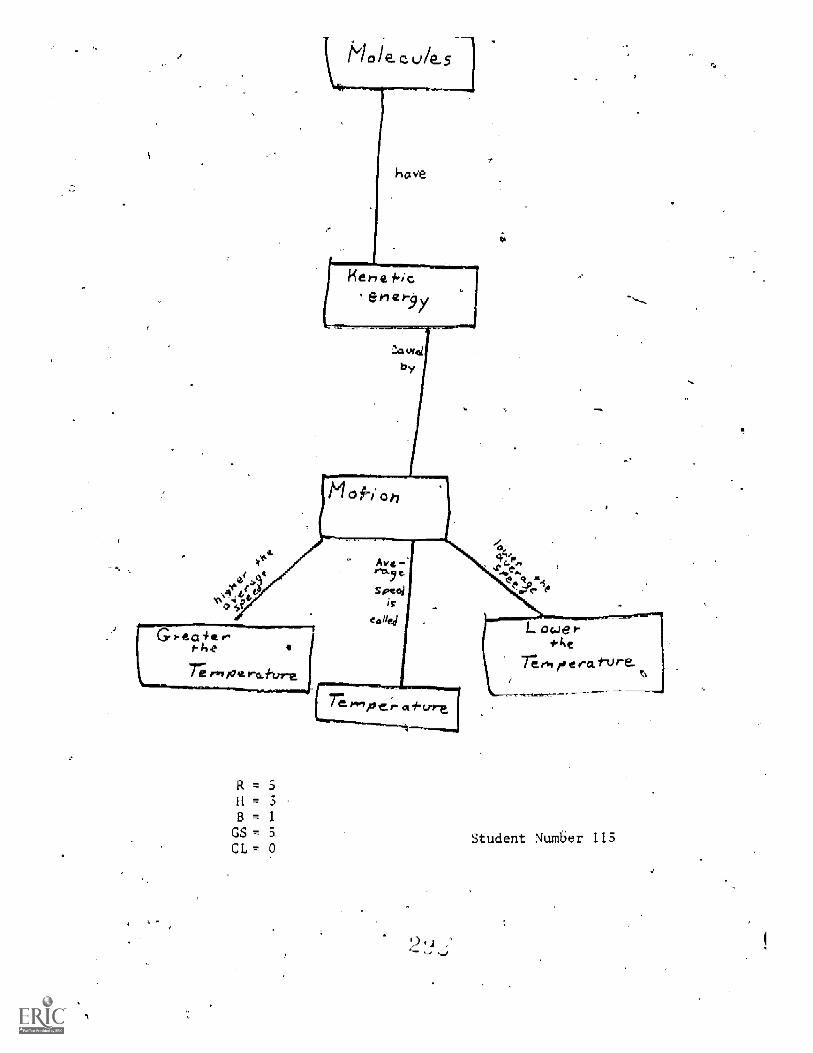
R = 511 =
B = 1
GS = 5
CL = 0Student Number 115
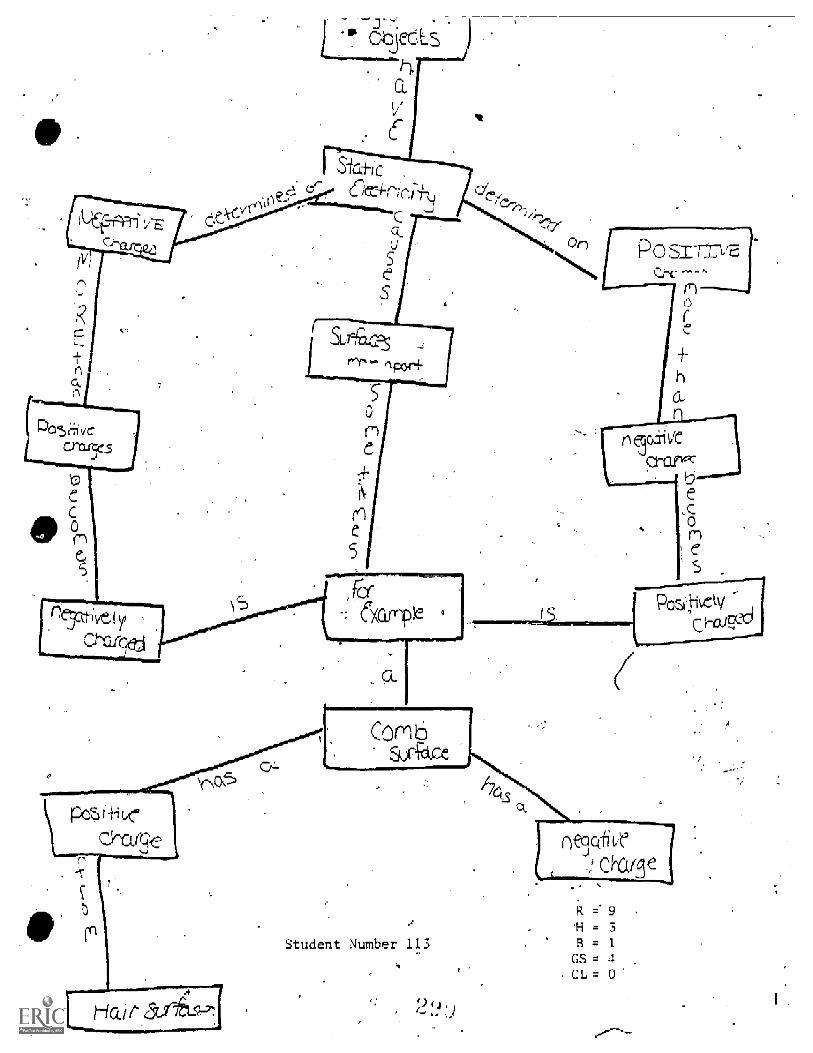
Student Number 113'H = 3B = 1
GS = 4CI, = 0
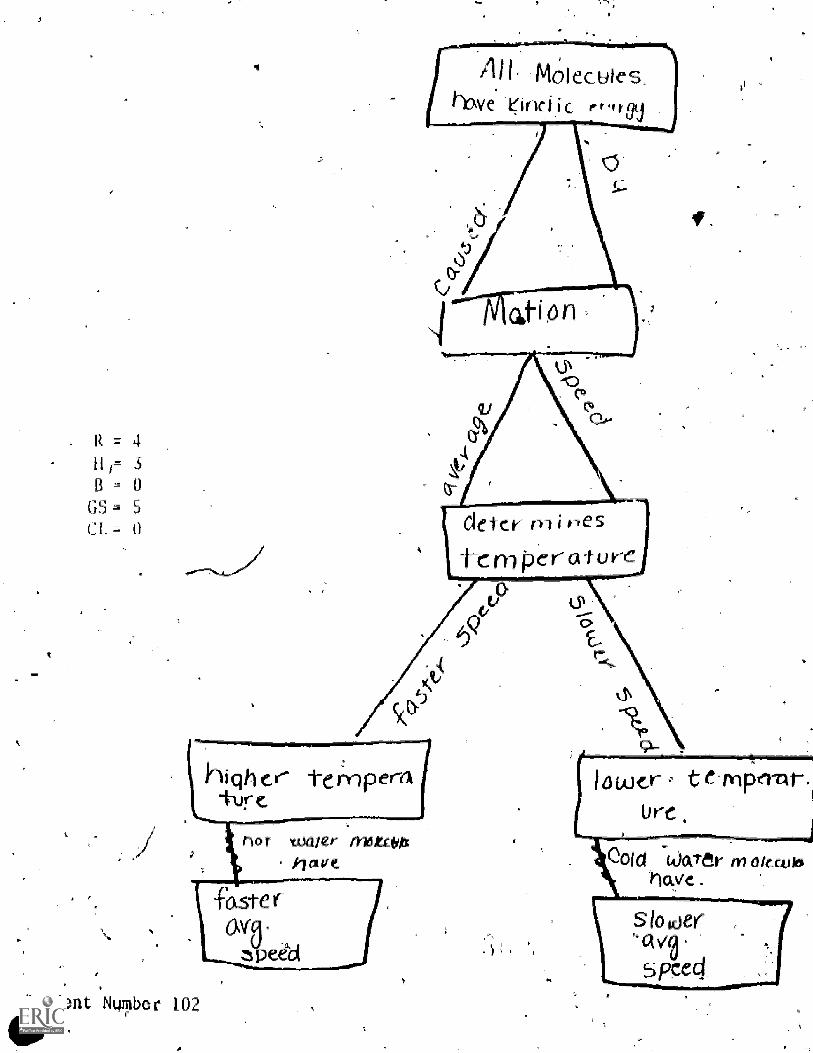
R = 4
H i= 3
B = 05
tcr m f ties
1-C per-a-tore
Student NurOor 102
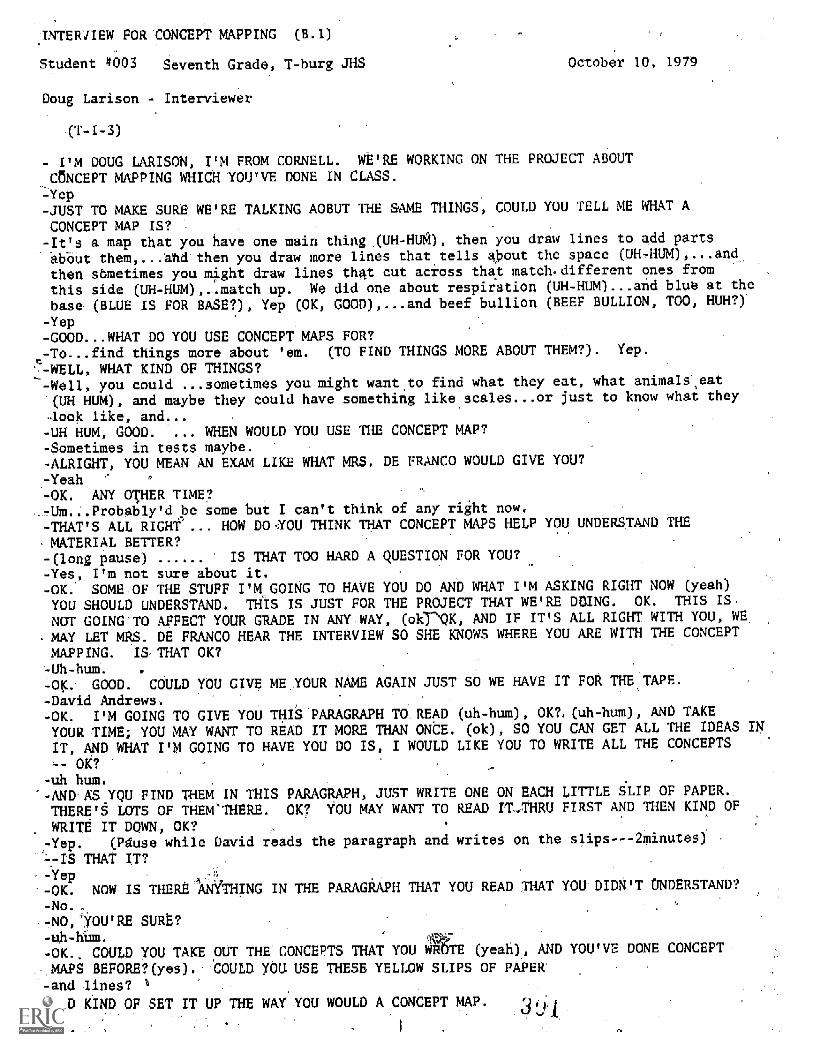
INTERVIEW FOR CONCEPT MAPPING (B.I)
Student #003 Seventh Grade, T-burg J1-IS
Doug Larison Interviewer
( -3)
October 1O, 1979
- I'M DOUG LARISON, I'M FROM CORNELL. WE'RE WORKING ON THE PROJECT ABOUT
CtiNCEPT MAPPING WHICH YOU'VE DONE IN CLASS.
- Yep
- JUST TO MAKE SURE WE'RE TALKING AOBUT THE SAME THINGS, COULD YOU TELL ME WHAT A
CONCEPT MAP IS?It's a map that you have one main thing (UH-HUM), then you draw lines to add parts
about them,...and then you draw more lines that tells about the space (UH-HUM),...and
then sometimes you might draw lines that cut across that match-different ones from
this side (UH-HUM),..match up. We did one about respiration (UH-HUM)...and blue at the
base (BLUE IS FOR BASE?), Yep (OK, GOOD),...and beef bullion (BEEF BULLION, TOO, HUH?)
- Yep
- GOOD...WHAT DO YOU USE CONCEPT MAPS FOR?- To...find things more about 'em. (TO FIND THINGS MORE ABOUT THEM?). Yep.
-WELL, WHAT KIND OF THINGS?- Well, you could sometimes you might want to find what they eat, what animals eat(UH HUM), and maybe they could have something like scales...or just to know what they
-look like, and...-UH HUM, GOOD. ... WHEN WOULD YOU USE THE CONCEPT MAP?- Sometimes in tests maybe.- ALRIGHT, YOU MEAN AN EXAM LIKE WHAT MRS. DE FRANCO WOULD GIVE YOU?
- Yeah
- OK. ANY OTHER TIME?- Um.:.Probably'dbe some but I can't think of any right now.
- THAT'S ALL RIGHT'... HOW DO .YOU THINK THAT CONCEPT MAPS HELP YOU UNDERSTAND THE
-MATERIAL BETTER?- (long pause) IS THAT TOO HARD A QUESTION FOR YOU?
-Yes, I'm not sure about it.- OK. SOME OF THE STUFF I'M GOING TO HAVE YOU DO AND WHAT I'M ASKING RIGHT NOW (yeah)
YOU SHOULD UNDERSTAND. THIS IS JUST FOR THE PROJECT THAT WE'RE DOING. OK. THIS IS
NOT GOING TO AFFECT YOUR GRADE IN ANY WAY, (okrOK, AND IF IT'S ALL RIGHT WITH YOU, WE
MAY LET MRS. DE FRANCO HEAR THE INTERVIEW SO SHE KNOWS WHERE YOU ARE WITH THE CONCEPT
MAPPING. IS THAT OK?- Uh-hum.
-OK. GOOD. COULD YOU GIVE ME YOUR NAME AGAIN JUST SO WE HAVE IT FOR THE TAPE.
- David Andrews.- OK. I'M GOING TO GIVE YOU THIS PARAGRAPH TO READ (uh-hum), OK?. (uh-hum), AND TAKE
YOUR TIME; YOU MAY WANT TO READ IT MORE THAN ONCE. (ok), SO YOU CAN GET ALL THE IDEAS IN
IT, AND WHAT I'M GOING TO HAVE YOU DO IS, I WOULD LIKE YOU TO WRITE ALL THE CONCEPTS
OK?- uh hum
- AND AS YOU FIND THEM IN THIS PARAGRAPH, JUST WRITE ONE ON EACH LITTLE SLIP OF PAPER.
THERE'S LOTS OF THEM'THERE. OK? YOU MAY WANT TO READ IT-THRU FIRST AND THEN KIND OF
WRITE IT DOWN, OK?-Yep,' (Pause while David reads the paragraph and writes on the slips,--2minutes)
--IS THAT IT?--Yep--OK. NOW IS THERE lAWTHING IN THE PARAGRAPH THAT YOU READ THAT YOU DIDN'T UNDERSTAND?
- No.
-NO, 'YOU'RE SURE?
-OK., COULD YOU TAKE OUT THE CONCEPTS THAT YOU WROTE (yeah), AND YOU'VE DONE CONCEPT
MAPS ).
-and lines? 1
-AND KIND OF SET IT UP THE WAY-YOU WOULD A CONCEPT MAP. 31A,
'COULD YOU USE THESE YELLOW SLIPS OF PAPER
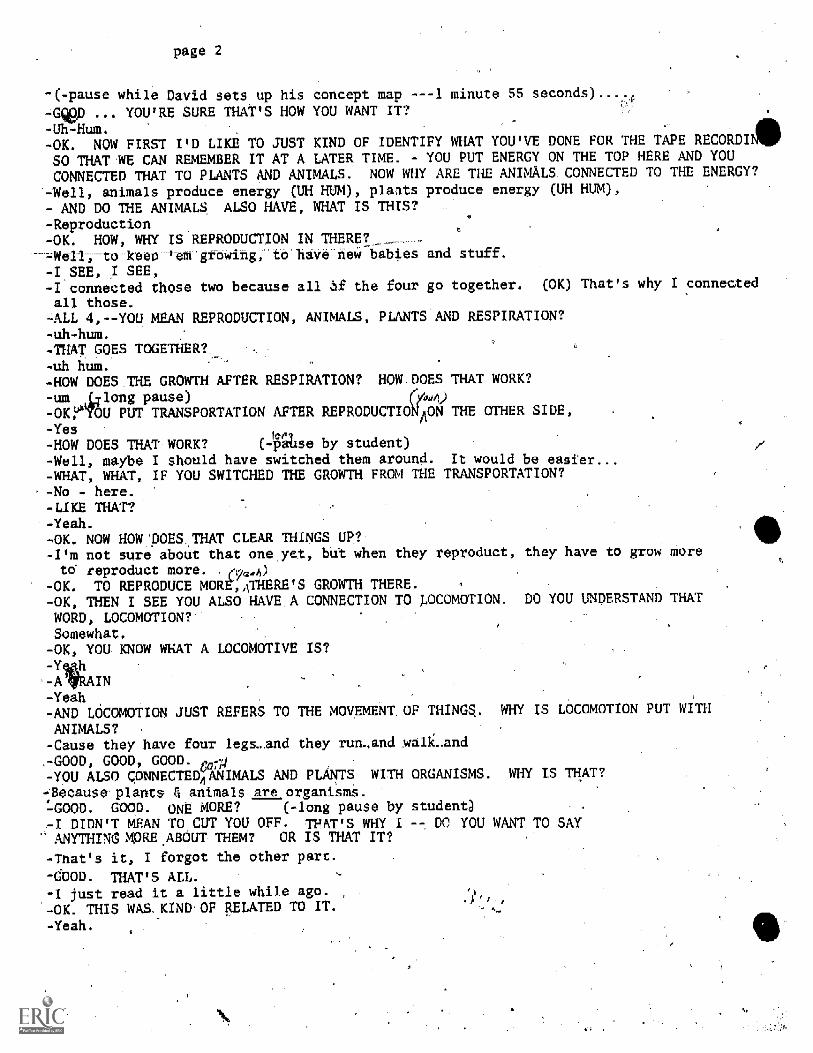
page 2
(-pause while David sets up his concept map ---1 minute SS seconds).
... YOU'RE SURE THAT'S HOW YOU WANT IT?
- Uh-Hum.
- OK. NOW FIRST I'D LIKE TO JUST KIND OF IDENTIFY WHAT YOU'VE DONE FOR THE TAPE RECORDI
SO THAT WE CAN REMEMBER IT AT A LATER TIME. YOU PUT ENERGY ON THE TOP HERE AND YOU
CONNECTED THAT TO PLANTS AND ANIMALS. NOW WHY ARE THE ANIMALS CONNECTED TO THE ENERGY?
- Well, animals produce energy (UH HUM), plaits produce energy (UH HUM),
- AND DO THE ANIMALS ALSO HAVE, WHAT IS THIS?
- Reproduction- OK. HOW, WHY IS REPRODUCTION IN THERE?
---Well, to keep 1-em growing, to have new babies and stuff.
- I SEE, I SEE,- I connected those two because all Of the four go together. (OK) That's why I connected
all those.-ALL 4,--YOU MEAN REPRODUCTION, ANIMALS, PLANTS AND RESPIRATION?- uh-hum.
- THAT GOES TOGETHER?- uh hum.
- HOW DOES THE GROWTH AFTER RESPIRATION? HOW DOES THAT WORK?
- um II-long pause) (4,01)
-0KMU PUT TRANSPORTATION AFTER REPRODUCTION ON THE OTHER SIDE,- Yes
- HOW DOESDOES THAT WORK? (-pahSe by student)- Well, maybe I should have switched them around. It would be easier...- WHAT, WHAT, IF YOU SWITCHED THE GROWTH FROM THE- No - here.
- LIKE THAT?- Yeah.
-OK. NOW HOW poEs THAT CLEAR THINGS UP?- I'm not sure about that one yet, but when they reproduct, they have to grow more
to reproduct more -y,A;
- OK. TO REPRODUCE MORS,ATHERE'S GROWTH THERE.- OK, THEN I SEE YOU ALSO HAVE A CONNECTION TO LOCOMOTION. DO YOU UNDERSTAND THAT
WORD, LOCOMOTION?Somewhat.- OK, YOU KNOW WHAT A LOCOMOTIVE IS?- Y h
- A IN- Yeah
- AND LOCOMOTION JUST REFERS TO THE MOVEMENT. OF THINGS. WHY IS LOCOMOTION PUT WITH
ANIMALS?- Cause they have four legsand they run-and walk_and- GOOD, GOOD, GOOD. cord- YOU ALSO CONNECTED4ANIMALS AND PLANTS WITH ORGANISMS. WHY IS THAT?
:Because plants & animals am organisms.- GOOD. GOOD. ONE MORE? (-long pause by student)- I DIDN'T MEAN TO CUT YOU OFF. THAT'S WHY I -- DO YOU W T TO SAYANYTHING MORE ABOUT THEM? OR IS THAT IT?
- That's it, I forgot the other part.
GOOD. THAT'S ALL.I just read it a little while ago.
- OK. THIS WAS KIND OF RELATED TO IT.
- Yeah.
TRANSPORTATION?
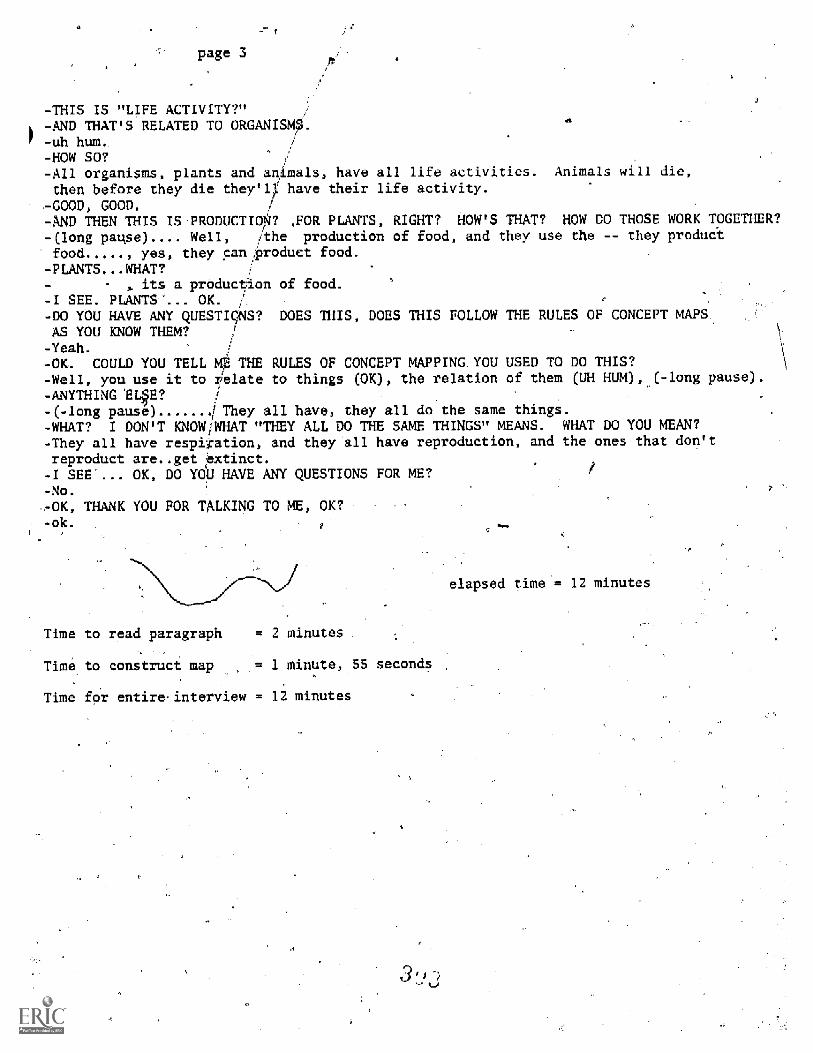
t
page 3
- THIS IS "LIFE ACTIVITY?"-AND THAT'S RELATED TO ORG_ S-uh hum.-HOW SO?- All organisms, plants and animals, have all life activities. Animals will die,then before they die they'll' have their life activity.
- GOOD, GOOD.-AND THEN THIS IS PRODUCTION? FOR PLANTS, RIGHT? HOW'S THAT? HOW DO THOSE WORK TOGETHER?
- (long pause). Well, /the production of food, and they use the -- they productfood....., yes, they can ,roduct food.
- PLANTS...WHAT?, its a production of food.
-I SEE. PLANTS'... OK.- DO YOU HAVE ANY QUESTICNS? DOES THIS, DOES THIS FOLLOW THE RULES OF CONCEPT MAPS.AS YOU KNOW THEM?Yeah.
- OK. COULD YOU TELL ME THE RULES OF CONCEPT MAPPING YOU USED TO DO THIS?- Well, you use it to xdielate to things (OK), the relation of them (UH HUM),-ANYTHING EL§E?- (-long pause) f They all have, they all do the same things.-WHAT? I DON'T KNOW/WHAT "THEY ALL DO THE SAME THINGS" MEANS. WHAT DO YOU MEAN?
- They all have respiration, and they all have reproduction, and the ones that don'treproduct are..get extinct.
-long pause).
-I SEE'... OK, DO YOU HAVE ANY QUESTIONS FOR ME?-No..,OK, THANK YOU FOR TALKING TO ME, OK?-ok.
elapsed time = 12 minutes
Time to read paragraph = 2 minutes
Time to construct map = I minute, SS seconds
Time for entire, interview = 12 minutes
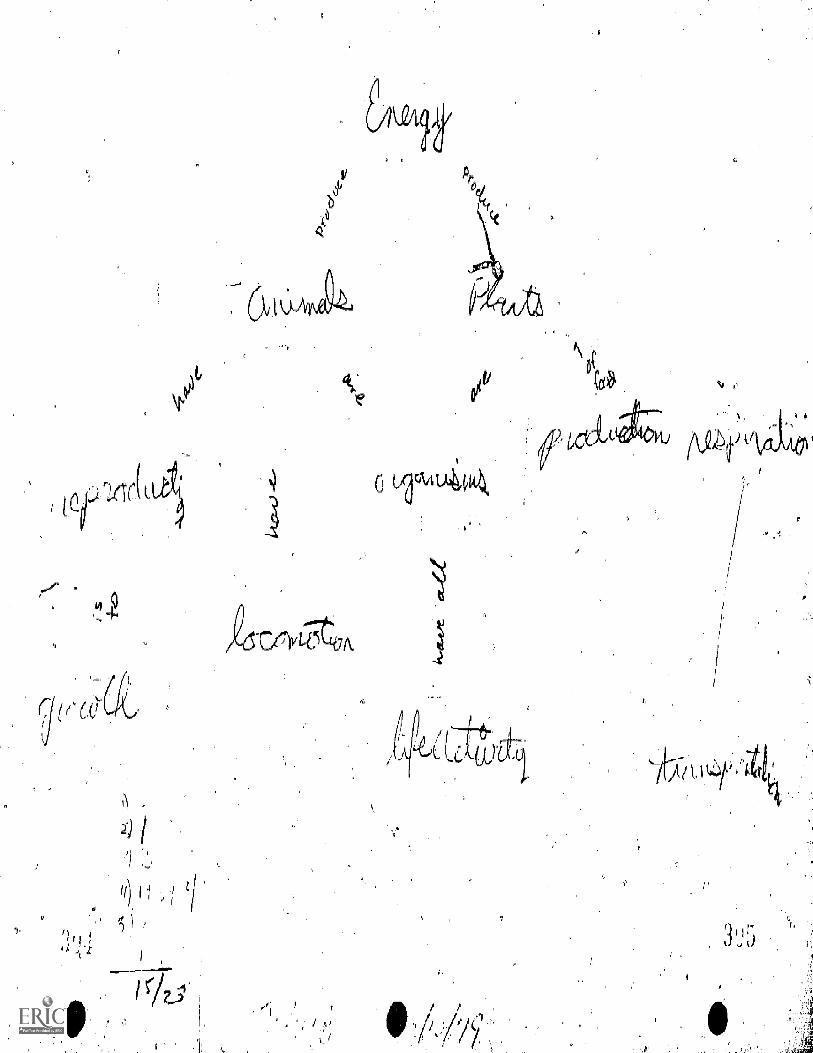
5
:
tp-
9
Student Number - 130
January 16, 1980 C. T. J.
Vestal Tape Code -1-9
Uh huh (affirmative)
AND WHAT'S YOUR LAST NAME?'
(she then spells it out)4
O.K. I'VE GOT TO PUT ALL THIS INFORMATION DOWN. JANUARY 16, 1980, YOU'RE AN
EIGHTH GRADER. WE KNOW THAT, BUT I JUST WANT VESTAL, AND THAT'S ME.O.K.? GOOD. ALL RIGHT. AS I SAID, WE ARE HERE IN CONNECTION WITH THE CONCEPTMAPPING TEAT YOU WERE DOING IN CLASS. THAT'S WHAT WE'RE GOING TO ASK YOU TO COTODAY, MAKE A CONCEPT MAT. WHAT YOU CO HERE TODAY IS FOR OUR PURPOSES ONLYALL RIGHT? TT'S NOT GOING TO AFFECT YOUR MARK IN ANY WAY...IN SCIENCE. O.K.?MR. DECATUR MAY WANT TO SEE THE MAP BECAUSE HE'S KIND OF CURIOUS ....KIND OF CURIOUS ABOUT WHAT'S BEEN GOING ON, STUFF LIKE THAT DO YOU HAVE ANYOBJECTIONS TO HIM SEEING Tr?
Uh Uh (negative)
O.K. 'UST PEOPLE DON'T. O.K. WE THAT. JUST SO WE THINK WE'RE TALKINGABOUT THE SAME ThaNG, WHAT DO YOU THINK A CONCEPT MAP IS? HOW WOULD YOU DESCRIBEIT?
Well, it " "s like if" you have a paragraph.. You can make it like into a diagr
. and it's easier to understand. Cause you don't have to read so much.
UH HUH. MAKEs IT EASIER THEN? IF'YOU HAD A GIRLFRIEND OUT IN CRaCAGO CALLING;YOU KNOW, '10 FIND OUT WHAT'S GOING ON AND HOW YOU'RE DOING AND YOU'RE TALKINGABOUT CONCEPT S, AND SHE ASKS YOU, ''WHAT DOES A. CONCEPT MAP LOOK LIKE?"
HOW WOULD YOU DESCRIBE Tr?
-It's like, um, it branches out -7-you'd have a general topic on top and then you'dput, like, a line going down from each one, and it has, like, specific things,and keeps getting down to most specific thing that there is.
SEE. THOSE LLNES...WHAT DO THOSE LINES CO?
Like, they're fill ins for words and, stuff, like, if you have a plant and you wanto put it's called, you stick it on the line.
UH HUH., ALL RIGHT. GOOD L. I TIME lATE HAVE,AN IDEA HAS IT HELPED YOU ANY?
Uh huh affirmative),
YOU CONCEPT MAPPING?
Yeah.
IS IT EASIER -THAN NOTE TAKING?
Uh huh affirmatiVe)
HAVE YOU USED IT TC STUDY FOR A TEST?
Yeah.
DID YOU GET A BETTER MARK?
Well, we only took about two tests, but I got a better mark this time.
GCOD! VERY GOOD! O.K. GOOD. TEAT'S WHAT WE'RE INTERESTED IN ... TO SEE IF
WE CAN CO THAT O.K. WHAT I'M GOING TO DO IS I'M GOING TO GIVE YOU A PARAGRAPH
TO READ AND IT'S KlUD OF SHORT, SOME ARE WORDS THAT YOU'VE HAD AIREADY;,YOU KNOW,
SO IT'S NOTHING BRAND NEW, AND WHAT I'M GOING TO ASK YOU TO DO IS READ TIE.
PARAGRAPHS AND THD1 nDENTIFT THE CONCEPTS IN THERE. O.K.? AND YOU WILL BE ABLE
TO WRITE THESE CONCEPTS DOWN ON THESE LITTLE SHEETS OF PAPER. O.K.? NOW, WE
USE THESE LINES ... THESE YELLOW PIECES OF PAPER TO REPRESENT THE LINES. WE CO
THIS SO WE CAN MOVE IT AROUND INSTEAD OF WRITING IT OUT AND CROSSING IT OUT
O.K.? AND YOU CAN WRITE ON THESE...THE CONCEPTS ON THESE AND YOU CAN WRITE ON
WHAT EVER CONNECTION YOU WANT TO MAKE THERE. O.K.? SO, IF YOU'LL JUST READ
THIS TO YOURSELF, YOU MAY WANT TO READ IT MORE THAN ONCE. I WON'T TAKE IT AWAY
FROM YOU WE CAN LEAVE IT OVER TIME TO REFER TO, O.K.?
(Pause for 16 seconds while reads paragraph.)
o.k., got it.
IS THERE ANYTHING IN THE PARAGRAPH YOU DON'T UNDERSTAND? ANY CONCEPT...ANY
TAORDS? NO? LOOK PRETTY FAMILIAR? THAT'S THE WAY WE WANTED IT O.K. NOW,
IF YOU 'WOULD, YOU CAN NOW,0 AND START WRITING OUT THE CONCEPTS THE CONCEPTS
ON THOSE PAPERS..
(Pause for 15 seconds while sites comepts.
Is it all right if I stick them here?YOU CAN
suri... WHATEVER YOU WANT. /MAKE THE MAP AS YOU GO
(Pause for 1 minute, 13 seconds)
NG.
Oh, boy.
(LAUGHTER) THAT'S THE WORST PART. THESE THINGS....FALL APART' A LETLE srr.
...TErriE WE GO. NEATNESS DOESN'T. COUNT, SO DON'T WORRY ABOUT THAT. O.K.?
(Pause for 2 minutes, 44 seconds)
I guess I inished.
O.K. GOOD. VERY GOO: O.K. YOU'RE NOT STUCK WITH TT. IF YOU WANT 10 MAKE ANY
CHANGES, ADJUST' TS, ADDITIONS, SUBTRACTIONS, MOVE IT AROUND. WHATEVER YOU WANT
TO DO, YOU CAN; O.K.?
(Pause for 17 seconds)
page 3
I guess that's it.
O.K. FIVE. I WANT TO I ENT= IT FOR TI-17 TAE RECORDER, O.K.?
Oh huh (affirrnative)
SO THAT TT MOWS. O.K. PUT "MATTER" UP ON TOP CONNECTED TO THE CONCEPT"MOLECULES'," AND HAS WRITTEN "HAS" ON THE LINE IN BETWEEN. MOLEMES ISCONNECTED Tql"MOTION" AND THE WORDS "ARE IN" CONNECT THOSE-TWO CONCEPTS. MOTIONIS CONNECTED TO "TEMPERATURE" WITH THE WORD "DETERMINES" ON THE LINE. TEMPERATUREHAS TWO LINES COMING OFF TT. ON THE LETT CONNECTED T_O "FASItli MOVING" ANT) THE
WORD "IF" BETWEEN IT. THEN RASTER MOVING CONNECTED TO THE CONCEPT "HIGHERTEMPrriAlrURE" WITH THE WORD "HAS" IN BETWEEN. ON THE RIGHT HAND SIDE OF TEMPERATURETHE WORD, EXCUSE ME, TEVERATURE IS CONNECTED TO THE CONCEPT "SLOWER MOVING" WITHTHE WORD "IF" IN BETWEEN, AND THAT'S CONNECTED TO "LOWER TEMPERATURE" WITH THEWORD "HAS" IN BETWEEN. O.K.? ALL RIGHT. WHY DID YOU CONNECT THESE TWO UT HERE?
because all matter is made of molecules.
UH HUH. WHY DID YOU CONNECT.THESE 'TWO?
Because molecules are in constant motion.
I SEE. AND, WHY DID YOU CONNECT THESE TWO. IT'S PRETTY EASY...IT'S PaErrzDEFINITE THE WAY YOU HAVE IT.
Well, the motion determines the temperature.
IS THAT WHAT.IT TS? THE MOTION DETERMINES THE TEMPERATURE? OR DOES TEE T ATURE
DETEMMTE THE MOTION?
The motion determines the temperathigher temperature.
cause if they're er moring it's got a
UE HUH I SEE. O.K. FINE., BOY! YOU JUST WANT TO ZIP SIGHT THOUGH THIS! ,SO YOU WON'T HAVE THAT MANY QUESTIONS ON IT. WOULD YOU USE THIS FOR FOR SOCIAL
STUDIES OR MATH OR SOMETHING. COULD YOU/. USE A CONCEPT MAP FOR THOSE.
Yeah, for social studies. 'I don't know about math.
HAVE YOU GIVEN TT ANY THOUGHT?
Yeah, I'd use it for social studies
YEAH? OH! TS 1T SIMPLER TO LOOK AT SOCIAL STUDIES? YOU MENTIONED AT THE BEGINNINGTHAT YOU PUT YOUR MORE GENERAL CONCEPT UP HERE, AND THE MORE SPECIFIC CONCEPTSOUT HERE. IS THAT HOW YOU DID IT HERE? DO YOU THINK?
Yeah, I'm pretty sure.
YOU'RE PRETTY SURE? O.K. GOOD! WELL, I DON'T HAVE ANY MORE QTESTIONS RIR
YOU. YOU REALLY ZIPPED RIGHT THROUGH THAT. VERY GOOD. DO YOU HAVE ANY QuEsnoNs
FOR ME?
3
NO? O.K.
No.
NO? SEE? IT'S NEVER AS
4
IT AS BAD. YOU THOUGHT IS WAS GONG TO BE?
PE,rfE SAY rps GO 1G TO BE. O.K.!
Time t© read paragraph = 16 seconds
Time to construct map = 4 minutes, 29 seconds
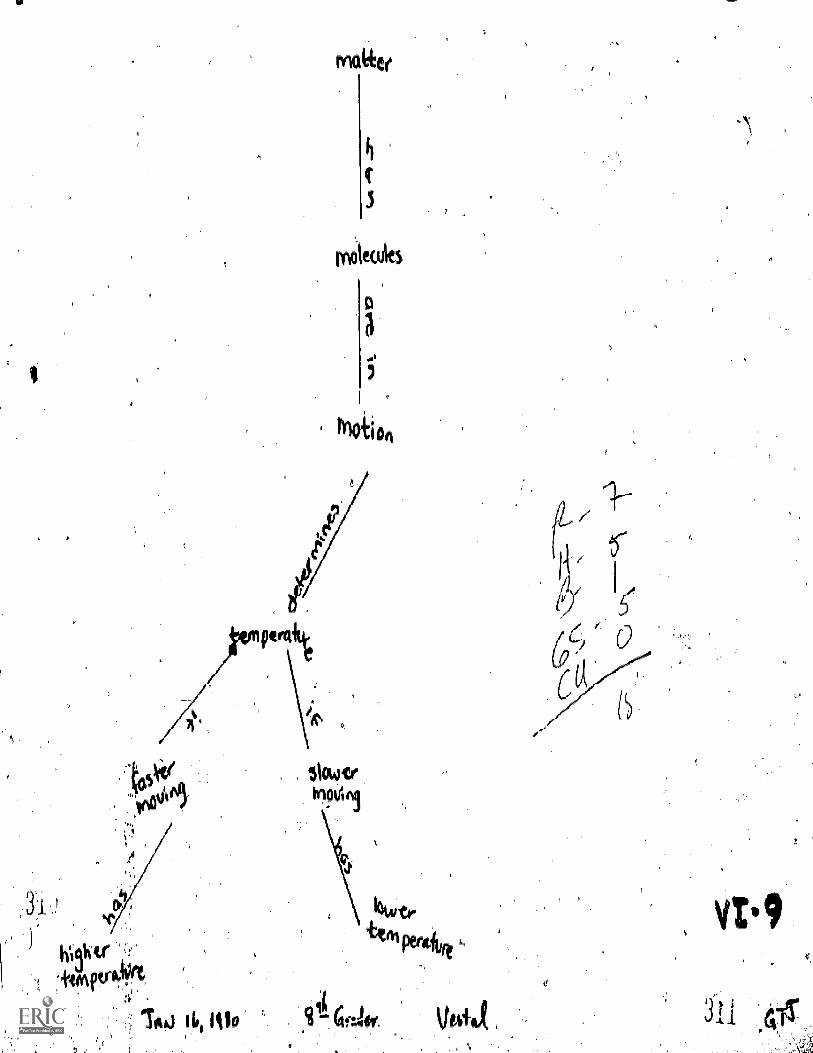
61A
.1)1101A1
APPENDIX
Sample laboratory exercises represented on the Knowledge '
from students in Trumansburg, 1979-1980.
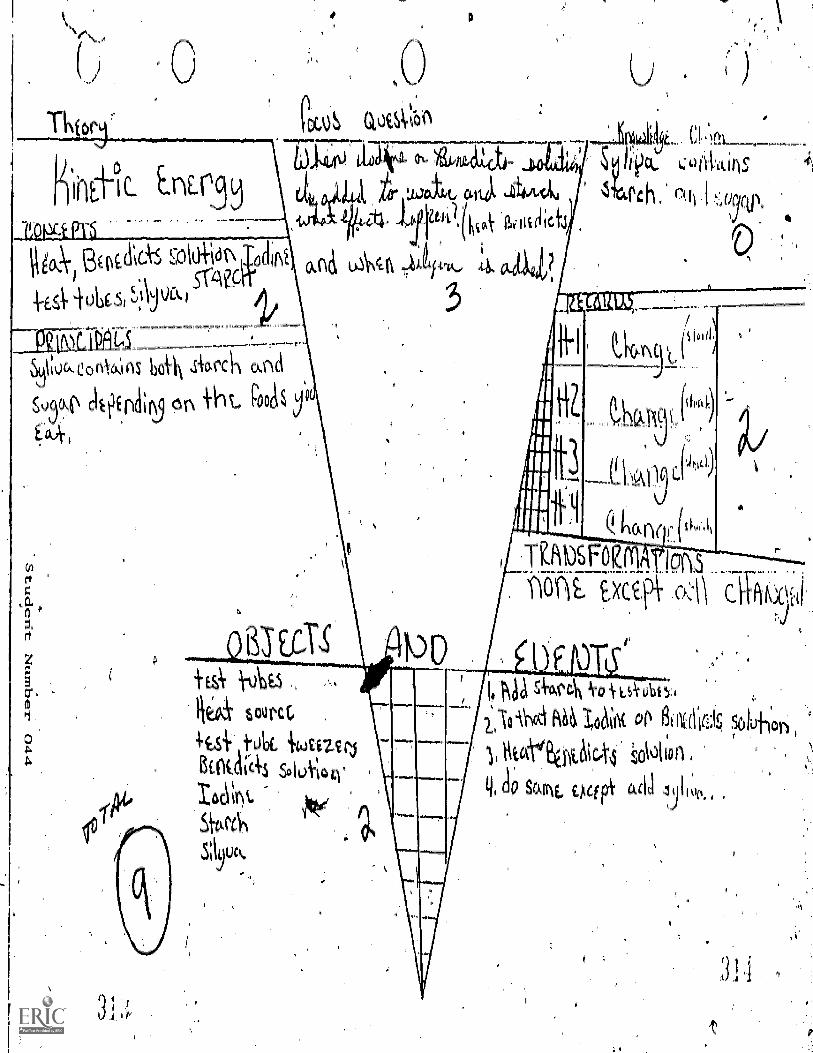
It Loaai
h.' 171111(1ect1)'
Boi16-5 -,cAtAid
1 E4 iot)E5, sAjoci
z
CD
0
1tockeoi AAS bah Si-eLM-) nd
0 C1011(11119 #VIt POOR
Y\C
(skid)
a
N1,1 siroxteR ko# t_Sk
14 1,0;IV. Ai
)1 11:1-.ceilitiltkid,s'solo(
d0 SME oci ,tic' 4,111.10.
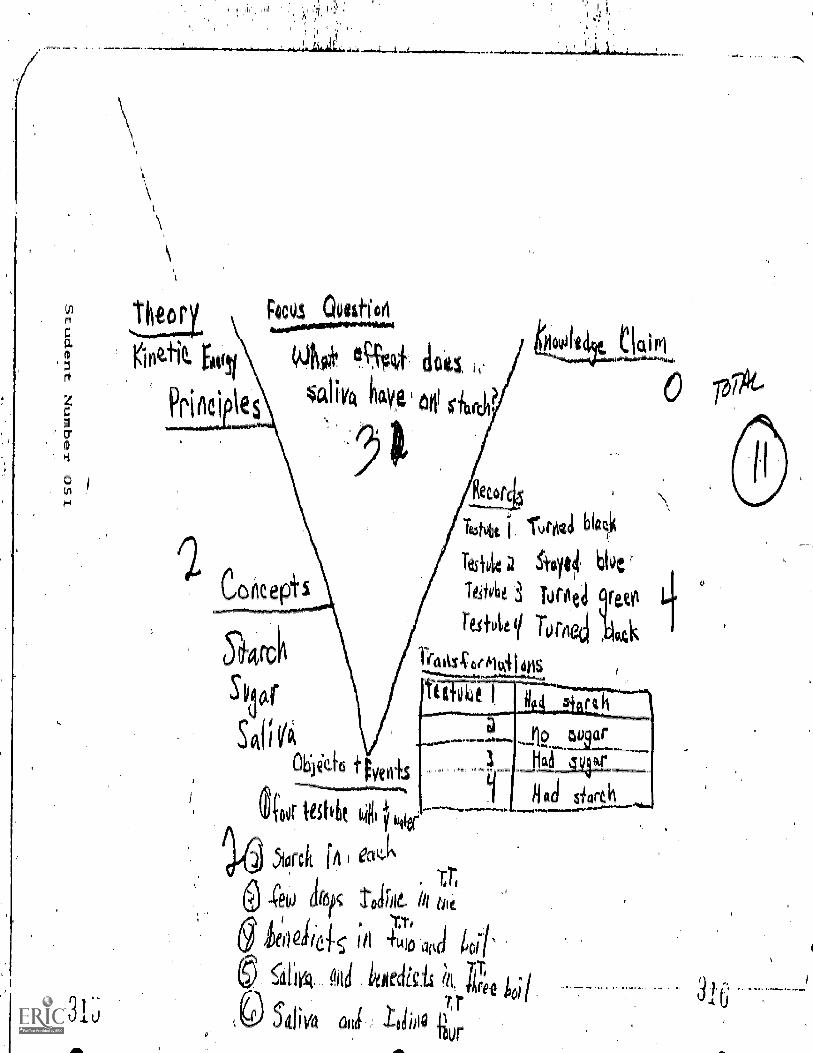
m
97M
Foos Quaff oit
ativ4
Whsik ic
haye tfuth?
To* 1, ¶utQ
-6106 a blue
°kepis Torileti rats
rest4til Tortied
5i4fC11 Tira c.000
S110,1 tair.ke
sA(;114lien+4
'$coqt .04 (41
5kirch fri erlitiN
-rewi1b,c Todinc
111
5111y4:. old :doeclicii. t Thl,;et
owl: lobo
AL. lujir
h Ad shirt
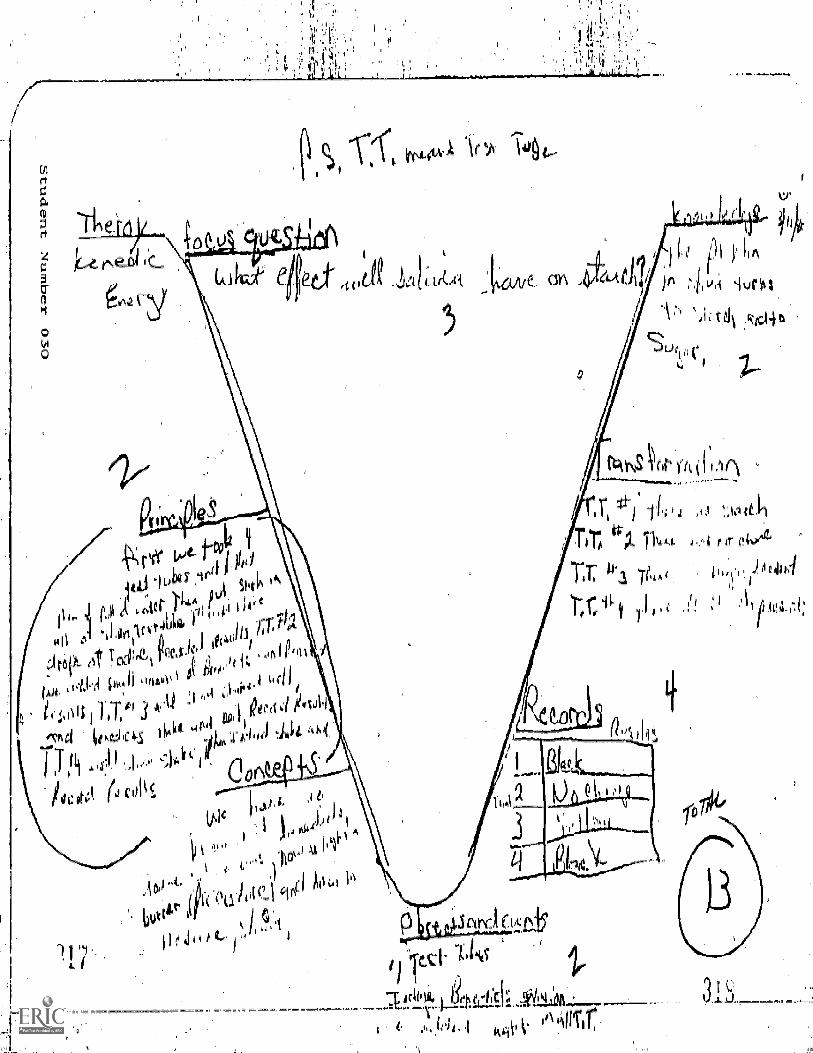
cro
rt
rt
c
0(A
0
Lt- tD011 iii
1l)b 41,(11 Pid
iAitlh'ji'll A i'c''lr 1-1.4_1:iilleu:''' ip,(1ii.iril(vt4luLe. 111 /oh'
, .
.11,0 t vie4
,-4'itoit M Ter1:41% 1e5 1,0,)t it .,1%
14.1,71iimii ,,(10,
hi
Iii Tit! - .1) ,,,4 0-."4-1 '. ell
_:,:hd er0,4icts 44kg. 4,1 11
0:I Per(i4 INO1
i
1
i .A.
jril ,c=1 IIt .
1)46.4 riiii.:111,1 .h
4., ,I,, 0 ,7,1 ig
Idi: 01=L'A(1.4 ciii
0
vic.11;'
i:I iond.)1)41
'Ii t I'dIIII ''
. 1 i '''° )11°IL'"
.luatiileA'st'Li i OL1 )011 (it7.1: 914:1 Ail '11 16
Ihisii4tL.)
.4 ' 14 I :3:.
Tit TK..*
TT: Ttu,., )A44114
tr.01 T1 ic h .1
TC.c1=
Ncs*.I e' 1 ikAII
J.. mmwMa
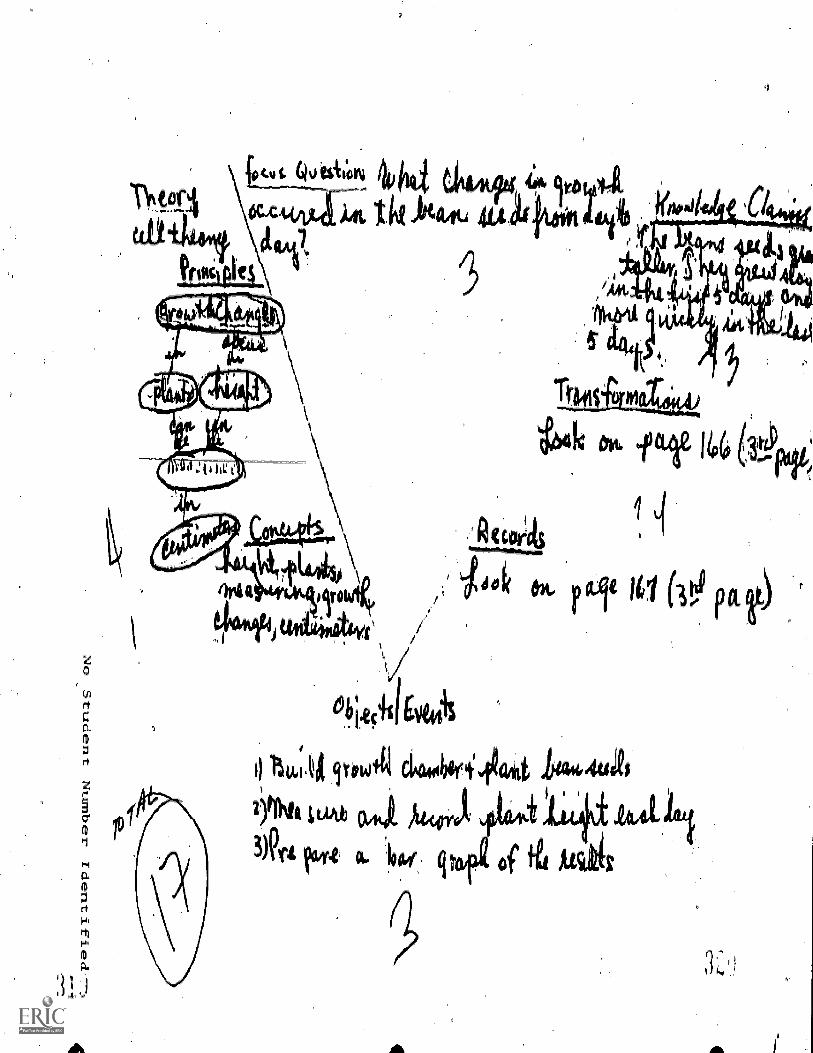
ill NO pat)
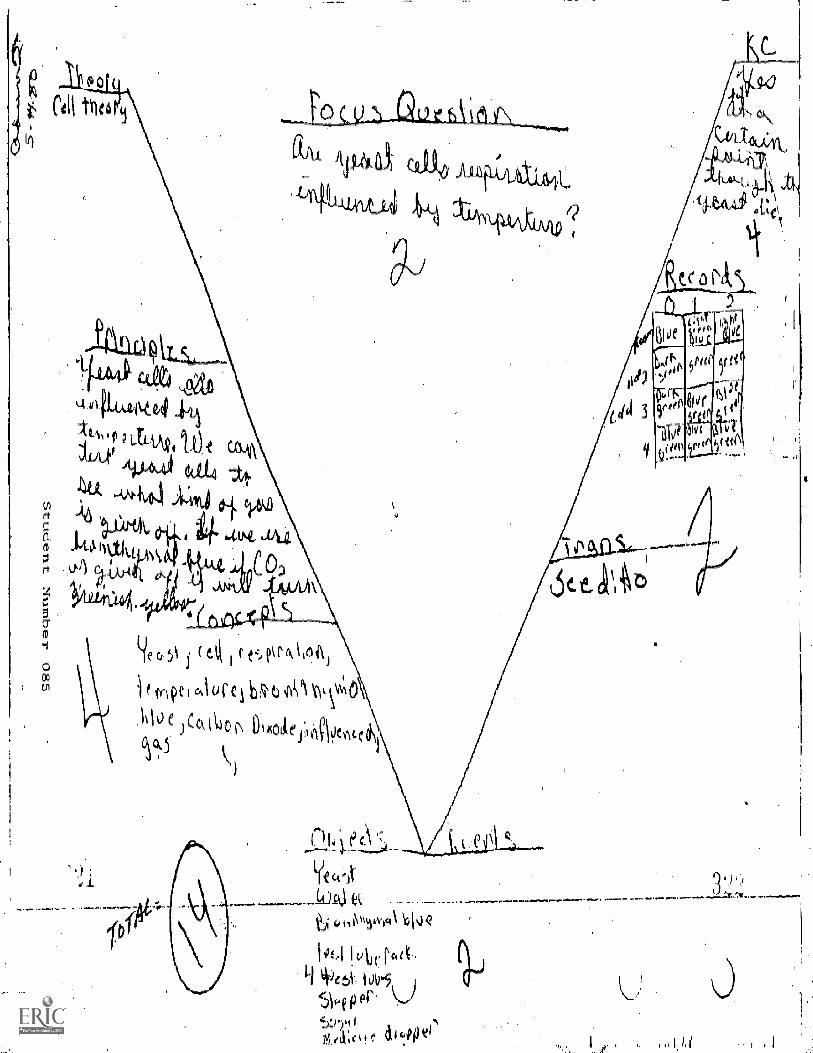
6 ,,1,o,r,c4k 6042
4-Je5i. iar5 )ji.3\oeper
a qati'
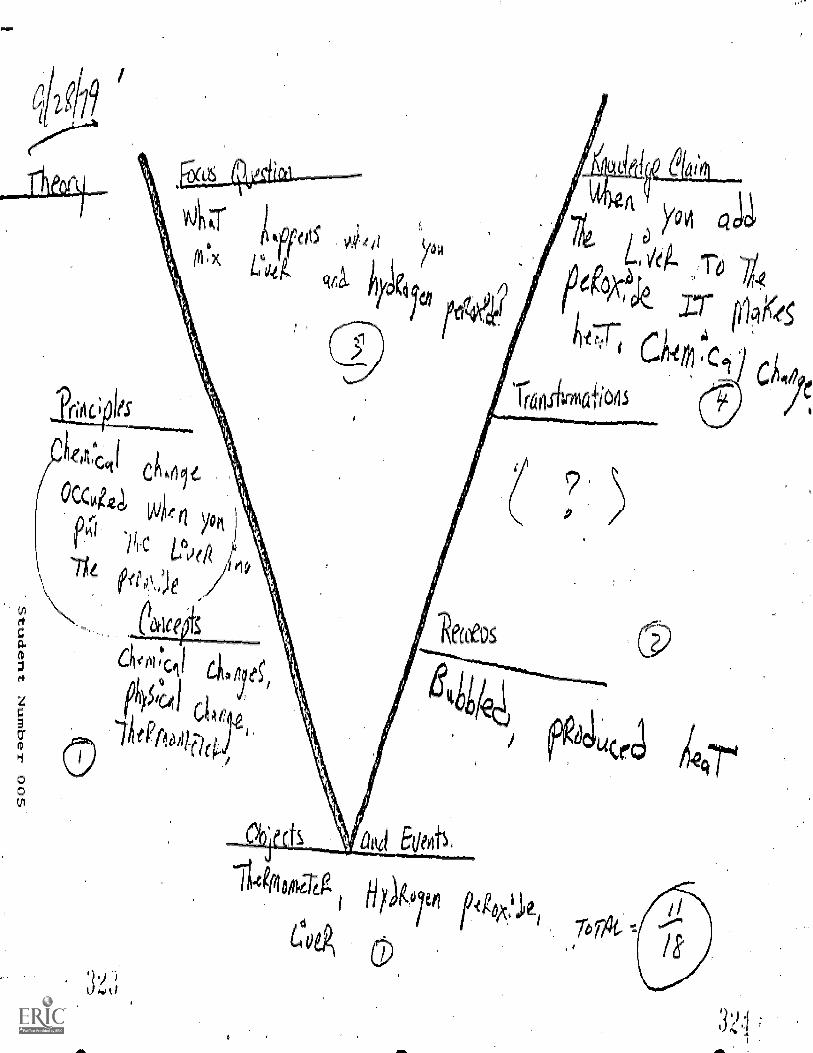
Li)
rt
C37CD
00
effimaai
To
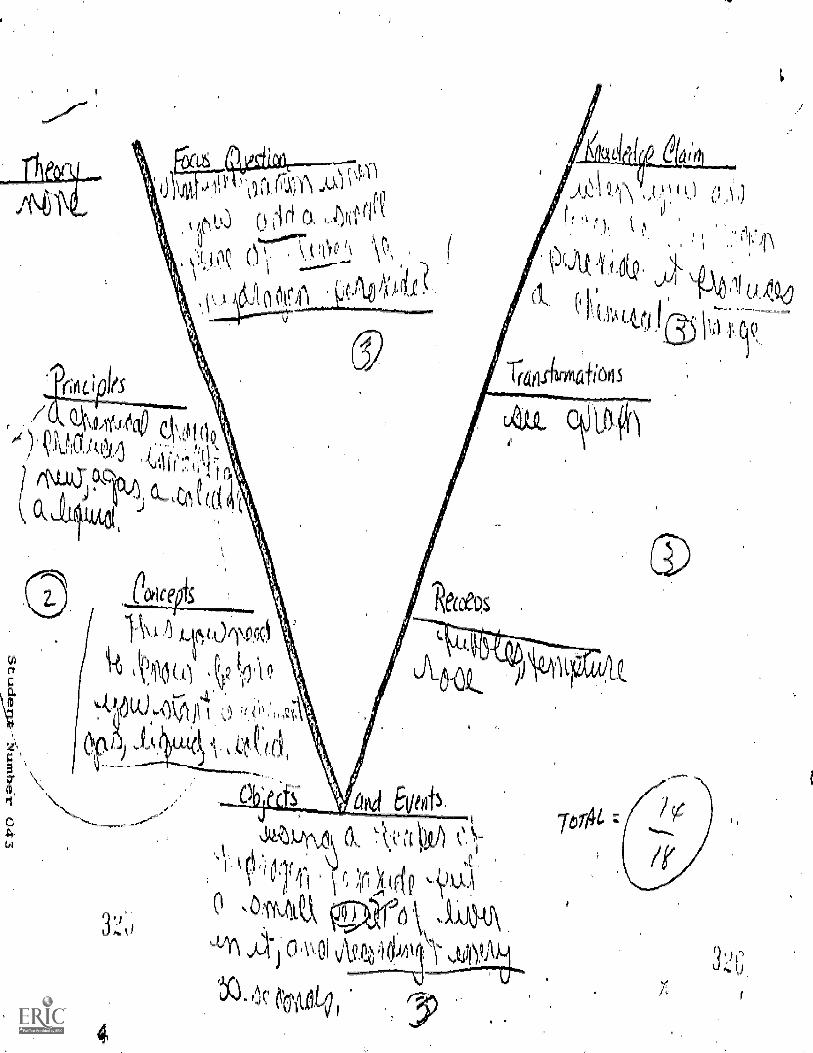
=
vrptfk-Ai) N! L
.o itr ;);/ 511
vi1 I):
ClIgiqNfArk
41 1\( V1.0 V-9
cAl: c)
c
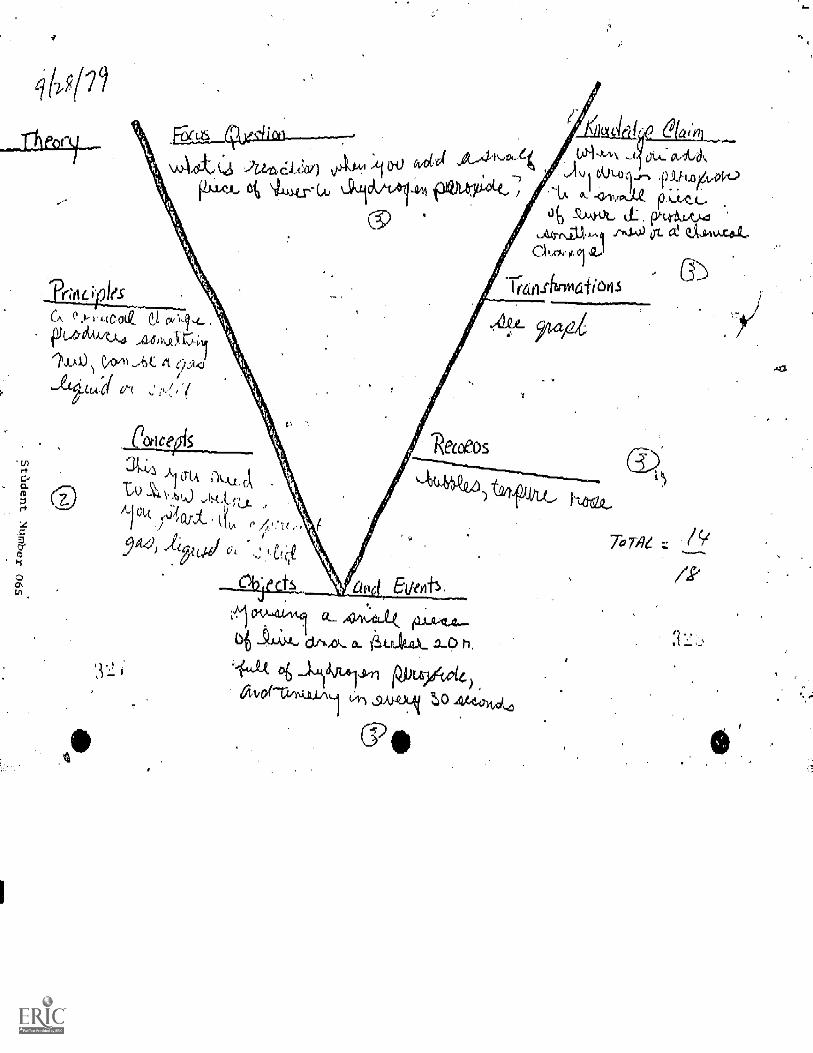
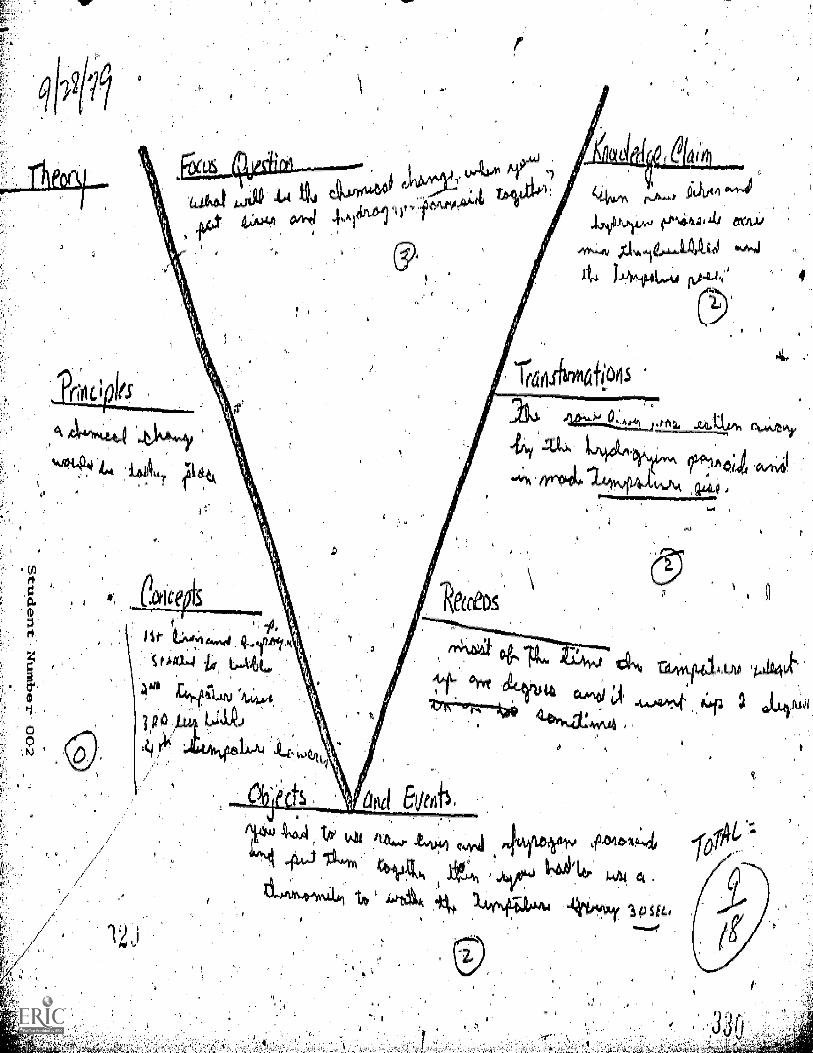
I
f Ail mud
di&A-UAW
4 LIM-0-86.-U
afizOtiS
rft
1,414
Art "if SE44
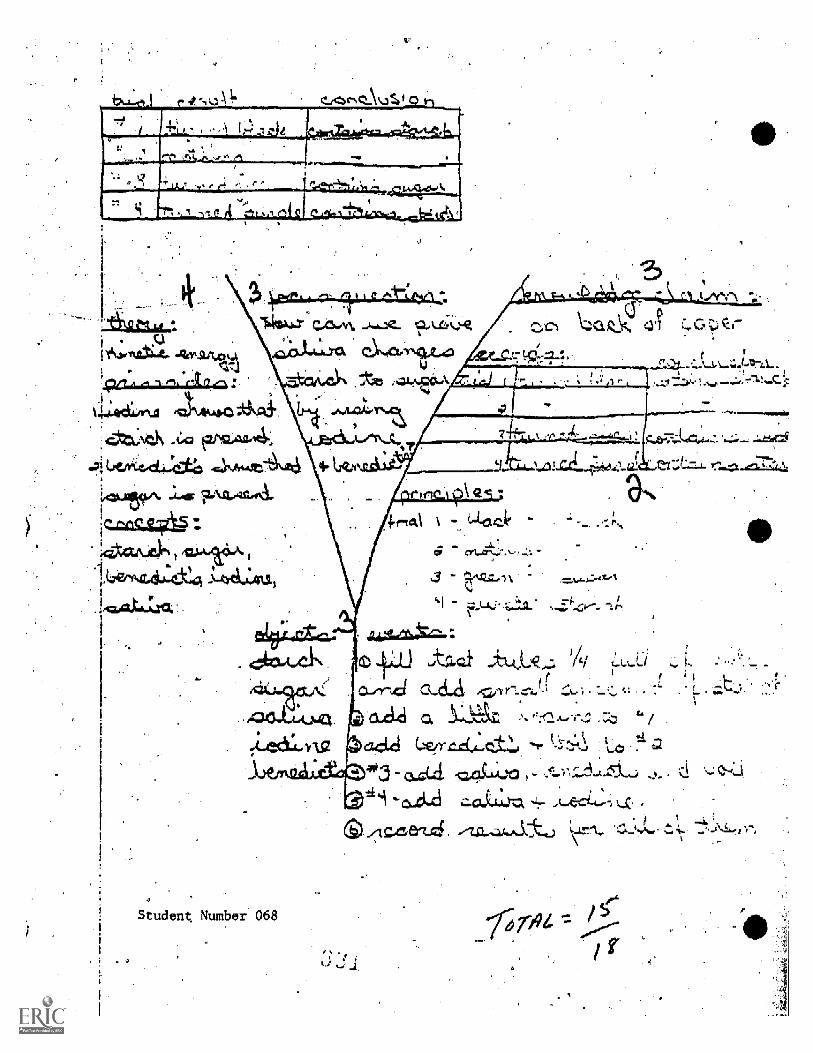
Student Number 068
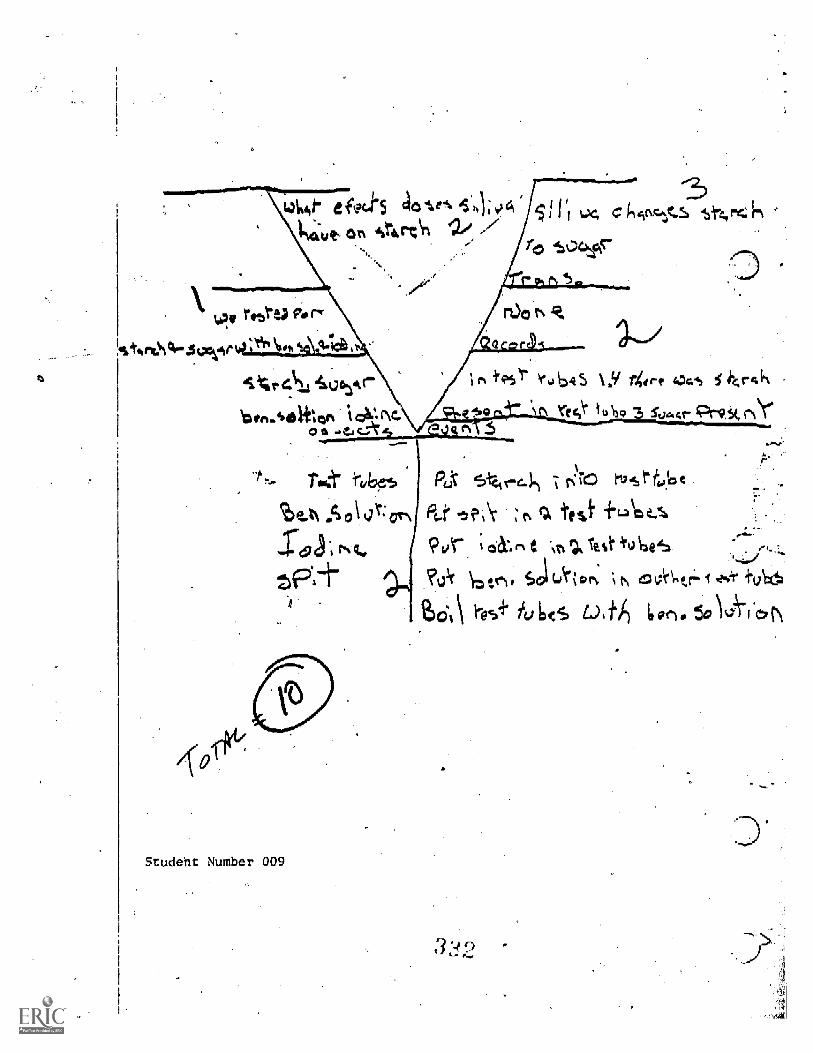
Student Number 009
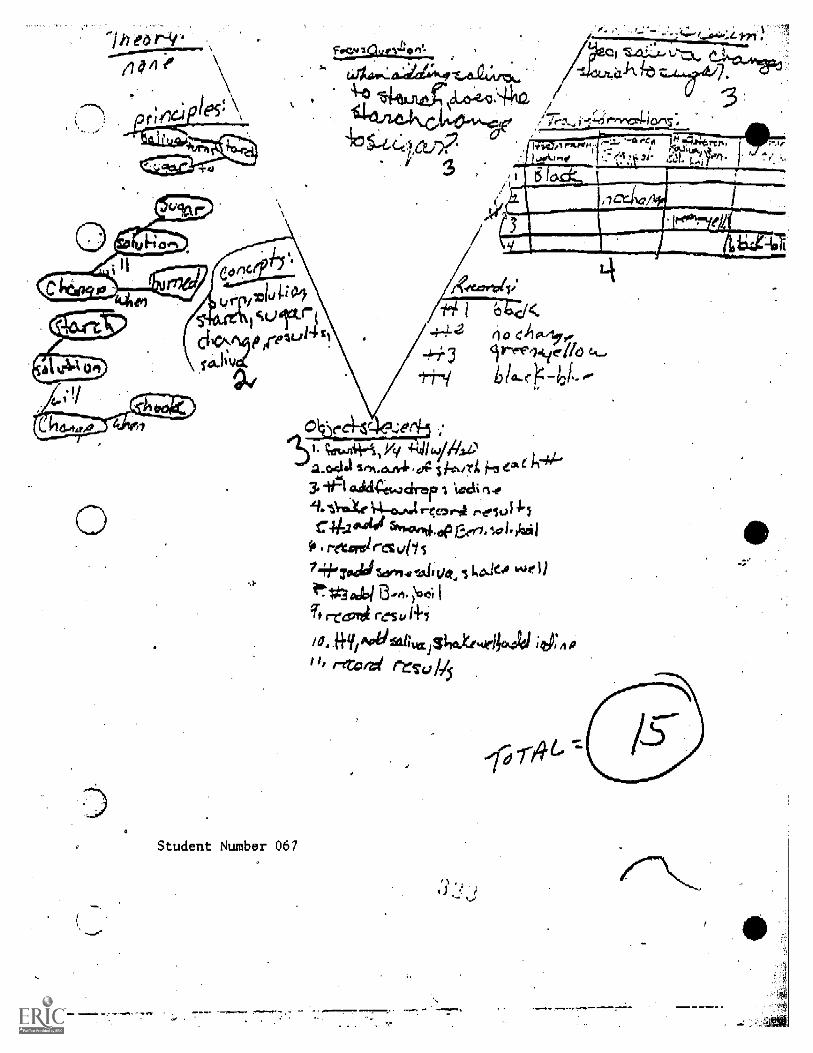
e
Student Number 067
41h1#4/31).c4.11,31.0414.ag s
asiget.acker %act+ n
tVarke IrLvtahrt T-es, r41 rely' 'LICAIN Sftborpfl..op r . 1.01
. reto io reCvli
7 -iialoglat urn44.-ailtimi
tuta,613n.'20;1rcant r u1+,
a .1.1.11 Ad) fill; 3rrroed rm.) bi
APPENDIX IV
Samples of students' explanations and concept maps for the "Winebottle"
and "Electricity" examples of conceptual questions.
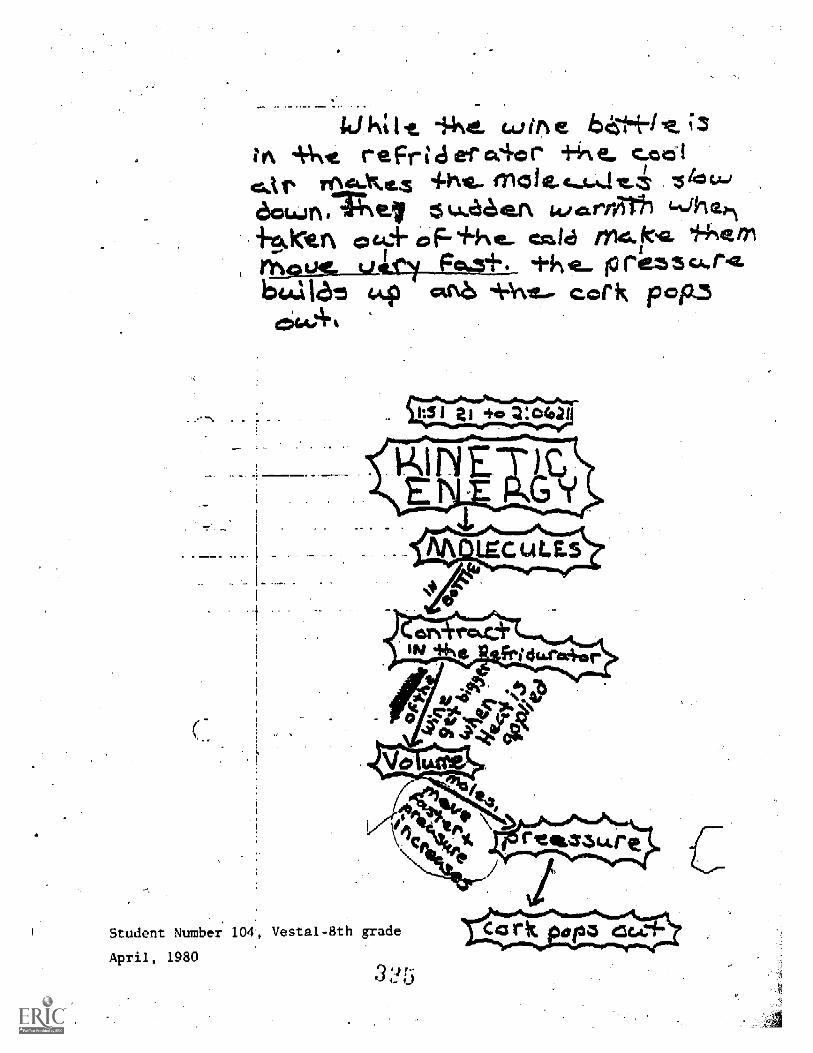
id It! 14%4 tileJrVve reff d erg% or +$'
cta yinca-Wies
ozujn,a17,e1 kA.te a an kr,cLrrifilli-Axice" °G.+ op- -1-he.. =Ala frAcre,/tojdg,__ALtify F*4+. p rez 5 41,,6,4 itbz 4.4.9 01M, *Inv cork popz
64404
Student Number 104, Vestal-8th grade
April, 1980
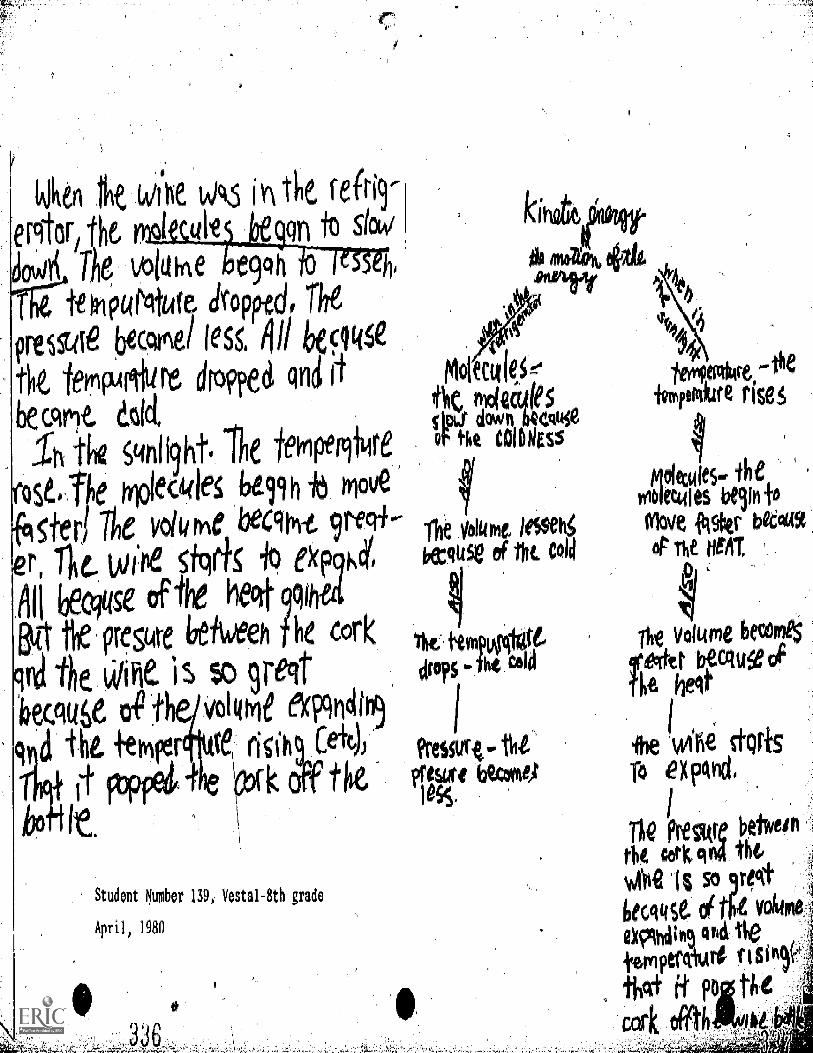
Whey k wq
ercitor, fit 01 (lit
tiowti Te volorte h h
tf Nita cfropptd, The
p isule bare/ fess, 411 1ecg(i6e
lemPArrtire dros,f)e ci. qnS
be ccirit
i the sttli9htd the fekipertOlre
se.fhe typlecide he99h moue
terI Ttle volume becgmt
Wig stqrfg 10 ekpga,
Alt bectiuse e-the hatt qqghtii
!NI f,iC prepte itiweeh 1k cod(n4 the cilie is 9-,) 9reql-
becciu6e 0-C th volume rici
cl fit te (5111 Cei)), \calk tke
iv\ tlie, reiri9
Q Slow
Student Number 139, Vestal-8th grade
April, 1980
MoIcIefilt tcLoJ down
tvle
NEss
The yalUme, ieSSeh
itt.145e of tht cold
1i p1t-drops The Wu
I?ceSsigt
prism becotole
sikire.-the0, Aire rises
Ideces.th
ell es bep(viove fokr beetaoP the KAT
Io
The VoILrne beopmes
ralegcqu°
be sTQrtsTo x Foci,
Tile ere betweinthg cart co4 th6sibi '16 so 910ieCtigSe eirk vokon
eidh9 via ote
ispiperoure 111501
atifti H ? tirecork offth
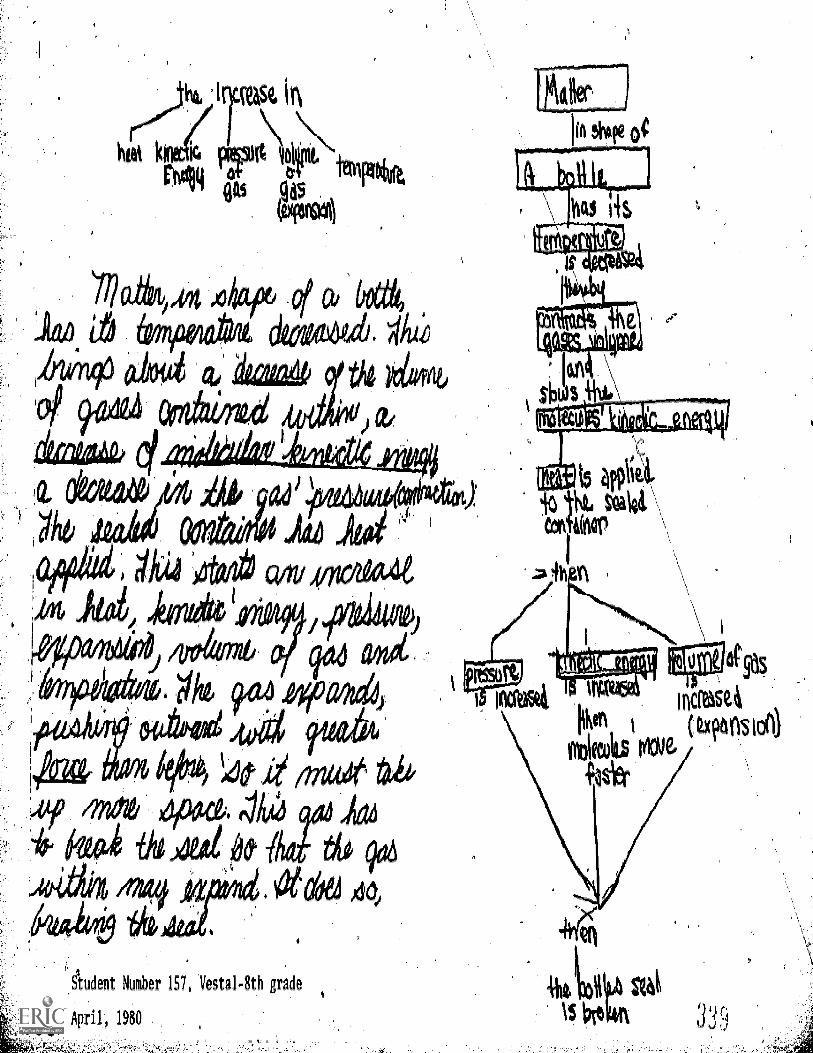
dtgtOr,
I increasei
(uPolteis
om
46*
etudent Number 157, Vestal -8th grade
April, 1980 .:
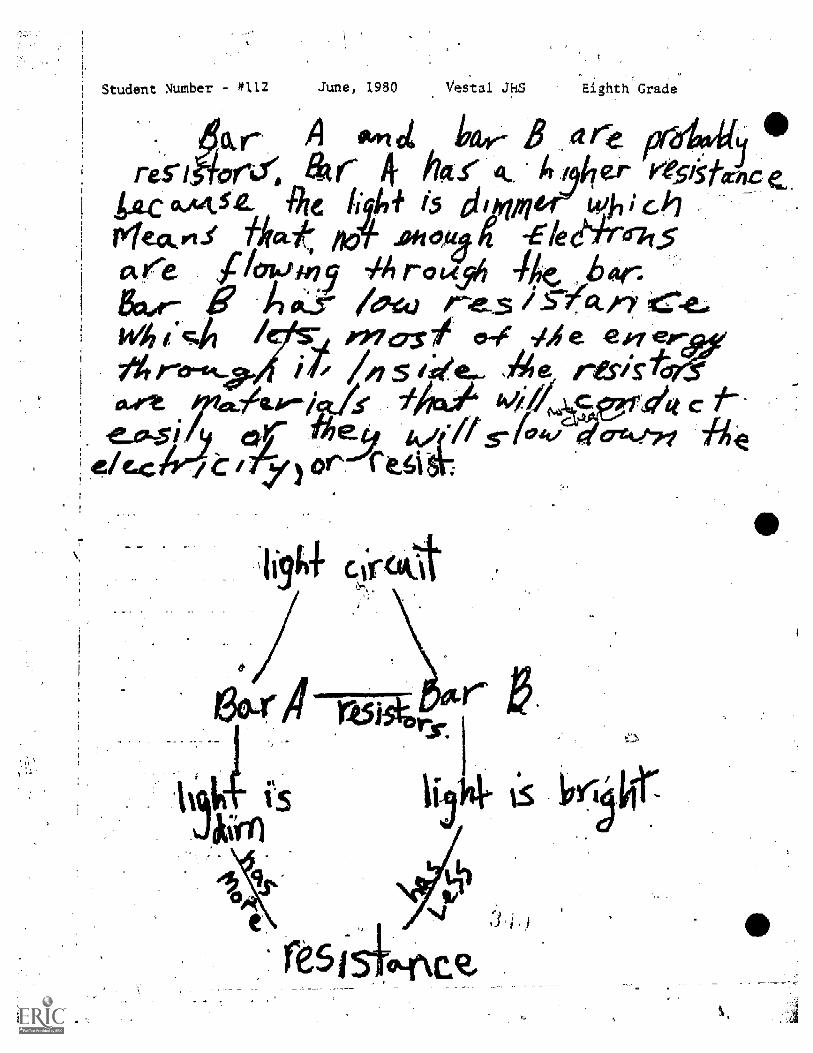
Student Number *112 1980 Vestal JH Eighth Grade
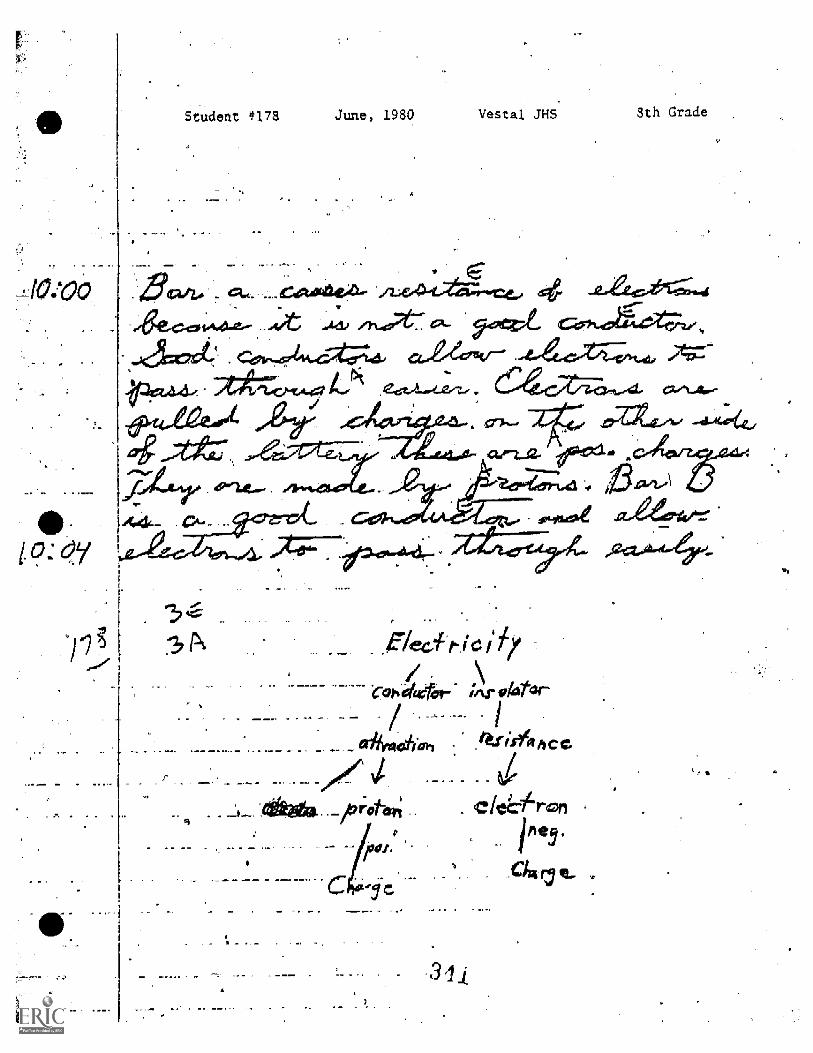
Student #178 June, 1980 Vestal JHS 5th Grade
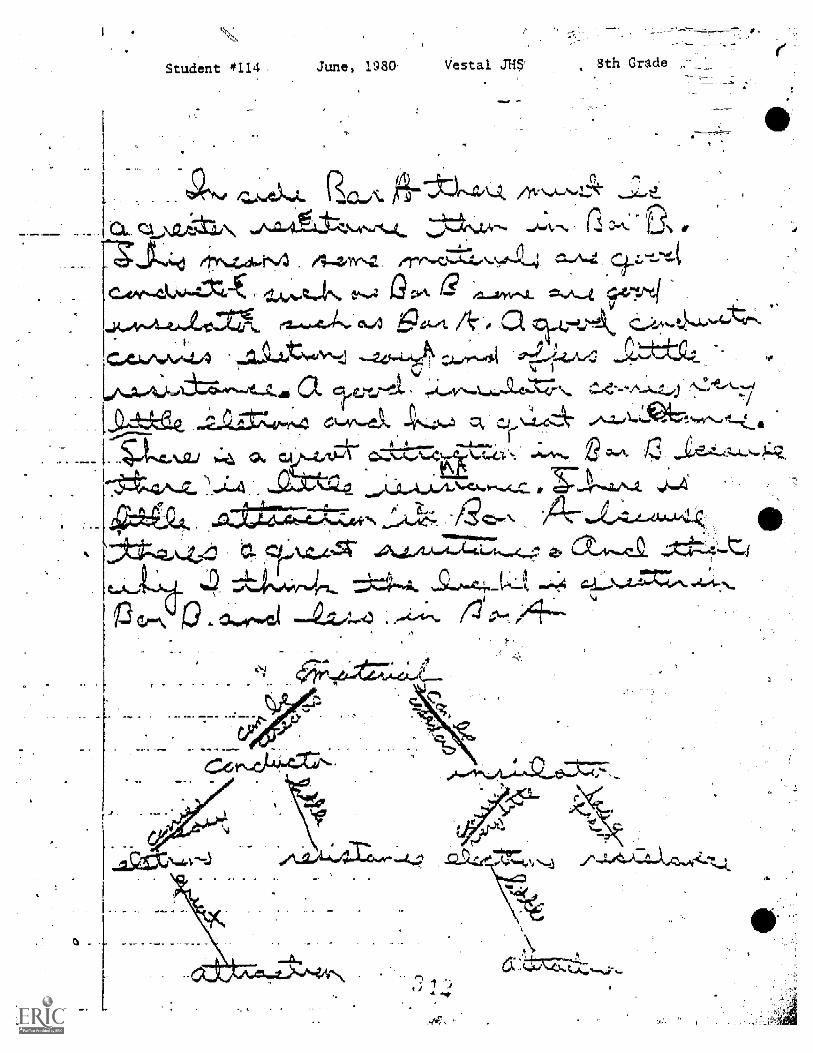
:- -----
Student 4 June, 1980 Vestal J1-15 8th Grade