cytomegalovirus shapes long-term immune reconstitution after allogeneic stem cell transplantation
TRANSCRIPT

114
ARTICLES
haematologica | 2015; 100(1)
Stem Cell Transplantation
©2014 Ferrata Storti Foundation. This is an open-access paper. doi:10.3324/haematol.2014.113415KT, MCW and WL contributed equally to this manuscript. The online version of this article has a Supplementary Appendix. Manuscript received on July 15, 2014. Manuscript accepted on September 23, 2014.Correspondence: [email protected]
Immune reconstitution after allogeneic stem cell transplantation is a dynamic and complex process depending onthe recipient and donor characteristics, on the modalities of transplantation, and on the occurrence of graft-versus-host disease. Multivariate methods widely used for gene expression profiling can simultaneously analyze the pat-terns of a great number of biological variables on a heterogeneous set of patients. Here we use these methods onflow cytometry assessment of up to 25 lymphocyte populations to analyze the global pattern of long-termimmune reconstitution after transplantation. Immune patterns were most distinct from healthy controls at sixmonths, and had not yet fully recovered as long as two years after transplant. The two principal determinants ofvariability were linked to the balance of B and CD8+ T cells and of natural killer and B cells, respectively.Recipient’s cytomegalovirus serostatus, cytomegalovirus replication, and chronic graft-versus-host disease were themain factors shaping the immune pattern one year after transplant. We identified a complex signature of under-and over-representation of immune populations dictated by recipient’s cytomegalovirus seropositivity. Finally, weidentified dimensions of variance in immune patterns as significant predictors of long-term non-relapse mortality,independently of chronic graft-versus-host disease.
Cytomegalovirus shapes long-term immune reconstitution after allogeneic stem cell transplantationRaphael Itzykson,1,2 Marie Robin,1 Helene Moins-Teisserenc,2,3,4 Marc Delord,2,5 Marc Busson,3,4 Aliénor Xhaard,1
Flore Sicre de Fontebrune,1,2 Régis Peffault de Latour,1 Antoine Toubert,2,3,4 and Gérard Socié1,2,4
1Service d’Hématologie Greffe, Hôpital Saint-Louis, APHP, Paris; 2Université Paris-Diderot et Paris Sorbonne Cité; 3Laboratoired’Immunologie, Hôpital Saint-Louis, APHP, Paris; 4Inserm UMRS-1160, Institut Universitaire d'Hématologie, Paris; and 5Plateformede Bioinformatique et Biostatistique, Institut Universitaire d'Hématologie, Paris, France
ABSTRACT
Introduction
Restoration of quantitatively and functionally normalimmunity is mandatory to limit infectious risks and relapseafter allogeneic hematopoietic stem cell transplantation(HSCT).1 The kinetics of reconstitution of innate and adaptiveimmune populations differ. The prompt recovery of neu-trophil, monocyte and natural killer (NK) cells contrasts withdelayed recovery of B- and T-cell subsets that can persistbeyond the first year after transplantation.2,3
Several studies have pinpointed the role of transplant char-acteristics, including conditioning regimen intensity, source ofstem cells and donor matching,4-7 and that of post-transplantevents including acute (aGvHD) and chronic (cGvHD) graft-versus-host disease and infections such as cytomegalovirus(CMV) replication on post-transplant immune reconstitu-tion.8-10
Other studies have focused on the study of a distinct subsetof immune cells, e.g. regulatory T cells (Tregs), CD5+ B cells,or NK cells.11-13 However, complex and heterogeneous clinicalsettings such as cGvHD often simultaneously affect severalimmune cell populations.3
While molecular biology8 and functional assays14 can beused to study immune reconstitution, flow cytometryuniquely allows the simultaneous assessment of severalimmune populations.9
Multivariate methods such as clustering algorithms, andprincipal component analyses are widely used to analyzemultidimensional data such as gene expression profiles, but
these methods have also been successfully applied to othertypes of data, such as clinical symptoms and murinehematopoietic reconstitution.15,16
In the present study, we use these tools to analyze simulta-neously the impact of several pre- and post-transplant vari-ables on the immune reconstitution of a large number ofimmune cell populations. Our results confirm that patterns ofimmune populations remain abnormal even two years aftertransplant, and uncover the crucial and independent role ofCMV serostatus and of CMV replication, and to a lesserextent of cGvHD, in shaping long-term immune reconstitu-tion following allogeneic HSCT.
Methods
PatientsImmune reconstitution was monitored as part of routine follow up
in all 410 patients undergoing allogeneic stem cell transplantation atour center between June 2005 and November 2009. Blood sampleswere collected prior to transplant and at three, six, 12 and 24 monthsafter transplant.3,6,12 All patients provided written informed consent inaccordance with the Declaration of Helsinki. The present study focus-es on patients with immune reconstitution profiling available attwelve months from transplant, regardless of indication, conditioningregimen, and stem cell source of HSCT; 190 patients met these crite-ria. Kinetics of reconstitution was studied in a smaller cohort of 77patients with data at all other study points. Characteristics of bothcohorts are shown in Table 1. Definition of clinical variables, including

CMV shapes immune reconstitution after HSCT
haematologica | 2015; 100(1) 115
Table 1. Patient characteristics. 12-months cohort Longitudinal cohort N % N %
N of patients 190 77 Recipient age ≤ 45 years 117 62% 48 62%> 45 years 73 38% 29 38%Diagnosis Acute leukemia (AML/ALL) 85 45% 40 52%MDS or MPN 37 19% 16 21%Bone marrow failure 22 12% 5 6%Lymphoid or PC malignancy 46 24% 16 21%
Gender matching Female to male 43 23% 14 18%Other 129 68% 58 76%NA 18 9% 5 6%
Donor age ≤ 45 years 125 66% 56 73%> 45 years 53 28% 21 27%NA 12 6% 0 0%
Stem cell source Bone Marrow 63 33% 26 34%Peripheral blood 110 58% 46 60%Cord Blood 17 9% 5 6%
Donor matching Matched sibling 100 53% 46 60%Matched unrelated donor 52 27% 19 25%Mismatched unrelated donor 21 11% 7 9%Cord blood 17 9% 5 6%
Conditioning regimen Reduced intensity 99 52% 37 48%Myeloablative 91 48% 40 52%
Total body irradiation Yes 82 43% 28 36%No 108 57% 49 64%
Antithymocyte globulins prophylaxis Yes 46 24% 15 19%No 144 76% 62 81%
CMV serostatus (donor/recipient) Negative / negative 53 28% 25 32%Positive / negative 46 24% 16 21%Negative / positive 35 18% 15 20%Positive / positive 53 28% 21 27%NA 3 2% 0 0%
Acute GvHD Grade 0 - I 101 53% 42 54%Grade II - IV 88 46% 35 45%NA 1 1% 0 0%
Chronic GvHD in the first 12 months No 66 35% 24 31%Limited 87 46% 35 46%Extensive 37 19% 18 23%
CMV reactivation in the first 12 months No 133 70% 55 71%Yes 57 30% 22 29%
Lymphocyte count at 12 months < 1.0 x10⁹/L 83 44% 31 40%≥1.0 x10⁹/L 107 56% 46 60%
AML: acute myeloid leukemia; ALL: acute lymphoblastic leukemia; PC: plasma cell; NA: not available.

R. Itzykson et al.
116 haematologica | 2015; 100(1)
Table 2. Immune subsets.Group Population Phenotype Restricted panel
B cells CD5+ B cells CD19+ / CD5+ Memory B cells CD19+ / CD27+ x Naive B cells CD19+ / CD27- xNK cells CD56bright CD16– NK cells CD3- / CD56bright / CD16- x1 CD56bright CD16+ NK cells CD3- / CD56bright / CD16+ CD56dim NK cells CD3- / CD56dim xNK / T cells NK/ T cells CD3+ / CD56+ CD4+ T cells CD25+ activated CD4+ T cells CD3+ / CD4+ / CD25+ HLA-DR+ activated CD4+ T cells CD3+ / CD4+ / HLA-DR+ Central memory CD4+ T cells CD3+ / CD4+ / CD45RA- / CCR7+ x Early differentiated CD4+ T cells CD3+ / CD4+ / CD28+ x Effector memory CD4+ T cells CD3+ / CD4+ / CD45RA- / CCR7- x Late effector memory CD4+ T cells CD3+ / CD4+ / CD45RA+ / CCR7- x Memory CD4+ T cells CD3+ / CD4+ / CD45ROb+ Naive CD4+ T cells CD3+ / CD4+ / CD45RA+ / CCR7+ xTregs Inducible Tregs CD3+ / CD4+ / CD25+ / CD127low / CD45RA– x Natural Tregs CD3+ / CD4+ / CD25+ / CD127low / CD45RA+ xCD8+ T cells CD25+ activated CD8+ T cells CD3+ / CD8+ / CD25+ HLA-DR+ activated CD8+ T cells CD3+ / CD8+ / HLA-DR+ Central memory CD8+ T cells CD3+ / CD8+ / CD45RA- / CCR7+ x Early differentiated CD8+ T cells CD3+ / CD8+ / CD28+ x Effector memory CD8+ T cells CD3+ / CD8+ / CD45RA- / CCR7- x Late effector memory CD8+ T cells CD3- / CD8+ / CD45RA+ / CCR7- x Memory CD8+ T cells CD3+ / CD8+ / CD45ROb+ Naive CD8+ T cells CD3+ / CD8+ / CD45RA+ / CCR7+ x1CD56bright NK cells, irrespective of CD16, were grouped as a single population in the restricted panel.
Figure 1A. Plots of the first 3 dimensions (DIM) from the correspondence analysis (CA)17 of immune pattern, determined on a restricted panelof 16 lymphocyte subsets (see Table 2) in 77 patients with longitudinal follow up prior to transplant, and after three, six, 12 and 24 monthsfrom transplant (red dots) compared to the immune pattern of 32 healthy controls (blue dots). Percentages indicate the proportion of vari-ance attributed to each dimension. Briefly, CA, like principal component analysis, allows the graphical representation of multidimensionaldata by generating ‘dimensions’ that reflect the similarity between rows (patients) and columns (immune populations) without losing infor-mation. The resulting dimensions are hierarchically organized, with the first dimension carrying the greater amount of information (percent-age of variance). The distance between 2 patients in the first dimensions of CA reflects the global similarity of their immune profile.Conversely, immune populations distant on CA dimensions have opposite representations in the patient population. (B) Similarity estimatedthrough RV coefficients18 between immune patterns of controls and transplant recipients at the same time points. RV coefficients (blacksquares) closer to 1 denote greater similarity between immune patterns of patients and controls. Log-transformed P values of the test of sig-nificance are indicated in gray bars.
A
B
pre-transplant 3 months
Patients Controls
-log10 (P value)
-log 1
0(Pvalue)
RV coefficient
Pre-
3 mo
6 mo
12 mo
24 mo
RV coefficient
DIM3(17.5%)
DIM2 (19.7%)
DIM1 (29.3%)
6 months 12 months 24 months
1.0
0.9
0.8
0.7
0.6
0.5
4
3
2
1
0

conditioning regimen intensity, GvHD grading and CMV replica-tion, is described in the Online Supplementary Methods.
ControlsBlood samples from 32 healthy donors were collected after
informed consent from the local blood donor center (HôpitalSaint-Louis, Paris, France).
Flow cytometry Flow cytometry analysis is detailed in Online Supplementary
Methods. Lymphocyte populations are summarized in Table 2.Only the restricted panel was assessed in the control samples,whereas the extended panel was used for patient samples.
Statistical analysisStatistical analyses are detailed in the Online Supplementary
Methods. All lymphocyte subsets were studied as proportions ofthe patient’s total lymphocyte count at the time of sampling. Multivariate analysis was performed by correspondence analy-
sis (CA), which is conceptually analogous to principal componentanalysis.17
Similarity between patients’ and controls’ datasets was evaluat-ed with the ‘RV’ coefficient, which measures the relationship oftwo sets of variables defined for the same individuals.18
One-way analysis of variance according to categorical variableswas performed with the Kruskall-Wallis test. When two variableswere each significantly impacting a single dimension, two-wayanalysis of variance (ANOVA) accounting for interaction were per-formed. Non-relapse mortality (NRM) and cumulative incidence of
relapse (CIR) were defined with a landmark at 12 months consid-ering relapse and death as competing events. Fine & Gray modelswere established after limited backward selection.19 All analyseswere carried with R 3.0.2 (www.cran.r-project.org).
Results
Kinetics of global patterns of immune reconstitutionIn order to analyze the kinetics of global immune
reconstitution, we first selected a subset of 77 patients(median age 40 years) for whom immune profiling hadbeen performed prior to transplant and at three, six, 12
and 24 months after transplant. (See Table 1 for patients’characteristics.) There was no significant difference inbase-line characteristics between this longitudinal cohortand the global population of 410 patients transplanted atour center over the same period (Online SupplementaryTable S1). The proportion of 16 lymphocyte subpopula-tions (‘restricted panel’, Table 2) at each time point inthose 77 patients was compared to that of 32 healthy con-trols (median age 43 years; P=0.11 vs. patients) throughcorrespondence analysis (CA). The two populations werecomparable with respect to CMV seropositivity (47% inboth groups; P=1.0). CA is a method analogous to princi-pal component analysis that allows the visualization ofmultidimensional categorical data (Figure 1A). Briefly, CAgenerates new variables for each patient, called ‘dimen-sions’, that combine and summarize the information con-tained in the many variables assessed (here, lymphocytesubsets). The resulting dimensions are hierarchicallyorganized, with the first dimension carrying the greateramount of information (percentage of variance). Thesefirst dimensions thus fairly reflect the heterogeneity ofpatients with respect to immune populations, with limit-ed loss of information: in the present analysis, the 3-dimensional depiction of the first three dimensions(DIM1, DIM2, and DIM3) captured a significant propor-tion of the panel’s variability (cumulative proportion ofvariance 66.5%). Consequently, the distance between 2patients in the first dimensions of CA reflects the globalsimilarity of their immune profile. Whereas the pattern ofimmune populations in patients seemed close to that ofhealthy controls prior to transplant, this pattern becamemore heterogeneous and distant from controls, especiallyat six and 12 months from transplant. We next used ‘RV’coefficients, which range from 0 (complete decorrelation)to 1 (complete correlation) to analyze the similaritybetween immune profiles of patients and controls.18Immune profiles of patients were significantly differentfrom controls at all times, including prior to transplant (–log10 (P) >2, i.e. P<0.01 in all instances). However, the sim-ilarity was close to 90% (RV coefficient=0.907) prior totransplant then decreased to reach a nadir close to 50%six months after transplant, before beginning to becomeclose to normal. Immune populations were still overall
CMV shapes immune reconstitution after HSCT
haematologica | 2015; 100(1) 117
Table 3. Prognostic factors of non-relapse mortality. Prognostic factors of NRM1 Univariate analysis Multivariate analysis Relative risk [95% CI] P Relative risk [95% CI] P
DIM1 0.26 [11 - 0.63] 0.003 DIM2 0.05 [01 - 0.19] <0.0001 0.01 [5.89x10⁻⁴ - 0.28] 0.006Female to male matching 1.46 [56 - 3.81] 0.016 Acute GvHD (grade II-IV) 4.83 [1.62 - 14.38] 0.005 Chronic GvHD in the first year 3.65 [1.90 - 7.02] 0.0001 2.23 [1.11 - 4.46] 0.001Lymphocyte count at 12 months 4.04 [1.48 - 11.03] 0.006 Proportion of lymphocytes CD4+ T cells 0.06 [9.45x10⁻⁴ - 4.21] 0.2 CD8+ T cells 64.46 [6.61 - 628.62] 0.0003 1.02 [1.00 - 1.04] 0.012B cells 3.x10-12 [9.x10-27 - 13x102] 0.12 NK cells 4.30 [27 - 68.08] 0.3
NRM: non-relapse mortality. 1Other clinical variables considered in univariate analysis (P>0.05): recipient and donor age, diagnosis, stem cell source, donor matching, conditioningregimen, CMV serostatus and CMV reactivation.

significantly different from controls at two years aftertransplant (Figure 1B).
Clustering of immune populationsWe next focused on the 190 patients alive at twelve
months after transplant with available information on 25lymphocyte subsets, including naïve, activated and mem-ory CD4+ and CD8+ T cells, resting and activated regulato-ry T cells (Tregs), CD56dim and CD56bright NK cells, andnaïve, and memory B cells (‘extended panel’, Table 2). Therelative proportion of each immune subset is plotted inOnline Supplementary Figure S1. Although this cohort rep-resents a selected patient population having survived thefirst year after HSCT, there was no additional inclusioncriterion, and the resulting cohort is thus heterogeneous interms of indication for HSCT, source of stem cells, condi-tioning regimen and donor matching, as summarized inTable 1. Comparison with the global transplant popula-tion is provided in Online Supplementary Table S1. Therewas no significant difference, except for a greater propor-tion of CMV seronegative recipients in the 12-monthstudy population (P=0.02). We performed CA on thisglobal dataset. The first 5 dimensions accounted for acumulative 75.5% of the total variance of the dataset[dimension (DIM) 1: 33.2%; DIM2: 15.5%]. Dimensionsresulting from CA display the similarity between patients(‘rows’ in our dataset), but can also be used to analyze thesimilarity between immune populations (‘columns’) acrossthe patient populations. We performed a supervised‘between-group’ clustering of immune populations, whichuncovered the distinct reconstitution of B and NK cell pop-ulations, and to a lesser extent of CD4+ and CD8+ T-cellsubsets. Expectedly, Tregs were closer to CD4+ T cells(Figure 2). We also performed unsupervised clusteringanalysis on the resulting dataset. This analysis uncovered6 statistically significant clusters (P<0.05 by approximatelyunbiased tests) (Online Supplementary Figure S2): B-cell sub-populations (naïve, memory and CD5+ B cells) formed acluster, as did NK-cell subpopulations. As further valida-tion, naïve (CD45RA+ / CCR7+) and ‘early differentiated’
(CD28+) CD8+ T cells were found to significantly cluster.Interestingly, within the CD8+ T-cell compartment, HLA-DR+ activated cells clustered with ‘late effector memory’(CD45RA+ / CCR7–) cells, whereas activated T cells char-acterized by CD25 expression instead clustered with ‘cen-tral memory’ (CD45RA– / CCR7+) cells. Of note, such dis-tinct clustering of CD25+ and HLA-DR+ activated CD8+ Tcells was also noted in patients studied at six months aftertransplant (data not shown).
Clinical determinants of immune reconstitution patternsTo determine which are the pre-transplant characteris-
tics and post-transplant clinical events that have the great-est influence on the pattern of immune reconstitution, weperformed non-parametric analysis of variance (Kruskall-
R. Itzykson et al.
118 haematologica | 2015; 100(1)
Figure 2. Supervised clustering of the 25 immune populations in 190patients at 12 months from transplant. Ellipses denote centroids ofclusters of immune populations. DIM1 and DIM2 are the first twodimensions of correspondence analysis.
P value<5x10⁻²<1x10⁻²
<1x10⁻³
<1x10⁻⁴<1x10⁻⁵
<1x10⁻⁶
Proportion of variance (%)
CMV reactivation
CMV serostatus
Chronic GVHD
Diagnosis
Fem to male
TBI
Acute GVHD
Donor age
Matching
Conditioning
Recipient age
ATG
HSC source
Lymphopenia
DIM1
DIM2
DIM3
DIM4
DIM5
Figure 3. Matrix of log-transformed P values of Kruskall-Wallis tests forone-way analysis of variancebetween each of the first five dimen-sions from the correspondenceanalysis of immune pattern of 190patients at 12 months from trans-plant, and the following variables,categorized as shown in Table 1:recipient age, disease category, gen-der matching, donor age, hematopoi-etic stem cell (HSC) source, condi-tioning regimen, CMV serostatus,acute GvHD, chronic GvHD and CMVreactivation in the first 12 months,lymphocyte counts at 12 monthsfrom transplant. The variables areordered according to a dendrogramresulting from unsupervised cluster-ing of explanatory variables. The pro-portion of variance contributed byeach dimension is provided in theadjacent histogram.
A B
DIM1
DIM2
0 20 40
Wallis) between each clinical variable and each of the firstfive dimensions of correspondence analysis. The pre-transplant variables included disease category, recipientand donor age, gender matching, donor matching, andsource of stem cells, conditioning regimen intensity, totalbody irradiation (TBI) as part of the conditioning, antithy-mocyte globulin (ATG) as part of GvHD prophylaxis, anddonor/recipient CMV serostatus. We also analyzed theimpact of clinical events that occurred in the first 12months after transplantation, including grade II-IV acuteGvHD, chronic GvHD (limited or extensive), and CMVreplication. Relapse in the first year of transplant occurredin only 10 (5%) patients and was thus too infrequent to beanalyzed. Lymphopenia (<1.0x10⁹/L) at the time ofimmunophenotyping, a potential confounder, was alsoincluded in this analysis. All these parameters were ana-lyzed as ordinal variables, using stratifications from Table1. CMV serostatus was considered as an ordinal variablein the following order: Donor[D]-/Recipient[R]-, D+/R-,D+/R+, D-/R+. After correcting for multiple testing, fewclinical variables were found to significantly affect theprincipal dimensions of immune patterns’ heterogeneity. Most notably, both CMV serostatus prior to transplant,
and CMV replication after transplant, strongly (both P<10-6) affected the 1st dimension of variance.Lymphopenia, and to a lesser extent chronic GvHD affect-ed the 2nd dimension, whereas the source of stem cells and
ATG only had weak influences (adjusted P=0.020 andP=0.014, respectively) on dimension 5, which accounts foronly 6.2% of the total variance of immune profiles. In par-ticular, donor or recipient age gender matching condition-ing intensity, TBI, donor matching, or antecedent acuteGvHD did not affect the global pattern of immune recon-stitution (Figure 3). Of note, comparable results werefound in an analysis carried on 223 patients analyzed sixmonths after transplant (data not shown), or when analyz-ing absolute instead of relative lymphocyte populationcounts (Online Supplementary Figure S3). Importantly,because dimensions in correspondence analysis areorthogonal (i.e. they carry independent information),these results also indicate that CMV status and chronicGvHD independently shape the pattern of immune recon-stitution after transplantation. We performed two-wayANOVA to dissect the impact of each variable significant-ly determining DIM1 and DIM2. We found the impact ofcGvHD on DIM2 to remain significant (P=0.004), inde-pendently of lymphopenia. A similar analysis showed thepredominant role of CMV serostatus (P<10-12) over CMVreplication (P<10-4) on the principal dimension of varianceDIM1, with significant interaction between both explana-tory variables (P=0.04) (Online Supplementary Table S3). Ofnote, the number of CMV replication episodes was linear-ly associated with DIM1 (R2=0.27; P<0.0001) (OnlineSupplementary Figure S4).
CMV shapes immune reconstitution after HSCT
haematologica | 2015; 100(1) 119
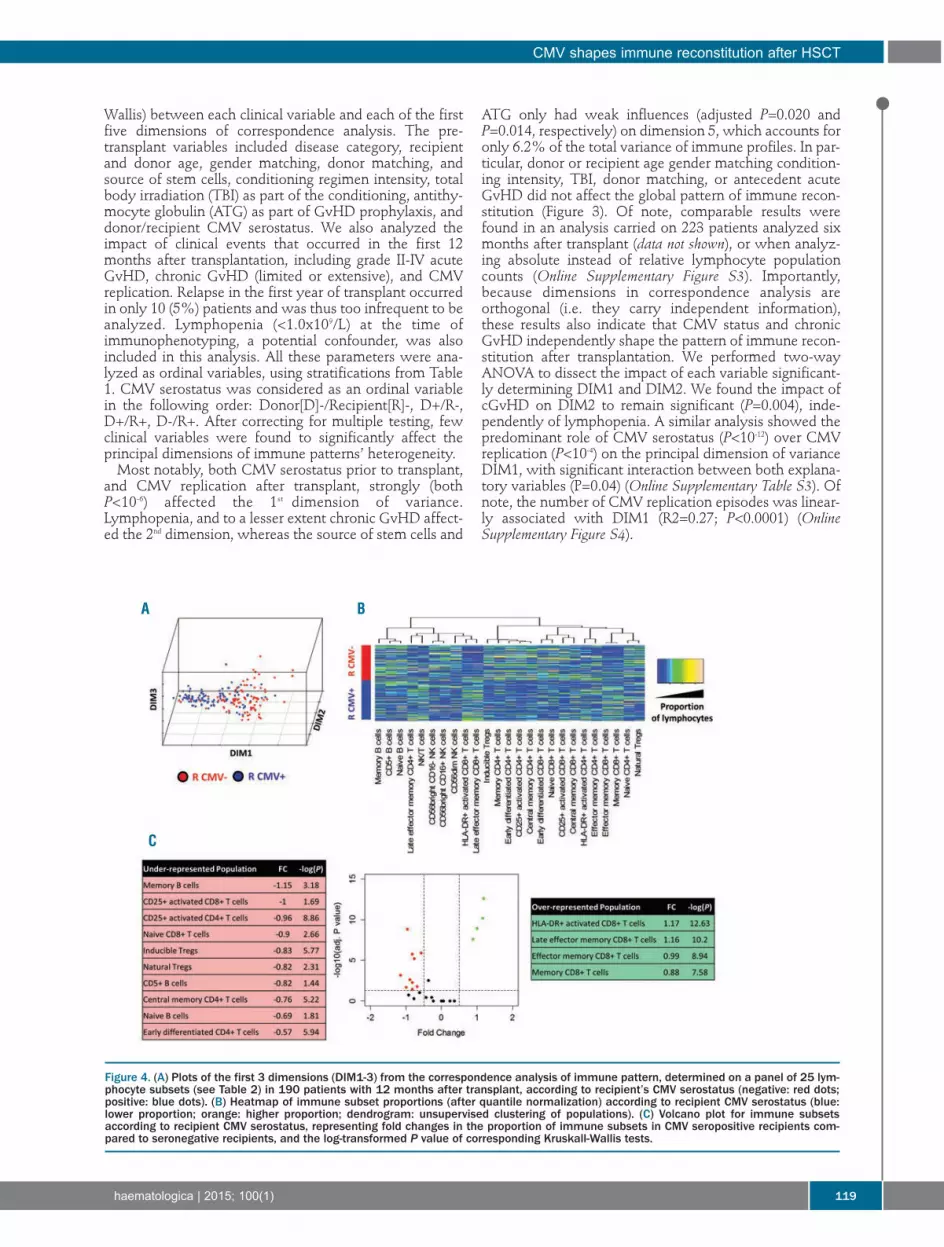
Figure 4. (A) Plots of the first 3 dimensions (DIM1-3) from the correspondence analysis of immune pattern, determined on a panel of 25 lym-phocyte subsets (see Table 2) in 190 patients with 12 months after transplant, according to recipient’s CMV serostatus (negative: red dots;positive: blue dots). (B) Heatmap of immune subset proportions (after quantile normalization) according to recipient CMV serostatus (blue:lower proportion; orange: higher proportion; dendrogram: unsupervised clustering of populations). (C) Volcano plot for immune subsetsaccording to recipient CMV serostatus, representing fold changes in the proportion of immune subsets in CMV seropositive recipients com-pared to seronegative recipients, and the log-transformed P value of corresponding Kruskall-Wallis tests.
A B
C
Reconstitution pattern in recipients seropositive for CMVWe next focused on the different balance of immune
populations according to CMV serostatus because thisvariable was the strongest determinant of the principaldimension of variance in the previous analysis. We firstsought to determine which groups of donor/recipientserostatus are associated to greater variability of immuneprofiles. To do so, we compared in the principal dimen-sion of variance (DIM1) various ways to dichotomizepatients according to Donor/Recipient (D/R) CMVserostatus. The χ2 value was 33.87 for D-/R- versus allother D/R statuses, compared to 8.96 for donor seroposi-tivity and 59.47 for recipient CMV seropositivity.Therefore, recipient seropositivity for CMV seemed thebest way to dichotomize patients on the basis of principaldimension of variance of immune reconstitution patterns(Kruskall-Wallis P<10-13). This was also apparent on thecorrespondence plot (Figure 4A and Online SupplementaryFigure S5). We performed two different approaches touncover the differences of twelve-month reconstitutionpatterns in recipients seropositive and seronegative forCMV. First, we plotted the heatmap of immune popula-tions according to recipient CMV serostatus (Figure 4B)revealing complex differences in the immune patterns ofrecipients according to their CMV serostatus. The mostapparent changes were increased proportions of HLA-DR+
activated and of late effector memory CD8+ T cells, con-trasting with decreased proportions of B-cell subsets inseropositive recipients. We next performed a volcano plotdisplaying fold changes in mean proportion of immunesubsets according to recipient CMV serostatus, and thecorresponding Student’s t-test P values (after adjusting formultiple comparison). This revealed that statistically sig-nificant changes [adjusted P<0.05, corresponding to –log(adjusted P) >1.23] in 14 of the 25 immune populationsstudied, with four being over-represented and ten under-represented at 12 months after transplant. As previouslynoted, under-represented populations included B-cell sub-
sets (naïve, memory, and CD5+ B cells), whereas over-rep-resented subsets included HLA-DR+ activated CD8+ T cellsand memory CD8+ T-cell populations. Of note, most ofthese statistically significant changes were of moderatemagnitude, with fold changes inferior to 1 (in absolutevalue), corresponding to less than doubling or fewer thanhalving of the mean proportion of the immune cells in thecorresponding compartment (Figure 4C). The dominantrole of the balance between B-cell and CD8+ T-cell subsetsdictated by CMV serostatus is in keeping with the resultsof the previous between-group analysis, showing that Bcells and CD8+ T cells are on opposite poles on the princi-pal dimension of variance of immune patterns (Figure 2).
Outcome according to immune patterns revealed by correspondence analysisWe finally sought to determine whether the global pat-
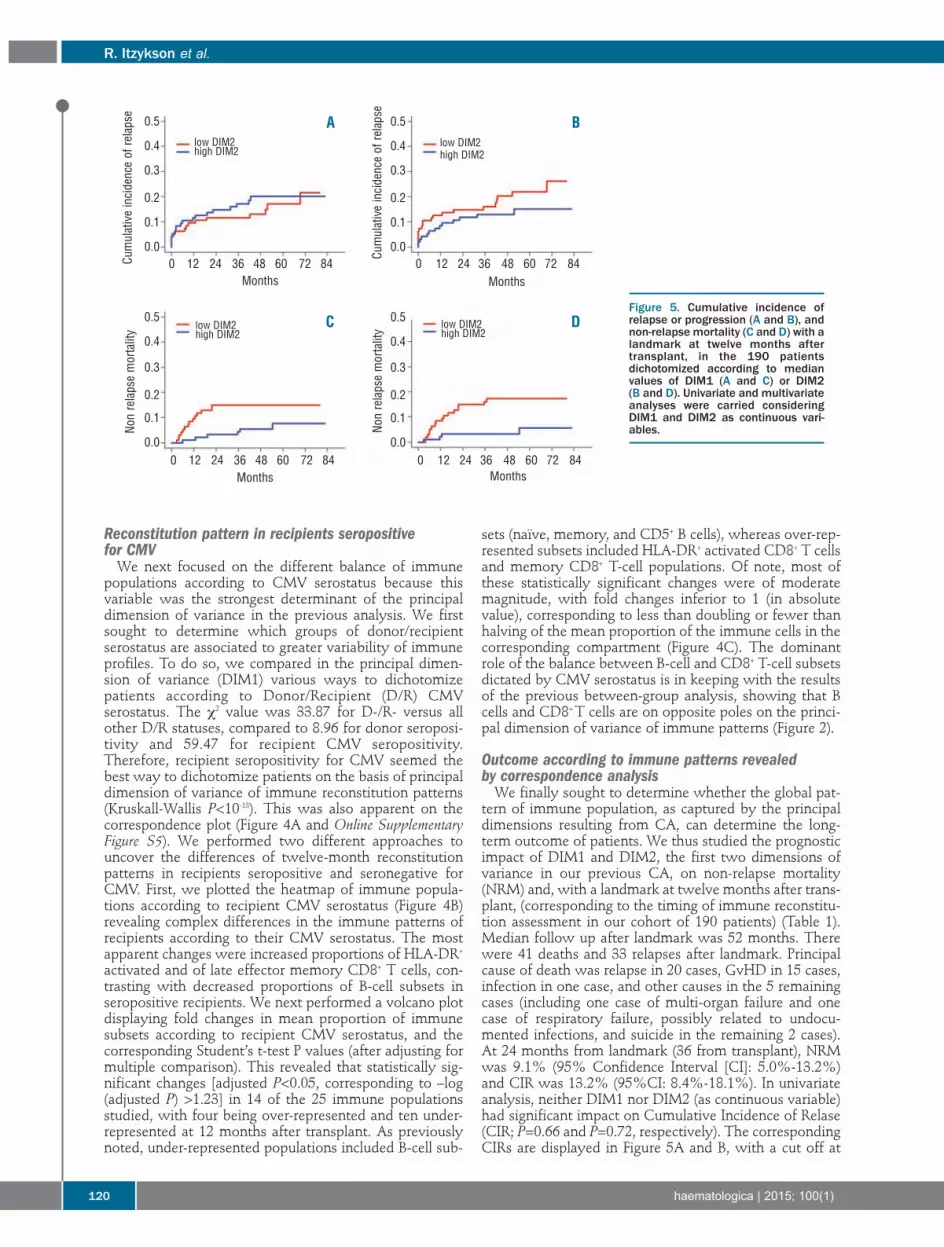
tern of immune population, as captured by the principaldimensions resulting from CA, can determine the long-term outcome of patients. We thus studied the prognosticimpact of DIM1 and DIM2, the first two dimensions ofvariance in our previous CA, on non-relapse mortality(NRM) and, with a landmark at twelve months after trans-plant, (corresponding to the timing of immune reconstitu-tion assessment in our cohort of 190 patients) (Table 1).Median follow up after landmark was 52 months. Therewere 41 deaths and 33 relapses after landmark. Principalcause of death was relapse in 20 cases, GvHD in 15 cases,infection in one case, and other causes in the 5 remainingcases (including one case of multi-organ failure and onecase of respiratory failure, possibly related to undocu-mented infections, and suicide in the remaining 2 cases).At 24 months from landmark (36 from transplant), NRMwas 9.1% (95% Confidence Interval [CI]: 5.0%-13.2%)and CIR was 13.2% (95%CI: 8.4%-18.1%). In univariateanalysis, neither DIM1 nor DIM2 (as continuous variable)had significant impact on Cumulative Incidence of Relase(CIR; P=0.66 and P=0.72, respectively). The correspondingCIRs are displayed in Figure 5A and B, with a cut off at
R. Itzykson et al.
120 haematologica | 2015; 100(1)
Figure 5. Cumulative incidence ofrelapse or progression (A and B), andnon-relapse mortality (C and D) with alandmark at twelve months aftertransplant, in the 190 patientsdichotomized according to medianvalues of DIM1 (A and C) or DIM2 (B and D). Univariate and multivariateanalyses were carried consideringDIM1 and DIM2 as continuous vari-ables.
A B
C D
Months
Non relapse mortality
Non relapse mortality
Cumulative incidence of relapse
Cumulative incidence of relapse
Months Months
Months
low DIM2high DIM2
low DIM2high DIM2
low DIM2high DIM2
low DIM2high DIM2
0 12 24 36 48 60 72 84 0 12 24 36 48 60 72 84
0 12 24 36 48 60 72 84 0 12 24 36 48 60 72 84
0.5
0.4
0.3
0.2
0.1
0.0
0.5
0.4
0.3
0.2
0.1
0.0
0.5
0.4
0.3
0.2
0.1
0.0
0.5
0.4
0.3
0.2
0.1
0.0

median value of DIM1 or DIM2, for the convenience ofgraphical display. Conversely, higher DIM1 and higherDIM2 values were significantly associated with lowerNRM (P=0.003 and P<0.0001, respectively) in univariateanalysis (Fine & Gray model) (Table 3 and Figure 5C andD). Among clinical variables, female-to-male sex mis-match (P=0.016), antecedent grade II-IV aGvHD(P=0.005), cGvHD in the first twelve months (P=0.0001),and lymphocyte count less than 1x10⁹/L at twelve months(P=0.006) were also significantly associated to higher ratesof NRM in univariate analysis, whereas recipient anddonor age, diagnosis, stem cell source, donor matching,conditioning regimen, CMV serostatus or replication hadno significant impact. In multivariate analysis, after back-ward regression, DIM2 and chronic GvHD were found tobe the only variables with significant and independentimpact on NRM (Table 3).DIM2 integrates information on the proportion of all 25
immune subsets, but particularly reflects the balance of Band NK cells, which are on opposite poles of this axis(Figure 2). Thus, higher DIM2 values, corresponding tohigher proportion of NK cells and lower proportion of Bcells, have a significant detrimental influence on lateNRM. In univariate analysis, a higher proportion of CD8+T cells was also significantly associated to higher NRM(P=0.0003), whereas neither the proportion of B cells northat of NK cells had any significant impact. Adding theCD8+ T-cell proportion to the previous multivariate modeldid not modify the significant role of DIM2 as a prognosticfactor for NRM (P=0.006) (Table 3).
Discussion
Immune reconstitution after allogeneic stem cell trans-plantation is a dynamic and complex process. We3 andothers7,20-33 have reported a delayed recovery of theimmune system post allogeneic HSCT mostly influencedby age and GvHD. Determination of lymphocyte popula-tion numbers through flow cytometry provides robustinformation on immune reconstitution after transplant.Most studies have focused on the role of a given lympho-cyte subpopulation, or of a precise modality of transplan-tation. Multivariate methods, such as those widely usedfor gene expression profiling, can simultaneously analyzethe patterns of a great number of biological variables on aheterogeneous set of patients. Here we use correspon-dence analysis to analyze the global pattern of long-termimmune reconstitution.The kinetics of global immune reconstitution was first
studied sequentially until two years. The profile of 16lymphocyte subpopulations as compared to healthy con-trols was significantly abnormal at all times, includingbefore transplant, possibly because of underlying malig-nancy and previous treatments, and reached a nadir sixmonths after transplant, before beginning to become nearto normal. However, immune populations were still over-all significantly different from controls at two years aftertransplant. The global view we provide of such an evolu-tion is in keeping with previous findings focusing ondefined immune subsets.3,7,20-33 We next focused onpatients alive at one year and analyzed global immunereconstitution of 25 lymphocyte subsets, and performed acorrespondence analysis on this global dataset. This latetime point was chosen to allow sufficient lymphocyte
count recovery and significant cumulative incidence ofcGvHD for analysis. Both study populations were definedon the basis of prolonged survival and thus include select-ed patients. However, their base-line characteristics werecomparable to that of the global population transplantedat our center during the same period, except for an over-representation of CMV seronegative recipients, which isin keeping with the role of CMV replication on NRM afterHSCT.34 The first 5 dimensions accounted for two-thirdsof the total variance of the dataset. Analyses uncoveredthe distinct reconstitution of B– and NK-cell populations,and to a lesser extent of CD4+ and CD8+ T-cell subsets.Tregs were closer to CD4+ and CD8+ T cells. Within theCD8+ DR+ T-cell clustered with late effector memory,whereas CD8+ CD25+ T cells clustered with central mem-ory cells.To determine which factors influence the pattern of
immune reconstitution we performed non-parametricanalysis of variance. Both CMV serostatus, and CMVreplication strongly (P<10-6) affected the 1st (and thus main)dimension of variance. Lymphopenia, and to a lesserextent chronic GvHD, affected the 2nd dimension, whereasthe source of stem cells and use of ATG had a weak influ-ence accounting for less than 10% of the total variance ofimmune profiles. Though older age as a dichotomic vari-able did not impact immune patterns, further analysis ofthe complex relationship between donor and recipient ageand immune recovery is required. Heatmapping ofimmune populations according to recipient CMV serosta-tus revealed complex differences in the immune patternsof recipients according to their CMV serostatus. The mostapparent changes were increased proportions of HLA-DR+ activated and of late effector memory CD8+ T cells,contrasting with decreased proportions of B-cell subsets inseropositive recipients. This likely reflects the expansionof absolute numbers of activated and memory T cells afterCMV reactivation (see Lugthart et al.35; other data notshown). The redistribution of T-cell phenotypes from naïvepredominant to memory-enriched after CMV infectionoccurs rapidly.36 Viral latency drives inflation of memorycells, and is considered a hallmark of CMV infection.37Numerous data have pinpointed the requirement for thehost to maintain control of latent CMV infection through-out life.38 In the setting of HSCT, several studies haveaddressed the role of CMV on immune recovery.35,39-42However, none of these have provided multivariate evi-dence of the dominant role of CMV in shaping immunereconstitution, compared to pre-transplant characteristics,and to occurrence of GvHD. Further studies on a larger setof healthy controls are required to compare this pattern tothat associated to CMV seropositivity in immunocompe-tent hosts. Chronic GvHD was, as expected, the secondmajor event to shape long-term immune reconstitution.Chronic GvHD has already been reported to influence B-and T-cell reconstitution3,8,9,20,21,43,44 but none of these stud-ies provided a broad overview as allowed here by CA. Itis interesting to note that CMV-specific memory T cellscross react with alloantigens45,46 and have long been sus-pected to be involved in the pathogenesis of GvHDthrough molecular mimicry. Finally, although ATG hasbeen reported to influence early immune reconstitu-tion,20,21,43,44 its role in influencing long-term reconstitutionwas weak in the present study, possibly because of thelate time point considered.Finally, we sought to determine whether the global pat-
CMV shapes immune reconstitution after HSCT
haematologica | 2015; 100(1) 121

tern of immune population, as captured by the principaldimensions, can correlate with long-term outcome ofthese patients. In multivariate analysis, DIM2 and chronicGvHD were found to be the only variables with signifi-cant and independent impact on NRM. DIM2 partlyreflects the balance between B- and NK-cell populations,but neither the proportion of B cells, nor that of NK cellsdid influence NRM in univariate analysis. This particularpoint suggests the interest of multivariate methods in cap-turing equilibriums between immune populations, by pro-viding novel information not captured by the analysis ofindividual immune populations. Future studies arerequired to incorporate data on myeloid populations insuch global profiling of immune reconstitution.47
In summary, multivariate methods such as correspon-dence analysis and unsupervized clustering provide usefultools to analyze immune reconstitution and point to thecrucial role of CMV serostatus (and CMV replication), andchronic GvHD in shaping long-term immune reconstitutionfollowing allogeneic hematopoietic stem cell transplanta-tion. Application of such tools to independent cohorts withdifferent flow cytometry panels may help validate thisapproach and gain novel insights into immune recovery.
Authorship and DisclosuresInformation on authorship, contributions, and financial & other
disclosures was provided by the authors and is available with theonline version of this article at www.haematologica.org.
R. Itzykson et al.
122 haematologica | 2015; 100(1)
References1. Mackall C, Fry T, Gress R, Peggs K, StorekJ, Toubert A. Background to hematopoieticcell transplantation, including post trans-plant immune recovery. Bone MarrowTransplant. 2009;44(8):457-62.
2. Storek J. Immunological reconstitutionafter hematopoietic cell transplantation - itsrelation to the contents of the graft. ExpertOpin Biol Ther. 2008;8(5):583-97.
3. Corre E, Carmagnat M, Busson M, deLatour RP, Robin M, Ribaud P, et al. Long-term immune deficiency after allogeneicstem cell transplantation: B-cell deficiencyis associated with late infections.Haematologica. 2010;95(6):1025-9.
4. Jimenez M, Ercilla G, Martinez C. Immunereconstitution after allogeneic stem celltransplantation with reduced-intensity con-ditioning regimens. Leukemia. 2007;21(8):1628-37.
5. Komanduri KV, St John LS, de Lima M,McMannis J, Rosinski S, McNiece I, et al.Delayed immune reconstitution after cordblood transplantation is characterized byimpaired thymopoiesis and late memory T-cell skewing. Blood. 2007;110(13):4543-51.
6. Servais S, Lengline E, Porcher R, CarmagnatM, Peffault de Latour R, Robin M, et al.Long-Term Immune Reconstitution andInfection Burden after MismatchedHematopoietic Stem Cell Transplantation.Biol Blood Marrow Transplant. 2014;20(4):507-17.
7. Storek J, Dawson MA, Storer B, Stevens-Ayers T, Maloney DG, Marr KA, et al.Immune reconstitution after allogeneicmarrow transplantation compared withblood stem cell transplantation. Blood.2001;97(11):3380-9.
8. Clave E, Busson M, Douay C, Peffault deLatour R, Berrou J, Rabian C, et al. Acutegraft-versus-host disease transientlyimpairs thymic output in young patientsafter allogeneic hematopoietic stem celltransplantation. Blood. 2009;113(25):6477-84.
9. Podgorny PJ, Liu Y, Dharmani-Khan P, PrattLM, Jamani K, Luider J, et al. Immune CellSubset Counts Associated with Graft-ver-sus-Host Disease. Biol Blood MarrowTransplant. 2014;20(4):450-62.
10. Jeljeli M, Guerin-El Khourouj V, Porcher R,Fahd M, Leveille S, Yakouben K, et al.Relationship between cytomegalovirus(CMV) reactivation, CMV-driven immuni-ty, overall immune recovery and graft-ver-
sus-leukaemia effect in children. Br JHaematol. 2014;166:229-39.
11. Dong S, Maiella S, Xhaard A, Pang Y,Wenandy L, Larghero J, et al.Multiparameter single-cell profiling ofhuman CD4+FOXP3+ regulatory T-cellpopulations in homeostatic conditions andduring graft-versus-host disease. Blood.2013;122(10):1802-12.
12. Moins-Teisserenc H, Busson M, Herda A,Apete S, Peffault de Latour R, Robin M, etal. CD19+CD5+ B cells and B1-like cellsfollowing allogeneic hematopoietic stemcell transplantation. Biol Blood MarrowTransplant. 2013;19(6):988-91.
13. Nguyen S, Dhedin N, Vernant JP, KuentzM, Al Jijakli A, Rouas-Freiss N, et al. NK-cell reconstitution after haploidenticalhematopoietic stem-cell transplantations:immaturity of NK cells and inhibitoryeffect of NKG2A override GvL effect.Blood. 2005;105(10):4135-42.
14. Barron MA, Gao D, Springer KL, PattersonJA, Brunvand MW, McSweeney PA, et al.Relationship of reconstituted adaptive andinnate cytomegalovirus (CMV)-specificimmune responses with CMV viremia inhematopoietic stem cell transplant recipi-ents. Clin Infect Dis. 2009;49(12):1777-83.
15. Geyer HL, Emanuel RM, Dueck AC,Kiladjian JJ, Xiao Z, Slot S, et al. Distinctclustering of symptomatic burden amongstmyeloproliferative neoplasm patients: ret-rospective assessment in 1470 patients.Blood. 2014;123(24):3803-10.
16. Naik SH, Perie L, Swart E, Gerlach C, vanRooij N, de Boer RJ, et al. Diverse and her-itable lineage imprinting of earlyhaematopoietic progenitors. Nature.2013;496(7444):229-32.
17. Husson F, Le S, Pages J. ExploratoryMultivariate Analysis by Example Using R.Boca Raton: Chapman & Hall/CRC, 2010.
18. Josse J, Pagès J, Husson F. Testing the signif-icance of the RV coefficient. Comput StatData Anal. 2008;53(1):82-91.
19. Fine JP, Gray RJ. A Proportional HazardsModel for the Subdistribution of aCompeting Risk. J Am Stat Assoc.1999;94(446):496-509.
20. Small TN, Papadopoulos EB, Boulad F,Black P, Castro-Malaspina H, Childs BH, etal. Comparison of immune reconstitutionafter unrelated and related T-cell-depletedbone marrow transplantation: effect ofpatient age and donor leukocyte infusions.Blood. 1999;93(2):467-80.
21. Parkman R, Weinberg KI. Immunological
reconstitution following bone marrowtransplantation. Immunol Rev. 1997;157:73-8.
22. Abrahamsen IW, Somme S, Heldal D,Egeland T, Kvale D, Tjonnfjord GE.Immune reconstitution after allogeneicstem cell transplantation: the impact ofstem cell source and graft-versus-host dis-ease. Haematologica. 2005;90(1):86-93.
23. D'Sa S, Peggs K, Pizzey A, Verfuerth S,Thuraisundaram D, Watts M, et al. T- andB-cell immune reconstitution and clinicaloutcome in patients with multiple myelo-ma receiving T-cell-depleted, reduced-intensity allogeneic stem cell transplanta-tion with an alemtuzumab-containing con-ditioning regimen followed by escalateddonor lymphocyte infusions. Br JHaematol. 2003;123(2):309-22.
24. Heining C, Spyridonidis A, Bernhardt E,Schulte-Monting J, Behringer D, Grullich C,et al. Lymphocyte reconstitution followingallogeneic hematopoietic stem cell trans-plantation: a retrospective study including148 patients. Bone Marrow Transplant.2007;39(10):613-22.
25. Maris M, Boeckh M, Storer B, Dawson M,White K, Keng M, et al. Immunologicrecovery after hematopoietic cell transplan-tation with nonmyeloablative condition-ing. Exp Hematol. 2003;31(10):941-52.
26. Sanchez-Garcia J, Serrano J, Gomez P,Martinez F, Martin C, Roman-Gomez J, etal. The impact of acute and chronic graft-versus-host disease on normal and malig-nant B-lymphoid precursors after allogeneicstem cell transplantation for B-lineage acutelymphoblastic leukemia. Haematologica.2006;91(3):340-7.
27. Storek J, Ferrara S, Ku N, Giorgi JV,Champlin RE, Saxon A. B cell reconstitu-tion after human bone marrow transplanta-tion: recapitulation of ontogeny? BoneMarrow Transplant. 1993;12(4):387-98.
28. Storek J, Gooley T, Witherspoon RP,Sullivan KM, Storb R. Infectious morbidityin long-term survivors of allogeneic mar-row transplantation is associated with lowCD4 T cell counts. Am J Hematol.1997;54(2):131-8.
29. Storek J, Saxon A. Reconstitution of B cellimmunity following bone marrow trans-plantation. Bone Marrow Transplant.1992;9(6):395-408.
30. Storek J, Joseph A, Espino G, Dawson MA,Douek DC, Sullivan KM, et al. Immunity ofpatients surviving 20 to 30 years after allo-geneic or syngeneic bone marrow trans-
plantation. Blood. 2001;98(13):3505-12.31. Storek J, Wells D, Dawson MA, Storer B,
Maloney DG. Factors influencing B lym-phopoiesis after allogeneic hematopoietic celltransplantation. Blood. 2001;98(2):489-91.
32. Storek J, Witherspoon RP, Storb R. T cellreconstitution after bone marrow transplan-tation into adult patients does not resembleT cell development in early life. BoneMarrow Transplant. 1995;16(3):413-25.
33. Tayebi H, Kuttler F, Saas P, Lienard A,Petracca B, Lapierre V, et al. Effect of granu-locyte colony-stimulating factor mobiliza-tion on phenotypical and functional proper-ties of immune cells. Exp Hematol.2001;29(4):458-70.
34. Schmidt-Hieber M, Labopin M, Beelen D,Volin L, Ehninger G, Finke J, et al. CMVserostatus still has an important prognosticimpact in de novo acute leukemia patientsafter allogeneic stem cell transplantation: areport from the Acute Leukemia WorkingParty of EBMT. Blood. 2013;122(19):3359-64.
35. Lugthart G, van Ostaijen-Ten Dam MM,Jol-van der Zijde CM, van Holten TC,Kester MG, Heemskerk MH, et al. Earlycytomegalovirus reactivation leaves a spe-cific and dynamic imprint on the reconsti-tuting T cell compartment long-term afterhematopoietic stem cell transplantation.
Biol Blood Marrow Transplant. 2014;20(5):655-61.
36. Pawelec G. T-cell immunity in the aginghuman. Haematologica. 2014;99(5):795-7.
37. Seckert CK, Griessl M, Buttner JK, SchellerS, Simon CO, Kropp KA, et al. Viral latencydrives 'memory inflation': a unifyinghypothesis linking two hallmarks ofcytomegalovirus infection. Med MicrobiolImmunol. 2012;201(4):551-66.
38. Nikolich-Zugich J. Ageing and life-longmaintenance of T-cell subsets in the face oflatent persistent infections. Nat RevImmunol. 2008;8(7):512-22.
39. Cwynarski K, Ainsworth J, Cobbold M,Wagner S, Mahendra P, Apperley J, et al.Direct visualization of cytomegalovirus-specific T-cell reconstitution after allogene-ic stem cell transplantation. Blood.2001;97(5):1232-40.
40. Mori T, Kato J. Cytomegalovirus infec-tion/disease after hematopoietic stem celltransplantation. Int J Hematol.2010;91(4):588-95.
41. Kheav VD, Busson M, Scieux C, Peffault deLatour R, Maki G, Haas P, et al. Favorableimpact of natural killer cell reconstitution onchronic graft-versus-host disease andcytomegalovirus reactivation after allogene-ic hematopoietic stem cell transplantation.
Haematologica. 2014 [Epub ahead of print].42. Hakki M, Riddell SR, Storek J, Carter RA,
Stevens-Ayers T, Sudour P, et al. Immunereconstitution to cytomegalovirus afterallogeneic hematopoietic stem cell trans-plantation: impact of host factors, drugtherapy, and subclinical reactivation. Blood.2003;102(8):3060-7.
43. Zakrzewski JL, Goldberg GL, Smith OM,van den Brink MR. Enhancing T cell recon-stitution after hematopoietic stem cell trans-plantation: a brief update of the latest trends.Blood Cells Mol Dis. 2008;40(1):44-7.
44. Geddes M, Storek J. Immune reconstitutionfollowing hematopoietic stem-cell trans-plantation. Best Pract Res Clin Haematol.2007;20(2):329-48.
45. Sewell AK. Why must T cells be cross-reac-tive? Nat Rev Immunol. 2012;12(9):669-77.
46. Farber DL, Yudanin NA, Restifo NP.Human memory T cells: generation, com-partmentalization and homeostasis. NatRev Immunol. 2014;14(1):24-35.
47. Mougiakakos D, Jitschin R, von Bahr L,Poschke I, Gary R, Sundberg B, et al.Immunosuppressive CD14+HLA-DRlow/neg IDO+ myeloid cells in patientsfollowing allogeneic hematopoietic stemcell transplantation. Leukemia. 2013;27(2):377-88.
CMV shapes immune reconstitution after HSCT
haematologica | 2015; 100(1) 123