cytochrome rc 552 , formed during expression of the truncated, thermus thermophilus cytochrome c 552...
TRANSCRIPT

CytochromerC552, Formed during Expression of the Truncated,ThermusthermophilusCytochromec552 Gene in the Cytoplasm ofEscherichia coli, ReactsSpontaneously To Form Protein-Bound 2-Formyl-4-vinyl (Spirographis) Heme†,‡
James A. Fee,*,§,| Thomas R. Todaro,§ Eugene Luna,§ Donita Sanders,§ Laura M. Hunsicker-Wang,§,|
Kirti M. Patel,⊥ Kara L. Bren,⊥ Ester Gomez-Moran,@ Michael G. Hill,@ Jingyuan Ai,# Thomas M. Loehr,#
W. Anthony Oertling,+ Pamela A. Williams,|,b C. David Stout,| Duncan McRee,|,[ and Andrzej PastuszynO
Department of Biology, UniVersity of California at San Diego, La Jolla, California 92093,Department of Molecular Biology, The Scripps Research Institute, La Jolla, California 92037,
Department of Chemistry, UniVersity of Rochester, Rochester, New York 14627-0216, Department of Chemistry,Occidental College, Los Angeles, California 90041, Department of EnVironmental and Biomolecular Systems,
OGI School of Science and Engineering, Oregon Health and Science UniVersity, BeaVerton, Oregon 97006-8921,Department of Chemistry/Biochemistry, Eastern Washington UniVersity, Cheney, Washington 99004, and
Department of Biochemistry and Molecular Biology, UniVersity of New Mexico,Albuquerque, New Mexico 87131-5221
ReceiVed May 20, 2004; ReVised Manuscript ReceiVed July 13, 2004
ABSTRACT: Expression of the truncated (lacking an N-terminal signal sequence) structural gene ofThermusthermophiluscytochromec552 in the cytoplasm ofEscherichia coliyields both dimeric (rC557) andmonomeric (rC552) cytochromec-like proteins [Keightley, J. A.,et al. (1998)J. Biol. Chem. 273, 12006-12016], which form spontaneously without the involvement of cytochromec maturation factors. CytochromerC557 is comprised of a dimer and has been structurally characterized [McRee, D.,et al. (2001)J. Biol.Chem. 276, 6537-6544]. Unexpectedly, the monomericrC552 transforms spontaneously to a cytochrome-like chromophore having, in its reduced state, theQoo transition (R-band) at 572 nm (therefore calledp572). The X-ray crystallographic structure ofrC552, at 1.41 Å resolution, shows that the 2-vinyl groupof heme ring I is converted to a [heme-CO-CH2-S-CH2-CR] conjugate with cysteine 11. Electron densitymaps obtained from isomorphous crystals of p572 at 1.61 Å resolution reveal that the 2-vinyl group hasbeen oxidized to a formyl group. This explains the lower energy of theQoo transition, the presence of anew, high-frequency band in the resonance Raman spectra at 1666 cm-1 for oxidized and at 1646 cm-1
for reduced samples, and the greatly altered, paramagnetically shifted1H NMR spectrum observed forthis species. The overall process defines a novel mechanism for oxidation of the 2-vinyl group to a 2-formylgroup and adds to the surprising array of chemical reactions that occur in the interaction of heme with theCXXCH sequence motif in apocytochromesc.
Cytochromec synthesis in Gram-negative prokaryotesnormally occurs from a messenger RNA that encodes a pre-apoprotein having a short (∼20 amino acids) N-terminalsignal peptide. The latter is recognized by the generalsecretory pathway which directs the pre-apoprotein to theperiplasm. The signal peptide is further recognized by leader
peptidases that cleave it to form apocytochromec. Heme isalso synthesized in the cytoplasm and transferred to theperiplasm with assistance from still unidentified factors.Apoprotein and heme are thus brought together in theperiplasm with the correct rotational orientation of the hememaintained, and additional Ccm1 factors assist in the correctformation of two thioether linkages with the commonCXXCH sequence motif. TheEscherichia colisystem hasbeen extensively reviewed by Tho¨ny-Meyer (1, 2), Kranz(3), and Ferguson (4) and their co-workers.
† Supported by NIH Grants GM35342 (J.A.F.), GM18865 (T.M.L.),GM63170 (K.L.B.), and GM48495 (C.D.S.).
‡ Structure coordinates of cytochromesrC552and p572 were depositedwith the Protein Data Bank as entries 1QYZ and 1ROQ, respectively.
* To whom correspondence should be addressed. Telephone: (858)784-9235. Fax: (858) 784-2857. E-mail: [email protected].
§ University of California at San Diego.| The Scripps Research Institute.⊥ University of Rochester.@ Occidental College.# Oregon Health and Science University.+ Eastern Washington University.b Present address: Astex Technology, 436 Cambridge Science Park,
Cambridge CB4 OQA, United Kingdom.[ Present address: ActiveSight, 4045 Sorrento Valley Blvd., San
Diego, CA 92121.O University of New Mexico.
1 Abbreviations: BCA, bicinchoninic acid; Ccm, cytochromecmaturation; rsC552, recombinant cytochromec obtained from theexpression of the chimericThermusVersutus/T. thermophilus cycAgenein E. coli cells also bearing plasmid pEC86;rC552, monomeric speciesof recombinant cytochromec obtained from the expression of thetruncatedT. thermophilus cycAgene inE. coli; p572, product obtainedfrom the spontaneous transformation ofrC552 at elevated temperaturesand characterized by aQ00 transition at 572 nm in the reduced form;rC557, minor species of recombinant cytochromec obtained from theexpression of the truncatedT. thermophilus cycAgene inE. coli andcharacterized by aQ00 transition at 557 nm in the reduced form and adisulfide-bridged dimeric structure; rR, resonance Raman.
12162 Biochemistry2004,43, 12162-12176
10.1021/bi048968l CCC: $27.50 © 2004 American Chemical SocietyPublished on Web 09/02/2004

In a number of cases, expression in theE. coli cytoplasmof truncated cytochromec genes (those lacking the code forthe signal peptide) yields an apocytochromec that foldsnormally and binds heme correctly (5-12). For example,the truncated gene forHydrogenobacter thermophiluscyto-chromec yields a protein with correct thioether linkages,apparently due to the correct proximity of protein thiol andheme vinyl entities, and proper folding (5-12). For othercytochromesc, however, cytoplasmic apocytochrome eitheris degraded or aggregates, and no holocytochromec isformed (13). In the case of the truncatedThermus thermo-philus cytochromec552 gene, expression inE. coli leads toincompletely or incorrectly formed versions of the proteinthat reveal novel heme-protein interactions.
The T. thermophiluscytochromec552 was first describedby Hon-Nami in 1977 (14). When its truncated structuralgene was placed under control of the T7 RNA polymerasepromoter in a plasmid borne byE. coli, the cells becamedistinctly red in color (15). This simple observation suggestedthe synthesis of abundant amounts of holocytochromec.Purification, however, yielded dimericrC557 and monomericcytochromerC552 (11) (see below). X-ray structure analysisyielded the novel findings thatrC557 is comprised ofcytochrome monomers in which the heme moeity is “flipped”about its R-γ axis, cysteine 14 has formed a thioetherlinkage with the 2-vinyl rather than the 4-vinyl group, the2-vinyl group remains unreacted, and a disulfide has formedbetween the monomers by oxidation of the two Cys11residues (16). This finding is important to the developmentof expression systems for cytochromesc.
Recently, there have been significant advances in thedevelopment of molecular genetic, expression systems forobtaining useful quantities of native-like cytochromesc.These are needed to address the roles of these proteins inenergy metabolism, mechanisms of electron transfer, proteincontrol of redox potentials, protein folding, apoptosis, etc.These and related efforts continue to be limited by theavailability of large quantities of native-like, recombinantproteins (see ref17 for discussion).
E. coli is a natural choice for the development of anexpression system. The first of these involved plasmid-directed expression of yeast (Saccharomyces cereVisiae)1-isocytochromec in the cytoplasm ofE. coli (10). Origi-nally, the 1-isocytochromec structural gene was tandemlyexpressed with the yeast cytochromec (heme) lyase geneand produced∼15 mg of mature 1-isocytochromec per literof culture medium. The material was spectrally identical tonative protein, but Lys72 was not trimethylated, as occursin yeast cells. A variation on this system (17), in which theyeast heme lyase gene was tandemly expressed with thestructural gene for horse heart cytochromec, gave yields ofnative-like protein as high as∼100 mg per liter of culturemedium. Unfortunately, the yeast heme lyase does notrecognize prokaryotic apocytochromesc (18).
An alternative expression protocol, though not as quan-titatively dramatic, has been to insert code for a signal peptideupstream of the cytochromec structural code, which leadsto transport of the pre-apocytochrome into theE. coliperiplasm. Coexpression of periplasm-directed Ccm factors,from an independently propagated plasmid (19), has beenfound to yield modest but useful amounts (≈1 mg per literof culture medium) of soluble, native-like cytochromesc
from Paracoccus denitrificans (20) andT. thermophilus(21).It has been noted that this system has a much broader rangeof acceptable pre-apoproteins (18).
None of these systems is perfect, however, and theirdevelopment continues. As noted by Rumbleyet al. (17),there are issues of folding traps, fidelity of heme insertion,and possibly incorrect chemical interaction of heme with theCXXCH residues. Our previous work on the expression ofthe truncated version of theT. thermophiluscytochromecgene showed that at least two “near” cytochromes actuallyform in the absence of assistance from maturation factors(11). Heme inversion (16) is now recognized as a commonerror of cytochromec synthesis in thein Vitro reaction ofheme with apocytochromesc (13, 22, 23) andin ViVo in thecase of the Lys8Gly mutant form of horse cytochromec (17),despite the presence of the heme lyase. It is reasonable thatknowledge of other, unexpected interactions between the twothiol groups of the apocytochromec and the two vinyl groupsof the heme, as reported here, is important for understandingcorrect cytochromec synthesis.
EXPERIMENTAL PROCEDURES
Recombinant Cytochromes.The cytochromec notation,origin, and defining properties are presented in footnote 1.Native-like cytochromec552, calledrsC552, was obtained asdescribed by Feeet al. (21). Monomeric, recombinantcytochromerC552, which is the starting material for this work,was prepared from aerobically grownE. coli cells asdescribed by Keightleyet al. (11) and freed of dimeric,recombinantrC557 as described by McReeet al. (16). Thep572 forms spontaneously from cytochromerC552 and canbe purified as follows. Approximately 5 mg of purifiedrC552
was exchanged into 50 mM sodium phosphate buffer at pH7.0 (solution A) and heated in a sealed Eppendorf tube at∼70 °C for 1 h. The protein was then loaded onto a 5 mL,cation-exchange column (Amersham-Pharmacia Mono S) anddeveloped as follows: 0-20 mL of 0% solution B, 20-60mL of 0-50% solution B, and 60-95 mL of 50-100%solution B. Solution B is solution A with 0.1 M NaCl.Fractions (1 mL) were collected. Most of the cytochromeelutes between∼15 and 35% solution B, although smallamounts of cytochrome elute throughout the elution profile.The pattern is variable from sample to sample and quitecomplex. Optical spectra of each fraction were recorded inoxidized and reduced states, and spectrally pure p572 wasusually found near 25 mL (25% solution B). Other fractionscontained mixtures of p572 andrC552. Fractions largely freeof rC552 were combined and concentrated for use in variousexperiments. Chromatography on a Vydac 201TP54 reverse-phase column under denaturing conditions shows a singlesharp band in the elution profile (see below). The chromo-phore is stable to the usual laboratory manipulation. BCAprotein analyses suggestεred
572 ) 22 400 M-1 cm-1, and thisvalue is used throughout to determine p572 concentration.
General Methods. Optical absorption spectra were re-corded on a SLM.AMINCO model DB3500 spectrophotom-eter in 1 cm cells. Fully oxidized proteins were obtained byadding potassium ferricyanide to a final concentration of 10µM, and reduced proteins were prepared by additions ofminute amounts of solid sodium dithionite to the opticalcuvette and thorough mixing. The reduced minus oxidizedextinction coefficient [∆ε ) 14.3 mM-1 cm-1 (14)] was used
Conversion of Heme IX to Protein-BoundSpirographisHeme Biochemistry, Vol. 43, No. 38, 200412163

to determine approximate concentrations ofrC552. Pyridinehemochromes were prepared according to the method ofBerry and Trumpower (24). The level of protein wasmeasured by the BCA protein assay kit of Pierce accordingto manufacturer’s directions. Cytochromec oxidase activity,using Thermuscytochromeba3 purified by the method ofKeightley et al. (25), was determined polarographically at25 °C using an Instech (Plymouth Meeting, PA) unit withoutput to a strip chart recorder.
X-ray Crystallography. Crystals ofrC552 (4 °C) and p572(room temperature), being isomorphous with those ofrsC552,were obtained in sitting drops against 36% MPEG 5K (w/w), 0.2 M imidazole malate buffer (pH 6.3) using∼12 mg/mL protein suspended in 25 mM Tris-HCl (pH 8.0) and 100mM NaCl (see ref21). Cryoprotection of crystals wasachieved by transferring them to mother liquor supplementedwith 20% glycerol. Diffraction data were collected at 100 Kat the Stanford Synchrotron Radiation Laboratory (SSRL)to a resolution of 1.41 Å forrC552 and 1.61 Å for p572 (seeTable 1). The primary data were processed using MOSFLM(26), scaled, and further reduced using the CCP4 suite ofprograms (27) (see Table 1). Initial electron density mapswere generated using the native and recombinant structures(21, 28) (PDB entries 1C52 and 1DT1) and interpretedfurther using XtalView (29). The model was refined insuccessive rounds using SHELXL (30, 31) with a test set of5% randomly chosen reflections being used to calculateRfree
at each stage. X-ray amplitudes, phases, and derived atomiccoordinates have been deposited with the Protein Data Bank(PDB entry 1QYZ forrC552 and PDB entry 1ROQ for p572).Heme atoms are referenced in both PDB notation and thatfound in Falk (32).
Protein Chemistry. Pepsin digestion was carried out witha 2 mg/mL stock pepsin solution in 5% formic acid accordingto the methods of Smyth (33). Holocytochromec (0.78 mg)
was dissolved in 0.66 mL of 5% formic acid, and a pepsin(CalBiochem) solution was added to a final w/w ratio of10:1. This mixture was incubated at 37°C for 22 h followedby drying with in Vacuocentrifugation. The dried sampleswere redissolved in 0.1% TFA in water and applied to aVydac 201TP54 column, and a 5 to 65%acetonitrile gradient,in the presence of 0.1% TFA, was used to elute the peptides.The eluant was monitored at both 400 and 214 nm, and theheme-containing peptide was subsequently characterized bymass spectrometry. It is noteworthy that these compoundsare unstable and decompose over the course of a few weekseven when dry at-20 °C.
Mass Spectrometry. Electrospray mass spectrometry ofproteins was carried out at the Scripps Research Center forMass Spectrometry (La Jolla, CA) using a Perkin-Elmer API100 Sciex single-quadrupole mass analyzer with the orificepotential set at 100 V. Mass spectra were obtained from ionspectra using the Perkin-Elmer program BioMultiView.MALDI-TOF experiments were carried out using a PerSep-tive spectrometer. Matrix-assisted laser desorption/ionization(MALDI) FTMS experiments were performed on an IonSpecFTMS mass spectrometer (see ref34).
CD Spectroscopy.Samples of oxidizedrC552 or rsC552 forcircular dichroism (CD) spectroscopy were 10µM in protein(for far-UV spectra) or 100µM in protein (for Soret regionspectra) in 100 mM potassium phosphate buffer (pH 7.0).CD spectra were recorded on a JASCO J-710 spectropola-rimeter at 22°C on samples in a quartz cell with a path lengthof 0.1 cm.
Resonance Raman. Spectra were obtained using a customMcPherson 2061/207 spectrograph (focal length of 0.67 mwith a 2400 groove/mm grating), a Princeton Instrumentsliquid N2-cooled (LN-1100PB) CCD detector, and a KaiserOptical holographic super-notch filter. Excitation (413 nm,5 mW) came from a Coherent Innova 302 Kr laser. Spectracollected in a 90°-scattering geometry for 5 min at roomtemperature were obtained from 10µL samples [proteinconcentration of 20-30µM in 100 mM Tris-HCl buffer (pH8)] in glass capillaries. Frequencies, accurate to 1 cm-1, werecalibrated relative to indene. Princeton Instruments’ WinSpecsoftware was used for data acquisition. Exported ASCII-xyfiles were analyzed using GRAMS-386 software (GalacticIndustries).
NMR Spectroscopy.Protein samples for1H NMR spec-troscopy were 0.25-1.5 mM in protein in 100 mM potassiumphosphate (pH 7.0) in 90% D2O. Samples were oxidized witha 3-fold excess of potassium ferricyanide and concentratedusing a Centricon-10 device prior to data collection. NMRspectra were collected on a 500 MHz Varian INOVAinstrument at 25°C and using a recycle time of 250 ms.Spectra were processed with 30 Hz line broadening.
Electrochemistry. Electrochemical experiments were car-ried out in a three-compartment cell using a BioanalyticalSystems (BAS) model CV 50W electrochemical analyzer.The gold-disk working electrode was polished with 0.05µmaluminum oxide (Buehler), thoroughly rinsed, and thenchemically modified by sonication for 30 min in a 0.05 mMaqueous solution of pyridine 4-aldehydesemicarbazone.Potentials were measured versus a standard calomel elec-trode. The reference electrode was separated from theworking compartment by a Luggin capillary. Data wererecorded at a pyridine 4-aldehydesemicarbazone-modified
Table 1: Data and Refinement Statistics for RecombinantThermusCytochromesrC552 and p572a
p572 rC552
X-ray wavelength (Å) 0.978 0.92017SSRL beamline 9-1 9-1no. of reflections 126687 80045no. of unique reflections 17825 31680Rmerge(%) 8.5 (30-1.61 Å
resolution)6.6 (30-1.41 Å
resolution)Rmerge(%) 42.0 (1.64-1.61 Å
resolution)35.6 (1.45-1.41 Å
resolution)completeness (%) 98.9 (30-1.61 Å
resolution)94.3 (30-1.41 Å
resolution)completeness (%) 98.9 (1.65-1.61 Å
resolution)98.6 (1.45-1.41 Å
resolution)multiplicity 7.1 5.5I/σi 7.7 (30-1.61 Å
resolution)5.5 (30-1.41 Å
resolution)I/σi 2.2 (1.65-1.61 Å
resolution)2.1 (1.45-1.41 Å
resolution)R-factor (I > 4σ) (%) 17.1 17.8R-factor (I > 0) (%) 18.7 19.7Rfree (I > 4σ) (%) 23.0 23.5Rfree (I > 0) (%) 25.5 26.0rmsd for bonds (Å) 0.01 0.015rmsd for angle distances (Å) 0.02 0.025
a The space group isp65. R ) 90°. â ) 90°. γ ) 120°. For rsC552,a ) b ) 86.90 Å andc ) 31.85 Å. ForrC552, a ) b ) 87.46 Å andc ) 32.21 Å. For p572,a ) b ) 86.77 Å andc ) 31.84 Å.
12164 Biochemistry, Vol. 43, No. 38, 2004 Feeet al.

gold electrode with a scan rate of 25 mV/s. Both native andrecombinant cytochromes gave linear plots of peak currentversus (scan rate)1/2, consistent with a diffusion-controlledprocess. Approximately 20% of therC552 sample wasconverted to p572 (as confirmed by visible spectroscopy),resulting in a shoulder in the voltammogram at∼325 mV.The protein concentrations were∼0.3 mM for p572 and the1:1 rC552/p572 mixture, and∼1 mM for rsC552 in 100 mMpotassium phosphate buffer (pH 7).
RESULTS
Formation and Purification of p572
The as-isolatedrC552 spontaneously converts to a materialhaving an absorption band at 572 nm unless maintained atcold-room temperatures. This occurs upon standing at roomtemperature for several days or by heating at elevatedtemperatures for a few minutes. Addition of ferricyanidecauses this peak to disappear, and subsequent addition ofdithionite results in reappearance of the 572 nm band as wellas a significantly attenuated 552 nm band. Additionalexperiments revealed that neither dioxygen nor light isrequired and that one-electron, reducedrC552 was convertedto p572 with equal efficiency (not shown). Figure 1A showsthe UV (left panel) and visible (right panel) optical absorptionspectra of purifiedrC552 in the oxidized (traces i, dotted line)and reduced (traces i, solid line) states. Formation of p572was started with fully oxidizedrC552 by heating for 30 minat 70°C.2 After heating had been carried out, the spectrumchanged to that shown as the thick solid line in Figure 1A(trace ii). Addition of a slight molar excess of ferricyanideyielded the bottom dotted line in Figure 1A (traces iii), andsubsequent addition of excess dithionite gave the bottom solidline in Figure 1A (traces iii), indicating a mixture of reducedrC552 and reduced p572. These observations suggest thatsome portion of the as-isolatedrC552 spontaneously convertsto a new form of iron porphyrin. Appearance of the reducedform of p572 probably results from the presence of spuriousreductants in the solution rather than reduced p572 being amechanistic requirement (see below). Such behavior has beenobserved in other high-potential metalloproteins (35).
It is possible to purify p572 from the remainingrC552 bycation exchange, possibly because only the p572 is in theone-electron reduced form and therefore has a differentoverall charge than the residual cytochromesc (see ref36);details are provided in Experimental Procedures. With thistechnique, we prepared∼1 mg quantities of pure p572 forcharacterization. Evidence of purity includes a single peakon reversed-phase liquid chromatography, a single band uponsodium dodecyl sulfate-polyacrylamide gel electrophoresis
(data not shown), electrospray mass spectrometry (seebelow), and formation of single crystals suitable for X-raycrystallographic studies (see below). To quantify p572, wedetermined that the 572 nm absorption band has a molarabsorbanceεred
572 of =22400 M-1 cm-1 (see ExperimentalProcedures). Table 2 lists relevant absorption bands andavailable extinction coefficients for the different proteins usedin this study. These preliminary observations suggest thatp572 is a modified cytochromec that retains electron transfercompetency.
Figure 1B shows optical absorption spectra of purified,oxidized, and reduced p572, and Table 2 lists quantitativedata. The spectrum of the oxidized form differs little fromthat of oxidized rC552, whereas the reduced protein issignificantly different. The shift of theQ00 transitions tolower energy in p572 would be consistent with the presenceof a carbonyl or Schiff base coupled to the porphyrinπ-system, as occurs in heme A-containing proteins (refs37and38 and references therein). Hints of this came with the
2 The appearance of the 572 nm band is complete in∼3 min underthese conditions and requires neither light nor air. A fairly extensivestudy of the effect of temperature and pH on the conversion ofrC552
to p572 revealed the following. At pH 7.2 and 70°C, the conversionis first-order over several half-times of the reaction;kobs∼ 30 s-1. Theconversion fraction, moles of p572 per initial moles ofrC552, is ∼0.3and is independent of temperature. The activation energy (Ea) for thisreaction is∼25 kcal/mol, accounting for the slowness of the reactionat cold-room temperatures. The ratio of p572 to startingrC552 is stronglypH dependent, being zero at pH 6,∼0.3 at pH 8.3, a maximum of∼0.5 at pH 10, and zero at pH 13. Thus, a higher pH favorsrC552-to-p572 conversion, suggesting the possible involvement of a catalyticbase.
FIGURE 1: (A) Effects of heating on the optical absorption spectraof recombinantT. thermophiluscytochromerC552. The Soret regionis shown in the left panel and the visible region in the right panel(5-fold vertical expansion). Sets of traces relating to a singleexperiment are offset to accommodate all spectra in one presenta-tion. (i) Oxidized (- - -) and reduced (s) spectra of the as-isolatedcytochromerC552. A small amount of p572 is already evident inthis sample. (ii) Spectrum after heating the oxidized form of as-isolatedrC552 for 30 min at 70°C and cooling to room temperature.(iii) After heating, the solution having the spectrum shown in traceii was treated with a small molar excess of ferricyanide to obtainthe oxidized spectrum of the heated solution (- - -). An excess ofsodium dithionite was subsequently added to obtain the reducedspectrum (s) of the heated solution, which reflects a mixture ofrC552 and p572. The pH was 8.0 in a 50 mM Tris-HCl buffercontaining 0.1 M NaCl. (B) Optical absorption spectra of purifiedp572. The Soret region is shown in the left panel and the visibleregion in the right. The oxidized spectrum (- - -) was obtained inthe presence of a small excess of ferricyanide, and the reducedspectrum (s) was obtained by subsequently adding a small excessof dithionite. The concentration of the sample was∼5 µM. SeeTable 2 for the visible region extinction coefficient.
Conversion of Heme IX to Protein-BoundSpirographisHeme Biochemistry, Vol. 43, No. 38, 200412165

qualitative observations that treatment with excess hydrazine,borohydride, or cyanoborohydride (see ref39and referencestherein) shifted the 572 nm absorption band to∼550 nm(data not shown).
Mass Spectrometry
Mass spectral studies provided the first clue to the originof the new chromophore. Figure 2 shows electrospray massspectra of rC552 (top) and purified p572 (bottom). Theexpected mass of the recombinantrC552 is 14 862 Da (11).Instead, we observe three components as described previ-ously (11). The top spectrum shows a dominant peak at14 893 Da, a second, weaker peak at 14 875 Da, and, atsimilar intensity, the expected peak at 14 862 Da. (The originof the smallest peak, at∼14 848 Da, is not known.) p572shows a major peak at 14 875 Da, corresponding to thecentral peak observed withrC552, and minor peaks at 14 862and 14 893 Da. Given that the uncertainties in the experi-mental masses are approximately(2 Da, the dominantfeature ofrC552 is the presence of an unexpected, additionalmass of (14 893 Daminusthe constant 14 862 Da)∼31 (2 Da. Similarly, p572 contains an additional (14 875 Daminus 14 862 Da)∼13 ( 2 Da. These data are broadlyconsistent with the presence of two additional O atoms inrC552 and one additional O atom in p572, not consideringloss of protons (see below).
The availability of relatively small amounts ofrC552 (15)and even smaller amounts of p572 obviated large-scaleisolation and heme extraction from the protein, as has beendone with other cytochromesc (see refs40 and 41, forexample). Therefore, to further characterize the modifiedheme, we degraded holoprotein with pepsin followed byhigh-resolution mass spectrometry of chromatographicallypurified, heme-containing peptides (see Experimental Pro-cedures). The heme peptide prepared fromrsC552 is expectedto have the amino acid sequence Ala-Gln-Cys-Ala-Gly-Cys-
His-Gln-Gln-Asn-Gly-Gln-Gly-Ile-Pro-Gly-Ala-Phe with theheme attached to the two cysteine residues via thioether links.The monoisotopic mass of the singly protonated form of thisentity is 2402.96 Da, while the isotopically averaged massis 2404.49 Da. Additional data are presented in the Sup-porting Information (Table 1-SM) and lie within the errorlimits of these predicted values, thus confirming its structure.By contrast, heme peptide isolated from p572 by the sameprocedure and subjected to identical treatment shows masses12-13 Da greater3 (Table 1-SM). The mass spectral datathus impose an important boundary condition on the possiblechemistry by whichrC552 converts to p572, namely, that therecan be no further addition of, e.g., O atoms (see Discussion).
Crystallographic Characterization of rC552
Crystals of rC552 were grown at 4°C to minimizeconversion to p572 (see Experimental Procedures), mountedon nylon loops, flash-frozen, and transported to SSRL atliquid nitrogen temperature. After data collection at 100 K,one crystal was dissolved into a minimum volume of bufferat ice temperature. The optical absorption spectrum of thedissolved protein registered the complete absence of either552 or 572 nm bands, indicating no significant reduction orconversion of heme had occurred while in the X-ray beam.Once this solution had been heated for a few moments, astrong band appeared at 572 nm, indicating that factors vitalto the conversion ofrC552 to p572 were retained during thecrystallographic experiment (not shown).
The structure ofrC552 was determined at a resolution of1.41 Å (Table 1), and coordinates and structure factors havebeen deposited with the Protein Data Bank (entry 1QYZ).The overall structure is generally similar to that of nativecytochromec552 (PDB entry 1C52) or native-like, recombi-nantrsC552 (PDB entry 1DT1); see Figure 3A. Differencesbetween the structures of nativec552 and p572 exist in thelysine rich region from Lys95 to Lys101, where the electrondensity map of the latter does not permit the main chain tobe traced. Similar disorder was reported for the native-likersC552 structure (21), and in therC552 structure, the chaincould not be traced from Val97 through Gly99. These
3 We have not attempted to isolate a heme peptide fromrC552 becauseof the likelihood that it would spontaneously convert to p572 duringthe experiment.
FIGURE 2: Electrospray mass spectra of recombinant cytochromerC552 and p572 dissolved in 10 mM ammonium acetate and freedfrom Na+ ions by gel filtration. CytochromerC552 exhibits peaksat 14 862, 14 875, and 14 893 Da, while p572 exhibits a very weaksignal at 14 862 Da, a dominant signal at 14 875 Da, and a veryweak signal at 14 893 Da. Spectra were recorded as described inExperimental Procedures.
Table 2: Optical Absorption Properties of the Cytochromes Used inThis Study
peak Soret (nm) â (nm) R (nm)
nativec552 409oxidized 417reduced 525 552reduced 21100a
reduced minus oxidized 14300a
rC552
oxidized 410reduced 417 522 552reduced minus oxidized 12200a
p572oxidized 416reduced 430 537 572reduced 22400a
reduced minus oxidized 13200a
a ε, ∆ε (M-1 cm-1).
12166 Biochemistry, Vol. 43, No. 38, 2004 Feeet al.

differences were previously attributed to differences inintermolecular packing in the different crystal types ratherthan real differences in structure and are not discussedfurther. It is also noteworthy that the heme and the axialligand positions do not differ significantly from those in thenative structure.
There are significant structural differences in the regionof heme ring I and nearby residues, Gln10, Cys11, Ala12,and Gly13, within which Cys11 lies∼3 Å farther from theheme than in the native structure (see Figure 3B). On eitherside of this stretch of the polypeptide, the structure of theprotein is highly similar to that of the native protein.Particularly important is the normal thioether linkage betweenCys14 and the 4-vinyl group of heme ring II and coordinationof the His15 Nδ and Met69 Sγ atoms to the heme iron. Bycontrast, the electron density shows an abnormal thioetherlinkage among ring I, 2-vinyl, and Cys-11. This is evidentin the experimental electron density (as an “omit” map inwhich Cys11 is replaced by Gly at position 11) of this region(see Figure 4), and the model is consistent with a CO-CH2-S-CH2 bridge between the heme and cysteine 11. Here wehave superimposed an|Fo| - |Fc| map on an atomic modelthat accounts for the experimental structure factors; the metricfeatures of the bridge are summarized in footnote 4. Efforts
to fit the observed electron density with that expected froma CA peroxide adduct (42) were unsuccessful because thehydrophobic side chain of Phe72 occupies the only spaceavailable for the second O atom of a peroxide. It is possiblethat the Phe72 side chain is not properly folded against theheme during the collapse of the protein about the heme.
A search of the literature revealed that this arrangementof atoms has been found previously in nature as ethylthio-propan-2-one (43) and has been synthesized on a fewoccasions (refs44-46and references therein), although littleis known about its chemical reactivity. Assembled within asteroid-like compound, an X-ray structure has been deter-mined (46; Cambridge Crystallographic Structure Database
4 The electron density map ofrC552 shows no evidence of a partialoccupancy from native-like material in which a normal CA thioetherlinkage occurs at 2-vinyl. Metric features of the bridge: heme 2-CA
distance) 1.44 Å, CA-O distance) 1.44 Å, CA-CB distance) 1.61Å, CB-Sγ of cysteine 11 distance) 2.12 Å, Sγ-Câ of cysteine 11distance) 1.82 Å, and Câ-CR distance) 1.53 Å (approximate errorsof (0.05 Å). The angles starting from heme 2 are as follows: 119.2°for heme 2-CA-CB, 93.1° for CA-CB-Sγ, 123.2° for CB-Sγ-Câ,and 115.4° for Sγ-Câ-CR. The torsion angles starting from heme 2are as follows:-172.1° for heme 2-CA-CB-Sγ, 64.6° for CA-CB-Sγ-Câ, and 87.6° for CB-Sγ-Câ-CR. Approximate errors in anglesare(2°.
FIGURE 3: Stereoview (wall-eye) showing overlapping structures of nativerC552 and p572. (A) The complete native (rsC552) structure isshown as a blue ribbon overlapped with that ofrC552 as a red ribbon. Proteins were aligned on the basis of their heme positions. Thisstructure contains the heme-to-cysteine 11 bridge as a ball-and-stick model. Significant differences between the protein structures are seenonly in the region of residues 10-13. (B) Overlapping ribbon structures (N-terminus to Cys14) ofrsC552 (red), rC552 (blue), and p572(yellow). The small colored balls correspond to the positions of the cytsteine 11 CR atom in each structure. The program RIBBONS recognizesresidues 11-15 in rC552 and residues 9-15 in p572 asâ-turn and coil rather thanR-helix as inrsC552. The Fe-to-cysteine 11 CR distancesare 6.51 Å forrsC552, 8.92 Å for rC552, and 8.92 Å for p572.
Conversion of Heme IX to Protein-BoundSpirographisHeme Biochemistry, Vol. 43, No. 38, 200412167

reference number 177055), which is quite similar to thatreported above except for a significantly different CB-Sγ-Câ-CR torsional angle (-117.96° vs +87.6°).5
The proposed bridging structure would not, at first sight,be expected to be very reactive. Indeed, this arrangement ofatoms is apparently stable at room temperature in water andin brine, as noted (46). However, withinrC552, it appears tobe quite reactive and can be converted to p572, as notedabove.
To account for formation of the bridge, we suggest thatthe Sγ atom of Cys11, as either a thiolate or a thiyl radical,reacts with CB of the 2-vinyl group with subsequent reactionsinvolving O2 yielding a CA-peroxo intermediate whichdecays to the bridge structure observed in the crystal. SeeScheme 1 in the Discussion.
Crystallographic Characterization of p572
Crystals of p572, isomorphous with those ofrC552, weregrown at room temperature and diffracted to 1.61 Å (PDBentry 1ROQ) (Table 1). The general structure is very similarto that of native (1C52) and native-like, recombinantrsC552
(1DT1). In this case, the crystal was not examined for one-electron reduction in the X-ray beam.
As in the case ofrC552, outside of the amino acid sequenceregion of residues 10-13, there are no significant differencesbetween p572 and the native cytochromec structure. As withrC552, p572 contains a normal thioether linkage betweenCys14 and the 4-vinyl group of heme ring II. However,important differences, relevant to the distinguishing proper-ties of p572, occur at the 2-vinyl on heme ring I and in theregion of Gln10, Cys11, Ala12, and Gly13 compared withboth native andrC552 structures. Indeed, the polypeptidechain in this region is very similar to that ofrC552 (see Figure3B). Figure 5A shows an “omit” (|Fo - Fc|) map of the spaceabout heme ring I and Cys11. A carbonyl group accountsfor the portion of the difference map near the heme, likely
formyl, lying approximately within the plane of the porphyrin(Figure 5B); there appears to be a weak connection between2-vinyl CA and Cys11 in p572, suggesting some heterogene-ity in the p572 reaction product. The electron density mapin the region of cysteine 11 is dominated by two large peaksevidently due to disorder of the cysteine 11 Sγ atom. A singleround of refinement of the structure using REFMAC5, aspart of the CCP4 suite of programs (27), suggested the twopeaks could be modeled with relativeSoccupancy of∼0.65and∼0.35. This accounts for the large peaks of density butleaves some 4σ positive difference density near the smallerof the two S peaks (not shown). Thus, we were unable tomodel the difference data satisfactorily with two conforma-tions of Cys11 using normal torsion angles. This residualerror may reflect the presence of the putative thiirane CH2
atoms, although it is not sufficiently defined to attempt a fitusing anR/S mixture of cysteine 11 thiiranes (see below).The Gln10, Cys11, Ala12 region is not well fit by the currentmodel, perhaps because of structural heterogeneity. For thesereasons, it is important not to overinterpret the observedelectron density in this region (see the Discussion).
Spectral Characterization of rC552 and p572
The spectral properties of these aberrant cytochromescshould support the proposed crystallographic structures.Accordingly, we have examinedrC552 and p572 by UV-visible optical absorption, circular dichroism, rR, and high-frequency1H NMR spectroscopies.
Optical Absorption Spectra.Spectra shown in Figure 1that arise from the low-spin, Fe(II) versions of the particularcytochromesc are generally known to arise fromπ-π*transitions of the porphyrin macrocycle. Details, includingwavelength and intensities, of these transitions are influencedby, and therefore carry information about, porphyrin sidechains, the nature of the ligands on the heme iron, and theenvironment within the protein (cf. refs32 and47-50). Forexample, in native and native-like cytochromesc552 andrsC552, respectively, theQ00 transition is split into twotransitions resulting from perturbations that lower thenormally D2h symmetry of the porphyrin and lead thenormally degenerate eg levels to assume different energies(51-53). Indeed, the similarity of spectral splitting in theseproteins indicates their structural identity (21). A strongindication thatrC552 is structurally different from the native-
5 The analogous distances in (S)-6R,9R-difluoro-11â-hydroxy-16R,17R-isopropylidenedioxy-21-(2-oxotetrahydrofuran-3-ylsulfanyl)-pregna-1,4-diene-3,20-dione (46) are as follows: 1.53 Å for C17-C20,1.23 Å for C20-O5, 1.46 Å for C20-C21, 1.79 Å for C21-S1, 1.79 Åfor S1-C22, and 1.52 Å for C22-C25. The corresponding angles are asfollows: 118.53° for C17-C20-C21, 118.24° for C21-C21-S1, 103.43°for C21-S1-C22, and 109.62° for S1-C22-C25. The correspondingtorsional angles are as follows:-166.75° for C17-C20-C21-S1,-70.00° for C21-C21-S1-C22, and-171.96° for C21-S1-C22-C25.
FIGURE 4: Stereoview (wall-eye) of an omit map (|Fo| - |Fc|) of the Cys11-heme ring I region inrC552, including a model derived fromScheme 1. Heme atom C3B, 2-vinyl atoms CA and CB, and cysteine 11 atoms Sγ, Câ, and CR were omitted from the electron densitycalculation. The model corresponds to the proposed CO-CH2-S-CH2-CR structure made up of the original 2-vinyl atoms and those of cysteine11. Contour levels: blue for 3σ and red for 5σ.
12168 Biochemistry, Vol. 43, No. 38, 2004 Feeet al.
like protein is the apparent absence ofQ00 splitting in rC552
(see Figure 8 of ref11).The dramatically shiftedγ and Q00 bands of p572 (see
Table 2) indicate a structural change affecting the energylevels of A1u, A2u, and possibly eg. It is well-known thatelectrophilic side chains such as vinyl and formyl cause thevisible and Soret bands to shift to longer wavelengths (54,55). The pyridine hemochromogen spectrum of p572 has apeak at∼581 nm, which is essentially identical with that of2(4)-formyldeutero IX porphyrin (32) and slightly lower inenergy than that of heme A6 (24). This provides rather strongevidence for the presence of a monoformyl porphyrin that,because of the Cys14-4-vinyl thioether link, also does nothave a vinyl group. Note that optical spectra would likelynot distinguish the following possible bridging structures inrC552: (a) the CdO group is orthogonal to the plane of theheme, (b) the CA had reacted with a hydrogen atom asopposed to O2 to form CH2 at CA (see below), and (c) ansp3 CA atom bearing a hydroperoxide group.
CD Spectroscopy.As shown in the Supporting Information(Figure 1SM), the far-UV CD spectrum ofrsC552 displaysminima at 208 and 222 nm, as expected for a protein witha high R-helical content. The spectrum ofrC552 also hasminima at 208 and 222 nm, but with intensities significantlylower than those observed forrsC552 (panel A of Figure
1SM). This may reflect the slightly lowerR-helical contentin rC552 that can be seen in the structure (Figure 3A,B). TheCD spectrum ofrsC552 in the Soret region displays a largepositive band at 405 nm and a small negative band at 417nm, whereas the Soret CD spectrum of purifiedrC552 haspositive (403 nm) and negative (417 nm) bands withintensities similar to each other (panel B of Figure 1SM).The positive Soret CD band ofrC552 is significantly lowerin intensity (by a factor of 2) than that forrsC552. The CDspectrum in this region arises from protein-induced deforma-tion of the heme (56) and from the interaction of the hemewith aromatic groups in its vicinity (57). Although small,these shifts nevertheless demonstrate that the local hemeenvironment inrC552 is significantly perturbed. The lowerintensities inrC552 may indicate the presence of substantialstructural heterogeneity in the molecule, or as suggested byWittung-Stafshede (58), newly isolatedrC552 may have theproperties of a “molten globule”.
Raman Spectroscopy. Resonance Raman (rR) spectra (59)have been reported for native cytochromec552 (60, 61) andnative-like, recombinantrsC552 (21). We present spectra ofoxidized and reduced forms of cytochromesrsC552, rC552,and p572. Table 3 summarizes the normal-mode frequencies(62) that we have assigned. Primary spectra are shown inFigure 6 and Figures 2SM-5SM of the Supporting Informa-tion.
The data for the recombinantrsC552 are indistinguishablefrom those of native cytochromec552 published previously
6 Note that heme A, which has one formyl and vinyl group each,has its pyridine hemochrome maximum at∼586 nm (24).
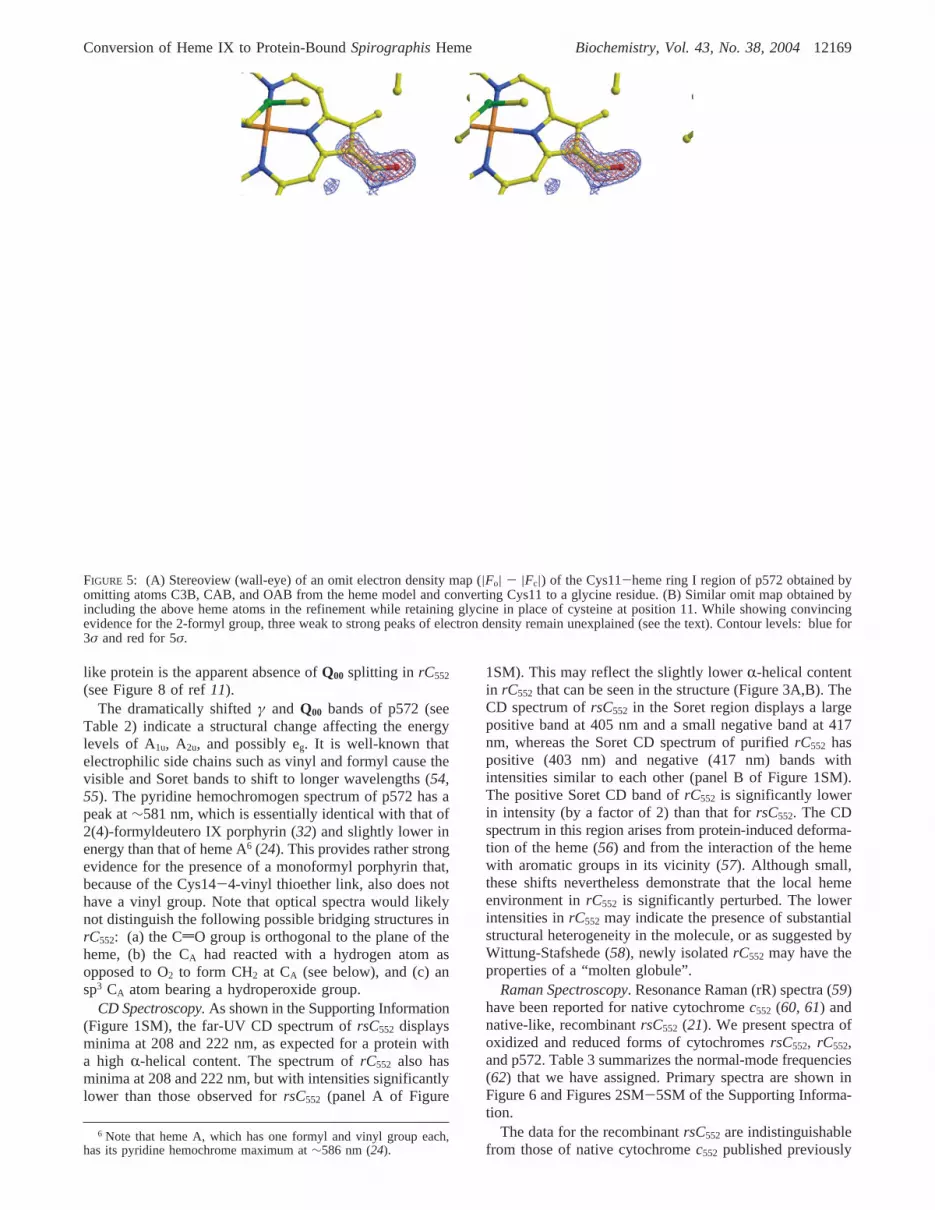
FIGURE 5: (A) Stereoview (wall-eye) of an omit electron density map (|Fo| - |Fc|) of the Cys11-heme ring I region of p572 obtained byomitting atoms C3B, CAB, and OAB from the heme model and converting Cys11 to a glycine residue. (B) Similar omit map obtained byincluding the above heme atoms in the refinement while retaining glycine in place of cysteine at position 11. While showing convincingevidence for the 2-formyl group, three weak to strong peaks of electron density remain unexplained (see the text). Contour levels: blue for3σ and red for 5σ.
Conversion of Heme IX to Protein-BoundSpirographisHeme Biochemistry, Vol. 43, No. 38, 200412169

(21, 60) (see Figures 2SM and 3SM, dotted lines). Moreover,these spectra are also very similar to those of yeastcytochromec (63). The comparison is obvious for the spectraof oxidized adducts all recorded at room temperature.However, the spectra of reduced yeast cytochromec in thestudy by Huet al. (63) were recorded at 12 K, affordinggreater resolution and frequencies∼4-9 cm-1 higher thanthose obtained at room temperature. Given this, the rR spectraof ferrocytochromersC552 and yeast ferrocytochromec arequite similar, confirming the similar chromophores andimmediate protein environment in these homologous proteins.
As shown in Table 3, normal-mode frequencies (62) ν10,ν19 (observed with visible excitation), and, to a lesser extent,ν3 are essentially unchanged forrsC552, rC552, and p572,confirming identical spin and coordination states of thecentral Fe in both oxidation states of all three cytochromes.Also similar are theν4 frequencies, which are useful inidentifying the Fe oxidation state. On the other hand,frequencies of modes involving the periphery of the por-phyrin and its substituents, that is,ν2 and ν11, showdifferences ranging from 8 to 20 cm-1, consistent withchanges in the heme periphery, in both oxidized and reducedadducts, among the three species.
Regardless of oxidation state or excitation wavelength, therR spectra ofrsC552 and rC552, compared in Figures 2SMand 3SM of the Supporting Information, are quite similar.This implies that little overlap occurs between the carbonylgroup of the bridge and the hemeπ-electron system inrC552.As noted above, the observed∼70° angle between thecarbonyl and heme planes is sufficiently close to orthogonalto prevent conjugation and resonance enhancement ofcarbonyl vibrations in the rR spectrum ofrC552 (64-68).This explains the overall similarity to that of spectra ofrC552
and rsC552, despite their significant structural differences.Our spectra confirm identical axial ligation in all three
adducts but demonstrate differences in the peripheral sub-stituents. The low-frequency feature at 412 cm-1 in thespectrum of oxidizedrsC552 increases in frequency to 418cm-1 and decreases in intensity in the spectrum of oxidizedrC552 (Figure 3SM of the Supporting Information, trace A).Similar differences are noted in the spectra of the reducedadducts (Figure 3SM, trace B). This feature is assigned tothe CâCACB bending motion of the covalent Cys linkages(63). The intensity decreaseis consistent with the crystal-lographic data. That is, as the CAdO group is held roughlyorthogonal to the heme plane in therC552, the CB positionand the vibrational bending motion itself are forced out ofplane and are no longer resonance-enhanced in the spectrumof rC552. Similarly, the increased frequencyof the bend isconsistent with the greater s character of CA and, hence,
Table 3: Resonance Raman, Normal-Mode Frequencies (cm-1) of T. thermophilusRecombinant CytochromesrsC552, rC552, and p572
oxidizeda reduceda
normal mode rsC552 rC552 p572 rsC552 rC552 p572
νCdO none none 1666 none (1643d) 1645ν10 1633a 1632 (1636b) 1633 (1635b) 1622 1622 (1622b) 1621 (1623b)ν38 - - - 1606 1606 1606ν2 1584 1584 1576 1588 1585 1579ν19 nrc 1586b 1585b nrc 1586b 1587b
ν11 1557(?) ∼1560 - 1541 1557 ∼15601558b 1554b 1541b/1558b 1553b
2ν15(?)e - - - nrc 1518b 1513b
ν3 1503 1503 1500 1491 1491 1490ν4 1371 1371 1370 1359 1359 1358ν13 1236 1235 nrc 1228 1228 nrc
ν15 747 746 nrc 749 747 nrc
νCA-Sf 691 688 nrc 689 685 nrc
δCâCACB 412 418 nrc 414 weak nrc
γ22 440 - nrc 440 - nrc
δCâCCCD (propanoate) 377 377 nrc 378 377 nrc
ν8 345 346 nrc 345 346/354 (?) nrc
a Unless noted otherwise, the excitation wavelength was 413 nm.b Excitation wavelength of 568 nm.c Not recorded.d Arises from contaminatingp572.e Assignment uncertain. Huet al. (63) assign a similar feature in the spectra of yeast cytochromec to this overtone, but the frequency weobserve here is not double theν15 frequency.f Assignment for yeast protein andrsC552 (63). The normal mode necessarily changes in the modifiedlinkage of rC552.
FIGURE 6: Resonance Raman spectra ofT. thermophilusrecom-binant cytochromerC552 and p572 in the high-frequency regionobtained with Soret band excitation at 413 nm at room tempera-ture: (A) oxidizedrC552, (B) reducedrC552, (C) oxidized p572,and (D) reduced p572. The typical sample concentration is 20-30µM, with a 2400 groove/mm grating; the entrance slit was set to150 µm, and data were accumulated over a period of 5 min. Allspectra were recorded at room temperature, and the typical sampleconcentration was 20-30 µM in 100 mM Tris-HCl buffer (pH 8).Additional spectra are provided in the Supporting Information.
12170 Biochemistry, Vol. 43, No. 38, 2004 Feeet al.

strengthened C-C bonds in the ring I-cysteine 11 linkageof rC552 compared torsC552. On the other hand, the weakerfeature at∼377 cm-1, attributed to a bending motion of thepropionate groups, remains unchanged in all spectra, reflect-ing the fact that the structural variations in the hemeperiphery are confined to the covalent linkages with theprotein.
The high-frequency rR spectra of oxidized and reducedrC552 (Figure 6, traces A and B, respectively) and oxidizedand reduced p572 (Figure 6, traces C and D, respectively),all obtained with 413 nm excitation, are shown in Figure 6.The rR spectra of p572 are clearly distinct from those ofc552proteins and yeast cytochromec, reflecting the movementof the carbonyl group into the overall heme plane. The strongfeature at 1645 cm-1 corresponds to a “formyl” stretch, andis known only in A-type hemes (69), theSpirographishemes(70), and photosynthetic pigments having a formyl substituent(71). This feature confirms the presence of a formyl groupand provides further support that it is conjugated andtherefore coplanar with the porphyrin ring (64-68). Like-wise, a weaker feature at approximately 1666 cm-1 in thespectrum of oxidized p572 is also assigned to the formylCdO stretching mode (Figure 6, trace C, not labeled). Boththe frequency decrease and intensity increase upon reductionare readily interpretable and consistent with those observedfor the a3 formyl groups of cytochromesaa3 (69, 72) andba3 (73). Indeed, the frequency of the strong 1645 cm-1
feature is low relative that of analogous A-type cytochromes(57), consistent with its position on the heme. Indeed,Tsubaki et al. (70) demonstrated that this frequency issensitive to the formyl position on asymmetrically substitutedhemes and that a formyl substituent on the C2 position of aferrous myoglobin derivative resulted in a frequency of 1648cm-1 compared to the frequency of 1660 cm-1 observed froma C4 formylated derivative. Thus, the 1645 cm-1 frequencyis evidence of a conjugated formyl group on C2 of ring I, assupported by the crystallographic results.
NMR Spectroscopy.Paramagnetically shifted heme methylresonances reveal important details of electron spin delo-calization on the porphyrin ring (74, 75). The 500 MHz1HNMR spectra of cytochromersC552 and of cytochromerC552
before and after heating, with a particular emphasis on thehyperfine-shifted resonances of the heme, are shown inFigure 7A-C. The well-resolved resonances at 34.8 and 34.2
ppm (shifts from spectrum in Figure 7B) in the spectrum ofoxidized, unheatedrC552 have been assigned to heme methyls3 and 8, respectively, and the upfield-shifted resonance at-15 ppm is assigned to the axial Metε-CH3 (16). After thesample had been heated to 70°C followed by cooling to 25°C, and oxidation of the reduced p572 with a small excessof ferricyanide, resonances attributed to p572 appear at 41.0,40.3, and-19 ppm. The1H NMR spectrum shown in Figure7D is that of the oxidized form of purified p572, therebyconfirming the assignment described above. The hememethyl resonances in therC552 remaining after heating shiftslightly from their positions in unheatedrC552, suggestingthat the cytochrome molecules that retainQ00 near 550 nmare also modified during heating. We have not furtherpursued this observation.
The 1H NMR spectrum of oxidized p572 is unique for acytochromec with His-Met axial ligation, indicating anunusual electronic structure. One novel feature is that it hasanomalously large shifts for the two most downfield-shiftedresonances (40.3 and 41.0 ppm at 25°C); typically, thelargest shift is∼35 ppm at this temperature for cytochromesc with His and Met axial ligands oriented as in p572 (74,76) (Figure 7). Another unusual property of the p572 NMRspectrum is an unusually large spread of heme methylresonances [> 30 ppm; compare to 20.5 ppm forrC552, avalue typical of cytochromesc (76)]. The characteristics ofthe spectrum of oxidized p572 suggest that the electronicstructure of the heme has been substantially altered relativeto that ofrC552 or rsC552, each of which has general featurestypical of cytochromesc. As the orientations of the axialligands are conserved among these species, the unusual hememethyl shift pattern of p572 is attributed to the presence ofa formyl group on the macrocycle.
Electron Transfer to Cytochrome ba3. Finally, a formylcytochromec is expected to have significantly differentelectrochemical and electron transferring properties. Cyto-chromec552 is the natural redox partner of cytochromeba3
oxidase in Thermus cells grown under microaerophilicconditions (25, 77). As measured under standard assayconditions (11), the relative activities of cytochromesrsC552,rC552, and p572 towardThermuscytochromeba3 are 1, 0.85,and e0.1, respectively. Because it is difficult to eliminaterC552 from preparations of p572, the latter number representsan upper limit, and we suspect the activity with p572 isconsiderably lower.
Electrochemistry
Preliminary, reductive titrations of heated, as-isolatedrC552
with ascorbate revealed that the 572 nm peak preceded theappearance of the 552 nm peak, suggesting that p572 mayhave a higher reduction potential than the remaining cyto-chromec. Accordingly, we measured the reduction potentialof purified p572 (trace A in Figure 6SM), an∼80:20 mixtureof rC552 and p572 (trace B in Figure 6SM), and native-likersC552 (trace C in Figure 6SM) using cyclic voltammetry.The midpoint potentials (Em) derived from these voltammo-grams are 200 mV forrsC552 and 340 mV for p572 (vs thestandard hydrogen electrode). As determined from thereduced minus oxidized optical absorption spectrum, therC552 sample used in this experiment was an∼80:20 mixtureof rC552 and p572 accounting for the much broader cyclic
FIGURE 7: 1H NMR spectra at 25°C for oxidized cytochromersC552(A) and cytochromerC552 as isolated (B), after heating the latterto 70 °C for 30 min followed by cooling to 25°C and oxidationwith ferricyanide (C) and p572 (D). Sample D was purified fromsample C. See Experimental Procedures for details of the recording.
Conversion of Heme IX to Protein-BoundSpirographisHeme Biochemistry, Vol. 43, No. 38, 200412171

voltammogram and the shoulder at∼325 mV (trace B inFigure 6SM); the midpoint potential ofrC552 is estimated tobe ∼220 mV, approximately 20 mV higher than that ofrsC552. The large positive shift in reduction potential seenfor p572 is consistent with the expected effects on hemereduction potentials of carbonyl or Schiff base coupling intothe porphyrinπ-system (32). Finally, assuming that steadystate oxidase activity may be limited by the transfer ofelectrons from the cytochromec to the CuA site ofba3 (∼240mV), the very high potential of p572 (∼340 mV) accountsfor its greatly reduced electron transfer activity with cyto-chromeba3.
DISCUSSION
During synthesis in the cytoplasm of aerobically grownE. coli, cytochromerC552 appears to bind two O atoms,thereby retaining in its molecular structure the capacity tospontaneously convert from a chromophore having aQ00
transition at∼550 nm, typical of a heme having no doublebonds conjugated to the porphyrinπ-system, to a chromo-phore with a formyl group that is strongly conjugated withthe hemeπ-system (p572), having aQ00 transition at 572nm. In effect, this conversion results in the oxidation of the2-vinyl group of iron protoporphyrin IX to [2-formyl-4-vinyl]or Spirographisheme (78). In the course of this conversion,rC552 decreases its mass by∼13 ( 4 Da. This occurs by anovel mechanism involving O2 and the Cys11 residue7,8 and,by comparison to organic routes, does not involve the useof powerful and somewhat indiscriminate oxidants.9
A substantial body of data on the spectral, mass, andstructural properties ofrC552 and p572 supports the chemistrysuggested below in Schemes 1 and 2. These data showunequivocally and without exception that (a) Cys11, the heme2-vinyl group (on heme ring I; cf. ref32), and presumablyO2
8 are the primary players in an unusual chemistry, (b) abridge of electron density inrC552 maps extends from the2-position of the heme to the CR atom of cysteine 11 whichcorresponds to the presence of CO-CH2-S-CH2 atoms, (c)the plane of CO in this bridging group is approximatelynormal to the plane of the heme, (d) the vinyl CA-CB bondis broken in p572 and CA is oxidized to a formyl group, and(e) only one extra O atom resides in the final p572 product,presumably in the formyl group.
To account for the formation of the heme-to-protein bridgein rC552, we suggest the chemistry shown in Scheme 1. Thisoriginates in a reaction of the Cys11 Sγ atom [either as athiolate (top) or as a thiyl radical (bottom)] with the CB
atom (dCH2) of 2-vinyl. In both paths, this is followed by
reaction of O2 with the resulting carbanion or free radical atCA which ultimately forms a hydroperoxide moeity. The anti-Markovnikov addition of RS to the 2-vinyl would generallysuggest a free radical route (79), where the cysteine radicalmay result from spurious oxidation. However, a thiolate isalso possible because improper folding of the N-terminalregion against the main body of the protein may hold the Sγ
of Cys11 away from CA, and stabilization of a carbanion onCA through conjugation with the porphyrinπ-system couldfacilitate nucleophilic attack of RSγ- at CB of the 2-vinyl,consistent with the pH dependence of the reaction.2 Similarly,a free radical at CA may be stabilized in its sp2 configuration,thereby facilitating reaction with O2. Subsequent dehydrationof the hydroperoxide to the carbonyl corresponds to a four-electron oxidation of the vinyl group.10 Lightner et al. (80)have noted both Markovnikov and anti-Markovnikov adductsin both photochemical and acid-catalyzed thiol addition toone of the vinyl groups of bilirubin.
The rather speculative Scheme 2 is offered, which leadsto a product consistent with the observed molecular masses,crystal structure, and spectral properties of p572. Here, theabnormal thioether loses a proton in a base-assisted process,2
forming an incipient carbanion on the Câ atom of cysteine11 which, as the simplest means of cleaving the CA-CB bondof the original 2-vinyl group, we suggest, attacks the CB
carbon of the erstwhile 2-vinyl group, with attendantformation of a thiirane at cysteine 11 (see refs81and82 for
7 Recently, evidence that thiolate groups can exhibit novel chemicalbehavior when associated with proteins has accrued, for example,unexpected disulfide formation (16), oxidation to sulfenates andsulfonates (83), involvement in the oxidation of porphyrin side chains(84), and formation of a cyclic sulfenyl amide (85). We add to this lista protein-thiol-mediated oxidation of a heme vinyl to a heme formylsubstituent.
8 E. coli cells able to synthesizerC552 when grown aerobically failto produce any cytochromec552when grown anaerobically. We thereforeassume that the presence of 31( 2 Da in the mass ofrC552, obtainedfrom aerobically grown cells, indicates the presence of two additionalO atoms in the as-isolated form of this protein.
9 There are several synthetic methods for the oxidation of a ring-bound vinyl group to a formyl group: KMnO4 and OsO4 (39), OsO4/NaIO4 (86), singlet oxygen (87), and ozonolysis (88).
10 Formally, the valence of C in methane is-IV, 0 in diamond, and+IV in CO2, and the valence of the cysteine 11 Sγ atom is maintainedat (-II). If only internal oxidation and reduction occur upon conversionof rC552 to p572, CA is reduced from C(+II) to C(+I) in the formylwhile Câ of Cys11 is oxidized from C(-I) to C(0) in the proposedthiirane (Scheme 2).
Scheme 1
Scheme 2
12172 Biochemistry, Vol. 43, No. 38, 2004 Feeet al.

some discussion of the properties of these compounds) anda formyl group at the original CA atom. It is reasonable tofurther suggest that the driving force for this process is thecoupling of theπ-system of the porphyrin and the formylgroup.
EVidence for Scheme 1. The optical and rR spectra suggestthat there are no unsaturated side chains in conjugation withthe porphyrin macrocycle ofrC552. Thus, theQ00 transitionis typical of cytochromesc, and the rR spectra indicate thecore of the heme, particularly those modes composedprimarily of porphyrin C-C and C-N vibrations, is highlysimilar in rC552 and native-likersC552. However, the CDspectra indicate a perturbed heme environment, while the1H NMR spectra show clearly that the distribution of electronspin density on the porphyrin ring differs inrC552 andrsC552.The symmetry of the electronic spin distribution on theporphyrin is also clearly different between these two proteinsas evidenced by the changed pattern of methyl resonances(Figure 7, traces A and B). Unfortunately, it is difficult tosort out the underlying structural differences betweenrC552
and native-likersC552 from such spectra.The crystallographic results, however, indicate a structure
that is consistent with the spectral observations. The electrondensity maps ofrC552 at a resolution of 1.41 Å show clearbridging density from heme ring I to the CR atom of cysteine11, and fixes the angle between the CA carbonyl plane andthe heme plane at∼70°. This seems to preclude significantcoupling of the carbonylπ-electrons into the hemeπ-electronsystem and makes the bridge appear to the heme as asaturated side chain. Hence, the bridge does not affect theenergy of theQ00 transition, but its presence alters the CDand 1H NMR spectra. The combined crystallographic andspectral data do not readily admit to other interpretationsand therefore provide strong evidence for the bridge asproposed. As for the suggested chemistry, our data do notdistinguish a nucleophilic from a free radical mechanism,and both seem plausible.11
Scheme 1 admits the possibility of a side reaction if theputative carbanion at CA reacts with a proton. This wouldyield a product having properties, including its molecularweight, similar to those of native-like cytochromec552 (exceptfor the somewhat different protein structure around the Cys11position). The occurrence of this reaction may account forthe observed partial conversion ofrC552 to p572,2 the minorband at 14 862 Da corresponding to the molecular massexpected for the native protein (Figure 2), the uniquehyperfine-shifted resonances that occur in heatedrC552 butare not associated with p572 (Figure 7, trace C), and thepossible appearance of electron density bridging the heme2-position and cysteine 11 in the structure of p572 (Figure5A).
Other data fromrC552, however, suggest the system maybe somewhat more complicated. For example, the massspectrum of as-isolatedrC552 indicates that two additionalO atoms are part of the structure, whereas the crystallographicstructure ofrC552 accounts for only one additional O atom.Can this be rationalized? Among several possibilities, wehypothesize that the structure ofrC552, as isolated, contains
a hydroperoxide group (Scheme 1) which converts to thecarbonyl at some point in the process of structure determi-nation and is trapped in the crystal. This might explain whyrC552, spectrally free of p572, always shows a significantamount of the 14 875 Da peak in its electrospray massspectrum (see Figure 2). Current spectral results would likelynot distinguish the presence of a hydroperoxide group fromthat of an unconjugated carbonyl. However, this idea mightbe tested by determining the mass ofrC552 that had beensubjected to the crystallographic experiment and then dis-solved into buffer; crystals treated in such a manner retaintheir ability to convert to p572, showing that the finalbridging structure, lacking the peroxy group, is still able toconvert to p572.
EVidence for Scheme 2. Turning to p572, we assume thatthe instability ofrC552 with respect to p572 lies in the heme-to-cysteine 11 bridge. Knowing that a conjugated hemeformyl substituent is part of p572 makes it reasonable tosuggest a mechanism for the conversion ofrC552 to p572.Key features of Scheme 2 are breaking of the CA-CB bondand formation of the CA carbonyl group which are stronglysupported by the crystal structures. Although this is admit-tedly not the chemical behavior expected from an isolatedmolecule of R1-CO-CH2-S-CH2-CHR2 (where R1 and R2 arealiphatic), the reaction we are suggesting occurs within aprotein molecule where anisotropic forces are likely to affectchemical reactivity (see below).
While crystallography confirms that the bridge betweenheme and Cys11 is broken and that an isolated, in-planeformyl group has formed on heme ring I, it does not tell usmuch about what has happened to Cys11. The electrondensity map in this region is dominated by two large peaksfor which the single cysteine 11 Sγ atom can account, andresidual positive density only indicates that additional lightatoms are present, which may arise from CH2 atoms in amixture of (R)- and (S)-thiirane.
The mass spectra of p572 and its heme peptide areconsistent with one extra O atom (compared to a nativestructure) and the loss of two to four H atoms. Thus, asmeasured by MALDI-TOF, the expected average mass(Mexpected) of a thiirane containing p572 heme peptide equals2418 Da (2404+ 16 - 2), while the observed average mass(Mobs) equals 2416( 2.4 Da (see Table 1-SM). Althoughother products may fall within this mass range, whateverhappens at cysteine 11 does not involve addition of otheratoms. For this reason, we have rationalizedMobs in termsof a structure in which the Sγ atom of cysteine 11 has becomepart of a cysteine 11 thiirane (or its mass equivalent). Theappearance of the structurally distinct products wouldcontribute to structural disorder in the region of cysteine 11.
In conclusion, the results extend our knowledge of thechemistry that can occur between heme and the CXXCHmotif of apocytochromesc. We are hopeful this descriptionof cytochrome p572 may suggest more detailed study ofprotein-bound, formyl-containing hemes, as might occur ifthese can be preparedin Vitro (see refs13, 22, and 23).Certainly, the spectral features of p572 may be useful in theanalysis of mixtures of heterologously expressed cytochromesc, particularly when mutant forms are being sought (17).Finally, the new heme protein chemistry presented here mayprovide insight into the need for chaperone-directed hemeattachment.
11 It is noteworthy that Carpena and co-workers (42) describe aperhydroxy group bound to the 2-vinyl CA atom in the catalase-peroxidase fromBurkholderia pseudomallei.
Conversion of Heme IX to Protein-BoundSpirographisHeme Biochemistry, Vol. 43, No. 38, 200412173

ACKNOWLEDGMENT
We acknowledge useful discussions with Dr. DavidGoodin of The Scripps Research Institute (La Jolla, CA) andDr. Linda Thony-Meyer of ETH (Zurich, Switzerland). Weappreciate the work at The Scripps Center for MassSpectrometry for providing the mass analyses used in thisstudy. We also thank the staff at the Stanford SynchrotronRadiation Laboratory (SSRL) for their excellent support inthe use of the beam lines. This work is based on researchconducted at SSRL, which is funded by the Department ofEnergy, Office of Basic Energy Sciences. SSRL beam linesare supported by the National Institutes of Health, theNational Center for Research Resources, the BiomedicalTechnology Program, and the Department of Energy, Officeof Biological and Environmental Research.
SUPPORTING INFORMATION AVAILABLE
Additional mass spectral data, circular dichroism spectra,primary resonance Raman spectra, and cyclic voltammo-grams. This material is available free of charge via theInternet at http://pubs.acs.org.
REFERENCES
1. Thony-Meyer, L. (2002) Cytochromec maturation: a complexpathway for a simple task?Biochem. Soc. Trans. 30, 633-638.
2. Thony-Meyer, L. (2000) Haem-polypeptide interactions duringcytochromec maturation,Biochim. Biophys. Acta 1459, 316-324.
3. Kranz, R. G., Lill, R., Goldman, B., Bonnard, G., and Merchant,S. (1998) Molecular mechanisms of cytochromec biogenesis:three distinct systems,Mol. Microbiol. 29, 383-396.
4. Page, M. D., Sambongi, Y., and Ferguson, S. J. (1998) Contrastingroutes of c-type cytochrome assembly in mitochondria, chloro-plasts and bacteria,Trends Biochem. Sci. 23, 103-108.
5. McEwan, A. G., Kaplan, S., and Donohue, T. J. (1989) Synthesisof Rhodobacter sphaeroidescytochromec2 in Escherichia coli,FEMS Microbiol. Lett. 59, 253-258.
6. von Wachenfeldt, C., and Hederstedt, L. (1990)Bacillus subtilisholo-cytochromec-550 can be synthesized in aerobicEscherichiacoli, FEBS Lett. 270, 147-151.
7. Grisshammer, R., Oeckl, C., and Michel, H. (1991) Expressionin Escherichia coliof c-type cytochrome genes fromRhodopseudo-monasViridis, Biochim. Biophys. Acta 1088, 183-190.
8. Sanbongi, Y., Yang, J.-H., Igarashi, Y., and Kodama, T. (1990)Cloning, nucleotide sequence and expression of the cytochromec-552 gene fromHydrogenobacter thermophilus, Eur. J. Biochem.24, 7-12.
9. Sinha, N., and Ferguson, S. J. (1998) AnEscherichia coli ccm(cytochromec maturation) deletion strain substantially expressesHydrogenobacter thermophiluscytochromec552 in the cytoplasm:availability of haem influences cytochromec552 maturation,FEMSMicrobiol. Lett. 161, 1-6.
10. Pollock, W. B. R., Rosell, F. I., Twitchett, M. B., Dumont, M. E.,and Mauk, A. G. (1998) Bacterial expression of a mitochondrialcytochromec. Trimethylation of Lys72 in yeastiso-1-cytochromec and the alkaline conformational transformation,Biochemistry37, 6124-6131.
11. Keightley, J. A., Sanders, D., Todaro, T. R., Pastuszyn, A., andFee, J. A. (1998) Cloning and expression inEscherichia coliofthe cytochormec552 gene fromThermus thermophilus: Evidencefor genetic linkage to an ATP-binding cassette protein and initialcharacterization of thecycAgene products,J. Biol. Chem. 273,12006-12016.
12. Karan, E. F., Russell, B. S., and Bren, K. L. (2002) Characteriza-tion of Hydrogenobacter thermophiluscytochromesc552 expressedin the cytoplasm and periplasm ofEscherichia coli, J. Biol. Inorg.Chem. 7, 260-272.
13. Daltrop, O., Smith, K. M., and Ferguson, S. J. (2003) Stereo-selectivein Vitro formation ofc-type cytochrome variants fromHydrogenobacter thermophiluscontaining only a single thioetherbond,J. Biol. Chem. 278, 24308-24313.
14. Hon-nami, K., and Oshima, T. (1977) Purification and someproperties of cytochromec552 from an extreme thermophile,Thermus thermophilusHB8, J. Biochem. 82, 769-776.
15. Keightley, J. A. (1993) Ph.D. Thesis, University of New Mexico,Albuquerque, NM.
16. McRee, D. E., Williams, P. A., Sridhar, V., Pastuszyn, A., Bren,K. L., Patel, K. M., Chen, Y., Todaro, T. R., Sanders, D., Luna,E., and Fee, J. A. (2001) Recombinant cytochromerC557 obtainedfrom Escherichia coli cells expressing a truncatedThermusthermophilus cycAgene,J. Biol. Chem. 276, 6537-6544.
17. Rumbley, J. N., Hoang, L., and Englander, S. W. (2002)Recombinant equine cytochromec in Escherichia coli: High-level expression, characterization, and folding and assemblymutants,Biochemistry 41, 13894-13901.
18. Sanders, C., and Lill, H. (2000) Expression of prokaryotic andeukaryotic cytochromesc in Escherichia coli, Biochim. Biophys.Acta 1459, 131-138.
19. Arslan, E., Schulz, H., Zufferey, R., Ku¨nzler, P., and Tho¨ny-Meyer,L. (1998) Overproduction of theBradyrhizobium japonicum c-typecytochrome subunits of thecbb3 oxidase inEscherichia coli,Biochem. Biophys. Res. Commun. 251, 744-747.
20. Ubbink, M., van Beeumen, J., and Canters, G. W. (1992)Cytochromec550 from ThiobacillusVersutus: Cloning, expressionin Escherichia coli, and purification of the heterologous holopro-tein, J. Bacteriol. 174, 3707-3714.
21. Fee, J. A., Chen, Y., Todaro, T. R., Bren, K. L., Patel, K. M.,Hill, M. G., Gomez-Moran, E., Loehr, T. M., Ai, J., Tho¨ny-Meyer,L., Williams, P. A., Stura, E., Sridhar, V., and McRee, D. E. (2000)Integrity of Thermus thermophiluscytochromec552 synthesizedby Escherichia colicells expressing the host-specific cytochromec maturation genes, ccmABCDEFGH: Biochemical, spectral andstructural characterization of the recombinant protein,Protein Sci.9, 2074-2084.
22. Daltrop, O., and Ferguson, S. J. (2003) Cytochromec maturation:The in Vitro reactions of horse heart apocytochromec andParacoccus denitrificansapocytochromec550 with heme,J. Biol.Chem. 278, 4404-4409.
23. Allen, J. W. A., Barker, P. D., and Ferguson, S. J. (2003) Acytochromeb562 variant with ac-type cytochrome CXXCH heme-binding motif as a probe of theEscherichia colicytochromecmaturation system,J. Biol. Chem. 278, 52075-52083.
24. Berry, E. A., and Trumpower, B. L. (1987) Simultaneousdetermination of hemes A, B and C from pyridine hemochromespectra,Anal. Biochem. 161, 1-15.
25. Keightley, J. A., Zimmermann, B. H., Mather, M. W., Springer,P., Pastuszyn, A., Lawrence, D. M., and Fee, J. A. (1995)Molecular genetic and protein chemical charactertization of thecytochromeba3 from Thermus thermophilusHB8, J. Biol. Chem.270, 20345-20358.
26. Leslie, A. G. W. (1992), Recent changes to the MOSFLM packagefor processing film and image plate data,Joint CCP4+ ESF-EAMCB Newsletter on Protein Crystallography, No. 26, SERC,Daresbury Laboratory, Warrington, U.K.
27. Leslie, A. W. G. (1994) The CCP4 suite: programs for proteincrystallography,Acta Crystallogr. D50, 760-763.
28. Than, M. E., Hof, P., Huber, R., Bourenkov, G. P., Bartunik, H.D., Buse, G., and Soulimane, T. (1997)Thermus thermophiluscytochrome c552: A new highly thermostable cytochrome-cstructure obtained by MAD phasing,J. Mol. Biol. 271, 629-644.
29. McRee, D. E. (1999) XtalView/Xfit: A versatile protein formanipulating atomic coordinates and electron density,J. Struct.Biol. 125, 156-165.
30. Sheldrick, G. M., and Schneider, T. R. (1997) SHELXL: High-Resolution Refinement,Methods Enzymol. 277b, 319-343.
31. Sheldrick, G. M. (1996) inProceedings of the CCP4 studyweekend, January 1996(Dodson, E., Moore, M., Ralph, A., andBailey, S., Eds.) Daresbury Laboratory, Warrington, U.K.
32. Falk, J. E. (1964)Porphyrins and metalloporphyrins, Elsevier,Amsterdam.
33. Smyth, D. G. (1967) Techniques in enzymatic hydrolysis,MethodsEnzymol. 11, 214-231.
34. Siuzdak, G. (1996)Mass Spectrometry for Biotechnology, Aca-demic Press, New York.
35. Fee, J. A., Malmstro¨m, B. G., and Va¨nngard, T. (1970) Thereduction of fungal laccase at high pH,Biochim. Biophys. Acta197, 136-142.
12174 Biochemistry, Vol. 43, No. 38, 2004 Feeet al.

36. Brautigan, D., Ferguson-Miller, S., and Margoliash, E. (1978)Mitochondrial cytochromec: Preparation and activity of nativeand chemically modified cytochromesc, Methods Enzymol. 53,128-164.
37. Takemori, S., and King, T. E. (1965) Effect of alkali andborohydride on cardiac cytochrome oxidase: formation of Schiffbase,J. Biol. Chem. 240, 504-513.
38. Caughey, W. S., Smythe, G. A., O’Keeffe, D. H., Maskasky, J.E., and Smith, M. L. (1975) Heme A of cytochromec oxidase:Structure and properties comparisons with hemes B, C, and S andderivatives,J. Biol. Chem. 250, 7602-7622.
39. Fuhrhop, J.-H., and Smith, K. M. (1975) inPorphyrins andmetalloporphyrins(Smith, K. M., Ed.) pp 757-869, Elsevier,Amsterdam.
40. Paul, K.-G. (1950) The splitting with silver salts of the cysteine-porphyrin bonds in cytochrome,Acta Chem. Scand. 4, 239-244.
41. Ambler, R. P. (1963) The amino acid sequence ofPseudomonascytochromec-551,Biochem. J. 89, 349-378.
42. Carpena, X., Loprasert, S., Mongkolsuk, S., Switala, J., Loewen,P. C., and Fita, I. (2003) Catalase-peroxidase KatG ofBurkhold-eria pseudomalleiat 1.7 Å resolution,J. Mol. Biol. 327, 475-489.
43. Ames, J. M. (1994) inSulfur compounds in foods, pp 147-159,American Chemical Society, Washington, DC.
44. Cole, K. C., Sandorfy, C., Fabi, M. T., Olivato, P. R., Rittner, R.,Trufem, C., Viertler, H., and Wladislaw, B. (1977) Interactionbetween the carbonyl group and a sulfur atom. Part 8. Correlationbetween the basicity constants, corrected for steric effects, andTaft s* values for some ketones and nitriles,J. Chem. Soc., PerkinTrans. 2, 2025-2027.
45. Olivato, P. R., and Guerrero, S. A. (1990) Conformational andelectronic interaction studies ofR-substituted carbonyl compounds.Part 9.ω-Hetero-substituted acetophenones,J. Chem. Soc., PerkinTrans. 2, 465-471.
46. Angell, R. M., Biggadike, K., Farrell, R. M., Flack, S. S., Hancock,A. P., Irving, W. R., Lynn, S. M., and Procopiou, P. A. (2002)Novel glucocorticoid antedrugs possessing a 21-(γ-lactone) ring,J. Chem. Soc., Perkin Trans. 1, 831-839.
47. Smith, K. M. (1975)Porphyrins and Metalloporphyrins, pp 910,Elsevier, Amsterdam.
48. Scheidt, W. R., and Reed, C. A. (1981) Spin-state/stereochemicalrelationships in iron-porphyrins: implications for the hemopro-teins,Chem. ReV. 81, 543-555.
49. Makinen, M. W., and Churg, A. K. (1983) inIron Porphyrins(Lever, A. B. P., and Gray, H. B., Eds.) pp 141-235, Addison-Wesley, Reading, MA.
50. Scott, R. A., and Mauk, A. G. (1996)Cytochrome C: AMultidisciplinary Approach, pp 728, University Science Books,Sausalito, CA.
51. Reddy, K. S., Angiolillo, P. J., Wright, W. W., Laberge, M., andVanderkooi, J. M. (1996) Spectral splitting in theR (Q0,0)absorption band of ferrous cytochromec and other heme proteins,Biochemistry 35, 12820-12830.
52. Rasnik, I., Sharp, K. A., Fee, J. A., and Vanderkooi, J. M. (2001)Spectral analysis of cytochromec: Effect of heme conformation,axial ligand, peripheral substituents and local electric fields,J.Phys. Chem. B 105, 282-286.
53. Shelnutt, J. A. (1980) The Raman excitation spectra and absorptionspectrum of a metalloporphyrin in an environment of lowsymmetry,J. Chem. Phys. 72, 3948-3958.
54. Lemberg, M. R. (1969) Cytochrome oxidase,Physiol. ReV. 49,48-121.
55. Marzocchi, M. P., and Smulevich, G. (2003) Relationship betweenheme vinyl conformation and the protein matrix in peroxidases,J. Raman Spectrosc. 34, 725-736.
56. Blauer, G., Sreerama, L., and Woody, R. W. (1993) Optical activityof hemoproteins in the Soret region. Circular dichroism of theheme undecapeptide of cytochromec in aqueous solution,Biochemistry 32, 6674-6679.
57. Hsu, M. C., and Woody, R. W. (1971) The origin of the hemeCotton effects in myoglobin and hemoglobin,J. Am. Chem. Soc.93, 3515-3525.
58. Wittung-Stafshede, P. (1998) A stable, molten-globule-like cyto-chromec, Biochim. Biophys. Acta 1382, 324-332.
59. Spiro, T. G. (1985) Resonance Raman spectroscopy as a probe ofheme protein structure and dynamics,AdV. Protein Chem. 37,111-159.
60. Kihara, H., Hon-nami, K., and Kitagawa, T. (1978) Alkalineisomerization of thermoresistant cytochromec552 and horse heart
cytochrome c studied by absorption and resonance Ramanspectroscopy,Biochim. Biophys. Acta 532, 337-346.
61. Hon-nami, K., Kihara, T., Kitagawa, T., Miyazawa, T., andOshima, T. (1980) Proton nuclear magnetic resonance andresonance Raman studies of thermophilic cytochromec552 fromThermus thermophilusHB8, Eur. J. Biochem. 110, 217-223.
62. Abe, M., Kitagawa, T., and Kyogoku, Y. (1978) Resonance Ramanspectra of octaethylporphinato-Ni(II) andmeso-deuterated and15Nsubstituted derivatives. II. A normal coordinate analysis,J. Chem.Phys. 69, 4526-4534.
63. Hu, S., Morris, I. K., Singh, J. P., Smith, K. M., and Spiro, T. G.(1993) Complete assignment of cytochromec resonance Ramanspectra via enzymatic reconstitution with isotopically labeledhemes,J. Am. Chem. Soc. 115, 12446-12458.
64. Salmeen, I., Rimai, L., and Babcock, G. (1978) Raman spectra ofheme A, cytochrome oxidase-ligand complexes, and alkalinedenatured oxidase,Biochemistry 17, 800-806.
65. Bocian, D. F., Masthay, M. B., and Birge, R. R. (1986) Effects ofmono- versus di-substitution of conjugating groups on theelectronic structure of porphyrins,Chem. Phys. Lett. 125, 467-472.
66. Chang, C. K., Hatada, M. H., and Tulinsky, A. (1983) Synthesisand molecular structure of formylporphyrin. Intrinsic propertiesof porphyrina, J. Chem. Soc., Perkin Trans., 371-378.
67. Reid, L. S., Lim, A. R., and Mauk, A. G. (1986) Role of hemevinyl groups in cytochromeb5 electron transfer,J. Am. Chem.Soc. 108, 8197-8201.
68. Kalsbeck, W. A., Ghosh, A., Pandey, R. K., Smith, K. M., andBocian, D. F. (1995) Determinants of the vinyl stretchingfrequency in protoporphyrins. Implications for cofactor-proteininteractions in heme proteins,J. Am. Chem. Soc. 117, 10959-10968.
69. Babcock, G. T. (1988) inBiological Applications of RamanSpectroscopy(Spiro, T. G., Ed.) pp 294-346, John Wiley & Sons,New York.
70. Tsubaki, M., Nagai, K., and Kitagawa, T. (1980) Resonance Ramanspectra of myoglobins reconstituted with spirographis and iso-spirographis hemes and iron 2,4-diformylprotoporphyrin IX. Effectof formyl substitution at the heme periphery,Biochemistry 19,379-385.
71. Lutz, M. (1977) Antenna chlorophyll in photosynthetic mem-branes: a study by resonance Raman spectroscopy,Biochim.Biophys. Acta 460, 408-430.
72. Ching, Y., Argade, P. V., and Rousseau, D. L. (1985) ResonanceRaman Spectra of CN--Bound Cytochrome Oxidase: SpectralIsolation of Cytochromesa2+, a3
2+, anda32+(CN-), Biochemistry
24, 4938-4946.73. Oertling, W. A., Surerus, K. K., Einarsdottir, O., Fee, J. A., Dyer,
R. B., and Woodruff, W. H. (1994) Spectroscopic characterizationof cytochromeba3, a terminal oxidase fromThermus thermo-philus: Comparison of thea3/CuB site to that of bovine cyto-chromeaa3, Biochemistry 33, 3128-3141.
74. La Mar, G. N., Satterlee, J. D., and de Ropp, J. S. (2000) inThePorphyrin Handbook(Kadish, K. M., Smith, K. M., and Ruilard,R., Eds.) pp 185-298, Academic Press, New York.
75. Kolczak, U., Hauksson, J. B., Davis, N. L., Pande, U., de Ropp,J. S., Langry, K. C., Smith, K. M., and La Mar, G. N. (1999)1HNMR investigation of the role of intrinsic heme versus protein-induced rhombic perturbations on the electronic structure of low-spin ferrihemoproteins: Effect of heme substituents on hemeorientation in myoglobin,J. Am. Chem. Soc. 121, 835-843.
76. Shokhirev, N. V., and Walker, F. A. (1998) The effect of axialligand plane orientation on the contact and pseudocontact shiftsof low-spin ferriheme proteins,J. Biol. Inorg. Chem. 3, 581-594.
77. Soulimane, T., von Walter, M., Hof, P., Than, M. E., Huber, R.,and Buse, G. (1997) Cytochromec552 from Thermus thermo-philus: A functional and crystallographic investigation,Biochem.Biophys. Res. Commun. 237, 572-576.
78. Fischer, H., and von Seeman, C. (1936) Die Konstitution desSpirographhisha¨mins, Z. Physiol. Chem. 242, 133-157.
79. Morrison, R. T., and Boyd, R. N. (1992)Organic Chemistry, 6thed., Prentice Hall, Englewood Cliffs, NJ.
80. Lightner, D. A., McKonagh, A. F., Wijekoon, W. M. D., andReisinger, M. (1988) Amplification of optical activity by remotechiral functionality. Circular dichroism of bilirubinexo-vinylN-acetyl-L-cysteine adducts,Tetrahedron Lett. 29, 3507-3510.
81. Hanson, R. M. (2003) inOrganic Reactions(Overman, L. E., Ed.)pp 1-160, John Wiley & Sons, New York.
Conversion of Heme IX to Protein-BoundSpirographisHeme Biochemistry, Vol. 43, No. 38, 200412175

82. Branalt, J., Kvarnstrom, I., Classon, B., and Samuelsson, B. (1996)Synthesis of [4,5-bis(hydroxymethyl)-1,3-oxathiolan-2-yl]nucleo-sides as potential inhibitiors of HIV vis stereospecific base-inducedrearrangement of a 2,3-epoxy thioacetate,J. Org. Chem. 61,3604-3610.
83. Claiborne, A., Miller, H., Parsonage, D., and Ross, R. P. (1993)Protein-sulfenic acid stabilization and function in enzyme catalysisand gene regulation,FASEB J. 7, 1483-1490.
84. Barker, P. D., Ferrer, J. C., Mylrajan, M., Loehr, T. M., Feng, R.,Konishi, Y., Funk, W. D., MacGillivray, R. T. A., and Mauk, A.G. (1993) Transmutation of a heme protein,Proc. Natl. Acad.Sci. U.S.A. 90, 6542-6546.
85. Salmeen, A., Jannik, N., Andersen, J. N., Myers, M. P., Meng,T.-C., Hinks, J. A., Tonks, N. K., and Barford, D. (2003) Redox
regulation of protein tyrosine phosphatase 1B involves a sulphenyl-amide intermediate,Nature 423, 769-773.
86. Keck, G. E., Cressman, E. N. K., and Enholm, E. J. (1989)Intramolecular allystannane cyclizations in alkaloid synthesis:Application to pyrrolizidine alkaloids,J. Org. Chem. 54, 4345-4349.
87. Gerlach, B., and Montforts, F.-P. (1995) Azachlorins: Synthesisof a novel type of hydroporphyrins from the bile pigment bilirubin,Liebigs Ann., 1509-1514.
88. Fava, C., Galeazzi, R., Mobbili, G., and Orena, M. (1999) Newchiral 3-naphthylaminomethyl-pyrrolidines: an unexpected epimer-isation reaction,Heterocycles 51, 2463-2470.
BI048968L
12176 Biochemistry, Vol. 43, No. 38, 2004 Feeet al.