cytochrome p450 reductase dependent inhibition of cytochrome p450 2b1 activity: implications for...
TRANSCRIPT
Cytochrome P450 reductase dependent inhibition ofcytochrome P450 2B1 activity: Implications for gene directedenzyme prodrug therapy
Johannes Lengler a, Markus Omann b, Dana Duvier b, Harry Holzmuller a,Wolfgang Gregor c, Brian Salmons a, Walter H. Gunzburg b, Matthias Renner a,*aAustrianova Biotechnology GmbH, Veterinarplatz 1, A-1210 Vienna, AustriabResearch Institute for Virology and Biomedicine, University of Veterinary Medicine, A-1210 Vienna, AustriacResearch Institute for Biochemical Pharmacology and Molecular Toxicology, University of Veterinary Medicine, A-1210 Vienna, Austria
b i o c h e m i c a l p h a r m a c o l o g y 7 2 ( 2 0 0 6 ) 8 9 3 – 9 0 1
a r t i c l e i n f o
Article history:
Received 5 April 2006
Accepted 12 June 2006
Keywords:
Cytochrome P450 reductase
Cytochrome P450
CYP2B1
Ifosfamide
P450 GDEPT
a b s t r a c t
Cytochrome P450 (P450) enzymes are often used in suicide gene cancer therapy strategies to
convert an inactive prodrug into its therapeutic active metabolites. However, P450 activity is
dependent on electrons supplied by cytochrome P450 reductase (CPR). Since endogenous
CPR activity may not be sufficient for optimal P450 activity, the overexpression of additional
CPR has been considered to be a valuable approach in gene directed enzyme prodrug therapy
(GDEPT). We have analysed a set of cell lines for the effects of CPR on cytochrome P450
isoform 2B1 (CYP2B1) activity. CPR transfected human embryonic kidney 293 (HEK293) cells
showed both strong CPR expression in Western blot analysis and 30-fold higher activity in
cytochrome c assays as compared to parental HEK293 cells. In contrast, resorufin and 4-
hydroxy-ifosfamide assays revealed that CYP2B1 activity was up to 10-fold reduced in CPR/
CYP2B1 cotransfected HEK293 cells as compared to cells transfected with the CYP2B1
expression plasmid alone. Determination of ifosfamide-mediated effects on cell viability
allowed independent confirmation of the reduction in CYP2B1 activity upon CPR coexpres-
sion. Inhibition of CYP2B1 activity by CPR was also observed in CYP2B1/CPR transfected or
infected pancreatic tumour cell lines Panc-1 and Pan02, the human breast tumour cell line
T47D and the murine embryo fibroblast cell line NIH3T3. A CPR mediated increase in CYP2B1
activity was only observed in the human breast tumour cell line Hs578T. Thus, our data
reveal an effect of CPR on CYP2B1 activity dependent on the cell type used and therefore
demand a careful evaluation of the therapeutic benefit of combining cytochrome P450 and
CPR in respective in vivo models in each individual target tissue to be treated.
# 2006 Elsevier Inc. All rights reserved.
avai lab le at www.sc iencedi rect .com
journal homepage: www.e lsev ier .com/ locate /b iochempharm
1. Introduction
Cytochrome P450 (P450) enzymes are widely expressed in
prokaryotes and eukaryotes. P450 is involved in the metabolic
oxidation and reduction of a variety of compounds including
* Corresponding author. Tel.: +43 1 25077 2601; fax: +43 1 25077 2690.E-mail address: [email protected] (M. Renner).
0006-2952/$ – see front matter # 2006 Elsevier Inc. All rights reserveddoi:10.1016/j.bcp.2006.06.012
xenobiotics used in tumour therapy [1]. Mammalian P450
enzymes are mainly expressed in the liver and only at low
levels in other tissues or tumours [2]. Thus, delivery of
exogenous P450 genes to tumours is used in gene-directed
enzyme prodrug therapy (GDEPT) to enable the hydroxylation
.
b i o c h e m i c a l p h a r m a c o l o g y 7 2 ( 2 0 0 6 ) 8 9 3 – 9 0 1894
of chemotherapeutic prodrugs including cyclophosphamide
and ifosfamide (IFO) into their active forms [3,4].
The flavoprotein NADPH cytochrome P450 reductase (CPR)
interacts with P450 as an electron donor and catalyses P450
monooxygenase reactions [5]. Most tested drugs are activated
more efficiently in microsomes containing P450 and CPR as
compared to P450 alone [6,7]. Recently, the influence of CPR on
P450 has also been shown in transgenic mice, which carry a
liver-specific deletion of CPR leading to a reduced P450 activity
in this organ [8].
Since the amount of P450 often exceeds that of CPR in
microsomal membranes, especially when P450 is overex-
pressed in GDEPT, the CPR/P450 ratio has been increased by
coexpression of CPR to provide an enhanced supply of
electrons, thereby enhancing P450 function and thus resulting
in a superior therapeutic effect [9]. For instance, the human
P450 isoform CYP3A4 was overexpressed in V79 Chinese
hamster lung fibroblast cells and CYP3A4 enzymatic activity
was measured by the dealkylation and deethylation of 7-
alkoxyresorufins [10]. CPR coexpression in these cells stimu-
lated P450 activity 5–10-fold suggesting a lack of endogenous
CPR [11]. In other studies the CYP3A4 cDNA was amplified in
Chinese hamster ovary cells to obtain high level expression of
CYP3A4. Here coexpression of CPR increased CYP3A4 activity
15-fold, although P450/CPR coexpression was accompanied by
a decrease in the amount of immunologically and spectrally
detectable P450 [12]. CPR overexpression was assumed to
increase heme-oxygenase activity, which decreases intracel-
lular heme and thereby P450 protein levels [12].
Coexpression of CPR in P450 mediated GDEPT has been
described previously to be effective in 9L rat glioma derived
cells, where cell killing upon cyclophosphamide treatment
was increased in rat CPR/CYP2B1 coexpressing cell clones as
compared to cells expressing CYP2B1 alone [7]. CPR over-
expression increased the concentration of toxic derivatives of
cyclophosphamide in the presence of CYP2B1 leading to a
better therapeutic effect [7].
In this study we evaluated the effect of CPR coexpression
on CYP2B1 activity in different cell lines such as NIH3T3
mouse fibroblast cells and HEK293 human embryonal kidney
cells, as well as in two human breast cell lines (T47D, Hs578T)
and two human pancreatic tumour cell lines (Pan02, Panc-1).
Cell lines with and without CYP2B1 and/or CPR expression
cassettes were analyzed for the levels of respective protein
expression. CPR function analysed in cytochrome c assays and
CYP2B1 activity determined in metabolic resorufin, 4-hydro-
xylation and cell viability assays revealed no or even a dose
dependent inhibiting effect of CPR on CYP2B1 activity in the
majority of cell lines tested.
2. Material and methods
2.1. Plasmid construction
Construction of plasmids pCMV-CYP2B1 encoding the CYP2B1
gene under control of the immediate early cytomegalovirus
(CMV) enhancer/promoter region, as well as the retroviral
vector plasmid pPCCMm1, which drives CYP2B1 expression
from mouse mammary tumour virus (MMTV) promoter in
infected cells have been described elsewhere [13,14]. CPR
cDNA was cloned from rat liver by isolating mRNA using the
RNeasy Kit (Qiagen, Hilden, Germany) according to the
manufacturer’s instructions, and reverse transcribed using
primer 50-CTG ATC TAG ACT CGA GCT AGC TCC ACA CAT CTA
GTG AGT AGC GGC CCT TG-30. The obtained cDNA was PCR
amplified using additionally the forward primer 50-CGC CAA
GCT TCT CGA GCA CCA TGG GGG ACT CTC ACG AAG ACA CCA
GTG CCA C-30, and the resulting fragment was inserted into
the expression plasmid pcDNA3.1 (Invitrogen, Lofer, Austria)
via HindIII/XbaI restriction sites resulting in plasmid pCMV-
CPR. To construct the retroviral vector plasmid pLCSN, the
CYP2B1-fragment was released from plasmid pc3/2B1 [3] using
EcoRI and SmaI restriction enzymes and inserted into the large
EcoRI/HpaI fragment of plasmid pLXSN [15].
2.2. Cell lines, transfection and infection
Human 2GP19Talf amphotropic retroviral packaging cells [16],
human HEK293 [17], Pan02 [18], Panc-1 [19] and murine NIH3T3
[20] cells were grown in Dulbecco’s modified Eagle’s medium/
Glutamax (DMEM, Invitrogen) supplemented with 10% fetal
calf serum (FCS, Invitrogen). DMEM containing 10% FCS and
10 mg/l insulin (Sigma, Schnelldorf, Germany) was used to
cultivate Hs578T cells [21]. T47D cells [22] were grown in RPMI
1640 medium (Invitrogen) supplemented with 10% FCS and
10 mg/l insulin.
Transfections were performed using Lipofectamin 2000 as
recommended by the supplier (Invitrogen). In dose-dependent
experiments, 100 fmol of plasmid pCMV-CYP2B1 and 0, 12.5,
25, 50, 100 and 200 fmol of plasmid pCMV-CPR and 20 fmol of
plasmid pCMV-DsRed-Express (Becton-Dickinson, Schwechat,
Austria) as transfection control, respectively, were supple-
mented with plasmid pcDNA3.1 to a final amount of 320 fmol
plasmid DNA, which was then transfected into the respective
cell lines. Forty-eight hours after transient transfection, cells
were subjected to fluorescence activated cell sorting (FACS),
cytochrome c, resorufin and 4-hydroxy-ifosfamide hydroxyla-
tion assays.
Infection of 4 � 105 target cells with virus supernatant
from 2 � 106 virus producing cells was performed as
described previously [16]. For the generation of stable CYP2B1
expressing cell populations, cells infected with vectors LCSN
and PCCMm1, respectively, were selected and maintained in
the presence of 0.4 mg/ml geneticin (G418, Invitrogen). Cells
stably transfected with plasmid pCMV-CPR were selected
and cultivated in the presence of 0.3 mg/ml hygromycin B
(Sigma).
2.3. FACS analysis
Cells were trypsinised and washed twice with phosphate-
buffered saline (PBS). Then, 10,000 cells per sample were
analysed for red fluorescence by FACS (FACSCalibur, Becton-
Dickinson), by exciting at a wavelength of 488 nm and
detecting in the spectrum of 585 � 21 nm. The percentage of
red fluorescing cells determined indicates the transfection
efficiency. For determination of green fluorescence, cells were
excited at a wavelength of 488 nm and emission was detected
in the spectrum of 530 � 15 nm. Experiments were performed
b i o c h e m i c a l p h a r m a c o l o g y 7 2 ( 2 0 0 6 ) 8 9 3 – 9 0 1 895
twice in triplicates and mean values with corresponding
standard errors were calculated.
2.4. Western blot analysis
Briefly, cell monolayers were washed with cold PBS, lysed in
buffer (25% glycerol, 0.1 M Tris–HCl pH 6.8, 1% Triton X-100,
1 mM PMSF) and sonicated. Protein concentration of lysate
was measured using the DC protein assay kit (Bio-Rad, Vienna,
Austria). Thirty micrograms of the protein extract and 10 ml of
a prestained protein standard (GE Healthcare, Freiburg,
Germany), respectively, were separated using SDS polyacryl-
amide gel electrophoresis and blotted onto a polyvinylidene
fluoride membrane (Amersham Biosciences, Little Chalfont,
United Kingdom). The membrane was blocked using 5% milk
powder in PBS supplemented with 0.1% Tween 20 and probed
using a polyclonal goat anti-CYP2B1 antibody (Becton-Dick-
inson) diluted 1:5000 and a polyclonal goat anti-CPR antibody
(Daiichi Pure Chemicals, Tokyo, Japan) diluted 1:10000 in PBS.
After three washing steps with PBS, the membrane was
incubated with a horseradish-peroxidase-linked immunoglo-
bulin G anti-goat antibody (Dako, Glostrup, Denmark).
Membranes were treated with the enhanced chemilumines-
cence system (ECL; Amersham Biosciences) and signals were
visualized by exposure on X-ray films (Amersham Bio-
sciences). Signal intensities were quantified using the Adobe
Photoshop 7.0 programme. Additionally, load of equal
amounts of protein per lane was verified in respective
Coomassie staining.
2.5. NADPH-cytochrome P450 reductase assay
Cells were collected in PBS supplemented with 1% Triton X-100
(Sigma) and lysed by sonication to generate whole-cell extracts.
Fifty micrograms of protein samples were incubated at room
temperature using the Genetest NADPH regenerating system
according to the manufacturer’s instructions (Becton Dick-
inson, Heidelberg, Germany). The chromophore of cytochrome
c (Sigma–Aldrich) which is reduced by CPR in the presence of
NADPH absorbs at 550 nm with e = 21,000 M�1 cm�1. The rate of
cytochrome c reduction was monitored over a 5 min interval on
a U-1100 spectrophotometer (Hitachi, Dusseldorf, Germany).
Data are shown as absolute values unless indicated otherwise.
2.6. Resorufin assay
For determination of CYP2B1 activity 1 � 105 HEK293, Panc-1,
NIH3T3, Pan02, T47D, and Hs578T cells were seeded 72 h after
transfection. Then, an excess of 7-pentoxyresorufin was
added to a final concentration of 1.5 mM and the cells were
incubated for 4 h at 37 8C. Using an excitation wavelength of
520 nm, fluorescence was detected at an emission wavelength
of 590 nm in a microplate reader (Tecan, Salzburg, Austria).
Resorufin formation was determined by comparing the
fluorescence of samples to the resorufin standards. Experi-
ments were performed twice in quadruplicates. Data are
shown as absolute resorufin values and expressed as mean
values with bars reflecting the standard error unless indicated
otherwise. All analyses were conducted within linear ranges in
respect to cell number and incubation time.
2.7. Measurement of 4-hydroxy-ifosfamide metabolites
Cells treated with IFO were monitored for their ability to release
4-hydroxy-ifosfamide into the culture media according to the
method described by Schwartz et al. [23]. Briefly, 1 � 106 cells
were incubated for 8 h in 2 ml DMEM with 10% FCS containing
1 mM IFO and 5 mM semicarbazide to trap and stabilize the 4-
hydroxy metabolites of IFO. Then, a 125 ml aliquot of this
medium was incubated with 67 ml of 1 M HCl solution suppl-
emented with 6 g/l 3-aminophenol and 6 g/l hydroxylamine for
30 min at 90 8C. Using an excitation wavelength of 350 nm,
fluorescencewas detectedatan emissionwavelengthof 515 nm
ina microplatereader (Tecan). 4-Hydroxy-ifosfamide formation
was determined according to 4-hydroperoxyifosfamide stan-
dards (Baxter, Vienna, Austria). Experiments were performed
twice in triplicate. Data are normalized to pCMV-CYP2B1-trans-
fected HEK293 and Panc-1 cells, respectively, and expressed
as mean values with bars reflecting the standard error.
2.8. Cytochrome P450 CO difference spectrum
Briefly, 5 � 106 HEK293 cells were transfected in 10 cm tissue
culture dishes with 800 fmol of plasmid pCMV-CYP2B1,
160 fmol of plasmid pCMV-DsRed-Express and 1600 fmol either
of plasmid pCMV-CPR or pcDNA3.1 using Lipofectamin 2000 as
described above. Forty-eight hours after transfection, cells were
harvested with a rubber policeman into 1 ml Et3N buffer
(250 mM sucrose, 10 mM triethanolamine, 1mM EGTA, pH 7.4)
per dish. Cells were lysed in a 5 ml Potter tube with a tight Teflon
pestle for 4 min and subsequently centrifuged at 9700 � g for
10 min to remove nuclei, mitochondria and cell debris. CO
difference spectra were performed with minor modifications as
described previously [12]. Briefly, a few grains of sodium
dithionite were dissolved in the cell lysate supernatant.
Spectrum 1 was measured and recorded, the same sample
was gently bubbled with carbon monoxide for 1 min and
spectrum 2 was measured and recorded. Then, the difference
spectrum (spectrum 2 minus spectrum 1) was calculated [24].
2.9. Cell viability assay
Five � 103 HEK293 cells, HEK293 cells cotransfected with
200 fmol plasmid pCMV-CRP and 100 fmol plasmid pCMV-
CYP2B1, and HEK293 cells cotransfected with 200 fmol plasmid
pcDNA3.1 and 100 fmol plasmid pCMV-CYP2B1 were seeded in
the wells of a 96-well plate and exposed once to 1, 0.5, 0.25 and
0 mM ifosfamide, respectively. Five days later, cells were
incubated for 4 h in XTT solution of the Cell Proliferation Kit II
(Roche, Mannheim, Germany) and subsequently analysed in a
microplatereader(Tecan)atanexcitationwavelengthof490 nm
and an emission wavelength of 690 nm. Experiments were
performed in quadruplicates and standard errors calculated.
3. Results
3.1. Expression and function of CPR and CYP2B1
The influence of CPR on CYP2B1 activity in various human cell
lines was first investigated in transient cotransfection analyses.
b i o c h e m i c a l p h a r m a c o l o g y 7 2 ( 2 0 0 6 ) 8 9 3 – 9 0 1896
Table 1 – Comparison of CPR and CYP2B1 activity in parental cells and cells transfected with respective CPR and CYP2B1expression vectors
Cytochrome c reduction (nmol/(min mg)) CPR Resorufin assay (mM) CYP2B1
� + � +
aHEK293 7.8 � 2.0*** 201.5 � 40.4*** 0 4.1 � 0.2***
Panc-1 2.1 � 1.0*** 16.3 � 0.6*** 0 2.4 � 0.2***
a HEK293 and Panc-1 cells were transiently transfected with expression plasmids pCMV-CPR (CPR+), pCMV-CYP2B1 (CYP2B1+) and the non-
coding control vector pcDNA3.1 (CPR�, CYP2B1�), respectively. The CPR activity of cell lysates was determined in cytochrome c reduction
assays and the CYP2B1 activity in resorufin assays. Number of cytochrome c reduction is n � 5 and resorufin assay is n = 4. ***P < 0.001,
compared to parental cells
For this the CPR coding sequence was isolated using RT-PCR
techniques and inserted into an expression plasmid under
control of the CMV immediate early enhancer/promoter region
to allow constitutive and high level gene expression. Transient
transfections of 200 fmol of the resulting plasmid pCMV-CPR
into HEK293 cells revealed a CPR-mediated reduction of
cytochrome c at 201.5� 3.5 nmol/(min mg). This is an almost
30-fold higher CPR activity as compared to the CPR activity of
non-transfected HEK293 cells, indicating high-level, functional
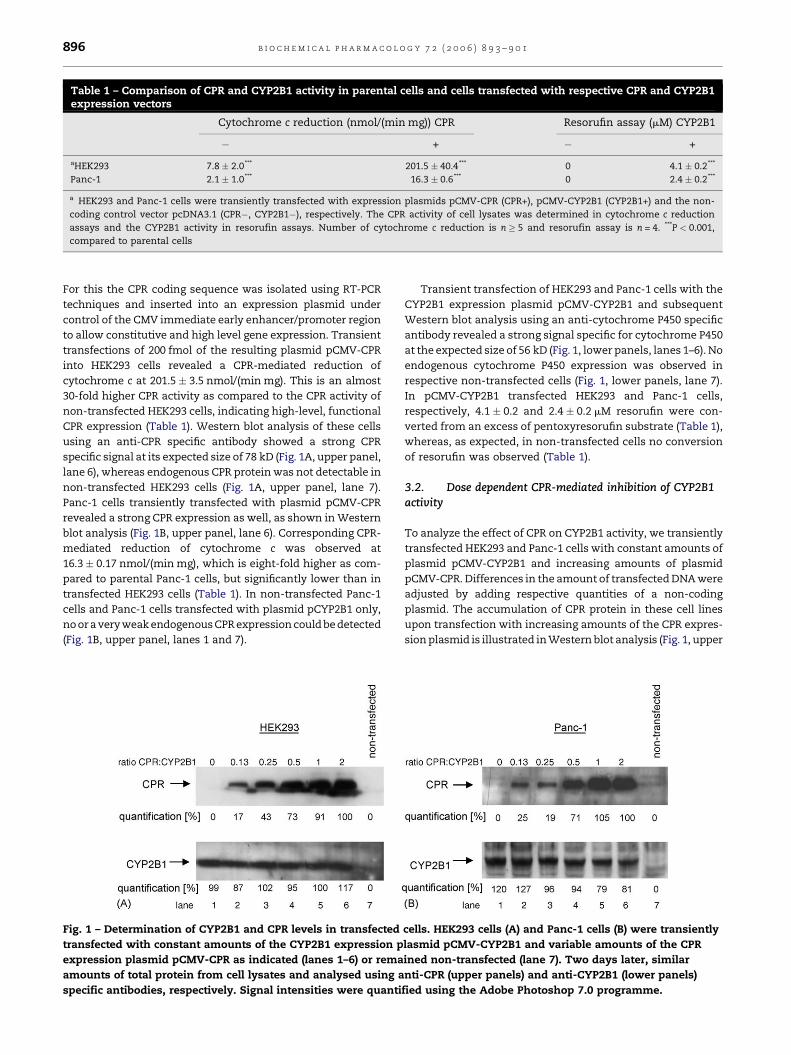
CPR expression (Table 1). Western blot analysis of these cells
using an anti-CPR specific antibody showed a strong CPR
specific signal at its expected size of 78 kD (Fig. 1A, upper panel,
lane 6), whereas endogenous CPR protein was not detectable in
non-transfected HEK293 cells (Fig. 1A, upper panel, lane 7).
Panc-1 cells transiently transfected with plasmid pCMV-CPR
revealed a strong CPR expression as well, as shown in Western
blot analysis (Fig. 1B, upper panel, lane 6). Corresponding CPR-
mediated reduction of cytochrome c was observed at
16.3� 0.17 nmol/(min mg), which is eight-fold higher as com-
pared to parental Panc-1 cells, but significantly lower than in
transfected HEK293 cells (Table 1). In non-transfected Panc-1
cells and Panc-1 cells transfected with plasmid pCYP2B1 only,
no or a very weak endogenous CPR expression could be detected
(Fig. 1B, upper panel, lanes 1 and 7).
Fig. 1 – Determination of CYP2B1 and CPR levels in transfected
transfected with constant amounts of the CYP2B1 expression p
expression plasmid pCMV-CPR as indicated (lanes 1–6) or rema
amounts of total protein from cell lysates and analysed using a
specific antibodies, respectively. Signal intensities were quanti
Transient transfection of HEK293 and Panc-1 cells with the
CYP2B1 expression plasmid pCMV-CYP2B1 and subsequent
Western blot analysis using an anti-cytochrome P450 specific
antibody revealed a strong signal specific for cytochrome P450
at the expected size of 56 kD (Fig. 1, lower panels, lanes 1–6). No
endogenous cytochrome P450 expression was observed in
respective non-transfected cells (Fig. 1, lower panels, lane 7).
In pCMV-CYP2B1 transfected HEK293 and Panc-1 cells,
respectively, 4.1 � 0.2 and 2.4 � 0.2 mM resorufin were con-
verted from an excess of pentoxyresorufin substrate (Table 1),
whereas, as expected, in non-transfected cells no conversion
of resorufin was observed (Table 1).
3.2. Dose dependent CPR-mediated inhibition of CYP2B1activity
To analyze the effect of CPR on CYP2B1 activity, we transiently
transfected HEK293 and Panc-1 cells with constant amounts of
plasmid pCMV-CYP2B1 and increasing amounts of plasmid
pCMV-CPR. Differences in the amount of transfected DNA were
adjusted by adding respective quantities of a non-coding
plasmid. The accumulation of CPR protein in these cell lines
upon transfection with increasing amounts of the CPR expres-
sion plasmid is illustrated in Western blot analysis (Fig. 1, upper
cells. HEK293 cells (A) and Panc-1 cells (B) were transiently
lasmid pCMV-CYP2B1 and variable amounts of the CPR
ined non-transfected (lane 7). Two days later, similar
nti-CPR (upper panels) and anti-CYP2B1 (lower panels)
fied using the Adobe Photoshop 7.0 programme.
b i o c h e m i c a l p h a r m a c o l o g y 7 2 ( 2 0 0 6 ) 8 9 3 – 9 0 1 897
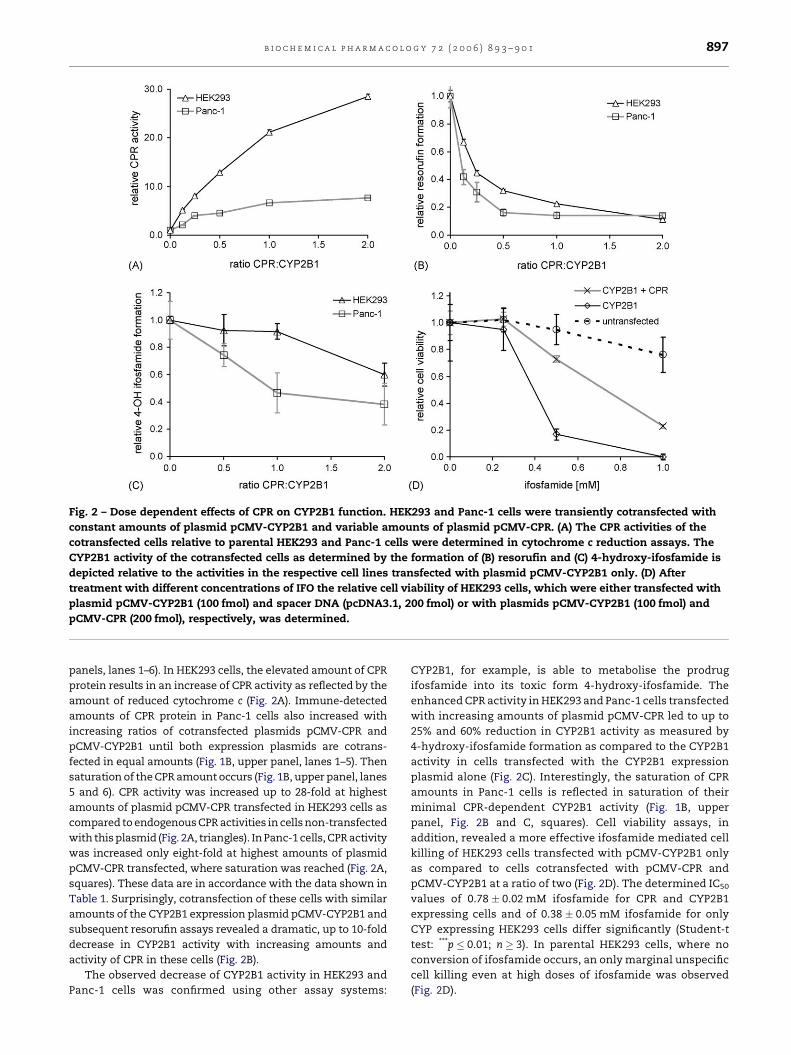
Fig. 2 – Dose dependent effects of CPR on CYP2B1 function. HEK293 and Panc-1 cells were transiently cotransfected with
constant amounts of plasmid pCMV-CYP2B1 and variable amounts of plasmid pCMV-CPR. (A) The CPR activities of the
cotransfected cells relative to parental HEK293 and Panc-1 cells were determined in cytochrome c reduction assays. The
CYP2B1 activity of the cotransfected cells as determined by the formation of (B) resorufin and (C) 4-hydroxy-ifosfamide is
depicted relative to the activities in the respective cell lines transfected with plasmid pCMV-CYP2B1 only. (D) After
treatment with different concentrations of IFO the relative cell viability of HEK293 cells, which were either transfected with
plasmid pCMV-CYP2B1 (100 fmol) and spacer DNA (pcDNA3.1, 200 fmol) or with plasmids pCMV-CYP2B1 (100 fmol) and
pCMV-CPR (200 fmol), respectively, was determined.
panels, lanes 1–6). In HEK293 cells, the elevated amount of CPR
protein results in an increase of CPR activity as reflected by the
amount of reduced cytochrome c (Fig. 2A). Immune-detected
amounts of CPR protein in Panc-1 cells also increased with
increasing ratios of cotransfected plasmids pCMV-CPR and
pCMV-CYP2B1 until both expression plasmids are cotrans-
fected in equal amounts (Fig. 1B, upper panel, lanes 1–5). Then
saturation of the CPR amount occurs (Fig. 1B, upper panel, lanes
5 and 6). CPR activity was increased up to 28-fold at highest
amounts of plasmid pCMV-CPR transfected in HEK293 cells as
compared to endogenous CPR activities in cells non-transfected
with this plasmid (Fig. 2A, triangles). In Panc-1 cells, CPR activity
was increased only eight-fold at highest amounts of plasmid
pCMV-CPR transfected, where saturation was reached (Fig. 2A,
squares). These data are in accordance with the data shown in
Table 1. Surprisingly, cotransfection of these cells with similar
amounts of the CYP2B1 expression plasmid pCMV-CYP2B1 and
subsequent resorufin assays revealed a dramatic, up to 10-fold
decrease in CYP2B1 activity with increasing amounts and
activity of CPR in these cells (Fig. 2B).
The observed decrease of CYP2B1 activity in HEK293 and
Panc-1 cells was confirmed using other assay systems:
CYP2B1, for example, is able to metabolise the prodrug
ifosfamide into its toxic form 4-hydroxy-ifosfamide. The
enhanced CPR activity in HEK293 and Panc-1 cells transfected
with increasing amounts of plasmid pCMV-CPR led to up to
25% and 60% reduction in CYP2B1 activity as measured by
4-hydroxy-ifosfamide formation as compared to the CYP2B1
activity in cells transfected with the CYP2B1 expression
plasmid alone (Fig. 2C). Interestingly, the saturation of CPR
amounts in Panc-1 cells is reflected in saturation of their
minimal CPR-dependent CYP2B1 activity (Fig. 1B, upper
panel, Fig. 2B and C, squares). Cell viability assays, in
addition, revealed a more effective ifosfamide mediated cell
killing of HEK293 cells transfected with pCMV-CYP2B1 only
as compared to cells cotransfected with pCMV-CPR and
pCMV-CYP2B1 at a ratio of two (Fig. 2D). The determined IC50
values of 0.78 � 0.02 mM ifosfamide for CPR and CYP2B1
expressing cells and of 0.38 � 0.05 mM ifosfamide for only
CYP expressing HEK293 cells differ significantly (Student-t
test: ***p � 0.01; n � 3). In parental HEK293 cells, where no
conversion of ifosfamide occurs, an only marginal unspecific
cell killing even at high doses of ifosfamide was observed
(Fig. 2D).
b i o c h e m i c a l p h a r m a c o l o g y 7 2 ( 2 0 0 6 ) 8 9 3 – 9 0 1898
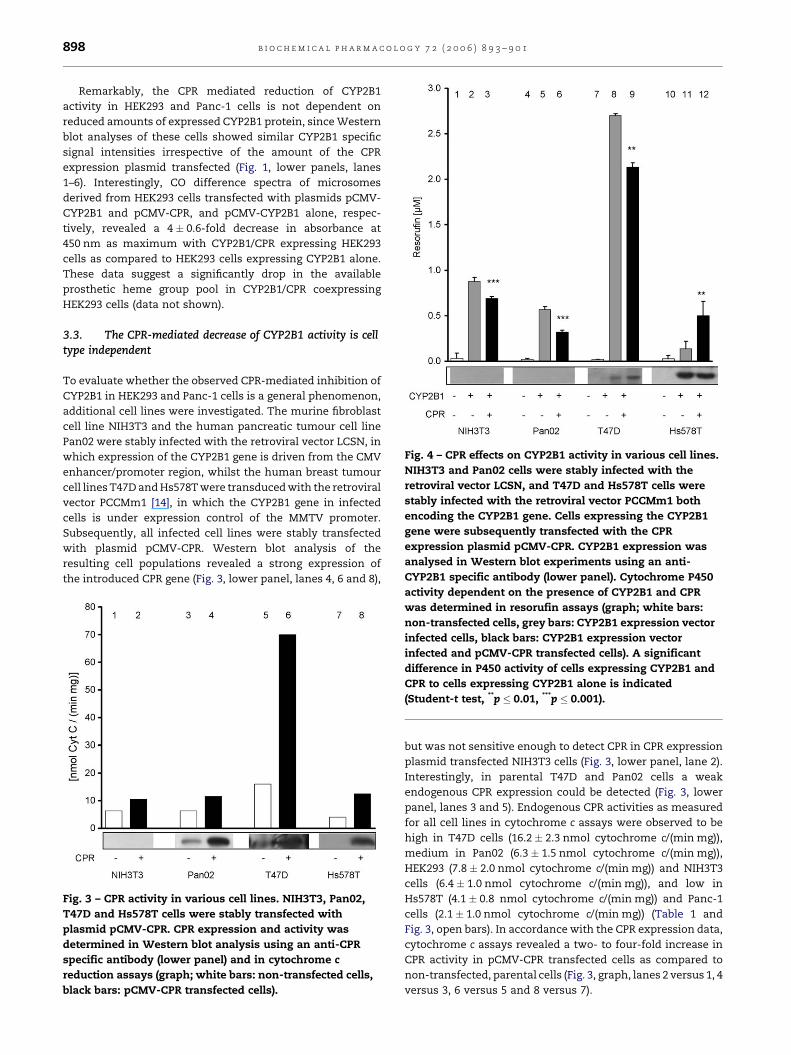
Fig. 4 – CPR effects on CYP2B1 activity in various cell lines.
NIH3T3 and Pan02 cells were stably infected with the
retroviral vector LCSN, and T47D and Hs578T cells were
stably infected with the retroviral vector PCCMm1 both
encoding the CYP2B1 gene. Cells expressing the CYP2B1
gene were subsequently transfected with the CPR
expression plasmid pCMV-CPR. CYP2B1 expression was
analysed in Western blot experiments using an anti-
CYP2B1 specific antibody (lower panel). Cytochrome P450
Remarkably, the CPR mediated reduction of CYP2B1
activity in HEK293 and Panc-1 cells is not dependent on
reduced amounts of expressed CYP2B1 protein, since Western
blot analyses of these cells showed similar CYP2B1 specific
signal intensities irrespective of the amount of the CPR
expression plasmid transfected (Fig. 1, lower panels, lanes
1–6). Interestingly, CO difference spectra of microsomes
derived from HEK293 cells transfected with plasmids pCMV-
CYP2B1 and pCMV-CPR, and pCMV-CYP2B1 alone, respec-
tively, revealed a 4 � 0.6-fold decrease in absorbance at
450 nm as maximum with CYP2B1/CPR expressing HEK293
cells as compared to HEK293 cells expressing CYP2B1 alone.
These data suggest a significantly drop in the available
prosthetic heme group pool in CYP2B1/CPR coexpressing
HEK293 cells (data not shown).
3.3. The CPR-mediated decrease of CYP2B1 activity is celltype independent
To evaluate whether the observed CPR-mediated inhibition of
CYP2B1 in HEK293 and Panc-1 cells is a general phenomenon,
additional cell lines were investigated. The murine fibroblast
cell line NIH3T3 and the human pancreatic tumour cell line
Pan02 were stably infected with the retroviral vector LCSN, in
which expression of the CYP2B1 gene is driven from the CMV
enhancer/promoter region, whilst the human breast tumour
cell lines T47D and Hs578T were transduced with the retroviral
vector PCCMm1 [14], in which the CYP2B1 gene in infected
cells is under expression control of the MMTV promoter.
Subsequently, all infected cell lines were stably transfected
with plasmid pCMV-CPR. Western blot analysis of the
resulting cell populations revealed a strong expression of
the introduced CPR gene (Fig. 3, lower panel, lanes 4, 6 and 8),
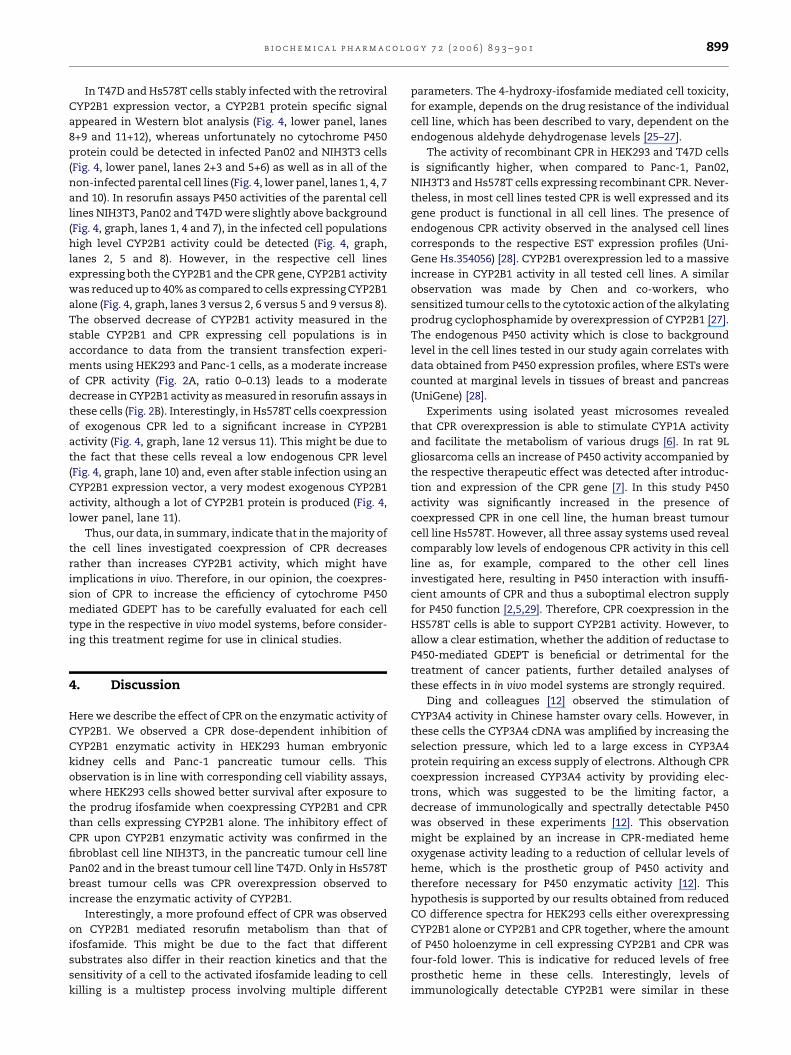
Fig. 3 – CPR activity in various cell lines. NIH3T3, Pan02,
T47D and Hs578T cells were stably transfected with
plasmid pCMV-CPR. CPR expression and activity was
determined in Western blot analysis using an anti-CPR
specific antibody (lower panel) and in cytochrome c
reduction assays (graph; white bars: non-transfected cells,
black bars: pCMV-CPR transfected cells).
activity dependent on the presence of CYP2B1 and CPR
was determined in resorufin assays (graph; white bars:
non-transfected cells, grey bars: CYP2B1 expression vector
infected cells, black bars: CYP2B1 expression vector
infected and pCMV-CPR transfected cells). A significant
difference in P450 activity of cells expressing CYP2B1 and
CPR to cells expressing CYP2B1 alone is indicated
(Student-t test, **p � 0.01, ***p � 0.001).
but was not sensitive enough to detect CPR in CPR expression
plasmid transfected NIH3T3 cells (Fig. 3, lower panel, lane 2).
Interestingly, in parental T47D and Pan02 cells a weak
endogenous CPR expression could be detected (Fig. 3, lower
panel, lanes 3 and 5). Endogenous CPR activities as measured
for all cell lines in cytochrome c assays were observed to be
high in T47D cells (16.2 � 2.3 nmol cytochrome c/(min mg)),
medium in Pan02 (6.3 � 1.5 nmol cytochrome c/(min mg)),
HEK293 (7.8 � 2.0 nmol cytochrome c/(min mg)) and NIH3T3
cells (6.4 � 1.0 nmol cytochrome c/(min mg)), and low in
Hs578T (4.1 � 0.8 nmol cytochrome c/(min mg)) and Panc-1
cells (2.1 � 1.0 nmol cytochrome c/(min mg)) (Table 1 and
Fig. 3, open bars). In accordance with the CPR expression data,
cytochrome c assays revealed a two- to four-fold increase in
CPR activity in pCMV-CPR transfected cells as compared to
non-transfected, parental cells (Fig. 3, graph, lanes 2 versus 1, 4
versus 3, 6 versus 5 and 8 versus 7).
b i o c h e m i c a l p h a r m a c o l o g y 7 2 ( 2 0 0 6 ) 8 9 3 – 9 0 1 899
In T47D and Hs578T cells stably infected with the retroviral
CYP2B1 expression vector, a CYP2B1 protein specific signal
appeared in Western blot analysis (Fig. 4, lower panel, lanes
8+9 and 11+12), whereas unfortunately no cytochrome P450
protein could be detected in infected Pan02 and NIH3T3 cells
(Fig. 4, lower panel, lanes 2+3 and 5+6) as well as in all of the
non-infected parental cell lines (Fig. 4, lower panel, lanes 1, 4, 7
and 10). In resorufin assays P450 activities of the parental cell
lines NIH3T3, Pan02 and T47D were slightly above background
(Fig. 4, graph, lanes 1, 4 and 7), in the infected cell populations
high level CYP2B1 activity could be detected (Fig. 4, graph,
lanes 2, 5 and 8). However, in the respective cell lines
expressing both the CYP2B1 and the CPR gene, CYP2B1 activity
was reduced up to 40% as compared to cells expressing CYP2B1
alone (Fig. 4, graph, lanes 3 versus 2, 6 versus 5 and 9 versus 8).
The observed decrease of CYP2B1 activity measured in the
stable CYP2B1 and CPR expressing cell populations is in
accordance to data from the transient transfection experi-
ments using HEK293 and Panc-1 cells, as a moderate increase
of CPR activity (Fig. 2A, ratio 0–0.13) leads to a moderate
decrease in CYP2B1 activity as measured in resorufin assays in
these cells (Fig. 2B). Interestingly, in Hs578T cells coexpression
of exogenous CPR led to a significant increase in CYP2B1
activity (Fig. 4, graph, lane 12 versus 11). This might be due to
the fact that these cells reveal a low endogenous CPR level
(Fig. 4, graph, lane 10) and, even after stable infection using an
CYP2B1 expression vector, a very modest exogenous CYP2B1
activity, although a lot of CYP2B1 protein is produced (Fig. 4,
lower panel, lane 11).
Thus, our data, in summary, indicate that in the majority of
the cell lines investigated coexpression of CPR decreases
rather than increases CYP2B1 activity, which might have
implications in vivo. Therefore, in our opinion, the coexpres-
sion of CPR to increase the efficiency of cytochrome P450
mediated GDEPT has to be carefully evaluated for each cell
type in the respective in vivo model systems, before consider-
ing this treatment regime for use in clinical studies.
4. Discussion
Here we describe the effect of CPR on the enzymatic activity of
CYP2B1. We observed a CPR dose-dependent inhibition of
CYP2B1 enzymatic activity in HEK293 human embryonic
kidney cells and Panc-1 pancreatic tumour cells. This
observation is in line with corresponding cell viability assays,
where HEK293 cells showed better survival after exposure to
the prodrug ifosfamide when coexpressing CYP2B1 and CPR
than cells expressing CYP2B1 alone. The inhibitory effect of
CPR upon CYP2B1 enzymatic activity was confirmed in the
fibroblast cell line NIH3T3, in the pancreatic tumour cell line
Pan02 and in the breast tumour cell line T47D. Only in Hs578T
breast tumour cells was CPR overexpression observed to
increase the enzymatic activity of CYP2B1.
Interestingly, a more profound effect of CPR was observed
on CYP2B1 mediated resorufin metabolism than that of
ifosfamide. This might be due to the fact that different
substrates also differ in their reaction kinetics and that the
sensitivity of a cell to the activated ifosfamide leading to cell
killing is a multistep process involving multiple different
parameters. The 4-hydroxy-ifosfamide mediated cell toxicity,
for example, depends on the drug resistance of the individual
cell line, which has been described to vary, dependent on the
endogenous aldehyde dehydrogenase levels [25–27].
The activity of recombinant CPR in HEK293 and T47D cells
is significantly higher, when compared to Panc-1, Pan02,
NIH3T3 and Hs578T cells expressing recombinant CPR. Never-
theless, in most cell lines tested CPR is well expressed and its
gene product is functional in all cell lines. The presence of
endogenous CPR activity observed in the analysed cell lines
corresponds to the respective EST expression profiles (Uni-
Gene Hs.354056) [28]. CYP2B1 overexpression led to a massive
increase in CYP2B1 activity in all tested cell lines. A similar
observation was made by Chen and co-workers, who
sensitized tumour cells to the cytotoxic action of the alkylating
prodrug cyclophosphamide by overexpression of CYP2B1 [27].
The endogenous P450 activity which is close to background
level in the cell lines tested in our study again correlates with
data obtained from P450 expression profiles, where ESTs were
counted at marginal levels in tissues of breast and pancreas
(UniGene) [28].
Experiments using isolated yeast microsomes revealed
that CPR overexpression is able to stimulate CYP1A activity
and facilitate the metabolism of various drugs [6]. In rat 9L
gliosarcoma cells an increase of P450 activity accompanied by
the respective therapeutic effect was detected after introduc-
tion and expression of the CPR gene [7]. In this study P450
activity was significantly increased in the presence of
coexpressed CPR in one cell line, the human breast tumour
cell line Hs578T. However, all three assay systems used reveal
comparably low levels of endogenous CPR activity in this cell
line as, for example, compared to the other cell lines
investigated here, resulting in P450 interaction with insuffi-
cient amounts of CPR and thus a suboptimal electron supply
for P450 function [2,5,29]. Therefore, CPR coexpression in the
HS578T cells is able to support CYP2B1 activity. However, to
allow a clear estimation, whether the addition of reductase to
P450-mediated GDEPT is beneficial or detrimental for the
treatment of cancer patients, further detailed analyses of
these effects in in vivo model systems are strongly required.
Ding and colleagues [12] observed the stimulation of
CYP3A4 activity in Chinese hamster ovary cells. However, in
these cells the CYP3A4 cDNA was amplified by increasing the
selection pressure, which led to a large excess in CYP3A4
protein requiring an excess supply of electrons. Although CPR
coexpression increased CYP3A4 activity by providing elec-
trons, which was suggested to be the limiting factor, a
decrease of immunologically and spectrally detectable P450
was observed in these experiments [12]. This observation
might be explained by an increase in CPR-mediated heme
oxygenase activity leading to a reduction of cellular levels of
heme, which is the prosthetic group of P450 activity and
therefore necessary for P450 enzymatic activity [12]. This
hypothesis is supported by our results obtained from reduced
CO difference spectra for HEK293 cells either overexpressing
CYP2B1 alone or CYP2B1 and CPR together, where the amount
of P450 holoenzyme in cell expressing CYP2B1 and CPR was
four-fold lower. This is indicative for reduced levels of free
prosthetic heme in these cells. Interestingly, levels of
immunologically detectable CYP2B1 were similar in these
b i o c h e m i c a l p h a r m a c o l o g y 7 2 ( 2 0 0 6 ) 8 9 3 – 9 0 1900
differently transfected cells. Henderson et al. [30] developed
hepatic CPR-null mice, which are characterized by a decrease
of P450 activity, but, however, an increase in P450 protein
levels in the liver.
Coexpression of the human CYP2B6 and CPR genes has also
been analysed in context of a CYP2B6/CPR fusion cassette
inserted into an adenoviral vector construct [31]. Infection of
HepG2 cells and several pulmonary cell lines with this viral
vector resulted in a three-fold increase in CPR activity and a
slight improvement in cell killing properties after cyclophos-
phamide treatment of the pulmonary cell lines [31]. Interest-
ingly, overexpression of CPR in HepG2 cells, which had the
highest levels of endogenous CPR activity, did not increase
cyclophosphamide-induced, CYP2B6-mediated cytotoxicity,
even when CPR and CYP2B6 were expressed at high levels
from separated gene cassettes [31].
Taken together, the data presented here clearly show that
in the majority of the cell lines tested here, the coexpression of
CPR did not improve activity of the therapeutic CYP2B1
protein, but, moreover, had a diametrically opposed effect by
inhibiting CYP2B1 function. Thus, combination of P450 and
CPR in GDEPT has to be evaluated on a case by case basis in
order to avoid compromising the therapeutic benefit of such
a treatment.
Acknowledgments
We thank Reinhard Ertl for excellent technical support in
performing FACS analysis. This project was financed in part by
The Austrian Research Promotion Fund programme, FFF Grant
No. 804960.
r e f e r e n c e s
[1] Nelson DR, Kamataki T, Waxman DJ, Guengerich FP,Estabrook RW, Feyereisen R, et al. The P450 superfamily:update on new sequences, gene mapping, accessionnumbers, early trivial names of enzymes, andnomenclature. DNA Cell Biol 1993;12:1–51.
[2] Yu LJ, Matias J, Scudiero DA, Hite KM, Monks A, SausvilleEA, et al. P450 enzyme expression patterns in the NCIhuman tumor cell line panel. Drug Metab Dispos2001;29:304–12.
[3] Lohr M, Muller P, Karle P, Stange J, Mitzner S, Jesnowski R,et al. Targeted chemotherapy by intratumour injection ofencapsulated cells engineered to produce CYP2B1, anifosfamide activating cytochrome P450. Gene Ther1998;5:1070–8.
[4] Le Blanc GA, Waxman DJ. Interaction of anticancer drugswith hepatic monooxygenase enzymes. Drug Metab Rev1989;20:395–439.
[5] Peterson JA, Ebel RE, O’Keeffe DH, Matsubara T, EstabrookRW. Temperature dependence of cytochrome P-450reduction. A model for NADPH-cytochrome P-450reductase:cytochrome P-450 interaction. J Biol Chem1976;251:4010–6.
[6] Sengstag C, Eugster HP, Wurgler FE. High promutagenactivating capacity of yeast microsomes containing humancytochrome P-450 1A and human NADPH-cytochrome P-450 reductase. Carcinogenesis 1994;15:837–43.
[7] Chen L, Yu LJ, Waxman DJ. Potentiation of cytochromeP450/cyclophosphamide-based cancer gene therapy bycoexpression of the P450 reductase gene. Cancer Res1997;57:4830–7.
[8] Wang XJ, Chamberlain M, Vassieva O, Henderson CJ, WolfCR. Relationship between hepatic phenotype and changesin gene expression in cytochrome P450 reductase (POR) nullmice. Biochem J 2005;388:857–67.
[9] Li DN, Pritchard MP, Hanlon SP, Burchell B, Wolf CR,Friedberg T. Competition between cytochrome P-450isozymes for NADPH-cytochrome P-450 oxidoreductaseaffects drug metabolism. J Pharmacol Exp Ther1999;289:661–7.
[10] Schmalix WA, Lang D, Schneider A, Bocker R, Greim H,Doehmer J. Stable expression and coexpression of humancytochrome P450 oxidoreductase and cytochrome P450 1A2in V79 Chinese hamster cells: sensitivity to quinones andbiotransformation of 7-alkoxyresorufins and triazines.Drug Metab Dispos 1996;24:1314–9.
[11] Schneider A, Schmalix WA, Siruguri V, de Groene EM,Horbach GJ, Kleingeist B, et al. Stable expression of humancytochrome P450 3A4 in conjunction with human NADPH-cytochrome P450 oxidoreductase in V79 Chinese hamstercells. Arch Biochem Biophys 1996;332:295–304.
[12] Ding S, Yao D, Burchell B, Wolf CR, Friedberg T. High levelsof recombinant CYP3A4 expression in Chinese hamsterovary cells are modulated by coexpressed human P450reductase and hemin supplementation. Arch BiochemBiophys 1997;348:403–10.
[13] Lengler J, Holzmuller H, Salmons B, Gunzburg WH, RennerM. FMDV-2A sequence and protein arrangement contributeto functionality of CYP2B1-reporter fusion protein. AnalBiochem 2005;343:116–24.
[14] Klein R, Ruttkowski B, Knapp E, Salmons B, Gunzburg WH,Hohenadl C. WPRE-mediated enhancement of geneexpression is promoter and cell line specific. Gene2006;372:153–61.
[15] Klein D, Indraccolo S, von Rombs K, Amadori A, Salmons B,Gunzburg WH. Rapid identification of viable retrovirus-transduced cells using the green fluorescent protein as amarker. Gene Ther 1997;4:1256–60.
[16] Pambalk K, Hohenadl C, Salmons B, Gunzburg WH, RennerM. Specific packaging of spliced retroviral vector transcriptslacking the Psi-region. Biochem Biophys Res Commun2002;293:239–46.
[17] Graham FL, Smiley J, Russell WC, Nairn R. Characteristics ofa human cell line transformed by DNA from humanadenovirus type 5. J Gen Virol 1977;36:59–74.
[18] Jaffee EM, Schutte M, Gossett J, Morsberger LA, Adler AJ,Thomas M, et al. Development and characterization of acytokine-secreting pancreatic adenocarcinoma vaccinefrom primary tumors for use in clinical trials. Cancer J SciAm 1998;4:194–203.
[19] Lieber M, Mazzetta J, Nelson-Rees W, Kaplan M, Todaro G.Establishment of a continuous tumor-cell line (panc-1)from a human carcinoma of the exocrine pancreas. Int JCancer 1975;15:741–7.
[20] Jainchill JL, Aaronson SA, Todaro GJ. Murine sarcoma andleukemia viruses: assay using clonal lines of contact-inhibited mouse cells. J Virol 1969;4:549–53.
[21] Hackett AJ, Smith HS, Springer EL, Owens RB, Nelson-ReesWA, Riggs JL, et al. Two syngeneic cell lines from humanbreast tissue: the aneuploid mammary epithelial (Hs578T)and the diploid myoepithelial (Hs578Bst) cell lines. J NatlCancer Inst 1977;58:1795–806.
[22] Judge SM, Chatterton Jr RT. Progesterone-specificstimulation of triglyceride biosynthesis in a breast cancercell line (T-47D). Cancer Res 1983;43:4407–12.
b i o c h e m i c a l p h a r m a c o l o g y 7 2 ( 2 0 0 6 ) 8 9 3 – 9 0 1 901
[23] Schwartz PS, Chen CS, Waxman DJ. Sustained P450expression and prodrug activation in boluscyclophosphamide-treated cultured tumor cells. Impact ofprodrug schedule on P450 gene-directed enzyme prodrugtherapy. Cancer Gene Ther 2003;10:571–82.
[24] Omura T, Sato R. The carbon monoxide-binding pigment ofliver microsomes. I. Evidence for its hemoprotein nature. JBiol Chem 1964;239:2370–8.
[25] Russo JE, Hilton J. Characterization of cytosolic aldehydedehydrogenase from cyclophosphamide resistant L1210cells. Cancer Res 1988;48:2963–8.
[26] Hilton J. Role of aldehyde dehydrogenase incyclophosphamide-resistant L1210 leukemia. Cancer Res1984;44:5156–60.
[27] Chen L, Waxman DJ. Intratumoral activation and enhancedchemotherapeutic effect of oxazaphosphorines followingcytochrome P-450 gene transfer: development of a
combined chemotherapy/cancer gene therapy strategy.Cancer Res 1995;55:581–9.
[28] http://www.ncbi.nlm.nih.gov/entrez/query.fcgi?CMD=search&DB=unigene.
[29] Huang Z, Raychowdhury MK, Waxman DJ. Impact of liverP450 reductase suppression on cyclophosphamideactivation, pharmacokinetics and antitumoral activity in acytochrome P450-based cancer gene therapy model. CancerGene Ther 2000;7:1034–42.
[30] Henderson CJ, Otto DM, Carrie D, Magnuson MA, McLarenAW, Rosewell I, et al. Inactivation of the hepaticcytochrome P450 system by conditional deletion of hepaticcytochrome P450 reductase. J Biol Chem 2003;278:13480–6.
[31] Tychopoulos M, Corcos L, Genne P, Beaune P, de Waziers I. Avirus-directed enzyme prodrug therapy (VDEPT) strategy forlung cancer using a CYP2B6/NADPH-cytochrome P450reductase fusion protein. Cancer Gene Ther 2005;12:497–508.