currents of change
TRANSCRIPT

november/december 2011 IEEE power & energy magazine 47
Currents of Change
European Experience and Perspectives with High Wind Penetration Levels
By Hannele Holttinen, Antje G. Orths, Peter Børre Eriksen, Jorge Hidalgo, Ana Estanqueiro, Frank Groome, Yvonne Coughlan, Hendrik Neumann, Bernhard Lange, Frans van Hulle, and Ivan Dudurych
© P
HO
TOD
ISC
Digital Object Identifi er 10.1109/MPE.2011.942351 Date of publication: 21 October 2011
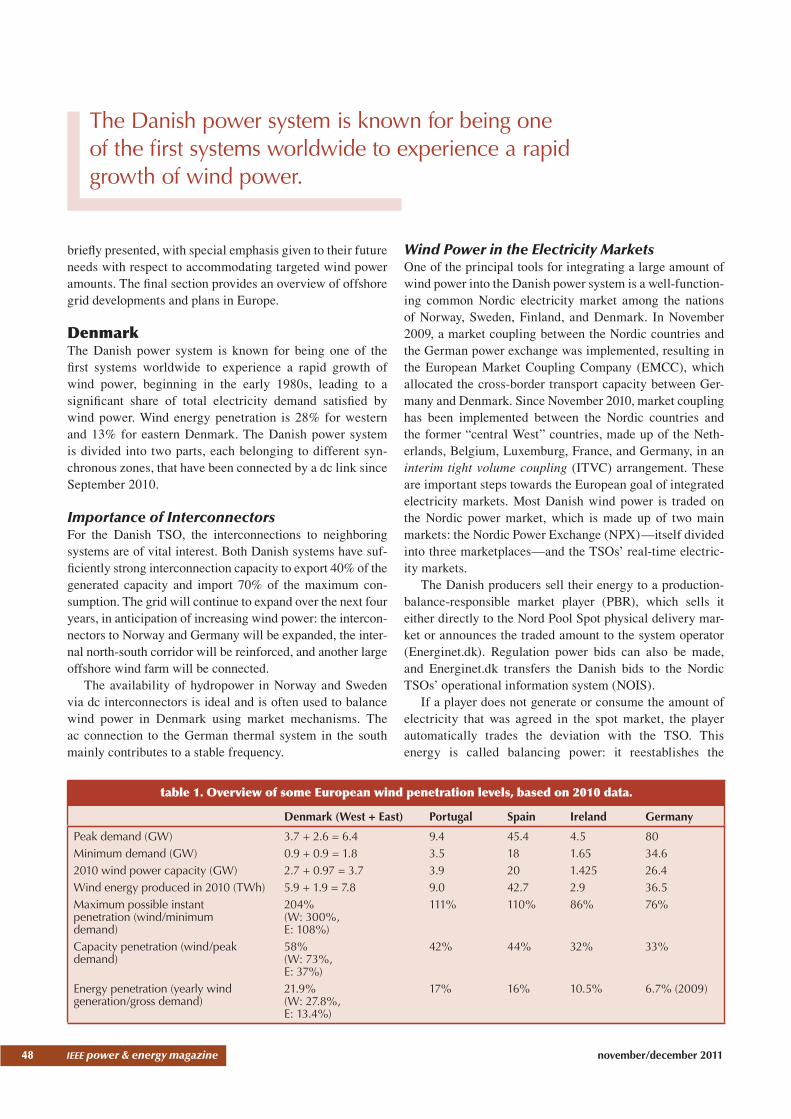
TTHE POWER SYSTEMS IN DENMARK, PORTUGAL, Spain, Ireland, and Germany have some of the highest wind penetrations in the world, as shown in Table 1.
The management of the different power systems to date, with increasing amounts of wind energy, has been success-ful. There have been no reported incidents in which wind has directly or indirectly been a major factor causing opera-tional problems on the system. In some areas with high wind penetration, however, the transmission system operator (TSO) had to increase remedial actions signifi cantly in order to decrease the loading of system assets during times of high wind power infeed. In some areas, the risk of faults may have increased. Higher targets for wind power will mean even higher penetration levels locally and high penetration levels in larger power systems. There are a number of issues that will require active management in the near future; in some cases, such management is needed today. In this article, the situations of fi ve countries with high wind penetration are
1540-7977/11/$26.00©2011 IEEE
48 IEEE power & energy magazine november/december 2011
table 1. Overview of some European wind penetration levels, based on 2010 data.
Denmark (West + East) Portugal Spain Ireland Germany
Peak demand (GW) 3.7 + 2.6 = 6.4 9.4 45.4 4.5 80Minimum demand (GW) 0.9 + 0.9 = 1.8 3.5 18 1.65 34.62010 wind power capacity (GW) 2.7 + 0.97 = 3.7 3.9 20 1.425 26.4Wind energy produced in 2010 (TWh) 5.9 + 1.9 = 7.8 9.0 42.7 2.9 36.5Maximum possible instant penetration (wind/minimum demand)
204% (W: 300%, E: 108%)
111% 110% 86% 76%
Capacity penetration (wind/peak demand)
58% (W: 73%,E: 37%)
42% 44% 32% 33%
Energy penetration (yearly wind generation/gross demand)
21.9%(W: 27.8%, E: 13.4%)
17% 16% 10.5% 6.7% (2009)
briefl y presented, with special emphasis given to their future needs with respect to accommodating targeted wind power amounts. The fi nal section provides an overview of offshore grid developments and plans in Europe.
DenmarkThe Danish power system is known for being one of the fi rst systems worldwide to experience a rapid growth of wind power, beginning in the early 1980s, leading to a signifi cant share of total electricity demand satisfi ed by wind power. Wind energy penetration is 28% for western and 13% for eastern Denmark. The Danish power system is divided into two parts, each belonging to different syn-chronous zones, that have been connected by a dc link since September 2010.
Importance of InterconnectorsFor the Danish TSO, the interconnections to neighboring systems are of vital interest. Both Danish systems have suf-fi ciently strong interconnection capacity to export 40% of the generated capacity and import 70% of the maximum con-sumption. The grid will continue to expand over the next four years, in anticipation of increasing wind power: the intercon-nectors to Norway and Germany will be expanded, the inter-nal north-south corridor will be reinforced, and another large offshore wind farm will be connected.
The availability of hydropower in Norway and Sweden via dc interconnectors is ideal and is often used to balance wind power in Denmark using market mechanisms. The ac connection to the German thermal system in the south mainly contributes to a stable frequency.
Wind Power in the Electricity MarketsOne of the principal tools for integrating a large amount of wind power into the Danish power system is a well-function-ing common Nordic electricity market among the nations of Norway, Sweden, Finland, and Denmark. In November 2009, a market coupling between the Nordic countries and the German power exchange was implemented, resulting in the European Market Coupling Company (EMCC), which allocated the cross-border transport capacity between Ger-many and Denmark. Since November 2010, market coupling has been implemented between the Nordic countries and the former “central West” countries, made up of the Neth-erlands, Belgium, Luxemburg, France, and Germany, in an interim tight volume coupling (ITVC) arrangement. These are important steps towards the European goal of integrated electricity markets. Most Danish wind power is traded on the Nordic power market, which is made up of two main markets: the Nordic Power Exchange (NPX)—itself divided into three marketplaces—and the TSOs’ real-time electric-ity markets.
The Danish producers sell their energy to a production-balance-responsible market player (PBR), which sells it either directly to the Nord Pool Spot physical delivery mar-ket or announces the traded amount to the system operator (Energinet.dk). Regulation power bids can also be made, and Energinet.dk transfers the Danish bids to the Nordic TSOs’ operational information system (NOIS).
If a player does not generate or consume the amount of electricity that was agreed in the spot market, the player automatically trades the deviation with the TSO. This energy is called balancing power: it reestablishes the
The Danish power system is known for being one of the first systems worldwide to experience a rapid growth of wind power.
november/december 2011 IEEE power & energy magazine 49
balance between generation and consumption for each player. In this way, the regulating power expenses paid by the TSO are transferred to the players responsible for the imbalance. This procedure of balance settlement is part of the regulating power market.
Wind power has contributed to the market design in that a negative price has been allowed since 30 November 2009. Before then, the Nord Pool Spot price was set to zero dur-ing hours of excess generation due to wind. By implement-ing negative spot prices, suppliers have a stronger incentive to reduce their supply bids in hours with very strong wind forecasts, and consumers also have a stronger incentive to use electricity in hours with negative prices. In western Den-mark, there were two incidents of negative prices in Decem-ber 2009 (a total of nine hours) and fi ve incidents in all of 2010 (a total of 11 hours). In the fi rst half of 2011, western and eastern Denmark have each experienced ten hours with negative prices.
Wind power and changes in market design have also pushed the combined heat and power (CHP) plants to move toward more fl exible operation. Even the smallest units are now scheduled according to the spot market. Currently, one-third of the local-scale CHP plants are not only operating on market terms but active in the regulating power market. In addition, in response to a change in the tax on using electric-ity for heating purposes, electric boilers have been installed in connection with some CHP plants. These units are con-structed for bidding on the down-regulating power market (i.e., to cope with increased consumption) and/or the reserve market.
ForecastingThe probability of an excess or defi cit of generation is esti-mated some days before the day of operation. With a large share of wind power capacity in the grid, it is important to have good wind forecasts in order to know whether wind power capacity is available or not.
The Danish TSO is the PBR for about one-third of the installed Danish wind power capacity. This gives an eco-nomic incentive to use optimized wind power forecasts when trading on the spot market at noon for the next day of operation. At present, the overall annual mean absolute error (MAE) on day-ahead forecasts amounts to about 5% relative to the installed wind power capacity. The intraday power market, though having low liquidity, is used from 3 p.m. the day before up until one hour before operation. This market is followed by the regulating power market, used several hours
before the hour of operation until the hour of operation. Wind power forecasts are updated every 15 minutes, with a fi ve-minute resolution. By using a scaling-up procedure, the actual wind production is estimated, thus facilitating opti-mal trading at the intraday market.
Future ChallengesThe Danish government has ambitious plans for transform-ing Denmark into a country free of fossil fuels by 2050. Most of the renewable potential will be provided by wind energy, mainly from offshore, which will be connected to the transmission system. Simultaneously, the transport and heat sectors are planned to become more closely connected to the electricity system, and thus “excess production” is expected to be used for transport purposes by electric cars or for heat production. Neighboring countries will also go through substantial changes of their energy systems, and therefore it is important to coordinate grid development in an international context.
SpainThe interest of Spain in moving to a low-carbon economy has demanded higher levels of renewable energy penetration. These higher levels of penetration of renewable energy (sup-plying 35% of annual consumption in the year 2010) have been achieved primarily by wind generation, making it one of the main technologies in the Spanish system (it accounts for 21% of total installed electric capacity). Total installed wind capacity in Spain as of May 2010 was 20,243 MW. This growth is expected to continue into the future, as more than 40% of the electric energy consumed in Spain must come from renewable sources by the year 2020 in order to comply with European initiatives.
Op erating a system with a large portion of wind genera-tion is complicated due to the inherent characteristics of both the wind plant and the power system. In the case of Spain, the fi rst challenge is being weakly interconnected with the rest of Europe and having to provide the required balanc-ing capacity to compensate for the variability of renewable energy mostly internally. The second challenge is the start-up time and the minimum technical capacity of the thermal units that are the main source of reserves, along with hydro-power generation (which has the drawback of fl uctuations between wet and dry cycles).
In spite of this, the Spanish system has been operated on some days with more than half of its demand covered by wind generation; a recent example was 9 November 2010,
Spain has reached high RE penetration while scrupulously maintaining the scheduled international power exchange and the required level of security of the electrical system.
50 IEEE power & energy magazine november/december 2011
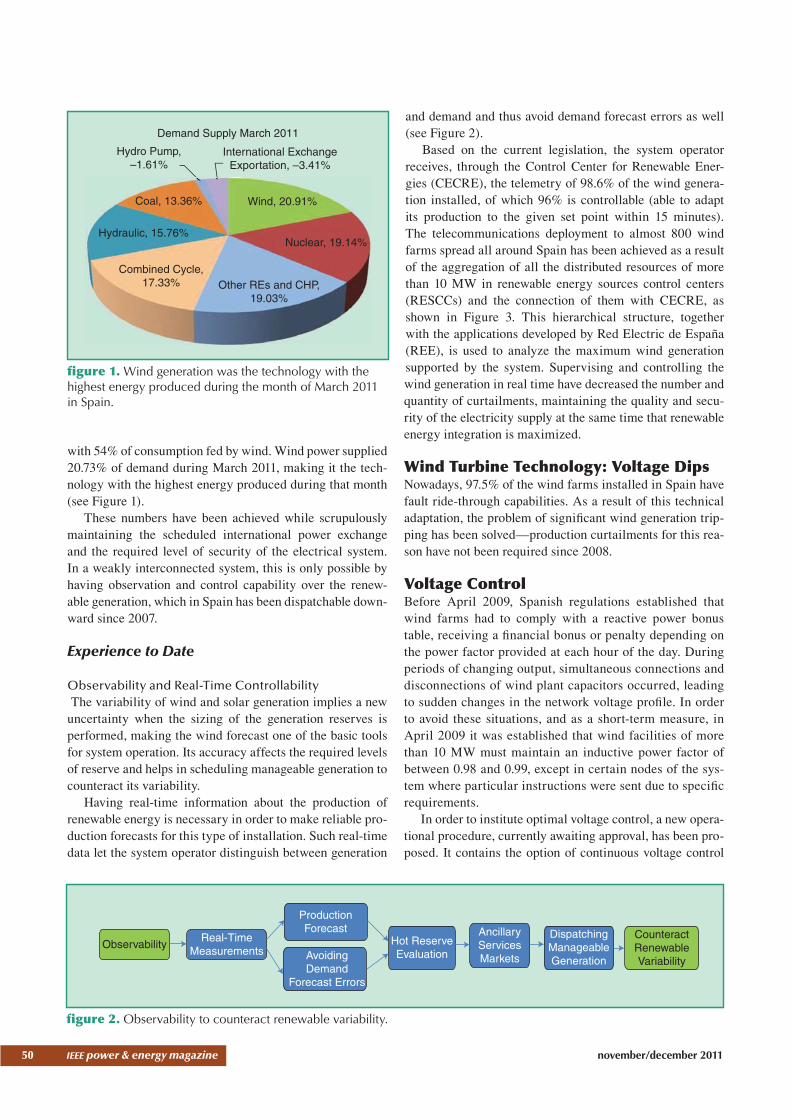
with 54% of consumption fed by wind. Wind power supplied 20.73% of demand during March 2011, making it the tech-nology with the highest energy produced during that month (see Figure 1).
These numbers have been achieved while scrupulously maintaining the scheduled international power exchange and the required level of security of the electrical system. In a weakly interconnected system, this is only possible by having observation and control capability over the renew-able generation, which in Spain has been dispatchable down-ward since 2007.
Experience to Date
Observability and Real-Time Controllability The variability of wind and solar generation implies a new
uncertainty when the sizing of the generation reserves is performed, making the wind forecast one of the basic tools for system operation. Its accuracy affects the required levels of reserve and helps in scheduling manageable generation to counteract its variability.
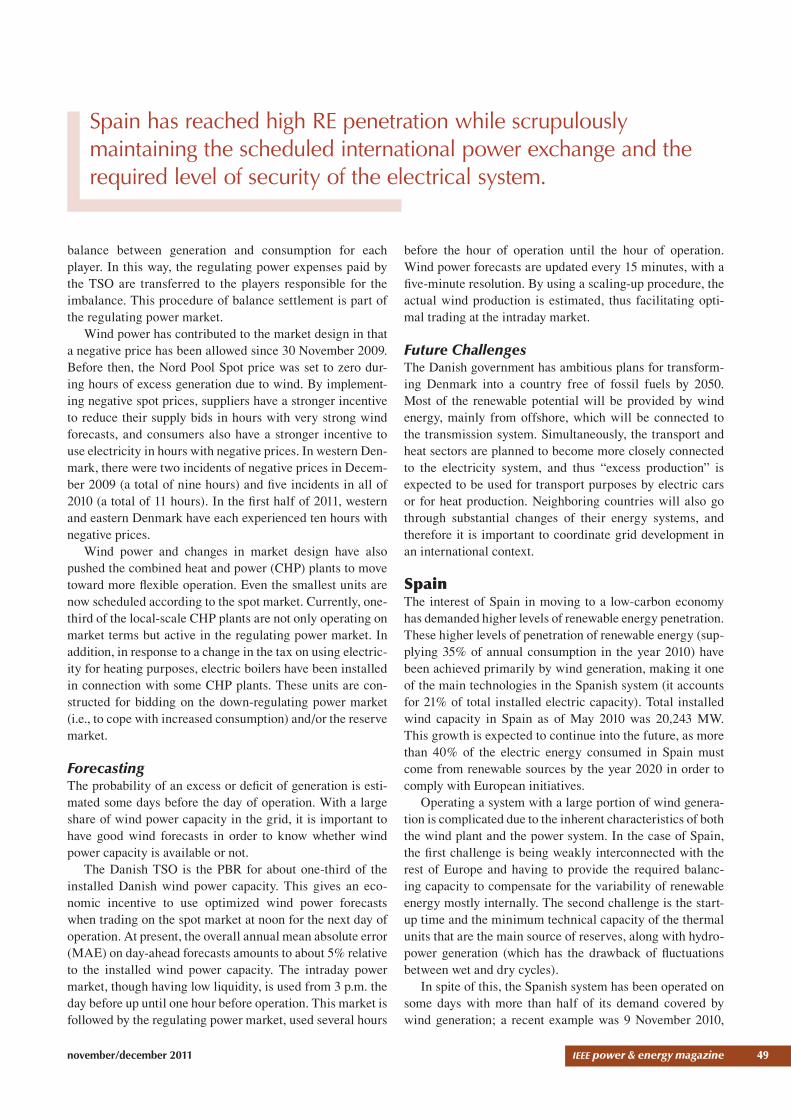
Having real-time information about the production of renewable energy is necessary in order to make reliable pro-duction forecasts for this type of installation. Such real-time data let the system operator distinguish between generation
and demand and thus avoid demand forecast errors as well (see Figure 2).
Based on the current legislation, the system operator receives, through the Control Center for Renewable Ener-gies (CECRE), the telemetry of 98.6% of the wind genera-tion installed, of which 96% is controllable (able to adapt its production to the given set point within 15 minutes). The telecommunications deployment to almost 800 wind farms spread all around Spain has been achieved as a result of the aggregation of all the distributed resources of more than 10 MW in renewable energy sources control centers (RESCCs) and the connection of them with CECRE, as shown in Figure 3. This hierarchical structure, together with the applications developed by Red Electric de España (REE), is used to analyze the maximum wind generation supported by the system. Supervising and controlling the wind generation in real time have decreased the number and quantity of curtailments, maintaining the quality and secu-rity of the electricity supply at the same time that renewable energy integration is maximized.
Wind Turbine Technology: Voltage DipsNowadays, 97.5% of the wind farms installed in Spain have fault ride-through capabilities. As a result of this technical adaptation, the problem of signifi cant wind generation trip-ping has been solved—production curtailments for this rea-son have not been required since 2008.
Voltage Control Before April 2009, Spanish regulations established that wind farms had to comply with a reactive power bonus table, receiving a fi nancial bonus or penalty depending on the power factor provided at each hour of the day. During periods of changing output, simultaneous connections and disconnections of wind plant capacitors occurred, leading to sudden changes in the network voltage profi le. In order to avoid these situations, and as a short-term measure, in April 2009 it was established that wind facilities of more than 10 MW must maintain an inductive power factor of between 0.98 and 0.99, except in certain nodes of the sys-tem where particular instructions were sent due to specifi c requirements.
In order to institute optimal voltage control, a new opera-tional procedure, currently awaiting approval, has been pro-posed. It contains the option of continuous voltage control
ObservabilityReal-Time
Measurements
ProductionForecast
AvoidingDemand
Forecast Errors
AncillaryServicesMarkets
DispatchingManageableGeneration
CounteractRenewableVariability
Hot ReserveEvaluation
figure 2. Observability to counteract renewable variability.
Demand Supply March 2011
Hydro Pump,–1.61%
International ExchangeExportation, –3.41%
Wind, 20.91%
Nuclear, 19.14%
Other REs and CHP,19.03%
Combined Cycle,17.33%
Hydraulic, 15.76%
Coal, 13.36%
figure 1. Wind generation was the technology with the highest energy produced during the month of March 2011 in Spain.
november/december 2011 IEEE power & energy magazine 51
to be provided by the renewable energy source (RES). Real tests based on real-time voltage set points sent by the sys-tem operator have been carried out with wind farms, accom-plishing remarkable results.
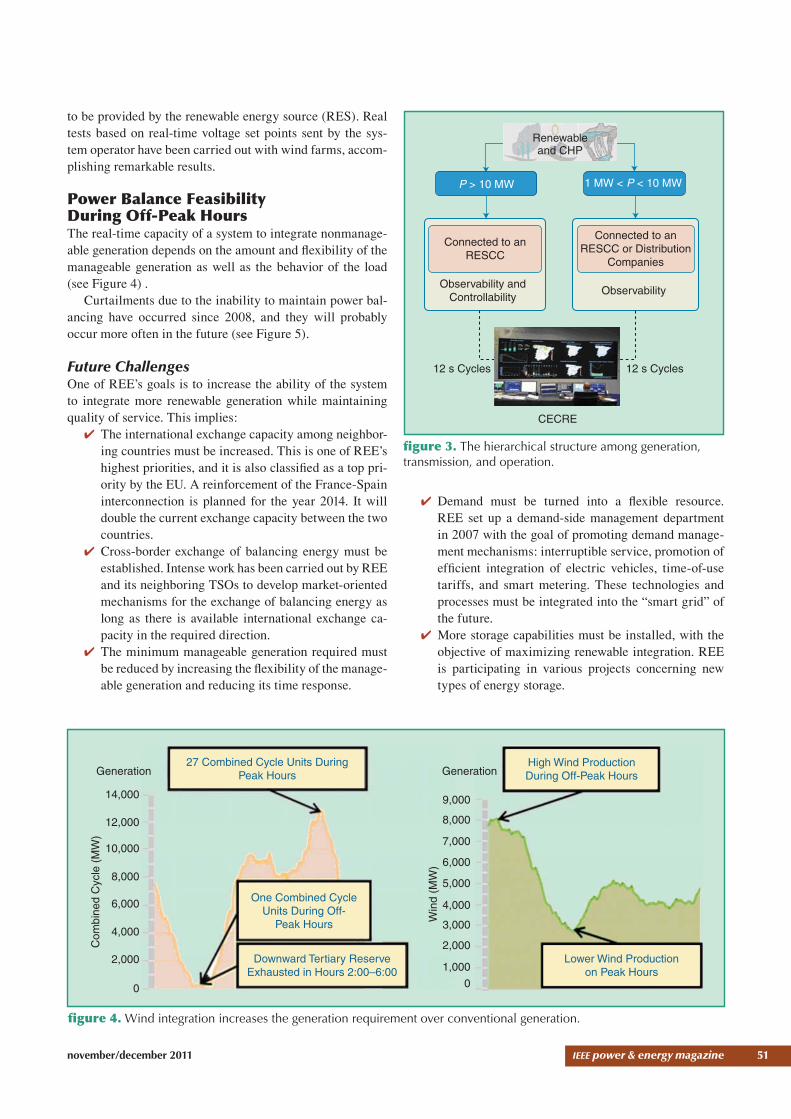
Power Balance Feasibility During Off-Peak HoursThe real-time capacity of a system to integrate nonmanage-able generation depends on the amount and fl exibility of the manageable generation as well as the behavior of the load (see Figure 4) .
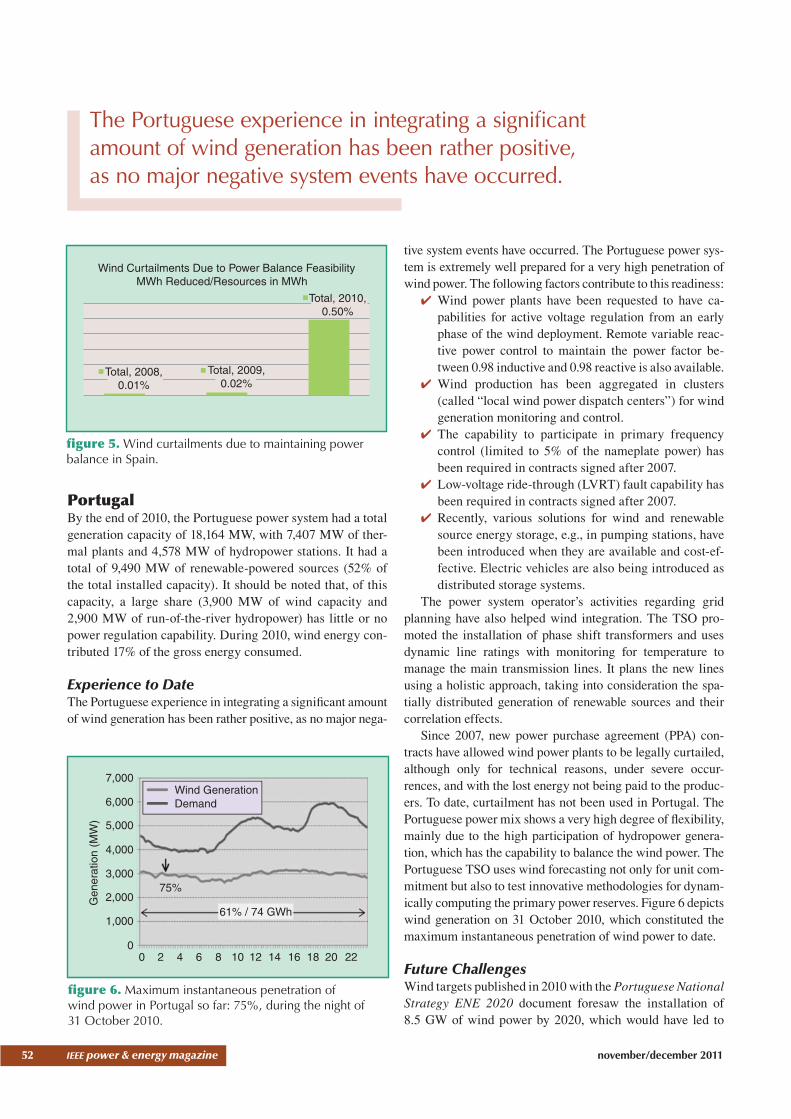
Curtailments due to the inability to maintain power bal-ancing have occurred since 2008, and they will probably occur more often in the future (see Figure 5).
Future ChallengesOne of REE’s goals is to increase the ability of the system to integrate more renewable generation while maintaining quality of service. This implies:
✔ The international exchange capacity among neighbor-ing countries must be increased. This is one of REE’s highest priorities, and it is also classifi ed as a top pri-ority by the EU. A reinforcement of the France-Spain interconnection is planned for the year 2014. It will double the current exchange capacity between the two countries.
✔ Cross-border exchange of balancing energy must be established. Intense work has been carried out by REE and its neighboring TSOs to develop market-oriented mechanisms for the exchange of balancing energy as long as there is available international exchange ca-pacity in the required direction.
✔ The minimum manageable generation required must be reduced by increasing the fl exibility of the manage-able generation and reducing its time response.
✔ Demand must be turned into a fl exible resource. REE set up a demand-side management department in 2007 with the goal of promoting demand manage-ment mechanisms: interruptible service, promotion of effi cient integration of electric vehicles, time-of-use tariffs, and smart metering. These technologies and processes must be integrated into the “smart grid” of the future.
✔ More storage capabilities must be installed, with the objective of maximizing renewable integration. REE is participating in various projects concerning new types of energy storage.
14,000
12,000
10,000
8,000
6,000
4,000
2,000
0
Generation Generation
Com
bine
d C
ycle
(M
W)
9,000
8,000
7,000
6,000
5,000
4,000
3,000
2,000
1,000
0
Win
d (M
W)
27 Combined Cycle Units DuringPeak Hours
One Combined CycleUnits During Off-
Peak Hours
Downward Tertiary ReserveExhausted in Hours 2:00–6:00
Lower Wind Productionon Peak Hours
High Wind ProductionDuring Off-Peak Hours
figure 4. Wind integration increases the generation requirement over conventional generation.
P > 10 MW 1 MW < P < 10 MW
Connected to anRESCC
Connected to anRESCC or Distribution
Companies
Observability andControllability
Observability
12 s Cycles12 s Cycles
CECRE
Renewableand CHP
figure 3. The hierarchical structure among generation, transmission, and operation.
52 IEEE power & energy magazine november/december 2011
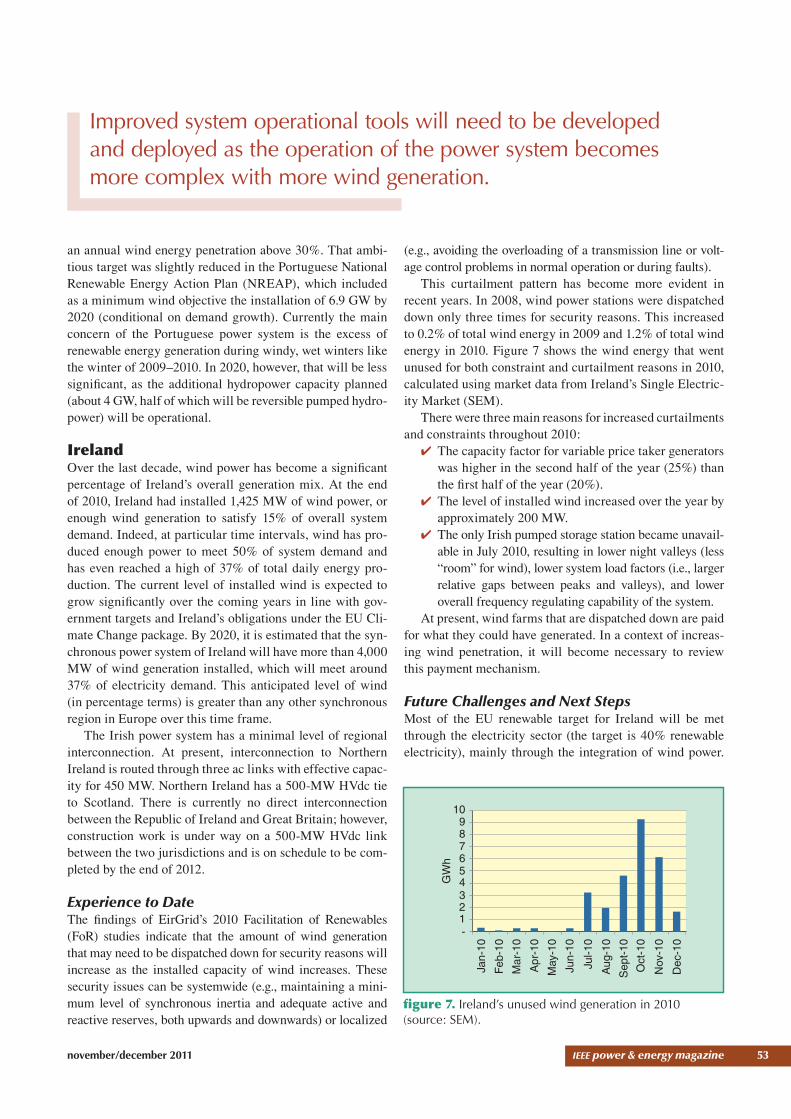
PortugalBy the end of 2010, the Portuguese power system had a total generation capacity of 18,164 MW, with 7,407 MW of ther-mal plants and 4,578 MW of hydropower stations. It had a total of 9,490 MW of renewable-powered sources (52% of the total installed capacity). It should be noted that, of this capacity, a large share (3,900 MW of wind capacity and 2,900 MW of run-of-the-river hydropower) has little or no power regulation capability. During 2010, wind energy con-tributed 17% of the gross energy consumed.
Experience to DateThe Portuguese experience in integrating a signifi cant amount of wind generation has been rather positive, as no major nega-
tive system events have occurred. The Portuguese power sys-tem is extremely well prepared for a very high penetration of wind power. The following factors contribute to this readiness:
✔ Wind power plants have been requested to have ca-pabilities for active voltage regulation from an early phase of the wind deployment. Remote variable reac-tive power control to maintain the power factor be-tween 0.98 inductive and 0.98 reactive is also available.
✔ Wind production has been aggregated in clusters (called “local wind power dispatch centers”) for wind generation monitoring and control.
✔ The capability to participate in primary frequency control (limited to 5% of the nameplate power) has been required in contracts signed after 2007.
✔ Low-voltage ride-through (LVRT) fault capability has been required in contracts signed after 2007.
✔ Recently, various solutions for wind and renewable source energy storage, e.g., in pumping stations, have been introduced when they are available and cost-ef-fective. Electric vehicles are also being introduced as distributed storage systems.
The power system operator’s activities regarding grid planning have also helped wind integration. The TSO pro-moted the installation of phase shift transformers and uses dynamic line ratings with monitoring for temperature to manage the main transmission lines. It plans the new lines using a holistic approach, taking into consideration the spa-tially distributed generation of renewable sources and their correlation effects.
Since 2007, new power purchase agreement (PPA) con-tracts have allowed wind power plants to be legally curtailed, although only for technical reasons, under severe occur-rences, and with the lost energy not being paid to the produc-ers. To date, curtailment has not been used in Portugal. The Portuguese power mix shows a very high degree of fl exibility, mainly due to the high participation of hydropower genera-tion, which has the capability to balance the wind power. The Portuguese TSO uses wind forecasting not only for unit com-mitment but also to test innovative methodologies for dynam-ically computing the primary power reserves. Figure 6 depicts wind generation on 31 October 2010, which constituted the maximum instantaneous penetration of wind power to date.
Future ChallengesWind targets published in 2010 with the Portuguese National Strategy ENE 2020 document foresaw the installation of 8.5 GW of wind power by 2020, which would have led to
7,000
6,000
5,000
4,000
3,000
2,000
1,000
0
Gen
erat
ion
(MW
)
0 2 4 6 8 10 12 14 16 18 20 22
75%
61% / 74 GWh
Wind GenerationDemand
figure 6. Maximum instantaneous penetration of wind power in Portugal so far: 75%, during the night of 31 October 2010.
Wind Curtailments Due to Power Balance FeasibilityMWh Reduced/Resources in MWh
Total, 2008,0.01%
Total, 2009,0.02%
Total, 2010,0.50%
figure 5. Wind curtailments due to maintaining power balance in Spain.
The Portuguese experience in integrating a significant amount of wind generation has been rather positive, as no major negative system events have occurred.
november/december 2011 IEEE power & energy magazine 53
an annual wind energy penetration above 30%. That ambi-tious target was slightly reduced in the Portuguese National Renewable Energy Action Plan (NREAP), which included as a minimum wind objective the installation of 6.9 GW by 2020 (conditional on demand growth). Currently the main concern of the Portuguese power system is the excess of renewable energy generation during windy, wet winters like the winter of 2009–2010. In 2020, however, that will be less signifi cant, as the additional hydropower capacity planned (about 4 GW, half of which will be reversible pumped hydro-power) will be operational.
IrelandOver the last decade, wind power has become a signifi cant percentage of Ireland’s overall generation mix. At the end of 2010, Ireland had installed 1,425 MW of wind power, or enough wind generation to satisfy 15% of overall system demand. Indeed, at particular time intervals, wind has pro-duced enough power to meet 50% of system demand and has even reached a high of 37% of total daily energy pro-duction. The current level of installed wind is expected to grow signifi cantly over the coming years in line with gov-ernment targets and Ireland’s obligations under the EU Cli-mate Change package. By 2020, it is estimated that the syn-chronous power system of Ireland will have more than 4,000 MW of wind generation installed, which will meet around 37% of electricity demand. This anticipated level of wind (in percentage terms) is greater than any other synchronous region in Europe over this time frame.
The Irish power system has a minimal level of regional interconnection. At present, interconnection to Northern Ireland is routed through three ac links with effective capac-ity for 450 MW. Northern Ireland has a 500-MW HVdc tie to Scotland. There is currently no direct interconnection between the Republic of Ireland and Great Britain; however, construction work is under way on a 500-MW HVdc link between the two jurisdictions and is on schedule to be com-pleted by the end of 2012.
Experience to DateThe fi ndings of EirGrid’s 2010 Facilitation of Renewables (FoR) studies indicate that the amount of wind generation that may need to be dispatched down for security reasons will increase as the installed capacity of wind increases. These security issues can be systemwide (e.g., maintaining a mini-mum level of synchronous inertia and adequate active and reactive reserves, both upwards and downwards) or localized
(e.g., avoiding the overloading of a transmission line or volt-age control problems in normal operation or during faults).
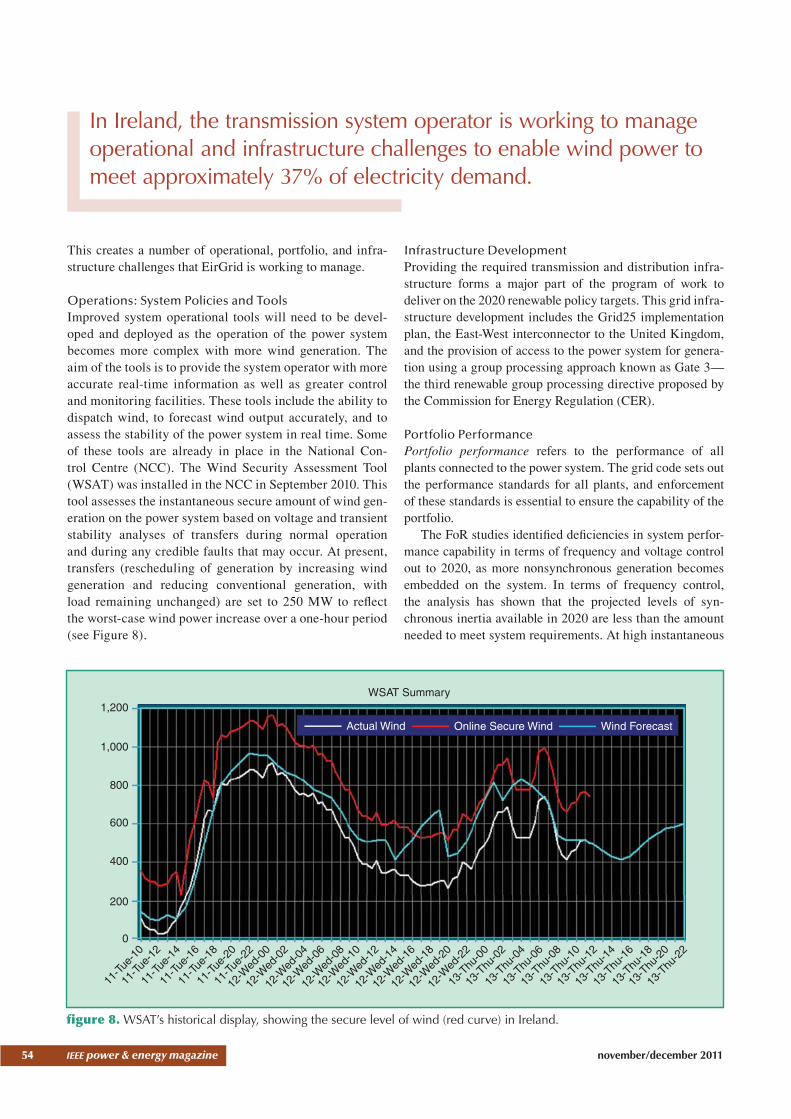
This curtailment pattern has become more evident in recent years. In 2008, wind power stations were dispatched down only three times for security reasons. This increased to 0.2% of total wind energy in 2009 and 1.2% of total wind energy in 2010. Figure 7 shows the wind energy that went unused for both constraint and curtailment reasons in 2010, calculated using market data from Ireland’s Single Electric-ity Market (SEM).
There were three main reasons for increased curtailments and constraints throughout 2010:
✔ The capacity factor for variable price taker generators was higher in the second half of the year (25%) than the fi rst half of the year (20%).
✔ The level of installed wind increased over the year by approximately 200 MW.
✔ The only Irish pumped storage station became unavail-able in July 2010, resulting in lower night valleys (less “room” for wind), lower system load factors (i.e., larger relative gaps between peaks and valleys), and lower overall frequency regulating capability of the system.
At present, wind farms that are dispatched down are paid for what they could have generated. In a context of increas-ing wind penetration, it will become necessary to review this payment mechanism.
Future Challenges and Next StepsMost of the EU renewable target for Ireland will be met through the electricity sector (the target is 40% renewable electricity), mainly through the integration of wind power.
10987654321-
Jan-
10
Feb
-10
Mar
-10
Apr
-10
May
-10
Jun-
10
Jul-1
0
Aug
-10
Sep
t-10
Oct
-10
Nov
-10
Dec
-10
GW
h
figure 7. Ireland’s unused wind generation in 2010 (source: SEM).
Improved system operational tools will need to be developed and deployed as the operation of the power system becomes more complex with more wind generation.
54 IEEE power & energy magazine november/december 2011
This creates a number of operational, portfolio, and infra-structure challenges that EirGrid is working to manage.
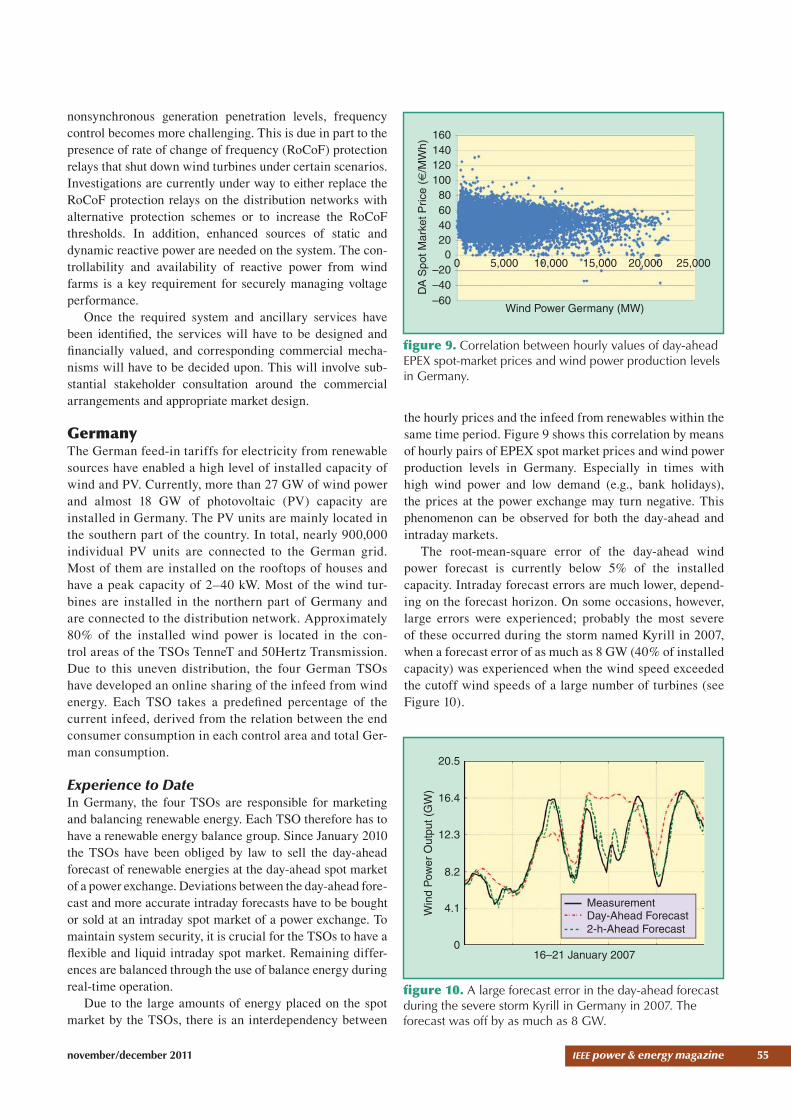
Operations: System Policies and ToolsImproved system operational tools will need to be devel-oped and deployed as the operation of the power system becomes more complex with more wind generation. The aim of the tools is to provide the system operator with more accurate real-time information as well as greater control and monitoring facilities. These tools include the ability to dispatch wind, to forecast wind output accurately, and to assess the stability of the power system in real time. Some of these tools are already in place in the National Con-trol Centre (NCC). The Wind Security Assessment Tool (WSAT) was installed in the NCC in September 2010. This tool assesses the instantaneous secure amount of wind gen-eration on the power system based on voltage and transient stability analyses of transfers during normal operation and during any credible faults that may occur. At present, transfers (rescheduling of generation by increasing wind generation and reducing conventional generation, with load remaining unchanged) are set to 250 MW to refl ect the worst-case wind power increase over a one-hour period (see Figure 8).
Infrastructure Development Providing the required transmission and distribution infra-structure forms a major part of the program of work to deliver on the 2020 renewable policy targets. This grid infra-structure development includes the Grid25 implementation plan, the East-West interconnector to the United Kingdom, and the provision of access to the power system for genera-tion using a group processing approach known as Gate 3—the third renewable group processing directive proposed by the Commission for Energy Regulation (CER).
Portfolio PerformancePortfolio performance refers to the performance of all plants connected to the power system. The grid code sets out the performance standards for all plants, and enforcement of these standards is essential to ensure the capability of the portfolio.
The FoR studies identifi ed defi ciencies in system perfor-mance capability in terms of frequency and voltage control out to 2020, as more nonsynchronous generation becomes embedded on the system. In terms of frequency control, the analysis has shown that the projected levels of syn-chronous inertia available in 2020 are less than the amount needed to meet system requirements. At high instantaneous
11-T
ue-1
0
11-T
ue-1
2
11-T
ue-1
4
11-T
ue-1
6
11-T
ue-1
8
11-T
ue-2
0
11-T
ue-2
2
12-W
ed-0
0
12-W
ed-0
2
12-W
ed-0
4
12-W
ed-0
6
12-W
ed-0
8
12-W
ed-1
0
12-W
ed-1
2
12-W
ed-1
4
12-W
ed-1
6
12-W
ed-1
8
12-W
ed-2
0
12-W
ed-2
2
13-T
hu-0
0
13-T
hu-0
2
13-T
hu-0
4
13-T
hu-0
6
13-T
hu-0
8
13-T
hu-1
0
13-T
hu-1
2
13-T
hu-1
4
13-T
hu-1
6
13-T
hu-1
8
13-T
hu-2
0
13-T
hu-2
2
WSAT Summary1,200
1,000
800
600
400
200
0
Actual Wind Online Secure Wind Wind Forecast
figure 8. WSAT’s historical display, showing the secure level of wind (red curve) in Ireland.
In Ireland, the transmission system operator is working to manage operational and infrastructure challenges to enable wind power to meet approximately 37% of electricity demand.
november/december 2011 IEEE power & energy magazine 55
nonsynchronous generation penetration levels, frequency control becomes more challenging. This is due in part to the presence of rate of change of frequency (RoCoF) protection relays that shut down wind turbines under certain scenarios. Investigations are currently under way to either replace the RoCoF protection relays on the distribution networks with alternative protection schemes or to increase the RoCoF thresholds. In addition, enhanced sources of static and dynamic reactive power are needed on the system. The con-trollability and availability of reactive power from wind farms is a key requirement for securely managing voltage performance.
Once the required system and ancillary services have been identifi ed, the services will have to be designed and fi nancially valued, and corresponding commercial mecha-nisms will have to be decided upon. This will involve sub-stantial stakeholder consultation around the commercial arrangements and appropriate market design.
GermanyThe German feed-in tariffs for electricity from renewable sources have enabled a high level of installed capacity of wind and PV. Currently, more than 27 GW of wind power and almost 18 GW of photovoltaic (PV) capacity are installed in Germany. The PV units are mainly located in the southern part of the country. In total, nearly 900,000 individual PV units are connected to the German grid. Most of them are installed on the rooftops of houses and have a peak capacity of 2–40 kW. Most of the wind tur-bines are installed in the northern part of Germany and are connected to the distribution network. Approximately 80% of the installed wind power is located in the con-trol areas of the TSOs TenneT and 50Hertz Transmission. Due to this uneven distribution, the four German TSOs have developed an online sharing of the infeed from wind energy. Each TSO takes a predefi ned percentage of the current infeed, derived from the relation between the end consumer consumption in each control area and total Ger-man consumption.
Experience to DateIn Germany, the four TSOs are responsible for marketing and balancing renewable energy. Each TSO therefore has to have a renewable energy balance group. Since January 2010 the TSOs have been obliged by law to sell the day-ahead forecast of renewable energies at the day-ahead spot market of a power exchange. Deviations between the day-ahead fore-cast and more accurate intraday forecasts have to be bought or sold at an intraday spot market of a power exchange. To maintain system security, it is crucial for the TSOs to have a fl exible and liquid intraday spot market. Remaining differ-ences are balanced through the use of balance energy during real-time operation.
Due to the large amounts of energy placed on the spot market by the TSOs, there is an interdependency between
the hourly prices and the infeed from renewables within the same time period. Figure 9 shows this correlation by means of hourly pairs of EPEX spot market prices and wind power production levels in Germany. Especially in times with high wind power and low demand (e.g., bank holidays), the prices at the power exchange may turn negative. This phenomenon can be observed for both the day-ahead and intraday markets.
The root-mean-square error of the day-ahead wind power forecast is currently below 5% of the installed capacity. Intraday forecast errors are much lower, depend-ing on the forecast horizon. On some occasions, however, large errors were experienced; probably the most severe of these occurred during the storm named Kyrill in 2007, when a forecast error of as much as 8 GW (40% of installed capacity) was experienced when the wind speed exceeded the cutoff wind speeds of a large number of turbines (see Figure 10).
20.5
16.4
12.3
8.2
4.1
0
Win
d P
ower
Out
put (
GW
)
16–21 January 2007
MeasurementDay-Ahead Forecast2-h-Ahead Forecast
figure 10. A large forecast error in the day-ahead forecast during the severe storm Kyrill in Germany in 2007. The forecast was off by as much as 8 GW.
16014012010080604020
–20–40–60
00 5,000 10,000 15,000 20,000 25,000
Wind Power Germany (MW)
DA
Spo
t Mar
ket P
rice
(€/M
Wh)
figure 9. Correlation between hourly values of day-ahead EPEX spot-market prices and wind power production levels in Germany.
56 IEEE power & energy magazine november/december 2011
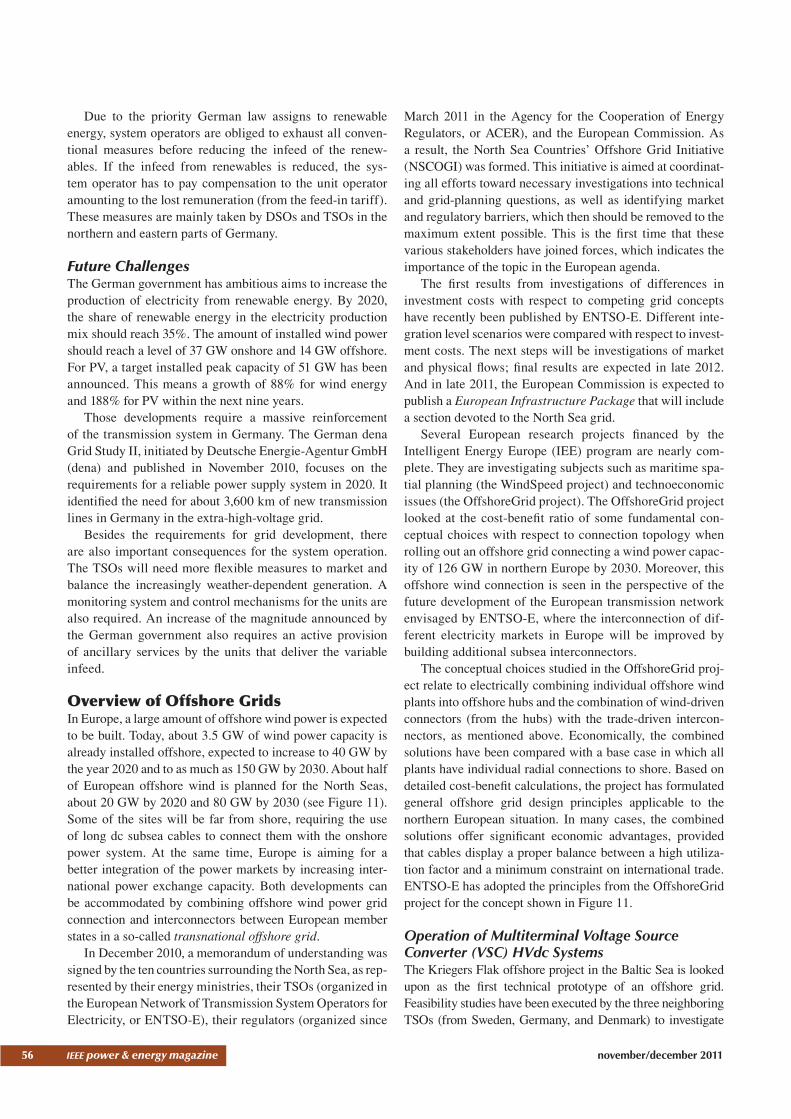
Due to the priority German law assigns to renewable energy, system operators are obliged to exhaust all conven-tional measures before reducing the infeed of the renew-ables. If the infeed from renewables is reduced, the sys-tem operator has to pay compensation to the unit operator amounting to the lost remuneration (from the feed-in tariff). These measures are mainly taken by DSOs and TSOs in the northern and eastern parts of Germany.
Future ChallengesThe German government has ambitious aims to increase the production of electricity from renewable energy. By 2020, the share of renewable energy in the electricity production mix should reach 35%. The amount of installed wind power should reach a level of 37 GW onshore and 14 GW offshore. For PV, a target installed peak capacity of 51 GW has been announced. This means a growth of 88% for wind energy and 188% for PV within the next nine years.
Those developments require a massive reinforcement of the transmission system in Germany. The German dena Grid Study II, initiated by Deutsche Energie-Agentur GmbH (dena) and published in November 2010, focuses on the requirements for a reliable power supply system in 2020. It identifi ed the need for about 3,600 km of new transmission lines in Germany in the extra-high-voltage grid.
Besides the requirements for grid development, there are also important consequences for the system operation. The TSOs will need more fl exible measures to market and balance the increasingly weather-dependent generation. A monitoring system and control mechanisms for the units are also required. An increase of the magnitude announced by the German government also requires an active provision of ancillary services by the units that deliver the variable infeed.
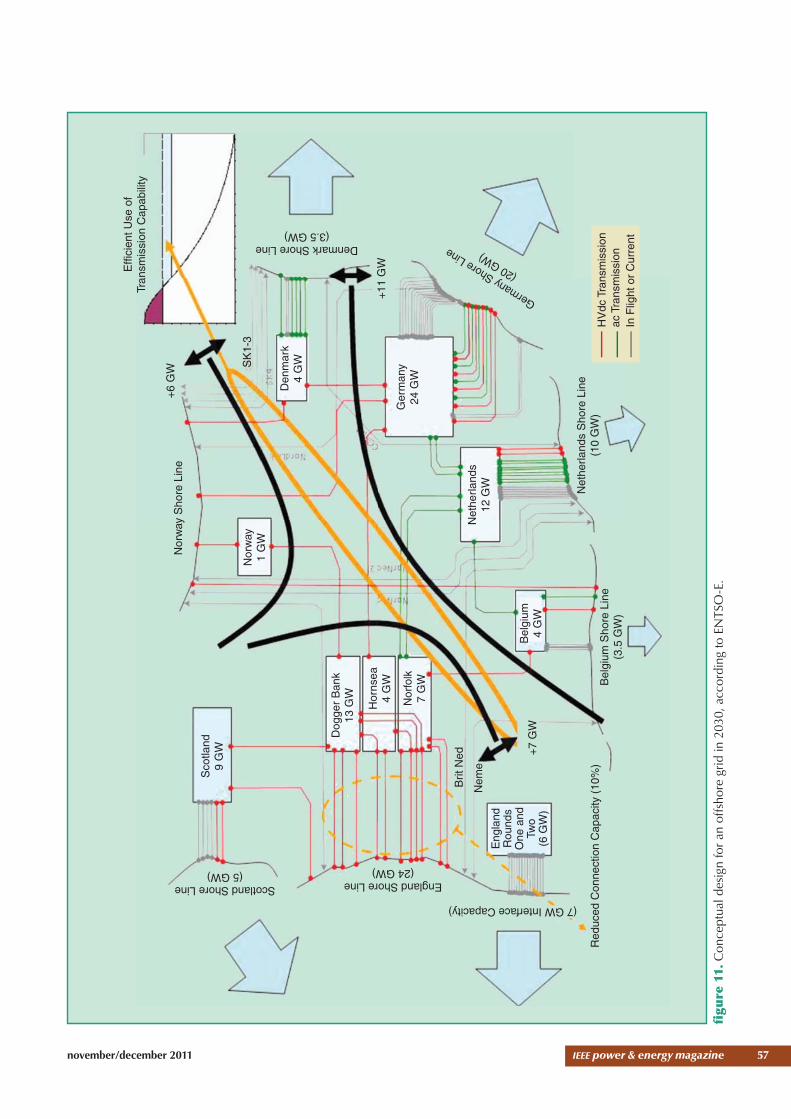
Overview of Offshore GridsIn Europe, a large amount of offshore wind power is expected to be built. Today, about 3.5 GW of wind power capacity is already installed offshore, expected to increase to 40 GW by the year 2020 and to as much as 150 GW by 2030. About half of European offshore wind is planned for the North Seas, about 20 GW by 2020 and 80 GW by 2030 (see Figure 11). Some of the sites will be far from shore, requiring the use of long dc subsea cables to connect them with the onshore power system. At the same time, Europe is aiming for a better integration of the power markets by increasing inter-national power exchange capacity. Both developments can be accommodated by combining offshore wind power grid connection and interconnectors between European member states in a so-called transnational offshore grid.
In December 2010, a memorandum of understanding was signed by the ten countries surrounding the North Sea, as rep-resented by their energy ministries, their TSOs (organized in the European Network of Transmission System Operators for Electricity, or ENTSO-E), their regulators (organized since
March 2011 in the Agency for the Cooperation of Energy Regulators, or ACER), and the European Commission. As a result, the North Sea Countries’ Offshore Grid Initiative (NSCOGI) was formed. This initiative is aimed at coordinat-ing all efforts toward necessary investigations into technical and grid-planning questions, as well as identifying market and regulatory barriers, which then should be removed to the maximum extent possible. This is the fi rst time that these various stakeholders have joined forces, which indicates the importance of the topic in the European agenda.
The fi rst results from investigations of differences in investment costs with respect to competing grid concepts have recently been published by ENTSO-E. Different inte-gration level scenarios were compared with respect to invest-ment costs. The next steps will be investigations of market and physical fl ows; fi nal results are expected in late 2012. And in late 2011, the European Commission is expected to publish a European Infrastructure Package that will include a section devoted to the North Sea grid.
Several European research projects fi nanced by the Intelligent Energy Europe (IEE) program are nearly com-plete. They are investigating subjects such as maritime spa-tial planning (the WindSpeed project) and technoeconomic issues (the OffshoreGrid project). The OffshoreGrid project looked at the cost-benefi t ratio of some fundamental con-ceptual choices with respect to connection topology when rolling out an offshore grid connecting a wind power capac-ity of 126 GW in northern Europe by 2030. Moreover, this offshore wind connection is seen in the perspective of the future development of the European transmission network envisaged by ENTSO-E, where the interconnection of dif-ferent electricity markets in Europe will be improved by building additional subsea interconnectors.
The conceptual choices studied in the OffshoreGrid proj-ect relate to electrically combining individual offshore wind plants into offshore hubs and the combination of wind-driven connectors (from the hubs) with the trade-driven intercon-nectors, as mentioned above. Economically, the combined solutions have been compared with a base case in which all plants have individual radial connections to shore. Based on detailed cost-benefi t calculations, the project has formulated general offshore grid design principles applicable to the northern European situation. In many cases, the combined solutions offer signifi cant economic advantages, provided that cables display a proper balance between a high utiliza-tion factor and a minimum constraint on international trade. ENTSO-E has adopted the principles from the OffshoreGrid project for the concept shown in Figure 11.
Operation of Multiterminal Voltage Source Converter (VSC) HVdc SystemsThe Kriegers Flak offshore project in the Baltic Sea is looked upon as the fi rst technical prototype of an offshore grid. Feasibility studies have been executed by the three neighboring TSOs (from Sweden, Germany, and Denmark) to investigate
november/december 2011 IEEE power & energy magazine 57
Sco
tland
9 G
W
Dog
ger
Ban
k13
GW
Hor
nsea
4 G
W
Nor
folk
7 G
W
Bel
gium
4 G
W
Eng
land
Rou
nds
One
and
Two
(6 G
W)
Net
herla
nds
12 G
W
Ger
man
y24
GW
Den
mar
k4
GW
Nor
way
1 G
W
Scotland Shore Line(5 GW)
England Shore Line(24 GW)
Bel
gium
Sho
re L
ine
(3.5
GW
)
Net
herla
nds
Sho
re L
ine
(10
GW
)
(7 GW Interface Capacity)
Red
uced
Con
nect
ion
Cap
acity
(10
%)
+7
GW
Brit
Ned
Nor
way
Sho
re L
ine
+6
GW
Denmark Shore Line(3.5 GW)
+11
GW
Germany Shore Line
(20 GW)
SK
1-3
HV
dc T
rans
mis
sion
ac T
rans
mis
sion
In F
light
or
Cur
rent
Nem
e
Effi
cien
t Use
of
Tran
smis
sion
Cap
abili
ty
figu
re 1
1. C
once
ptua
l des
ign
for
an o
ffsho
re g
rid in
203
0, a
ccor
ding
to E
NTS
O-E
.
58 IEEE power & energy magazine november/december 2011
the possibility of interconnecting three offshore wind power plants belonging to different countries, thus creating the fi rst offshore node of an offshore grid. Parts of this project are cur-rently under construction in the Baltic Sea. This concept will be further developed in the North Sea grid study mentioned above.
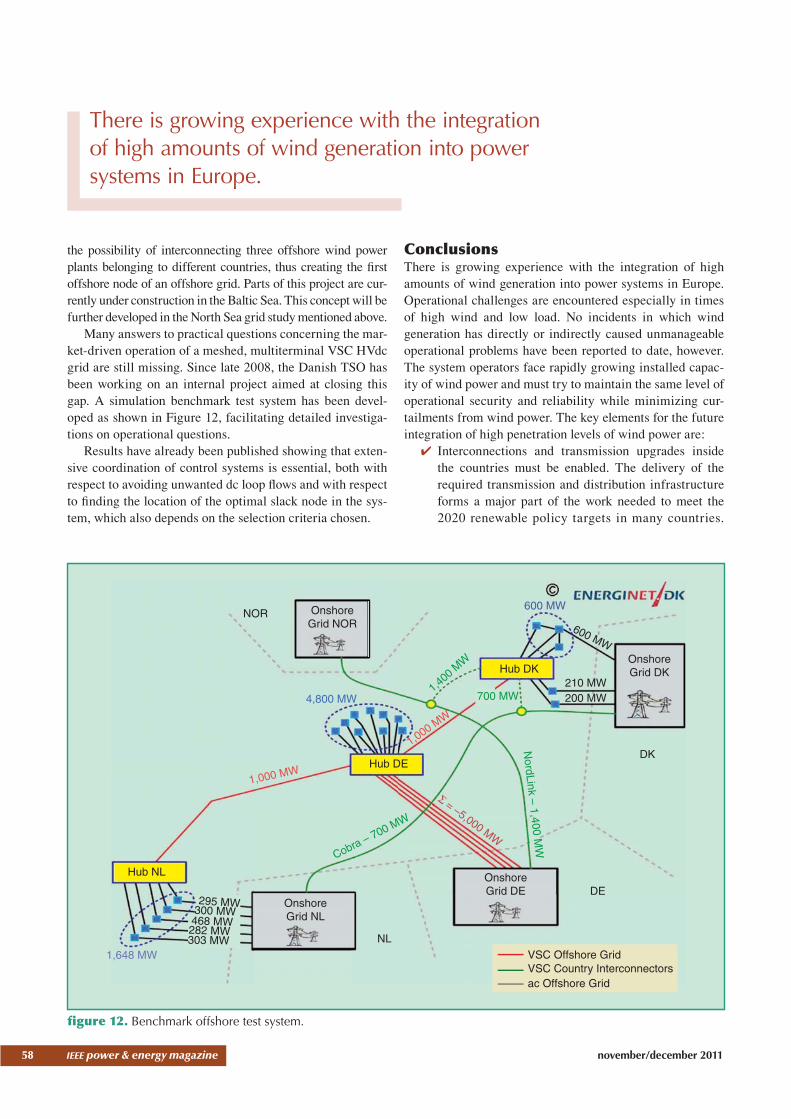
Many answers to practical questions concerning the mar-ket-driven operation of a meshed, multiterminal VSC HVdc grid are still missing. Since late 2008, the Danish TSO has been working on an internal project aimed at closing this gap. A simulation benchmark test system has been devel-oped as shown in Figure 12, facilitating detailed investiga-tions on operational questions.
Results have already been published showing that exten-sive coordination of control systems is essential, both with respect to avoiding unwanted dc loop fl ows and with respect to fi nding the location of the optimal slack node in the sys-tem, which also depends on the selection criteria chosen.
ConclusionsThere is growing experience with the integration of high amounts of wind generation into power systems in Europe. Operational challenges are encountered especially in times of high wind and low load. No incidents in which wind generation has directly or indirectly caused unmanageable operational problems have been reported to date, however. The system operators face rapidly growing installed capac-ity of wind power and must try to maintain the same level of operational security and reliability while minimizing cur-tailments from wind power. The key elements for the future integration of high penetration levels of wind power are:
✔ Interconnections and transmission upgrades inside the countries must be enabled. The delivery of the required transmission and distribution infrastructure forms a major part of the work needed to meet the 2020 renewable policy targets in many countries.
OnshoreGrid NOR
NOR600 MW
600 MW
210 MW200 MW
OnshoreGrid DK
OnshoreGrid DE
OnshoreGrid NL
DK
DE
1,400
MW
NordLink – 1,400 M
W
1,000 MW
1,000 MW
Σ = –5,000 MW
Cobra – 700 MW
NL
Hub NL
Hub DE
Hub DK
1,648 MW
4,800 MW
295 MW
303 MW282 MW468 MW300 MW
VSC Offshore GridVSC Country Interconnectorsac Offshore Grid
700 MW
figure 12. Benchmark offshore test system.
There is growing experience with the integration of high amounts of wind generation into power systems in Europe.
november/december 2011 IEEE power & energy magazine 59
Enhancing the use of existing grid infrastructure and interconnections to enable operation at full capacity is also important.
✔ There must be well-functioning markets offering a range of scheduling periods (i.e., day-ahead, hour-ahead, and real-time) to accommodate the uncertain-ty in wind plant forecasts. Establishing cross-border exchange mechanisms for balancing energy is also important.
✔ Improved system operational tools will need to be de-veloped and deployed as the operation of the power system becomes more complex with more wind gener-ation. These tools include the ability to forecast wind output accurately, to obtain accurate real-time infor-mation on generation levels, and to assess the stability of the power system in real time in order to control wind plant output when necessary from a system se-curity point of view.
✔ System fl exibility must be increased. This means re-ducing the response time of the conventional genera-tion plants, turning demand into a fl exible resource, and looking for feasible storage options.
✔ Policies and capabilities must be put in place to deal with system issues such as transient stability, voltage collapse, and reactive power support. Grid connec-tion rules (grid codes) applied to both wind power and conventional generation technologies must be de-veloped, with a clear picture of the capabilities of the whole generation portfolio.
✔ The technical and economic consequences of a jointly planned future offshore grid that gathers together the remote offshore wind power in northern Europe and adds trade capacity among the respective countries need to be further investigated. Initial investigations have already been made in the framework of Euro-pean research projects and by the European TSOs of ENTSO-E for NSCOGI.
For Further Reading A. Orths and P. B. Eriksen, “Europe going renewable—The TSOs’ power transmission challenges,” in Proc. 8th Int. Workshop Large Scale Integration of Wind Power into Pow-er Systems and Transmission Networks for Offshore Wind Farms, Bremen, Germany, 2009, pp. 3–9.
M. de la Torre, T. Domínguez, G. Juberías, E. Prieto, and O. Alonso, “Operation of a power system with large integra-tion of renewable energies,” in Proc. 7th Int. Workshop on
Large-Scale Integration of Wind Power into Power Systems,Madrid, Spain, May 26–27, 2008, pp. 13–18.
A. Estanqueiro, C. Mateus, and R. Pestana, “Operation-al experience of extreme wind penetrations,” in Proc. 9th Int. Workshop on Large Scale Integration of Wind Power into Power Systems and Transmission Networks for Off-shore Wind Farms, Quebec, Canada, Oct. 18–19, 2010, pp. 34–40.
K. Rudion, A. Orths, H. Abildgaard, and Z. A. Styczyn-ski, “Analysis of operational strategies for multi-terminal VSC HVDC systems,” in Proc. 9th Int. Workshop Large Scale Integration of Wind Power into Power Systems and Transmission Networks for Offshore Wind Farms, Oct. 18–19, 2010, Quebec, Canada, pp. 411–418.
Ecofys. (2010). All island TSO facilitation of renewables studies. [Online]. 77 pp. Available: http://www.eirgrid.com/renewables/facilitationofrenewables
Dena Grid Study II. (2010). Integration of renewable energy sources into the German power supply system until 2020. Deutsche Energie-Agentur Dena. [Online]. Available: http://www.dena.de/
Secretariat of ENTSO-E AISBL. (Feb. 2011). Offshore grid development in the North Seas—ENTSO-E views. [Online]. Available: www.entsoe.eu
OffshoreGrid project [Online]. Available: http://www.offshoregrid.eu
WindSpeed project [Online]. Available: http://www.windspeed.eu
BiographiesHannele Holttinen is with the VTT Technical Research Centre of Finland.
Antje G. Orths is with Energinet.dk, Denmark, and the Otto von Guericke University of Magdeburg, Germany.
Peter Børre Eriksen is with Energinet.dk, Denmark.Jorge Hidalgo is with REE, Spain. Ana Estanqueiro is with the Laboratorio Nacional de
Energia e Geologia and the University of Lisbon. Frank Groome is with EirGrid, Ireland.Yvonne Coughlan is with EirGrid, Ireland. Hendrik Neumann is with Amprion, Germany.Bernhard Lange is with the Fraunhofer Institute for
Wind Energy and Energy System Technology, Germany.Frans van Hulle is with the European Wind Energy
Association.Ivan Dudurych is with EirGrid, Ireland.
p&e
The German government has ambitious aims to increase the production of electricity from renewable energy.