credit default swaps: implied ratings versus official ones
TRANSCRIPT
4OR-Q J Oper Res (2012) 10:163–180DOI 10.1007/s10288-011-0195-3
RESEARCH PAPER
Credit default swaps: implied ratings versus official ones
R. Castellano · R. Giacometti
Received: 15 April 2011 / Revised: 15 December 2011 / Published online: 19 January 2012© Springer-Verlag 2012
Abstract Recently, in line with the progressive development of the credit deriva-tives market, the academic research has begun to explore the relationship betweenCredit Default Swap market and rating events. In this paper, following a market basedapproach, we calibrate an Implied Rating model on Credit Default Swap marketspreads. The non parametric mapping of Implied Ratings is calibrated on a largedata set of Credit Default Swap quotes that includes the years of financial turmoils.This allows also to investigate the existence of possible differences between normaland abnormal market conditions. Unlike other models, the one proposed considers alinear penalty function which allows to evaluate market quotes in a neutral way andto formalize a more computationally efficient programming model. We compare thebehaviors of credit rating agencies in different markets (EU and USA) and in differentsub-periods, in order to analyze whether Implied Rating changes anticipate or followthe effective rating changes supplied by Fitch Ratings, Moody’s and Standard andPoor’s.
Keywords Credit default swaps · Credit ratings · Implied ratings · Early warningsignals · Linear programming
MSC classification (2000) 90C05 · 91A28 · 62P05
R. Castellano (B)DIEF, University of Macerata, Macerata, Italye-mail: [email protected]
R. GiacomettiDMSIA, University of Bergamo, Bergamo, Italye-mail: [email protected]
123

164 R. Castellano, R. Giacometti
1 Introduction
The introduction of the Credit Default Swap (CDS) market, dated back to late 1990s,brought the attention on these derivatives as main providers of direct informationrelated with the creditworthiness of a company. CDSs are insurance policies protect-ing against the default of a reference entity and allow to transfer and isolate credit riskfrom other sources of risks. Among credit derivatives, CDS are the most liquid creditrisk instruments.
A large body of literature has shown that the CDS market is superior to bond andstock markets in signalling early warnings of future changes in the creditworthinessof a reference entity, and that CDS quotes provide estimates of the credit risk of areference entity, over short time horizons (Blanco et al. 2005; Hull et al. 2004; Nordenand Weber 2004).
Several recent studies have investigated the effects of rating announcements madeby Credit Rating Agencies (CRAs) on CDS quotes as well as on stock and bond prices(Goh and Ederington 1993; Steiner and Heinke 2001; Hull et al. 2004; Norden andWeber 2004; Ammer and Clinton 2004; Micu et al. 2006; Castellano and Scaccia2010; Afonso et al. 2011; only to cite a few). Most of these studies find that nega-tive rating announcements have similar impact on stock and credit markets, as theyare anticipated by the markets. Castellano and Scaccia (2010) incorporate the abil-ity of Markov Switching Models in modeling state-dependent means and variancesinto the event-study methodology to study the reactions of CDS quotes to reviewsfor downgrading, and examine whether and to what extent the CDS market respondsto these announcements which should reflect the latest available information relatedwith the creditworthiness of a company. Focusing on volatility switches, they findthat negative watchlistings made by CRAs, in most of the cases, do not convey extrainformation to the market, and that the variance of CDS spread changes may timelyprovide information about the negative alteration in the creditworthiness of a specificcompany.
These findings reflect the differences between the way markets and CRAs processinformation. CRAs take into account the same information of the market but, given thenature of the rating process, almost always react more slowly since they have to balanceaccuracy and stability, meaning that they do not change so often official ratings as theyfollow the through-the-cycle methodology. Over all, agencies’ analysts might simplytake a different view than the market on the credit risk level of a reference entity.
In contrast, some other studies obtained results that move in the opposite direction.For instance, Micu et al. (2006) show that all type of rating announcements(outlooks, reviews and actual rating changes), whether positive or negative, have asignificant impact on CDS quotes only at or after the official announcements, mean-ing that announcements are not anticipated by the market. Afonso et al. (2011) findthat the reaction of CDS spreads to negative rating events has increased during thecrisis and rating announcements are essentially not anticipated.
Another line of research focuses on market based Implied Ratings (IRs), since theymay track credit risk more timely than CRAs. Most of these studies derive price-basedratings, rather than default probabilities based on firm fundamentals as in the struc-
123

Credit default swaps: implied ratings versus official ones 165
tural model introduced by Merton’s seminal work (1974) and further developed, forinstance, by Black and Cox (1976), and Longstaff and Schwartz (1995).
Unlike structural models, Kou and Varotto (2008) and Breger et al. (2003) follow amarket based approach that grounds the IRs models on the assumption that bond pricesare, on average, highly informative. Reyngold et al. (2007) calibrate their market basedIRs model on CDS quotes, since they implicitly assume that CDS market processesinformation faster than bond market.
In this study, following the market based approach, a CDS-IRs system is imple-mented. This allows to create a non-parametric mapping from the official ratings to themarket implied ones. Unlike Reyngold et al. (2007), the proposed model considers alinear penalty function which allows to evaluate in a neutral way market quotes and for-malize a more computationally efficient linear programming. Moreover, we comparethe behaviors of the three major CRAs in different markets (U.S. and EU) and dif-ferent sub-periods (2004–2006 and 2007–2009), in order to highlight the existenceof possible changes in CRAs’ behaviors, during the years characterized by financialturmoils, in the two major markets. Indeed, we consider an historical data set of CDSdaily quotes (spreads) from 2004 to 2009, and collect rating announcements providedby the three major CRAs (Fitch Ratings, Moody’s and Standard & Poor’s) for thesame period.
This allows to analyze the differences between CRAs’ ratings and CDS-IRs, andcompare how they have evolved over time. Furthermore, we test whether IRs may pro-vide early warning signals to anticipate future CRAs’ downgrades and defaults, andto assess which is, with respect to the two considered markets, the delay/anticipationof the CRAs in changing official ratings.
In particular, we calibrate the proposed IR model on a large data set of CDS quotesthat includes the years of financial turmoil, ongoing on global dimension. This allowsto highlight differences between normal and abnormal market conditions, and to verifywhether CRAs—during the financial crisis—may have underestimated/overestimatedthe credit risk associated to issuers of credit products. We compute IRs by year,1
and analyze the daily rating gaps, i.e. the differences between IRs and official ratingsassigned to the reference entities by each CRA under consideration.
The paper is organized as follows: in Sect. 2, we provide a brief description of theCDS market. In Sect. 3, we describe the methodology adopted. Section 4 describesthe data set and the results. In Sect. 5 some concluding remarks are reported.
2 Credit rating agencies and CDS market
The main goal of credit rating is to facilitate the comparison of an issuer’s underlyinglong-term creditworthiness by means of standardized categories, so rating decisionsare typically not influenced by events whose impact on credit quality is expectedto be temporary (Micu et al. 2006; Weinsten 1977). For this reason, CRAs providevarious kinds of announcement: i.e. outlooks, reviews (watchlistings) and effectiverating changes.
1 The model was calibrated also on semiannual basis.
123

166 R. Castellano, R. Giacometti
Fig. 1 Liquidity in the CDS market source: BIS
Over the last twenty years, the demand for clear and internationally acceptedindicators of default risk was pushed by investors willing to invest in internationalsecurities—whether corporate or government bonds—whose credit quality they wouldhave been virtually unable to assess on their own. CRAs worked for decades on imple-menting an understandable system that would allow any investor to invest in interna-tional securities with which they were not directly familiar (Utzig 2010).
Nowadays, after the financial crisis started in 2007, market agents have placedunder great observation the belief that CRAs, having access to non-public informa-tion, convey extra information to the market through rating changes, watchlistingsand outlooks. It therefore became pretty common to look at the size of the abnormalsecurity price changes to obtain information about the creditworthiness of a specificcompany. In particular, CDS spreads become useful indicators to price and measurecredit risk (Blanco et al. 2005; Longstaff et al. 2005).
The CDS is the most liquid of the currently traded credit derivatives and accountsfor around half of the credit derivatives market. So far, the most standard and liquidmaturity of the CDS contracts is 5 years, typical notional amount is US$10 million.Trading mainly takes place in London and New York. Figure 1 shows the impres-sive growth of liquidity registered in the CDS market up the 2007 and the reductionobserved during the ongoing financial crisis.
In 2004, the total outstanding notional in single-name and multi-name CDS wason the order of 6 trillion dollars; by 2007 it had grown to approximately 58 trilliondollars. After the crisis, the volume of the CDS market has halved to 30 trillion dol-lars in December 2010.2 However, this reduction is not attributable to a decreasedtrading activity in CDSs but to the netting of short and long CDS positions on thesame credit entity held by the same institutions, as demanded by regulators (Jarrow2010; Avellaneda and Cont 2010). While liquidity in the bond and interbank lendingmarkets declined dramatically during the financial crisis, the CDS market remained
2 These data are from the Bank for International Settlements (BIS)—Semiannual OTC derivatives statisticsat end-December 2010.
123

Credit default swaps: implied ratings versus official ones 167
active and provided agents with a way to hedge risk and a function for market-basedcredit risk price determination.
3 The implied rating model
In this section, the non-parametric mapping from the official ratings to the marketimplied ones is described.
As pointed out in the previous section, CDS spreads reflect the credit risk premiumrelated to a reference entity. In principle, all the CDS written on reference entities withthe same rating class should have similar quotes, forming a cluster. However, this isnot always the case and some quotes behave like outliers. In Fig. 2 we provide anexample for three hypothetical rating classes (c1, c2 and c3), where, for each referenceentity and at a fixed point in time, on the x-axis and y-axis the rating classes and thespreads are respectively plotted. We expect all the spreads of a specific rating classto fall into the range defined by its upper and lower bounds (i.e., for rating class c2we expect all the quotes identified by the green dots to fall into the interval boundedby b−
2 and b+2 ). However, this is not always the case and in Fig. 2 the outliers for the
considered rating class are highlighted with an ellipse designed with a dashed line.Following Reyngold et al. (2007), we assume that the quotes of a specific rating
class must be bounded from above and below (i.e. they belong to a given interval).The outliers of each rating class are the CDS quotes falling outside the interval definedby those bounds. The idea behind the proposed IRs model is to determine the optimalbounds, minimizing the average distance between each spread and the crossed bound-ary, for all CDSs and all rating classes.
We consider daily CDS spreads and, for each day t with 1 ≤ t ≤ T , weassign to each CDS a rating class out of M possible values belonging to the setS = {c1, c2, . . . , cM }, with S ⊂ N and c1 ≤ c2 ≤ · · · ≤ cM . Starting from the officialratings provided by each of the three CRAs (Fitch Ratings, Moody’s and Standard &
Fig. 2 Description of the IRs Model
123

168 R. Castellano, R. Giacometti
Poor’s), we compute the IRs boundaries for each rating class, ck , given Nk , the numberof CDS quotes belonging to the kth rating class, up to time T .
Let:
– ck be the kth rating class, with 1 ≤ k ≤ M ;– s jkt be the j th spread in rating class ck at time t , with 1 ≤ k ≤ M , 1 ≤ t ≤ T and
1 ≤ j ≤ Nk ;– b+
k and b−k be respectively the upper and lower boundaries for rating class ck .
The boundaries of the IRs are obtained minimizing the following objective func-tion, representing the average distance between each spread and the crossed boundary,for all CDSs and rating classes:
minb+,b−
M∑
k=1
Nk∑
j=1
T∑
t=1
1
Nk
[max
(s jkt − b+
k , 0) + max
(b−
k − s jkt , 0)]
(3.1)
subject to:
b+k−1 = b−
k , ∀k > 1
b+k−1 ≤ b−
k , ∀k > 1.
The previous constraints guarantee that the upper bound of a category is also thelower bound of the next higher category.
The linearization of (3.1) brings to the following equivalent linear programmingmodel:
minb+,b−
M∑
k=1
Nk∑
j=1
T∑
t=1
1
Nk
(z jkt + w jkt
)(3.2)
b+k−1 = b−
k , ∀k > 1
b+k−1 ≤ b−
k , ∀k > 1
z jkt ≥ s jkt − b+k , ∀ j, k, t
w jkt ≥ b−k − s jkt , ∀ j, k, t
z jkt ≥ 0, ∀ j, k, t
w jkt ≥ 0, ∀ j, k, t
where z jkt and w jkt are positive auxiliary variables.Compared to the model proposed by Reyngold et al. (2007), in the proposed IRs
model we use a different penalty function. Theoretically, many other different penaltyfunctions could be applied but we choose a linear one since it allows to manage theobserved CDS quotes in a neutral way, without heavily penalizing the outliers lyingfar from the bounds with respect to those which are closer. The linear penalty functionused here implies a neutral position with respect to the possible misclassified obser-vations and allows to avoid the assumption of subjective views on market behaviors.
123
Credit default swaps: implied ratings versus official ones 169
Table 1 The sample of effective rating changes
In this respect, we stress that, especially during periods characterized by huge vol-atility, CDS spreads overshot. They may peak because of factors which are eitherirrational or due to considerations not related with credit quality. For this reason, thechoice of not penalizing heavily and arbitrarily outliers too far from the bounds seemsto be the most appropriate; the one that allows to take a neutral picture of the market.
The IRs model is calibrated by year on the CDS quotes in the sample period,3 inorder to consider dynamic bounds. If agencies and market acted with the same timing,official agency and IRs should mimic each other. However, empirical evidences sup-port the existence of some temporal lags. We conclude the study with an analysisperformed on various temporal lags, in order to test whether IRs anticipate/followa change in the official ones. Furthermore, the differences in the lead/lag reactionsamong the three CRAs are analyzed.
4 Application and results
In this section we describe the characteristics of the data set on which the non-parametric mapping of the market IRs is calibrated, and the results of the analysis.Model validation and testing procedures are also outlined.
4.1 The data set
The data set consists of single name CDS spreads over the period 2004–2009. Datacover the time period from June 1, 2004 to October 15, 2009 and refer to the 5-yearmaturity CDS, representing the most liquid contract and a benchmark for the CDSmarket. The sample consists of 103.804 CDS quotes referred to 75 firms, 37 fromEurope and 38 from U.S. The industry composition of the sample is 20% financial,12% automotive, 18.6% energy and 49.3% from other industrial sectors. All the 75CDS contracts refer to senior unsecured reference obligations.
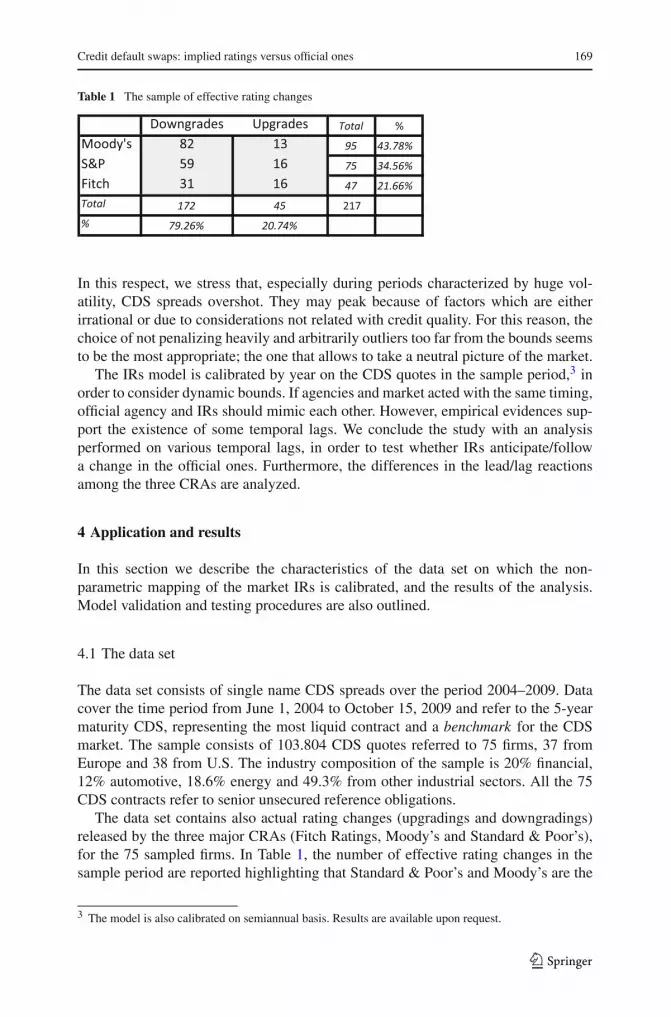
The data set contains also actual rating changes (upgradings and downgradings)released by the three major CRAs (Fitch Ratings, Moody’s and Standard & Poor’s),for the 75 sampled firms. In Table 1, the number of effective rating changes in thesample period are reported highlighting that Standard & Poor’s and Moody’s are the
3 The model is also calibrated on semiannual basis. Results are available upon request.
123
170 R. Castellano, R. Giacometti
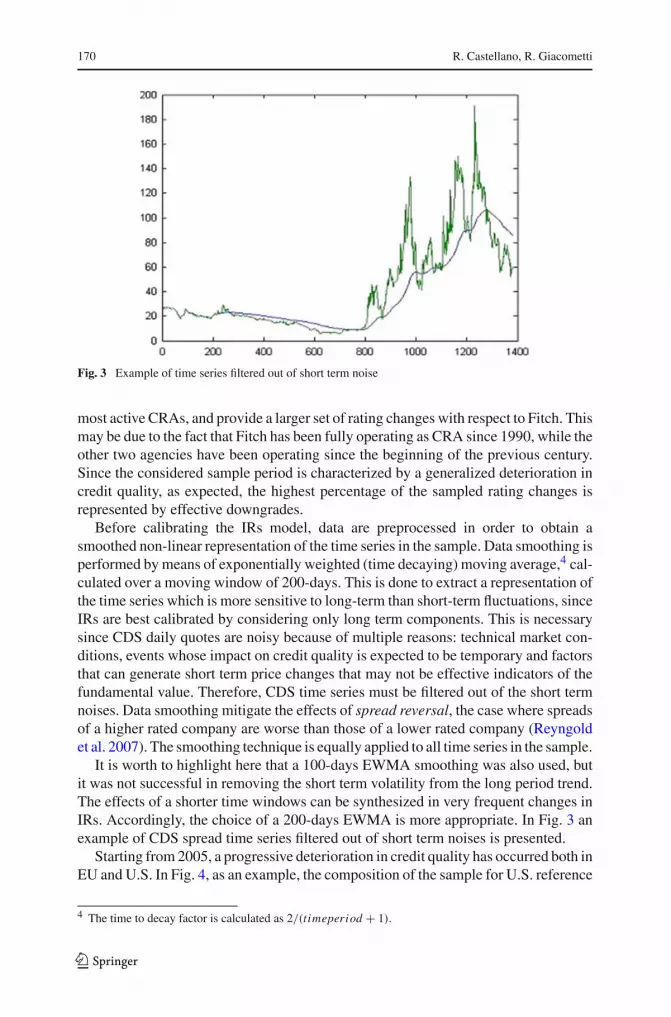
Fig. 3 Example of time series filtered out of short term noise
most active CRAs, and provide a larger set of rating changes with respect to Fitch. Thismay be due to the fact that Fitch has been fully operating as CRA since 1990, while theother two agencies have been operating since the beginning of the previous century.Since the considered sample period is characterized by a generalized deterioration incredit quality, as expected, the highest percentage of the sampled rating changes isrepresented by effective downgrades.
Before calibrating the IRs model, data are preprocessed in order to obtain asmoothed non-linear representation of the time series in the sample. Data smoothing isperformed by means of exponentially weighted (time decaying) moving average,4 cal-culated over a moving window of 200-days. This is done to extract a representation ofthe time series which is more sensitive to long-term than short-term fluctuations, sinceIRs are best calibrated by considering only long term components. This is necessarysince CDS daily quotes are noisy because of multiple reasons: technical market con-ditions, events whose impact on credit quality is expected to be temporary and factorsthat can generate short term price changes that may not be effective indicators of thefundamental value. Therefore, CDS time series must be filtered out of the short termnoises. Data smoothing mitigate the effects of spread reversal, the case where spreadsof a higher rated company are worse than those of a lower rated company (Reyngoldet al. 2007). The smoothing technique is equally applied to all time series in the sample.
It is worth to highlight here that a 100-days EWMA smoothing was also used, butit was not successful in removing the short term volatility from the long period trend.The effects of a shorter time windows can be synthesized in very frequent changes inIRs. Accordingly, the choice of a 200-days EWMA is more appropriate. In Fig. 3 anexample of CDS spread time series filtered out of short term noises is presented.
Starting from 2005, a progressive deterioration in credit quality has occurred both inEU and U.S. In Fig. 4, as an example, the composition of the sample for U.S. reference
4 The time to decay factor is calculated as 2/(t imeperiod + 1).
123

Credit default swaps: implied ratings versus official ones 171
Fig. 4 Composition of the sample by year for U.S. reference entities (Moody’s)
entities, according to Moody’s ratings, is represented by year. As expected, the largestpart of transitions towards the worse rating classes occurred during the last three yearsof the analysis (2007–2009), in line with the financial crisis which started in 2007 andexperienced its peak in 2008. The distribution by rating classes and year, for the otherAgencies and European market presents similar characteristics. It is worth to noticethat the most relevant difference in the database under consideration, disaggregatedby geographical area and analyzed by year, is that the European reference entities’creditworthiness is, on average, higher than U.S. ones.
4.2 The results
Once the IRs model is calibrated, we analyze the results of the reclassification. Inorder to obtain dynamic boundaries, the model is calibrated by year and semester.5
Results are summarized in the so called Hit-Miss Matrices (HMMs). For each year andgeographical area, A = [
ai j]
is the HMM, whose generic element ai j represents thepercentage of CDS quotes officially in the j th rating class and reclassified in the i thimplied one. The diagonal elements provide information on the percentages of CDSquotes confirmed in their original class, whilst the off-diagonal elements represent thepercentages of reclassified CDSs. In particular, the off-diagonal elements which arehighlighted in orange and green represent the percentage of quotes reclassified withinone or two notches. The remaining elements point out a stronger migration.
The analysis suggest that the IRs model is more severe than CRAs in the assign-ments of credit quality grades. This severity becomes even stronger when the years ofthe financial crisis are considered. In this context, we notice an increasing number ofnon-zero off-diagonal elements of the HMMs, testifying an increasing disalignmentof IRs with respect to official ones. This signals a substantial different behavior of theCRAs with respect to market’s view, probably due to an increase in market volatilityduring the financial crisis. As an example, Tables 2 and 3, report the 2005 and 2008
5 We report only results calibrated on annual basis, those calibrated by semester are available upon request.
123

172 R. Castellano, R. Giacometti
Tabl
e2
HM
M(M
oody
’s)
2005
DC
Ca
Caa
B3
B2
B1
Ba1
Ba2
Ba3
Baa
3B
aa2
Baa
1A
3A
2A
1A
a3A
a2A
a1A
aaT
otal
D0.
00%
0.00
%0.
00%
DC
0.00
%0.
00%
0.00
%0.
00%
CC
a0.
00%
0.00
%0.
00%
99.8
1%0.
00%
9.42
%C
aC
aa0.
00%
71.2
1%0.
19%
0.00
%66
.67%
15.2
0%1.
71%
Caa
B3
28.7
9%0.
00%
33.8
5%0.
00%
12.2
9%6.
53%
27.9
6%1.
99%
12.4
3%B
3B
20.
00%
66.1
5%0.
00%
14.9
5%0.
00%
0.59
%3.
34%
7.60
%4.
40%
0.63
%B
2B
10.
00%
0.00
%72
.76%
0.00
%0.
00%
0.00
%0.
56%
0.50
%1.
05%
B1
Ba1
0.00
%0.
00%
0.00
%0.
00%
0.00
%14
.38%
0.44
%0.
95%
Ba1
Ba2
0.00
%0.
00%
38.1
3%0.
00%
2.37
%0.
77%
6.00
%B
a2B
a30.
00%
45.1
0%17
.63%
0.00
%2.
97%
7.68
%B
a3B
aa3
9.64
%26
.44%
40.7
8%8.
03%
29.5
8%22
.82%
100.
00%
Baa
3B
aa2
0.00
%18
.56%
12.4
3%2.
32%
0.00
%B
aa2
Baa
13.
42%
4.79
%19
.16%
0.00
%0.
00%
Baa
1A
35.
54%
15.5
7%4.
00%
0.00
%0.
00%
0.00
%A
3A
26.
61%
4.79
%20
.68%
11.7
9%0.
00%
0.00
%0.
00%
0.00
%A
2A
126
.72%
11.7
7%13
.68%
13.8
1%0.
00%
42.4
1%34
.24%
0.00
%A
1A
a33.
52%
3.16
%17
.72%
0.00
%7.
59%
64.2
0%26
.91%
0.00
%A
a3A
a218
.02%
41.0
5%1.
56%
13.4
6%54
.55%
0.00
%A
a2A
a115
.02%
8.95
%0.
00%
0.00
%45
.45%
9.57
%A
a1A
aa12
.61%
59.6
3%0.
00%
90.4
3%A
aaT
otal
0.00
%0.
00%
100.
00%
100.
00%
100.
00%
100.
00%
100.
00%
0.00
%10
0.00
%10
0.00
%10
0.00
%10
0.00
%10
0.00
%10
0.00
%10
0.00
%10
0.00
%10
0.00
%10
0.00
%10
0.00
%10
0.00
%T
otal
123

Credit default swaps: implied ratings versus official ones 173
Tabl
e3
HM
M(M
oody
’s)
2008
DC
Ca
Caa
B3
B2
B1
Ba1
Ba2
Ba3
Baa
3B
aa2
Baa
1A
3A
2A
1A
a3A
a2A
a1A
aaT
otal
D0.
00%
0.00
%0.
00%
DC
0.00
%10
0.00
%4.
24%
7.92
%7.
80%
CC
a0.
00%
0.00
%58
.47%
29.6
7%21
.59%
33.6
6%1.
85%
Ca
Caa
0.00
%24
.58%
32.3
1%8.
89%
13.8
6%3.
82%
21.9
5%6.
79%
2.97
%C
aaB
312
.71%
25.7
1%4.
44%
29.9
6%13
.22%
3.90
%6.
35%
3.70
%11
.93%
6.30
%B
3B
21.
95%
3.17
%10
.11%
6.21
%1.
95%
10.7
6%0.
88%
2.27
%0.
59%
B2
B1
2.15
%4.
76%
10.1
1%5.
89%
18.0
5%8.
29%
5.13
%0.
59%
B1
Ba1
0.28
%11
.75%
10.8
6%36
.15%
12.6
8%13
.76%
0.00
%4.
77%
0.59
%B
a1B
a217
.46%
17.6
0%4.
94%
0.00
%31
.04%
21.3
0%0.
00%
4.53
%0.
79%
Ba2
Ba3
27.9
4%7.
49%
29.7
8%0.
00%
29.8
1%62
.65%
0.00
%3.
58%
3.94
%15
.03%
3.57
%B
a3B
aa3
7.41
%11
.25%
0.00
%18
.69%
41.9
3%20
.25%
75.2
6%77
.60%
34.9
5%B
aa3
Baa
20.
00%
14.4
7%0.
00%
2.57
%3.
15%
1.84
%3.
68%
3.57
%1.
62%
Baa
2B
aa1
13.8
3%21
.36%
2.10
%1.
57%
2.76
%4.
21%
1.95
%1.
39%
Baa
1A
34.
50%
0.95
%4.
91%
3.54
%2.
15%
2.63
%3.
25%
1.39
%A
3A
211
.50%
4.06
%13
.32%
10.8
3%2.
15%
3.16
%5.
84%
2.08
%A
2A
15.
14%
10.8
6%12
.62%
16.5
4%6.
13%
3.68
%4.
22%
4.17
%0.
65%
A1
Aa3
13.7
5%17
.90%
27.1
0%1.
77%
9.51
%2.
11%
0.00
%3.
24%
0.00
%1.
74%
Aa3
Aa2
15.8
4%11
.93%
16.1
2%7.
87%
26.6
9%5.
26%
0.00
%26
.85%
0.00
%11
.74%
Aa2
Aa1
2.17
%0.
72%
2.57
%2.
76%
0.00
%12
.96%
0.00
%13
.26%
Aa1
Aaa
10.7
4%11
.34%
0.00
%72
.61%
Aaa
Tot
al0.
00%
100.
00%
100.
00%
100.
00%
100.
00%
100.
00%
100.
00%
100.
00%
100.
00%
100.
00%
100.
00%
100.
00%
100.
00%
100.
00%
100.
00%
100.
00%
100.
00%
100.
00%
0.00
%10
0.00
%T
otal
123

174 R. Castellano, R. Giacometti
Fig 5 Ford’s credit quality evolution—IRs versus official ones
HMMs for U.S. companies relative to Moody’s (tables concerning other years, CRAsand geographical regions are available upon request).
Table 2 shows that, during 2005, reclassification mainly affects the below andlower investment grade rating classes. It is worth to highlight that in 2005 there is alsothe greater concentration of CDS quotes.6 At the same time, the greater number ofnon-zero elements in the upper triangular matrix shows that the IRs model is moresevere with respect to the agency in the assignment of credit quality for those classes.Even though the greatest part of CDS quotes are concentrated on the lower invest-ment grade, non investment grade and high risk, it can be observed that, during 2008,reclassification mainly affects high and lower investment grade classes (see Table 3).
In Fig. 5, as an example, the dynamics of Ford’s credit quality—according toMoody’s and IRs model—is presented. We observe that IRs signal early warningsof official rating changes, which in this case are mainly downgradings.
A more accurate analysis has been performed on the divergent views betweenIRs and each CRA, pointing out, by year, the percentages of reclassified referenceentities, grouped by number of notches. The results reported in Table 4 show a com-mon behavior among the Agencies with respect to U.S. reference entities. In particular,by year, we observe a decrease in the percentage of reference entities confirmed by theIRs model in the same rating class (i.e. zero notches). At the same time, we observea progressive misalignment and an increasing strictness of IRs, that are highlightedby a larger percentage of notches greater than zero. As outlined in the Appendix, byconvention we assign increasing natural numbers to rating classes with decreasingcredit quality. Therefore, notches with positive values represent downgradings.
As regards the European CDS market (see Table 5), it can be observed that, in2005, the official ratings referred to European reference entities were more aligned toIRs than the U.S. ones. At the same time, during the years characterized by financial
6 In the Appendix the classification of the creditworthiness is reported.
123

Credit default swaps: implied ratings versus official ones 175
Table 4 Reclassification for U.S. companies by year and rating agency
Notches 2005 (%) 2006 (%) 2007 (%) 2008 (%) 2009 (%)
Panel (a) Moody’s
>2 15 19 18 22 32
2 11 8 8 6 9
1 12 13 17 16 7
0 27 26 23 20 18
−1 10 26 16 10 9
−2 9 4 10 7 6
<−2 14 4 8 19 19
Panel (b) S&P
>2 11 15 11 17 27
2 21 8 10 9 7
1 11 10 11 15 7
0 24 30 32 25 20
−1 7 19 10 10 11
−2 10 13 8 8 6
<−2 16 6 19 17 22
Panel (c) Fitch
>2 12 11 10 24 36
2 20 5 8 12 5
1 13 17 20 12 7
0 22 27 28 22 15
−1 13 15 13 6 12
−2 10 17 10 6 6
<−2 10 8 11 17 19
distresses, there is a greater misalignment which does not show a clear trend, sincean increasing percentage of non-zero notches can be observed in both directions (i.e.downgradings and upgradings). Therefore, according to IRs model, it can be concludedthat the European corporate debt market did not suffered a deterioration in the credit-worthiness as strong as in the U.S.
An extensive analysis of the IRs’ ability to anticipate/follow official effectiverating changes is provided by means of a re-evaluation of the classical event studymethodology.
Following Norden and Weber (2004), and Hull et al. (2004), for each referenceentity, we identify rating events (i.e. upgradings and downgrading) and create an eventtime window which covers the period of n days before and n′ days after each rat-ing event. The possible contaminations of multiple rating events in the chosen timewindow is avoided, removing multiple events occurring in the same window.
In each event time window, the cumulative notches are computed and the sign of theresulting value is compared with the sign of the official rating changes (i.e. a positivesign for downgrading and a negative sign for upgrading). Following this methodology,
123

176 R. Castellano, R. Giacometti
Table 5 Reclassification for European companies by year and rating agency
Notches 2005 (%) 2006 (%) 2007 (%) 2008 (%) 2009 (%)
Panel (a) Moody’s
>2 8 2 11 16 22
2 10 15 12 11 10
1 23 21 16 13 13
0 35 29 21 13 14
−1 12 13 15 15 11
−2 5 12 14 12 10
<−2 6 8 10 21 20
Panel (b) S&P
>2 0 1 9 13 13
2 7 10 10 11 12
1 21 24 19 16 15
0 42 32 22 12 13
−1 16 15 16 7 8
−2 7 14 16 17 12
<−2 8 5 8 25 27
Panel (c) Fitch
>2 9 11 9 12 14
2 8 18 15 14 8
1 21 19 19 17 22
0 35 22 17 15 12
−1 10 14 17 14 9
−2 6 10 15 11 9
<−2 11 7 8 18 26
Table 6 Percentage ofsuccessful anticipation of ratingchanges in European and U.S.markets
60 (%) 90 (%) 120 (%) 150 (%)
EU
Moody’s 46.67 61.11 64.29 57.14
Fitch 67.86 69.23 66.67 62.96
S&P’s 88.89 86.36 86.96 90.48
U.S.
Moody’s 82.05 76.67 76.67 77.78
Fitch 81.58 78.79 89.66 89.66
S&P’s 74.42 63.89 64.29 55.17
the convergence/divergence of the IRs model towards the official rating system andthe convergence/divergence of the official rating system towards the IRs model areanalyzed. In Tables 6 and 7, the results of the analysis are presented for differentlengths, expressed by the number of days before and after the event, respectively.
123

Credit default swaps: implied ratings versus official ones 177
Table 7 Percentage ofsuccessful posticipation of ratingchanges in European and U.S.markets
5 (%) 10 (%) 15 (%) 20 (%)
EU
Moody’s 39.50 17.20 15.89 13.25
Fitch 26.40 16.90 14.30 13.01
S&P’s 23.02 13.09 13.04 12.89
U.S.
Moody’s 22.99 14.01 13.09 13.02
Fitch 30.01 13.05 12.60 12.47
S&P’s 28.02 16.50 14.19 13.25
Results confirm the anticipation capacity of the IRs. The signaling power of themodel is mostly pronounced for U.S. market. This is probably due to a superior capacityof the U.S. market, with respect to the European one, in processing the informationrelated with credit quality. However, results show that CRAs move, but slowly, in thesame direction of the market. On the contrary, with the only exception of Standard &Poor’s, these trends are not so pronounced for European market.
By comparing the behaviors of the CRAs in the two considered markets (i.e. U.S.and EU), it can be concluded that Standard & Poor’s is the agency that seems to reactfaster to market’s views in Europe, whilst the same can be noticed for Fitch in relationto U.S. market. In this respect, it is worth to notice that, even though the official rat-ings provided by Fitch are more stable with respect to Moody’s and Standard & Poor’s(see Sect. 4.1), in the U.S. market the Fitch’s official changes in credit quality move,on average, in the same direction than IRs. The results shown in Table 7 confirm thatthe revisions of creditworthiness officially announced by CRAs are not very crucialin determining adjustments in CDS spreads.
Kou and Varotto (2008) performed a similar analysis on the Eurobond Market,using a data base covering the time period 1988–1998. Although they analyze a dif-ferent market and a different sample period, it might be interesting to compare theirresults with those obtained here. In this respect, the obtained results concerning theCDS market are in line with those obtained on the Eurobond Market, in the sense thatIRs anticipate the future movements of agency ratings. In particular, Kou and Varotto(2008) concludes that the IRs when calibrated on the Eurobond Market may provideearly warnings up to 6 months before and official rating changes.
4.3 Model performance and robustness check
The dimension of the analyzed problem depend on the considered geographical areas(U.S. and EU) and the considered years (the whole period: 2004–2009; or the twosubperiods: 2004–2006 and 2007–2009). Given the number of rating classes, M, thenumber of reference entities, N, the number of business days in the selected time hori-zon, T, the problem with maximum dimension is represented by U.S. reference entities,in the whole period (i.e. 2004–2009), with N = 38, M = 20; T = 1,380. This problemhas O(M N T ) variables and O(M N T ) linear constraints. Using the CPLEX—Gamslibrary, the average CPU run-time, with respect to the solution for each CRA, is 100 s.
123

178 R. Castellano, R. Giacometti
The average CPU run-time for the quadratic penalty function used in Reyngoldet al. (2007) is of 450 s, using CONOPT-Gams Library. As expected, the boundsobtained with the two different penalty functions are very different, especially for theperiod 2007–2009. This is due to the fact that a quadratic penalty function penalizesmore heavily the outliers lying far from the bounds, with respect to the ones closer tothe bounds.
In order to check the robustness of the results, we perform a sensitivity analysiswith respect to the calibration windows. The model is calibrated by year and semesterand, in both the cases, we find similar results in terms of optimal dynamic bounds. Theonly relevant difference in the results is detected in the year 2007. This is obviouslydue to the jump in volatility registered in the CDS market, in that year.
Furthermore, considering the problem characterized by the maximum size (U.S.market, 2004–2009), we contaminate the 1% of the CDS premia, randomly chosen,perturbing by ±1%. In the +1% case, a maximum shift in the bounds equal to 0.11%is obtained, while the average shift is equal to 0.03%. In the −1% case, the maximumshift of the bounds is −0.03% and the average shift is equal to −0.0034%.7
5 Conclusions and further research
The credit derivatives market seems to supply views of firms’ credit quality differ-ent from those supplied by CRAs. The signal of incorrect or slow changes in creditquality can be detected by abnormal CDS quote changes. In this study, we implementa linear programming model able to process information from CDS market quotesand to create a non-parametric mapping from the official ratings to the market impliedones.
The proposed IRs model is applied to a large data set of CDS quotes, includingthe years of the ongoing financial crisis, in order to verify whether CRAs—during thefinancial crisis - have really slowly reacted to the general deterioration in creditwor-thiness and underestimated the credit risk associated with issuers of credit products.We compute IRs by year and geographical area, and analyze the daily rating gaps, i.e.the differences between IRs and official ratings assigned to the reference entities byeach CRA under consideration. This allows to verify which agency was more reactiveto the abnormal market changes registered during the financial crisis. The analysis isalso performed distinguishing between U.S. and EU markets, in order to investigatepossible different behaviors in the two markets.
Results show that there is a misalignments between IRs and official ratings, whichbecome more pronounced during the years of the sample characterized by financialturmoils. Indeed, during the pre-crisis, the misalignments between IRs and officialratings are at most within two notches, while during the crisis are significantly greater.As regards the European CDS market, it can be observed that, in the pre-crisis period,the official ratings were more aligned to IRs than the U.S. ones. However, during thecrisis, we find evidences of a greater misalignment which does not show a clear trend.Hence, according to IRs model, the European corporate debt market did not suffered a
7 Robustness check results are available upon request.
123

Credit default swaps: implied ratings versus official ones 179
deterioration in the creditworthiness as strong as in the U.S. Moreover, results confirmthat the anticipation capacity of the IRs model is mostly pronounced for U.S. market.This is probably due to a superior capacity of this market, with respect to the Europeanone, in processing the information related with credit quality.
Results also show that CRAs move, but slowly, in the same direction of the market.However, we do not find a unique agency that performs better than the others in bothmarkets. In fact, it seems that the better performing agency in the U.S. is Fitch, whileStandard & Poor’s react faster to market’s views in Europe.
This paper leaves room for further research and investigation. On a method-ological level, it could be of particular interest the use of different smoothingtechniques in order to verify which is the most appropriate to extract from CDStime series a representation which is more sensitive to long-term than short-termfluctuations. On a financial level, it could be useful to analyze whether some differ-ences in the delays of the CRAs’ actions could be identified in connection to specificindustries.
Appendix
Credit quality grades
IRs Moody’s S&P Fitch Denommation
c1 1 Aaa AAA AAA Investment grade High investment grade
c2 2 Aa1 AA AA1
c3 3 Aa2 AA AA
c4 4 Aa3 AA− AA−c5 5 A1 A+ A− Lower investment grade
c6 6 A2 A A
c7 7 A3 A− A−c8 8 Baa1 BBB+ BBB+
c9 9 Baa2 BBB BBB
c10 10 Baa3 BBB− BBB−c11 11 Ba1 BB BB Non investment grade Below investment grade
c12 12 Ba2 BB BB
c13 13 Ba3 BB− BB−c14 14 B1 B+ B+ Speculative grade
c15 15 B2 B B
c16 16 B3 B− B−c17 17 Caa CCC CCC High risk
c18 18 Ca CC CC
c19 19 C C C
c20 20 D D D
123
180 R. Castellano, R. Giacometti
References
Afonso A, Furceri D, Gomes P (2011) Sovereign credit ratings and financial markets linkages: applicationto european data. European Central Banks—Eurosystem, WP 1347
Ammer J, Clinton N (2004) Good news in no news? The impact of credit rating changes on the pric-ing of asset-backed securities. Federal Reserve Board, International Finance Discussion Paper 809.http://www.federalreserve.gov/pubs/ifdp/2004/809/default.htm
Avellaneda M, Cont R (2010) Transparency in credit default swap markets. Finance concepts. http://www.finance-concepts.com/images/fc/CDSMarketTransparency.pdf
Black F, Cox JC (1976) Valuing corporate securities: some effects on bond indenture provisions. J Finance31:351–367
Blanco F, Brennan S, Marsh IW (2005) An empirical analysis of the dynamic relationship between invest-ment grade bonds and credit default swaps. J Finance 60:2255–2281
Breger LL, Goldberg LR, Cheyette O (2003) Market implied ratings. Risk Magazine, LondonCastellano R, Scaccia L (2010) A Markov switching re-evaluation of event-study methodology. In:
Lechevallier Y, Saporta G (eds) COMPSTAT’2010—19th international conference on computationalstatistics. Physica, Heidelberg pp 429–436
Goh J, Ederington L (1993) Is a bond rating downgrade bad news, good news, or no news for stockholders?J Finance 48:2001–2008
Hull J, Predescu M, White A (2004) The relationship between credit default swap spreads, bond yields andcredit rating announceents. J Bank Finance 28:2789–2811
Jarrow RA (2010) The economics of credit default swaps. Johnson School Research Paper Series, p 31Kou J, Varotto S (2008) Timeliness of spread implied ratings. Eur Financ Manag 14:503–527Longstaff FA, Mithal S, Neis E (2005) Corporate yield spreads: default risk or liquidity? new evidence from
the credit-default swap market. J Finance 60:2213–2253Longstaff F, Schwartz E (1995) A simple approach to valuing risky fixed and floating rate debt. J Finance
50:789–819Merton R (1974) On the pricing of corporate debt: the risk structure of interest rates. J Finance 9:449–470Micu M, Remolona E, Wooldridge P (2006) The price impact of rating announcements: which announce-
ments matter? Bank for International Settlements 207Norden L, Weber M (2004) Informational efficiency of credit default swap and stock markets: the impact
of credit rating announcements. J Bank Finance 28:2813–2843Reyngold A, Kogacil AE, Gupton GM (2007) Fitch CDS implied ratings (CDS_IR) model. Quantitative
Financial Research Special Reports, Fitch RatingsSteiner M, Heinke V (2001) Event study concerning international bond price effects of credit rating actions.
Int J Finance Econ 6:139–157Utzig S (2010) The financial crisis and the regulation of credit rating agencies: an European banking
perspective. Asian Development Bank 188Weinsten M (1977) The effect of a rating change announcement on bond price. J Financ Econ 5:329–350
123