cortical firing and sleep homeostasis
TRANSCRIPT
Neuron
Article
Cortical Firing and Sleep HomeostasisVladyslav V. Vyazovskiy,1 Umberto Olcese,1,3 Yaniv M. Lazimy,1 Ugo Faraguna,1 Steve K. Esser,1 Justin C. Williams,2
Chiara Cirelli,1 and Giulio Tononi1,*1Department of Psychiatry2Department of Biomedical EngineeringUniversity of Wisconsin-Madison, Madison, WI 53719, USA3PERCRO Laboratory, Scuola Superiore Sant’Anna, 56217 Pisa, Italy
*Correspondence: [email protected]
DOI 10.1016/j.neuron.2009.08.024
SUMMARY
The need to sleep grows with the duration of wakeful-ness and dissipates with time spent asleep, aprocess called sleep homeostasis. What are theconsequences of staying awake on brain cells, andwhy is sleep needed? Surprisingly, we do not knowwhether the firing of cortical neurons is affected byhow long an animal has been awake or asleep.Here, we found that after sustained wakefulnesscortical neurons fire at higher frequencies in allbehavioral states. During early NREM sleep aftersustained wakefulness, periods of population ac-tivity (ON) are short, frequent, and associated withsynchronous firing, while periods of neuronal silenceare long and frequent. After sustained sleep, firingrates and synchrony decrease, while the duration ofON periods increases. Changes in firing patterns inNREM sleep correlate with changes in slow-waveactivity, a marker of sleep homeostasis. Thus, thesystematic increase of firing during wakefulness iscounterbalanced by staying asleep.
INTRODUCTION
During non-rapid eye movement (NREM) sleep the electroen-
cephalogram (EEG) shows characteristic slow waves that can
be recorded over the entire cortical surface (Massimini et al.,
2004). It is well known that slow wave activity (SWA, the
NREM EEG power between 0.5 and 4 Hz) increases after
periods of wakefulness and decreases after periods of sleep
(Achermann and Borbely, 2003). For example, staying awake
from �3 to �24 hr results in progressively higher SWA levels
at sleep onset, while naps during the day reduce SWA the
following night (Tobler and Borbely, 1986; Vyazovskiy et al.,
2006; Werth et al., 1996b). Also, SWA peaks early on during
sleep and decreases thereafter along with the decline in sleep
pressure (Achermann and Borbely, 2003). There is also evidence
for a regional regulation of slow waves (Cajochen et al., 1999;
Oleksenko et al., 1992), and recent studies show that cortical
areas that have been ‘‘used’’ more during waking show higher
SWA relative to less engaged areas (e.g., Huber et al., 2004;
Kattler et al., 1994), whereas areas that have been ‘‘used’’ less
show reduced SWA (Huber et al., 2006). Thus, at least under
acute conditions, sleep SWA can be considered a reliable EEG
marker of sleep need and may thus be related to sleep function
(Tononi and Cirelli, 2006).
At the cellular level, it is well known that cortical neuronal firing
patterns are characteristically different in NREM sleep com-
pared to both wakefulness and REM sleep (Burns et al., 1979;
Desiraju, 1972; Hobson and McCarley, 1971; Murata and
Kameda, 1963; Noda and Adey, 1970, 1973; Steriade et al.,
2001; Verzeano and Negishi, 1960). Intracellular recordings
have shown that, during NREM sleep, virtually all cortical
neurons engage in the slow (<1 Hz) oscillation, consisting of
a depolarized up state, when neurons show sustained firing,
and a hyperpolarized down state, characterized by neuronal
silence (Amzica and Steriade, 1998; Destexhe et al., 1999;
Steriade et al., 1993d, 2001). There is a close temporal relation-
ship between these cellular phenomena and simultaneously
recorded slow (or delta) waves, which are defined as surface-
negative EEG events that fall in the SWA frequency range
(Amzica and Steriade, 1998; Contreras and Steriade, 1995).
Specifically, the surface negativity in the EEG signal (or depth
positivity in the local field potential, LFP) corresponds to the
down state of cortical neurons as recorded intracellularly and
to the suppression of spiking activity as recorded extracellularly,
suggesting that EEG or LFP slow waves are a reflection of near-
synchronous transitions between up and down states in large
populations of cortical neurons (Burns et al., 1979; Calvet
et al., 1973; Contreras and Steriade, 1995; Ji and Wilson, 2007;
Luczak et al., 2007; Molle et al., 2006; Mukovski et al., 2007;
Murata and Kameda, 1963; Noda and Adey, 1973; Steriade
et al., 1993c, 2001).
Thus, (1) sleep EEG slow waves reflect the transition between
up and down states of cortical neurons, and (2) EEG SWA is
a marker of sleep homeostasis and presumably of sleep need.
One might then hypothesize that some aspects of cortical firing
may change in relation to sleep pressure. In other words, do
cortical neurons fire differently depending on how long the brain
has been awake? Surprisingly, this basic question has never
been addressed. To fill this gap, we recorded continuously for
several days EEG and cortical unit activity in freely behaving
rats, during spontaneous sleep/waking cycles as well as after
sleep deprivation. We report here that cortical firing patterns
do indeed change as a function of sleep homeostasis, in terms
of neuronal firing rates, firing synchrony, and distribution of ON
and OFF periods.
Neuron 63, 865–878, September 24, 2009 ª2009 Elsevier Inc. 865

Neuron
Cortical Firing and Sleep Need
Figure 1. Cortical Activity in Sleep and Waking
(A and B) Hypnogram, EEG traces from the right barrel cortex and corresponding electromyogram (EMG) in a representative rat during a 2 hr interval of undis-
turbed baseline starting at light onset (positivity is upward).
(C) Average EEG power spectra in NREM sleep, REM sleep, and waking (mean + SEM, n = 6 rats). Note high values of spectral power in the slow waves range
(SWA, 0.5–4.0 Hz; gray bar) in NREM sleep.
(D) Raw multiunit activity (MUA) recorded simultaneously in the same rat from a microwire array placed in the left barrel cortex (six individual channels are shown).
Note high tonic firing in waking and REM sleep, and OFF periods in NREM sleep.
(E) Raster plots of spike activity for the same 6 channels shown in (D) (each vertical line is a spike). Note the close temporal relationship between OFF periods and
the negative phase of EEG slow waves. Spike sorting was done according to a standard technique (see Experimental Procedures and Figure S1) and the recorded
neural population was stable over time (Figure S2).
RESULTS
The Negative Phase of EEG Slow Waves Correspondsto OFF Periods in Cortical Multiunit ActivityThe EEG during waking and REM sleep is characterized by theta
(6–9 Hz) waves and fast frequencies, while in NREM sleep is
dominated by high amplitude and low frequency (0.5–4.0 Hz)
slow (delta) waves, which account for most of the power in the
EEG spectrum (Figures 1A–1C). Neuronal activity in the barrel
cortex, measured extracellularly using microelectrode arrays
(see Figures S1 and S2 available online), also changes dramati-
cally between sleep and waking, with periodic total suppression
of neuronal firing during NREM sleep (Figures 1D and 1E). We call
the periods when all recorded neurons are silent for at least
50 ms OFF periods, as opposed to ON periods, when at least
a subset of them shows sustained firing (Figure 1E; average
duration, ON periods = 815.5 ± 119.9 ms; OFF periods = 85.8 ±
5.9 ms, n = 6 rats). The OFF periods occur nearly simultaneously
with the negative phase of the slow waves on the surface EEG
866 Neuron 63, 865–878, September 24, 2009 ª2009 Elsevier Inc.
(Figures 1C–1E). Thus, they likely correspond to the down state
of the slow oscillations as recorded intracellularly. We use the
terms ‘‘ON’’ and ‘‘OFF’’ periods, instead of ‘‘up’’ and ‘‘down’’
or ‘‘depolarized’’ and ‘‘hyperpolarized’’ states (Bazhenov et al.,
2002; Steriade et al., 1993d, 2001), because the periods of
neuronal activity and silence were defined based on the popula-
tion extracellular activity and not based on changes in mem-
brane potential of individual neurons as measured intracellularly.
Analysis of neuronal activity based on consecutive 4 s epochs
revealed a rapid decrease of mean cortical firing rates at the tran-
sition from waking to NREM sleep and a gradual increase from
NREM to REM sleep (Figure 2A). Overall, periods with high firing
rate were more frequent in waking and REM sleep, while periods
with low firing rates prevailed in NREM sleep (Figure 2B). Still,
firing rates were highly variable within each behavioral state
(Figure 2B), likely reflecting different ‘‘substates.’’ For example,
during active waking many neurons showed periods of silence
of up to several seconds, followed by robust firing often in asso-
ciation with specific behaviors, such as exploring or grooming
Neuron
Cortical Firing and Sleep Need
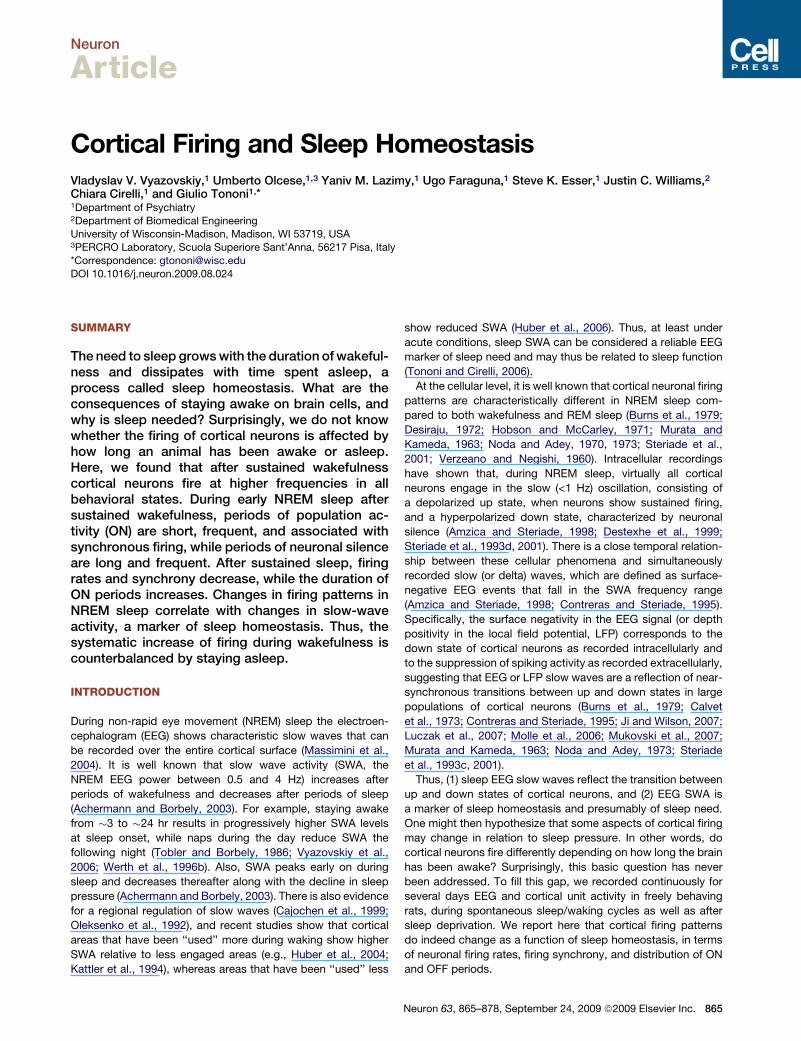
(data not shown). On average, firing rates were �15%–20%
higher during active relative to quiet waking (15.4 ± 0.9 versus
13.0 ± 0.8 Hz, p < 0.001; quiet waking accounted for <10% of
total waking time, consistent with previous reports (Huber
et al., 2007b). During NREM sleep, compared to waking and
REM sleep, there was a greater proportion of short (<20 ms) in-
terspike intervals (ISIs), likely reflecting high intensity firing during
the ON periods, as well as a several fold increase in long ISIs
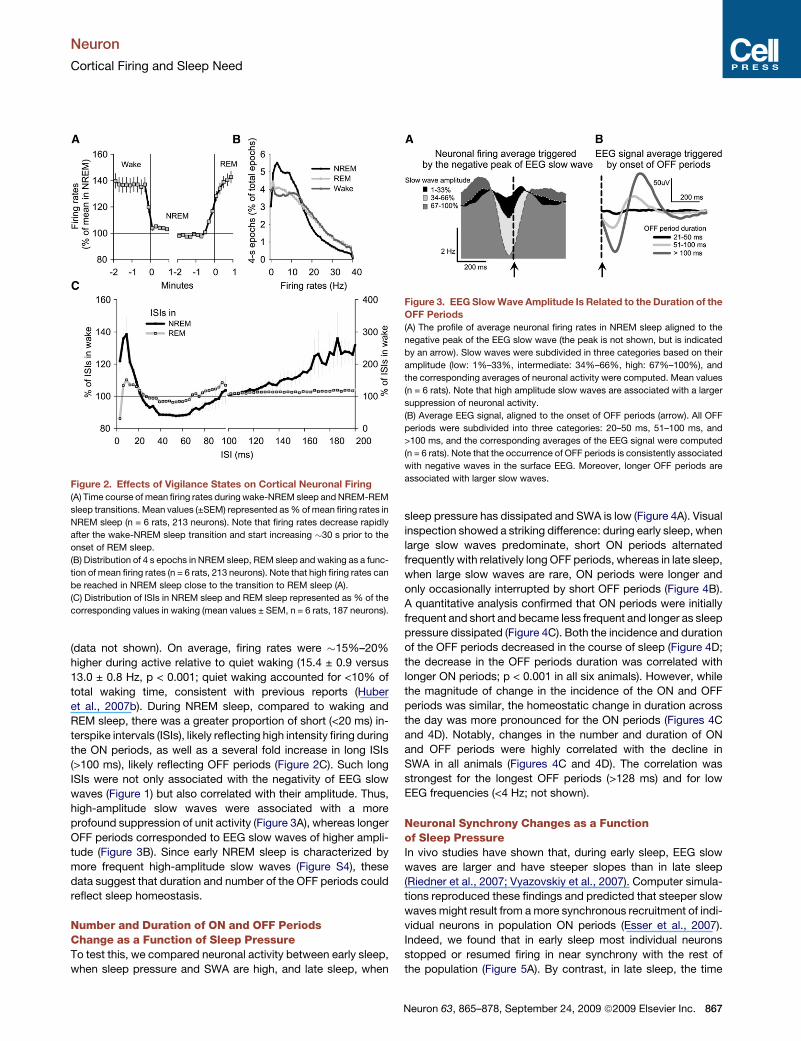
(>100 ms), likely reflecting OFF periods (Figure 2C). Such long
ISIs were not only associated with the negativity of EEG slow
waves (Figure 1) but also correlated with their amplitude. Thus,
high-amplitude slow waves were associated with a more
profound suppression of unit activity (Figure 3A), whereas longer
OFF periods corresponded to EEG slow waves of higher ampli-
tude (Figure 3B). Since early NREM sleep is characterized by
more frequent high-amplitude slow waves (Figure S4), these
data suggest that duration and number of the OFF periods could
reflect sleep homeostasis.
Number and Duration of ON and OFF PeriodsChange as a Function of Sleep PressureTo test this, we compared neuronal activity between early sleep,
when sleep pressure and SWA are high, and late sleep, when
Figure 2. Effects of Vigilance States on Cortical Neuronal Firing
(A) Time course of mean firing rates during wake-NREM sleep and NREM-REM
sleep transitions. Mean values (±SEM) represented as % of mean firing rates in
NREM sleep (n = 6 rats, 213 neurons). Note that firing rates decrease rapidly
after the wake-NREM sleep transition and start increasing �30 s prior to the
onset of REM sleep.
(B) Distribution of 4 s epochs in NREM sleep, REM sleep and waking as a func-
tion of mean firing rates (n = 6 rats, 213 neurons). Note that high firing rates can
be reached in NREM sleep close to the transition to REM sleep (A).
(C) Distribution of ISIs in NREM sleep and REM sleep represented as % of the
corresponding values in waking (mean values ± SEM, n = 6 rats, 187 neurons).
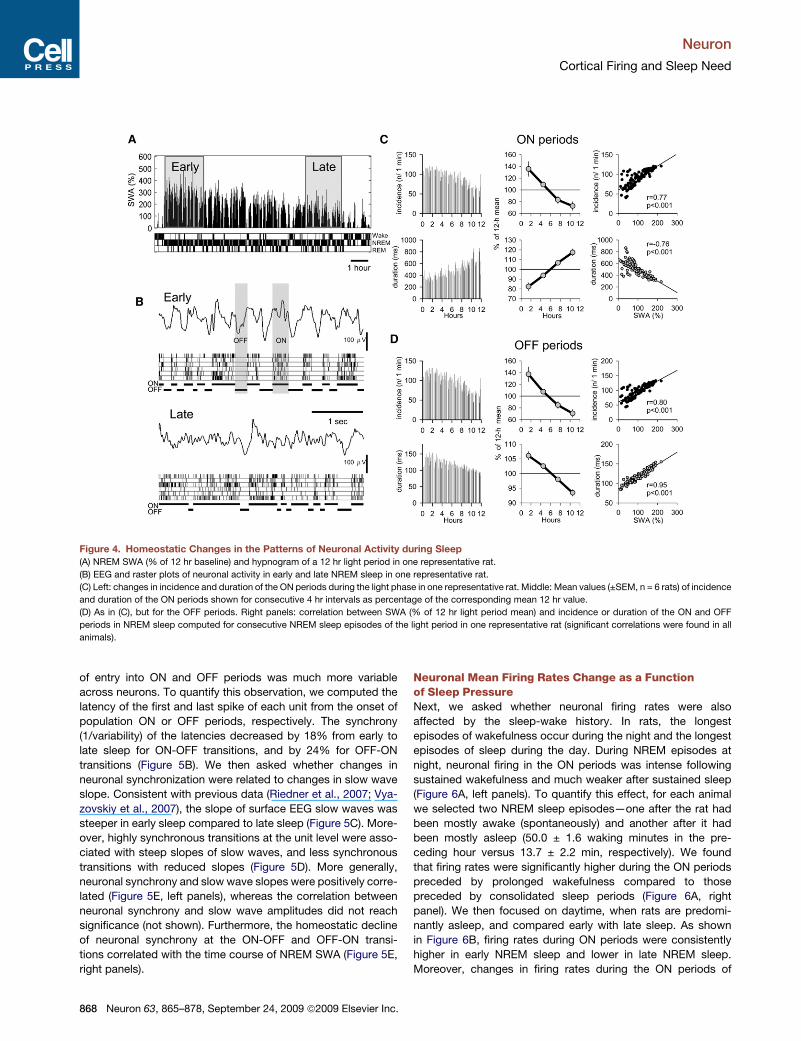
sleep pressure has dissipated and SWA is low (Figure 4A). Visual
inspection showed a striking difference: during early sleep, when
large slow waves predominate, short ON periods alternated
frequently with relatively long OFF periods, whereas in late sleep,
when large slow waves are rare, ON periods were longer and
only occasionally interrupted by short OFF periods (Figure 4B).
A quantitative analysis confirmed that ON periods were initially
frequent and short and became less frequent and longer as sleep
pressure dissipated (Figure 4C). Both the incidence and duration
of the OFF periods decreased in the course of sleep (Figure 4D;
the decrease in the OFF periods duration was correlated with
longer ON periods; p < 0.001 in all six animals). However, while
the magnitude of change in the incidence of the ON and OFF
periods was similar, the homeostatic change in duration across
the day was more pronounced for the ON periods (Figures 4C
and 4D). Notably, changes in the number and duration of ON
and OFF periods were highly correlated with the decline in
SWA in all animals (Figures 4C and 4D). The correlation was
strongest for the longest OFF periods (>128 ms) and for low
EEG frequencies (<4 Hz; not shown).
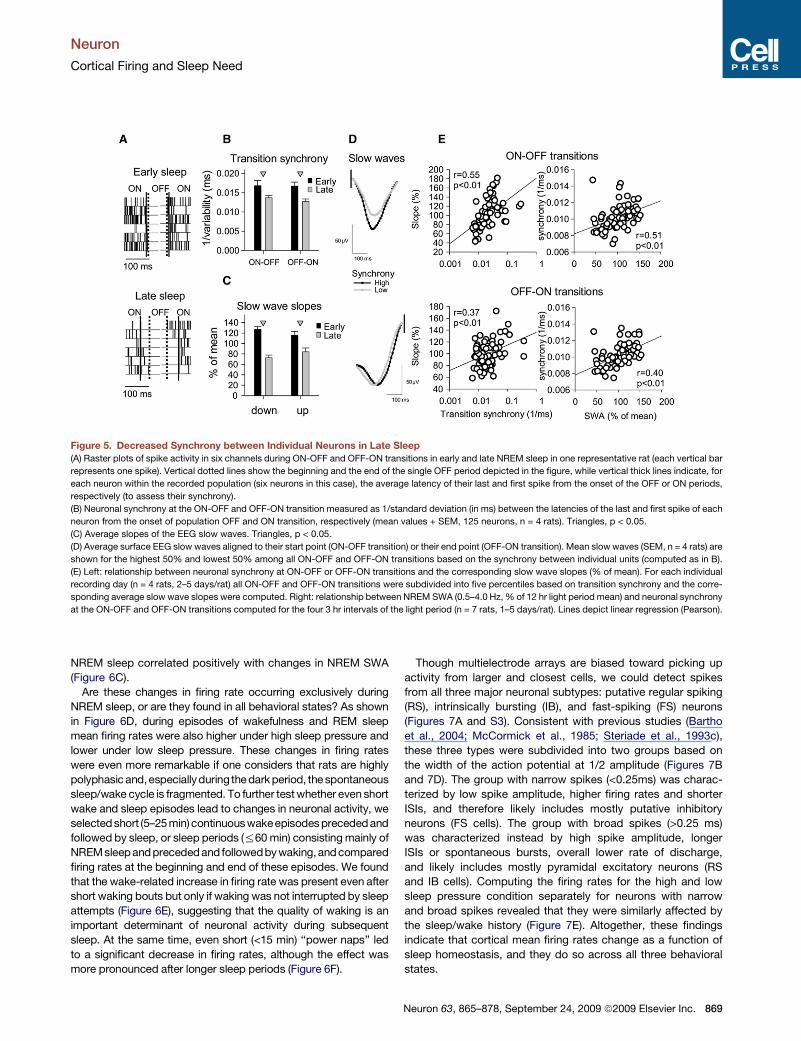
Neuronal Synchrony Changes as a Functionof Sleep PressureIn vivo studies have shown that, during early sleep, EEG slow
waves are larger and have steeper slopes than in late sleep
(Riedner et al., 2007; Vyazovskiy et al., 2007). Computer simula-
tions reproduced these findings and predicted that steeper slow
waves might result from a more synchronous recruitment of indi-
vidual neurons in population ON periods (Esser et al., 2007).
Indeed, we found that in early sleep most individual neurons
stopped or resumed firing in near synchrony with the rest of
the population (Figure 5A). By contrast, in late sleep, the time
Figure 3. EEG Slow Wave Amplitude Is Related to the Duration of the
OFF Periods
(A) The profile of average neuronal firing rates in NREM sleep aligned to the
negative peak of the EEG slow wave (the peak is not shown, but is indicated
by an arrow). Slow waves were subdivided in three categories based on their
amplitude (low: 1%–33%, intermediate: 34%–66%, high: 67%–100%), and
the corresponding averages of neuronal activity were computed. Mean values
(n = 6 rats). Note that high amplitude slow waves are associated with a larger
suppression of neuronal activity.
(B) Average EEG signal, aligned to the onset of OFF periods (arrow). All OFF
periods were subdivided into three categories: 20–50 ms, 51–100 ms, and
>100 ms, and the corresponding averages of the EEG signal were computed
(n = 6 rats). Note that the occurrence of OFF periods is consistently associated
with negative waves in the surface EEG. Moreover, longer OFF periods are
associated with larger slow waves.
Neuron 63, 865–878, September 24, 2009 ª2009 Elsevier Inc. 867
Neuron
Cortical Firing and Sleep Need
Figure 4. Homeostatic Changes in the Patterns of Neuronal Activity during Sleep
(A) NREM SWA (% of 12 hr baseline) and hypnogram of a 12 hr light period in one representative rat.
(B) EEG and raster plots of neuronal activity in early and late NREM sleep in one representative rat.
(C) Left: changes in incidence and duration of the ON periods during the light phase in one representative rat. Middle: Mean values (±SEM, n = 6 rats) of incidence
and duration of the ON periods shown for consecutive 4 hr intervals as percentage of the corresponding mean 12 hr value.
(D) As in (C), but for the OFF periods. Right panels: correlation between SWA (% of 12 hr light period mean) and incidence or duration of the ON and OFF
periods in NREM sleep computed for consecutive NREM sleep episodes of the light period in one representative rat (significant correlations were found in all
animals).
of entry into ON and OFF periods was much more variable
across neurons. To quantify this observation, we computed the
latency of the first and last spike of each unit from the onset of
population ON or OFF periods, respectively. The synchrony
(1/variability) of the latencies decreased by 18% from early to
late sleep for ON-OFF transitions, and by 24% for OFF-ON
transitions (Figure 5B). We then asked whether changes in
neuronal synchronization were related to changes in slow wave
slope. Consistent with previous data (Riedner et al., 2007; Vya-
zovskiy et al., 2007), the slope of surface EEG slow waves was
steeper in early sleep compared to late sleep (Figure 5C). More-
over, highly synchronous transitions at the unit level were asso-
ciated with steep slopes of slow waves, and less synchronous
transitions with reduced slopes (Figure 5D). More generally,
neuronal synchrony and slow wave slopes were positively corre-
lated (Figure 5E, left panels), whereas the correlation between
neuronal synchrony and slow wave amplitudes did not reach
significance (not shown). Furthermore, the homeostatic decline
of neuronal synchrony at the ON-OFF and OFF-ON transi-
tions correlated with the time course of NREM SWA (Figure 5E,
right panels).
868 Neuron 63, 865–878, September 24, 2009 ª2009 Elsevier Inc.
Neuronal Mean Firing Rates Change as a Functionof Sleep PressureNext, we asked whether neuronal firing rates were also
affected by the sleep-wake history. In rats, the longest
episodes of wakefulness occur during the night and the longest
episodes of sleep during the day. During NREM episodes at
night, neuronal firing in the ON periods was intense following
sustained wakefulness and much weaker after sustained sleep
(Figure 6A, left panels). To quantify this effect, for each animal
we selected two NREM sleep episodes—one after the rat had
been mostly awake (spontaneously) and another after it had
been mostly asleep (50.0 ± 1.6 waking minutes in the pre-
ceding hour versus 13.7 ± 2.2 min, respectively). We found
that firing rates were significantly higher during the ON periods
preceded by prolonged wakefulness compared to those
preceded by consolidated sleep periods (Figure 6A, right
panel). We then focused on daytime, when rats are predomi-
nantly asleep, and compared early with late sleep. As shown
in Figure 6B, firing rates during ON periods were consistently
higher in early NREM sleep and lower in late NREM sleep.
Moreover, changes in firing rates during the ON periods of
Neuron
Cortical Firing and Sleep Need
Figure 5. Decreased Synchrony between Individual Neurons in Late Sleep
(A) Raster plots of spike activity in six channels during ON-OFF and OFF-ON transitions in early and late NREM sleep in one representative rat (each vertical bar
represents one spike). Vertical dotted lines show the beginning and the end of the single OFF period depicted in the figure, while vertical thick lines indicate, for
each neuron within the recorded population (six neurons in this case), the average latency of their last and first spike from the onset of the OFF or ON periods,
respectively (to assess their synchrony).
(B) Neuronal synchrony at the ON-OFF and OFF-ON transition measured as 1/standard deviation (in ms) between the latencies of the last and first spike of each
neuron from the onset of population OFF and ON transition, respectively (mean values + SEM, 125 neurons, n = 4 rats). Triangles, p < 0.05.
(C) Average slopes of the EEG slow waves. Triangles, p < 0.05.
(D) Average surface EEG slow waves aligned to their start point (ON-OFF transition) or their end point (OFF-ON transition). Mean slow waves (SEM, n = 4 rats) are
shown for the highest 50% and lowest 50% among all ON-OFF and OFF-ON transitions based on the synchrony between individual units (computed as in B).
(E) Left: relationship between neuronal synchrony at ON-OFF or OFF-ON transitions and the corresponding slow wave slopes (% of mean). For each individual
recording day (n = 4 rats, 2–5 days/rat) all ON-OFF and OFF-ON transitions were subdivided into five percentiles based on transition synchrony and the corre-
sponding average slow wave slopes were computed. Right: relationship between NREM SWA (0.5–4.0 Hz, % of 12 hr light period mean) and neuronal synchrony
at the ON-OFF and OFF-ON transitions computed for the four 3 hr intervals of the light period (n = 7 rats, 1–5 days/rat). Lines depict linear regression (Pearson).
NREM sleep correlated positively with changes in NREM SWA
(Figure 6C).
Are these changes in firing rate occurring exclusively during
NREM sleep, or are they found in all behavioral states? As shown
in Figure 6D, during episodes of wakefulness and REM sleep
mean firing rates were also higher under high sleep pressure and
lower under low sleep pressure. These changes in firing rates
were even more remarkable if one considers that rats are highly
polyphasic and,especiallyduring the dark period, the spontaneous
sleep/wake cycle is fragmented. To further test whether even short
wake and sleep episodes lead to changes in neuronal activity, we
selected short (5–25 min) continuous wakeepisodes preceded and
followed by sleep, or sleep periods (%60 min) consisting mainly of
NREMsleepand precededand followedby waking,and compared
firing rates at the beginning and end of these episodes. We found
that the wake-related increase in firing rate was present even after
short waking bouts but only if waking was not interrupted by sleep
attempts (Figure 6E), suggesting that the quality of waking is an
important determinant of neuronal activity during subsequent
sleep. At the same time, even short (<15 min) ‘‘power naps’’ led
to a significant decrease in firing rates, although the effect was
more pronounced after longer sleep periods (Figure 6F).
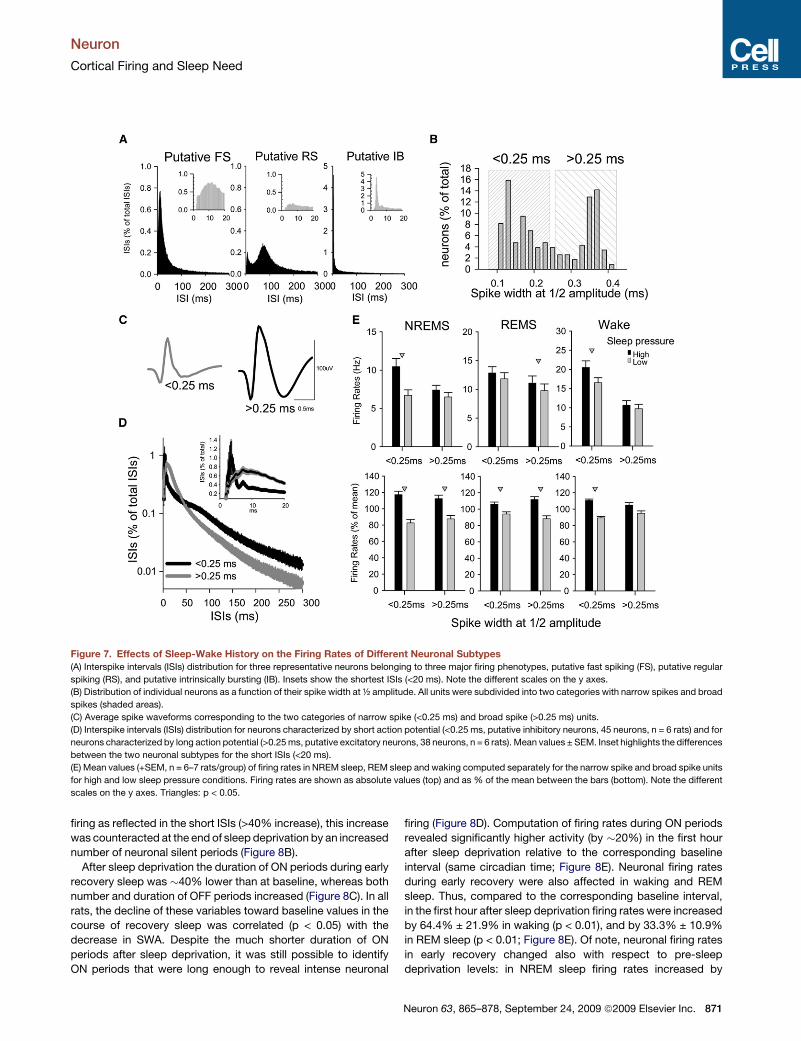
Though multielectrode arrays are biased toward picking up
activity from larger and closest cells, we could detect spikes
from all three major neuronal subtypes: putative regular spiking
(RS), intrinsically bursting (IB), and fast-spiking (FS) neurons
(Figures 7A and S3). Consistent with previous studies (Bartho
et al., 2004; McCormick et al., 1985; Steriade et al., 1993c),
these three types were subdivided into two groups based on
the width of the action potential at 1/2 amplitude (Figures 7B
and 7D). The group with narrow spikes (<0.25ms) was charac-
terized by low spike amplitude, higher firing rates and shorter
ISIs, and therefore likely includes mostly putative inhibitory
neurons (FS cells). The group with broad spikes (>0.25 ms)
was characterized instead by high spike amplitude, longer
ISIs or spontaneous bursts, overall lower rate of discharge,
and likely includes mostly pyramidal excitatory neurons (RS
and IB cells). Computing the firing rates for the high and low
sleep pressure condition separately for neurons with narrow
and broad spikes revealed that they were similarly affected by
the sleep/wake history (Figure 7E). Altogether, these findings
indicate that cortical mean firing rates change as a function of
sleep homeostasis, and they do so across all three behavioral
states.
Neuron 63, 865–878, September 24, 2009 ª2009 Elsevier Inc. 869
Neuron
Cortical Firing and Sleep Need
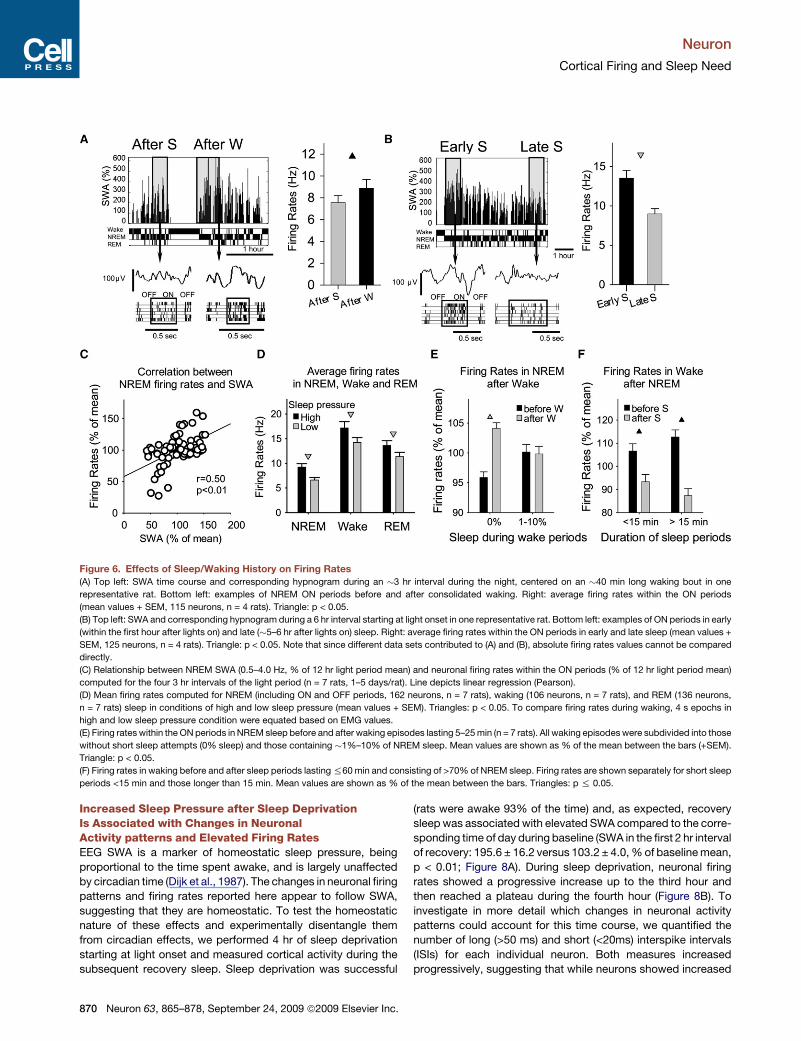
Figure 6. Effects of Sleep/Waking History on Firing Rates
(A) Top left: SWA time course and corresponding hypnogram during an �3 hr interval during the night, centered on an �40 min long waking bout in one
representative rat. Bottom left: examples of NREM ON periods before and after consolidated waking. Right: average firing rates within the ON periods
(mean values + SEM, 115 neurons, n = 4 rats). Triangle: p < 0.05.
(B) Top left: SWA and corresponding hypnogram during a 6 hr interval starting at light onset in one representative rat. Bottom left: examples of ON periods in early
(within the first hour after lights on) and late (�5–6 hr after lights on) sleep. Right: average firing rates within the ON periods in early and late sleep (mean values +
SEM, 125 neurons, n = 4 rats). Triangle: p < 0.05. Note that since different data sets contributed to (A) and (B), absolute firing rates values cannot be compared
directly.
(C) Relationship between NREM SWA (0.5–4.0 Hz, % of 12 hr light period mean) and neuronal firing rates within the ON periods (% of 12 hr light period mean)
computed for the four 3 hr intervals of the light period (n = 7 rats, 1–5 days/rat). Line depicts linear regression (Pearson).
(D) Mean firing rates computed for NREM (including ON and OFF periods, 162 neurons, n = 7 rats), waking (106 neurons, n = 7 rats), and REM (136 neurons,
n = 7 rats) sleep in conditions of high and low sleep pressure (mean values + SEM). Triangles: p < 0.05. To compare firing rates during waking, 4 s epochs in
high and low sleep pressure condition were equated based on EMG values.
(E) Firing rates within the ON periods in NREM sleep before and after waking episodes lasting 5–25 min (n = 7 rats). All waking episodes were subdivided into those
without short sleep attempts (0% sleep) and those containing �1%–10% of NREM sleep. Mean values are shown as % of the mean between the bars (+SEM).
Triangle: p < 0.05.
(F) Firing rates in waking before and after sleep periods lasting %60 min and consisting of >70% of NREM sleep. Firing rates are shown separately for short sleep
periods <15 min and those longer than 15 min. Mean values are shown as % of the mean between the bars. Triangles: p % 0.05.
Increased Sleep Pressure after Sleep DeprivationIs Associated with Changes in NeuronalActivity patterns and Elevated Firing RatesEEG SWA is a marker of homeostatic sleep pressure, being
proportional to the time spent awake, and is largely unaffected
by circadian time (Dijk et al., 1987). The changes in neuronal firing
patterns and firing rates reported here appear to follow SWA,
suggesting that they are homeostatic. To test the homeostatic
nature of these effects and experimentally disentangle them
from circadian effects, we performed 4 hr of sleep deprivation
starting at light onset and measured cortical activity during the
subsequent recovery sleep. Sleep deprivation was successful
870 Neuron 63, 865–878, September 24, 2009 ª2009 Elsevier Inc.
(rats were awake 93% of the time) and, as expected, recovery
sleep was associated with elevated SWA compared to the corre-
sponding time of day during baseline (SWA in the first 2 hr interval
of recovery: 195.6 ± 16.2 versus 103.2 ± 4.0, % of baseline mean,
p < 0.01; Figure 8A). During sleep deprivation, neuronal firing
rates showed a progressive increase up to the third hour and
then reached a plateau during the fourth hour (Figure 8B). To
investigate in more detail which changes in neuronal activity
patterns could account for this time course, we quantified the
number of long (>50 ms) and short (<20ms) interspike intervals
(ISIs) for each individual neuron. Both measures increased
progressively, suggesting that while neurons showed increased
Neuron
Cortical Firing and Sleep Need
Figure 7. Effects of Sleep-Wake History on the Firing Rates of Different Neuronal Subtypes
(A) Interspike intervals (ISIs) distribution for three representative neurons belonging to three major firing phenotypes, putative fast spiking (FS), putative regular
spiking (RS), and putative intrinsically bursting (IB). Insets show the shortest ISIs (<20 ms). Note the different scales on the y axes.
(B) Distribution of individual neurons as a function of their spike width at ½ amplitude. All units were subdivided into two categories with narrow spikes and broad
spikes (shaded areas).
(C) Average spike waveforms corresponding to the two categories of narrow spike (<0.25 ms) and broad spike (>0.25 ms) units.
(D) Interspike intervals (ISIs) distribution for neurons characterized by short action potential (<0.25 ms, putative inhibitory neurons, 45 neurons, n = 6 rats) and for
neurons characterized by long action potential (>0.25 ms, putative excitatory neurons, 38 neurons, n = 6 rats). Mean values ± SEM. Inset highlights the differences
between the two neuronal subtypes for the short ISIs (<20 ms).
(E) Mean values (+SEM, n = 6–7 rats/group) of firing rates in NREM sleep, REM sleep and waking computed separately for the narrow spike and broad spike units
for high and low sleep pressure conditions. Firing rates are shown as absolute values (top) and as % of the mean between the bars (bottom). Note the different
scales on the y axes. Triangles: p < 0.05.
firing as reflected in the short ISIs (>40% increase), this increase
was counteracted at the end of sleep deprivation by an increased
number of neuronal silent periods (Figure 8B).
After sleep deprivation the duration of ON periods during early
recovery sleep was �40% lower than at baseline, whereas both
number and duration of OFF periods increased (Figure 8C). In all
rats, the decline of these variables toward baseline values in the
course of recovery sleep was correlated (p < 0.05) with the
decrease in SWA. Despite the much shorter duration of ON
periods after sleep deprivation, it was still possible to identify
ON periods that were long enough to reveal intense neuronal
firing (Figure 8D). Computation of firing rates during ON periods
revealed significantly higher activity (by �20%) in the first hour
after sleep deprivation relative to the corresponding baseline
interval (same circadian time; Figure 8E). Neuronal firing rates
during early recovery were also affected in waking and REM
sleep. Thus, compared to the corresponding baseline interval,
in the first hour after sleep deprivation firing rates were increased
by 64.4% ± 21.9% in waking (p < 0.01), and by 33.3% ± 10.9%
in REM sleep (p < 0.01; Figure 8E). Of note, neuronal firing rates
in early recovery changed also with respect to pre-sleep
deprivation levels: in NREM sleep firing rates increased by
Neuron 63, 865–878, September 24, 2009 ª2009 Elsevier Inc. 871

Neuron
Cortical Firing and Sleep Need
Figure 8. Effects of Sleep Deprivation on Cortical Firing
(A) SWA time course during the light period in baseline and after sleep deprivation (SDep) in one representative rat. Hypnogram from the same animal is shown
below.
(B) Time course of neuronal firing rates, and the number of long (>50 ms) and short (<20 ms) interspike intervals (ISIs) in waking during SDep (50 neurons,
n = 5 rats). Mean values ± SEM shown as % of the value during the first hour of SDep. Asterisks: p < 0.05. Inset: average firing rates during the first and fourth
hour of SDep after equating the 4 s epochs based on EMG values (mean values shown as % of the mean between the two bars + SEM). Triangle: p < 0.05.
(C) Number and duration of ON and OFF periods during the first hour of recovery after SDep (Rec) and corresponding time interval during baseline (BSL). Values
are mean + SEM (n = 5 rats). Triangles, p < 0.05.
(D) Representative examples of ON periods (boxed) during baseline and recovery sleep in one rat.
(E) Average firing rates within the ON periods during the first 1 hr interval after SDep and the corresponding time interval during baseline in NREM sleep
(62 neurons, n = 7 rats) and REM sleep (49 neurons, n = 7 rats). Values are mean ± SEM.
34.0% ± 16.3% (p < 0.05), whereas in REM sleep the increase
reached 53.7% ± 30.3% (p < 0.05). During the initial recovery,
NREM sleep was characterized by significantly shorter ON
periods as compared to pre-sleep deprivation levels (�37.3% ±
10.3%, p < 0.05), whereas both the duration of the OFF periods
and the number of ON and OFF periods were significantly
increased (by 32.0% ± 11.8%, 81.1% ± 33.5%, and 132.7% ±
45.7%, respectively, p < 0.05).
DISCUSSION
Since the beginning of unit recordings in vivo, many studies have
investigated changes in neuronal firing across behavioral states.
872 Neuron 63, 865–878, September 24, 2009 ª2009 Elsevier Inc.
Early reports found that, throughout the cerebral cortex, neurons
often show a burst-pause pattern in NREM sleep, compared to
tonic firing in wakefulness and REM sleep (Burns et al., 1979;
Calvet et al., 1973; Desiraju, 1972; Hobson and McCarley,
1971; Murata and Kameda, 1963; Noda and Adey, 1970, 1973;
Verzeano and Negishi, 1960). Later, intracellular recordings
in vivo showed that during NREM sleep virtually all cortical
neurons alternate between a depolarized up state, during which
they are spontaneously firing, and a hyperpolarized, silent down
state (Steriade et al., 2001). This so-called slow oscillation
(<1 Hz) between up and down states occurs more or less
synchronously across many neurons (Steriade et al., 1993b),
leading to an alternation between periods of multiunit activity
Neuron
Cortical Firing and Sleep Need
and silence in extracellular recordings (Steriade et al., 2001) and
to negative peaks (slow waves) in the sleep EEG. By contrast,
wakefulness and REM sleep are characterized by a sustained
depolarization and tonic firing and are associated with an
absence of EEG slow waves.
So far, however, no study had asked whether cortical neuronal
firing patterns change not just depending on whether one is
awake or asleep, but rather depending on how long one has
been awake or asleep. This question is important because sleep
is homeostatically regulated: the longer one has been awake, the
more one needs to sleep; conversely, sleep need can only be
reduced by having slept (Achermann and Borbely, 2003). This
homeostatic regulation is a main reason to think that sleep
may serve an essential function for brain cells (Cirelli and Tononi,
2008). Therefore, knowing whether firing patterns change de-
pending on how long the brain has been awake or asleep might
shed light on the need for sleep at the cellular level. By recording
continuously EEG and cortical unit activity in freely behaving
rats, we found that neuronal firing rates, firing synchrony, and
distribution of ON and OFF periods do indeed change as a func-
tion of sleep homeostasis.
Homeostatic Changes in Neuronal Firing RatesA key finding of this study is that spontaneous firing rates of
cortical neurons increase in a systematic manner with the dura-
tion of preceding wakefulness and decrease with the duration
of preceding sleep. These changes in firing rate, which were
correlated with changes in sleep homeostasis, were evident
across wakefulness, NREM sleep, and REM sleep, suggesting
an overall shift in neuronal excitability independent of the current
behavioral state. It is generally assumed that average firing rates
ought to be relatively stable thanks to the tight balance between
excitation and inhibition (Haider et al., 2006). For example, it has
been shown that a dynamic equilibrium of excitation and inhibi-
tion keeps spontaneous network activity within physiological
ranges and prevents paroxysmal activity (McCormick and
Contreras, 2001). Moreover, the tight balance between excitation
and inhibition is maintained during the middle portion of sleep up
states, although excitation is briefly uncoupled from inhibition at
the up-down and down-up transitions (Haider et al., 2006).
Functionally, firing rates should be regulated to avoid (1) in-
creased energy requirements (Attwell and Laughlin, 2001; Laugh-
lin et al., 1998), (2) neurotoxicity (Choi, 1988), and (3) risk of
seizures (McCormick and Contreras, 2001). As shown here,
however, merely staying awake leads to a progressive increase
in firing rates. Consistent with this finding, (1) in mice, cortical
metabolic rates increase after a comparable period (4 hr) of wake-
fulness and decrease with sleep (Vyazovskiy et al., 2008b);
(2) in rats, the levels of glutamate in the cortical extrasynaptic
space increase progressively during wakefulness and decrease
during NREM sleep (Dash et al., 2009); (3) sleep deprivation leads
to increased cortical excitability, resulting in lowered threshold
for epileptic activity (Badawy et al., 2006; Civardi et al., 2001;
Rowan et al., 1982; Scalise et al., 2006). Thus, it would seem
that, notwithstanding various mechanisms promoting stable
activity levels, staying awake leads to a progressive increase in
firing rates of cortical neurons, which is counterbalanced by
staying asleep. The changes in firing rates that we observed
between the high and low sleep pressure conditions were usually
in the range of a few action potentials per neuron per second.
While an increase in 1–2 Hz in the firing rate of individual neurons
maybe modest in relation tospecific stimuli orbehaviors, a gener-
alized increase of spontaneous firing rates across the entire
neuronal population and across all conditions is likely significant
as it may raise the already high metabolic costs of brain activity
(Laughlin et al., 1998). Specifically, it has been estimated that
an increase in activity of just 1 action potential/cortical neuron/s
can increase glucose consumption by 21 mmol/100 g gray
matter/min (Attwell and Laughlin, 2001; Sokoloff et al., 1977).
This is a substantial change if one considers that the total average
glucose consumption in the awake rodent cortex ranges from
107 to 162 mmol/100 g/min (Sokoloff et al., 1977).
Increased neuronal firing rates after spontaneous waking
episodes suggested that a further increase could occur during
extended wakefulness, a possibility that we tested by sleep
depriving rats for 4 hr starting at light onset. In most neurons,
firing rates increased continuously for the first 3 hr and showed
no further significant change in the last hour, most likely due to
an increased number of neuronal silent periods. These results
are consistent with the observation that cortical glutamate levels
no longer increase after a few hours of continuous waking in the
rat (Dash et al., 2009). We also found that prolonging wakeful-
ness beyond the usual bedtime led to a further increase in firing
rates during recovery sleep. By contrast, when animals were
allowed to sleep, firing rates decreased progressively in all
behavioral states. Since the comparison between sleep depriva-
tion and sleep was done at the same time of day, changes in
mean firing rates must be related to the time the animal spent
awake or asleep, rather than to differences in circadian phase.
Moreover, these data suggest that under physiological condi-
tions sleep may be important, perhaps even necessary, for
returning neuronal activity to a lower, sustainable level after
periods of wakefulness. Of note, firing rates decreased from
the high to the low sleep pressure condition in neurons with
both narrow and broad action potentials. Since these two cate-
gories are characterized by high and low mean firing rates and
likely correspond to inhibitory and excitatory neurons, respec-
tively, the data suggest that the balance between excitation
and inhibition is generally maintained at different levels of phys-
iological sleep pressure.
For the interpretation of the present results it is important to
assess the stability of unit recordings over several hours or
even days, since changes in the number of spikes could be
due to a progressive increase in the number of active units rather
than to an increased firing of the same units. As shown in
Figure S2, however, waveform analysis (Williams et al., 1999)
indicates that the shape of the spikes of individual sorted units
remained stable over several hours. Furthermore, while the
number of recorded units may change progressively over time
due to electrode deterioration and other technical factors, we
observed several cycles of systematic increases and decreases
of firing with time awake and asleep, respectively. These cycles
repeated over several sleep-wake episodes in the course of the
same day, or even across different days, and were strongly
correlated with SWA. Therefore, our results likely cannot be
explained by recording instability.
Neuron 63, 865–878, September 24, 2009 ª2009 Elsevier Inc. 873
Neuron
Cortical Firing and Sleep Need
Homeostatic Changes in Neuronal Synchronizationand Relationship to EEG Slow Wave ActivityA second finding was that changes in mean firing rate were
accompanied by changes in neuronal synchronization during
the transition between ON and OFF periods. During sleep
episodes following prolonged bouts of wakefulness (early sleep),
individual neurons stopped or resumed firing in near synchrony
with the rest of the population. By contrast, during sleep
episodes following prolonged bouts of NREM sleep (late sleep),
the time of entry into ON and OFF periods was much less
synchronous.
In turn, changes in synchrony were accompanied by changes
in the duration of population ON and OFF periods. During early
sleep, when most neurons were active or silent synchronously,
ON periods were short and frequent. During late sleep, the
periods of activity and inactivity of individual neurons became
progressively less synchronized. Indeed, it was apparent that
in late sleep some neurons were unresponsive to the population
‘‘drive’’ and remained in the ON mode while the rest of the pop-
ulation was already silent, or remained silent when most other
neurons generated spikes. Consequently, population ON
periods became longer and less frequently interrupted by popu-
lation OFF periods. Without chronic intracellular recordings, it is
difficult to know whether the duration of the individual neurons’
up state also increases with decreasing sleep pressure, though
our computer simulations suggest that this may be the case
(Esser et al., 2007).
Finally, we found that changes in neuronal synchrony were
linked to changes in the EEG slow waves. Specifically, high firing
synchrony was associated with steep slopes of simultaneously
occurring EEG slow waves, whereas low synchrony was associ-
ated with decreased slopes. These observations provide direct
in vivo evidence that EEG slow wave slopes are determined by
the rate of recruitment and decruitment of cortical neurons into
the slow oscillation, as predicted by modeling work (Esser
et al., 2007). Furthermore, changes in the number and duration
of ON and OFF periods were also correlated with the decrease
in SWA in the course of sleep, consistent with the notion that
large and steep EEG slow waves should reflect the near-
synchronous transitions between up and down state in large
populations of cortical neurons, whereas reduced synchrony
should be associated with smaller and shallower waves (Burns
et al., 1979; Calvet et al., 1973; Contreras and Steriade, 1995;
Ji and Wilson, 2007; Luczak et al., 2007; Molle et al., 2006;
Mukovski et al., 2007; Murata and Kameda, 1963; Noda and
Adey, 1973; Steriade et al., 1993c, 2001). While slow wave
slopes are likely a function of neuronal synchrony, the mecha-
nisms underlying the changes in slow wave amplitude are less
clear, and may be related to the duration of the corresponding
periods of neuronal silence (e.g., Figure 3). We found that
neuronal synchrony had less pronounced effects on the slope
and amplitude of the slow wave corresponding to the OFF-ON
transition. Such data are consistent with earlier observations
that the second segment of the slow wave is characterized by
steeper slope and is less affected by sleep-wake history
compared to the first segment (Vyazovskiy et al., 2009; Vyazov-
skiy et al., 2007). Moreover, in anesthetized ferrets, the transition
from down to up state occurs at a significantly faster rate and
874 Neuron 63, 865–878, September 24, 2009 ª2009 Elsevier Inc.
more synchronously than the transition from activity to silence
(Haider et al., 2006).
As mentioned in the Introduction, EEG slow waves are a well-
established marker of sleep need. In general, the longer one has
been awake, the higher the amount of SWA in the sleep EEG;
conversely, SWA decreases progressively in the course of sleep
(Achermann and Borbely, 2003). However, the cellular correlates
of slow wave homeostasis are largely unknown. The present
results establish that sleep-wake history is reflected at the level
of cortical neuronal activity in terms of both firing rates and firing
synchrony. Moreover, there is a tight link between changes in
neuronal firing on one hand and homeostatic changes of EEG
SWA on the other. Thus, our findings suggest that changes in
neuronal firing and synchrony may represent a cellular counter-
part of the homeostatic regulation of sleep, raising the possibility
that they may have physiological significance.
Possible Mechanisms Underlying HomeostaticChanges in Firing Rate and SynchronyWhy would cortical firing rates and neuronal synchrony increase
with the duration of wakefulness and decrease with the duration
of sleep? Mechanisms that could be responsible for compensa-
tory changes in firing rates include homeostasis of intrinsic excit-
ability, such as changes in intrinsic conductances (van Welie
et al., 2004), as well as global synaptic scaling (Turrigiano,
1999). However, the changes in firing rate observed in vivo in
our experiments may be too small to trigger the homeostatic
changes observed in vitro or after non-physiologic manipulations
during development (Desai et al., 2002).
Another possibility is that changes in neuronal firing and
synchrony reflect a progressive, net increase in the strength of
cortico-cortical connections during wakefulness, followed by a
gradual net decrease during sleep (Tononi and Cirelli, 2006), as
suggested by some recent studies (Bellina et al., 2008; Gilestro
et al., 2009; Rao et al., 2007; Vyazovskiy et al., 2008a). Indeed,
in a large-scale model of the corticothalamic system, a net
decrease in the efficacy of excitatory cortico-cortical connec-
tions can lead, at the cellular level, to (1) a decrease in mean firing
rates both when the model was run in sleep mode and in waking
mode, (2) a decrease in population synchrony at the ON-OFF and
OFF-ON transitions in sleep mode, and (3) a decrease in the
number of ON (and OFF) periods and an increase in their duration
(Figure S5). At the EEG level, consistent with previous work
(Esser et al., 2007), it led to (4) a decrease in the slope of sleep
slow waves and (5) a decrease in SWA. Highly synchronous burst
firing during the ON periods of early NREM sleep, the alternation
of depolarization and hyperpolarization at around 1 Hz, and the
neuromodulatory milieu of sleep may help restore synaptic
strength (Czarnecki et al., 2007; Lubenov and Siapas, 2008;
Seol et al., 2007). On the other hand, these mechanisms could
act to some extent also during wakefulness or on a fast time
scale that does not require sustained periods of NREM sleep.
Moreover, fast-acting processes of synaptic depression and
rebound, operating differentially in excitatory and inhibitory
synapses (Galarreta and Hestrin, 1998), could help maintain a
balance of synaptic strength without requiring sleep-dependent
downscaling. Furthermore, it is uncertain whether and how sleep
may affect synaptic homeostasis during development, when
Neuron
Cortical Firing and Sleep Need
sleep is especially abundant. For example, studies in kittens
show that the first few hours of sleep immediately following
monocular deprivation are important both to maintain the post-
synaptic reduction in evoked responses to the deprived eye
and to potentiate the response to the nondeprived eye (Aton
et al., 2009; Dadvand et al., 2006; Frank et al., 2001). However,
whether the overall effect of sleep after monocular sleep depriva-
tion is a net increase, a net decrease, or no change in synaptic
strength, remains unclear, and what might happen during devel-
opment under more physiological conditions remains unknown.
Finally, changes in the levels of arousal-promoting neuromo-
dulators could in principle account for many of our findings
(Figure S5). Neuromodulators such as acetylcholine not only
can switch the cortex from a sleep to a wake mode of firing
(Steriade et al., 1993a) but can affect both intrinsic and synaptic
conductances (Gil et al., 1997; Marder and Thirumalai, 2002).
Thus, progressive changes in neuromodulatory levels between
early and late sleep may alter the firing patterns of cortical
neurons, and our previous computer simulations showed that
both lowering synaptic strength and increasing levels of
arousal-promoting neuromodulators can decrease SWA and
the amplitude of slow waves (Esser et al., 2007). It should be
mentioned, however, that the current in vivo experiments
showed that changes in mean firing rates as a function of
sleep-wake history occurred in all behavioral states, in spite of
clear-cut differences in neuromodulatory levels between sleep
and waking (Jones, 2005).
Changes in firing after learning tasks or electrical stimulation
have been investigated in brain regions outside the cortex,
such as the hippocampal formation. Hippocampal recordings
have revealed only weak, nonsignificant increases in global firing
rates during sleep after exposure to a novel environment (Hirase
et al., 2001; Kudrimoti et al., 1999) or after electrically-induced
LTP (Dragoi et al., 2003) relative to sleep before, suggesting
that hippocampal global firing rates are stable across behavioral
states and learning conditions (Buzsaki et al., 2007; Karlsson and
Frank, 2008; Pavlides and Winson, 1989). However, it is not clear
whether the hippocampus is involved in sleep homeostasis, slow
oscillations are absent in several hippocampal subregions
(Isomura et al., 2006), and the balance of excitation and inhibition
may be regulated differently (Buzsaki et al., 2007). Moreover, in
most of these studies, the waking experience was short lasting.
In future studies, it will be important to simultaneously record
EEG, neural activity, and the levels of extracellular neuromodula-
tors. Moreover, one should investigate whether the homeostatic
changes in firing patterns observed in barrel cortex can be gener-
alized to other cortical areas, including prefrontal areas where
slow wave homeostasis is most pronounced (Cajochen et al.,
1999; Werth et al., 1996a), and in subcortical areas, including
the suprachiasmatic nucleus of the hypothalamus that controls
the 24 hr distribution of sleep and waking (Deboer et al., 2003).
Also, one would want to know how firing patterns change after
tasks that activate circumscribed cortical regions, as suggested
by the local regulation of sleep SWA (Huber et al., 2004, 2007a;
Vyazovskiy and Tobler, 2008; Faraguna et al., 2008). Moreover,
the current findings raise the question of whether the overall
increase in firing rate observed across waking reflects a general-
ized phenomenon or is mainly driven by changes in a subset of
neurons, for instance those with sustained firing across most of
wake and not those with episodic firing, or those with the highest
firing rates, or those exhibiting specific firing patterns (tonic or
burst firing). It will also be important to clarify whether firing asso-
ciated with some behavioral activities, perhaps those leading to
experience-dependent plasticity and to the release of neuromo-
dulators, contribute more than others to the overall increase in
firing rate during the physiological waking period. If the present
findings can indeed be generalized to other cortical regions,
they would suggest that sleep may serve, among other functions,
to maintain neuronal firing rates at a sustainable level.
EXPERIMENTAL PROCEDURES
Surgery and Multiunit Activity Recording
Male WKY rats were implanted in the left barrel cortex (n = 6) or in the frontal
cortex (n = 1) with 16-ch (2 3 8) polyimide-insulated tungsten microwire arrays,
as detailed in the Supplemental Data. After surgery, all rats were housed indi-
vidually in transparent Plexiglas cages. Lighting and temperature were kept
constant (LD 12:12, light on at 10 a.m., 23�C ± 1�C; food and water available
ad libitum and replaced daily at 10 a.m.). About a week was allowed for
recovery after surgery, and experiments were started only after the sleep/
waking cycle had fully normalized. Animal protocols followed the National
Institutes of Health Guide for the Care and Use of Laboratory Animals and
were in accordance with institutional guidelines.
Signal Processing and Analysis
Data acquisition and online spike sorting were performed with the Multichannel
Neurophysiology Recording and Stimulation System (Tucker-Davis Technolo-
gies Inc., TDT), as detailed in the Supplemental Data. Spike data were collected
continuously (25 kHz, 300–5 kHz), concomitantly with the local field potentials
(LFPs) from the same electrodes (256 Hz) and surface EEG (256 Hz). Amplitude
thresholds for online spike detection were set manually based on visual and
auditory control and allowed only crossings of spikes with signal-to-noise ratio
of at least 2 (Figures S1 and S2). EEG power spectra were computed by a fast
Fourier transform (FFT) routine for 4 s epochs (0.25 Hz resolution). For staging,
signals were loaded with custom-made Matlab programs using standard TDT
routines and subsequently transformed into the EDF (European Data Format)
with Neurotraces software. Sleep stages were scored off-line by visual inspec-
tion of 4 s epochs (SleepSign, Kissei), where the EEG, LFP, EMG, and spike
activity was displayed. Vigilance states could always be determined.
Experimental Design
Recordings were performed continuously for 2–3 weeks starting from day 5
after surgery, when rats appeared normal and their sleep-wake cycle had
normalized. A total of 4–7 animals contributed to different experiments and
data analyses. To assure that the homeostatic changes were consistent
across days, at least one 12 hr light period and one 12 hr dark period (range,
1–7 days) were selected per animal based on signal stability, and analyzed
separately. After 2–3 stable baselines, one or two 4 hr sleep deprivation
(SDep) experiments were performed in each animal (at least 5 days apart),
each followed by an undisturbed recovery period, as detailed in the Supple-
mental Data. Analysis of the firing rates is detailed in the Supplemental Data.
Data Processing and Analysis and Spike Sorting
Details are given in the Supplemental Data.
Histological Verification
Upon completion of the experiments the position of the arrays was verified by
histology in all animals. In all cases, the deep row of the array was located
within layer V, whereas the superficial row was in layers II–III.
Computer Simulations
The large-scale computational model of the thalamocortical system is similar
to the one previously used (Esser et al., 2007) and is described in detail in the
Neuron 63, 865–878, September 24, 2009 ª2009 Elsevier Inc. 875
Neuron
Cortical Firing and Sleep Need
Supplemental Data. Synaptic strength was varied in a subset (33%) of cortico-
cortical AMPA connections. Several levels of strength decrease were tested
(details in Supplemental Data). Data shown refer to a 25% decrease, which
was found to be sufficient to induce changes in neuronal activity similar to
those observed in in vivo experiments.
SUPPLEMENTAL DATA
Supplemental Data include five figures and Supplemental Experimental Proce-
dures and can be found with this article online at http://www.cell.com/neuron/
supplemental/S0896-6273(09)00637-0.
ACKNOWLEDGMENTS
This work was supported by NIMH P20 MH077967 (C.C.), NIH Director’s
Pioneer award (G.T.), and AFOSR FA9550-08-1-0244 (G.T.). We thank Tom
Richner and Dr. Silvestro Micera for help with data analysis, Aaron Nelson
for help with the experiments, Dr. Yuval Nir for helpful comments on the manu-
script, and Dr. Lisa Krugner-Higby for advice about surgical procedures.
Accepted: August 21, 2009
Published: September 23, 2009
REFERENCES
Achermann, P., and Borbely, A.A. (2003). Mathematical models of sleep regu-
lation. Front. Biosci. 8, s683–s693.
Amzica, F., and Steriade, M. (1998). Electrophysiological correlates of sleep
delta waves. Electroencephalogr. Clin. Neurophysiol. 107, 69–83.
Aton, S.J., Seibt, J., Dumoulin, M., Jha, S.K., Steinmetz, N., Coleman, T.,
Naidoo, N., and Frank, M.G. (2009). Mechanisms of sleep-dependent consol-
idation of cortical plasticity. Neuron 61, 454–466.
Attwell, D., and Laughlin, S.B. (2001). An energy budget for signaling in the grey
matter of the brain. J. Cereb. Blood Flow Metab. 21, 1133–1145.
Badawy, R.A., Curatolo, J.M., Newton, M., Berkovic, S.F., and Macdonell, R.A.
(2006). Sleep deprivation increases cortical excitability in epilepsy: syndrome-
specific effects. Neurology 67, 1018–1022.
Bartho, P., Hirase, H., Monconduit, L., Zugaro, M., Harris, K.D., and Buzsaki,
G. (2004). Characterization of neocortical principal cells and interneurons by
network interactions and extracellular features. J. Neurophysiol. 92, 600–608.
Bazhenov, M., Timofeev, I., Steriade, M., and Sejnowski, T.J. (2002). Model of
thalamocortical slow-wave sleep oscillations and transitions to activated
states. J. Neurosci. 22, 8691–8704.
Bellina, V., Huber, R., Rosanova, M., Mariotti, M., Tononi, G., and Massimini,
M. (2008). Cortical excitability and sleep homeostasis in humans: a TMS/
hd-EEG study. J. Sleep Res. 17, 39.
Burns, B.D., Stean, J.P., and Webb, A.C. (1979). The effects of sleep on
neurons in isolated cerebral cortex. Proc. R. Soc. Lond. B. Biol. Sci. 206,
281–291.
Buzsaki, G., Kaila, K., and Raichle, M. (2007). Inhibition and brain work. Neuron
56, 771–783.
Cajochen, C., Foy, R., and Dijk, D.J. (1999). Frontal predominance of a relative
increase in sleep delta and theta EEG activity after sleep loss in humans. Sleep
Res. Online 2, 65–69.
Calvet, J., Fourment, A., and Thiefry, M. (1973). Electrical activity in neocortical
projectionandassociationareas duringslowwavesleep. Brain Res.52, 173–187.
Choi, D.W. (1988). Glutamate neurotoxicity and diseases of the nervous
system. Neuron 1, 623–634.
Cirelli, C., and Tononi, G. (2008). Is sleep essential? PLoS Biol. 6, e216. 10.
1371/journal.pbio.0060216.
Civardi, C., Boccagni, C., Vicentini, R., Bolamperti, L., Tarletti, R., Varrasi, C.,
Monaco, F., and Cantello, R. (2001). Cortical excitability and sleep deprivation:
a transcranial magnetic stimulation study. J. Neurol. Neurosurg. Psychiatry 71,
809–812.
876 Neuron 63, 865–878, September 24, 2009 ª2009 Elsevier Inc.
Contreras, D., and Steriade, M. (1995). Cellular basis of EEG slow rhythms:
a study of dynamic corticothalamic relationships. J. Neurosci. 15, 604–622.
Czarnecki, A., Birtoli, B., and Ulrich, D. (2007). Cellular mechanisms of burst
firing-mediated long-term depression in rat neocortical pyramidal cells. J.
Physiol. 578, 471–479.
Dadvand, L., Stryker, M.P., and Frank, M.G. (2006). Sleep does not enhance
the recovery of deprived eye responses in developing visual cortex. Neurosci-
ence 143, 815–826.
Dash, M.B., Douglas, C.L., Vyazovskiy, V.V., Cirelli, C., and Tononi, G. (2009).
Long-term homeostasis of extracellular glutamate in the rat cerebral cortex
across sleep and waking states. J. Neurosci. 29, 620–629.
Deboer, T., Vansteensel, M.J., Detari, L., and Meijer, J.H. (2003). Sleep states
alter activity of suprachiasmatic nucleus neurons. Nat. Neurosci. 6,
1086–1090.
Desai, N.S., Cudmore, R.H., Nelson, S.B., and Turrigiano, G.G. (2002). Critical
periods for experience-dependent synaptic scaling in visual cortex. Nat. Neu-
rosci. 5, 783–789.
Desiraju, T. (1972). Discharge properties of neurons of the parietal association
cortex during states of sleep and wakefulness in the monkey. Brain Res. 47,
69–75.
Destexhe, A., Contreras, D., and Steriade, M. (1999). Spatiotemporal analysis
of local field potentials and unit discharges in cat cerebral cortex during natural
wake and sleep states. J. Neurosci. 19, 4595–4608.
Dijk, D.J., Beersma, D.G., and Daan, S. (1987). EEG power density during nap
sleep: reflection of an hourglass measuring the duration of prior wakefulness.
J. Biol. Rhythms 2, 207–219.
Dragoi, G., Harris, K.D., and Buzsaki, G. (2003). Place representation within
hippocampal networks is modified by long-term potentiation. Neuron 39,
843–853.
Esser, S.K., Hill, S.L., and Tononi, G. (2007). Sleep homeostasis and cortical
synchronization: I. Modeling the effects of synaptic strength on sleep slow
waves. Sleep 30, 1617–1630.
Faraguna, U., Vyazovskiy, V.V., Nelson, A.B., Tononi, G., and Cirelli, C. (2008).
A causal role for brain-derived neurotrophic factor in the homeostatic regula-
tion of sleep. J. Neurosci. 28, 4088–4095.
Frank, M.G., Issa, N.P., and Stryker, M.P. (2001). Sleep enhances plasticity in
the developing visual cortex. Neuron 30, 275–287.
Galarreta, M., and Hestrin, S. (1998). Frequency-dependent synaptic depres-
sion and the balance of excitation and inhibition in the neocortex. Nat. Neuro-
sci. 1, 587–594.
Gil, Z., Connors, B.W., and Amitai, Y. (1997). Differential regulation of neocor-
tical synapses by neuromodulators and activity. Neuron 19, 679–686.
Gilestro, G.F., Tononi, G., and Cirelli, C. (2009). Widespread changes in
synaptic markers as a function of sleep and wakefulness in Drosophila.
Science 324, 109–112.
Haider, B., Duque, A., Hasenstaub, A.R., and McCormick, D.A. (2006).
Neocortical network activity in vivo is generated through a dynamic balance
of excitation and inhibition. J. Neurosci. 26, 4535–4545.
Hirase, H., Leinekugel, X., Czurko, A., Csicsvari, J., and Buzsaki, G. (2001).
Firing rates of hippocampal neurons are preserved during subsequent sleep
episodes and modified by novel awake experience. Proc. Natl. Acad. Sci.
USA 98, 9386–9390.
Hobson, J.A., and McCarley, R.W. (1971). Cortical unit activity in sleep and
waking. Electroencephalogr. Clin. Neurophysiol. 30, 97–112.
Huber, R., Ghilardi, M.F., Massimini, M., and Tononi, G. (2004). Local sleep and
learning. Nature 430, 78–81.
Huber, R., Ghilardi, M.F., Massimini, M., Ferrarelli, F., Riedner, B.A., Peterson,
M.J., and Tononi, G. (2006). Arm immobilization causes cortical plastic
changes and locally decreases sleep slow wave activity. Nat. Neurosci. 9,
1169–1176.
Huber, R., Esser, S.K., Ferrarelli, F., Massimini, M., Peterson, M.J., and Tononi,
G. (2007a). TMS-induced cortical potentiation during wakefulness locally
Neuron
Cortical Firing and Sleep Need
increases slow wave activity during sleep. PLoS ONE 2, e276. 10.1371/journal.
pone.0000276.
Huber, R., Tononi, G., and Cirelli, C. (2007b). Exploratory behavior, cortical
BDNF expression, and sleep homeostasis. Sleep 30, 129–139.
Isomura, Y., Sirota, A., Ozen, S., Montgomery, S., Mizuseki, K., Henze, D.A.,
and Buzsaki, G. (2006). Integration and segregation of activity in entorhinal-
hippocampal subregions by neocortical slow oscillations. Neuron 52,
871–882.
Ji, D., and Wilson, M.A. (2007). Coordinated memory replay in the visual cortex
and hippocampus during sleep. Nat. Neurosci. 10, 100–107.
Jones, B.E. (2005). From waking to sleeping: neuronal and chemical
substrates. Trends Pharmacol. Sci. 26, 578–586.
Karlsson, M.P., and Frank, L.M. (2008). Network dynamics underlying the
formation of sparse, informative representations in the hippocampus. J. Neu-
rosci. 28, 14271–14281.
Kattler, H., Dijk, D.J., and Borbely, A.A. (1994). Effect of unilateral somatosen-
sory stimulation prior to sleep on the sleep EEG in humans. J. Sleep Res. 3,
159–164.
Kudrimoti, H.S., Barnes, C.A., and McNaughton, B.L. (1999). Reactivation of
hippocampal cell assemblies: effects of behavioral state, experience, and
EEG dynamics. J. Neurosci. 19, 4090–4101.
Laughlin, S.B., de Ruyter van Steveninck, R.R., and Anderson, J.C. (1998). The
metabolic cost of neural information. Nat. Neurosci. 1, 36–41.
Lubenov, E.V., and Siapas, A.G. (2008). Decoupling through synchrony in
neuronal circuits with propagation delays. Neuron 58, 118–131.
Luczak, A., Bartho, P., Marguet, S.L., Buzsaki, G., and Harris, K.D. (2007).
Sequential structure of neocortical spontaneous activity in vivo. Proc. Natl.
Acad. Sci. USA 104, 347–352.
Marder, E., and Thirumalai, V. (2002). Cellular, synaptic and network effects of
neuromodulation. Neural Netw. 15, 479–493.
Massimini, M., Huber, R., Ferrarelli, F., Hill, S., and Tononi, G. (2004). The sleep
slow oscillation as a traveling wave. J. Neurosci. 24, 6862–6870.
McCormick, D.A., and Contreras, D. (2001). On the cellular and network bases
of epileptic seizures. Annu. Rev. Physiol. 63, 815–846.
McCormick, D.A., Connors, B.W., Lighthall, J.W., and Prince, D.A. (1985).
Comparative electrophysiology of pyramidal and sparsely spiny stellate
neurons of the neocortex. J. Neurophysiol. 54, 782–806.
Molle, M., Yeshenko, O., Marshall, L., Sara, S.J., and Born, J. (2006). Hippo-
campal sharp wave-ripples linked to slow oscillations in rat slow-wave sleep.
J. Neurophysiol. 96, 62–70.
Mukovski, M., Chauvette, S., Timofeev, I., and Volgushev, M. (2007). Detection
of active and silent states in neocortical neurons from the field potential signal
during slow-wave sleep. Cereb. Cortex 17, 400–414. Published online March
17, 2006. 10.1093/cercor/bhj157.
Murata, K., and Kameda, K. (1963). The activity of single cortical neurones
of unrestrained cats during sleep and wakefulness. Arch. Ital. Biol. 101,
306–331.
Noda, H., and Adey, W.R. (1970). Firing of neuron pairs in cat association
cortex during sleep and wakefulness. J. Neurophysiol. 33, 672–684.
Noda, H., and Adey, W.R. (1973). Neuronal activity in the association cortex
of the cat during sleep, wakefulness and anesthesia. Brain Res. 54, 243–259.
Oleksenko, A.I., Mukhametov, L.M., Polyakova, I.G., Supin, A.Y., and
Kovalzon, V.M. (1992). Unihemispheric sleep deprivation in bottlenose
dolphins. J. Sleep Res. 1, 40–44.
Pavlides, C., and Winson, J. (1989). Influences of hippocampal place cell firing
in the awake state on the activity of these cells during subsequent sleep
episodes. J. Neurosci. 9, 2907–2918.
Rao, Y., Liu, Z.W., Borok, E., Rabenstein, R.L., Shanabrough, M., Lu, M.,
Picciotto, M.R., Horvath, T.L., and Gao, X.B. (2007). Prolonged wakefulness
induces experience-dependent synaptic plasticity in mouse hypocretin/orexin
neurons. J. Clin. Invest. 117, 4022–4033.
Riedner, B.A., Vyazovskiy, V.V., Huber, R., Massimini, M., Esser, S., Murphy,
M., and Tononi, G. (2007). Sleep homeostasis and cortical synchronization:
III. A high-density EEG study of sleep slow waves in humans. Sleep 30,
1643–1657.
Rowan, A.J., Veldhuisen, R.J., and Nagelkerke, N.J. (1982). Comparative eval-
uation of sleep deprivation and sedated sleep EEGs as diagnostic aids in
epilepsy. Electroencephalogr. Clin. Neurophysiol. 54, 357–364.
Scalise, A., Desiato, M.T., Gigli, G.L., Romigi, A., Tombini, M., Marciani, M.G.,
Izzi, F., and Placidi, F. (2006). Increasing cortical excitability: a possible
explanation for the proconvulsant role of sleep deprivation. Sleep 29,
1595–1598.
Seol, G.H., Ziburkus, J., Huang, S., Song, L., Kim, I.T., Takamiya, K., Huganir,
R.L., Lee, H.K., and Kirkwood, A. (2007). Neuromodulators control the polarity
of spike-timing-dependent synaptic plasticity. Neuron 55, 919–929.
Sokoloff, L., Reivich, M., Kennedy, C., Des Rosiers, M.H., Patlak, C.S.,
Pettigrew, K.D., Sakurada, O., and Shinohara, M. (1977). The [14C]deoxyglu-
cose method for the measurement of local cerebral glucose utilization: theory,
procedure, and normal values in the conscious and anesthetized albino rat.
J. Neurochem. 28, 897–916.
Steriade, M., Amzica, F., and Nunez, A. (1993a). Cholinergic and noradrenergic
modulation of the slow (approximately 0.3 Hz) oscillation in neocortical cells.
J. Neurophysiol. 70, 1385–1400.
Steriade, M., Contreras, D., Curro Dossi, R., and Nunez, A. (1993b). The slow
(< 1 Hz) oscillation in reticular thalamic and thalamocortical neurons: scenario
of sleep rhythm generation in interacting thalamic and neocortical networks.
J. Neurosci. 13, 3284–3299.
Steriade, M., Nunez, A., and Amzica, F. (1993c). Intracellular analysis of rela-
tions between the slow (< 1 Hz) neocortical oscillation and other sleep rhythms
of the electroencephalogram. J. Neurosci. 13, 3266–3283.
Steriade, M., Nunez, A., and Amzica, F. (1993d). A novel slow (< 1 Hz) oscilla-
tion of neocortical neurons in vivo: depolarizing and hyperpolarizing compo-
nents. J. Neurosci. 13, 3252–3265.
Steriade, M., Timofeev, I., and Grenier, F. (2001). Natural waking and sleep
states: a view from inside neocortical neurons. J. Neurophysiol. 85,
1969–1985.
Tobler, I., and Borbely, A.A. (1986). Sleep EEG in the rat as a function of prior
waking. Electroencephalogr. Clin. Neurophysiol. 64, 74–76.
Tononi, G., and Cirelli, C. (2006). Sleep function and synaptic homeostasis.
Sleep Med. Rev. 10, 49–62.
Turrigiano, G.G. (1999). Homeostatic plasticity in neuronal networks: the
more things change, the more they stay the same. Trends Neurosci. 22,
221–227.
van Welie, I., van Hooft, J.A., and Wadman, W.J. (2004). Homeostatic scaling
of neuronal excitability by synaptic modulation of somatic hyperpolarization-
activated Ih channels. Proc. Natl. Acad. Sci. USA 101, 5123–5128.
Verzeano, M., and Negishi, K. (1960). Neuronal activity in cortical and thalamic
networks. J. Gen. Physiol. 43 (Suppl ), 177–195.
Vyazovskiy, V.V., and Tobler, I. (2008). Handedness leads to interhemispheric
EEG asymmetry during sleep in the rat. J. Neurophysiol. 99, 969–975.
Vyazovskiy, V.V., Ruijgrok, G., Deboer, T., and Tobler, I. (2006). Running wheel
accessibility affects the regional electroencephalogram during sleep in mice.
Cereb. Cortex 16, 328–336.
Vyazovskiy, V.V., Riedner, B.A., Cirelli, C., and Tononi, G. (2007). Sleep
homeostasis and cortical synchronization: II. A local field potential study of
sleep slow waves in the rat. Sleep 30, 1631–1642.
Vyazovskiy, V.V., Cirelli, C., Pfister-Genskow, M., Faraguna, U., and Tononi, G.
(2008a). Molecular and electrophysiological evidence for net synaptic potenti-
ation in wake and depression in sleep. Nat. Neurosci. 11, 200–208.
Vyazovskiy, V.V., Cirelli, C., Tononi, G., and Tobler, I. (2008b). Cortical meta-
bolic rates as measured by 2-deoxyglucose-uptake are increased after waking
and decreased after sleep in mice. Brain Res. Bull. 75, 591–597.
Neuron 63, 865–878, September 24, 2009 ª2009 Elsevier Inc. 877
Neuron
Cortical Firing and Sleep Need
Vyazovskiy, V.V., Faraguna, U., Cirelli, C., and Tononi, G. (2009). Triggering slow
waves during NREM sleep in the rat by intracortical electrical stimulation: effects
of sleep/wake history and background activity. J. Neurophysiol. 101, 1921–1931.
Werth, E., Achermann, P., and Borbely, A.A. (1996a). Brain topography of the
human sleep EEG: antero-posterior shifts of spectral power. Neuroreport 8,
123–127.
878 Neuron 63, 865–878, September 24, 2009 ª2009 Elsevier Inc.
Werth, E., Dijk, D.J., Achermann, P., and Borbely, A.A. (1996b). Dynamics of
the sleep EEG after an early evening nap: experimental data and simulations.
Am. J. Physiol. 271, R501–R510.
Williams, J.C., Rennaker, R.L., and Kipke, D. (1999). Stability of chronic
multichannel neural recordings: Implications for a long-term neural interface.
Neurocomputing 26–27, 1069–1076.