cortical and thalamic cellular correlates of electroencephalographic burst-suppression
TRANSCRIPT
Electroencephalography and clinical Neurophysiology , 90 (1994) 1-16 1 © 1994 Elsevier Science Ireland Ltd. 0013-4694/94/$07.00
EEG93105
Cortical and thalamic cellular correlates of electroencephalographic burst-suppression
M. Steriade *, F. Amzica and D. Contreras Laboratoire de Neurophysiologie, Facult~ de M~decine, Universit~ Laval, Quebec GIK 7P4 (Canada)
(Accepted for publication: 16 September 1993)
Summary This experimental study on anesthetized cats used intracellular recordings Of cortical, thalamocortical and reticular thalamic neurons (n = 54), as well as multi-site extracellular recordings (n = 36), to investigate the cellular correlates of EEG burst-suppression patterns, defined as alternating wave bursts and periods of electrical silence. Burst-suppression was elicited by the administration of the same or other anesthetic agents upon the background of an already synchronized EEG activity.
About 95% of cortical cells entered burst-suppression, in close time-relation with EEG activity, displaying sequences of phasic depolarizing events associated with bursts of EEG waves and an electrical silence of the neuronal membrane during flat EEG epochs. The membrane potential (V m) hyperpolarized by -- 10 mV prior to any EEG change and the slow rhythms reflecting deep stages of anesthesia progressively disorganized with transition to burst-suppression. During flat EEG epochs, the apparent input resistance (tested through short hyperpolarizing current pulses) decreased (range 12-60%) and neuronal responsiveness to orthodromic volleys (tested by thalamic and cortical evoked excitatory postsynaptic potentials) was dramatically reduced. It is proposed that the decreased input resistance is mainly due to an increase in K ÷ conductances.
At variance with cortical neurons, only 60-70% of thalamic cells ceased firing before overt EEG burst-suppression and were completely silent during flat periods of EEG activity. The remaining 30-40% of thalamic cells discharged rhythmic (1-4 Hz) spike bursts during periods of EEG silence. This rhythm, within the frequency range of delta waves, is generated in thalamic cells by the interplay between two of their intrinsic currents at critical levels of V m hyperpolarization. However, with the deepening of burst-suppression, when silent EEG periods became longer than 30 sec, thalamic cells also ceased firing.
The assumption that full-blown burst-suppression is achieved through virtually complete disconnection in brain circuits implicated in the genesis of the EEG is corroborated by the revival of normal cellular and EEG activities after volleys setting into action thalamic and cortical networks.
Key words: Burst-suppression; NREM sleep; Spindles; Delta waves; Slow ( < 1 Hz) rhythm; Intracellular recordings; Cortex; Thalamus
The e lec t roencephalographic ( E E G ) burs t -suppres- sion consists of t rans ien t sequences of high-voltage slow waves in te rmingled with sharp waves, a l te rna t ing with periods of depressed background activity or com- plete electrographic flatness. This aspect has been known since Derbyshire et al. (1936) have shown that wave bursts separa ted by periods of electrical silence may appear unde r different anesthetics. The te rm burs t -suppress ion was in t roduced to describe the oc- currence of a l te rna t ing wave burs ts and blackout se- quences in deeply narcot ized animals (Swank 1949), in the isolated cerebral cortex (Swank and Wat son 1949; Henry and Scoville 1952), dur ing coma with dissolut ion of cerebral funct ions (Bauer and Niedermeyer 1979), after t r auma associated with cerebral anoxia (Stockard et al. 1975), and in the cortex inf i l t ra ted by tumora l tissue (Fischer-Wil l iams 1963).
* Corresponding author. Tel.: (418) 656-5547; Fax: (418) 656-7898.
Despi te the repea ted descr ipt ion of this E E G aspect u n d e r a variety of clinical and exper imenta l condit ions, there are no available data as to the neu rona l events associated with the burs t -suppress ion pat tern . This ar- ticle reports, by means of in t racel lu lar recordings of cat 's neocort ical and thalamic neu rons as well as mult i-si te s imul taneous extracellular recordings, the evolut ion from the normal ly synchronized E E G activity to burs t - suppress ion dur ing various types of anesthesia. O ur data shed light on the high degree of coherence be tween cerebral ne u r ons dur ing this E E G condi t ion and on the differential propensi ty of cortical and thal- amic cells to burs t -suppress ion pat terns.
Methods and mater ia l
Exper iments were conducted on adul t cats u n d e r different anesthetics: u r e thane (1.8 g / k g , i.p.); ke- tamine, and xylazine (10-15 m g / k g and 2 - 3 m g / k g ,
SSDI 0013-4694(93)E0245-2

2 M. STER1ADE ET AL.
i.m.); ketamine (40 mg/kg, i.m.) supplemented with nitrous oxide (N20); or sodium pentobarbital (35 mg/ kg, i.p.). These anesthetics were repeated to maintain a permanent state of EEG synchronization. In addition to general anesthetics, pressure points and tissues to be incised during the surgical procedures were infiltrated with lidocaine. The animals were paralyzed with gal- lamine triethiodide and artificially ventilated by moni- toring the end-tidal CO 2 concentration around 3.7- 3.8%. Burst-suppression was achieved by the adminis- tration of the same or other anesthetics upon a back- ground of an already synchronized EEG (see Results).
Intracellular recordings were performed with mi- cropipettes (tip diameter 0.5 /xm) filled with 3 M solution of K-acetate (DC resistance 25-40 MO), in- serted into: (a)visual areas 17 and 18, suprasylvian association areas 5 and 7, and motor areas 4 and 6 of the neocortex; (b) dorso-lateral geniculate (dLG), lat- eroposterior (LP), ventroanterior-ventrolateral (VA- VL), and intralaminar centrolateral (CL) thalamic nu- clei; and (c) rostrolateral and perigeniculate (PG) sec- tors of the reticular thalamic (RE) nuclear complex. For thalamic recordings, parts of the cortex and fornix overlying the thalamic nuclei where recordings were planned were removed to facilitate the passage of the micropipettes. The stability of intracellular recordings was insured by cisternal drainage, bilateral pneumotho- rax, hip suspension, and by covering the brain with 4% agar dissolved in saline. A high-impedance amplifier with active bridge circuitry was used to record and inject current inside the cells. The signals were digitally recorded on tape (bandpass: DC to 9 kHz) and data were fed into a computer with a sample rate of 20 kHz for off-line analysis. For extracellular recordings from multiple sites we used either coarser micropipettes or tungsten microwires (impedance: 2-8 MI2). Extracellu- lar data were filtered at 300 Hz and 10 kHz and sampled at 10 kHz for off-line spike discrimination and analysis.
The gross electrical activity was recorded from the cortical surface through stainless steel screws into the calvarium (EEG), from the depth of the cortex (elec- trocorticogram, ECoG), and from different thalamic nuclei (electrothalamogram, EThG). In some experi- ments, the mass electrical activity was also recorded in the pedunculo-pontine tegmental (PPT) region of the brain-stem.
Stimulating coaxial electrodes were inserted into appropriate thalamic nuclei and homotopic points in the contralateral neocortex (in the case of cortical recordings) and in the white matter or deep layers of the cerebral cortex (in the case of thalamic recordings). Testing volleys had durations of 0.05-0.3 msec and intensities ranging from 0.05 to 0.5 mA.
At the end of experiments, animals received a lethal dose of sodium pentobarbital and were perfused trans-
cardially with saline 1011owed by 10% paraformalde- hyde. The location of recording and stimulating elec- trodes in the thalamus and PPT region was controlled on 40-75 ttm sections stained with thionine.
Results
Data base, neuronal identification, and normal sleep oscillatory patterns in neocortical and thalamic neurons
The present results are based on 90 cells. Forty-two cortical, 33 thalamocortical, and 15 RE thalamic neu- rons entered the stage of burst-suppression by re-ad- ministration of the initial anesthetic, or by adding another anesthetic to the initial one, or by administer- ing the muscarinic blocker scopolamine when the EEG was fully synchronized.
(a) Out of 42 neocortical cells, 30 were recorded intracellularly and 12 extracellularly. The resting mem- brane potential (V m) of intracellularly recorded neu- rons was more negative than -60 mV and their input resistance ranged between 10 and 40 Mg2. All were regular-spiking, slow-adapting cells, as defined in vitro (Connors et al. 1982) and in vivo (Nufiez et al. 1993). Corticothalamic or callosal neurons were identified by means of antidromic invasion from appropriate thalam- ic nuclei or the contralateral cortical areas. (b) Thalam- ocortical cells (13 intraceUularly and 20 extracellularly) were identified by their antidromic invasion from the respective cortical projection areas. Their activity in- cluded brief (5-15 msec), high-frequency (250-400 Hz) spike bursts, with progressively increased duration of interspike intervals (Domich et al. 1986). (c) RE thala- mic neurons (11 recorded extracellularly, 4 intracellu- larly) were recognized by their long (> 50 msec) spike bursts, with a decreased duration followed by an in- creased duration of interspike intervals (Domich et al. 1986; Contreras et al. 1993). Spike bursts with a first and last long interval are illustrated in the expanded trace of Fig. 8B. The acceleration-deceleration pattern of spike bursts fired by RE thalamic cells is dissimilar to that of spike bursts in thalamocortical neurons (see above point b). Intracellularly recorded relay and RE thalamie neurons had VmS more negative than -55 mV.
Before entering burst-suppression, cortical and tha- lamic cells displayed 3 types of sleep oscillation (see Steriade 1993). (a) Spindles (7-14 Hz) were over- whelming under barbiturates, less pronounced under ketamine, and appeared only occasionally under ure- thane. During EEG spindle oscillations, GABAergic RE thalamic cells oscillated with rhythmic (7-14 Hz) spike barrages over a sustained depolarization, whereas thalamocortical cells exhibited a mirror image, with inhibitory postsynaptic potentials (IPSPs) within the same frequency range. The spindle sequences recurred

CELLULAR CORRELATES OF EEG BURST-SUPPRESSION 3
periodically, with a slow rhythm of 0.1-0.3 Hz. Both spindle rhythms (7-14 Hz and 0.1-0.3 Hz) have been described in the EEG and thalamic neuronal activity of
cat (see Steriade et al. 1990) and they are also observed in the EEG of humans, during stage 2 sleep (Evans 1992). (b) Spike bursts within the delta frequency range
A q
2
3
l S
B q
4
2 s Fig. 1. EEG patterns of burst-suppression. Recordings by means of screws inserted into the calvarium overlying anterior suprasylvian (association) cortex. A: ketamine and xylazine anesthesia (1). On this control background, another dose of ketamine (5 mg/kg, i.v.) was administered (10 sec before onset of panel 2). Panels 3 and 4 are taken 2 rain and 4 min after panel 2. Note, in 2-4, progressively increased amplitudes of sharp waves and appearance of flat periods with increasing durations. B1_4: recovery from burst-suppression by removing N20 (at 20 sec before onset of 1) that was previously added on a background anesthesia produced by urethane. The flat episodes were replaced by normal
EEG activity (2) and thereafter by sequences of fast ( ~- 20 Hz) waves (3).

4 M. STERIADE ET AL.
(1-4 Hz) occurred in thalamocortical cells during ure- thane or ketamine and xylazine anesthesia (see Figs. 9A and 10B). The thalamic origin of this clock-like, stereotyped, delta pattern was demonstrated both in vitro (McCormick and Pape 1990; Leresche et al. 1991) and in vivo (Steriade et al. 1991; Curr6 Dossi et al. 1992). Besides the single-cell firing at the delta fre- quency, focal waves within the same frequency range could also be seen, resulting from the synchronization of oscillatory thalamic neurons. (c) The slow rhythm ( < 1 Hz) of cortical neurons appeared under urethane or ketamine and xylazine anesthesia. This oscillation (see Figs. 2-3) was recently described in a high propor- tion (88%) of cells recorded from sensory, association and motor areas, in either anesthetized or brain-stem-
transected undrugged animals (Steriade et al. 1993c,d). The slow rhythm is cortical-generated, as it survives thalamectomy, and is reflected in both RE thalamic and thalamocortical neurons where it groups the other two sleep rhythms (spindles and delta) within complex wave sequences recurring every 2-5 sec (Steriade et al. 1993b). In ketamine and xylazine anesthetized animals, the slow cortical rhythm had higher frequencies (gener- ally 0.5-0.9 Hz) than under urethane anesthesia (gen- erally 0.2-0.5 Hz). Intracellular recordings showed that the slow oscillation of neocortical cells under urethane increases its frequency by administering ketamine (Steriade et al. 1993c). Besides, under ketamine EEG cortical waves became spiky and had quite high ampli- tudes (Fig. 1A).
A
I n t r a - c e l l - 7 2 m Y
2 s
B ~ S c o p o l a m i n e L ~
C
20
I n t ra -ce l l
"0 n"i,ll l ECoG
l i i ̧ Fig. 2. Relation between ECoG and cellular activities during burst-suppression. Intracellular recording of corticothalamic neuron at a depth of 0.8 mm in area 7. A: slow ( -~ 0.3 Hz) oscillation during control period (urethane anesthesia). B: effect of scopolamine administration (arrow; 0.5 mg/kg i.v.) on ECoG. C: 20 min later. Close-time relation between neuronal activity and ECoG during full-blown burst-suppression. In this and
following figures depicting intracellular recordings, V m is indicated.
CELLULAR CORRELATES OF EEG BURST-SUPPRESSION 5
The EEG pattern of burst-suppression Although various anesthetics produced quite distinct
EEG patterns, similar burst-suppression aspects re- sulted from additional doses of a given anesthetic or from the mixture of different anesthetics.
The EEG pattern of burst-suppression that followed administration of various anesthetics generally con- sisted of sharp waves with high amplitudes, at frequen- cies usually ranging between 2 and 7 Hz, separated by progressively longer periods of complete flatness. The electrical silence lasted for 1-2 sec during the initial stage of this pattern (Fig. 1A3), but reached 5-15 sec in later stages (Figs. 1A 4 and 2C) and even 30 sec or more in some instances (see below, Figs. 7 and 9A). In most cases (85%), the normal EEG activity resumed
after the burst-suppression episodes. During recovery, the flat periods became progressively shorter and were eventually replaced by grapho-elements characterizing the initial anesthesia (Fig. 1B). When this evolution had a tendency toward a desynchronized EEG (Fig. 1B4) , we immediately administered a general anes- thetic.
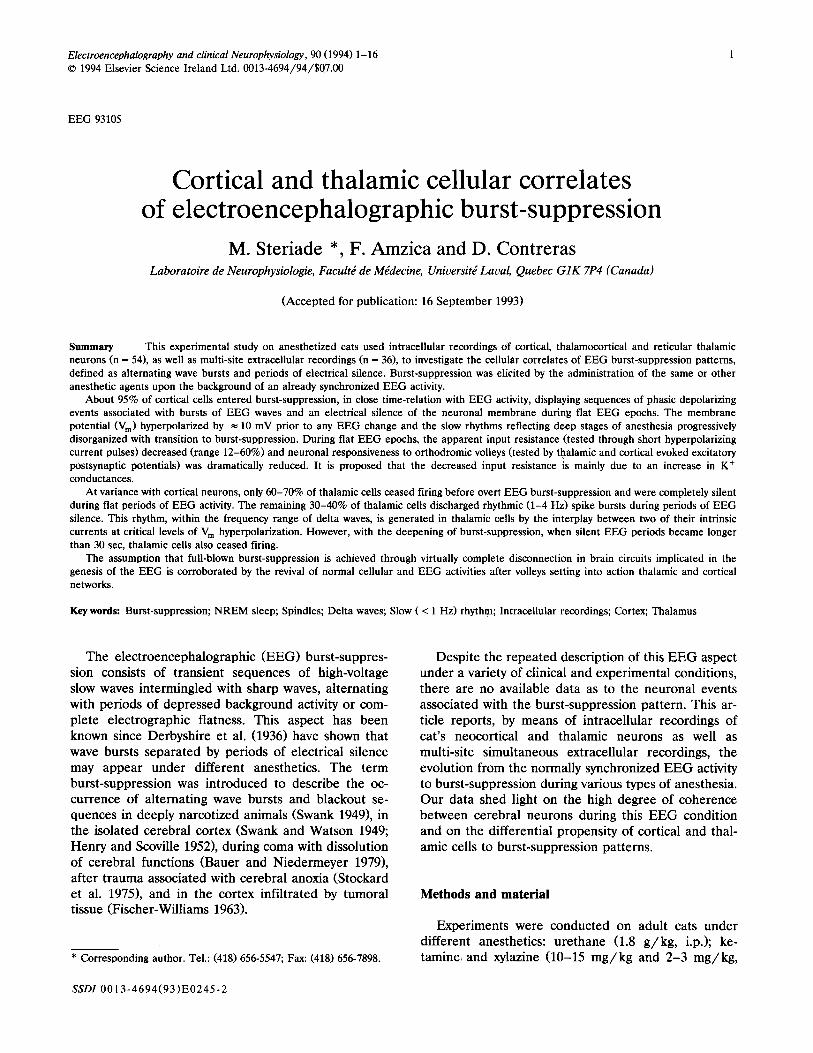
Cortical cellular correlates of EEG burst-suppression and changes in membrane conductance
Forty out of 42 cortical cells entered the burst-sup- pression pattern. The close relation, during burst-sup- pression, between the activity of an intracellularly recorded neuron in the suprasylvian area 7 and the focal waves recorded at the depth of the precruciate
A
I n t r a - c e l l - 6 4 m Y
2 s
B
I n t r a - c e l l - 7 4 mV
\ ,~,:.,, : : ,..., ~ vr , ,,.,, . [ ":'IV'. :' 'X I :.A,~V:,,.mV~ ' : , ;' L \H'{: ,,r ~Jbk " t ,w~ ',~,,, v'~:v',.,:" itti , ' ' , I t ~ ,
E C o G ? ~ ii
C
I n t r a - c e l l - 74 mV
E C o G
Fig. 3. Hyperpolarization of V m and disorganization of slow cortical (= 0.3 Hz) rhythm during burst-suppression. Area 5 neuron recorded intracellularly. A: slow oscillation ( -- 0.3 Hz) under urethane anesthesia. B: on this background, administration of a barbiturate (5 mg/kg, i.v.) produced V m hyperpolarization of 10 mV, abolished action potential generation, transformed the 0.3 Hz depolarizing envelopes into shorter depolarizing events, and disorganized the slow oscillation. Right part of panel C shows further V m hyperpolarization and burst-suppression
pattern reaching both cellular and ECoG activities, with periods of flatness lasting for 2-5 sec.
6 M. STERIADE ET A L
A
- 8 0 m Y
BS
l O m s
1 _, mv ..... i/o.j
B 1
C
It~J~ Contr.-/" ~ _ ~ - ~ S u r f . - f i e l d J \ J ' / 2 B S I >
10 ms
2 o°,r
Cx
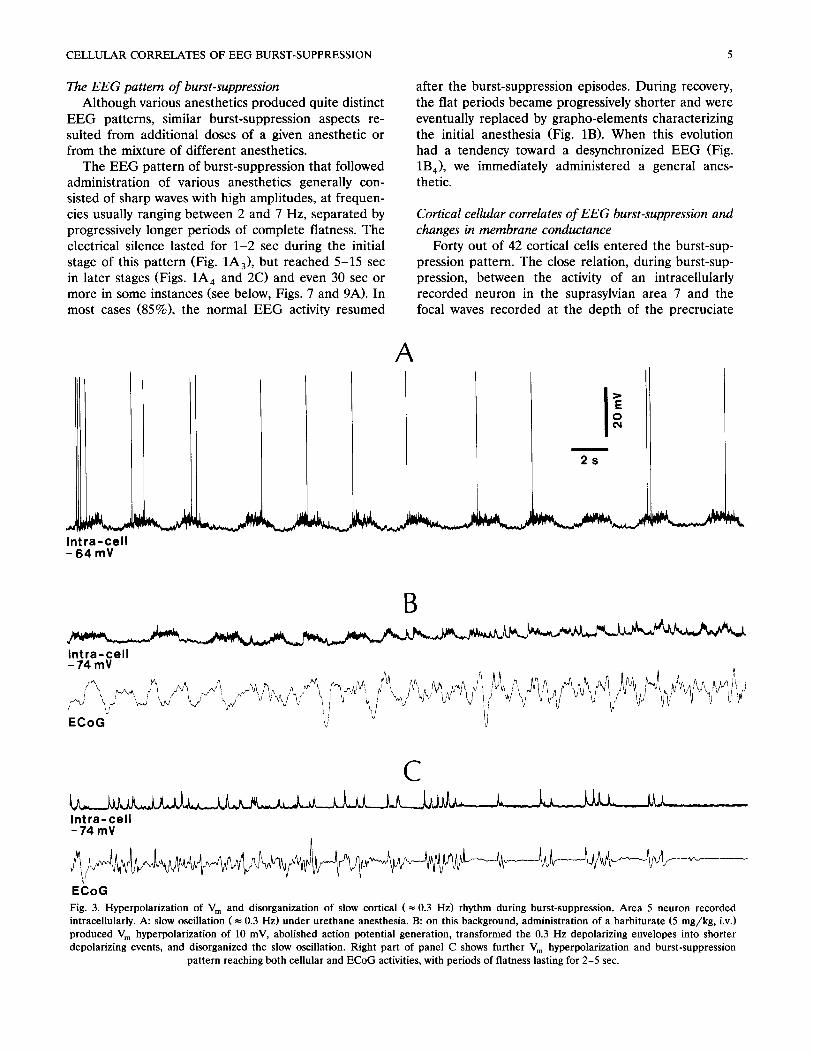
Fig. 4. Changes in membrane conductance and synaptic responsiveness during burst-suppression. A: neuron recorded at a depth of 0.8 mm in area 5. Input resistance measured through hyperpolarizing current pulses (1 nA, 50 msec) during a control period (Contr.), flat epochs of burst-suppression (BS), and initial period of recovery (Recov.). B: neuron recorded at a depth of 0.3 mm in area 7, simultaneously with the field potential at the cortical surface. Responses to stimulus applied to the LP thalamic nucleus during a control period (Contr.) and flat epochs of BS. C: neuron at a depth of 0.9 mm in area 5. In 1, hyperpolarizing current pulses (1 nA, 30 msec) during Contr. and BS. In 2, biphasic EPSP of the same cell, elicited by stimulation of the homotopic cortical focus in area 5 of the contralateral hemisphere. In all cases, averaged responses (12 in
A, 10 in B, and 16 in C).
area 6, 12 mm apart, is depicted in Fig. 2. In this case, the hypersynchronized EEG state was elicited by ad- ministration of scopolamine, a muscarinic antagonist. The EEG synchronization induced by muscarinic blockers (see Fig. 2B), previously described by Wilker (1952), is explained by the fact that muscarinic recep- tors antagonize the low-frequency rhythms of cortical cells, transforming them into tonically activated firing (Steriade et al. 1993a; see Discussion). During the initial urethane anesthesia, the cellular slow ( = 0.3 Hz) oscillation consisted of prolonged depolarizing en- velopes that occasionally led to action potentials, sepa- rated by long-lasting hyperpolarizations (Fig. 2A). Dur-
ing burst-suppression elicited by scopolamine adminis- tration, the V m hyperpolarized by 8 mV (the record in Fig. 2C is under steady depolarizing current, + 0.2 nA, to elicit some action potentials), the slow rhythm disap- peared, and the neuron displayed sequences of phasic depolarizing events appearing exclusively during the bursts of EEG waves. The periods of flatness in EEG recordings were associated with a complete electrical silence of the neuron.
The slow intracellular rhythm was progressively dis- organized with transition to burst-suppression (Fig. 3A and B). In this cell the V m hyperpolarized by 10 mV and abolition of action potentials took place prior to
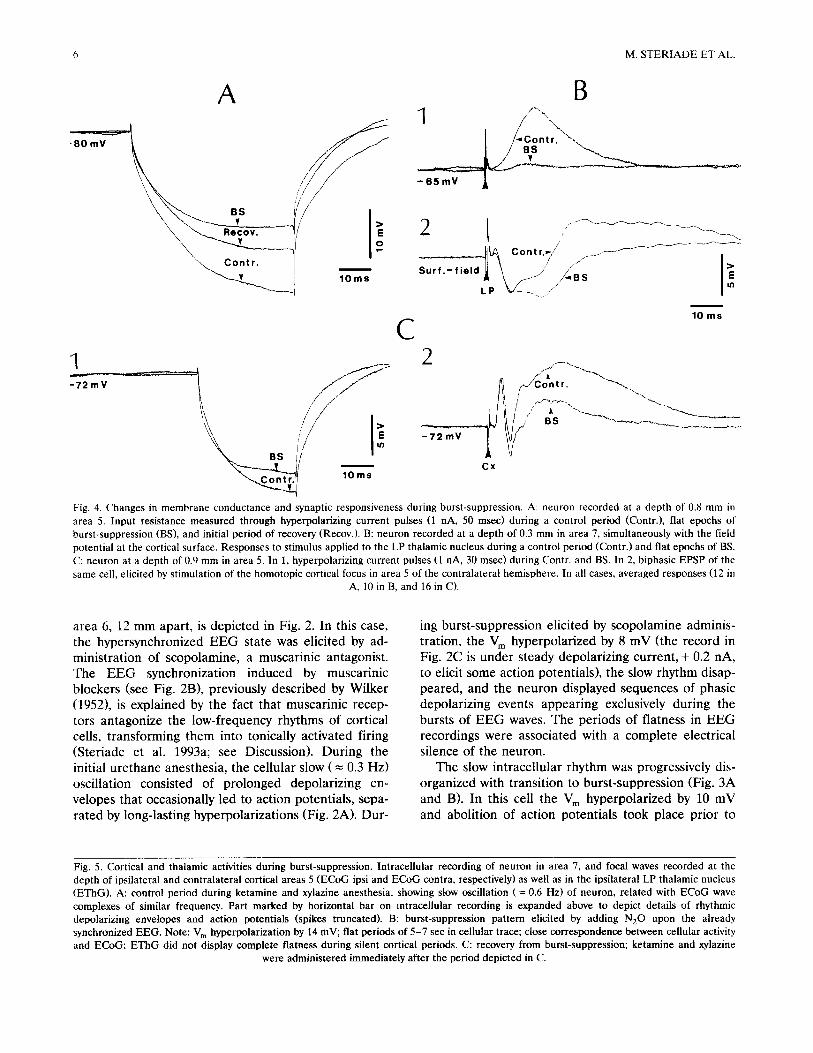
Fig. 5. Cortical and thalamic activities during burst-suppression. Intracellular recording of neuron in area 7, and focal waves recorded at the depth of ipsilateral and contralateral cortical areas 5 (ECoG ipsi and ECoG contra, respectively) as well as in the ipsilateral LP thalamic nucleus (EThG). A: control period during ketamine and xylazine anesthesia, showing slow oscillation ( --- 0.6 Hz) of neuron, related with ECoG wave complexes of similar frequency. Part marked by horizontal bar on intracellular recording is expanded above to depict details of rhythmic depolarizing envelopes and action potentials (spikes truncated). B: burst-suppression pattern elicited by adding N20 upon the already synchronized EEG. Note: V m hyperpolarization by 14 mV; flat periods of 5-7 sec in cellular trace; close correspondence between cellular activity and ECoG; EThG did not display complete flatness during silent cortical periods. C: recovery from burst-suppression; ketamine and xylazine
were administered immediately after the period depicted in C.
CELLULAR CORRELATES OF EEG BURST-SUPPRESSION 7
A
2s
Intra-cell _00my 1 / A
ECo~ ipsi ~ ~ __ ~ ] V ~ w v ~ '~ '
Intra-cell -80mV
B
ECoG ipsi
ECoG contra ~ ~
C
Intra-cell - 7 2 m V
8 M. STER1ADE ET AL.
A I I I i i I J I
I n t r a - c e l l - 6 4 m Y
E C o G I - -
E T h G
B r a i n s t e m - PPT
?
i
- 6 8 m Y
B
E Io 2 s
. ,~ . . . . 2 . . . . . . . . . " 7 1 2 1 " T ' £ ' " ~ ; . . . . . . . .
: g
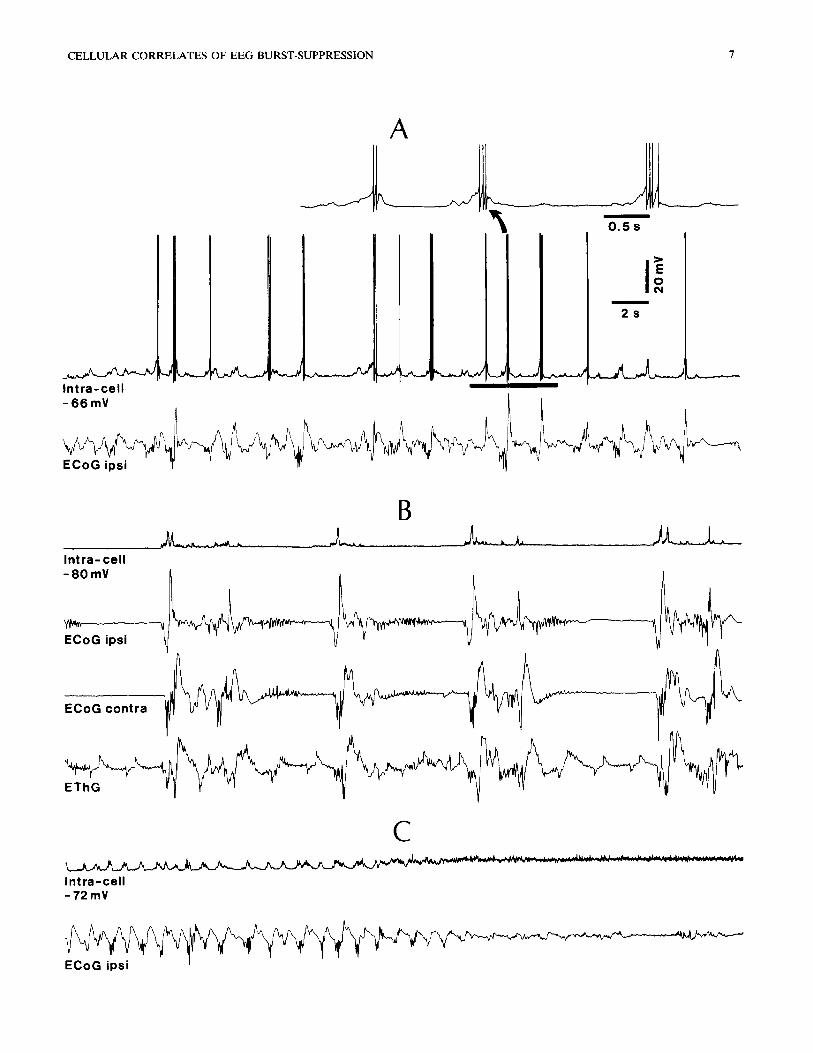
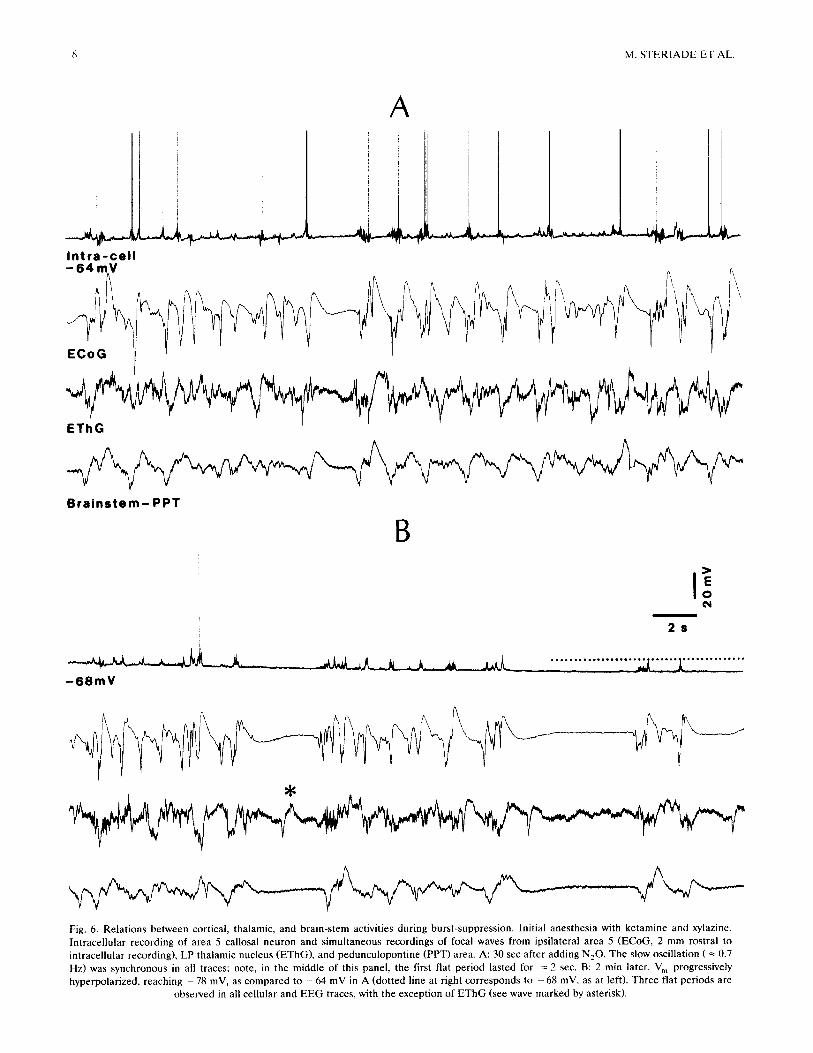
Fig. 6. Relations between cortical, thalamic, and brain-stem activities during burst-suppression. Initial anesthesia with ketamine and xylazine. Intracellular recording of area 5 callosal neuron and simultaneous recordings of focal waves from ipsilateral area 5 (ECoG, 2 mm rostral to intracellular recording), LP thalamic nucleus (EThG), and pedunculopontine (PPT) area. A: 30 sec after adding N20. The slow oscillation ( -~ 0.7 Hz) was synchronous in all traces; note, in the middle of this panel, the first flat period lasted for = 2 sec. B: 2 min later. V m progressively hyperpolarized, reaching - 78 mV, as compared to - 64 mV in A (dotted line at right corresponds to - 68 mV, as at left). Three flat periods are
observed in all cellular and EEG traces, with the exception of EThG (see wave marked by asterisk).

C E L L U L A R C O R R E L A T E S OF E E G BURST-SUPPRESSION 9
any change in the EEG activity (Fig. 3B). The pro- longed depolarizing envelopes of the 0.3 Hz rhythm (Fig. 3A) became shorter and less rhythmic, developing into transient depolarizations (Fig. 3B) that, eventually, became grouped and separated by periods of electrical silence lasting for 2-5 sec (right part in Fig. 3C). Those silent periods corresponded to the flat EEG epochs defining burst-suppression.
We estimated the changes in membrane conduc- tance in cortical neurons that could be recorded during control and burst-suppression epochs (n = 6). Conduc- tance changes were measured by using hyperpolarizing pulses of 50 msec or shorter, with an intensity of 1 nA.
The increase in membrane conductance of cortical neurons during flat EEG periods of burst-suppression largely varied in this sample, ranging from 60% to 12%. These two extreme values are shown in Fig. 4A and C r The area 5 cell in Fig. 4A displayed an apparent input resistance of 32 M/] during the control period (before burst-suppression), of 19 M/] during flat periods of burst-suppression, and of 24 M ~ during the initial period of recovery from burst suppression. The neuron in Fig. 4C~, tested with a shorter (30 msec) hyperpolarizing pulse, displayed a much less evident decrease in the input resistance, from 16 M ~ to 14 MO. As the neurons hyperpolarized by = 10 mV dur-
A
Iii lilill,ll,~ HI i H I , I1 mlill i l i fill] lli~ ....................... II1 llill II1 II I I I 1 I l l I II I1 Illi I r! . . . . . .
Area 4
~, ~ J~. , . , , . . I L . ~l .. l l , , / t . . . . . . . . . . . . . . . 11~ I,,1,,,,111 L I/I. 111 IB i l l t i .... 11.1. I L i
~,r,].!. 11~ ' 1 I~ ~ll-rl'l I ~''!ll ' l l lll I I . . . . . . . . i . . . . . . . . . . . . . . . . . . . . I I ¸ . . . . . . . . .
E E G - M o t . C x .
EEG- Vis. C x . 2 5
B
IJI,JII,ll~,~IJL[ U _.IL, ! ~1~1 m i U Ii l ] U I1; ..... I 11 ~1 ~1 1[] r! l,ll, lrl rlrr"r*:l[ I* 1 I1[1' .... I ] l l ~ ' I 'I ' ~ 1 ~i~ 1 ' I I ~ ..... ~ I I I[ I ]f I ~ r~" ~ In 1 l I B I
Fig. 7. Recovery from cortical burst-suppression by thalamocortical volleys. Simultaneous activity of extracellularly recorded neurons in cortical areas 4 and 18 (two top traces) and surface E E G from motor and visual areas. Initial anesthesia with ketamine and xylazine. Additional administration of ure thane (0.2 g / kg , i.v.) led to burst-suppression, as seen in right part of A. Complete silence in cellular and EEG activities lasted for 32 sec (a period of 8 sec separates A from B) until 12 stimuli were applied to the CL intralaminar thalamic nucleus (arrows). Stimuli
were followed by self-sustained recovery from burst-suppression.

I0 M. STERIADE ET AL.
Intra -cel l - 8 4 m V
E EG l:i i'
I
Illt A
l.~j
! !
i ~ i ̧
I
B f~
1
i
i i
LI
I
0 .2s Fig. 8. Burst-suppression pattern in intracellularly recorded RE thalamic neuron (rostrolateral district). Urethane anesthesia supplemented by pentobarbital. A and B: 2 epochs showing close relation between the activity of RE thalamic cell and EEG during burst-suppression. Part
marked by horizontal bar in B is expanded below.
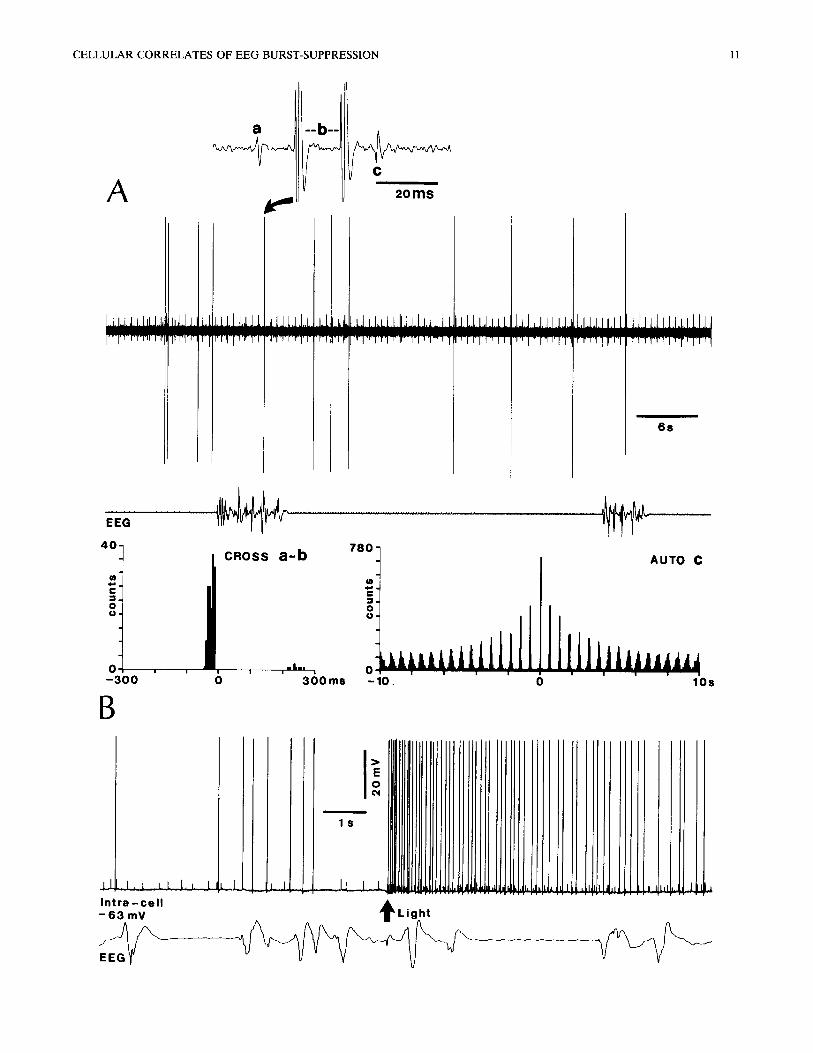
Fig. 9. Thalamocortical neurons may remain active during EEG burst-suppression. Neurons recorded extracellularly (A) and intracellularly (B) from the dLG nucleus. A: 3 cells (a-c) simultaneously recorded by the same microelectrode. EEG burst-suppression elicited by ketamine (5 mg/kg, i.v.) over a background of urethane anesthesia. Note that during long-lasting ( ~ 30 sec) flat EEG periods, all 3 dLG neurons remained active. The cross-correlogram shows that neurons a (upward, initially positive spike; see above expanded trace) and b (large spike) fired in synchrony, the action potentials of a preceding those of b by = 10-20 msec. Neuron c (initially negative spike) discharged rhythmically at delta frequency ( = 1.6 Hz); its autocorrelogram computed over 10 sec illustrates the delta oscillation, B: persistence of spontaneous and light-evoked
activity in dLG cell during flat EEG episodes.
CELLULAR CORRELATES OF EEG BURST-SUPPRESSION 11
A
a ' - - b - - - -
C
2 o r e s
I l l g l l n l l m l u l m w i l W l l l l I M I l l l l l l I IB IWBI~U~J i I I I Im U U a = ~ B B = l
~ m llllulluluua , * , , , , l ib
6 $
E E G
40-
W" P 3 . @ ¢J.
0 - 3 0 0
B
CROSS a - b r s o
W
i I=mn I I |
0 3 0 0 m s -1'0.
AUTO C
l!]JJJi.,.:,,, ' 1 ' 05
.1~--[1 I _J_L_ [.L LJ In t ra -ce l l - 6 3 m V
L L ..... t l
o
l s
~ L i g h t

12 M. STERIADE ET AL.
ing burst-suppression (see above), we measured these changes in membrane conductance by manually clamp- ing the V,, at the control value.
In contrast with the variable or small changes in input resistance estimated from the voltage deflections elicited by injecting current pulses into the soma, we observed dramatic changes in neuronal responsiveness tested by using synaptic volleys. The thalamic evoked EPSP was drastically diminished or suppressed during burst-suppression (Fig. 4B t) and, in some instances, we observed a selective diminution of the late component of the caltosal evoked EPSP (Fig. 4C2).
The relations between the intracellular events of cortical neurons and burst-suppression episodes in global activities recorded from cortical, thalamic, and brain-stem tegmental fields are illustrated in Figs. 5 and 6. The main point arising from these simultaneous recordings is that, while cortical areas of both hemi- spheres as well as the PPT area at the meso-pontine junction showed periods of alternating wave bursts and flatness matching the activity of intracellularly recorded cortical neurons, the thalamic recording displayed signs of activity during the periods of electrical silence in the cortex and brain-stem. The neuron in Fig. 5 displayed a complete silence 3-4 sec before the flatness in the ipsi- and contralateral ECoG. The wave bursts of the EThG corresponded to those in the ECoG; however, in no instance became the EThG totally silent (Fig. 5B). Similarly, the silent periods of the callosal neuron depicted in Fig. 6 corresponded to flat epochs of the same duration in the ECoG and brain-stem PPT recordings; during those epochs, however, the EThG exhibited smooth or sharp waves (asterisk in Fig. 6B). The persistence of electrical activity in the thalamus during silent periods in cortical cells and ECoG cor- roborates our results from recordings of thalamic neu- rons (see next section).
While the complete flatness of the cell membrane might have suggested that virtually all cortical neurons were unresponsive during this state, in some cortical neurons (n = 18) thalamic volleys delivered during the epochs of electrical silence were able to elicit neuronal firing or subthreshold depolarizing potentials as well as the revival of EEG activity. Moreover, the restoration of EEG and cellular discharges continued as self-sus- tained activities, for variable periods of time (10-50 sec), after one or a few pulses to thalamocortical pathways (Fig. 7). This simultaneous recording of neu- rons and EEG from motor and visual cortices shows that setting into action the thalamocortical projections
from the CL intralaminar nucleus to both those areas resulted in the reappearance of EEG and single-cell activities after more than 30 sec of electrical silence. Similar results were obtained by stimulating various cortical fields, the brain-stem PPT area, or prethalamic specific relays such as the bulbar nuclei giving rise to medial lemniscal pathways (data not shown).
Thalamic neuronal correlates of EEG burst-suppression The behavior of thalamic neurons was less globally
correlated with EEG burst-suppression patterns than was the case of cortical neurons. Only 60-70% of them (11 RE thatamic and 20 thalamocortical cells) ceased firing before the occurrence of burst-suppression; thereafter, those cells discharged during EEG wave bursts and were completely silent during flat periods of the EEG. An example of such an RE thalamic cell, whose activity was closely related to EEG burst-sup- pression patterns, is illustrated in Fig. 8. During flat EEG epochs lasting for ~ 10 sec, the membrane repo- larized from its activity during preceding wave bursts, but signs of synaptic activity could still be visible (Fig. 8A). Interestingly, the frequency of cyclic depolarizing events during periods of activity closely corresponded to the frequency of EEG spiky waves (see -- 2 Hz and
7 Hz in both cellular and EEG activities during the first and second burst episodes in Fig. 8B).
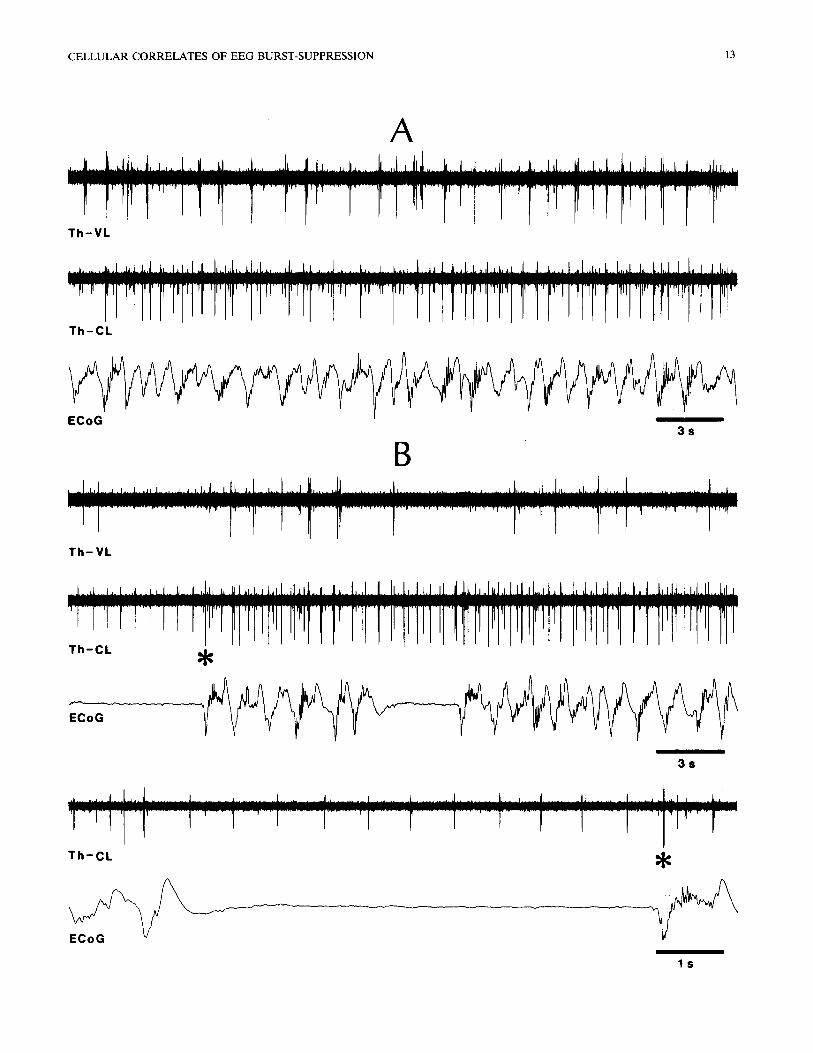
The thalamic neurons deviating from the close EEG-cell correspondence during burst-suppression were mainly recorded from dLG, VA-VL and CL nu- clei. Basically, during flat EEG periods some of those cells displayed rhythmic spike bursts within the delta frequency range (cell c in Fig. 9A) or they only de- creased the firing rates, whereas during active EEG epochs they exhibited an increase in their background noise and their rhythmic burst firing became less regu- lar, with intermingled single spikes. All 3 simultane- ously recorded dLG neurons depicted in Fig. 9A dis- charged during flat EEG periods: two of them fired action potentials in good time-relation (cell a preced- ing cell b by ~ 10-20 msec), while cell c displayed a spectacular rhythmicity within the delta frequency range. Another, intracellularly recorded, dLG neuron was typically driven by light stimulation, its activated firing continuing regardless of the occurrence of flat EEG epochs (Fig. 9B). Similar persistence of rhythmic bursting activity within the delta frequency range was observed in the VA-VL and CL thalamic nuclei (Fig. 10). However, with the deepening of the burst-suppres- sion pattern, when the periods of silent epochs in the
Fig. 10. Delta activity in thalamocortical neurons, surviving during burst-suppression. Simultaneous recording of VL and CL thalamocortical neurons and of ECoG from pericruciate area 4. Ketamine and xylazine anesthesia (A) supplemented by urethane (0.3 g/kg, i.v.) (B). Part of B, marked by asterisk marking the spike burst of larger action potential, is expanded below to illustrate the clock-like delta activity of neuron with
smaller action potential during EEG flat period.
A
B
T I I - V L
T h - C L
CELLULAR CORRELATES OF EEG BURST-SUPPRESSION 13
3 s
T h - V L
I n - -GL
ECoG
3 $
T h - C L
l s
14 M. STERIADE ET Air.
EEG activity became longer than 30 sec, all thalamic cells ceased firing.
Discussion
This study provides the first cellular data on EEG burst-suppression patterns. Our results demonstrate a close correspondence between neocortical as well as thalamic activities at the single-cell level and mass electrical events recorded from the cortex, thalamus and upper brain-stem. As discussed below, the distinct preservation of thalamic spike bursts during periods of electrical silence in the neocortex is in keeping with the oscillatory properties of thalamocortical cells at appro- priate levels of V~ hyperpolarization produced by ei- ther pharmacological or morphological disconnection procedures.
A major and consistent finding was that the V m hyperpolarization of cortical neurons reliably preceded the overt EEG aspects of burst-suppression (see Fig. 3B). This precursor cellular sign is attributable to an increase in GABAergic inhibitory processes at both thalamic and cortical synapses, together with a disfacil- itation avalanche in excitatory brain-stem-thalamo- cortical circuits. Although the actions exerted by vari- ous anesthetics are diverse, there is general consensus that synaptic transmission is particularly susceptible to depression by anesthetic agents. Various data point to a common ability of different anesthetics (among them urethane, ketamine, N20, and barbiturates, as used in the present experiments) to potentiate the effects of GABA receptor stimulation (Nicoll and Madison 1982; Gage and Robertson 1985; see also reviews by Roth and Miller 1986; and Keane and Biziere 1987). Synap- tic inhibition would consequently lead to disconnection throughout thalamocortical systems.
In addition to these linked processes of synaptic inhibition and disfacilitation, the hyperpolarization of thalamic and cortical cells at increasing levels of anes- thesia is ascribable to: (a) the inactivation of inward Ca 2+ currents (Krnjevic and Pull 1988; Takenoshita and Steinbach 1991) as well as the depression of a mixed Na+-K ÷ current (I h) (Tokimasa et al. 1980) that contributes to the depolarization of neurons; and (b) an increase in K + conductance (Nicoll and Madison 1982; Berg-Johnsen and Langmoen 1987; Sugiyama et al. 1992). As to the powerful effect exerted by scopol- amine in promoting burst-suppression patterns (see Fig. 2), it is also probably due to an increase in K + currents, as activation of muscarinic receptors dimin- ishes or suppresses the voltage-dependent K + current I M, the Ca2+-dependent K ÷ IAH P, as well as an Na +- activated K ÷ current of cortical pyramidal neurons (Halliwell 1986; McCormick and Williamson 1989; Schwindt et al. 1989). These actions explain why the
increase in release of acetylcholine from the cerebral cortex is associated with states of EEG activation (Celesia and Jasper 1966).
It is then likely that the increase in gK plays the major role in the induction of burst-suppression episodes. This proposal is based on two cellular corre- lates of this EEG pattern: the V m hyperpolarization and the increase in membrane conductance (see Fig. 4). The discrepancy between a wide range of decreased input resistance (from 12% to 60%) in various neurons, as estimated from direct current injection and a con- stant and marked decrease up to suppression of EPSPs elicited by thalamic or cortical orthodromic volleys, is postulated to result from the site of conductance in- crease, probably far away from the somatic impalement site.
The persistence of rhythmic spike bursts within delta frequency (1-4 Hz) in thalamocortical cells during pe- riods of complete EEG flatness (Figs. 9 and 10), at a time when the overwhelming majority of cortical neu- rons were silent, reflects the pacemaking properties of thalamocortical neurons at critical levels of hyperpolar- ization, namely, ~ 10 mV more negative than the resting V m (McCormick and Pape 1990; Leresche et al. 1991; Steriade et al. 1991; Curr6 Dossi et al. 1992). At such V m levels (around - 7 0 mV), the delta oscillation of thalamic cells results from the interplay between the hyperpolarization-activated cation current I h and the low-threshold Ca 2+ c u r r e n t I t (McCormick and Pape 1990; Soltesz et al. 1991) that generates high-frequency bursts of fast Na ÷ action potentials in thalamic cells (Desch~nes et al. 1984; Jahnsen and Llin~is 1984). While the I h may also be present in neocortical neu- rons, the intrinsic delta oscillation is less likely to be generated in these neurons because only a small sub- population displays the LTS and the de-inactivation of this conductance requires unusually large amounts of hyperpolarization, - 1 0 0 to --120 mV (Nufiez et al. 1993), that are not reached in states of quiescent sleep or anesthesia.
The revival of normal EEG and cellular activities from burst-suppression by volleys applied to prethal- amic, thalamocortical, or corticothalamic pathways, corroborates the assumption that full-blown burst-sup- pression is achieved through complete disconnection within these brain circuits and indicates that, in some instances, a few repetitive stimuli or even a single volley may be enough to produce recovery from the dramatic blackout during burst-suppression. In this line of thinking, the spontaneous recurrence of cyclic EEG wave bursts may be seen as triggered by remnant activities in different parts of the affected circuitry, mainly in the dorsothalamic-RE thalamic network in which a significant proportion of neurons remained active during burst-suppression. As yet, however, it is unclear why this recovery is transient and whether or
CELLULAR CORRELATES OF EEG BURST-SUPPRESSION 15
not there is a real periodicity in the re-appearance of electrical activity. According to the state of the whole system, the wave bursts may fade and be replaced by electrical silence or may recover toward a normal pat- tern. The elucidation of this point could shed light on the mechanisms underlying the alternating pattern be- tween sequences of wave bursts and complete flatness in the E E G and cellular activities. Another type of E E G activity occurring in the normal EEG-synchro- nized sleep, termed the cyclic alternating pattern (Evans 1975; Terzano et al. 1983, 1988) that is orga- nized in sequences of two or more decasecond cycles, may be viewed as a periodic oscillation of surviving arousal systems within sleep or coma.
Work supported by the Medical Research Council of Canada (Grant MT-3689).
F.A. and D.C. are doctoral students in this laboratory. We thank R. Curt6 Dossi and A. Nufiez for their collaboration in initial recordings, and P. Gigubre and D. Drolet for technical assistance.
References
Bauer, G. and Niedermeyer, E. Acute convulsions. Clin. Neurophys- iol., 1979, 10: 127-144.
Berg-Johnsen, J. and Langmoen, I.A. Isoflurane hyperpolarizes neu- rones in rat and human cerebral cortex. Acta Physiol. Scand., 1987, 130: 679-685.
Celesia, G.G. and Jasper, H.H. Acetylcholine released from cerebral cortex in relation to states of activation. Neurology, 1966, 16: 1053-1063.
Connors, B.W., Gutnick, M.J. and Prince, D.A. Electrophysiological properties of neocortical neurons in vitro. J. Neurophysiol., 1982, 48: 1302-1320.
Contreras, D., Curr6 Dossi, R. and Steriade, M. Electrophysiological properties of cat reticular thalamic neurones in vivo. J. Physiol. (Lond.), 1993: 470: 273-294.
Curr6 Dossi, R., Nufiez, A. and Steriade, M. Electrophysiology of a slow (0.5-4 Hz) intrinsic oscillation of cat thalamocortical neu- rones in vivo. J. Physiol. (Lond.), 1992, 447: 215-234.
Derbyshire, A.J., Rempel, B., Forbes, A. and Lambert, E.F. The effects of anesthetics on action potentials in the cererbal cortex of the cat. Am. J. Physiol., 1936, 116: 577-596.
Desch~nes, M., Paradis, M., Roy, J.P. and Steriade, M. Electrophysi- ology of neurons of lateral thalamic nuclei in cat: resting proper- ties and burst discharges. J. Neurophysiol., 1984, 51: 1196-1219.
Domich, L., Oakson, G. and Steriade, M. Thalamic burst patterns in the naturally sleeping cat: a comparison between cortically-pro- jecting and reticularis neurones. J. Physiol. (Lond.), 1986, 379: 429-450.
Evans, B.M. Cyclic EEG changes in subacute spongiform and anoxic encephalopathy. Electroenceph. clin. Neurophysiol., 1975, 39: 587-598.
Evans, B.M. Cyclical activity in non-rapid eye movement sleep: a proposed arousal inhibitory mechanism. Electroenceph. clin. Neurophysiol., 1992, 86: 123-131.
Fischer-Williams, M. Burst-suppression activity as indication of un- dercut cortex. Electroenceph. clin. Neurophysiol., 1963, 15: 723- 724.
Gage, P.W. and Robertson, B. Prolongation of inhibitory postsynap- tic currents by pentobarbitone, halothane and ketamine in CA1
pyramidal cells in rat hippocampus. Br. J. Pharmacol., 1985, 85: 675 -681.
Halliwell, J.V. M-current in human cortical neurones. Neurosci. Lett., 1986, 67: 1-6.
Henry, C.E. and Scoville, W.B. Suppression-burst activity from iso- lated cerebral cortex in man. Electroenceph. clin. Neurophysiol., 1952, 4: 1-22.
Jahnsen, H. and Llinfis, R. Electrophysiological properties of guinea- pig thalamic neurones: an in vitro study. J. Physiol. (Lond.), 1984, 349: 205-226.
Keane, P.E. and Biziere, K. The effects of general anesthetics on GABAergic transmission. Life Sci., 1987, 41: 1437-1448.
Krnjevic, K. and Pull, E. Halothane suppresses slow inward currents in hippocampal slices. Can. J. Physiol. Pharmacol., 1988, 66: 1570-1575.
Leresche, N., Lightowler, S., Soltesz, I., Jassik-Gerschenfeld, D. and Crunelli, V. Low-frequency oscillatory activities intrinsic to rat and cat thalamocortical cells. J. Physiol. (Lond.), 1991, 441: 155-174.
McCormick, D.A. and Pape, H.C. Properties of a hyperpolarization- activated cation current and its role in rhythmic oscillation in thalamocortical neurones. J. Physiol. (Lond.), 1990, 431: 291-318.
McCormick, D.A. and Williamson, A. Convergence and divergence of neurotransmitter action in human cerebral cortex. Proc. Nat. Acad. Sci. (USA), 1989, 86: 8098-8102.
Nicoll, R.A. and Madison, D.V. General anesthetics hyperpolarize neurons in the vertebrate central nervous system. Science, 1982, 217: 1055-1057.
Nufiez, A., Amzica, F. and Steriade, M. Electrophysiology of associa- tion cortical neurons in vivo: intrinsic properties and synaptic responses. J. Neurophysiol., 1993: 70: 418-430.
Roth, S.H. and Miller, K.W. (Eds.). Molecular and Cellular Mecha- nisms of Anesthetics. Plenum, New York, 1986.
Schwindt, P.C., Spain, W.J. and Crill, W.E. Long-lasting reduction of excitability by a sodium-dependent potassium current in rat neo- cortical neurons. J. Neurophysiol., 1989, 61: 233-244.
Soltesz, I., Lightowler, S., Leresche, N., Jassik-Gerschenfeld, D., Pollard, C.E. and Crunelli, V. Two inward currents and the transformation of low-frequency oscillations of rat and cat thala- mocortical cells. J. Physiol. (Lond.), 1991, 441: 175-197.
Steriade, M. Cellular substrates of brain rhythms. In: E. Nieder- meyer and F. Lopes da Silva (Eds.), Electroencephalography: Basic Principles, Clinical Applications, and Related Fields. Williams and Wilkins, Baltimore, t993: 27-62.
Steriade, M., Jones, E.G. and Llinfis, R.R. Thalamic Oscillations and Signaling. Wiley-lnterscience, New York, 1990.
Steriade, M., Curr6 Dossi, R. and Nufiez, A. Network modulation of a slow intrinsic oscillation of cat thalamocortical neurons impli- cated in sleep delta waves: cortically-induced synchronization and brainstem cholinergic suppression. J. Neurosci., 1991, 11: 3200- 3217.
Steriade, M., Amzica, F. and Nufiez, A. Cholinergic and noradrener- gic modulation of the slow ( < 1 Hz) oscillation of neocortical neurons. J. Neurophysiol., 1993a: 70: 1385-1400.
Steriade, M., Contreras, D., Curr6 Dossi, R. and Nufiez, A. The slow ( < 1 Hz) oscillation in reticular thalamic and thalamocortical neurons. Scenario of sleep rhythms generation in interacting thalamic and neocortical networks. J. Neurosci., 1993b: 13: 3284- 3299.
Steriade, M., Nufiez, A. and Amzica, F. A novel slow oscillation ( < 1 Hz) of neocortical neurons in vivo: depolarizing and hyperpolariz- ing components. J. Neurosci., 1993c: 13: 3252-3265.
Steriade, M., Nufiez, A. and Amzica, F. Intracellular analysis of relations between the slow ( < 1 Hz) neocortical oscillation and other sleep rhythms of the electroencephalogram. J. Neurosci., 1993d: 13: 3266-3283.
I~ M. STER1ADE ET AL.
Stockard, J.J., Bickford, R.G. and Aung, M.H. The electroen- cephalogram in traumatic brain injury. In: P.J. Vinken and G.W. Bruyn (Eds.), Handbook of Clinical Neurology, Vol. 23 (I). North Holland, Amsterdam, 1975: 217-367.
Sugiyama, K., Muteki, T. and Shimoji, K. Halothane-induced hyper- polarization and depression of postsynaptic potentials of guinea- pig thalamic neurons in vitro. Brain Res., 1992, 576: 97-103.
Swank, R.L. Synchronization of spontaneous electrical activity of cerebrum by barbiturate narcosis. J. Neurophysiol., 1949, 12: 161-172.
Swank, R.L and Watson, C.W. Effects of barbiturates and ether on spontaneous electrical activity of dog brain. J. Neurophysiol.. 1949, 12: 137-160.
Takenoshita, M. and Steinbach, J.H. Halothane blocks low-voltage- activated calcium current in rat sensory neurons. J. Neurosci., 1991, 11: 1404-1412.
Terzano, M.G., Mancia, D. and Manzoni, G.C. Periodic activities in Creutzfeldt-Jakob disease and epilepsy. In: G. Nistico, R. Di Perri and H. Meinardi (Eds.), Epilepsy: an Update on Research and Therapy. Alan R. Liss, New York, 1983: 199-226.
Terzano, M.G., Parrino, L. and Spaggiari, M.C. The cyclic alternat- ing pattern sequences in the dynamic organization of sleep. Electroenceph. clin. Neurophysiol., 1988, 69: 437-447.
Tokimasa, T., Sugiyama, K., Akasu, T. and Muteki, T. Volatile anesthetics inhibit a cyclic AMP-dependent sodium-potassium current in cultured sensory neurones of bullfrog. Br. J. Pharma- col., 1990, 101: 190-192.
Wilker, A. Pharmacologic dissociation of behavior and EEG "sleep patterns" in dogs: morphine, N-allylnor-morphine and atropine. Proc. Soc. Exp. Biol. Med. (NY), 1952, 79: 261-265.