corporate presentation - west china cement limited
TRANSCRIPT
Corporate Presentation
October/ November 2011
Contents
Highlights 3
Company Background 5
Financial Analysis 10
Market and Outlook 14
Appendices 26
– Financial Information
– Board of Directors
2
Page
Operational Highlights
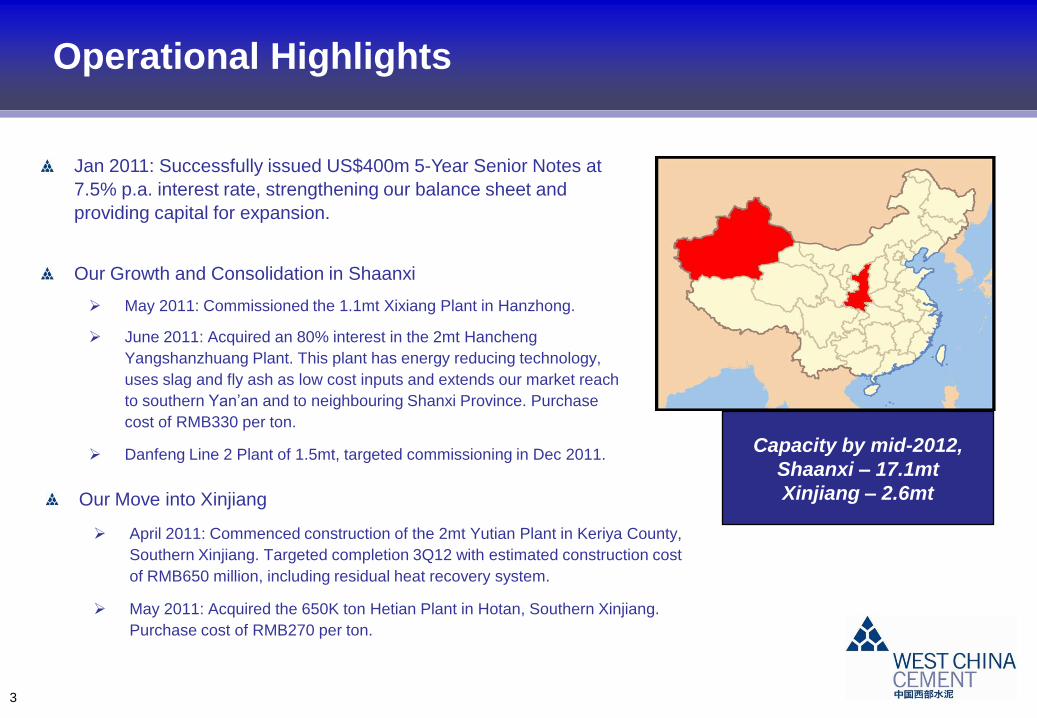
Jan 2011: Successfully issued US$400m 5-Year Senior Notes at
7.5% p.a. interest rate, strengthening our balance sheet and
providing capital for expansion.
Our Growth and Consolidation in Shaanxi
May 2011: Commissioned the 1.1mt Xixiang Plant in Hanzhong.
June 2011: Acquired an 80% interest in the 2mt Hancheng
Yangshanzhuang Plant. This plant has energy reducing technology,
uses slag and fly ash as low cost inputs and extends our market reach
to southern Yan‟an and to neighbouring Shanxi Province. Purchase
cost of RMB330 per ton.
Danfeng Line 2 Plant of 1.5mt, targeted commissioning in Dec 2011.
3
Our Move into Xinjiang
April 2011: Commenced construction of the 2mt Yutian Plant in Keriya County,
Southern Xinjiang. Targeted completion 3Q12 with estimated construction cost
of RMB650 million, including residual heat recovery system.
May 2011: Acquired the 650K ton Hetian Plant in Hotan, Southern Xinjiang.
Purchase cost of RMB270 per ton.
Capacity by mid-2012,
Shaanxi – 17.1mt
Xinjiang – 2.6mt
(continued)Financial Highlights
4
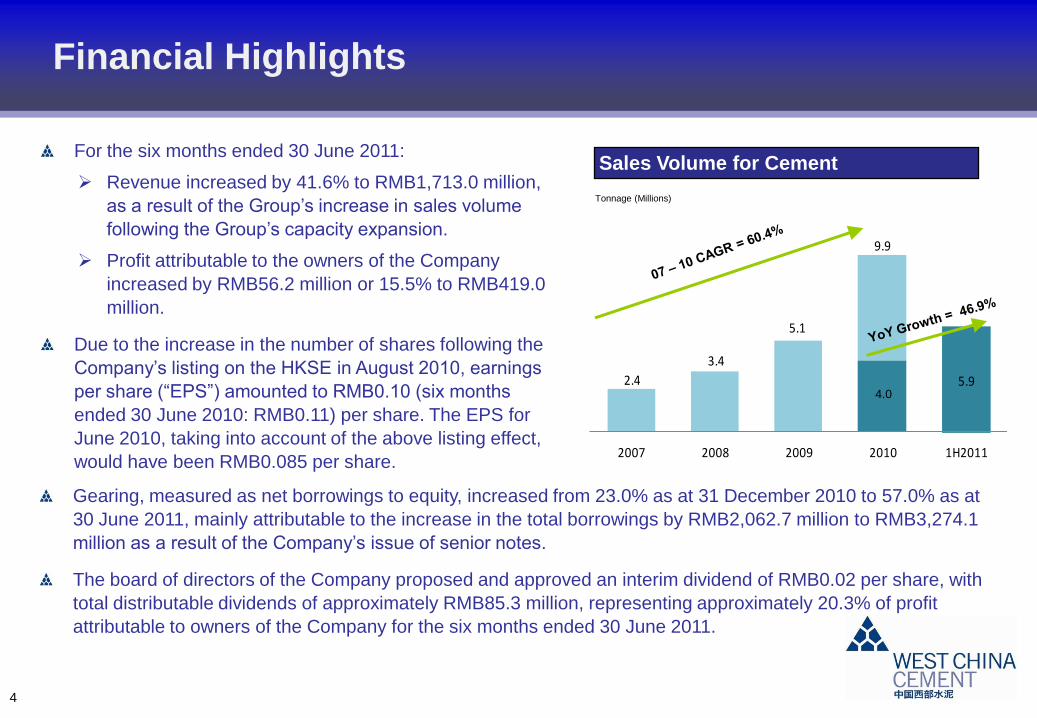
For the six months ended 30 June 2011:
Revenue increased by 41.6% to RMB1,713.0 million,
as a result of the Group‟s increase in sales volume
following the Group‟s capacity expansion.
Profit attributable to the owners of the Company
increased by RMB56.2 million or 15.5% to RMB419.0
million.
Due to the increase in the number of shares following the
Company‟s listing on the HKSE in August 2010, earnings
per share (“EPS”) amounted to RMB0.10 (six months
ended 30 June 2010: RMB0.11) per share. The EPS for
June 2010, taking into account of the above listing effect,
would have been RMB0.085 per share.
2.4
3.4
5.1
9.9
5.9
2007 2008 2009 2010 1H2011
Sales Volume for Cement
Tonnage (Millions)
Gearing, measured as net borrowings to equity, increased from 23.0% as at 31 December 2010 to 57.0% as at
30 June 2011, mainly attributable to the increase in the total borrowings by RMB2,062.7 million to RMB3,274.1
million as a result of the Company‟s issue of senior notes.
The board of directors of the Company proposed and approved an interim dividend of RMB0.02 per share, with
total distributable dividends of approximately RMB85.3 million, representing approximately 20.3% of profit
attributable to owners of the Company for the six months ended 30 June 2011.
4.0
West China Cement Limited
Company Background
5
Company Development
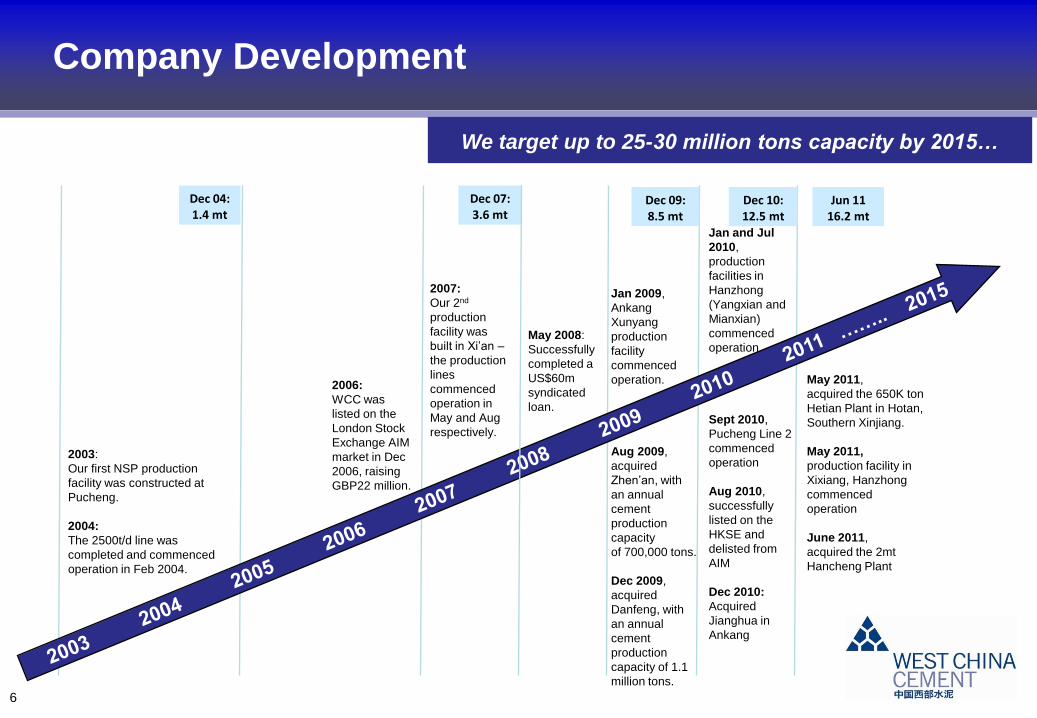
We target up to 25-30 million tons capacity by 2015…
6
Jan and Jul
2010,
production
facilities in
Hanzhong
(Yangxian and
Mianxian)
commenced
operation
Sept 2010,
Pucheng Line 2
commenced
operation
Aug 2010,
successfully
listed on the
HKSE and
delisted from
AIM
Dec 2010:
Acquired
Jianghua in
Ankang
2003:
Our first NSP production
facility was constructed at
Pucheng.
2004:
The 2500t/d line was
completed and commenced
operation in Feb 2004.
2006:
WCC was
listed on the
London Stock
Exchange AIM
market in Dec
2006, raising
GBP22 million.
Jan 2009,
Ankang
Xunyang
production
facility
commenced
operation.
Aug 2009,
acquired
Zhen‟an, with
an annual
cement
production
capacity
of 700,000 tons.
Dec 2009,
acquired
Danfeng, with
an annual
cement
production
capacity of 1.1
million tons.
Dec 04: 1.4 mt
Dec 07: 3.6 mt
Dec 09: 8.5 mt
Dec 10: 12.5 mt
Jun 1116.2 mt
May 2011,
acquired the 650K ton
Hetian Plant in Hotan,
Southern Xinjiang.
May 2011,
production facility in
Xixiang, Hanzhong
commenced
operation
June 2011,
acquired the 2mt
Hancheng Plant
2007:
Our 2nd
production
facility was
built in Xi‟an –
the production
lines
commenced
operation in
May and Aug
respectively.
May 2008:
Successfully
completed a
US$60m
syndicated
loan.
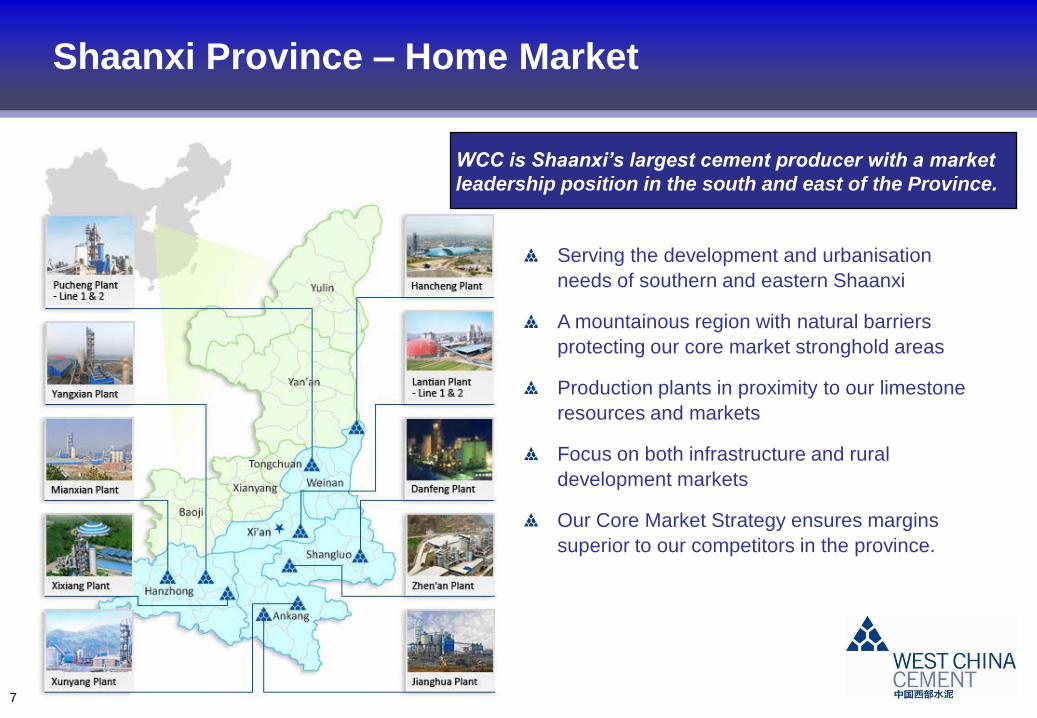
Shaanxi Province – Home Market
Serving the development and urbanisation
needs of southern and eastern Shaanxi
A mountainous region with natural barriers
protecting our core market stronghold areas
Production plants in proximity to our limestone
resources and markets
Focus on both infrastructure and rural
development markets
Our Core Market Strategy ensures margins
superior to our competitors in the province.
7
WCC is Shaanxi’s largest cement producer with a market
leadership position in the south and east of the Province.
Diversifying into New Market - Xinjiang
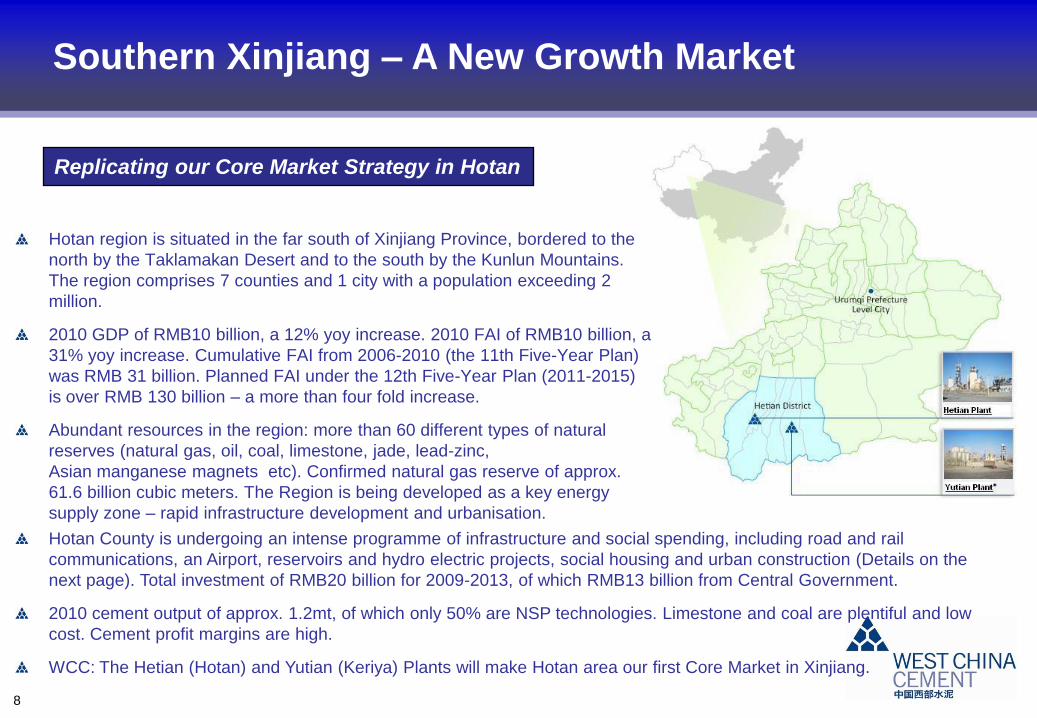
Hotan region is situated in the far south of Xinjiang Province, bordered to the
north by the Taklamakan Desert and to the south by the Kunlun Mountains.
The region comprises 7 counties and 1 city with a population exceeding 2
million.
2010 GDP of RMB10 billion, a 12% yoy increase. 2010 FAI of RMB10 billion, a
31% yoy increase. Cumulative FAI from 2006-2010 (the 11th Five-Year Plan)
was RMB 31 billion. Planned FAI under the 12th Five-Year Plan (2011-2015)
is over RMB 130 billion – a more than four fold increase.
Abundant resources in the region: more than 60 different types of natural
reserves (natural gas, oil, coal, limestone, jade, lead-zinc,
Asian manganese magnets etc). Confirmed natural gas reserve of approx.
61.6 billion cubic meters. The Region is being developed as a key energy
supply zone – rapid infrastructure development and urbanisation.
For the period ended
June 30
Southern Xinjiang – A New Growth Market
8
Replicating our Core Market Strategy in Hotan
Hotan County is undergoing an intense programme of infrastructure and social spending, including road and rail
communications, an Airport, reservoirs and hydro electric projects, social housing and urban construction (Details on the
next page). Total investment of RMB20 billion for 2009-2013, of which RMB13 billion from Central Government.
2010 cement output of approx. 1.2mt, of which only 50% are NSP technologies. Limestone and coal are plentiful and low
cost. Cement profit margins are high.
WCC: The Hetian (Hotan) and Yutian (Keriya) Plants will make Hotan area our first Core Market in Xinjiang.
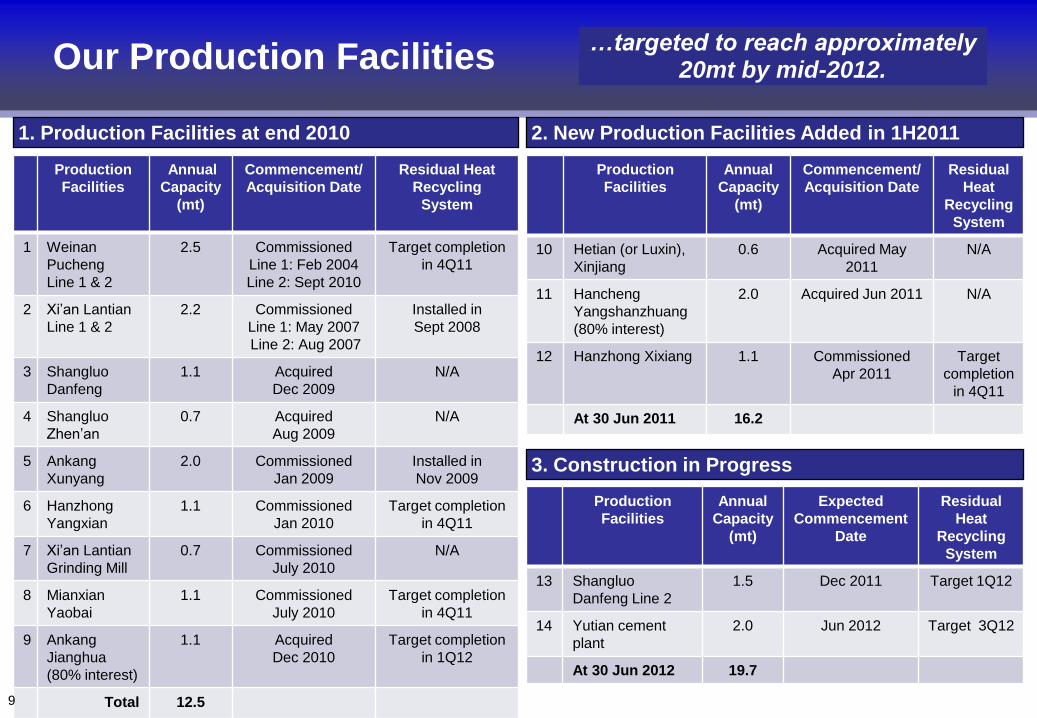
Our Production Facilities
Production
Facilities
Annual
Capacity
(mt)
Commencement/
Acquisition Date
Residual Heat
Recycling
System
1 Weinan
Pucheng
Line 1 & 2
2.5 Commissioned
Line 1: Feb 2004
Line 2: Sept 2010
Target completion
in 4Q11
2 Xi‟an Lantian
Line 1 & 2
2.2 Commissioned
Line 1: May 2007
Line 2: Aug 2007
Installed in
Sept 2008
3 Shangluo
Danfeng
1.1 Acquired
Dec 2009
N/A
4 Shangluo
Zhen‟an
0.7 Acquired
Aug 2009
N/A
5 Ankang
Xunyang
2.0 Commissioned
Jan 2009
Installed in
Nov 2009
6 Hanzhong
Yangxian
1.1 Commissioned
Jan 2010
Target completion
in 4Q11
7 Xi‟an Lantian
Grinding Mill
0.7 Commissioned
July 2010
N/A
8 Mianxian
Yaobai
1.1 Commissioned
July 2010
Target completion
in 4Q11
9 Ankang
Jianghua
(80% interest)
1.1 Acquired
Dec 2010
Target completion
in 1Q12
Total 12.5
1. Production Facilities at end 2010
9
Production
Facilities
Annual
Capacity
(mt)
Commencement/
Acquisition Date
Residual
Heat
Recycling
System
10 Hetian (or Luxin),
Xinjiang
0.6 Acquired May
2011
N/A
11 Hancheng
Yangshanzhuang
(80% interest)
2.0 Acquired Jun 2011 N/A
12 Hanzhong Xixiang 1.1 Commissioned
Apr 2011
Target
completion
in 4Q11
At 30 Jun 2011 16.2
2. New Production Facilities Added in 1H2011
Production
Facilities
Annual
Capacity
(mt)
Expected
Commencement
Date
Residual
Heat
Recycling
System
13 Shangluo
Danfeng Line 2
1.5 Dec 2011 Target 1Q12
14 Yutian cement
plant
2.0 Jun 2012 Target 3Q12
At 30 Jun 2012 19.7
3. Construction in Progress
…targeted to reach approximately 20mt by mid-2012.
West China Cement Limited
Financial Analysis
10
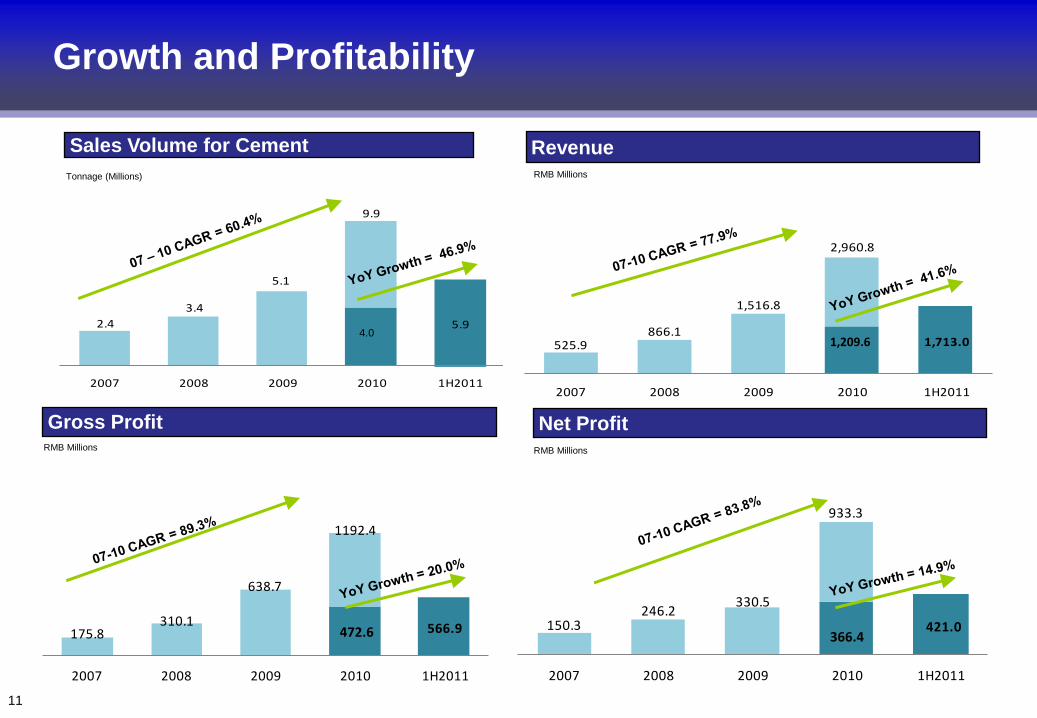
Growth and Profitability
175.8310.1
638.7
1192.4
566.9
2007 2008 2009 2010 1H2011
Gross ProfitRMB Millions
472.6
Net Profit
150.3246.2
330.5
933.3
421.0
2007 2008 2009 2010 1H2011
RMB Millions
366.4
2.4
3.4
5.1
9.9
5.9
2007 2008 2009 2010 1H2011
Sales Volume for Cement
Tonnage (Millions)
4.0
11
Revenue
525.9866.1
1,516.8
2,960.8
1,713.0
2007 2008 2009 2010 1H2011
RMB Millions
1,209.6
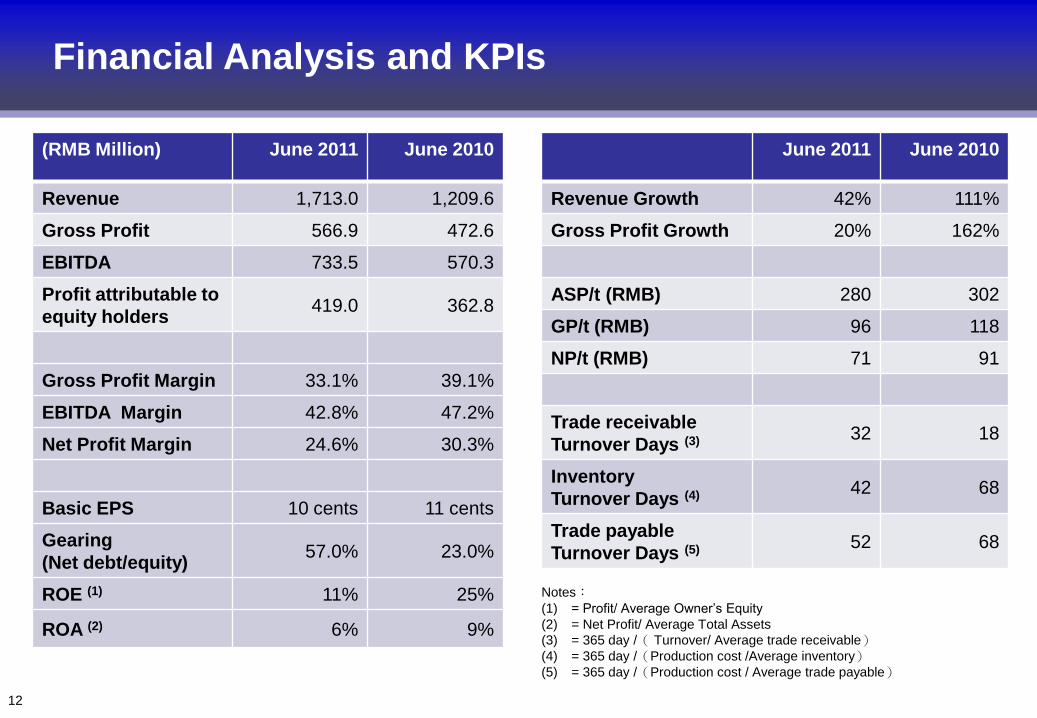
Financial Analysis and KPIs
(RMB Million) June 2011 June 2010
Revenue 1,713.0 1,209.6
Gross Profit 566.9 472.6
EBITDA 733.5 570.3
Profit attributable to
equity holders419.0 362.8
Gross Profit Margin 33.1% 39.1%
EBITDA Margin 42.8% 47.2%
Net Profit Margin 24.6% 30.3%
Basic EPS 10 cents 11 cents
Gearing
(Net debt/equity)57.0% 23.0%
ROE (1) 11% 25%
ROA (2) 6% 9%
12
June 2011 June 2010
Revenue Growth 42% 111%
Gross Profit Growth 20% 162%
ASP/t (RMB) 280 302
GP/t (RMB) 96 118
NP/t (RMB) 71 91
Trade receivable
Turnover Days (3) 32 18
Inventory
Turnover Days (4) 42 68
Trade payable
Turnover Days (5) 52 68
Notes:(1) = Profit/ Average Owner‟s Equity
(2) = Net Profit/ Average Total Assets
(3) = 365 day /( Turnover/ Average trade receivable)(4) = 365 day /(Production cost /Average inventory)(5) = 365 day /(Production cost / Average trade payable)
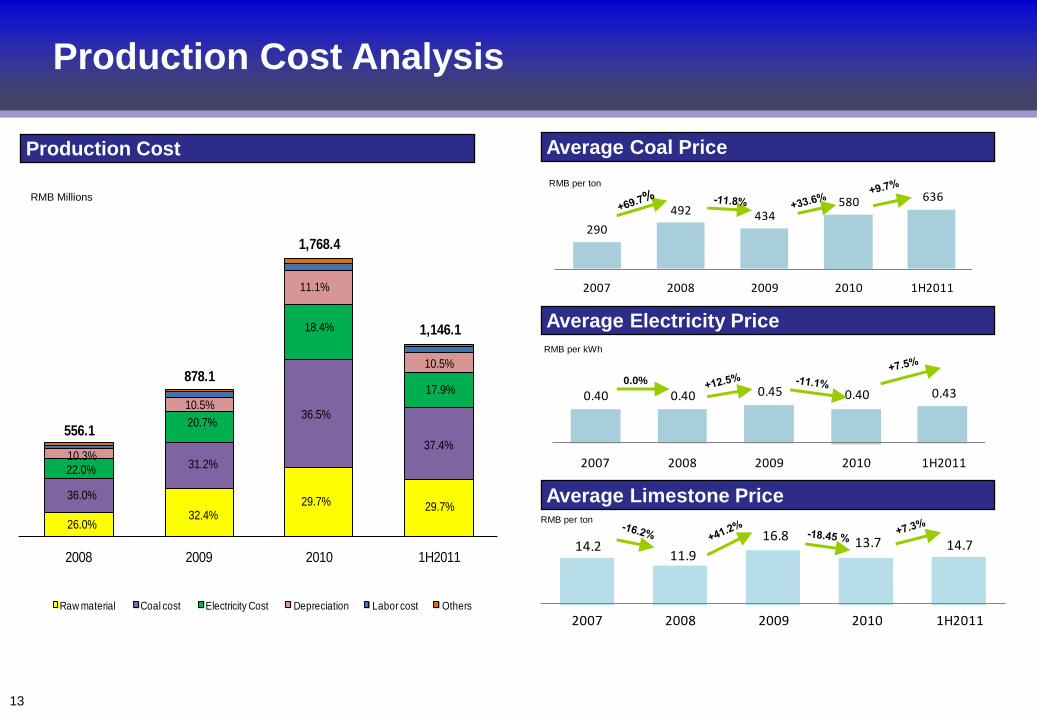
Production Cost Analysis
556.1
878.1
1,768.4
2008 2009 2010 1H2011
Raw material Coal cost Electricity Cost Depreciation Labor cost Others
31.2%
26.0%
22.0%
31.2%
29.7%
18.4%
10.3%
10.5%
36.0%
32.4%
20.7%36.5%
18.4%
11.1%
29.7%
37.4%
17.9%
10.5%
1,146.1
Production Cost
RMB Millions
13
Average Coal Price
290
492 434580 636
2007 2008 2009 2010 1H2011
RMB per ton
Average Electricity Price
RMB per kWh
0.40 0.40 0.45 0.40 0.43
2007 2008 2009 2010 1H2011
Average Limestone Price
14.211.9
16.8 13.7 14.7
2007 2008 2009 2010 1H2011
RMB per ton
0.0%
West China Cement Limited
Market and Outlook
14
September Rain: Highest rainfall in 50 years in Shaanxi has led to inventory buildup at all producers. October
will be spent clearing this inventory at current prices, with possible price pick ups in November.
Current Demand: Although some national infrastructure projects (e.g. High Speed Railway construction) are on
hold, we are seeing obvious demand pick up in the South of Shaanxi. The Southern Shaanxi Resettlement
Project (approx. annual demand 1.2-1.4m tons); the Hanjiang to Weihe River Water Transport Project (approx
annual demand 400,000 tons) and the Ankang to Pingli Road (approx. total demand 4-500,000 tons) all started
construction in October after the rains.
Current Supply: There are signs that the rain affected 3Q has accelerated the industry rationalisation process.
2 out of 3 small plants next to our Weinan Hancheng Plant have closed. Small plants in Hanzhong are closing.
Producers in Baoji District are making little or no cash profits and signs of rational behavior amongst the industry
players are becoming apparent.
Future Supply: We see net capacity additions of less than 5m tons in 2011-12 in Shaanxi. WCC is completing
its Danfeng Line 2 plant (1.5m tons) by year end. Conch and Jidong are both building 2m ton plants with
licences acquired as part of recent M&A, but these recent acquisitions do include some backward or borderline
capacity slated for closure.
WCC’s margins in the south have remained defendable. WCC is making Rmb70-80 gross margin per ton
whilst our peers in the Baoji are making Rmb0-25 gross per ton.
Shaanxi Cement Market – Near Term Outlook
15
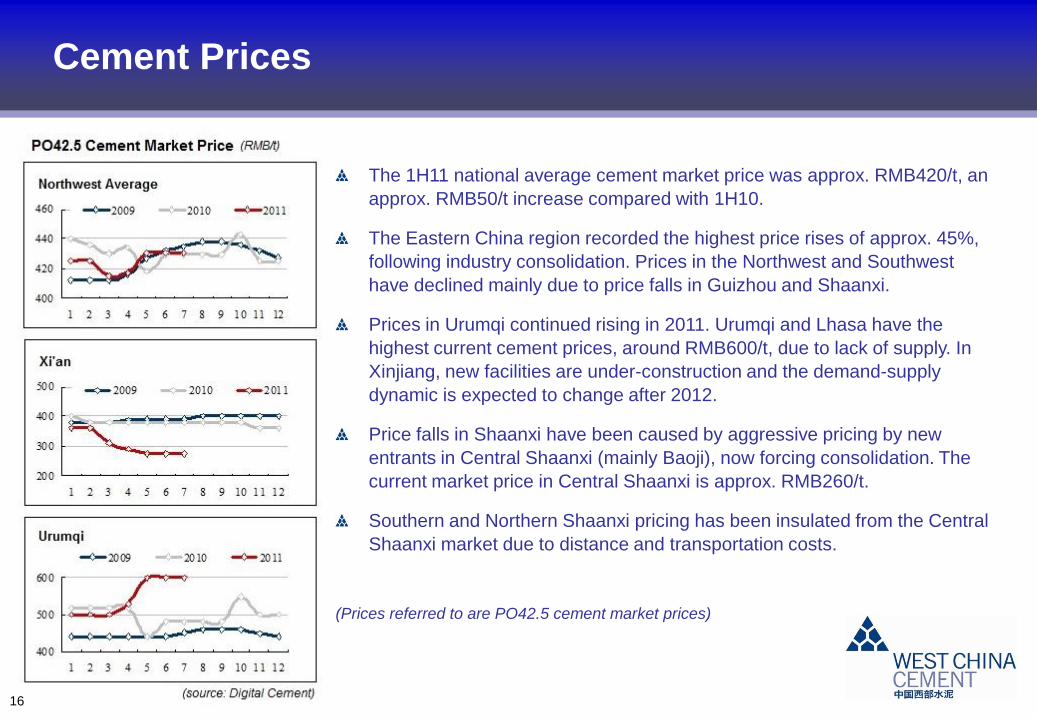
Cement Prices
The 1H11 national average cement market price was approx. RMB420/t, an
approx. RMB50/t increase compared with 1H10.
The Eastern China region recorded the highest price rises of approx. 45%,
following industry consolidation. Prices in the Northwest and Southwest
have declined mainly due to price falls in Guizhou and Shaanxi.
Prices in Urumqi continued rising in 2011. Urumqi and Lhasa have the
highest current cement prices, around RMB600/t, due to lack of supply. In
Xinjiang, new facilities are under-construction and the demand-supply
dynamic is expected to change after 2012.
Price falls in Shaanxi have been caused by aggressive pricing by new
entrants in Central Shaanxi (mainly Baoji), now forcing consolidation. The
current market price in Central Shaanxi is approx. RMB260/t.
Southern and Northern Shaanxi pricing has been insulated from the Central
Shaanxi market due to distance and transportation costs.
(Prices referred to are PO42.5 cement market prices)
16
Shaanxi Cement – Capacity and Pricing
17
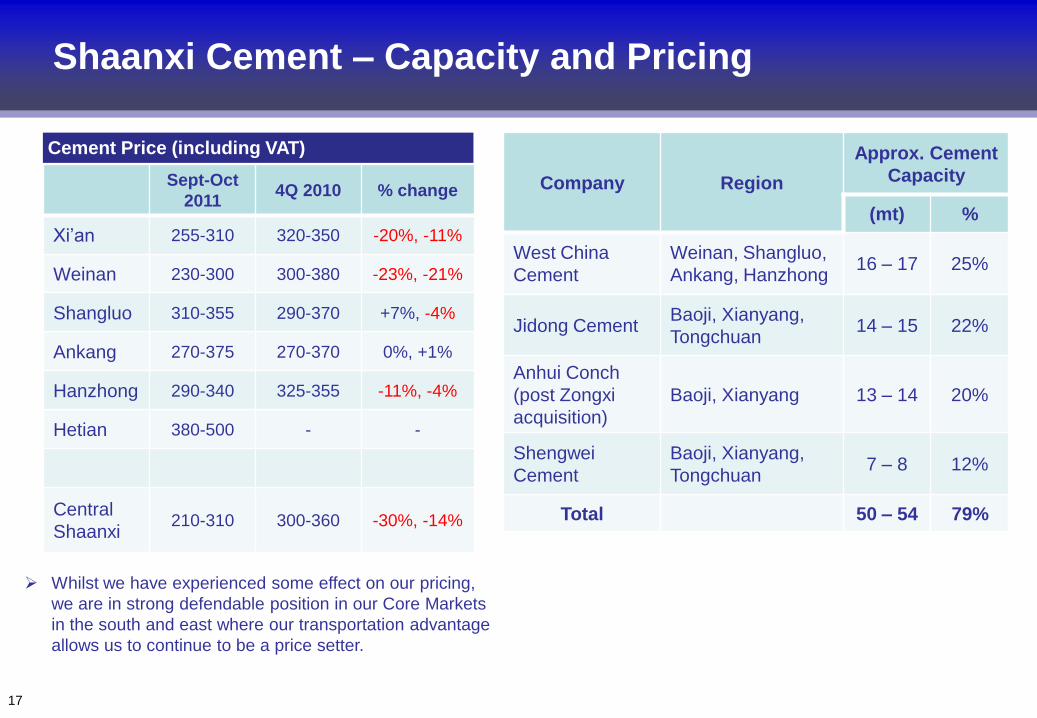
Cement Price (including VAT)
Sept-Oct
20114Q 2010 % change
Xi‟an 255-310 320-350 -20%, -11%
Weinan 230-300 300-380 -23%, -21%
Shangluo 310-355 290-370 +7%, -4%
Ankang 270-375 270-370 0%, +1%
Hanzhong 290-340 325-355 -11%, -4%
Hetian 380-500 - -
Central
Shaanxi210-310 300-360 -30%, -14%
Company Region
Approx. Cement
Capacity
(mt) %
West China
Cement
Weinan, Shangluo,
Ankang, Hanzhong16 – 17 25%
Jidong CementBaoji, Xianyang,
Tongchuan14 – 15 22%
Anhui Conch
(post Zongxi
acquisition)
Baoji, Xianyang 13 – 14 20%
Shengwei
Cement
Baoji, Xianyang,
Tongchuan7 – 8 12%
Total 50 – 54 79%
Whilst we have experienced some effect on our pricing,
we are in strong defendable position in our Core Markets
in the south and east where our transportation advantage
allows us to continue to be a price setter.
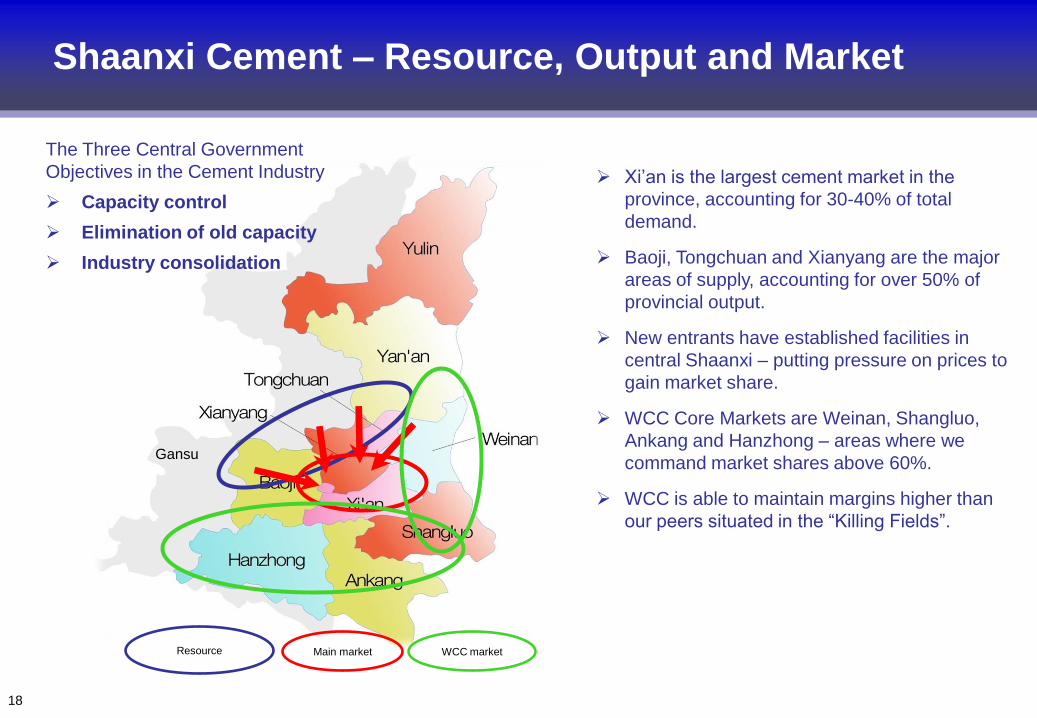
Shaanxi Cement – Resource, Output and Market
18
Gansu
Resource Main market WCC market
Xi‟an is the largest cement market in the
province, accounting for 30-40% of total
demand.
Baoji, Tongchuan and Xianyang are the major
areas of supply, accounting for over 50% of
provincial output.
New entrants have established facilities in
central Shaanxi – putting pressure on prices to
gain market share.
WCC Core Markets are Weinan, Shangluo,
Ankang and Hanzhong – areas where we
command market shares above 60%.
WCC is able to maintain margins higher than
our peers situated in the “Killing Fields”.
The Three Central Government
Objectives in the Cement Industry
Capacity control
Elimination of old capacity
Industry consolidation
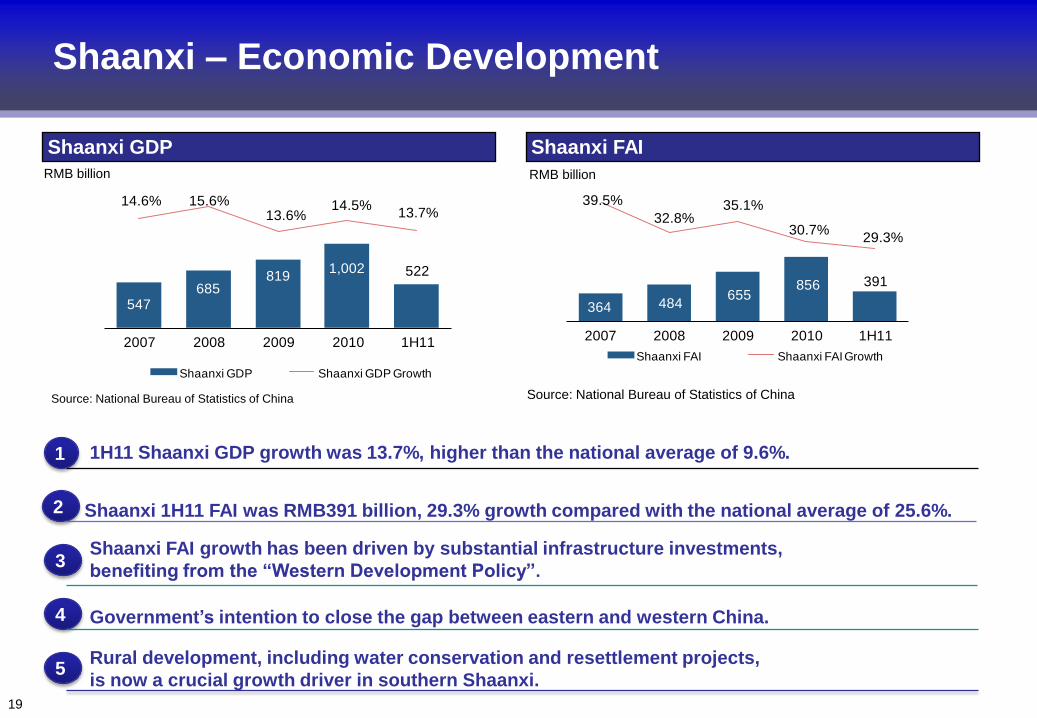
Shaanxi – Economic Development
547685
8191,002 522
14.6% 15.6% 13.6%
14.5% 13.7%
5%
6%
7%
8%
9%
10%
11%
12%
13%
14%
15%
16%
-10
10
30
50
70
90
110
130
150
2007 2008 2009 2010 1H11
Shaanxi GDP Shaanxi GDP Growth
Shaanxi GDP
RMB billion
Source: National Bureau of Statistics of China
364 484655
856 391
39.5%
32.8% 35.1%
30.7% 29.3%
13%14%15%16%17%18%19%20%21%22%23%24%25%26%27%28%29%30%31%32%33%34%35%36%37%38%39%40%
0
200
400
600
800
1,000
1,200
1,400
1,600
2007 2008 2009 2010 1H11
Shaanxi FAI Shaanxi FAI Growth
Shaanxi FAI
RMB billion
Source: National Bureau of Statistics of China
Shaanxi FAI growth has been driven by substantial infrastructure investments,
benefiting from the “Western Development Policy”.
Government’s intention to close the gap between eastern and western China.
1H11 Shaanxi GDP growth was 13.7%, higher than the national average of 9.6%.
Rural development, including water conservation and resettlement projects,
is now a crucial growth driver in southern Shaanxi.
4
3
1
5
2 Shaanxi 1H11 FAI was RMB391 billion, 29.3% growth compared with the national average of 25.6%.
19
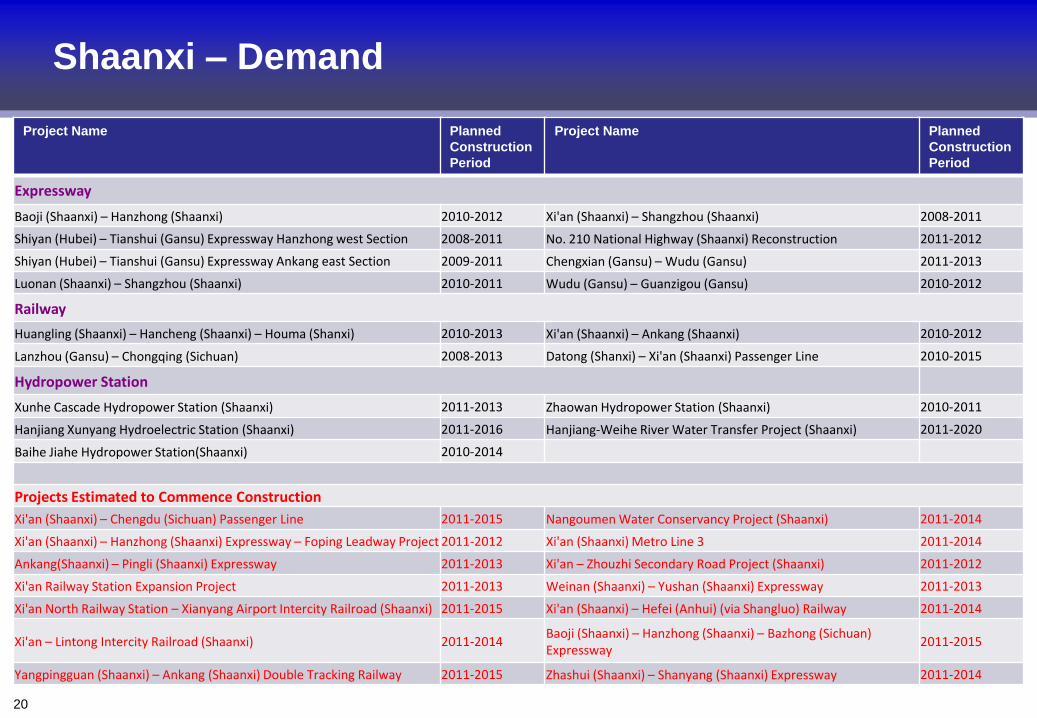
Shaanxi – Demand
Project Name Planned
Construction
Period
Project Name Planned
Construction
Period
Expressway
Baoji (Shaanxi) – Hanzhong (Shaanxi) 2010-2012 Xi'an (Shaanxi) – Shangzhou (Shaanxi) 2008-2011
Shiyan (Hubei) – Tianshui (Gansu) Expressway Hanzhong west Section 2008-2011 No. 210 National Highway (Shaanxi) Reconstruction 2011-2012
Shiyan (Hubei) – Tianshui (Gansu) Expressway Ankang east Section 2009-2011 Chengxian (Gansu) – Wudu (Gansu) 2011-2013
Luonan (Shaanxi) – Shangzhou (Shaanxi) 2010-2011 Wudu (Gansu) – Guanzigou (Gansu) 2010-2012
Railway
Huangling (Shaanxi) – Hancheng (Shaanxi) – Houma (Shanxi) 2010-2013 Xi'an (Shaanxi) – Ankang (Shaanxi) 2010-2012
Lanzhou (Gansu) – Chongqing (Sichuan) 2008-2013 Datong (Shanxi) – Xi'an (Shaanxi) Passenger Line 2010-2015
Hydropower Station
Xunhe Cascade Hydropower Station (Shaanxi) 2011-2013 Zhaowan Hydropower Station (Shaanxi) 2010-2011
Hanjiang Xunyang Hydroelectric Station (Shaanxi) 2011-2016 Hanjiang-Weihe River Water Transfer Project (Shaanxi) 2011-2020
Baihe Jiahe Hydropower Station(Shaanxi) 2010-2014
Projects Estimated to Commence Construction
Xi'an (Shaanxi) – Chengdu (Sichuan) Passenger Line 2011-2015 Nangoumen Water Conservancy Project (Shaanxi) 2011-2014
Xi'an (Shaanxi) – Hanzhong (Shaanxi) Expressway – Foping Leadway Project 2011-2012 Xi'an (Shaanxi) Metro Line 3 2011-2014
Ankang(Shaanxi) – Pingli (Shaanxi) Expressway 2011-2013 Xi'an – Zhouzhi Secondary Road Project (Shaanxi) 2011-2012
Xi'an Railway Station Expansion Project 2011-2013 Weinan (Shaanxi) – Yushan (Shaanxi) Expressway 2011-2013
Xi'an North Railway Station – Xianyang Airport Intercity Railroad (Shaanxi) 2011-2015 Xi'an (Shaanxi) – Hefei (Anhui) (via Shangluo) Railway 2011-2014
Xi'an – Lintong Intercity Railroad (Shaanxi) 2011-2014Baoji (Shaanxi) – Hanzhong (Shaanxi) – Bazhong (Sichuan) Expressway
2011-2015
Yangpingguan (Shaanxi) – Ankang (Shaanxi) Double Tracking Railway 2011-2015 Zhashui (Shaanxi) – Shanyang (Shaanxi) Expressway 2011-2014
20
Shaanxi – Demand
21
In our Core Market in the south, we have recently been named the primary cement supplier for the Southern Shaanxi
Resettlement Project (陝南移民搬遷工程).
• This project aims to resettle approximately 2.4 million people in Hanzhong, Ankang and Shangluo regions,
(approximately a quarter of the total population in these regions), over the next 10 years, from 2011 to 2020.
• Total investment is over RMB110 billion and the expected cement consumption will be about 12-14 million tons.
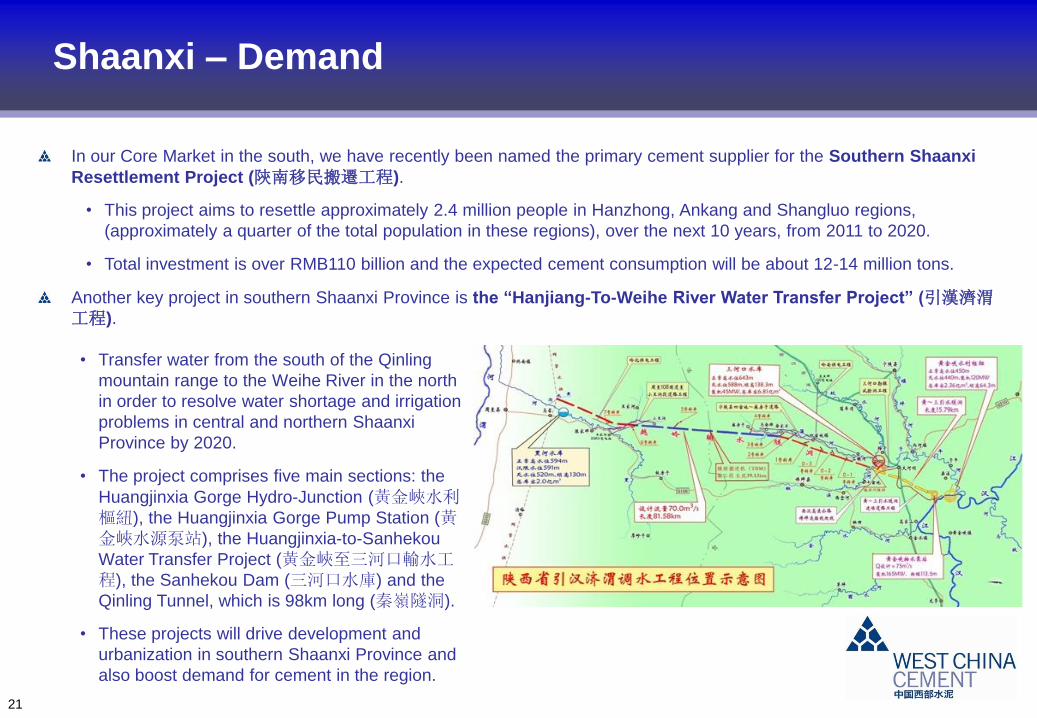
Another key project in southern Shaanxi Province is the “Hanjiang-To-Weihe River Water Transfer Project” (引漢濟渭工程).
• Transfer water from the south of the Qinling
mountain range to the Weihe River in the north
in order to resolve water shortage and irrigation
problems in central and northern Shaanxi
Province by 2020.
• The project comprises five main sections: the
Huangjinxia Gorge Hydro-Junction (黃金峽水利樞紐), the Huangjinxia Gorge Pump Station (黃金峽水源泵站), the Huangjinxia-to-Sanhekou
Water Transfer Project (黃金峽至三河口輸水工程), the Sanhekou Dam (三河口水庫) and the
Qinling Tunnel, which is 98km long (秦嶺隧洞).
• These projects will drive development and
urbanization in southern Shaanxi Province and
also boost demand for cement in the region.
Xinjiang – Economic Development
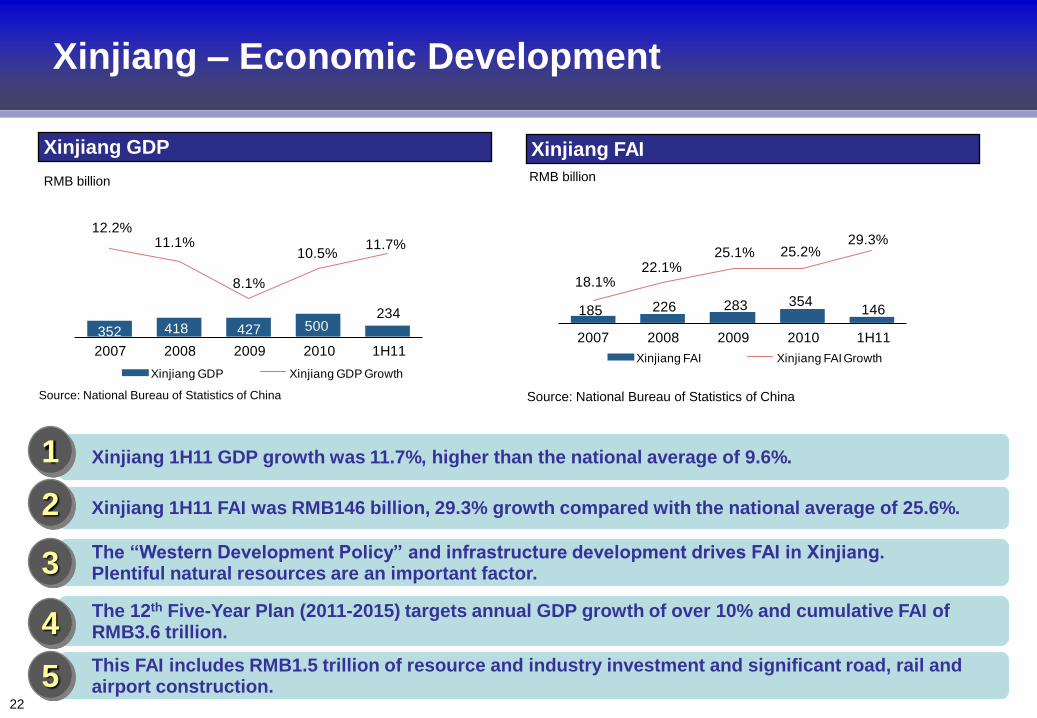
352 418 427 500234
12.2% 11.1%
8.1%
10.5%11.7%
5%
6%
7%
8%
9%
10%
11%
12%
13%
14%
15%
16%
0
50
100
150
200
250
300
2007 2008 2009 2010 1H11
Xinjiang GDP Xinjiang GDP Growth
Xinjiang GDP
RMB billion
Source: National Bureau of Statistics of China
185 226 283 354146
18.1%22.1%
25.1% 25.2%29.3%
13%14%15%16%17%18%19%20%21%22%23%24%25%26%27%28%29%30%31%32%33%34%35%36%37%38%39%40%
0
50
100
150
200
250
300
2007 2008 2009 2010 1H11
Xinjiang FAI Xinjiang FAI Growth
Xinjiang FAI
RMB billion
Source: National Bureau of Statistics of China
22
Xinjiang 1H11 GDP growth was 11.7%, higher than the national average of 9.6%.1
Xinjiang 1H11 FAI was RMB146 billion, 29.3% growth compared with the national average of 25.6%.2
The “Western Development Policy” and infrastructure development drives FAI in Xinjiang. Plentiful natural resources are an important factor.
The 12th Five-Year Plan (2011-2015) targets annual GDP growth of over 10% and cumulative FAI of RMB3.6 trillion.
This FAI includes RMB1.5 trillion of resource and industry investment and significant road, rail and airport construction.
3
4
5
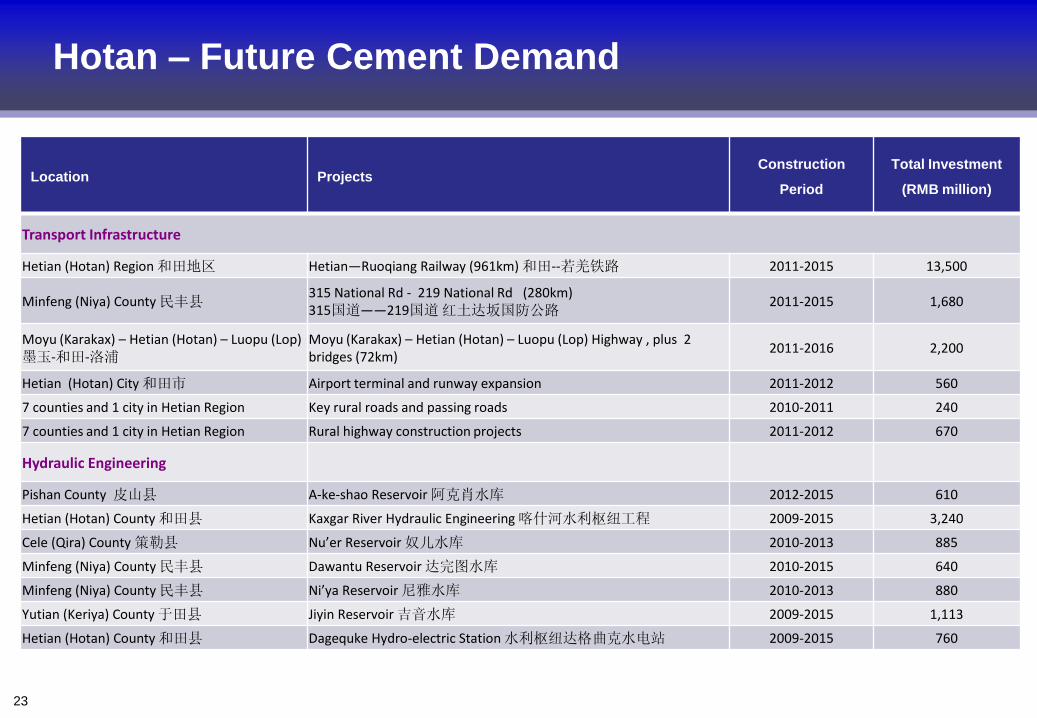
Hotan – Future Cement Demand
Location ProjectsConstruction
Period
Total Investment
(RMB million)
Transport Infrastructure
Hetian (Hotan) Region 和田地区 Hetian—Ruoqiang Railway (961km) 和田--若羌铁路 2011-2015 13,500
Minfeng (Niya) County 民丰县315 National Rd - 219 National Rd (280km) 315国道——219国道红土达坂国防公路
2011-2015 1,680
Moyu (Karakax) – Hetian (Hotan) – Luopu (Lop) 墨玉-和田-洛浦
Moyu (Karakax) – Hetian (Hotan) – Luopu (Lop) Highway , plus 2 bridges (72km)
2011-2016 2,200
Hetian (Hotan) City 和田市 Airport terminal and runway expansion 2011-2012 560
7 counties and 1 city in Hetian Region Key rural roads and passing roads 2010-2011 240
7 counties and 1 city in Hetian Region Rural highway construction projects 2011-2012 670
Hydraulic Engineering
Pishan County 皮山县 A-ke-shao Reservoir 阿克肖水库 2012-2015 610
Hetian (Hotan) County 和田县 Kaxgar River Hydraulic Engineering 喀什河水利枢纽工程 2009-2015 3,240
Cele (Qira) County 策勒县 Nu’er Reservoir 奴儿水库 2010-2013 885
Minfeng (Niya) County 民丰县 Dawantu Reservoir 达完图水库 2010-2015 640
Minfeng (Niya) County 民丰县 Ni’ya Reservoir 尼雅水库 2010-2013 880
Yutian (Keriya) County 于田县 Jiyin Reservoir 吉音水库 2009-2015 1,113
Hetian (Hotan) County 和田县 Dagequke Hydro-electric Station 水利枢纽达格曲克水电站 2009-2015 760
23
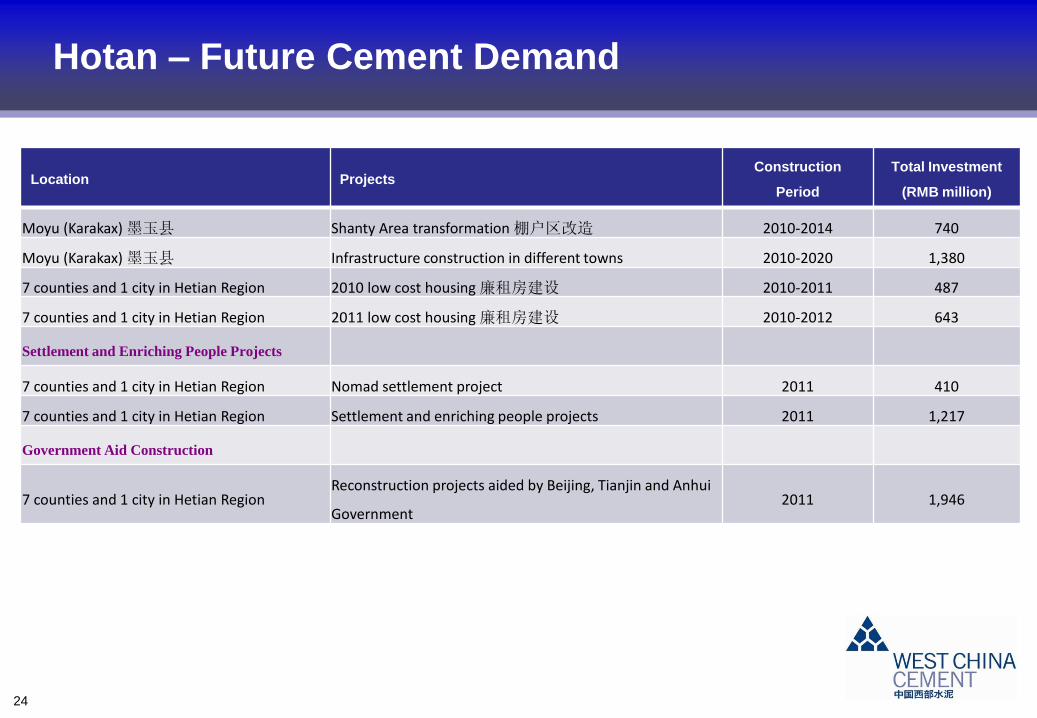
Location ProjectsConstruction
Period
Total Investment
(RMB million)
Moyu (Karakax) 墨玉县 Shanty Area transformation 棚户区改造 2010-2014 740
Moyu (Karakax) 墨玉县 Infrastructure construction in different towns 2010-2020 1,380
7 counties and 1 city in Hetian Region 2010 low cost housing 廉租房建设 2010-2011 487
7 counties and 1 city in Hetian Region 2011 low cost housing 廉租房建设 2010-2012 643
Settlement and Enriching People Projects
7 counties and 1 city in Hetian Region Nomad settlement project 2011 410
7 counties and 1 city in Hetian Region Settlement and enriching people projects 2011 1,217
Government Aid Construction
7 counties and 1 city in Hetian RegionReconstruction projects aided by Beijing, Tianjin and Anhui
Government2011 1,946
Hotan – Future Cement Demand
24
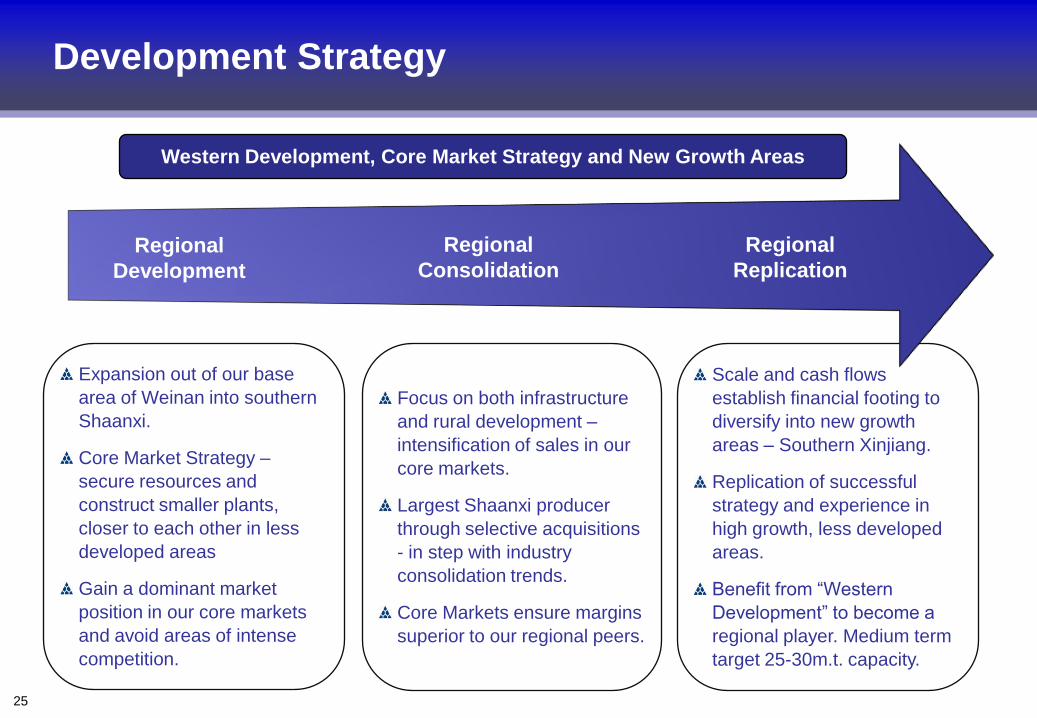
Development Strategy
Western Development, Core Market Strategy and New Growth Areas
Expansion out of our base
area of Weinan into southern
Shaanxi.
Core Market Strategy –
secure resources and
construct smaller plants,
closer to each other in less
developed areas
Gain a dominant market
position in our core markets
and avoid areas of intense
competition.
Focus on both infrastructure
and rural development –
intensification of sales in our
core markets.
Largest Shaanxi producer
through selective acquisitions
- in step with industry
consolidation trends.
Core Markets ensure margins
superior to our regional peers.
Scale and cash flows
establish financial footing to
diversify into new growth
areas – Southern Xinjiang.
Replication of successful
strategy and experience in
high growth, less developed
areas.
Benefit from “Western
Development” to become a
regional player. Medium term
target 25-30m.t. capacity.
25
Regional
Development
Regional
Consolidation
Regional
Replication
West China Cement Limited
Appendices
26
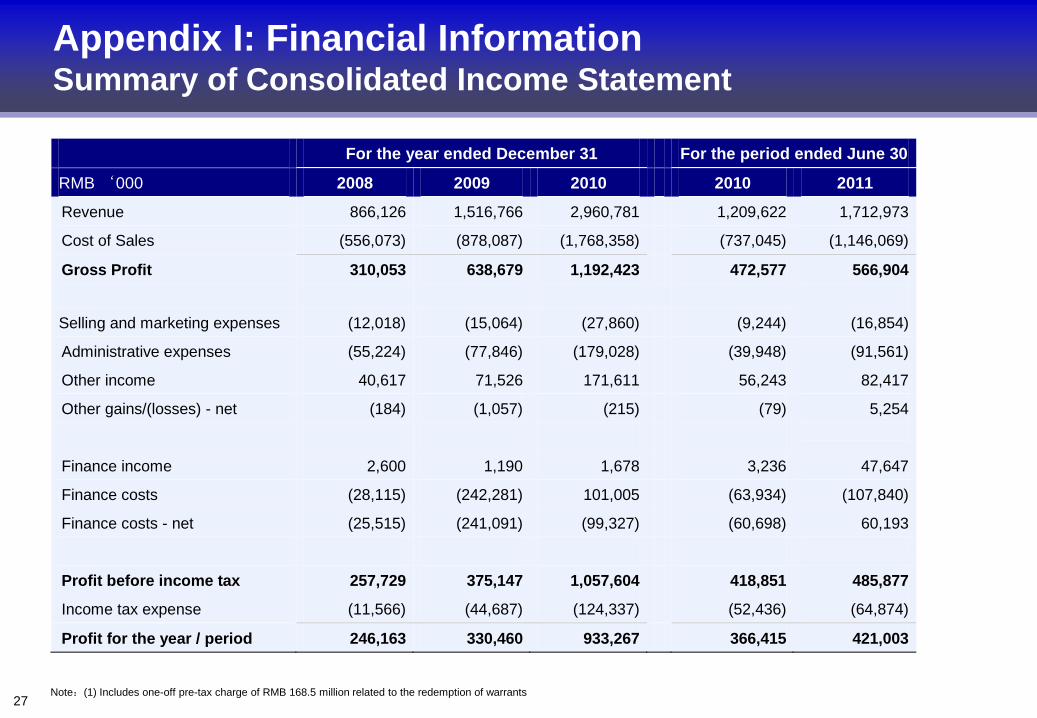
Appendix I: Financial Information Summary of Consolidated Income Statement
Note:(1) Includes one-off pre-tax charge of RMB 168.5 million related to the redemption of warrants
(1)
For the year ended December 31 For the period ended June 30
RMB ‘000 2008 2009 2010 2010 2011
Revenue 866,126 1,516,766 2,960,781 1,209,622 1,712,973
Cost of Sales (556,073) (878,087) (1,768,358) (737,045) (1,146,069)
Gross Profit 310,053 638,679 1,192,423 472,577 566,904
Selling and marketing expenses (12,018) (15,064) (27,860) (9,244)
(16,854)
Administrative expenses (55,224) (77,846) (179,028) (39,948) (91,561)
Other income 40,617 71,526 171,611 56,243 82,417
Other gains/(losses) - net (184) (1,057) (215) (79) 5,254
Finance income 2,600 1,190 1,678 3,236 47,647
Finance costs (28,115) (242,281) 101,005 (63,934) (107,840)
Finance costs - net (25,515) (241,091) (99,327) (60,698) 60,193
Profit before income tax 257,729 375,147 1,057,604 418,851 485,877
Income tax expense (11,566) (44,687) (124,337) (52,436) (64,874)
Profit for the year / period 246,163 330,460 933,267 366,415 421,003
27
As at December 31
As at June
30
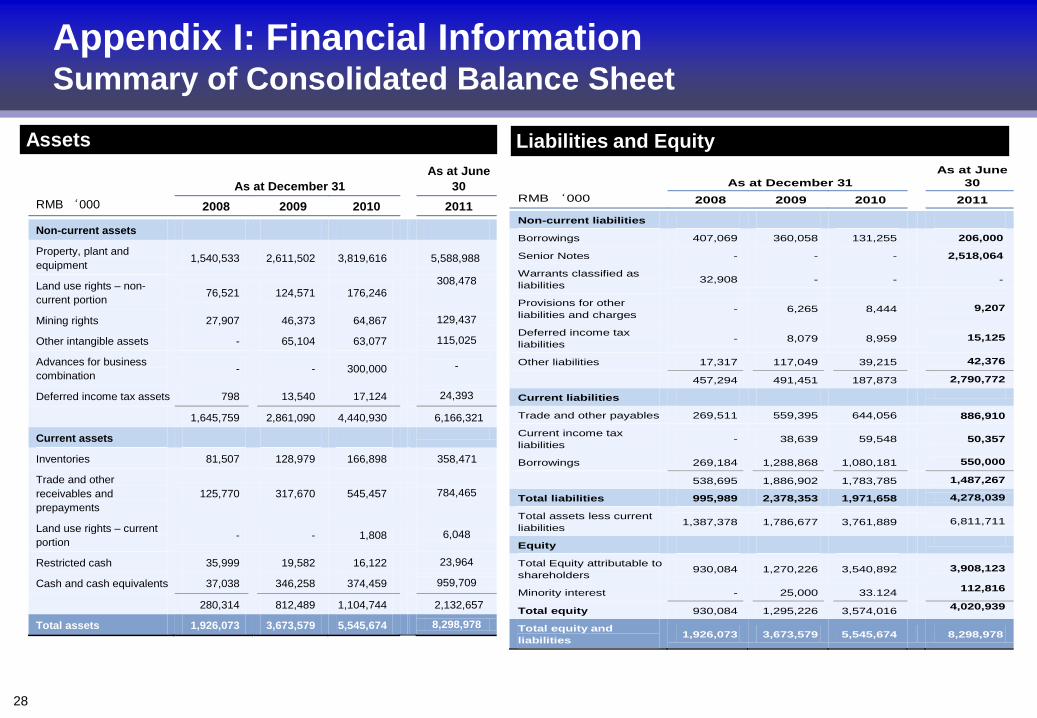
RMB ‘000 2008 2009 2010 2011
Non-current assets
Property, plant and
equipment 1,540,533 2,611,502 3,819,616 5,588,988
Land use rights – non-
current portion 76,521 124,571 176,246
308,478
Mining rights 27,907 46,373 64,867 129,437
Other intangible assets - 65,104 63,077 115,025
Advances for business
combination - - 300,000
-
Deferred income tax assets 798 13,540 17,124 24,393
1,645,759 2,861,090 4,440,930 6,166,321
Current assets
Inventories 81,507 128,979 166,898 358,471
Trade and other
receivables and
prepayments
125,770 317,670 545,457 784,465
Land use rights – current
portion - - 1,808 6,048
Restricted cash 35,999 19,582 16,122 23,964
Cash and cash equivalents 37,038 346,258 374,459 959,709
280,314 812,489 1,104,744 2,132,657
Total assets 1,926,073 3,673,579 5,545,674 8,298,978
Appendix I: Financial Information Summary of Consolidated Balance Sheet
Assets Liabilities and Equity
As at December 31
As at June
30
RMB ‘000 2008 2009 2010 2011
Non-current liabilities
Borrowings 407,069 360,058 131,255 206,000
Senior Notes - - - 2,518,064
Warrants classified as
liabilities 32,908 - - -
Provisions for other
liabilities and charges - 6,265 8,444 9,207
Deferred income tax
liabilities - 8,079 8,959 15,125
Other liabilities 17,317 117,049 39,215 42,376
457,294 491,451 187,873 2,790,772
Current liabilities
Trade and other payables 269,511 559,395 644,056
886,910
Current income tax
liabilities - 38,639 59,548
50,357
Borrowings 269,184 1,288,868 1,080,181 550,000
538,695 1,886,902 1,783,785 1,487,267
Total liabilities 995,989 2,378,353 1,971,658 4,278,039
Total assets less current
liabilities 1,387,378 1,786,677 3,761,889 6,811,711
Equity
Total Equity attributable to
shareholders 930,084 1,270,226 3,540,892 3,908,123
Minority interest - 25,000 33.124 112,816
Total equity 930,084 1,295,226 3,574,016 4,020,939
Total equity and
liabilities 1,926,073 3,673,579 5,545,674 8,298,978
28
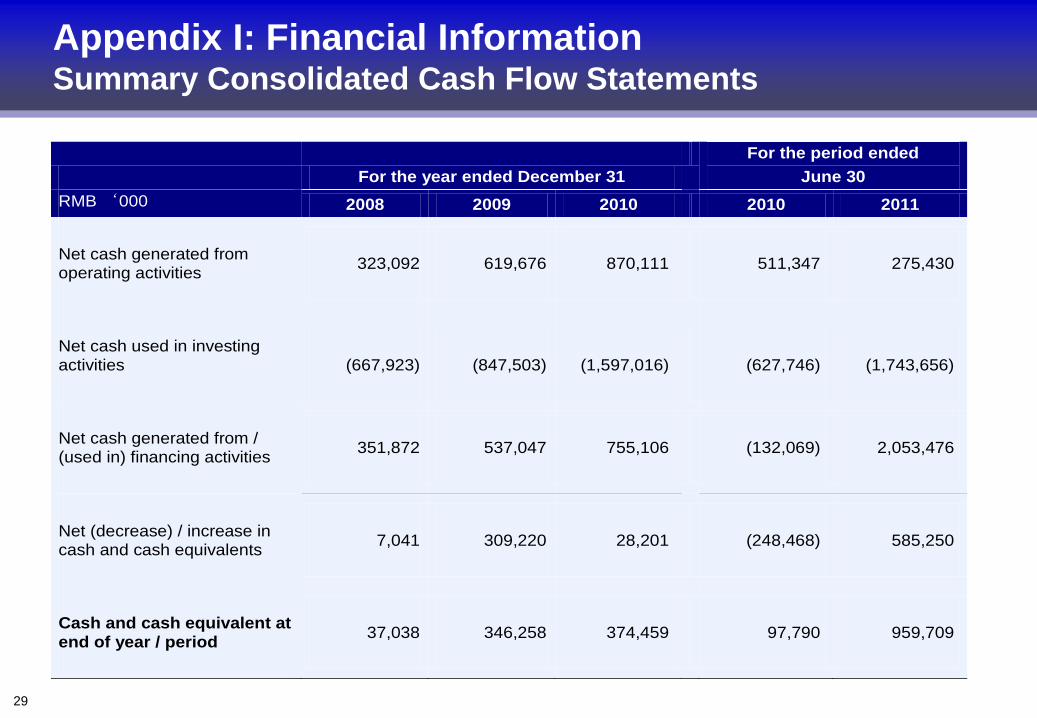
Appendix I: Financial Information Summary Consolidated Cash Flow Statements
For the year ended December 31
For the period ended
June 30
RMB ‘000 2008 2009 2010 2010 2011
Net cash generated from operating activities
323,092 619,676 870,111 511,347 275,430
Net cash used in investing activities (667,923) (847,503) (1,597,016) (627,746) (1,743,656)
Net cash generated from / (used in) financing activities
351,872 537,047 755,106 (132,069) 2,053,476
Net (decrease) / increase in cash and cash equivalents
7,041 309,220 28,201 (248,468) 585,250
Cash and cash equivalent at
end of year / period 37,038 346,258 374,459 97,790 959,709
29
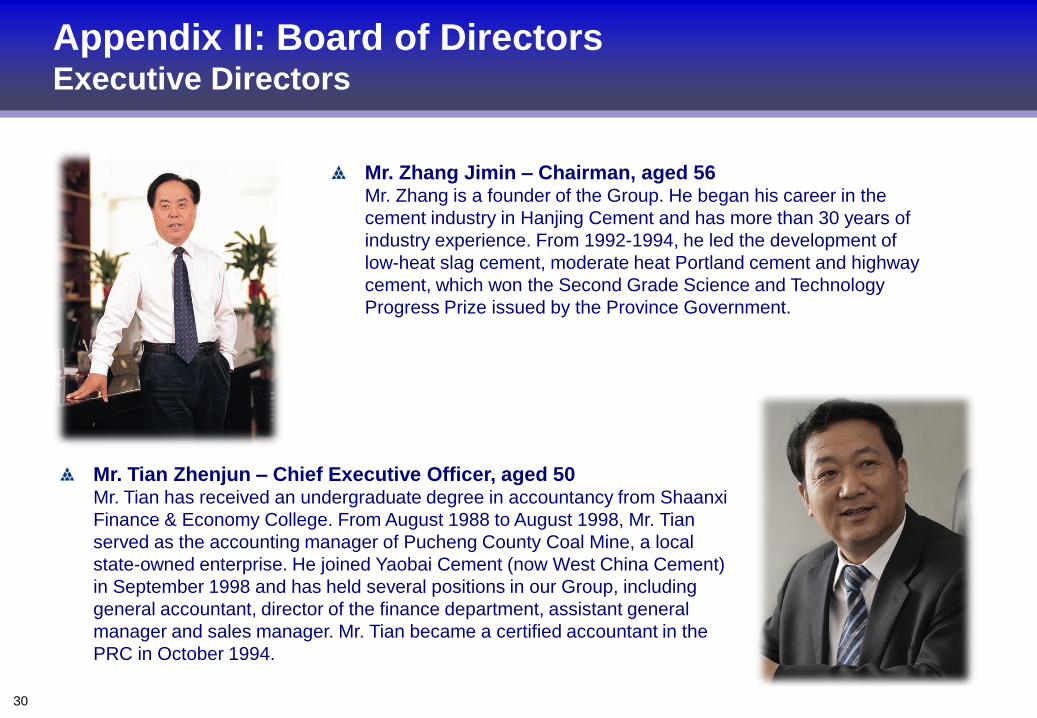
Appendix II: Board of Directors Executive Directors
Mr. Zhang Jimin – Chairman, aged 56Mr. Zhang is a founder of the Group. He began his career in the
cement industry in Hanjing Cement and has more than 30 years of
industry experience. From 1992-1994, he led the development of
low-heat slag cement, moderate heat Portland cement and highway
cement, which won the Second Grade Science and Technology
Progress Prize issued by the Province Government.
Mr. Tian Zhenjun – Chief Executive Officer, aged 50Mr. Tian has received an undergraduate degree in accountancy from Shaanxi
Finance & Economy College. From August 1988 to August 1998, Mr. Tian
served as the accounting manager of Pucheng County Coal Mine, a local
state-owned enterprise. He joined Yaobai Cement (now West China Cement)
in September 1998 and has held several positions in our Group, including
general accountant, director of the finance department, assistant general
manager and sales manager. Mr. Tian became a certified accountant in the
PRC in October 1994.
30
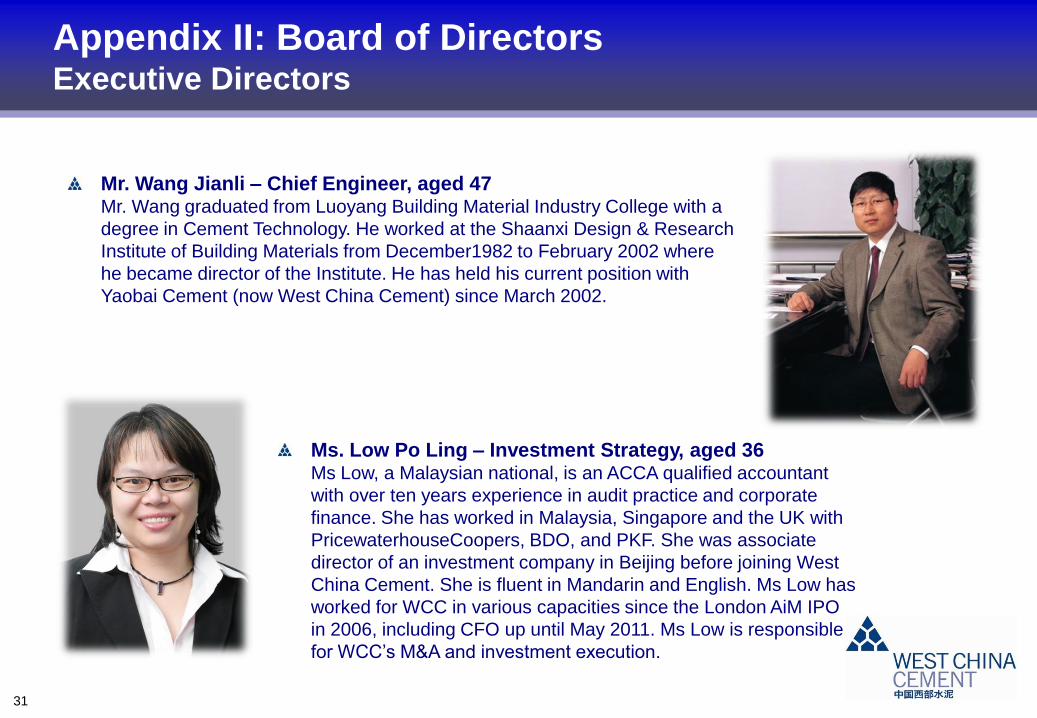
Appendix II: Board of Directors Executive Directors
Mr. Wang Jianli – Chief Engineer, aged 47Mr. Wang graduated from Luoyang Building Material Industry College with a
degree in Cement Technology. He worked at the Shaanxi Design & Research
Institute of Building Materials from December1982 to February 2002 where
he became director of the Institute. He has held his current position with
Yaobai Cement (now West China Cement) since March 2002.
Ms. Low Po Ling – Investment Strategy, aged 36Ms Low, a Malaysian national, is an ACCA qualified accountant
with over ten years experience in audit practice and corporate
finance. She has worked in Malaysia, Singapore and the UK with
PricewaterhouseCoopers, BDO, and PKF. She was associate
director of an investment company in Beijing before joining West
China Cement. She is fluent in Mandarin and English. Ms Low has
worked for WCC in various capacities since the London AiM IPO
in 2006, including CFO up until May 2011. Ms Low is responsible
for WCC‟s M&A and investment execution.
31
Appendix II: Board of Directors Non-Executive Directors
Mr. Lee Kong Wai Conway – Independent Non-executive Director, aged 56
Mr. Lee received a bachelor‟s degree in arts from Kingston University (formerly known as Kingston Polytechnic) in London and further obtained his
postgraduate diploma in business from Curtin University of Technology in Australia. Mr. Lee served as a partner of Ernst & Young over the past 29 years
and held key leadership positions in the development of such firm in China. Mr. Lee is a member of the ICAEW, the ICA in Australia, the ACCA, the Hong
Kong ICPA and the Macau Society of Registered Accountants. Mr. Lee currently also serves as an independent non-executive director of China Taiping
Insurance Holdings Company Limited and Chaowei Power Holdings Limited, companies listed on the Main Board of the Stock Exchange since October
2009 and July 2010, respectively, and Sino Vanadium Inc., a company listed on the TSX Venture Exchange in Canada since October 2009. Mr. Lee was
appointed as a member of the Chinese People‟s Political Consultative Conference of Hunan Province in China since 2007.
Mr. Tam King Ching Kenny – Independent Non-executive Director, aged 62
Mr. Tam received a bachelor‟s degree in commerce from the Concordia University in. He is a practising CPA in Hong Kong. He is a fellow member of the
Hong Kong ICPA and a member of the ICA of Ontario, Canada. Mr. Tam is serving as a member of the Ethics Committee and Practice Review committee in
the Hong Kong ICPA. He is also a past president of The Society of Chinese Accountants and Auditors. Mr. Tam also serves as an independent non-
executive director of five other listed companies on the Main Board of the Stock Exchange, namely, Kingmaker Footwear Holdings Limited, CCT Telecom
Holdings Limited, Shougang Concord Grand (Group) Limited, Starlite Holdings Limited and Van Shung Chong Holdings Limited since May 1994, December
1999, February 1996, July 2004 and September 2004, respectively, and a listed company on the GEM board of the Stock Exchange, namely, North Asia
Strategic Holdings Limited, since September 2004. He was also an independent non-executive director of King Stone Energy Group Limited (formerly
known as Yun Sky Chemical (International) Holdings Limited), a listed company on the Main Board of the Stock Exchange, during the period from August
2005 to September 2008.
Mr. Wong Kun Kau – Independent Non-executive Director, aged 50
Mr. Wong received a bachelor „s degree in social sciences from the University of Hong Kong. He has 28 years of experience in fund management, securities
broking and corporate financing involving securities origination, underwriting and placing of equities and equity-linked products, mergers and acquisitions,
corporate restructuring and reorganizations and other general corporate advisory activities. Mr. Wong has extensive experience in the Greater China region
markets. He is the founder and currently the managing partner of Bull Capital Partners Ltd, a direct investment fund management company. Before founding
Bull Capital Partners Ltd., Mr. Wong was the head of investment banking (Asia) of BNP Paribas Capital (Asia Pacific) Limited from 2002 to 2007.
Mr. Ma Zhaoyang – Non-executive Director, aged 43
Mr. Ma received a master‟s degree in management from Northwestern Polytechnic University. Mr. Ma has been a professor of management at
Northwestern Polytechnic University in Shaanxi, China since 1996. In view of his academic knowledge and extensive experience in strategic planning, Mr.
Ma was appointed an advisory role with us in respect of the overall strategic planning and operation of our business. Mr. Ma has been the chairman and
director of Sino Vanadium Inc., a vanadium mining company listed on the TSX Venture Exchange in Canada since June 2009. He has also been a non-
executive director of Taihua PLC, a pharmaceutical company listed on the LSE, where he assumes an advisory role since December 2006. He is currently
and has been an independent non-executive director of Xi‟an Kaiyuan Holding Group Co., Ltd. (西安開元控股集團股份有限公司), a company listed on the
Shenzhen Stock Exchange which is principally engaged in department store retail businesses and where he assumes an advisory role since May 2006.
32
Contact Us
尧柏特种水泥集团有限公司
中国 陕西省 西安市高新区高新四路1号高科广场A座1903室电话: +86 29 8836 1679
传真: +86 29 8836 1687
WEST CHINA CEMENT LIMITED
YAOBAI SPECIAL CEMENT GROUP CO., LTD
Unit 1903 Gaoke Plaza Tower A, 4th Gaoxin Road
Xi‟an High-Tech Industry Development Zone
Xi‟an, Shaanxi, China
Tel: +86 29 8836 1679
Fax: +86 29 8836 1687
Email: [email protected]
33
Important Disclaimer and Notice to Recipients
This document, which has been prepared by and is the sole responsibility of West China Cement Limited (the “Company”), comprises a presentation
to institutional investors for their information. It does not constitute or form any part of any offer or invitation to issue or sell, or any solicitation of any
offer to subscribe for or purchase, any shares in the Company, nor shall it, or any part of it, or the fact of its distribution form the basis of, or be relied
upon in connection with, any contract or commitment whatsoever.
No reliance may be placed for any purpose whatsoever on the information given to you today or contained in this document or on its completeness. No
representation or warranty, express or implied, is made or given by the directors, officers or employees or any other person as to the fairness, accuracy
or completeness of the information or opinions contained in this document. No person accepts any liability whatsoever for any loss, howsoever arising,
from any use of this document or its contents or otherwise arising in connection herewith.
The presentation slides contain forward-looking statements, including in relation to the Company‟s proposed strategy, plans and objectives. These
forward-looking statements speak only at the date of this presentation. Such forward-looking statements involve known and unknown risks,
uncertainties and other important factors beyond the control of the Company that could cause the actual performance or achievements of the Company
to be materially different from such forward-looking statements. Accordingly, you should not rely on any forward-looking statements and the
Company accepts no obligation to disseminate any updates or revisions to such forward-looking statements.
This presentation is only being made to, and this document is only being distributed to, authorised persons or exempt persons within the meaning of
the Financial Services and Markets Act 2000 or any order made thereunder or to those persons falling within the following articles of the Financial
Services and Markets Act 2000 (Financial Promotion) Order 2001 as amended: Investment Professionals as defined in Article 19(5), Certified High Net
Worth Individuals as defined in Article 48(2), High Net Worth Companies as defined in Article 49(2) and certain Sophisticated Investors as defined in
Article 50(1) and it is not intended to be distributed or passed on, directly or indirectly, to the press or other media or to any other class of persons. This
document and its contents are confidential and it is being supplied to you solely for your information and may not be reproduced, re-distributed
or passed on to any other person or published, in whole or in part, for any purpose. In particular, neither this document nor any copy of it may be taken,
transmitted or distributed into the United States of America, its territories and possessions or any other area subject to its jurisdiction or any political
sub-division thereof (the “United States”) or to any citizen, resident or national of the United States.
Institutional presentation materials
34