consequences of rainforest fragmentation for frugivorous
TRANSCRIPT

Consequences of Rainforest Fragmentation for FrugivorousVertebrates and Seed Dispersal
Author
Moran, Catherine
Published
2007
Thesis Type
Thesis (PhD Doctorate)
School
Griffith School of Environment
DOI
https://doi.org/10.25904/1912/54
Copyright Statement
The author owns the copyright in this thesis, unless stated otherwise.
Downloaded from
http://hdl.handle.net/10072/367385
Griffith Research Online
https://research-repository.griffith.edu.au
Consequences of rainforest fragmentation for frugivorous
vertebrates and seed dispersal
Catherine Moran
B.Sc. (Hons.)
Griffith School of Environment
Faculty of Science, Engineering, Environment and Technology
Griffith University
Submitted in fulfilment of the requirements of the degree of Doctor of Philosophy
June, 2007

i
Abstract
Seed dispersal strongly influences patterns of plant regeneration. Frugivorous
(fruit eating) vertebrates disperse the seeds of between 70% and 90% of rainforest plant
species. Forest fragmentation may affect the abundance and distribution of frugivore
species. Consequently, patterns of seed dispersal and plant regeneration may vary
between extensive forest and fragmented forest landscapes. This thesis assessed
frugivorous vertebrates and seed dispersal in a rainforest landscape in subtropical
Australia. First, this study quantitatively compared the distribution and abundance of
frugivorous bird and bat species between fragmented and extensive rainforest. Second,
the roles of these frugivore species in seed dispersal were evaluated based on their
functional attributes and the plant species that they had been recorded consuming.
Third, secondary consequences of forest fragmentation for seed dispersal were predicted
from these results.
The field components of this study were conducted in the Sunshine Coast region
of southern Queensland. Surveys of frugivorous bird and bat species were undertaken in
a network of 48 study sites distributed throughout a 4 000 km2 area. Sites comprised 16
replicates of each of three site types: extensive forest (> 4 000 ha), rainforest remnants
and patches of secondary regrowth. Extensive forest sites were stratified by altitude
(low (<200 m above sea level (a.s.l.), medium (200-500 m a.s.l.), and high (>500 m
a.s.l.).
Birds were surveyed using 40 minute area searches within a one hectare plot
during the early morning. Each site was surveyed for birds four times: twice during
summer and twice in winter. Forty-two frugivorous bird species were identified during
surveys. Twenty-six of these species occurred frequently enough to quantitatively assess
their abundance pattern in remnant and regrowth sites relative to extensive forest. There
ii
were five species that were recorded in much lower numbers in remnants and/or
regrowth than in extensive forest (‘decreasers’), seven that showed higher abundance in
remnants and/or regrowth than in extensive forest (‘increasers’) and 14 whose
abundance did not vary substantially between the three habitat types (‘tolerant’ species).
The decreasers included four rainforest pigeons (the wompoo, rose-crowned and superb
fruit-doves Ptilinopus magnificus, P. regina and P. superbus and brown cuckoo-dove
Macropygia amboinensis) and the green catbird Ailuroedus crassirostris. There was no
evidence for the complete seasonal movement of frugivorous bird species between high
and low altitudes.
A lack of understanding of the functional roles of frugivorous species has
previously limited our capacity to predict specific consequences for seed dispersal of
frugivore declines. A major dimension of functional variation among frugivore species
is the suite of plant species that they disperse, which depends initially on their patterns
of consumption of plant species. In this thesis, frugivorous bird species that were
expected to have similar patterns of plant species consumption were assembled into
‘functional groups’. These groupings were based on the bird species’ gape width, degree
of frugivory and their methods of seed treatment. For example, it was proposed that
species with wide gapes would be able to consume large fruits, whereas those with
narrow gapes could only consume small fruits. It was also expected that species with
fruit-dominated diets (‘major frugivores’) may consume a different suite of plant
species than species with mixed diets or with diets dominated by non-fruit (‘minor
frugivores’). Species that crushed seeds were expected to disperse few viable seeds.
Analyses showed that decreaser bird species were predominantly from functional
groups that had the potential to disperse large-seeded plant species and may be the main
dispersers of native laurels (Lauraceae). Consequently, it is likely that the dispersal of
these plants may be reduced in fragmented forest.
iii
Relationships between the functional attributes of frugivores and their actual
patterns of plant species consumption were analysed using data on the plant species that
each frugivore species was known to consume. Diet data were collated from 151
published sources as well as field observation and included records for 244 plant
species. Major variation in patterns of plant species consumption corresponded with
variation in frugivore species’ attributes. For example, the average size of fruits
consumed by bird species increased with their gape width, although minor frugivores
tended to consume fruits that were much smaller than their capacity. Statistical
comparisons showed that highly frugivorous bird species consumed the highest number
of plant species from the Lauraceae, whereas bird species with mixed diets consumed
more arillate plant species from the Celastraceae, Sapindaceae, Mimosaceae and
Elaeocarpaceae than other frugivore groups. Bird species from a range of functional
groups consumed figs and small-fruited plants from families such as Euphorbiaceae and
Solanaceae. Minor frugivores and a small number of major and mixed-diet bird species
had species-poor diets that were dominated by these latter plant taxa.
In order to specifically assess the potential consequences of forest
fragmentation for seed dispersal, patterns of plant species consumption were compared
among decreaser, tolerant and increaser frugivore species. In particular, the potential for
tolerant and increaser bird species to substitute for decreasers was evaluated. Analyses
showed that dietary records for 12% of the 220 native plant species represented in the
data set, including several from the Rubiaceae, were restricted to decreaser bird species.
In addition, analyses showed that few non-decreaser species consumed numbers of
native plant species with fruits wider than 10 mm, or from the Lauraceae, Myrtaceae,
Meliaceae, Verbenaceae and Vitaceae that were comparable to decreaser bird species.
Consequently, it is predicted that there is limited potential for functional substitution by
iv
other bird species for decreasers and, therefore, that the dispersal of these plant taxa
may be substantially reduced in fragmented compared with extensive rainforest.
The potential for frugivorous bats to disperse seeds in fragmented forest was
also assessed. Frugivorous bats were surveyed during summer in each of the 48 sites
that had been surveyed for birds. Two observers conducted nocturnal, hour long
searches along a 400-500 m transect. Two flying-fox species (grey-headed flying-fox
Pteropus poliocephalus and black flying-fox P. alecto) and the eastern tube-nosed bat
Nyctimene robinsoni were recorded during surveys. At the time of surveys, Pteropus
spp. were most frequently recorded in regrowth, whereas N. robinsoni was detected
more frequently in extensive forest and remnants than in regrowth. Decreaser bird
species and N. robinsoni are rainforest and fruit specialists whereas tolerant and
increaser bird species and Pteropus spp. have more generalist patterns of habitat and
resource use. N. robinsoni has limited potential to substitute for decreaser bird species
as a seed disperser in fragmented rainforest of the study region, because it is known to
consume only a small number of plant species and because of its rarity in regrowth. In
contrast, Pteropus spp. were widespread in fragmented forest and consumed
approximately one-third of the plant species that were consumed by decreaser bird
species. In fragmented landscapes, Pteropus spp. may potentially substitute for
decreaser bird species as dispersers of large-fruited plant taxa and plants from the
Myrtaceae, although they appear unlikely to disperse seeds >9 mm more than short
distances away from parent plants.
The results of this study show that fragmented remnant and regrowth patches of
rainforest do not adequately conserve the full complement of frugivorous vertebrate
species in the subtropics of eastern Australia. Although the number of frugivore species
that showed sensitivity to rainforest fragmentation was relatively small, this may have
substantial functional consequences. These consequences are likely because decreaser
v
species may be the sole or predominant dispersers of a substantial proportion of native
plant species, which may consequently be susceptible to reduced dispersal away from
parent plants in fragmented forest. Reduced dispersal may have a number of
implications for plant regeneration. First, dispersal to recruitment sites within forest
fragments is likely to be reduced, resulting in lower rates and clumped spatial patterns
of recruitment. Second, dispersal of these species between rainforest fragments may be
lower, leading to low rates of recolonisation following local extinctions. Third, short-
distance dispersal to new habitats may be lower, resulting in low representation of
susceptible plant species in regenerating forest on previously cleared land. Fourth, long
distance dispersal of these plant taxa would be low, which would mean that they may
have a limited capacity to shift their geographical range, for example in response to
changing global climatic conditions.
Further clearing and fragmentation of rainforest would exacerbate the situation
for decreaser frugivore species and may lead to the decline of additional frugivore
species. It is recommended that remaining rainforest be protected from continued
clearing. Restoration of forest areas based on the needs of decreaser frugivore species
may help to re-establish them in fragmented landscapes. These actions could help to
restore the regenerative capacity of many rainforest plant species and hence increase the
long term integrity of fragmented rainforest ecosystems.
vi
Statement of originality
This thesis has not previously been submitted for a degree or diploma in any university.
To the best of my knowledge and belief, the thesis contains no material previously
published or written by another person except where reference is made in the thesis
itself.
…………………………………
C. Moran
Publications arising from this thesis
Slightly modified versions of Chapters Two and Three have previously been
peer reviewed and published as a book chapter and journal article, respectively. I was
responsible for conducting the research reported in those publications. The co-authors
were listed in recognition of their contributions as my academic supervisors. These
publications are listed below:
Chapter Two: Moran C, Catterall CP, Green RJ and Olsen MF (2004) Fates of
feathered frugivores in fragmented forests. pp. 699-712 in Lunney D (Ed.) Conservation
of Australia’s Forest Fauna. Second edition. Royal Zoological Society of NSW,
Mosman.
Chapter Three: Moran C, Catterall CP, Green RJ and Olsen MF (2004) Functional
variation among frugivorous birds: implications for rainforest seed dispersal in a
fragmented subtropical landscape. Oecologia 141, 584-595.
vii
Table of contents
ABSTRACT...............................................................................................................................................I
STATEMENT OF ORIGINALITY ........................................................................................................VI
PUBLICATIONS ARISING FROM THIS THESIS ..............................................................................VI
LIST OF FIGURES ...............................................................................................................................XII
ACKNOWLEDGEMENTS ................................................................................................................. XIII
CHAPTER ONE: EFFECTS OF RAINFOREST FRAGMENTATION ON FRUGIVOROUS
VERTEBRATES AND THE POTENTIAL CONSEQUENCES FOR SEED DISPERSAL AND
PLANT REGENERATION ...................................................................................................................... 1
1.1 RAINFOREST FRAGMENTATION, FOREST FAUNA AND SEED DISPERSAL............................................ 1
1.2 THE FUNCTIONAL ROLE OF FRUGIVORES IN SEED DISPERSAL .......................................................... 2
1.3 THE ROLE OF SEED DISPERSAL IN PLANT REGENERATION................................................................ 8
1.4 CONSEQUENCES OF RAINFOREST CLEARING AND FRAGMENTATION FOR FRUGIVORES .................. 11
1.5 RELATIONSHIPS BETWEEN FRUGIVORE SPECIES’ TRAITS AND THEIR SENSITIVITY TO
RAINFOREST FRAGMENTATION...................................................................................................... 16
1.6 CONSEQUENCES OF CHANGES IN THE COMPOSITION OF FRUGIVORE ASSEMBLAGES FOR SEED
DISPERSAL AND PATTERNS OF PLANT REGENERATION................................................................... 20
1 .7 AIMS AND STRUCTURE OF THIS THESIS......................................................................................... 26
1.8 RAINFOREST FRAGMENTATION, FRUGIVORES AND SEED DISPERSAL IN AUSTRALIA...................... 31
CHAPTER TWO: CHANGES IN THE AVIAN FRUGIVORE ASSEMBLAGE IN
FRAGMENTED RAINFOREST COMPARED WITH EXTENSIVE FOREST IN SUBTROPICAL
AUSTRALIA .......................................................................................................................................... 34
2.1 INTRODUCTION ............................................................................................................................. 34
2.2 METHODS ..................................................................................................................................... 35
2.2.1 Study region.......................................................................................................................... 35
2.2.2 Site network .......................................................................................................................... 37
Page
viii
2.2.3 Bird surveys .......................................................................................................................... 42
2.2.4 Data treatment...................................................................................................................... 42
2.2.5 Classification of frugivorous birds ....................................................................................... 44
2.3 RESULTS ....................................................................................................................................... 45
2.3.1 Abundance of frugivorous bird species in extensive, remnant and regrowth sites ............... 45
2.3.2 Changes in the frugivorous bird assemblage in fragmented forest ...................................... 51
2.3.3 Seasonal patterns of frugivorous bird abundance ................................................................ 54
2.3.4 Effects of altitude and season on frugivorous bird numbers................................................. 54
2.4 DISCUSSION .................................................................................................................................. 57
2.4.1 Bird species showing a decreaser response to rainforest fragmentation ............................. 57
2.4.2 Bird species showing an increaser response to fragmentation............................................. 60
2.4.3 Frugivore assemblage change in fragmented habitats ......................................................... 61
2.4.4 Seasonal changes in frugivorous bird abundance ................................................................ 62
2.4.5 Frugivorous birds and seed dispersal in remnant and regrowth rainforest:
conservation implications.................................................................................................... 63
CHAPTER THREE: SEED DISPERSAL POTENTIAL OF FRUGIVOROUS BIRD SPECIES IN
RELATION TO THEIR GAPE WIDTH, FRUGIVORY LEVEL AND SEED TREATMENT ............ 67
3.1 INTRODUCTION ............................................................................................................................. 67
3.2 METHODS ..................................................................................................................................... 70
3.2.1 Assessment of the functional attributes of frugivorous bird species: gape width,
frugivory level and seed-crushing behaviour ...................................................................... 70
3.2.2 Data analyses ....................................................................................................................... 72
3.3 RESULTS ....................................................................................................................................... 74
3.3.1 Variation in seed dispersal potential among species within the frugivorous bird
assemblage .......................................................................................................................... 74
3.3.2 Functional group abundance in remnants and regrowth relative to extensive forest........... 78
3.4 DISCUSSION .................................................................................................................................. 81
3.4.1 Characteristics of the frugivorous birds assemblage ........................................................... 81
3.4.2 Functional characteristics of the frugivorous bird assemblage in fragmented
rainforest in subtropical Australia: assessment of potential consequences for seed
dispersal .............................................................................................................................. 81
ix
CHAPTER FOUR: VARIATION IN PATTERNS OF PLANT SPECIES CONSUMPTION BY
FRUGIVOROUS BIRD SPECIES IS RELATED TO GAPE WIDTH, DEGREE OF FRUGIVORY
AND SEED TREATMENT .................................................................................................................... 87
4.1 INTRODUCTION ............................................................................................................................. 87
4.2 METHODS ..................................................................................................................................... 89
4.2.1 Diet composition of the frugivorous bird assemblage .......................................................... 89
4.2.2 Functional attributes of bird species .................................................................................... 91
4.2.3 Data analyses ....................................................................................................................... 92
4.3 RESULTS ....................................................................................................................................... 94
4.3.1 General patterns of plant consumption................................................................................. 94
4.3.2 The effect of gape width and frugivory level on diaspore size selection............................... 97
4.3.3 Plant species richness of the diets of major, mixed and minor frugivores............................ 99
4.3.4 Plant species diet composition in relation to frugivory level, gape width and seed
treatment............................................................................................................................ 100
4.4. DISCUSSION ............................................................................................................................... 109
4.4.1 Overlap and variation among frugivorous bird species in patterns of plant species
consumption....................................................................................................................... 109
4.4.2 Frugivore gape width and patterns of fruit size consumption ............................................ 110
4.4.3 Frugivory level and patterns of plant species consumption................................................ 111
4.4.4 Variation among bird species within a frugivory level....................................................... 113
4.4.5 Gape width and frugivory level as indicators of the functional potential of
frugivorous birds as seed dispersers ................................................................................. 114
CHAPTER FIVE: REDUCED DISPERSAL POTENTIAL OF NATIVE RAINFOREST PLANT
SPECIES IN FRAGMENTED RAINFOREST..................................................................................... 116
5.1 INTRODUCTION ........................................................................................................................... 116
5.2 METHODS ................................................................................................................................... 119
5.2.1 Changes in the frugivorous bird assemblage in fragmented subtropical rainforest........... 119
5.2.2 Fruit consumption database ............................................................................................... 119
5.2.3 Data analyses ..................................................................................................................... 120
5.3 RESULTS ..................................................................................................................................... 121
5.3.1 Diet comparisons between frugivore response groups ....................................................... 121

x
5.3.2 Specific substitution potential between frugivore taxa ....................................................... 128
5.4 DISCUSSION ................................................................................................................................ 137
5.4.1 Reduced dispersal of native rainforest plants as a consequence of rainforest
fragmentation..................................................................................................................... 137
5.4.2 Potential for disperser substitution in fragmented forest ................................................... 139
5.4.3 Implications for conservation of regenerative potential in fragmented rainforest ............. 141
CHAPTER SIX: THE DISTRIBUTION OF FRUGIVOROUS BATS AND THEIR POTENTIAL
TO DISPERSE SEEDS IN FRAGMENTED RAINFOREST. ............................................................. 143
6.1 INTRODUCTION ........................................................................................................................... 143
6.2 METHODS ................................................................................................................................... 146
6.2.1 The study region and site network ...................................................................................... 146
6.2.2 Surveys of frugivorous bat distribution............................................................................... 146
6.2.3 Frugivorous bird data......................................................................................................... 147
6.2.4 Information on the consumption of native plant species by frugivorous bat and bird
species................................................................................................................................ 148
6.2.5 Data handling ..................................................................................................................... 149
6.3 RESULTS ..................................................................................................................................... 150
6.3.1 Distribution and abundance of frugivorous bats ................................................................ 150
6.3.2 Association of bat distribution with environmental attributes............................................ 153
6.3.3 Comparison between frugivorous bat and bird species in their patterns of plant
species consumption .......................................................................................................... 154
6.3.4 Potential for frugivorous bat species to substitute for decreaser bird species as
dispersers in fragmented forest.......................................................................................... 158
6.4 DISCUSSION ................................................................................................................................ 158
6.4.1 The distribution of flying-foxes in fragmented rainforest in the Sunshine Coast................ 158
6.4.2 The distribution of the eastern tube-nosed fruit-bat in fragmented rainforest in the
Sunshine Coast .................................................................................................................. 161
6.4.3 The potential for seed dispersal by frugivorous bats in remnants and regrowth:
comparison with frugivorous birds.................................................................................... 162
CHAPTER 7: GENERAL DISCUSSION: CONSEQUENCES OF FOREST FRAGMENTATION
FOR FRUGIVORES AND IMPLCATIONS FOR SEED DISPERSAL.............................................. 165
xi
7.1 SUMMARY OF THE FINDINGS OF THIS THESIS............................................................................... 165
7.2 THE SENSITIVITY OF FRUGIVOROUS VERTEBRATE SPECIES TO RAINFOREST FRAGMENTATION
IN SUBTROPICAL AUSTRALIA ...................................................................................................... 168
Decreaser species ........................................................................................................................ 168
Tolerant species........................................................................................................................... 171
7.3 CORRELATES OF FRUGIVORE SPECIES’ SENSITIVITY TO RAINFOREST FRAGMENTATION .............. 173
7.4 PATTERNS OF PLANT SPECIES CONSUMPTION ACROSS THE FRUGIVORE ASSEMBLAGE: AN
ALTERNATIVE MODEL ................................................................................................................. 175
7.5 POTENTIAL CONSEQUENCES OF RAINFOREST FRAGMENTATION FOR SEED DISPERSAL AND
PATTERNS OF PLANT REGENERATION .......................................................................................... 179
7.6 CONSERVATION ISSUES............................................................................................................... 185
APPENDIX 1........................................................................................................................................ 187
APPENDIX 2........................................................................................................................................ 193
APPENDIX 3........................................................................................................................................ 198
REFERENCES ………………………………………………………………………………………. 203

xii
List of figures
Figure 1.1 Conceptual representation of patterns of plant species consumption by frugivorous bird species………………………………………………………………………. 7
Figure 1.2 Potential seed dispersal trajectories in fragmented forest landscapes with respect to plant regeneration……………………………………………………………….. 22
Figure 1.3 Conceptual links between the chapters of this thesis…………………………… 30 Figure 2.1 Aerial view of part of the Sunshine Coast study region………………………… 37 Figure 2.2 Map of study region showing site locations……………………………………. 39 Figure 2.3 Examples of the seven patterns of abundance in remnants and regrowth compared
with extensive forest……………………………………………………………. 50 Figure 2.4 Ordination of the 48 study sites based on the abundances of 39 frugivorous bird
species ………………………………………………………………………….. 53 Figure 3.1 Inter-relationships between frugivorous bird attributes ……………………….. 77 Figure 3.2 Ordination of the 48 study sites based on numbers of birds from each functional
group …………………………………………………………………………… 80 Figure 4.1 The average size of diaspores consumed compared with gape width …………. 98 Figure 4.2 The average proportion of diaspores close to the maximum handling capacity
consumed by frugivores………………………………………………………… 99 Figure 4.3 The number of native plant species consumed by each frugivore ……………... 100 Figure 4.4 Overlap in the number of plant species consumed by frugivorous birds in relation to
frugivory level………………………………………………………………….. 101 Figure 4.5 Classification of frugivore species based on Bray-Curtis similarity in patterns of
consumption of native plant species……………………………………………. 106 Figure 4.6 Overlap in the number of plant species consumed by frugivorous birds in relation to
gape width classes………………………………………………………………. 109 Figure 5.1 The proportion of native plant species with large (≥10 mm) diaspores that were
consumed by decreaser, tolerant and increaser frugivore species………………. 125 Figure 5.2 Classification of frugivore species according to presence / absence of native plant
species in the diet……………………………………………………..………… 127 Figure 5.3 The number of native plant species from selected plant families consumed by
decreaser, tolerant and increaser frugivores…………………………………….. 130 Figure 5.4. Overlap in the number of native plant species consumed by frugivore species from
the decreaser, tolerant and increaser response groups…………………………... 132 Figure 6.1. The abundance (mean ± SE) of flying-foxes recorded during a 60 minute search of
extensive, remnant and regrowth forest sites…………………………………… 152 Figure 6.2 The proportion of native plant species with a median diaspore width ≥10 mm that
were known to be consumed by decreaser, tolerant and increaser bird species, and by flying-foxes……………………………………………………………………… 156
Figure 6.3 Classification of frugivore species based on similarity of patterns of consumption of native plant species………………………………………………………………. 157
Figure 7.1 Map of Australia showing the approximate location of other studies in fragmented forest that have included frugivore species…………………………….………… 169
Figure 7.2 A model of variation in patterns of plant species consumption by frugivorous bird species in subtropical Australia………………………………………………….. 176
Figure 7.3 Relationship between bird species’ gape widths and their body mass………….. 179 Figure 7.4 The frugivore species that potentially disperse seeds along different dispersal
trajectories in fragmented forest landscapes ………………………………… 182-3
Page

xiii
Acknowledgements
I thank my principal supervisor, Associate Professor Carla Catterall, for her
contributions to all stages of this project. This thesis and my PhD experience have
greatly benefited from her dedicated attention and brilliant clear thinking. I am also
grateful to my associate supervisors, Drs. Ronda Green and Mike Olsen, for their
important contributions to this project, especially in its formative stages.
I acknowledge the traditional owners of the country in which the field
components of this work were conducted, the Ka’bi or Gubbi Gubbi, Undumbi and
Badtjala people. I am grateful to the people who supported my field work on their land:
Caloundra City Council, Mim Coulstock, David and Bernie Daugaard, John and Joan
Dillon, Wally and Annalies Gogel, Barbara Hansa, Max and Chrissie Hendersen, Ken
and Trish Long, Gillian and Neil MacLeod, Ted McCosker, Maroochy Shire Council,
Noosa Shire Council, John and Valerie Poulson, Arthur and Narelle Powter,
Queensland Environmental Protection Agency, Graham and Annabel Wearne and Greg
and Charmaine Wightman.
I acknowledge and thank the people who have generously contributed data to
this project. John Kanowski conducted bat surveys simultaneously with the author. Carl
Gosper, Damian Hackett and Stephen McKenna provided large amounts of unpublished
data from their work on frugivory and Stephen McKenna contributed information on
fruit attributes from his collection. Lyla, John and Francis Hansen, Val Jones, Valda
McLean and Shirley Rooke voluntarily conducted frugivory observations throughout
the Sunshine Coast.
I am grateful to the people who have facilitated logistical aspects of this project.
Financial support was provided by an Australian Postgraduate Research Award, the
Rainforest Co-operative Research Centre, Griffith University, and the Norman
xiv
Wettenhall Foundation. Dave Curmi assisted with field site set up. Heather Janetski
arranged for access to bird specimens at the Queensland Museum and Chris Stansbury
and John Kanowski helped to measure their gapes. Milton and Merle Rawson provided
generous hospitality during components of my field work. Child care was provided by
Cath Cleary and Bev Moran and especially by Maureen and Peter Kanowski who made
an enormous contribution to the care of Stella while I worked on my thesis.
Helpful advice on various technical aspects of the project was generously
provided by the following people: Nick Clancy, Les Hall, Rachel King, Bill McDonald,
and members of Wildlife Ecology Discussion Group at Griffith University (at various
times including Carla Catterall, Paul Finn, Ronda Green, Peter Grimbacher, Clare
Hourigan, John Kanowski, Stephen McKenna, Aki Nakamura, Wendy Neilan, Scott
Piper, Terry Reis, Billie Roberts and Tang Yong).
During my time at Griffith University, Rachel King, Scott Piper, Naomi Doak
and Sarah Boulter have provided encouragement, empathy, perspective, humour, and
intellectual and musical adventure. These have been so important.
The kindness and encouragement of my friends, parents, siblings, grandparents
and parents- and siblings-in-law has helped keep me going. My family, John, Stella and
Ruby, have been patient, considerate and positive, despite the toll this project has taken
on our time together, among other things. In particular, I thank John for his many
sacrifices and logistical and moral support.

1
Chapter One
Effects of rainforest fragmentation on frugivorous vertebrates and the
potential consequences for seed dispersal and plant regeneration
1.1 Rainforest fragmentation, forest fauna and seed dispersal
Rainforest has been heavily cleared and fragmented worldwide (e.g., Myers,
1984; Turner and Corlett, 1996; Whitmore, 1997). The long-term survival of rainforest
flora and fauna in the wild will therefore depend on their ability to persist in fragmented
rainforest landscapes (Myers, 1984; Laurance, 1991; Daily et al., 2001; Sodhi et al.,
2004).
Rainforest fragmentation has negative consequences for the distribution and
abundance of many forest biota (e.g., Turner, 1996; Laurance and Bierregaard, 1997;
Laurance and Peres, 2006). Because animals play important roles in rainforest
dynamics, changes in the composition of rainforest fauna in fragmented forest
landscapes may have secondary consequences for plant-animal interactions and
ecosystem functions (Burkey, 1993; Didham et al., 1996; Daily et al., 2001; van Bael et
al., 2003; Şekercioğlu et al., 2004; Hooper et al., 2005; Şekercioğlu, 2006). For
example, between 70% and 90% of rainforest plant species are fleshy-fruited (Howe
and Smallwood, 1982; Willson et al., 1989; Butler, 2003). Frugivorous (fruit eating)
fauna are the main dispersers of the seeds of fleshy-fruited plants (van der Pijl, 1982;
Corlett, 1998). Therefore, changes in the frugivore assemblage in rainforest remnants
could alter the dispersal of a large proportion of the rainforest flora in fragmented
landscapes (Corlett, 1998; Silva and Tabarelli, 2000). The extent to which this occurs
2
will depend the level of variation among frugivore species in their function as seed
dispersers.
1.2 The functional role of frugivores in seed dispersal
Seed dispersal is the movement of seed away from a parent plant (Howe and
Smallwood, 1982; Levin et al., 2003). Birds are an abundant and diverse element of the
frugivorous fauna in forests worldwide (e.g., Corlett, 1998). Mammals and to a lesser
extent, reptiles, amphibians, fish and invertebrates may also play a role in seed dispersal
(Corlett, 1998). Frugivorous animal species vary in their functional roles as seed
dispersers as a consequence of several factors. Primary variation among frugivore
species arises from differences in the suite of plant species that they consume and hence
disperse (Crome, 1975; Snow, 1981; Herrera, 1984; Howe, 1986; Innis, 1989; Sun et
al., 1997; Brown and Hopkins, 2002). Variation among frugivore species in the suite of
plant species that they consume is affected by the interaction between the
morphological, physiological and behavioural traits of the frugivore species and the
morphological, chemical and nutritive traits of the fruits of plant species (Gautier-Hion
et al., 1985; Moermond and Denslow, 1985; Corlett, 1996; Kitamura et al., 2002;
Poulsen et al., 2002; Silva et al., 2002).
There is broad variation in patterns of plant consumption among higher
taxonomic groupings of frugivores (van der Pijl, 1982; Gautier-Hion et al., 1985;
Willson et al., 1989; Bollen et al., 2004). For example, because they have teeth, most
mammals can consume large fruits with hard rinds or husks, whereas most birds, whose
beaks limit their capacity to break into or swallow large fruits, cannot (van der Pijl,
1982; Gautier-Hion et al., 1985). This variation in patterns of consumption of plant taxa
has been conceptualised in terms of taxonomic-based ‘dispersal syndromes’, which are
described by suites of fruit characteristics, including size, colour, pulp characteristics
3
and location on a plant, and suites of related frugivore characteristics such as their
perception of fruit colour or odour, digestive physiology and feeding behaviour (van der
Pijl, 1982; Bollen et al., 2004).
However, the broad categories of ‘bird’, ‘bat’ and ‘terrestrial mammal’ dispersal
syndromes obscure the sometimes substantial variation in patterns of plant species
consumption among faunal species within these categories (Willson et al., 1989; Stiles,
1993; Graham et al., 2002; Lord et al., 2002). For example, there is a maximum limit to
the size of fruit that a given frugivore species can handle which results from its body
mass and the size of its oral aperture (Herrera, 1981, 1984; Wheelwright, 1985; Mack,
1993). Consequently, the bird species in an assemblage may vary in substantially in
their capacity to disperse large fruited species because, although they may consume the
fleshy part of fruits piecemeal (Levey, 1987), only frugivore species with wide gapes or
large body mass are able to transport large seeds (Wheelwright, 1985; Silva and
Tabarelli, 2000; Lord et al., 2002).
Beyond the intractable constraint on the maximum size of fruits that a frugivore
species can handle, there is a lack of agreement regarding the factors that are important
in determining major variation in patterns of fruit consumption within frugivore
assemblages (Herrera, 1998, 2002; Levey and Martínez del Rio, 2001). However, the
few studies that have examined interactions among multiple frugivore and plant species
in rainforest (Pratt and Stiles, 1985; Hamann and Curio, 1999; Brown and Hopkins,
2002; Kitamura et al., 2002) have shown that there is additional, unexplained variation
among frugivore species in their patterns of plant consumption beyond that related to
fruit size. For example, Kitamura et al. (2002) considered patterns of consumption of
259 plant species by 25 frugivore species in north eastern Thailand and showed that
certain frugivore species did not consume fruits from certain plant species, despite their
size-related morphological capacity to handle them. Similarly, Pratt and Stiles (1985)
4
found that patterns of consumption of 20 plant species by 35 frugivorous bird species in
Papua New Guinea were related to the interaction between avian taxonomy and fruit
structure in addition to fruit size: capsular fruits were consumed predominantly by birds
of paradise (Paradisideae) whereas drupes and berries were mostly consumed by either
small passerines (which took small fruits) or pigeons and bowerbirds (large fruits).
Several factors other than fruit size potentially influence patterns of plant species
consumption by frugivore species. First, the chemical content of many fruits is
dominated by carbohydrate and water, whereas a small proportion of fruits contain high
levels of lipids or nutrients such as nitrogen (McKey, 1975; Izhaki and Safriel, 1989).
Highly frugivorous species may need to consume the fruits of particular nutrient-rich
plant species in order to obtain a complete diet from fruit (Izhaki and Safriel, 1989;
Bairlein, 1996). Therefore, it is logical to expect that a frugivore species’ level of
nutritional dependence on fruit may influence its patterns of plant species consumption
(Morton, 1973; McKey, 1975; Bairlein, 1996; Bosque and Calchi, 2003). For example,
highly frugivorous species may actively select fruits with high lipid content (McKey,
1975), or fruits with high levels of protein (White, 1993) or other essential minerals and
nutrients (Pulliam, 1975; Schaefer et al., 2003). In contrast, frugivores whose diets
include non-fruit items such as animals or seeds may obtain substantial amounts of
energy, minerals and nutrients from these sources (Izhaki and Safriel, 1989) and hence
be less selective of particular plant species.
A frugivore species’ patterns of plant species consumption may also be strongly
influenced by its digestive physiology. Variation among frugivore species in their
digestive physiology affects their capacity to assimilate certain forms of carbohydrate
(Martínez del Rio et al., 1988; Martínez del Rio and Karasov, 1990) or lipids (Cipollini
and Levey, 1997; Levey and Martínez del Rio, 2001). For example, frugivore species
that are unable to digest sucrose would be expected to consume few of the plant species

5
that produce sucrose-rich fruits (Martínez del Rio and Restrepo, 1993). Furthermore, a
frugivore species’ capacity to cope with secondary compounds is likely to have a strong
influence over the plant species that it consumes (Sun et al., 1997; Izhaki et al., 2002;
Levey and Martínez del Rio, 2001). Because both the occurrence of secondary
compounds in plants and an animal’s capacity to detoxify these compounds (at least in
herbivores) has a strong phylogenetic basis (Bernays and Chapman, 1994),
specialisation by frugivores on particular secondary compounds would be expected to
result in an association between the diets of phylogenetically-related frugivores and
phylogenetically-related plants.
Most discussions of the factors associated with variation in patterns of plant
species consumption by frugivores, other than those associated with fruit size, relate to
three different conceptual models: the lipid-carbohydrate dichotomy (McKey, 1975);
specialisation on core plant taxa (Fleming, 1986); or a null model (Burns, 2006).
The lipid-carbohydrate dichotomy
Several studies in the Neotropics have suggested an association between highly
frugivorous bird species and the consumption of plant species with lipid-rich fruits
(Snow BK, 1962; Snow DW, 1970, 1971; Howe and Primack, 1975; McKey, 1975;
Howe and Estabrook, 1977; Wheelwright, 1983). McKey (1975) proposed a model to
synthesise these findings within a coevolutionary framework, suggesting that a small
number of highly frugivorous species would consume ‘high quality’ fruits that have
lipid-rich pulp, and would preferentially disperse seeds to good germination sites,
whereas the larger group of opportunistic frugivores would consume ‘low quality’,
carbohydrate-rich fruits. The predictions of this model, as they relate to variation among
frugivore species in their patterns of plant consumption, are illustrated in Figure 1.1(a).
6
Empirical tests of the predictions of this model have advanced understanding of
frugivore-plant interactions, although they have shown little support for either a
dichotomous pattern of consumption based on lipid and carbohydrate content (e.g.,
Herrera, 1984; Fuentes, 1994; Corlett, 1996; Sun et al., 1997), or superior dispersal by
highly frugivorous bird species (Wheelwright and Orians, 1982). Although highly
frugivorous bird species may consume large proportions of lipid-rich fruits (Crome,
1975; Herrera, 1984; Stiles, 1993), they may also frequently consume fruits with
relatively low lipid content (Fuentes, 1994; Sun et al., 1997). Furthermore, species that
have mixed diets may also regularly consume lipid-rich fruits (Levey and Karasov,
1989; Howe, 1993; Martinez del Rio and Restrepo, 1993; Fuentes, 1994). It is likely
that patterns of plant species consumption by frugivorous species are influenced by their
need to balance intake of a variety of nutrients and minerals (Pulliam, 1975), or by
chemical compounds (Izhaki et al., 2002), not only by their energetic requirements.
Specialisation on ‘core plant taxa’
Fleming (1986) developed a model of plant consumption for frugivorous
phyllostomid bats, based on data collected in the Neotropics (Barro Colorado Island and
Costa Rica). This model described specialisation by particular bat species on certain
‘core plant taxa’, with the opportunistic addition of other plant species as their fruit
became available (Figure 1.1(b)). The core plant taxa that Fleming identified were
characterised by being available throughout the year; for one set of bat species (in the
Carollia and Sturnira genera) these plant taxa were ‘high quality’ fruits (Piper and
Solanum spp.) that occurred in low densities, while for bat species in the genus
Artibeus, the core taxon comprised high density, ‘low quality’ fruits (Ficus spp.). I am
not aware of any subsequent tests of the generality of this model for frugivorous bats
elsewhere, or for other frugivore taxa.

7
(a)
(b)
(c)
Figure 1.1 Conceptual representations of patterns of plant species consumption by
frugivorous bird species. The outer frames represent available plant species. Arrows
indicate the consumption of plant taxa by frugivores. Three alternative models are
represented: (a) the lipid-carbohydrate dichotomy proposed by McKey (1975) for
Neotropical birds; (b) the ‘core plant taxa’ model proposed by Fleming (1986) for
Neotropical bat genera; and (c) the neutral model proposed by Burns (2006) for
temperate birds.
Carollia, Sturnira
Artibeus
Piper spp. Solanum spp.
Ficus spp.
Remaining fruits
All fruits
All frugivores
Specialist frugivores
Generalist frugivores
Small, sugar rich fruits
Large, lipid-rich fruits

8
Null model of plant consumption
The frugivory literature has been dominated by ‘adaptive’ and ‘coevolutionary’
explanations of patterns of seed consumption and dispersal. Recently, Burns (2006)
proposed a null model in which fruit preferences did not differ among frugivore species,
but rather that frugivores consumed various fruits in proportion to their availability in
the environment. Burns (2006) found some support for this hypothesis amongst a small
number of bird and plant species (six and seven, respectively) in a northern hemisphere
temperate forest. While a null model is valuable for focussing attention on patterns that
can be explained by chance alone, many previous studies have reported strong
deterministic patterns in frugivore feeding behaviour. For example, in a 12-year study
of plant-frugivore interactions in Spanish scrubland, Herrera (1998) showed that plant
species were not consumed in proportion to their availability in the environment. Even
Burns (2006, p.430) concluded that “…deterministic processes are not entirely
unimportant in structuring pair-wise interactions between fruits and frugivores…” in his
study system. The applicability of a neutral hypothesis to patterns of plant consumption
by frugivore species in rainforest ecosystems has not been tested.
1.3 The role of seed dispersal in plant regeneration
Seed dispersal is one of several processes that determine the extent and patterns
of plant regeneration (Wang and Smith, 2002). For example, following dispersal, the
process of plant regeneration may be strongly influenced by seed predation, which in
turn is related to seed predator abundance (Forget, 1993; Wright et al., 2000; Wright
and Duber, 2001; Murray and Garcia, 2002; Babweteera et al., 2007). Nevertheless,
seed dispersal establishes the critical template for plant regeneration (Herrera, 1985;
Nathan and Muller-Landau, 2000; Levin et al., 2003), and makes an important
9
contribution to individual plant reproductive success, plant population dynamics, and
the ability of plant species to colonise new habitats (Howe and Smallwood, 1982).
Individual plant reproductive success
First, seed dispersal may increase the likelihood of successful reproduction by
an individual plant by removing its seeds from the region of highest per capita seed and
seedling mortality (Janzen, 1970; Connell, 1971; Howe and Smallwood, 1982; Harms et
al., 2000). This concept forms the basis of the ‘Janzen-Connell’ hypothesis, which
predicts that seed and/ or seedling mortality should be highest directly beneath parent
plants as a result of density-dependent factors such as sibling competition, and the
activity of fungal pathogens, seed predators and seedling herbivores (Janzen, 1970;
Connell, 1971). However, the benefits of escape (or consequences of not escaping)
depend on how these agents of mortality vary in relation to the position of the parent
tree and to seed and seedling density (Chapman and Chapman, 1995; Levin et al.,
2003). For example, seedlings of certain plant species may suffer very high mortality
beneath parent plants (Howe et al., 1985; Schupp, 1988; Chapman and Chapman, 1995),
whereas those of other plant species may not (Janzen and Martin, 1982; Chapman and
Chapman, 1995; Corlett and Turner, 1997; Baider and Florens, 2006). Nevertheless,
there is increasing evidence that density-dependent mortality is a pervasive factor in
structuring rainforest plant assemblages (Harms et al., 2000; Wright, 2002), and
therefore that localised seed dispersal is an important functional process in rainforest
dynamics (Terborgh et al., 2002).
Seed dispersal may also increase a plant’s reproductive success by delivering
seeds to ‘microsites’ that contain combinations of abiotic conditions (e.g., soil fertility,
moisture, light) and biotic factors (e.g., competitors, predators) that improve
germination, survival and growth (Grubb, 1977; Hubbell, 1979). These may be sites of
10
limited spatial extent that occur in particular topographic positions (e.g., along
watercourses) or that occur stochastically in dynamic forest systems (e.g., light gaps
caused by tree falls) (Schupp, 1993). Hence, the probability of a seed reaching a suitable
microsite and recruiting successfully is likely to increase with the number of seeds
dispersed, and the spatial extent and temporal period of dispersal (Hurtt and Pacala,
1995). In addition, the seeds of many rainforest plant species may persist for only a
short time in the seed bank (Hopkins and Graham, 1984; Alvarez-Bullya and Martínez-
Ramos, 1990). Ongoing dispersal would be required to maintain the chance that seeds
of these plant species were present when a recruitment opportunity arose (Chesson and
Warner, 1981; Muller-Landau et al., 2002).
Plant population dynamics
Seed dispersal affects the demographic characteristics and dynamics of plant
populations. For example, the size and rate of expansion of plant populations are
products of the reproductive success of individual plants, which depends on the
successful dispersal and establishment of propagules (Levin et al., 2003). Furthermore,
seed dispersal to suitable microsites is a critical factor in the recovery of plant
populations following localised extinctions, whether from stochastic environmental and
demographic causes or from human activities (Cochrane et al., 1999).
Patterns of seed dispersal within and among populations may also affect gene
flow and population genetic structure, which in turn may influence the susceptibility of
populations to disturbances (Hamilton, 1999; Jordano and Godoy, 2002).
Colonisation of new habitats
Seed dispersal is fundamental to plant colonisation of new habitats. In
fragmented forest landscapes, seed dispersal strongly influences patterns of plant

11
regeneration on cleared land (McDonnell and Stiles, 1983; Guevara et al., 1986; Silva et
al., 1996; Holl et al., 2000; Zimmerman et al., 2000; Hooper et al., 2004; Laurence,
2004; Franklin and Rey, 2007).
Dispersal over long distances to new habitats determines the biogeographical
distribution of plant species and the potential for species’ range expansions (Ridley,
1930; Levin et al., 2003). Long distance seed dispersal is likely to take on increasing
importance given the changing climatic conditions associated with global warming
(Primack and Miao, 1992; Matlack, 1995; Westoby and Burgman, 2006; Weir and
Corlett, 2007).
1.4 Consequences of rainforest clearing and fragmentation for
frugivores
The composition of frugivore assemblages may change as a consequence of
different species’ responses to forest clearing and fragmentation; throughout the world,
some species have shown sensitivity to forest fragmentation, whereas others are more
tolerant of forest fragmentation (Corlett, 1998; Silva and Tabarelli, 2000). Comparisons
of historical bird species lists with contemporary surveys have revealed that certain
frugivorous species are sensitive to forest fragmentation. For example, Castelletta et al.
(2000) reported that, within 20 years of widespread deforestation in Singapore, four of
the ten frugivorous bird species had become locally extinct. In different regions of the
Colombian Andes, Kattan et al. (1994) documented the local extinction over an 80 year
period of 36% (22 of 61 species) of frugivorous bird species, while Renjifo (1999)
reported that 40% of frugivorous bird species (17 of 42 species) had become extinct
following forest fragmentation. In the Brazilian Atlantic, Ribon et al. (2003) reported
that 10 frugivorous bird species had become extinct and a further 11 were threatened
12
(i.e., approximately 66% of a total of 32 frugivorous bird species) following extensive
forest clearing.
Other than these historical studies, research into the effects of forest
fragmentation on frugivore species has generally involved comparisons of frugivore
assemblages between continuous and fragmented forest, or evaluation of the effects of
fragment size and isolation. I consider these in turn below.
Frugivore assemblage change in forest fragments compared with continuous forest
Two studies have compared frugivore species’ responses to fragmentation using
systematic pre-fragmentation and post-fragmentation surveys. Working in the
experimentally fragmented forests of the Biodynamics of Forest Fragmentation Project
in Brazil (Bierregaard et al., 1992), Bierregaard and Stouffer (1997) compared average
rates of capture of the 12 frugivorous bird species that were most common pre-clearing
with their capture rates 2-3 years after the forest had been fragmented into 1 ha and 10
ha patches. Capture rates of these species declined significantly from 35 individuals/
1000 mist-net hours before clearing to approximately 20 individuals / 1000 net hours.
However, nine additional frugivorous bird species were recorded only after forest
fragmentation. Cosson et al. (1999) compared the abundance of 14 frugivorous bat
species in an area of forest in French Guiana before and after its fragmentation by
flooding of the surrounding landscape to create a dam. Six bat species were not
observed in any forest fragments following flooding, and the average abundance of
seven of the eight remaining frugivorous bat species was lower in fragments (size range
5 - 40 ha) than in the mainland control site (0 – 65% of their abundance in the control
site).
Several studies have compared frugivore assemblages in forest fragments and
continuous forest ‘reference’ sites. In subtropical Australia, Date et al. (1996) surveyed
13
the incidence of nine frugivorous pigeon species in ten rainforest fragments (size range
1 ha to 80 ha) and 15 rainforest sites contiguous with large tracts of forest. Four of the
pigeon species occurred more frequently in continuous than fragmented sites, five
species were recorded in similar frequency between these two site types and one species
was more common in fragments. In Uganda, the average number of frugivore species
(birds and monkeys) in a large tract of forest (8 500 ha in size) was 1.14 times the
number of species in fragments (size range 130 ha – 1 400 ha), although this difference
was not statistically significant (Farwig et al., 2006).
Other workers have compared the number of frugivore species visiting a focal
tree species between continuous forest and rainforest fragments. For example, Graham
et al. (2002) compared frugivorous bird assemblages at Dendropanax arboreus
(Araliaceae) and Bursera simaruba (Burseraceae) between fragments (mean 4.1 ha in
size) and a large forest tract (650 ha) in Mexico. While the average numbers of bird
species, visits to focal trees and fruits consumed were similar for both tree species
between habitats, the species composition of frugivorous birds feeding at D. arboreus
varied between continuous and fragmented forest, largely because two of the bird
species from continuous forest did not visit trees in fragments. In the Atlantic forest of
Brazil, Pizo (1997) reported 35 bird species visiting fruiting Cabralea canjerana
(Meliaceae) trees in an extensive forest tract (49 000 ha) compared with 14 frugivorous
bird species at the same tree species in a 250 ha rainforest remnant. The lower number
of frugivorous bird species in the 250 ha remnant may have been a consequence of its
reduced size and isolation, although the lower sampling effort in the smaller fragment
(45 hours of observation compared with 70 in the large forest tract) may also have
contributed to this result. In Tanzania, five of the ten frugivorous bird species recorded
in fruiting Leptonychia usambarensis (Sterculiaceae) in continuous forest (7 500 ha in
size) were not recorded at trees of this species in three small fragments (2, 13 and 31 ha
14
in size), and mean visitation rates of two additional bird species were at least 75% lower
in fragments than in continuous forest (Cordeiro and Howe, 2003). Although a higher
number of individual trees were observed in continuous forest than in fragments (16
compared with 10) in this study, and this may have contributed to the difference in
species’ totals, it should not have biased the data on average visitation rates per tree
(Cordeiro and Howe, 2003).
In summary, there is some evidence of reduced total frugivore species richness
associated with forest fragmentation (Cordeiro and Howe, 2003; Farwig et al., 2006).
Studies that have evaluated the responses of individual species have reported declined
abundance of one suite of frugivore species, maintained abundance of another group of
species and, in some cases, increased numbers of a further suite of species (Date et al.,
1996; Bierregaard and Stouffer, 1997; Cosson et al., 1999).
The effect of fragment size on frugivore assemblages
Cordeiro and Howe (2001) conducted transect surveys in five forest patches in
Tanzania that varied in size from 0.5 ha to 3 500 ha. They detected the lowest numbers
of frugivorous bird and primate species in the three smallest fragments (0.5, 9 and 30
ha) but similar species’ numbers between the 521 and 3 500 ha sites. The lower
numbers of species detected in the smaller fragments may have been partly due to the
lower survey effort in these habitats. Şekercioğlu et al. (2002) reported similar numbers
of frugivorous bird species in a large (>200 ha) remnant and in small (approx. 5 ha)
rainforest remnants in Costa Rica. Similarly, in French Guiana, Cosson et al. (1999)
showed that three years after fragmentation, the patterns of reduced abundance of
frugivorous bat species were similar between small (<5 ha) islands and a larger (40 ha)
forest island. Date et al. (1996) reported no association between the abundance of
frugivorous pigeon species and fragment size (with size ranging from 1 to 80 ha), even
15
for species that were less abundant in fragments than continuous forest overall (e.g.,
Ptilinopid fruit-dove species). In Brazil, Bierregaard and Stouffer (1997) reported that
capture rates of only two of the six bird species tested varied between 1 ha and 10 ha
fragments. In both cases, bird species’ abundances were significantly higher in one
hectare than ten hectare fragments. The abundance of other species showed the opposite
pattern, but data were not significant in statistical comparisons.
In summary, most studies have tended to show only a limited effect of fragment
size on the abundance of frugivore species (Cosson et al., 1990; Date et al., 1996;
Şekercioğlu et al., 2002).
The effect of isolation on frugivore assemblages
In Costa Rica, Luck and Daily (2003) reported that the average number of
frugivorous bird species declined from 21.5 at Micona spp. (Melastomaceae) trees that
were located within 2 km of a large rainforest remnant in a low intensity agricultural
matrix, to 14.1 at trees located 5-8 km from forest in areas of high agricultural intensity.
In subtropical Australia, Green (1993) compared visitation by frugivorous bird species
at two species of fig (Ficus platypoda and F. superba), Ehretia acuminata
(Boraginaceae) and Diploglottis australis (Sapindaceae) in more-forested upland areas
and less-forested valleys. This study found that fewer frugivorous bird species visited
the fig trees in the valleys than in the mountain areas, whereas similar numbers of bird
species were recorded at the other two plant species. In Kenya, Eshiamwata et al. (2006)
reported a similar species richness of frugivorous birds at Ficus thonningii located
within 200 m of forest compared with those over 1 km from forest, although the
landscape they worked in may have contained a large amount of forest habitat.
In summary, lower numbers of frugivorous species have been reported visiting
certain fruiting plant species in matrix habitats compared with relatively well-forested
16
areas (Green, 1993; Luck and Daily, 2003), however, there may be variation between
regions or plant species.
1.5 Relationships between frugivore species’ traits and their sensitivity
to rainforest fragmentation
Studies of frugivore species’ responses to forest fragmentation have shown that
certain frugivore species are sensitive to forest fragmentation, whereas other frugivore
species appeared to be relatively tolerant of, or even advantaged by, these changes (see
Section 1.4). Variation among species in their sensitivity to rainforest fragmentation
may be due to differences in behavioural, ecological or demographic attributes (Lovejoy
et al., 1986; Laurance, 1990; Stouffer and Bierregaard, 1995; Turner, 1996; Sieving and
Karr, 1997; Warburton, 1997; Corlett, 1998). Henle et al. (2004) reviewed empirical
and theoretical evidence for the association of different plant and animal species’
attributes with their sensitivity to forest fragmentation. These authors identified certain
aspects of demography (particularly population size and variability), and ecological
traits (patterns of microhabitat and matrix use, rarity and biogeographical distribution)
as being the most consistently related to differing fragmentation responses among
species. Studies of the association between frugivore traits and their responses to forest
fragmentation have focussed mainly on the effects of dispersal ability, degree of
resources specialisation and body size. Among the studies evaluated by Henle et al.
(2004), several factors, including dispersal power, body size, and ecological
specialisation had inconsistent associations with species’ fragmentation sensitivity.
Below, I review the findings of studies relating frugivore species’ attributes to their
fragmentation responses.

17
Ability to disperse through the matrix
A species’ abundance in fragmented forest landscapes depends partly on its
ability to disperse through matrix habitats (Wiens, 1994; Bierregard et al., 1992;
Warburton, 1997; Graham, 2001; Şekercioğlu et al., 2002). This ability would affect a
species’ capacity to recolonise fragments after localised extinctions and to use networks
of patches to satisfy resource requirements.
The natural dispersal ability of volant (flying) taxa is typically greater than that
of terrestrial taxa. However, not all birds (Stouffer and Bierregaard, 1995) or bats
(Cosson et al., 1999) readily disperse through fragmented parts of the landscape. In
practice, a species’ dispersal potential may be limited by resource availability, relative
to cost. For example, Graham (2001) showed that although the keel-billed toucan
Ramphastos sulphuratus did fly among rainforest fragments in Mexico, its movements
were limited to areas of the landscape that contained a minimum threshold amount of
forest and fruit resources. This was interpreted as being a result of this species’ need to
balance the cost of moving a certain distance with the energy gained from available
resources (Graham, 2001).
Dispersal ability may also be related to a species’ scale of movement. For
example, it has been proposed that migratory and nomadic species may have greater
dispersal power than sedentary species and hence have a greater capacity to move
through the modified matrix (reviewed in Henle et al., 2004). However, it has
conversely been reasoned that sedentary species may be more likely to have smaller
area requirements and hence be more capable of persisting in isolated fragments than
species with large area needs (Henle et al., 2004). For example, nomadic frugivore
species may move over large areas to find ripe fruit that is spatially and temporally
patchy (Leighton and Leighton, 1983; Innis, 1989). Forest fragmentation may reduce
18
the capacity of these frugivore species to move among key fruit resources (Karr, 1976;
Leighton and Leighton, 1983; Terborgh, 1986; Wheelwright, 1986; Laurance and
Yensen, 1991). However, different frugivore species’ sensitivity to fragmentation has
not been specifically correlated with variation in their movement patterns.
Degree of specialisation on resources
A species’ ability to traverse the matrix is not only associated with their capacity
or willingness to move, but also with their use of matrix elements, such as isolated trees,
copses of regrowth, windbreaks and agricultural crops (Estrada et al., 1993; Crome et
al., 1994; Graham, 2001). Species with specialised patterns of forest resource use are
arguably less likely to use habitat elements within the cleared matrix, and hence more
likely to be adversely affected by fragmentation, than species with more generalised
habitat requirements (Willis, 1974; Karr, 1976; Leck, 1979; Andrén, 1994; Christiansen
and Pitter, 1994; Turner, 1996; Warburton, 1997; Gascon et al., 1999; Sigel et al.,
2006). For example, in a tropical rainforest landscape in Australia, frugivorous bird
species that were dependent on rainforest were less likely to use matrix resources than
species that used more open forest or a variety of forest types (Crome et al., 1994).
Studies conducted in the Neotropics (Christiansen and Pitter, 1997) and south east Asia
(Castelletta et al., 2000) have shown that frugivorous bird species that specialised on
fruit were disproportionately sensitive to rainforest fragmentation. In contrast, species
with diets that comprised more than one food type tended to be more resilient. In a
study of natural fragments of monsoon rainforest in northern Australia, Price et al.
(1999) found that the use of rainforest patches by specialist frugivorous bird species was
strongly affected by the cumulative amount of rainforest within a landscape, but that
this did not clearly affect bird species that had the ability to switch from fruit to
invertebrates or other dietary items.
19
Body size
Many studies have proposed that large body size may be associated with
frugivore declines in fragmented forest (Kattan et al., 1994; Corlett, 1998, 2002;
Restrepo et al., 1997; Renjifo, 1999; Castelletta et al., 2000; McConkey and Drake,
2002). The distribution of large-bodied species in fragmented forest landscapes may be
restricted as a result of their large area requirements (Leck, 1979; Pimm et al., 1988;
Turner, 1996; Sieving and Karr, 1997; Sodhi et al., 2004). Furthermore, increased
hunting pressure in fragmented forest may disproportionately affect large-bodied
species (Corlett, 2002; Sodhi et al., 2004; Terborgh and Nuñez-Iturri, 2006), especially
large-bodied frugivores (Brash, 1987).
Restrepo et al. (1997) examined changes in the proportional distributions of
body mass of frugivorous bird assemblages along a gradient from forest remnant to
pasture in Colombia. Their results showed that larger-bodied species were consistently
lost from avian frugivore assemblages in more disturbed situations, although small-
bodied species were also lost from assemblages in one of the four landscapes surveyed.
However, Daily and Ehrich (1994) and Luck and Daily (2003) reported greater
persistence of large-bodied than small-bodied avian frugivore species in agricultural
landscapes in Costa Rica. This result was interpreted as a consequence of the superior
position of larger birds in the foraging dominance hierarchy in this region (Daily and
Ehrlich, 1994). Similarly, Cosson et al. (1999) reported a clear positive relationship
between the body size of bat species and their abundance in rainforest fragments in
French Guiana.

20
1.6 Consequences of changes in the composition of frugivore
assemblages for seed dispersal and patterns of plant regeneration
This section develops a framework for the study of the consequences of forest
fragmentation for frugivores, and the secondary consequences for seed dispersal and
plant regeneration. There is variation among frugivore species in the plant species that
they disperse (Section 1.2) and also in their responses to forest fragmentation (Section
1.4). Consequently, it would be expected that forest fragmentation would result in
changes in the dispersal of frugivore-dispersed plant species, and that this in turn would
be likely to affect patterns of plant regeneration (Section 1.3). This logic has been used
to predict changes in seed dispersal and plant regeneration as a consequence of changes
in the abundance of frugivore species in fragmented forest (e.g., Restrepo et al., 1997).
However, because of limited understanding of the specific roles of frugivore species in
seed dispersal, the predicted changes have often been vague. Furthermore, there has
been limited consideration of the potential for different spatial dimensions of seed
dispersal (See Section 1.3) to be differentially affected by changes in the composition of
frugivore assemblages.
Furthermore, for regenerating plants, the different processes of escape from
density dependent mortality, recolonisation of microhabitats and colonisation of new
habitats (described in Section 1.3) occur at different spatial scales. In Figure 1.2 and
Table 1.1, these are described as different seed dispersal trajectories for a given plant or
plant species in fragmented forest landscapes. These seed dispersal trajectories can be
used as a basis for systematically considering potential changes in qualitative aspects of
the dispersal of different plant species that may result from changed composition of
frugivore assemblages in fragmented forest. For example, variation among frugivore
species in their patterns of movement may create different spatial patterns of seed
deposition. First, dispersal along trajectory b (Figure 1.2) would be affected by
21
differences at the scale of patterns of microhabitat use by frugivore species (Reid, 1989;
Schupp, 1993; Wenny and Levey, 1998; Alcántara et al., 2000; Loiselle and Blake,
2002). Second, differences among frugivore species in their patterns of movement
among fragments (e.g., Tewksbury et al., 2002) and into secondary regrowth (e.g., Silva
et al., 1996) would affect dispersal along trajectories c, d and f. Finally, there is also
variation among frugivore species in their propensity to move over large areas across
the landscape (Holbrook et al., 2002; Dennis and Westcott, 2006), and hence to disperse
seeds along trajectory e.
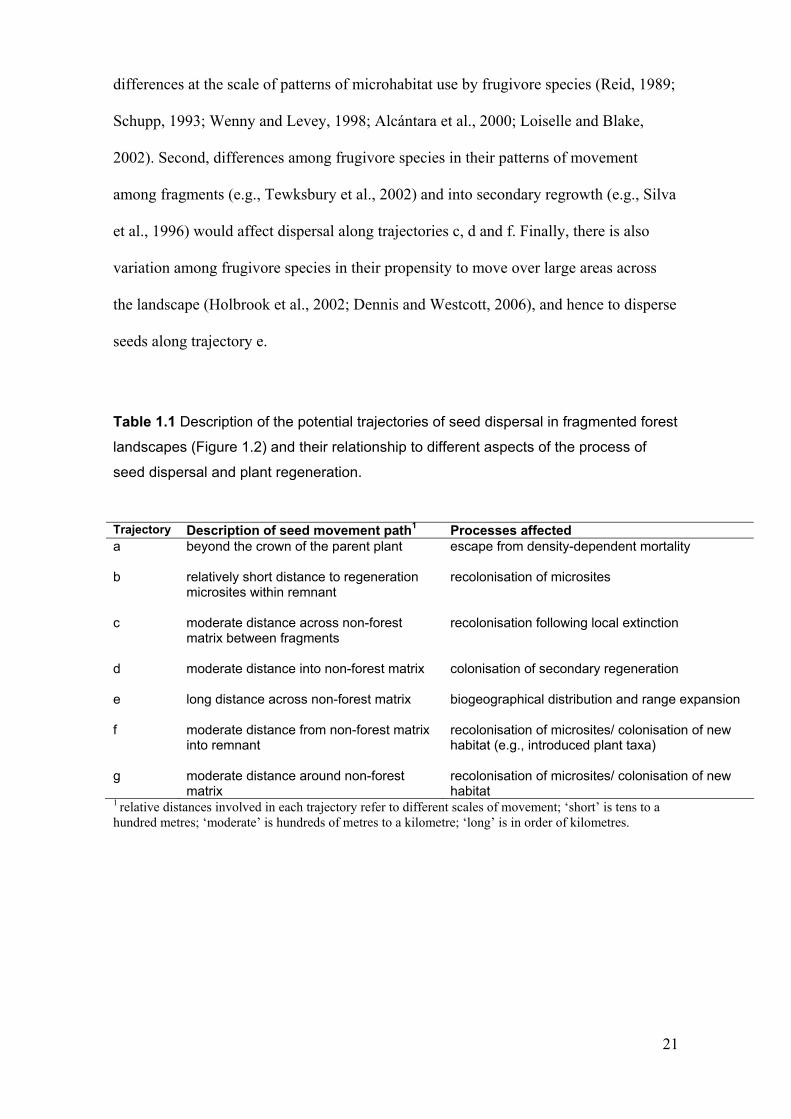
Table 1.1 Description of the potential trajectories of seed dispersal in fragmented forest
landscapes (Figure 1.2) and their relationship to different aspects of the process of
seed dispersal and plant regeneration.
Trajectory Description of seed movement path1 Processes affected a beyond the crown of the parent plant escape from density-dependent mortality b
relatively short distance to regeneration microsites within remnant
recolonisation of microsites
c
moderate distance across non-forest matrix between fragments
recolonisation following local extinction
d
moderate distance into non-forest matrix
colonisation of secondary regeneration
e
long distance across non-forest matrix
biogeographical distribution and range expansion
f
moderate distance from non-forest matrix into remnant
recolonisation of microsites/ colonisation of new habitat (e.g., introduced plant taxa)
g
moderate distance around non-forest matrix
recolonisation of microsites/ colonisation of new habitat
1 relative distances involved in each trajectory refer to different scales of movement; ‘short’ is tens to a hundred metres; ‘moderate’ is hundreds of metres to a kilometre; ‘long’ is in order of kilometres.
22
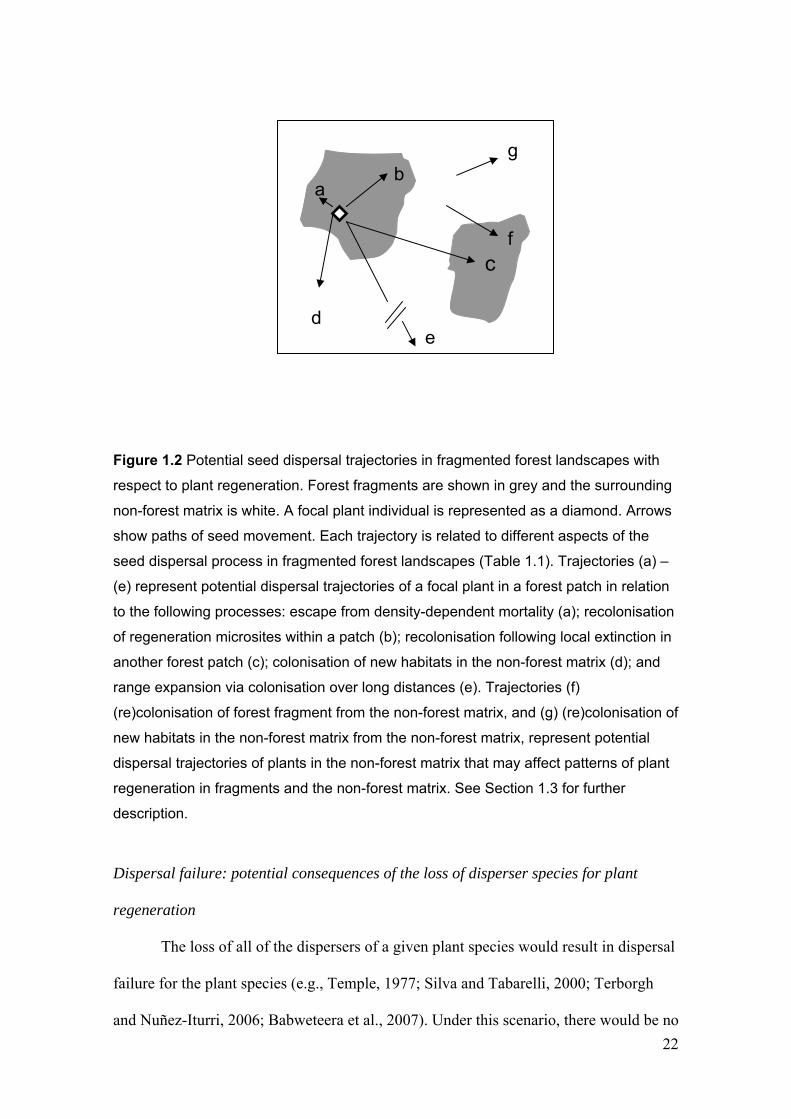
Figure 1.2 Potential seed dispersal trajectories in fragmented forest landscapes with
respect to plant regeneration. Forest fragments are shown in grey and the surrounding
non-forest matrix is white. A focal plant individual is represented as a diamond. Arrows
show paths of seed movement. Each trajectory is related to different aspects of the
seed dispersal process in fragmented forest landscapes (Table 1.1). Trajectories (a) –
(e) represent potential dispersal trajectories of a focal plant in a forest patch in relation
to the following processes: escape from density-dependent mortality (a); recolonisation
of regeneration microsites within a patch (b); recolonisation following local extinction in
another forest patch (c); colonisation of new habitats in the non-forest matrix (d); and
range expansion via colonisation over long distances (e). Trajectories (f)
(re)colonisation of forest fragment from the non-forest matrix, and (g) (re)colonisation of
new habitats in the non-forest matrix from the non-forest matrix, represent potential
dispersal trajectories of plants in the non-forest matrix that may affect patterns of plant
regeneration in fragments and the non-forest matrix. See Section 1.3 for further
description.
Dispersal failure: potential consequences of the loss of disperser species for plant
regeneration
The loss of all of the dispersers of a given plant species would result in dispersal
failure for the plant species (e.g., Temple, 1977; Silva and Tabarelli, 2000; Terborgh
and Nuñez-Iturri, 2006; Babweteera et al., 2007). Under this scenario, there would be no
a
c
b
d e
g
f
23
dispersal along any of the trajectories shown in Figure 1.2. Dispersal failure, if
combined with recruitment failure beneath parent plants, would eventually lead to a
plant species’ extinction (Temple, 1977; Janzen and Vasquez-Yanez, 1991). However,
since seedlings of many plant species may be able to recruit beneath parent plants
(Section 1.3), dispersal failure may not reduce reproduction to zero. Nevertheless,
dispersal failure is likely to reduce plant reproductive success and lead to population
decline over the longer term (Levin et al., 2003). For example, in Uganda, the tree
Balanites wilsoniana can only be dispersed by African elephants Loxodonta africana
because of the very large size of its fruit (Babweteera et al., 2007). While seedlings of
B. wilsoniana recruited in forest fragments without elephants, the survival of these
undispersed juveniles was substantially lower than that of juveniles that established
away from the parent. Therefore, it would be expected that B. wilsoniana would have
higher reproductive success in the forest where elephants were present (Babweteera et
al., 2007). Other studies have also shown higher germination rates in dispersed than
undispersed seeds (Asquith et al., 1999) and higher growth and survival of juvenile
plants that have germinated beyond the crown of conspecific plants (Hubbell and
Foster, 1990; Bleher and Böhning-Gaese, 2001).
In addition to reducing per capita reproductive success, dispersal failure of a
plant species would eliminate its ability to colonise microsites, either within a fragment
(Orrock et al., 2006; Figure 1.2, trajectory b), or between fragments (Poschlod et al.,
1996; McEuen and Curran, 2004; Figure 1.2, trajectory c). Consequently, the species
would be unable to recolonise following localised extinctions, and its distribution would
become more clumped. The population would consequently be more susceptible to local
extinction if stochastic disturbances affected all individuals in the spatially-constrained
population (Fahrig and Merriam, 1994; Cochrane et al., 1999). Furthermore, plant
species that lacked dispersal would be unable to colonise new habitats, such as
24
regenerating vegetation (Figure 1.2, trajectory d). Finally, the failed dispersal of a plant
species would mean it could not migrate over large distances. This may compromise the
survival of that plant species in the longer term, for example if its existing range became
climatically unsuitable as a result of changed global conditions (Primack and Miao,
1992; Westoby and Burgman, 2006; Weir and Corlett, 2007; Figure 1.2, trajectory e).
Potential consequences of reduced frugivore species richness or abundance for seed
dispersal and plant regeneration
The majority of rainforest plant species are likely to be dispersed by multiple
frugivore species (Wheelwright and Orians, 1982; Moermond and Denslow, 1985;
Bronstein and Hoffman, 1987). Consequently, the loss of all disperser species may be
unlikely for most plant species. In most studies, lower numbers of disperser species
and/or individuals have been reported, rather than the complete absence of dispersers
(e.g., Howe and Cordeiro, 2003; see Section 1.4).
Logically, reduced numbers of frugivore species may be associated with lower
rates of visitation and fruit removal. This has been shown empirically in Tanzania
(Cordeiro and Howe, 2003), Madagascar (Bleher and Böhning-Gaese 2001, 2006) and
Brazil (Pizo, 1997). However, in Costa Rica, Luck and Daily (2003) reported
substantially reduced frugivore species richness, but no change in rates of visitation to
Micona spp. (Melastomaceae). In Kenya, Farwig et al. (2006) reported slightly declined
species richness of frugivores at fruiting Prunus africana (Rosaceae) in forest fragments
compared with a large forest tract, but a concomitant increase in visitation and seed
removal. Therefore, the number of frugivore species visiting a plant may not be directly
related to the rate of dispersal of that plant species. Factors such as changed competitive
interactions (e.g., Willson and Crome, 1989), and density or behavioural compensation
(Loiselle and Blake, 2002) may interact with changes in the composition of the
25
frugivore assemblage to influence seed removal rates in fragmented forest landscapes.
In addition, there is variation among frugivore species in the quantity of seeds that they
disperse (Graham et al., 2002; Cordeiro and Howe, 2003), as well as the temporal
period over which they disperse seeds (Greenberg et al., 1995). Furthermore, there may
be variation among frugivore species in the proportion of seeds that they disperse to
suitable germination microhabitats (e.g, Reid, 1989; Murray et al., 1993; Wenny and
Levey, 1998; Aukema and Martínez del Rio, 2002).
Consequently, the reduced abundance or loss of different frugivore species may
have different impacts on the quantity and quality of seed dispersal. Therefore, the
consequences for seed dispersal may be difficult to predict based on information about
species richness or overall frugivore abundance. However, more detailed consequences
for seed dispersal and plant regeneration of changes in the species composition or
relative abundance of individual frugivore species may be predictable if information
about frugivore species composition is combined with an understanding of functional
variation among species and interpreted in the framework shown in Figure 1.2.
Limited knowledge regarding the disperser assemblage of most plant species
constrains the capacity to predict changes in seed dispersal following changes in the
frugivore assemblage. An exception may be large-fruited plant species; dispersal failure
may be predicted from knowledge of the loss of frugivore species if all of the species
with the morphological capacity to disperse large fruits have gone extinct, because
small frugivores are unable to disperse large fruits (Herrera, 1984; Moermond and
Denslow, 1985; Wheelwright, 1985). Because large frugivores have declined in
fragmented forest in many parts of the world (see Section 1.5), it has been predicted that
dispersal of large-fruited plant species will consequently be reduced or fail (Corlett,
1996, 1998; Corlett and Turner, 1997; Silva and Tabarelli, 2000; McConkey and Drake,
2002; Kitamura et al., 2005). In Uganda, Chapman and Onderdonk (1998) found that

26
the abundance of seedlings, especially of large-seeded plant species, declined in
fragments with reduced abundance of primates, compared with extensive forest.
1 .7 Aims and structure of this thesis
The aim of this thesis is to investigate changes in the frugivorous vertebrate
assemblage as a consequence of rainforest fragmentation in the moist subtropics of
Australia, and to assess the potential for subsequent changes in seed dispersal. This
broad aim is addressed first by investigating the effects of fragmentation on the
frugivore species within a complete regional assemblage, and then by assessing the
potential roles of the different frugivore species in seed dispersal through analyses of
their morphology, behaviour and patterns of consumption of plant species. Finally, this
information is synthesised to predict the consequences of fragmentation for seed
dispersal by frugivores.
In his review of the biological effects of rainforest fragmentation, Turner (1996)
recommended three key research directions to advance ecological understanding of the
consequences of rainforest fragmentation: (1) study in older fragments, (2) the
identification of susceptible groups of taxa, and (3) the assessment of higher order
effects, including seed dispersal. Rainforest landscapes in subtropical Australia present
an opportunity to undertake study of all three research areas. First, forests in this region
have been fragmented for 70-150 years, sufficient time for assemblages to undergo
some degree of ‘relaxation’ (Brooks et al., 1999). Second, for reasons detailed below,
the vertebrate frugivore assemblage in subtropical Australia may be well suited to
identifying variation among species in their responses to fragmentation and functional
roles. Third, this approach may contribute to the development of a predictive
understanding of the secondary consequences of rainforest fragmentation for seed
dispersal.
27
Compared with many other regions of the world, the frugivore assemblage in
Australia is relatively simple (Crome, 1978; Dennis, 1997; Corlett and Primack, 2006).
The dominant frugivores are birds and bats (Green, 1993, 1995). There are no primates
or other non-volant frugivorous mammals as in other regions (e.g., Corlett, 1998).
In addition to its relative simplicity, there is a substantial amount of information
on the consumption of fleshy fruited plants by frugivore species in subtropical Australia
(e.g., Innis, 1989; Green, 1995; Recher et al., 1995; Church, 1997), and dietary
information has been partly compiled for each species in the Handbook of Australian,
New Zealand and Antarctic Birds (HANZAB) series (Marchant & Higgins, 1993;
Higgins & Davies, 1996; Higgins, 1999; Higgins et al., 2001), although it has not been
synthesised across any regional bird assemblage.
Furthermore, there is a sufficient number of species comprising the frugivore
assemblage in subtropical Australia to detect strong patterns of variation among species,
if they exist. Many previous community-wide studies of the of patterns of plant species
consumption by frugivore species have been conducted in ecosystems with few
frugivorous species, such as Mediterranean scrublands (18 bird species; Herrera
(1984)), littoral forest in Madagascar (6 bird species and 7 mammal species; Bollen et
al. (2004)) and temperate rainforest in Canada (6 bird species; Burns (2006)). The small
numbers of frugivore species in these studies may have made it difficult to detect
statistically significant variation among species. Based on the number of frugivorous
bird species recorded at fruiting trees, there are at least 32 frugivorous bird species in
subtropical Australia (Green, 1993).
Specifically, this thesis addresses three sets of questions relating to:
1. the distribution and abundance of frugivorous bird and bat species in
fragmented forest relative to extensive rainforest in a specific study region
(the Sunshine Coast) of subtropical Australia;
28
2. variation among these frugivore species in their seed dispersal potential
(assessed using degree of frugivory, capacity for ingesting large seeds, and
other attributes), and their patterns of consumption of plant species and types
of fruits; and
3. the extent to which the seed dispersal potential of rainforest plant species is
likely to change as a consequence of changes in the frugivorous vertebrate
community in fragmented rainforest.
Figure 1.3 summarises the structure and conceptual links among the subsequent
chapters of this thesis.
In Chapter Two, the specific composition of the frugivorous bird assemblage in
the fragmented subtropical rainforest landscape of the Sunshine Coast, Australia is
identified. This chapter also presents the results of field surveys aimed at assessing
whether the abundance of frugivorous bird species is affected by forest fragmentation,
using replicate sites of extensive, remnant and regrowth rainforest.
In Chapter Three, functional traits of frugivorous bird species that may
influence their role as seed dispersers are assessed for the frugivorous bird assemblage.
Specifically, bird species’ gape width, degree of frugivory and seed treatment are
analysed in relation to their responses to fragmentation. Information about the response
of frugivorous bird species in extensive versus fragmented forest (Chapter Two) is used
to assess the possibility of reduced dispersal potential of rainforest plant species in
fragmented rainforest.
In Chapter Four, data on plant species consumption by frugivorous bird species
are compiled from published literature and field records. Tests of association are
conducted between the frugivore traits that were used in functional analyses conducted
in Chapter Three, and frugivore species’ patterns of plant species consumption.
29
In Chapter Five, patterns of plant species consumption by frugivorous bird
species are assessed using the same data as in Chapter Four in relation to the potential
for reduced dispersal of certain plant species as a result of declined abundance of
particular bird species in fragmented rainforest.
In Chapter Six, the species composition and responses to forest fragmentation
of the frugivorous bat assemblage is identified for the same site network as the bird
assemblage considered in Chapter Two. Information on patterns of plant species
consumption by these bats is used to assess their potential to disperse similar plant
species to frugivorous birds, particularly those bird species that decline in fragmented
forest.
Chapter Seven provides a synthesis of the findings of the previous chapters in
relation to understanding the functional roles of frugivore species in seed dispersal and
predicting consequences of rainforest fragmentation for seed dispersal. This chapter
makes specific predictions regarding seed dispersal and plant regeneration in
fragmented rainforests of the study region and considers the implications for
conservation.

30
C
hap
ter
Tw
o: C
hang
es in
the
avia
n fr
ugiv
ore
asse
mbl
age
in fr
agm
ente
d ra
info
rest
com
pare
d w
ith e
xten
sive
fore
st in
sub
trop
ical
Aus
tral
ia
Qua
ntit
ativ
e su
rvey
s of
fru
givo
rous
bir
d sp
ecie
s in
ex
tens
ive
fore
st, r
emna
nt &
reg
row
th.
Ch
apte
r S
ix:
The
dis
trib
utio
n of
fr
ugiv
orou
s ba
ts a
nd th
eir
pote
ntia
l to
dis
pers
e se
eds
in f
ragm
ente
d ra
info
rest
.
Sur
veys
of
frug
ivor
ous
bat s
peci
es in
ex
tens
ive
fore
st, r
emna
nt a
nd
regr
owth
. Ana
lyse
s pa
tter
ns o
f pl
ant
spec
ies
cons
umpt
ion,
esp
ecia
lly
in
rela
tion
to s
peci
es c
onsu
med
by
frug
ivor
ous
bird
s th
at d
ecli
ne in
fr
agm
ente
d fo
rest
(C
hapt
er 5
).
Ch
apte
r T
hre
e: S
eed
disp
ersa
l pot
entia
l of
frug
ivor
ous
bird
spe
cies
in r
elat
ion
to th
eir
gape
wid
th, f
rugi
vory
leve
l and
see
d tr
eatm
ent
Pro
pose
s ke
y fu
ncti
onal
trai
ts o
f fr
ugiv
orou
s bi
rd s
peci
es. P
redi
cts
cons
eque
nces
of
chan
ges
in th
e fr
ugiv
orou
s bi
rd a
ssem
blag
e (C
hapt
er 2
) fo
r se
ed d
ispe
rsal
usi
ng th
is a
ppro
ach.
Ch
apte
r F
ou
r: V
aria
tion
in p
atte
rns
of p
lant
sp
ecie
s co
nsum
ptio
n by
frug
ivor
ous
bird
sp
ecie
s is
rel
ated
to
gape
wid
th,
degr
ee o
f fr
ugiv
ory
and
seed
trea
tmen
t T
ests
pre
dict
ed r
elat
ions
hips
bet
wee
n fr
ugiv
ore
trai
ts a
nd p
atte
rns
of p
lant
spe
cies
con
sum
ptio
n (C
hapt
er 3
).
Usi
ng a
ttri
bute
s of
frug
ivor
e sp
ecie
s to
pr
edic
t the
ir fu
ncti
onal
rol
es in
see
d di
sper
sal
Usi
ng p
atte
rns
of p
lant
spe
cies
con
sum
ptio
n by
fr
ugiv
ore
spec
ies
to a
sses
s po
tent
ial c
hang
es in
se
ed d
ispe
rsal
and
pla
nt r
egen
erat
ion
Ch
apte
r F
ive:
Red
uced
dis
pers
al p
oten
tial o
f na
tive
rain
fore
st p
lant
spe
cies
in fr
agm
ente
d ra
info
rest
Use
s in
form
atio
n on
pat
tern
s of
pla
nt s
peci
es
cons
umpt
ion
to p
redi
ct c
onse
quen
ces
of th
e ch
ange
s in
the
avia
n fr
ugiv
ore
asse
mbl
age
(Cha
pter
2)
for
seed
dis
pers
al.
Ch
apte
r S
eve
n:
Gen
eral
dis
cuss
ion:
C
onse
quen
ces
of f
ores
t fra
gmen
tatio
n fo
r fr
ugiv
orou
s ve
rteb
rate
s an
d ra
info
rest
se
ed d
ispe
rsal
S
ynth
esis
es th
e re
sult
s fr
om e
ach
chap
ter
and
mak
es r
ecom
men
dati
ons
for
cons
erva
tion
an
d re
sear
ch.
Fig
ure
1.3
Con
cept
ual l
inks
bet
wee
n th
e ch
apte
rs o
f th
is t
hesi
s.
31
1.8 Rainforest fragmentation, frugivores and seed dispersal in
Australia
There are three major areas of rainforest along the east coast of Australia. These are the
tropical rainforests of north Queensland (approximately 15ºS - 19ºS), the subtropical
rainforests of southern Queensland and northern New South Wales (26ºS - 30ºS), and
the cooler temperate rainforests of Tasmania (40 - 44ºS) (Webb and Tracey, 1981).
Smaller patches of rainforest (including ‘dry rainforests’) occur across coastal and sub-
coastal areas of northern and eastern Australia (Webb and Tracey, 1981; Bowman,
2000).
Australian rainforests are relicts of ancient rainforests that formerly covered
extensive areas of the continent (Kershaw et al., 1991). Cool and dry climatic conditions
during the late Tertiary, and especially during the Pleistocene, resulted in the retraction
of rainforest to moist and protected refugial areas (Webb and Tracey, 1981; Adam,
1992; Goosem, 2000). During this period, much of the rainforest in Australia was
replaced by open forests, woodland, savanna and grasslands, which were better suited to
the changed climatic conditions and associated increase in fire (Martin, 1990; Kershaw
et al., 1991). There has been some minor re-expansion of rainforest over the last few
thousand years, although the distribution of rainforest remains disjunct, reflecting the
“archipelago of refugia” that were available during former climatic regimes (Webb and
Tracey, 1981: 609). The current distribution of rainforest in Australia is shown in the
National Land and Water Resources Audit (NLWRA) (2001).
Formerly, large tracts of continuous subtropical rainforest (tens of thousands of
hectares) were associated with fertile soil on basalt lava flows on plateaux (e.g., the
Lamington and Maleny plateaux in southern Queensland, and the ‘Big Scrub’ of
northern New South Wales). Rainforest also occurs in areas of less fertile soils. In the
Australian subtropics, rainforests on poor soil are restricted to areas that receive high
32
rainfall, are locally nutrient-enriched and moist (e.g., along watercourses), or are
associated with topographic features that provide protection from fire (e.g., gullies)
(Webb and Tracey, 1981). Patches of subtropical rainforest in these situations are
typically surrounded by more extensive, drier and fire-prone forest types (often
dominated by dry-fruited Eucalyptus and related tree genera).
Large areas of subtropical rainforest have been cleared in Australia (Webb and
Tracey, 1981). Most of the clearing in these rainforest landscapes was for agriculture
and occurred from the mid 1800s (Young and McDonald, 1987; Watson, 1989;
Frawley, 1991; Catterall and Kingston, 1993). The pre-European rainforest cover across
the continent was estimated to have been four million ha; it has been estimated that
approximately three-quarters of this remains (NLWRA, 2001). Subtropical rainforests
have been heavily cleared from basalt plateaux, in the lowlands and along watercourses
(Catterall and Kingston, 1993). For example, less than 1% of the original rainforest
cover remains of the Big Scrub, formerly the most extensive patch of lowland
subtropical rainforest in Australia (Frith, 1952, 1976; Floyd, 1990). Large forest tracts
are now mostly restricted to upland areas (Webb and Tracey, 1981; Catterall and
Kingston, 1993; Date et al., 1996).
Contemporary rainforest landscapes in Australia resemble those in many other
regions of the world in comprising a mosaic of remnant forest patches, grazed land,
agricultural cropland, tree crops, regrowth and suburban development (e.g., Guevara
and Laborde, 1993; Benítez-Malvido and Martínez-Ramos, 2003). An important point
of difference is that there is no shifting agriculture in Australia, whereas this is a feature
of rainforests in some parts of Asia (e.g., Lawrence, 2004) and South America
(Tabarelli and Peres, 2002).
There is a lack of knowledge regarding ecological processes in fragmented
rainforest landscapes in the Australian subtropics, including the dynamics of plant
33
regeneration (Adam, 1992; Green, 1995; Gilmore 1999; Hunter 1999). As a
consequence, the long-term conservation values of the region’s remnant rainforests may
be compromised, for example if regeneration trajectories are truncated by a lack of
dispersal of certain plant taxa. This thesis provides new information relating to these
issues.

34
Chapter Two
Changes in the avian frugivore assemblage in fragmented rainforest
compared with extensive forest in subtropical Australia
2.1 Introduction
Populations of many frugivorous bird species have declined following the
fragmentation of tropical rainforests (Kattan et al. 1994; Date et al., 1996; Bierregaard
and Stouffer, 1997; Pizo, 1997; Corlett, 1998; Renjifo, 1999; Castelletta et al., 2000;
Silva and Tabarelli 2000; Cordeiro and Howe, 2001, 2003; Ribon et al., 2003). It has
been suggested that some frugivorous bird species from subtropical Australia may also
be sensitive to rainforest fragmentation (Frith, 1952; Date et al., 1991; Date et al., 1996;
Price et al., 1999). Furthermore, it has been suggested that certain frugivorous bird
species may migrate seasonally between upland and lowland areas in response to
altitudinal differences in fruit availability (Innis, 1989; Date et al., 1991). Because
rainforests have been heavily cleared in the lowlands of subtropical Australia (Catterall
et al., 1997), seasonal dependence on these areas may limit populations of these
frugivorous bird species (Date et al., 1991). However, species’ responses to forest
fragmentation in subtropical Australia have not been assessed across the avian frugivore
assemblage.
Understanding the use of fragmented forests by birds in the context of extensive
and ongoing rainforest clearing may help develop management strategies appropriate
for avian conservation (Saunders et al., 1991; Sodhi et al., 2004). Furthermore,
frugivores disperse the seeds of a large proportion of rainforest plant species (Willson et
al., 1989; Butler, 2003). Consequently, changed numbers of frugivores in fragmented
rainforest may result in changed patterns of plant regeneration (Janzen and Vasquez-
Yanez, 1991; Harrington et al., 1997; Restrepo et al., 1997; Corlett, 1998; Silva and
35
Tabarelli, 2000). For example, the decline of particular frugivore species in fragmented
landscapes may mean that certain plant species have lower dispersal potential in these
areas. The declined abundance of a suite of frugivorous bird species in small forest
fragments in Tanzania has been associated with reduced seed dispersal, lower levels of
recruitment, and clumped spatial patterns of recruitment of certain plant species
(Cordeiro and Howe, 2001, 2003). In particular, large fruited plant species may be
especially susceptible to reduced dispersal in fragmented landscapes because of the
decline of large bodied frugivores (Corlett, 1996, 1998; Harrington et al., 1997; Silva
and Tabarelli, 2000; Kitamura et al., 2002; McConkey and Drake, 2002; Meehan et al.,
2002).
In this chapter, frugivorous bird species’ abundances are assessed in fragmented
rainforest in a subtropical Australian landscape. Specifically, differences in the
abundance of frugivorous bird species between large tracts of forest, rainforest remnants
and patches of rainforest regrowth are quantified. It is expected that the abundance of
certain species may be lower in remnants and regrowth than in extensive forest, while
that of other species may be higher. The effects of season and altitude on the birds’ use
of rainforest habitats are also assessed. It is anticipated that certain species may occur in
upland areas during summer and lowland areas during winter (Date et al., 1991; Recher
et al. 1995). Potential implications of observed changes in the frugivorous bird
assemblage for the dispersal of large fruited and other rainforest plants in fragmented
landscapes are described.
2.2 Methods
2.2.1 Study region
The study was conducted in a 4 000 km2 subtropical rainforest landscape in the
hinterland of the region known as the Sunshine Coast, approximately 100 km north of
36
the city of Brisbane in Southeast Queensland, Australia (152-154˚ E, 26-27˚ S).
Approximately two-thirds of the pre-European forest cover has been cleared throughout
the region (Catterall et al., 1997), including extensive areas of rainforest (Meier and
Figgis, 1985; Young and McDonald, 1987). Extant forest fragments comprise a mosaic
with cattle grazing land, agricultural cropland, plantation forests and suburban
development (e.g., Figure 2.1).
Rainforest in coastal lowland areas of the study region had been almost totally
cleared by the early 20th century (Frawley, 1991). Except for rainforest patches within
open forests in the Cooloola area in the north, lowland rainforest has been reduced to
scattered, small isolates behind coastal sand dunes or fringing watercourses. Rainforest
in sub-coastal lowlands associated with the Mary River Valley, situated approximately
30 kilometres inland, have also been heavily cleared, mostly for cattle grazing. Much of
the remainder of the study region comprises undulating terrain associated with the
Blackall and Conondale Ranges. A large expanse of continuous rainforest formerly
occurred on the basaltic plateau of the Blackall Range, but this had been extensively
cleared by the early twentieth century, firstly for timber and then for dairy farming
(Young and McDonald, 1987; Watson, 1989; Frawley, 1991), leaving rainforest
remnants in gullies and along steeper slopes (e.g., Figure 2.1). Extensive eucalypt
forest-rainforest mosaics extend from the northern and southern ends of the Blackall
Range and cover large areas of the Conondale Ranges. Unmanaged rainforest regrowth
on previously cleared land makes an increasing contribution to regional forest cover.
Additionally, many small areas have been replanted by private landholders, community
groups and local authorities over the past three decades (Catterall et al., 2004).

37
Figure 2.1 Aerial view of part of the Sunshine Coast study region showing remnant and
regrowth forests interspersed with rural and residential land uses on the south eastern
part of the Blackall Range (Source: Queensland Department of Natural Resources,
1997). Forest cover tends to be associated with undulating terrain or watercourses.
The area seen in this view contains a moderate level of forest cover compared with
other fragmented parts of the landscape.
2.2.2 Site network
Study sites were chosen to represent a range of situations in which rainforest
remains or has re-established in the study region. Sixteen replicate sites within each of
three different states of rainforest landscape context and condition were selected: (i)
rainforest within extensive tracts of forest; (ii) remnant rainforest isolated from
extensive forest by surrounding cleared and modified land; and (iii) regrowth, also
isolated by cleared and modified land (Figure 2.2). Sites were identified using

38
vegetation mapping, aerial photography and on-ground assessment. As far as possible,
replicate sites within each type were distributed throughout the study region. A one-
hectare plot was marked within each of the study sites. The configuration of the plot
was influenced by the shape and landform attributes of each site, but was usually either
200 m x 50 m or 100 m x 100 m.
Extensive forest sites were distributed along eastern slopes of the Conondale
Ranges, on the northern and southern ends of the Blackall Range, and on the Cooloola
sand mass in the north of the study region (Figure 2.2). These sites were located within
forest tracts greater that 4 000 ha in size and comprising at least 20% rainforest. Many
of the extensive forest sites were located in patches of rainforest surrounded by eucalypt
open forest and woodland, together with some large areas of forest timber plantations,
usually the native hoop pine Araucaria cunninghamii. Extensive forest sites that were
located in the smaller rainforest patches (several hectares) contained a more
conspicuous eucalypt element, a lower diversity and abundance of rainforest plant
species and were less structurally complex than sites located among larger rainforest
patches (tens to hundreds of hectares).
The sixteen extensive forest sites were stratified by altitude: five were located in
upland (>500 m a.s.l), six in mid-elevation (200-500 m a.s.l) and the remaining five in
lowland (<200 m a.s.l.) forests (overall range 90-800 m a.s.l., mean 370 m, S.E. 53 m).
Remnants and regrowth were located at mid-elevations and in lowland areas (both
ranging from 20-500 m a.s.l.: remnants, mean 206 m, S.E. 41 m; regrowth, mean 165
m, S.E. 41 m). It was not possible to locate high altitude replicate sites of remnant or
regrowth rainforest.
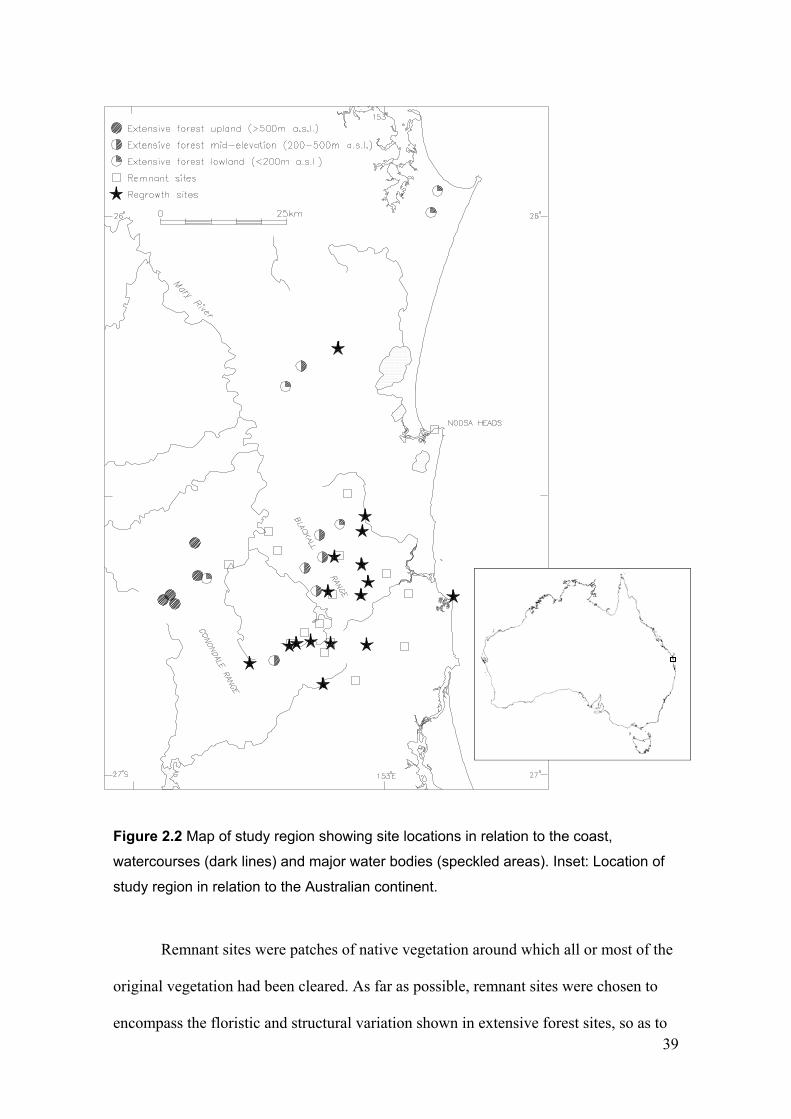
39
Figure 2.2 Map of study region showing site locations in relation to the coast,
watercourses (dark lines) and major water bodies (speckled areas). Inset: Location of
study region in relation to the Australian continent.
Remnant sites were patches of native vegetation around which all or most of the
original vegetation had been cleared. As far as possible, remnant sites were chosen to
encompass the floristic and structural variation shown in extensive forest sites, so as to
40
concentrate on the influence of landscape situation rather than resource differences.
Eight were remnants of the formerly-extensive rainforest on the basaltic Blackall Range,
seven had a sclerophyll forest component (e.g. trees from Eucalyptus and Lophostemon)
and the remaining site was littoral rainforest. Remnant sites were often situated along
watercourses, in gullies and on slopes that were too steep to be cleared. The interiors of
remnant patches were generally intact, although some had been selectively logged. Sites
were not currently grazed by cattle.
The following fleshy fruited plant taxa were characteristic of extensive and
remnant sites: palms (e.g. Archontophoenix cunninghamiana and Livistona australis),
figs Ficus spp., laurels (especially Cryptocarya spp. and Endiandra spp.),
Elaeocarpaceae (Elaeocarpus and Sloanea spp.), basswoods (especially Polyscias spp.),
Sapotaceae (e.g. Pouteria spp.), Sapindaceae (e.g. Diploglottis australis) and fleshy
fruited Myrtaceae (e.g. Syzygium and Acmena spp.). Fleshy fruited vines, especially the
native grapes (Cissus spp. family Vitaceae), whip vine Flagellaria indica and climbing
pandans Freycinetia spp. (both genera from the Pandanaceae) were common throughout
extensive and isolated remnant sites. Some remnant sites seemed to contain a greater
proportion of pioneer species such as bleeding heart Homalanthus nutans and
macaranga Macaranga tanarius (both Euphorbiaceae), blackwood wattle Acacia
melanoxylon (Mimosaceae) than extensive sites. These and fleshy fruited weeds such as
camphor laurel Cinnamomum camphora (Lauraceae), broad- and small-leaved privet
Ligustrum lucidum and L. sinense (Oleaceae), wild tobacco Solanum mauritianum
(Solanaceae) and lantana Lantana camara (Verbenaceae) were usually found in areas of
ongoing disturbance, such as around walking tracks or near edges, especially in smaller
remnants.
Regrowth sites were located mostly on former cattle pasture that had been
regenerating for at least a decade. The floristic and structural composition of regrowth

41
sites differed from remnant and extensive forest sites. Patches with a developed tree
species layer about 10 to 15 m in height were chosen. Regrowth sites generally
contained a lower abundance and diversity of large-diameter trunks than remnant and
extensive forest sites. Regrowth sites commonly contained the following plant taxa:
sandpaper figs (Ficus coronata and F. fraseri Moraceae), jackwood Cryptocarya
glaucescens, bleeding heart Homalanthus nutans, basswood Polyscias elegans
(Araliaceae), wild quince Guioa semiglauca (Sapindaceae), and piccabeen palms
Archontophoenix cunninghamiana. The suite of introduced woody weeds from the
Lauraceae, Oleaceae, Solanaceae and Verbenaceae that occurred in disturbed areas in
remnants was common in most regrowth sites. Fleshy fruited vines were also common.
There were more patches of rainforest throughout extensive forest mosaics than
in the landscapes surrounding remnant and regrowth sites. Individual remnant and
regrowth sites varied in their isolation from other forest, with some sites located within
relatively well forested (>50% forest cover) areas, many sites in moderately forested
(30-50%) parts of the landscape, and several in areas where over 70% of the forest had
been cleared. Regrowth sites were often situated in more highly cleared parts of the
landscape than remnant sites. Sites of the same type were separated by at least 2 km,
and most were more than 5 km apart. Sites of different types were also usually well
separated, although there were four cases where a remnant and a regrowth site were
closely situated. Most remnant and regrowth sites were between five and 10 km from
extensive forest, although some were located further away. Remnant sites ranged in size
(including interspersed eucalypt forest) from two to 100 ha (approximate mean 46.1 ha,
S.E. 9.4 ha) and regrowth sites were between approximately two and 10 ha in size
(mean 3.4 ha, S.E. 0.5 ha).
42
2.2.3 Bird surveys
The quantitative measure of bird abundance was the number of individuals of
each frugivorous bird species seen or heard during a 40 minute visit to each 1 ha plot.
Bird counts were conducted within four hours of dawn and involved walking throughout
the plot as many times as possible, following up on movements and sounds of falling
fruit. A combination of visual detection and call recognition was used to identify the
bird species. Most of the frugivorous bird species have loud, distinctive calls, making
them equally detectible across site types. Small, canopy-dwelling species (e.g.
mistletoebird) may have been under-recorded if they were not calling. The author
surveyed all sites. Bird surveys were not conducted during strong wind or heavy rain.
Each plot was surveyed in this manner on four separate occasions; twice during
January-March (summer) and twice between July and September (winter) in 2001.
Consecutive surveys at any site were no less than three weeks apart. The total
observation time at each site was 160 minutes; 80 minutes in both summer and winter.
The data on frugivorous bird distribution deriving from these bird surveys was
used in subsequent chapters of this thesis (Chapters Three, Five and Six). The
distribution of frugivorous bats was assessed using the same site network (reported in
Chapter Six).
2.2.4 Data treatment
The number of individuals of each frugivorous bird species was summed across
the two visits made during a season. Data for species that were recorded in less than five
sites in either season were not statistically analysed because their frequency was
considered too low to determine a distribution pattern. A two-way split plot Analysis of
Variance (ANOVA) was used to test whether the abundance of birds that were recorded
in at least five sites during both seasons varied between site types (three levels:

43
extensive, remnant, regrowth) and seasons (two levels: summer, winter). Season was
used as the split, with site nested within site type (site:site type) as the error term when
testing for effect of site type, and site:site type x season as the error term when testing
for the effect of season or the interaction between season and site type. Where a species
was recorded in at least five sites during one season only, a one-way ANOVA was
conducted on the data from only that season to test for an effect of site type on
abundance, and a paired t-test was used to test whether the difference in numbers
between seasons was significant. A species was considered to show a substantial
difference in numbers between summer and winter if the ANOVA result was significant
and the abundance turnover exceeded 50% (after Catterall et al., 1998). The method
used to calculate seasonal turnover:
percent abundance turnover =
Where: max. is number of individuals recorded in the season in which the species was most
common; and
min. is the number in the season in which it was least common.
Where there was a significant effect of site type, Least Significant Difference
(LSD) comparisons were conducted to test for pair-wise differences. ANOVA procedures
and LSD tests were conducted using the SAS statistical package (SAS Institute 1999).
Multidimensional scaling ordination using the semi-strong hybrid technique
(Faith et al., 1987) in WinPATN (Belbin et al., 2003) was used to describe differences
among the 48 sites in terms of patterns of variation in frugivorous bird species
composition. Data for 39 bird species were included in these analyses; three species that
were detected at only one site (rock dove, blue-faced honeyeater and house sparrow)
(max. – min.)
max.
x 100
44
were not included. Principal axis correlations were conducted to determine associations
between the site ordination and the abundance of each bird species; associations found
to be significant (at p<0.05) using a randomisation test (10 000 iterations) were
displayed as species abundance vectors in the ordination space. Analysis of Similarity
(ANOSIM; Clarke and Green, 1988) was used to test for overall and pair-wise
differences (using 10 000 iterations) among the three site types in their frugivorous bird
species composition.
An interaction between site elevation (three levels: high (N=5), mid (N=6) or
low (N=5)) and season (two levels: summer and winter) on selected frugivorous bird
numbers in extensive forest was tested by way of a two-factor ANOVA using the PROC
GLM procedure in SAS (SAS Institute 1999). Analyses were conducted on pooled data
for all frugivorous birds and separately on data for selected species (those nominated as
being altitudinal migrants by Date et al. (1991)).
2.2.5 Classification of frugivorous birds
Literature searches revealed records of many bird species consuming fleshy
fruit. As pointed out by Jones and Crome (1990), almost any rainforest-dwelling
vertebrate will occasionally eat fleshy fruit, although some species do so very rarely.
Reference texts were used to systematically determine which of the bird species
recorded during field surveys were frugivorous. A species was classified as frugivorous
if frugivory was included in its dietary description in Blakers et al. (1984), or if it had
been recorded consuming fruits from more than plant three genera in Barker and
Vestjens (1988, 1989) or in the Handbook of Australian, New Zealand and Antarctic
Birds (HANZAB) series (Marchant and Higgins, 1993; Higgins and Davies, 1996;
Higgins, 1999; Higgins et al., 2001)). Parrots, lorikeets, rosellas, cockatoos (Green,
1993) and some pigeons (Frith, 1982) grind or crush many, if not most of the seeds
45
from the fleshy fruits they consume. Although such birds may have relatively low
potential as seed dispersers (Snow, 1981), they were included in the list of avian
frugivores if they satisfied the previous criteria.
2.3 Results
2.3.1 Abundance of frugivorous bird species in extensive, remnant and regrowth sites
Using the criteria stated in Section 2.2.5, 42 bird species were classified as
frugivores (Table 2.1). In total, 2768 individuals from these species were recorded
during surveys. Other species that were known to eat fruit infrequently were recorded
during surveys but these did not meet the stated criteria and are not considered further in
this study. Of the 42 frugivorous bird species recorded during surveys, 26 were
sufficiently common (present at five or more sites in at least one season) for statistical
analyses (Table 2.1). Twelve of these 26 species showed a statistically significant
(P<0.05) difference in abundance among the three site types in one or both seasons. The
patterns of abundance change between remnant and/or regrowth sites and extensive
forest are indicated in Table 2.2. Eight frugivorous bird species showed a significant
difference between seasons together with greater than 50% seasonal turnover in
abundance. The rose-crowned fruit-dove Ptilinopus regina and scarlet honeyeater
Myzomela sanguinolenta showed a significant interaction between site type and season.
Patterns of statistically significant differences in abundance between site types (Table
2.2, Figure 2.3) grouped readily into three classes:
1. decreasers: species that showed lower numbers outside extensive forest in
remnant and/or regrowth sites;
2. increasers: species that showed higher numbers outside extensive forest in
remnant and/or regrowth sites; and
46
3. tolerant: no significant difference in numbers between remnants, regrowth and
extensive forest.
There were five decreaser species (Tables 2.2, 2.3), three of which were fruit-
doves (Ptilinopus spp.). The fruit-doves generally showed declining abundance from
extensive forest through remnants to regrowth (Tables 2.2, Figure 2.3(i-ii)). The other
two decreasers, the brown cuckoo-dove and green catbird, showed similar abundance in
extensive and remnant forests but were less common in regrowth (Table 2.2, Figure
2.3(iii)). There were seven increaser species (Tables 2.2, 2.3, five of which (rainbow
lorikeet, black-faced cuckoo-shrike, figbird, Torresian crow and silvereye) were
significantly more abundant in regrowth than in either remnant or extensive forest
(Table 2.2, Figure 2.3(v)). The increaser bar-shouldered dove showed similar abundance
between remnant and regrowth sites and was absent from extensive forest (Figure
2.3(iv)), while the Australian magpie was present, but least abundant in extensive forest,
and most abundant in regrowth, with numbers in remnant forest intermediate (Table 2.2,
Figure 2.3(vi)). The remaining 14 species were classified as tolerant (Table 2.3), since
their numbers did not differ significantly among site types (Table 2.2, Figure 2.3(vi)).
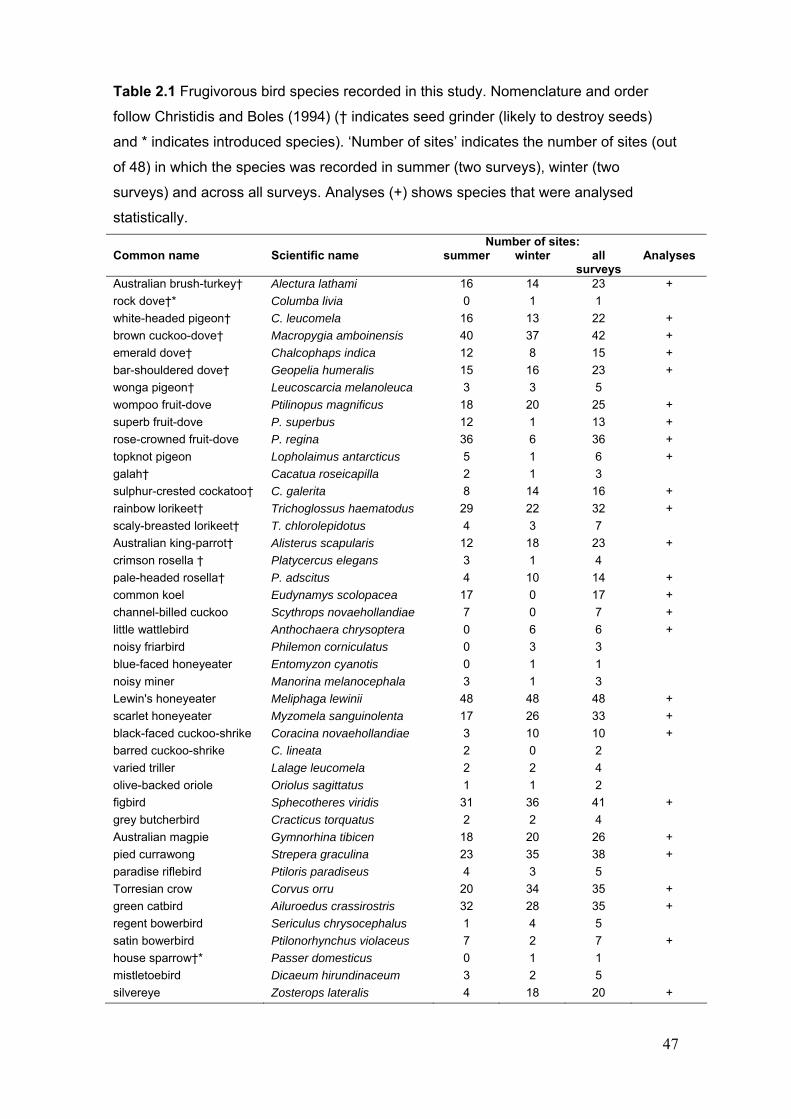
47
Table 2.1 Frugivorous bird species recorded in this study. Nomenclature and order
follow Christidis and Boles (1994) († indicates seed grinder (likely to destroy seeds)
and * indicates introduced species). ‘Number of sites’ indicates the number of sites (out
of 48) in which the species was recorded in summer (two surveys), winter (two
surveys) and across all surveys. Analyses (+) shows species that were analysed
statistically.
Number of sites: Common name Scientific name summer winter all
surveys Analyses
Australian brush-turkey† Alectura lathami 16 14 23 +
rock dove†* Columba livia 0 1 1
white-headed pigeon† C. leucomela 16 13 22 +
brown cuckoo-dove† Macropygia amboinensis 40 37 42 +
emerald dove† Chalcophaps indica 12 8 15 +
bar-shouldered dove† Geopelia humeralis 15 16 23 +
wonga pigeon† Leucoscarcia melanoleuca 3 3 5
wompoo fruit-dove Ptilinopus magnificus 18 20 25 +
superb fruit-dove P. superbus 12 1 13 +
rose-crowned fruit-dove P. regina 36 6 36 +
topknot pigeon Lopholaimus antarcticus 5 1 6 +
galah† Cacatua roseicapilla 2 1 3
sulphur-crested cockatoo† C. galerita 8 14 16 +
rainbow lorikeet† Trichoglossus haematodus 29 22 32 +
scaly-breasted lorikeet† T. chlorolepidotus 4 3 7
Australian king-parrot† Alisterus scapularis 12 18 23 +
crimson rosella † Platycercus elegans 3 1 4
pale-headed rosella† P. adscitus 4 10 14 +
common koel Eudynamys scolopacea 17 0 17 +
channel-billed cuckoo Scythrops novaehollandiae 7 0 7 +
little wattlebird Anthochaera chrysoptera 0 6 6 +
noisy friarbird Philemon corniculatus 0 3 3
blue-faced honeyeater Entomyzon cyanotis 0 1 1
noisy miner Manorina melanocephala 3 1 3
Lewin's honeyeater Meliphaga lewinii 48 48 48 +
scarlet honeyeater Myzomela sanguinolenta 17 26 33 +
black-faced cuckoo-shrike Coracina novaehollandiae 3 10 10 +
barred cuckoo-shrike C. lineata 2 0 2
varied triller Lalage leucomela 2 2 4
olive-backed oriole Oriolus sagittatus 1 1 2
figbird Sphecotheres viridis 31 36 41 +
grey butcherbird Cracticus torquatus 2 2 4
Australian magpie Gymnorhina tibicen 18 20 26 +
pied currawong Strepera graculina 23 35 38 +
paradise riflebird Ptiloris paradiseus 4 3 5
Torresian crow Corvus orru 20 34 35 +
green catbird Ailuroedus crassirostris 32 28 35 +
regent bowerbird Sericulus chrysocephalus 1 4 5
satin bowerbird Ptilonorhynchus violaceus 7 2 7 +
house sparrow†* Passer domesticus 0 1 1
mistletoebird Dicaeum hirundinaceum 3 2 5
silvereye Zosterops lateralis 4 18 20 +

48
Table 2.2 Frugivorous bird species’ abundances in each of the three site types, during
summer and winter. Nomenclature and order follow Christidis and Boles (1994). The
mean abundance of individuals (No. individuals per hectare per hour; summed across
two 40-minute surveys in 1 ha) is shown for all sites (Total), in Extensive forest (Ext, 16
sites), Remnants (Rem, n=16), and Regrowth (Reg, n=16). ANOVA p shows results of
analyses testing for differences in abundance between site types (ST), seasons (S)
and STxS. x indicates season for which effect of site type was not tested (species too
infrequent). Letters next to means show LSD results (means with different letters are
significantly different). Abund. pattern corresponds with Figure 2.2 (i to iii are
“decreasers”, iv to vi “increasers”, and vii “tolerant”).
Mean abundance ANOVA p values
Bird species Season Total Ext Rem Reg ST S ST x S Abund. pattern
Australian brush-turkey s 0.63 0.44 0.82 0.63 0.35 0.17 0.96 vii
w 0.38 0.13 0.56 0.44
white-headed pigeon s 0.63 0.38 0.88 0.63 0.10 0.55 0.11 vii
w 0.77 0.19 0.63 1.50
brown cuckoo-dove s 2.04 2.75a 2.63a 0.75b 0.02 0.20 0.06 iii
w 2.46 2.06 3.63 1.69
emerald dove s 0.42 0.25 0.56 0.44 0.43 0.07 0.89 vii
w 0.23 0.13 0.38 0.19
bar-shouldered dove s 0.52 0.00b 0.88a 0.69a 0.002 0.67 0.29 iv
w 0.46 0.00 0.50 0.88
wompoo fruit-dove s 1.21 2.65a 1.00b 0.00c 0.0002 0.87 0.71 i
w 1.25 2.65 0.82 0.31
superb fruit-dove s 0.29 0.56a 0.25ab 0.06b 0.031 0.00122 ii
w 0.02 0.00 0.06 0.00 x
rose-crowned fruit-dove s 1.88 2.81a 2.00b 0.81c 0.0021 0.0001 0.04 i
w 0.23 0.56 0.13 0.00 0.071
topknot pigeon s 0.44 1.06 0.06 0.19 0.241 0.332 vii
w 0.15 0.00 0.00 0.44 x
sulphur-crested cockatoo s 0.35 0.56 0.31 0.19 0.07 0.54 0.08 vii
w 0.42 0.94 0.13 0.19
rainbow lorikeet s 2.52 1.81b 1.19b 4.56a 0.01 0.08 0.16 v
w 1.73 0.94 1.50 2.75
Australian king-parrot s 0.35 0.38 0.38 0.32 0.31 0.17 0.34 vii
w 0.65 1.06 0.63 0.26
pale-headed rosella s 0.15 0.25 0.19 0.00 x
w 0.69 0.00 0.75 1.31 0.101 0.362 vii
common koel s 0.48 0.38 0.38 0.69 0.401 0.00012 vii
w 0.00 0.00 0.00 0.00 x
channel-billed cuckoo s 0.17 0.06 0.19 0.25 0.461 0.012 vii
w 0.00 0.00 0.00 0.00 x
little wattlebird s 0.00 0.00 0.00 0.00 x
w 0.15 0.00 0.18 0.25 0.211 0.022 vii
Lewin's honeyeater s 4.29 4.13 4.75 4.00 0.46 0.04 0.53 vii
w 3.79 3.88 3.88 3.63
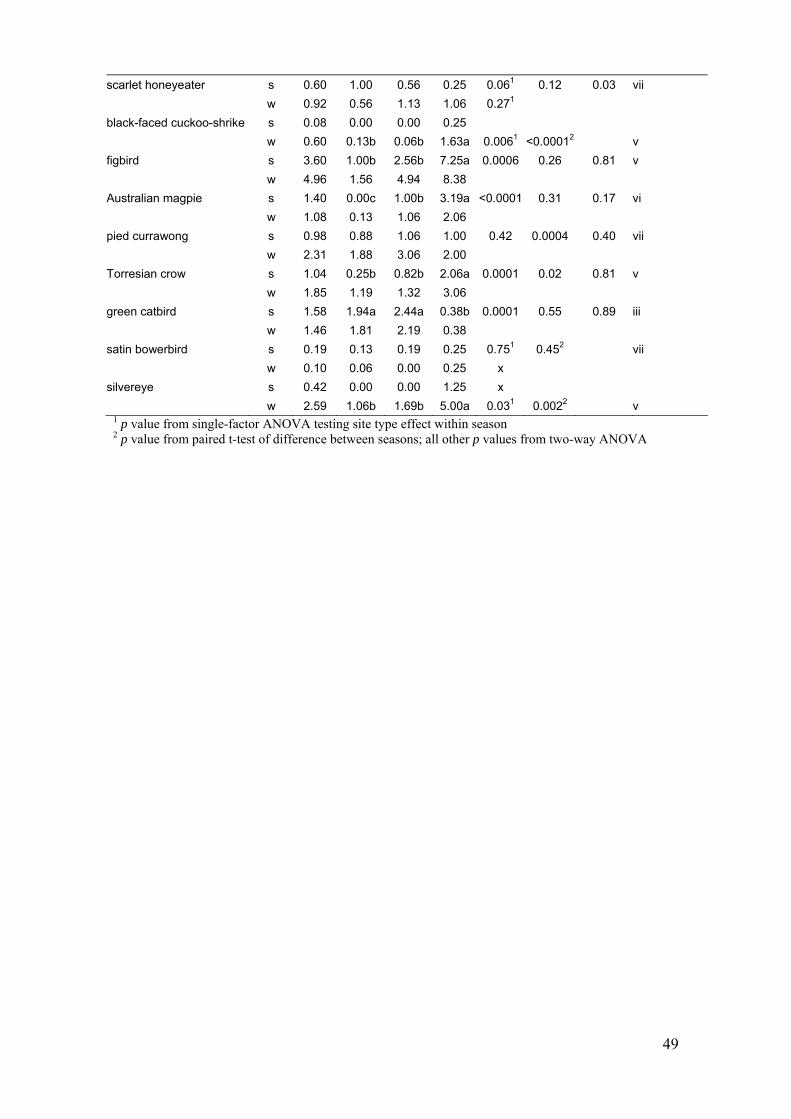
49
scarlet honeyeater s 0.60 1.00 0.56 0.25 0.061 0.12 0.03 vii
w 0.92 0.56 1.13 1.06 0.271
black-faced cuckoo-shrike s 0.08 0.00 0.00 0.25
w 0.60 0.13b 0.06b 1.63a 0.0061 <0.00012 v
figbird s 3.60 1.00b 2.56b 7.25a 0.0006 0.26 0.81 v
w 4.96 1.56 4.94 8.38
Australian magpie s 1.40 0.00c 1.00b 3.19a <0.0001 0.31 0.17 vi
w 1.08 0.13 1.06 2.06
pied currawong s 0.98 0.88 1.06 1.00 0.42 0.0004 0.40 vii
w 2.31 1.88 3.06 2.00
Torresian crow s 1.04 0.25b 0.82b 2.06a 0.0001 0.02 0.81 v
w 1.85 1.19 1.32 3.06
green catbird s 1.58 1.94a 2.44a 0.38b 0.0001 0.55 0.89 iii
w 1.46 1.81 2.19 0.38
satin bowerbird s 0.19 0.13 0.19 0.25 0.751 0.452 vii
w 0.10 0.06 0.00 0.25 x
silvereye s 0.42 0.00 0.00 1.25 x
w 2.59 1.06b 1.69b 5.00a 0.031 0.0022 v 1 p value from single-factor ANOVA testing site type effect within season 2 p value from paired t-test of difference between seasons; all other p values from two-way ANOVA
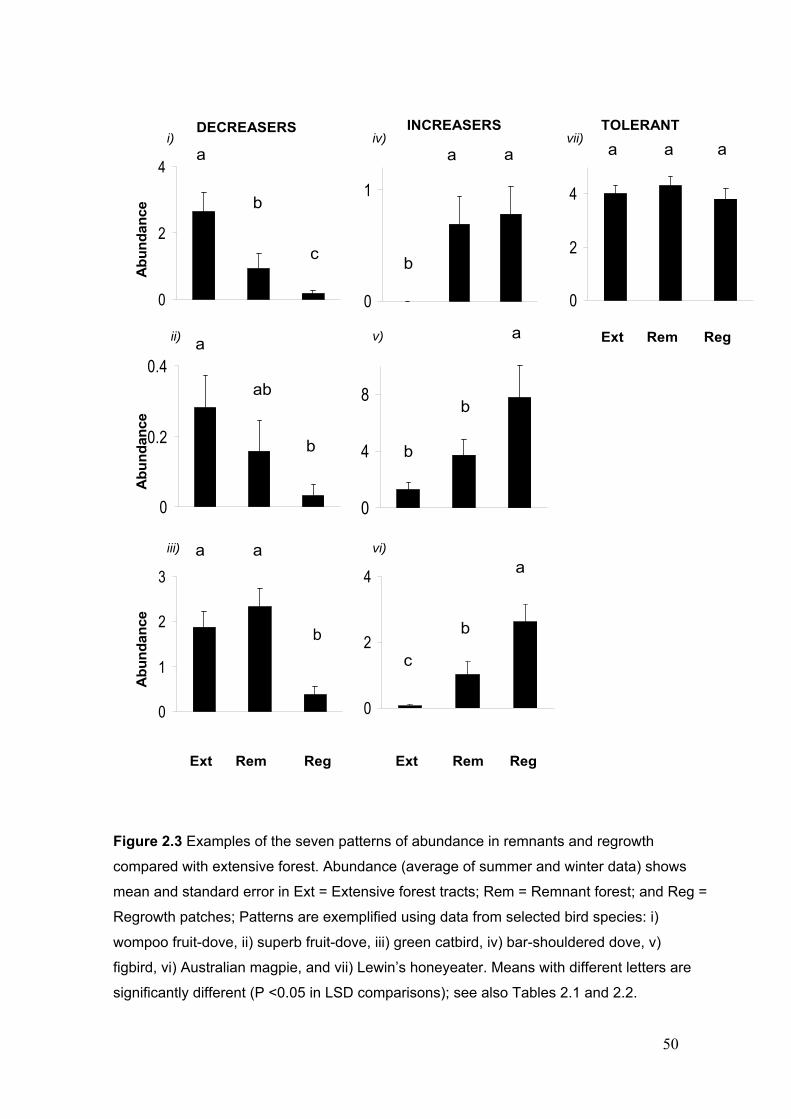
50
Figure 2.3 Examples of the seven patterns of abundance in remnants and regrowth
compared with extensive forest. Abundance (average of summer and winter data) shows
mean and standard error in Ext = Extensive forest tracts; Rem = Remnant forest; and Reg =
Regrowth patches; Patterns are exemplified using data from selected bird species: i)
wompoo fruit-dove, ii) superb fruit-dove, iii) green catbird, iv) bar-shouldered dove, v)
figbird, vi) Australian magpie, and vii) Lewin’s honeyeater. Means with different letters are
significantly different (P <0.05 in LSD comparisons); see also Tables 2.1 and 2.2.
DECREASERS TOLERANT
Ext Rem Reg Ext Rem Reg
Ext Rem Reg
0
2
4
i) A
bu
nd
ance
0
0.2
0.4
Ab
un
dan
ce
0
1
2
3
iii)
INCREASERS
0
1
iv) A
bu
nd
an
ce
0
4
8
v)
0
2
4
vi)
0
2
4
vii)
a
b
c
b
ab
a ii)
b
a a
a
b
b
a a a
a a
b
a
a a a
a
a
a a a
b
b
b
b
b
b
c
c
ab
b

51
Table 2.3 Frugivorous bird species' responses to rainforest fragmentation, and their
seasonality. Numerals (i-vii) show the pattern of abundance change among the three
site types (see text, Fig. 2.3 and Table 2.2); Season shows the time of greater
abundance if the effect of season was significant and turnover exceeded 50%. †
indicates seed-crusher (likely to destroy seeds).
Species Season i wompoo fruit-dove
rose-crowned fruit-dove summer
ii superb fruit-dove summer
Decreasers
iii brown cuckoo-dove† green catbird
iv bar-shouldered dove† Increasers
v rainbow lorikeet† black-faced cuckoo-shrike figbird Torresian crow silvereye
winter winter
vi Australian magpie
Tolerant
vii Australian brush-turkey† white-headed pigeon† emerald dove† topknot pigeon sulphur-crested cockatoo† Australian king-parrot† pale-headed rosella† common koel channel-billed cuckoo little wattlebird Lewin’s honeyeater scarlet honeyeater pied currawong satin bowerbird
summer summer winter winter
2.3.2 Changes in the frugivorous bird assemblage in fragmented forest
Figure 2.4(i) displays an ordination of the 48 study sites based on the abundance
of frugivorous bird species. The extensive forest sites are grouped towards one extreme
of the ordination space, with regrowth sites at the other and remnant sites intermediate
in terms of bird species composition. The composition of the frugivorous bird
assemblage varied significantly among the three site types (ANOSIM global p<0.001) and
between all site types in separate pair-wise comparisons (ANOSIM p = 0.001 for extensive
versus remnant sites; p<0. 0001 for both other comparisons).

52
Figure 2.4(ii) shows that the bird species associated with the region of the
ordination containing most of the extensive forest sites included the five decreaser
species. In addition, the topknot pigeon and sulphur-crested cockatoo, both of which
showed a decreasing trend (Table 2.2) and the paradise riflebird, which was only
recorded in extensive forest (Table 2.4), were associated with this region of the
ordination. The bird species associated with regrowth sites included the seven increaser
species as well as two non rainforest species (noisy miner and grey butcherbird) and the
pale headed rosella (Figure 2.4(ii)).
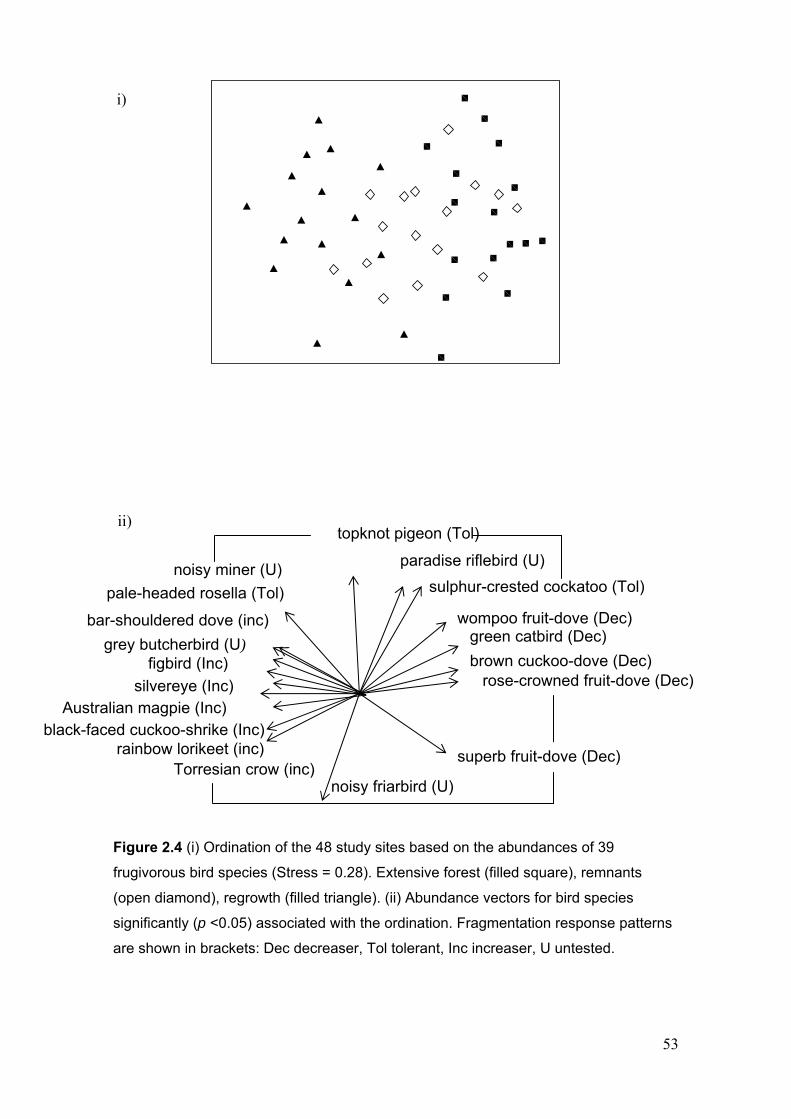
53
Figure 2.4 (i) Ordination of the 48 study sites based on the abundances of 39
frugivorous bird species (Stress = 0.28). Extensive forest (filled square), remnants
(open diamond), regrowth (filled triangle). (ii) Abundance vectors for bird species
significantly (p <0.05) associated with the ordination. Fragmentation response patterns
are shown in brackets: Dec decreaser, Tol tolerant, Inc increaser, U untested.
green catbird (Dec)
rose-crowned fruit-dove (Dec)
ii)
grey butcherbird (U)
topknot pigeon (Tol)
sulphur-crested cockatoo (Tol)
wompoo fruit-dove (Dec)
brown cuckoo-dove (Dec)
noisy friarbird (U)
black-faced cuckoo-shrike (Inc) Australian magpie (Inc)
silvereye (Inc)
figbird (Inc)
bar-shouldered dove (inc)
pale-headed rosella (Tol)
noisy miner (U)
Torresian crow (inc) rainbow lorikeet (inc)
paradise riflebird (U)
superb fruit-dove (Dec)
i)

54
2.3.3 Seasonal patterns of frugivorous bird abundance
The common koel and channel-billed cuckoo were absent in winter, yet
relatively common during summer, clearly the result of immigration. The rose-crowned
and superb fruit-doves also showed large and significant summer increases, although
they were present in low numbers during winter months, a pattern that is also consistent
with immigration into the study region. The black-faced cuckoo-shrike, silvereye, little
wattlebird, and pied currawong were recorded in substantially higher numbers during
winter than summer. Numbers of the Lewin’s honeyeater and Torresian crow also
differed between seasons, but their seasonal abundance turnover was less than 50%, and
was probably due to factors such as reproduction or local movements rather than larger-
scale migration. The remaining 18 species showed no significant difference in
abundance between seasons. The decreasing response pattern detected for the rose-
crowned fruit-dove was significant only during summer (Table 2.2). During winter,
numbers of this species were similar across site types, although its abundance was very
low. The significant interaction detected in the ANOVA for the scarlet honeyeater was not
supported by LSD tests, although a tendency towards a decreasing response pattern was
shown in summer, with a trend towards an increasing response pattern in winter (Table
2.2).
2.3.4 Effects of altitude and season on frugivorous bird numbers
The numbers of frugivorous birds (data for all species pooled) and of the
wompoo and rose-crowned fruit-doves, white-headed and topknot pigeons and the
brown cuckoo-dove in extensive forest at different elevations in summer and winter is
shown in Table 2.5. No significant (p<0.05) interactions were detected between the two
factors using ANOVA, indicating that the data on bird abundance patterns were not
strongly influenced by altitudinal movements of rainforest pigeons. Note that the superb

55
fruit-dove was not recorded at any extensive forest sites, and very few other sites, in
winter.
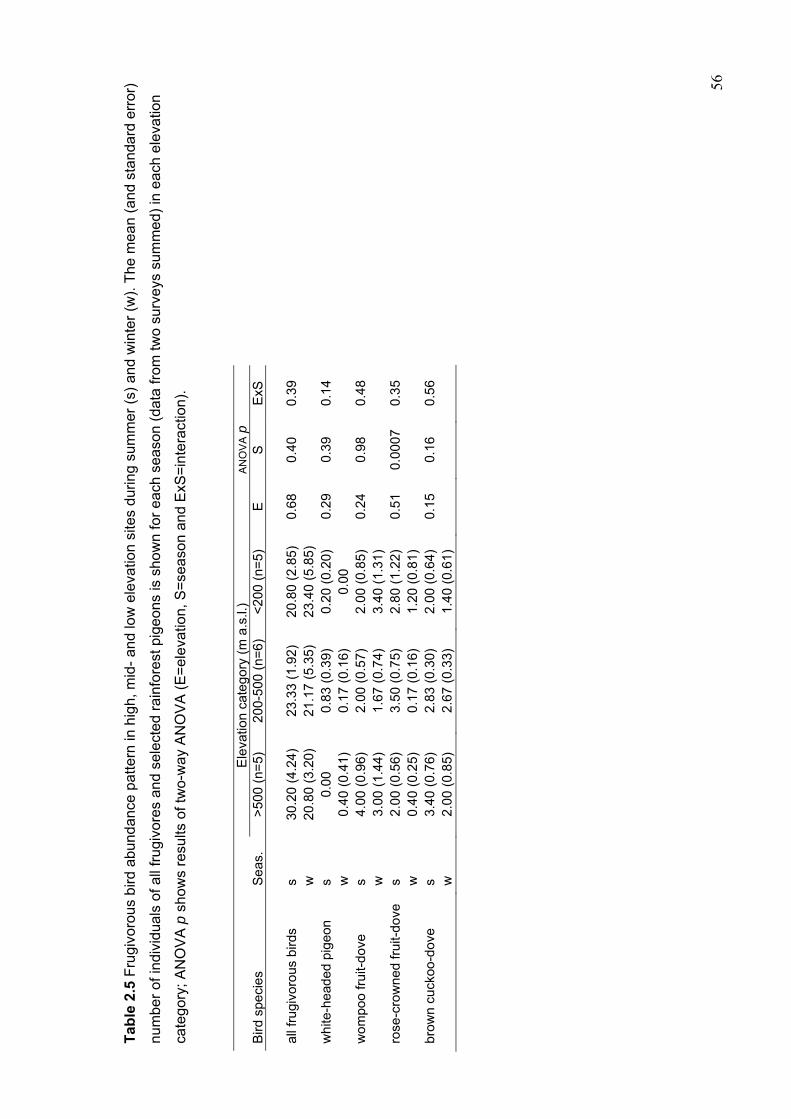
56
Tab
le 2
.5 F
rugi
voro
us b
ird a
bund
ance
pat
tern
in h
igh,
mid
- an
d lo
w e
leva
tion
site
s du
ring
sum
mer
(s)
and
win
ter
(w).
The
mea
n (a
nd s
tand
ard
erro
r)
num
ber
of in
divi
dual
s of
all
frug
ivor
es a
nd s
elec
ted
rain
fore
st p
igeo
ns is
sho
wn
for
each
sea
son
(dat
a fr
om tw
o su
rvey
s su
mm
ed)
in e
ach
elev
atio
n
cate
gory
; AN
OV
A p
sho
ws
resu
lts o
f tw
o-w
ay A
NO
VA
(E
=el
evat
ion,
S=
seas
on a
nd E
xS=
inte
ract
ion)
.
Ele
vatio
n ca
tego
ry (
m a
.s.l.
) A
NO
VA p
B
ird s
peci
es
Sea
s.
>50
0 (n
=5)
20
0-50
0 (n
=6)
<
200
(n=
5)
E
S
ExS
al
l fru
givo
rous
bird
s s
30.2
0 (4
.24)
23
.33
(1.9
2)
20.8
0 (2
.85)
0.
68
0.40
0.
39
w
20
.80
(3.2
0)
21.1
7 (5
.35)
23
.40
(5.8
5)
w
hite
-hea
ded
pige
on
s 0.
00
0.83
(0.
39)
0.
20 (
0.20
) 0.
29
0.39
0.
14
w
0.
40 (
0.41
) 0.
17 (
0.16
) 0.
00
w
ompo
o fr
uit-
dove
s
4.00
(0.
96)
2.00
(0.
57)
2.00
(0.
85)
0.24
0.
98
0.48
w
3.00
(1.
44)
1.67
(0.
74)
3.40
(1.
31)
ro
se-c
row
ned
frui
t-do
ve
s 2.
00 (
0.56
) 3.
50 (
0.75
) 2.
80 (
1.22
) 0.
51
0.00
07
0.35
w
0.40
(0.
25)
0.17
(0.
16)
1.20
(0.
81)
br
own
cuck
oo-d
ove
s 3.
40 (
0.76
) 2.
83 (
0.30
) 2.
00 (
0.64
) 0.
15
0.16
0.
56
w
2.
00 (
0.85
) 2.
67 (
0.33
) 1.
40 (
0.61
)
57
2.4 Discussion
In this study, extensive forest sites were treated as a reference against which to
quantify changes in numbers of frugivorous bird species in remnants and regrowth.
Since remnants and extensive forest sites were similar in fleshy fruited plant species
composition, differences in frugivorous bird numbers between these two site types were
most likely due to differences in site context rather than resource availability within the
site. Differences in frugivorous bird numbers between remnants and extensive forest
may reflect a response to several factors associated with the differing landscape context,
including reduced total area of habitat, edge effects, or greater functional isolation. The
patterns of bird abundance in regrowth sites reflect differences in both the availability of
fleshy fruit resources and the landscape context.
2.4.1 Bird species showing a decreaser response to rainforest fragmentation
A number of studies in different parts of the world have documented bird
declines and local extinctions in fragmented rainforest (e.g., Kattan et al., 1994; Corlett,
1998; Renjifo, 1999; Castelletta et al., 2000; Ribon et al., 2003). Consistent with
descriptions provided by Frith (1952), the wompoo, rose-crowned and superb fruit-
doves were generally less abundant in remnants and regrowth than extensive forest.
Despite being known to fly across cleared land (Frith, 1952; Howe et al., 1981; Date et
al., 1991, 1996; Gosper and Holmes, 2002), fruit-doves used remnant and regrowth
rainforest habitats in the Sunshine Coast much less frequently than extensive forest
areas. The Australian fruit-doves are obligate frugivores and the plants that characterise
their diets are typical of mature rainforest (Crome, 1975, 1990; Innis, 1989).
Consequently, their low numbers in fragmented forest may be due to low availability of
58
the required plant species in remnants and in the local landscapes surrounding remnant
sites.
Although fruit-doves showed overall decreasing abundance in remnants
compared with extensive forest, their abundance in certain individual remnants
resembled that of extensive rainforest sites. These remnant sites, plotted among
extensive forest sites in the ordination space, were mostly located in relatively well
forested parts of the landscape. These remnants may function as part of a network of
patches (Howe et al., 1981; Date et al., 1991, 1996; Price et al., 1999) that, although
discontinuous, are sufficiently close that the energetic costs and perceived predation risk
associated with movement between patches are not too high. In Mexico, Graham (2001)
described a similar situation for the strong-flying keel-billed toucan Ramphastos
sulphuratus, which moved between forest fragments, but only in parts of the landscape
that contained at least a minimum threshold amount of forest and fruit resources.
The brown cuckoo-dove and green catbird showed much lower abundance in
regrowth than in remnants and extensive forest. The brown cuckoo-dove is noted for its
conspicuousness in regrowth vegetation at forest edges and consumes a range of plants
that are common in rainforest regrowth (Frith, 1952; Crome, 1975; Willson and Crome,
1989). However, this species roosts in well-developed forest (Frith, 1982) and may
therefore be limited in its use of isolated regrowth patches, unless these are located
close to mature forest. Furthermore, the brown cuckoo-dove and green catbird are
sedentary or only locally nomadic in subtropical rainforests (Frith, 1982; Blakers et al.,
1984; Innis and McEvoy, 1992; Date et al., 1996). These species may require a larger
area of contiguous vegetation than is provided within or in local landscapes surrounding
most of the regrowth patches surveyed in this study. In general, these areas occur as
narrow strips or small patches with low amounts of surrounding forest cover compared
with many remnant sites. The data presented in this chapter may indicate area-
59
sensitivity of these species at very small patch sizes. Data presented by Howe et al.
(1981) also suggest that brown cuckoo-doves may be unable to persist in very small
remnants; they were ‘common’ in patches of 1 ha to 2.5 ha, but ‘rare’ in those under 1
ha. While both the brown cuckoo-dove and green catbird are highly frugivorous, the
former grinds ingested seeds in a muscular gizzard (Frith, 1982; Dennis and Westcott,
2006) and the later eats flowers, invertebrates, and the eggs and nestlings of other birds
in addition to fruit (Blakers et al., 1984). The consumption of alternative food sources
that are high in protein relative to the pulp of most fruits (Morton, 1973) may mean that
these species are less constrained in their fruit preferences than the fruit-specialists that
rely only on the nutritional quality of fruit pulp (Snow, 1981). They may consequently
be able to satisfy their energetic and nutritional needs in the smaller area of forest
available in remnants than the obligate frugivore species.
Species declines in fragmented habitats may also result from changed biotic
interactions (Terborgh and Winter, 1980; Karr, 1982; Doak et al., 1992). For example,
the aggressive, non-rainforest noisy miner invaded regrowth patches from the
surrounding matrix. This species has been shown to exclude other bird species in open
eucalypt forest (Piper and Catterall, 2003). Rates of nest predation may also increase in
fragmented rainforest (Sieving and Karr, 1997). However, it is not clear whether the
species classified as decreasers in the present work would be disproportionately affected
by these changes.
The differences in bird species’ abundances between habitat types in the present
study were clearly the result of habitat choice by birds within individual species. For
example, four regrowth sites were located adjacent to, or within tens of metres of,
remnant sites (Figure 2.2). However, these remnant and regrowth sites contained
different bird assemblages and were plotted in separate regions of the ordination based
on bird species’ abundance. At one of these site pairs, several bird species were present

60
in the remnant site but never recorded in the regrowth (e.g. the wompoo and rose-
crowned fruit-doves, and green catbird), or were recorded in much lower numbers in the
regrowth than adjacent remnant rainforest (e.g. brown cuckoo-dove). These results
suggest greater habitat preferences of frugivorous birds in subtropical Australia than
shown by Laurance et al. (1996) in their comparison of adjoining extensive and
regrowth rainforest patches in the Atherton Tableland area of North Queensland.
2.4.2 Bird species showing an increaser response to fragmentation
As well as decreasers, the present work detected several species that increased in
abundance in remnant and regrowth rainforest compared with extensive forest.
Consistent with observations made during the 1950s in subtropical rainforest remnants
(Frith, 1952), the seed-crushing bar-shouldered dove was absent from extensive forest
but invaded some rainforest remnant and regrowth patches. This may reflect greater
availability of grasses or other food within and surrounding remnants and regrowth
patches (Frith, 1952).
The black-faced cuckoo-shrike, figbird, rainbow lorikeet, Torresian crow and
silvereye were found in similar abundance in remnants and extensive rainforest but were
most abundant in regrowth. These species commonly use non-rainforest habitats, in
contrast with the rainforest-dependent decreaser species (Blakers et al., 1984; Catterall
et al., 1998). Furthermore, with the exception of the highly frugivorous figbird, these
increaser frugivores regularly eat a variety of other food types (Blakers, et al. 1984). As
suggested for the bar-shouldered dove, high numbers of these species in regrowth may
reflect ready use of the types of resources occurring within and surrounding regrowth
patches. These may include non-fruit food types such as the high nectar availability in
ornamental garden plantings, or resources like fleshy fruited weeds that would boost the

61
availability of food at various times for frugivores that may not be more opportunistic
than fruit-specialists.
Fleshy fruited weeds, in particular camphor laurel, have been identified as
potentially important food sources for the topknot and white-headed pigeons (Frith,
1982; Innis, 1989; Date et al., 1996). It has been suggested that the spread of camphor
laurel has contributed to an increase in numbers of these species throughout certain
Australian subtropical rainforest landscapes following dramatic declines during the
early half of 1900s (Frith, 1952, 1982; Date et al., 1996). Importantly, camphor laurel
bears fruits at a time when the availability of fruiting native rainforest plants is low
(Innis, 1989; Date et al., 1991; Scanlon et al., 2000). Unlike the fruit-doves, neither the
topknot nor white-headed pigeon, both fruit-specialists, showed significantly different
numbers in rainforest remnants or regrowth compared with extensive forests in the
present study, although topknot pigeon numbers showed a decreasing trend.
2.4.3 Frugivore assemblage change in fragmented habitats
The abundance of over half of the bird species (14 of 26) evaluated in the
present work was similar among extensive forest, remnants and regrowth. It has been
proposed that rainforest contraction in regions such as Africa and Australia during the
Pleistocene may have imposed an ‘extinction filter’ on rainforest fauna (Howe et al.,
1981; Balmford, 1996; Corlett and Primack, 2006). As a result, the species that have
persisted may be those that are unspecialised and with the capacity for movement
between disjunct rainforest patches. These attributes may be associated with relatively
high tolerance of anthropogenic forest fragmentation (Howe et al., 1981; Balmford,
1996; Corlett and Primack, 2006).
The changes in the frugivorous bird assemblage in fragmented forest in the study
region resemble those described by a ‘cut-and-paste’ model (Woinarski 1993; Crome et

62
al., 1994). That is, the avian frugivore communities in remnant and regrowth sites
comprised species from diverse habitats, formed by the decline of some species and
concurrent increase of others, in response to changes in habitat quality, area and/ or
landscape forest cover. This model better describes the assemblage changes documented
between extensive, remnant and especially regrowth sites in the present study than those
that emphasise declines (e.g. ‘nested subsets’; Patterson, 1987).
2.4.4 Seasonal changes in frugivorous bird abundance
A greater abundance and diversity of native fleshy fruits are generally available
in subtropical Australian rainforests during summer than winter (Innis, 1989; Church,
1997). During winter, fruit availability seems to be highest in lowland areas (Innis,
1989; Date et al., 1991). The seasonal differences in fruit availability may influence the
abundance of frugivorous birds in rainforest habitats within the study region. Numbers
of the common koel, channel-billed cuckoo, superb and rose-crowned fruit-doves
increased substantially during summer and all are regular summer immigrants to the
study region. The first two species are total migrants (Higgins, 1999). The rose-crowned
fruit-dove is a partial migrant, with some individuals over-wintering in forests within
the study region while the majority of individuals appear to return to tropical forests in
northern Australia or Papua New Guinea (Blakers et al., 1984). The superb fruit-dove is
considered vagrant in subtropical Australia.
Numbers of the little wattlebird, black-faced cuckoo-shrike, pied currawong and
silvereye increased substantially during winter. The higher winter numbers of silvereyes
reflect an influx of individuals of this species from the south to the study region
(Blakers et al., 1984). The silvereye and the black-faced cuckoo-shrike were classed as
increasers in the present study, while the other two winter-abundant species (little
wattlebird and pied currawong) were classified as tolerant. This contrasted with the bird
63
species that were more common in summer than winter in that they were either
decreasers (the fruit-doves) or classed as tolerant (common koel and channel-billed
cuckoo). All four winter-abundant bird species make use of remnant and especially
regrowth rainforests, and their increased winter abundance may indicate a response to
winter fruit availability in regrowth habitat, potentially including the winter-fruiting
weeds. Indeed, silvereyes of a subtropical island population were found to increase
their intake of fruit during winter (Catterall, 1985), and pied currawongs have been
reported to move from eucalypt open forests into rainforest during winter (Lindsey,
1995), concurrent with a dietary shift from insects to fruit (Blakers et al., 1984). There
is some evidence of a winter influx of the little wattlebird into eastern Queensland
(Blakers et al., 1984). This species usually occupies coastal eucalypt forests and
heathlands rather than rainforests (Blakers et al., 1984), but the occurrence of this
species in coastal remnant and regrowth rainforest in the Sunshine Coast, possibly
reflects increased fruit intake during winter.
Date et al. (1991, 1996) suggested that there may be seasonal altitudinal
migration in some species of rainforest pigeon, and proposed the general scenario of
movement into upland forests during summer and lowland forests during winter. The
surveys conducted for the present study may have been too infrequent to detect detailed
seasonal movement patterns, but would have captured substantial turnover between
altitudes. The results do not show a seasonal exchange of frugivorous birds between
extensive forest sites at different elevations.
2.4.5 Frugivorous birds and seed dispersal in remnant and regrowth rainforest:
conservation implications
The wompoo fruit-dove suffered population declines and localised extinctions
from southern parts of its range (the southern limits of subtropical rainforest in
64
Australia) during the early part of the 20th century (Recher et al., 1995) and appeared to
be declining in other parts of subtropical Australia from the late 1920s, following
widespread rainforest clearing and fragmentation. This prompted Frith (1952) to predict
that this species was …”doomed to early extinction” (pp.91-92). Frith (1952) also
forecast ongoing decline in superb fruit-dove populations as a result of rainforest loss
but suggested the nomadic behaviour of rose-crowned fruit-doves would give them
greater resilience to habitat destruction and fragmentation (Frith, 1982). Patterns of
frugivorous bird abundance in Sunshine Coast habitats suggest that neither regrowth nor
remnant rainforest patches provide suitable habitat for significant numbers of these
three fruit-dove species.
Changed dispersal of rainforest plants has been predicted as a consequence of
frugivore declines in fragmented landscapes throughout the world (Howe, 1984; Crome
1990; Janzen and Vasquez-Yanez, 1991; Corlett, 1998; Sodhi et al., 2004; Terborgh and
Nuñez-Iturri, 2006). Silva and Tabarelli (2000) predicted that around 30% of native
plant species could be lost from forest fragments in Brazil, based on an assessment of
the patterns of frugivore decline in that region and the potential for frugivore species to
disperse large seeds and certain plant families. While the present study classified a
group of decreaser frugivore species, it also showed the numerical replacement of these
by a suite of increaser species. Increasers also potentially disperse rainforest seeds, but
it is unclear whether these species may substitute in fragmented forests by dispersing
the same suite of plant species as birds from the decreaser group. In subtropical
Australia, the fruit-doves may swallow and disperse larger fruits and seeds than most
other frugivorous species (Green 1993). If increaser or tolerant species do not disperse
the same large fruited plant species as the decreasers, seedlings of such plants may not
recruit in many rainforest regrowth or remnant patches. Even if non-decreaser
frugivores disperse similar plant species to decreasers, rates of seed dispersal for these
65
plant species will be lower, unless tolerant or increaser frugivores show density
compensation (Renjifo, 1999; Loiselle and Blake, 2002) or increased rates of fruit
consumption. Higher-order interactions involving seed or seedling predators may also
change in fragmented forest landscapes, and may exacerbate or offset the effects of
changed seed dispersal (Harrington et al. 1997; Murray and Garcia, 2002; Wright et al.
2002). Following seed dispersal, factors that influence plant establishment, growth and
survival determine regeneration outcomes (Wang and Smith, 2002).
The seeds of plants dispersed by increaser birds are likely to be moved into and
around fragmented forest landscapes at greater rates than in extensive forest. It has
been suggested that fruits consumed by mixed diet, opportunistic frugivores, such as
characterise the increaser species of the present study, may be mostly sugary, watery
and small seeded (McKey, 1975). Many fleshy fruited weeds fit this description
(Richardson et al., 2000) and their increased dispersal and recruitment in remnants and
regrowth can be expected as a result of the regular use of these habitats by the increaser
bird species. This may lead to positive feedback cycles between the fleshy fruited weeds
and the fragmentation-tolerant opportunistic frugivores in regrowth areas of highly
disturbed rainforest landscapes.
Qualitative aspects of seed dispersal may also change in fragmented forests. For
example, the abundance of two seed-crusher species increased (bar-shouldered dove and
rainbow lorikeet), while only one (the brown cuckoo-dove) decreased in fragmented
forest habitats. This may mean that a greater proportion of the seeds of the plant species
consumed in fragmented forest are destroyed than are dispersed in viable condition,
although neither of the increaser species seem to consume large amounts of fleshy fruit.
Furthermore, the lump-lined stomach of the decliner fruit-doves (Crome, 1975)
potentially influences germination success of seeds. Differences among frugivore
species in their use of particular habitat elements may also change spatial patterns of

66
seed dispersal in fragmented parts of the landscape (Schupp, 1993; Silva et al., 1996;
Alcántara et al., 2000; Jordano and Schupp, 2000; Loiselle and Blake, 2002; Dennis and
Westcott, 2006).
67
Chapter Three
Seed dispersal potential of frugivorous bird species in relation to their
gape width, frugivory level and seed treatment
3.1 Introduction
Fruit-eating birds may disperse the seeds of up to 70% of plant species in
subtropical Australian rainforests (Willson et al., 1989; Green, 1995; Butler, 2003).
There may be variation among bird species in the plant species that they disperse
because of different patterns of plant species consumption (Crome, 1975; Snow, 1981;
Herrera, 1984; Howe, 1986; Innis, 1989; Sun et al., 1997; Brown and Hopkins, 2002).
However, there is little agreement regarding the factors that influence patterns of plant
species consumption by frugivore species (Herrera, 1998, 2002). Consequently, in the
absence of detailed dietary information, which is typically available for only a small
proportion of the species in a frugivore assemblage (e.g., Crome, 1975), there is only a
limited basis for predicting patterns of plant consumption by frugivore species. Major
differences among frugivore species in their patterns of plant species consumption may
be related to certain morphological and behavioural attributes. If so, it may be possible
to use these attributes to describe groups of frugivore species with similar combinations
of attributes (functional groups) that potentially disperse similar plant species to one
another.
The role that a bird species plays in the dispersal of seeds of a particular plant
species depends first on whether it feeds on fruit from that plant species and second on
whether it disperses viable seeds or destroys seeds. Birds may crush and destroy seeds
either in the bill while feeding (parrots: Crome and Shields 1992) or by grinding during

68
digestion (some pigeons and doves: Frith 1982, and megapodes). Seed-crushing birds
would make a small contribution to seed dispersal.
Patterns of plant species consumption reflect variation among frugivorous bird
species in their gape sizes. Gape width imposes an intractable limit on the size of fruits
and/or seeds able to be ingested by a bird species (Herrera, 1981; Moermond and
Denslow, 1985; Wheelwright, 1985). Consequently, bird species with narrow gapes are
physically constrained to swallowing only small fruits, whereas birds with wider gapes
are capable of consuming plant species with larger fruits (Wheelwright, 1985).
The plant species consumed by a bird species may also be influenced by the
extent to which it specialises on fruit rather than other food sources. For example, it was
predicted that birds with fruit-dominated diets would consume fruits with greater
protein and lipid content rather than those with high sugar content (Snow, 1971; Crome,
1975; McKey, 1975; Howe, 1977; Howe and Estabrook, 1977; Stiles, 1993).
Subsequent studies have shown patterns that are inconsistent with this prediction
(Fuentes, 1994; Sun et al., 1997; Witmer and Van Soest, 1998). This may be due to
interspecific variation in factors that influence the net nutritional value of fruit, such as
frugivore digestive adaptations (Martínez del Rio and Restrepo, 1993) and plant
secondary compounds (Cipollini and Levey, 1997). However, it may be reasonable to
expect that highly frugivorous species, and particularly obligate frugivores such as the
Australian fruit-doves (Crome, 1975; Frith 1982; Recher et al., 1995), would need to
consume fruits with certain energetic or nutritional values to satisfy their requirements
(White, 1993; Morton, 1973; Izhaki and Safriel, 1989; Bairlein, 1996). This may
generate variation among frugivore species in the plant species that they consume. For
example, highly frugivorous bird species are associated with the consumption of plants
from the Lauraceae, a family noted for its high lipid content (Snow, 1971, 1981; Crome,
1975; Wheelwright, 1983; Stiles, 1993). Frugivore species that have mixed diets can

69
obtain nutrition from other food sources, most of which are rich in protein and other
nutrients compared with fruit (Morton, 1973; Izhaki and Safriel, 1989). Consequently,
the plant species composition of frugivore diets may vary among frugivore species
depending on their degree of dependence on fruit. Furthermore, the species richness and
volume of fruits consumed by a bird species may be positively related to its degree of
frugivory (Wheelwright et al., 1984), although Pratt and Stiles (1985) proposed that
mixed-diet species were less selective and therefore would consume a wider variety of
plant species.
The identification of groups of functionally distinct frugivore species may make
it possible to forecast consequences of changes in frugivore assemblage composition for
seed dispersal. For example, it has been predicted that declined abundance of certain
frugivorous bird species in fragmented rainforest may result in declining plant
populations in fragmented landscapes (Howe, 1984; Crome 1990; Janzen and Vasquez-
Yanez, 1991; Corlett, 1998; Sodhi et al., 2004; Terborgh and Nuñez-Iturri, 2006). In
particular, it has been proposed that the dispersal of large-seeded plant species will be
limited in fragmented rainforest regions throughout the world (Corlett, 1996, 1998;
Harrington et al,. 1997; Silva and Tabarelli, 2000; Kitamura et al., 2002; McConkey and
Drake, 2002).
Chapter Two described the changes in the frugivorous bird assemblage resulting
from either declined or increased numbers of individual species in fragmented
compared with extensive rainforest in a subtropical region of Australia. The present
chapter asseses the potential functional role of different frugivorous bird species in the
dispersal of seeds from rainforest plants. The approach employed considers variation
among frugivore species in their dietary preferences to be the primary dimension of
functional variation among disperser species.
70
Bird species are categorised into functional groups using information about their
gape width, frugivory level and seed-crushing behaviour. It is proposed that this
approach assembles groups of bird species that potentially disperse a similar suite of
plant species. Data from the field study of bird distribution in the Sunshine Coast region
(Chapter Two) is used to compare between these functional groups in terms of their
numbers in rainforest remnants and regrowth, relative to extensive forest. The extent to
which seed dispersal may vary between forested and fragmented parts of the landscape
as a consequence of functional variation among frugivorous bird species is considered.
3.2 Methods
Chapter Two describes the study region (Section 2.2.1) and site network (2.2.2),
field surveys of bird species abundance (2.2.3), and the classification of the 42
frugivorous bird species (2.2.5). The different abundance patterns that were detected
among frugivorous bird species are detailed in Section 2.3.1 in Chapter Two.
Note that the frugivore attribute data used in this chapter are used in analyses in
Chapter Four.
3.2.1 Assessment of the functional attributes of frugivorous bird species: gape width,
frugivory level and seed-crushing behaviour
Vernier callipers were used to measure (to 0.01 mm) the gape width (width of
the bill at the junction of the upper and lower mandibles) of skin specimens kept in the
Queensland Museum. There may have been some shrinkage of specimens, but this is
should be proportional across species. Measurements were taken from 10 individuals of
each species, except for the Australian king-parrot Alisterus scapulatus for which only
nine specimens were available. Specimens collected from the vicinity of the study area
(i.e. southeast Queensland) were measured where possible. Where there was probably

71
sexual dimorphism in gape width, measurements were taken from five male and five
female specimens. Fruit-doves and the topknot pigeon have a peculiar gape morphology
which enables gape distension (Crome and Shields, 1992). To quantify the extent of this
distension, the closed gape width was measured (as for dried specimens) from two
thawed specimens of the wompoo fruit-dove and one of the rose-crowned fruit-dove
that had been frozen fresh (hence the inter-mandibular flesh was intact) and then
compared with the maximum width of a plasticine ball that could be swallowed by the
specimens. The distension was similar for both species (25%) and this value was used to
augment the average width of measurements taken from skins for the fruit-doves and
topknot pigeon.
Each bird species was allocated to one of three diet groups, reflecting the
relative dominance of fleshy fruit in their diets: major (fruit-dominated diet), mixed
(diet comprising two to several main food types, one of which was fruit), and minor
(diet dominated by foods other than fruit, but occasionally including fruit). These
categories were determined from descriptions in the literature (Blakers et al. (1984) and
the Handbook of Australian, New Zealand and Antarctic Birds (HANZAB) series
(Marchant and Higgins, 1993; Higgins and Davies, 1996; Higgins, 1999, Higgins et al.,
2001)) and in discussion with experts. Dietary descriptions in the literature were usually
qualitative but sufficiently consistent to enable the allocation of species to a relative
level of frugivory.
Bird species that potentially destroy seeds were identified from references in the
literature to the destruction of seeds during feeding, grinding-based digestion, or
detection of crushed seeds in faecal samples (Blakers et al., 1984; Crome and Shields,
1992; and the HANZAB series). Seed-crushing bird species were considered to have
low potential as seed dispersers relative to other frugivorous birds, although some seeds,
particularly if very small or hard, may pass through the bird’s gut intact (Snow, 1981).
72
Bird species for which seed-crushing behaviour was not mentioned were considered to
generally disperse viable seed, although it is recognised that even birds that do not crush
seeds may not always function as effective dispersers, for example if they consume the
flesh of a fruit but not the seed (“fruit-thieving”) (Green, 1993).
3.2.2 Data analyses
To establish whether a bird species’ frugivory level, gape size and seed
treatment were confounded with one another, pair-wise and three-way interactions were
tested using a log linear model in the statistical package SPSS (2001). The factors were
frugivory level (three levels, major (1), mixed (2) and minor (3)), gape width classes
(three levels, small (<10 mm), medium (10 – 15 mm) or large (>15 mm)) and seed
treatment (two levels, seed-disperser and seed-crusher). The data were the number of
bird species (total 42) within each cell of the three-way table of factors.
Each of the 42 bird species recorded during the field study was classed into one
of the following seven functional groups based on combinations of the measured
attributes of seed treatment, gape width and frugivory level. All seed-crushing bird
species were grouped together (as group 8) since the seed dispersal potential of these
birds is likely to be similarly low, irrespective of gape width and frugivory level. Seed-
dispersing birds (species that do not crush seeds) were allocated to the following
groups:
1. large-gaped (>15 mm) with fruit-dominated diet;
2. medium-gaped (10-15 mm) with fruit-dominated diet;
3. large-gaped with mixed diet;
4. medium-gaped with mixed diet;
5. small-gaped (<10 mm) with fruit-dominated diet;
6. small-gaped with mixed diet; and

73
7. fruit a minor dietary component (all gape widths pooled).
The abundance of birds within each functional group was calculated by
summing the data for all species comprising each group, including those species that
were too uncommon for individual analysis (recorded in less than five sites during
summer and winter surveys; Chapter Two, Section 2.3.1). One-way ANOVA, together
with Least Significant Difference (LSD) tests, were conducted using SPSS (2001) to
test for differences in the abundance of each functional group, between extensive,
remnant and regrowth sites.
The eight functional groups described above were further combined to form
three groups that are proposed to differ substantially in their influence on overall seed
dispersal dynamics; functional groups 1- 3 (likely to have high influence), 4 - 6
(medium), and 7 - 8 (low). An association between these three groups and sensitivity to
forest fragmentation, as indicated by decreasing (1), tolerant (2) or increasing (3)
abundance patterns, was tested using Spearman’s rank correlations in SPSS (2001).
Multidimensional scaling ordination using the semi-strong hybrid technique
(Faith et al. 1987) in WinPATN (Belbin et al., 2003) was used to describe differences
among the 48 sites in terms of patterns of variation in functional group composition.
Data for 39 bird species were included in these analyses; three species that were
detected at only one site (rock dove, blue-faced honeyeater and house sparrow) were not
included. Principal axis correlations were conducted to determine associations between
the site ordination and the abundance of each functional group; associations found to be
significant (at p< 0.05) using a randomisation test (MCAO, 10 000 iterations) were
displayed as functional group abundance vectors in the ordination space.
74
3.3 Results
3.3.1 Variation in seed dispersal potential among species within the frugivorous bird
assemblage
The 42 frugivorous bird species that occur in rainforest habitats in the Sunshine
Coast, along with their gape width, frugivory level and seed-crushing behaviour, are
shown in Table 3.1. Just over one-third (15) of these species destroy seeds by crushing
or grinding them. Species’ gape widths ranged from 5.2 mm (scarlet honeyeater) to 32.8
mm (channel-billed cuckoo) (Table 3.1). There were nine species with small (<10 mm)
gapes, 15 with medium (10 – 15 mm) gapes, and 18 with large (>15 mm) gapes. Eleven
bird species had fruit-dominated diets (major frugivores), 15 had mixed diets and 16 had
diets dominated by food types other than fruit (minor frugivores). None of the
interactions between frugivory level, gape width and seed treatment were significant in
the Loglinear model (loglinear model likelihood ratio (L.R.) χ2 = 6.38, p = 0.90 for
three-way interaction; pair-wise chi-squared tests showed no interaction between gape
width and frugivory level (χ2 = 0.38, p = 0.98), frugivory level and seed treatment (χ2 =
0.82, p = 0.66), nor gape width and seed treatment (χ2 = 2.51, p = 0.29) (Figure 3.1).
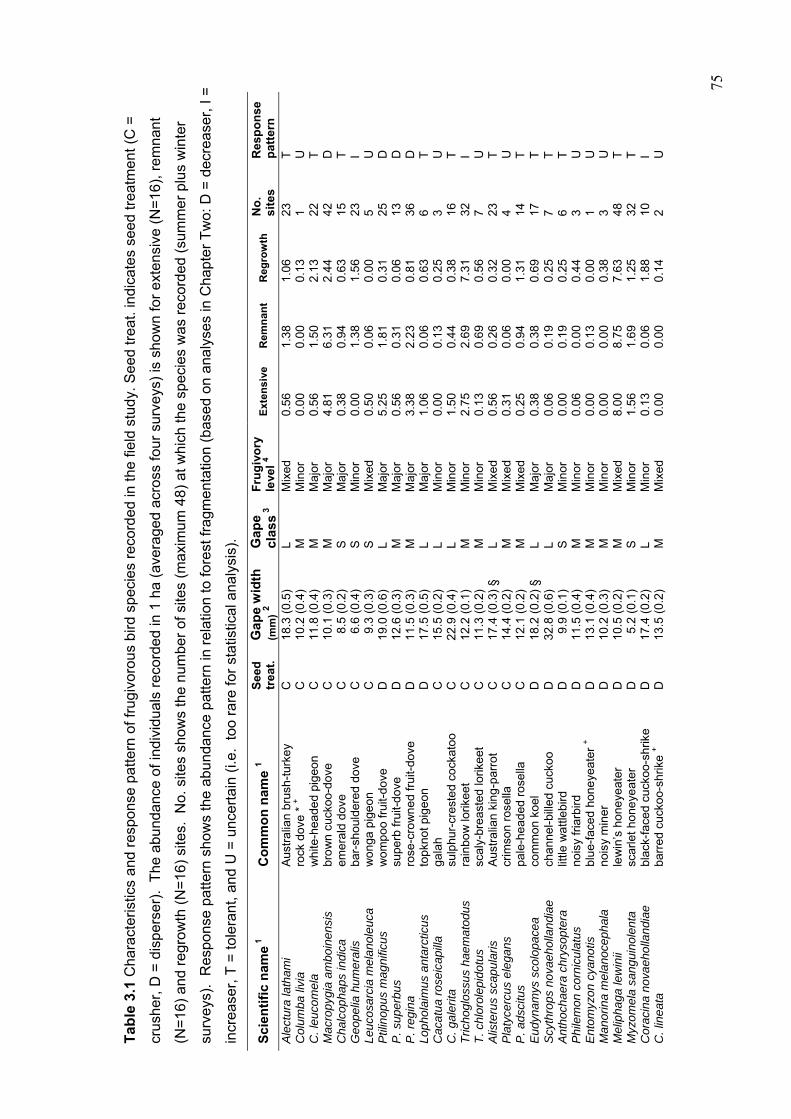
75
Tab
le 3
.1 C
hara
cter
istic
s an
d re
spon
se p
atte
rn o
f fru
givo
rous
bird
spe
cies
rec
orde
d in
the
field
stu
dy. S
eed
trea
t. in
dica
tes
seed
trea
tmen
t (C
=
crus
her,
D =
dis
pers
er).
The
abu
ndan
ce o
f ind
ivid
uals
rec
orde
d in
1 h
a (a
vera
ged
acro
ss fo
ur s
urve
ys)
is s
how
n fo
r ex
ten
sive
(N
=16
), r
emna
nt
(N=
16)
and
regr
owth
(N
=16
) si
tes.
No.
site
s sh
ows
the
num
ber
of s
ites
(max
imu
m 4
8) a
t whi
ch th
e sp
ecie
s w
as r
ecor
ded
(sum
me
r pl
us w
inte
r
surv
eys)
. R
espo
nse
patte
rn s
how
s th
e ab
unda
nce
patt
ern
in r
elat
ion
to fo
rest
frag
men
tatio
n (b
ased
on
anal
yses
in C
hapt
er T
wo:
D =
dec
reas
er, I
=
incr
ease
r, T
= to
lera
nt, a
nd U
= u
ncer
tain
(i.e
. to
o ra
re fo
r st
atis
tical
ana
lysi
s).
Sci
enti
fic
nam
e 1
Co
mm
on
nam
e 1
See
d
trea
t.
Gap
e w
idth
(m
m) 2
Gap
e cl
ass 3
F
rug
ivo
ry
leve
l 4
Ext
ensi
ve
Rem
nan
t R
egro
wth
N
o.
site
s R
esp
on
se
pat
tern
A
lect
ura
lath
ami
Aus
tral
ian
brus
h-tu
rke
y
C
18.3
(0.
5)
L M
ixed
0.
56
1.38
1.
06
23
T
Col
um
ba li
via
rock
dov
e *
+
C
10.2
(0.
4)
M
Min
or
0.00
0.
00
0.13
1
U
C. l
euco
mel
a w
hite
-hea
ded
pig
eon
C
11
.8 (
0.4)
M
M
ajor
0.
56
1.50
2.
13
22
T
Mac
ropy
gia
am
boi
nens
is
bro
wn
cuck
oo-d
ove
C
10.1
(0.
3)
M
Maj
or
4.81
6.
31
2.44
42
D
C
halc
opha
ps in
dica
em
eral
d do
ve
C
8.
5 (0
.2)
S
Maj
or
0.38
0.
94
0.63
15
T
G
eope
lia h
um
era
lis
bar-
shou
lder
ed d
ove
C
6.
6 (0
.4)
S
Min
or
0.00
1.
38
1.56
23
I
Leuc
osar
cia
mel
ano
leuc
a w
on
ga p
ige
on
C
9.
3 (0
.3)
S
Mix
ed
0.50
0.
06
0.00
5
U
Ptil
inop
us m
ag
nific
us
wo
mp
oo fr
uit-
dov
e
D
19.0
(0.
6)
L M
ajor
5.
25
1.81
0.
31
25
D
P. s
uper
bus
supe
rb fr
uit-
dove
D
12
.6 (
0.3)
M
M
ajor
0.
56
0.31
0.
06
13
D
P. r
egin
a ro
se-c
row
ne
d fr
uit-
dove
D
11
.5 (
0.3)
M
M
ajor
3.
38
2.23
0.
81
36
D
Lop
hola
imus
ant
arct
icus
to
pkno
t pig
eon
D
17
.5 (
0.5)
L
Maj
or
1.06
0.
06
0.63
6
T
Cac
atu
a ro
seic
apill
a ga
lah
C
15
.5 (
0.2)
L
Min
or
0.00
0.
13
0.25
3
U
C. g
aler
ita
sulp
hur-
cres
ted
cock
atoo
C
22
.9 (
0.4)
L
Min
or
1.50
0.
44
0.38
16
T
T
richo
glos
sus
hae
mat
odus
ra
inbo
w lo
rikee
t C
12
.2 (
0.1)
M
M
inor
2.
75
2.69
7.
31
32
I T
. chl
orol
epi
do
tus
scal
y-br
eas
ted
lorik
eet
C
11
.3 (
0.2)
M
M
inor
0.
13
0.69
0.
56
7 U
A
liste
rus
scap
ular
is
Aus
tral
ian
kin
g-p
arro
t C
17
.4 (
0.3)
§
L M
ixed
0.
56
0.26
0.
32
23
T
Pla
tyce
rcus
ele
gans
cr
imso
n ro
sella
C
14
.4 (
0.2)
M
M
ixed
0.
31
0.06
0.
00
4 U
P
. ads
citu
s pa
le-h
ead
ed r
ose
lla
C
12.1
(0.
2)
M
Mix
ed
0.25
0.
94
1.31
14
T
E
udyn
amys
sco
lopa
cea
com
mon
ko
el
D
18.2
(0.
2) §
L
Maj
or
0.38
0.
38
0.69
17
T
S
cyth
rops
nov
aeh
olla
ndi
ae
chan
nel-
bille
d cu
ckoo
D
32
.8 (
0.6)
L
Maj
or
0.06
0.
19
0.25
7
T
Ant
hoch
aera
chr
ysop
tera
lit
tle w
attle
bird
D
9.9
(0.1
) S
M
inor
0.
00
0.19
0.
25
6 T
P
hile
mon
cor
nicu
latu
s no
isy
fria
rbird
D
11
.5 (
0.4)
M
M
inor
0.
06
0.00
0.
44
3 U
E
nto
myz
on
cyan
otis
bl
ue-
face
d ho
ne
yeat
er +
D
13
.1 (
0.4)
M
M
inor
0.
00
0.13
0.
00
1 U
M
anor
ina
me
lano
ceph
ala
no
isy
min
er
D
10.2
(0.
3)
M
Min
or
0.00
0.
00
0.38
3
U
Mel
ipha
ga le
win
ii le
win
’s h
one
yeat
er
D
10.5
(0.
2)
M
Mix
ed
8.00
8.
75
7.63
48
T
M
yzo
mel
a sa
ngu
inol
enta
sc
arle
t ho
neye
ater
D
5.2
(0.1
) S
M
inor
1.
56
1.69
1.
25
32
T
Cor
acin
a n
ova
eho
lland
iae
blac
k-fa
ced
cuck
oo-s
hrik
e
D
17.4
(0.
2)
L M
inor
0.
13
0.06
1.
88
10
I C
. lin
eat
a ba
rred
cuc
koo-
shrik
e +
D
13.5
(0.
2)
M
Mix
ed
0.00
0.
00
0.14
2
U
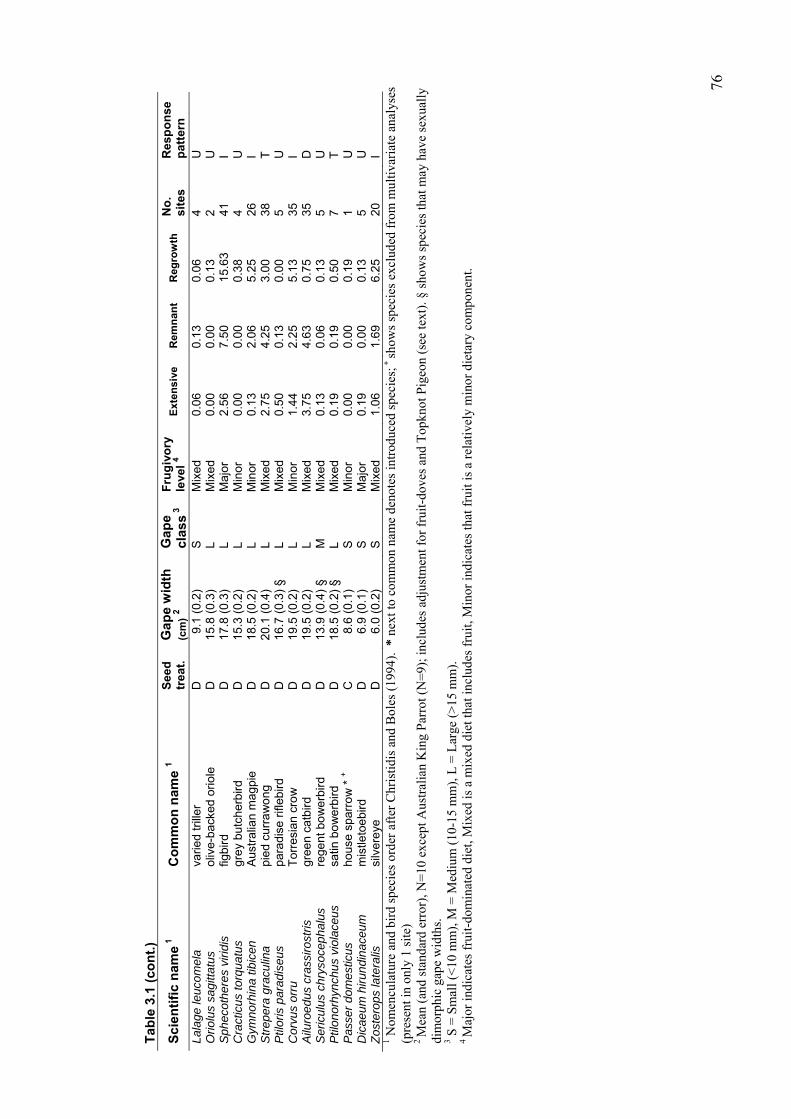
76
Tab
le 3
.1 (
con
t.)
Sci
enti
fic
nam
e 1
Co
mm
on
nam
e 1
See
d
trea
t.
Gap
e w
idth
(c
m) 2
Gap
e cl
ass 3
F
rug
ivo
ry
leve
l 4
Ext
ensi
ve
Rem
nan
t R
egro
wth
N
o.
site
s R
esp
on
se
pat
tern
La
lage
leuc
om
ela
varie
d tr
iller
D
9.1
(0.2
) S
M
ixed
0.
06
0.13
0.
06
4 U
O
riolu
s sa
gitta
tus
oliv
e-ba
cked
ori
ole
D
15
.8 (
0.3)
L
Mix
ed
0.00
0.
00
0.13
2
U
Sph
ecot
here
s vi
ridis
fig
bird
D
17
.8 (
0.3)
L
Maj
or
2.56
7.
50
15.6
3 41
I
Cra
ctic
us to
rqua
tus
gre
y bu
tch
erbi
rd
D
15.3
(0.
2)
L M
inor
0.
00
0.00
0.
38
4 U
G
ymno
rhin
a tib
icen
A
ustr
alia
n m
agpi
e D
18
.5 (
0.2)
L
Min
or
0.13
2.
06
5.25
26
I
Str
eper
a gr
acu
lina
pie
d cu
rra
wo
ng
D
20
.1 (
0.4)
L
Mix
ed
2.75
4.
25
3.00
38
T
P
tilor
is p
arad
iseu
s pa
radi
se r
ifleb
ird
D
16
.7 (
0.3)
§
L M
ixed
0.
50
0.13
0.
00
5 U
C
orvu
s or
ru
Tor
resi
an c
row
D
19
.5 (
0.2)
L
Min
or
1.44
2.
25
5.13
35
I
Ailu
roed
us c
rass
irost
ris
gree
n ca
tbir
d
D
19.5
(0.
2)
L M
ixed
3.
75
4.63
0.
75
35
D
Ser
icul
us c
hrys
ocep
halu
s re
gent
bo
we
rbir
d
D
13.9
(0.
4) §
M
M
ixed
0.
13
0.06
0.
13
5 U
P
tilon
orhy
nchu
s vi
olac
eus
satin
bo
we
rbird
D
18
.5 (
0.2)
§
L M
ixed
0.
19
0.19
0.
50
7 T
P
asse
r do
mes
ticus
ho
use
spar
row
* +
C
8.6
(0.1
) S
M
inor
0.
00
0.00
0.
19
1 U
D
icae
um
hir
undi
nac
eum
m
istle
toe
bird
D
6.9
(0.1
) S
M
ajor
0.
19
0.00
0.
13
5 U
Z
oste
rops
late
ralis
si
lver
eye
D
6.0
(0.2
) S
M
ixed
1.
06
1.69
6.
25
20
I 1 N
omen
cula
ture
and
bir
d sp
ecie
s or
der
afte
r C
hris
tidis
and
Bol
es (
1994
). *
nex
t to
com
mon
nam
e de
note
s in
trod
uced
spe
cies
; + sh
ows
spec
ies
excl
uded
fro
m m
ultiv
aria
te a
naly
ses
(pre
sent
in o
nly
1 si
te)
2 M
ean
(and
sta
ndar
d er
ror)
, N=
10 e
xcep
t Aus
tral
ian
Kin
g P
arro
t (N
=9)
; inc
lude
s ad
just
men
t for
fru
it-do
ves
and
Top
knot
Pig
eon
(see
text
). §
sho
ws
spec
ies
that
may
hav
e se
xual
ly
dim
orph
ic g
ape
wid
ths.
3 S
= S
mal
l (<
10 m
m),
M =
Med
ium
(10
-15
mm
), L
= L
arge
(>
15 m
m).
4 M
ajor
indi
cate
s fr
uit-
dom
inat
ed d
iet,
Mix
ed is
a m
ixed
die
t tha
t inc
lude
s fr
uit,
Min
or in
dica
tes
that
fru
it is
a r
elat
ivel
y m
inor
die
tary
com
pone
nt.

77
.
Figure 3.1 Inter-relationships between frugivorous bird attributes; i) the number of
seed-crushing and seed-dispersing bird species from each frugivory level (major n=11,
mixed-diet n=15, and minor n=12); ii) the number of seed-crushing and seed-dispersing
bird species from each gape width class (small n=6, medium n=15, and large n=17);
and iii) the actual gape width of each bird species in major, mixed-diet and minor
frugivory levels
0
4
8
12
16
Major Mixed Minor
Frugivory level
No
. fru
giv
ore
sp
eci
es Disperser
Crusher
0
4
8
12
16
20
Small Medium Large
Gape width class
No
. fru
giv
ore
sp
eci
es Disperser
Crusher
0
10
20
30
40
Gap
e w
idth
(m
m)
Frugivory
Major Mixed Minor

78
3.3.2 Functional group abundance in remnants and regrowth relative to extensive
forest
The abundance of two functional groups (medium-gaped birds with fruit-
dominated diets and large-gaped birds with mixed diets) showed a decreasing response
to fragmentation and two groups (small-gaped, mixed-diet birds and minor frugivores)
showed an increaser abundance pattern (Table 3.3). The remaining four functional
groups showed a tolerant abundance pattern, although both seed-crushers and the large-
gaped, major frugivore group showed an increasing trend that was not statistically
significant.
Table 3.2 The mean (and S.E.) abundance of frugivorous bird species within each of
the eight functional groups in extensive (n=16), remnant (n=16) and regrowth (n=16)
forest in southeast Queensland.
Functional group 1 Extensive Remnant Regrowth ANOVA p 2 Abund. pattern3
1. Large gape, fruit-dominated diet (5)
9.31 (1.69) 9.94 (1.60) 17.50 (3.84) 0.06 T
2. Medium gape, fruit-dominated diet (2)
3.94 (0.62)a 2.44 (0.35)b 0.88 (0.30)c <0.0001 D
3. Large gape, mixed diet (5) 7.19 (0.88)a 9.19 (1.18)a 4.38 (0.85)b 0.005 D 4. Medium gape, mixed diet (3) 8.13 (0.50) 8.81 (0.63) 7.94 (0.60) 0.54 T 5. Small gape, fruit-dominated diet (1)
0.19 (0.10) 0.00 0.13 (0.09) 0.22 T
6. Small gape, mixed diet (2) 1.13 (0.49)a 1.81 (0.97)a 6.31 (1.70)b 0.005 I 7. Fruit a minor dietary component (all gape width classes) (9)
3.31 (0.67)a 6.38 (1.13)a 14.94 (1.66)b <0.0001 I
8. Seed-crushers (all gape width classes and frugivory levels) (15)
13.19 (1.29) 17.50 (1.76) 18.50 (1.87) 0.07 T
1 The number of species in each group is shown in brackets next to group name. The species comprising
each group are shown in Table 3.2. 2 Results of ANOVA between site types (d.f. = 2, 47). Groups differing significantly in abundance
(p<0.05) are given different letters. 3 The response to fragmentation for each group (D=decreaser, T=tolerant, I=increaser, see Chapter Two
for description of patterns).
There was a positive association between a species’ seed dispersal potential and
its sensitivity to forest fragmentation and disturbance (Spearman’s r = 0.39, p = 0.049).
Bird species making a relatively high potential contribution to seed dispersal tended to
show decreaser or tolerant abundance patterns, while bird species considered to have
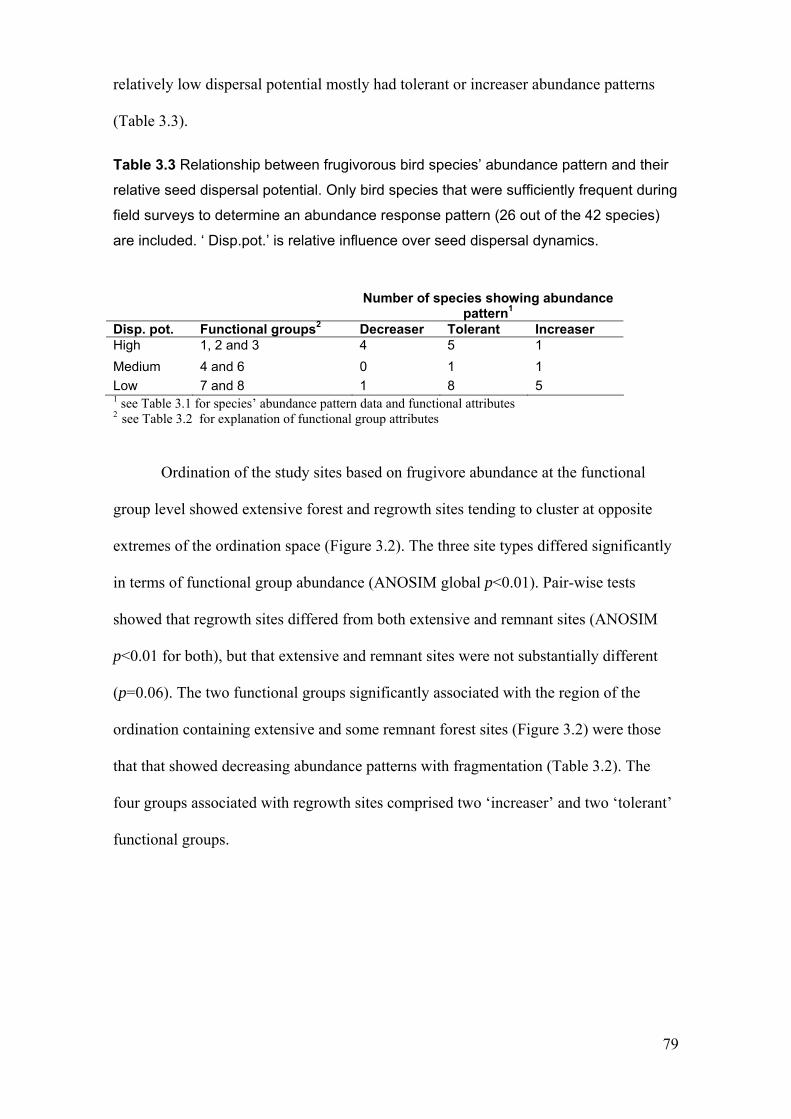
79
relatively low dispersal potential mostly had tolerant or increaser abundance patterns
(Table 3.3).
Table 3.3 Relationship between frugivorous bird species’ abundance pattern and their
relative seed dispersal potential. Only bird species that were sufficiently frequent during
field surveys to determine an abundance response pattern (26 out of the 42 species)
are included. ‘ Disp.pot.’ is relative influence over seed dispersal dynamics.
Number of species showing abundance pattern1
Disp. pot. Functional groups2 Decreaser Tolerant Increaser High 1, 2 and 3 4 5 1
Medium 4 and 6 0 1 1
Low 7 and 8 1 8 5 1 see Table 3.1 for species’ abundance pattern data and functional attributes 2 see Table 3.2 for explanation of functional group attributes
Ordination of the study sites based on frugivore abundance at the functional
group level showed extensive forest and regrowth sites tending to cluster at opposite
extremes of the ordination space (Figure 3.2). The three site types differed significantly
in terms of functional group abundance (ANOSIM global p<0.01). Pair-wise tests
showed that regrowth sites differed from both extensive and remnant sites (ANOSIM
p<0.01 for both), but that extensive and remnant sites were not substantially different
(p=0.06). The two functional groups significantly associated with the region of the
ordination containing extensive and some remnant forest sites (Figure 3.2) were those
that that showed decreasing abundance patterns with fragmentation (Table 3.2). The
four groups associated with regrowth sites comprised two ‘increaser’ and two ‘tolerant’
functional groups.

80
Figure 3.2 Ordination of the 48 study sites based on numbers of birds from each
functional group (Stress = 0.22). is extensive forest, is remnants, is regrowth.
The lower panel shows abundance vectors for those functional groups significantly
(p<0.05) associated with the ordination.
Medium-gaped, major frugivores
Minor frugivores
Crushers
Small-gaped, mixed-diet frugivores
Large-gaped, major frugivores
Large-gaped, mixed-diet frugivores
81
3.4 Discussion
3.4.1 Characteristics of the frugivorous birds assemblage
Approximately one-third of the 42 frugivorous bird species recorded in these
surveys crush seeds. This is a similar proportion of the frugivorous bird assemblage as
that recorded in the Neotropics (Terborgh 1986). Seed-crushing species included several
species of parrot, plus certain doves and pigeons, such as the white-headed pigeon and
brown cuckoo-dove. Birds that crush seeds probably contribute relatively little to seed
dispersal, although a small proportion of ingested seeds may remain intact following
passage through the gut of these species (Snow 1981; Corlett, 1998; Dennis and
Westcott, 2006).
Of the 27 seed-dispersing bird species identified, seven species may also
contribute comparatively little to broad patterns of seed dispersal, since fleshy fruits are
only a minor component of their diets. The 20 remaining species do not crush seeds and
have either fruit-dominated or mixed diets in which fruit is a conspicuous component.
These birds would have most influence over seed dispersal dynamics in the study
region, although some species were recorded in low numbers during surveys.
In the frugivore assemblage studied, there was no consistent association between
any of the measured functional attributes. The positive association between gape size
and dietary dominance of fruit that had been reported elsewhere (Fuentes 1994) was not
apparent in this assemblage.
3.4.2 Functional characteristics of the frugivorous bird assemblage in fragmented
rainforest in subtropical Australia: assessment of potential consequences for
seed dispersal
The frugivore attributes of seed crushing behaviour, gape width and frugivory
level were used to describe groups of species that may have similar functional roles in
82
terms of their capacity to disperse the seeds of similar plants, especially plants with
similar-sized diaspores. This dimension of functional variation among frugivore species
is useful in assessing whether changes in the species composition of a frugivore
assemblage may result in the loss of potential dispersal agents for certain plant species
(e.g., Silva and Tabarelli, 2000). In addition to dietary composition, variation among
frugivore species in factors such as their abundance in a habitat, feeding rates, dispersal
distances and patterns of microhabitat use is likely to lead to variation in their role as
seed dispersers (Schupp, 1993; Jordano and Schupp, 2000; Loiselle and Blake, 2002).
The functional groupings were not assembled using specific dietary information,
but the attributes used to form the groups have been linked with dietary composition
(Crome, 1975, 1978; Moermond and Denslow, 1983, 1985; Wheelwright, 1985;
Moermond et al., 1986; Whelan and Willson, 1994). All but one of the groups formed
using these attributes were multispecific, indicating functional overlap and the potential
for substitution among frugivore species (Loiselle and Blake 2002). The only functional
group with a single member (the mistletoebird) was the small-gaped, fruit-dominated
diet group. This species is likely to have a different diet to most other frugivore species
in that it is largely restricted to fruits from mistletoe plants (Loranthaceae). However,
other bird species may also be efficient and effective dispersers of seeds from these
plants (Reid, 1989), and the importance of mistletoe as food for the mistletoebird may
be disproportionate to the importance of the mistletoebird as a disperser of mistletoe, as
has been described for other frugivore-plant interactions (Herrera, 1984; Jordano, 1987;
Silva et al., 2002).
In the context of changes in the frugivore assemblage in fragmented landscapes,
functional overlap may mean that the decline of one frugivore species may be offset by
increased numbers of a functionally similar bird species. Dispersers of large fruited
plants are vulnerable to decline in tropical fragmented landscapes throughout the world
83
(Corlett, 1996, 1998; Harrington et al,. 1997; Silva and Tabarelli, 2000; Kitamura et al.,
2002; McConkey and Drake, 2002). Foraging observations at large-seeded plant species
suggest that this may also be the case in subtropical rainforests of southeast Queensland
(Green, 1993). Approximately 30% of the species comprising the avian frugivore
assemblage of subtropical Australia (14 out of 42 of the species considered in this
study) have wide gapes (>15 mm). Four of these species are minor frugivores and may
make relatively little contribution to the dispersal of these plants. A similar percentage
(24%) of the frugivorous bird species had gapes wider than 15 mm in the Brazilian
Atlantic (Silva and Tabarelli, 2000).
However, the overall abundance of the functional group that may have the
greatest potential to disperse large-seeded plants (large-gaped, major frugivores) did not
decline in fragmented rainforest in the Sunshine Coast, and in fact showed a strong
tendency towards increasing in abundance in regrowth. This increasing tendency was
entirely due to the greatly increased abundance of the figbird in remnant, and
particularly in regrowth, sites, compared with extensive forest. Numbers of other bird
species from this functional group were either low and similar among site types (e.g.
common koel) or much lower in remnants (e.g. wompoo fruit-dove). Although fruit-
doves have been nominated as having the greatest potential among avian frugivores to
disperse large-seeded plants in subtropical Australian rainforests (Frith, 1982; Green,
1995), the present work has shown that figbirds are also morphologically capable of
dispersing large fruits. Consequently, the high abundance of figbirds in remnants and
regrowth habitats of the study region potentially maintains the dispersal of large-seeded
plant species in these parts of the landscape. Furthermore, other bird species with the
potential to disperse large-seeded plants (the topknot pigeon, pied currawong and satin
bowerbird) were also present in these habitats. Hence, in contrast to tropical landscapes
elsewhere, the loss or decline of bird species such as the wompoo fruit-dove from

84
fragmented subtropical Australian rainforest landscapes may not result in reduced
dispersal of large fruited plant species.
However, the functional group approach used here may overstate potential
similarity among frugivore species. For example, although the channel-billed cuckoo
has a large gape and fruit-dominated diet, available information suggests that their diet
may be dominated by figs (Blakers et al., 1984). Consequently, this species may not
contribute to the dispersal of large fruited plants, despite their very large gape. Second,
movement patterns and gut passage rates may mean that certain frugivore species do not
disperse seeds among fragmented habitats (Silva et al., 1996; Alcántara et al., 2000). In
the case of figbirds, radiotracking in northern Australia has shown that birds of this
species regularly fly distances of several kilometres between rainforest patches, and also
visit isolated trees (Price, 1999). Furthermore, aviary tests showed that the gut passage
times of figbirds resembled those of fruit pigeons (Price 1999). Therefore, the role of
figbirds in dispersing seeds within and among remnant and regrowth forests would
probably not be limited by restricted movement patterns nor by very rapid gut passage
times. Third, patterns of plant species consumption are likely to be influenced by a
frugivore species’ digestive adaptations (Levey and Grajal, 1991; Martínez del Rio and
Restrepo, 1993; Cipollini and Levey, 1997) and ability to handle secondary compounds
(Levey and Martínez del Rio, 2001). The relationship between these factors and
frugivory level is not known, although may be likely to be associated with taxonomy.
The two functional groups whose overall abundance decreased in remnants
and/or regrowth were large-gaped birds with mixed diets and medium-gaped birds with
fruit-dominated diets. An overall decrease in the dispersal of plants eaten by birds from
these two groups would be expected to result from declines of these functional groups.
The medium-gaped birds with fruit-dominated diets (superb and rose-crowned fruit-
doves) small fruit-doves may consume a suite of rainforest plants that is distinct from
85
other birds, even the closely-related wompoo fruit-dove. In a detailed dietary study of
these species in north Queensland, the superb and rose-crowned fruit-doves
predominantly consumed species from the family Araliaceae and from the lauraceous
genera Endiandra and Litsea, whereas the wompoo fruit-dove fed more on plants from
the family Elaeocarpaceae and the lauraceous genus Cryptocarya (Crome, 1975). All
three species were associated with extensive forest rather than remnant or regrowth sites
in the present study. It seems likely that the greatly reduced numbers of these birds in
fragmented and disturbed habitats would cause changes in the composition and rate of
seed dispersal in these habitats, even though the figbird replaces them numerically.
Numbers of the small-gaped, mixed diet functional group increased in regrowth
compared with remnant and extensive forest. This group comprised the varied triller and
the silvereye, although the increasing pattern was driven by numbers of the silvereye.
The plant species dispersed by these frugivores would be expected to increase in
fragmented rainforest landscapes of subtropical Australia. Consequently, the
regeneration trajectory of rainforest regrowth in fragmented parts of the landscape may
be strongly influenced by the plant species consumption patterns of these bird species.
If, as may be expected from their small size and mixed diet, these birds consume large
numbers of introduced weed species (Richardson et al., 2000), fragmented rainforest
may be overwhelmed by the input of fleshy-fruited weeds.
There was an overall positive association between a species’ seed dispersal
potential and the extent to which their abundance was negatively impacted in remnants
and regrowth. It was considered that birds with fruit-dominated diets and large or
medium gapes were likely to have a disproportionately high influence over general seed
dispersal patterns. Because these species are nutritionally dependent on fruit, they may
be likely to consistently eat a large volume of fruit and to need to feed on a range of
plant species to cope with the temporal variation in availability of any given species

86
(Leighton and Leighton, 1983). Since having a larger gape gives birds access to a
greater range of available fruits (Wheelwright 1985), it was also expected that large-
gaped birds with mixed diets may have relatively high seed dispersal potential. All
except one of the species (figbird) within these three functional groups showed either a
decreasing or tolerant abundance response to forest fragmentation and disturbance.
Consequently, it is predicted that the overall rate of seed dispersal may be lower, and
that fewer plant taxa plant taxa would be dispersed in remnants and regrowth than in
extensive forest. The plants that are predicted to be most likely to be affected by these
changes are large fruited plants and Lauraceae. Beyond this, predictive power is limited
by a lack of information regarding associations between frugivore traits and patterns of
consumption of plant species.
The approach presented here provides a means of systematically assessing
dispersal potential in relation to frugivore assemblage composition. As this has not
previously been done, specific dietary information is required to assess whether the
functional attributes selected do reflect major variation among frugivorous bird species
in their diet composition.
87
Chapter Four
Variation in patterns of plant species consumption by frugivorous bird
species is related to gape width, degree of frugivory and seed treatment
4.1 Introduction
A primary determinant of functional variation among frugivore species is the
suite of plant species that they consume and disperse (Gautier-Hion et al., 1985; Corlett,
1998; Hamann and Curio, 1999; Kitamura et al., 2002; Poulsen et al., 2002; Silva et al.,
2002). However, information on plant species consumption is extremely time-
consuming to collect and only limited information is available for most of the frugivore
species in an assemblage (Hamann and Curio, 1999; Kitamura et al., 2002; Silva et al.,
2002). In contrast, information regarding the morphology and behaviour of frugivore
species may be more easily gained (e.g, Dunning, 1993). These factors may influence
patterns of plant species consumption by interacting with variation in the traits of plant
species (e.g., fruit size) (van der Pijl, 1982; Gautier-Hion et al., 1985). Potentially,
information about the relevant traits of frugivore species may be used to assess their role
in seed dispersal when detailed dietary information is not available.
Functional classifications of frugivore species, which relate types of frugivores
to the types of plants they consume, are a step in the development of a predictive
understanding of seed dispersal interactions. Most studies of frugivore diets have
documented variation among only a subset of the frugivore or plant species in an
assemblage (e.g, Crome, 1975; Innis, 1989; Sun et al., 1997; Brown and Hopkins, 2002;
Kitamura et al., 2002). Consequently, our understanding of patterns of fruit-frugivore
interactions across frugivore communities is limited (Herrera, 1998, 2001). The

88
traditional approach of comparing among taxonomic groups (e.g., birds and mammals)
has yielded knowledge of broad patterns of dietary variation across a frugivore
community (Van der Pijl, 1982; Gautier-Hion et al., 1985; Bollen et al., 2004).
However, this approach obscures the variation among species within taxonomic groups
(Willson et al., 1989; Stiles, 1993; Graham et al., 2002; Lord et al., 2002). For example,
the gape width of frugivorous bird species imposes an intractable upper threshold on the
size of fruits that they can swallow (Herrera, 1981; Wheelwright, 1985). Consequently,
bird species with wider gapes are capable of consuming plant species with larger fruits
while bird species with narrow gapes are physically constrained to swallowing only
small fruits (Wheelwright, 1985; Silva and Tabarelli, 2000; McConkey and Drake,
2002; Kitamura et al., 2002). In Costa Rica, Wheelwright (1985) showed that the
maximum and mean size of fruits that were consumed by frugivorous bird species were
positively correlated with their gape widths.
Variation in patterns of plant species consumption by different frugivore species
may also be explained by variation in the energetic or chemical content of fruits
(Herrera, 1982, 1987; Stiles, 1993; Jordano, 1995; Cipollini and Levey, 1997).
Frugivore species vary in their capacity to digest plant toxins, lipids and sugars (Izhaki
and Safriel, 1989; Martínez del Rio and Restrepo, 1993; Cipollini and Levey, 1997).
Frugivore species also vary in their degree of nutritional dependence on fruit (Snow,
1971; McKey, 1975). Most frugivorous species eat fruit as part of a varied diet that also
includes other items, such as nectar or invertebrates. The tissues of non-fruit foods,
especially insects, are relatively rich in protein and other nutrients (Morton, 1973;
Herrera, 1987; Izhaki and Safriel, 1989). Frugivore species that only consume fruits, but
crush and digest seeds would obtain nutrition from the seeds as well as the fruit pulp
(Snow, 1981; Innis, 1989; Jones and Crome, 1990). However, fruit is the sole source of
nutrition for a small number of species. It has been proposed that these dietary

89
specialists may be likely to select fruits with relatively high energy and protein content
(Morton, 1973; McKey, 1975; Bairlein, 1996; Bosque and Calchi, 2003). For example,
it has been reported that highly frugivorous bird species prefer to consume lipid-rich
fruits (Snow, 1971; Crome, 1975; McKey, 1975; Howe and Estabrook, 1977; Howe,
1981; Wheelwright, 1983; Stiles, 1993). This may be because lipids provide more
energy than carbohydrates (Johnson et al., 1985; Witmer and Van Soest, 1998), or
because lipids tend to co-occur with high nitrogen levels (Sun et al., 1997).
In Chapter Three, it was proposed that gape width, frugivory level and seed
treatment were important functional attributes of frugivorous bird species because they
are likely to determine variation in the composition of plant species consumed by bird
species. In the present Chapter, actual patterns of plant species consumption by
frugivorous species are examined across the subtropical bird assemblage of eastern
Australia, in relation to the nominated attributes. This is made possible by a relatively
large published record of foraging information for the bird species of this region.
Specifically, tests are conducted for relationships between frugivore species’ gape
width, frugivory level and seed treatment and their patterns of fruit size consumption,
the dietary composition of plant species, and the frequency of specific plant families in
the diet. The results are used to assess whether the selected functional attributes are
useful indicators of differences among frugivorous bird species in their roles as seed
dispersers.
4.2 Methods
4.2.1 Diet composition of the frugivorous bird assemblage
In Chapter Two, 42 frugivorous bird species were identified in subtropical
rainforests of the Sunshine Coast, eastern Australia. Records of the consumption of
native plant species by these birds were obtained from 151 published sources (Appendix
90
1), together with several unpublished data sets (See Acknowledgements). Most records
had been obtained from opportunistic field observation of fruit consumption, although
some were from targeted surveys of particular plant or frugivore species. A small
number of records were obtained from bird gut contents. There was large variation
among bird species in the number of individual frugivory records available (i.e., the
total number of sources that had reported observations of frugivory). These ranged from
2 records for the galah to 228 for the satin bowerbird (including repeat observations of
the consumption of a given plant species by a bird species).
Foraging records included native and exotic species of tree, shrub, vine and herb
(Appendix 2). Because of the large geographic range of many of the bird species from
subtropical Australian rainforests, frugivory records may have been collected from a
region extending from temperate southern Australia (e.g., French, 1990) to tropical
Papua New Guinea (Frith et al., 1976). Records obtained from observation outside the
eastern Australian subtropics were included in analyses only if the plant species also
occurred within this region. The data set included records accumulated during a period
of more than 140 years, with the earliest account published by Gould (1865). For a
given frugivore species, the data potentially included foraging records from multiple
years, seasons and geographic locations. These records were compiled into a binary data
matrix containing the presence or absence of each fleshy-fruited plant species in the diet
of each of the frugivorous bird species.
Records were rejected if it appeared that the bird had not been observed actually
consuming the fruit (e.g., if it was simply observed in the fruiting plant), or if it was
judged from accompanying information that the interaction was an instance of fruit theft
(consumption of the fruit pulp without ingestion of the seed). Diaspore size (see below)
was used to further screen the records for likely cases of fruit theft; if the size of the
fruit greatly exceeded the gape width of the bird species, it was assumed that it would
91
only be capable of consuming part of the fruit and had probably acted as a fruit thief
(Howe and Estabrook, 1977). Cases were excluded if the median diaspore size was
more than twice the gape width of the frugivore species. This approach accounts for
potentially substantial intraspecific variation in diaspore size (Edwards, 2005). Each
record in the screened data set was treated as evidence of the potential for the bird
species to consume and disperse viable seed from the plant species.
For each plant species, diaspore size (the functional dispersal unit) was recorded.
For most plant species, the measurement was the shorter axis (usually diameter) of the
whole fruit. However, seed diameter was used for soft fruits with multiple small seeds
(e.g. many species in the Solanaceae and Moraceae) that can be dispersed as a result of
piecemeal consumption (Corlett, 1998; Kitamura et al., 2002). Similarly, for dehiscent,
arillate fruits such as Alectryon spp. (family Sapindaceae), the diameter of an individual
seed plus the fleshy aril was used. Diaspore size data were collected from published
literature (Williams et al., 1984; Floyd, 1989; Cooper and Cooper, 1994; Hauser and
Blok, 1998; Butler, 2003), supplemented with data from field collections (S. McKenna,
C. Moran) and biological web sites. In most cases, a range of diaspore size values was
reported and the median of these was used in analyses.
Diaspores with a median width greater than 75% of the gape width of a bird
species were considered to be close to the bird species’ morphological handling
capacity. This was used to calculate, for each bird species, the percentage of plant
species consumed that had diaspores close in size to the bird’s handling capacity.
4.2.2 Functional attributes of bird species
Four of the 42 bird species (scarlet honeyeater Myzomela sanguinolenta, house
sparrow Passer domesticus, rock dove Columba livia and Australian magpie
Gymnorhina tibicen) were rarely recorded consuming fruit of native plant species (less

92
than two native plant species recorded) and are therefore not considered further. The
remaining 38 bird species were categorised based on three attributes considered to
influence their patterns of fruit consumption in terms of plant species (see Chapter
Three). Gape width was measured on museum specimens of each bird species and
ranged from 6.0 mm (silvereye Zosterops lateralis) to 32.8 mm (channel-billed cuckoo
Scythrops novaehollandiae). For some analyses these data were used to group bird
species into three gape width categories: small (<10 mm), medium (10 – 15 mm), or
large (>15 mm). Each species’ degree of frugivory was classified into one of three
categories: 11 bird species had a fruit-dominated diet (‘major frugivores’), 15 had a diet
comprising more than one main food type, one of which was fruit (‘mixed-diet
frugivores’) and 12 had a diet dominated by food other than fruit, but which
occasionally included fruit (‘minor frugivores’). The relative level of dependence of
each bird species on fruit was determined primarily from qualitative descriptions in the
literature (Blakers et al., 1984; the Handbook of Australian, New Zealand and Antarctic
Birds (HANZAB) series: Marchant and Higgins, 1993; Higgins and Davies, 1996;
Higgins, 1999; Higgins et al., 2001). Each bird species was also categorised as being
either a seed-disperser or seed-crusher, based on information contained in the HANZAB
series about the destruction of seeds during either feeding (parrots, cockatoos) or
digestion (certain pigeon and dove species, Australian brush turkey). The measurement
and classification of frugivore attributes is explained in more detail in Chapter Three
(Section 3.2.1).
4.2.3 Data analyses
Tests to establish whether a bird species’ frugivory level, gape size and seed
treatment were independent of one another were described in Chapter Three (Section
3.2.2).
93
One-way analyses of covariance (ANCOVA) were used to test the effect of the
independent variable frugivory level (three levels: major (n=10 (the channel-billed
cuckoo was excluded from analyses)), mixed-diet (n=15) and minor (n=12)) on the
following dependent variables: i) the size of diaspores consumed; ii) the percentage of
diaspores consumed that were close to a bird species’ handling capacity (i.e., wider than
75% of its gape width); and iii) the total number of plant species consumed. Species’
gape widths (actual width in mm) were used as the covariate in analyses. Homogeneity
of regression slopes was tested using the interaction between frugivory level and gape
width.
Differences between major and mixed-diet frugivores in the number of species
consumed from plant families with at least three species represented in the data set were
tested using t-tests. A parametric procedure was used for families with >15 plant species
in the data set (three families), while randomisation (1 000 iterations) was used for the
25 plant families with 4 - 15 species represented (using the Pop-tools add-in in MS
Excel (Hood, 2003).
A classification tree for frugivore species, based on their dietary composition,
was generated using the UPGMA algorithm (Manly, 1994) and Bray-Curtis
dissimilarity metric in PRIMER (Clarke and Warwick, 2001). Plant species that had
been recorded in the diet of less than three frugivore species, and frugivores that had
been recorded consuming less than three plant species were excluded from all
multivariate analyses to reduce variation in the data. Multivariate analyses were
subsequently conducted on a data matrix containing information for 35 bird species and
151 plant species. Similarity percentages (SIMPER; Clarke, 1993) analyses were used
to identify the plant species that contributed most to the dissimilarity between these
groups.
94
4.3 Results
Frugivory level, gape width and seed treatment varied independently across the
38 bird species (Chapter Three, Section 3.3.1, Figure 3.1). Therefore, relationships
between each attribute and patterns of plant species consumption were tested
independently.
4.3.1 General patterns of plant consumption
The functional attributes and patterns of native plant species consumption of
frugivorous bird species are shown in Table 4.1. The data set relating bird species to
plant species contained information for 244 native plant species that had been consumed
by at least one of the 38 frugivorous bird species. There was considerable variation
between plant species in the suites of frugivore species that were known to consume
them. An average of 5.2 (S.E. 0.30) frugivorous bird species was recorded consuming
each native plant species (range 1 – 26 bird species).
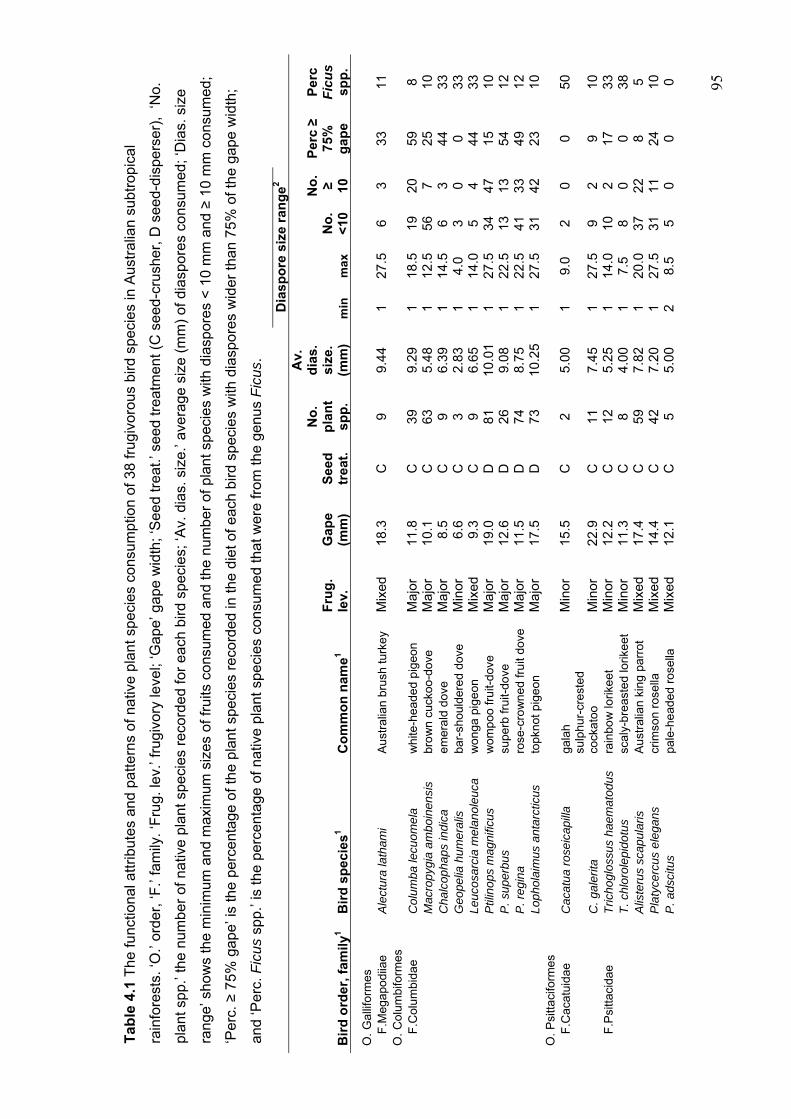
95
Tab
le 4
.1 T
he f
unct
iona
l att
ribut
es a
nd p
atte
rns
of n
ativ
e pl
ant
spec
ies
cons
umpt
ion
of 3
8 fr
ugiv
orou
s bi
rd s
peci
es in
Aus
tral
ian
subt
ropi
cal
rain
fore
sts.
‘O.’
orde
r, ‘F
.’ fa
mily
. ‘F
rug.
lev.
’ fru
givo
ry le
vel;
‘Gap
e’ g
ape
wid
th; ‘
See
d tr
eat.
’ see
d tr
eatm
ent (
C s
eed-
crus
her,
D s
eed-
disp
erse
r),
‘No.
plan
t sp
p.’ t
he n
umbe
r of
nat
ive
plan
t sp
ecie
s re
cord
ed f
or e
ach
bird
spe
cies
; ‘A
v. d
ias.
siz
e.’ a
vera
ge s
ize
(mm
) of
dia
spor
es c
onsu
med
; ‘D
ias.
siz
e
rang
e’ s
how
s th
e m
inim
um a
nd m
axi
mum
siz
es o
f fru
its c
onsu
med
and
the
num
ber
of p
lant
spe
cies
with
dia
spor
es <
10
mm
and
≥ 1
0 m
m c
onsu
med
;
‘Per
c. ≥
75%
gap
e’ is
the
perc
enta
ge o
f th
e pl
ant
spec
ies
reco
rded
in th
e di
et o
f ea
ch b
ird s
peci
es w
ith d
iasp
ores
wid
er t
han
75%
of t
he
gape
wid
th;
and
‘Per
c. F
icu
s sp
p.’ i
s th
e pe
rcen
tage
of n
ativ
e pl
ant s
peci
es c
onsu
med
tha
t w
ere
from
the
gen
us F
icus
.
Dia
spo
re s
ize
ran
ge
2
Bir
d o
rder
, fam
ily1
Bir
d s
pec
ies1
Co
mm
on
nam
e1 F
rug
. le
v.
Gap
e (m
m)
See
d
trea
t.
No
. p
lan
t sp
p.
Av.
d
ias.
si
ze.
(mm
) m
in
max
N
o.
<10
No
. ≥ 10
Per
c ≥
75%
g
ape
Per
c F
icu
s sp
p.
O.
Gal
lifor
mes
F.M
egap
odi
iae
A
lect
ura
lath
ami
Aus
tral
ian
brus
h tu
rke
y M
ixed
18
.3
C
9 9.
44
1 27
.5
6 3
33
11
O. C
olum
bifo
rmes
F.C
olum
bida
e C
olu
mba
lecu
om
ela
w
hite
-hea
ded
pig
eon
Maj
or
11.8
C
39
9.
29
1 18
.5
19
20
59
8
Mac
ropy
gia
am
boi
nens
is
bro
wn
cuck
oo-d
ove
Maj
or
10.1
C
63
5.
48
1 12
.5
56
7 25
10
Cha
lcop
haps
indi
ca
emer
ald
dove
M
ajor
8
.5
C
9 6.
39
1 14
.5
6 3
44
33
G
eope
lia h
um
era
lis
bar-
shou
lder
ed d
ove
Min
or
6.6
C
3
2.83
1
4.0
3 0
0 33
Leuc
osar
cia
mel
ano
leuc
a w
on
ga p
ige
on
Mix
ed
9.3
C
9
6.65
1
14.0
5
4 44
33
Ptil
inop
s m
agni
ficus
w
om
poo
frui
t-d
ove
Maj
or
19.0
D
81
10
.01
1 27
.5
34
47
15
10
P
. sup
erbu
s su
perb
frui
t-do
ve
Maj
or
12.6
D
26
9.
08
1 22
.5
13
13
54
12
P
. reg
ina
rose
-cro
wn
ed
frui
t dov
e M
ajor
11
.5
D
74
8.75
1
22.5
41
33
49
12
Lop
hola
imus
ant
arct
icus
to
pkno
t pig
eon
M
ajor
17
.5
D
73
10.2
5 1
27.5
31
42
23
10
O
. P
sitta
cifo
rmes
F.C
acat
uid
ae
Cac
atu
a ro
seic
apill
a ga
lah
Min
or
15.5
C
2
5.00
1
9.0
2 0
0 50
C
. gal
erita
su
lphu
r-cr
este
d co
ckat
oo
Min
or
22.9
C
11
7.
45
1 27
.5
9 2
9 10
F
.Psi
ttaci
dae
Tric
hogl
ossu
s ha
em
atod
us
rain
bow
lorik
eet
Min
or
12.2
C
12
5.
25
1 14
.0
10
2 17
33
T. c
hlor
ole
pid
otu
s sc
aly-
bre
aste
d lo
rike
et
Min
or
11.3
C
8
4.00
1
7.5
8 0
0 38
Alis
teru
s sc
apul
aris
A
ustr
alia
n ki
ng
par
rot
Mix
ed
17.4
C
59
7.
82
1 20
.0
37
22
8 5
P
laty
cerc
us e
lega
ns
crim
son
rose
lla
Mix
ed
14.4
C
42
7.
20
1 27
.5
31
11
24
10
P
. ads
citu
s pa
le-h
ead
ed r
ose
lla
Mix
ed
12.1
C
5
5.00
2
8.5
5 0
0 0
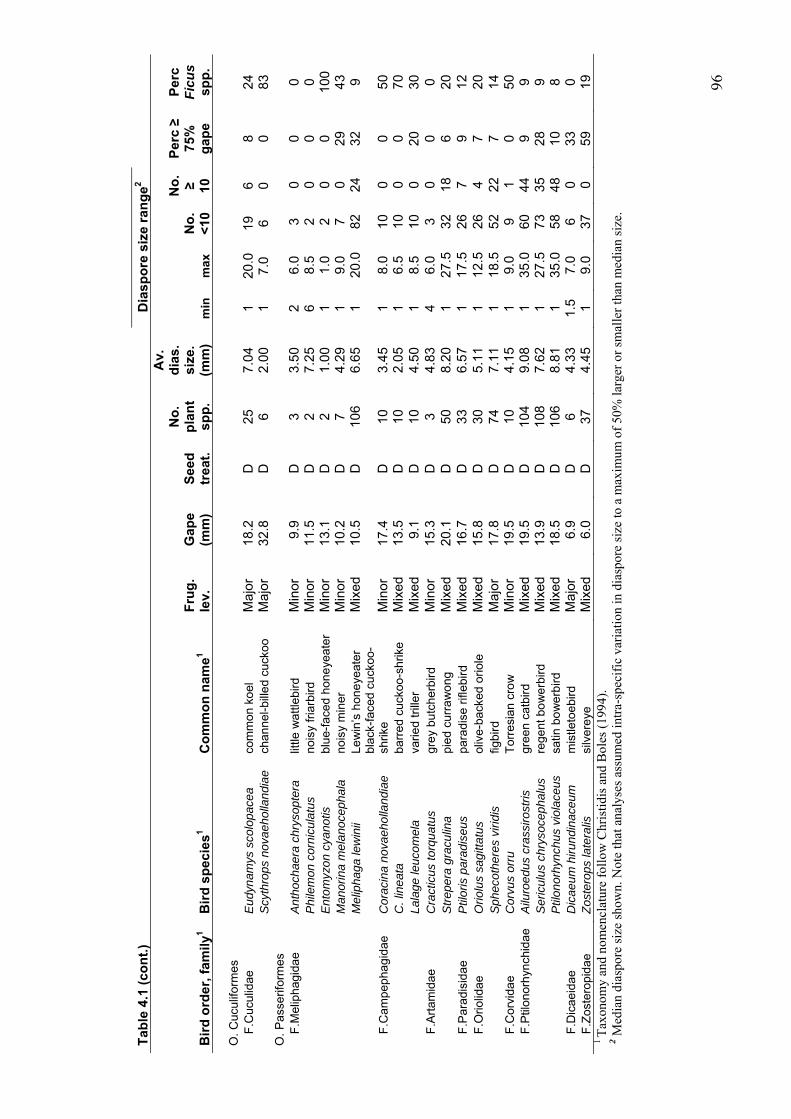
96
Tab
le 4
.1 (
con
t.)
D
iasp
ore
siz
e ra
ng
e2
Bir
d o
rder
, fam
ily1
Bir
d s
pec
ies1
Co
mm
on
nam
e1 F
rug
. le
v.
Gap
e (m
m)
See
d
trea
t.
No
. p
lan
t sp
p.
Av.
d
ias.
si
ze.
(mm
) m
in
max
N
o.
<10
No
. ≥ 10
Per
c ≥
75%
g
ape
Per
c F
icu
s sp
p.
O. C
ucul
iform
es
F
.Cuc
ulid
ae
Eud
ynam
ys s
colo
pace
a co
mm
on k
oel
M
ajor
18
.2
D
25
7.04
1
20.0
19
6
8 24
Scy
thro
ps n
ovae
hol
lan
dia
e ch
anne
l-bi
lled
cuck
oo
Maj
or
32.8
D
6
2.00
1
7.0
6 0
0 83
O
. P
asse
rifor
mes
F.M
elip
hag
ida
e A
ntho
chae
ra c
hrys
opte
ra
little
wat
tlebi
rd
Min
or
9.9
D
3
3.50
2
6.0
3 0
0 0
P
hile
mon
cor
nicu
latu
s no
isy
fria
rbird
M
inor
11
.5
D
2 7.
25
6 8.
5 2
0 0
0
Ent
om
yzo
n cy
anot
is
blu
e-fa
ced
hon
eye
ater
M
inor
13
.1
D
2 1.
00
1 1.
0 2
0 0
100
M
anor
ina
me
lano
ceph
ala
nois
y m
iner
M
inor
10
.2
D
7 4.
29
1 9.
0 7
0 29
43
Mel
ipha
ga le
win
ii Le
win
’s h
one
yeat
er
Mix
ed
10.5
D
10
6 6.
65
1 20
.0
82
24
32
9
F.C
ampe
pha
gid
ae
Cor
acin
a n
ova
eho
lland
iae
blac
k-fa
ced
cuck
oo-
shrik
e M
inor
17
.4
D
10
3.45
1
8.0
10
0 0
50
C
. lin
eat
a ba
rred
cuc
koo-
shrik
e M
ixed
13
.5
D
10
2.05
1
6.5
10
0 0
70
La
lage
leuc
om
ela
varie
d tr
iller
M
ixed
9
.1
D
10
4.50
1
8.5
10
0 20
30
F
.Art
amid
ae
Cra
ctic
us to
rqua
tus
gre
y bu
tch
erbi
rd
Min
or
15.3
D
3
4.83
4
6.0
3 0
0 0
S
trep
era
grac
ulin
a pi
ed c
urra
wo
ng
Mix
ed
20.1
D
50
8.
20
1 27
.5
32
18
6 20
F
.Par
adis
idae
P
tilor
is p
arad
iseu
s pa
radi
se r
ifleb
ird
Mix
ed
16.7
D
33
6.
57
1 17
.5
26
7 9
12
F.O
riolid
ae
Orio
lus
sagi
ttatu
s ol
ive-
back
ed o
riol
e M
ixed
15
.8
D
30
5.11
1
12.5
26
4
7 20
Sph
ecot
here
s vi
ridis
fig
bird
M
ajor
17
.8
D
74
7.11
1
18.5
52
22
7
14
F.C
orvi
dae
Cor
vus
orru
T
orre
sian
cro
w
Min
or
19.5
D
10
4.
15
1 9.
0 9
1 0
50
F.P
tilon
orh
ynch
idae
A
iluro
edus
cra
ssiro
stris
gr
een
catb
ird
Mix
ed
19.5
D
10
4 9.
08
1 35
.0
60
44
9 9
S
eric
ulus
chr
ysoc
epha
lus
rege
nt b
ow
erb
ird
Mix
ed
13.9
D
10
8 7.
62
1 27
.5
73
35
28
9
Ptil
onor
hync
hus
viol
aceu
s sa
tin b
ow
erb
ird
Mix
ed
18.5
D
10
6 8.
81
1 35
.0
58
48
10
8 F
.Dic
aeid
ae
Dic
aeu
m h
irun
din
aceu
m
mis
tleto
ebi
rd
Maj
or
6.9
D
6
4.33
1.
5 7.
0 6
0 33
0
F.Z
oste
ropi
dae
Z
oste
rops
late
ralis
si
lver
eye
M
ixed
6
.0
D
37
4.45
1
9.0
37
0 59
19
1 T
axon
omy
and
nom
encl
atur
e fo
llow
Chr
isti
dis
and
Bol
es (
1994
).
2 M
edia
n di
aspo
re s
ize
show
n. N
ote
that
ana
lyse
s as
sum
ed in
tra-
spec
ific
var
iati
on in
dia
spor
e si
ze to
a m
axim
um o
f 50
% la
rger
or
smal
ler
than
med
ian
size
.

97
4.3.2 The effect of gape width and frugivory level on diaspore size selection
The channel-billed cuckoo was removed from analyses relating to patterns of
diaspore size consumption, since it showed a strongly different pattern from other major
frugivore species; it predominantly consumed plants with very small diaspores (average
2 mm), despite its very large gape (32.8 mm; Table 4.1). This was a consequence of the
dominance of Ficus spp. in its diet (83%; Table 4.1). ANCOVA showed that the
average size of diaspores consumed varied significantly among the three frugivory
levels. Inspection of the data (Figure 4.1) showed that major and mixed-diet frugivores
consumed larger diaspores than minor frugivores (Figure 4.1; Table 4.2). The average
width (mm) of diaspores that was consumed by a bird species increased with its gape
width (mm) at a ratio of approximately 1:2 (Table 4.2; Figure 4.1). Frugivory level and
gape width together explained 74% of the variation in diaspore size consumption (eta
squared 0.43 and 0.31, respectively).
The consumption of plant species with diaspores that were close to the limit of a
bird species’ handling capacity was also influenced by frugivory level; minor frugivores
consumed a low dietary proportion of plant species with diaspores that were close to the
limit of their handling capacity (Figure 4.2, Table 4.2). The dietary proportion of these
fruits decreased with gape width (Table 4.2, Figure 4.2). Together, these two factors
explained 65% of the variation in consumption of diaspores that were close in size to
bird species’ handling capacity (eta squared 0.39 and 0.26 for frugivory level and gape
width, respectively).
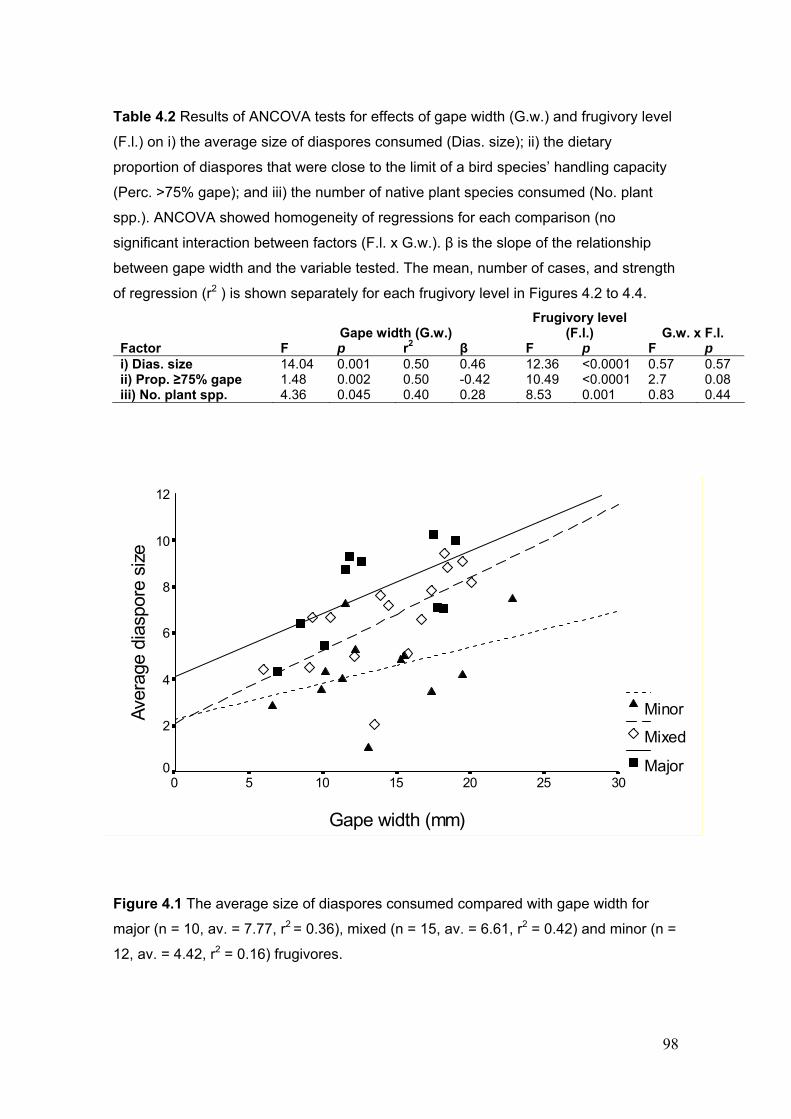
98
Table 4.2 Results of ANCOVA tests for effects of gape width (G.w.) and frugivory level
(F.l.) on i) the average size of diaspores consumed (Dias. size); ii) the dietary
proportion of diaspores that were close to the limit of a bird species’ handling capacity
(Perc. >75% gape); and iii) the number of native plant species consumed (No. plant
spp.). ANCOVA showed homogeneity of regressions for each comparison (no
significant interaction between factors (F.l. x G.w.). β is the slope of the relationship
between gape width and the variable tested. The mean, number of cases, and strength
of regression (r2 ) is shown separately for each frugivory level in Figures 4.2 to 4.4.
Gape width (G.w.) Frugivory level
(F.l.) G.w. x F.l. Factor F p r2 β F p F p i) Dias. size 14.04 0.001 0.50 0.46 12.36 <0.0001 0.57 0.57 ii) Prop. ≥75% gape 1.48 0.002 0.50 -0.42 10.49 <0.0001 2.7 0.08 iii) No. plant spp. 4.36 0.045 0.40 0.28 8.53 0.001 0.83 0.44
Gape width (mm)
302520151050
Ave
rage
dia
spor
e si
ze
12
10
8
6
4
2
0
Minor
Mixed
Major
Figure 4.1 The average size of diaspores consumed compared with gape width for
major (n = 10, av. = 7.77, r2 = 0.36), mixed (n = 15, av. = 6.61, r2 = 0.42) and minor (n =
12, av. = 4.42, r2 = 0.16) frugivores.
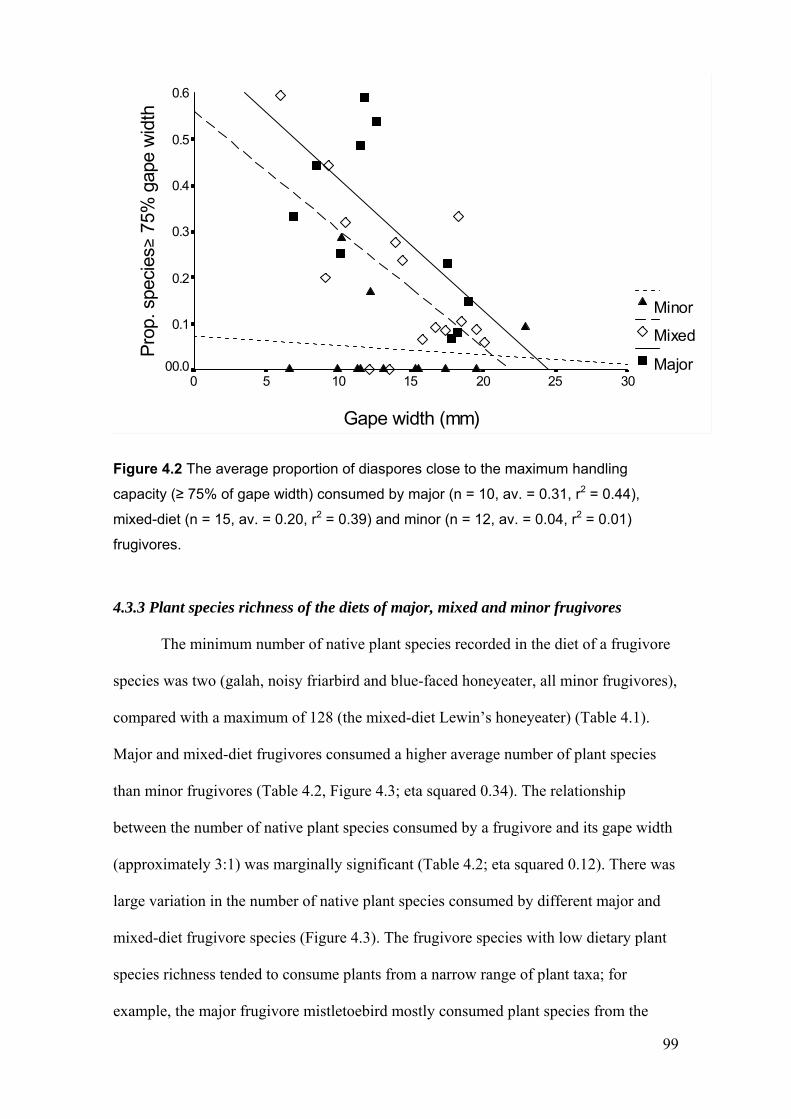
99
Gape width (mm)
302520151050
Pro
p. s
peci
es
75%
gap
e w
idth
0.6
0.5
0.4
0.3
0.2
0.1
00.0
Minor
Mixed
Major
Figure 4.2 The average proportion of diaspores close to the maximum handling
capacity (≥ 75% of gape width) consumed by major (n = 10, av. = 0.31, r2 = 0.44),
mixed-diet (n = 15, av. = 0.20, r2 = 0.39) and minor (n = 12, av. = 0.04, r2 = 0.01)
frugivores.
4.3.3 Plant species richness of the diets of major, mixed and minor frugivores
The minimum number of native plant species recorded in the diet of a frugivore
species was two (galah, noisy friarbird and blue-faced honeyeater, all minor frugivores),
compared with a maximum of 128 (the mixed-diet Lewin’s honeyeater) (Table 4.1).
Major and mixed-diet frugivores consumed a higher average number of plant species
than minor frugivores (Table 4.2, Figure 4.3; eta squared 0.34). The relationship
between the number of native plant species consumed by a frugivore and its gape width
(approximately 3:1) was marginally significant (Table 4.2; eta squared 0.12). There was
large variation in the number of native plant species consumed by different major and
mixed-diet frugivore species (Figure 4.3). The frugivore species with low dietary plant
species richness tended to consume plants from a narrow range of plant taxa; for
example, the major frugivore mistletoebird mostly consumed plant species from the
≥
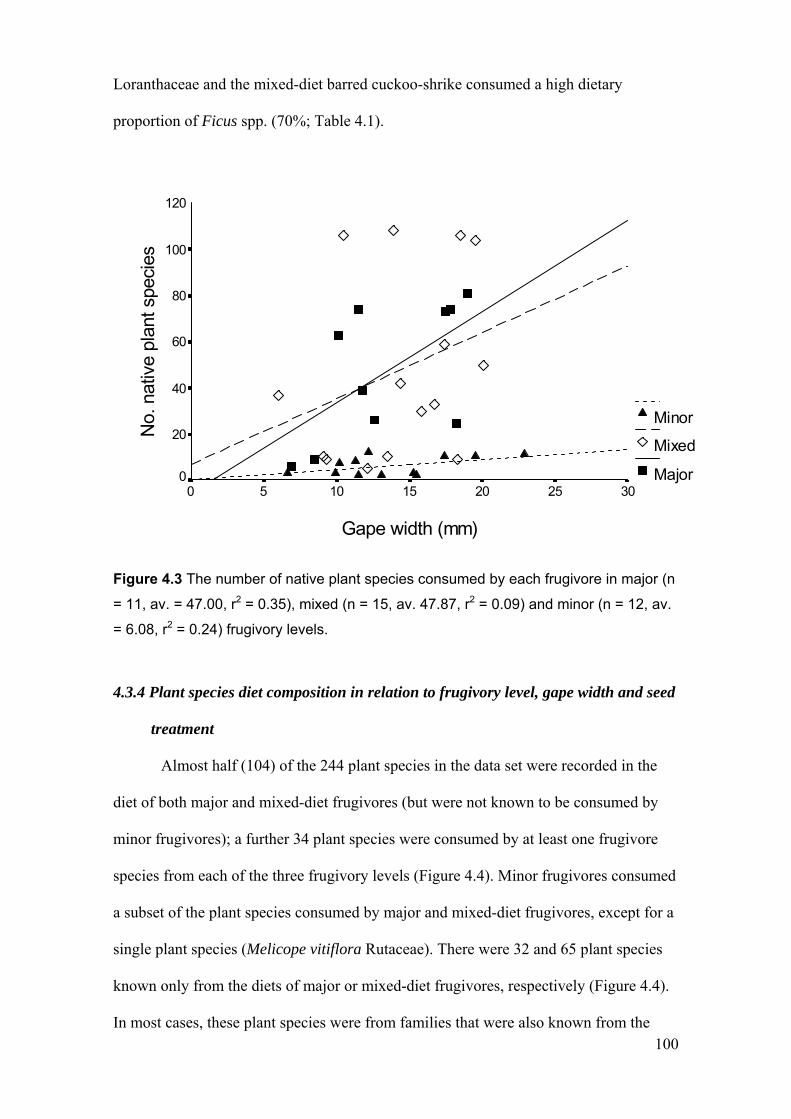
100
Loranthaceae and the mixed-diet barred cuckoo-shrike consumed a high dietary
proportion of Ficus spp. (70%; Table 4.1).
Gape width (mm)
302520151050
No.
nat
ive
plan
t spe
cies
120
100
80
60
40
20
0
Minor
Mixed
Major
Figure 4.3 The number of native plant species consumed by each frugivore in major (n
= 11, av. = 47.00, r2 = 0.35), mixed (n = 15, av. 47.87, r2 = 0.09) and minor (n = 12, av.
= 6.08, r2 = 0.24) frugivory levels.
4.3.4 Plant species diet composition in relation to frugivory level, gape width and seed
treatment
Almost half (104) of the 244 plant species in the data set were recorded in the
diet of both major and mixed-diet frugivores (but were not known to be consumed by
minor frugivores); a further 34 plant species were consumed by at least one frugivore
species from each of the three frugivory levels (Figure 4.4). Minor frugivores consumed
a subset of the plant species consumed by major and mixed-diet frugivores, except for a
single plant species (Melicope vitiflora Rutaceae). There were 32 and 65 plant species
known only from the diets of major or mixed-diet frugivores, respectively (Figure 4.4).
In most cases, these plant species were from families that were also known from the
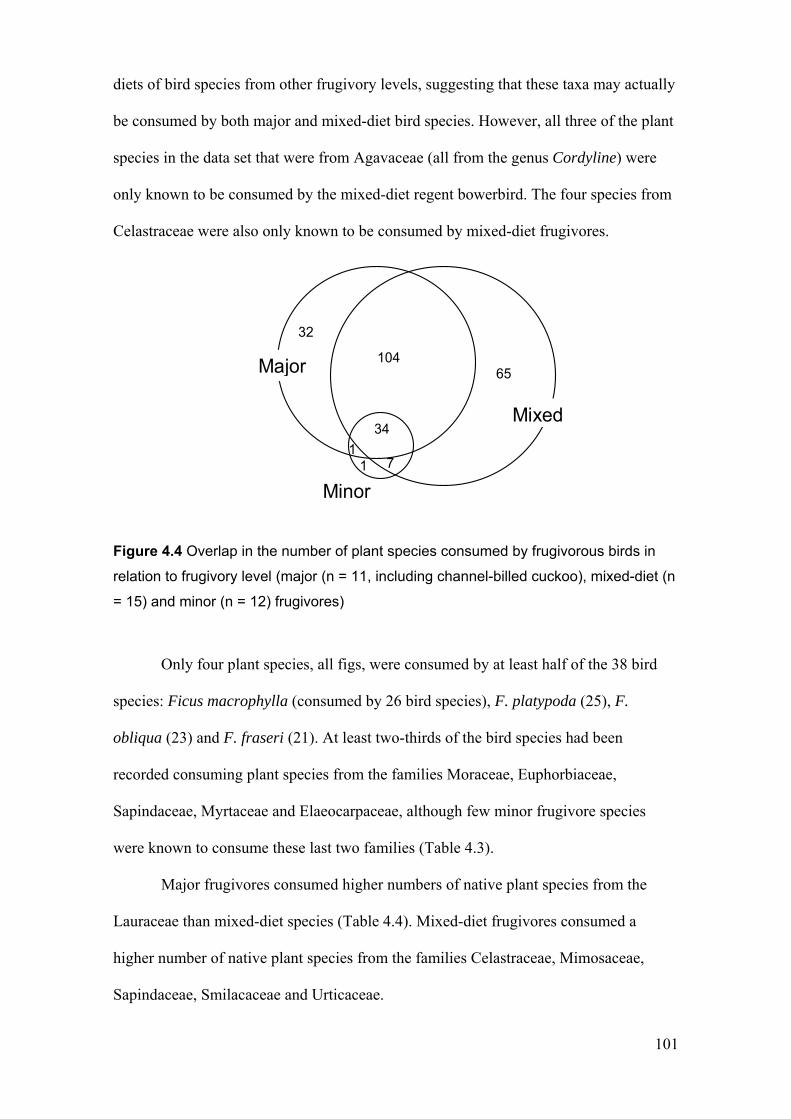
101
diets of bird species from other frugivory levels, suggesting that these taxa may actually
be consumed by both major and mixed-diet bird species. However, all three of the plant
species in the data set that were from Agavaceae (all from the genus Cordyline) were
only known to be consumed by the mixed-diet regent bowerbird. The four species from
Celastraceae were also only known to be consumed by mixed-diet frugivores.
Figure 4.4 Overlap in the number of plant species consumed by frugivorous birds in
relation to frugivory level (major (n = 11, including channel-billed cuckoo), mixed-diet (n
= 15) and minor (n = 12) frugivores)
Only four plant species, all figs, were consumed by at least half of the 38 bird
species: Ficus macrophylla (consumed by 26 bird species), F. platypoda (25), F.
obliqua (23) and F. fraseri (21). At least two-thirds of the bird species had been
recorded consuming plant species from the families Moraceae, Euphorbiaceae,
Sapindaceae, Myrtaceae and Elaeocarpaceae, although few minor frugivore species
were known to consume these last two families (Table 4.3).
Major frugivores consumed higher numbers of native plant species from the
Lauraceae than mixed-diet species (Table 4.4). Mixed-diet frugivores consumed a
higher number of native plant species from the families Celastraceae, Mimosaceae,
Sapindaceae, Smilacaceae and Urticaceae.
Major
Mixed
Minor
32
65104
34
11
7
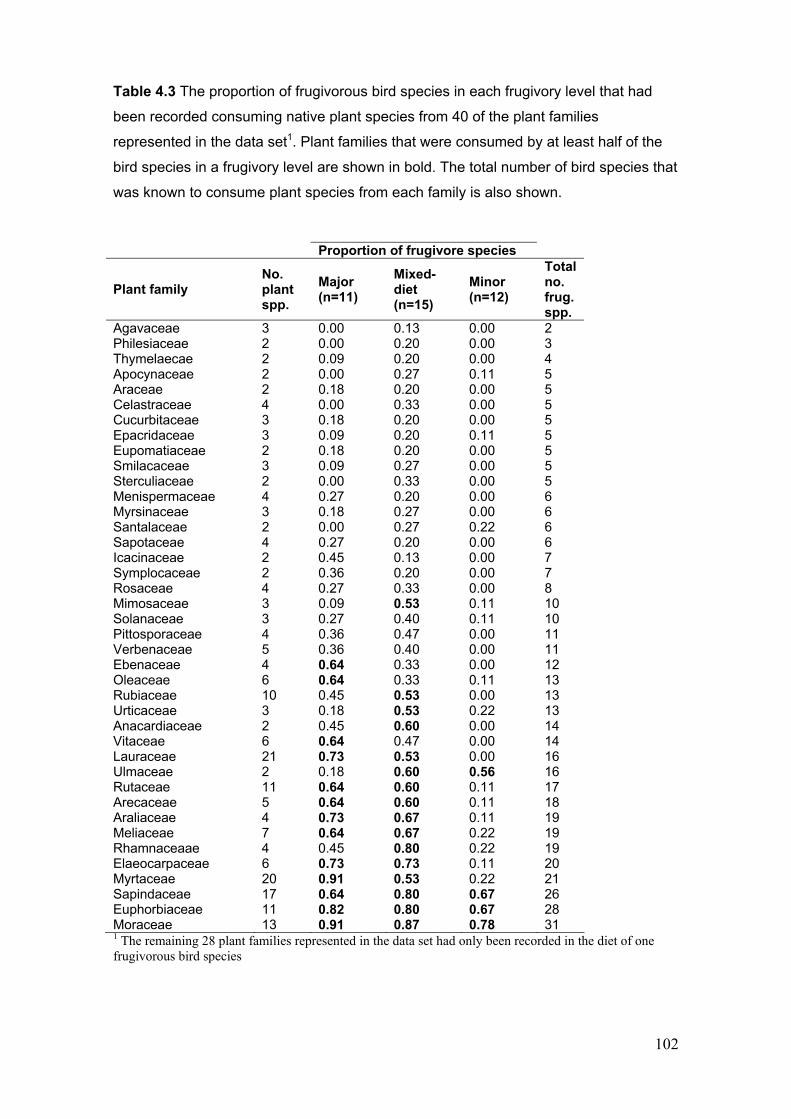
102
Table 4.3 The proportion of frugivorous bird species in each frugivory level that had
been recorded consuming native plant species from 40 of the plant families
represented in the data set1. Plant families that were consumed by at least half of the
bird species in a frugivory level are shown in bold. The total number of bird species that
was known to consume plant species from each family is also shown.
Proportion of frugivore species
Plant family No. plant spp.
Major (n=11)
Mixed-diet (n=15)
Minor (n=12)
Total no. frug.spp.
Agavaceae 3 0.00 0.13 0.00 2 Philesiaceae 2 0.00 0.20 0.00 3 Thymelaecae 2 0.09 0.20 0.00 4 Apocynaceae 2 0.00 0.27 0.11 5 Araceae 2 0.18 0.20 0.00 5 Celastraceae 4 0.00 0.33 0.00 5 Cucurbitaceae 3 0.18 0.20 0.00 5 Epacridaceae 3 0.09 0.20 0.11 5 Eupomatiaceae 2 0.18 0.20 0.00 5 Smilacaceae 3 0.09 0.27 0.00 5 Sterculiaceae 2 0.00 0.33 0.00 5 Menispermaceae 4 0.27 0.20 0.00 6 Myrsinaceae 3 0.18 0.27 0.00 6 Santalaceae 2 0.00 0.27 0.22 6 Sapotaceae 4 0.27 0.20 0.00 6 Icacinaceae 2 0.45 0.13 0.00 7 Symplocaceae 2 0.36 0.20 0.00 7 Rosaceae 4 0.27 0.33 0.00 8 Mimosaceae 3 0.09 0.53 0.11 10 Solanaceae 3 0.27 0.40 0.11 10 Pittosporaceae 4 0.36 0.47 0.00 11 Verbenaceae 5 0.36 0.40 0.00 11 Ebenaceae 4 0.64 0.33 0.00 12 Oleaceae 6 0.64 0.33 0.11 13 Rubiaceae 10 0.45 0.53 0.00 13 Urticaceae 3 0.18 0.53 0.22 13 Anacardiaceae 2 0.45 0.60 0.00 14 Vitaceae 6 0.64 0.47 0.00 14 Lauraceae 21 0.73 0.53 0.00 16 Ulmaceae 2 0.18 0.60 0.56 16 Rutaceae 11 0.64 0.60 0.11 17 Arecaceae 5 0.64 0.60 0.11 18 Araliaceae 4 0.73 0.67 0.11 19 Meliaceae 7 0.64 0.67 0.22 19 Rhamnaceaae 4 0.45 0.80 0.22 19 Elaeocarpaceae 6 0.73 0.73 0.11 20 Myrtaceae 20 0.91 0.53 0.22 21 Sapindaceae 17 0.64 0.80 0.67 26 Euphorbiaceae 11 0.82 0.80 0.67 28 Moraceae 13 0.91 0.87 0.78 31 1 The remaining 28 plant families represented in the data set had only been recorded in the diet of one frugivorous bird species

103
Table 4.4 The average number of native plant species from selected plant families that
were consumed by major and mixed-diet frugivores. Plant families with three or more
plant species in the data set were included. ‘No spp.’ shows the number of native plant
species from each family represented in the data set. ‘p’ shows the results of t-tests
comparing the number of plant species between major and mixed-diet frugivores;
significant (p<0.05) results are shown in bold. Statistical significance was determined
from randomisation for all plant families except Lauraceae, Myrtaceae and
Sapindaceae (see text).
Average no. plant spp. Plant family No.
spp. Major1 n = 8
Mixed1 n = 10
p
Araliaceae 4 1.63 1.60 0.38 Arecaceae 5 1.88 1.60 0.25 Celastraceae 4 0.00 0.60 0.005 Curcurbitaceae 3 0.25 0.40 0.58 Ebenaceae 4 1.25 1.20 0.85 Elaeocarpaceae 6 2.75 3.20 0.40 Epacridaceae 3 0.25 0.30 0.94 Euphorbiaceae 11 2.38 3.20 0.81 Lauraceae 21 9.88 4.80 0.04 Meliaceae 7 1.88 3.20 0.16 Menispermaceae 4 0.38 0.40 0.66 Mimosaceae 3 0.25 1.40 0.03 Moraceae 13 7.13 7.40 0.49 Myrsinaceae 3 0.38 0.40 0.58 Myrtaceae 20 4.13 5.50 0.26 Oleaceae 6 1.75 1.20 0.24 Pittosporaceae 4 0.50 0.80 0.17 Rhamnaceae 4 0.88 1.70 0.08 Rosaceae 4 0.63 0.90 0.57 Rubiaceae 10 1.13 1.70 0.45 Rutaceae 11 2.13 2.10 0.90 Sapindaceae 17 2.13 5.00 0.003 Sapotaceae 4 0.38 0.30 0.65 Smilacaceae 3 0.13 0.40 0.01 Solanaceae 3 0.63 0.70 0.93 Urticaceae 3 0.13 1.10 <0.001 Verbenaceae 5 0.63 0.90 0.47 Vitaceae 6 2.63 2.50 0.83 1 Three major frugivore species (emerald dove, channel-billed cuckoo and mistletoebird) and five mixed-diet frugivore species (Australian brush turkey, wonga pigeon, pale-headed rosella, barred cuckoo-shrike and varied triller) were not included in these analyses because of the low plant species richness of their diets (Table 4.1, Figure 4.4). Minor frugivores were not included in analyses because of the low number of plant species that they consumed from most families.
The UPGMA classification assembled frugivore species into four groups that
broadly corresponded with frugivory level (Figure 4.5). Most major frugivores were
classified together in Group 1, most mixed-diet frugivores were in Group 2 and most
104
minor frugivores were in Group 3 (Figure 4.5). Group 4 comprised species from all
three frugivory levels; the two major frugivore species in Group 4 were small gaped,
and the three mixed-diet species were either small gaped or seed crushers.
Table 4.5 shows the percentage dissimilarity between the different groupings of
bird species in the classification and the plant species that contributed most to these
differences. There was a high level of dissimilarity among all groups: the two groups of
bird species that had the least dissimilar patterns of plant species consumption were
Groups 1 and 2 (Table 4.5). The plant species listed for each set of pair-wise
comparisons were consumed by many of the bird species in one of the groups and
relatively few of the bird species in the other group. In many cases, the same plant
species may have contributed to differences among more than two groups. For example,
Guioa semiglauca (Sapindaceae) was more common in the diets of bird species in
Group 4 than 3 but more common among Group 2 birds than those in Group 4. Bird
species in Groups 3 and 4 generally consumed low numbers of plant species.
Consequently, the plant species that contributed most to the dissimilarity between the
groups were all more frequent in the diets of species in Groups 1 and 2 than 3 or 4
(Table 4.5). In terms of differences in diet composition, bird species in Groups 3 and 4
consumed few of the species consumed by Groups 1 and 2. In contrast, bird species in
Groups 1 and 2 consumed most of the plant species consumed by the other birds.
The plant taxa that distinguished the bird species in Group 1 from Groups 2, 3
and 4 consistently included several from the Lauraceae (Table 4.5). This was consistent
with the results of univariate comparisons of major and mixed-diet bird species (Table
4.4). In addition, consumption of the large fruited Eleaocarpus grandis (22.5 mm
median diameter) and individual species from Burseraceae, Ebenaceae and Vitaceae
distinguished this group of bird species from all other groups (Table 4.5). The bird
species in Group 2 were distinguished from birds in Groups 1, 3 and 4 by their
105
consumption of arillate species from the Elaeocarpaceae, Mimosaceae and Sapindaceae
(Table 4.5); five of the six plant species that distinguished between Groups 2 and 1, and
which were more abundant in the diets of species in Group 2, were arillate species.
Shared consumption of species from Araliaceae and Arecaceae distinguished birds in
Group 1 and 2 from those in Groups 3 and 4. Bird species in Group 3 were
distinguished from Group 4 by their consumption of Ficus spp. Bird species in Group 4
were distinguished by Euphorbiaceae, Solanaceae and certain species in Sapindaceae
and Rhamnaceae.
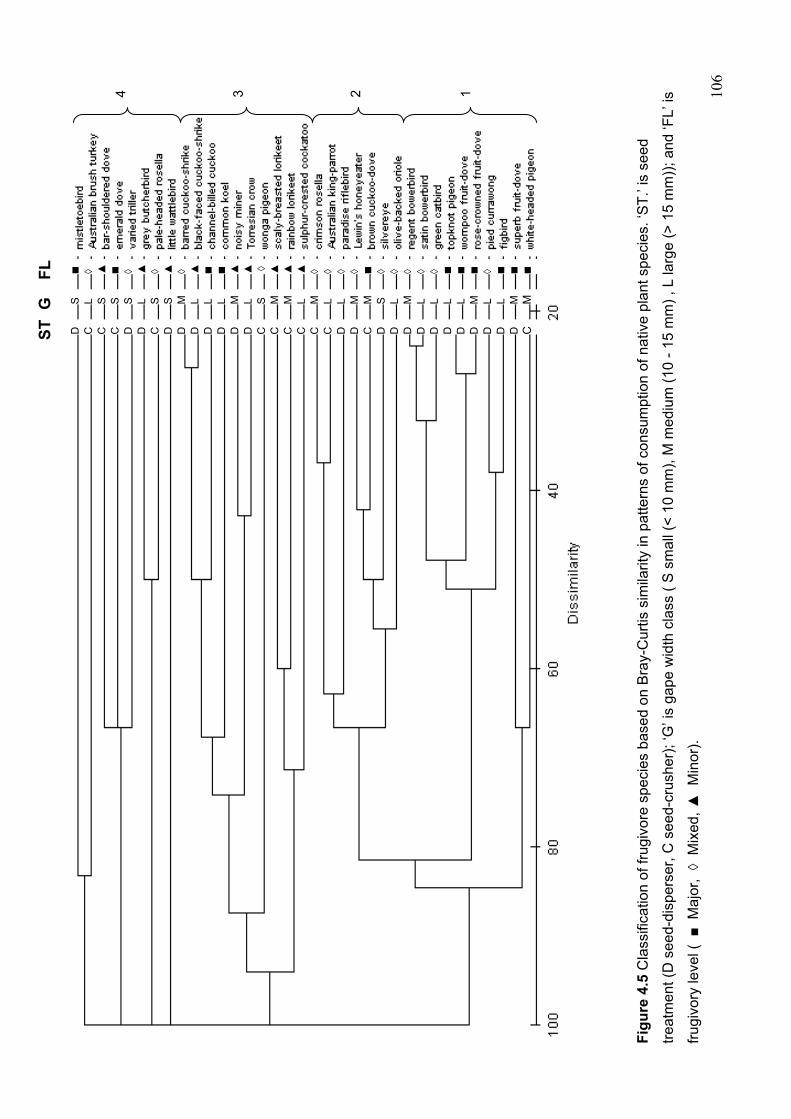
10
6
Fig
ure
4.5
Cla
ssifi
catio
n of
frug
ivor
e sp
ecie
s ba
sed
on B
ray-
Cur
tis s
imila
rity
in p
atte
rns
of c
onsu
mpt
ion
of n
ativ
e pl
ant s
peci
es. ‘
ST
.’ is
see
d
trea
tmen
t (D
see
d-di
sper
ser,
C s
eed-
crus
her)
; ‘G
’ is
gape
wid
th c
lass
( S
sm
all (
< 1
0 m
m),
M m
ediu
m (
10 -
15
mm
) , L
larg
e (>
15
mm
)); a
nd ‘F
L’ is
frug
ivor
y le
vel (
■ M
ajor
, ◊
Mix
ed, ▲
Min
or).
4 3 2 1
S
L S
S
S
L S
S
M
L
L
L M
L S
M
M
L M
L
L M
M
S
L M
L
L
L
L M
L
L M
MGF
L
ST
D
C
C
C
D
D
C
D D
D
D
D
D
D
C
C
C
C
C
C
D D C
D
D
D
D
D
D
D
D
D
D
D
C
■ ◊
▲ ■
◊
▲
◊
▲
◊
▲
■
■
▲
▲ ◊
▲ ▲
▲
◊
◊
◊
◊ ■ ◊
◊
◊
◊
◊ ■
■
■
◊ ■
■ ■
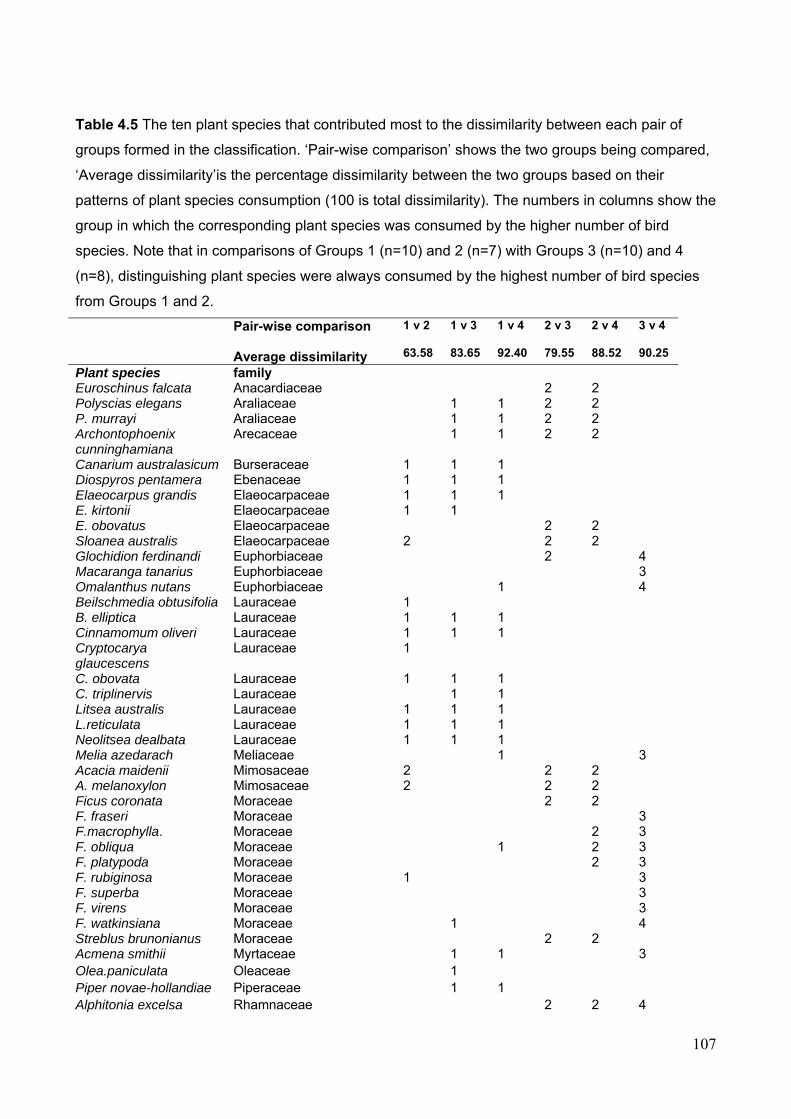
107
Table 4.5 The ten plant species that contributed most to the dissimilarity between each pair of
groups formed in the classification. ‘Pair-wise comparison’ shows the two groups being compared,
‘Average dissimilarity’is the percentage dissimilarity between the two groups based on their
patterns of plant species consumption (100 is total dissimilarity). The numbers in columns show the
group in which the corresponding plant species was consumed by the higher number of bird
species. Note that in comparisons of Groups 1 (n=10) and 2 (n=7) with Groups 3 (n=10) and 4
(n=8), distinguishing plant species were always consumed by the highest number of bird species
from Groups 1 and 2.
Pair-wise comparison Average dissimilarity
1 v 2 63.58
1 v 3 83.65
1 v 4 92.40
2 v 3 79.55
2 v 4 88.52
3 v 4 90.25
Plant species family Euroschinus falcata Anacardiaceae 2 2 Polyscias elegans Araliaceae 1 1 2 2 P. murrayi Araliaceae 1 1 2 2 Archontophoenix cunninghamiana
Arecaceae 1 1 2 2
Canarium australasicum Burseraceae 1 1 1 Diospyros pentamera Ebenaceae 1 1 1 Elaeocarpus grandis Elaeocarpaceae 1 1 1 E. kirtonii Elaeocarpaceae 1 1 E. obovatus Elaeocarpaceae 2 2 Sloanea australis Elaeocarpaceae 2 2 2 Glochidion ferdinandi Euphorbiaceae 2 4 Macaranga tanarius Euphorbiaceae 3 Omalanthus nutans Euphorbiaceae 1 4 Beilschmedia obtusifolia Lauraceae 1 B. elliptica Lauraceae 1 1 1 Cinnamomum oliveri Lauraceae 1 1 1 Cryptocarya glaucescens
Lauraceae 1
C. obovata Lauraceae 1 1 1 C. triplinervis Lauraceae 1 1 Litsea australis Lauraceae 1 1 1 L.reticulata Lauraceae 1 1 1 Neolitsea dealbata Lauraceae 1 1 1 Melia azedarach Meliaceae 1 3 Acacia maidenii Mimosaceae 2 2 2 A. melanoxylon Mimosaceae 2 2 2 Ficus coronata Moraceae 2 2 F. fraseri Moraceae 3 F.macrophylla. Moraceae 2 3 F. obliqua Moraceae 1 2 3 F. platypoda Moraceae 2 3 F. rubiginosa Moraceae 1 3 F. superba Moraceae 3 F. virens Moraceae 3 F. watkinsiana Moraceae 1 4 Streblus brunonianus Moraceae 2 2 Acmena smithii Myrtaceae 1 1 3 Olea.paniculata Oleaceae 1 Piper novae-hollandiae Piperaceae 1 1 Alphitonia excelsa Rhamnaceae 2 2 4
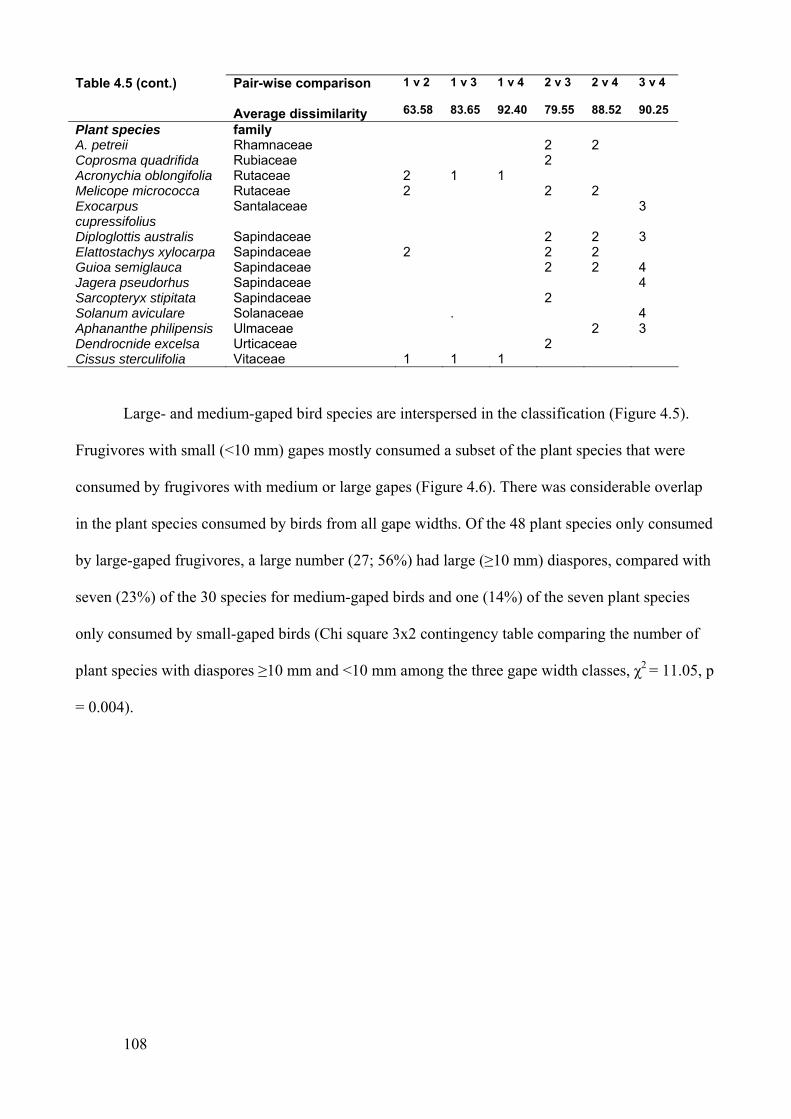
108
Table 4.5 (cont.) Pair-wise comparison Average dissimilarity
1 v 2 63.58
1 v 3 83.65
1 v 4 92.40
2 v 3 79.55
2 v 4 88.52
3 v 4 90.25
Plant species family A. petreii Rhamnaceae 2 2 Coprosma quadrifida Rubiaceae 2 Acronychia oblongifolia Rutaceae 2 1 1 Melicope micrococca Rutaceae 2 2 2 Exocarpus cupressifolius
Santalaceae 3
Diploglottis australis Sapindaceae 2 2 3 Elattostachys xylocarpa Sapindaceae 2 2 2 Guioa semiglauca Sapindaceae 2 2 4 Jagera pseudorhus Sapindaceae 4 Sarcopteryx stipitata Sapindaceae 2 Solanum aviculare Solanaceae . 4 Aphananthe philipensis Ulmaceae 2 3 Dendrocnide excelsa Urticaceae 2 Cissus sterculifolia Vitaceae 1 1 1
Large- and medium-gaped bird species are interspersed in the classification (Figure 4.5).
Frugivores with small (<10 mm) gapes mostly consumed a subset of the plant species that were
consumed by frugivores with medium or large gapes (Figure 4.6). There was considerable overlap
in the plant species consumed by birds from all gape widths. Of the 48 plant species only consumed
by large-gaped frugivores, a large number (27; 56%) had large (≥10 mm) diaspores, compared with
seven (23%) of the 30 species for medium-gaped birds and one (14%) of the seven plant species
only consumed by small-gaped birds (Chi square 3x2 contingency table comparing the number of
plant species with diaspores ≥10 mm and <10 mm among the three gape width classes, χ2 = 11.05, p
= 0.004).
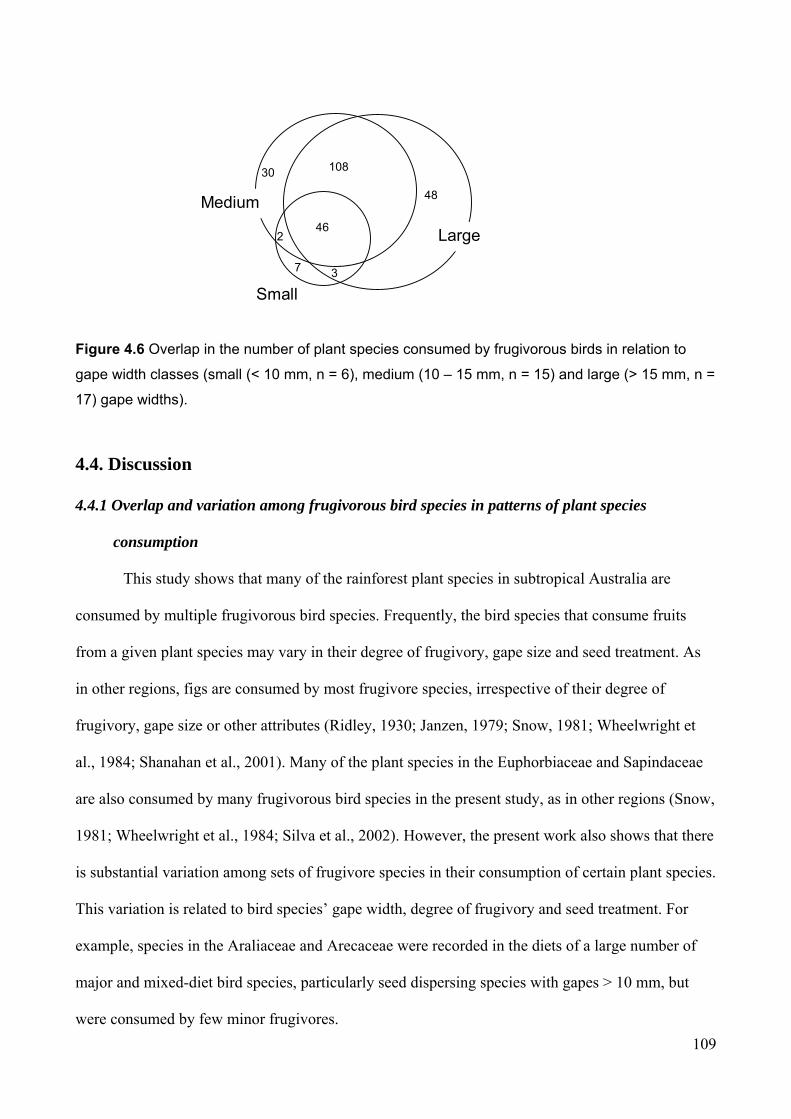
109
Figure 4.6 Overlap in the number of plant species consumed by frugivorous birds in relation to
gape width classes (small (< 10 mm, n = 6), medium (10 – 15 mm, n = 15) and large (> 15 mm, n =
17) gape widths).
4.4. Discussion
4.4.1 Overlap and variation among frugivorous bird species in patterns of plant species
consumption
This study shows that many of the rainforest plant species in subtropical Australia are
consumed by multiple frugivorous bird species. Frequently, the bird species that consume fruits
from a given plant species may vary in their degree of frugivory, gape size and seed treatment. As
in other regions, figs are consumed by most frugivore species, irrespective of their degree of
frugivory, gape size or other attributes (Ridley, 1930; Janzen, 1979; Snow, 1981; Wheelwright et
al., 1984; Shanahan et al., 2001). Many of the plant species in the Euphorbiaceae and Sapindaceae
are also consumed by many frugivorous bird species in the present study, as in other regions (Snow,
1981; Wheelwright et al., 1984; Silva et al., 2002). However, the present work also shows that there
is substantial variation among sets of frugivore species in their consumption of certain plant species.
This variation is related to bird species’ gape width, degree of frugivory and seed treatment. For
example, species in the Araliaceae and Arecaceae were recorded in the diets of a large number of
major and mixed-diet bird species, particularly seed dispersing species with gapes > 10 mm, but
were consumed by few minor frugivores.
7 3
246
108
48
30
Large
Medium
Small
110
The present study documents less overlap among frugivorous bird species in their patterns of
plant species consumption than has previously been implied in functional classifications that have
grouped most bird species together as a functional unit (e.g., van der Pijl, 1982; Gautier-Hion et al.,
1985; Bollen et al., 2004). It is possible that increased data on fruit-frugivore interactions in the
study region would show greater overlap among bird species in their patterns of consumption of
plant species. For example, interactions involving rarer plant and/or bird taxa are likely to be under-
recorded in field observations of frugivory (Silva et al., 2002). However, the data used in the
present work were collected over large geographical and temporal scales. This suggests that the
major differences among frugivore species in their pattern of plant species consumption may be
consistent over space and time.
4.4.2 Frugivore gape width and patterns of fruit size consumption
There was a positive association between a bird species’ gape width and the average size of
fruits that it consumed. The average size of fruits consumed by minor frugivore species was
substantially smaller than their handling capacity. This contrasted with major and mixed-diet
frugivores that consumed relatively high proportions of fruits that were close to their maximum
handling capacity. The patterns of plant consumption shown by most major and mixed-diet
frugivorous bird species are consistent with the gape-limited patterns of fruit size consumption
reported by Wheelwright (1985) for frugivorous birds in Costa Rica. It has been proposed that net
energy yield would be higher for fruits that are close to a species’ fruit size handling capacity
because there may be additional searching and handling costs associated with consuming small
fruits (Martin, 1985; Herrera, 1987; Sallabanks and Courtney, 1993). Furthermore, because larger
seeds may be regurgitated more readily than smaller seeds, and hence eliminated more rapidly than
small seeds can be defecated, net rates of pulp intake may be higher when consuming larger fruits
(Murray et al., 1993).
111
However, larger-gaped birds also consumed small fruits, as has been documented in Costa
Rica (Wheelwright, 1985) and Thailand (Kitamura et al., 2002). Even the exclusively frugivorous
bird species with larger gapes (the Ptilinopus fruit doves and topknot pigeon) consumed some small
fruits (Table 4.1). Consequently, rather than consuming a distinctly different set of plant species,
small-gaped frugivore species consumed the small-fruited subset of the plant species that were
collectively consumed by larger-gaped bird species. With the exception of the largest fruits, which
were only consumed by some of the bird species with gapes wider than 15 mm, there was also
considerable overlap in patterns of plant species consumption between birds with medium and large
gapes. Although there may be energetic or nutritional advantages to consuming larger fruits,
patterns of fruit size consumption may be complicated by variation among plant species in factors
such as their fruit pulp to seed ratios (Howe and van der Kerckhove, 1980; Herrera, 1987) and pulp
chemistry (Martínez del Rio and Restrepo, 1993; Cipollini and Levey, 1997).
4.4.3 Frugivory level and patterns of plant species consumption
McKey (1975) proposed that patterns of plant consumption would vary between highly
frugivorous species and those with mixed diets. Specifically, it was reasoned that highly
frugivorous species would specialise on lipid-rich fruits, while mixed-diet frugivores would
consume fruits from carbohydrate-rich plant species (McKey, 1975; Howe and Estabrook, 1977;
Snow, 1981). In subtropical Australia, there is substantial overlap among major and mixed-diet
frugivores in their patterns of plant species consumption, contrary to the predicted dichotomy.
Major frugivores did consume the highest number of plant species from the family Lauraceae, a
family known for the high lipid content of fruit pulp (Snow, 1971, 1981; Crome, 1975; Stiles 1993).
However, as in other regions (e.g., Howe, 1981; Herrera, 1984; Fuentes, 1994; Sun et al., 1997),
major frugivores were not the only consumers of plant species that may contain high lipid content.
There is little information regarding nutrient, mineral or chemical content of Australian fruits.
However, the plant taxa that characterised the diets of mixed-diet frugivores included families that
112
bear fruits with lipid-rich pulp in other regions, including Celastraceae (Corlett, 1996) and
Sapindaceae (Snow, 1981). These data suggest that lipids may be energetically important for both
major and mixed-diet frugivores in subtropical Australia.
However, neither major nor mixed-diet species specialised on lipid-rich fruits, and both
groups consumed many plant taxa that are associated with high carbohydrate content in other
regions (e.g., Moraceae). This may reflect the need to consume a variety of nutrients and minerals
(Pulliam, 1975; Schaefer et al., 2003), or to avoid consuming toxic amounts of fats (Bairlein, 1998)
or secondary chemicals that may be associated with particular plant taxa (Bairlein, 1996; Cipollini
and Levey, 1997). In addition, lipid-specialisation may not be possible because plants that bear
lipid-rich fruits may not always be fruiting (Leighton and Leighton, 1983; Wheelwright, 1986;
Innis, 1989).
There was a consistent difference between major and mixed-diet frugivores in their
consumption of plant species with arillate fruits. It is difficult to provide a mechanistic explanation
for the disproportionate consumption of arillate species by mixed-diet frugivores. It was reported
that birds of paradise (family Paradisidae) were the sole consumers of certain arillate fruits in Papua
New Guinea, interpreted to be a function of their relatively long and narrow bills (Pratt and Stiles,
1985). However, a more recent study showed that other frugivore groups, including fruit pigeons,
also consumed arillate fruits in Papua New Guinea (Brown and Hopkins, 2002).
In the present study, a set of bird species that were classified as mixed-diet frugivores
showed patterns of plant species consumption that closely resembled several major frugivores
(Group 1 in the classification). The major frugivore bird species in this group included the
Ptilinopus fruit-doves and topknot pigeon, which are among the most highly frugivorous bird
species in the world (Crome, 1975). These species shared a substantial proportion of plant species
with the mixed-diet green catbird, satin and regent bowerbirds (all in the family Ptilonorhynchidae)
and pied currawong. Similar patterns of plant species consumption were shown for fruit-dove and
bowerbird species from these same genera in Papua New Guinea (Pratt and Stiles, 1985; Brown and
113
Hopkins, 2002). Similarity in patterns of plant species consumption between these bird species may
be related to a substantial increase in the degree of frugivory of the bowerbirds, catbird and pied
currawong during the non-breeding season (Blakers et al. 1984; Innis and McEvoy, 1992; Frith et
al., 2004). This seasonal switch to a fruit-dominated diet may necessitate the consumption of plant
taxa with particular nutritional attributes (Bairlein, 1996). Hence, frugivore species that have fruit-
dominated diets during part of the year may show overall patterns of plant consumption similar to
species that have fruit-dominated diets throughout the year.
4.4.4 Variation among bird species within a frugivory level
Although the structure of fruit-frugivore interactions in the assemblage studied is related to
degree of frugivory, there is also substantial variation in patterns of plant consumption within the
major and mixed-diet frugivore groups. Minor frugivore species were similar to one another; they
consumed a low number of native plant species, predominantly Ficus spp., and were mostly
classified together in Group 3. However, there were several major and mixed-diet frugivore species
(in Groups 3 and 4 in the classification) that consumed only a subset of the plant species consumed
by other major and mixed-diet frugivores. Based on data collected in Papua New Guinea, Brown
and Hopkins (2002) suggested that some relatively frugivorous species, including the barred
cuckoo-shrike (“yellow-eyed cuckoo-shrike” in their study), may specialise on figs. It appears that
this is the case for this and certain other major and mixed-diet species that had high dietary
proportions of figs (e.g., in the present study, channel-billed cuckoo, common koel, wonga pigeon).
Overall, seed-crushing species were not distinguished from seed-dispersing species based on
dietary composition, although there were insufficient data to test for an effect of seed treatment
within frugivory levels. For example, it may be reasonable to expect that seed-crushing major
frugivore species show patterns of plant species consumption similar to mixed-diet frugivores, since
they derive nutrition from seed as well as fruit pulp (Snow, 1981; Innis, 1989; Jones and Crome,
1990). In this study, two of the three seed-crushing species that were classed as major frugivores

114
(emerald dove and brown cuckoo-dove) had diets that resembled mixed-diet species more than
major frugivores. The diet of the seed-crushing white-headed pigeon was relatively similar to the
other major frugivore species.
Classification based on functional attributes may overestimate the functional similarity
between certain species at finer scales. For example, in the present study, both the figbird and
wompoo fruit-dove have large gapes and fruit-dominated diets and have relatively similar dietary
composition in the context of the entire avian frugivore assemblage. However, in a pair-wise
comparison of plant species dietary composition, the figbird was only known to consume 44% of
the plant species consumed by the wompoo fruit-dove (see Chapter Five). Consideration of
taxonomic relatedness among species may help elucidate some of the additional variation within the
groups formed using functional attributes. In the present study, close taxonomic relatives with
similar functional traits tended to have the most similar diets (e.g., the wompoo and rose-crowned
fruit-doves and topknot pigeon; bowerbirds and catbird). However, some sets of close relatives with
different functional traits also had similar diets (e.g., black-faced and barred cuckoo-shrike),
whereas others did not (e.g., figbird and olive-backed oriole). Secondary chemical compounds may
generate similar patterns of plant species consumption by taxonomic relatives.
4.4.5 Gape width and frugivory level as indicators of the functional potential of frugivorous birds
as seed dispersers
There is a worldwide concern that large fruited plant species may not be dispersed in
disturbed rainforest (Corlett, 1996, 1998; Corlett and Turner, 1997; Harrington et al,. 1997; Silva
and Tabarelli, 2000; McConkey and Drake, 2002). Studies investigating the potential for a
frugivorous bird species to disperse large-fruited plants have often considered its gape width as an
indication of its functional capacity (e.g., Silva and Tabarelli, 2000; McConkey and Drake, 2002). It
has recently been argued that gape size is an unreliable measure of fruit size handling capacity
(Dennis and Westcott, 2006). However, with the notable exception of the channel-billed cuckoo, the
115
present study has shown a strong association between gape width and patterns of fruit size
consumption among the avian frugivore assemblage of subtropical Australia, provided that gape
distensibility and frugivory level are accounted for. For example, the consumption of large fruits by
Ptilinopus fruit-doves could not be predicted on the basis of hard-tissue bill dimensions (Dennis and
Westcott, 2006). However, their capacity to handle larger fruits is evident if their gape distensibility
is incorporated into the measurement of gape width (as described in Chapter Three, Section 3.2.1).
The present work has also shown the importance of incorporating a measure of frugivory level into
analyses of seed dispersal potential to avoid over-estimating the ability of minor frugivore species
to disperse large seeds. For example, based on the results presented here, it would be predicted that,
despite its wide gape, the black-faced cuckoo-shrike would only consume small fruits because of its
low degree of frugivory. In most studies relating patterns of fruit size selection to frugivore
attributes (e.g., Silva and Tabarelli, 2000), frugivory level has not been explicitly considered.
In Chapter Three, it was proposed that classification of frugivorous bird species based on
their gape width, frugivory level and seed crushing behaviour should yield functionally similar
groups of species. The results of the present chapter show that groups formed using these frugivore
attributes are associated with major differences in dietary composition among bird species in
subtropical Australia. The classification of frugivorous species using readily available functional
attributes provides a framework for predicting substantial differences among frugivore species in
their roles as seed dispersers. In application to conservation, this approach could be used to forecast
and manage the consequences of frugivore declines in fragmented forests for seed dispersal (Silva
and Tabarelli, 2000; Kitamura et al., 2002). Ideally, classification based on the chosen attributes
would not entirely substitute for detailed, species-specific dietary information. However, the
collection of such information is extremely time-consuming. Furthermore, scientists are required to
inform management decisions in the absence of this information. The approach demonstrated here
provides a systematic means of identifying the plant and frugivore species that may be a priority for
conservation and for research into patterns of plant-frugivore interactions.
116
Chapter Five
Reduced dispersal potential of native rainforest plant species in fragmented
rainforest
5.1 Introduction
Seed dispersal enhances the reproductive success of plants by removing seeds from
competition, predation and other causes of seed and seedling mortality that are most intense directly
beneath the parent (Janzen, 1970; Connell, 1971; Harms et al., 2000). Seed dispersal is also the
agent of plant mobility, enabling colonisation of suitable germination microsites that become
available following local disturbances within forest (Grubb, 1977; Hubbell, 1979). Frugivorous
vertebrates disperse the seeds of most rainforest plants (Howe and Smallwood, 1982: Willson et al.,
1989). Therefore, declines in the abundance of frugivores following rainforest clearing and
fragmentation may alter the rates or patterns of seed dispersal and plant regeneration (Corlett, 1998,
2002; Bleher and Böhning-Gaese, 2001, 2006; Cordeiro and Howe, 2001, 2003). For example, the
complete absence of dispersers for a particular plant species would mean that recruitment could
only occur beneath the crown of the parent plant, and may result in reduced recruitment (Bleher and
Böhning-Gaese, 2001; Cordeiro and Howe, 2003; Babweteera et al., 2007). Dispersal failure in
fragmented forests would prevent the plant species from recolonising forest remnants from which it
had gone extinct, and would mean it was unable to colonise cleared land during secondary
succession (Poschlod et al., 1996; Duncan and Chapman, 2002). Consequently, plant species that
experience dispersal failure would have low recruitment rates and restricted spatial distribution and
be vulnerable to stochastic extinction (Fahrig and Merriam, 1994; Cochrane et al., 1999).
In the situation where dispersers are present but their abundance is greatly reduced, dispersal
may not fail but would potentially be reduced. The consequences of substantially reduced dispersal
117
of a plant species for plant regeneration may resemble those described for dispersal failure,
although the extent to which recruitment would be spatially and quantitatively limited would
depend on the feeding rates and patterns of intra- and inter-habitat movements by remaining
dispersers (Loiselle and Blake, 2002; Schupp et al., 2002; Dennis and Westcott, 2006).
The decline of certain frugivore species in fragmented landscapes may result in dispersal
failure or reduction for plant species, but this depends on the dietary composition of other frugivore
species in the regional frugivore assemblage. For example, it has been predicted that large-seeded
plant species are unlikely to be dispersed in fragmented tropical rainforest regions worldwide as a
result of the decline of the entire suite of frugivore species that are capable of dispersing large seeds
(Chapman and Chapman, 1995; Corlett, 1998, 2002; Silva and Tabarelli, 2000; Kitamura et al.,
2002; McConkey and Drake, 2002). On the other hand, most fleshy-fruited plant species are eaten
and dispersed by multiple frugivore species (Howe, 1977; Howe and Smallwood, 1982;
Wheelwright and Orians, 1982; Brown and Hopkins, 2002), and many frugivore species do occur in
fragmented landscapes (Estrada et al., 1993; Corlett, 1998; Renjifo, 1999; Chapters Two and Six of
this thesis). Therefore, the consequences of the decline of one frugivore species for plant dispersal
may be offset by increases in the density or consumption rates of other, functionally similar
frugivore species (Corlett, 1998; Renjifo, 1999; Nathan and Muller-Landau, 2000; Loiselle and
Blake, 2002).
The potential for functional substitution among frugivore species can be examined by
identifying the attributes of frugivores that reflect their role as seed dispersers (Silva and Tabarelli,
2000; Dennis and Westcott, 2006). For example, in Chapter Three, I showed that, while the bird
species that declined in fragmented parts of subtropical Australia had large gapes and fruit-
dominated diets, these attributes were shared by some of the frugivorous bird species that persisted
or increased in abundance in fragmented parts of the landscape. I proposed that the plant species
dispersed by decreaser species may not necessarily experience dispersal failure, although dispersal
may be reduced, depending on whether the abundance and behaviour of substitute disperser species
118
fully compensated for the declines. The use of functional attributes of frugivores may be a useful
means of identifying broad sets of plant taxa that they consume (Chapter Four), and hence the
plants that may be vulnerable to frugivore declines (e.g., Silva and Tabarelli, 2000; Kitamura et al.,
2002; Chapter Three of this thesis). However, it may be necessary to compare actual dietary
composition across the frugivore assemblage to determine the specific plant taxa that would be
affected by changes in the abundance of individual frugivore species (Galetti, 2001). Among the
studies that have considered the specific plant species consumed by individual frugivore species,
most attention has been paid to large frugivore species and large-fruited plant species (e.g.,
Kitamura et al., 2002; McConkey and Drake, 2002; Babweteera et al., 2007).
The present study considers patterns of plant species consumption across an entire regional
avian frugivore assemblage to assess the likelihood that the effects of fragmentation-related
decreases in some bird species could be offset by the presence of other frugivore species with
similar dietary composition. This study does not explicitly evaluate the potential for the changed
abundance of certain frugivore species to result in other changes to seed dispersal, such as the
dispersal of fewer seeds, or seed input to fewer or different microsites (Schupp, 1993; Jordano and
Schupp, 2000; Loiselle and Blake, 2002). Frugivore species were previously identified as showing
decreased, increased or similar abundance in fragmented compared with intact forest in a rainforest
landscape of subtropical Australia (Chapter Two). Here, records of the consumption of plant species
by frugivore species are used to assess dietary similarity among frugivore species and among the
groups of species that showed different abundance responses to fragmentation. Diet composition is
assessed in terms of plant species, genus, family, and fruit size. This approach identifies plant taxa
that are vulnerable to reduced dispersal, for example because they are known only from the diets of
frugivores with decreased abundance in fragmented landscapes. This chapter will also examine
potential changes in the dispersal of introduced plant species. The potential implications for the
maintenance of plant regenerative potential in fragmented rainforest are considered.
119
5.2 Methods
5.2.1 Changes in the frugivorous bird assemblage in fragmented subtropical rainforest
The distribution and clearing history of subtropical rainforest in Australia were described in
Chapter One (Section 1.4.1). Chapter Two described the study region and site network used in the
present work (Section 2.2.1), and field and analytical methods (Section 2.2.2).
The responses of avian frugivores to rainforest fragmentation in a region of subtropical
Australia were assessed in Chapter Two (Section 2.3.1). Three response patterns were identified
among 26 frugivorous bird species by comparing species’ abundances between rainforest remnants
and areas of regrowth relative to extensive forest. These three patterns were “decreaser” species
(n=5), which had lower abundance in remnants and / or regrowth than in extensive forest;
“increaser” species (n=7), which had higher abundance in remnants and / or regrowth than
extensive forest; and “tolerant” species (n=14), which showed no clear difference in abundance in
either remnant or regrowth habitats, compared with extensive forest. Other frugivorous bird species
(n=16) in the region were too uncommon for statistical analyses, and may therefore be likely to
make a relatively small contribution to seed dispersal because of their low abundance. Nine of the
26 bird species grind or crush seeds (Chapter Three, Section 3.2.1) and are not considered further in
the present chapter as they probably contribute relatively little to the dispersal of viable seed. The
non-seed-crushing scarlet honeyeater Myzomela sanguinolenta was also excluded, due to the low
number of observations of fruit consumption recorded to the level of plant species. Therefore, 16
frugivorous bird species (four decreaser, five increaser, and seven tolerant species) are considered
here.
5.2.2 Fruit consumption database
Data on the consumption of plant species by the 16 frugivore species were derived from 100
published sources (Appendix 1), together with several unpublished data sets. The data used in the
present study of 16 bird species in relation to their fragmentation-related abundance responses

120
comprised a subset of the database described in Chapter Four (Section 4.2.1); this chapter deals
with 16 of the 38 frugivorous bird species that were considered in Chapter Four. The plant species
included in analyses are listed in Appendix 2.
5.2.3 Data analyses
Spearman rank correlations were used to test for an association between the frugivore
species’ sensitivity to fragmentation (scored as increaser (low sensitivity) = 1, tolerant = 2,
decreaser (high sensitivity) = 3) and the total number of native plant species, genera and families
that they consumed. Spearman rank correlation was also used to test the association between
sensitivity to fragmentation and the number of native plant species consumed from the plant
families with at least five species in the data set. The dietary proportions of exotic plant species and
of native plant species with large (≥10 mm diameter) diaspores were compared among decreaser,
tolerant and increaser frugivores, using Spearman’s rank correlations and with analysis of variance
(ANOVA), using frugivore species as replicates within each fragmentation response group. Pair-
wise differences were tested using least significant difference (LSD) comparisons.
To examine similarities among the 16 frugivore species in their dietary composition, a
classification tree was generated using the UPGMA algorithm (Manly, 1994) in PRIMER (5.2.9)
(Clarke and Warwick, 2001), with the Bray-Curtis dissimilarity metric. The statistical significance
of overall dietary differences between frugivore response groups was tested using analysis of
similarity, with 9 999 iterations (ANOSIM; Clarke and Green, 1988), also in PRIMER. Plant
species with less than three consumer species, and frugivore species that consumed less than three
native plant species were excluded. For analyses based on patterns of consumption of plant species,
the Bray-Curtis dissimilarity was based on the presence of native plant species in the diet of
frugivore species. For analyses at higher taxonomic levels, counts of the number of native species
consumed from each plant genus or family were used. Genera or families with only one plant
species in the data set were excluded.
121
Potential redundancy between pairs of frugivore species was quantified as the percentage of
plant species in the diet of each decreaser frugivore that was also consumed by the other frugivore
species. The redundancy between individual decreaser species and particular combinations of other
species was also similarly quantified. The magnitude of potential dispersal reduction that would
result from the absence of each individual frugivore species was assessed by calculating the number
of plant species recorded solely in the diet of each frugivore species, as well as the number of plant
species known only from the collective diet of groups of certain frugivore species (for example, all
decreaser frugivores). The attributes of the plant species that were recorded only in the diet of
decreaser frugivores were identified (higher taxonomic association, growth form and diaspore size)
and compared with those of the remaining plant species in the data set. This comparison was made
using chi-squared tests on cross-tabulations of species’ frequencies within attribute classes in SPSS
(2001).
5.3 Results
The data matrix comprised information for 254 plant species from 164 genera and 67
families, including 31 plant species introduced to subtropical eastern Australia from other
continents, and three introduced from tropical Australia (collectively referred to as “exotic species”)
(Appendix 2). The data on plant species' presence in the diet of the 16 frugivore species yielded
records of 912 different combinations of plant and frugivore species. Most of the 220 native plants
(70%) were recorded in the diet of more than one frugivore species.
5.3.1 Diet comparisons between frugivore response groups
There was considerable variation among frugivore species in the numbers of plant taxa they
consumed, with numbers of native plant species ranging from one to 106 (Table 5.1). All decreaser
frugivores, together with several tolerant or increaser species, consumed relatively high numbers of
plant species, genera and families (Table 5.1). There was no statistically significant correlation
122
between sensitivity to fragmentation and the number of native plant species (Rs = 0.45, p = 0.08, n
= 16), genera (Rs = 0.36, p = 0.17) or families (Rs = 0.37, p = 0.16) consumed, although all
associations were positive. Exotic plants comprised a larger average percentage of the diet of
increasers (41%) than of tolerant (25%) or decreaser (9%) frugivores (Table 5.1) (Rs = 0.70, p =
0.002; ANOVA F = 4.24, p = 0.04).
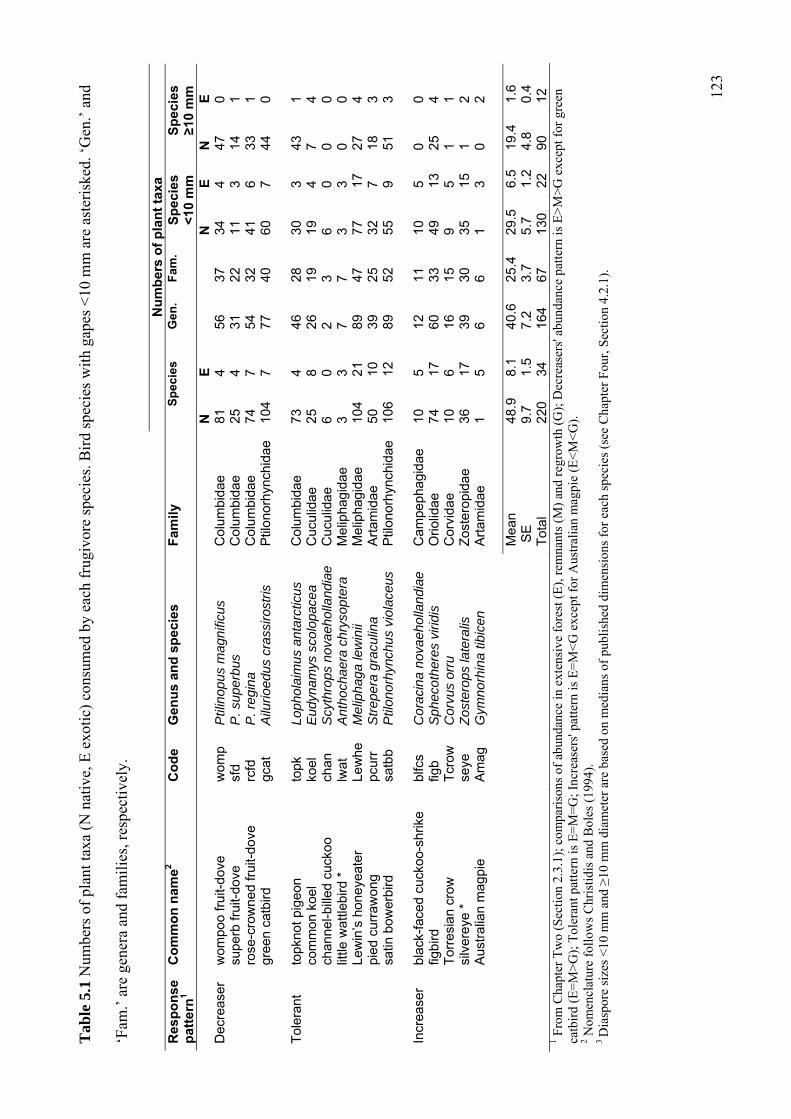
12
3
Tab
le 5
.1 N
umbe
rs o
f pl
ant t
axa
(N n
ativ
e, E
exo
tic)
con
sum
ed b
y ea
ch f
rugi
vore
spe
cies
. Bir
d sp
ecie
s w
ith
gape
s <
10 m
m a
re a
ster
iske
d. ‘
Gen
.’ a
nd
‘Fam
.’ a
re g
ener
a an
d fa
mil
ies,
res
pect
ivel
y.
N
um
ber
s o
f p
lan
t ta
xa
Res
po
nse
p
atte
rn1
Co
mm
on
nam
e2 C
od
e G
enu
s an
d s
pec
ies
Fam
ily
Sp
ecie
s G
en.
Fam
. S
pec
ies
<10
mm
S
pec
ies
≥1
0 m
m
N
E
N
E
N
E
D
ecre
aser
wom
poo
frui
t-do
ve
supe
rb fr
uit-
dove
ro
se-c
row
ned
frui
t-do
ve
gree
n ca
tbird
wom
p sf
d rc
fd
gcat
Ptil
inop
us m
agni
ficus
P
. sup
erbu
s P
. reg
ina
Ailu
rioe
dus
cras
siro
stris
Col
umbi
dae
Col
umbi
dae
Col
umbi
dae
Ptil
onor
hync
hida
e
81
25
74
104
4 4 7 7
56
31
54
77
37
22
32
40
34
11
41
60
4 3 6 7
47
14
33
44
0 1 1 0 T
oler
ant
topk
not p
igeo
n co
mm
on k
oel
chan
nel-b
illed
cuc
koo
little
wat
tlebi
rd *
Le
win
’s h
oney
eate
r pi
ed c
urra
won
g sa
tin b
ower
bird
topk
ko
el
chan
lw
at
Lew
he
pcur
r sa
tbb
Loph
olai
mus
ant
arct
icus
E
udyn
amys
sco
lopa
cea
Scy
thro
ps n
ovae
holla
ndia
e A
ntho
chae
ra c
hrys
opte
ra
Mel
ipha
ga le
win
ii S
trep
era
grac
ulin
a P
tilon
orhy
nchu
s vi
olac
eus
Col
umbi
dae
Cuc
ulid
ae
Cuc
ulid
ae
Mel
ipha
gida
e M
elip
hagi
dae
Art
amid
ae
Ptil
onor
hync
hida
e
73
25
6 3 104
50
106
4 8 0 3 21
10
12
46
26
2 7 89
39
89
28
19
3 7 47
25
52
30
19
6 3 77
32
55
3 4 0 3 17
7 9
43
7 0 0 27
18
51
1 4 0 0 4 3 3 In
crea
ser
blac
k-fa
ced
cuck
oo-s
hrik
e fig
bird
T
orre
sian
cro
w
silv
erey
e *
Aus
tral
ian
mag
pie
blfc
s fig
b T
crow
se
ye
Am
ag
Cor
acin
a no
vaeh
olla
ndia
e S
phec
othe
res
virid
is
Cor
vus
orru
Z
oste
rops
late
ralis
G
ymno
rhin
a tib
icen
Cam
peph
agid
ae
Orio
lidae
C
orvi
dae
Zos
tero
pida
e A
rtam
idae
10
74
10
36
1
5 17
6 17
5
12
60
16
39
6
11
33
15
30
6
10
49
9 35
1
5 13
5 15
3
0 25
1 1 0
0 4 1 2 2
M
ean
SE
48
.9
9.7
8.1
1.5
40.6
7.
2 25
.4
3.7
29.5
5.
7 6.
5 1.
2 19
.4
4.8
1.6
0.4
Tot
al
220
34
164
67
130
22
90
12
1 Fro
m C
hapt
er T
wo
(Sec
tion
2.3.
1); c
ompa
riso
ns o
f ab
unda
nce
in e
xten
sive
for
est (
E),
rem
nant
s (M
) an
d re
grow
th (
G);
Dec
reas
ers'
abu
ndan
ce p
atte
rn is
E>
M>
G e
xcep
t for
gre
en
catb
ird
(E=
M>
G);
Tol
eran
t pat
tern
is E
=M
=G
; Inc
reas
ers'
patt
ern
is E
=M
<G
exc
ept f
or A
ustr
alia
n m
agpi
e (E
<M
<G
).
2 Nom
encl
atur
e fo
llow
s C
hris
tidis
and
Bol
es (
1994
).
3 D
iasp
ore
size
s <
10 m
m a
nd ≥
10 m
m d
iam
eter
are
bas
ed o
n m
edia
ns o
f pu
blis
hed
dim
ensi
ons
for
each
spe
cies
(se
e C
hapt
er F
our,
Sec
tion
4.2
.1).

124
The average dietary proportion of native plant species with large diaspores (≥10 mm
diameter) was significantly greater for decreasers (0.49) and tolerant frugivores (0.31) than
increasers (0.09), (Rs = 0.72, p =0.004; ANOVA F = 6.09, p = 0.02, Figure 5.1). There was
substantial variation among individual species within the tolerant response group; only two species
(topknot pigeon and satin bowerbird) consumed dietary proportions of native plants with large
diaspores within the range shown by decreaser frugivores (Figure 5.1).
ANOSIM showed that the overall native plant species composition of the diets of decreaser
frugivores was not significantly different from that of either tolerant or increaser frugivores (global
R = 0.137, p = 0.12). This was consistent both at the level of plant genus (R = 0.115, p = 0.15) and
family (R = 0.093, p = 0.18). Most decreaser frugivore species consumed a broadly similar suite of
plant species to one another (Figure 5.2), and were also similar to two tolerant frugivores: topknot
pigeon (which resembled wompoo and rose-crowned fruit-doves), and satin bowerbird (similar to
green catbird). The increaser figbird, tolerant Lewin’s honeyeater and tolerant pied currawong had
the next most similar dietary composition to the group containing most of the decreaser species
(Figure 5.2). These patterns were similar when classification was conducted on both plant genus
and family data. The superb fruit-dove’s diet did not closely resemble that of the other decreaser
species, probably due to the low abundance of this mostly tropical bird species in subtropical
Australia (Innis, 1989; Date et al., 1996; Gosper and Holmes, 2002), and consequently the low
number of subtropical plant species known in its diet (Table 5.1).
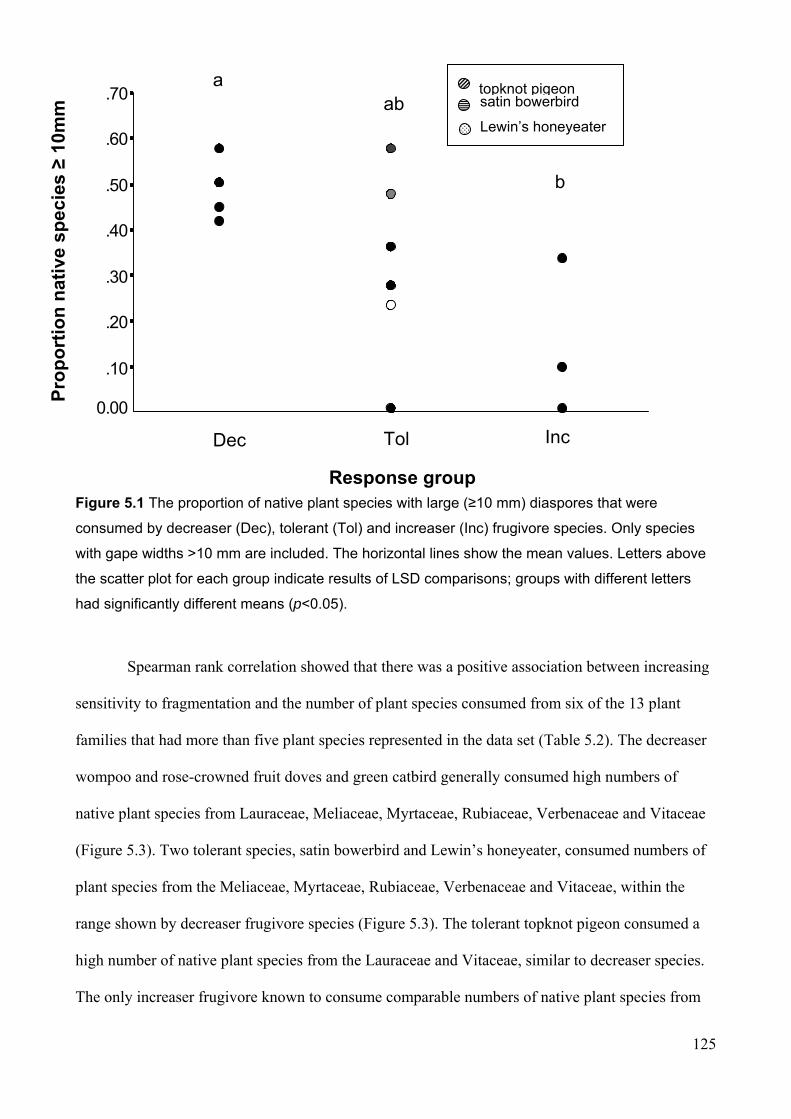
125
. 7 0
. 6 0
. 5 0
. 4 0
. 3 0
. 2 0
. 1 0
0 . 0 0
Figure 5.1 The proportion of native plant species with large (≥10 mm) diaspores that were
consumed by decreaser (Dec), tolerant (Tol) and increaser (Inc) frugivore species. Only species
with gape widths >10 mm are included. The horizontal lines show the mean values. Letters above
the scatter plot for each group indicate results of LSD comparisons; groups with different letters
had significantly different means (p<0.05).
Spearman rank correlation showed that there was a positive association between increasing
sensitivity to fragmentation and the number of plant species consumed from six of the 13 plant
families that had more than five plant species represented in the data set (Table 5.2). The decreaser
wompoo and rose-crowned fruit doves and green catbird generally consumed high numbers of
native plant species from Lauraceae, Meliaceae, Myrtaceae, Rubiaceae, Verbenaceae and Vitaceae
(Figure 5.3). Two tolerant species, satin bowerbird and Lewin’s honeyeater, consumed numbers of
plant species from the Meliaceae, Myrtaceae, Rubiaceae, Verbenaceae and Vitaceae, within the
range shown by decreaser frugivore species (Figure 5.3). The tolerant topknot pigeon consumed a
high number of native plant species from the Lauraceae and Vitaceae, similar to decreaser species.
The only increaser frugivore known to consume comparable numbers of native plant species from
Dec Tol
topknot pigeon satin bowerbird
Lewin’s honeyeater
Inc
Response group
Pro
po
rtio
n n
ativ
e sp
ecie
s ≥
10m
m
a ab
b
126
these families was the figbird, which consumed relatively high numbers of species from Lauraceae
and Meliaceae (Figure 5.3).

12
7
silv
ere
ye
ch
an
ne
l-b
ille
d c
uck
oo
bla
ck-f
ace
d c
uck
oo
-sh
rike
To
rre
sia
n c
row
com
mo
n k
oe
l
su
pe
rb f
ruit-
do
ve
gre
en
ca
tbir
d
sa
tin b
ow
erb
ird
ro
se-c
row
ne
d f
ruit-
do
ve
to
pk
no
t p
ige
on
wo
mp
oo
fru
it-d
ove
pie
d c
urr
aw
on
g
fig
bir
d
Le
win
's h
on
eye
ate
r
10
08
06
04
02
00
De
cre
ase
r
To
lera
nt
Incr
ea
ser
Fig
ure
5.2
Cla
ssifi
catio
n of
frug
ivor
e sp
ecie
s (b
ased
on
Bra
y-C
urtis
dis
sim
ilarit
y m
atrix
and
UP
GM
A s
ortin
g) a
ccor
ding
to
pres
ence
/ a
bsen
ce o
f
nativ
e pl
ant s
peci
es in
the
diet
. Sym
bol
s ne
xt to
nam
es s
how
the
resp
onse
gro
up fo
r ea
ch fr
ugiv
ore
spec
ies
(see
text
). T
he li
ttle
wat
tlebi
rd a
nd
Aus
tral
ian
mag
pie
wer
e no
t in
clud
ed b
ecau
se t
hey
cons
umed
onl
y th
ree
and
one
nativ
e sp
ecie
s, r
espe
ctiv
ely.
Dis
sim
ilarit
y
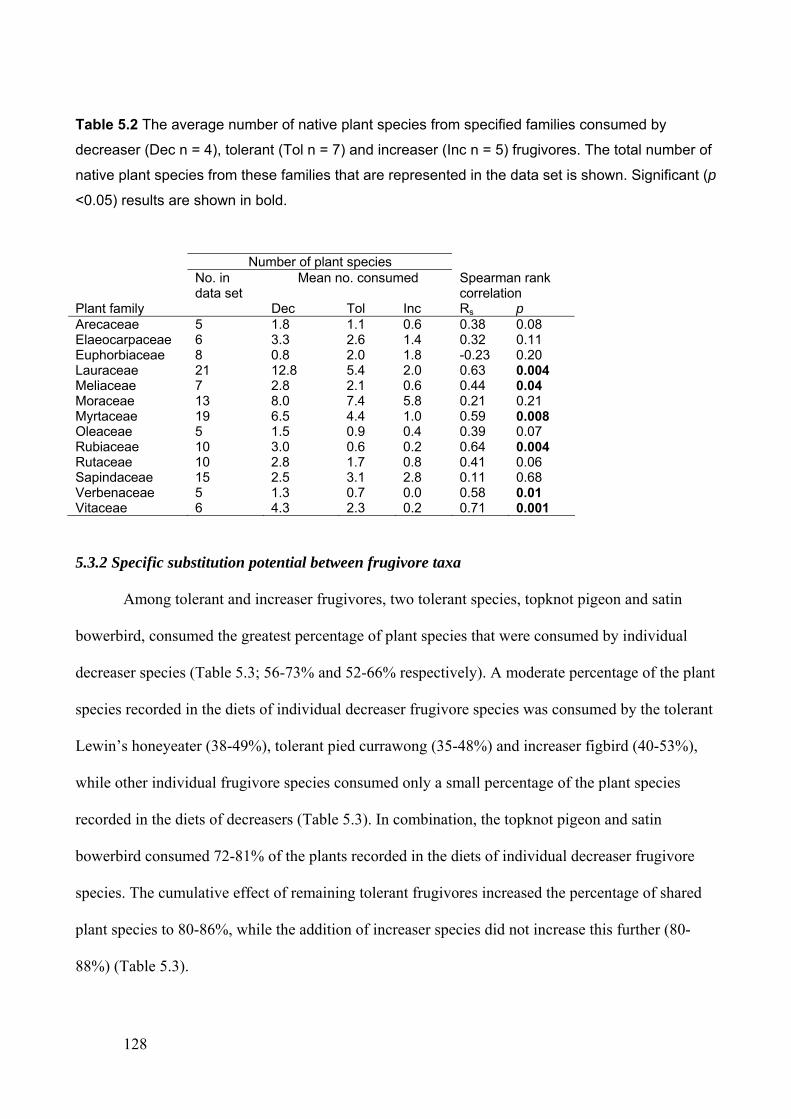
128
Table 5.2 The average number of native plant species from specified families consumed by
decreaser (Dec n = 4), tolerant (Tol n = 7) and increaser (Inc n = 5) frugivores. The total number of
native plant species from these families that are represented in the data set is shown. Significant (p
<0.05) results are shown in bold.
Number of plant species No. in
data set Mean no. consumed Spearman rank
correlation Plant family Dec Tol Inc Rs p Arecaceae 5 1.8 1.1 0.6 0.38 0.08 Elaeocarpaceae 6 3.3 2.6 1.4 0.32 0.11 Euphorbiaceae 8 0.8 2.0 1.8 -0.23 0.20 Lauraceae 21 12.8 5.4 2.0 0.63 0.004 Meliaceae 7 2.8 2.1 0.6 0.44 0.04 Moraceae 13 8.0 7.4 5.8 0.21 0.21 Myrtaceae 19 6.5 4.4 1.0 0.59 0.008 Oleaceae 5 1.5 0.9 0.4 0.39 0.07 Rubiaceae 10 3.0 0.6 0.2 0.64 0.004 Rutaceae 10 2.8 1.7 0.8 0.41 0.06 Sapindaceae 15 2.5 3.1 2.8 0.11 0.68 Verbenaceae 5 1.3 0.7 0.0 0.58 0.01 Vitaceae 6 4.3 2.3 0.2 0.71 0.001
5.3.2 Specific substitution potential between frugivore taxa
Among tolerant and increaser frugivores, two tolerant species, topknot pigeon and satin
bowerbird, consumed the greatest percentage of plant species that were consumed by individual
decreaser species (Table 5.3; 56-73% and 52-66% respectively). A moderate percentage of the plant
species recorded in the diets of individual decreaser frugivore species was consumed by the tolerant
Lewin’s honeyeater (38-49%), tolerant pied currawong (35-48%) and increaser figbird (40-53%),
while other individual frugivore species consumed only a small percentage of the plant species
recorded in the diets of decreasers (Table 5.3). In combination, the topknot pigeon and satin
bowerbird consumed 72-81% of the plants recorded in the diets of individual decreaser frugivore
species. The cumulative effect of remaining tolerant frugivores increased the percentage of shared
plant species to 80-86%, while the addition of increaser species did not increase this further (80-
88%) (Table 5.3).

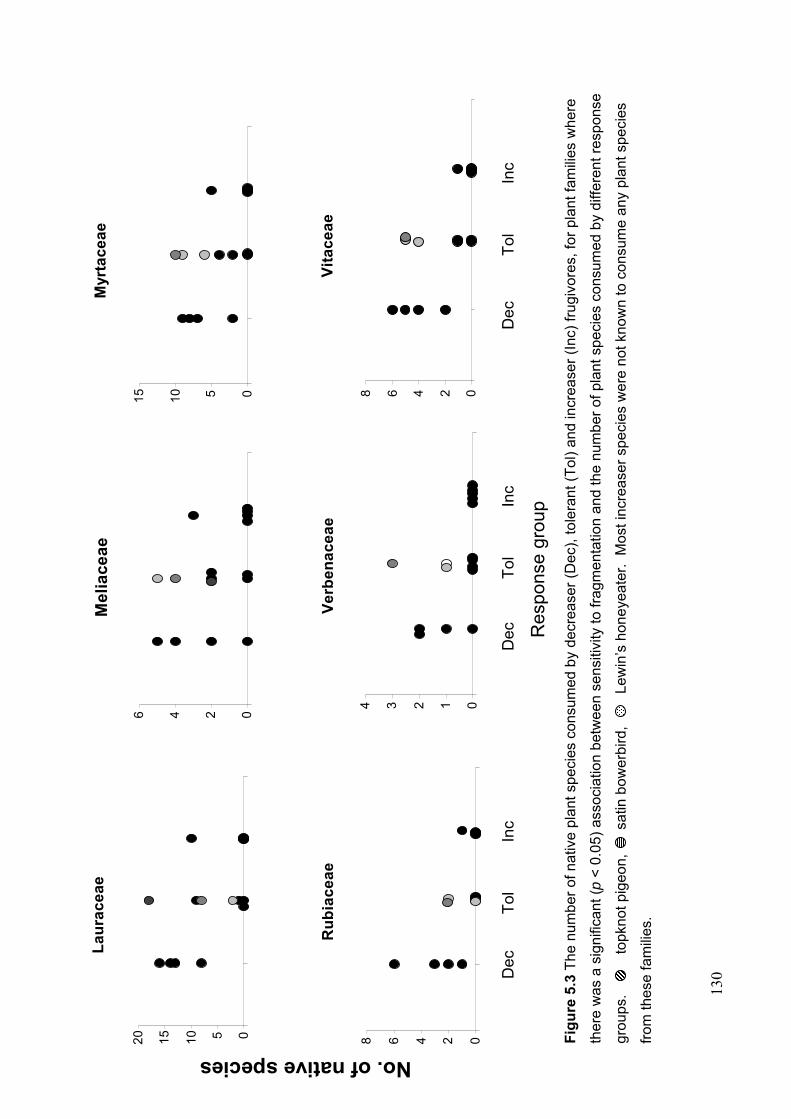
130
Fig
ure
5.3
The
num
ber
of n
ativ
e pl
ant s
peci
es c
onsu
med
by
decr
ease
r (D
ec),
tole
rant
(T
ol)
and
incr
ease
r (I
nc)
frug
ivor
es,
for
plan
t fa
mili
es w
here
ther
e w
as a
sig
nific
ant (
p <
0.0
5) a
ssoc
iatio
n be
twee
n se
nsiti
vity
to fr
agm
enta
tion
and
the
num
ber
of p
lant
spe
cies
con
sum
ed b
y di
ffer
ent r
espo
nse
grou
ps.
top
knot
pig
eon,
satin
bow
erbi
rd,
Lew
in’s
hon
eyea
ter.
Mos
t inc
reas
er s
peci
es w
ere
not k
now
n to
con
sum
e an
y pl
ant s
peci
es
from
thes
e fa
mili
es.
L
au
rac
ea
e
0
5
10
15
20
M
eli
ac
ea
e
0246
M
yrta
ce
ae
0510
15
R
ub
iac
ea
e
0
2
4
6
8
V
erb
en
ac
ea
e
01234
V
ita
ce
ae
0 2 4 6 8
No. of native species
Res
pons
e gr
oup
Dec
T
ol
Inc
Dec
T
ol
Inc
Dec
T
ol
Inc
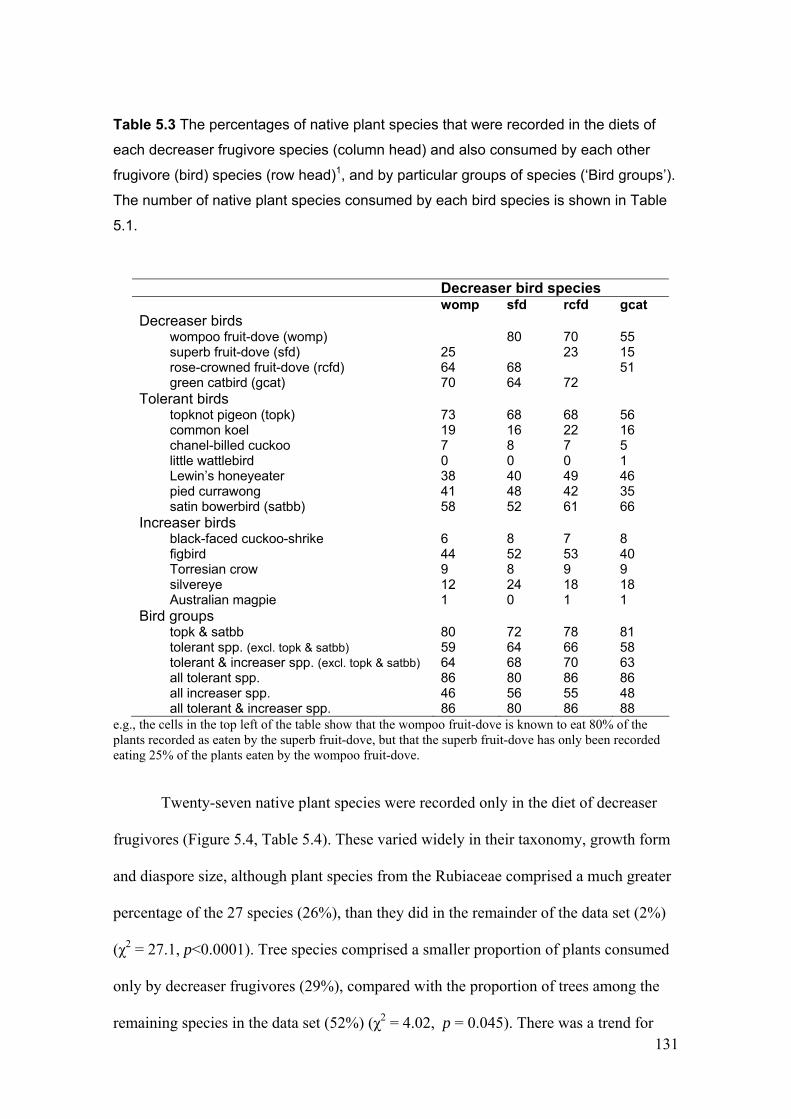
131
Table 5.3 The percentages of native plant species that were recorded in the diets of
each decreaser frugivore species (column head) and also consumed by each other
frugivore (bird) species (row head)1, and by particular groups of species (‘Bird groups’).
The number of native plant species consumed by each bird species is shown in Table
5.1.
Decreaser bird species womp sfd rcfd gcat Decreaser birds
wompoo fruit-dove (womp) 80 70 55 superb fruit-dove (sfd) 25 23 15 rose-crowned fruit-dove (rcfd) 64 68 51 green catbird (gcat) 70 64 72
Tolerant birds topknot pigeon (topk) 73 68 68 56 common koel 19 16 22 16 chanel-billed cuckoo 7 8 7 5 little wattlebird 0 0 0 1 Lewin’s honeyeater 38 40 49 46 pied currawong 41 48 42 35 satin bowerbird (satbb) 58 52 61 66
Increaser birds black-faced cuckoo-shrike 6 8 7 8 figbird 44 52 53 40 Torresian crow 9 8 9 9 silvereye 12 24 18 18 Australian magpie 1 0 1 1
Bird groups topk & satbb 80 72 78 81 tolerant spp. (excl. topk & satbb) 59 64 66 58 tolerant & increaser spp. (excl. topk & satbb) 64 68 70 63 all tolerant spp. 86 80 86 86 all increaser spp. 46 56 55 48 all tolerant & increaser spp. 86 80 86 88
e.g., the cells in the top left of the table show that the wompoo fruit-dove is known to eat 80% of the plants recorded as eaten by the superb fruit-dove, but that the superb fruit-dove has only been recorded eating 25% of the plants eaten by the wompoo fruit-dove.
Twenty-seven native plant species were recorded only in the diet of decreaser
frugivores (Figure 5.4, Table 5.4). These varied widely in their taxonomy, growth form
and diaspore size, although plant species from the Rubiaceae comprised a much greater
percentage of the 27 species (26%), than they did in the remainder of the data set (2%)
(χ2 = 27.1, p<0.0001). Tree species comprised a smaller proportion of plants consumed
only by decreaser frugivores (29%), compared with the proportion of trees among the
remaining species in the data set (52%) (χ2 = 4.02, p = 0.045). There was a trend for
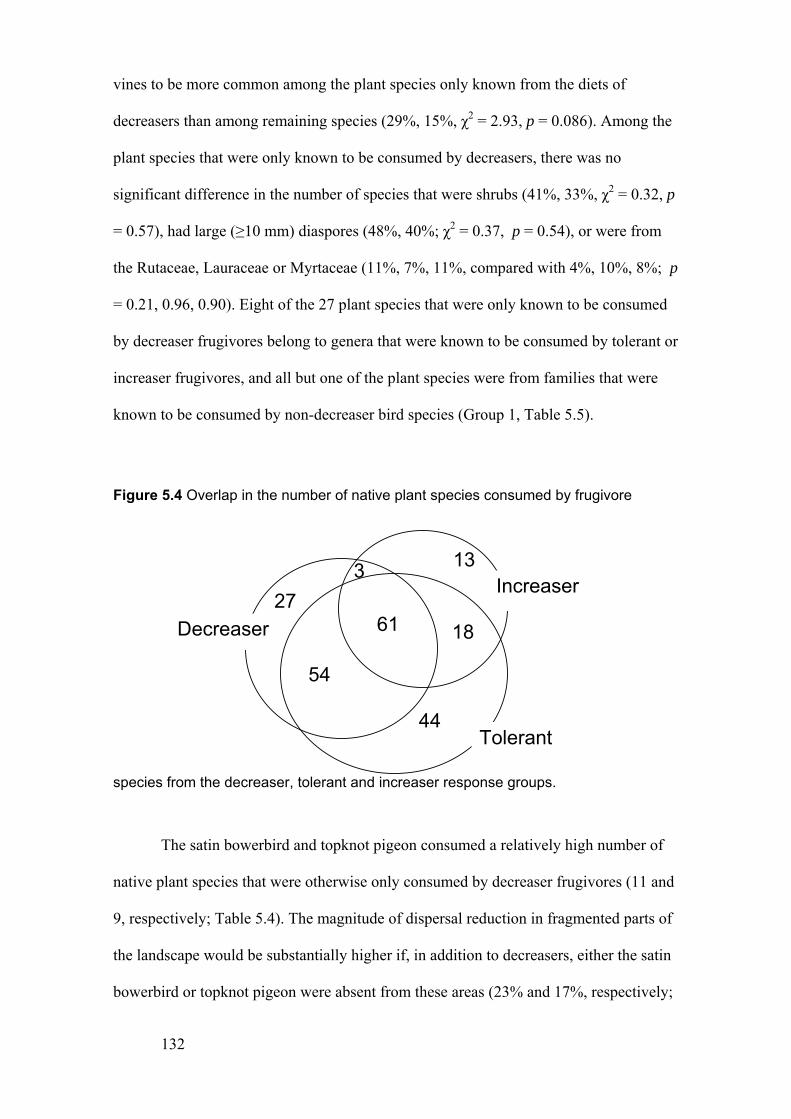
132
vines to be more common among the plant species only known from the diets of
decreasers than among remaining species (29%, 15%, χ2 = 2.93, p = 0.086). Among the
plant species that were only known to be consumed by decreasers, there was no
significant difference in the number of species that were shrubs (41%, 33%, χ2 = 0.32, p
= 0.57), had large (≥10 mm) diaspores (48%, 40%; χ2 = 0.37, p = 0.54), or were from
the Rutaceae, Lauraceae or Myrtaceae (11%, 7%, 11%, compared with 4%, 10%, 8%; p
= 0.21, 0.96, 0.90). Eight of the 27 plant species that were only known to be consumed
by decreaser frugivores belong to genera that were known to be consumed by tolerant or
increaser frugivores, and all but one of the plant species were from families that were
known to be consumed by non-decreaser bird species (Group 1, Table 5.5).
Figure 5.4 Overlap in the number of native plant species consumed by frugivore
species from the decreaser, tolerant and increaser response groups.
The satin bowerbird and topknot pigeon consumed a relatively high number of
native plant species that were otherwise only consumed by decreaser frugivores (11 and
9, respectively; Table 5.4). The magnitude of dispersal reduction in fragmented parts of
the landscape would be substantially higher if, in addition to decreasers, either the satin
bowerbird or topknot pigeon were absent from these areas (23% and 17%, respectively;
Decreaser
Increaser
Tolerant
27
13
44
3
54
1861
133
Table 5.4). Apart from these two tolerant species and decreaser species, there are no
known additional dispersers among the species analysed here for 32% of native plant
species. Species with diaspores ≥10 mm diameter were much more common among the
plant species that were only consumed by the bird species group comprising the topknot
pigeon, satin bowerbird and decreasers, than in the remainder of the data set (60%
compared with 32%; χ2 =14.34, p = 0.0002). In addition, species from the Rubiaceae
(11%, 1%; χ2 = 9.00, p = 0.003) were more frequent among the plant species that were
only consumed by members of this group. There was no significant difference in the
number of species from the Lauraceae (13% , 8%; χ2 = 0.80, p = 0.37), Myrtaceae (both
9%; χ2 = 0.05, p = 0.81), or Rutaceae (7%, 3%; χ2 0.84, p = 0.36), or in the number of
species that were trees (44%, 52%; χ2 = 0.85, p = 0.36), shrubs (33%, 35%; χ2 = 0.01, p
= 0.91) or vines (23%, 13%; χ2 = 2.51, p = 0.11). Plant species that were only consumed
by members of this group included both of the species from the Icacinaceae, three of the
four native Verbenaceae and two of the three native Sapotaceae that were represented in
the data set.
The Lewin’s honeyeater, satin bowerbird and figbird were the unique consumers
of a relatively high number of native plant species (20, 12 and 8, respectively, Table
5.4). Therefore, the loss of any of these species may also result in substantially reduced
dispersal of a noteworthy percentage of native rainforest plant species. In particular, the
declined abundance of the Lewin’s honeyeater may cause a substantial reduction in the
dispersal of 23% of the native plant species in the data set. Most other non-decreaser
frugivore species had few native plant species for which they were the only recorded
consumer (Table 5.4).

134
Table 5.4 For each frugivore (frug.), the number of native plant species that it
consumed that were not consumed by another frugivore species (sp.), or were only
also consumed by a decreaser (Dec.) frugivore(s) is shown. The magnitude of potential
dispersal failure that would result from the absence of each individual frugivore species
together with decreaser frugivores, if there were no gaps in the data set, is also shown.
Bird codes are explained in Table 5.1.
No native plant species consumed:
Dispersal failure in absence of decreasers plus each other species1:
not by other frug.
Only by subject sp. plus any Dec
no. of plant species
% of plant species (n=220)
Decreaser species womp 6 5 sfd 1 4 rcfd 5 5 gcat 8 4 All decreaser 27 27 27 12 Tolerant species topk 1 9 37 17 koel 0 0 27 12 chan 0 0 27 12 lwat 0 0 27 12 Lewhe 20 4 51 23 pcurr 1 0 28 13 satbb 12 11 50 23 Increaser species bfcs 1 1 29 13 figb 8 0 35 16 Tcrow 0 2 29 13 seye 3 0 30 13 Amag 0 0 27 12 Species groups topk and satbb 13 30 70 32 all tolerant 44 54 125 57 all tolerant and inc 75 118 220 100
1 calculated by adding the 27 plant species recorded only in the diet of decreasers, the number of plant species recorded only in the diet of the subject non-decreaser, and those plant species only recorded in their diet plus that of decreasers.
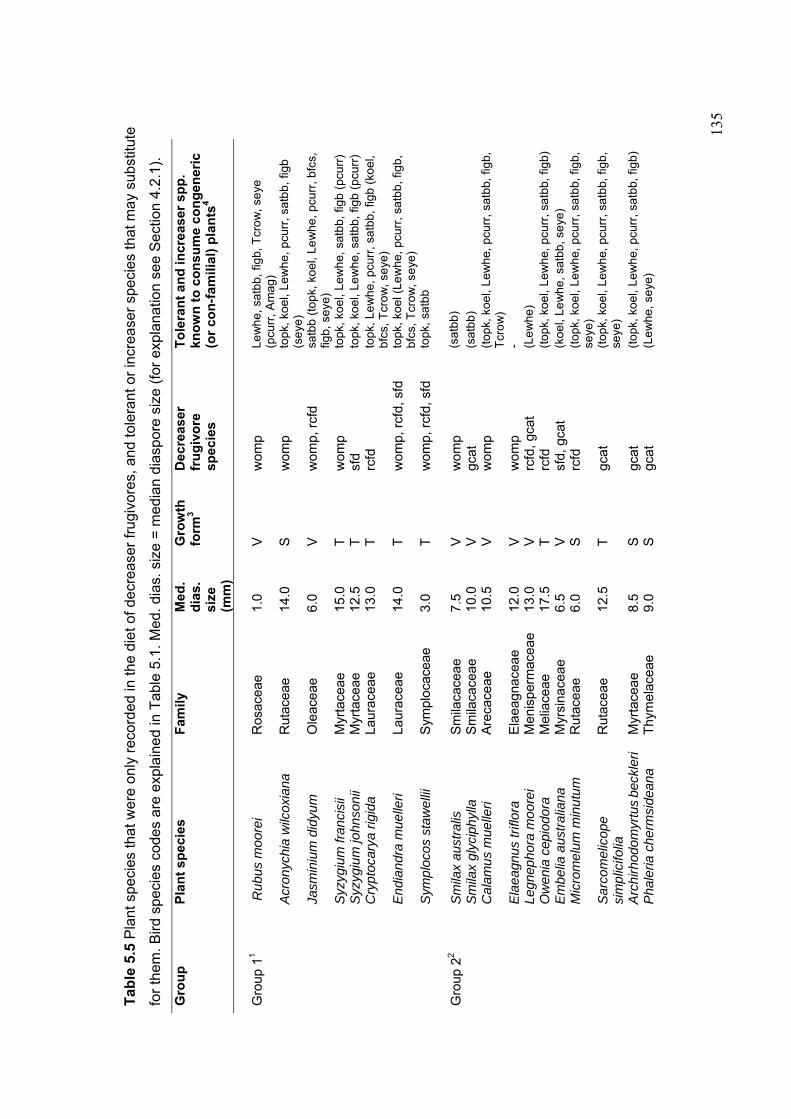
13
5
Tab
le 5
.5 P
lant
spe
cies
that
wer
e on
ly r
ecor
ded
in th
e di
et o
f dec
reas
er fr
ugiv
ores
, and
tole
rant
or
incr
ease
r sp
ecie
s th
at m
ay s
ubst
itute
for
them
. Bird
spe
cies
cod
es a
re e
xpla
ined
in T
able
5.1
. Med
. di
as.
size
= m
edia
n di
aspo
re s
ize
(for
exp
lana
tion
see
Sec
tion
4.2.
1).
Gro
up
P
lan
t sp
ecie
s F
amily
M
ed.
dia
s.
size
(m
m)
Gro
wth
fo
rm3
Dec
reas
er
fru
giv
ore
sp
ecie
s
To
lera
nt
and
incr
ease
r sp
p.
kno
wn
to
co
nsu
me
con
gen
eric
(o
r co
n-f
amili
al)
pla
nts
4
R
ubus
moo
rei
Ros
acea
e 1.
0 V
w
omp
Lew
he,
sat
bb, f
igb,
Tcr
ow
, se
ye
(pcu
rr,
Am
ag)
Acr
onyc
hia
wilc
oxia
na
Rut
acea
e 14
.0
S
wom
p to
pk, k
oel,
Lew
he, p
curr
, sat
bb,
figb
(s
eye)
Ja
smin
ium
did
yum
O
leac
eae
6.0
V
wom
p, r
cfd
satb
b (t
opk,
ko
el, L
ew
he,
pcu
rr, b
fcs,
fig
b, s
eye
) S
yzyg
ium
fran
cisi
i M
yrta
ceae
15
.0
T
wom
p to
pk, k
oel,
Lew
he, s
atbb
, fig
b (p
curr
) S
yzyg
ium
john
soni
i M
yrta
ceae
12
.5
T
sfd
topk
, koe
l, Le
whe
, sat
bb, f
igb
(pcu
rr)
Cry
ptoc
arya
rig
ida
Laur
acea
e 13
.0
T
rcfd
to
pk, L
ew
he,
pcu
rr, s
atbb
, fig
b (k
oel,
bfcs
, Tcr
ow,
seye
) E
ndia
ndra
mue
lleri
Laur
acea
e 14
.0
T
wom
p, r
cfd,
sfd
to
pk, k
oel (
Lew
he, p
curr
, sat
bb,
figb
, bf
cs, T
crow
, se
ye)
Gro
up 1
1
Sym
ploc
os s
taw
ellii
S
ympl
ocac
eae
3.0
T
wom
p, r
cfd,
sfd
to
pk, s
atbb
S
mila
x au
stra
lis
Sm
ilaca
ceae
7.
5 V
w
omp
(sat
bb)
Sm
ilax
glyc
iphy
lla
Sm
ilaca
ceae
10
.0
V
gcat
(s
atbb
) C
alam
us m
uelle
ri A
reca
ceae
10
.5
V
wom
p (t
opk,
koe
l, Le
wh
e, p
curr
, sat
bb, f
igb,
T
cro
w)
Ela
eagn
us tr
iflor
a E
laea
gnac
eae
12.0
V
w
omp
- Le
gnep
hora
moo
rei
Men
ispe
rmac
eae
13.0
V
rc
fd, g
cat
(Le
whe
) O
wen
ia c
epio
dora
M
elia
ceae
17
.5
T
rcfd
(t
opk,
koe
l, Le
wh
e, p
curr
, sat
bb, f
igb)
E
mbe
lia a
ustr
alia
na
Myr
sina
ceae
6.
5 V
sf
d, g
cat
(koe
l, Le
wh
e, s
atbb
, se
ye)
Mic
rom
elum
min
utum
R
utac
eae
6.0
S
rcfd
(t
opk,
koe
l, Le
wh
e, p
curr
, sat
bb, f
igb,
se
ye)
Sar
com
elic
ope
sim
plic
ifolia
R
utac
eae
12.5
T
gc
at
(top
k, k
oel,
Lew
he,
pcu
rr, s
atbb
, fig
b,
seye
)
Arc
hirh
odom
yrtu
s beck
leri
Myr
tace
ae
8.5
S
gcat
(t
opk,
koe
l, Le
wh
e, p
curr
, sat
bb, f
igb)
Gro
up 2
2
Pha
leria
che
rmsi
dean
a T
hym
elac
eae
9.0
S
gcat
(L
ew
he,
seye
)
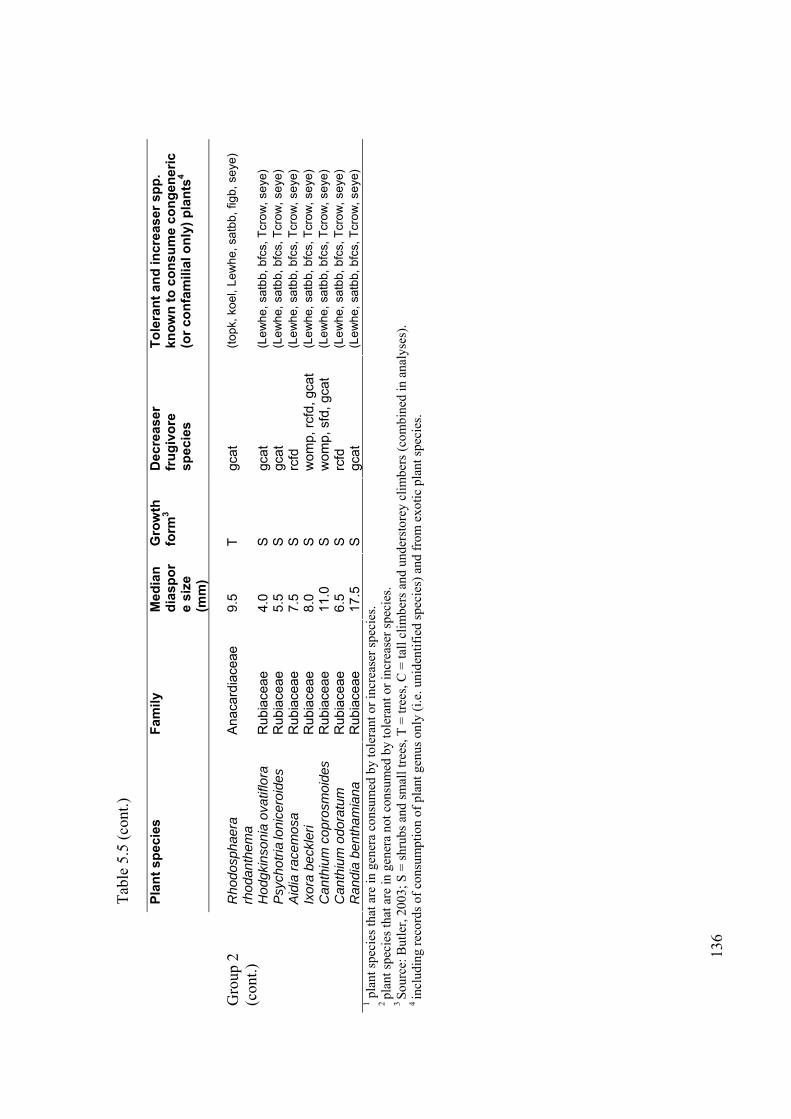
136
Tab
le 5
.5 (
cont
.)
Pla
nt
spec
ies
Fam
ily
Med
ian
d
iasp
or
e si
ze
(mm
)
Gro
wth
fo
rm3
Dec
reas
er
fru
giv
ore
sp
ecie
s
To
lera
nt
and
incr
ease
r sp
p.
kno
wn
to
co
nsu
me
con
gen
eric
(o
r co
nfa
mili
al o
nly
) p
lan
ts4
Rho
dosp
haer
a rh
odan
them
a A
naca
rdia
ceae
9.
5 T
gc
at
(top
k, k
oel,
Lew
he,
sat
bb, f
igb,
se
ye)
Hod
gkin
soni
a ov
atifl
ora
Rub
iace
ae
4.0
S
gcat
(L
ew
he,
satb
b, b
fcs,
Tcr
ow,
seye
) P
sych
otria
loni
cero
ides
R
ubia
ceae
5.
5 S
gc
at
(Le
whe
, sa
tbb,
bfc
s, T
crow
, se
ye)
Aid
ia r
acem
osa
Rub
iace
ae
7.5
S
rcfd
(L
ew
he,
satb
b, b
fcs,
Tcr
ow,
seye
) Ix
ora
beck
leri
Rub
iace
ae
8.0
S
wom
p, r
cfd,
gca
t (L
ew
he,
satb
b, b
fcs,
Tcr
ow,
seye
) C
anth
ium
cop
rosm
oide
s R
ubia
ceae
11
.0
S
wom
p, s
fd, g
cat
(Le
whe
, sa
tbb,
bfc
s, T
crow
, se
ye)
Can
thiu
m o
dora
tum
R
ubia
ceae
6.
5 S
rc
fd
(Le
whe
, sa
tbb,
bfc
s, T
crow
, se
ye)
Gro
up 2
(c
ont.)
Ran
dia
bent
ham
iana
R
ubia
ceae
17
.5
S
gcat
(L
ew
he,
satb
b, b
fcs,
Tcr
ow,
seye
) 1 p
lant
spe
cies
that
are
in g
ener
a co
nsum
ed b
y to
lera
nt o
r in
crea
ser
spec
ies.
2 pl
ant s
peci
es th
at a
re in
gen
era
not c
onsu
med
by
tole
rant
or
incr
ease
r sp
ecie
s.
3 S
ourc
e: B
utle
r, 2
003;
S =
shr
ubs
and
smal
l tre
es, T
= tr
ees,
C =
tall
clim
bers
and
und
erst
orey
clim
bers
(co
mbi
ned
in a
naly
ses)
. 4 in
clud
ing
reco
rds
of c
onsu
mpt
ion
of p
lant
gen
us o
nly
(i.e
. uni
dent
ifie
d sp
ecie
s) a
nd f
rom
exo
tic p
lant
spe
cies
.
137
5.4 Discussion
5.4.1 Reduced dispersal of native rainforest plants as a consequence of rainforest
fragmentation
Based on patterns of consumption of plant species by frugivorous bird species,
substantially reduced dispersal is likely for 27 native rainforest plant species in the
absence of four frugivorous bird species from fragmented rainforest. The analyses
underpinning this result are based on data for approximately half of the fleshy-fruited
plant species that were recorded in subtropical Australian rainforest in a comprehensive
inventory by Butler (2003). If these data reflect patterns among the general fleshy-
fruited flora of the region, 12% of native rainforest plant species may have severely
reduced regenerative potential in fragmented forest because of the absence of known
disperser species. If these plant species are unable to germinate under parent plants, for
example due to high levels of fungal attack or seed predation, these species will fail to
regenerate and may become extinct in rainforest fragments. Similar predictions have
been made elsewhere where numbers of disperser species have declined dramatically
(Janzen and Vasquez-Yanez, 1991; Chapman and Chapman, 1995; Terborgh and
Nuñez-Iturri, 2006).
However, many plant species do regenerate in the absence of dispersers (Janzen
and Martin, 1982; Chapman and Chapman, 1995; Corlett and Turner, 1997), although
their recruits may be less abundant and more spatially aggregated than in forest with an
intact disperser assemblage (Hubbell and Foster, 1990; Bleher and Böhning-Gaese,
2001; Schupp et al., 2002; Cordeiro and Howe, 2003). Plant species without dispersers
would also be unable to colonise rainforest fragments following local extinction
(McEuan and Curran, 2004) or secondary regrowth on cleared land (Duncan and
Chapman, 2002; Ingle, 2003). The low regenerative potential of plant species may result
138
in high vulnerability to extinction in fragmented rainforest (Poschlod et al., 1996;
Cochrane et al., 1999).
The plant family Rubiaceae is well represented among the species that were
identified as being vulnerable to substantially reduced dispersal in the fragmented
rainforest landscapes of subtropical Australia. Substantially reduced dispersal in forest
fragments may result in reduced numbers and a clumped spatial distribution of recruits
(e.g., Cordeiro and Howe, 2003; Babweteera et al., 2006). Recruitment of plants in the
Rubiaceae has been shown to be relatively low in isolated forest patches in both Brazil
(Tabarelli et al., 1999) and Singapore (Turner et al., 1996). This has been attributed to
unsuitable germination conditions in fragments (Turner et al., 1996; Tabarelli et al.,
1999). If the patterns detected in the present study reflect the situation in other regions,
low recruitment of plants from the Rubiaceae may be a consequence of frugivore
declines, and subsequently reduced dispersal in fragmented forest.
However, it is also possible that plant species from the Rubiaceae are consumed
by additional frugivore species in subtropical Australia than available data show. It is
thought that many frugivore species disperse Rubiaceae in tropical regions (Snow,
1981; Silva et al., 2002), although patterns of consumption of this family are not well
understood (Wheelwright et al., 1984). As in other regions (e.g., Corlett, 1996), plant
species within the Rubiaceae in subtropical Australia are typically shrubs or small trees
that bear medium-sized (average diameter 8.04 mm, n = 22) drupes or berries that are
mostly black or orange in colour (Butler, 2003). These fruit characteristics are typically
associated with consumption by many bird species (Gautier-Hion et al., 1985;
Wheelwright, 1985; Brown and Hopkins, 2002; Bollen et al., 2004). On the other hand,
factors such as secondary metabolites that require specific digestive adaptation may
limit the suite of frugivores that consume a plant taxon (Martínez del Rio and Restrepo,
1993; Izhaki et al., 2002). It is possible that chemistry is a factor limiting the

139
consumption of Rubiaceae by many bird species, since Izhaki et al. (2002) have shown
that anthraquinones, a particular class of secondary compound, were especially common
in the species of Rubiaceae that they studied, and that these deterred consumption by
some bird species.
5.4.2 Potential for disperser substitution in fragmented forest
In general, increaser species in subtropical Australia have low potential to
substitute for decreaser species as seed dispersers, since they consume a low number of
native plant taxa, a high dietary proportion of exotic plants and a low dietary proportion
of plant species with large fruits. In contrast, the overall diet consumption patterns of
tolerant frugivores resembled those of the decreaser species, suggesting considerable
potential for disperser substitution by tolerant frugivores in fragmented rainforest.
Hence, many native rainforest plants should retain some potential for dispersal within
and between remnants and into regrowth, although this would depend on whether
increaser species such as the figbird, and tolerant frugivores, particularly the topknot
pigeon, satin bowerbird and Lewin’s honeyeater actually moved and transported seeds
across habitat boundaries. However, this assessment of bird species’ potential to
substitute for one another as seed dispersers is based on the presence or absence of plant
species in their diets and does not account for variation in other factors that may
influence plant regeneration outcomes, including the numbers of fruits consumed, or
the microsites to which seeds are dispersed (Schupp, 1993).
Where the movement of frugivore species in fragmented forest has been studied
in other parts of the world, few frugivore species have moved between forest fragments
or into cleared areas (Duncan and Chapman, 2002; Silva et al., 1996; McEuen and
Curran, 2004). Patterns of native plant recruitment in weed-dominated regrowth in
subtropical eastern Australia indicate that frugivorous birds do disperse seeds from a
140
variety of native plant species across cleared land (Neilan et al., 2006). In particular
figbirds and large flocks of topknot pigeons regularly travel many kilometres over
cleared land (Frith, 1957; Price 1999) and consequently may disperse seeds among
fragmented rainforest patches.
However, most individual tolerant species consumed a relatively low percentage
of the plant species that were consumed by decreaser frugivores. Consequently, the
continued dispersal in remnant and regrowth patches of 30 of the plant species dispersed
by decreasers (an additional 14% of plant species in the data set) may depend on only
two tolerant frugivore species; the topknot pigeon and satin bowerbird. The reduced
number of disperser species for these plant species, combined with a relatively low
abundance of both topknot pigeon and satin bowerbird during site-based surveys in
remnants and regrowth (Chapter Two, Table 2.2), suggests that dispersal of seeds of
these plant species would be reduced in fragmented rainforest.
In addition to the Rubiaceae, this study identifies the plant families Lauraceae,
Meliaceae, Myrtaceae, Verbenaceae and Vitaceae, as well as those species with
diaspores ≥ 10 mm wide, as being susceptible to reduced dispersal in fragmented forest
in subtropical Australia. As with Rubiaceae, restricted recruitment of plants from the
families Lauraceae, Myrtaceae and Meliaceae in forest fragments in other regions has
been attributed to germination limitation (Turner et al., 1996; Tabarelli et al., 1999). As
suggested by the results of the present study for subtropical Australia, reduced dispersal
may also be important in these regions, especially since many plant species from these
families are consumed by only a subset of the frugivore assemblage (Snow, 1981;
Wheelwright et al., 1984; Silva and Tabarelli, 2000).
In subtropical Australia, the Lewin’s honeyeater is known to consume several
plant species from the families identified as being susceptible to reduced dispersal in
fragmented forest. Populations of these bird species appear to be stable (Blakers et al.,
141
1984; Higgins et al., 2001), and numbers of this species were consistently high in the
surveys conducted for this study (Chapter Two, Table 2.2). Therefore, in addition to the
topknot pigeon and satin bowerbird, the Lewin’s honeyeater may help maintain the
regenerative potential of some plant families in fragmented forest, although it may
contribute little to the dispersal of large-seeded plant species from any family. In the
study region, frugivorous Pteropid bats also use remnants and regrowth (Chapter Six).
These bats consume a range of plant species from the Myrtaceae (Eby, 1995; Chapter
Six of this thesis) and can transport large fruits in their teeth or claws (Ratcliffe, 1932).
However the seeds that they move beyond about 100-200 m from source trees are likely
to be those that they swallow or carry in cheek pouches; smaller than 9 mm diameter
(Eby, 1995; McConkey and Drake, 2002; Meehan et al., 2005). Therefore, frugivorous
bats may play an important role in dispersing seeds of these plants within remnants and
possibly into adjacent cleared areas (Galindo-González and Sosa, 2003), but may
contribute little to their dispersal among more widely separated fragments.
5.4.3 Implications for conservation of regenerative potential in fragmented rainforest
Data presented here and in Chapter Four suggest that most native Australian
rainforest plant species are probably dispersed by multiple frugivore species. However,
it is predicted that fragmentation-related changes in the frugivore assemblage of
subtropical rainforests may result in substantially reduced dispersal of a suite of plant
species. The size of this suite of plants is strongly dependent on the responses of two
“tolerant” frugivore species. Additional understanding of the factors affecting the
abundance of both the topknot pigeon and satin bowerbird in response to landscape
change is required because of the disproportionate effect that losing these species would
have over seed dispersal. The topknot pigeon is widespread in certain fragmented
rainforest landscapes of subtropical Australia (Date et al., 1996; Gosper and Holmes,
142
2002; Neilan et al., 2006). However, the distribution of the topknot pigeon was shown
to be restricted in small fragments compared with extensive forest in another area of
subtropical Australia (Howe et al., 1981). While the abundance pattern of topknot
pigeons suggested fragmentation tolerance, there was a trend toward a decreaser
abundance pattern, and numbers of this species were relatively low and highly variable
in the region of the present study (Chapter Two). This species has previously undergone
dramatic population declines following rapid rainforest clearing by European settlers in
the late nineteenth century (Frith, 1952, 1957; Date et al., 1996). Similarly, the
assessment of fragmentation tolerance of the satin bowerbird was based on relatively
low occurrence during the surveys conducted for the present study, although this species
was reported by Howe et al. (1981) to be relatively common in fragmented subtropical
rainforest. If, in addition to identified decreaser species, the satin bowerbird and topknot
pigeon declined in fragmented parts of the landscape, the present analyses suggest that
the dispersal of one-third of native rainforest plant species may be substantially reduced
in these areas. A comparable magnitude of dispersal reduction has been predicted from
Brazil (Silva and Tabarelli, 2000) and Thailand (Kitamura et al., 2002), regions in
which a large proportion of rainforest has also been cleared.
143
Chapter Six
The distribution of frugivorous bats and their potential to disperse
seeds in fragmented rainforest.
6.1 Introduction
Seed dispersal by frugivorous fauna plays several important roles in the
maintenance of biodiversity in fragmented landscapes. The dispersal of seeds within and
between large forest tracts, remnant forest patches and other habitats helps maintain
species and genetic diversity, initiates recolonisation after local extinction, and is crucial
for natural regeneration of rainforest on cleared land (Howe and Smallwood, 1982;
Guevara et al., 1986; Young et al., 1996; Galindo-González et al., 2000; Wright, 2002).
Frugivore species differ in their capacity to disperse plant species in fragmented
parts of the landscape, depending first on whether they use fragmented habitats, second,
on the suite of plant species they consume and third on their patterns of movement
within and between different habitat types. Hence, the species composition of the
frugivore assemblage in remnant and regrowth forest will influence patterns of seed
dispersal and forest regeneration. Dispersal of certain plant species may be reduced in
these areas if they are not dispersed by the frugivore species that occur in fragmented
parts of the landscape (Hamann and Curio, 1999; Silva and Tabarelli, 2000; Corlett,
1998, 2002; Cordeiro and Howe, 2001, 2003). For example, relatively few frugivores
have the capacity to disperse fruits with large seeds and those that do are often
vulnerable to the effects of fragmentation (Wheelwright, 1985; Chapman and Chapman,
1995; Corlett, 1998, 2002; Silva and Tabarelli, 2000; Kitamura et al., 2002; McConkey
and Drake, 2002; Walker, 2006).
144
Frugivorous birds and bats are the main seed dispersers in Australian subtropical
rainforests (Green, 1995), where approximately 70% of plant species are fleshy-fruited
(Willson et al., 1989; Butler 2003). Surveys in remnants and regrowth patches in a
fragmented subtropical rainforest landscape in Australia have found that frugivorous
bird species showed one of three patterns of abundance relative to extensive forest: (i)
lower numbers in remnant and/or regrowth rainforest patches compared with extensive
forest (‘decreaser’ pattern); (ii) higher numbers in remnant and/or regrowth rainforest
patches compared with extensive forest (‘increaser’ pattern); or (iii), no substantial
difference in numbers between the three site types (‘tolerant’ pattern: Chapter Two).
The impact of the decreased abundance of certain bird species on seed dispersal in
remnant and regrowth rainforest patches depends on whether remaining frugivore
species perform similar seed dispersal roles in these habitats.
In Australia, three species of frugivorous bat species occur regularly in
subtropical rainforests: the grey-headed and black flying-foxes (Pteropus poliocephalus
and P. alecto) and eastern tube-nosed fruit-bat (Nyctimene robinsoni). Two additional
species, the little red flying-fox (P. scapulatus) and Queensland blossom bat
(Syconycteris australis), occasionally feed on fruit but are not common in rainforest
(Ratcliffe, 1932; Law and Spencer, 1995). The consequences of the extensive loss and
fragmentation of subtropical Australian rainforest for the distribution of frugivorous
bats are not well understood. It is widely held that populations of P. poliocephalus have
suffered dramatic declines since European settlement (Eby et al., 1999; Eby and
Lunney, 2002; Dickman and Fleming, 2002). Elsewhere throughout the Old World
tropics, pteropid populations have undergone large declines (Cox et al., 1991; Corlett,
1998; McConkey and Drake, 2002), in some cases associated with restricted distribution
in fragmented habitats (Mildenstein et al., 2005). In Australia, both P. poliocephalus
(Eby 1991a, 1998; McDonald-Madden et al., 2005) and P. alecto (Markus and Hall,

145
2004) are known to use forest resources in fragmented parts of the landscape, but their
distribution has not been systematically compared between fragmented and intact forest.
The distribution and habits of N. robinsoni are poorly known, especially in the southern
parts of its range.
Chapter Five assessed the potential for tolerant and increaser bird species to
substitute for decreaser bird species as seed dispersers, based on a comparison of their
patterns of plant species consumption. The results of analyses showed that certain plant
taxa may be solely or predominantly dispersed by decreaser bird species, and therefore
may be susceptible to substantially reduced dispersal in fragmented rainforest.
However, Chapter Five also showed that a large proportion of the plant species
dispersed by decreaser bird species are potentially dispersed by certain tolerant bird
species in fragmented forest. The ability of frugivorous bats to substitute for decreaser
bird species as seed dispersers in fragmented forest landscapes of subtropical Australia
has not been evaluated. If frugivorous bats do not consume a similar suite of plant
species to decreaser frugivores, or if their distribution is restricted to extensive forest,
they would have low potential to substitute for decreaser bird species as seed dispersers.
Studies conducted in north Queensland, the Philippines, Madagascar and Peru have
reported little overlap between the diets of frugivorous bird and bat species (Gorchov et
al., 1995; Hamann and Curio, 1999; Bollen et al., 2004; Richards, 1990). In contrast,
Eby (1998) found that the plant species consumed by P. poliocephalus in subtropical
Australian rainforests comprised a subset of those that were collectively consumed by
the sympatric assemblage of frugivorous birds. However, more detailed dietary
comparisons between individual species are needed to show whether frugivorous bats
have the potential to substitute as seed dispersers for the frugivorous bird species that
decline in fragmented subtropical rainforest landscapes.

146
This chapter tests the overall hypothesis that the distribution of frugivorous bats
is restricted in a fragmented rainforest landscape of subtropical Australia. The presence
and abundance of foraging flying-foxes and N. robinsoni are compared between
extensive forest, and patches of remnant and regrowth patches that have been isolated
by clearing (16 sites of each type). The effect of site altitude and presence of a
watercourse are also evaluated. Information about the native plant species known to be
consumed by frugivorous bats is compiled and used, in conjunction with information
about their use of remnant and regrowth habitats, to assess their potential to disperse
seeds in fragmented parts of the study region. In particular, the potential for frugivorous
bat species to substitute for decreaser bird species as seed dispersers in fragmented
habitats is assessed, especially in relation to the dispersal of plant species with large
seeds and other plant taxa that have been identified as vulnerable to reduced dispersal in
fragmented forest (Chapter Five).
6.2 Methods
6.2.1 The study region and site network
Bat surveys were conducted in the same network of 48 sites as the bird surveys.
A description of the site network and study region is provided in Chapter Two (Section
2.2.1). The distribution and clearing history of subtropical rainforest in Australia were
described in Chapter One (Section 1.4.1).
6.2.2 Surveys of frugivorous bat distribution
The occurrence of frugivorous bats was assessed using a single, hour-long
nocturnal search at each site during summer (January-February) 2003. Surveys were
timed to occur during the period of maximum fruit abundance in rainforest in
subtropical Australia (Innis, 1989; Church, 1997). Searches were conducted between

147
one hour after sunset (usually around 8 pm) and 2 am. Two observers searched for bats
(the author and J. Kanowski), each using a spotlight (30 W) and walking slowly for
approximately 400-500 m, usually along a watercourse or path. Bats were located
through movement, calls and foraging sounds, using binoculars for identification when
necessary. Most flying-fox records involved sighting of individuals, although records
were occasionally made from calls. Abundance estimates may consequently have been
biased towards remnant and especially regrowth sites where visibility was greater.
However, presence-absence information would be a reliable measure of site use, since
flying-foxes were usually heard when they alighted in vegetation or when they dropped
or dislodged fruit. Where possible, flying-foxes were identified to species; otherwise the
record was made as ‘Pteropus sp.’ Only large flying-foxes were involved in the
instances of undetermined species, so it was assumed that these were either P.
poliocephalus or P. alecto, since P. scapulatus are noticeably smaller (Hall and
Richards, 2000; personal observation). Some N. robinsoni individuals were both seen
and heard but this species was usually detected by the distinctive, squeaky call which it
emits while flying. Except in the unlikely circumstance that this species has different
calling behaviour between habitat types, presence-absence information for this species
would not be biased toward any particular habitat type.
6.2.3 Frugivorous bird data
The patterns of abundance of frugivorous birds in the same site network were
determined from 40 minute searches of a 1 ha plot at each site, conducted twice in
summer and twice in winter, 2001 by the author (described in Section 2.2.3). Of the 26
bird species that had been recorded frequently enough to assign a fragmentation
response pattern, 14 are known to either destroy seeds (i.e., ‘seed crushers’; e.g., white-
headed pigeon Columba leucomela, Australian king-parrot Alisterus scapulatus) or to
148
consume fleshy fruits only infrequently (e.g., black-faced cuckoo-shrike Coracina
novaehollandiae, Torresian crow Corvus orru (i.e., ‘minor frugivores’)) (Chapter
Three). These species potentially make relatively little contribution to seed dispersal,
either because they do not disperse viable seed or because they consume a small number
of plant taxa (Chapter Four). Therefore, only the remaining 12 bird species that usually
disperse intact seeds and have fruit-dominated or mixed diets are considered in the
present chapter.
6.2.4 Information on the consumption of native plant species by frugivorous bat and
bird species
Information about the fleshy-fruited plant species consumed by the 12
frugivorous bird species, P. poliocephalus, P. alecto and N. robinsoni were obtained
from 130 published sources (Appendix 1) and several unpublished data sets. The data
set containing records of plant species consumption by frugivorous bird species was
described in Chapter Four (Section 4.2.1). The majority of the foraging records for
flying-foxes came from data published by Eby (1995, 1998). Most of the published
foraging records for both birds and bats were obtained from direct field observation
although a relatively small proportion of records were obtained from gut contents, scats,
or regurgitated seeds. There was large variation among frugivore species in the amount
of foraging information available. Except in the case of targeted surveys of particular
frugivore or plant species, records were typically accompanied by minimal information
about the observed interaction, such as details of fruit handling. Records were rejected if
it appeared that the frugivore had not been observed actually consuming the fruit (i.e., it
was only observed in the fruiting plant), or if it was judged from accompanying
information that the interaction was likely to be an instance of fruit theft (consumption
of the flesh without ingesting the seed). Diaspore size (the average width of the
149
functional dispersal unit; see Section 4.2.1) was used to evaluate the likelihood that
flying-foxes would transport the seed away from source plants. Although the size of
fruits that flying-foxes are able to consume is not constrained by their gape width
(Ratcliffe, 1932), their ability to transport seeds is size-limited, since only small seeds
can pass through their gut (c.a. 4 mm for P. poliocephalus (Eby, 1991b)), or be carried
in cheek pouches (c.a. 9 mm (Eby, 1995)). Flying-foxes may also carry larger fruits in
their jaws, but are only likely to transport these over short distances (in the order of
metres) (Ratcliffe, 1932). For the purpose of this work, it was considered that flying-
foxes were potentially able to carry in their cheek pouches diaspores with a maximum
median width of 18 mm, based on the possibility of large intraspecific variation in fruit
size (Edwards, 2005).
Because of the wide geographical range of many of the frugivore species that
occur in subtropical Australia, frugivory records may have been collected from an area
extending from temperate southern Australia to tropical Papua New Guinea, but the
analyses presented here only considered records of the consumption of plant species that
were native to the study region (based on published accounts of plant distribution and
expert advice). Plant taxa included in analyses are listed in Appendix 2. For a given
frugivore species, the data potentially included foraging records from multiple years,
seasons and geographic locations. The data were compiled into a binary matrix showing
whether or not each fleshy-fruited plant species had been recorded in the diet of each of
the frugivore species.
6.2.5 Data handling
Bat distribution in extensive, remnant and regrowth sites
The presence of frugivorous bats (and the abundance of flying-foxes) was (i)
compared across habitat types; and (ii) analysed in relation to environmental attributes
150
of sites (altitude and the presence of a watercourse), which may be related to the
foraging distribution of frugivorous bats Australia (Palmer and Woinarski 1999; Palmer
et al. 2000). I did not attempt to quantify abundance of N. robinsoni as most records
were from calls. For flying-foxes, the abundance measure was the number of individuals
recorded during the hour survey. Log-transformation normalised abundance data for ‘all
flying-foxes’ (i.e., positively identified P. poliocephalus and P. alecto plus unidentified
large flying-foxes), but not for P. poliocephalus alone. Non-parametric statistical tests
were used on raw abundance data for P. poliocephalus.
Patterns of plant species consumption
The number of native plant species, genera and families, the proportion of plant
species with a median diaspore size ≥10 mm, and the average diaspore size of plant
species consumed were calculated for each frugivore species under consideration in the
present work. A dendrogram showing multivariate similarities among the diets of
frugivores (flying-foxes and the 12 frugivorous bird species) was generated using the
UPGMA algorithm and Bray-Curtis similarity metric (Manly 1994) in the statistical
program PRIMER, based on the presence or absence of native plant species in the
frugivores’ diets. Plant species known to be eaten by less than three frugivores were
excluded from this analysis.
6.3 Results
6.3.1 Distribution and abundance of frugivorous bats
Frugivorous bats were recorded in most of the sites surveyed (Table 6.1). P.
scapulatus and S. australis were recorded only once each (both in the same coastal
remnant site); data for these two species are not considered further. While it was often
not possible to distinguish between P. poliocephalus and P. alecto during surveys, many

151
more individuals of P. poliocephalus were positively identified than P. alecto. During
the survey period, P. poliocephalus was recorded in significantly more sites in remnant
and regrowth forest than extensive forest (Table 6.1). The abundance of P.
poliocephalus also varied significantly between site types (Kruskal-Wallis H = 11.17,
d.f .= 2, P = 0.004), being higher in regrowth and remnants than extensive forest (Figure
6.1). The occurrence of ‘all flying-foxes’ (P. poliocephalus, P. alecto and unidentified
large flying-foxes) was not statistically different between site types, although there was
a similar trend to that shown when data for definitely identified P. poliocephalus was
analysed separately (Table 6.1). The abundance of ‘all flying-foxes’ was higher in both
remnant and regrowth forest than in extensive forest (ANOVA F2, 47 =8.99, P=0.001)
(Figure 6.1). N. robinsoni was detected in more extensive forest and remnant sites than
in regrowth (Table 6.1).
Table 6.1 Distribution of frugivorous bats in surveys of extensive, remnant and
regrowth rainforest in the Sunshine Coast, Queensland, Australia. The table shows the
number of sites in which each species was recorded.
Species Total Extensive Remnant Regrowth p (n = 48) (n = 16) (n = 16) (n = 16) P. poliocephalus 25 4 9 12 0.044 P. alecto 3 1 1 1 - Unidentified large flying-foxes 19 7 8 4 - All large flying-foxes1 39 10 15 14 0.064 N. robinsoni2 13 6 6 1 0.025 Any fruit-eating bat3 41 12 15 14 0.314 1 includes unidentified individuals considered to be P. poliocephalus or P. alecto. 2 extensive and remnant sites pooled for statistical test. 3 includes all flying-foxes and N. robinsoni. 4 χ2 test of independence for distribution in different forest types, d.f.=2 5 Fisher’s exact test, regrowth versus extensive and remnant sites
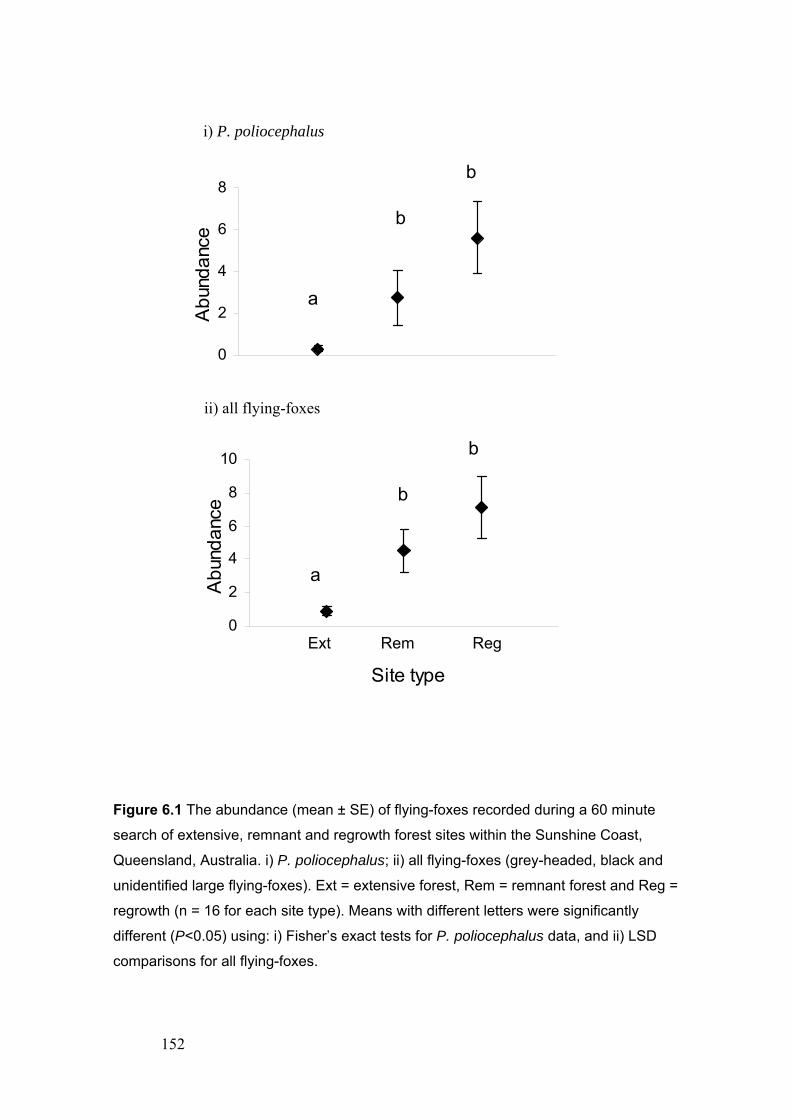
152
Figure 6.1 The abundance (mean ± SE) of flying-foxes recorded during a 60 minute
search of extensive, remnant and regrowth forest sites within the Sunshine Coast,
Queensland, Australia. i) P. poliocephalus; ii) all flying-foxes (grey-headed, black and
unidentified large flying-foxes). Ext = extensive forest, Rem = remnant forest and Reg =
regrowth (n = 16 for each site type). Means with different letters were significantly
different (P<0.05) using: i) Fisher’s exact tests for P. poliocephalus data, and ii) LSD
comparisons for all flying-foxes.
i) P. poliocephalus
0
2
4
6
8A
bun
da
nce
a
b
b
ii) all flying-foxes
0
2
4
6
8
10
Site type
Abun
danc
e
a
b
b
Ext Rem Reg
153
6.3.2 Association of bat distribution with environmental attributes
N. robinsoni was recorded at nine of the 34 sites that contained a watercourse
and four of the 14 sites without, showing no clear association with watercourses (χ2 =
0.02). In contrast, the presence of flying-foxes was strongly associated with
watercourses; P. poliocephalus was present at 24 of the 34 sites with watercourses and
at only one of the 14 sites without (Fisher’s exact test, p<0.001), while ‘all large flying-
foxes’ (P. poliocephalus, P. alecto and unidentified large flying-foxes) were present in
32 of the sites with watercourses and in seven of the sites without (Fisher’s exact test, p
= 0.001). The mean abundance of P. poliocephalus was also higher in sites with a
watercourse (average of 4.1 bats per survey) than in sites without (0.1 bats per survey;
Wilcoxon rank test z = -3.83, p = 0.0001). There was a similar result for ‘all large
flying-foxes’ (5.3 bats per survey in sites with watercourse, 1.5 bats per survey in sites
without; t-test = 3.38, p = 0.001, d.f. = 46).
For N. robinsoni, there was no clear association between altitude and occurrence
within extensive and remnant forest (logistic regression R = -0.13, N = 32, p = 0.09).
This species was recorded at 7 of 13 sites below 200 m, 5 of 13 sites located between
200 and 500 m, and none of six sites above 500 m a.s.l. Similarly, no altitudinal trend
was detected in the distribution of flying foxes within the habitats in which they were
most abundant (remnant and regrowth sites), either in terms of abundance (Pearson’s
correlation coefficient R = -0.15, N = 32, p = 0.21), or presence/ absence (logistic
regression R<0.0001, N = 32, p = 0.28). Flying-foxes were recorded at 16 of the 17
remnant and regrowth sites below 200 m and 13 of 15 sites above 200 m.
154
6.3.3 Comparison between frugivorous bat and bird species in their patterns of plant
species consumption
There were a total of 811 foraging records for birds and bats, from 221 native
species of trees, shrubs, vines and herbs. N. robinsoni had only been positively recorded
feeding on the fruits of four native plant species in subtropical Australia (Table 6.2),
Elaeocarpus grandis (Elaeocarpaceae), Ficus watkinsiana (Moraceae), Endiandra
discolor (Lauraceae) and Melodorum leichardtii (Annonaceae). Several additional plant
species, especially figs, are likely to be consumed by this bat, but as observations had
been recorded only to genus level (e.g., ‘Ficus sp.’), these were not quantifiable in the
present data set. Flying-foxes were known to consume 48 species, 31 genera and 29
families of native plants; values which are moderate in comparison with the ranges
shown by bird species (6 – 106 species, 2 – 89 genera, 3 – 52 families) (Table 6.2).
Flying-foxes were known to consume ten of the 20 plant species in the dataset from the
Myrtaceae, and ten of the 13 species from the Moraceae. For the remaining 27 plant
families known to be consumed by flying-foxes, only one or two plant species had been
recorded.
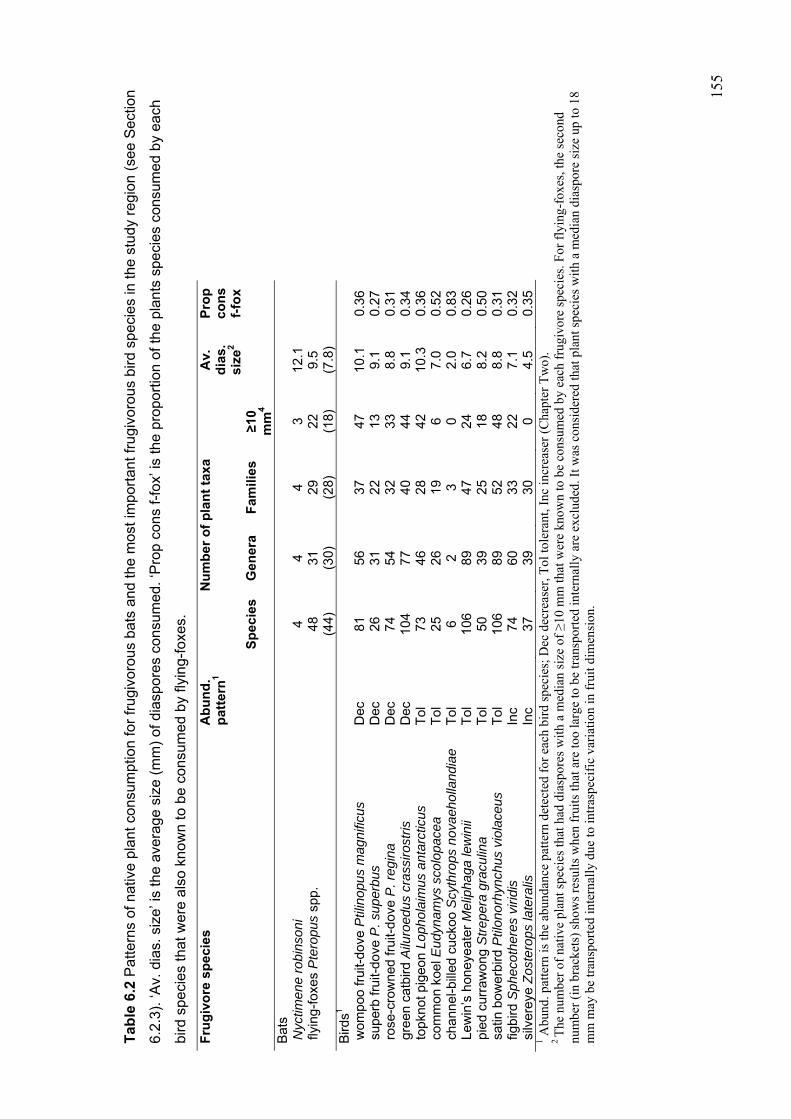
15
5
Tab
le 6
.2 P
atte
rns
of n
ativ
e pl
ant c
onsu
mpt
ion
for
frug
ivor
ous
bats
and
the
mos
t im
port
ant
frug
ivor
ous
bird
spe
cies
in t
he s
tudy
reg
ion
(see
Sec
tion
6.2.
3). ‘
Av.
dia
s. s
ize’
is th
e av
erag
e si
ze (
mm
) of
dia
spor
es c
onsu
med
. ‘P
rop
cons
f-fo
x’ is
the
prop
ortio
n of
the
plan
ts s
peci
es c
onsu
med
by
each
bird
spe
cies
that
wer
e al
so k
now
n to
be
cons
umed
by
flyin
g-fo
xes.
Fru
giv
ore
sp
ecie
s A
bu
nd
. p
atte
rn1
Nu
mb
er o
f p
lan
t ta
xa
Av.
d
ias.
si
ze2
Pro
p
con
s f-
fox
Sp
ecie
s G
ener
a F
amili
es
≥10
mm
4
Bat
s
Nyc
timen
e ro
bins
oni
4
4 4
3 12
.1
fl
ying
-fox
es P
tero
pus
spp.
48
(44)
31
(3
0)
29
(28)
22
(1
8)
9.5
(7
.8)
B
irds1
w
ompo
o fr
uit-
dove
Ptil
inop
us m
agni
ficus
D
ec
81
56
37
47
10
.1
0.36
s
uper
b fr
uit-
dove
P. s
uper
bus
Dec
26
31
22
13
9.
1 0.
27
ros
e-cr
owne
d fr
uit-
dove
P. r
egin
a D
ec
74
54
32
33
8.8
0.31
g
reen
cat
bird
Ailu
roed
us c
rass
irost
ris
Dec
10
4 77
40
44
9.
1 0.
34
topk
not p
igeo
n Lo
phol
aim
us a
ntar
ctic
us
Tol
73
46
28
42
10
.3
0.36
c
omm
on k
oel E
udyn
amys
sco
lopa
cea
T
ol
25
26
19
6 7.
0 0.
52
cha
nnel
-bill
ed c
ucko
o S
cyth
rops
nov
aeho
lland
iae
T
ol
6 2
3 0
2.0
0.83
L
ewin
’s h
oney
eate
r M
elip
haga
lew
inii
Tol
10
6 89
47
24
6.
7 0.
26
pie
d cu
rraw
ong
Str
eper
a gr
acul
ina
T
ol
50
39
25
18
8.2
0.50
s
atin
bow
erbi
rd P
tilon
orhy
nchu
s vi
olac
eus
Tol
10
6 89
52
48
8.
8 0.
31
figb
ird S
phec
othe
res
virid
is
Inc
74
60
33
22
7.1
0.32
s
ilver
eye
Zos
tero
ps la
tera
lis
Inc
37
39
30
0 4.
5 0.
35
1 Abu
nd. p
atte
rn is
the
abun
danc
e pa
ttern
det
ecte
d fo
r ea
ch b
ird
spec
ies;
Dec
dec
reas
er, T
ol to
lera
nt, I
nc in
crea
ser
(Cha
pter
Tw
o).
2 T
he n
umbe
r of
nat
ive
plan
t spe
cies
that
had
dia
spor
es w
ith a
med
ian
size
of ≥1
0 m
m th
at w
ere
know
n to
be
cons
umed
by
each
fru
givo
re s
peci
es. F
or f
lyin
g-fo
xes,
the
seco
nd
num
ber
(in
brac
kets
) sh
ows
resu
lts
whe
n fr
uits
that
are
too
larg
e to
be
tran
spor
ted
inte
rnal
ly a
re e
xclu
ded.
It w
as c
onsi
dere
d th
at p
lant
spe
cies
wit
h a
med
ian
dias
pore
siz
e up
to 1
8 m
m m
ay b
e tr
ansp
orte
d in
tern
ally
due
to in
tras
peci
fic
vari
atio
n in
fru
it di
men
sion
.
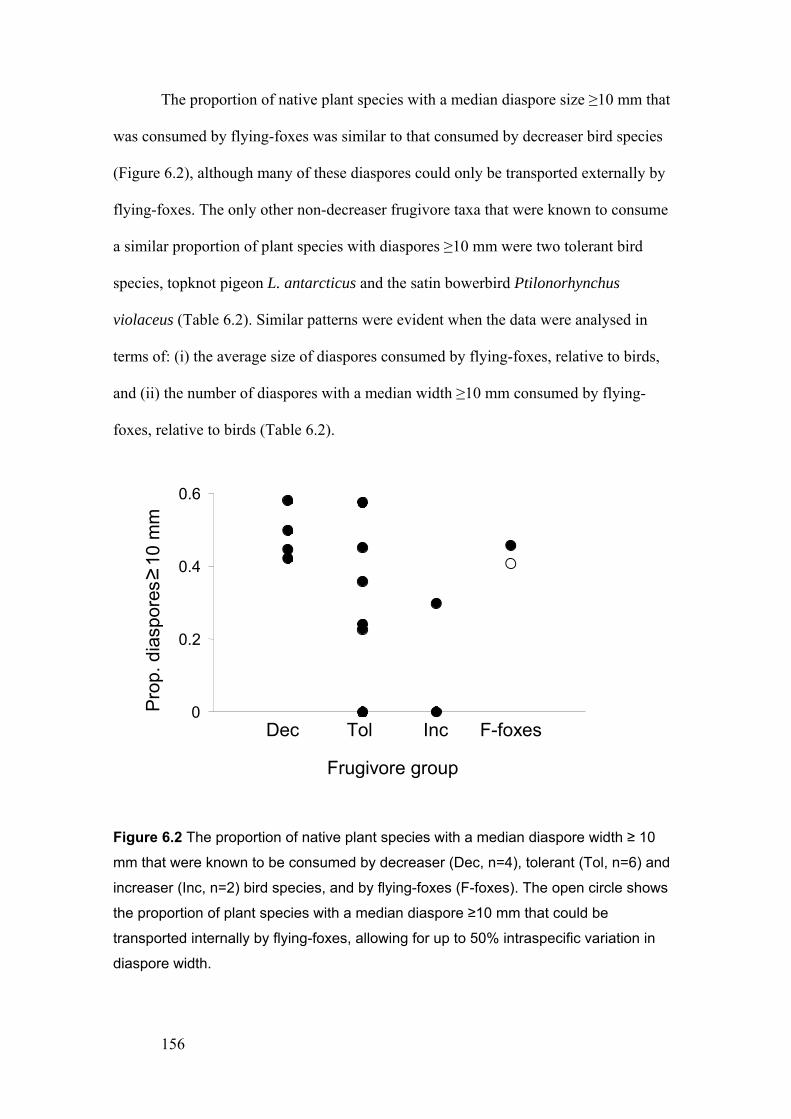
156
The proportion of native plant species with a median diaspore size ≥10 mm that
was consumed by flying-foxes was similar to that consumed by decreaser bird species
(Figure 6.2), although many of these diaspores could only be transported externally by
flying-foxes. The only other non-decreaser frugivore taxa that were known to consume
a similar proportion of plant species with diaspores ≥10 mm were two tolerant bird
species, topknot pigeon L. antarcticus and the satin bowerbird Ptilonorhynchus
violaceus (Table 6.2). Similar patterns were evident when the data were analysed in
terms of: (i) the average size of diaspores consumed by flying-foxes, relative to birds,
and (ii) the number of diaspores with a median width ≥10 mm consumed by flying-
foxes, relative to birds (Table 6.2).
Figure 6.2 The proportion of native plant species with a median diaspore width ≥ 10
mm that were known to be consumed by decreaser (Dec, n=4), tolerant (Tol, n=6) and
increaser (Inc, n=2) bird species, and by flying-foxes (F-foxes). The open circle shows
the proportion of plant species with a median diaspore ≥10 mm that could be
transported internally by flying-foxes, allowing for up to 50% intraspecific variation in
diaspore width.
0
0.2
0.4
0.6
Frugivore group
Pro
p. d
iasp
ores
10
mm
Dec Tol Inc F-foxes
≥

157
Figure 6.3 Classification of frugivore species based on Bray-Curtis dissimilarity metric
using patterns of consumption of native plant species.
Frugivorous bats did not consume a different set of plant species to frugivorous
birds overall; for all of the native plant species known to be consumed by either flying-
foxes or N. robinsoni, at least one of the 12 bird species considered here was also
known to be a consumer. In the multivariate analysis, flying-foxes were not strongly
separated from frugivorous birds based on dietary composition (Figure 6.3). The plant
species that comprised flying-fox diets represented around one-third of the plant species
consumed by most of the frugivorous bird species considered here, including decreaser
bird species (Table 6.3).
silver eye
common koel
channel-billed cukoo
pied currawong
Pteropus
figbird
Lewin's honeyeater
green catbird
satin bowerbird
rose-crowned fruit-dove
wompoo fruit-dove
topknot pigeon
superb fruit-dove
100 80 60 40 20 0
Dissimilarity
silvereyecommon koelchannel-billed cuckoo
pied currawongflying-foxes
figbirdLewin's honeyeatergreen catbirdsatin bowerbirdrose-crowned fruit-dovewompoo fruit-dovetopknot pigeonsuperb fruit-dove
100 80 60 40 20 0
Dissimilarity

158
6.3.4 Potential for frugivorous bat species to substitute for decreaser bird species as
dispersers in fragmented forest
The eastern tube-nosed fruit-bat consumed a very low percentage of the plant
species that were consumed by decreaser bird species. The percentage of plant species
consumed by each decreaser bird species that was known to be consumed by flying-
foxes is shown in Table 6.2; flying-foxes consumed around one-third of the plant
species known from the diets of each decreaser bird species. Neither flying-foxes nor
the eastern tube-nosed bat were known to consume any of the plant species that were
only known from the diets of decreaser species among frugivorous birds (Chapter Five,
Table 5.5). In relation to the plant families that were most frequent in the diets of
decreaser species (and hence predicted to be vulnerable to reduced dispersal in
fragmented rainforest), flying-foxes consumed half of the plant species from Myrtaceae
(10 out of 20). The average number of species from the Myrtaceae consumed by
decreaser bird species was 6.5 (Table 5.2). There were no records of flying-foxes
consuming plants from the Verbenaceae, and they were only known to consume one
species from each Meliaceae (Melia azedarach; out of a total of seven species) and
Lauraceae (Cryptocarya obovata; out of 21 species). Flying-foxes had been recorded
consuming one-third (two out of six) of the plant species from the Vitaceae in the data
set.
6.4 Discussion
6.4.1 The distribution of flying-foxes in fragmented rainforest in the Sunshine Coast
Pteropus poliocephalus and P. alecto are similar in many respects, including
size and reproductive characteristics, communal roosting behaviour (Ratcliffe 1932;
Hall and Richards 2000) and the consumption of both fruit and nectar (Richards and

159
Hall 1998). Because it was not always possible to identify these flying-foxes to species
during surveys for the present work, the two species are henceforth considered
collectively, although it is acknowledged that all comments may not apply equally to
both species. P. scapulatus is not included in subsequent uses of the term ‘flying-foxes’
in the context of the present work.
During surveys for this work, flying-foxes were recorded foraging in most of the
48 sites across all three habitat types. They were not restricted to extensive forest, and
used remnants and regrowth, despite their relatively small size and isolation and any
floristic and structural differences between the site types. The ability of flying-foxes to
use fragmented habitats may be due, in part, to their mobility over large geographic
areas. P. poliocephalus has been recorded travelling tens of kilometres from daytime
roosts to forage in multiple feeding areas (Eby, 1991b; Spencer et al,. 1991). This is in
contrast to the Philippines were large flying-foxes have been reported to have
comparatively restricted foraging ranges (0.4 to 12 km) and apparently avoid disturbed
habitats in agricultural areas (Mildenstein et al., 2005). The capacity of Australian
flying-foxes to routinely traverse large distances would readily enable movement
between most forest patches in the Sunshine Coast, including those that have been
isolated by clearing. Australian flying-foxes also forage in a range of forest types,
including rainforest, eucalypt forests, paperbark and mangrove forests (Ratcliffe, 1932;
Eby, 1995). Their diets are fairly broad and comprise nectar, pollen and fruit from a
range of flowering and fruiting plant species, genera and families (Parry-Jones and
Augee, 1991; Eby, 1998; Southerton et al., 2004). Similarly, generalist patterns of forest
and food resource use by Neotropical phyllostomid bats in Brazil are associated with
higher abundance in fragmented and modified habitats, compared with specialist bat
taxa (Marinho-Filho and Sazima, 1998).
160
During the period of the surveys conducted for the present study, flying-foxes
were recorded in higher frequency and abundance in remnant and especially regrowth
rainforest sites compared with extensively forested areas. Since the distribution of
flying-foxes is known to correspond with localised food availability (Eby, 1991a; Parry-
Jones and Augee, 1992; Palmer et al., 2000), the relatively high numbers observed in
remnants and regrowth probably reflected fruit availability in these sites at this time.
During surveys, most observations of foraging flying-foxes in all three site types were at
native sandpaper figs, especially Ficus coronata. These figs appeared to be especially
common in regrowth sites, and are associated with early stages of rainforest regrowth in
subtropical Australia (Kooyman, 1996).
The capacity to infer general patterns of flying-fox distribution from the survey
conducted for this work is limited. This is due to the combination of a temporally
restricted survey effort, and the potential for the geographic distribution of nomadic
flying-foxes in eastern Australia to vary considerably with the availability of ephemeral
food resources (Nelson, 1965; Parry-Jones and Augee, 1992; Eby, 1995). Many daytime
roost sites are located in small remnants and regrowth vegetation in extensively-cleared
parts of the region (Roberts, 2005) and flying-foxes forage and roost in vegetation in
urban landscapes elsewhere in Australia (Parry-Jones and Augee, 1991; Markus, 2004;
McDonald-Madden et al., 2005)
However, while flying-foxes may make use of fragmented and disturbed
rainforest habitats in the Sunshine Coast, they apparently have not benefited at a
population level from such changes to the landscape. As is the case for Pteropid
populations throughout the Old World tropics (Fujita and Tuttle, 1991), flying-fox
numbers are declining in subtropical Australia (Lunney and Moon, 1997; Eby et al.,
1999; Eby and Lunney, 2002; Dickman and Fleming, 2002). Declines were reported by
the early part of the 20th century as a result of habitat loss and persecution (Ratcliffe,
161
1932). Although they use rainforest, including disturbed habitats, flying-foxes
(particularly P. poliocephalus) appear to depend on nectar resources for at least part of
the year (Ratcliffe, 1932; Eby et al., 1999; Southerton et al., 2004). Hence, clearing of
large tracts of nectar-producing open forests in south-east Queensland (Catterall et al.,
1997) would have removed resources that may be critical for maintaining flying-fox
populations (Eby et al., 1999). Consequently, even a scenario of increased extent of
rainforest regrowth would be unlikely to compensate for the loss of seasonally-
important nectar resources in terms of maintaining flying-fox populations.
Flying-foxes were more abundant in sites associated with a watercourse than in
‘dry’ sites. This may reflect their use of Ficus coronata as a major food resource at the
time of surveys, since these plants tend to occur most abundantly close to water (Floyd,
1989). However, watercourses are also strongly associated with the location of flying-
fox colonial day roosts (‘camps’) in south-east Queensland (Roberts, 2005), and may be
used by flying-foxes to navigate through the landscape (Palmer and Woinarski, 1999).
Hence, flying-fox foraging activity in the Australian subtropics may generally be
concentrated in vegetation along drainage lines, as has been described for P. alecto in
the monsoonal forests of northern Australia (Palmer et al., 2000), for Pteropus spp. in
the Philippines (Mildenstein et al., 2005) and for frugivorous bats in Mexico (Galindo-
González and Sosa, 2003). Although flying-fox camps in south-east Queensland are
mostly restricted to low altitudes (below 120 m a.s.l., Roberts, 2005), foraging is not
confined to lowland rainforest in the Sunshine Coast.
6.4.2 The distribution of the eastern tube-nosed fruit-bat in fragmented rainforest in
the Sunshine Coast
Nyctimene robinsoni was recorded in 13 of the 48 subtropical rainforest sites in
the study region. Previous reports have suggested that the geographical range of N.
162
robinsoni in Australia is mostly tropical, based on infrequent records of this species
from subtropical rainforests (Hall and Richards, 1979; Milledge, 1987; Hall et al.,
1995). However, the surveys conducted for the present study indicate that it may be
more common in subtropical rainforest than previously thought, at least in the study
region.
N. robinsoni was recorded more frequently in extensive and remnant rainforest
than in regrowth sites. In contrast with flying-foxes and the frugivorous bird species that
showed tolerant or increaser abundance patterns (Chapter Two), N. robinsoni depends
on rainforest, mostly consumes fruit, and makes only limited foraging movements
(Spencer and Fleming, 1989; Hall and Richards, 2000). These attributes were also
typical of the frugivorous bird species that were less common in remnants and regrowth
than in extensive forest in the study region. These characteristics were also associated
with the bat species that had restricted distribution in fragmented forests in the neo-
tropics (Cosson et al., 1999). The physical separation of remnants did not prevent their
use by N. robinsoni. The low frequency of this species in regrowth patches may have
been a result of insufficient availability of food plants and the small size of these sites
(see Chapter Two, Section 2.2.2 for description of characteristic floristics of regrowth in
relation to remnants and extensive forest). Given the habitat specialisation of N.
robinsoni, coupled with its apparent preference for mature rainforest rather than
regrowth, rainforest clearing must have substantially reduced the extent of suitable
habitat and is likely to have led to reduced populations of this species.
6.4.3 The potential for seed dispersal by frugivorous bats in remnants and regrowth:
comparison with frugivorous birds
Both N. robinsoni and flying-foxes potentially disperse seeds in fragmented
subtropical rainforest. N. robinsoni probably only disperses a small number of plant
163
species, and may disperse few seeds into or within patches of regrowth. In contrast,
flying-foxes are known to consume at least one-third of the native plant species
consumed by decreaser bird species. Since opportunistic observation of the foraging
patterns of night-feeding flying-foxes would be lower than for diurnal birds, the actual
proportion may be higher than reported here. Hence, flying-foxes have the potential to
at least partially compensate for decreaser bird species with respect to the dispersal of
rainforest plant species. For example, only a few frugivorous bird species,
predominantly decreasers, consume high numbers of native plant species from the
Myrtaceae in subtropical Australia (Chapter Five). However, flying-foxes are also
known to consume many plant species from the Myrtaceae (Eby, 1995; this study) and
may help maintain dispersal of these plants in fragmented parts of the landscape.
In addition to consuming the fruits of a particular plant, the potential of a
frugivore to disperse seeds between fragmented habitats is influenced by its foraging
and ranging behaviour, combined with its gut passage rate (Schupp, 1993; Wenny and
Levey, 1998; Loiselle and Blake, 2002). Flying-foxes may consume fruits within the
source plant and drop the seeds beneath the crown of the parent. Alternatively, flying-
foxes may transport seeds relatively short distances away from parent plants by flying to
a nearby tree to consume harvested fruits, behaviour which may be particularly common
when other foraging flying-foxes are present (Richards, 1990). In addition, P.
poliocephalus may move continually between successive feeding trees, sometimes over
several kilometres, including across cleared land (Eby, 1991b). Hence, flying-foxes
potentially disperse seeds both within and between extensive forest, remnant and
regrowth patches. Many frugivorous bird species also routinely travel across cleared
land between forest areas in subtropical Australia, and may play a similar role in seed
dispersal in fragmented parts of the landscape. However, birds tend to eliminate seeds
while perched (McDonell and Stiles, 1983). In contrast, frugivorous bats may also
164
defecate in flight (Charles-Dominique, 1986), and hence potentially disperse seeds to
cleared areas as well as areas with standing vegetation. Work in West Africa (Thomas,
1982) and Mexico (Medellín and Gaona, 1999; Galindo-González and Sosa, 2003) has
shown that frugivorous bats are responsible for the majority of seed input to cleared
land, while birds make little contribution to seed input in these areas, although the
reverse has been found in the Philippines (Ingle, 2003).
The frugivorous bird species that decline in remnants and regrowth in the
Sunshine Coast consume many large-fruited plant species. Nevertheless, flying-foxes,
along with two tolerant bird species topknot and satin bowerbird, may disperse large-
seeded plant species in fragmented parts of subtropical Australia. However, while
flying-foxes can carry fruits as large as mangoes in their jaws or claws (Ratcliffe, 1932),
they spit out or drop most large seeds close to the parent tree (van der Pijl, 1982; Eby,
1995; McConkey and Drake, 2002; Meehan et al., 2005). Longer distance dispersal may
be restricted to small seeds that can be transported internally in the gut, or possibly
cheek pouches. Indeed, Pteropid fruit bats may potentially disperse some very small
seeds over hundreds of kilometres (Shilton et al., 1999). Hence, although flying-foxes
potentially disperse large seeds a short distance away from the source tree, they may
contribute relatively little to the dispersal of large seeds between distant forest patches
or regenerating areas.
Although flying-foxes do not consume different plant species to frugivorous
birds in subtropical Australia (c.f., Fleming et al., 1987; Richards, 1990; Gorchov et al.,
1995; Hamann and Curio, 1999; Bollen et al., 2004), they potentially have a distinctive
role as dispersers of rainforest plants in deforested parts of the landscape. This is
because of their use of fragmented rainforest, mobility over long distances, ability to
defecate seeds in treeless areas, and consumption of a large number of plant species
from the Myrtaceae.

165
Chapter 7
General discussion: Consequences of forest fragmentation for
frugivores and implcations for seed dispersal
7.1 Summary of the findings of this thesis
This thesis has evaluated consequences of forest fragmentation for fauna and the
potential for impacts on higher order interactions. Specifically, this work has assessed
changes in the abundance and distribution of frugivorous vertebrate species in a
fragmented rainforest landscape and evaluated the functional roles of frugivore species
to make predictions regarding potential changes in the process of seed dispersal in
fragmented rainforest.
The salient findings of each chapter of this thesis are summarised in Table 7.1.
Frugivorous bird and bat species showed varied responses to rainforest fragmentation
(Chapters 2 and 6). The abundance of a subset of frugivorous species was lower in
fragmented compared with extensive rainforest. Frugivorous bird species that declined
in fragmented rainforest habitats shared similar functional traits (Chapter 3). There was
a strong association between functional attributes of frugivores and their actual patterns
of plant species consumption (Chapter 4). A substantial proportion of native rainforest
plant species may be dispersed solely or predominantly by the frugivore species that
declined in fragmented forest landscapes (Chapters 5 and 6). It was predicted that
dispersal of these plant species in fragmented habitats would depend on only a small
subset of frugivore species, and consequently that regeneration of these plants would be
reduced in fragmented forest.

166
Tab
le 7
.1 S
umm
ary
of th
e sc
ope
and
maj
or f
indi
ngs
of th
e co
mpo
nent
stu
dies
rep
orte
d in
the
chap
ters
of
this
thes
is.
Fo
cus
Ke
y fi
nd
ing
s C
hap
ter
2 A
sses
smen
t of
the
abun
danc
e of
frug
ivor
ous
bird
spe
cies
in fr
agm
ente
d an
d ex
tens
ive
fore
st.
For
ty-t
wo
subt
ropi
cal A
ustr
alia
n bi
rd s
peci
es a
re a
t lea
st p
artly
frug
ivor
ous.
Fie
ld s
urve
ys d
ocum
ente
d th
ree
gene
ral
abun
danc
e pa
ttern
s am
ong
the
26 m
ost c
omm
on fr
ugiv
orou
s bi
rd s
peci
es: d
ecre
aser
(ab
unda
nce
low
er in
rem
nant
an
d/or
reg
row
th th
an in
ext
ensi
ve fo
rest
(fiv
e sp
ecie
s), i
ncre
aser
(ab
unda
nce
high
er in
rem
nant
and
/or
regr
owth
than
ex
tens
ive
fore
st (
seve
n sp
p.),
and
tole
rant
(ab
unda
nce
sim
ilar
acro
ss s
ite ty
pes
(14
spp.
)). R
espo
nse
patte
rns
wer
e ge
nera
lly c
onsi
sten
t bet
wee
n se
ason
s. F
urth
erm
ore,
the
abun
danc
e o
f fru
givo
rous
bird
spe
cies
in e
xten
sive
fore
st a
t di
ffere
nt a
ltitu
des
(low
(<
200
m a
.s.l.
), m
ediu
m (
200-
500
m a
.s.l.
) an
d hi
gh (
>50
0 m
a.s
.l.))
did
not
var
y be
twee
n se
ason
s.
C
hap
ter
3 A
sses
smen
t of
the
func
tiona
l rol
es o
f bird
sp
ecie
s an
d po
tent
ial
chan
ges
in s
eed
disp
ersa
l in
frag
men
ted
fore
st.
The
bird
trai
ts p
ropo
sed
to s
tron
gly
influ
ence
a s
peci
es’ s
eed
disp
ersa
l pot
entia
l wer
e ga
pe w
idth
(sm
all,
med
ium
, la
rge)
, fru
givo
ry le
vel (
maj
or, m
ixed
-die
t and
min
or fr
ugiv
ores
) an
d se
ed tr
eatm
ent (
seed
-dis
pers
ers
and
seed
-cr
ushe
rs).
Tes
ts s
how
ed th
at d
ecre
aser
bird
spe
cies
tend
ed to
be
seed
-dis
pers
ing
maj
or fr
ugiv
ores
with
larg
e or
m
ediu
m g
apes
. It w
as p
redi
cted
that
this
wou
ld r
esul
t in
redu
ced
disp
ersa
l of
plan
t spe
cies
with
larg
e fr
uits
and
from
La
urac
eae.
Ch
apte
r 4
Tes
t of t
he
asso
ciat
ion
betw
een
patte
rns
of p
lant
spe
cies
con
sum
ptio
n an
d th
e tr
aits
iden
tifie
d in
C
hapt
er 3
.
The
ave
rage
siz
e of
frui
ts c
onsu
med
by
a bi
rd s
peci
es in
crea
sed
with
gap
e w
idth
, exc
ept f
or m
inor
frug
ivor
es. M
inor
fr
ugiv
ores
con
sum
ed s
mal
l fru
its, i
rres
pect
ive
of th
eir
gape
wid
th. M
ajor
and
mix
ed-d
iet f
rugi
vore
s co
nsum
ed a
hig
her
num
ber
of p
lant
spe
cies
than
min
or fr
ugiv
ores
. The
die
ts o
f min
or fr
ugiv
ores
and
bird
spe
cies
with
sm
all g
apes
mos
tly
com
pris
ed p
lant
spe
cies
from
the
Mor
acea
e an
d E
upho
rbia
ceae
. Am
ong
the
spec
ies
with
gap
es w
ider
than
10
mm
, m
ajor
frug
ivor
es c
onsu
med
the
high
est n
umbe
r of
nat
ive
plan
t spe
cies
from
the
fam
ily L
aura
ceae
, whe
reas
mix
ed-
diet
frug
ivor
es c
onsu
med
the
high
est n
umbe
r of
spe
cies
from
the
Cel
astr
acea
e, M
imos
acea
e, S
apin
dace
ae a
nd
Sm
ilaca
ceae
.
Ch
apte
r 5
Eva
luat
ion
of th
e po
tent
ial f
or c
hang
ed s
eed
disp
ersa
l in
frag
men
ted
rain
fore
st la
ndsc
apes
, usi
ng
info
rmat
ion
on p
atte
rns
of
plan
t spe
cies
con
sum
ptio
n by
frug
ivor
e sp
ecie
s,
toge
ther
with
dat
a on
thei
r re
spon
se to
frag
men
tatio
n (C
hapt
er 2
)
The
re w
as c
onsi
dera
ble
over
lap
in th
e di
et o
f fru
givo
re s
peci
es th
at s
how
ed d
iffer
ent r
espo
nses
to fr
agm
enta
tion.
H
owev
er, t
here
wer
e no
kno
wn
tole
rant
or
incr
ease
r di
sper
sers
for
12%
of t
he n
ativ
e pl
ant s
peci
es in
the
data
set
. T
his
incl
uded
sev
eral
spe
cies
from
the
Rub
iace
ae. I
t was
pre
dict
ed th
at d
ispe
rsal
of t
hese
pla
nt s
peci
es w
ould
be
seve
rely
red
uced
in fr
agm
ente
d ra
info
rest
. In
addi
tion,
dec
reas
ers
cons
umed
the
high
est n
umbe
r of
pla
nt s
peci
es
with
frui
ts ≥
10 m
m in
dia
met
er, a
nd o
f pla
nt s
peci
es fr
om th
e La
urac
eae,
Mel
iace
ae, M
yrta
ceae
, Ver
bena
ceae
and
V
itace
ae. O
nly
a sm
all n
umbe
r of
oth
er b
ird s
peci
es c
onsu
med
sim
ilar
num
bers
of t
hese
pla
nt ta
xa. I
t was
pre
dict
ed
that
dis
pers
al o
f the
se p
lant
s w
ould
be
subs
tant
ially
red
uced
in fr
agm
ente
d ra
info
rest
. Inc
reas
er fr
ugiv
ores
had
lim
ited
pote
ntia
l to
subs
titut
e fo
r de
crea
sers
as
seed
dis
pers
ers
in fr
agm
ente
d fo
rest
.
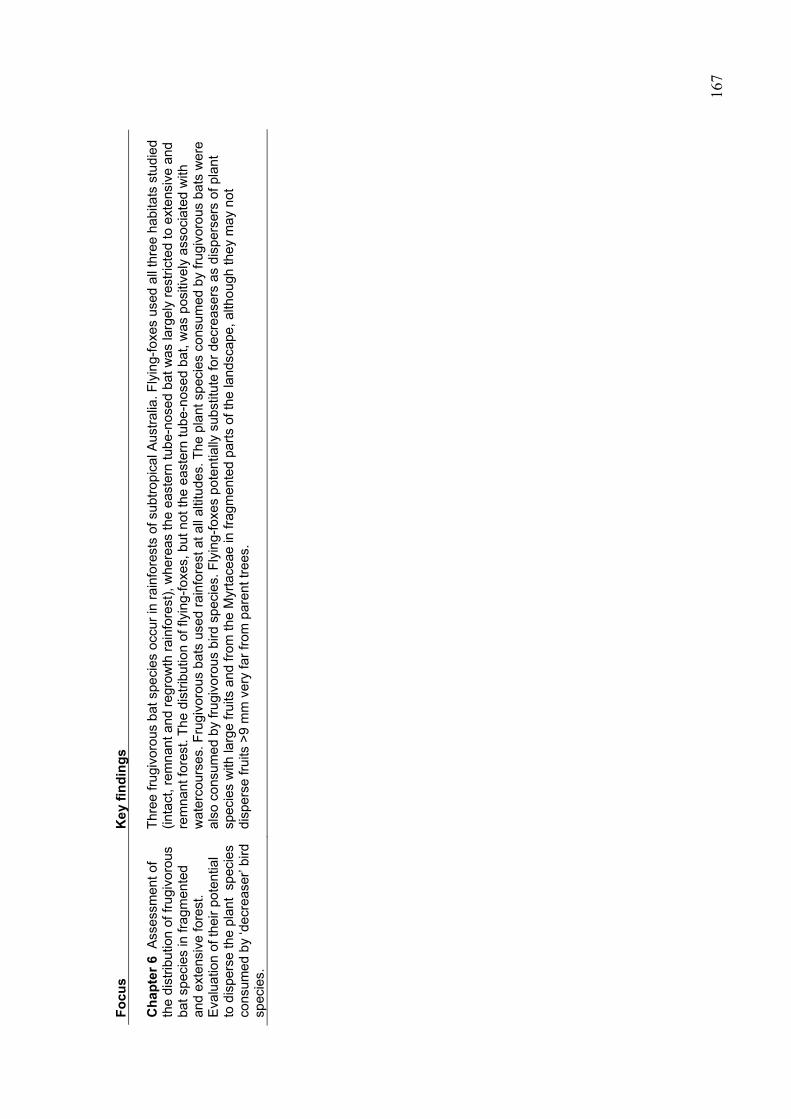
16
7
Fo
cus
Ke
y fi
nd
ing
s C
hap
ter
6 A
sses
smen
t of
the
dist
ribut
ion
of fr
ugiv
orou
s ba
t spe
cies
in fr
agm
ente
d an
d ex
tens
ive
fore
st.
Eva
luat
ion
of th
eir
pote
ntia
l to
dis
pers
e th
e pl
ant
spec
ies
cons
umed
by
‘dec
reas
er’ b
ird
spec
ies.
Thr
ee fr
ugiv
orou
s ba
t spe
cies
occ
ur in
rai
nfor
ests
of s
ubtr
opic
al A
ustr
alia
. Fly
ing-
foxe
s us
ed a
ll th
ree
habi
tats
stu
died
(in
tact
, rem
nant
and
reg
row
th r
ainf
ores
t), w
here
as th
e ea
ster
n tu
be-n
osed
bat
was
larg
ely
rest
ricte
d to
ext
ensi
ve a
nd
rem
nant
fore
st. T
he d
istr
ibut
ion
of fl
ying
-fox
es, b
ut n
ot th
e ea
ster
n tu
be-n
osed
bat
, was
pos
itive
ly a
ssoc
iate
d w
ith
wat
erco
urse
s. F
rugi
voro
us b
ats
used
rai
nfor
est a
t all
altit
udes
. The
pla
nt s
peci
es c
onsu
med
by
frug
ivor
ous
bats
wer
e al
so c
onsu
med
by
frug
ivor
ous
bird
spe
cies
. Fly
ing-
foxe
s po
tent
ially
sub
stitu
te fo
r de
crea
sers
as
disp
erse
rs o
f pla
nt
spec
ies
with
larg
e fr
uits
and
from
the
Myr
tace
ae in
frag
men
ted
part
s of
the
land
scap
e, a
lthou
gh th
ey m
ay n
ot
disp
erse
frui
ts >
9 m
m v
ery
far
from
par
ent t
rees
.

168
7.2 The sensitivity of frugivorous vertebrate species to rainforest
fragmentation in subtropical Australia
There have been no previous assessments of effects of forest fragmentation
across a regional frugivore assemblage in Australia. However, some of the frugivore
species that were evaluated in the present work had been included in other studies of
faunal change in fragmented landscapes. These studies provide an opportunity to asses
whether the species’ response patterns detected in the present study may be consistent
among regions or at different times. The locations of the studies that have been
conducted in Australia are shown in Figure 7.1.
Decreaser species
In the present study, the abundance of five bird species, and the occurrence of
the eastern tube-nosed bat, was lower in fragmented than in extensive rainforest. Three
bird species, all seed-dispersing Columbidae from the genus Ptilinopus (wompoo,
superb and rose-crowned fruit-doves), showed a clear reduction in abundance in
rainforest fragments compared with extensive forest. They were also absent from most
of the isolated regrowth patches surveyed for this study. Similarly, Howe et al. (1981)
only once recorded the wompoo fruit-dove during surveys of small rainforest remnants
in the Dorrigo region, while Warburton (1997) reported that both the wompoo and
superb fruit-doves were relatively uncommon in small remnants in the Wet Tropics. In
contrast, it has been reported that Ptilinopus species are widespread in fragmented
rainforest landscapes in the Big Scrub region (Gosper and Holmes, 2002). It has been
postulated that extensive patches of advanced regrowth dominated by the fleshy-fruited,
introduced species camphor laurel Cinnamomum camphora may facilitate the use of
fragmented rainforest landscapes in the Big Scrub region by these species (Date et al.,
1996; Gosper and Holmes, 2002; Neilan et al., 2006). The present work showed that, in
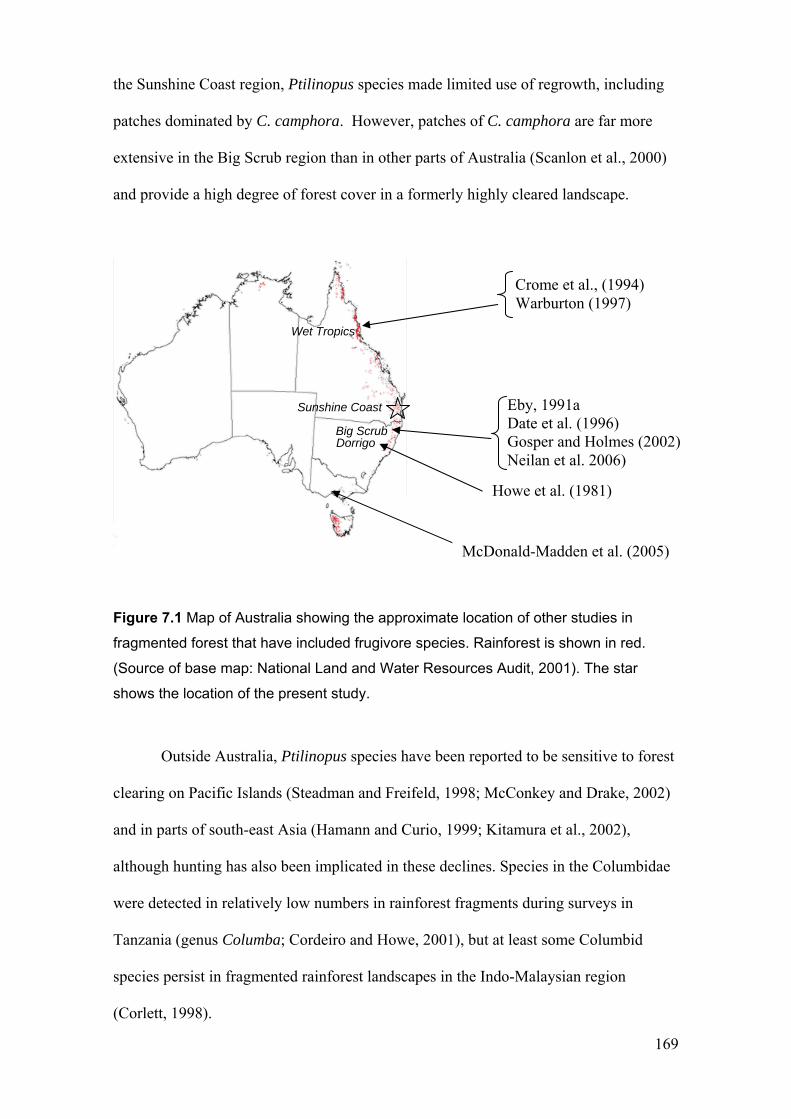
169
the Sunshine Coast region, Ptilinopus species made limited use of regrowth, including
patches dominated by C. camphora. However, patches of C. camphora are far more
extensive in the Big Scrub region than in other parts of Australia (Scanlon et al., 2000)
and provide a high degree of forest cover in a formerly highly cleared landscape.
Figure 7.1 Map of Australia showing the approximate location of other studies in
fragmented forest that have included frugivore species. Rainforest is shown in red.
(Source of base map: National Land and Water Resources Audit, 2001). The star
shows the location of the present study.
Outside Australia, Ptilinopus species have been reported to be sensitive to forest
clearing on Pacific Islands (Steadman and Freifeld, 1998; McConkey and Drake, 2002)
and in parts of south-east Asia (Hamann and Curio, 1999; Kitamura et al., 2002),
although hunting has also been implicated in these declines. Species in the Columbidae
were detected in relatively low numbers in rainforest fragments during surveys in
Tanzania (genus Columba; Cordeiro and Howe, 2001), but at least some Columbid
species persist in fragmented rainforest landscapes in the Indo-Malaysian region
(Corlett, 1998).
Crome et al., (1994) Warburton (1997)
McDonald-Madden et al. (2005)
Eby, 1991a Date et al. (1996) Gosper and Holmes (2002) Neilan et al. 2006)
Howe et al. (1981)
Wet Tropics
Sunshine Coast
Big Scrub Dorrigo
170
In the present study, three frugivore species, the brown cuckoo-dove
(Columbidae), green catbird (Ptilonorhynchidae) and eastern tube-nosed bat
(Pteropidae) had similar numbers in extensive forest and remnants, but much lower
abundance or frequency of occurrence in regrowth. To my knowledge, there have been
no other studies of the eastern tube-nosed fruit-bat in fragmented landscapes. Consistent
with the results of the present study, the frequency of the brown-cuckoo-dove was
similar between remnants and extensive forest in studies in the Big Scrub (Date et al.,
1996) and Wet Tropics (Warburton, 1997). Neilan et al. (2006) reported that the brown
cuckoo-dove was common in regrowth patches adjacent to extensive forest in the Big
Scrub region, but that this species was uncommon in regrowth sites distanced from
extensive forest.
The two other studies of the distribution of the endemic green catbird in
fragmented forest landscapes have reported divergent patterns from those documented
in the present study. The first (Howe et al., 1981) reported very low abundance in
remnants in the Dorrigo region (i.e., greater sensitivity to fragmentation than reported
here), while the second (Neilan et al., 2006) reported high abundance in regrowth
patches in the Big Scrub region (i.e., greater tolerance of fragmentation than detected in
the present study). In the case of the remnants studied by Howe et al. (1981), many sites
may have been too small (0.1-2.5 ha) for this species to maintain a territory (average 2.1
ha; Innis and McEvoy, 1992). The greater resilience of the green catbird in the Big
Scrub region mirrors the trend already described for other decreaser bird species, and
may at least partly be attributed to the more extensive occurrence of advanced regrowth
in that region.
171
Tolerant species
Fifteen vertebrate frugivore taxa (14 bird species and Pteropid flying foxes)
showed similar abundances across extensive, remnant and regrowth in the study region.
Among these tolerant species was the topknot pigeon, the only seed-dispersing
Columbid species that did not decrease in fragmented rainforest in the study region. The
topknot pigeon is also widespread in fragmented landscapes in the Big Scrub region
(Date et al., 1996; Neilan et al., 2006), but its numbers were much lower in small
remnants than in nearby extensive forest in the Dorrigo area (Howe et al., 1981). In the
Wet Tropics, this species occurred only infrequently in remnants smaller than 30 ha
(Warburton, 1997).
In agreement with the classification of the satin bowerbird as tolerant in the
present study, this species occurred in most of the small remnants surveyed in the
Dorrigo region by Howe et al. (1981). However, in the Wet Tropics, Warburton (1997)
reported strongly decreased abundance of the satin bowerbird in remnants smaller than
around 660 ha. However, this species occupies highland rainforest in north Queensland
(Nix and Switzer 1991), and its low incidence in the remnants surveyed by Warburton
may have been the result of the lower altitude of smaller remnants, rather than their
decreased size. The satin bowerbird was uncommon in the regrowth sites surveyed in
the Big Scrub region by Neilan et al. (2006), whereas it may have been expected to be
more widespread if it were tolerant of fragmentation.
Consistent with the present study, the Lewin’s honeyeater and pied currawong
were recorded in all (or almost all) of the remnant and regrowth sites surveyed
respectively by Warburton (1997) and Neilan et al. (2006). The white-headed pigeon,
emerald dove and Australian king-parrot occurred in most of the rainforest remnants
surveyed in the Big Scrub by Date et al. (1996) and/ or in the Wet Tropics by
Warburton (1997). These species, as well as the Australian brush turkey were also
172
frequently recorded in regrowth patches in the Big Scrub region by Neilan et al. (1996).
There have been no other studies of the fragmentation sensitivity of the common koel,
but a congeneric species, Eudynamys cyanocephala, also uses fragmented forest
landscapes in south east Asia (Corlett and Ko, 1995).
Australian flying-foxes are known to range widely in fragmented forest
landscapes (Eby, 1991a; McDonald-Madden et al., 2005). Outside Australia, the
distribution of flying-foxes appears to be limited in fragmented forest landscapes
(Mildenstein et al., 2005), although increased hunting and persecution of flying-foxes
have typically accompanied forest loss and fragmentation in these areas (Cox et al.,
1991; Corlett, 1998; McConkey and Drake, 2002). Use of modified parts of the
Sunshine Coast landscape by flying-foxes may reflect reduced levels of persecution
since 1995 (Eby and Lunney, 2002).
Increaser species
In the present study, the bar-shouldered dove only occurred in remnants and
regrowth sites. Similarly, Date et al. (1996) detected this species in remnants but not in
extensive forest in the Big Scrub. While the figbird was moderately common in the
extensive and remnant forests surveyed for the present study, it was very abundant in
the regrowth sites surveyed. Similarly, this species was common in regrowth in the Big
Scrub region (Neilan et al., 2006), and occurred in the fragments and planted
windbreaks assessed in the Wet Tropics by Crome et al. (1994). In contrast, the
incidence of the figbird was relatively low in the smallest fragments surveyed by
Warburton (1997) in the Wet Tropics. As in the present study, the Torresian crow and
silvereye were common in regrowth in the Big Scrub (Neilan et al., 2006), and the
silvereye was present in rainforest fragments in the Wet Tropics (Crome et al., 1994).

173
White-eyes (Zosteropidae) also appear to be tolerant of forest fragmentation in Asia
(Corlett, 1998).
In summary, frugivore species that were classified as increasers in the present
study have generally also been reported to be widespread in fragmented rainforest
landscapes in other parts of Australia. However, for decreasers and certain tolerant
species, there was considerable variation among studies in the reported consequences of
forest fragmentation. In particular, decreaser species may be more widespread in the Big
Scrub region than in the Sunshine Coast, possibly due to the extent of advanced
regrowth in the former. Although classified as tolerant species in the present study, the
topknot pigeon, satin bowerbird and flying-foxes showed sensitivity to forest
fragmentation in certain studies in other regions.
7.3 Correlates of frugivore species’ sensitivity to rainforest
fragmentation
This thesis has shown large interspecific variation in sensitivity to forest
fragmentation within the broadly defined frugivore guild in subtropical Australia. There
is also variation among frugivore species in their responses to forest fragmentation in
other regions (e.g., Restrepo et al., 1997; Corlett, 1998; Luck and Daily, 2003).
Understanding species’ characteristics associated with different responses to
fragmentation may improve our predictive capacity in relation to the biological
consequences of forest clearing and fragmentation (Henle et al., 2004). Because most
studies of the consequences of forest fragmentation for frugivores have not evaluated
species-specific responses, there is limited understanding of the general profile of a
fragmentation-sensitive frugivore species. Although the present study was not explicitly
deigned to test correlates of susceptibility to fragmentation, the community-wide data
174
set provides an opportunity to assess whether certain factors were clearly correlated
with variation in species’ responses to forest fragmentation.
As proposed by Henle et al. (2004) and reviewed in Chapter One of this thesis
(Section 1.5), a species’ sensitivity to forest fragmentation is likely to be influenced by
combinations of demographic traits (particularly population size and variability,
dispersal power and generation time), and ecological traits (specialised patterns of
microhabitat and matrix use and biogeographical distribution). Specific demographic
data were unavailable for most of the species in the present study, but information on
their ecological traits was generally accessible. Thus, information on body size,
biogeographical position, rarity and patterns of resource use of frugivore species (see
Appendix 3) were evaluated with respect to their sensitivity to rainforest fragmentation
in subtropical Australia.
In summary, of the factors examined, specialised patterns of resource use were
most closely associated with sensitivity to fragmentation (see analyses in Appendix 3).
Specifically, frugivorous bird and bat species that were sensitive to forest fragmentation
were rainforest-dependent fruit-specialists. In contrast, species that used open eucalypt
forest or a variety of forest types, or that consumed fruit as well as other food types
were more likely to be tolerant or to show increased abundance in fragmented
rainforest. This is consistent with results from other regions (Kattan et al., 1994;
Castelletta et al., 2000). For example, bird species that consumed one type of food went
extinct more rapidly in Singapore than species that consumed multiple food types (e.g.,
Castelletta et al., 2000). Rainforest-dependent bird species were also more sensitive to
rainforest fragmentation than species that used a variety of forest types in the Australian
Wet Tropics (Crome et al., 1994; Warburton, 1997). Contrary to findings in other
regions (e.g., Restrepo et al., 1997; Renjifo, 1999), large body size was not associated
with sensitivity to forest fragmentation.
175
An exception to the general profile of fragmentation-sensitive species presented
above may be the topknot pigeon. The topknot pigeon is a rainforest and fruit-specialist
that was classified as tolerant in the present study, although this species has shown
fragmentation sensitivity in some other regions (Howe et al., 1981; Warburton, 1997).
The topknot pigeon differs from the rainforest- and fruit-specialist decreaser species in
its frequent aggregation into large flocks (50 to hundreds of individuals), whereas the
decreaser pigeon species mostly forage alone or in pairs (Frith, 1982; Westcott and
Dennis, 2006). Gregarious foraging behaviour may reduce risk of predation (Pulliam,
1973; Howe, 1979; Watson et al., 2007), and hence increase a species’ willingness to
traverse the non-forest matrix. Thus, the profile of a fragmentation-sensitive frugivore
species may include non-gregarious foraging behaviour, at least in subtropical
Australia.
7.4 Patterns of plant species consumption across the frugivore
assemblage: an alternative model
Frugivory level, gape width and seed treatment were associated with variation
among frugivorous bird species in their patterns of plant species consumption (Chapter
4). In Figure 7.2, I propose a model of the relationships between bird attributes and
major dimensions of dietary variation in subtropical Australian rainforest. To my
knowledge, this has been the first assessment of patterns of plant species consumption
based on information for individual frugivore species across an entire assemblage of
frugivorous rainforest birds. This is also the first community-wide evaluation of
associations among frugivore species’ attributes and their patterns of consumption of a
large number of plant species.
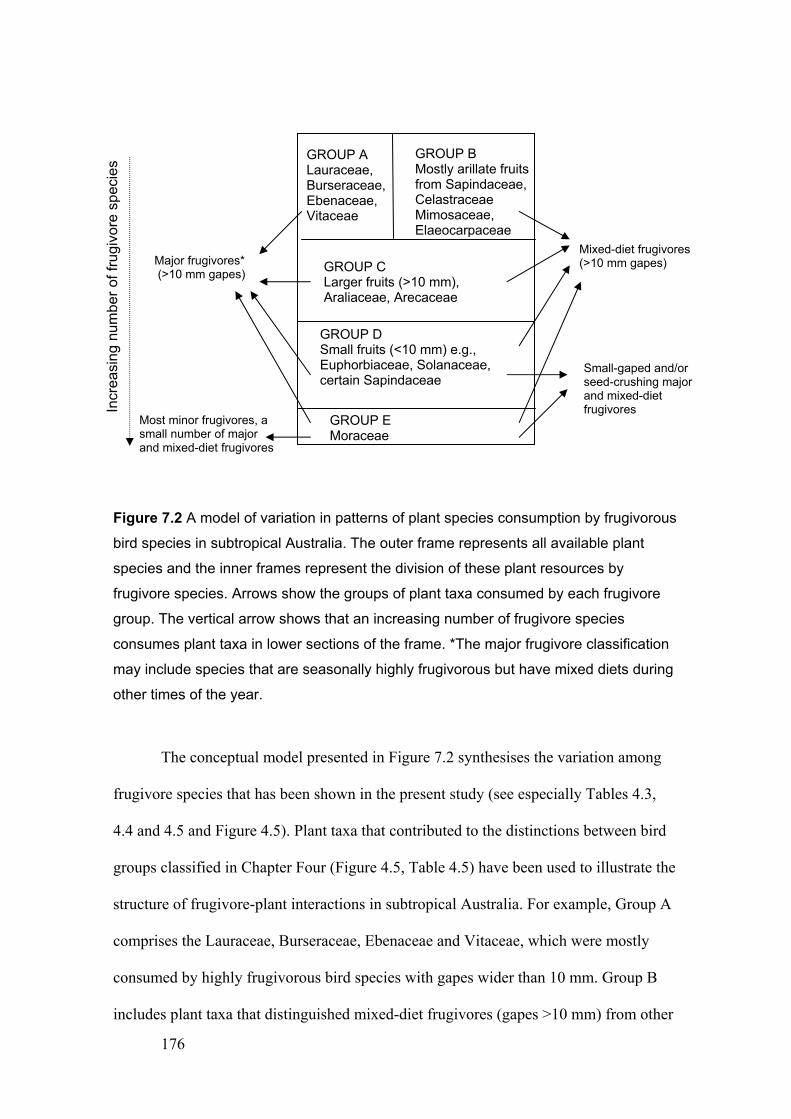
176
Figure 7.2 A model of variation in patterns of plant species consumption by frugivorous
bird species in subtropical Australia. The outer frame represents all available plant
species and the inner frames represent the division of these plant resources by
frugivore species. Arrows show the groups of plant taxa consumed by each frugivore
group. The vertical arrow shows that an increasing number of frugivore species
consumes plant taxa in lower sections of the frame. *The major frugivore classification
may include species that are seasonally highly frugivorous but have mixed diets during
other times of the year.
The conceptual model presented in Figure 7.2 synthesises the variation among
frugivore species that has been shown in the present study (see especially Tables 4.3,
4.4 and 4.5 and Figure 4.5). Plant taxa that contributed to the distinctions between bird
groups classified in Chapter Four (Figure 4.5, Table 4.5) have been used to illustrate the
structure of frugivore-plant interactions in subtropical Australia. For example, Group A
comprises the Lauraceae, Burseraceae, Ebenaceae and Vitaceae, which were mostly
consumed by highly frugivorous bird species with gapes wider than 10 mm. Group B
includes plant taxa that distinguished mixed-diet frugivores (gapes >10 mm) from other
Mixed-diet frugivores (>10 mm gapes)
Major frugivores* (>10 mm gapes)
GROUP C Larger fruits (>10 mm), Araliaceae, Arecaceae
GROUP A Lauraceae, Burseraceae, Ebenaceae, Vitaceae
GROUP B Mostly arillate fruits from Sapindaceae, Celastraceae Mimosaceae, Elaeocarpaceae
Small-gaped and/or seed-crushing major and mixed-diet frugivores
Most minor frugivores, a small number of major and mixed-diet frugivores
GROUP E Moraceae
GROUP D Small fruits (<10 mm) e.g., Euphorbiaceae, Solanaceae, certain Sapindaceae
Incr
easi
ng n
umbe
r of
frug
ivor
e sp
ecie
s
177
bird species; these are mostly arillate fruited species from Sapindaceae, Mimosaceae
and Celastraceae. Plant taxa represented as Group C (Araliaceae, Arecaceae) in Figure
7.2 were consumed by both of these groups of bird species, but generally not by minor
frugivores, bird species with small gapes or by seed-crushing species. Although most
frugivorous bird species consumed Moraceae (Chapter Four, Table 4.3), bird species in
Group D may also consume small-fruited pioneer taxa (e.g., Euphorbiaceae), whereas
the minor and other frugivore species in Group E may have had fig-dominated diets
(Figure 7.2).
Although patterns of plant species consumption across this frugivore community
did not conform neatly to any of the existing models of plant species consumption
(Section 1.2, Figure 1.2), elements of all of these models may describe components of
the model presented in Figure 7.2. For example, certain small fruited plant species
(Group D) and figs (Group E) were consumed by most frugivorous birds, despite
variation among species in their gape width, frugivory level or seed treatment (Figure
7.2). A neutral model of plant-frugivore interactions, as proposed by Burns (2006), may
describe patterns of consumption of these plant species. However, the dichotomous
consumption of plants in Groups A and B by major and mixed-diet frugivores
respectively may more closely resemble the pattern proposed by McKey (1975).
Contrary to initial predictions (McKey, 1975), the differences are not based on strict
lipid or carbohydrate preferences. Furthermore, this dietary distinction was only evident
in a portion of the diets of major and mixed-diet frugivores; species from both groups
consumed several other plant taxa (e.g., Group C in Figure 7.2), despite their different
degrees of frugivory.
It is possible that, for major and mixed-diet frugivores (with gapes wider than 10
mm), plant species in Groups D and E resemble ‘core plant taxa’, while those in Groups
A, B and C are added as they become available, in the manner proposed in the ‘core

178
plant taxa’ model by Fleming (1986). A major characteristic of the ‘core plant taxa’ that
distinguished between groups of Neotropical bat genera was their extended fruit
availability (Fleming, 1986). An analysis of fruiting phenology in subtropical Australian
rainforest showed that several plant in Groups D and E (e.g., Moraceae, Solanaceae and
Euphorbiaceae) fruit over extended periods (Innis, 1989). However, in contrast to
Fleming’s model, major and mixed-diet frugivore species in the present study were
distinguished by their consumption of intermittently-available species (i.e., Groups A
and B), rather than by their consumption of plant species that had longer periods of
availability.
The extent to which the model presented in Figure 7.2 may be consistent in other
regions is not known, although it is based on a much larger amount of data than existing
models of frugivore-plant interactions. However, a functional attribute approach, such
as that used in Chapter Three, could be used to assess potential functional similarity and
variation among frugivore species in many situations where diet information is lacking.
Data on bird species’ body mass may be more accessible than gape width measurements
for species in other regions (e.g., Dunning, 1993). For the bird species included in the
present study, gape width is strongly positively associated with body mass (Figure 7.3).
The gape width of seven bird species was smaller than expected from their body size;
six of these species (encircled) were the seed-crushing Columbidae in the assemblage
(feral pigeon, emerald dove, bar-shouldered dove, brown cuckoo-dove, wonga pigeon
and white-headed pigeon). The seventh species was the Australian brush-turkey, also a
seed-crusher. Seed-crushers may therefore have a larger ratio of body mass to gape
width. The capacity of a bird species to fly with seeds is limited by its body size (Mack,
1993) and non-crushing species may therefore rapidly regurgitate or defecate
indigestible seed ballast (Murray et al., 1993). In contrast, seed-crushing species may
retain seeds for a relatively long time in order to digest them. Therefore, seed-crushers,

179
especially those species that have a diet dominated by the seeds of fleshy-fruited plants
(e.g., brown cuckoo-dove, white-headed pigeon), may require a large body mass. The
channel-billed-cuckoo had a much larger gape than expected from its body size (Figure
7.3). In general, body mass may be useful as a surrogate measure of relative seed size
handling capacity for most bird species, but would over estimate this capacity for seed
crushers. This would not affect predictions if seed crushers were classified in a separate
functional group with limited potential to disperse viable seed, as they were in the
present study.
Log body mass (g)
8765432
Gap
e w
idth
(m
m)
40
30
20
10
0
Figure 7.3 Relationship between bird species’ gape widths and their (ln+1) body mass
(R2 = 0.48, p <0.00001, d.f. = 40; with outliers removed, R2 = 0.83, p <0.00001, d.f. =
32).
7.5 Potential consequences of rainforest fragmentation for seed
dispersal and patterns of plant regeneration
Chapter One introduced the concept of seed dispersal trajectories to highlight the
consequences of the multiple spatial dimensions of seed dispersal for plant regeneration
outcomes (Section 1.6, Figure 1.2, Table 1.1). Incorporating the knowledge developed
in this thesis regarding frugivore species’ responses to forest fragmentation and
channel-billed cuckoo
Australian brush-turkey seed-crushing
Columbidae
180
information regarding their patterns of movement in the landscape, may be used to
asses: (1) the potential for variation among frugivore species in their contribution to the
movement of seeds along certain trajectories; and therefore, (2) whether particular
aspects of plant regeneration may be disproportionately affected by changes in the
frugivore assemblage in fragmented forest.
Dennis and Westcott (2006) developed a classification of frugivorous vertebrate
species in tropical Australia based partly on differences in their spatial scale and rate of
movements and gut passage rates. Table 7.1 combines information from the present
study with that presented by Dennis and Westcott (2006) to examine consequences of
forest fragmentation for seed dispersal in the study region. For example, species that
range widely across the landscape, travel fast and have a slow gut passage rate and use
remnant and regrowth habitats (e.g., topknot pigeon, channel-billed cuckoo, barred
cuckoo-shrike; Table 7.1), may disperse seeds along all trajectories, except over short
distances to microsites within a forest fragment (trajectory b). In contrast, the black-
faced cuckoo-shrike, which predominantly uses regrowth rainforest (Chapter Two),
would be expected to disperse relatively few seeds from or into remnants (trajectories c,
d, e and f). Because decreaser fruit-doves were in very low numbers in fragmented
forest (Chapter Two), they may not disperse seeds along any of the dispersal trajectories
in fragmented forest (Table 7.1). The decreaser green catbird and eastern tube-nosed bat
were considered to have the potential to disperse seeds only along trajectory b (Table
7.1) because, although these species occurred in fragments during the present work
(Chapters Two and Six), the eastern tube-nosed bat makes limited foraging movements
(Spencer and Fleming 1989) and the green catbird is territorial (Innis and McEvoy,
1992). The satin bowerbird potentially disperses seeds along trajectories c, d, f and g if
the distances are short.
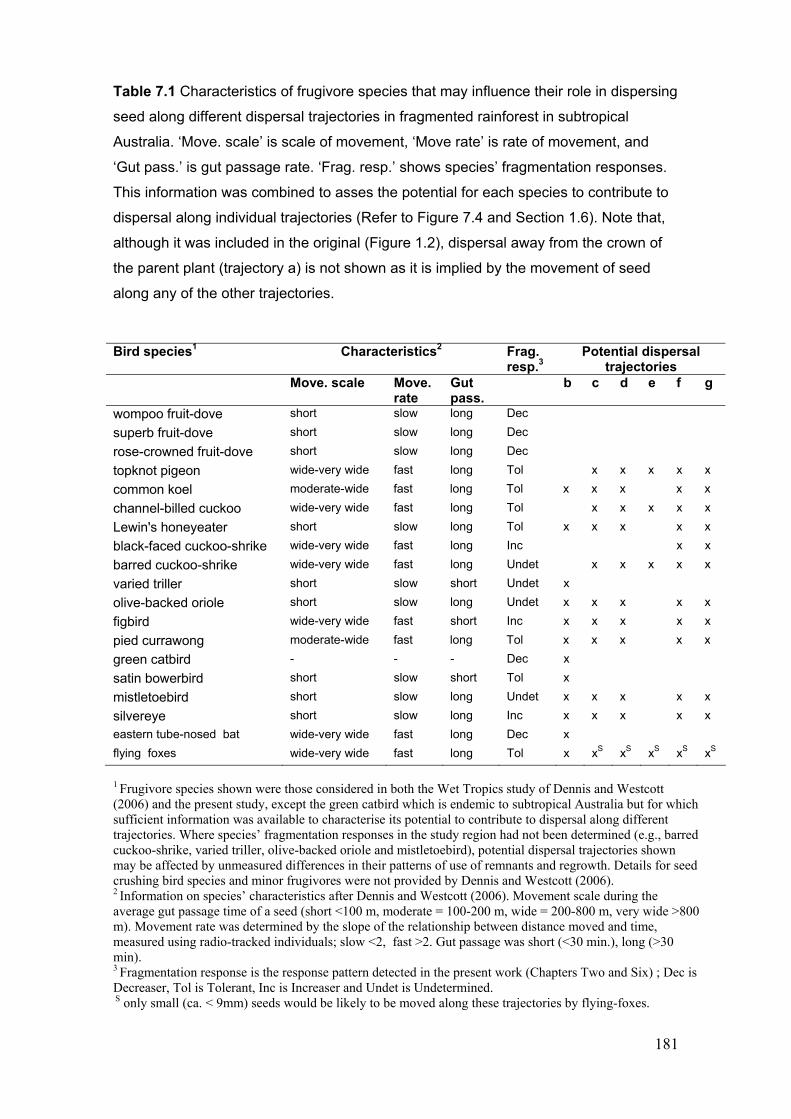
181
Table 7.1 Characteristics of frugivore species that may influence their role in dispersing
seed along different dispersal trajectories in fragmented rainforest in subtropical
Australia. ‘Move. scale’ is scale of movement, ‘Move rate’ is rate of movement, and
‘Gut pass.’ is gut passage rate. ‘Frag. resp.’ shows species’ fragmentation responses.
This information was combined to asses the potential for each species to contribute to
dispersal along individual trajectories (Refer to Figure 7.4 and Section 1.6). Note that,
although it was included in the original (Figure 1.2), dispersal away from the crown of
the parent plant (trajectory a) is not shown as it is implied by the movement of seed
along any of the other trajectories.
Bird species1 Characteristics2 Frag. resp.3
Potential dispersal trajectories
Move. scale Move.rate
Gut pass.
b c d e f g
wompoo fruit-dove short slow long Dec
superb fruit-dove short slow long Dec
rose-crowned fruit-dove short slow long Dec
topknot pigeon wide-very wide fast long Tol x x x x x
common koel moderate-wide fast long Tol x x x x x
channel-billed cuckoo wide-very wide fast long Tol x x x x x
Lewin's honeyeater short slow long Tol x x x x x
black-faced cuckoo-shrike wide-very wide fast long Inc x x
barred cuckoo-shrike wide-very wide fast long Undet x x x x x
varied triller short slow short Undet x
olive-backed oriole short slow long Undet x x x x x
figbird wide-very wide fast short Inc x x x x x
pied currawong moderate-wide fast long Tol x x x x x
green catbird - - - Dec x
satin bowerbird short slow short Tol x
mistletoebird short slow long Undet x x x x x
silvereye short slow long Inc x x x x x
eastern tube-nosed bat wide-very wide fast long Dec x
flying foxes wide-very wide fast long Tol x xS xS xS xS xS
1 Frugivore species shown were those considered in both the Wet Tropics study of Dennis and Westcott (2006) and the present study, except the green catbird which is endemic to subtropical Australia but for which sufficient information was available to characterise its potential to contribute to dispersal along different trajectories. Where species’ fragmentation responses in the study region had not been determined (e.g., barred cuckoo-shrike, varied triller, olive-backed oriole and mistletoebird), potential dispersal trajectories shown may be affected by unmeasured differences in their patterns of use of remnants and regrowth. Details for seed crushing bird species and minor frugivores were not provided by Dennis and Westcott (2006). 2 Information on species’ characteristics after Dennis and Westcott (2006). Movement scale during the average gut passage time of a seed (short <100 m, moderate = 100-200 m, wide = 200-800 m, very wide >800 m). Movement rate was determined by the slope of the relationship between distance moved and time, measured using radio-tracked individuals; slow <2, fast >2. Gut passage was short (<30 min.), long (>30 min). 3 Fragmentation response is the response pattern detected in the present work (Chapters Two and Six) ; Dec is Decreaser, Tol is Tolerant, Inc is Increaser and Undet is Undetermined. S only small (ca. < 9mm) seeds would be likely to be moved along these trajectories by flying-foxes.
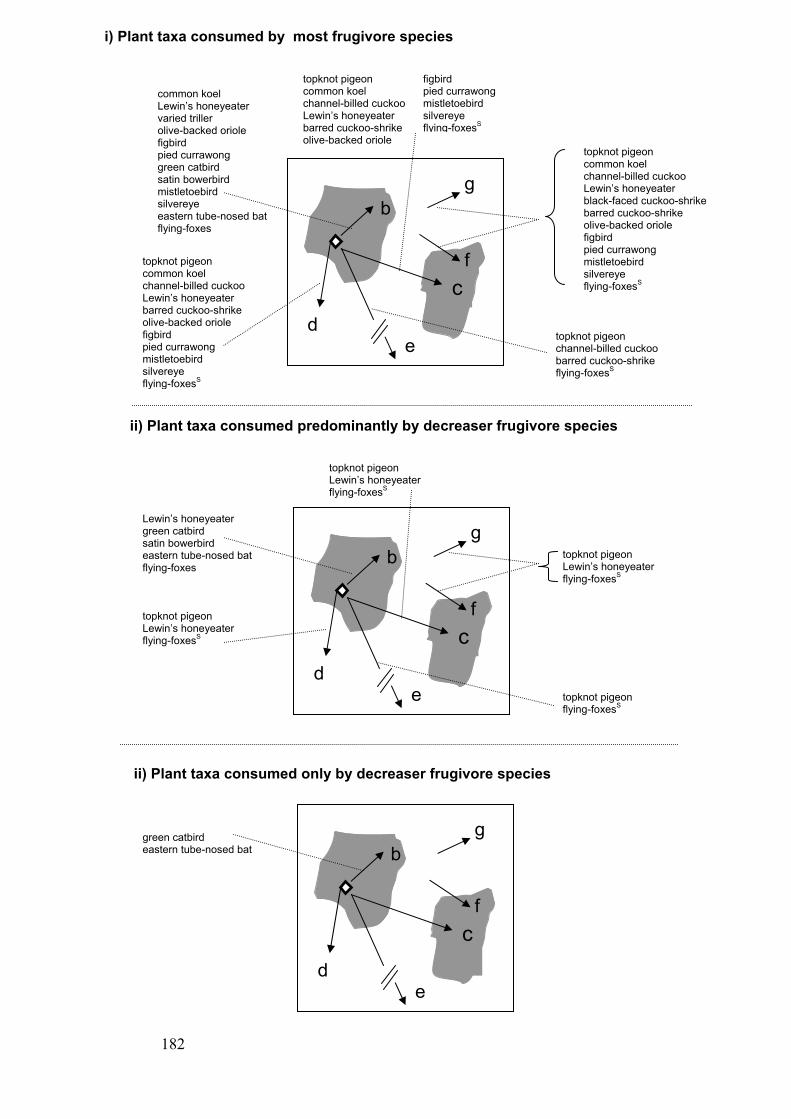
182
i) Plant taxa consumed by most frugivore species
ii) Plant taxa consumed predominantly by decreaser frugivore species
topknot pigeon channel-billed cuckoo barred cuckoo-shrike flying-foxesS
topknot pigeon common koel channel-billed cuckoo Lewin’s honeyeater barred cuckoo-shrike olive-backed oriole figbird pied currawong mistletoebird silvereye flying-foxesS
common koel Lewin’s honeyeater varied triller olive-backed oriole figbird pied currawong green catbird satin bowerbird mistletoebird silvereye eastern tube-nosed bat flying-foxes
topknot pigeon common koel channel-billed cuckoo Lewin’s honeyeater barred cuckoo-shrike olive-backed oriole
c
b
d e
g
f
figbird pied currawong mistletoebird silvereye flying-foxesS
topknot pigeon common koel channel-billed cuckoo Lewin’s honeyeater black-faced cuckoo-shrike barred cuckoo-shrike olive-backed oriole figbird pied currawong mistletoebird silvereye flying-foxesS
topknot pigeon Lewin’s honeyeater flying-foxesS
c
b
d e
g
f
Lewin’s honeyeater green catbird satin bowerbird eastern tube-nosed bat flying-foxes
topknot pigeon Lewin’s honeyeater flying-foxesS
topknot pigeon Lewin’s honeyeater flying-foxesS
topknot pigeon flying-foxesS
ii) Plant taxa consumed only by decreaser frugivore species
c
b
de
g
f
green catbird eastern tube-nosed bat
183
Figure 7.4 (on previous page)The frugivore species that potentially disperse seeds
along different dispersal trajectories in fragmented forest landscapes for plant taxa that
are i) consumed by most frugivore species; ii) predominantly consumed by decreaser
species; and iii) only consumed by decreaser species. The grey patches in this figure
represent forest fragments and the white area represents the cleared or modified
matrix. ‘Decreaser’ frugivore species that occurred in low frequency in rainforest
remnants in this study (all fruit-doves; Chapter 2), are not shown in this figure because
they are likely to disperse few seeds in fragmented forest. Seed-crushing frugivore
species are not shown in this figure because they are likely to disperse few viable
seeds. The white diamond represents an individual plant. Arrows show the trajectories
of seed movement. Table 7.1 shows the characteristics associated with bird species’
potential to disperse seeds along different trajectories. S flying-foxes are likely to
disperse only small seeds (<9 mm) along trajectories involving movement beyond tens
of metres.
Many plant species, including Moraceae, and Euphorbiaceae, are consumed by
most frugivore species (Chapters 4 and 5). Consequently, seeds of these plant taxa are
potentially dispersed by multiple frugivore species along most dispersal trajectories
(Figure 7.4i). However, a relatively small number of frugivore species had the potential
to disperse plant taxa over long distances to new habitats (trajectory e). With the
exception of the topknot pigeon and flying-foxes, these frugivore species had fig-
dominated diets (Chapter Four). Flying-foxes may only disperse small-seeded plant
species along this trajectory (Eby, 1991b, 1995; Shilton et al., 1999). Consequently, the
topknot pigeon may be the main agent of colonisation of new habitats for most plant
taxa. Plant taxa that are not dispersed to new habitats may have a limited ability to cope
with climate change (Primack and Miao, 1992; Matlack, 1995; Westoby and Burgman,
2006; Weir and Corlett, 2007).
There was a suite of plant taxa, including Lauraceae, Myrtaceae, Meliaceae,
Verbenaceae and Vitaceae and plant species with large fruits (>10 mm), that were
predominantly consumed by decreaser frugivores. Analyses of the potential of tolerant
and increaser species to disperse these plants have shown that only a small subset of
184
frugivore species (topknot pigeon, satin bowerbird, Lewin’s honeyeater or flying-foxes)
may be likely to substitute for decreaser frugivore species as dispersers of these plant
taxa in fragmented rainforest (Chapters Five and Six). The decreaser green catbird and
eastern tube-nosed bat potentially disperse seeds within fragments, although the eastern
tube-nosed bat may only consume a small number of these plant species (Chapter Six).
Figure 7.4 (ii) shows that a small number of frugivore species potentially disperse these
plant taxa along each trajectory. Unless these frugivore species increase their feeding
rates on these plant taxa concurrent with the decline of decreaser species (i.e.,
‘behavioural compensation’ (Loiselle and Blake, (2002)), dispersal rates of these plants
would be likely to be reduced in fragmented forest.
In the case of plant taxa that were only known to be consumed by decreaser
frugivore species, which is likely to include several species from the Rubiaceae
(Chapter Five), dispersal along any of the trajectories shown would be severely limited
in fragmented rainforest (Figure 7.4 (iii)). Consequently, regeneration of these plant
taxa would be likely to be substantially reduced in fragmented forest landscapes.
The predicted reductions in dispersal of certain plant taxa may be tested by
comparing observations of fruit removal between fragmented and extensive forest
landscapes. Predictions relating to the consequences of frugivore declines for seed
dispersal along certain trajectories in fragmented rainforest, for example, reductions in
dispersal to recruitment microsites, may be assessed using seed trapping (e.g., Harvey,
2000), or seed tracking techniques (e.g., Levey and Sargent, 2000; Tewksbury et al.,
2002). Dispersal over long distances to new habitats (Figure 7.4, trajectory e) may be
infrequent for most plant species (Nathan and Muller-Landau, 2000), but may be
severely limited in fragmented landscapes for certain plant taxa (e.g., those not
consumed by the topknot pigeon). Differences among plant species in their potential for
185
dispersal over long distances may be inferred by analysing changes in species’
distributions, for example in response to global climatic changes.
Many frugivore species may contribute to the dispersal of seeds from the non-
forest matrix into fragments and within the non-forest matrix (trajectories f and g,
Figure 1.6; Table 7.1). Consequently, high rates of fruit removal from plants in the non-
forest matrix, and seed input from these plants into fragments and secondary regrowth
are expected. Introduced plant species are ubiquitous in most fragmented landscapes
(Buckley et al., 2006) and, depending on the patterns of consumption of plant species by
frugivore species, may be among the plant species with high dispersal rates in
fragmented forest landscapes. Based on their consumption of a relatively high dietary
proportion of introduced plant taxa (Chapter Five, Table 5.1), it is predicted that
increaser bird species would disperse the seeds of introduced plant species. Studies of
fruit removal and seed input (e.g., Guevara and Laborde, 1993; Medellín and Gaona,
1999), and of plant recruitment within fragments (e.g., Janzen, 1983) or in regrowth
(e.g., Neilan et al., 2006) may asses these predictions.
7.6 Conservation issues
This thesis has shown that existing fragmented rainforest in the study region is
likely to have lost a component of the vertebrate frugivorous fauna and, as a
consequence, that the regenerative potential of a substantial proportion of native plant
species may be reduced. Continued clearing and fragmentation of rainforest would be
likely to exacerbate this situation by further disadvantaging decreaser species, and
potentially leading to the decline of additional frugivore species.
All of the decreaser frugivore species identified in this work used at least a
subset of the rainforest remnants surveyed. The specific patterns of use of fragmented
rainforest habitats by these frugivore species may be related to the size and

186
configuration of fragments (Doak et al., 1992; Andrén, 1994; Wiens, 1994; With et al.,
1997; Price et al., 1999; Graham, 2001; Graham and Blake, 2001; Develey and
Metzger, 2006). Identification of factors that influence the distribution of decreaser
frugivore species in fragmented parts of the landscape, such as a threshold fragment size
or degree of connectivity, would highlight the areas of highest conservation value for
these susceptible vertebrate taxa. This understanding could also inform rainforest
restoration actions in terms of the landscape attributes that are necessary to reinstate
populations of decreaser frugivore species in fragmented landscapes. Information
provided in this thesis may be used to identify specific plant resources that would be
useful for decreaser frugivore species. For example, Lauraceae may be important for
fruit-pigeons (Crome, 1975; Innis, 1989; Recher et al., 1995), while strangling figs (e.g.,
Ficus watkinsiana, F. macrophylla) and Elaeocarpus grandis may be important for the
eastern tube-nosed bat.
Based on the secondary consequences of frugivore declines that have been
predicted in this thesis, rainforest restoration would also be necessary to return the
regenerative capacity of several plant taxa in fragmented parts of the landscape. In the
short-term, replanting or direct-seeding of the plant taxa that are vulnerable to reduced
dispersal in fragmented forest could be incorporated into ecological management and
restoration works. In the longer term, ecological restoration that enables the movement
of frugivore species across modified parts of the landscape may facilitate seed dispersal
by frugivores in these habitats (Tucker and Murphy, 1997; Tewksbury et al., 2002;
Martínez-Garza and Howe, 2003; Jansen, 2005).
187
Appendix 1
Original published sources of records of plant species consumption by frugivore
species. The thesis chapters in which data from each source was included are shown
following each reference.
Barker, R.D., Vestjens, W.J.M., 1989. The food of Australian birds: Non-Passerines. C.S.I.R.O., Melbourne. 4, 5, 6
Barker, R.D., Vestjens, W.J.M., 1990. The food of Australian birds: Passerines. C.S.I.R.O., Melbourne. 4, 5, 6
Bedggood, G.W., 1970. Bird notes from East Gippsland. Australian Bird Watcher 3, 252-265. 4, 5, 6
Béland, P., 1977. Mimicry in Orioles of south-eastern Queensland. Emu 77, 215-218. 4, 5, 6
Binns, G. 1954. The camp out at Lake Barrine, Atherton Tableland, North Queensland. Emu 54, 29-46. 4
Bourke, P.A., 1949. The breeding population of a thirty-five acre ‘Timber Paddock’. Emu 49, 73-83. 4, 5, 6
Bravery, J.A., 1970. The birds of Atherton Shire, Queensland. Emu 66, 267-271.4, 5, 6 Brookes, G.B. 1919. Report on investigation in regard to the spread of prickly-pear by
the Scrub Turkey. Q. Ag. J. 11, new series, 26-28. 4 Burton, A.C.G., Morris A.K., 1993. New South Wales Bird Report. Aust. Birds 26, 89-
133. 4, 5, 6 Campbell, A.J., Barnard, H.G., 1917. Birds of the Rockingham Bay district, North
Queensland. Emu 17, 1-12. 4, 5, 6 Carter, T., 1924. Birds of the Broome Hill district. Part III. Emu 23, 306-318. 4, 5, 6 Chisholm, A.H., 1938. The birds of Barellan, N.S.W. with botanical and other notes.
Emu 37, 301-313. 4 Chisholm, A.H., 1944. An interesting old notebook. Emu 43, 281-288. 4, 5, 6 Church R., 1997. Avian frugivory in a subtropical rainforest: Eleven years of
observations in Lamington National Park. The Sunbird 27, 85-97. 4, 5, 6 Cleland, J.B., 1911. Examination of contents of stomachs and crops of Australian birds.
Emu 11, 79-95. 4 Cleland, J.B. Cited in Higgins, P.J. (Ed.), 1999. Handbook of Australian, New Zealand
and Antarctic Birds: V4 Parrots to Dollarbirds. Oxford University Press, Melbourne. 4, 5, 6
Cleland, J.B., Maiden, J.H., Froggatt, W.W., Ferguson, E.W., Musson, C.T., 1918. The food of Australian birds. N.S.W. Department of Agricultural Science Bulletin No. 15. 4, 5, 6
Cooper, R.P., 1962. A revision of the distribution of the Brown Pigeon. Emu 61, 266-269. 4
Cooper, R.M., Knight, B., 1989. New South Wales Bird Report for 1985 Aust. Birds 22, 1-45.
Cooper W., Cooper, W.T., 1994. Fruits of the rain forest: A guide to fruits in Australian tropical rain forests. Geo Production, Chatswood. 4, 5, 6
Crome, F.H.J., 1975a. The ecology of fruit pigeons in tropical northern Queensland. Aust. Wildl. Res. 2, 155-185. 4, 5, 6
188
Crome, F.H.J., 1975b. Breeding, feeding and status of the Torres Strait Pigeon at Low Isles, north Queensland. Emu 75,189-98. 4, 5, 6
Crome, F.H.J., 1978. Foraging ecology of an assemblage of birds in lowland rainforest in northern Queensland. Aust. J. Ecol. 3, 195-212. 4, 5, 6
Crome F.H.J., Shields J., 1992. Parrots and Pigeons of Australia. Angus & Robertson, Pymble. 4, 5, 6
Crouther, M.M., 1985. Some breeding records of the common koel Eudynamis scolopacea. Australian Bird Watcher 11, 49-56. 4, 5, 6
Date, E.M, Recher, H.F., 1990. Ecology and Management of Rainforest Pigeons in NSW – An interim report. NSW NPWS, Sydney. 4, 5, 6
Denny, T., Dudman, D., 1979. Koel behaviour. Sunbird 10,78.4, 5, 6 De Warren, J.J., 1928. The avifauna of the upper reaches of the Macleay River, NSW.
Emu 28,11-120. 4, 5, 6 Drew, R.A.I., 1987. Reduction in fruit fly (Tephritidae: Dacinae) populations in their
endemic rainforest habitat by frugivorous vertebrates. Aust. J. Zool. 35, 283-8. 4, 5, 6
Eby, P. ,1991 “Finger-winged night workers”: managing forests to conserve the role of Grey-headed Flying Foxes as pollinators and seed dispersers. pp. 91-100 in (D. Lunney (ed.)) Conservation of Australia’s Forest Fauna. Royal Zoological Society of NSW, Mosman. 6
Eby, P., 1995. The biology and management of flying foxes in New South Wales. Species Management Report No. 18. New South Wales National Parks and Wildlife Service, Hurstville. 6
Eby, P. 1998. An analysis of diet specialisation in frugivorous Pteropus poliocephalus (Megachiroptera) in Australian subtropical rainforest. Aust. J. Ecol. 23, 443-456. 6
Firth, D.J., 1979. Ecology of Cinnamomum camphora (l.) Nees and Eberm (camphor laurel) in the Richmond-Tweed region of north-eastern New South Wales. Unpublished thesis, Department of Botany, University of New England, Armidale. 4, 5
Floyd, A.G., 1989. Rainforest trees of mainland south-eastern Australia. Forestry Commission of New South Wales, Sydney. 4, 5, 6
Floyd, A.G., 1990. Australian Rainforests in New South Wales. Volume 1. Surrey Beatty & Sons, Chipping Norton. 4, 5, 6
Forde, N., 1986. Relationships between birds and fruits in temperate Australia. in Ford, H.A., Paton, D.C. (Eds.), The dynamic partnership: Birds and plants in southern Australia. D.J. Woolman, Government Printers, Adelaide, pp. 42-58. 4, 5, 6
Forshaw, J.M., 1969. Australian Parrots. Landsdowne Press, Melbourne. 4 Forshaw, J.M., Muller, K.A., 1978. Annotated list of birds observed at Iron Range,
Cape York Peninsula, Queensland, during October 1974. Aust. Bird Watcher 7, 171-194. 4, 5, 6
Forshaw, J.M., Cooper, W.T. (1981) Australian Parrots. Second edition. Landsdowne Editions, Melbourne. 4
French, K., 1990. Evidence for frugivory by birds in montane and lowland forests in South-east Australia. Emu 90,185-189. 4, 5, 6
Frith, H.J., 1952. Notes on the pigeons of the Richmond River. Emu 52,89-99. 4, 5, 6 Frith H.J., 1957. Food habits of the Topknot Pigeon. Emu 57, 341-345. 4, 5, 6 Frith H.J., 1982. Pigeons and doves of Australia. Rigby Publishers, Adelaide. 4, 5, 6 Frith, H.J., Crome, F.H.J., Wolfe, T.O., 1976. Food of fruit-pigeons in New Guinea.
Emu 76, 49-58. 4, 5, 6 Frith, C.B., Frith, D.W., 2004. Bird Families of the World: The Bowerbirds
Ptilonorhynchidae. Oxford University Press: Oxford. 4, 5, 6
189
Gannon, G.R., 1936. Plants spread by the Silvereye. Emu 35, 314-316. 4, 5, 6 Gibson, J.D., 1977. The birds of the County of Camden (including the Illawarra
district). Aust. Birds 11, 41-80. 4, 5, 6 Gilbert, P.A., 1936. The Topknot Pigeon. Emu 35, 301-312. 4, 5, 6 Gosper, C.R., 1994. Comparison of the avifauna of rainforest remnants with regrowth
dominated by the exotic tree camphor laurel Cinnamomum camphora. Unpublished thesis, University of New England, Armidale. 4, 5, 6
Gosper, C.R., 1999. Plant food resources of birds in coastal dune communities in New South Wales. Corella 2, 53-62. 4, 5, 6
Gosper, D.G., cited in Higgins, P.J. (Ed.), 1999. Handbook of Australian, New Zealand and Antarctic Birds: V4 Parrots to Dollarbirds. Oxford University Press, Melbourne. 4, 5, 6
Gosper, D.G., 1962. Breeding records of the koel. Aust. Bird Watcher 1, 226-228. 4, 5, 6
Gould, J., 1865. Handbook to the Birds of Australia. 2 volumes. J. Gould, London. 4, 5, 6
Green R.J., 1993. Avian seed dispersal in and near subtropical rainforests. Wildl. Res. 20, 535-557. 4, 5, 6
Hackett, D., 1996. Frugivory and Ligustrum lucidum in north-eastern NSW: Implications for seed dispersal and avifauna conservation. Integrated project, Southern Cross University, Lismore. 4, 5, 6
Hall, L.S., Richards, G. 2000. Flying foxes: Fruit and blossom bats of Australia. UNSW Press: Sydney. 6
Halse, S.A., 1978. Feeding habits of six species of honeyeaters in south-western Australia. Emu 78, 145-148. 4, 5, 6
Hindwood, K.A., 1959. The Purple-crowned Pigeon in southeastern Australia. Emu 59, 219-20. 4, 5, 6
Hindwood, K.A., 1970. The Regent Bowerbird near Sydney. Birds (Sydney) 5, 21-24. 4, 5, 6
Holland, L., 1964. Pigeons of the Woolgoolga District, N.S.W. Aust. Bird Watcher 2, 61-69. 4, 5, 6
Holmes, G., 1987. Avifauna of the Big Scrub region. Report prepared for the Australian National Parks and Wildlife Service & NSW National Parks and Wildlife Service, Sydney. 4, 5, 6
Holmes, G., 1990. Biology and Ecology of Coxen's Fig-parrot. Royal Australasian Ornithologists Union, Report 65. 4, 5, 6
Holmes, G., cited in Higgins, P.J. (Ed.), 1999. Handbook of Australian, New Zealand and Antarctic Birds: V4 Parrots to Dollarbirds. Oxford University Press, Melbourne. 4, 5, 6
Hoskin, E., 1991. Birds of Sydney 1770-1989. Surrey Beatty and Sons: Sydney. 4, 5, 6 Howe, F.E., 1928. Notes on some Victorian birds. Emu 27, 252-265. 4, 5, 6 Innis, G.J., 1989. Feeding ecology of fruit pigeons in subtropical rainforests of south-
eastern Queensland. Aust. Wildl. Res. 16, 365-94. 4, 5, 6 Innis, G.J., McEvoy, J., 1992. Feeding ecology of green catbirds (Ailuroedus
crassirostris) in subtropical rainforests of south-eastern Queensland. Wildl. Res. 19, 317-29. 4, 5, 6
Jarvis, H., 1929. Feeding habits of some Queensland birds. Q. Agric. J. 32, 8-12. 4, 5, 6 Jenkins, C.F.H., 1968. Notes on the feeding habits of some West Australian birds. W.
A. Nat. 11, 52-55. 4 Johncock, C.F., 1903. Notes on Loranthus exocarpi. Trans. R. Soc. S. Aust. 27, 253-
255. 4, 5

190
Johnstone, R.E., Burbidge, A.H., 1991. The avifauna of Kimberley rainforests, in McKenzie, N.L., Johnstone, R.B., Kendrick, P.G. (Eds.) Kimberley Rainforests in Australia. Surrey Beatty, Sydney, pp.361-395. 4, 5, 6
Keast, A., 1958. The influence of ecology on variation in the Mistletoebird (Dicaeum hirundinaceum). Emu 58, 195-206. 4
Keast, A., 1968. Seasonal movements in Australian honeyeaters (Meliphagidae) and their ecological significance. Emu 67, 159-209. 4, 5
Knight, B.J., 1970. A popular native. Bird Observer 462, 4-5. 4 Lea, A.M. and Gray, J.T. (1935b). The food of Australian Birds. Part II. Emu 35,
63-98. Lea, A.M., Gray, J.T., 1936. The food of Australian Birds. Part IV. Emu 35, 251-280. 4,
5, 6 Leach, G.J., Hines, H.B., 1987. Birds of the Marburg District, South-East Queensland.
Sunbird 17, 65-95. 4, 5 Lenz, N.H.G., 1993. Behavioural and reproductive biology of the regent bowerbird
Sericulus chrysocephalus (Lewin, 1808). PhD Thesis, Griffith University, Nathan. 4, 5, 6
Lepschi, B.J., 1997. Food of some birds in southern Australia: Additions to Barker and Vestjens, Part 2. Emu 97, 84-87. 4, 6
Liddy, J., 1985. A note on the associations of birds and Lantana near Beerburrum, south-eastern Queensland. Corella 9, 125-126. 4, 5
Lindsey, T.R., 1984. New South Wales Bird Report for 1982. Aust. Birds 18, 37-69. 4, 5, 6
Lindsey, T.R., 1985. New South Wales Bird Report for 1983. Aust. Birds 19, 65-100. 4, 5
Lord, E.A.R., 1943. Migratory notes (1941 – 1942). Emu 43, 18-23. 4, 5, 6 Lord, E.A.R., 1956. Birds of the Murphy’s Creek district, Queensland. Emu 56, 100-
128. 4, 5, 6 Makin, D., 1969. Birds of Sandy Cape, Fraser Island. Q. Nat. 19, 31-42. 4, 5 Male, T.D. Roberts, G.E., 2002. Defence of fruiting trees by birds in an Australian
forest. Biotropica 34, 172-6. 4, 5, 6 Mannes, E., 1976. Brown Pigeon observations. N.S.W. Field Ornithology Club
Newsletter 16, 3. 4, 5, 6 Marshall, A.J., 1935. On the birds of the McPherson Ranges, Mt. Warning and
contiguous lowlands. Emu 35, 36-48. 4, 5 Marshall, A.J., 1964. Southern Figbird near Bass Strait. Emu 63, 339. 4, 5, 6 Mees, G.F., 1969. A systematic review of the Indo-Australian Zosteropidae. III.
Zoologische Verhandelingen 102, 1-390. 4, 5, 6 Morris, J.G., 1969. The control of feral pigeons and sparrows associated with intensive
animal production. Aust. J. Sc. 32, 9-15. Morris, A.K., 1975. The birds of Gosford, Wyong, and Newcastle (County of
Cumberland). Aust. Birds 9, 37-76. 4, 5, 6 North cited in Higgins, P.J., (Ed.), 1999. Handbook of Australian, New Zealand and
Antarctic Birds: V4 Parrots to Dollarbirds. Oxford University Press, Melbourne. 4, 5, 6
North cited in Marchant, S., Higgins, P.J., (Eds.), 1993. Handbook of Australian, New Zealand and Antarctic Birds: V2 Raptors to Lapwings. Oxford University Press, Melbourne. 4, 5, 6
Norton, J., 1897. Magpies (Black and Grey). Agric. Gazette of N.S.W. 8, 535-537. 4, 5, 6

191
Panetta, F.D., Sparkes, E.C., 2001. Reinvasion of a riparian forest community by an animal-dispersed tree weed following control measures. Biological Invasions 3:75-88. 4, 5, 6
Parry-Jones, K., Augee, M.L. 1991. Food selection by Grey-headed Flying-foxes (Pteropus poliocephalus) occupying a summer colony site near Gosford, New South Wales. Aust. Wildl. Res. 18,111-124. 6
Parry-Jones, K., Augee, M.L., 2001. Factors affecting the occupation of a colony site in Sydney, New South Wales by the Grey-headed Flying-Fox Pteropus poliocephalus (Pteropidae). Aust. Ecol. 26, 47-55. 6
Paton, D.C., 1986. Honeyeaters and their plants in southeastern Australia, in Ford, H.A., Paton, D.C., (Eds.), The dynamic partnership: Birds and plants in southern Australia. D.J. Woolman, Government Printers, Adelaide, pp. 9-19. 4, 5
Perkins, D.L., 1973. Some observations from Fraser Island. Sunbird 4, 40-41.4, 5, 6 Ratcliffe, F., 1932. Notes on the fruit bats (Pteropus spp.) of Australia. J. An. Ecol. 1,
32-57. 6 Recher, H.F., Date, E.M., Ford, H.A., 1995. The biology and management of rainforest
pigeons in N.S.W.. N.S.W. National Parks and Wildlife Species Management Report No. 16. 4, 5, 6
Reid, N., 1986. Pollination and seed dispersal of mistletoes (Loranthaceae) by birds in southern Australia in Ford, H.A., Paton, D.C., (Eds.), The dynamic partnership: Birds and plants in southern Australia. D.J. Woolman, Government Printers, Adelaide, pp. 64-84. 4, 5, 6
Richards, G.C. 1990. The Spectacled flying-fox, Pteropus conspicillatus, in North Queensland: Part 2, Diet, feeding ecology and seed dispersal. Aust. Mamm. 13:25-31. 6
Roberts, G.J., Ingram, G.J., 1976. An annotated list of the land birds of Cooloola. Sunbird 7, 1-20. 4, 5, 6
Rogers, J., 1998. A coastal walk. Bird Observer 789, 10-11. 4 Rose, A.B., 1973. Food of some Australian birds. Emu 73, 177-183. 4, 5, 6 Rose, A.B., 1997. Notes on the diet of cuckoos in New South Wales. Australian Bird
Watcher 17: 130-133. Aust. Bird Watcher 17, 134-137. 4, 5, 6 Rose, A.B., 1999. Notes on the non-nectar foods of some honeyeaters in eastern New
South Wales. Aust. Bird Watcher 18, 26-34. 4, 5, 6 Rowley, I., Vestjens, W.J.M., 1969. The comparative ecology of Australian corvids. V.
Food. C.S.I.R.O. Wildl. Res. 18, 131-155. 4, 5, 6 Saunders, T., cited in Higgins, P.J., Davies, S.J.J.F., (Eds.), 1996. Handbook of
Australian, New Zealand and Antarctic Birds: V3 Snipe to Pigeons. Oxford University Press, Melbourne. 4, 5, 6
Scanlon, T., the Camphor Laurel Taskforce, 2001. Camphor Laurel Kit: Everything you need to know about camphor laurel and its control. North Coast Weed Advisory Committee, Grafton, NSW http://www.fncw.nsw.gov.au/camphor_kit.html 4, 5, 6
Shanks, D.. 1949. Observations from the Upper King River district, Victoria. Emu 49, 132-141. 4 Smith, L., 1984. Garden plants attractive to birds. Aust. Birds 18, 17-32. 4, 5, 6 Spencer, H.J., Fleming, T.H. 1989. Roosting and Foraging Behaviour of the Queensland
Tube-nosed Bat, Nyctimene robinsoni (Pteropidae): Preliminary Radio-tracking Observations. Aust. Wildl. Res. 16:413-420. 6
Stansbury, C.D., Vivian-Smith, G., 2003. Interactions between frugivorous birds and weeds in Queensland as determined from a survey of birders. Plant Prot. Quart. 18, 157-165. 4, 5, 6
192
Storr, G.M., 1953. Birds of the Cooktown and Laura districts, north Queensland. Emu 53, 225-248. 4, 5, 6
Vestjens, W.J.M., Carrick, R., 1974. Food of the Black-backed Magpie, Gymnorhina tibicen, at Canberra. Aust. Wildl. Res. 1, 71-83. 4, 5
Waterhouse cited in Higgins, P.J., Davies, S.J.J.F., (Eds.), 1996. Handbook of Australian, New Zealand and Antarctic Birds: V3 Snipe to Pigeons. Oxford University Press, Melbourne. 4, 5, 6
Waterhouse, R.D., 1995. Observations on the diet of the Lewin's Honeyeater Meliphaga lewinii in the Illawarra Rainforest, New South Wales. Corella 19, 102-105. 4, 5, 6
Wheeler, W.R., 1967. The birds of Cairns, Cooktown and the Atherton Tablelands. Aust. Bird Watcher 3, 55-76. 4, 5, 6
Wheeler, W.R., 1972. Bird notes 1970-71. Bird Obs. 484, 4-8. 4, 5, 6

193
Appendix 2
List of plant species used in the data sets analysed in Chapters Four, Five and
Six and the total number of frugivorous bird and bat species (data for Pteropus alecto
and P. poliocephalus combined) known to consume each plant species.
Thesis Chapter Family Genus Species 4 5 6 Total number
frugivore species
Agavaceae Cordyline petiolaris 4 5 6 2 Agavaceae Cordyline rubra 5 6 1 Agavaceae Cordyline stricta 5 6 1 Akaniaceae Akania bidwillii 4 5 6 4 Alangiaceae Alangium villosum 4 5 6 5 Anacardiaceae Euroschinus falcata 4 5 6 14 Anacardiaceae Rhodosphaera rhodanthema 4 5 6 1 Annonaceae Melodorum leichhardtii 4 5 6 2 Annonaceae Polyalthia nitidissima 4 5 6 1 Apocynaceae Carissa ovata 4 5 6 2 Apocynaceae Melodinus australis 4 5 6 4 Araceae Alocasia brisbanensis 4 5 6 1 Araceae Pothos longipes 4 5 6 5 Araliaceae Cephalaralia cephalobotrys 5 6 1 Araliaceae Polyscias elegans 4 5 6 18 Araliaceae Polyscias murrayi 4 5 6 15 Araliaceae Polyscias sambucifolia 4 5 6 1 Arecaceae Archontophoenix cunninghamia 4 5 6 18 Arecaceae Calamus muelleri 4 5 6 3 Arecaceae Linospadix monostachya 4 5 6 3 Arecaceae Livistonia australis 5 6 7 Arecaceae Ptychosperma elegans 4 5 6 1 Boraginaceae Ehretia acuminata 4 5 6 15 Burseraceae Canarium australasicum 4 5 6 9 Caprifoliaceae Sambucus australasica 4 5 6 2 Celastraceae Celastrus subspicata 4 5 6 4 Celastraceae Maytenus bilocularis 4 5 6 1 Celastraceae Maytenus cunninghamii 4 5 6 1 Celastraceae Siphonodon australis 5 6 2 Chenopodiaceae Enchylaena tomentosa 4 5 6 1 Cucurbitaceae Diplocyclos palmatus 5 6 4 Cucurbitaceae Sicyos australis 5 6 1 Cucurbitaceae Zehneria cunninghamii 4 5 6 2 Cunoniaceae Schizomeria ovata 4 5 6 7 Dilleniaceae Hibbertia scandens 4 5 6 6 Ebenaceae Diospyros australis 4 5 6 3 Ebenaceae Diospyros fasciculosa 4 5 6 3 Ebenaceae Diospyros geminata 4 5 6 6 Ebenaceae Diospyros pentamera 4 5 6 12 Elaeagnaceae Elaeagnus triflora 4 5 6 1 Elaeocarpaceae Elaeocarpus grandis 4 5 6 8 Elaeocarpaceae Elaeocarpus kirtonii 4 5 6 9 Elaeocarpaceae Elaeocarpus obovatus 4 5 6 15 Elaeocarpaceae Elaeocarpus reticulatus 4 5 6 11 Elaeocarpaceae Sloanea australis 4 5 6 8 Elaeocarpaceae Sloanea woollsii 4 5 6 11 Epacridaceae Leucopogon parviflorus 4 5 6 1 Epacridaceae Monotoca elliptica 4 5 6 2 Epacridaceae Trochocarpa laurina 4 5 6 3 Euphorbiaceae Actephila lindleyi 5 6 1 Euphorbiaceae Breynia oblongifolia 4 5 6 4 Euphorbiaceae Claoxylon australe 4 5 6 3 Euphorbiaceae Cleistanthus cunninghamii 5 6 3 Euphorbiaceae Drypetes deplanchei 4 5 6 7

194
Thesis Chapter Family Genus Species 4 5 6 Total number
frugivore species
Euphorbiaceae Flueggea leucopyrus 5 6 1 Euphorbiaceae Glochidion ferdinandi 4 5 6 12 Euphorbiaceae Glochidion sumatranum 4 5 6 4 Euphorbiaceae Macaranga tanarius 4 5 6 7 Euphorbiaceae Mallotus discolor 4 5 6 7 Euphorbiaceae Omalanthus nutans 4 5 6 15 Eupomatiaceae Eupomatia laurina 4 5 6 1 Eupomatiaceae Galbulimima belgraveana 4 5 6 4 Flacourtiaceae Caesaria multinervosa 4 5 6 2 Flacourtiaceae Scolopia braunii 4 5 6 6 Flacourticaeae Berberidopsis beckleri 5 6 1 Flagellariaceae Flagellaria indica 4 5 6 6 Grossulariaceae Polyosma cunninghamii 4 5 6 4 Icacinaceae Citronella moorei 4 5 6 4 Icacinaceae Pennantia cunninghamii 4 5 6 7 Lauraceae Beilschmedia elliptica 4 5 6 7 Lauraceae Beilschmedia obtusifolia 4 5 6 8 Lauraceae Cinnamomum oliveri 4 5 6 10 Lauraceae Cinnamomum virens 4 5 6 6 Lauraceae Cryptocarya bidwillii 4 5 6 6 Lauraceae Cryptocarya erythroxylon 4 5 6 4 Lauraceae Cryptocarya foetida 4 5 6 1 Lauraceae Cryptocarya glaucescens 4 5 6 6 Lauraceae Cryptocarya hypospodia 4 5 6 3 Lauraceae Cryptocarya macdonaldii 4 5 6 4 Lauraceae Cryptocarya microneura 4 5 6 4 Lauraceae Cryptocarya obovata 4 5 6 9 Lauraceae Cryptocarya rigida 4 5 6 1 Lauraceae Cryptocarya triplinervis 4 5 6 11 Lauraceae Endiandra discolor 4 5 6 5 Lauraceae Endiandra muelleri 4 5 6 4 Lauraceae Endiandra sieberi 4 5 6 2 Lauraceae Litsea australis 4 5 6 9 Lauraceae Litsea reticulata 4 5 6 11 Lauraceae Neolitsea australiensis 4 5 6 7 Lauraceae Neolitsea dealbata 4 5 6 10 Liliaceae Dianella caerulea 4 5 6 5 Loganiaceae Strychnos psilosperma 4 5 6 4 Meliaceae Anthocarapa nitidula 4 5 6 7 Meliaceae Dysoxylum fraserianum 4 5 6 7 Meliaceae Dysoxylum mollissimum 4 5 6 8 Meliaceae Dysoxylum rufum 4 5 6 3 Meliaceae Melia azedarach 4 5 6 18 Meliaceae Owenia cepiodora 4 5 6 2 Meliaceae Synoum glandulosum 4 5 6 5 Menispermaceae Hypserpa laurina 5 6 1 Menispermaceae Legnephora moorei 4 5 6 2 Menispermaceae Stephania japonica 4 5 6 2 Menispermaceae Tinospora smilacina 5 6 1 Mimosaceae Acacia aulacocarpa 5 6 2 Mimosaceae Acacia maidenii 4 5 6 7 Mimosaceae Acacia melanoxylon 4 5 6 8 Monimaceae Palmeria scandens 4 5 6 2 Monimiaceae Hedycarya angustifolia 4 5 6 4 Moraceae Ficus coronata 4 5 6 13 Moraceae Ficus fraseri 4 5 6 22 Moraceae Ficus macrophylla 4 5 6 27 Moraceae Ficus microcarpa 4 5 6 6 Moraceae Ficus obliqua 4 5 6 24 Moraceae Ficus platypoda 4 5 6 25 Moraceae Ficus rubiginosa 4 5 6 15 Moraceae Ficus superba 4 5 6 17 Moraceae Ficus virens 4 5 6 12 Moraceae Ficus watkinsiana 4 5 6 17 Moraceae Maclura cochinchinensis 4 5 6 7 Moraceae Streblus brunonianus 4 5 6 10 Moraceae Trophis scandens 4 5 6 3 Myoporaceae Myoporum insulare 4 5 6 2 Myrsinaceae Embelia australiana 4 5 6 2
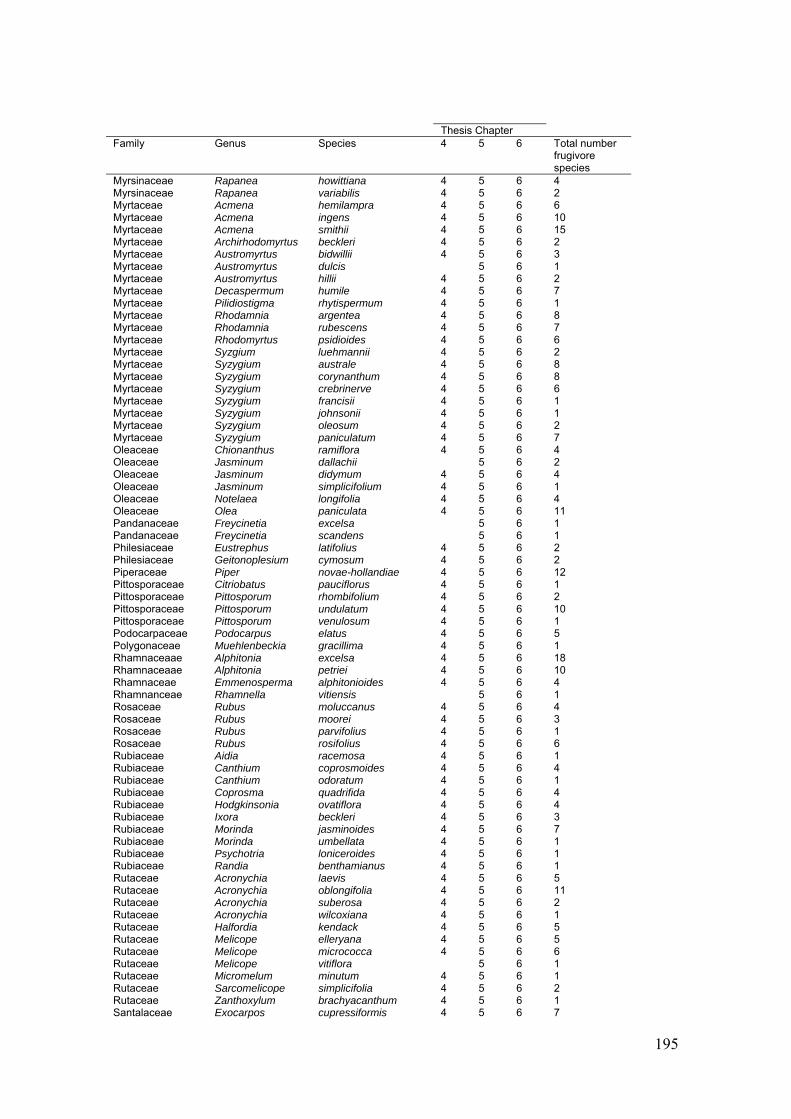
195
Thesis Chapter Family Genus Species 4 5 6 Total number
frugivore species
Myrsinaceae Rapanea howittiana 4 5 6 4 Myrsinaceae Rapanea variabilis 4 5 6 2 Myrtaceae Acmena hemilampra 4 5 6 6 Myrtaceae Acmena ingens 4 5 6 10 Myrtaceae Acmena smithii 4 5 6 15 Myrtaceae Archirhodomyrtus beckleri 4 5 6 2 Myrtaceae Austromyrtus bidwillii 4 5 6 3 Myrtaceae Austromyrtus dulcis 5 6 1 Myrtaceae Austromyrtus hillii 4 5 6 2 Myrtaceae Decaspermum humile 4 5 6 7 Myrtaceae Pilidiostigma rhytispermum 4 5 6 1 Myrtaceae Rhodamnia argentea 4 5 6 8 Myrtaceae Rhodamnia rubescens 4 5 6 7 Myrtaceae Rhodomyrtus psidioides 4 5 6 6 Myrtaceae Syzgium luehmannii 4 5 6 2 Myrtaceae Syzygium australe 4 5 6 8 Myrtaceae Syzygium corynanthum 4 5 6 8 Myrtaceae Syzygium crebrinerve 4 5 6 6 Myrtaceae Syzygium francisii 4 5 6 1 Myrtaceae Syzygium johnsonii 4 5 6 1 Myrtaceae Syzygium oleosum 4 5 6 2 Myrtaceae Syzygium paniculatum 4 5 6 7 Oleaceae Chionanthus ramiflora 4 5 6 4 Oleaceae Jasminum dallachii 5 6 2 Oleaceae Jasminum didymum 4 5 6 4 Oleaceae Jasminum simplicifolium 4 5 6 1 Oleaceae Notelaea longifolia 4 5 6 4 Oleaceae Olea paniculata 4 5 6 11 Pandanaceae Freycinetia excelsa 5 6 1 Pandanaceae Freycinetia scandens 5 6 1 Philesiaceae Eustrephus latifolius 4 5 6 2 Philesiaceae Geitonoplesium cymosum 4 5 6 2 Piperaceae Piper novae-hollandiae 4 5 6 12 Pittosporaceae Citriobatus pauciflorus 4 5 6 1 Pittosporaceae Pittosporum rhombifolium 4 5 6 2 Pittosporaceae Pittosporum undulatum 4 5 6 10 Pittosporaceae Pittosporum venulosum 4 5 6 1 Podocarpaceae Podocarpus elatus 4 5 6 5 Polygonaceae Muehlenbeckia gracillima 4 5 6 1 Rhamnaceaae Alphitonia excelsa 4 5 6 18 Rhamnaceaae Alphitonia petriei 4 5 6 10 Rhamnaceae Emmenosperma alphitonioides 4 5 6 4 Rhamnanceae Rhamnella vitiensis 5 6 1 Rosaceae Rubus moluccanus 4 5 6 4 Rosaceae Rubus moorei 4 5 6 3 Rosaceae Rubus parvifolius 4 5 6 1 Rosaceae Rubus rosifolius 4 5 6 6 Rubiaceae Aidia racemosa 4 5 6 1 Rubiaceae Canthium coprosmoides 4 5 6 4 Rubiaceae Canthium odoratum 4 5 6 1 Rubiaceae Coprosma quadrifida 4 5 6 4 Rubiaceae Hodgkinsonia ovatiflora 4 5 6 4 Rubiaceae Ixora beckleri 4 5 6 3 Rubiaceae Morinda jasminoides 4 5 6 7 Rubiaceae Morinda umbellata 4 5 6 1 Rubiaceae Psychotria loniceroides 4 5 6 1 Rubiaceae Randia benthamianus 4 5 6 1 Rutaceae Acronychia laevis 4 5 6 5 Rutaceae Acronychia oblongifolia 4 5 6 11 Rutaceae Acronychia suberosa 4 5 6 2 Rutaceae Acronychia wilcoxiana 4 5 6 1 Rutaceae Halfordia kendack 4 5 6 5 Rutaceae Melicope elleryana 4 5 6 5 Rutaceae Melicope micrococca 4 5 6 6 Rutaceae Melicope vitiflora 5 6 1 Rutaceae Micromelum minutum 4 5 6 1 Rutaceae Sarcomelicope simplicifolia 4 5 6 2 Rutaceae Zanthoxylum brachyacanthum 4 5 6 1 Santalaceae Exocarpos cupressiformis 4 5 6 7
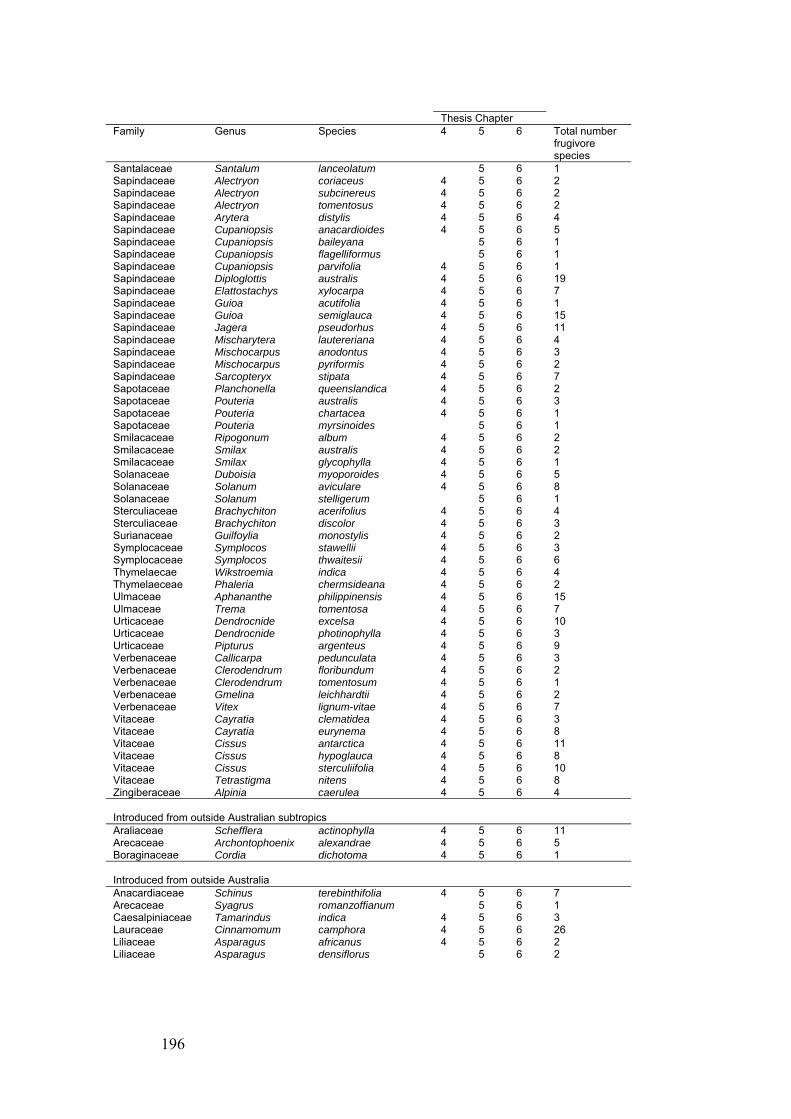
196
Thesis Chapter Family Genus Species 4 5 6 Total number
frugivore species
Santalaceae Santalum lanceolatum 5 6 1 Sapindaceae Alectryon coriaceus 4 5 6 2 Sapindaceae Alectryon subcinereus 4 5 6 2 Sapindaceae Alectryon tomentosus 4 5 6 2 Sapindaceae Arytera distylis 4 5 6 4 Sapindaceae Cupaniopsis anacardioides 4 5 6 5 Sapindaceae Cupaniopsis baileyana 5 6 1 Sapindaceae Cupaniopsis flagelliformus 5 6 1 Sapindaceae Cupaniopsis parvifolia 4 5 6 1 Sapindaceae Diploglottis australis 4 5 6 19 Sapindaceae Elattostachys xylocarpa 4 5 6 7 Sapindaceae Guioa acutifolia 4 5 6 1 Sapindaceae Guioa semiglauca 4 5 6 15 Sapindaceae Jagera pseudorhus 4 5 6 11 Sapindaceae Mischarytera lautereriana 4 5 6 4 Sapindaceae Mischocarpus anodontus 4 5 6 3 Sapindaceae Mischocarpus pyriformis 4 5 6 2 Sapindaceae Sarcopteryx stipata 4 5 6 7 Sapotaceae Planchonella queenslandica 4 5 6 2 Sapotaceae Pouteria australis 4 5 6 3 Sapotaceae Pouteria chartacea 4 5 6 1 Sapotaceae Pouteria myrsinoides 5 6 1 Smilacaceae Ripogonum album 4 5 6 2 Smilacaceae Smilax australis 4 5 6 2 Smilacaceae Smilax glycophylla 4 5 6 1 Solanaceae Duboisia myoporoides 4 5 6 5 Solanaceae Solanum aviculare 4 5 6 8 Solanaceae Solanum stelligerum 5 6 1 Sterculiaceae Brachychiton acerifolius 4 5 6 4 Sterculiaceae Brachychiton discolor 4 5 6 3 Surianaceae Guilfoylia monostylis 4 5 6 2 Symplocaceae Symplocos stawellii 4 5 6 3 Symplocaceae Symplocos thwaitesii 4 5 6 6 Thymelaecae Wikstroemia indica 4 5 6 4 Thymelaeceae Phaleria chermsideana 4 5 6 2 Ulmaceae Aphananthe philippinensis 4 5 6 15 Ulmaceae Trema tomentosa 4 5 6 7 Urticaceae Dendrocnide excelsa 4 5 6 10 Urticaceae Dendrocnide photinophylla 4 5 6 3 Urticaceae Pipturus argenteus 4 5 6 9 Verbenaceae Callicarpa pedunculata 4 5 6 3 Verbenaceae Clerodendrum floribundum 4 5 6 2 Verbenaceae Clerodendrum tomentosum 4 5 6 1 Verbenaceae Gmelina leichhardtii 4 5 6 2 Verbenaceae Vitex lignum-vitae 4 5 6 7 Vitaceae Cayratia clematidea 4 5 6 3 Vitaceae Cayratia eurynema 4 5 6 8 Vitaceae Cissus antarctica 4 5 6 11 Vitaceae Cissus hypoglauca 4 5 6 8 Vitaceae Cissus sterculiifolia 4 5 6 10 Vitaceae Tetrastigma nitens 4 5 6 8 Zingiberaceae Alpinia caerulea 4 5 6 4 Introduced from outside Australian subtropics
Araliaceae Schefflera actinophylla 4 5 6 11 Arecaceae Archontophoenix alexandrae 4 5 6 5 Boraginaceae Cordia dichotoma 4 5 6 1 Introduced from outside Australia
Anacardiaceae Schinus terebinthifolia 4 5 6 7 Arecaceae Syagrus romanzoffianum 5 6 1 Caesalpiniaceae Tamarindus indica 4 5 6 3 Lauraceae Cinnamomum camphora 4 5 6 26 Liliaceae Asparagus africanus 4 5 6 2 Liliaceae Asparagus densiflorus 5 6 2

197
Thesis Chapter Family Genus Species 4 5 6 Total number
frugivore species
Liliaceae Asparagus plumosus 4 5 6 2 Moraceae Ficus benjamima 4 5 6 11 Myrsinaceae Ardissia crenata 4 5 6 1 Myrtaceae Eugenia uniflora 4 5 6 2 Myrtaceae Psidium guajava 5 6 6 Ochnaceae Ochna serrulata 4 5 6 11 Oleaceae Ligustrum lucidum 4 5 6 15 Oleaceae Ligustrum sinense 4 5 6 13 Oleaceae Olea europea 4 5 6 3 Passifloraceae Passiflora suberosa 4 5 6 4 Phytolaccaceae Phytolacca americana 4 5 6 2 Phytolaccaceae Phytolacca octandra 4 5 6 18 Phytolaccaceae Rivina humilis 4 5 6 2 Rosaceae Duchesnea indica 4 5 6 4 Rosaceae Rosa rubiginosa 4 5 6 2 Rosaceae Rubus fructosus 4 5 6 8 Rubiaceae Coffea aribica 4 5 6 1 Rutaceae Murraya paniculata 4 5 6 2 Solanaceae Lycium ferocissimum 4 5 6 9 Solanaceae Physalis peruviana 4 5 6 5 Solanaceae Solanum americanum 4 5 6 9 Solanaceae Solanum capsicoides 5 6 1 Solanaceae Solanum erianthum 5 6 2 Solanaceae Solanum hispidum 4 5 6 2 Solanaceae Solanum mauritianum 4 5 6 21 Solanaceae Solanum nigrum 4 5 6 5 Solanaceae Solanum pseudocapsicum 5 6 1 Solanaceae Solanum seaforthianum 4 5 6 6 Ulmaceae Celtis sinensis 4 5 6 10 Verbenaceae Lantana camara 4 5 6 21 Vitaceae Vitis vinifera 4 5 6 11
198
Appendix 3
Associations between frugivore species’ responses to forest fragmentation as
detected in this thesis and their ecological attributes are assessed (Table A3.1). This
topic was introduced in Section 1.4.2 and the results are discussed in Section 7.1.2 in
the main body of this thesis.
Body mass
Body mass among frugivorous species in subtropical Australia ranges from 9 g
(mistletoebird) to 2 300 g (Australian brush turkey) (average 263 g S.E. 59 g). There is
no association between body size and fragmentation sensitivity (sensitivity scored as
Increaser = 1, Tolerant = 2, Decreaser = 3; Spearman’s Rank correlation coefficient =
0.01, p = 0.96). The body mass of the species that were sensitive to forest
fragmentation ranged from 48 g to 485 g (average 199 g). Of the nine large-bodied
species (> 400 g), seven were tolerant of fragmentation, one was a decreaser and one
was an increaser (Table A3.1).
Biogeographical distribution
There is no clear association between species that are endemic to Australia and
sensitivity to forest fragmentation. Only six of the frugivore species that were common
enough in survey data to analyse for response to fragmentation are endemic to
Australia; one was a decreaser, one an increaser and four were tolerant (Table A3.1). Of
the six frugivore species that were decreasers, only one (the green catbird) is endemic to
Australia; the remaining decreaser species had large geographical distributions.
199
Rarity
In the present study, a species’ relative abundance (or rarity) was indicated by its
average abundance in extensive forest sites during surveys (Table A3.1). There is an
association between a species’ abundance and its sensitivity to fragmentation
(sensitivity scored as Increaser = 1, Tolerant = 2, Decreaser = 3; Spearman’s Rank
correlation coefficient = 0.37, p = 0.05). However, contrary to the expectation that less
common species may be more susceptible to fragmentation (Henle et al., 2004), this
analysis shows that decreaser species were typically common in extensive forest.
Patterns of resource specialisation
A frugivore species’ degree of habitat and dietary specialisation was determined
from information on their degree of dependence on rainforest and fruit, respectively.
Consistent with the expectation that resource specialists are more fragmentation
sensitive (see Section 1.4.2.2), decreaser species tended to be both rainforest and fruit
specialists. Five out of six (83%) decreaser frugivore species were rainforest specialists,
compared with (4 of 14) 29% of tolerant frugivore species and none of the five increaser
species were rainforest specialists (Fisher’s exact test (decreaser versus tolerant and
increaser species) χ2 = 8.68, p =0.008; Table 7.2). Similarly, 83% of decreaser frugivore
species were fruit specialists, compared with 36% of tolerant frugivores and 14% of
increasers (Fisher’s exact test (decreaser versus tolerant and increaser species) χ2 = 5.80,
p =0.03; Table 7.2)
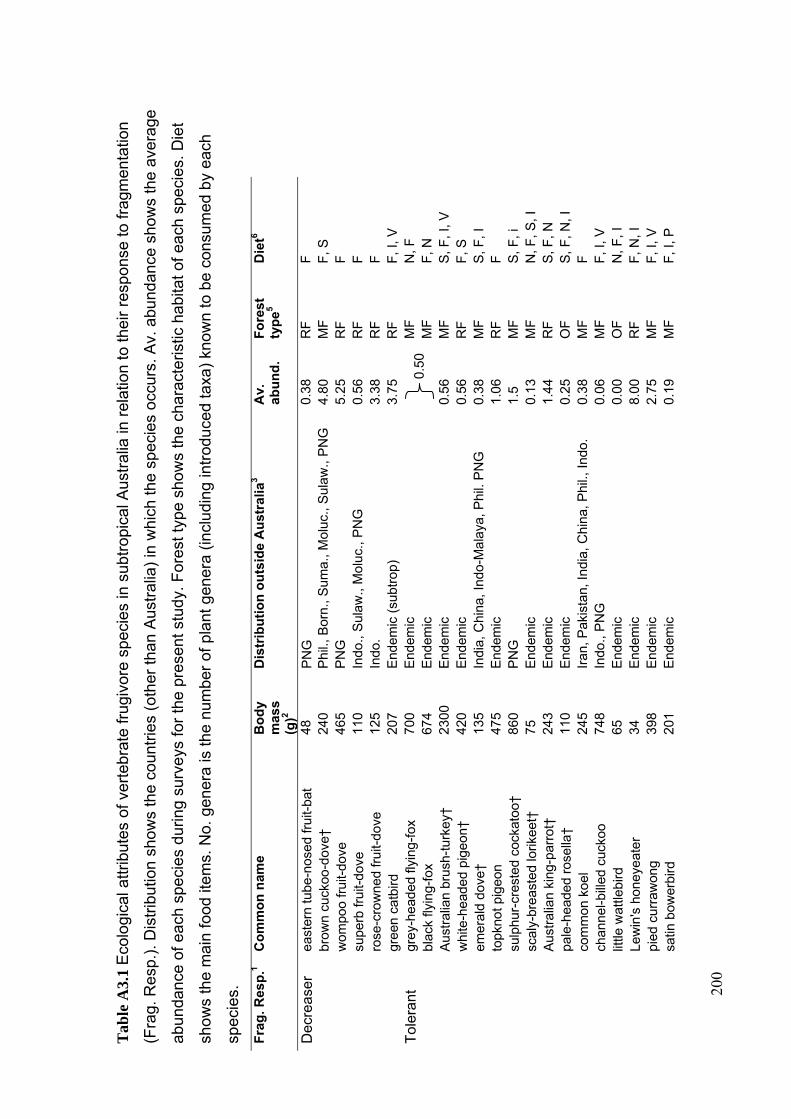
200
Tab
le A
3.1
Eco
logi
cal a
ttrib
utes
of
vert
ebra
te f
rugi
vore
spe
cies
in s
ubtr
opic
al A
ustr
alia
in r
elat
ion
to th
eir
resp
onse
to fr
agm
enta
tion
(Fra
g. R
esp.
). D
istr
ibut
ion
show
s th
e co
untr
ies
(oth
er th
an A
ustr
alia
) in
whi
ch th
e sp
ecie
s oc
curs
. Av.
abu
ndan
ce s
how
s th
e av
erag
e
abun
danc
e of
eac
h sp
ecie
s du
ring
surv
eys
for
the
pres
ent s
tudy
. For
est t
ype
show
s th
e ch
arac
teris
tic h
abita
t of
eac
h sp
ecie
s. D
iet
show
s th
e m
ain
food
item
s. N
o. g
ener
a is
the
num
ber
of p
lant
gen
era
(incl
udin
g in
trod
uced
taxa
) kn
own
to b
e co
nsum
ed b
y ea
ch
spec
ies.
Fra
g. R
esp
.1 C
om
mo
n n
ame
Bo
dy
mas
s (g
)2
Dis
trib
uti
on
ou
tsid
e A
ust
ralia
3 A
v.
abu
nd
. F
ore
st
typ
e5 D
iet6
Dec
reas
er
east
ern
tube
-nos
ed fr
uit-
bat
48
PN
G
0.38
R
F
F
br
own
cuck
oo-d
ove†
24
0 P
hil.,
Bor
n., S
uma.
, Mol
uc.,
Sul
aw.,
PN
G
4.80
M
F
F, S
wom
poo
frui
t-do
ve
465
PN
G
5.25
R
F
F
su
perb
frui
t-do
ve
110
Indo
., S
ulaw
., M
oluc
., P
NG
0.
56
RF
F
rose
-cro
wne
d fr
uit-
dove
12
5 In
do.
3.38
R
F
F
gr
een
catb
ird
207
End
emic
(su
btro
p)
3.75
R
F
F, I
, V
Tol
eran
t gr
ey-h
eade
d fly
ing-
fox
700
End
emic
M
F
N, F
blac
k fly
ing-
fox
674
End
emic
0.
50M
F
F, N
Aus
tral
ian
brus
h-tu
rkey
† 23
00
End
emic
0.
56
MF
S
, F, I
, V
w
hite
-hea
ded
pige
on†
420
End
emic
0.
56
RF
F
, S
em
eral
d do
ve†
135
Indi
a, C
hina
, Ind
o-M
alay
a, P
hil.
PN
G
0.38
M
F
S, F
, I
to
pkno
t pig
eon
475
End
emic
1.
06
RF
F
sulp
hur-
cres
ted
cock
atoo
† 86
0 P
NG
1.
5 M
F
S, F
, i
sc
aly-
brea
sted
lorik
eet†
75
E
ndem
ic
0.13
M
F
N, F
, S, I
Aus
tral
ian
king
-par
rot†
24
3 E
ndem
ic
1.44
R
F
S, F
, N
pa
le-h
eade
d ro
sella
† 11
0 E
ndem
ic
0.25
O
F
S, F
, N, I
com
mon
koe
l 24
5 Ir
an, P
akis
tan,
Indi
a, C
hina
, Phi
l., In
do.
0.38
M
F
F
ch
anne
l-bill
ed c
ucko
o
748
Indo
., P
NG
0.
06
MF
F
, I, V
little
wat
tlebi
rd
65
End
emic
0.
00
OF
N
, F, I
Lew
in's
hon
eyea
ter
34
End
emic
8.
00
RF
F
, N, I
pied
cur
raw
ong
398
End
emic
2.
75
MF
F
, I, V
satin
bow
erbi
rd
201
End
emic
0.
19
MF
F
, I, P

20
1
Fra
g. R
esp
.1 C
om
mo
n n
ame
Bo
dy
mas
s (g
)2
Dis
trib
uti
on
ou
tsid
e A
ust
ralia
3 A
v.
abu
nd
. F
ore
st
typ
e5 D
iet6
Incr
ease
r ro
ck d
ove†
* 30
8 al
l con
tinen
ts e
xcep
t Ant
arct
ic
0.00
M
OD
S
, I
ba
r-sh
ould
ered
dov
e†
130
PN
G
0.00
M
F
S
ra
inbo
w lo
rikee
t†
125
Indo
., P
NG
2.
75
MF
N
, S, F
, I
bl
ack-
face
d cu
ckoo
-shr
ike
134
Sou
th-e
ast A
sia,
PN
G, I
ndia
0.
13
MF
I,
S, F
figbi
rd
128
End
emic
2.
56
Mf,
Mod
F
Aus
tral
ian
mag
pie
299
PN
G (
Intr
od in
NZ
) 0.
13
OF
, Mod
. I,
S
T
orre
sian
cro
w
499
PN
G
1.44
O
F, M
od
V, I
, P, F
silv
erey
e 11
P
acifi
c Is
land
s, N
Z
1.06
M
F
N, I
, F
Und
eter
min
ed
won
ga p
igeo
n†
415
End
emic
0.
50
MF
S
, F, I
para
dise
rifl
ebird
10
4*
End
emic
(su
btro
p.)
0.50
R
F
F, I
rege
nt b
ower
bird
10
2 E
ndem
ic (
subt
rop.
) 0.
13
RF
F
, I
cr
imso
n ro
sella
†
135
End
emic
0.
31
MF
S
, F, N
, I
no
isy
fria
rbird
11
0 P
NG
0.
06
OF
N
, F, I
, V
bl
ue-f
aced
hon
eyea
ter
105
PN
G
0.00
O
F
I, N
, F
ba
rred
cuc
koo-
shrik
e 70
P
NG
0.
00
MF
F
, I
va
ried
trill
er
34
PN
G
0.06
R
F
I, F
, S
ol
ive-
back
ed o
riole
96
P
NG
0.
00
MF
I,
F
gr
ey b
utch
erbi
rd
91
End
emic
0.
00
OF
, Mod
I,
V, P
, S, F
mis
tleto
ebird
9
Pac
ific
Isla
nds
0.19
M
F
F, I
gala
h†
330
End
emic
0.
00
OF
S
, F, I
nois
y m
iner
75
E
ndem
ic
0.00
O
F
I, N
, F, V
1 F
ragm
enta
tion
resp
onse
is th
e re
spon
se p
atte
rn (
Dec
reas
er, T
oler
ant o
r In
crea
ser)
sho
wn
in th
is s
tudy
(C
hapt
er T
wo)
. Und
eter
min
ed is
spe
cies
that
wer
e de
tect
ed to
o in
freq
uent
ly
duri
ng s
urve
ys to
ass
ign
a fr
agm
enta
tion
res
pons
e. B
at r
espo
nses
wer
e de
term
ined
fro
m a
sin
gle
sum
mer
sur
vey.
2 M
ass
data
was
obt
aine
d fr
om (
Chu
rchi
ll, 1
998)
for
bat
s an
d B
aker
et a
l. (1
997)
for
bir
ds, e
xcep
t the
bar
red
cuck
oo-s
hrik
e (D
unni
ng, 1
993)
. * d
ata
for
the
para
dise
rif
lebi
rd f
rom
on
e in
divi
dual
. and
bat
s.
3 D
istr
ibut
ion
info
rmat
ion
was
fro
m th
e H
AN
ZA
B s
erie
s fo
r bi
rds
and
(Chu
rchi
ll, 1
998)
for
bat
s ; ‘
subt
rop.
’ sh
own
in b
rack
ets
afte
r E
ndem
ic s
peci
es in
dica
tes
that
the
spec
ies
is
ende
mic
to s
ubtr
opic
al A
ustr
alia
; rem
aini
ng e
ndem
ic s
peci
es a
re e
ndem
ic to
the
Aus
tral
ian
cont
inen
t. B
orn.
is B
orne
o, I
ndo.
is I
ndon
esia
, Mol
uc. i
s M
oluc
cas,
PN
G is
Pap
ua N
ew
Gui
nea,
Phi
l. is
Phi
lipp
ines
, Sum
a. is
Sum
atra
, Sul
aw. i
s S
ulaw
esi.
4 Bir
d sp
ecie
s’ a
vera
ge a
bund
ance
was
det
erm
ined
fro
m f
our
surv
eys
in e
ach
of th
e 16
site
s. B
at a
bund
ance
was
sur
veye
d on
ce in
eac
h si
te.
202
5 For
est t
ype(
s): R
F is
rai
nfor
est,
MF
is r
ainf
ores
t as
wel
l as
open
for
est a
nd/o
r w
oodl
and,
OF
is o
pen
fore
st, G
is g
rass
land
, MO
D is
mod
ifie
d.
6 Foo
d is
: F (
frui
t) S
(se
ed)
I (i
nver
tebr
ates
) N
(ne
ctar
) P
(no
n-fr
uit/
seed
pla
nt m
ater
ial)
V (
vert
ebra
tes)
. Lis
ted
in a
ppro
xim
ate
orde
r of
rel
ativ
e di
etar
y pr
opor
tion.
Foo
d an
d fo
rest
ty
pe in
form
atio
n fr
om B
lake
rs e
t al (
1984
), H
AN
ZA
B s
erie
s or
Cat
tera
ll et
al.
(200
4) f
or b
irds
and
fro
m E
by (
1995
), R
icha
rds
and
Hal
l (19
98),
Hal
l and
Ric
hard
s (2
000)
for
bat
s.
203
References
Adam P (1992) Australian Rainforests. Oxford University Press, New York
Alcántara JM, Rey PJ, Valera F and Sánchez-Lafuente AM (2000) Factors shaping the
seedfall pattern of a bird-dispersed plant. Ecology 81, 1937-1950.
Alvarez-Bullya ER and Martínez-Ramos M (1990) Seed bank versus seed rain in the
regeneration of a tropical pioneer tree. Oecologia 84, 314-325.
Andrén H (1994) Effects of habitat fragmentation on birds and mammals in landscapes
with different proportions of suitable habitat. Oikos 71, 355-366.
Asquith NM, Terborgh J, Arnold AE and Riveros CM (1999) The fruits the agouti ate:
Hymenaea courabil seed fate when its disperser is absent. Journal of Tropical
Ecology 15, 229-235.
Aukema JE and Martínez del Rio C (2002) Where does a fruit-eating bird deposit
mistletoe seeds? Seed deposition patterns and an experiment. Ecology 83, 3489-
3496.
Babweteera F, Savill P and Brown N (2007) Balanites wilsoniana: regeneration with
and without elephants. Biological Conservation 134, 40-47.
Baider C and Florens FBV (2006) Current decline of the “Dodo tree”: A case of broken-
down interactions with extinct species or the result of new interactions with alien
invaders? pp. 199-214 in Laurance WF and Peres CA (eds) Emerging Threats to
Tropical Forests. University of Chicago Press, Chicago.
Bairlein F (1996) Fruit-eating in birds and its nutritional consequences. Comparative
Biochemistry and Physiology 113, 215-224.
Bairlein F (1998) The effect of diet composition on migratory fuelling in garden
warblers Sylvia borin. Journal of avian biology 29, 546-551.

204
Baker GB, Dettmann EB, Scotney BT, Hardy LJ and Drynan DAD (1997) Report on
the Australian Bird and Bat Banding Scheme, 1984-95. Australian Bird and Bat
Banding Scheme and Australian Nature Conservation Agency, Canberra.
Balmford A (1996) Extinction filters and current resilience: the significance of past
selection pressures for conservation biology. Trends in Ecology and Evolution
11, 193-196.
Barker RD and Vestjens WJM (1988) The Food of Australian Birds: Non-passerines.
CSIRO, Melbourne
Barker RD and Vestjens WJM (1989) The Food of Australian Birds: Passerines.
CSIRO, Melbourne
Belbin L, Griffith University, CSIRO and University of Queensland (2003) PATN for
Windows. Version 2.28.
Benítez-Malvido J and Martínez-Ramos M (2003) Impact of forest fragmentation on
understory plant species richness in Amazonia. Conservation Biology 17, 389-
400.
Bernays EA and Chapman RF (1994) Host-plant Selection in Phytophagous Insects.
Chapman and Hall, New York.
Bierregaard RO Jr., Lovejoy TE, Kapos V, dos Santos AA and Hutchins RW (1992)
The biological dynamics of tropical rainforest remnants. Bioscience 42, 859-866
Bierregaard RO Jr. and Stouffer PC (1997) Understory birds and dynamic habitat
mosaics in Amazonian rainforests. pp. 138-155 in Laurance WF and
Bierregaard RO Jr. (eds.) Tropical forest remnants: the ecology, conservation,
and management of fragmented communities. University of Chicago Press.
Blakers M, Davies SJJF and Reilly PN (1984) The Atlas of Australian Birds. Melbourne
University Press, Melbourne.
205
Bleher B and Böhning-Gaese K (2001) Consequences of frugivore diversity for seed
dispersal, seedling establishment and the spatial pattern of seedlings and trees.
Oecologia 129, 385-394.
Bleher B and Böhning-Gaese K (2006) The role of birds in seed dispersal and its
consequences for forest ecosystems. Acta Zoologica Sinica 52(Suppl.), 116-119.
Bollen A, Van Elsacker L and Ganzhorn JU (2004) Relations between fruits and
disperser assemblages in a Malagasy littoral forest: a community-level approach.
Journal of Tropical Ecology 20, 599-612.
Bond WJ (1994) Do mutualisms matter? Assessing the impact of pollinator and
disperser disruption on plant extinction. Philosophical Transactions of the Royal
Society of London-Biology Sciences, 344, 83–90.
Bosque C and Calchi R (2003) Food choice by blue-gray tanagers in relation to protein
content. Comparative Biochemistry and Physiology Part A. 135, 321-327.
Bowman DMJS (2000) Australian rainforests: islands of green in a land of fire.
Cambridge University Press, Cambridge.
Brash AR (1987) The history of avian extinction and forest conversion on Puerto Rico.
Biological Conservation 39, 97-111.
Bronstein JL and Hoffman K (1987) Spatial and temporal variation in frugivory at a
Neotropical fig, Ficus pertusa. Oikos 49, 261-268.
Brooks M, Pimm SL, Oyugi JO (1999) Time lag between deforestation and bird
extinction in tropical forest fragments Conservation Biology 13, 1140–1150.
Brown ED and Hopkins MJG (2002) Tests of disperser specificity between frugivorous
birds and rainforest fruits in New Guinea. Emu 102, 137-146.
Buckley YM, Anderson S, Catterall CP, Corlett RT, Engel T, Gosper CR, Nathan R,
Richardson DM, Setter M, Spiegel O, Vivian-Smith G, Voigt FA, Weir JS and
206
Westcott DA (2006) Management of plant invasions mediated by frugivore
interactions Journal of Applied Ecology 43, 848–857.
Burkey TV (1993) Edge effects in seed and egg predation at two Neotropical rainforest
sites. Biological Conservation 66, 139-143.
Burns KC (2006) A simple null model predicts fruit-frugivore interactions in a
temperate rainforest. Oikos 115, 427-432.
Butler DW (2003) Seed dispersal syndromes and the distribution of woody plants in
South-East Queensland's vine-forests. PhD Thesis. University of Queensland,
Brisbane.
Castelletta M, Sodhi NS and Subaraj R (2000) Heavy extinctions of forest avifauna in
Singapore: Lessons for biodiversity conservation in southeast Asia.
Conservation Biology 14, 1870-1880.
Catterall CP (1985) Winter energy deficits and the importance of fruit versus insects in
a tropical island bird population. Australian Journal of Ecology 10, 265-279.
Catterall CP and Kingston M (1993) Remnant bushland of south east Queensland in the
1990’s. Griffith University, Nathan Queensland, Australia.
Catterall CP, Kingston MB, Park K and Sewell S (1998) Deforestation, urbanisation and
seasonality: interacting effects on a regional bird assemblage. Biological
Conservation 84, 65-81.
Catterall CP, Kanowski J, Wardell-Johnson GW, Proctor H, Reis T, Harrison D and
Tucker NIJ (2004) Quantifying the biodiversity values of reforestation:
perspectives, design issues and outcomes in Australian rainforest landscapes. pp.
359-393 in Lunney D (ed.) Conservation of Australia’s Forest Fauna, 2nd
edition. Royal Zoological Society of NSW, Mossman.
Catterall CP, Storey RJ and Kingston MB (1997) Reality versus rhetoric: A case study
monitoring regional deforestation. pp. 367-377 in Hale P and Lamb D (eds)
207
Conservation Outside Nature Reserves. Centre for Conservation Biology,
University of Queensland, Brisbane.
Chapman CA and Onderdonk DA (1998) Forests without primates: Primate/plant
codependency. American Journal of Primatology 45, 127-141.
Chapman CA and Chapman LJ (1995) Survival without dispersers: seedling recruitment
under parent plants. Conservation Biology 9, 675-678.
Charles-Dominique P (1986) Inter-relationships between frugivorous vertebrates and
pioneer plants: Cecropia, birds and bats in French Guyana. pp. 119-135 in
Estrada A and Fleming TH (eds) Frugivores and Seed Dispersal. Dr.W. Junk,
Dordrecht.
Chesson PL and Warner RR (1981) Environmental Variability Promotes Coexistence in
Lottery Competitive Systems The American Naturalist 117, 923-943
Christiansen MB and Pitter E (1997) Species loss in a forest bird community near
Lagoa Santa in southern Brazil. Biological Conservation 80, 23-32.
Christidis L and Boles WE (1994) The Taxonomy and Species of Birds of Australia and
its Territories. Royal Australasian Ornithologists Union, Melbourne.
Church RJ (1997) Avian frugivory in a subtropical rainforest: Eleven years of
observations in Lamington National Park. The Sunbird 27, 85-91.
Churchill S (1998) Australian bats. Reed New Holland: Sydney.
Cipollini ML and Levey DJ (1997) Secondary metabolites of fleshy vertebrate-
dispersed fruits: Adaptive hypotheses and implications for seed dispersal.
American Naturalist 150, 346-372.
Clarke KR (1993) Non-parametric multivariate analyses of changes in community
structure. Australian Journal of Ecology 18, 117-143.
Clarke KR and Green RH (1988) Statistical design and analysis for a ‘biological effects’
study. Marine Ecology Progress Series 46, 213-226.

208
Clarke KR and Warwick RM (2001) Changes in Marine Communities: An Approach to
Statistical Analysis and Interpretation. Second Edition. PRIMER-E Ltd.,
Plymouth.
Cochrane MA, Alencar A, Schulze MD, Souza CM Jr., Nepstad DC, Lefebvre P and
Davidson EA (1999) Positive feedbacks in the fire dynamic of closed canopy
tropical forests. Science 284, 1832-1835.
Connell JH (1971) On the role of natural enemies in preventing competitive exclusion
in some marine animals and in rainforest trees. pp 298-313 in den Boer PJ and
Gradwell GR (eds.) Dynamics of Populations. Centre for Agricultural
Publishing, Wageningen, The Netherlands.
Cooper W and Cooper WT (1994) Fruits of the Rain Forest: A Guide to Fruits in
Australian Tropical Rain Forests. Geo Production, Chatswood.
Cordeiro NJ and Howe HF (2001) Low recruitment of trees dispersed by animals in
African forest fragments. Conservation Biology 15, 1733-1741.
Cordeiro NJ and Howe HF (2003) Forest fragmentation severs mutualism between seed
dispersers and an endemic African tree. Proceedings of the National Academy of
Science 100, 14052-14056.
Corlett RT (1996) Characteristics of vertebrate-dispersed fruits in Hong Kong. Journal
of Tropical Ecology 12, 819-833.
Corlett RT (1998) Frugivory and seed dispersal by vertebrates in the Oriental
(Indomalayan) Region. Biological Reviews 73, 413-448.
Corlett RT (2002) Frugivory and seed dispersal in degraded tropical east Asian
landscapes. pp. 451-465 in Levey DJ, Silva WR and Galetti M (eds) Seed
Dispersal and Frugivory: Ecology, Evolution and Conservation. CAB
International, Oxford.
209
Corlett RT and Ko WP (1995) Frugivory by koels in Hong Kong. Memoirs of the Hong
Kong Natural History Society 20, 221-222.
Corlett RT and Turner IT (1997) Long-term survival in tropical forest remnants in
Singapore and Hong Kong. pp. 333-345 in Laurance WF and Bierregaard RO
(eds) (1997) Tropical Forest Remnants: Ecology, Management and
Conservation of Fragmented Communities. University of Chicago Press,
Chicago.
Corlett RT and Primack RB (2006) Tropical rainforests and the need for cross-
continental comparisons. Trends in Ecology and Evolution 21, 104-110.
Cosson J, Pons J and Masson D (1999) Effects of forest fragmentation on frugivorous
and nectarivorous bats in French Guiana. Journal of Tropical Ecology 15, 515-
534.
Cox PA, Elmqvist T, Pierson ED and Rainey WE (1991) Flying foxes as strong
interactors in south Pacific island ecosystems: A conservation hypothesis.
Conservation Biology 5, 448-454.
Crome FHJ (1975) The ecology of fruit pigeons in tropical northern Queensland.
Australian Wildlife Research 2, 155-185.
Crome FHJ (1978) Foraging ecology of an assemblage of birds in lowland rainforest in
northern Queensland. Australian Journal of Ecology 3, 195-212.
Crome FHJ (1990) Vertebrates and succession. pp. 53-64 in Webb LJ and Kikkawa J
(eds) Australian Tropical Rainforests: Science – Value – Meaning. CSIRO,
Melbourne.
Crome FHJ, Isaacs J and Moore L (1994) The utility to birds and mammals of remnant
riparian vegetation and associated windbreaks in the tropical Queensland
uplands. Pacific Conservation Biology 1, 328-343.
210
Crome FHJ and Shields J (1992) Parrots and Pigeons of Australia. Collins Angus and
Robinson Publishers, Sydney.
Daily GC and Ehrlich PR (1994) Influence of social status on individual foraging and
community structure in a bird guild. Oecologia 100, 53-65.
Daily GC, Ehrlich PR and Sánchez-Azofeifa GA (2001) Countryside biogeography: use
of human-dominated habitats by the avifauna of southern Costa Rica. Ecological
Applications 11, 1-13.
Date EM, Ford HA and Recher HE (1991) Frugivorous pigeons, stepping stones and
weeds in northern New South Wales. pp. 241-244 in Saunders DA and Hobbs RJ
(eds) Nature Conservation 2: The Role of Corridors. Surrey Beatty and Sons,
Chipping Norton, New South Wales.
Date EM, Recher HF, Ford HA and Stewart DA (1996) The conservation and ecology
of rainforest pigeons in northeastern New South Wales. Pacific Conservation
Biology 2, 299-308.
Dennis AJ (1997) Musky rat-kangaroos, Hypsiprymnodon moschatus: cursorial
frugivores in Australia’s wet tropical rain-forests. PhD thesis, James Cook
University of North Queensland, Townsville, Australia
Dennis AJ and Westcott DA (2006) Reducing complexity when studying seed dispersal
at community scales: a functional classification of vertebrate seed dispersers in
tropical forests. Oecologia 149, 620-634.
Develey PF and Metzger JP (2006) Emerging threats to birds in Brazilian Atlantic
forests: the role of forest loss and configuration in a severely fragmented
ecosystem. pp. 269-90 in Laurance WF and Peres CA (eds) Emerging Threats to
Tropical Forests. University of Chicago Press, Chicago.
Dickman C and Fleming M (2002) Pest or passenger pigeon? The New South Wales
Scientific Committee’s assessment of the status of the P. poliocephalus. pp. 20-
211
28 in Eby P and Lunney D (eds) Managing the Grey-headed Flying-fox as a
Threatened Species in New South Wales. Royal Zoological Society of New
South Wales, Mossman.
Didham RK, Ghazoul J, Stork NE and Davis AJ (1996) Insects in fragmented forests: a
functional approach. Trends in Ecology and Evolution 11, 255-260.
Doak DF, Marino PC and Kareiva PM (1992) Spatial scale mediates the influence of
habitat fragmentation on dispersal success: Implications for conservation.
Theoretical Population Biology 41, 315-336.
Duncan RS and Chapman CA (1999) Seed dispersal and potential forest succession in
abandoned agriculture in tropical Africa. Ecological Applications 9, 998-1008.
Duncan RS and Chapman CA (2002) Limitations of animal seed dispersal for
enhancing forest succession on degraded lands. pp. 437-450 in Levey DJ, Silva
WR and Galetti M (eds) Seed Dispersal and Frugivory: Ecology, Evolution and
Conservation. CAB International, Oxford.
Dunning JB (1993) CRC Handbook of Avian Body Masses. CRC Press: Boca Raton,
Florida.
Eby P (1991a) Seasonal movements of Pteropus poliocephalus (Chiroptera:
Pteropidae), from two maternity camps in northern New South Wales. Wildlife
Research 18, 547-549.
Eby P (1991b) “Finger-winged night workers”: managing forests to conserve the role of
Grey-headed Flying-foxes as pollinators and seed dispersers. pp. 91-100 in
Lunney D (ed.) Conservation of Australia’s Forest Fauna. Royal Zoological
Society of New South Wales, Mossman.
Eby P (1995) The Biology and Management of Flying Foxes in New South Wales.
Species Management Report No. 18. New South Wales National Parks and
Wildlife Service, Hurstville.
212
Eby P (1998) An analysis of diet specialisation in frugivorous Pteropus poliocephalus
(Megachiroptera) in Australian subtropical rainforest. Australian Journal of
Ecology 23, 443-456.
Eby P, Collins L, Richards G and Parry-Jones K (1999) The distribution, abundance and
vulnerability to population reduction of a nomadic nectarivore, Pteropus
poliocephalus during a period of resource concentration. Australian Zoologist
31, 240-253.
Eby P and Lunney D (2002) Managing the Grey-headed Flying-fox as a threatened
species: a context for the debate. pp. 1-12 in Eby P and Lunney D (eds)
Managing the Grey-headed Flying-fox as a Threatened Species in New South
Wales. Royal Zoological Society of New South Wales, Mossman.
Edwards W (2005) Within- and between-species patterns of allocation to pulp and seed
in vertebrate dispersed plants. Oikos 110, 109-114.
Eshiamwata GW, Berens DG, Bleher B, Dean WRJ and Böhning-Gaese K (2006) Bird
assemblages in isolated Ficus trees in Kenyan farmland. Journal of Tropical
Ecology 22, 723-726.
Estrada A, Coates-Estrada R, Meritt D Jr, Monteil S and Curiel D (1993) Patterns of
frugivore species richness and abundance in forest islands and in agricultural
habitats at Los Tuxtlas, Mexico. Vegetatio 107/108, 245-257.
Fahrig L and Merriam G (1994) Conservation of fragmented populations. Conservation
Biology 8, 50-59.
Faith DP, Minchin PR and Belbin L (1987) Compositional dissimilarity as a robust
measure of ecological distance. Vegetatio 69, 57-68.
Farwig N, Böhning-Gaese K and Bleher B (2006) Enhanced seed dispersal of Prunus
africana in fragmented and disturbed forests? Oecologia 147, 238-252.
213
Fleming TH (1986) Opportunism versus specialization: the evolution of feeding
strategies in frugivorous bats. pp. 105-135 in Estrada A and Fleming TH (eds)
Frugivores and Seed Dispersal. Dr W. Junk, Dordrecht.
Fleming TH, Breitwisch R and Whitesides GH (1987) Patterns of tropical vertebrate
frugivore diversity. Annual Review of Ecology and Systematics 18, 91-109.
Floyd AG (1989) Rainforest Trees of Mainland South Eastern Australia. Inkata Press,
Sydney.
Floyd AG (1990) Australian rainforests in New South Wales. Volume 2. Surrey Beatty
and Sons, Sydney.
Forget P-M (1993) Post-dispersal predation and scatterhoarding of Dipteryx panamensis
(Papilionaceae) seeds by rodents in Panama. Oecologia 94, 255-261.
Franklin J and Rey SJ (2007) Spatial patterns of tropical forest trees in Western
Polynesia suggest recruitment limitations during secondary succession. Journal
of Tropical Ecology 23, 1-12.
Frawley K (1991) Past rainforest management in Queensland. pp. 85-106 in Werren G
and Kershaw P (eds) The Rainforest Legacy: Australian National Rainforest
Study Volume 3. Rainforest History, Dynamics and Management. Australian
Government Publishing Service, Canberra.
French K (1990) Evidence for frugivory by birds in montane and lowland forests in
south-east Australia. Emu 90, 185-189.
Frith C, Frith D, Barnes E and McGuire M (2004) The Bowerbirds. Ptilonorhynchidae.
Oxford University Press.
Frith HJ (1952) Notes on the pigeons of the Richmond River, NSW. Emu 52, 89-99.
Frith HJ (1957) Food habits of the topknot pigeon. Emu 57, 341-345.
Frith HJ (1982) Pigeons and Doves of Australia. Rigby, Adelaide
214
Frith HJ, Crome FHJ and Wolfe TO (1976) Food of fruit-pigeons in New Guinea. Emu
76, 49-58.
Fuentes M (1994) Diets of fruit-eating birds: what are the causes of interspecific
differences? Oecologia 97, 134-142
Fujita MS and Tuttle MD (1991) Flying foxes (Chiroptera: Pteropididae): threatened
animals of key ecological and economic importance. Conservation Biology 5,
455-463.
Galetti M (2001) The future of the Atlantic forest. Conservation Biology 15, 4.
Galindo-González J, Guevara S and Sosa VJ (2000) Bat- and bird-generated seed rains
at isolated trees in pastures in a tropical rainforest. Conservation Biology 14,
1693-1703.
Galindo-González J and Sosa VJ (2003) Frugivorous bats in isolated trees and riparian
vegetation associated with human-made pastures in a fragmented tropical
landscape. Southwestern Naturalist 48, 579-589.
Gascon C, Lovejoy TE, Bierregaard RO Jr, Malcolm JR, Stouffer PC, Vasconcelos HL,
Laurance WF, Zimmerman B, Tocher M and Borges S (1999) Matrix habitat and
species richness in tropical forest remnants. Biological Conservation 91, 223-
229.
Gautier-Hion A, Duplantier JM, Quiris R, Feer F, Decoux JP, Dubost GF, Emmons L,
Erard C, Hecketsweiler P and Moungazi A (1985) Fruit characters as a basis of
fruit choice and seed dispersal in a tropical forest vertebrate community.
Oecologia 55, 324-333.
Gilmore S (1999) Fauna and rainforest fragmentation – developing improved
conservation planning. pp. 29-66 in Horton S (ed.) Rainforest Remnants: A
Decade of Growth. New South Wales National Parks and Wildlife Service,
Hurstville.
215
Goosem S (2000) Landscape ecology and values. pp. 14-30 in McDonald G and Lane
M (eds.) Securing the Wet Tropics? A retrospective on managing Australia’s
tropical rainforests. Federation Press, Sydney.
Gorchov DL, Cornejo F, Ascorra C. and Jaramillo M (1995) Dietary overlap between
frugivorous birds and bats in the Peruvian Amazon. Oikos 74, 235-250.
Gosper DG and Holmes G (2002) Status of birds in the Richmond River District, New
South Wales 1973-2000. Corella 26, 89-105.
Gould J (1865) Handbook to the Birds of Australia. J. Gould, London.
Graham CH (2001) Factors influencing movement patterns of keel-billed toucans in a
fragmented tropical landscape in southern Mexico. Conservation Biology 15,
1789-1798.
Graham CH and Blake JG (2001) Influence of patch- and landscape-level factors on
bird assemblages in a fragmented tropical landscape. Ecological Applications
11, 1709-1721.
Graham C, Martínez-Leyva JE and Cruz-Paredes L (2002) Use of fruiting trees by birds
in continuous forest and riparian forest remnants in Los Tuxtlas, Veracruz,
Mexico. Biotropica 34, 589-597.
Green RJ (1993) Avian seed dispersal in and near subtropical rainforests. Wildlife
Research 20, 535-557.
Green RJ (1995) Using frugivores for regeneration: a survey of knowledge and
problems in Australia. pp.1-11 in Bissonette JA and Krausman PR (eds)
Integrating People and Wildlife for a Sustainable Future. The Wildlife Society,
Maryland.
Greenberg R, Foster M and Marquez L (1995) The role of white-eyed vireos in the
dispersal of Bursera simaruba fruit. Journal of Tropical Ecology 11, 619-639.
216
Grubb PJ (1977) The maintenance of species richness in plant communities: The
importance of the regeneration niche. Biological Reviews 52, 107-145.
Guevara S, Purata S and van der Maarel E (1986) The role of remnant trees in tropical
secondary succession. Vegetatio 66, 74-84.
Guevara S and Laborde J (1993) Monitoring seed dispersal at isolated standing trees in
tropical pastures: consequences for local species availability. Vegetatio 107/108,
319-338.
Hall LS and Richards G (1979) Bats of Eastern Australia. Queensland Museum Booklet
No.12. Queensland Museum, Brisbane.
Hall LS and Richards G (2000) Flying Foxes: Fruit and Blossom Bats of Australia.
University of New South Wales Press, Sydney.
Hall LS, Richards GC and Spencer HJ (1995) Eastern Tube-nose Bat Nyctimene
robinsoni. pp. 426-8 in Strahan R (ed.) The Mammals of Australia. Australian
Museum and Reed, Sydney.
Hamann A and Curio E (1999) Interactions among frugivores and fleshy fruit trees in a
Philippine submontane rainforest. Conservation Biology 13, 766-773.
Hamilton MB (1999) Tropical tree gene flow and seed dispersal. Nature 401, 129-130.
Harms KE, Wright SJ, Calderón O, Hernández A and Herre EA (2000) Pervasive
density-dependent recruitment enhances seedling diversity in a tropical forest.
Nature 404, 493-495.
Harrington GN, Irvine AK, Crome FHJ and Moore LA (1997) Regeneration of large-
seeded trees in Australian rainforest fragments: a study of higher-order
interactions. pp. 292-303 in Laurance WF and Bierregaard RO (eds) Tropical
Forest Remnants: Ecology, Management and Conservation of Fragmented
Communities. University of Chicago Press, Chicago.
217
Harvey CA (2000) Windbreaks enhance seed dispersal into agricultural landscapes in
Monteverde, Costa Rica. Ecological Applications 10, 155-173.
Hauser J. and Blok J (1998) Fragments of Green: An Identification Field Guide for
Rainforest Plants of the Greater Brisbane Region to the Border Ranges. 2nd
Edition. Australian Rainforest Conservation Society, Bardon.
Henle K, Davies KF, Kleyer M, Margules C and Settele J (2004) Predictors of species
sensitivity to fragmentation. Biodiversity and Conservation 13, 207-251.
Herrera CM (1981) Are tropical fruits more rewarding than temperate ones? American
Naturalist 118, 896-907.
Herrera CM (1982) Seasonal variation in the quality of fruits and diffuse coevolution
between plants and avian dispersers. Ecology 63, 773-785.
Herrera CM (1984) A study of avian frugivores, bird-dispersed plants, and their
interaction in Mediterranean scrublands. Ecological Monographs 54, 1-23.
Herrera CM (1985) Determinants of plant-animal coevolution: the case of mutualistic
dispersal of seeds by vertebrates. Oikos 44, 132-141.
Herrera CM (1987) Vertebrate-dispersed plants of the Iberian Peninsula: A study of
fruit characteristics. Ecological Monographs 57, 305-331.
Herrera CM (1998) Long-term dynamics of Mediterranean frugivorous birds and fleshy
fruits: A 12-year study. Ecological Monographs 68, 511-538.
Herrera CM (2002) Seed dispersal by vertebrates. pp. 185–208 in Herrera CM and
Pellmyr O (eds.) Plant–animal interactions: an evolutionary approach),
Blackwell Publishing, Oxford.
Herrera CM, Jordano P, López-Soria L and Amat JA (1994) Recruitment of a mast-
fruiting, bird-dispersed tree: bridging frugivore activity and seedling
establishment. Ecological Monographs 64, 315-344.
218
Higgins PJ (1999) Handbook of Australian, New Zealand and Antarctic Birds: Volume
4. Parrots to Dollarbirds. Oxford University Press, Melbourne.
Higgins PJ and Davies SJJF (1996) Handbook of Australian, New Zealand and
Antarctic Birds: Volume 3. Snipe to Pigeons. Oxford University Press,
Melbourne.
Higgins PJ, Peter JM and Steele WK (2001) Handbook of Australian, New Zealand and
Antarctic Birds: Volume 5. Tyrant-flycatchers to Chats. Oxford University
Press, Melbourne.
Holbrook KM, Smith TB and Hardesty BD (2002) Implications of long-distance
movements of frugivorous rain forest hornbills. Ecography 25, 745-749.
Holl KD, Loik ME, Lin EHV and Samuels IA (2000) Tropical montane forest
restoration in Costa Rica: overcoming barriers to dispersal and establishment.
Restoration Ecology 8, 339-349.
Hood GM (2003) Pop Tools Version 2.5.9. URL http://www.cse.csiro.au/poptools
Hooper Du, Chapin FS III, Ewel JJ, Hector A, Inchausti P, Lavorel S, Lawton JH,
Lodge DM, Loreau M, Naeem S, Schmid B, Setala H, Symstad AJ, Vandermeer
J and Wardle DA (2005) Effects of biodiversity on ecosystem functioning: a
consensus of current knowledge. Ecological Monographs 75, 3-35.
Hooper ER, Legendre P and Condit R (2004) Factors affecting community composition
of forest regeneration in deforested, abandoned land in Panama. Ecology 85,
3313-3326.
Hopkins MS and Graham AW (1984) Viable soil seed banks in disturbed lowland
tropical rainforest sites in North Queensland. Australian Journal of Ecology 9,
71-79.
Howe HF (1977) Bird activity and seed dispersal of a tropical wet forest tree. Ecology
58, 539-550.

219
Howe HF (1979) Fear and frugivory. American Naturalist 114, 925-931.
Howe HF (1981) Dispersal of a neotropical nutmeg (Virola sebifera) by birds. Auk 98,
88-98.
Howe HF (1984) Implications of seed dispersal by animals for tropical reserve
management. Biological Conservation 30, 261-281.
Howe HF (1986) Seed dispersal by fruit eating birds and mammals. pp. 123-190 in
Murray DR (ed.) Seed dispersal. Academic Press, Sydney.
Howe HF (1993) Specialized and generalized dispersal systems: where does ‘the
paradigm’ stand? Vegetatio 107/108, 3-13.
Howe HF and Primack RB (1975) Differential Seed Dispersal by Birds of the Tree
Casearia nitida (Flacourtiaceae) Biotropica, 7, 278-283.
Howe HF and Estabrook GF (1977) On intraspecific competition for avian dispersers in
tropical trees. American Naturalist 111, 817-832.
Howe HF and van der Kerckhove GA (1980) Nutmeg dispersal by birds. Science 210,
925-927.
Howe HF and Smallwood J (1982) Ecology of seed dispersal. Annual Review of
Ecology and Systematics 13, 210-228.
Howe HF, Schupp EW and Westley LC (1985) Early consequences of seed dispersal for
a neotropical tree (Virola surinamensis). Ecology 66, 781-791.
Howe HF and Miriti MN (2000) No question: seed dispersal matters. Trends in Ecology
and Evolution 15, 434-436.
Howe RW, Howe TD and Ford HA (1981) Bird distributions on small rainforest
remnants in New South Wales. Australian Wildlife Research 8, 637-651.
Hubbell SP (1979) Tree dispersion, abundance and diversity in a tropical dry forest.
Science 203, 1299-1309.
220
Hubbell SP and Foster RB (1990) The fate of juvenile trees in a Neotropical forest:
implications for the natural maintenance of tropical tree diversity. pp. 317-341 in
Bawa KS and Hadley M (eds.) Reproductive Ecology of Tropical Forest Plants.
Parthenon Publishing, Paris.
Hunter J (1999) Fragmentation: the consequences. pp. 19-28 in Horton S (ed.)
Rainforest Remnants: A Decade of Growth. New South Wales National Parks
and Wildlife Service, Hurstville.
Hurtt GC and Pacala GC (1995) The consequences of recruitment limitation:
Reconciling chance, history and competitive differences between plants. Journal
of Theoretical Biology 176, 1-12.
Ingle NI (2003) Seed dispersal by wind, birds, and bats between Philippine montane
rainforest and successional vegetation. Oecologia 134, 251-261.
Innis GJ (1989) Feeding ecology of fruit pigeons in subtropical rainforests of south-
eastern Queensland. Australian Wildlife Research 16, 365-394.
Innis GJ and McEvoy J (1992) Feeding ecology of green catbirds (Ailuroedus
crassirostris) in subtropical rainforests of south-eastern Queensland. Wildlife
Research 19, 317-329.
Izhaki I and Safriel UN (1989) Why are there so few exclusively frugivorous birds?
Experiments on fruit digestibility. Oikos 54, 23-32.
Izhaki I, Tsahar E, Paluy I and Friedman J (2002) Within population variation and
interrelationships between morphology, nutritional content, and secondary
compounds of Rhamnus alaternus fruits. New Phytologist 156, 217-223.
Jansen A (2005) Avian use of restoration plantings along a creek linking rainforest
patches on the Atherton Tablelands, North Queensland. Restoration Ecology 13,
275-283.

221
Janzen DH (1970) Herbivores and the number of tree species in tropical forests.
American Naturalist 104, 501-528.
Janzen DH (1979) How to be a fig. Annual Review of Ecology and Systematics 10, 13-
51.
Janzen DH (1983) No park is an island: increase in interference from outside as park
size decreases. Oikos , 402-410.
Janzen DH (1986) The Eternal External Threat. pp. 286-303 in Soulé ME (ed.)
Conservation Biology: Science of Scarcity and Diversity. Sinauer Associates
Inc., Massachusetts.
Janzen DH and Martin PS (1982) Neotropical anachronisms: the fruits the
Gomphotheres ate. Science 215, 19-27.
Janzen DH and Vásquez-Yanez C (1991) Aspects of tropical seed ecology of relevance
to management of tropical forest wildlands. pp. 137-158 in Gomez-Pompa A,
Whitmore TC and Hadley M (eds.) Rainforest Regeneration and Management.
Man and the Biosphere Series, Volume 6. UNESCO & The Parthenon
Publishing Group, Paris.
Johnson RA, Willson MF, Thompson JN and Bertin RI (1985) Nutritional values of
wild fruits and consumption by migrant frugivorous birds. Ecology 66, 819-827.
Jones RE and Crome FHJ (1990) The biological web – plant/animal interactions in the
rainforest. pp. 74-87 in Webb LJ and Kikkawa J (eds.) Australian Tropical
Rainforests: Science – Value – Meaning. CSIRO, Melbourne.
Jordano P (1987) Patterns of mutualistic interactions in pollination and seed dispersal:
connectance, dependence asymmetries, and coevolution. American Naturalist
129, 657-677.
222
Jordano P (1995) Angiosperm fleshy fruits and seed dispersers: a comparative analysis
of adaptation and constraints in plant-animal interactions. American Naturalist
145, 163-191.
Jordano P and Schupp EW (2000) Determinants of seed dispersal effectiveness: the
quantity component of the Prunus mahaleb –frugivorous bird interaction.
Ecological Monographs 70, 591-615.
Jordano P and Godoy JA (2002) Frugivore-generated seed shadows: a landscape view
of demographic and genetic effects. pp. 305-321 in Levey DJ, Silva WR and
Galetti M (eds) Seed Dispersal and Frugivory: Ecology, Evolution and
Conservation. CAB International, Oxford.
Kanowski J, Catterall CP, Dennis AJ and Westcott DA (2004a) Animal-Plant
Interactions In Rainforest Conservation And Restoration. Rainforest CRC,
Cairns.
Kanowski J, Catterall CP, Reis T and Wardell-Johnson GW (2004b) Animal-plant
interactions in rainforest restoration in tropical and subtropical Australia. pp. 20
–24 in Kanowski J, Catterall CP, Dennis AJ and Westcott DA (eds) Animal-
Plant Interactions In Rainforest Conservation And Restoration. Rainforest CRC,
Cairns.
Karr JR (1976) Seasonality, resource availability, and community diversity in tropical
bird communities. American Naturalist 110, 973-994.
Karr JR (1982) Avian extinction on Barro Colorado Island, Panama: A reassessment.
American Naturalist 119, 220-239.
Kattan GH, Alvarez-López H and Giraldo M (1994) Forest fragmentation and bird
extinctions: San Antonio eighty years later. Conservation Biology 8, 138-146.
Kershaw AP, Sluiter IR, Mason JM, Wagstaff BE and Whitelaw M (1991) The history
of rainforest in Australia – evidence from pollen. pp. 1-15 in Werren G and
223
Kershaw P (Eds.) The rainforest legacy. Australian National Rainforest Study.
Volume 3. Australian Government Publishing Service, Canberra.
Kitamura S, Yumoto T, Poonswad P, Chuailua P, Plongmai K, Maruhashi T and Noma
N (2002) Interactions between fleshy fruits and frugivores in a tropical seasonal
forest in Thailand. Oecologia 133, 559-572
Kitamura S, Suzuki S, Yumoto T, Chuailua P, Plongmai K, Poonswad P, Noma N,
Maruhashi T and Suckasam C (2005) A botanical inventory of a tropical
seasonal forest in Khao Yai National Park, Thailand: implications for fruit-
frugivore interactions. Biodiversity and Conservation 14, 1241-1262.
Kooyman RM (1996) Growing Rainforest: Rainforest Restoration and Regeneration.
Recommendations for the Humid Sub-tropical Region of Northern New South
Wales and South East Queensland. State Forests of New South Wales, Casino
and Greening Australia, Brisbane.
Larson DL (1996) Seed dispersal by specialist versus generalist foragers: the plant’s
perspective. Oikos 76, 113-120.
Laurance WF (1990) Comparative responses of five arboreal marsupials to tropical
forest fragmentation. Journal of Mammalogy 71, 641-653.
Laurance WF (1991) Edge effects in tropical forest fragments: application of a model
for the design of nature reserves. Biological Conservation 57, 205-219.
Laurance WF (2006) Have we overstated the tropical biodiversity crisis? Trends in
Ecology and Evolution 22, 65-70.
Laurance WF and Bierregaard RO (eds) (1997) Tropical Forest Remnants: Ecology,
Management and Conservation of Fragmented Communities. University of
Chicago Press, Chicago.
Laurance WF, Gordon CF and Perry E (1996) Structure of breeding bird communities
in rainforest and regrowth forest in tropical Queensland. Sunbird 26, 1-15.
224
Laurance WF and Peres CA (eds) (2006) Emerging Threats to Tropical Forests.
University of Chicago Press, Chicago.
Laurance WF and Yensen E (1991) Predicting the impacts of edge effects in fragmented
habitats. Biological Conservation 55, 77-92.
Law BS and Spencer HJ (1995) Common blossom bat Syconicteris australis. pp. 423-
425 in Strahan, R. (ed.) The Mammals of Australia. Australian Museum and
Reed, Sydney.
Lawrence D (2004) Erosion of tree diversity during 200 years of shifting cultivation in
Bornean rain forest. Ecological Applications 14, 1855-1869.
Leck CF (1979) Avian extinctions in an isolated tropical wet-forest preserve, Ecuador.
The Auk 96, 343-352.
Leighton M and Leighton DR (1983) Vertebrate responses to fruiting seasonality within
a Bornean rain forest. pp. 181-196 in Sutton SL, Whitmore TC and Chadwick
AC (eds.) Tropical Rainforest Ecology and Management. Blackwell Scientific
Publications, Oxford.
Levey DJ (1987) Seed size and fruit-handling techniques of avian frugivores. American
Naturalist 129, 471-485.
Levey DJ and Grajal A (1991) Evolutionary implications of fruit-processing limitations
in cedar waxwings. American Naturalist 138, 171-189.
Levey DJ and Karasov WH (1989) Digestive responses of temperate birds switched to
fruit and insect diets. Auk 106, 675-686.
Levey DJ and Sargent S (2000) A simple method for tracking vertebrate-dispersed
seeds. Ecology 81, 267-274.
Levey DJ and Martínez del Rio C (2001) It takes guts (and more) to eat fruit: lessons
from avian nutritional ecology. Auk 118, 819-831.
225
Levin SA, Muller-Landau HC, Nathan R and Chave J (2003) The ecology and evolution
of seed dispersal: a theoretical perspective. Annual Review of Ecology and
Systematics 34, 575-604.
Lindsey TR (1995) Encyclopaedia of Australian Birds. Angus & Robertson, Pymble.
Loiselle BA and Blake JG (2002) Potential consequences of extinction of frugivorous
birds for shrubs of a tropical wet forest. pp. 397-406 in Levey DJ, Silva WR and
Galetti M (eds.) Seed Dispersal and Frugivory: Ecology, Evolution and
Conservation. CAB International, Oxford.
Lord JM, Markey AS and Marshall J (2002) Have frugivores influenced the evolution
of fruit traits in New Zealand? pp. 55-68 in Levey DJ, Silva WR and Galetti M
(eds.) Seed Dispersal and Frugivory: Ecology, Evolution and Conservation.
CAB International, Oxford.
Lovejoy TE, Bierregaard RO Jr, Rylands AB, Malcolm JR, Quintela CE, Harper LH,
Brown KS Jr, Powell AH, Powell GVN, Schubart HOR and Hays MB (1986)
Edge and other effects of isolation on Amazon forest fragments. pp. 257-85 in
Soulé ME (ed.) Conservation Biology: Science of Scarcity and Diversity.
Sinauer Associates Inc., Massachusetts.
Luck GW and Daily GC (2003) Tropical countryside bird assemblages: Richness,
composition, and foraging differ by landscape context. Ecological Applications
13, 235-247.
Lunney D and Moon C (1997) Flying foxes and their camps in the remnant rainforests
of north-east New South Wales. pp. 247-77 in Dargavel J (ed.) Australia’s Ever-
changing Forests III. Centre for Resource and Environmental Studies,
Australian National University, Canberra.
Mack AL (1993) The sizes of vertebrate-dispersed fruits: a Neotropical-Paleotropical
comparison. American Naturalist 142, 840-856.
226
Manly BFJ (1994) Multivariate Statistical Methods: A Primer. Chapman and Hall,
London.
Marchant S and Higgins PJ (1993) Handbook of Australian, New Zealand and Antarctic
Birds: Volume 2. Raptors to Lapwings. Oxford University Press, Melbourne.
Marinho-Filho J and Sazima I (1998) Brazilian bats and conservation biology: a first
survey. pp. 282-294 in Kunz TH and Racey PA (eds.) Bat Biology and
Conservation. Sminthsonian Institute Press, Washington D.C.
Markus N and Hall LS (2004) Foraging behaviour of the Black Flying-fox (Pteropus
alecto) in the urban landscape of Brisbane, Queensland. Wildlife Research 31,
345-355.
Martin TE (1985) Resource selection by tropical frugivorous birds: integrating multiple
interactions. Oecologia 66, 563-573.
Martin, H.A. (1990). Tertiary climate and phytogeography in southeastern Australia.
Review of Palaeobotany and Palynology 65, 47-55.
Martínez del Rio C, Stevens BR, Daneke D and Andreadis PT (1988) Physiological
correlates of preference and aversion for sugars in three species of birds.
Physiological Zoology 61, 222-229.
Martínez del Rio C and Restrepo C (1993) Ecological and behavioural consequences of
digestion in frugivorous animals. Vegetatio 197/108:205-216.
Martínez del Rio C and Karasov WH (1990) Digestion strategies in nectar- and fruit-
eating birds and the sugar composition of plant rewards. American Naturalist
136, 618-637.
Martínez-Garza C and Howe HF (2003) Restoring tropical diversity: beating the time
tax on species loss. Journal of Applied Ecology 40, 423-429.
Matlack GR (2005) Slow plants in a fast forest: local dispersal as a predictor of species
frequencies in a dynamic landscape. Journal of Ecology 93, 50-59.
227
McConkey KR and Drake DR (2002) Extinct pigeons and declining bat populations: are
large seeds still being dispersed in the tropical Pacific? pp. 381-395 in Levey DJ,
Silva WR and Galetti M (eds) Seed Dispersal and Frugivory: Ecology,
Evolution and Conservation. CAB International, Oxford.
McDonald-Madden E, Schreiber ESG, Forsyth DM, Choquenot D and Clancy TF
(2005) Factors affecting Grey-headed Flying-fox (Pteropus poliocephalus:
Pteropidae) foraging in the Melbourne metropolitan area, Australia. Austral
Ecology 30: 600-608.
McDonnell MJ and Stiles EW (1983) The structural complexity of old field vegetation
and the recruitment of bird-dispersed plant species. Oecologia 56, 109-116.
McEuan AB and Curran LM (2004) Seed dispersal and recruitment limitation across
spatial scales in temperate forest fragments. Ecology 85, 507-518.
McKey D (1975) The ecology of coevolved seed dispersal systems. pp. 159-191 in
Gilbert E and Raven PH (eds.) Coevolution of Animals and Plants. University of
Texas, Austin.
Medellín RA and Gaona O (1999) Seed dispersal by bats and birds in forest and
disturbed habitats of Chiapas, México. Biotropica 31, 478-485.
Meehan HJ, McConkey KR and Drake DR (2005) Early fate of Myristica hypargyraea
seeds dispersed by Ducula pacifica in Tonga, Western Polynesia. Austral
Ecology 30, 374-382.
Meier L and Figgis P (1985) Rainforests of Australia. Ure Smith Press, Sydney.
Mildenstein TL, Steir SC, Nuevo-Diego CE and Scott Mills L (2005) Habitat selection
of endangered and endemic large flying-foxes in Subic Bay, Philipines.
Biological Conservation 126, 93-102.
Milledge DR (1987) Notes on the occurrence of the Queensland Tube-nosed bat
Nyctimene robinsoni in north-eastern New South Wales. Macroderma 3, 28-29.
228
Moermond TC, Denslow JS (1983) Fruit choice in Neotropical birds: effect of fruit type
and accessibility on selectivity. Journal of Animal Ecology 52, 407-420
Moermond TC, Denslow JS (1985) Neotropical frugivores: patterns of behaviour,
morphology and nutrition with consequences for fruit selection. Ornithological
Monographs 36, 865-897
Moermond TC, Denslow JS, Levey DJ and Santana E (1986) The influence of
morphology on fruit choice in neotropical birds. pp. 137-146 in Estrada A and
Fleming TH (eds.) Frugivores and Seed Dispersal. Dr.W. Junk Publishers,
Dordrecht.
Morton ES (1973) On the evolutionary advantages and disadvantages of fruit eating in
tropical birds. American Naturalist 107, 8-22.
Muller-Landau HC, Wright SJ, Calderón O, Hubbell SP and Foster RB (2002)
Assessing recruitment limitation: Concepts, methods and case-studies from a
tropical forest. pp. 35-53 in Levey DJ, Silva WR and Galetti M (eds.) Seed
Dispersal and Frugivory: Ecology, Evolution and Conservation. CAB
International, Oxford.
Murray KG, Winnett-Murray K, Cromie EA, Minor M. and Meyers E (1993) The
influence of seed packaging and fruit colour on feeding preferences of American
robins Vegetatio 107/108, 217-226.
Murray KG and Garcia-C JM (2002) Contributions of seed dispersal and demography to
recruitment limitation in a Costa Rican cloud forest. pp. 323-338 in Levey DJ,
Silva WR and Galetti M (eds.) Seed Dispersal and Frugivory: Ecology,
Evolution and Conservation. CAB International, Oxford.
Myers N (1984) The Primary Source: Tropical Forests and our Future. W W Norton &
Co Ltd, New York.
229
Nathan R and Muller-Landau C (2000) Spatial patterns of seed dispersal, their
determinants and consequences for recruitment. Trends in Ecology and
Evolution 15, 278-285.
National Land and Water Resources Audit (2001) Australian Native Vegetation
Assessment. Commonwealth of Australia, Canberra.
http://audit.ea.gov.au/ANRA/vegetation/docs/native_vegetation/nat_veg_fact01.cfm
Neilan W, Catterall CP, Kanowski J and McKenna S (2006) Do frugivorous birds assist
rainforest succession in weed dominated oldfield regrowth of subtropical
Australia? Biological Conservation 129, 393-407.
Nelson JE (1965) Movements of Australian flying foxes. Australian Journal of Zoology
13: 53-73.
Nepstad DC, Uhl C, Pereira CA and Silva JMC (1996) A comparative study of tree
establishment in abandoned pasture and mature forest of eastern Amazonia.
Oikos 76:25-39.
Nix HA and Switzer MA (1991) (Eds.) Rainforest Animals: An atlas of vertebrates
endemic to the Australian Wet Tropics. Australian National Parks and Wildlife
Service, Canberra.
Orrock JL, Levey DJ, Danielson BJ and Damschen EI (2006) Seed predation, not seed
dispersal, explains the landscape-level abundance of an early-successional plant.
Journal of Ecology 94, 838-845.
Palmer C and Woinarski JCZ (1999) Seasonal roosts and foraging movements of the
Black Flying-fox (Pteropus alecto) in the Northern Territory: resource tracking
in a landscape mosaic. Wildlife Research 26, 823-838.
Palmer C, Price O and Bach C (2000) Foraging ecology of the black flying fox
(Pteropus alecto) in the seasonal tropics of the Northern Territory, Australia.
Wildlife Research 27, 169-178.
230
Parry-Jones KA and Augee ML (1991) Food selection by Grey-headed Flying-foxes
(Pteropus poliocephalus) occupying a summer colony site near Gosford, New
South Wales. Wildlife Research 18, 111-124.
Parry-Jones KA and Augee ML (1992) Movements of Grey-headed flying foxes
(Pteropus poliocephalus) to and from a colony site on the central coast of New
South Wales. Wildlife Research 19, 331-340.
Patterson BD (1987) The principle of nested subsets and its implications for biological
conservation. Conservation Biology 1, 323-334
Pimm SL, Jones HL and Diamond J (1988) On the risk of extinction. American
Naturalist 132, 757-785.
Piper SD and Catterall CP (2003). A particular case and a general pattern:
hyperaggressive behaviour by one species may mediate avifaunal decreases in
fragmented Australian forests. Oikos 101, 602-614.
Pizo MA (1997) Seed dispersal and predation in two populations of Cabralea canjerana
(Meliaceae) in the Atlantic Forest of southeastern Brazil. Journal of Tropical
Ecology 13, 559-577.
Poschlod P, Bakker J, Bonn S, Fischer S (1996) Dispersal of plants in fragmented
landscapes. pp. 123-127 in Settele J, Margules CR, Poschlod P and Henle K
(eds.) Species Survival in Fragmented Landscapes. Kluwer Academic
Publishers, Netherlands.
Poulsen JR, Clarke CJ, Connor EF and Smith TB (2002) Differential resource use by
primates and hornbills: implications for seed dispersal. Ecology 83, 228-240.
Pratt TK and Stiles EW (1985) The influence of fruit size and structure on composition
of frugivore assemblages in New Guinea. Biotropica 17, 314-21.
Price OF (1999) Conservation of frugivorous birds and monsoon rainforest patches in
the Northern Territory. PhD Thesis, Australian National University, Canberra
231
Price OF, Woinarski JCZ and Robinson D (1999) Very large area requirements for
frugivorous birds in monsoon rainforests of the Northern Territory, Australia.
Biological Conservation 91, 169-180.
Primack RB and Miao SL (1992) Dispersal can limit local plant distribution.
Conservation Biology 6, 513-519.
Pulliam HR (1973) On the advantages of flocking. Journal of Theoretical Biology 38,
419-422.
Pulliam HR (1975) Diet optimization with nutrient constraints. American Naturalist
109, 765-768.
Queensland Department of Natural Resources (1997) GeoScape: Scanned Aerial
Photography. Regional South East Queensland. QDNR, Coopooroo, Brisbane.
Ratcliffe F (1932) Notes on the fruit bats (Pteropus spp.) of Australia. Journal of
Animal Ecology 1, 32-57.
Recher HF, Date EM and Ford HA (1995) The Biology and Management of Rainforest
Pigeons in New South Wales. Species Management Report No. 16, NSW
National Parks and Wildlife, Hurstville.
Reid N (1989) Dispersal of mistletoes by honeyeaters and flowerpeckers: components
of seed dispersal quality. Ecology 70, 137-145.
Renjifo LM (1999) Composition changes in a subandean avifauna after long-term forest
fragmentation. Conservation Biology 13, 1124-1139.
Restrepo C, Renjifo LM and Marples M (1997) Frugivorous birds in fragmented
neotropical forests: landscape pattern and body mass distribution. pp. 171-189 in
Laurence WF and Bierregaard RO (eds.) Tropical Forest Remnants: Ecology,
Management and Conservation of Fragmented Communities. University of
Chicago Press, Chicago.
232
Ribon R, Simon JE and de Mattos GT (2003) Bird extinctions in Atlantic Forest
fragments of the Viçosa region, southeastern Brazil. Conservation Biology 17,
1827-1839.
Richards G (1990) The spectacled flying-fox, Pteropus conspicillatus, in north
Queensland: Part 2, diet and feeding ecology and seed dispersal. Australian
Mammalogist 13, 25-31.
Richards G and Hall LS (1998) Conservation biology of Australian bats: Are recent
advances solving our problems? pp. 271-281 in Kunz TH and Racey PA (eds.)
Bat Biology and Conservation. Sminthsonian Institute Press, Washington D. C.
Richardson DM, Allsopp N, D’Antonio CM, Milton SJ and Rejmanek M (2000) Plant
invasions – the role of mutualisms. Biological Review 75, 65-93.
Ridley HN (1930) The Dispersal of Plants Throughout the World. L.Reeve and Co.
Kent, England.
Roberts B (2005) Habitat characteristics of flying fox camps in south-east Queensland.
Unpublished BSc (Hons). Thesis, Griffith University, Brisbane.
Sallabanks R and Courtney SP (1993) On fruit-frugivore relationships: variety is the
spice of life. Oikos 68: 567-570.
SAS Institute (1999) SAS Procedures Guide. Release 6.11. SAS Inc., Cary.
Saunders DA, Hobbs RJ and Margules CR (1991) Biological consequences of
ecosystem fragmentation. Conservation Biology 5:18-32.
Scanlon T and the Camphor Laurel Taskforce (2000) Camphor Laurel Kit. North Coast
Weed Advisory Committee.
http://www.northcoastweeds.org.au/camphorkit.htm.
Schaefer HM, Schmidt V and Bairlein F (2003) Discrimination abilities for nutrients:
which difference matters for choosy birds and why? Animal Behaviour 65, 531-
541.
233
Schupp EW (1988) Seed and early seedling predation in the forest understorey and in
treefall gaps. Oikos 51, 71-78.
Schupp EW (1993) Quantity, quality and the effectiveness of seed dispersal by animals.
Vegetatio 107/108, 15-29.
Schupp EW, Milleron T and Russo SE (2002) Dissemination limitation and the origin
of species-rich tropical forests. pp. 397-406 in Levey DJ, Silva WR and Galetti
M (eds.) Seed Dispersal and Frugivory: Ecology, Evolution and Conservation.
CAB International, Oxford.
Şekercioğlu CH (2006) Increasing awareness of avian ecological function. Trends in
Ecology and Evolution 21: 464-471.
Şekercioğlu CH, Ehrlich PR, Daily GC, Ayhen D, Goehring D and Sandi RF (2002)
Disappearance of insectivorous birds from tropical forest fragments.
Proceedings of the National Academy of Sciences 99, 263-267.
Şekercioğlu CH, Daily GC and Ehrlich PR (2004) Ecosystem consequences of bird
declines. Proceedings of the National Academy of Sciences 101, 18042-18047.
Shanahan M, So S, Compton SG and Corlett R (2001) Fig-eating by vertebrate
frugivores: a global review. Biological Reviews 76, 529-572.
Shilton LA, Altringham JD, Compton SG and Whittaker RJ (1999) Old World fruit bats
can be long-distance seed dispersers through extended retention of viable seeds
in the gut. Proceedings of the Royal Society B: Biological Sciences 266, 219-
223.
Sigel BJ, Sherry TW and Young BE (2006) Avian community response to lowland
tropical rainforest isolation: 40 years if change at La Selva biological station,
Costa Rica. Conservation Biology 20, 111-121.
Sieving KE and Karr JR (1997) Avian extinction and persistence mechanisms in
lowland Panama. pp. 156-170 in Laurance WF and Bierregaard RO (eds.)
234
Tropical Forest Remnants: Ecology, Management and Conservation of
Fragmented Communities. University of Chicago Press, Chicago.
Silva WR, Marco PD Jr, Hasui E and Gomes VSM (2002) Patterns of fruit-frugivore
interactions in two Atlantic forest bird communities of south-eastern Brazil:
implications for conservation. pp. 423-35 in Levey DJ, Silva WR and Galetti M
(eds.) Seed Dispersal and Frugivory: Ecology, Evolution and Conservation.
CAB International, Oxford.
Silva JMC and Tabarelli M (2000) Tree species impoverishment and the future flora of
the Atlantic forest of northeast Brazil. Nature 404, 72–73.
Silva JMC, Uhl C, Murray G (1996) Plant Succession, Landscape Management and the
Ecology of Frugivorous Birds in Abandoned Amazonian Pastures. Conservation
Biology 10, 491-513.
Snow BK (1970) A field study of the bearded bellbird in Trinidad. Ibis 112, 299-329.
Snow DW (1962) The natural history of the oilbird, Steatornis caripensis, in Trinidad,
W.I. Part 2. Population, breeding ecology and food. Zoologica 47, 199-221.
Snow DW (1971) Evolutionary aspects of fruit-eating by birds. Ibis 113, 194-202.
Snow DW (1981) Tropical frugivorous birds and their food plants: a world survey.
Biotropica 3, 1-14.
Sodhi NS, Liow LH and Bazzaz FA (2004) Avian extinctions from tropical and
subtropical forests. Annual Review of Ecology and Systematics 35, 323-345.
Southerton SG, Birt P, Porter J and Ford HA (2004) Review of gene movement by bats
and birds and its potential significance for eucalypt plantation forestry.
Australian Forestry 67: 44-53.
Spencer HJ and Fleming TH (1989) Roosting and foraging behaviour of the Queensland
Tube-nosed bat, Nyctimene robinsoni (Pteropidae): Preliminary radio-tracking
observations. Australian Wildlife Research 16, 413-420.
235
Spencer HJ, Palmer C and Parry-Jones K (1991) Movements of fruit-bats in eastern
Australia, determined by using radio-tracking. Wildlife Research 18, 463-468.
SPSS (2001) SPSS for Windows. SPSS: Chicago.
Steadman DW and Freifeld HB (1998) Distribution, relative abundance, and habitat
relationships of landbirds in the Vava’u group, kingdom of Tonga. Condor 100,
609-628.
Stiles EW (1993) The influence of pulp lipids on fruit preference by birds. Vegetatio
107/108, 227-235.
Stocker GC and Irvine AK (1983) Seed dispersal by cassowaries (Casuarius casuarius)
in north Queensland rainforest. Biotropica 15, 170–176
Stouffer PC and Bierregaard RO Jr. (1995) Use of Amazonian forest fragments by
understorey insectivorous birds. Ecology 76, 2429-2445.
Sun C, Moermond TC and Givnish TJ (1997) Nutritional determinants of diet in three
turacos in a tropical montane forest. Auk 114: 200-211.
Tabarelli M, Mantovani W and Peres C (1999) Effects of habitat fragmentation on plant
guild structure in the montane Atlantic forest of southeastern Brazil. Biological
Conservation 91, 119-127.
Tabarelli M and Peres C (2002) Abiotic and vertebrate seed dispersal in the Brazilian
Atlantic forest: implications for forest regeneration. Biological Conservation
106, 165-176.
Temple SA (1977) Plant-animal mutualism: Coevolution with dodo leads to near
extinction of plant. Science 197, 885-886.
Terborgh J (1986) Community aspects of frugivory in tropical forests. pp 371-384 in
Estrada A and Fleming TH (eds.) Frugivores and seed dispersal. Dr. W. Junk,
Dordrecht.
236
Terbourgh J and Diamond JM (1970) Niche overlap in feeding assemblages of New
Guinea birds. Wilson Bulletin 82, 29-52.
Terborgh J and Winter B (1980) Some causes of extinction. pp. 119-133 in Soule ME
and Wilcox BA (eds.) Conservation biology: An evolutionary-ecological
perspective. Sinauer Press, Sunderland, Massachusetts,
Terborgh J, Pitman N, Silman M, Schichter H, Núñez PV (2002) Maintenance of Tree
Diversity in Tropical Forests. pp 1-17 in Levey DJ, Silva WR, Galetti M (eds.)
Seed Dispersal and Frugivory. CABI Publishing, Oxon New York.
Terborgh J and Nuñez-Iturri G (2006) Disperser-free tropical forests await an unhappy
fate. pp. 241-52 in Laurance WF and Peres CA (eds) Emerging threats to
tropical forests. University of Chicago Press, Chicago.
Tewksbury JJ, Levey DJ, Haddad NM, Sargent S, Orrock JL, Weldon A, Danielson BJ,
Brinkerhoff J, Damschen EI, and Townsend P (2002) Corridors affect plants,
animals, and their interactions in fragmented landscapes Proceedings of the
National Academy of Sciences 99, 12923–12926.
Tucker NIJ and Murphy TM (1997) The effects of ecological rehabilitation on
vegetation recruitment: some observations from the wet tropics of North
Queensland. Forest Ecology and Management 99, 133-152.
Turner IM (1996) Species loss in fragments of tropical rain forest: a review of the
evidence. Journal of applied Ecology 33, 200-209.
Turner IM and Corlett RT (1996) The conservation value of small, isolate fragments of
lowland tropical rain forest. Trends in Ecology and Evolution 11, 330-333.
Turner IM, Chua KS, Ong JSY, Soong BC, Tan HTW (1996) A century of plant species
loss from an isolated fragment of lowland tropical rain forest. Conservation
Biology. 10, 1229-1244.
237
Uhl C, Clark H, Clark K and Maquirino P (1982) Successional patterns associated with
slash-and-burn agriculture in the upper Rio Negro region of the Amazon Basin.
Biotropica 14, 249-254.
van Bael SA, Brown JD, Robinson SK (2003) Birds defend trees from herbivores in a
Neotropical forest canopy. Proceedings of the National Academy of Sciences
100, 8304-8307.
van der Pijl L (1982) Principles of Seed Dispersal in Higher Plants. Springer-Verlag,
Berlin.
Walker JS (2006) Resource use and rarity among frugivorous birds in a tropical
rainforest on Sulawesi. Biological Conservation 130: 60-69.
Wang BC and Smith TB (2002) Closing the seed dispersal loop. Trends in Ecology and
Evolution 117, 379-385.
Warburton NH (1997) Structure and conservation of forest avifauna in isolated
rainforest remnants in tropical Australia. pp. 190-206 in Laurance WF and
Bierregaard RO (eds.) Tropical Forest Remnants: Ecology, Management and
Conservation of Fragmented Communities. University of Chicago Press,
Chicago.
Watson D (1989) Clearing the scrubs of south-east Queensland. pp. 365-392 in Frawley
KJ and Semple NM (eds.) Australia’s Ever Changing Forests. Proceedings o f
the First National Conference in Australian Forest History, Canberra.
Watson M, Aebischer NJ and Cresswell W (2007) Vigilance and fitness in grey
partridges Perdix perdix: the effects of group size and foraging-vigilance trade-
offs on predation mortality. Journal of Animal Ecology 76, 211-221.
Webb LJ and Tracey JG (1981) Australian rainforests: patterns and change. pp. 607-694
in Keast A (ed.) Ecological Biogeography of Australia. W. Junk, The Hague.
238
Weir JES and Corlett RT (2007) How far do birds disperse seeds in the degraded
tropical landscape of Hong Kong, China? Landscape Ecology 22, 131-140.
Wenny DG and Levey DJ (1998) Directed seed dispersal by bellbirds in a tropical cloud
forest. Proceedings of the National Academy of Science, U.S.A. 95, 6204-6207.
Westoby M and Burgman M (2006) Climate change as a threatening process. Austral
Ecology 31, 549-550.
Wheelwright NT (1983) Fruits and the ecology of resplendent quetzals. Auk 100, 286-
301.
Wheelwright NT (1985) Fruit size, gape width, and the diets of fruit-eating birds.
Ecology 66, 808-818.
Wheelwright NT (1986) A seven-year study of individual variation in fruit production
in tropical bird-dispersed tree species in the family Lauraceae. pp. 19-35 in
Estrada A and Fleming T (eds.) Frugivores and Seed Dispersal. Dr. W. Junk,
Dordrecht.
Wheelwright NT and Orians GH (1982) Seed dispersal by animals: contrasts with
pollen dispersal, problems of terminology, and constraints on coevolution.
American Naturalist 119, 402-413.
Wheelwright NT, Haber WA, Murray KG and Guindon C (1984) Tropical fruit-eating
birds and their food plants: A survey of a Costa Rican lower montane forest.
Biotropica 16, 173-192.
Whelan CJ and Willson MF (1994) Fruit choice in migrating North American birds:
Field and aviary experiments. Oikos 71, 137-151.
White TCR (1993) The Inadequate Environment: Nitrogen and the Abundance of
Animals. Springer, Berlin.
Whitmore TC (1997) Tropical forest disturbance, disappearance, and species loss. pp. 2-
28 in Laurence WF and Bierregaard RO Jr. (eds.) Tropical forest remnants:
239
Ecology, management and conservation of fragmented communities. The
University of Chicago Press, Chicago.
Wiens JA (1994) Habitat fragmentation: island v landscape perspectives on bird
conservation. Ibis 137, S97-S104.
Williams JB, Harden GJ and McDonald WJF (1984) Trees and Shrubs in Rainforests of
New South Wales and Southern Queensland. University of New England,
Armidale.
Willis EO (1974) Populations and local extinctions of birds on Barro Colorado Island,
Panama. Ecological Monographs 44, 153-169.
Willson MF and Crome FHJ (1989) Patterns of seed rain at the edge of a tropical
Queensland rain forest. Journal of Tropical Ecology 5, 301-108.
Willson MF, Irvine AK, Walsh NG (1989) Vertebrate dispersal syndromes in some
Australian and New Zealand plant communities, with geographic comparisons.
Biotropica 21, 133-147.
With KA, Gardner RH and Turner MG (1997) Landscape connectivity and population
distributions in heterogeneous environments. Oikos 78, 151-169.
Witmer MC and van Soest PJ (1998) Contrasting digestive strategies of fruit-eating
birds. Functional Ecology 12, 728-741.
Woinarski JCZ (1993) A cut-and-paste community: birds of monsoon rainforests in
Kakadu National Park, Northern Territory. Emu 93, 100-120
Wright SJ (2002) Plant diversity in tropical forests: a review of mechanisms of species
coexistence. Oecologia 130, 1-14.
Wright SJ and HC Duber (2001) Poachers and forest fragmentation alter seed dispersal,
seed survival, and seedling recruitment in the palm Attalea butyraceae, with
implications for tropical tree diversity. Biotropica 33, 583-595.

240
Wright SJ, Zeballos H, Dominguez I, Gallardo MM, Moreno MC and Ibanez R (2002)
Poachers alter mammal abundance, seed dispersal, and seed predation in a
neotropical forest. Conservation Biology 14, 227-239.
Young PAR and McDonald WJF (1987) The distribution, composition and status of the
rainforests of southern Queensland. pp. 119-142 in Werren GL and Kershaw AP
(eds.) The Rainforest Legacy: Australian National Rainforest Study Volume 1 -
The Distribution and Status of Rainforest Types. Special Australian Heritage
Publication Series Number 7 (1), Canberra.
Young A, Boyle T and Brown T (1996) The population genetic consequences of habitat
fragmentation for plants. Trends in Ecology and Evolution 11, 413-418.
Zimmerman JK, Pascarella JB and Aide TM (2000) Barriers to forest regeneration in an
abandoned pasture in Puerto Rico. Restoration Ecology 8, 350-360.