protostars in perseus: outflow‐induced fragmentation
TRANSCRIPT

THE ASTROPHYSICAL JOURNAL, 509 :733È748, 1998 December 20. The American Astronomical Society. All rights reserved. Printed in U.S.A.(
PROTOSTARS IN PERSEUS: OUTFLOW-INDUCED FRAGMENTATION
MARY BARSONY1,2Department of Physics, University of California, Riverside, CA 92521
DEREK WARD-THOMPSON
Department of Physics and Astronomy, University of Wales Cardi†, P.O. Box 913, 5 The Parade, Cardi† CF2 3YB, UK
PHILIPPE ANDRE�CEA, DSM, DAPNIA, Service dÏAstrophysique, C. E. Saclay, F-91191 Gif-sur-Yvette Cedex, France
AND
JOANN OÏLINGER3Department of Physics, University of California, Riverside, CA 92521
Received 1997 December 24 ; accepted 1998 July 24
ABSTRACTWe present new far-infrared, submillimeter, and millimeter images of candidate protostars in the
Perseus molecular cloud complex : L1448N/IRS3, L1448C, and IRAS 03282]3035. L1448N/IRS3 is nowknown to comprise three separate millimeter-continuum sources : L1448N(A) and L1448N(B), whichform a close (7A separation) binary, and L1448NW, D20A to the northwest. The new maps presentedhere include 12, 25, 60, and 100 km high-resolutionÈprocessed (HIRES-processed) IRAS images, 450 and800 km maps from the 15 m James Clerk Maxwell Telescope (JCMT), and a 1300 km bolometer arraymap of the L1448 sources from the IRAM 30 m telescope. We present new spectral energy distributions(SEDs) for L1448C, L1448NW, and IRAS 03282. We conÐrm the Class 0 status of L1448C, L1448N(A),L1448N(B), and IRAS 03282. There is evidence for a modest compact ““ disk ÏÏ component in L1448C(D0.004 We deduce that a 1.4 circumbinary envelope surrounds the D1 protobinaryM
_). M
_M
_system, L1448N(A)] L1448N(B). The dust emission from IRAS 03282 is found to be somewhatextended, on scales of 0.015È0.03 pc. Extensive HIRES-processed point-source modeling of the 100 kmemission associated with IRAS 03282 reveals an elongated structure along a north-south axis, spatiallycoincident with the previously mapped (1, 1) emission. Both the 100 km dust emission and theNH3ammonia trace the dense core from which IRAS 03282 is currently forming. We identify two distinctoutÑows in L1448N for the Ðrst time, one powered by L1448N(A) and the other by L1448N(B). A bridgeof dust emission linking L1448C to L1448N is clearly evident in our HIRES-processed 100 km map.This dust structure traces the surface where the L1448C and L1448N(A) outÑows collide. Two new 100km emission peaks are found, one coinciding with HH 197, the other with an bow-shock feature.H2Both 100 km peaks are located at positions where the blueshifted L1448C jet is deÑected. The luminosityradiated by the dust emission bridge is D6.5 which is a new estimate for the instantaneous L1448CL
_,
outÑow mechanical luminosity. We Ðnd for all of the conÐrmed Perseus Class 0L mech/L bol º 50%sources for which outÑow data are available from the literature. Thus, we conÐrm a high as aL mech/L bolnew distinguishing characteristic of Class 0 outÑows. The dynamical times for the L1448N(B) andL1448C outÑows have been revised upward to 13,000 and 32,000 yr, respectively, based on the identiÐca-tion of L1448N(B) as the powering source of HH 196 and of L1448C as the driving source of HH 267.As a consequence, the outÑow dynamical times now agree with the typical ages inferred for Class 0sources. There is strong evidence for outÑow-induced star formation in the L1448 cloud. Being older, theL1448C outÑow has disrupted and fragmented the core that is now forming the youngerL1448N(A)] L1448N(B) protobinary. The interaction of the L1448N(A) and L1448N(B) outÑows, inturn, may have produced the L1448NW condensation.Subject headings : infrared : ISM: continuum È ISM: individual (L1448, IRAS 03282]3035) È
ISM: jets and outÑows È stars : preÈmain-sequence
1. INTRODUCTION
The Perseus molecular cloud complex is among thenearest low-mass star-forming regions in the Galaxy, lyingabout 10¡ north and D100È200 pc from the Taurus darkclouds. Based on kinematic evidence, both the neighboringPer OB2 association and the Perseus molecular cloud arethought to have formed a few million years ago as the con-
1 NSF CAREER Grantee.2 NSF POWRE Visiting Professor, Physics Department, Harvey Mudd
College, Claremont, CA 91711.3 Present Address : IPAC 100-22, Caltech, Pasadena, CA 91125.
sequence of a supernova shell expanding into an ambientH I cloud & Cernicharo The Perseus cloud(Bachiller 1986a).contains B1.7] 104 of gas and dust, over a D2¡ ] 6¡M
_area, corresponding to 10 pc ] 33 pc at a distance of 300 pc& Cernicharo The dense cores (deÐned as(Bachiller 1986a).
the areas within the contours) of the PerseusAV
º 5complex include B5, IC 348, B3, B1, and a ringlike structuremade up of NGC 1333, L1455, and L1448. In this study, wefocus on two condensations, L1448 and the nameless corecontaining the source, IRAS 03282]3035.
The L1448 globule has a mass of B100 in C18OM_maps, within a B1.3 pc] 0.7 pc area, although the cor-
responding ammonia core contains just 50 over aM_
733

734 BARSONY ET AL. Vol. 509
1 pc] 0.5 pc area & Cernicharo(Bachiller 1986b ; Angladaet al. The low-mass ammonia core containing IRAS1989).03282 contains only 2 Martin-Pintado, &M
_(Bachiller,
Planesas et al. and lies in a molecular1991b ; Tafalla 1993)ridge between B1 and L1455. These cores harbor objectsthat are thought to exemplify the earliest observable protos-tellar stage.
The youngest known protostars, also known as Class 0sources, have recently been identiÐed as objects withunusually large ratios signalling the pres-L submm/L bol,ence of substantial (º0.1È0.2 gas and dust envelopesM
_)
Ward-Thompson, & Barsony(Andre� , 1993 ; Andre� 1994 ;& MontmerleAndre� 1994 ; Barsony 1994 ; Ward-ThompsonIn some cases, these surrounding envelopes have1996).
been shown to be infalling (see, e.g., et al.Myers 1995 ; Zhouet al. et al.1995 ; Ward-Thompson 1996 ; Gregersen 1997 ;
& Gregersen Class 0 sources are inferredWolf-Chase 1997).to be just a few times 104 yr old. Protostars radiate thermalenergy generated by the gravitational collapse of the inter-stellar material from which they form. This energy emergesmostly at far-infrared and submillimeter wavelengthsbecause of scattering and reprocessing of the radiation bythe surrounding dust envelope. Consequently, Class 0sources are not directly observable at wavelengths short-ward of 10 km and have continuum spectral energy dis-tributions (SEDs) that can be Ðt by single temperaturemodiÐed blackbodies with T ¹ 30 K. Surprisingly, all ofthese objects drive bipolar outÑows. The associated shock-ionized gas at the source is often detectable via its weakcentimeter-continuum emission. Because of their short life-times, such objects are extremely rare and, in a statisticalsense, are expected to account for only a few percent, bynumber, of the population of any young star cluster
Stahler & Fletcher(Barsony 1994 ; 1994a, 1994b).The search for Class 0 sources is ongoing, since only
about two dozen candidates are known, of which only ahandful have completely determined SEDs (see, e.g.,
et al. et al.Davidson 1987 ; Chandler 1990 ; Andre� 1993 ;Bachiller et al. & Barsony In this1994, 1995 ; Hurt 1996).paper, we focus on three sources in Perseus that containClass 0 candidates : L1448C, L1448N, and IRAS03282]3035 (hereafter IRAS 03282).
L1448-IRS3 is the brightest of the three Infrared Astrono-mical Satellite (IRAS) Point Source Catalog (PSC) sourcesassociated with the L1448 cloud core. It was subsequentlyfound to be associated with maser emission and a 6 cmH2Ocontinuum source, both indicators of recent star-formingactivity et al. Higher angular resolution(Anglada 1989).(42A FWHM) mapping revealed two peaks, one cen-NH3tered on the L1448-IRS3 position, the other 75A to the south
et al. Yet higher angular resolution (12A)(Bachiller 1990).molecular line mapping of CO (J \ 2 ] 1) revealed a spec-tacular, high-velocity bipolar molecular outÑow centeredon the southern ammonia peak and a weaker, lower veloc-ity, molecular outÑow of smaller extent centered on L1448-IRS3 et al. Soon thereafter, a 2 cm radio(Bachiller 1990).continuum source et al. and a strong milli-(Curiel 1990)meter continuum source Andre� , & Cabrit(Bachiller, 1991a)were both detected at the southern ammonia peak andidentiÐed as the exciting source of the high-velocity outÑow.This source is now referred to as L1448C.
The northern ammonia peak is called L1448N and con-sists of three components : L1448N(A), L1448N(B), andL1448NW. The close (7A separation) binary, consisting of
L1448N(A) and L1448N(B), was discovered via itscentimeter-continuum emission at the VLA et al.(Curiel
The third source, L1448NW, was Ðrst detected D20A1990).to the north-west of the nominal IRAS PSC position bymillimeter interferometry & Padgett(Terebey 1997).L1448N has been identiÐed by various authors as either aClass 0 or a Class I young stellar object (YSO), withoutreference to the multiple components of the system et(Ballyal. Palagi, & Felli1997 ; Persi, 1994 ; Barsony 1994 ;
et al. After the existence of three com-Bachiller 1995).ponents was established, it was suggested that all three arelikely Class 0 candidates, because of lack of any associatedpoint sources of near-infrared emission to K ¹ 18 mag
& Padgett(Terebey 1997).IRAS 03282 was Ðrst identiÐed as an object of interest
from the IRAS Point Source Catalog as a low-luminosityfar-infrared source associated with an ammonia peak
et al. These same authors discovered a(Bachiller 1991b).highly collimated, extremely high-velocity (EHV), bipolarmolecular outÑow driven by the IRAS source. Subsequentstudies found and mapped the near-infrared shocked molec-ular hydrogen emission excited by this outÑow et al.(Bally
et al.1993a ; Bachiller 1994).All three sources, L1448N, L1448C, and IRAS 03282,
have been proposed as Class 0 candidates et al.(Andre�Bachiller et al. et al.1993 ; Barsony 1994 ; 1994, 1995 ; Bally
& Padgett In order to better under-1997 ; Terebey 1997).stand the true natures of these sources, we have undertakento determine their spectral energy distributions as accu-rately as possible. By combining new IRAS high-resolutionÈprocessed (HIRES-processed) data withsubmillimeter- and millimeter-continuum mapping, wehave derived improved values of bolometric source lumi-nosities, dust temperatures, and circumstellar masses. Thelocation of these sources in the diagramMcircumstellar-L bolestablishes their evolutionary status relative to known Class0 and Class I objects & Montmerle(Andre� 1994 ; Saracenoet al. 1996).
This paper is laid out as follows : observations and datareduction techniques are described in results are pre-° 2,sented in individual sources and their outÑow properties° 3,are discussed in and the conclusions are summarized° 4,in ° 5.
2. OBSERVATIONS AND DATA REDUCTION
2.1. Millimeter Continuum Mapping : IRAM 30 mObservations
Our 1.3 mm continuum mapping of the L1448 region wascarried out with the seven-channel Max-Planck-Institut fu� rRadioastonomie (MPIfR) bolometer array at the IRAM 30m telescope located near Granada, Spain, on the evening of1993 March 6. A single ““ on-the-Ñy ÏÏ coverage correspond-ing to an e†ective Ðeld of view of D4@] 3@ (in azimuth-elevation) was taken in the dual-beam raster mode. Thespatial sampling was 4A s~1 in azimuth, the chop-throw was30A in azimuth, and the chopping frequency was 2 Hz. Themap took a total of D50 minutes, including overheads. Thepassband of the bolometers used has an equivalent width ofD70 GHz and is centered at GHz (see, e.g.,leff B 240
At this frequency, the beam size of the tele-Kreysa 1992).scope was measured by us to be D12A, using Uranus andother strong, pointlike sources such as quasars. The point-ing and focus of the telescope were checked just before andjust after the on-the-Ñy map using the bright source

No. 2, 1998 PROTOSTARS IN PERSEUS 735
L1448-N, whose peak position is known from the interfero-metric measurements of Chandler, & Andre�Terebey, (1993 ;hereafter TCA). The pointing was found to be stable tobetter than D1A. The zenith atmospheric opacity, as mea-sured by sky dips just before and just after the map ofL1448, was relatively high but stable, at an opacity ofqD 0.4. Calibration was achieved through on-o† obser-vations and on-the-Ñy mapping of Mars (see, e.g., &GrifÐnOrton and references therein) and of the secondary1993,calibrator, L1448-N. The total, absolute calibration uncer-tainty is estimated to be D20%. The dual-beam map wasrestored using the EKH algorithm Klein, &(Emerson,Haslam The Ðnal map shown in has an1979). Figure 1estimated rms noise of D30 mJy per 12A beam in its central
(observed by all channels).3@] [email protected]
2.2. Submillimeter Continuum Mapping : JCMTObservations
Submillimeter continuum observations at 800 km werecarried out at the James Clerk Maxwell Telescope (JCMT),on Mauna Kea, Hawaii, during an observing run that tookplace on the mornings of 1992 August 21È24 at 01 :30È09 :30 Hawaii Standard Time (HST) (UT\ 11 :30È19 :30).Continuum observations at 450 km were carried out duringa second observing run at the JCMT on the evenings of1993 December 27È31 at 17 :30È01 :30 HST (UT\ 03 :30È11 :30). The detector used was the common-user receiverUKT14, which contained a single-element, 3He-cooledGe:In :Sb bolometer and a series of Ðlters matched to theatmospheric transmission windows et al.(Duncan 1990).The observations were carried out while using the second-ary mirror to chop in azimuth at around 7 Hz and synchro-nously to detect the signal, thus rejecting ““ sky ÏÏ emission.Calibration was performed during the Ðrst run using theplanet Mars et al. et al. &(GrifÐn 1986 ; Orton 1986 ; GrifÐnOrton and the secondary calibrators GL 490 and GL1993)618 which were measured in all wavebands(Sandell 1994),at least once per hour. During the second run the planetswere not favorably placed, so the planet Uranus was mea-sured at the start of each shift et al. et(GrifÐn 1986 ; Ortonal. & Orton and subsequently the same1986 ; GrifÐn 1993),secondary calibrators, GL 490 and GL 618 (Sandell 1994),were used, again being measured in all wavebands at leastonce per hour. The atmospheric opacity q at 225 GHz wasmonitored by the Caltech Submillimeter Observatory radi-ometer throughout the observations and was in the range0.10È0.15 throughout the Ðrst run, when only 800 kmobservations were carried out. During the second run theopacity, q at 225 GHz, lay in the region of 0.04È0.08, allow-ing observations at 450 and 350 km to be carried out.
Using the 225 GHz opacity data and the monitoring ofcalibration sources of known intensity, values wereobtained for the atmospheric opacity and detector sensi-tivity at each wavelength. These were found to be in goodagreement with the typical values & Robson(Stevens 1994),and a fully self-consistent calibration was obtained. Alto-gether we estimate our total calibration uncertainty to beD ^ 20% at 1100 and 800 km, and D^30% at 450 and350 km. Pointing and focus checks were performed typicallyonce per hour. The focus was found to be very stablethroughout, and the pointing was observed to be accurateto typically 2AÈ3A. Photometry was carried out at all sub-millimeter wavebands during the second observing run,
using a chop throw of 60A, integration times of up to 100 s,and the 65 mm aperture setting of the bolometer, yieldingan aperture on the sky of at 1100 and 450 km, at18A.5 16A.5800 km, and at 350 km. This mode was used to make a19A.5small stepped grid map of the source L1448-C on a10A ] 10A grid spacing with 10 s point~1 at 450 km, sincethis source was too faint to map at this wavelength in anyother way under the prevailing weather conditions.
Larger, dual-beam, on-the-Ñy (OTF) maps were made at450 km of L1448N and IRAS 03282. Likewise, OTF mapswere made at 800 km of the whole of L1448 and of IRAS03282. The OTF maps were all made using a di†raction-limited aperture at each wavelength (13A and 8A at 800 and450 km, respectively). In OTF mode the telescope isscanned continuously in azimuth while simultaneouslychopping in azimuth, creating a dual-beam map, which isbuilt up row by row. The maps used chop throws of 40A and20A and map step sizes of 4A and 2A at 800 and 450 km,respectively. At 800 km, one OTF map was made of L1448and two were made of IRAS 03282. At 450 km, three OTFmaps were made of L1448N and three of IRAS 03282. All800 km OTF maps used integration times of 2 s point~1,and all 450 km OTF maps used integration times of 3 spoint~1. The maps were calibrated by making maps of theplanets Mars and Uranus in an identical manner. The resto-ration to single-beam maps used an algorithm within theJCMTDR software, which is based on that described by
et al. and all data reduction was carried outEmerson (1979),in the manner described by & Ward-MeyerdierksThompson at the Edinburgh node of STARLINK.(1995)
2.3. Far-Infrared Mapping : HIRES Processing of the IRASData
IRAS was able to complete nearly three total sky surveysby scanning of its rectangular detectors at four di†erentwavelengths. Detector responses were read out every [email protected] the scan directionÈeach such data point is called a““ footprint.ÏÏ At each wavelength, there were two subarraysof rectangular detectors, with seven or eight detectors persubarray. The average detector sizes (FWHM) were45A ] 267A, 45A ] 279A, 90A ] 285A, and 180A ] 303A at 12,25, 60, and 100 km, respectively.
Although IRAS was not originally designed as animaging instrument, past software development, includingcoaddition of the survey data (Survey Co-Adds) and Full-Resolution Survey Coadds (FRESCO), succeeded inproducing images from the IRAS survey data. Recent soft-ware developments have resulted in the possibility of signiÐ-cant improvements in IRAS image quality and resolution.Several steps are involved in producing the best currentlyavailable images from the IRAS detector responses. First,the raw IRAS data are run through the LAUNDRprogram, which uses several one-dimensional Ñat-Ðeldingand deglitching techniques to bring the background level ofadjacent tracks to a common level. An unwanted, trouble-some artifact that results from imperfect detector cali-brations across adjacent tracks is ““ striping. ÏÏ Destripingalgorithms are now implemented in both the LAUNDRpackage and in the image construction software YORIC tominimize this problem et al.(Cao 1996).
HIRES (High-Resolution) processing of the IRAS data isimplemented in the YORIC program developed at the

736 BARSONY ET AL. Vol. 509
Infrared Processing and Analysis Center (IPAC), which4uses the maximum correlation method (MCM) described by
Fowler, & Melnyk At each iteration,Aumann, (1990).YORIC creates simulated IRAS detector responses to aninput image, compares these simulated responses to theactual detector responses recorded by IRAS in the area ofsky to be simulated, and calculates correction factors foreach image pixel (the default pixel size being 15A) based onstatistical correlations. The calculated correction factors arethen applied to the input image, which becomes the nextoutput image for further iterations of the algorithm. Priorto the development of YORIC /HIRES, images from theIRAS data were produced by FRESCO, which is essentiallyequivalent to one iteration of HIRES processing.
Default HIRES processing, which can be requested remo-tely via electronic mail to IPAC, typically halts at 20 iter-ations of the MCM algorithm. SigniÐcant improvements inimage resolution may be attained past 20 iterations,however, depending on the data set in question. In theseminal paper by et al. the example provid-Aumann (1990),ed was a 60 km image of the galaxy M101 after 60 iter-ations, whereas & Barsony found signiÐcantHurt (1996)resolution improvement after 150 iterations at 60 and 100km in the Serpens star-forming core.
In order to derive IRAS Ñuxes in confused regions, point-source modeling o†ers signiÐcant advantages over simplesoftware aperture photometry of the HIRES-processedIRAS survey images & Barsony We therefore(Hurt 1996).created simulated data at each waveband, consisting ofpoint-source spikes of speciÐed height, inserted (initially) atthe published locations of the embedded objects, as input toHIRES. The resulting HIRES-processed point-sourcemodels were then compared with the HIRES-processedIRAS survey images. If the contour-mapped morphology ofan object could not be matched using a single input spikemodel, multiple input spikes were used to simulate a singlesource. The Ñux heights, number of input spikes, and spikepositions were adjusted until the simulations resembled theHIRES-processed survey data as closely as possible, interms of contour-mapped morphologies, the Ñux-weightedcentroid positions, and the total integrated Ñuxes. Theadvantage of point-source modeling over aperture photo-metry for extracting Ñuxes is that the input Ñuxes for thebest-match image to the IRAS survey data are known,whereas simple software aperture photometry su†ers fromuncertainties as to the ““ correct ÏÏ aperture size to use andthe systematic e†ects introduced by the processing algo-rithm itself.
Since the iterative point-source modeling describedabove is computationally intensive and time consuming andrequires human intervention, we installed the HIRES-processing software on the University of California River-side SUN SparcStations so we could run YORIC locally.We obtained the IRAS LAUNDR data for L1448 andIRAS 03282 directly from IPAC. At this stage in the pro-cessing, the raw data had already been corrected for cosmic-ray hits, detector glitches, and some of the cross-scanstriping artifacts. The data had also been baseline sub-tracted and a Ñux bias had been applied to prevent clippingof negative noise in the subsequent processing. We usedYORIC v1.87 for processing of the L1448 data and YORIC
4 The Infrared Processing and Analysis Center (IPAC) is funded byNASA as part of the Infrared Astronomical Satellite (IRAS) extendedmission under contract to the Jet Propulsion Laboratory (JPL).
v2.11 to process the IRAS 03282 data. The signiÐcant newimprovements in YORIC v2.11 include better treatment ofextended background emission and the implementation of anew destriping algorithm et al.(Cao 1996).
The irregular sampling of the sky brightness by sub-sequent passes of the IRAS detectors results in variablespatial resolution across a HIRES-processed image. Wetherefore quote ““ e†ective ÏÏ resolutions at each waveband,obtained by averaging the point-source responses sampledon a rectangular grid throughout each image. The e†ectiveresolutions of our HIRES-processed images of the L1448Ðeld are D35A ] 28A at 12 km and 25 km, 35A ] 37A at 60km, and 45A ] 40A at 100 km. For the IRAS 03282 Ðeld, thee†ective beam sizes are 33A ] 36A at 60 km, and 40A ] 39Aat 100 km. The standard deviations from these values rangefrom 14% to 22%. The e†ective resolutions at 100 km areapproaching the di†raction limit. The default pixel size of15A was used.
Absolute calibration uncertainty for HIRES-derivedÑuxes is estimated to be 20% & Surace For(Levine 1993).those wavebands/sources for which more than a singlepoint-source component was required to most faithfullyreproduce the observed emission, the derived Ñuxes for eachinput point source can vary by as much as 8% withoutsigniÐcantly altering the source emission morphology. Wetherefore estimate overall 22% uncertainties for the quotedÑux values in confused regions.
3. RESULTS
3.1. L 1448C and L 1448NWe present the 1300 km continuum map of L1448C and
L1448N in Both L1448C, the famous outÑowFigure 1.source, and L1448N, the stronger, northern emission peak,are resolved by our data. For L1448C, we derive a decon-volved Gaussian source size of with a 12A18A.5 ] 15A.5beam. The positions of the three components of L1448NÈ
FIG. 1.È1.3 mm continuum emission map of L1448N and L1448Cfrom the IRAM 30 m telescope. The seven-element MPIfR bolometerarray map presented here has contour levels starting at [100 mJy per 12Abeam, then at ]100 mJy beam~1 up to the peak level of 1400 mJy beam~1in 100 mJy beam~1 steps. The map noise level is at 30 mJy beam~1. Thefour known millimeter-continuum sources in the region are indicated.

No. 2, 1998 PROTOSTARS IN PERSEUS 737
L1448N(A), L1448N(B), and L1448NWÈare indicated bystars in Although the 7A binary, composed ofFigure 1.L1448N(A) and L1448N(B), remains unresolved, we clearlydetect L1448NW, allowing an estimate its 1.3 mm Ñux.
The 800 km JCMT map encompassing L1448C andL1448N is presented in The formal deconvolved,Figure 2.nonaxisymmetric Gaussian source size for L1448C at 800km is along the major axis at P.A. 130¡, in an 18A13A.4beam, with the source being unresolved along the minoraxis. In both Figures and L1448C appears somewhat1 2,elongated along a northwest-southeast axis, hinting at anonaxisymmetric dust envelope structure. The locations ofthe three subcomponents of L1448N are indicated in Figure
by the stars. Again, the northwest extension in the lowest2contours allows a separate Ñux estimate for L1448NW.
shows our 450 km step-mapped image ofFigure 3L1448C, covering an area D1@] 1@ at 18A resolution.L1448C is not resolved by these observations. Figure 4shows our 450 km on-the-Ñy map of L1448N, at 8Aresolution, covering a 35A ] 35A area. The close (7A) binary,L11448N(A) and L1448N(B), is located near the center of
and remains unresolved. L1448NW lies just o† ourFigure 4450 km map.
FIG. 2.ÈL1448C and L1448N 800 km isophotal contour map, super-posed on a gray-scale image of L1448 at 800 km. The sources, L1448C andL1448N, are clearly seen. The positions of the four known millimeter-continuum sources in the region are indicated by stars. The 1 p noise levelof this map is 0.33 Jy per 13A beam. The base contour level is 3 p, at 1 Jy per13A beam, and the contour interval is 0.5 Jy per 13A beam. The (0, 0)position of the map is at Thisa1950\ 03h22m33s.0, d1950\]30¡[email protected] was made in dual-beam, on-the-Ñy scanning mode, with a step size of4A, a beam size of 13A, and a chop-throw of 40A.
FIG. 3.ÈL1448C 450 km isophotal contour map, superposed on agray-scale image of L1448C at 450 km. The source, L1448C, is clearlydetected. The 1 p noise level of the map is 0.75 Jy per 18A beam. The basecontour level is 8 p, at 6 Jy per 18A beam, and the contour interval is 4 Jyper 18A beam. The (0, 0) position of the map is at a1950\ 03h22m34s.3,
This map was made in stepped grid-mapping mode,d1950\]30¡[email protected] a step size of 10A, a beam size of 18A, and a chop-throw of 60A. Hencethis map is marginally undersampled, and the source is unresolved.
Figures and show our 120-iteration 60 km and 1005a 5bkm HIRES-processed IRAS maps, respectively, of the [email protected]
region encompassing both L1448C and L1448N. This] [email protected] the Ðrst time L1448C and L1448N have been clearlyimaged at these wavelengths et al. The(Bachiller 1991a).
FIG. 4.ÈL1448N 450 km isophotal contour map, superposed on agray-scale image of L1448N at 450 km. The positions of L1448N(A) (theweaker, northern source) and L1448N(B) (the stronger, southern source)are indicated by stars. This protobinary is unresolved by our data.L1448NW lies to the northwest, just outside the mapped area. The 1 pnoise level is 0.66 Jy per 8A beam. The base contour level is 3 p, at 2 Jy per8A beam, and the contour interval is 2 Jy per 8A beam. The (0, 0) position ofthe map is at This map wasa1950\ 03h22m31s.7, d1950\]30¡[email protected] in dual-beam, on-the-Ñy scanning mode, with a step size of 2A, abeam size of 8A, and a chop-throw of 20A.

738 BARSONY ET AL. Vol. 509
FIG. 5.È60 km and 100 km HIRES IRAS images of L1448C andL1448N. Comparison of HIRES-processed IRAS maps of L1448N andL1448C at (a) 60 km and at (b) 100 km after 120 iterations, with identicallyHIRES-processed, point-source models at (c) 60 km and at (d) 100 km.Contour levels for (a) and (c) (60 km) are 40È200 MJy sr~1 in steps of 40,then 280È1320 MJy sr~1 in increments of 80. The contour levels for (b) and(d) (100 km) are at 390È930 MJy sr~1 in steps of 60. The 1 p noise level is atD3.2 and 10.1 MJy sr~1 for the 60 km and 100 km maps, respectively. Thefour known millimeter-continuum sources in the region are indicated bystars. The locations of the input spikes that were used to simulate theextended IRAS emission are marked by crosses. Note that the point-sourcemodel in (d) cannot reproduce the central 100 km emission peak evident inthe data and associated with HH 197.
four known millimeter-continuum sources in the region,L1448C, L1448N(A), L1448N(B), and L1448NW, are indi-cated by stars in all panels of et al.Figure 5 (Guilloteau
et al. & Padgett There1992 ; Bachiller 1995 ; Terebey 1997).is 100 km emission originating from the region betweenL1448C and L1448N in the map of FiguresFigure 5b. 5cand show the best-Ðt HIRES-processed point-source5dmodels to the HIRES-processed IRAS maps presented inFigures and Note that the presence of extended 1005a 5b.km emission between L1448N and L1448C is further cor-roborated by the fact that this structure could not be well Ðtvia simple point-source modeling (compare Figs. and5b 5d).The locations of the model input point sources used togenerate the model contour plots of Figures and are5c 5dindicated by crosses. The input point-source coordinatesand Ñuxes used to generate these best-Ðt models are listed inTable 1.
Figures and show our 40-iteration, 12 km and 256a 6bkm HIRES-processed IRAS maps, respectively, of the [email protected]
region encompassing both L1448C and L1448N.] [email protected], the four known millimeter continuum sources in theregion are indicated by stars in all the panels of Figure 6.Figures and show the corresponding best-Ðt HIRES-6c 6dprocessed point-source models to the HIRES-processedIRAS maps presented in Figures and The locations of6a 6b.the input point sources used to generate the model contourplots of Figures and are indicated by crosses. The6c 6dcorresponding coordinates and locations of the model inputpoint-source spikes are listed in Table 1.
FIG. 6.È12 km and 25 km HIRES IRAS Images of L1448C andL1448N. Comparison of HIRES-processed IRAS maps of L1448N andL1448C at (a) 12 km and at (b) 25 km after 40 iterations, with identicallyHIRES-processed point-source models at (c) 12 km and at (d) 25 km.Contour levels for (a) and (c) (12 km) are 4È8 MJy sr~1 in steps of 1, then11È23 MJy sr~1 in increments of 3. The contour levels for (b) and (d) (25km) are 50È320 MJy sr~1 in increments of 30. The 1 p noise levels are atD1.3 and 2.0 MJy sr~1 in the 12 km and 25 km maps, respectively. Thefour known millimeter-continuum sources in the region are indicated bystars. The locations of the input spikes that were used to simulate theextended IRAS emission are marked by crosses.
lists the new millimeter, submillimeter, and far-Table 2infrared photometry for the L1448 sources derived from themaps we have presented in Figures Apart from the 3501È6.km and 1100 km data from the JCMT, which were derivedfrom single pointings, all the Ñuxes listed in column (4) of
are integrated Ñux values. We also list previouslyTable 2published Ñuxes (and references) for each source in Table 2,where applicable, for comparison purposes.
3.2. IRAS 03282]3035 (IRAS 03282)shows our 800 km JCMT map of the 1@] 1@Figure 7
region surrounding IRAS 03282 at 13A resolution. A formalGaussian deconvolution gives a source size of 24A.1 ] 10A.3for IRAS 03282 at 800 km. shows the 450 kmFigure 8JCMT map of IRAS 03282 at 8A resolution. The formalGaussian deconvolved source size is 16A.6 ] 9A.7.
Figures and show our 100th-iteration, HIRES-9a 9bprocessed IRAS survey images of IRAS 03282 at 60 km and100 km, respectively. Figures and show the corre-9c 9dsponding HIRES-processed point-source models to theIRAS emission of Figures and In all four panels, the9a 9b.millimeter continuum source position is indicated by thestar et al. this paper). The crosses in Figures(Bachiller 1994 ;
and indicate the positions of the model input spikes9c 9dthat were required to generate the contour plots displayedin the bottom panels. The coordinates and Ñuxes of theinput spikes that went into the point-source models of theIRAS HIRES emission are listed in Table 1. Figure 10shows the locations of the 100 km point-source spikes thatbest reproduce the HIRES emission as plusses superposedon the single-dish ammonia map of et al.Bachiller (1991b).

No. 2, 1998 PROTOSTARS IN PERSEUS 739
TABLE 1
HIRES MODEL INPUT SPIKES FOR ALL SOURCES
SPIKE HEIGHT (Jy) AT j
SOURCE a (B1950.0) d (B1950.0) 12 km 25 km 60 km 100 km
L1448Ca . . . . . . . . . . 3 22 34.3 30 33 35L1448C . . . . . . . . . . . 3 22 34.3 30 33 30 0.06 1.65 19.05 59.9
3 22 35.5 30 33 30 0.14 1.28 12.1 10.43 22 37.8 30 33 30 0.13 0 0 0
L1448N(A)b . . . . . . . 3 22 31.93 30 34 51.0L1448N(B)b . . . . . . . 3 22 31.79 30 34 44.91L1448NWb . . . . . . . 3 22 31.10 30 35 03.80L1448N . . . . . . . . . . . 3 22 32.0 30 34 45 0.33 3.28 14.9 13.0
3 22 33.2 30 35 0 0.33 1.39 6.20 03 22 32.0 30 35 0 0.01 0.99 2.60 2.803 22 30.8 30 35 0 0 0 2.12 34.23 22 34.3 30 34 30 0 0 3.0 03 22 32.0 30 34 30 0 0 0 39.0
IRAS 03282c . . . . . . 3 28 15.8 30 35 20IRAS 03282 . . . . . . 3 28 16.4 30 34 59 0 0 0.10 4.15
3 28 15.2 30 34 59 0 0 0.22 0.153 28 17.5 30 35 14 0 0 0.08 03 28 16.4 30 35 14 0 0 0.52 1.103 28 15.2 30 35 14 0 0 0.59 0.153 28 14.0 30 35 14 0 0 0.03 03 28 17.5 30 35 29 0 0 0.08 03 28 16.4 30 35 29 0 0 0.22 2.853 28 15.2 30 35 29 0 0 0.48 1.03 28 16.4 30 35 44 0 0 0 1.153 28 15.2 30 35 44 0 0 0 0.453 28 15.2 30 35 59 0 0 0 0.05
NOTE.ÈUnits of right ascension are hours, minutes, and seconds, and units of declination aredegrees, arcminutes, and arcseconds.
a Position from et al.Bachiller 1991a.b Position from S. Terebey 1997 (private communication).c Position from et al.Bachiller 1994.
FIG. 7.ÈIRAS 03282 800 km isophotal contour map, superposed on agray-scale image of IRAS 03282 at 800 km. The source, IRAS 03282, isclearly detected. The 1 p noise level of the map is 0.2 Jy per 13A beam. Thebase contour level is 1.5 p, at 0.3 Jy per 13A beam, and the contour intervalis 0.2 Jy per 13A beam. The (0, 0) position of the map is at a1950\
This map was made in dual-beam,03h28m15s.8, d1950\]30¡[email protected]Ñy scanning mode, with a step size of 4A, a beam size of 13A, and achop-throw of 40A.
IRAS 03282 remains undetected at 12 and 25 km to 3 pupper limits of 0.18 and 0.29 Jy, respectively. The sub-millimeter and far-infrared photometry for IRAS 03282derived from the images presented in Figures and is7, 8, 9
FIG. 8.ÈIRAS 03282 450 km isophotal contour map, superposed on agray-scale image of IRAS 03282 at 450 km. The source, IRAS 03282, isclearly detected. The 1 p noise level of the map is 0.15 Jy per 8A beam. Thebase contour level is 2 p, at 0.3 Jy per 8A beam, and the contour interval is0.2 Jy per 8A beam. The (0, 0) position of the map is at a1950\ 03h28m15s.8,
This map was made in dual-beam, on-the-Ñy scan-d1950\]30¡[email protected] mode, with a step size of 2A, a beam size of 8A, and a chop-throw of20A.

740 BARSONY ET AL. Vol. 509
TABLE 2
FLUXES FOR L1448C, L1448N, AND IRAS 03282
j Beam Fluxa Previous FluxSource Name (km) (arcsec) (Jy) (Jy) References
(1) (2) (3) (4) (5) (6)
L1448C . . . . . . . . . . 12 35] 28 0.33 ^ 0.07 0.2 ^ 0.1 125 35] 28 2.9 ^ 0.6 1.7 ^ 0.5 160 35] 37 31.2 ^ 6.5 D25 1
100 45] 40 70.3 ^ 14.8 D75 1350 19.5] 19.5 30 ^ 3.0450 18.5] 18.5 21 ^ 2.0800 16.5] 16.5 3.0 ^ 0.3
1100 18.5] 18.5 1.0 ^ 0.11300 12] 12 1.0 ^ 0.1 0.58b 12600 3] 2.5 0.091^ 0.002c 23500 2.8] 2.1 0.026^ 0.002d 1, 3
L1448N . . . . . . . . . . 12 35 ] 28 0.67 ^ 0.15 0.61 ^ 0.05 425 35] 28 5.7 ^ 1.2 5.2 ^ 0.4 460 35] 37 28.8 ^ 6.1 25 ^ 5 4
100 45] 40 89.0 ^ 18.7 167 ^ 23 4350 19.5] 19.5 45.0 ^ 3.0450 18.5] 18.5 28.0 ^ 2.0800 16.5] 16.5 5.8 ^ 0.4
1100 18.5] 18.5 2.3 ^ 0.21300 12] 12 2.2 ^ 0.1 1.4b 52600 3] 2.5 0.185 2, 52720 7.5] 6.6 0.225e 5
L1448NW. . . . . . . . 12 35 ] 28 ¹0.01525 35] 28 ¹0.0560 35] 37 3.2 ^ 0.5
100 45] 40 23 ^ 7.5800 16.5] 16.5 2.0 ^ 0.5
1300 12] 12 0.4 ^ 0.12720 7.5] 6.6 ¹0.021 5
IRAS 03282 . . . . . . 12 34] 29 ¹0.18 ¹0.25 625 37] 35 ¹0.29 ¹0.25 660 33] 36 2.32 ^ 0.5 2.29 6
100 40] 39 11.05 ^ 2.4 13.5 6350 19.5] 19.5 9.1 ^ 1.0450 18.5] 18.5 5.9 ^ 1.0800 16.5] 16.5 1.4 ^ 0.1 D1.5 7
1100 18.5] 18.5 0.58 ^ 0.05 D0.4 71300 12] 12 0.3 7
a Error bars quoted are 1 p, upper limits are 3 p. Absolute calibration uncertainties are listedin ° 2.2.
b Quoted value is for peak Ñux.c Of this 91 mJy, 41 mJy are associated with the central source and 50 mJy with extended
emission along the outÑow axis.et al. attribute 16 mJy to the central source and 10 mJy to the componentd Guilloteau 1992
associated with the outÑow. Bachiller et al. attribute 12 mJy to the central source.1991ae This is a lower limit to the total source Ñux at this frequency.REFERENCES.È(1) et al. (2) et al. (3) et al. (4)Bachiller 1991a ; Bachiller 1995 ; Guilloteau 1992 ;
& Cernicharo (5) et al. (6) et al. (7) et al.Bachiller 1986b; Terebey 1993 ; Bachiller 1991b; Bachiller1994.
listed in For comparison, in we also listTable 2. Table 2previously published Ñuxes for IRAS 03282.
4. DISCUSSION
4.1. L 1448C4.1.1. Source Properties and Envelope versus Disk
Contribution to Emission
The millimeter, submillimeter, and far-infrared maps ofL1448C presented in Figures and are consistent1, 2, 3, 5, 6with a dust envelope extent of D13AÈ19A. For comparison,the dust envelope of the prototypical Class 0 source, VLA1623, would have an angular diameter of 15A at the distanceof Perseus.
shows the spectral energy distribution ofFigure 11aL1448C derived from the photometry listed in columns (2)
and (4) of The solid curve represents a single-Table 2.temperature, modiÐed blackbody Ðt to these data, of theform
Sj \ Bj(Td)(1[ e~qj)d) , (1)
assuming a 16A source diameter and a j~1.5 wavelengthdependence of the dust optical depth. The values of the dusttemperature, and of the 250 km optical depth,T
d, q250,derived from this Ðt are listed in Table 3.
In their analysis of infall envelope density proÐlesobserved at varying resolutions, assumed a densityTCAdistribution approaching o(r) P r~3@2 and a radial tem-perature variation, T (r) P r~0.4, in a typical protostellarinfall envelope. Based on such a model, predict theTCAratio of 2.7 mm Ñux in an 8A beam to the 1.3 mm Ñux in a12A beam to be D1/20. Applying this scaling law to the

No. 2, 1998 PROTOSTARS IN PERSEUS 741
FIG. 9.È60 km and 100 km HIRES IRAS images of IRAS 03282. Com-parison of HIRES-processed IRAS maps of IRAS 03282 at (a) 60 km andat (b) 100 km after 120 iterations, with identically HIRES-processed point-source models at (a) 60 km and at (b) 100 km. Contour levels for (a) and (c)(60 km) start at 3 p and are spaced by 1 p (D3.2 MJy sr~1). Contour levelsfor (b) and (d) (100 km) start at 3 p and are spaced by 1.2 p, where 1 p is 7.5MJy sr~1. The star indicates the millimeter-continuum source position
et al. The positions of the model point-source spikes(Bachiller 1994)required to produce the model emission maps (c) and (d) are indicated bycrosses. Whereas the 60 km emission region is closely associated with theredshifted outÑow cavity, the 100 km emission region model traces thedense (1, 1) core in both spatial extent and orientation.NH3
integrated 1.3 mm Ñux (1 Jy) for L1448C reported in thiswork predicts a value of D50 mJy for L1448C at(Table 2)2.7 mm in an 8A beam. The observed 2.6 mm Ñux in a
beam associated with L1448C consists of two com-3A] 2A.5ponents : a compact, 41 ^ 2 mJy source, marginally resolv-ed in the east-west direction, with a spatial extent, and1A.550 mJy of ““ extended ÏÏ emission that coincides fairly wellwith the outÑow axis. Since the total 2.6 mm Ñux (D90 mJy)from L1448C integrated over an e†ective 8A beam exceedsthe 50 mJy expected from an infall envelope alone, theobserved compact emission may originate from an accre-tion disk. A strict lower limit to this disk mass can bederived using assuming optically thin radi-equation (2),ation from a diameter source at 40 K, 300 pc awayÈthis1A.5calculation gives 0.004 as a lower limit (using the massM
_
FIG. 10.È100 km emission from the IRAS 03282 ammonia core ThisÐgure shows the contour map of the 1) emission from etNH3(1, Bachilleral. with the positions of the best-Ðt 100 km point-source model(1991b)spikes to the IRAS HIRES emission superposed (see also TheFig. 9d).Ðlled star indicates the IRAS PSC position, and the open star indicates themillimeter-continuum position et al. The small dots indi-(Bachiller 1994).cate positions of the telescope pointings used to produce the ammoniamap. Although the HIRES-processed 100 km contours from IRAS 03282appear elongated in an almost east-west direction, the point-source model-ing of this emission (as shown in this Ðgure and in reveals that theFig. 9d)true shape of the 100 km emitting region in IRAS 03282 follows the north-south distribution evident in the ammonia core.
calculation detailed below). Of course, it is highly likely thatthe disk component is optically thick, and, furthermore, it ismost likely highly (D80¡) inclined to our line of sight. Asimilar relatively weak, unresolved central emission com-ponent on small scales has been detected at millimeter andsubmillimeter wavelengths in the prototypical Class 0source, VLA 1623 et al. The source of this(Pudritz 1996).emission is interpreted as a small-scale (¹175 AU) accre-tion disk with a disk mass M
dº 0.03M
_.
Some of the source properties we can derive from themodel Ðts to the SED of L1448C are listed in WeTable 3.list two values for the bolometric luminosity, oneL bol,obtained by integrating under the single dust temperatureSED Ðt, the other by integrating under a curve that passesthrough all the data, including the ““ excess ÏÏ mid-IR (orupper limit) points. We can also derive values for the cir-cumstellar mass, and the inferred central source mass,M
c,
Infall envelope dust masses are derived from theM*.
TABLE 3
DERIVED SOURCE PROPERTIES
d)(diameter) Tdust L bola L bolbSource (arcsec) (K) q250 km (L
_) (L
_) L submm/L bolb L bol/(103] L 1.3 mm)b
(1) (2) (3) (4) (5) (6) (7) (8)
L1448C . . . . . . . . . . 16 24 0.05 9.3 8.1 0.02 8.7L1448Nc . . . . . . . . . 20 22.5 0.06 13.6 10.6 0.03 7.0L1448NW. . . . . . . . 10 22 0.07 2.7 0.045 4.3IRAS 03282 . . . . . . 20 19.5 0.04 1.8 1.55 0.05 4.1
b These values of the bolometric luminosity are derived from integrating under the single Ðt curves only.Tda These are upper limits for source bolometric luminosities, in that these values are calculated from curves that
pass through all the data points, including those showing excess 12 and 25 km emission above the single Ðts (withTdupper limits assumed to be measured points).
c Values include all emission from the L1448N region.

742 BARSONY ET AL. Vol. 509
FIG. 11.ÈSEDs of L1448C, L1448NW, and IRAS 03282. (a) SED forL1448C. Filled triangles represent new IRAS photometry (this work), plussigns indicate photometry from the JCMT (this work), the Ðlled circlerepresents the IRAM 30 m data (this work), and the crosses indicate milli-meter photometry taken from the literature (see for references).Table 2The parameters of the plotted modiÐed blackbody Ðt are a 16A sourcediameter, K, and b \ 1.5 (where (b) SED forT
d\ 24 q250\ 0.05, qj P j~b).
L1448NW. The upper limit and the Ðlled triangles represent new IRASphotometry (this work), the plus sign indicates our estimate of the 800 kmÑux from the image presented in the Ðlled circle indicates the 1.3 mmFig. 2,Ñux estimated from the image presented in (this work). The param-Fig. 1eters of the plotted modiÐed blackbody Ðt are a 10A source diameter,
K, and b \ 1.5. (c) SED of IRAS 03282. Upper limitsTd\ 22 q250\ 0.07,
and Ðlled triangles represent new IRAS photometry (this work), plus signsindicate photometry from the JCMT (this work), and the Ðlled circle rep-resents the IRAM 30 m data (this work). The parameters of the plottedmodiÐed blackbody Ðt are a 20A source diameter, K,T
d\ 20 q250 \ 0.04,
and b \ 1.5.
formula (Hildebrand 1983)
Mc\ Sj d2
ij Bj(Td), (2)
evaluated at 1.3 mm with cm2 g~1i1.3 mm\ 0.01 (Andre�1994).
For L1448C, we derive a source luminosity of 8 fromL_the single-temperature, best-Ðt SED curve of inFigure 11a,
good agreement with previous determinations (Bachiller etal. et al. Our derived envelope1991a, 1995 ; Andre� 1993).
mass, using the above formula, is 1.4 again in goodM_
,agreement with previous determinations et al.(Bachiller
We can estimate a central, accreting core mass if we1995).assume all of the observed luminosity is accretion lumi-nosity and if we adopt reasonable values for the infall rateand central source radius. For an infall rate of 10~6 M
_yr~1 (10~5 yr~1) and a 3 radius, the central accret-M_
R_ing core mass should be 0.8 (0.08) for L1448C.M
_4.1.2. OutÑow/Dust Interactions
The above source parameters for L1448C were derivedassuming a simple, spherically symmetric source structure.However, there is distinct evidence for nonaxisymmetricsubstructure within the dust envelope around L1448C inour data. The elongation of the 1.3 mm continuum contoursin is precisely along the jet axis, and the slightFigure 1distortion of the contours along an east-west direction has acounterpart in the 2.6 mm continuum emission as mappedby the Plateau de Bure interferometer et al.(Bachiller 1995).The westerly extension in the lowest 800 km contours hascounterparts in both the 1.3 mm and the 2.6 mm continuumdata. Upon comparison with the 0 km s~1 CO J \ 1 ] 0emission mapped by et al. it becomesBachiller (1995),apparent that much of the observed 800 km structure ofL1448C seen in traces the blueshifted outÑowFigure 2cavity.
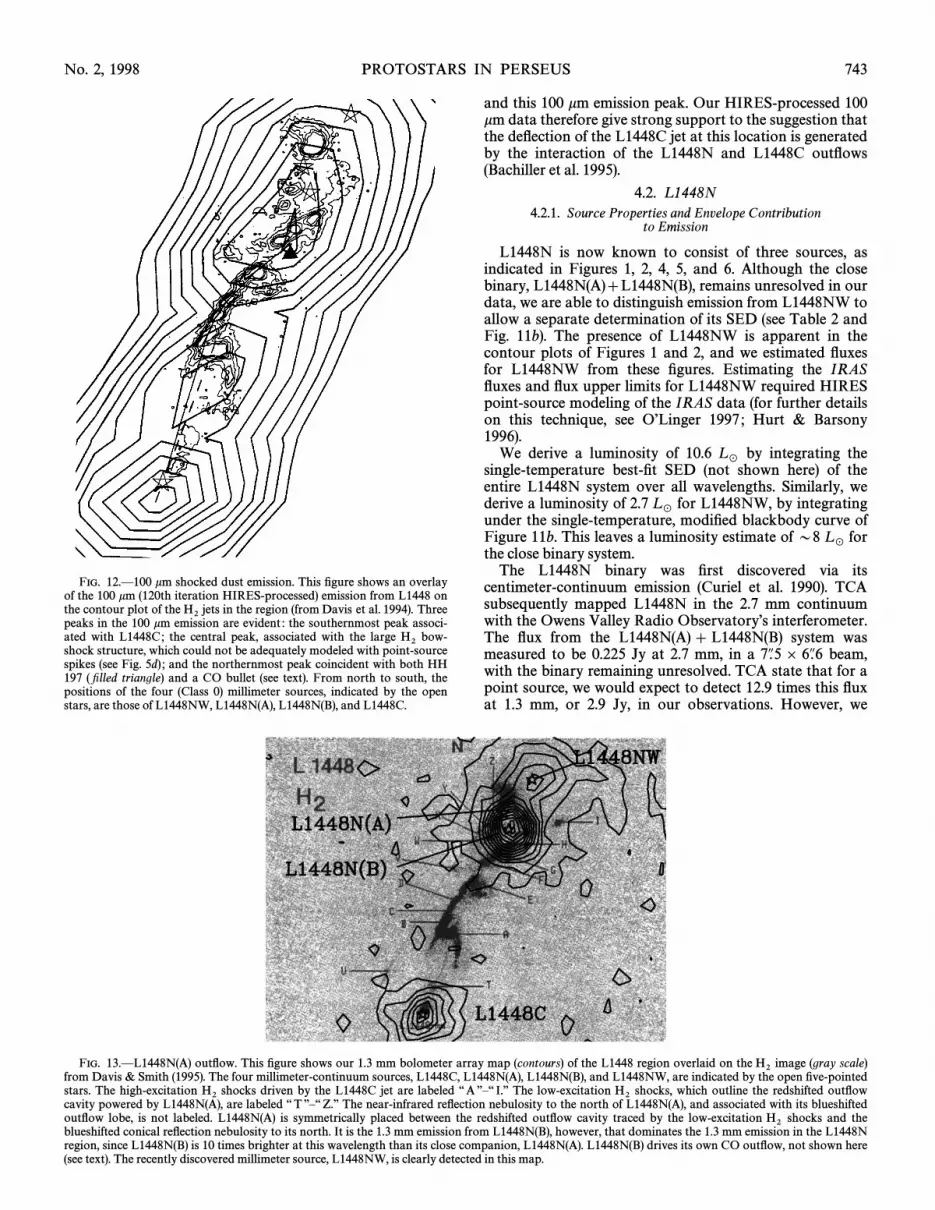
Our most dramatic Ðndings of dust/outÑow interactionsin the L1448C outÑow can be seen in Figure 12. Figure 12shows our 100 km contour map superposed on the con-H2tours of et al. The blueshifted L1448C jet isDavis (1994).inferred to bend through 20¡ along its entire length via aseries of knots produced by oblique shocks Lada,H2 (Bally,& Lane et al. et al.1993b ; Davis 1994 ; Bachiller 1994).Three 100 km emission peaks are apparent in theFigure 12 :southernmost peak coincides with L1448C, while thecentral and northernmost peaks are associated with dust/outÑow interaction regions that are discussed below.
Our 100 km data provide evidence for deÑection of theL1448C jet at two separate locations. The Ðrst jet bending,evident as an emission peak in the 100 km HIRES-processed IRAS data, coincides with the large, bow shockÈlike feature in the image. In addition, this central 100 kmH2peak is not associated with any other known embeddedobject. Clearly, the dust emission, as traced by the 100 kmdata, is closely associated with this bow shock. TheH2second jet bending for which there is evidence in the 100 kmmap of occurs near L1448N, at the northernmostFigure 12100 km emission peak. The position of this 100 km peakcoincides with a previously identiÐed CO bullet (designated““ B3 ÏÏ by et al. and the recently discoveredBachiller 1990)HH whose location is indicated by the Ðlled triangle.197,5The high-excitation knots, F, G, and H, associated withH2the blueshifted L1448C outÑow, and the low-excitation H2knots, X and Z, associated with the redshifted outÑow fromL1448N(A), identiÐed by & Smith and shownDavis (1995)in are all associated with this northern 100 kmFigure 13,peak. It is apparent that a large fraction of the 100 km IRASemission associated with L1448N actually has its origin inan interaction region between these two distinct outÑows.SigniÐcant bending of the L1448C jet occurs near HH 197
5 The position of HH 197 was inadvertently listed incorrectly in Table 1of et al. its correct position is : (B1950.0) 30¡34@30ABally (1997) ; 03h22m32s.2,(D. Devine 1997, private communication).
No. 2, 1998 PROTOSTARS IN PERSEUS 743
FIG. 12.È100 km shocked dust emission. This Ðgure shows an overlayof the 100 km (120th iteration HIRES-processed) emission from L1448 onthe contour plot of the jets in the region (from et al. ThreeH2 Davis 1994).peaks in the 100 km emission are evident : the southernmost peak associ-ated with L1448C; the central peak, associated with the large bow-H2shock structure, which could not be adequately modeled with point-sourcespikes (see and the northernmost peak coincident with both HHFig. 5d) ;197 ( Ðlled triangle) and a CO bullet (see text). From north to south, thepositions of the four (Class 0) millimeter sources, indicated by the openstars, are those of L1448NW, L1448N(A), L1448N(B), and L1448C.
and this 100 km emission peak. Our HIRES-processed 100km data therefore give strong support to the suggestion thatthe deÑection of the L1448C jet at this location is generatedby the interaction of the L1448N and L1448C outÑows
et al.(Bachiller 1995).
4.2. L 1448N4.2.1. Source Properties and Envelope Contribution
to Emission
L1448N is now known to consist of three sources, asindicated in Figures and Although the close1, 2, 4, 5, 6.binary, L1448N(A)]L1448N(B), remains unresolved in ourdata, we are able to distinguish emission from L1448NW toallow a separate determination of its SED (see andTable 2
The presence of L1448NW is apparent in theFig. 11b).contour plots of Figures and and we estimated Ñuxes1 2,for L1448NW from these Ðgures. Estimating the IRASÑuxes and Ñux upper limits for L1448NW required HIRESpoint-source modeling of the IRAS data (for further detailson this technique, see & BarsonyOÏLinger 1997 ; Hurt1996).
We derive a luminosity of 10.6 by integrating theL_single-temperature best-Ðt SED (not shown here) of the
entire L1448N system over all wavelengths. Similarly, wederive a luminosity of 2.7 for L1448NW, by integratingL
_under the single-temperature, modiÐed blackbody curve ofThis leaves a luminosity estimate of D8 forFigure 11b. L
_the close binary system.The L1448N binary was Ðrst discovered via its
centimeter-continuum emission et al.(Curiel 1990). TCAsubsequently mapped L1448N in the 2.7 mm continuumwith the Owens Valley Radio ObservatoryÏs interferometer.The Ñux from the L1448N(A)] L1448N(B) system wasmeasured to be 0.225 Jy at 2.7 mm, in a beam,7A.5 ] 6A.6with the binary remaining unresolved. state that for aTCApoint source, we would expect to detect 12.9 times this Ñuxat 1.3 mm, or 2.9 Jy, in our observations. However, we
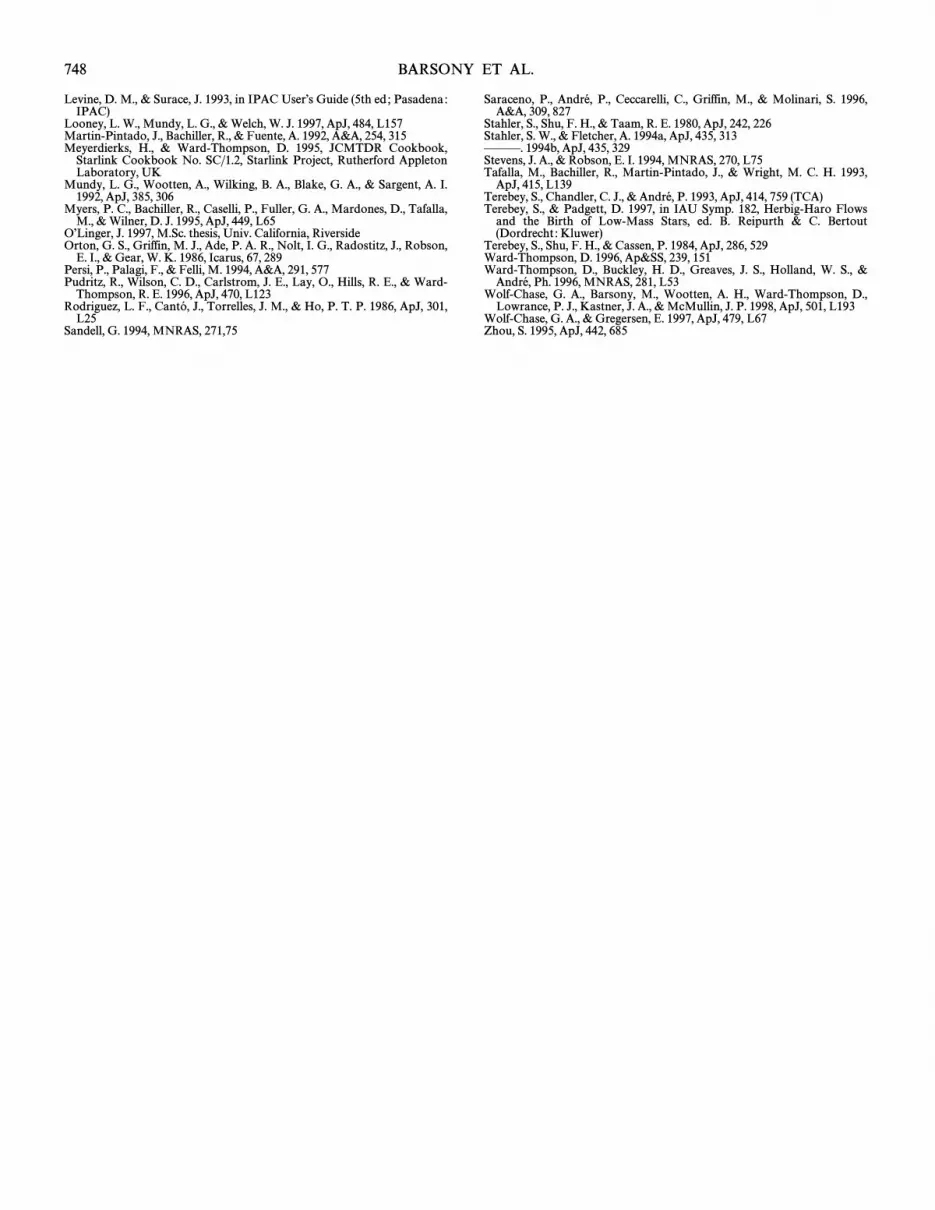
FIG. 13.ÈL1448N(A) outÑow. This Ðgure shows our 1.3 mm bolometer array map (contours) of the L1448 region overlaid on the image (gray scale)H2from & Smith The four millimeter-continuum sources, L1448C, L1448N(A), L1448N(B), and L1448NW, are indicated by the open Ðve-pointedDavis (1995).stars. The high-excitation shocks driven by the L1448C jet are labeled ““ A ÏÏÈ““ I.ÏÏ The low-excitation shocks, which outline the redshifted outÑowH2 H2cavity powered by L1448N(A), are labeled ““ T ÏÏÈ““ Z.ÏÏ The near-infrared reÑection nebulosity to the north of L1448N(A), and associated with its blueshiftedoutÑow lobe, is not labeled. L1448N(A) is symmetrically placed between the redshifted outÑow cavity traced by the low-excitation shocks and theH2blueshifted conical reÑection nebulosity to its north. It is the 1.3 mm emission from L1448N(B), however, that dominates the 1.3 mm emission in the L1448Nregion, since L1448N(B) is 10 times brighter at this wavelength than its close companion, L1448N(A). L1448N(B) drives its own CO outÑow, not shown here(see text). The recently discovered millimeter source, L1448NW, is clearly detected in this map.

744 BARSONY ET AL. Vol. 509
measure a total integrated Ñux of 2.2 Jy at 1.3 mm for theentire L1448N region (see of which we attributeTable 2),1.7^ 0.2 Jy to the binary (see Although this discrep-Fig. 1).ancy is only at the 2 p level, it may nevertheless be a hint ofthe extended circumbinary structure (B30A along its majoraxis), seen in recent high spatial resolution spectral linemaps toward the L1448N(A) ] L1448N(B) binary system
& Padgett(Terebey 1997).It may be possible to disentangle the contribution of the
binary from its circumbinary envelope in the followingmanner. First, we note that the predicted 2.7 mm Ñux for aninfall envelope model of L1448N is D30È50 mJy (see Fig. 6of Extrapolating the Shu, & CassenTCA). Terebey, (1984)infall envelope model Ñux estimate to 1.3 mm leads to apredicted Ñux of 0.6È1 Jy. As stated above, we attribute a1.3 mm Ñux of 1.7^ 0.2 Jy to the L1448N(A)] L1448N(B)system from our observations. For a 1 Jy model(circumbinary) infall envelope, the remaining 0.7 Jy excess1.3 mm Ñux could be attributed to the two point sources ofthe binary, L1448N(A) and L1448N(B). This excess 1.3 mmÑux corresponds to D1 of gas and dust from the com-M
_bined binary, assuming optically thin emission and Td\ 24
K, embedded in a 1.4 envelope at the same dust tem-M_perature. In view of the Ñux measurement uncertainties,
these estimates are only indicative. Our derived value of 1for the sum of the binary components is in reasonableM
_agreement with the dynamical mass determination of 0.75for the ““ central mass ÏÏ in this system &M
_(Terebey
Padgett The circumbinary infall envelope, in this1997).case, would contain about once or twice the mass of the sumof the accreting binary components.
Unfortunately, our 1.3 mm Ñux estimate of 0.4 ^ 0.1 Jy isnot accurate enough to deÐnitively establish whether or notL1448NW is pointlike or marginally resolved. This isbecause, given the measured 3 p upper limit of 0.021 Jy at2.7 mm the predicted upper limits for the 1.3 mm(TCA),Ñux from L1448NW are 0.27 Jy (for an unresolved pointsource) and 0.42 Jy (for a somewhat resolved infallenvelope). Were the emission from L1448NW to originatefrom an extended envelope component, the infall envelopewould have a mass of D0.8 (for the parameter valuesM
_listed in If we further hypothesized an infall rate ofTable 2).10~6 (10~5) yr~1, the central protostellar coreM0 \ M
_mass would be only 0.26 (0.026M_
M_
).
4.2.2. T wo Distinct OutÑows in L 1448N
Since most known Class 0 sources drive bipolar molecularoutÑows, we must examine all three sources associated withL1448NÈL1448N(A), L1448N(B), and L1448NWÈ for thepresence of outÑows to determine their true natures. Carefulcomparison of the positions of these millimeter continuumsources with previously published data on the L1448Nregion shows conclusive evidence for two separate outÑowsemanating from the L1448N region, one powered byL1448N(A), the other by L1448N(B). There are nopublished data in the literature on the outÑow status ofL1448NW.
The outÑow from L1448N(A) is evident in Figure 13,which shows our 1.3 mm bolometer array map (contours),with the positions of the millimeter continuum sources indi-cated, superposed on the emission (gray scale) towardH2this region. Imaging in two separate lines resulted in theH2identiÐcation of high- and low-excitation emission fea-H2tures for the Ðrst time & Smith The low-(Davis 1995).
excitation emission features labeled ““ T ÏÏÈ““ Z ÏÏ inH2 Figureform a conical structure along whose axis lies the highly13
collimated redshifted CO jet driven by L1448N(A)et al. The corresponding blueshifted(Bachiller 1995).
L1448N(A) outÑow lobe has not yet been mapped in milli-meter lines but signals its presence in the extended, conicalreÑection nebulosity whose peak is estimated to lie west1A.5and north of L1448N(A), as seen through the broad-6A.0band K Ðlter centered at 2 km et al. Inspec-(Bally 1993b).tion of shows that the millimeter sourceFigure 13L1448N(A), not L1448N(B), lies on the symmetry axis of the
outÑow associated with the L1448N region. In addition,H2that hallmark of outÑows from low-mass YSOs, a H2Omaser, is found to be coincident with the position ofL1448N(A), not with L1448N(B) et al. The(Curiel 1990).L1448C outÑow is delineated by the high-excitation shocks,labeled ““ A ÏÏÈ““ I ÏÏ, in Note that the L1448N(A)Figure 13.outÑow is antiparallel to the outÑow powered by L1448C.
The Ðrst map of the L1448N(B) outÑow appears in thepaper reporting the discovery of the L1448C outÑow and istherein labeled ““ RN, ÏÏ for Red Northern lobe et(Bachilleral. The corresponding blueshifted outÑow lobe from1990).L1448N(B) has been partially mapped by et al.Bontemps
The L1448N(B) outÑow axis, passing through the(1996).““ RN ÏÏ lobe, L1448N(B), and the partially mapped blue-shifted lobe, is along a distinctly di†erent direction than thesymmetry axis of the L1448N(A) outÑow. Along theL1448N(B) outÑow axis, 6@ to the northwest, lies HH 196, aseries of blueshifted optical emission knots et al.(Bally1997).
4.3. IRAS 03282]30354.3.1. Source Properties
IRAS 03282 is the least luminous of all the sources con-sidered so far (see Its dust emission is marginallyTable 3).resolved at all wavelengths (see Figs. and although7, 8, 9),only the 100 km emission has sufficient strength to allow amore detailed determination of the underlying source mor-phology.
An excellent example of the advantage of point-sourcemodeling of the HIRES data is given by the results shownin for the inferred geometry of the 100 km emis-Figure 9dsion region from IRAS 03282. The initial model for the 100km emission was a single spike at the IRAS Point SourceCatalog position. Except for reproducing the general emis-sion shape of the image in the singleÈpoint sourceFigure 9b,model did not produce a good Ðt to the HIRES-processedIRAS survey data. In particular, the Ñux-weighted centroidof the singleÈpoint source model was o†set 9A to thesouthwest of the Ñux-weighted centroid of InFigure 9b.addition, the highest level contour shapes of the two maps,near the image center, did not match. The process ofdeveloping the Ðnal multiple-spike model (speciÐed in Table
which produced the Ñux distribution shown in1), Figure 9d,involved attempting to closely match the Ñux-weighted cen-troid positions, the morphology of the emission centroids,and the total integrated Ñuxes of Figures and The9b 9d.resulting model consists of nine input spikes, which form anemission region elongated along a north-south axis, despitethe fact that the HIRES-processed image appears some-what elongated along an east-west axis. The apparent 100km HIRES morphology in this case is the result of theorientation of the satellite detector tracks relative the actual

No. 2, 1998 PROTOSTARS IN PERSEUS 745
source emission on the sky and is produced by the HIRES-processing algorithm. By identically processing a point-source model of the emission with HIRES, we can infer theactual distribution of the 100 km emission region moreaccurately than by using the HIRES-processed survey dataalone. To corroborate our inferred morphology for the100km emission from IRAS 03282, we present in Figure 10the ammonia map of IRAS 03282, obtained at similarresolution to our 100 km HIRES maps et al.(Bachiller
The plus signs in represent the positions1991b). Figure 10of our input model 100 km point-source spikes, whereas thecontours show the ammonia emission. Our inferred 100 kmemission region corresponds well with the dense ammoniacore et al. et al.(Bachiller 1991b ; Tafalla 1993).
We present the SED of IRAS 03282 in derivedFigure 11cfrom our new photometry, as listed in The best-ÐtTable 2.single dust temperature modiÐed blackbody curve to thesedata, given by is also plotted in Weequation (1), Figure 11c.derive a source luminosity of 1.6 for IRAS 03282 byL
_integrating under this curve over all wavelengths. From anextrapolated 1.3 mm Ñux of 45 mJy, we derive an envelopemass of 0.8 following The observed lumi-M
_, equation (2).
nosity implies a central source mass of 0.15 (0.015) forM_assumed mass infall rates of 10~6 (10~5) yr~1 onto a 3M0
source.R_
4.4. Class 0 ClassiÐcation, OutÑow Energetics, and RevisedT imescales
4.4.1. Class 0 ClassiÐcation
Physically, a Class 0 protostar is a rather complicatedobject. It consists of an accreting core, which is in theprocess of forming an accretion disk, drives a bipolarmolecular outÑow, and is surrounded by a massive infallenvelope. Observationally, a Class 0 protostar exhibits avery cold K) spectral energy distribution and can(T
d¹ 30
be identiÐed as the driving source of a bipolar molecularoutÑow. Other quantiÐable observational characteristics ofClass 0 protostars, such as relatively large (º5 ] 10~5)ratios values of in theL submm/L bol, L bol/(103L 1.3 mm)range 2È15, a weak, if detectable, mid-IR (10 km) Ñux, andlocation in the evolutionary status vs.(Mcircumstellar L bol)diagram, all follow from the SED shape. The weak,centimeter-wave Ñux detected toward such objects arisesfrom the shock ionization of ambient material by theemerging bipolar jet.
In we present SEDs for three PerseusFigure 11,millimeter-continuum sources, which include the new far-infrared, submillimeter, and millimeter photometry listed in
Both L1448C and IRAS 03282Table 2. (Fig. 11a) (Fig. 11c)drive well-known molecular outÑows, and their SED shapesÐt the deÐning criteria for Class 0 protostars. We have calcu-lated values of where is the total sourceL submm/L bol, L submmluminosity integrated over wavelengths j º 350 km, and
where is corre-L bol/(103L 1.3 mm), L 1.3 mm 4nd2S1.3] *l,sponding to an integrated 1.3 mm Ñux density and abandpass *l\ 50 GHz, in columns (5) and (6) of Table 3.The values of these quantities fall well within the rangeoccupied by Class 0 protostars for both L1448C and IRAS03282.
Our newly determined SED for the millimeter continuumsource, L1448NW, is plotted in Although itsFigure 11b.SED shape, and concomitant values of andL submm/L bolfall well within the Class 0 range (seeL bol/(103L 1.3 mm) Table
additional high-resolution millimeter-continuum data,3),as well as molecular-line imaging, are required to deÐni-tively characterize its true nature.
L1448N(A) and L1448N(B) have been resolved at centi-meter et al. and millimeter & Padgett(Curiel 1990) (Terebey
wavelengths and remain undetected individually as1997)point sources to very sensitive upper limits in the near-infrared (K º 18 mag). Although we have not resolved thisbinary in any of the data presented in this paper, we can,nevertheless, deduce the combined SED of this system forclassiÐcation purposes. We note this is also the case for theunresolved binary systems IRAS 16293 and L1551/IRS 5
et al. et al. Mundy,(Mundy 1992 ; Rodriguez 1986 ; Looney,& Welch The combined Ñux from the L1448N proto-1997).binary at each wavelength in our data may be estimated bysubtracting the measured/extrapolated contribution ofL1448NW from the total observed emission over the entireL1448N region. In this way, we can establish that the com-bined SED of the L1448N(A)] L1448N(B) system does,indeed, satisfy the Class 0 classiÐcation criteria. We haveplotted L1448NW in assuming it has a slightlyFigure 14extended envelope. It is clear that all of the sources treatedin this work lie well within the Class 0 realm of the evolu-tionary status diagram of In addition, L1448C,Figure 14.L1448N(A), L1448N(B), and IRAS 03282 each drive distinctbipolar molecular outÑows.
In we have plotted the locations of L1448C,Figure 14,L1448NW, the L1448N protobinary, and IRAS 03282 inthe versus diagram. This diagram may beMcircumstellar L bolused as a diagnostic tool for determining the relative ages ofprotostars & Montmerle et al.(Andre� 1994 ; Saraceno 1996).The diagram shows circumstellar mass (along the verticalaxis) versus central core mass (horizontal axis), assumingthat all luminosity is generated by gravitational infall,according to the formula
L bol \GM0 M
*R
*, (3)
where a ““ standard ÏÏ 3 protostellar radius is assumedR_Shu, & Taam The diagonal lines in(Stahler, 1980). Figure
mark the boundaries where the circumstellar mass14equals the accreting core mass of the protostar, for constantmass accretion rates of 10~5 yr~1 (solid line) 2] 10~6M
_yr~1 (dashed line). Class 0 sources have larger circum-M_stellar than core masses and lie in the region above the
FIG. 14.ÈEvolutionary status diagram for protostars : vs.Mcirc L bol

746 BARSONY ET AL. Vol. 509
diagonal demarcation lines, whereas Class I sources havelarger core than circumstellar envelope masses and lie in theregion below the diagonal demarcation lines.
Given their Class 0 status, the clear detections of bothL1448C and L1448N(A)] L1448N(B) in the IRAS 12 kmband, and the excess (above the simple, single-temperatureblackbody curves) 25 km emission from each of thesesources plotted in deserve comment. We argueFigure 11that the source of this excess mid-IR emission, associatedwith L1448C and the L1448N protobinary, must be thelocal, ongoing outÑow/dust interactions, of which we haveample evidence via the observed centimeter-continuumemission, near-infrared reÑection nebulosities, shockedmolecular hydrogen, and HH objects powered by each ofthese sources. We note that if we scale down the observed12 and 25 km Ñuxes of L1448C by the ratio of the lumi-nosities of L1448C to IRAS 03282, then the expected 12 kmÑux for IRAS 03282 falls below our 3 p IRAS upper limit (asquoted in The expected 25 km Ñux for IRAS 03282Table 2).according to this scaling, would be D0.55 Jy, within a factorof 2 of our 3 p upper limit of 0.29 Jy. The purpose of thiscalculation is to show the plausibility of shock-heated dustas the source of the observed mid-IR excess in these sources.Any (radiatively heated) envelope or disk component con-tribution to the mid-IR emission must originate from withinD1 AU of the central object and would be unresolved.
4.4.2. OutÑow Energetics
Various authors have noted that Class 0 sources drivesystematically more powerful outÑows than do Class Isources of similar luminosity et al. Bachiller et(Curiel 1990 ;al. et al. et al.1990, 1991a, 1991b ; Andre� 1993 ; Bontemps
A particularly useful quantity to illustrate this is1996).the ratio of outÑow mechanical luminosity to theL mech/L bol,central source luminosity.
The derived estimates of using the millimeter, sub-L bol,millimeter, and far-infrared photometry presented in thispaper, are listed for each source in Although weTable 3.cannot resolve the emission from the protobinary consistingof L1448N(A) and L1448N(B), we can estimate their indi-vidual bolometric luminosities if we assume that these are inthe same ratio as their millimeter-continuum Ñuxes
& Padgett With this assumption, we arrive(Terebey 1997).at values of for L1448N(A) andL bol \ 0.8 L
_L bol \ 7.1 L
_for L1448N(B).Using CO outÑow properties published in the literature
for L1448C et al. L1448N(B) et(Bachiller 1990), (Bachilleral. and IRAS 03282 et al. we esti-1990), (Bachiller 1991b),mate CO outÑow luminosities of 1.0, 0.44, and 0.9 L
_,
respectively, for each of these sources. An alternativeapproach to estimate wind mechanical luminosities makesuse of centimeter-wave radio continuum Ñux measure-ments. If the observed radio emission originates from shockheating of ambient gas by a neutral wind from the centralsource, then, for reasonable values of mass-loss rate, termin-al wind velocity, and jet opening angle, one can estimate thewind mechanical power that would be required to producethe observed centimeter-wave radio-continuum emission(Curiel et al. Using this method, the derived1989, 1990).wind mechanical luminosities for L1448C, L1448N(A), andL1448N(B), are 3.5 (0.3), 6.2 (0.6), and 4.2 (0.4) respec-L
_,
tively, for assumed jet opening angles of )/4n \ 0.1(1).We can also estimate the instantaneous mechanical lumi-
nosity radiated by the L1448C outÑow from our 100 and 60
km maps. The advantage of this method for determining theinstantaneous outÑow mechanical luminosity is that, unlikethe case for the CO outÑow mechanical luminosity esti-mates, no assumptions of outÑow geometry, dynamicaltime, or optical depth e†ects are required. Integratingthe observed Ñux of the ““ emission bridge ÏÏ structure overthese wavelengths yields a mechanical luminosity estimateof 6.5 L
_.
Combining the above outÑow/wind mechanical lumi-nosity estimates with our bolometric luminosity determi-nations, it is clear that for the Class 0 sources consideredhere, the ratio of is generally º50%. For com-L mech/L bolparison, this ratio typically lies in the range 10~2 to 10~3for Class I sources (Lada 1985).
4.4.3. Revised T imescales
The results of recent large Ðeld-of-view optical imaging ofmolecular outÑow regions (10@È30@) require a reassessmentof outÑow dynamical times et al. &(Bally 1997 ; Eislo� ffelMundt Whitney, & Kenyon SpeciÐ-1997 ; Gomez, 1997).cally, [S II] and Ha imaging of the L1448 region hasresulted in the discovery of HH 196, 0.52 pc from its drivingsource, L1448N(B). As a consequence, the dynamical timeof the L1448N(B) outÑow is lengthened to 13,000 yr from2600 yr. For this estimate, we used the 40 km s~1 terminalvelocity reported for the redshifted L1448N(B) (““ RN ÏÏ) lobe
et al. The use of this velocity is also justiÐed(Bachiller 1990).by the fact that all of the knots associated with HH 196 areblueshifted, with [37 km s~1¹ VLSR¹ 0 km s~1 (Ballyet al. In the case of L1448C, a circular complex of HH1997).knots, HH 267, has been discovered lying directly on a linewith the direction of the bent, blueshifted jet, at a distance of2.3 pc et al. Given this distance, the revised(Bally 1997).dynamical time for the L1448C outÑow becomes 32,000 yr,almost an order of magnitude greater than the original esti-mate of 3500 yr (Bachiller et al. Here, we have1990, 1995).used the reported 70 km s~1 terminal velocity for theL1448C outÑow and note that the reported range of veloci-ties for HH 267 is km s~1, the same as that0 ¹ VLSR ¹[65for HH 197, the other newly discovered HH object associ-ated with the blueshifted outÑow lobe of L1448C. Giventhat any outÑow interaction with the ambient interstellarmedium will decelerate the jet gas, the currently inferredterminal velocities are a lower limit to the original terminalvelocities of these Ñows, and our outÑow dynamical timeestimates are, in this sense, upper limits on the true outÑowdynamical times.
These revised, longer, outÑow dynamical times shed newlight on the star formation process. In particular, the typicalinferred ages of the youngest protostars are now of the sameorder of magnitude as the dynamical times of their outÑows.These results may be used to emphasize the importance ofconsidering the simultaneous occurrence of protostellarinfall and outÑow in star formation models.
4.5. OutÑow-induced FragmentationWe have demonstrated that L1448 contains three very
young sources, all with ages of order 50,000 yr, all in a fairlysmall (D0.15 pc) region. We argue that normal fragmenta-tion cannot account for these observations, since this wouldcall for a ““ synchronized ÏÏ onset of collapse, which wouldhave to propagate at the sound speed within a dynamicaltime. However, if we take the fragmentation size scale in

No. 2, 1998 PROTOSTARS IN PERSEUS 747
L1448 to be 0.05 pc and adopt a dynamical time of 50,000yr, the implied sound speed for propagating disturbanceswould be 1 km s~1. Although this velocity is close to theAlfve� n speed, it is much larger than the thermal soundspeed, so thermal fragmentation is ruled out. However, theoutÑow velocity from L1448C exceeds the Alfve� n speed bynearly 2 orders of magnitude. We therefore propose thatthere is evidence for the L1448C outÑow having induced thefragmentation of the L1448N core.
Furthermore, with regard to the particular history of starformation in the L1448 dark cloud, our newly derivedoutÑow dynamical times suggest a picture in which theolder, powerful L1448C outÑow fragmented the core that isnow forming L1448N(A) and L1448N(B) (see et al.Bachiller
Finally, we suggest that the interaction between the1991b).L1448N(A) and L1448N(B) outÑows may have created thedense condensation, L1448NW.
5. SUMMARY
1. We have presented new far-infrared, submillimeter,and millimeter maps of the protostellar sources L1448C,L1448N, and IRAS 03282 in the Perseus molecular cloudcomplex.
2. We have presented newly determined spectral energydistributions for L1448C, L1448NW, and IRAS 03282,from which we derive basic source properties, such as bolo-metric luminosity, circumstellar mass, and central core massfor each source. Based on the new data presented in thispaper, combined with other authorsÏ molecular-lineimaging, we conÐrm the Class 0 status of L1448C,L1448N(A), L1448N(B), and IRAS 03282. More data arerequired to characterize the true nature of L1448NW.
3. We distinguish the low-excitation, shocked molecular-hydrogen Ñow powered by L1448N(A) from the COoutÑow powered by L1448N(B) for the Ðrst time and pointout the presence of three distinct outÑow sources inL1448N/IRS3.
4. Comparison of our HIRES-processed 100 km map ofL1448 with previously published optical, NIR, andmolecular-line imaging reveals evidence for extensive dust/outÑow interactions in this system. HIRES point-sourcemodeling of the 100 km emission morphology of IRAS03282 shows the emitting dust structure in this source to be
intimately associated with the ammonia core from whichthis source is currently forming.
5. The instantaneous outÑow luminosity of L1448C isestimated to be 6.5 from our maps of its dust emission,L
_leading to a value of 80% for for this source.L mech/L bolSimilarly high values of this ratio (º50%) are found for theother Class 0 sources in this study.
6. By identifying L1448N(B) as the powering source ofHH 196 and L1448C as the powering source of HH 267, werevise the outÑow dynamical times for these two sourcesupward to 13,000 yr (from 2600 yr) and 32,000 yr (from 3500yr), respectively.
7. OutÑow dynamical timescales are now of the sameorder of magnitude as typical Class 0 protostar ages.
8. There is strong evidence for outÑow-induced fragmen-tation in the L1448 cloud. The L1448C outÑow fragmentedthe L1448N core that is now forming the protobinarysystem, L1448N(A) ] L1448N(B). The interaction of theL1448N(A) and L1448N(B) outÑows, in turn, may have pro-duced the newly discovered dense condensation, L1448NW.
The JCMT is operated by the Joint Astronomy Centre onbehalf of the Particle Physics and Astronomy ResearchCouncil of the United Kingdom, the Netherlands Organiz-ation for ScientiÐc Research, and the National ResearchCouncil of Canada. We wish to thank the sta† of theInfrared Processing and Analysis Center in Pasadena, CA,Diane Engler and Ron Beck, for their efficiency in proces-sing our HIRES requests, and Robert Hurt for helpfuldiscussions regarding point-source modeling of the HIRESdata. We are grateful to F. Motte for her assistance withanalyzing the 1.3 mm bolometer array data. We thankDavid Hollenbach for helpful suggestions and informativediscussion on shock physics, and Susan Terebey for acareful and thorough reading of the manuscript. M. B. andJ. O. acknowledge Ðnancial support from M. B.Ïs NSFCAREER Award, NSF Grant AST 95-01788. M. B. grate-fully acknowledges an NSF POWRE Visiting Pro-fessorship, NSF Grant AST 97-31797, for providing thenecessary time to bring this work to completion. D. W. T.wishes to thank the Royal Observatory Edinburgh for aSenior Research Fellowship, during which this research wascarried out.
REFERENCES
Ph. 1994, in The Cold Universe, Proc. XIIIth Moriond Astro-Andre� ,physics Meetings, ed. T. Montmerle, C. J. Lada, F. Mirabel, & J. TranThaü nh Vaü n (Gif-sur-Yvette : Frontieres),EŠ ditions 179
Ph., & Montmerle, Th. 1994, ApJ, 420,Andre� , 837Ph., Ward-Thompson, D., & Barsony, M. 1993, ApJ, 406,Andre� , 122
G., Rodri� guez, L. F., Torrelles, J. M., Estalella, R., Ho, P. T. P.,Anglada,Canto� , J., Lo� pez, R., & Verdes-Montenegro, L. 1989, ApJ, 31, 208
H. H., Fowler, J. W., & Melnyk, M. 1990, AJ, 99,Aumann, 1674R., Andre� , Ph., & Cabrit, S. 1991a, A&A, 241,Bachiller, L43R., & Cernicharo, J. 1986a, A&A, 166,Bachiller, 283
1986b, A&A, 168,ÈÈÈ. 262R., Cernicharo, J., Martin-Pintado, J., Tafalla, M., & Lazare†, B.Bachiller,
1990, A&A, 231, 174R., Guilloteau, S., Dutrey, A., Planesas, P., & Martin-Pintado, J.Bachiller,
1995, A&A, 299, 857R., Martin-Pintado, J., & Planesas, P. 1991b, A&A, 251,Bachiller, 639R., Terebey, S., Jarrett, T., Martin-Pintado, J., Beichman, C. A.,Bachiller,
& Van Buren, D. 1994, ApJ, 437, 296J., Devine, D., Alten, V., & Sutherland, R. S. 1997, ApJ, 478,Bally, 603J., Devine, D., Hereld, M., & Rauscher, B. J. 1993a, ApJ, 418,Bally, L75J., Lada, E., & Lane, A. P. 1993b, ApJ, 418,Bally, 322
M. 1994, in ASP Conf. Proc. 65, Clouds, Cores, and Low-MassBarsony,Stars, ed. D. P. Clemens & R. Barvainis (San Francisco : ASP), 197
S., Andre� , P., Terebey, S., & Cabrit, S. 1996, A&A, 311,Bontemps, 858Y., Prince, T. A., Terebey, S., & Beichman, C. A. 1996, PASP, 108,Cao, 535
C. J., Gear, W. K., Sandell, G., Hayashi, S., Duncan, W. D.,Chandler,Griffin, M. J., & Hazell, A. S. 1990, MNRAS, 243, 330
S., Raymond, J. C., Rodri� guez, L. F., Canto� , J., & Moran, J. M.Curiel,1990, ApJ, 365, L85
S., Rodriguez, L. F., Canto� , J., Bohigas, J., Roth, M., & Torrelles,Curiel,J. M. 1989, Astrophys. Lett. Commun., 27, 299
J. A. 1987, ApJ, 315,Davidson, 602C. J., Dent, W. R. F., Matthews, H. E., Aspin, C., & Lightfoot, J. F.Davis,
1994, MNRAS, 266, 933C. J., & Smith, M. D. 1995, ApJ, 443,Davis, L41
W. D., Robson, E. I., Ade, P. A. R., Griffin, M. J., & Sandell, G.Duncan,1990, MNRAS, 243, 126
J., & Mundt, R. 1997, AJ, 114,Eislo� ffel, 280D. T., Klein, U., & Haslam, C. G. T. 1979, A&A, 76,Emerson, 92
M., Whitney, B. A., & Kenyon, S. J. 1997, AJ, 114,Gomez, 1138E. M., Evans, N. J., II, Zhou, S., & Choi, M. 1997, ApJ, 484,Gregersen, 256
M. J., Ade, P. A. R., Orton, G. S., Robson, E. I., Gear, W. K., Nolt,GrifÐn,I. G., & Radostitz, J. V. 1986, Icarus, 65, 244
M. J., & Orton G. S. 1993, Icarus, 105,GrifÐn 537S., Bachiller, R., Fuente, A., & Lucas, R. 1992, A&A, 265,Guilloteau, L49R. H. 1983, QJRAS, 24,Hildebrand, 267
R. L., & Barsony, M. 1996, ApJ, 460,Hurt, L45E. 1992, in ESA Symposium on Photon Detectors for SpaceKreysa,
Instrumentation, ESA SP-356 (Noordwijk : ESA), 207C. J. 1985, ARA&A, 23,Lada, 267
748 BARSONY ET AL.
D. M., & Surace, J. 1993, in IPAC UserÏs Guide (5th ed ; Pasadena :Levine,IPAC)
L. W., Mundy, L. G., & Welch, W. J. 1997, ApJ, 484,Looney, L157J., Bachiller, R., & Fuente, A. 1992, A&A, 254,Martin-Pintado, 315
H., & Ward-Thompson, D. 1995, JCMTDR Cookbook,Meyerdierks,Starlink Cookbook No. SC/1.2, Starlink Project, Rutherford AppletonLaboratory, UK
L. G., Wootten, A., Wilking, B. A., Blake, G. A., & Sargent, A. I.Mundy,1992, ApJ, 385, 306
P. C., Bachiller, R., Caselli, P., Fuller, G. A., Mardones, D., Tafalla,Myers,M., & Wilner, D. J. 1995, ApJ, 449, L65
J. 1997, M.Sc. thesis, Univ. California,OÏLinger, RiversideG. S., Griffin, M. J., Ade, P. A. R., Nolt, I. G., Radostitz, J., Robson,Orton,
E. I., & Gear, W. K. 1986, Icarus, 67, 289P., Palagi, F., & Felli, M. 1994, A&A, 291,Persi, 577
R., Wilson, C. D., Carlstrom, J. E., Lay, O., Hills, R. E., & Ward-Pudritz,Thompson, R. E. 1996, ApJ, 470, L123
L. F., Canto� , J., Torrelles, J. M., & Ho, P. T. P. 1986, ApJ, 301,Rodriguez,L25
G. 1994, MNRAS,Sandell, 271,75
P., Andre� , P., Ceccarelli, C., Griffin, M., & Molinari, S. 1996,Saraceno,A&A, 309, 827
S., Shu, F. H., & Taam, R. E. 1980, ApJ, 242,Stahler, 226S. W., & Fletcher, A. 1994a, ApJ, 435,Stahler, 3131994b, ApJ, 435,ÈÈÈ. 329J. A., & Robson, E. I. 1994, MNRAS, 270,Stevens, L75M., Bachiller, R., Martin-Pintado, J., & Wright, M. C. H. 1993,Tafalla,
ApJ, 415, L139S., Chandler, C. J., & Andre� , P. 1993, ApJ, 414, 759Terebey, (TCA)S., & Padgett, D. 1997, in IAU Symp. 182, Herbig-Haro FlowsTerebey,
and the Birth of Low-Mass Stars, ed. B. Reipurth & C. Bertout(Dordrecht : Kluwer)
S., Shu, F. H., & Cassen, P. 1984, ApJ, 286,Terebey, 529D. 1996, Ap&SS, 239,Ward-Thompson, 151D., Buckley, H. D., Greaves, J. S., Holland, W. S., &Ward-Thompson,
Andre� , Ph. 1996, MNRAS, 281, L53G. A., Barsony, M., Wootten, A. H., Ward-Thompson, D.,Wolf-Chase,
Lowrance, P. J., Kastner, J. A., & McMullin, J. P. 1998, ApJ, 501, L193G. A., & Gregersen, E. 1997, ApJ, 479,Wolf-Chase, L67
S. 1995, ApJ, 442,Zhou, 685