conductivity analysis for high-resolution eeg
TRANSCRIPT
Conductivity Analysis for High-Resolution EEG
Sergei I. Turovets Pieter Poolman Adnan SalmanNeuroInformatics Center Electrical Geodesics, Inc. NeuroInformatics Center
5294 University of Oregon Eugene, OR 97403, USA 5294 University of OregonEugene, OR 97403, USA [email protected] Eugene, OR 97403, [email protected] [email protected]
Allen D. Malony Don M. TuckerNeuroInformatics Center Electrical Geodesics, Inc.
5294 University of Oregon Eugene, OR 97403, USAEugene, OR 97403, USA [email protected]@cs.uoregon.edu
Abstract
We describe a technique for noninvasiveconductivity estimation of the human head tissues invivo. It is based on the bounded electrical impedancetomography (bEIT) measurements procedure andrealistically shaped high-resolution finite differencemodel (FDM) of the human head geometry composedfrom the subject specific co-registered CT and MRI.The first experimental results with two subjectsdemonstrate feasibility of such technology.
1. Introduction
Electroencephalography (EEG) is an indispensableneurological diagnostic tool in terms of the fast timescale, portability and cost efficiency. Improved spatialresolution of EEG measures would greatly benefitmultiple clinical and research applications, includingstroke, epilepsy and cognitive studies. The recentadvances in dense-array electrode application havemade EEG brain imaging for both rapid applicationand long-term monitoring feasible [1]. It has beenshown that reliable inverse solutions can be obtainedand dense-array sampling (128, 256 and 512 channels)on the scalp can be projected back to the cortex,providing a unique opportunity for monitoring brainactivity both in space and time. However, the spatialaccuracy of EEG will remain limited because i) mostlysimplistic models of the human head (like multi-shellspheres) are commonly used in the inverse procedureof back-to-cortex projection, and ii) the regional
conductivities of the human head tissues are largelyunknown. Several imaging modalities have beenproposed so far to quantitatively measure the electricalconductivity of tissue non-invasively, but none of themis free from some limitations and shortcomings.Magnetoacoustic Hall effect imaging [2] relies onpropagation of ultrasound into the tissue, and is notquantitative. Magnetic resonance current densityimaging [3] requires applying rather high level ofexternal currents to make the produced magnetic fieldcontrast visible to MRI. The electrical conductivitytensor of tissue can be quantitatively inferred from thewater self-diffusion tensor as measured by diffusiontensor magnetic resonance imaging (DTI) [4]. It can besuccessful in extracting anisotropic conductivities ofthe brain tissue, but more problematic with respect tobone (skull) tissues where the water content is muchsmaller.
The lack of accurate skull conductivity (mostresistive tissue) is particularly problematic given thedevelopmental variations in the human skull frominfancy through adolescence. Without an accurateforward model of the skull (specifying the volumeconduction from cortex to scalp) even advancedinverse efforts cannot achieve precision with EEG dataas the error of source localization, due to theconductivity uncertainty, may reach a few centimeters[5].
Several authors addressed this problem by usingnoninvasive electrical impedance tomography (EIT)approach. In EIT, harmless currents are injected intothe body, and the potential field created by volumeconduction of this current through body tissues is
2008 International Conference on BioMedical Engineering and Informatics
978-0-7695-3118-2/08 $25.00 © 2008 IEEEDOI 10.1109/BMEI.2008.358
1310
2008 International Conference on BioMedical Engineering and Informatics
978-0-7695-3118-2/08 $25.00 © 2008 IEEEDOI 10.1109/BMEI.2008.358
386
measured. From the potential field and the knownposition of the injected current, properties of the bodytissue can be inferred. Although this method has beenresearched for many years, it has not been successfullyapplied to medical problems [6]. A major factor in thepoor adoption of EIT is that it was initially conceivedas an imaging method. However, traditional EIT isgenerally assumed to exhibit low spatial resolution inthe presence of resistive interfaces like skull tissues,particularly at the low frequencies of physiologicalinterest.
The problem of skull conductivity can be properlyaddressed in vivo within the framework of bounded (orparameterized) EIT applied to a subject prior to EEGmeasurements. The word “parameterized” is key, as itmeans just a few unknown parameters must beresolved during the inverse search. This is much lessambitious than the classic EIT, which seeks imaging ofthe subject interior in terms of conductivity on a pixel-to-pixel basis. Mathematically (and in practicalcomputational terms), a parameterized EIT solution ismuch more reliable, stable and easier to find [7].Parameterization of the realistic geometry of thehuman head can be accomplished by means ofsegmentation of MRI/CT scans into several tissues andanatomical parcellation of the skull into its constituentparts. The whole head conductivity map can then berepresented by compartments with unknown piecewiseconstant conductivities and known boundaries. Severalprevious studies have been reported by other authorswho parameterized the problem to solve for a smallnumber of conductivity parameters using nonlinearinverse methods and assuming that the internalgeometry of the head is already known. Oostendorp etal. [8], and Van Burik and Peters [9] showed in a three-layer boundary element (BEM) head model that itappears possible to determine the scalp/brain ratio.Gonçalves et al. [10] also applied spherical and a three-layer BEM to fit their EIT measurements for sixsubjects. However, since in such models skullthickness and conductivity are interchangeable to someextent, more accurate geometry representation isneeded. We note here that BEM models have problemsin dealing with skull inhomogeneities and anisotropies[11] and, in fact, are topologically equivalent to thespherical models. Recently we have shown in ourgroup that by using the parameterized EIT procedureand realistically shaped high-resolution finitedifference models (FDM) of the human head, it waspossible to extract three and four tissues conductivities[12,13]with the multi-start downhill simplex algorithm[14], and up to 13 conductivities with the simulatedannealing algorithm [15] with good accuracy insimulations with synthetic data. A similar approachwas used by Hoekema et al. [16] in the conductivity
measurements of skull parts temporarily removedduring epilepsy surgery; however, fitting for only oneunknown parameter was performed.
It is apparent that solving the conductivityinformation problem is a prerequisite to sourcelocalization. It can be performed, in essence, using thesame EEG measurement equipment, with the smalldifference that a few electrode pairs must be used toinject safe levels of current, while the rest of theelectrodes are used to record the potentials of theinjected current. There is one important differencefrom the classic EIT: for the present project it isnecessary to work in the range of low EEG frequencies(1-100 Hz), where effects of the electrode polarization(contact impedance) [17] may become significant andrequire a complete electrode computational model [18].As a result of such an inverse procedure, we still willhave just estimates (not exact) of conductivities of theconstituent regional tissues, but we assume thatapplying a realistic head geometry, with very highaccuracy, will balance this uncertainty with other EEGerror contributions. The ultimate criteria, however,would be the accuracy of EEG source localization,determined with account of different possible errorcontributions, like measurement noise or systematicbias of the particular computational inverse procedure.Such contributions could originate also from localstructural skull inhomogeneities and anisotropies [11],[19] and appropriate balance between them is still to beinvestigated in a systematic way.
In this paper we report the results of our firstexperiments performed with human subjects. Becausethe same EEG spectral range and electrodes are usedfor bounded EIT (bEIT) as for measuring EEG, thebEIT procedure provides an efficient, low-costspecification of the electrical volume conductionthrough head tissues. With dense-array bEIT measuredas routinely as testing scalp electrode impedance, wecan realize the promise of recent biophysicssimulations suggesting that, with accurate correctionfor head tissue conductivity, EEG provides spatialresolution of brain activity that is equal to or betterthan magnetoencephalography (MEG) [20].
2. Methods and Materials
2.1 Hardware and Data acquisitionFor our bEIT studies, we employed the existing
NetAmps 300 EEG amplifier (manufactured byElectrical Geodesics, Inc.) and an isolated currentgenerator. The NetAmps 300 platform synchronouslydigitizes 256 analog channels at 20 kHz and 24 bits,and uses a field-programmable gate array (FPGA) tocollate and transfer data in IEEE 1394 (Firewire)
1311387
format to a computer. The NetAmps 300 platform uses“sigma-delta” type A-to-D converters, achieving highlinearity, accuracy and resolution at low cost, so thateach detector can have a dedicated A-to-D converter,without the need for high-speed multiplexing ofdifferent detector signals onto a single higher-speed A-to-D converter.
The current source is battery-powered and isolatedfrom the amplifier circuitry. The waveform of theinjected current is sensed across a resistor with knownvalue and in series with the impedance load containingthe head and injector/sink electrodes. Current injectionparameters, e.g. source/sink electrodes, frequency, andamperage are set via a software interface. Initialexperimental results pointed to current leakagesomewhere in the current injection setup. Circuitanalysis and subsequent testing indicated that thecombination of T-filters on the NetAmps 300 front-endand a shared common ground plane between theamplifier and current source was the root cause.Therefore, in our latest design, the current source isbattery-powered and isolated from the NetAmps 300circuitry in order to eliminate leakage current throughthe shared common ground plane in the amplifier.Through trial and error we settled on a Howland-typedesign. Advantages of this topology over other designsinclude its small number of components, a single activedevice and the ability to adjust output resistance [21].
For each subject, a properly sized 128 (or 256) -channel HydroCel Geodesic Sensor Net (HCGSN) isapplied and the electrode positions are measured withthe Geodesic Photogrammetry System (GPS) [22].Together with the extracted EEG topography/injectordata, the head MRI/CT geometry (including electrodeposition) forms the input to our FDM modelingprocess.
During the bEIT data acquisition, sinusoidalcurrent injection, at frequencies ranging from 1 Hz to 8kHz, is performed for specified electrode pairs via thecurrent source, while acquiring impressed EEG datawith the NetAmps 300 data collection system. Thecurrent level is chosen to maximize the data quality.The aim is to inject current levels that that will providegood signals for data analysis without saturating theamplifier. The level of injected current (1-60 µA) iswell below the accepted health and safety levels. Thefrequency range of the injected current is chosen tocomply with the Nyquist limit of the 20 kHz samplingrate of the EEG amplifier. It is noted that high injectionfrequencies (several kHz) may lead to alternative andintractable current paths due to the impact of straycapacitances in the amplifier, leads, etc. This issue willbe addressed in future in more detail.
2.2 Signal processingExtraction of the amplitude and phase from the
induced bEIT potentials is based on a softwareimplementation of locked-in detection [23,24]. A lock-in detector takes as input a periodic reference signaland a noisy system signal, and extracts only that part ofthe system signal that matches the reference signal infrequency. The lock-in detector yields remarkablesensitivity at the locked-in frequency, and is capable ofdiscarding the impact of offset errors, 1/f noise, etc.efficiently. In short, the building blocks of the lock-indetector consist of a phase-adjustable reference signal,multiplication, low-pass filtering, and time averaging.
For the purposes of our current injector, thereference signal is sensed across a series resistor in thecurrent loop. It is therefore impractical to attempt tophase shift the reference signal in order to zero out theunknown system signal phase. We have shown that inthe absence of a phase-adjustable reference signal, ahigh-fidelity software lock-in detector can beassembled by integrating a band-pass filter, zero-crossing counter, and time-series regression, e.g. via aFourier transform. The working principle of thismodified lock-in detection is based on minimizing theimpact of non-DFT frequency components in referenceand system signals, and ensuring that the referencefrequency coincides with a DFT frequency. Givenmultiple-frequency EIT data, the lock-in detector canalso be used to extract amplitudes and phase angles ofindividual frequency components from a mixedsinusoid signal. The data flow through the modifiedlock-in detector is described in more details in ourconcurrent paper at CISP 2008 [24].
2.3 Computational FrameworkThere are several vital components for
accomplishing the conductivity estimation task: 1)develop an accurate computational model; 2) acquire ahigh-quality experimental data set, and 3) match thesimulation with experiment with a posterioricorrections, if needed, to the modeling andexperimental procedures to reach convergence. Inpractice this is an iterative process. To develop anaccurate computational model of electrical fielddistribution in a human head with high geometricalprecision provided by MRI/CT scans (1 mm), we haveemployed a Finite Difference (FD) 3D numericalsolver [25] and parallelize it in a multi-clusterenvironment [12], [26]. With an appropriate inversesolver we have been able to mimic the whole bEITcycle of conductivity estimation using the syntheticdata corrupted with realistic noise levels. It has beenproven that at least with up 10% Gaussian noise level,
1312388
the conductivity extraction for synthetic data is stillviable.
In our preliminary work [12], to solve thenonlinear optimization problem, we employed thedownhill simplex method of Nelder and Mead. Ourobservation was that simplex search performs wellwhen the number of parameters is few (three or fourparameters), however we found it reaches thepracticality limits with more unknowns and fails toconverge frequently. More than that, to avoid the localminima in the simplex search, we used a statisticalapproach. The inverse procedure was repeated forhundreds of randomly generated sets of conductivityguesses from appropriate physiological intervals, andthen the solutions closest to the global minimumsolution were selected using a simple error thresholdcriteria and results were averaged. With the highergeometry resolution and further differentiation of skulland soft tissue parts, a more powerful technique isrequired. For instance, beyond single digit numbers ofsearch parameters and 1 mm MRI/CT resolution, thesimplex computation quickly becomes impractical. Topursue higher dimensionality, it was clear we mustreplace the simplex method used in our earlier work.We chose the advanced simulated annealing algorithmwhich is a Monte-Carlo global minimization technique.It has been shown to be more robust for optimizationacross complex multi-variate search spaces. Thisalgorithm has allowed us to extend the conductivitymodeling to study the impact of skull inhomogeneitieson the conductivity modeling [15].
The most heavy computational processing onposteriori conductivity extractions in the inverseprocedure has been performed at the University ofOregon Neuroinformatics Center, where a three-cluster(IBM p650; IBM p690; IBM BladeServer) highperformance parallel computing system, dedicated toanalysis of human EEG and MEG data, has beenconstructed. In what follows, the work done toaccomplish these tasks and the final results aredescribed.
3. Results
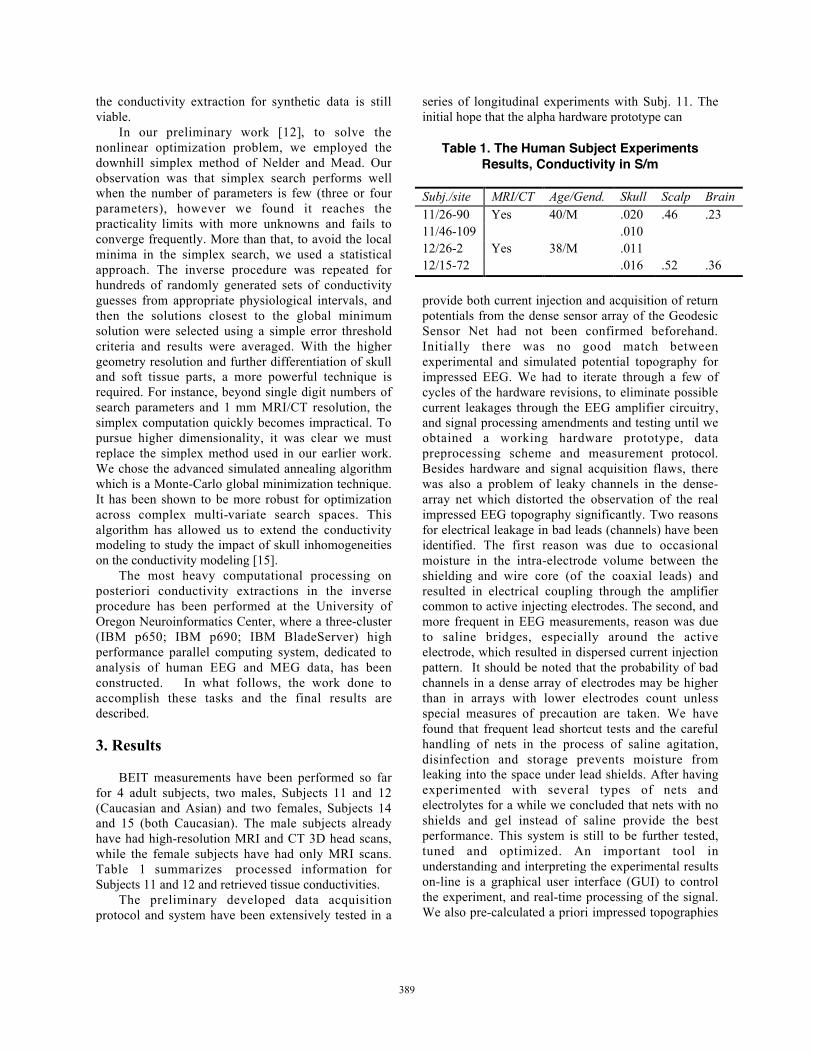
BEIT measurements have been performed so farfor 4 adult subjects, two males, Subjects 11 and 12(Caucasian and Asian) and two females, Subjects 14and 15 (both Caucasian). The male subjects alreadyhave had high-resolution MRI and CT 3D head scans,while the female subjects have had only MRI scans.Table 1 summarizes processed information forSubjects 11 and 12 and retrieved tissue conductivities.
The preliminary developed data acquisitionprotocol and system have been extensively tested in a
series of longitudinal experiments with Subj. 11. Theinitial hope that the alpha hardware prototype can
Table 1. The Human Subject ExperimentsResults, Conductivity in S/m
Subj./site MRI/CT Age/Gend. Skull Scalp Brain11/26-90 Yes 40/M .020 .46 .2311/46-109 .01012/26-2 Yes 38/M .01112/15-72 .016 .52 .36
provide both current injection and acquisition of returnpotentials from the dense sensor array of the GeodesicSensor Net had not been confirmed beforehand.Initially there was no good match betweenexperimental and simulated potential topography forimpressed EEG. We had to iterate through a few ofcycles of the hardware revisions, to eliminate possiblecurrent leakages through the EEG amplifier circuitry,and signal processing amendments and testing until weobtained a working hardware prototype, datapreprocessing scheme and measurement protocol.Besides hardware and signal acquisition flaws, therewas also a problem of leaky channels in the dense-array net which distorted the observation of the realimpressed EEG topography significantly. Two reasonsfor electrical leakage in bad leads (channels) have beenidentified. The first reason was due to occasionalmoisture in the intra-electrode volume between theshielding and wire core (of the coaxial leads) andresulted in electrical coupling through the amplifiercommon to active injecting electrodes. The second, andmore frequent in EEG measurements, reason was dueto saline bridges, especially around the activeelectrode, which resulted in dispersed current injectionpattern. It should be noted that the probability of badchannels in a dense array of electrodes may be higherthan in arrays with lower electrodes count unlessspecial measures of precaution are taken. We havefound that frequent lead shortcut tests and the carefulhandling of nets in the process of saline agitation,disinfection and storage prevents moisture fromleaking into the space under lead shields. After havingexperimented with several types of nets andelectrolytes for a while we concluded that nets with noshields and gel instead of saline provide the bestperformance. This system is still to be further tested,tuned and optimized. An important tool inunderstanding and interpreting the experimental resultson-line is a graphical user interface (GUI) to controlthe experiment, and real-time processing of the signal.We also pre-calculated a priori impressed topographies
1313389
on a generic atlas head models with the injection/sinkpair configurations used afterwards in experiments.
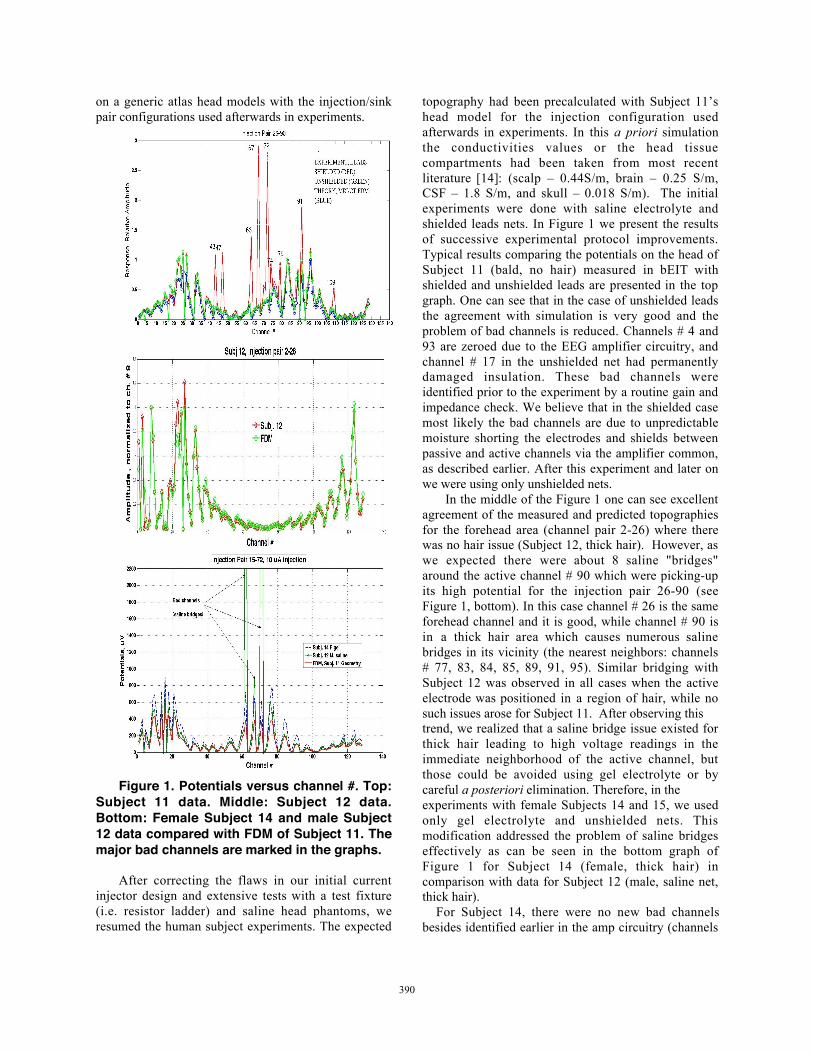
Figure 1. Potentials versus channel #. Top:Subject 11 data. Middle: Subject 12 data.Bottom: Female Subject 14 and male Subject12 data compared with FDM of Subject 11. Themajor bad channels are marked in the graphs.
After correcting the flaws in our initial currentinjector design and extensive tests with a test fixture(i.e. resistor ladder) and saline head phantoms, weresumed the human subject experiments. The expected
topography had been precalculated with Subject 11’shead model for the injection configuration usedafterwards in experiments. In this a priori simulationthe conductivities values or the head tissuecompartments had been taken from most recentliterature [14]: (scalp – 0.44S/m, brain – 0.25 S/m,CSF – 1.8 S/m, and skull – 0.018 S/m). The initialexperiments were done with saline electrolyte andshielded leads nets. In Figure 1 we present the resultsof successive experimental protocol improvements.Typical results comparing the potentials on the head ofSubject 11 (bald, no hair) measured in bEIT withshielded and unshielded leads are presented in the topgraph. One can see that in the case of unshielded leadsthe agreement with simulation is very good and theproblem of bad channels is reduced. Channels # 4 and93 are zeroed due to the EEG amplifier circuitry, andchannel # 17 in the unshielded net had permanentlydamaged insulation. These bad channels wereidentified prior to the experiment by a routine gain andimpedance check. We believe that in the shielded casemost likely the bad channels are due to unpredictablemoisture shorting the electrodes and shields betweenpassive and active channels via the amplifier common,as described earlier. After this experiment and later onwe were using only unshielded nets.
In the middle of the Figure 1 one can see excellentagreement of the measured and predicted topographiesfor the forehead area (channel pair 2-26) where therewas no hair issue (Subject 12, thick hair). However, aswe expected there were about 8 saline "bridges"around the active channel # 90 which were picking-upits high potential for the injection pair 26-90 (seeFigure 1, bottom). In this case channel # 26 is the sameforehead channel and it is good, while channel # 90 isin a thick hair area which causes numerous salinebridges in its vicinity (the nearest neighbors: channels# 77, 83, 84, 85, 89, 91, 95). Similar bridging withSubject 12 was observed in all cases when the activeelectrode was positioned in a region of hair, while nosuch issues arose for Subject 11. After observing thistrend, we realized that a saline bridge issue existed forthick hair leading to high voltage readings in theimmediate neighborhood of the active channel, butthose could be avoided using gel electrolyte or bycareful a posteriori elimination. Therefore, in theexperiments with female Subjects 14 and 15, we usedonly gel electrolyte and unshielded nets. Thismodification addressed the problem of saline bridgeseffectively as can be seen in the bottom graph ofFigure 1 for Subject 14 (female, thick hair) incomparison with data for Subject 12 (male, saline net,thick hair). For Subject 14, there were no new bad channelsbesides identified earlier in the amp circuitry (channels
1314390

# 4 and 93) and net wire (channel # 17). Potentials areplotted as they measured and calculated in the model inmicro-volts. The theoretical curve (red) is in a goodagreement, though, it was not expected to match theexperiment perfectly as it was calculated on the basisof different geometry (Subject 11) with 2 mm
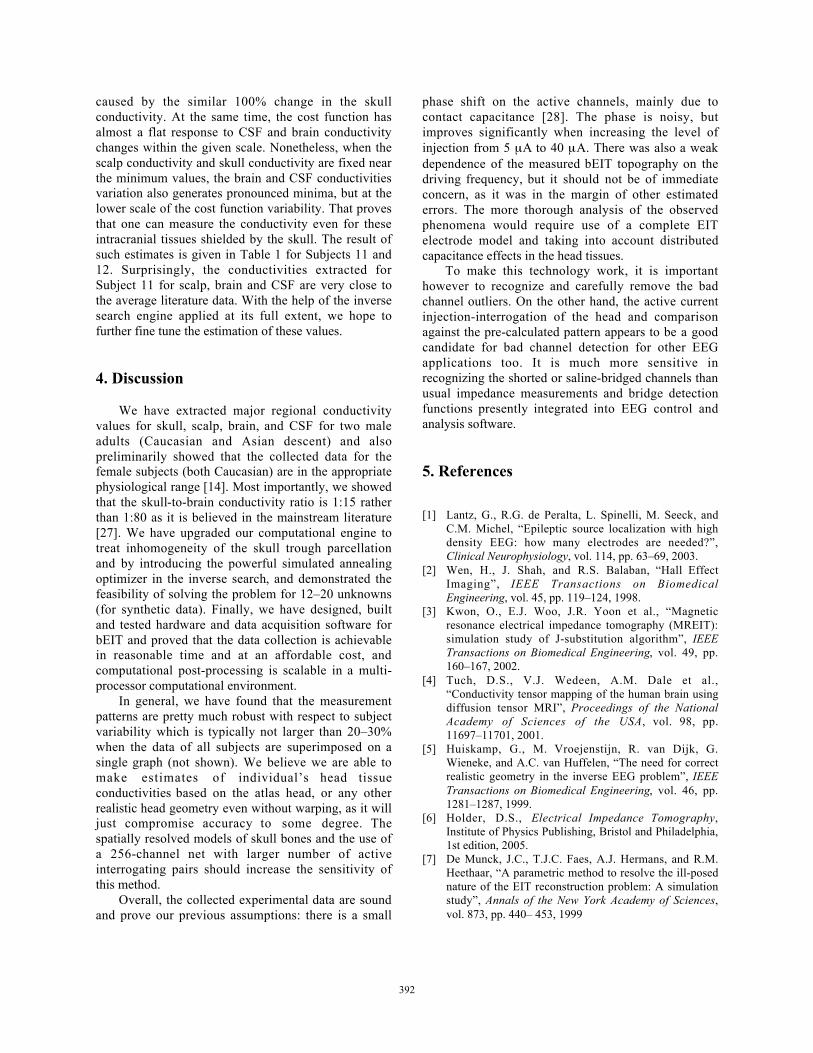
Figure 2. The cost function minimization forSubject 11 (top) and Subject 12 (bottom) for
different skull conductivities when the rest ofthe tissue conductivities are fixed to their best
estimates. Injections pairs and the skullconductivities minimizing the cost function
are shown in the legends. These resultsproves 1:15 ratio of skull to brain conductivity
rather than 1:80 [27]. Resolution is 1 mm.
resolution and given for a typical conductivityparameters set from recent literature without anyadditional fitting. Taking into account the good fit tothe experiment seen in Figure 1, we can conclude thatwe have measured the skull to brain conductivity ratioroughly as 1:15 which agrees with the most recentresults of other groups [8], [10], [29], [30].
Before applying the inverse solver we decided totune our estimates in 1D by alternatively varying theconductivity of a tissue of interest and fixing the rest of
the tissue conductivities at the best previous estimates.The results of such a search are shown in Figure 2 and3. We have started from the set of conductivities usedto match the patterns in Figure 1. First we dealt withthe most important skull conductivity fitting, as theskull data reported in the literature have the largestuncertainty: the variations reported reach up to 1000%[31]. We have processed so far only data from a fewinjection pairs for Subjects 11 and 12; the results aresummarized in Figure 2. One can see that the skullconductivity estimate for the sagittal injection pair 15-72 (where the bones are thick) is larger in both cases(Caucasian and Asian adult male), while also slightlyhigher (0.022 versus 0.016 S/m) for the Caucasiansubject. At the same time the transverse injection pairs(109-46 and 26-2) produce smaller estimates 0.010 and0.011 respectively. These results are in good agreementwith the findings by Oostendorp et al. [8] who alsoused a similar technique and current injection pattern.
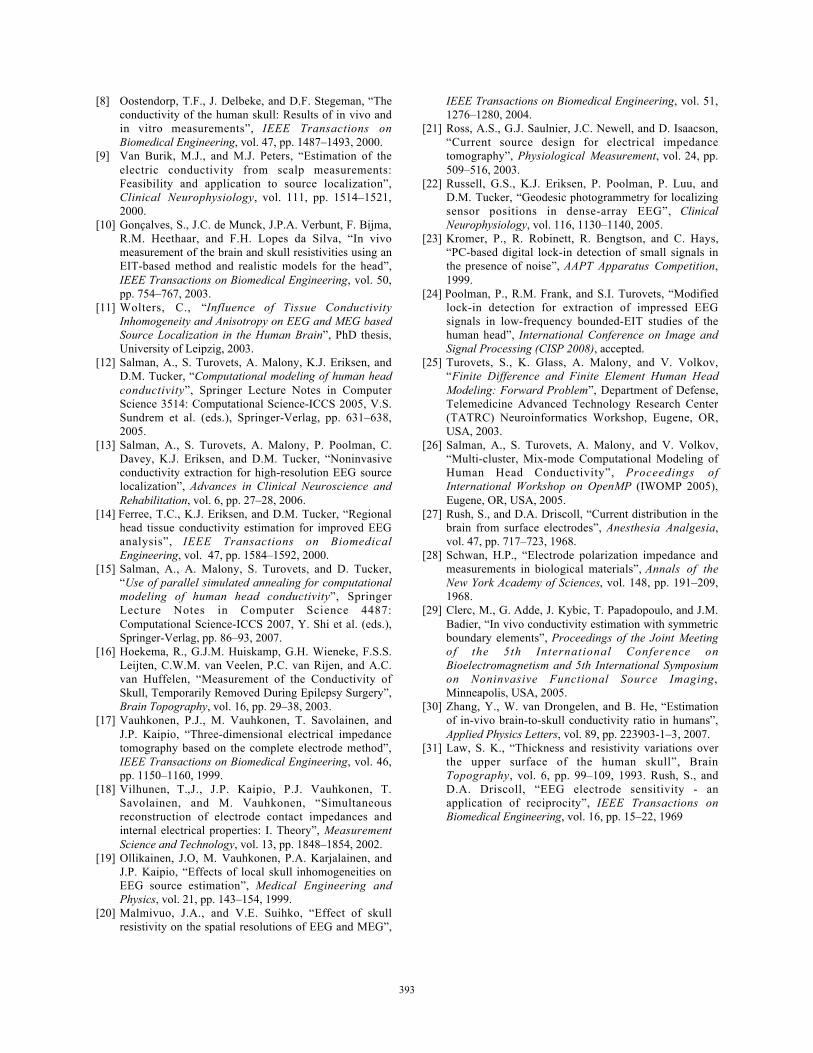
Figure 3. Cost function versus normalizedtissue conductivities for Subject 11, injectionpair 26-90, at 1 mm resolution. The costfunction is most sensitive to the changes inscalp and skull, and less sensitive to CSF andbrain conductivity changes.
One possible explanation for this result is that thefront and rear skull regions are thicker (having a tri-layer structure with marrow [31]) whereas the temporalskull plates are compact, and resistive, cortical bones. In Figure 3 we show cumulative behavior of thecost functions when all tissue conductivities are variedseparately. Several important conclusions can be drawnfrom these results. It seems the forward solution forexternally impressed current is more affected by thescalp and skull misspecifications in conductivities thanby brain or CSF misspecifications. For instance, a100% change in the scalp conductivity from thenominally true value will result in the error functionchange which is two times larger than the change
1315391
caused by the similar 100% change in the skullconductivity. At the same time, the cost function hasalmost a flat response to CSF and brain conductivitychanges within the given scale. Nonetheless, when thescalp conductivity and skull conductivity are fixed nearthe minimum values, the brain and CSF conductivitiesvariation also generates pronounced minima, but at thelower scale of the cost function variability. That provesthat one can measure the conductivity even for theseintracranial tissues shielded by the skull. The result ofsuch estimates is given in Table 1 for Subjects 11 and12. Surprisingly, the conductivities extracted forSubject 11 for scalp, brain and CSF are very close tothe average literature data. With the help of the inversesearch engine applied at its full extent, we hope tofurther fine tune the estimation of these values.
4. Discussion
We have extracted major regional conductivityvalues for skull, scalp, brain, and CSF for two maleadults (Caucasian and Asian descent) and alsopreliminarily showed that the collected data for thefemale subjects (both Caucasian) are in the appropriatephysiological range [14]. Most importantly, we showedthat the skull-to-brain conductivity ratio is 1:15 ratherthan 1:80 as it is believed in the mainstream literature[27]. We have upgraded our computational engine totreat inhomogeneity of the skull trough parcellationand by introducing the powerful simulated annealingoptimizer in the inverse search, and demonstrated thefeasibility of solving the problem for 12–20 unknowns(for synthetic data). Finally, we have designed, builtand tested hardware and data acquisition software forbEIT and proved that the data collection is achievablein reasonable time and at an affordable cost, andcomputational post-processing is scalable in a multi-processor computational environment.
In general, we have found that the measurementpatterns are pretty much robust with respect to subjectvariability which is typically not larger than 20–30%when the data of all subjects are superimposed on asingle graph (not shown). We believe we are able tomake estimates of individual’s head tissueconductivities based on the atlas head, or any otherrealistic head geometry even without warping, as it willjust compromise accuracy to some degree. Thespatially resolved models of skull bones and the use ofa 256-channel net with larger number of activeinterrogating pairs should increase the sensitivity ofthis method.
Overall, the collected experimental data are soundand prove our previous assumptions: there is a small
phase shift on the active channels, mainly due tocontact capacitance [28]. The phase is noisy, butimproves significantly when increasing the level ofinjection from 5 µA to 40 µA. There was also a weakdependence of the measured bEIT topography on thedriving frequency, but it should not be of immediateconcern, as it was in the margin of other estimatederrors. The more thorough analysis of the observedphenomena would require use of a complete EITelectrode model and taking into account distributedcapacitance effects in the head tissues.
To make this technology work, it is importanthowever to recognize and carefully remove the badchannel outliers. On the other hand, the active currentinjection-interrogation of the head and comparisonagainst the pre-calculated pattern appears to be a goodcandidate for bad channel detection for other EEGapplications too. It is much more sensitive inrecognizing the shorted or saline-bridged channels thanusual impedance measurements and bridge detectionfunctions presently integrated into EEG control andanalysis software.
5. References
[1] Lantz, G., R.G. de Peralta, L. Spinelli, M. Seeck, andC.M. Michel, “Epileptic source localization with highdensity EEG: how many electrodes are needed?”,Clinical Neurophysiology, vol. 114, pp. 63–69, 2003.
[2] Wen, H., J. Shah, and R.S. Balaban, “Hall EffectImaging”, IEEE Transactions on BiomedicalEngineering, vol. 45, pp. 119–124, 1998.
[3] Kwon, O., E.J. Woo, J.R. Yoon et al., “Magneticresonance electrical impedance tomography (MREIT):simulation study of J-substitution algorithm”, IEEETransactions on Biomedical Engineering, vol. 49, pp.160–167, 2002.
[4] Tuch, D.S., V.J. Wedeen, A.M. Dale et al.,“Conductivity tensor mapping of the human brain usingdiffusion tensor MRI”, Proceedings of the NationalAcademy of Sciences of the USA, vol. 98, pp.11697–11701, 2001.
[5] Huiskamp, G., M. Vroejenstijn, R. van Dijk, G.Wieneke, and A.C. van Huffelen, “The need for correctrealistic geometry in the inverse EEG problem”, IEEETransactions on Biomedical Engineering, vol. 46, pp.1281–1287, 1999.
[6] Holder, D.S., Electrical Impedance Tomography,Institute of Physics Publishing, Bristol and Philadelphia,1st edition, 2005.
[7] De Munck, J.C., T.J.C. Faes, A.J. Hermans, and R.M.Heethaar, “A parametric method to resolve the ill-posednature of the EIT reconstruction problem: A simulationstudy”, Annals of the New York Academy of Sciences,vol. 873, pp. 440– 453, 1999
1316392
[8] Oostendorp, T.F., J. Delbeke, and D.F. Stegeman, “Theconductivity of the human skull: Results of in vivo andin vitro measurements”, IEEE Transactions onBiomedical Engineering, vol. 47, pp. 1487–1493, 2000.
[9] Van Burik, M.J., and M.J. Peters, “Estimation of theelectric conductivity from scalp measurements:Feasibility and application to source localization”,Clinical Neurophysiology, vol. 111, pp. 1514–1521,2000.
[10] Gonçalves, S., J.C. de Munck, J.P.A. Verbunt, F. Bijma,R.M. Heethaar, and F.H. Lopes da Silva, “In vivomeasurement of the brain and skull resistivities using anEIT-based method and realistic models for the head”,IEEE Transactions on Biomedical Engineering, vol. 50,pp. 754–767, 2003.
[11] Wolters, C., “Influence of Tissue ConductivityInhomogeneity and Anisotropy on EEG and MEG basedSource Localization in the Human Brain”, PhD thesis,University of Leipzig, 2003.
[12] Salman, A., S. Turovets, A. Malony, K.J. Eriksen, andD.M. Tucker, “Computational modeling of human headconductivity”, Springer Lecture Notes in ComputerScience 3514: Computational Science-ICCS 2005, V.S.Sundrem et al. (eds.), Springer-Verlag, pp. 631–638,2005.
[13] Salman, A., S. Turovets, A. Malony, P. Poolman, C.Davey, K.J. Eriksen, and D.M. Tucker, “Noninvasiveconductivity extraction for high-resolution EEG sourcelocalization”, Advances in Clinical Neuroscience andRehabilitation, vol. 6, pp. 27–28, 2006.
[14] Ferree, T.C., K.J. Eriksen, and D.M. Tucker, “Regionalhead tissue conductivity estimation for improved EEGanalysis”, IEEE Transactions on BiomedicalEngineering, vol. 47, pp. 1584–1592, 2000.
[15] Salman, A., A. Malony, S. Turovets, and D. Tucker,“Use of parallel simulated annealing for computationalmodeling of human head conductivity”, SpringerLecture Notes in Computer Science 4487:Computational Science-ICCS 2007, Y. Shi et al. (eds.),Springer-Verlag, pp. 86–93, 2007.
[16] Hoekema, R., G.J.M. Huiskamp, G.H. Wieneke, F.S.S.Leijten, C.W.M. van Veelen, P.C. van Rijen, and A.C.van Huffelen, “Measurement of the Conductivity ofSkull, Temporarily Removed During Epilepsy Surgery”,Brain Topography, vol. 16, pp. 29–38, 2003.
[17] Vauhkonen, P.J., M. Vauhkonen, T. Savolainen, andJ.P. Kaipio, “Three-dimensional electrical impedancetomography based on the complete electrode method”,IEEE Transactions on Biomedical Engineering, vol. 46,pp. 1150–1160, 1999.
[18] Vilhunen, T.,J., J.P. Kaipio, P.J. Vauhkonen, T.Savolainen, and M. Vauhkonen, “Simultaneousreconstruction of electrode contact impedances andinternal electrical properties: I. Theory”, MeasurementScience and Technology, vol. 13, pp. 1848–1854, 2002.
[19] Ollikainen, J.O, M. Vauhkonen, P.A. Karjalainen, andJ.P. Kaipio, “Effects of local skull inhomogeneities onEEG source estimation”, Medical Engineering andPhysics, vol. 21, pp. 143–154, 1999.
[20] Malmivuo, J.A., and V.E. Suihko, “Effect of skullresistivity on the spatial resolutions of EEG and MEG”,
IEEE Transactions on Biomedical Engineering, vol. 51,1276–1280, 2004.
[21] Ross, A.S., G.J. Saulnier, J.C. Newell, and D. Isaacson,“Current source design for electrical impedancetomography”, Physiological Measurement, vol. 24, pp.509–516, 2003.
[22] Russell, G.S., K.J. Eriksen, P. Poolman, P. Luu, andD.M. Tucker, “Geodesic photogrammetry for localizingsensor positions in dense-array EEG”, ClinicalNeurophysiology, vol. 116, 1130–1140, 2005.
[23] Kromer, P., R. Robinett, R. Bengtson, and C. Hays,“PC-based digital lock-in detection of small signals inthe presence of noise”, AAPT Apparatus Competition,1999.
[24] Poolman, P., R.M. Frank, and S.I. Turovets, “Modifiedlock-in detection for extraction of impressed EEGsignals in low-frequency bounded-EIT studies of thehuman head”, International Conference on Image andSignal Processing (CISP 2008), accepted.
[25] Turovets, S., K. Glass, A. Malony, and V. Volkov,“Finite Difference and Finite Element Human HeadModeling: Forward Problem”, Department of Defense,Telemedicine Advanced Technology Research Center(TATRC) Neuroinformatics Workshop, Eugene, OR,USA, 2003.
[26] Salman, A., S. Turovets, A. Malony, and V. Volkov,“Multi-cluster, Mix-mode Computational Modeling ofHuman Head Conductivity”, Proceedings ofInternational Workshop on OpenMP (IWOMP 2005),Eugene, OR, USA, 2005.
[27] Rush, S., and D.A. Driscoll, “Current distribution in thebrain from surface electrodes”, Anesthesia Analgesia,vol. 47, pp. 717–723, 1968.
[28] Schwan, H.P., “Electrode polarization impedance andmeasurements in biological materials”, Annals of theNew York Academy of Sciences, vol. 148, pp. 191–209,1968.
[29] Clerc, M., G. Adde, J. Kybic, T. Papadopoulo, and J.M.Badier, “In vivo conductivity estimation with symmetricboundary elements”, Proceedings of the Joint Meetingof the 5th International Conference onBioelectromagnetism and 5th International Symposiumon Noninvasive Functional Source Imaging,Minneapolis, USA, 2005.
[30] Zhang, Y., W. van Drongelen, and B. He, “Estimationof in-vivo brain-to-skull conductivity ratio in humans”,Applied Physics Letters, vol. 89, pp. 223903-1–3, 2007.
[31] Law, S. K., “Thickness and resistivity variations overthe upper surface of the human skull”, BrainTopography, vol. 6, pp. 99–109, 1993. Rush, S., andD.A. Driscoll, “EEG electrode sensitivity - anapplication of reciprocity”, IEEE Transactions onBiomedical Engineering, vol. 16, pp. 15–22, 1969
1317393