conceptual design of a hybrid (turbofan/solar
TRANSCRIPT
7TH EUROPEAN CONFERENCE FOR AERONAUTICS AND SPACE SCIENCES (EUCASS)
Copyright 2015 by First Author and Second Author. Published by the EUCASS association with permission.
CONCEPTUAL DESIGN OF A
HYBRID (TURBOFAN/SOLAR) POWERED HALE UAV
Erdinç MERMER* and Prof. Dr. Serkan ÖZGEN**
*TÜBİTAK Space Technologies Research Institute
Ankara Turkey
**Middle East Technical University
Ankara Turkey
Abstract
The aim of the study is to design a HALE UAV using both turbofan engine and solar energy in order
to obtain at least 24 hours endurance with 250 kg camera and 750 kg battery total 1000 kg payload
capacity and 6096m (20000 ft) to 9144 m (30000 ft) service ceiling. During daytime, required power
is obtained from solar panels. Morover, excess solar energy is used for charging the lithium-ion
battery. It is assumed that turbofan engine is used only for climbing to the required altitude. During
loiter, only solar energy and battery power are used. The design methodology consists of two main
parts. In the first part, typical conceptual design methodology is used. Weight analysis, wing loading
and thrust loading, required power analysis, aircraft performance analysis are performed. While
performing the conceptual design, aircraft is assumed as a turbofan-powered aircraft. Due to long
wingspan and large wing area, typical structural weight determination techniques are not suitable for
the HALE UAV. Therefore, a new structural weight prediction model is used. In the second part of
the thesis, solar energy and battery energy are examined in order to assess whether endurance and
service ceiling requirements are satisfied. Solar radiation model is used for verification.
1. Introduction
Solar powered aircraft systems have been studied approximately since 40 years. Solar cell technology has been
developed in terms of cell efficiency since many years, which is promising for solar-based aircraft concepts when
compared to conventional long endurance aircraft. The most recent solar-based aircraft are the Solar Impulse and
Qinetiq Zephyr systems, which are using solar cells with efficiency of 22% and 28%, respectively. Moreover, GaAs-
based solar cells with around 30% efficiency are commonly used in space industry and this technology has almost
exceeded 40% of efficiency recently. Although the cost of this technology is high at the moment, the use of GaAs-
based solar cells in airborne and spaceborne missions in the near future will be commonplace, decreasing the cost for
affordable missions. Due to the fact that the solar radiation is available only during daytime, the battery is the only
source of power during night flight. Solar Impulse is one of the most important competitors for this study because of
its advanced battery technology. Solar impulse obtains its nighttime energy from 4 pieces of 164 kWh/kg Li-Ion
batteries, while Qinetic Zephyr uses 350 kWh/kg Lithium Sulphur batteries. In the near future, Sulphur based
batteries will be used more commonly for solar powered aircraft since their energy density is nearly as twice as much
as ion based ones.
1.1 Conceptual Design
Before starting the conceptual design, it is essential for designers to remember that most of the airplane designs are
evolutionary, not revolutionary. Therefore, choosing suitable competitor aircraft and specifying applicable
requirements is very important. The conceptual design begins with requirements. Hybrid UAV design requirements
for the current study are stated in Table 1.
DOI: 10.13009/EUCASS2017-200
Mermer, Özgen
2
Table 1 Requirements
Payload
(kg)
Endurance
(hour)
Range
(nm)
Cruise Speed
(m/s)
Service Ceiling
(km)
Stall Speed
@ sea level
(m/s)
1000 24-48 1000 35 9-21 50
The competitor study is performed to predict the aircraft initial geometric and weight parameters, for instance, aspect
ratio and weight fractions. From the competitor study, average empty weight fraction is found as 0.6218, aspect ratio
is found as 24.5. is assumed as 40, average wingspan is calculated as 66.45 m and average chord length is
calculated as 2.44 m. Since there are no hybrid aircraft design data in the literature, competitor aircraft have been
chosen among HALE UAVs and solar powered UAVs, as shown in Table 2.
Table 2 Competitor Aircraft
Aircraft Phantom Eye
2010
Global Observer 2
2005
Global Hawk
1998
Lockheed U2S
2010 Condor 1989
Length 16 m 25 m 14 m 22.4 m 19.2 m
Wingspan 65 m 79 m 35 m 71.9 m 31.4 m
Empty Weight 3700 kg 2750 kg 3851 kg 2300 kg 14300 kg
Gross Weight 4561 kg 4168 kg 10387 kg 2300 kg 18500 kg
Propulsion Hydrogen Hydrogen Turbofan Turbofan Turboprop
Thrust/Power 2x112 kW - 31 kN 86 kN 130 kW
Range 13000 km 17300 km 24985 km 1541 km --
Endurance 7 days 7 days 36 hours 12 hours 80 hours
Service Ceiling 20 km 20 km 20 km 12 km 21.3 km
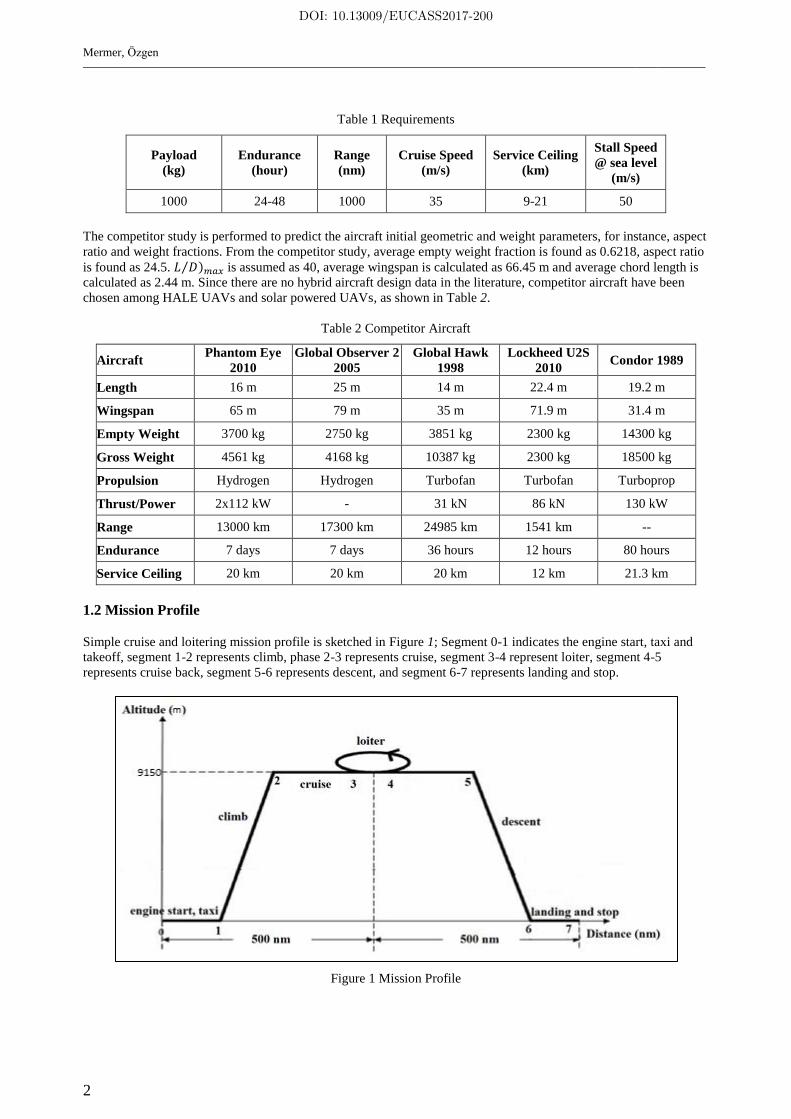
1.2 Mission Profile
Simple cruise and loitering mission profile is sketched in Figure 1; Segment 0-1 indicates the engine start, taxi and
takeoff, segment 1-2 represents climb, phase 2-3 represents cruise, segment 3-4 represent loiter, segment 4-5
represents cruise back, segment 5-6 represents descent, and segment 6-7 represents landing and stop.
Figure 1 Mission Profile
DOI: 10.13009/EUCASS2017-200
Mermer, Özgen
3
Takeoff gross weight is the total aircraft weight including crew, payload, empty and fuel weights.
(1)
While estimating takeoff gross weight Table 2 [1] is used. Constants which are for high altitude UAV are used for
calculations. for fixed sweep wing.
Fuel weight depends on the mission to be flown, the fuel consumption rate of the engine and aerodynamics of the
aircraft. As indicated in Figure 1, mission profile is separated into 7 parts. Each phase of the mission is represented
by a weight fraction. At the end of the mission, all weight fractions are multiplied and fuel weight fraction is
calculated. For a simple cruise mission Raymer [1] describes fuel weight and gross weight calculations as follows:
(2)
Where represents the fuel weight of the aircraft symbolizes the takeoff gross weight of the aircraft and
stands for the weight of the aircraft at the end of the mission. It is assumed that the fuel tanks are completely empty
at the end of the flight except for trapped and unused fuel, see below. The weight fractions for each phase is
calculated as follows.
(0-1) For the engine start, taxi and takeoff, historical trend is used [1]:
(3)
is the takeoff weight of the aircraft.
(1-2) For climb, historical trend is used [1]:
(4)
Where is the weight of the aircraft at the beginning of cruise.
(2-3) For cruise, Breguet range equation is used [1]:
(5)
where is the weight of the aircraft at end of the cruise and and specific fuel
consumption is taken as .
(4-5) Cruise back:
(6)
where is the weight of the aircraft at end of the loiter and is the weight of the aircraft at end of the cruise back.
(5-6) For descent, historical trend is used [1]:
is the landing weight of the aircraft.
(7)
(6-7) For landing and stop, historical trend is used [1]:
(8)
As a result:
(9)
(10)
DOI: 10.13009/EUCASS2017-200
Mermer, Özgen
4
assuming that 6% is the reserve or trapped fuel. Using the takeoff gross weight estimation equation:
(11)
Takeoff gross weight and fuel weight is calculated as:
By assigning service ceiling as 9150 m (30000 ft) and range as 1000 nm, take off gross weight is determined
iteratively using equation 11.
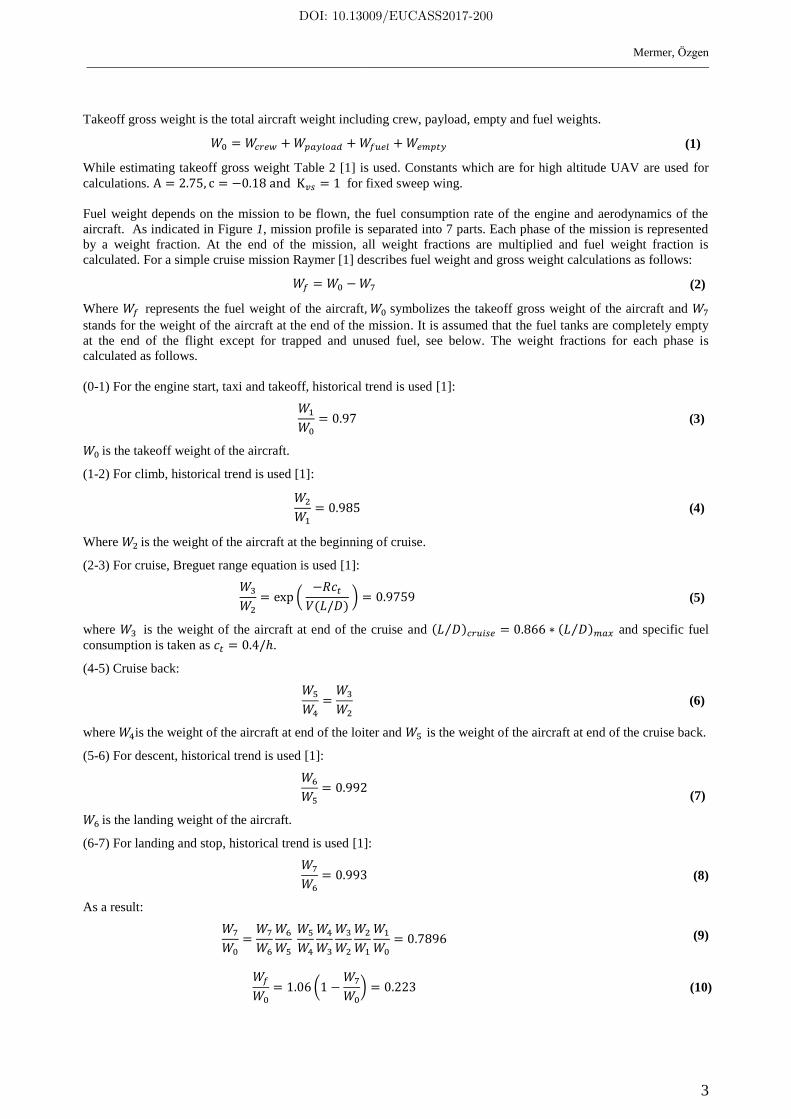
After determining the takeoff gross weight, thrust to weight ratio calculations are performed. Calculations are done
by using 5 desired performance parameters. While determining T/W, an initial wing loading is assumed, which is
assigned as 24.45 kg/m2 based on competitor study, yielding T/W = 0.175. Aspect ratio is calculated using
competitor average aspect ratio, which is 24.5.
Figure 2 Thrust Loading vs. Wing Loading
Wing loading is another crucial parameter for aircraft design since almost all performance characteristics depend on
wing loading. Optimum wing loading is calculated by using aircraft design requirements such as takeoff distance,
landing distance, cruise speed, stall speed, instantaneous turn and sustained turn. The lowest wing loading is chosen
after calculations since the lowest wing loading, i.e. largest wing satisfies all of the requirements. Wing loading
calculations are performed with various velocity values, because observing the effects of the velocity changes on
wing loading is useful when surveying performance parameters at different altitudes. After all calculations, the
lowest wing loading becomes W/S = 24.9 kg/m2
corresponding to the cruise velocity wing loading. Wing area can be
determined by dividing the weight estimation by wing loading. The results of this calculation yields the wing
planform area as 165 m2.
Using the aspect ratio and planform area, wingspan can be calculated from equation 12 as 63.55 m
(12)
Up to now, aspect ratio, wingspan and wing area are determined. As known, elliptic lift distribution is very important
for long wingspans since they are prone to structural failure due to high bending moments at the root. Generally,
solar airplanes which have long wingspan, have variable taper ratio in order to obtain elliptic lift distribution. Also,
DOI: 10.13009/EUCASS2017-200
Mermer, Özgen
5
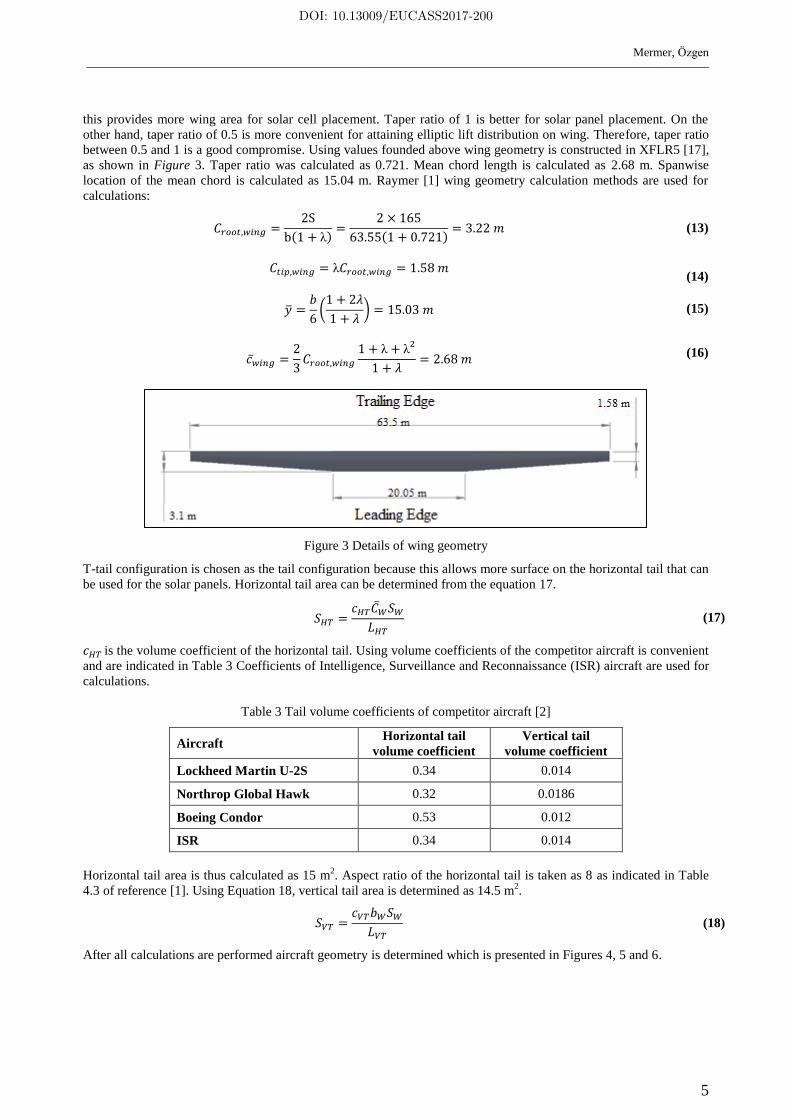
this provides more wing area for solar cell placement. Taper ratio of 1 is better for solar panel placement. On the
other hand, taper ratio of 0.5 is more convenient for attaining elliptic lift distribution on wing. Therefore, taper ratio
between 0.5 and 1 is a good compromise. Using values founded above wing geometry is constructed in XFLR5 [17],
as shown in Figure 3. Taper ratio was calculated as 0.721. Mean chord length is calculated as 2.68 m. Spanwise
location of the mean chord is calculated as 15.04 m. Raymer [1] wing geometry calculation methods are used for
calculations:
(13)
(14)
(15)
(16)
Figure 3 Details of wing geometry
T-tail configuration is chosen as the tail configuration because this allows more surface on the horizontal tail that can
be used for the solar panels. Horizontal tail area can be determined from the equation 17.
(17)
is the volume coefficient of the horizontal tail. Using volume coefficients of the competitor aircraft is convenient
and are indicated in Table 3 Coefficients of Intelligence, Surveillance and Reconnaissance (ISR) aircraft are used for
calculations.
Table 3 Tail volume coefficients of competitor aircraft [2]
Aircraft Horizontal tail
volume coefficient
Vertical tail
volume coefficient
Lockheed Martin U-2S 0.34 0.014
Northrop Global Hawk 0.32 0.0186
Boeing Condor 0.53 0.012
ISR 0.34 0.014
Horizontal tail area is thus calculated as 15 m2. Aspect ratio of the horizontal tail is taken as 8 as indicated in Table
4.3 of reference [1]. Using Equation 18, vertical tail area is determined as 14.5 m2.
(18)
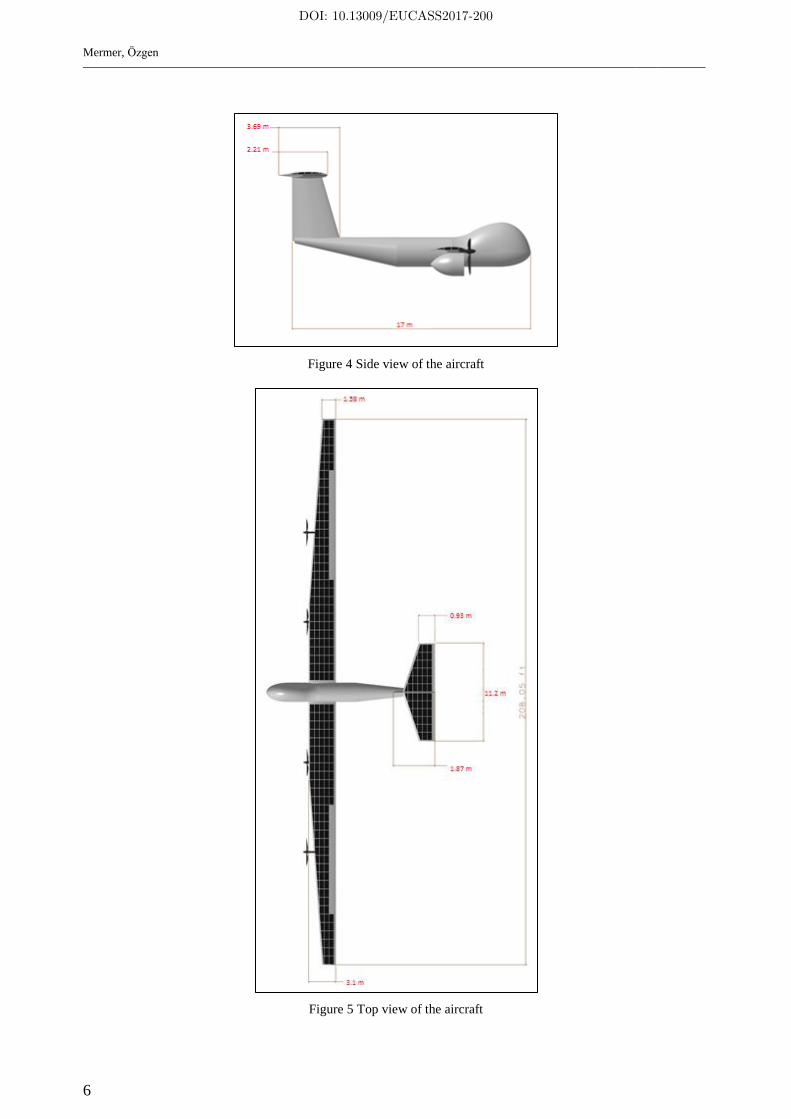
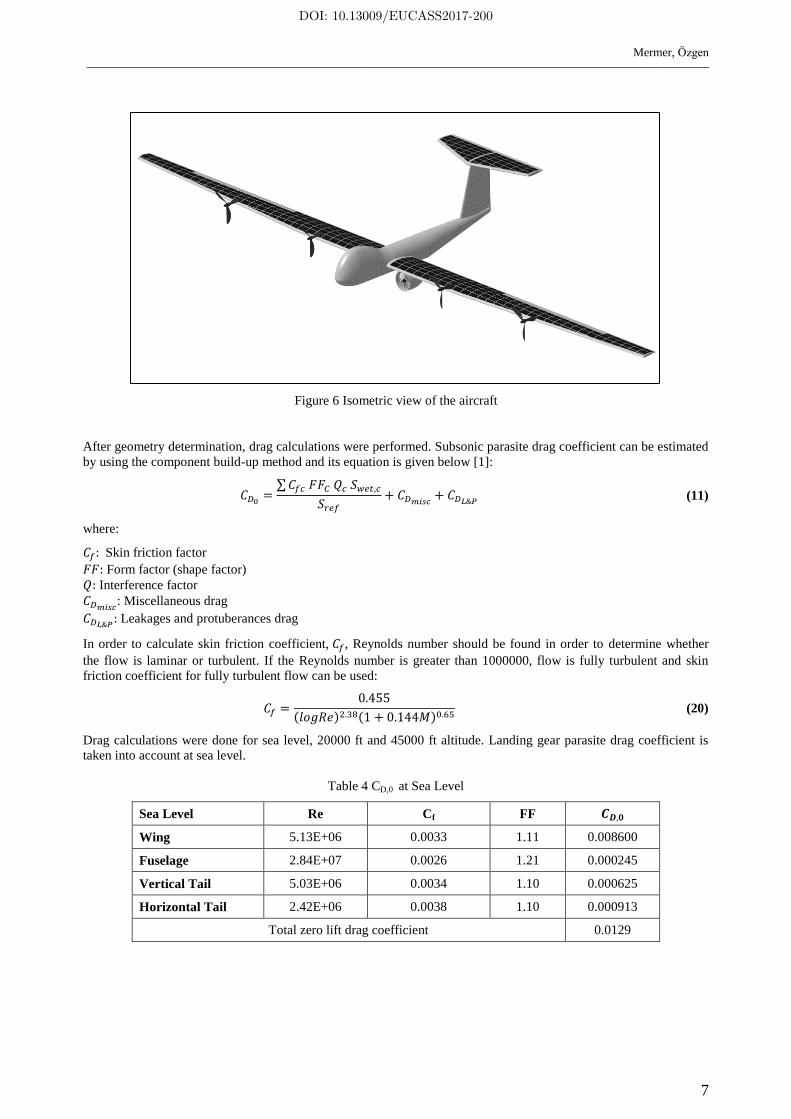
After all calculations are performed aircraft geometry is determined which is presented in Figures 4, 5 and 6.
DOI: 10.13009/EUCASS2017-200
Mermer, Özgen
6
Figure 4 Side view of the aircraft
Figure 5 Top view of the aircraft
DOI: 10.13009/EUCASS2017-200
Mermer, Özgen
7
Figure 6 Isometric view of the aircraft
After geometry determination, drag calculations were performed. Subsonic parasite drag coefficient can be estimated
by using the component build-up method and its equation is given below [1]:
(11)
where:
Skin friction factor
Form factor (shape factor)
Interference factor
: Miscellaneous drag
Leakages and protuberances drag
In order to calculate skin friction coefficient, , Reynolds number should be found in order to determine whether
the flow is laminar or turbulent. If the Reynolds number is greater than 1000000, flow is fully turbulent and skin
friction coefficient for fully turbulent flow can be used:
(20)
Drag calculations were done for sea level, 20000 ft and 45000 ft altitude. Landing gear parasite drag coefficient is
taken into account at sea level.
Table 4 CD,0 at Sea Level
Sea Level Re Cf FF
Wing 5.13E+06 0.0033 1.11 0.008600
Fuselage 2.84E+07 0.0026 1.21 0.000245
Vertical Tail 5.03E+06 0.0034 1.10 0.000625
Horizontal Tail 2.42E+06 0.0038 1.10 0.000913
Total zero lift drag coefficient 0.0129
DOI: 10.13009/EUCASS2017-200
Mermer, Özgen
8
Table 5 CD,0 at 6096 m (20000 ft) altitude
20000ft Re Cf FF
Wing 3.07E+06 0.0037 1.11 0.001900
Fuselage 1.70E+07 0.0028 1.21 0.001046
Vertical Tail 3.02E+06 0.0037 1.10 0.000718
Horizontal Tail 1.45E+06 0.0042 1.10 0.009736
Total zero lift drag coefficient 0.0134
Table 6 CD,0 at 13716 m (45000 ft) altitude
45000ft Re Cf FF
Wing 1.25E+06 0.0043 1.12 0.01146
Fuselage 6.95E+06 0.0032 1.21 0.00084
Vertical Tail 1.23E+06 0.0043 1.10 0.00123
Horizontal Tail 5.96E+05 0.0049 1.10 0.00217
Total zero lift drag coefficient 0.0157
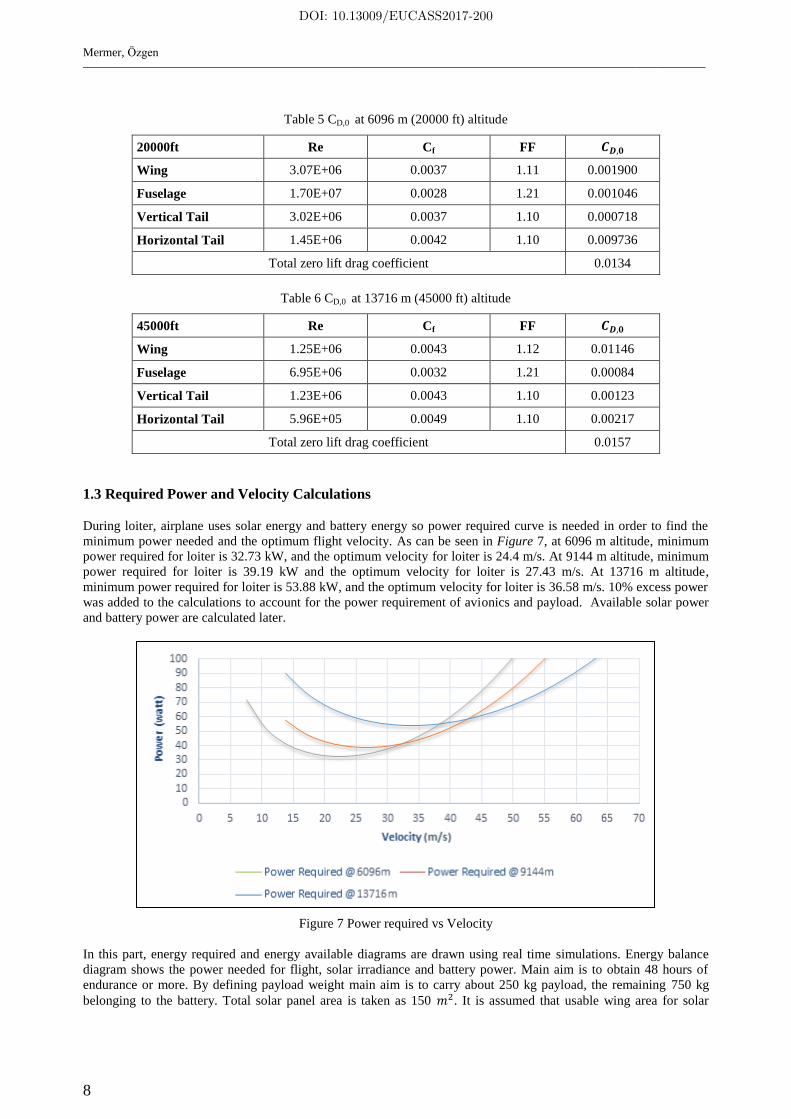
1.3 Required Power and Velocity Calculations
During loiter, airplane uses solar energy and battery energy so power required curve is needed in order to find the
minimum power needed and the optimum flight velocity. As can be seen in Figure 7, at 6096 m altitude, minimum
power required for loiter is 32.73 kW, and the optimum velocity for loiter is 24.4 m/s. At 9144 m altitude, minimum
power required for loiter is 39.19 kW and the optimum velocity for loiter is 27.43 m/s. At 13716 m altitude,
minimum power required for loiter is 53.88 kW, and the optimum velocity for loiter is 36.58 m/s. 10% excess power
was added to the calculations to account for the power requirement of avionics and payload. Available solar power
and battery power are calculated later.
Figure 7 Power required vs Velocity
In this part, energy required and energy available diagrams are drawn using real time simulations. Energy balance
diagram shows the power needed for flight, solar irradiance and battery power. Main aim is to obtain 48 hours of
endurance or more. By defining payload weight main aim is to carry about 250 kg payload, the remaining 750 kg
belonging to the battery. Total solar panel area is taken as 150 . It is assumed that usable wing area for solar
DOI: 10.13009/EUCASS2017-200
Mermer, Özgen
9
panels is 140 m2. Solar panels are not used on the regions on the wing which have high curvature and the control
surfaces. Also using same assumptions, solar panel area on horizontal tail is estimated as 10 .
1.4 Solar Irradiance
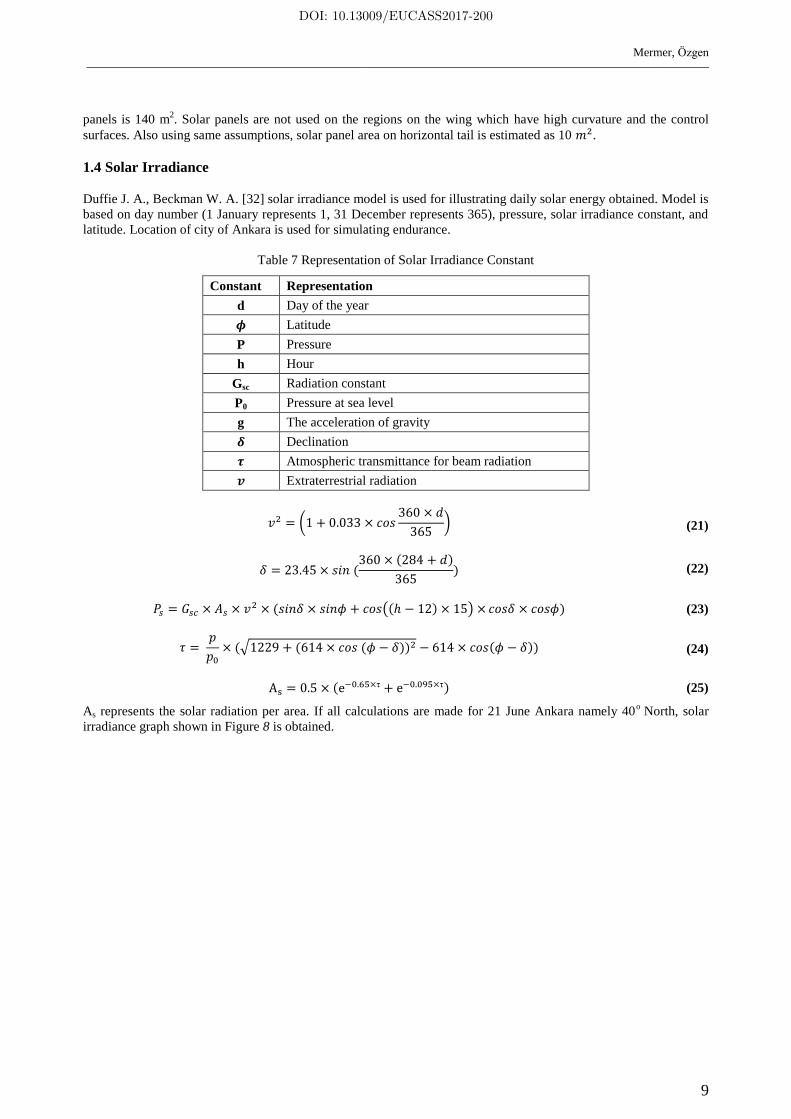
Duffie J. A., Beckman W. A. [32] solar irradiance model is used for illustrating daily solar energy obtained. Model is
based on day number (1 January represents 1, 31 December represents 365), pressure, solar irradiance constant, and
latitude. Location of city of Ankara is used for simulating endurance.
Table 7 Representation of Solar Irradiance Constant
Constant Representation
d Day of the year
Latitude
P Pressure
h Hour
Gsc Radiation constant
P0 Pressure at sea level
g The acceleration of gravity
Declination
Atmospheric transmittance for beam radiation
Extraterrestrial radiation
(21)
(22)
(23)
(24)
(25)
As represents the solar radiation per area. If all calculations are made for 21 June Ankara namely 40o
North, solar
irradiance graph shown in Figure 8 is obtained.
DOI: 10.13009/EUCASS2017-200
Mermer, Özgen
10
Figure 8 Average Annual Solar Radiation Fluxes of Ankara
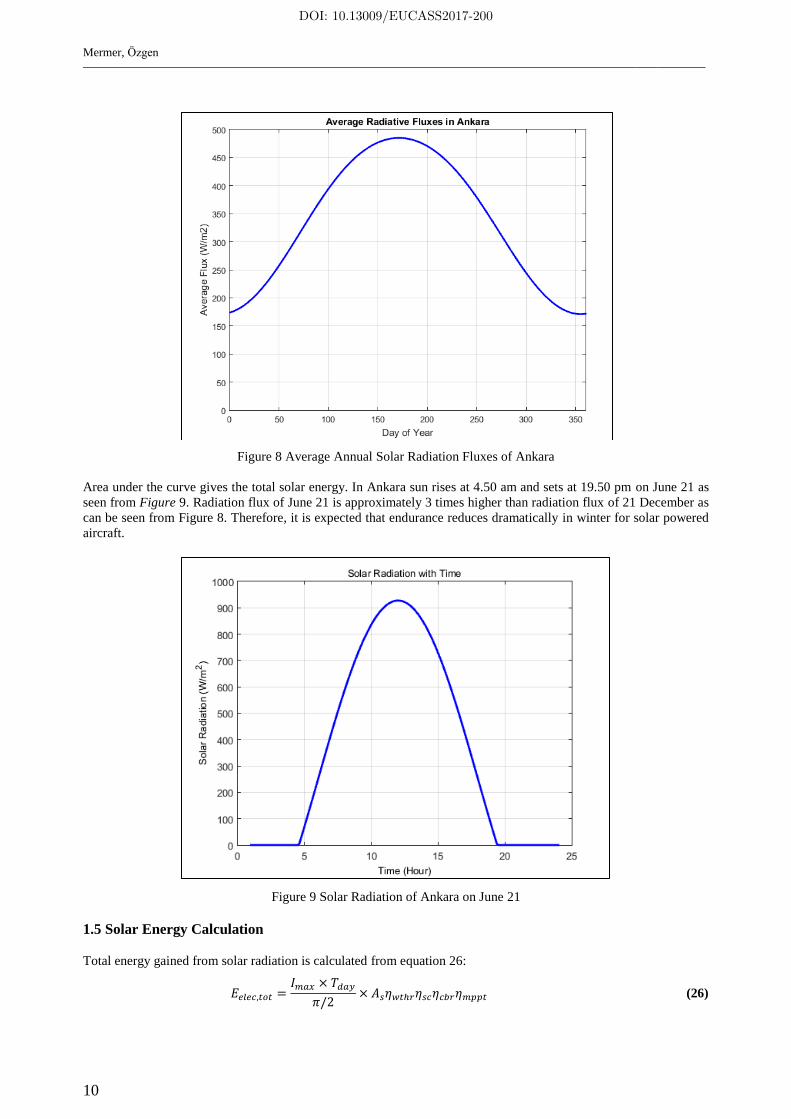
Area under the curve gives the total solar energy. In Ankara sun rises at 4.50 am and sets at 19.50 pm on June 21 as
seen from Figure 9. Radiation flux of June 21 is approximately 3 times higher than radiation flux of 21 December as
can be seen from Figure 8. Therefore, it is expected that endurance reduces dramatically in winter for solar powered
aircraft.
Figure 9 Solar Radiation of Ankara on June 21
1.5 Solar Energy Calculation
Total energy gained from solar radiation is calculated from equation 26:
(26)
DOI: 10.13009/EUCASS2017-200
Mermer, Özgen
11
where:
is the weather efficiency, namely if there is a clear sky or dark sky. It is assumed that the sky is clear.
is the solar cell efficiency taken as 0.3.
is the wing camber efficiency taken as 0.9. It is calculated by using wing upper surface slope. It ıs calculated by
taking both oncoming airfoil upper surface coordinate data and calculating its slope. Solar panels are not used on
area having high slope.
(Sunlight conversion system efficiency) is taken as 0.95.
The efficiency values are summarized in Table 8.
Table 8 Efficiency of Solar Instruments
Instruments Efficiency
Cell configuration 0.93%
MPPT 0.97%
MPPT tracking 0.95%
Charge/Discharge 0.986%
Propeller 0.8%
Electric Motor 87%
Gearbox 95%
Required energy is calculated before conceptual design phase. Power required analysis is performed in order to
simulate loitering phase. During simulation, the flight efficiencies are assumed as constant. Also, it is assumed that
aircraft flies in clear sky. Wind is assumed as steady, there is no gust. During simulations, batteries are taken as fully
charged before takeoff.
Battery is one of the most important components for solar powered aircraft. When determining battery properties,
Solar Impulse’s battery technology is used, since Solar Impulse designers use the most cost and energy efficient
batteries. Moreover battery availability is another crucial parameter for designers. Therefore, if one who wants to
design a solar powered aircraft, must take into account the availability of technological instruments. Specific energy
of the Solar Impulse’s batteries is greater than 259.45 Wh/kg, which means they are efficient enough and available
for Hybrid UAV. There are 4 pieces of 41 kWh lithium-ion batteries and total 52 kW power plant on Solar Impulse.
Each battery weighs 157.85 kg and 5 identical batteries are used for this study. Also, it is assumed that excess solar
energy is stored in the batteries. Battery charge and discharge efficiencies are taken as 0.986 [4].
1.6 Real Time Simulation
Theory of real time simulation is based on energy balance of the system. Aircraft takes off with fully charged
batteries. Until flying up to the mission area and altitude, turbofan engine is used. Then solar irradiance energy and
battery energy are used. If required power becomes greater than the available power, simulation stops. Optimum
takeoff time is found by trying different times of the day. For instance, On June 21 maximum endurance occurs when
aircraft starts loitering at 24.00. On the other hand, On December 21 (shortest daytime) maximum endurance time
occurs when aircraft starts loitering at 06.00 am. Simulations are performed for 2 additional different days of the year
which are 21 March, 23 September. Solar radiation on equinoxes are same. Differences are sunrise and sunset times.
Simulations are performed for each day in order to show the optimum loitering hours.
1.7 Methods for Reconstructing Solar Cycle
Major advantage of the hybrid system is the possibility of reconstructing the solar cycle. One way is to add excess
fuel to the aircraft in order to attain to the point where required power is equal to the solar power obtained from solar
panels. After reaching that point, cycle restarts.
Another method is the unpowered gliding method. In other words, if required energy becomes more than available
solar and battery energy, aircraft starts unpowered gliding in order attain to the point where required power is equal
to the solar power obtained from solar panels. For instance when aircraft loiters at 13716 kg with 40% efficient solar
DOI: 10.13009/EUCASS2017-200
Mermer, Özgen
12
cells on June 21, approximately 4 hours are needed to reach to that point. After 4 hours of unpowered gliding, solar
cycle restarts at 1524 m altitude at 11.00 am.
2. Simulations of Various Cases
First case is the lowest altitude case. At 6096 m aircraft needs 32 kW power in order to sustain loitering. As
mentioned before, 4 different days of the year are used for illustrating loitering time.
2.1 Simulations for 30% Efficient Solar Cells
2.1.1 6096 m, June 21, 30% Efficient Solar Cells
The longest daytime of the year in the northern hemisphere occurs on 21 June. Sun rises at 04:50 am. Aircraft starts
loitering at 24:00. All simulations are performed for location of Ankara (40o latitude).
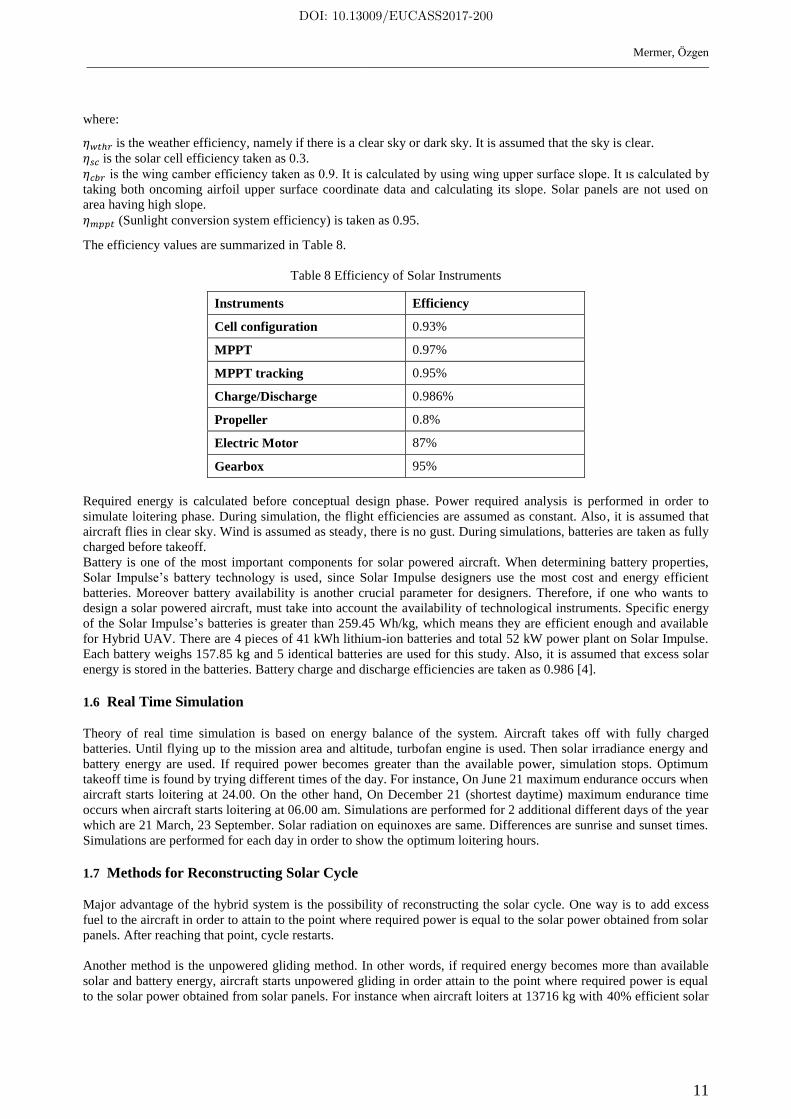
As mentioned before, when required power is less than battery power and solar powered gained from sun, simulation
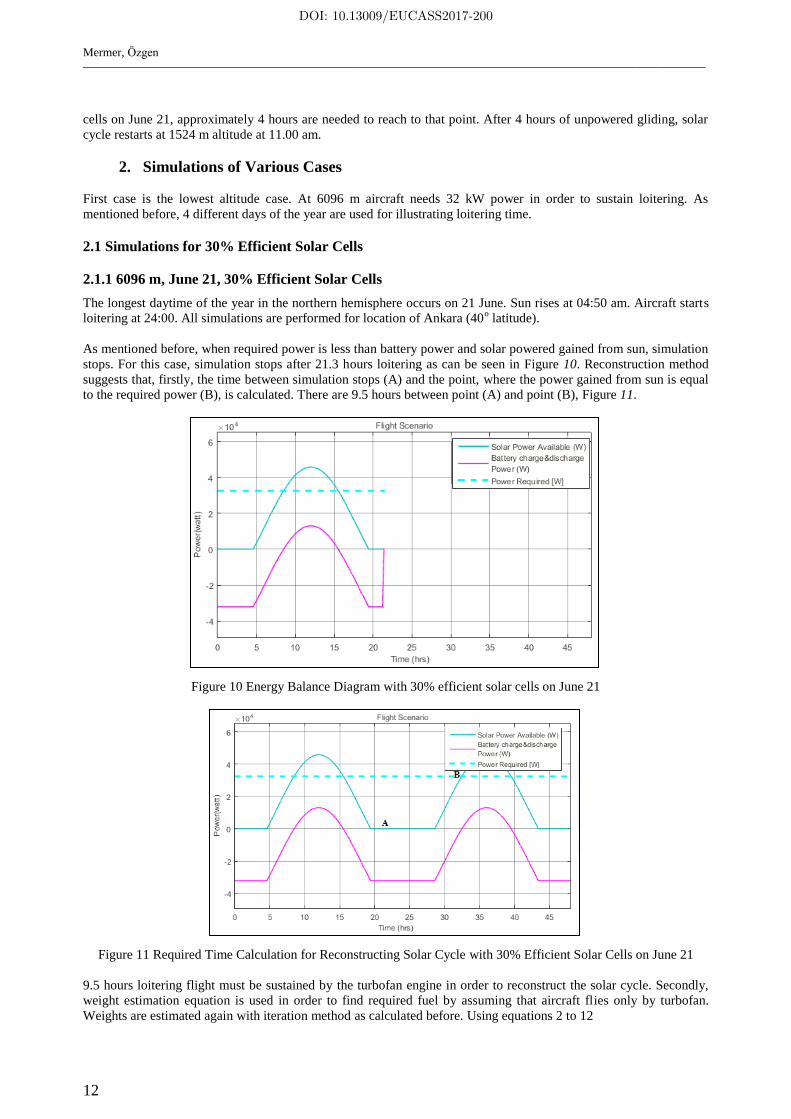
stops. For this case, simulation stops after 21.3 hours loitering as can be seen in Figure 10. Reconstruction method
suggests that, firstly, the time between simulation stops (A) and the point, where the power gained from sun is equal
to the required power (B), is calculated. There are 9.5 hours between point (A) and point (B), Figure 11.
Figure 10 Energy Balance Diagram with 30% efficient solar cells on June 21
Figure 11 Required Time Calculation for Reconstructing Solar Cycle with 30% Efficient Solar Cells on June 21
9.5 hours loitering flight must be sustained by the turbofan engine in order to reconstruct the solar cycle. Secondly,
weight estimation equation is used in order to find required fuel by assuming that aircraft flies only by turbofan.
Weights are estimated again with iteration method as calculated before. Using equations 2 to 12
DOI: 10.13009/EUCASS2017-200
Mermer, Özgen
13
, engine start, taxi and takeoff, historical trend was used.
,
, then
.
Specific fuel consumption was taken as 0.4/h.
(27)
, where endurance is 9.5 hours.
, cruise back,
, descend,
, landing and stop.
Also,
Hence, is calculated from:
After iterations, 5450 kg is calculated. Then W4 is calculated as 4295 kg. Therefore:
, during 9.5 hours loiter and fuel is consumed.
If 595 kg. excess fuel added to the fuel tanks before takeoff, solar cycle can be reconstructed and endurance becomes
48 hours. But it is too heavy for aircraft to fill in such an excess fuel before takeoff. Therefore optimizing excess fuel
method does not work for these conditions.
2.1.2 6096 m, March 21, 30% Efficient Solar Cells
With same conditions except the day of the year, simulations are performed and following results are obtained. Sun
rises at 05:50 am and the maximum endurance occurs when aircraft starts loitering at 05:50 am. Loitering lasts 17.1
hours.
DOI: 10.13009/EUCASS2017-200
Mermer, Özgen
14
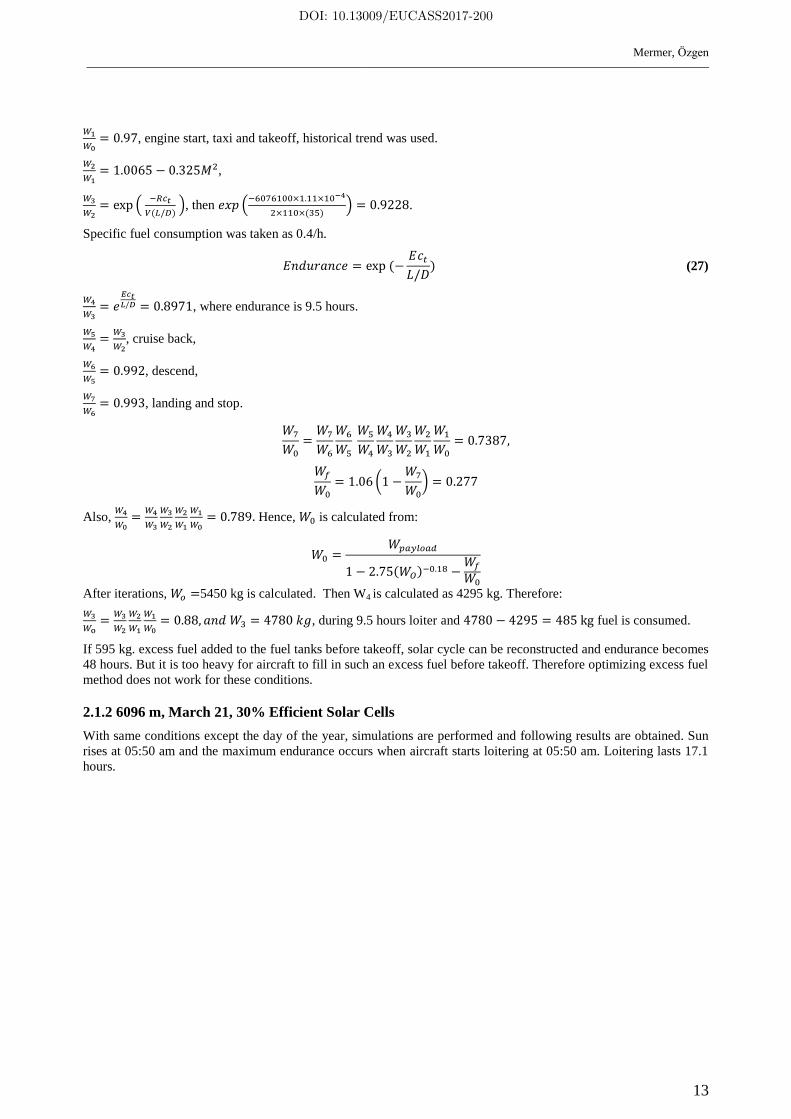
Figure 12 Energy Balance Diagram with 30% Efficient Solar Cells on March 21
As seen from Figure 12, loitering endurance is 17.2 hours. Time needed for reconstructing the solar cycle is 10.2
hours, Figure 13. Using equations 2 to 12 excess fuel is calculated as 548 kg. It does not make sense to reconstruct
solar cycle for these conditions.
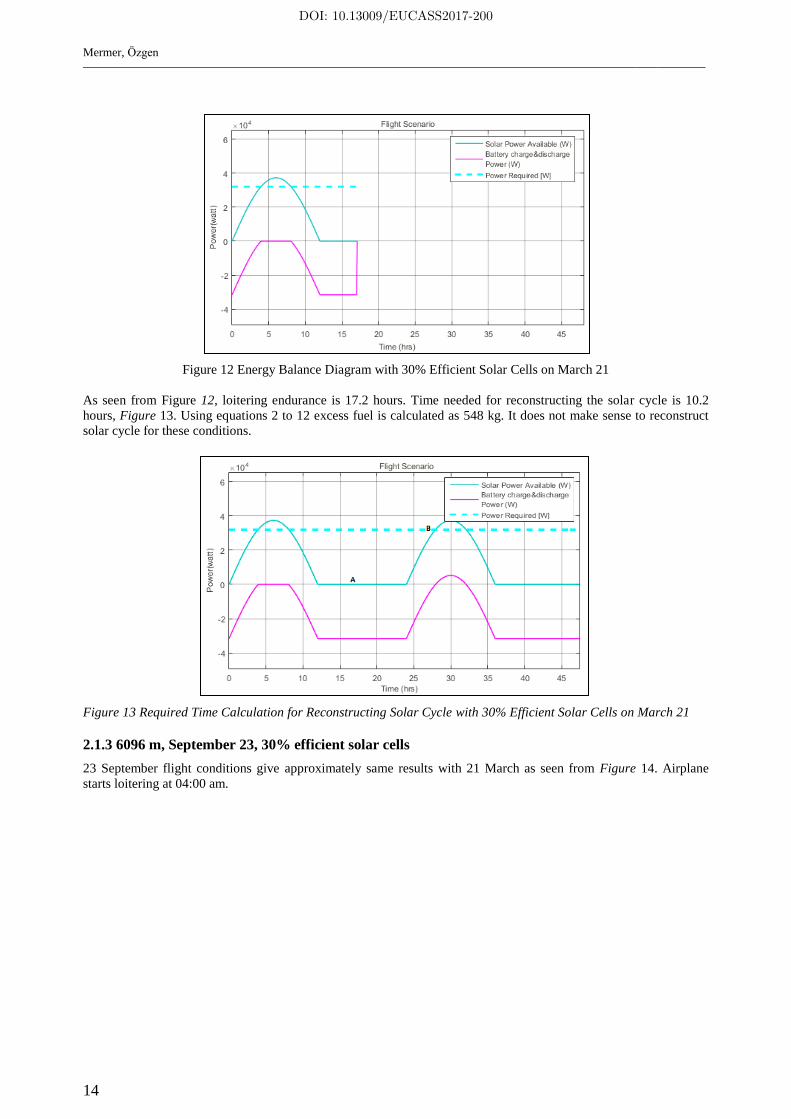
Figure 13 Required Time Calculation for Reconstructing Solar Cycle with 30% Efficient Solar Cells on March 21
2.1.3 6096 m, September 23, 30% efficient solar cells
23 September flight conditions give approximately same results with 21 March as seen from Figure 14. Airplane
starts loitering at 04:00 am.
DOI: 10.13009/EUCASS2017-200
Mermer, Özgen
15
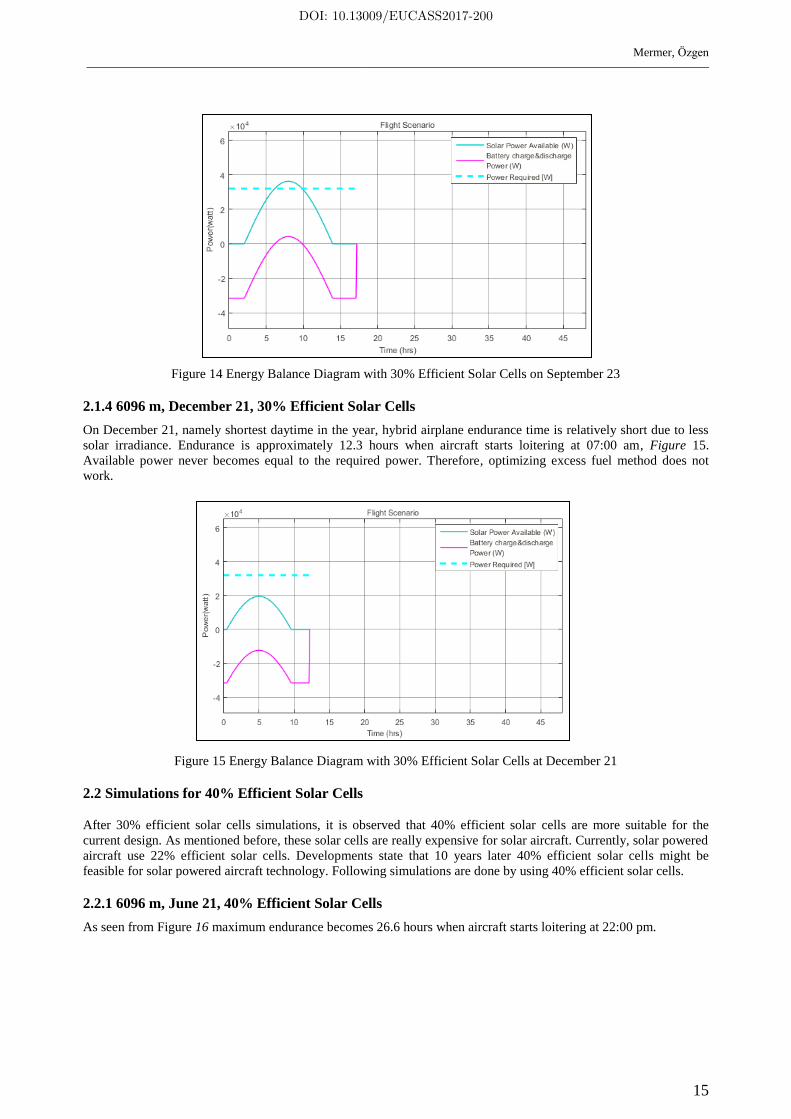
Figure 14 Energy Balance Diagram with 30% Efficient Solar Cells on September 23
2.1.4 6096 m, December 21, 30% Efficient Solar Cells
On December 21, namely shortest daytime in the year, hybrid airplane endurance time is relatively short due to less
solar irradiance. Endurance is approximately 12.3 hours when aircraft starts loitering at 07:00 am, Figure 15.
Available power never becomes equal to the required power. Therefore, optimizing excess fuel method does not
work.
Figure 15 Energy Balance Diagram with 30% Efficient Solar Cells at December 21
2.2 Simulations for 40% Efficient Solar Cells
After 30% efficient solar cells simulations, it is observed that 40% efficient solar cells are more suitable for the
current design. As mentioned before, these solar cells are really expensive for solar aircraft. Currently, solar powered
aircraft use 22% efficient solar cells. Developments state that 10 years later 40% efficient solar cells might be
feasible for solar powered aircraft technology. Following simulations are done by using 40% efficient solar cells.
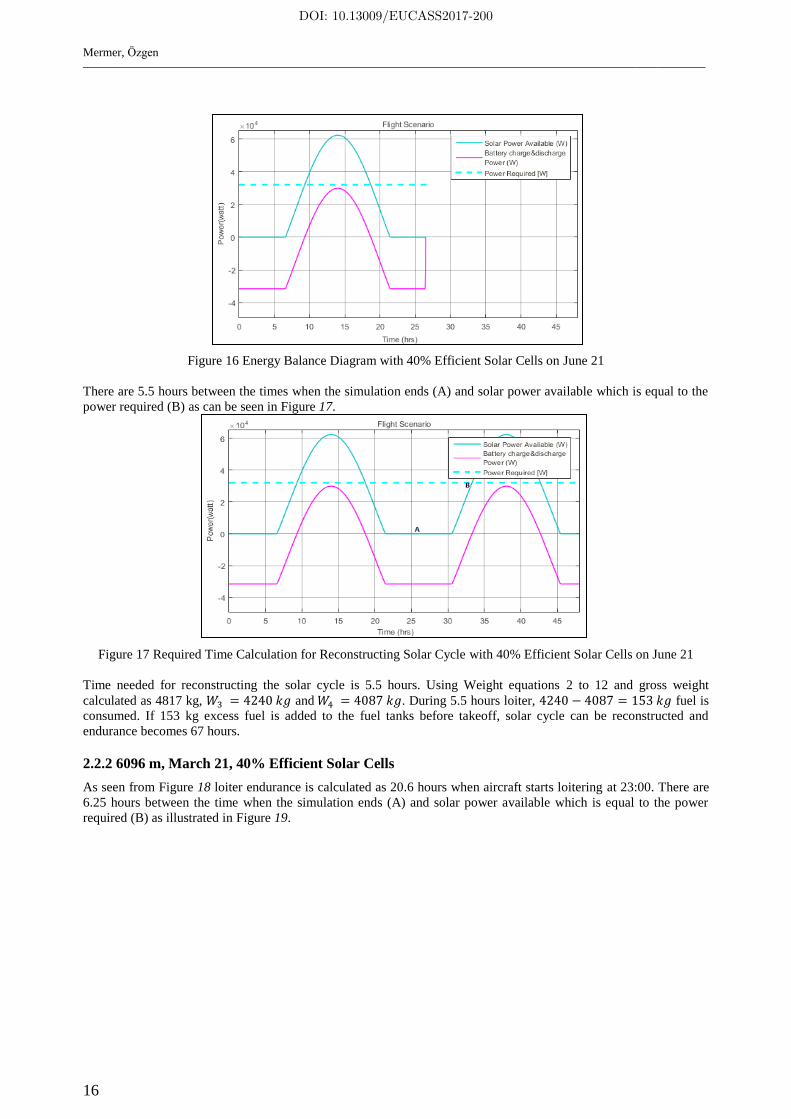
2.2.1 6096 m, June 21, 40% Efficient Solar Cells
As seen from Figure 16 maximum endurance becomes 26.6 hours when aircraft starts loitering at 22:00 pm.
DOI: 10.13009/EUCASS2017-200
Mermer, Özgen
16
Figure 16 Energy Balance Diagram with 40% Efficient Solar Cells on June 21
There are 5.5 hours between the times when the simulation ends (A) and solar power available which is equal to the
power required (B) as can be seen in Figure 17.
Figure 17 Required Time Calculation for Reconstructing Solar Cycle with 40% Efficient Solar Cells on June 21
Time needed for reconstructing the solar cycle is 5.5 hours. Using Weight equations 2 to 12 and gross weight
calculated as 4817 kg, and . During 5.5 hours loiter, fuel is
consumed. If 153 kg excess fuel is added to the fuel tanks before takeoff, solar cycle can be reconstructed and
endurance becomes 67 hours.
2.2.2 6096 m, March 21, 40% Efficient Solar Cells
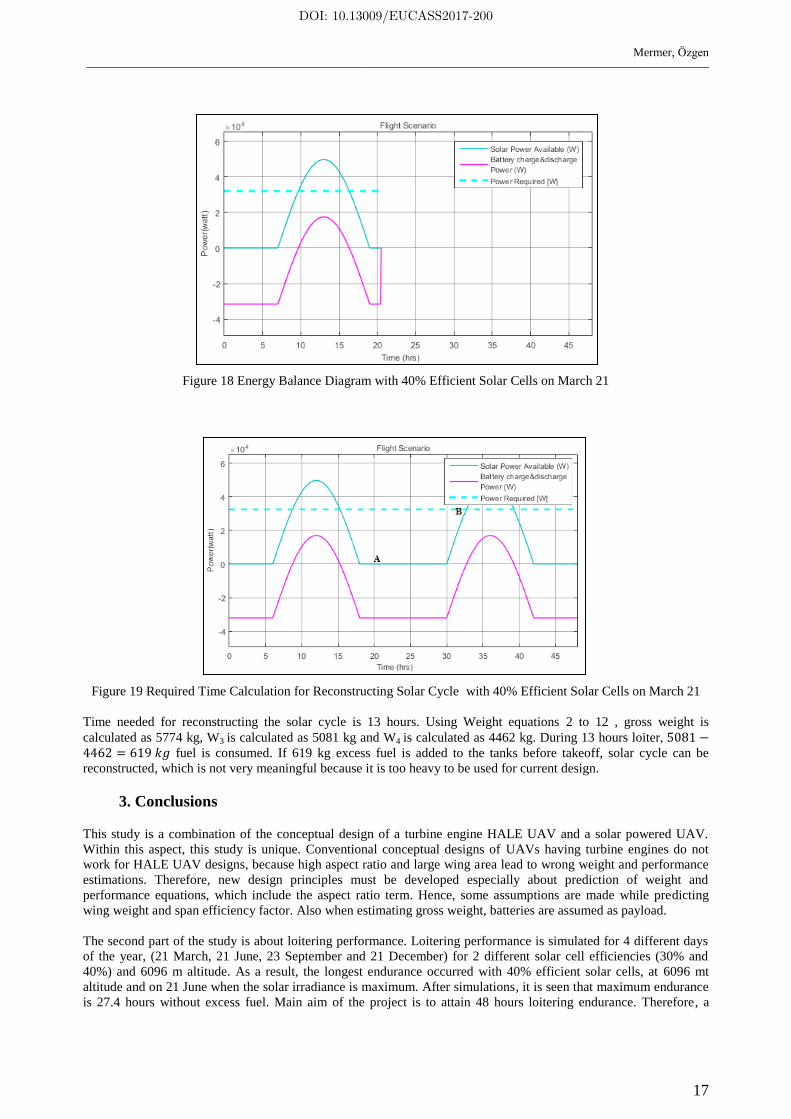
As seen from Figure 18 loiter endurance is calculated as 20.6 hours when aircraft starts loitering at 23:00. There are
6.25 hours between the time when the simulation ends (A) and solar power available which is equal to the power
required (B) as illustrated in Figure 19.
DOI: 10.13009/EUCASS2017-200
Mermer, Özgen
17
Figure 18 Energy Balance Diagram with 40% Efficient Solar Cells on March 21
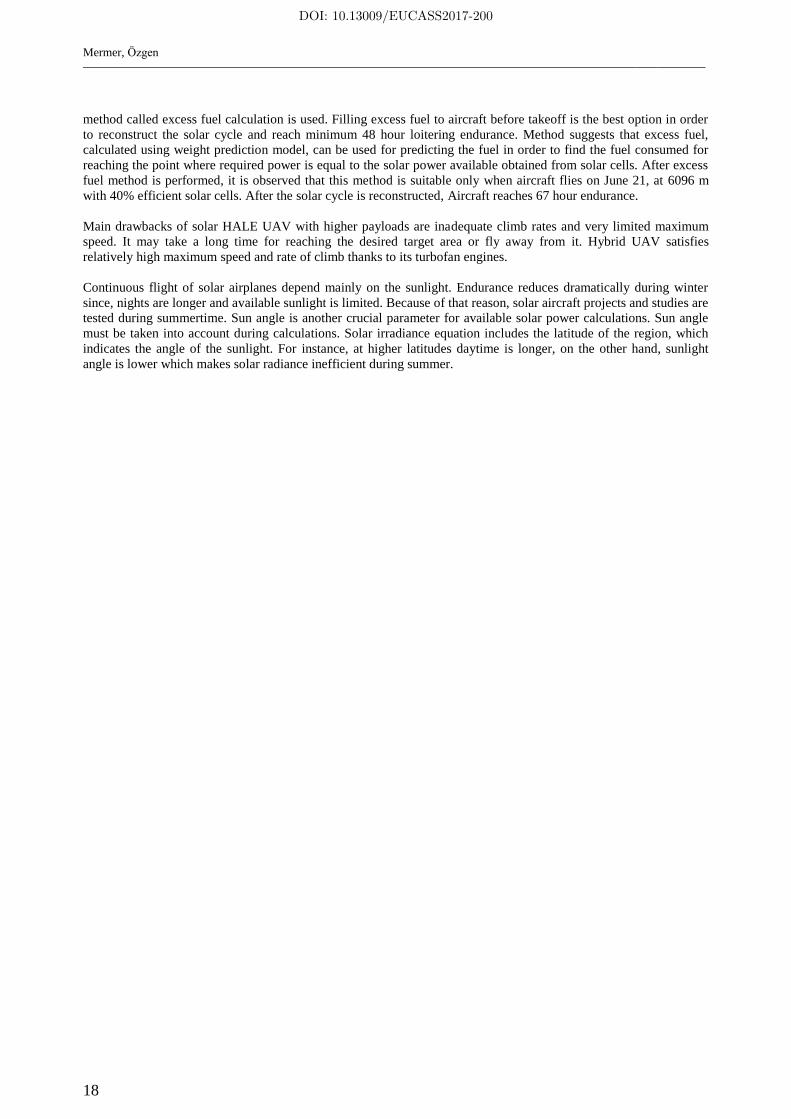
Figure 19 Required Time Calculation for Reconstructing Solar Cycle with 40% Efficient Solar Cells on March 21
Time needed for reconstructing the solar cycle is 13 hours. Using Weight equations 2 to 12 , gross weight is
calculated as 5774 kg, W3 is calculated as 5081 kg and W4 is calculated as 4462 kg. During 13 hours loiter, fuel is consumed. If 619 kg excess fuel is added to the tanks before takeoff, solar cycle can be
reconstructed, which is not very meaningful because it is too heavy to be used for current design.
3. Conclusions
This study is a combination of the conceptual design of a turbine engine HALE UAV and a solar powered UAV.
Within this aspect, this study is unique. Conventional conceptual designs of UAVs having turbine engines do not
work for HALE UAV designs, because high aspect ratio and large wing area lead to wrong weight and performance
estimations. Therefore, new design principles must be developed especially about prediction of weight and
performance equations, which include the aspect ratio term. Hence, some assumptions are made while predicting
wing weight and span efficiency factor. Also when estimating gross weight, batteries are assumed as payload.
The second part of the study is about loitering performance. Loitering performance is simulated for 4 different days
of the year, (21 March, 21 June, 23 September and 21 December) for 2 different solar cell efficiencies (30% and
40%) and 6096 m altitude. As a result, the longest endurance occurred with 40% efficient solar cells, at 6096 mt
altitude and on 21 June when the solar irradiance is maximum. After simulations, it is seen that maximum endurance
is 27.4 hours without excess fuel. Main aim of the project is to attain 48 hours loitering endurance. Therefore, a
DOI: 10.13009/EUCASS2017-200
Mermer, Özgen
18
method called excess fuel calculation is used. Filling excess fuel to aircraft before takeoff is the best option in order
to reconstruct the solar cycle and reach minimum 48 hour loitering endurance. Method suggests that excess fuel,
calculated using weight prediction model, can be used for predicting the fuel in order to find the fuel consumed for
reaching the point where required power is equal to the solar power available obtained from solar cells. After excess
fuel method is performed, it is observed that this method is suitable only when aircraft flies on June 21, at 6096 m
with 40% efficient solar cells. After the solar cycle is reconstructed, Aircraft reaches 67 hour endurance.
Main drawbacks of solar HALE UAV with higher payloads are inadequate climb rates and very limited maximum
speed. It may take a long time for reaching the desired target area or fly away from it. Hybrid UAV satisfies
relatively high maximum speed and rate of climb thanks to its turbofan engines.
Continuous flight of solar airplanes depend mainly on the sunlight. Endurance reduces dramatically during winter
since, nights are longer and available sunlight is limited. Because of that reason, solar aircraft projects and studies are
tested during summertime. Sun angle is another crucial parameter for available solar power calculations. Sun angle
must be taken into account during calculations. Solar irradiance equation includes the latitude of the region, which
indicates the angle of the sunlight. For instance, at higher latitudes daytime is longer, on the other hand, sunlight
angle is lower which makes solar radiance inefficient during summer.
DOI: 10.13009/EUCASS2017-200
Mermer, Özgen
19
References
[1] Raymer, D. P., Aircraft Design: A ConceptualApproach, 4th edition, AIAA Education Series, 2006.
[2] Nicolai L. M., Grant. E. Carichner. Fundamentals of Aircraft and Airship Design Volume I — Aircraft
Design, AIAA Series, 2010
[3] Gudmundsson, S., General Aviation Aircaft Design Applied Methods and Procedures, BH Series, 2014
[4] Noth, A., Design of Solar Powered Airplanes for Continuous Flight, Ph. D. Dissertation, Autonomous
Systems Lab, ETH Zürich, Switzerland, 2008.
[5] “Solar Impulse.” [Online]. Available: http://www.solarimpulse.com, last visited on March 2016.
[6] “Airfoil profile database.” [Online]. Available: http://aerospace.illinois.edu/m-selig/ads.html, last visited on
March 2016.
[7] “Northrop Grumman Corp. Global Hawk.” [Online]. Available:
http//www.northopgrumman.com/Capabilities/GlobalHawk/pages/default.aspx, last visited on March 2016.
[8] “Battery University.” [Online]. Available: http://batteryuniversity.com/, last visited on March 2016.
[9] Boucher, R. J., “Sunrise the World's First Solar-Powered Airplane.” Journal of Aircraft Vol 22, No 10,
1985.
[10] Romeo, G., Frulla, G., Cestino, E, and Corsino, G., “Design, Aerodynamic, Structural Analysis of Long-
Endurance Solar-Powered Stratospheric Platform”, Journal of Aircraft,pp:1505-1520, 2004.
[11] Boucher, R. J. , “History of Solar Flight.” SAE, and ASME, 20th
Joint Propulsion Conference, Cincinnati,
OH, June 11-13, AIAA-1984-1429, 1984.
[12] “Autonomus Solar Airplane for Mars Exploration”, [Online]. Available: http://www.sky-sailor.ethz.ch, last
visited on March 2016.
[13] “Navair Orders 7 Zephyr Ultra-long Endurance UAV's”, [Online]. Available:
http://www.defenseindustrydaily.com/NAVAIR-Orders-7-Zephyr-Ultra-Long-Endurance-UAVs-05426/, last visited
on March 2016.
[14] Hoerner, S. F., Fluid Dynamic Drag, Brick Town, N. J. USA, 1965.
[15] Altman, A., Ph.D. thesis, A Conceptual Design Methodology for Low Speed High Altitude Long Endurance
Unmanned Aerial Vehicles, 2000.
[16] Duffie, J.A., Beckman, W. A., Solar energy thermal proceseses, 4th edition, John Wiley and Sons, Inc,
2013.
[17] Deperrois, A., XFLR5 Program, [Online]. Available:http://www.xflr5.com/xflr5.htm, 2012, last visited on
March 2016.
[18] Gundlach, J., Designing Unmanned Aircraft Systems, AIAA Education Series, 2012.
[19] Mermer, E., Köker, A., Kurtuluş, D.F., Yılmaz, E., “Design and Performance of Wing Configurations for
High Altitude Solar Powered Unmanned Systems,”, AIAC- 2013-141 2013.
[20] Anderson, J. D. Jr., Aircraft Performance and Design, McGraw Hill, 1999.
[21] Office of the Secretary of Defense. “Unmanned Aerial Vehicle Reliability Study.” February 2003.
[22] Keidel, B., “Design of a solar-powered hale aircraft for year-round operation at intermediate latitudes.”
Proceeding of the RTO symposium on “UV for aerial, ground and naval military ope- rations”, Ankara, Turkey,
2000.
[23] Nickol, Craig, L., High altitude long endurance uav analysis of alternatives and technology requirements
development. NASA/TP-2007-214861, National Aeronautics and Space Administration, Langley Research Center,
Hampton, VA, 2007.
[24] Montagnier, O., Laurent, B., “Optimization of A Solar-Powered High Altitude Long Endurance UAV.” 27th
International Congress of Aeronautical Science, Nice France. September 2010.
[25] Cestino, E. "Design of solar high altitude long endurance aircraft for multi payload & operations."
Aerospace science and technology 10.6 (2006): 541-550 2006.
[26] Roberto, C., Marino, L., "Preliminary Design of a Hybrid Propulsion System For High-Endurance UAV."
In: Proceedings of the ASME 2010 International Mechanical Engineering Congress & Exposition IMECE2010,
Vancouver, British Columbia, Canada, November 12-18, 2010.
[27] Roskam, J., Airplane Design Parts I through VIII, Darcorporation, 2003
[28] Gundlach, J., Designing Unmanned Aircraft Systems: A Comprehensive Approach, American Institute of
Aeronautics & Astronautics Series.2013.
[29] Harvey, J. R., "Development of a hybrid-electric power-system model for a small surveillance aircraft."
28th International Congress of the Aeronautical Sciences. 2012.
[30] Flittie, K, Curtin, B., "Pathfinder solar-powered aircraft flight performance", AIAA Atmospheric Flight
Mechanics Conference & Exhibit, Boston, 1998.
DOI: 10.13009/EUCASS2017-200