compressed representations of macromolecular structures and properties
TRANSCRIPT

Structure464
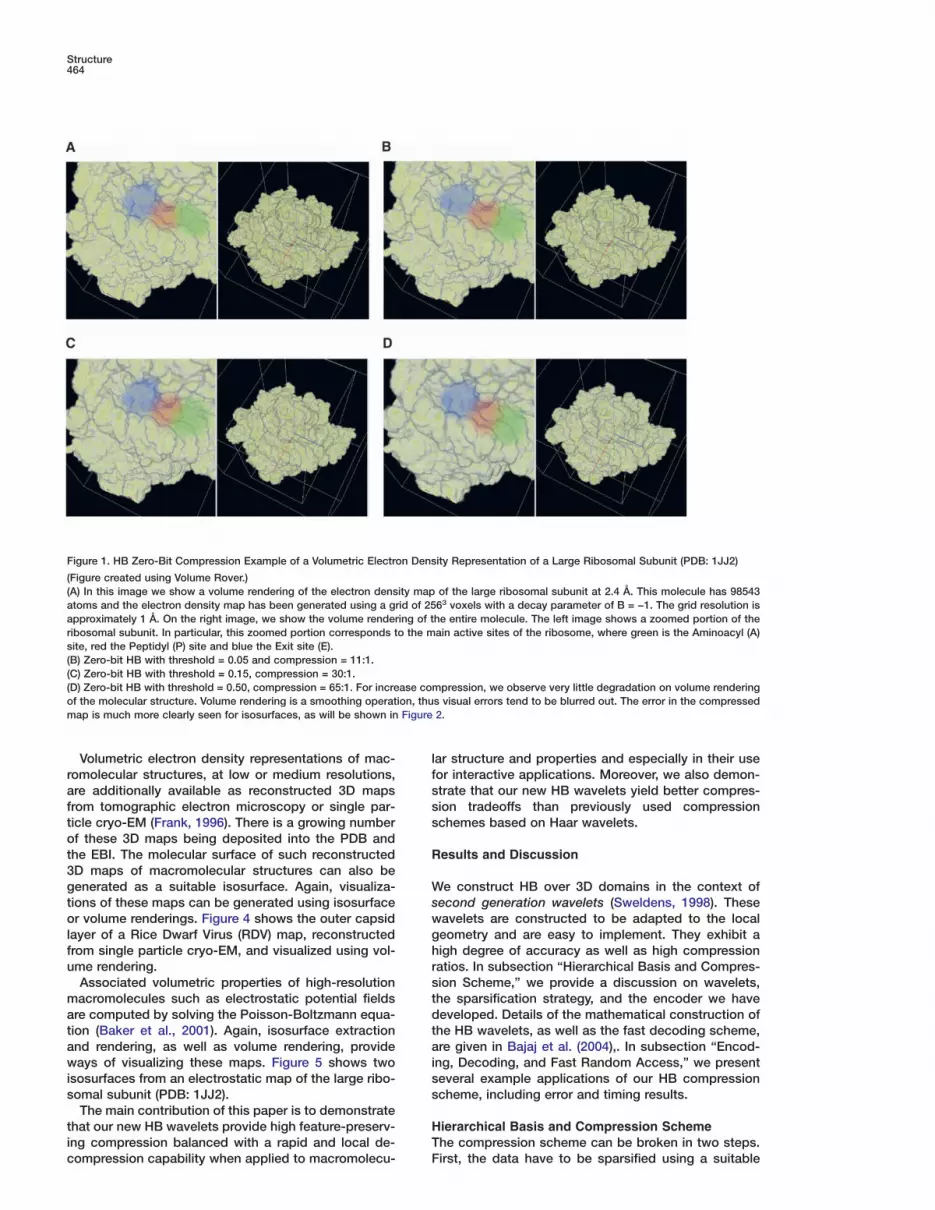
Figure 1. HB Zero-Bit Compression Example of a Volumetric Electron Density Representation of a Large Ribosomal Subunit (PDB: 1JJ2)
(Figure created using Volume Rover.)(A) In this image we show a volume rendering of the electron density map of the large ribosomal subunit at 2.4 Å. This molecule has 98543atoms and the electron density map has been generated using a grid of 2563 voxels with a decay parameter of B = −1. The grid resolution isapproximately 1 Å. On the right image, we show the volume rendering of the entire molecule. The left image shows a zoomed portion of theribosomal subunit. In particular, this zoomed portion corresponds to the main active sites of the ribosome, where green is the Aminoacyl (A)site, red the Peptidyl (P) site and blue the Exit site (E).(B) Zero-bit HB with threshold = 0.05 and compression = 11:1.(C) Zero-bit HB with threshold = 0.15, compression = 30:1.(D) Zero-bit HB with threshold = 0.50, compression = 65:1. For increase compression, we observe very little degradation on volume renderingof the molecular structure. Volume rendering is a smoothing operation, thus visual errors tend to be blurred out. The error in the compressedmap is much more clearly seen for isosurfaces, as will be shown in Figure 2.
Volumetric electron density representations of mac- lfromolecular structures, at low or medium resolutions,
are additionally available as reconstructed 3D maps ssfrom tomographic electron microscopy or single par-
ticle cryo-EM (Frank, 1996). There is a growing number sof these 3D maps being deposited into the PDB andthe EBI. The molecular surface of such reconstructed R3D maps of macromolecular structures can also begenerated as a suitable isosurface. Again, visualiza- W
stions of these maps can be generated using isosurfaceor volume renderings. Figure 4 shows the outer capsid w
glayer of a Rice Dwarf Virus (RDV) map, reconstructedfrom single particle cryo-EM, and visualized using vol- h
rume rendering.Associated volumetric properties of high-resolution s
tmacromolecules such as electrostatic potential fieldsare computed by solving the Poisson-Boltzmann equa- d
ttion (Baker et al., 2001). Again, isosurface extractionand rendering, as well as volume rendering, provide a
iways of visualizing these maps. Figure 5 shows twoisosurfaces from an electrostatic map of the large ribo- s
ssomal subunit (PDB: 1JJ2).The main contribution of this paper is to demonstrate
that our new HB wavelets provide high feature-preserv- HTing compression balanced with a rapid and local de-
compression capability when applied to macromolecu-
ar structure and properties and especially in their useor interactive applications. Moreover, we also demon-trate that our new HB wavelets yield better compres-ion tradeoffs than previously used compressionchemes based on Haar wavelets.
esults and Discussion
e construct HB over 3D domains in the context ofecond generation wavelets (Sweldens, 1998). Theseavelets are constructed to be adapted to the localeometry and are easy to implement. They exhibit aigh degree of accuracy as well as high compressionatios. In subsection “Hierarchical Basis and Compres-ion Scheme,” we provide a discussion on wavelets,he sparsification strategy, and the encoder we haveeveloped. Details of the mathematical construction of
he HB wavelets, as well as the fast decoding scheme,re given in Bajaj et al. (2004),. In subsection “Encod-
ng, Decoding, and Fast Random Access,” we presenteveral example applications of our HB compressioncheme, including error and timing results.
ierarchical Basis and Compression Schemehe compression scheme can be broken in two steps.
First, the data have to be sparsified using a suitable
Compression of Molecular Structures and Properties465
Figure 2. HB Zero-Bit Compression Example of a Volumetric Electron Density Representation of a Large Ribosomal Subunit (PDB: 1JJ2), atnear Atomistic Resolution
(Figure created using Volume Rover.)(A) In this image we show a volume rendering of the electron density map of the large ribosomal subunit at 2.4 Å. This molecule has 98543atoms and the electron density map has been generated using a grid of 5123 voxels with a decay parameter of B = −5, which shows highermolecular detail than in Figure 1. Out of this grid, we extract a subvolume of 2163 voxels that contains the A, P, and E active sites. The gridresolution is approximately 0.5 Å. Note that this is a minimal uniform resolution needed to obtain accurate isosurfaces. A coarser resolutionleads to very displeasing artifacts, where many of the atomistic details are difficult to recognize. On the right image, we have the volumerendering of the A, P, and E active sites of the ribosome. The left image shows a zoomed portion of the ribosomal structure, where severalnucleotides on the active site can be seen.(B) Zero-bit HB compression with threshold = 0.05 and compression = 8:1.(C) Zero-bit HB compression with threshold = 0.15, compression = 18:1.(D) Zero-bit HB compression with threshold = 0.50, compression = 42:1.For the volume rendered image on the right, very little degradation of the ribosomal structure is visible as the compression increases. Incontrast, the atomistic details shown via isosurface rendering clearly degrade.
functional representation. The second step is to pro-duce an encoding and decoding, which tells where thenonzero terms are located. The main idea behind wave-lets is to start with a coarse representation of the mo-lecular map and do successive refinements to obtainthe desired resolution. Each level of resolution will beapproximated by a series of functions called the scalingfunctions. The main objective is to construct an effi-cient representation of a molecular map over the em-bedded domain at different levels of resolution. How-ever, this is not a very efficient way to represent afunction and can be very costly in terms of the numberof scaling functions needed to approximate the molec-ular map. This motivates us to look at the differencesbetween one level of resolution and the next. Insteadof representing a molecular map at a single high-reso-lution level, we transform it into a very coarse approxi-mation (i.e., level zero) and the differences betweeneach level of resolution. The functions that describethese differences are called the wavelets. In compari-son to the scaling functions, the coefficients associatedwith the wavelet exhibit fast decay for smooth data. Ifa molecular map contains a discontinuity, the neighbor-
hood wavelet coefficients are in general large, but awayfrom the discontinuity the decay is very fast. Thismakes wavelets very well suited for representing localand global variations. In contrast, Fourier and sphericalharmonics have very slow decays due to the bias to-ward global representations.
A linear HB is constructed in 3D (Bajaj et al., 2004)due to the high degree of compression, ease of imple-mentation, and fast random access. In this same paper,we devise the strategies for the compression of molec-ular data. The linear HB representation we construct isessentially an adaptive mesh representation. However,most adaptive meshes are discontinuous, unless acomputational expensive step is used a priori to avoiddiscontinuities. These discontinuities lead to artifactsfor the visualization of molecular volumes and surfaces;in particular, the isosurface extraction would be verypoor. In contrast, the HB wavelet representation itselfis continuous.
Encoding, Decoding, and Fast Random AccessAs with all compression schemes, a suitable encodingof the nonzero wavelets is a necessary step. Many suchschemes have been developed for efficient transmis-
sion of compressed data streams. However, very fewStructure466
geEttfnace
ToTmvXemttRuutT
Figure 3. HB Zero-Bit Compression of a Volumetric Electron Den-sity Representation of a Microtubule Structure
h(Figure created using Volume Rover.)
t(A) This microtubule representation has 1,210,410 atoms and thetelectron density map has been embedded in a grid of 512 ) 512 )s1024 voxels with a decay parameter of B = −2.3. The grid resolution
is of approximately 0.6 Å. The image above shows the isosurface eof the microtubule at atomic resolution. b(B) Zero-bit HB compression with threshold = 0.05 and compres- asion = 32:1.
o(C) Zero-bit HB compression with threshold = 0.15, compression =t77:1.a(D) Zero-bit HB compression with threshold = 0.35, compression =
132:1. iThis image clearly shows the degradation of the molecular data Vwith respect to very high compression. At a compression ratio of a132, structural feature degradation is quite apparent.
i
aencoding schemes, like volume rendering and isocon-touring, have been developed for visualization pur- b
pposes. Such encoding schemes should aim for highcompression ratios and fast random access. The zero- (
cbit encoding scheme, introduced by Bajaj et al. (2001a),uses a two-stage significance map to achieve a good n
ccompromise between these two aspects. Whetherwavelet coefficients are null or not is stored in “zero- gbits,” while the significance information of the detail co-efficients of each non-null detail node is stored in addi- a
(tional bits. Nevertheless, since the encoding is limitedto Haar wavelets, unpleasant and visual artifacts ap- t
wpear at moderately high compression ratios. To solvethis problem, a novel encoding scheme is created on m
sthe basis of zero-bit encoding for HB linear wavelets.The wavelet coefficients are assumed to be mostly i
tzero, with a few localized nonzero coefficients, as shallbe the case for a large number of volumetric maps. b
rUnder this assumption, a multiresolution encodingscheme can be built to optimally access the concen- strated information. In this encoding scheme, the rectan-
ular 3D volume data are subdivided into blocks ofqual size (which can be predetermined by the user).ach block is further segmented into cells which con-
ain a fixed number of voxels. Now, we run the waveletransform on each cell separately. Since the trans-ormed data usually has large swaths of zeros, a largeumber of cells or blocks can be ignored. By constructingn appropriate multiresolution indexing scheme, an effi-ient encoding of the nonzero coefficients is built (Bajajt al., 2004).
imings, Errors, and Visualizationsf Molecular Mapso gauge the effectiveness of the HB representation toolecular maps, we apply it to three different types of
olumetric data, in particular to volumetric maps from-ray crystal structures at multiple feature resolutions,lectrostatic potential field data, and reconstructed 3Daps from cryo-EM. Moreover, actual random access
imings for the zero-bit decoder are presented. All ofhe figures in this paper were created with the Volumeover software. Volume Rover (http://ccvweb.csres.texas.edu/ccv/projects/project.php?proID=9) is a vol-metric map visualization software tool developed athe Computational Visualization Center, University ofexas at Austin.For volumetric electron density maps created from
igh-resolution X-ray structural data, such as shown forhe ribosome in Figure 2, the astute reader would noticehat the volumetric map seems oversampled. However,uch volumetric sampling resolutions are at times nec-ssary to visualize the atomic resolution feature detailsecause of the approximations inherent to isosurfacend volume rendering. Isosurface rendering are basedn surface triangle extraction from a local piecewiserilinear approximation of the volumetric data. This en-bles use of the triangle processing pipeline of graph-
cs cards, and hence accelerated rendering speeds.olume rendering is also based on a local piecewisepproximation and again done so as to achieve graph-
cs card accelerated volumetric.Our wavelet method sparsifies the molecular map by
pplying a level-dependent threshold criterion denotedy e. This term compares the wavelet coefficients to theeak of the molecular map and a level depend factor
Bajaj et al., 2004). As e is increased, we observe thatompression ratio increases, but the peak signal tooise ratio (PSNR)—which describes the quality of theompressed data—of the reconstructed image de-rades.In Figure 1 we demonstrate compression results forsynthesized 2563 map of the large ribosomal subunit
PDB: 1JJ2) with a decay rate of B = − 1. Notice thathis is the minimum resolution needed to avoid un-anted volume rendering artifacts. Of interest in thisolecule are the Aminocyl, Peptidyl, and Exit active
ites on the ribosome. If one looks carefully, the leftmages for Figures 1A–1D show some degradation ofhe active sites as compression is increased. This cane explained by the smoothing operation of volume
endering algorithms. However, errors are more clearlyeen for the isosurface renderings.To show the effect of compression on the isosurface,
Compression of Molecular Structures and Properties467
Figure 4. HB Compression Example of a Reconstructed 3D Map of an RDV Structure
(Figure created using Volume Rover.)(A) Volume rendering and isosurface of the RDV map at 6.8 Å resolution in a grid of 241 ) 4812 voxels. On the right image, the outer capsidlayer is rendered in green. The left image shows a zoomed portion of the capsid, displaying one of the trimeric subunits (purple).(B) Threshold = 0.15, compression = 22:1.(C) Threshold = 0.35, compression = 37:1.(D) Threshold = 0.50, compression = 57:1. As the compression increases, we observe a slight degradation in the trimeric subunit of thevirus capsid.
we synthesize a 5123 electron density map from thelarge ribosomal subunit (PDB: 1JJ2) with a rate of de-cay of B = − 5. For this rate of decay, the atomistic de-tails can be distinguished. A smaller grid resolutionwould lead to highly degraded isosurface. In Figures2A–2D, we show the volume rendering of the A, P, andE active sits and an isosurface of a nucleotide on thesesites. As the compression increases, it is clear that theatomistic features degrade. However, even at highcompression many of the atomistic features can be dis-tinguished.
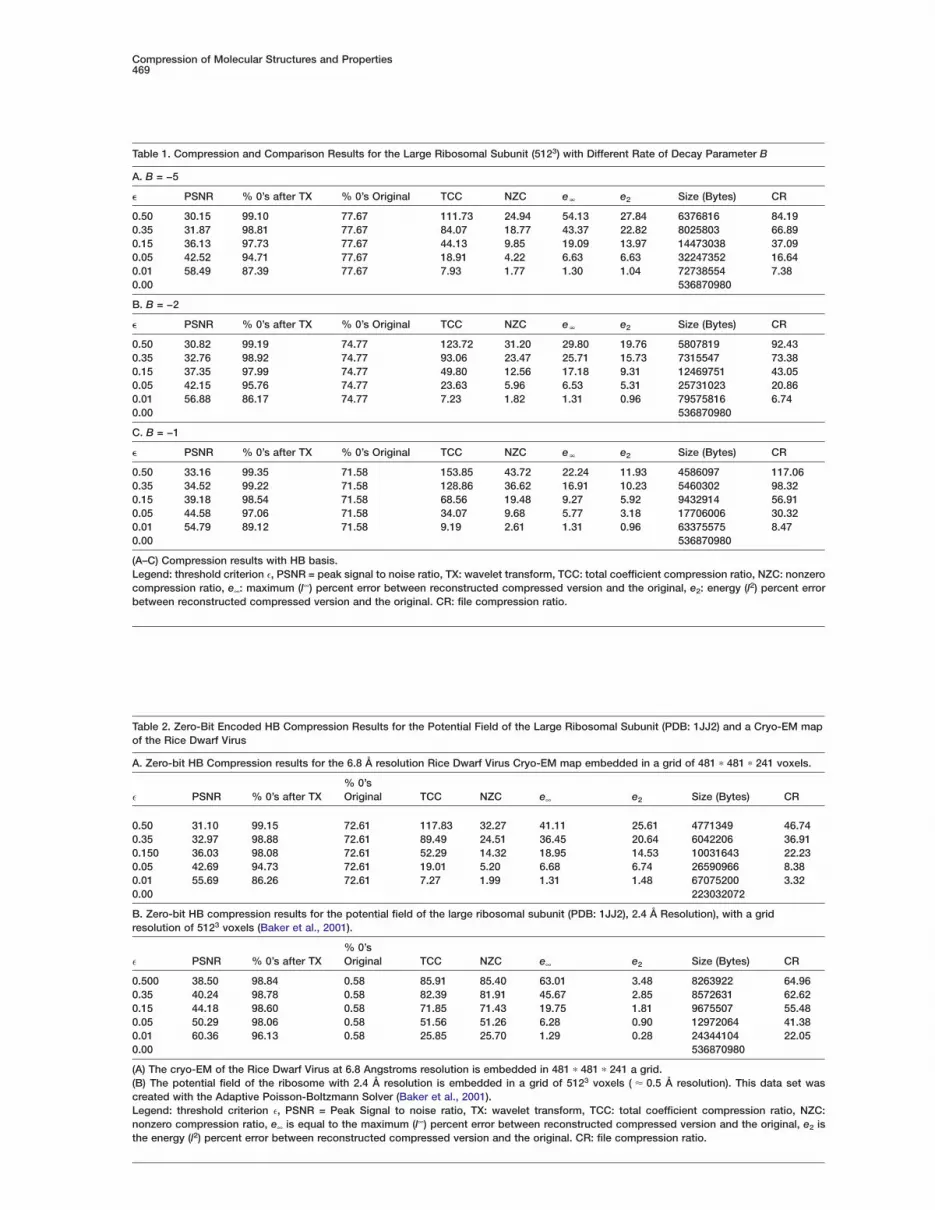
Another interesting feature to observe is the com-pression capabilities of our scheme with respect tomaps of varying resolutions. In Tables 1A–1C, compres-sion results for the large ribosomal subunit (PDB: 1JJ2)electron density map at rates of decay B = −5, −2, −1.For a fixed threshold level, we observe that both thePSNR and CR increase with a decrease in resolution(by changing B).
In Figure 3, compression results for a 1.2 million atommicrotubule structure are shown. Much of the overallstructure is preserved at high compression ratios ofaround 130:1. However, many of the atomistic detailsare lost and the whole structure seems to loose reso-lution.
Our HB scheme is applied on a 3D map of the RiceDwarf Virus, reconstructed from single-particle cryo-
EM. The dataset dimension is 241 × 4812 with a resolu-tion of 6.8 Å. In Figure 4A, on the right image we showa volume rendering of the original RDV cryo-EM map.In addition, on the left image, an isosurface shows thetrimeric unit of the virus. In Figures 4B–4D, compres-sion results for three different thresholds are shown.High visual accuracy of the structure of the virus canbe observed even at a compression ratio of 57:1. InTable 2A, we present numeric data of our compressionalgorithm for more threshold levels.
We finally test the HB representation with zero-bit en-coding on the potential field of the large ribosomal sub-unit (PDB: 1JJ2). This molecular map was created froma Poisson-Boltzmann solver (Baker et al., 2001). InTable 2B, we observe that the CR increases as thePSNR falls. However, even at high compressions ratiosthe image quality degrades very slowly, as shown inFigures 5A–5D.
For sake of completeness, we compare our con-tinuous zero-bit HB scheme with the zero-bit Haarcompression method that to our knowledge is the onlyother compression-based interactive algorithm avail-able. We choose the same data that were produced forFigure 2. It is clear from Figure 6 that at high compres-sion, our method preserves the structure well. On theother hand, blocky artifacts are seen in the Haar caseas the wavelets are discontinuous.
Structure468
Figure 5. HB Zero-Bit Compression Example on a Computed Electrostatics Potential Field Property of a Large Ribosomal Subunit
(Figure created using Volume Rover.)(A) Noncompressed map of the potential field of the large ribosomal subunit. This 5123 gridded field data was created using the AdaptivePoisson-Boltzmann Solver (Baker et al., 2001). The right image shows two isosurfaces of the field, where the blue isosurface is positive andthe red one is negative potential. The left image shows a zoomed portion of the field, as captured by the smaller cube shown in the rightimage. The pictures are created using our center’s VolRover software.(B) Zero-bit HB with threshold= 0.05, compression = 41:1.(C) Zero-bit HB with threshold = 0.15, compression = 55:1.(D) Zero-bit HB with threshold = 0.35, compression = 62:1. We see very little degradation of the field as we increase the compression.However, as shown in Table 2, the errors clearly increase with higher compression.
In Table 3, we show random access timing test cases lofor our method tested on the electron density map of
the large ribosomal subunit (PDB: 1JJ2), with varying dorates of decay. The four test cases are as follows:ds• t1: The average time of 1000 random accesses of
a voxel from the compressed format. vw• t2: The average time of 1000 random accesses of
a full cell from the compressed format. dw• t3: The average time of 1000 random accesses of
a voxel inside a cell, where the cell was chosen at gdrandom from the uncompressed format.
• t4: The average time to decode the entire com-pressed volume (5123) for 10 runs.
SSThese timings were run on an SGI ONYX2 system usinga
a single processor. As observed, to decode a single Dvoxel, the slowest case is t1. However, for most volumerending and isocontouring applications it is more effi-cient to decode an entire cell since many neighboring Apoints are used.
WfConclusions(We have demonstrated the value of HB wavelet com-(
pressed volumetric representations for macromolecular cstructures and associated properties, especially in the f
mage of rapidly increasing structures and medium reso-
ution maps in both the PDB and EBI. The added valuef fast decompression time yields the necessary ingre-ient for enabling interactive visualization performancen current desktop computers. Our future work is pre-ominantly in the development of computational analy-is algorithms that work directly from HB compressedolumes of bio-molecules and associated properties,ith fast decompression. We are also interested in theevelopment of interactive visualization techniqueshich optimally utilize the faster bandwidth of pro-rammable graphics hardware, commonplace on mostesktop computers.
upplemental Dataupplemental Data include five movies and can be found with thisrticle online at http://www.structure.org/cgi/content/full/13/3/463/C1/.
cknowledgments
e sincerely thank Professor Wah Chiu (Baylor School of Medicine)or the 3D map of the Rice Dwarf Virus, Professor Nathan BakerWashington University at St. Louis), Professor Andrew McCammonUniversity of California, San Diego) for the electrostatics potentialomputed data for the 50S large subunit of the ribosome, and Pro-essor Dave Sept (Washington University at St. Louis) for the 1.2illion atom microtubule data. This work was supported in part by
Compression of Molecular Structures and Properties469
Table 1. Compression and Comparison Results for the Large Ribosomal Subunit (5123) with Different Rate of Decay Parameter B
A. B = −5
� PSNR % 0’s after TX % 0’s Original TCC NZC eN e2 Size (Bytes) CR
0.50 30.15 99.10 77.67 111.73 24.94 54.13 27.84 6376816 84.190.35 31.87 98.81 77.67 84.07 18.77 43.37 22.82 8025803 66.890.15 36.13 97.73 77.67 44.13 9.85 19.09 13.97 14473038 37.090.05 42.52 94.71 77.67 18.91 4.22 6.63 6.63 32247352 16.640.01 58.49 87.39 77.67 7.93 1.77 1.30 1.04 72738554 7.380.00 536870980
B. B = −2
� PSNR % 0’s after TX % 0’s Original TCC NZC eN e2 Size (Bytes) CR
0.50 30.82 99.19 74.77 123.72 31.20 29.80 19.76 5807819 92.430.35 32.76 98.92 74.77 93.06 23.47 25.71 15.73 7315547 73.380.15 37.35 97.99 74.77 49.80 12.56 17.18 9.31 12469751 43.050.05 42.15 95.76 74.77 23.63 5.96 6.53 5.31 25731023 20.860.01 56.88 86.17 74.77 7.23 1.82 1.31 0.96 79575816 6.740.00 536870980
C. B = −1
� PSNR % 0’s after TX % 0’s Original TCC NZC eN e2 Size (Bytes) CR
0.50 33.16 99.35 71.58 153.85 43.72 22.24 11.93 4586097 117.060.35 34.52 99.22 71.58 128.86 36.62 16.91 10.23 5460302 98.320.15 39.18 98.54 71.58 68.56 19.48 9.27 5.92 9432914 56.910.05 44.58 97.06 71.58 34.07 9.68 5.77 3.18 17706006 30.320.01 54.79 89.12 71.58 9.19 2.61 1.31 0.96 63375575 8.470.00 536870980
(A–C) Compression results with HB basis.Legend: threshold criterion e, PSNR = peak signal to noise ratio, TX: wavelet transform, TCC: total coefficient compression ratio, NZC: nonzerocompression ratio, e∞: maximum (l∞) percent error between reconstructed compressed version and the original, e2: energy (l2) percent errorbetween reconstructed compressed version and the original. CR: file compression ratio.
Table 2. Zero-Bit Encoded HB Compression Results for the Potential Field of the Large Ribosomal Subunit (PDB: 1JJ2) and a Cryo-EM mapof the Rice Dwarf Virus
A. Zero-bit HB Compression results for the 6.8 Å resolution Rice Dwarf Virus Cryo-EM map embedded in a grid of 481 ∗ 481 ∗ 241 voxels.
% 0’se PSNR % 0’s after TX Original TCC NZC e∞ e2 Size (Bytes) CR
0.50 31.10 99.15 72.61 117.83 32.27 41.11 25.61 4771349 46.740.35 32.97 98.88 72.61 89.49 24.51 36.45 20.64 6042206 36.910.150 36.03 98.08 72.61 52.29 14.32 18.95 14.53 10031643 22.230.05 42.69 94.73 72.61 19.01 5.20 6.68 6.74 26590966 8.380.01 55.69 86.26 72.61 7.27 1.99 1.31 1.48 67075200 3.320.00 223032072
B. Zero-bit HB compression results for the potential field of the large ribosomal subunit (PDB: 1JJ2), 2.4 Å Resolution), with a gridresolution of 5123 voxels (Baker et al., 2001).
% 0’se PSNR % 0’s after TX Original TCC NZC e∞ e2 Size (Bytes) CR
0.500 38.50 98.84 0.58 85.91 85.40 63.01 3.48 8263922 64.960.35 40.24 98.78 0.58 82.39 81.91 45.67 2.85 8572631 62.620.15 44.18 98.60 0.58 71.85 71.43 19.75 1.81 9675507 55.480.05 50.29 98.06 0.58 51.56 51.26 6.28 0.90 12972064 41.380.01 60.36 96.13 0.58 25.85 25.70 1.29 0.28 24344104 22.050.00 536870980
(A) The cryo-EM of the Rice Dwarf Virus at 6.8 Angstroms resolution is embedded in 481 ∗ 481 ∗ 241 a grid.(B) The potential field of the ribosome with 2.4 Å resolution is embedded in a grid of 5123 voxels ( ≈ 0.5 Å resolution). This data set wascreated with the Adaptive Poisson-Boltzmann Solver (Baker et al., 2001).Legend: threshold criterion e, PSNR = Peak Signal to noise ratio, TX: wavelet transform, TCC: total coefficient compression ratio, NZC:nonzero compression ratio, e∞ is equal to the maximum (l∞) percent error between reconstructed compressed version and the original, e2 isthe energy (l2) percent error between reconstructed compressed version and the original. CR: file compression ratio.
Structure470
Figure 6. Compression Comparison between Zero-Bit HB and Haar Schemes
(Figure created using Volume Rover.)(A) Rendering example of the large ribosomal subunit data set (See also Figure 2). In the right image, a portion of the electron density of theribosome is shown. This portion corresponds to the active P site (Peptidyl transferase activity). The left image shows a zoomed part of theactive site. This figure contains a colored purple isosurface showing the hexagonal shape of a purine nucleotide near the active site.(B) HB method, compression = 42:1. For a 42:1 compression ratio we observe degradation of the molecular structure. However, the nucleotidestructure can still be distinguished with our HB method. This in contrast to the Haar representation.(C) Haar method, compression = 42:1. For the Haar method we observe that for the same compression as HB, the hexagonal shape of thenucleotides is highly distorted. In addition, volume rendered image on the right appears blocky.
John Wiley & Sons). Baker, N., Spet, D., Joseph, S., Holst, M.J., and McCammon, J.A.
Table 3. Reconstruction Random Access Timings for the Electron Density Maps of the Large Ribosomal Subunit (PDB: 1JJ2) with VaryingRates of Decay
Rate of Decay t1 t2 t3 t4
B = − 1 5.049 × 10⁻⁵ 1.456 × 10⁻⁴ 2.58 × 10⁻⁶ 26.679B = − 2 5.379 × 10⁻⁵ 1.427 × 10⁻⁴ 2.58 × 10⁻⁶ 25.835B = − 5 5.404 × 10⁻⁵ 1.375 × 10⁻⁴ 2.58 × 10⁻⁶ 24.829
The timings are in seconds.Legend: t1= The average time of 1000 random accesses of a voxel from the compressed format. t2= The average time of 1000 randomaccesses of a full cell from the compressed format. t3= The average time of 1000 random accesses of a voxel inside a cell, where the cellwas chosen at random from the uncompressed format. t4= The average time to decode the entire compressed volume (5123) for 10 runs.
NSF grants INT-9987409, ACI-022003, and EIA-0325550 and a grant B(from the NIH 0P20 RR020647. Our HB software for volumetric com-
pression and decompression, and our Volume Rover visualization ssoftware can be downloaded at Computational Visualization Cen- Tter’s software download page (http://www.ices.utexas.edu/ccv/ Bsoftware). Finally, we mention that to our knowledge, we do not
phave any financial conflict that can influence the results or inter-
cpretation of this manuscript.
3
BReceived: December 10, 2004tRevised: February 10, 2005
Accepted: February 11, 2005 BPublished: March 8, 2005 f
BReferences
pJBajaj, C. (1998). Data Visualization Techniques (Chichester, UK:
ajaj, C., Castrillon-Candas, J.E., Siddavanahalli, V., and Xu, Z.2004). Compressed volumetric representations of macromoleculartructures and properties. ICES Technical report, University ofexas, Austin.
ajaj, C., Pascucci, V., and Zhuang, G. (1999). Progressive com-ression and transmission of arbitrary triangular meshes. In Pro-eedings of IEEE Visualization Conference (San Francisco, CA), pp.07–316.
ajaj, C., Ihm, I., and Park, S. (2000). Compression-based 3D tex-ure mapping for real-time rendering. Graph. Models 62, 391–410.
ajaj, C., Ihm, I., and Park, S. (2001a). 3D RGB image compressionor interactive applications. ACM Trans. Graph. 20, 10–38.
ajaj, C., Ihm, I., and Park, S. (2001b). Visualization-specific com-ression of large volume data. In Proc. of Pacific Graphics (Tokyo,apan), pp. 212–222.
Compression of Molecular Structures and Properties471
(2001). Electrostatics of nanosystems: application to microtubulesand the ribosome. Proc. Natl. Acad. Sci. USA 98, 10037–10041.
Baker, T.S., Olson, N.H., and Fuller, S.D. (1999). Adding the thirddimension to virus life cycles: Three-dimensional reconstruction oficosahedral viruses from cryo-electron micrographs. AmericanSoc. Microbiol. 63, 862–922.
Berman, H.M., Westbrook, J., Feng, Z., Gilliland, G., Bhat, T.N.,Weissig, H., Shindyalov, I.N., and Bourne, P.E. (2000). The ProteinData Bank (www.pdb.org). Nucleic Acids Res. 28, 235–242.
Blinn, J.F. (1982). A generalization of algebraic surface drawing.ACM Trans. Graph. 1, 235–256.
Boys, S. (1950). Electronic wave functions. i, a general method ofcalculation for the stationary states of any molecular system. Proc.R. Soc. Lond. A Math. Phys. Sci. 200, 542–554.
Darst, S.A., Polyakov, A., Richter, C., and Zhang, G. (1998). Insightsinto Escherichia coli RNA polymerase structure from a combinationof x-ray and electron crystallography. J. Struct. Biol. 124, 115–122.
Frank, J. (1996). Three-Dimensional Electron Microscope of Macro-molecular Assemblies (San Diego, CA: Academic Press).
Frank, J., Penczek, P., Agrawal, R.K., Grassucci, R.A., and Heagle,A.B. (2000). Three-dimensional cryoelectron microscopy of ribo-somes. Methods Enzymol. 317, 276–291.
Grant, J., and Pickup, B. (1995). A gaussian description of molecu-lar shapes. J. Phys. Chem. 99, 3503–3510.
Heel, M.V., Gowen, B., Matadeen, R., Orlova, E.V., Finn, R., Pape,T., Cohen, D., Stark, H., Schmidt, R., Schatz, M., and Patwardhan,A. (2000). Single-particle electron cryo-microscopy: Towardsatomic resolution. Q. Rev. Biophys. 33, 307–369.
Medalia, O., Weber, I., Frangakis, A.S., Nicastro, D., Gerisch, G.,and Baumeister, W. (2002). Macromolecular architecture in eukary-otic cells visualized by cryoelectron tomography. Science 298,1209–1213.
Mestres, J., Rohrer, D.C., and Maggiora, G.M. (1997). Mimic: A mo-lecular-field matching program. exploiting applicability if molecularsimilarity approaches. J. Comput. Chem. 18, 934–954.
Orlova, E.V., Serysheva, I., Heel, M.V., Hamilton, S.L., and Chiu, W.(1996). Two structural configurations of the skeletal muscle calciumrelease channel. Nat. Struct. Biol. 3, 547–552.
Rossmann, M.G., Bernal, R., and Pletnev, S.V. (2001). Combiningelectron microscopic with x-ray crystallographic structures. J.Struct. Biol. 136, 190–200.
Sali, A., Glaeser, R., Earnest, T., and Baumeister, W. (2003). Fromwords to literature in structural proteomics. Nature 422, 216–225.
Sweldens, W. (1998). The lifting scheme: A construction of secondgeneration wavelets. SIAM J. Math. Anal. 29, 511–546.
Yserentant, H. (1992). Hierarchical bases. ICIAM 91. RE Ed, SIAMPhiladelphia 49, 329–412.
Zhou, Z.H., Baker, M.L., Jiang, W., Dougherty, M., Jakana, J., Dong,G., Lu, G., and Chiu, W. (2001). Electron cryomicroscopy and bioin-formatics suggest protein fold models for rice dwarf virus. Nat.Struct. Biol. 8, 868–873.
Structure464
Figure 1. HB Zero-Bit Compression Example of a Volumetric Electron Density Representation of a Large Ribosomal Subunit (PDB: 1JJ2)
(Figure created using Volume Rover.)(A) In this image we show a volume rendering of the electron density map of the large ribosomal subunit at 2.4 Å. This molecule has 98543atoms and the electron density map has been generated using a grid of 2563 voxels with a decay parameter of B = −1. The grid resolution isapproximately 1 Å. On the right image, we show the volume rendering of the entire molecule. The left image shows a zoomed portion of theribosomal subunit. In particular, this zoomed portion corresponds to the main active sites of the ribosome, where green is the Aminoacyl (A)site, red the Peptidyl (P) site and blue the Exit site (E).(B) Zero-bit HB with threshold = 0.05 and compression = 11:1.(C) Zero-bit HB with threshold = 0.15, compression = 30:1.(D) Zero-bit HB with threshold = 0.50, compression = 65:1. For increase compression, we observe very little degradation on volume renderingof the molecular structure. Volume rendering is a smoothing operation, thus visual errors tend to be blurred out. The error in the compressedmap is much more clearly seen for isosurfaces, as will be shown in Figure 2.
Volumetric electron density representations of mac- lfromolecular structures, at low or medium resolutions,
are additionally available as reconstructed 3D maps ssfrom tomographic electron microscopy or single par-
ticle cryo-EM (Frank, 1996). There is a growing number sof these 3D maps being deposited into the PDB andthe EBI. The molecular surface of such reconstructed R3D maps of macromolecular structures can also begenerated as a suitable isosurface. Again, visualiza- W
stions of these maps can be generated using isosurfaceor volume renderings. Figure 4 shows the outer capsid w
glayer of a Rice Dwarf Virus (RDV) map, reconstructedfrom single particle cryo-EM, and visualized using vol- h
rume rendering.Associated volumetric properties of high-resolution s
tmacromolecules such as electrostatic potential fieldsare computed by solving the Poisson-Boltzmann equa- d
ttion (Baker et al., 2001). Again, isosurface extractionand rendering, as well as volume rendering, provide a
iways of visualizing these maps. Figure 5 shows twoisosurfaces from an electrostatic map of the large ribo- s
ssomal subunit (PDB: 1JJ2).The main contribution of this paper is to demonstrate
that our new HB wavelets provide high feature-preserv- HTing compression balanced with a rapid and local de-
compression capability when applied to macromolecu-
ar structure and properties and especially in their useor interactive applications. Moreover, we also demon-trate that our new HB wavelets yield better compres-ion tradeoffs than previously used compressionchemes based on Haar wavelets.
esults and Discussion
e construct HB over 3D domains in the context ofecond generation wavelets (Sweldens, 1998). Theseavelets are constructed to be adapted to the localeometry and are easy to implement. They exhibit aigh degree of accuracy as well as high compressionatios. In subsection “Hierarchical Basis and Compres-ion Scheme,” we provide a discussion on wavelets,he sparsification strategy, and the encoder we haveeveloped. Details of the mathematical construction of
he HB wavelets, as well as the fast decoding scheme,re given in Bajaj et al. (2004),. In subsection “Encod-
ng, Decoding, and Fast Random Access,” we presenteveral example applications of our HB compressioncheme, including error and timing results.
ierarchical Basis and Compression Schemehe compression scheme can be broken in two steps.
First, the data have to be sparsified using a suitable

Compression of Molecular Structures and Properties465
Figure 2. HB Zero-Bit Compression Example of a Volumetric Electron Density Representation of a Large Ribosomal Subunit (PDB: 1JJ2), atnear Atomistic Resolution
(Figure created using Volume Rover.)(A) In this image we show a volume rendering of the electron density map of the large ribosomal subunit at 2.4 Å. This molecule has 98543atoms and the electron density map has been generated using a grid of 5123 voxels with a decay parameter of B = −5, which shows highermolecular detail than in Figure 1. Out of this grid, we extract a subvolume of 2163 voxels that contains the A, P, and E active sites. The gridresolution is approximately 0.5 Å. Note that this is a minimal uniform resolution needed to obtain accurate isosurfaces. A coarser resolutionleads to very displeasing artifacts, where many of the atomistic details are difficult to recognize. On the right image, we have the volumerendering of the A, P, and E active sites of the ribosome. The left image shows a zoomed portion of the ribosomal structure, where severalnucleotides on the active site can be seen.(B) Zero-bit HB compression with threshold = 0.05 and compression = 8:1.(C) Zero-bit HB compression with threshold = 0.15, compression = 18:1.(D) Zero-bit HB compression with threshold = 0.50, compression = 42:1.For the volume rendered image on the right, very little degradation of the ribosomal structure is visible as the compression increases. Incontrast, the atomistic details shown via isosurface rendering clearly degrade.
functional representation. The second step is to pro-duce an encoding and decoding, which tells where thenonzero terms are located. The main idea behind wave-lets is to start with a coarse representation of the mo-lecular map and do successive refinements to obtainthe desired resolution. Each level of resolution will beapproximated by a series of functions called the scalingfunctions. The main objective is to construct an effi-cient representation of a molecular map over the em-bedded domain at different levels of resolution. How-ever, this is not a very efficient way to represent afunction and can be very costly in terms of the numberof scaling functions needed to approximate the molec-ular map. This motivates us to look at the differencesbetween one level of resolution and the next. Insteadof representing a molecular map at a single high-reso-lution level, we transform it into a very coarse approxi-mation (i.e., level zero) and the differences betweeneach level of resolution. The functions that describethese differences are called the wavelets. In compari-son to the scaling functions, the coefficients associatedwith the wavelet exhibit fast decay for smooth data. Ifa molecular map contains a discontinuity, the neighbor-
hood wavelet coefficients are in general large, but awayfrom the discontinuity the decay is very fast. Thismakes wavelets very well suited for representing localand global variations. In contrast, Fourier and sphericalharmonics have very slow decays due to the bias to-ward global representations.
A linear HB is constructed in 3D (Bajaj et al., 2004)due to the high degree of compression, ease of imple-mentation, and fast random access. In this same paper,we devise the strategies for the compression of molec-ular data. The linear HB representation we construct isessentially an adaptive mesh representation. However,most adaptive meshes are discontinuous, unless acomputational expensive step is used a priori to avoiddiscontinuities. These discontinuities lead to artifactsfor the visualization of molecular volumes and surfaces;in particular, the isosurface extraction would be verypoor. In contrast, the HB wavelet representation itselfis continuous.
Encoding, Decoding, and Fast Random AccessAs with all compression schemes, a suitable encodingof the nonzero wavelets is a necessary step. Many suchschemes have been developed for efficient transmis-
sion of compressed data streams. However, very few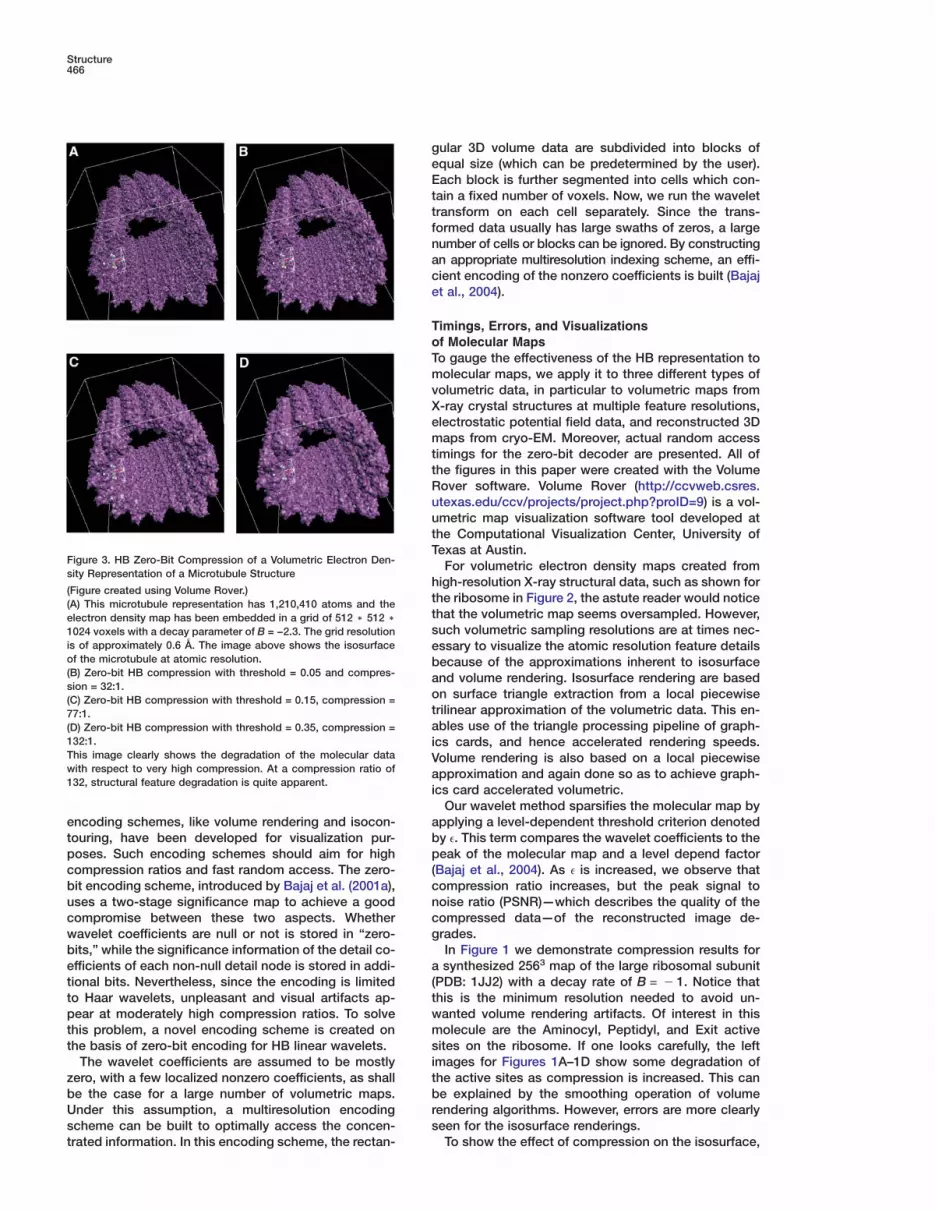
Structure466
geEttfnace
ToTmvXemttRuutT
Figure 3. HB Zero-Bit Compression of a Volumetric Electron Den-sity Representation of a Microtubule Structure
h(Figure created using Volume Rover.)
t(A) This microtubule representation has 1,210,410 atoms and thetelectron density map has been embedded in a grid of 512 ) 512 )s1024 voxels with a decay parameter of B = −2.3. The grid resolution
is of approximately 0.6 Å. The image above shows the isosurface eof the microtubule at atomic resolution. b(B) Zero-bit HB compression with threshold = 0.05 and compres- asion = 32:1.
o(C) Zero-bit HB compression with threshold = 0.15, compression =t77:1.a(D) Zero-bit HB compression with threshold = 0.35, compression =
132:1. iThis image clearly shows the degradation of the molecular data Vwith respect to very high compression. At a compression ratio of a132, structural feature degradation is quite apparent.
i
aencoding schemes, like volume rendering and isocon-touring, have been developed for visualization pur- b
pposes. Such encoding schemes should aim for highcompression ratios and fast random access. The zero- (
cbit encoding scheme, introduced by Bajaj et al. (2001a),uses a two-stage significance map to achieve a good n
ccompromise between these two aspects. Whetherwavelet coefficients are null or not is stored in “zero- gbits,” while the significance information of the detail co-efficients of each non-null detail node is stored in addi- a
(tional bits. Nevertheless, since the encoding is limitedto Haar wavelets, unpleasant and visual artifacts ap- t
wpear at moderately high compression ratios. To solvethis problem, a novel encoding scheme is created on m
sthe basis of zero-bit encoding for HB linear wavelets.The wavelet coefficients are assumed to be mostly i
tzero, with a few localized nonzero coefficients, as shallbe the case for a large number of volumetric maps. b
rUnder this assumption, a multiresolution encodingscheme can be built to optimally access the concen- strated information. In this encoding scheme, the rectan-
ular 3D volume data are subdivided into blocks ofqual size (which can be predetermined by the user).ach block is further segmented into cells which con-
ain a fixed number of voxels. Now, we run the waveletransform on each cell separately. Since the trans-ormed data usually has large swaths of zeros, a largeumber of cells or blocks can be ignored. By constructingn appropriate multiresolution indexing scheme, an effi-ient encoding of the nonzero coefficients is built (Bajajt al., 2004).
imings, Errors, and Visualizationsf Molecular Mapso gauge the effectiveness of the HB representation toolecular maps, we apply it to three different types of
olumetric data, in particular to volumetric maps from-ray crystal structures at multiple feature resolutions,lectrostatic potential field data, and reconstructed 3Daps from cryo-EM. Moreover, actual random access
imings for the zero-bit decoder are presented. All ofhe figures in this paper were created with the Volumeover software. Volume Rover (http://ccvweb.csres.texas.edu/ccv/projects/project.php?proID=9) is a vol-metric map visualization software tool developed athe Computational Visualization Center, University ofexas at Austin.For volumetric electron density maps created from
igh-resolution X-ray structural data, such as shown forhe ribosome in Figure 2, the astute reader would noticehat the volumetric map seems oversampled. However,uch volumetric sampling resolutions are at times nec-ssary to visualize the atomic resolution feature detailsecause of the approximations inherent to isosurfacend volume rendering. Isosurface rendering are basedn surface triangle extraction from a local piecewiserilinear approximation of the volumetric data. This en-bles use of the triangle processing pipeline of graph-
cs cards, and hence accelerated rendering speeds.olume rendering is also based on a local piecewisepproximation and again done so as to achieve graph-
cs card accelerated volumetric.Our wavelet method sparsifies the molecular map by
pplying a level-dependent threshold criterion denotedy e. This term compares the wavelet coefficients to theeak of the molecular map and a level depend factor
Bajaj et al., 2004). As e is increased, we observe thatompression ratio increases, but the peak signal tooise ratio (PSNR)—which describes the quality of theompressed data—of the reconstructed image de-rades.In Figure 1 we demonstrate compression results forsynthesized 2563 map of the large ribosomal subunit
PDB: 1JJ2) with a decay rate of B = − 1. Notice thathis is the minimum resolution needed to avoid un-anted volume rendering artifacts. Of interest in thisolecule are the Aminocyl, Peptidyl, and Exit active
ites on the ribosome. If one looks carefully, the leftmages for Figures 1A–1D show some degradation ofhe active sites as compression is increased. This cane explained by the smoothing operation of volume
endering algorithms. However, errors are more clearlyeen for the isosurface renderings.To show the effect of compression on the isosurface,

Compression of Molecular Structures and Properties467
Figure 4. HB Compression Example of a Reconstructed 3D Map of an RDV Structure
(Figure created using Volume Rover.)(A) Volume rendering and isosurface of the RDV map at 6.8 Å resolution in a grid of 241 ) 4812 voxels. On the right image, the outer capsidlayer is rendered in green. The left image shows a zoomed portion of the capsid, displaying one of the trimeric subunits (purple).(B) Threshold = 0.15, compression = 22:1.(C) Threshold = 0.35, compression = 37:1.(D) Threshold = 0.50, compression = 57:1. As the compression increases, we observe a slight degradation in the trimeric subunit of thevirus capsid.
we synthesize a 5123 electron density map from thelarge ribosomal subunit (PDB: 1JJ2) with a rate of de-cay of B = − 5. For this rate of decay, the atomistic de-tails can be distinguished. A smaller grid resolutionwould lead to highly degraded isosurface. In Figures2A–2D, we show the volume rendering of the A, P, andE active sits and an isosurface of a nucleotide on thesesites. As the compression increases, it is clear that theatomistic features degrade. However, even at highcompression many of the atomistic features can be dis-tinguished.
Another interesting feature to observe is the com-pression capabilities of our scheme with respect tomaps of varying resolutions. In Tables 1A–1C, compres-sion results for the large ribosomal subunit (PDB: 1JJ2)electron density map at rates of decay B = −5, −2, −1.For a fixed threshold level, we observe that both thePSNR and CR increase with a decrease in resolution(by changing B).
In Figure 3, compression results for a 1.2 million atommicrotubule structure are shown. Much of the overallstructure is preserved at high compression ratios ofaround 130:1. However, many of the atomistic detailsare lost and the whole structure seems to loose reso-lution.
Our HB scheme is applied on a 3D map of the RiceDwarf Virus, reconstructed from single-particle cryo-
EM. The dataset dimension is 241 × 4812 with a resolu-tion of 6.8 Å. In Figure 4A, on the right image we showa volume rendering of the original RDV cryo-EM map.In addition, on the left image, an isosurface shows thetrimeric unit of the virus. In Figures 4B–4D, compres-sion results for three different thresholds are shown.High visual accuracy of the structure of the virus canbe observed even at a compression ratio of 57:1. InTable 2A, we present numeric data of our compressionalgorithm for more threshold levels.
We finally test the HB representation with zero-bit en-coding on the potential field of the large ribosomal sub-unit (PDB: 1JJ2). This molecular map was created froma Poisson-Boltzmann solver (Baker et al., 2001). InTable 2B, we observe that the CR increases as thePSNR falls. However, even at high compressions ratiosthe image quality degrades very slowly, as shown inFigures 5A–5D.
For sake of completeness, we compare our con-tinuous zero-bit HB scheme with the zero-bit Haarcompression method that to our knowledge is the onlyother compression-based interactive algorithm avail-able. We choose the same data that were produced forFigure 2. It is clear from Figure 6 that at high compres-sion, our method preserves the structure well. On theother hand, blocky artifacts are seen in the Haar caseas the wavelets are discontinuous.

Structure468
Figure 5. HB Zero-Bit Compression Example on a Computed Electrostatics Potential Field Property of a Large Ribosomal Subunit
(Figure created using Volume Rover.)(A) Noncompressed map of the potential field of the large ribosomal subunit. This 5123 gridded field data was created using the AdaptivePoisson-Boltzmann Solver (Baker et al., 2001). The right image shows two isosurfaces of the field, where the blue isosurface is positive andthe red one is negative potential. The left image shows a zoomed portion of the field, as captured by the smaller cube shown in the rightimage. The pictures are created using our center’s VolRover software.(B) Zero-bit HB with threshold= 0.05, compression = 41:1.(C) Zero-bit HB with threshold = 0.15, compression = 55:1.(D) Zero-bit HB with threshold = 0.35, compression = 62:1. We see very little degradation of the field as we increase the compression.However, as shown in Table 2, the errors clearly increase with higher compression.
In Table 3, we show random access timing test cases lofor our method tested on the electron density map of
the large ribosomal subunit (PDB: 1JJ2), with varying dorates of decay. The four test cases are as follows:ds• t1: The average time of 1000 random accesses of
a voxel from the compressed format. vw• t2: The average time of 1000 random accesses of
a full cell from the compressed format. dw• t3: The average time of 1000 random accesses of
a voxel inside a cell, where the cell was chosen at gdrandom from the uncompressed format.
• t4: The average time to decode the entire com-pressed volume (5123) for 10 runs.
SSThese timings were run on an SGI ONYX2 system usinga
a single processor. As observed, to decode a single Dvoxel, the slowest case is t1. However, for most volumerending and isocontouring applications it is more effi-cient to decode an entire cell since many neighboring Apoints are used.
WfConclusions(We have demonstrated the value of HB wavelet com-(
pressed volumetric representations for macromolecular cstructures and associated properties, especially in the f
mage of rapidly increasing structures and medium reso-
ution maps in both the PDB and EBI. The added valuef fast decompression time yields the necessary ingre-ient for enabling interactive visualization performancen current desktop computers. Our future work is pre-ominantly in the development of computational analy-is algorithms that work directly from HB compressedolumes of bio-molecules and associated properties,ith fast decompression. We are also interested in theevelopment of interactive visualization techniqueshich optimally utilize the faster bandwidth of pro-rammable graphics hardware, commonplace on mostesktop computers.
upplemental Dataupplemental Data include five movies and can be found with thisrticle online at http://www.structure.org/cgi/content/full/13/3/463/C1/.
cknowledgments
e sincerely thank Professor Wah Chiu (Baylor School of Medicine)or the 3D map of the Rice Dwarf Virus, Professor Nathan BakerWashington University at St. Louis), Professor Andrew McCammonUniversity of California, San Diego) for the electrostatics potentialomputed data for the 50S large subunit of the ribosome, and Pro-essor Dave Sept (Washington University at St. Louis) for the 1.2illion atom microtubule data. This work was supported in part by
Compression of Molecular Structures and Properties469
Table 1. Compression and Comparison Results for the Large Ribosomal Subunit (5123) with Different Rate of Decay Parameter B
A. B = −5
� PSNR % 0’s after TX % 0’s Original TCC NZC eN e2 Size (Bytes) CR
0.50 30.15 99.10 77.67 111.73 24.94 54.13 27.84 6376816 84.190.35 31.87 98.81 77.67 84.07 18.77 43.37 22.82 8025803 66.890.15 36.13 97.73 77.67 44.13 9.85 19.09 13.97 14473038 37.090.05 42.52 94.71 77.67 18.91 4.22 6.63 6.63 32247352 16.640.01 58.49 87.39 77.67 7.93 1.77 1.30 1.04 72738554 7.380.00 536870980
B. B = −2
� PSNR % 0’s after TX % 0’s Original TCC NZC eN e2 Size (Bytes) CR
0.50 30.82 99.19 74.77 123.72 31.20 29.80 19.76 5807819 92.430.35 32.76 98.92 74.77 93.06 23.47 25.71 15.73 7315547 73.380.15 37.35 97.99 74.77 49.80 12.56 17.18 9.31 12469751 43.050.05 42.15 95.76 74.77 23.63 5.96 6.53 5.31 25731023 20.860.01 56.88 86.17 74.77 7.23 1.82 1.31 0.96 79575816 6.740.00 536870980
C. B = −1
� PSNR % 0’s after TX % 0’s Original TCC NZC eN e2 Size (Bytes) CR
0.50 33.16 99.35 71.58 153.85 43.72 22.24 11.93 4586097 117.060.35 34.52 99.22 71.58 128.86 36.62 16.91 10.23 5460302 98.320.15 39.18 98.54 71.58 68.56 19.48 9.27 5.92 9432914 56.910.05 44.58 97.06 71.58 34.07 9.68 5.77 3.18 17706006 30.320.01 54.79 89.12 71.58 9.19 2.61 1.31 0.96 63375575 8.470.00 536870980
(A–C) Compression results with HB basis.Legend: threshold criterion e, PSNR = peak signal to noise ratio, TX: wavelet transform, TCC: total coefficient compression ratio, NZC: nonzerocompression ratio, e∞: maximum (l∞) percent error between reconstructed compressed version and the original, e2: energy (l2) percent errorbetween reconstructed compressed version and the original. CR: file compression ratio.
Table 2. Zero-Bit Encoded HB Compression Results for the Potential Field of the Large Ribosomal Subunit (PDB: 1JJ2) and a Cryo-EM mapof the Rice Dwarf Virus
A. Zero-bit HB Compression results for the 6.8 Å resolution Rice Dwarf Virus Cryo-EM map embedded in a grid of 481 ∗ 481 ∗ 241 voxels.
% 0’se PSNR % 0’s after TX Original TCC NZC e∞ e2 Size (Bytes) CR
0.50 31.10 99.15 72.61 117.83 32.27 41.11 25.61 4771349 46.740.35 32.97 98.88 72.61 89.49 24.51 36.45 20.64 6042206 36.910.150 36.03 98.08 72.61 52.29 14.32 18.95 14.53 10031643 22.230.05 42.69 94.73 72.61 19.01 5.20 6.68 6.74 26590966 8.380.01 55.69 86.26 72.61 7.27 1.99 1.31 1.48 67075200 3.320.00 223032072
B. Zero-bit HB compression results for the potential field of the large ribosomal subunit (PDB: 1JJ2), 2.4 Å Resolution), with a gridresolution of 5123 voxels (Baker et al., 2001).
% 0’se PSNR % 0’s after TX Original TCC NZC e∞ e2 Size (Bytes) CR
0.500 38.50 98.84 0.58 85.91 85.40 63.01 3.48 8263922 64.960.35 40.24 98.78 0.58 82.39 81.91 45.67 2.85 8572631 62.620.15 44.18 98.60 0.58 71.85 71.43 19.75 1.81 9675507 55.480.05 50.29 98.06 0.58 51.56 51.26 6.28 0.90 12972064 41.380.01 60.36 96.13 0.58 25.85 25.70 1.29 0.28 24344104 22.050.00 536870980
(A) The cryo-EM of the Rice Dwarf Virus at 6.8 Angstroms resolution is embedded in 481 ∗ 481 ∗ 241 a grid.(B) The potential field of the ribosome with 2.4 Å resolution is embedded in a grid of 5123 voxels ( ≈ 0.5 Å resolution). This data set wascreated with the Adaptive Poisson-Boltzmann Solver (Baker et al., 2001).Legend: threshold criterion e, PSNR = Peak Signal to noise ratio, TX: wavelet transform, TCC: total coefficient compression ratio, NZC:nonzero compression ratio, e∞ is equal to the maximum (l∞) percent error between reconstructed compressed version and the original, e2 isthe energy (l2) percent error between reconstructed compressed version and the original. CR: file compression ratio.

Structure470
Figure 6. Compression Comparison between Zero-Bit HB and Haar Schemes
(Figure created using Volume Rover.)(A) Rendering example of the large ribosomal subunit data set (See also Figure 2). In the right image, a portion of the electron density of theribosome is shown. This portion corresponds to the active P site (Peptidyl transferase activity). The left image shows a zoomed part of theactive site. This figure contains a colored purple isosurface showing the hexagonal shape of a purine nucleotide near the active site.(B) HB method, compression = 42:1. For a 42:1 compression ratio we observe degradation of the molecular structure. However, the nucleotidestructure can still be distinguished with our HB method. This in contrast to the Haar representation.(C) Haar method, compression = 42:1. For the Haar method we observe that for the same compression as HB, the hexagonal shape of thenucleotides is highly distorted. In addition, volume rendered image on the right appears blocky.
John Wiley & Sons). Baker, N., Spet, D., Joseph, S., Holst, M.J., and McCammon, J.A.
Table 3. Reconstruction Random Access Timings for the Electron Density Maps of the Large Ribosomal Subunit (PDB: 1JJ2) with VaryingRates of Decay
Rate of Decay t1 t2 t3 t4
B = − 1 5.049 × 10⁻⁵ 1.456 × 10⁻⁴ 2.58 × 10⁻⁶ 26.679B = − 2 5.379 × 10⁻⁵ 1.427 × 10⁻⁴ 2.58 × 10⁻⁶ 25.835B = − 5 5.404 × 10⁻⁵ 1.375 × 10⁻⁴ 2.58 × 10⁻⁶ 24.829
The timings are in seconds.Legend: t1= The average time of 1000 random accesses of a voxel from the compressed format. t2= The average time of 1000 randomaccesses of a full cell from the compressed format. t3= The average time of 1000 random accesses of a voxel inside a cell, where the cellwas chosen at random from the uncompressed format. t4= The average time to decode the entire compressed volume (5123) for 10 runs.
NSF grants INT-9987409, ACI-022003, and EIA-0325550 and a grant B(from the NIH 0P20 RR020647. Our HB software for volumetric com-
pression and decompression, and our Volume Rover visualization ssoftware can be downloaded at Computational Visualization Cen- Tter’s software download page (http://www.ices.utexas.edu/ccv/ Bsoftware). Finally, we mention that to our knowledge, we do not
phave any financial conflict that can influence the results or inter-
cpretation of this manuscript.
3
BReceived: December 10, 2004tRevised: February 10, 2005
Accepted: February 11, 2005 BPublished: March 8, 2005 f
BReferences
pJBajaj, C. (1998). Data Visualization Techniques (Chichester, UK:
ajaj, C., Castrillon-Candas, J.E., Siddavanahalli, V., and Xu, Z.2004). Compressed volumetric representations of macromoleculartructures and properties. ICES Technical report, University ofexas, Austin.
ajaj, C., Pascucci, V., and Zhuang, G. (1999). Progressive com-ression and transmission of arbitrary triangular meshes. In Pro-eedings of IEEE Visualization Conference (San Francisco, CA), pp.07–316.
ajaj, C., Ihm, I., and Park, S. (2000). Compression-based 3D tex-ure mapping for real-time rendering. Graph. Models 62, 391–410.
ajaj, C., Ihm, I., and Park, S. (2001a). 3D RGB image compressionor interactive applications. ACM Trans. Graph. 20, 10–38.
ajaj, C., Ihm, I., and Park, S. (2001b). Visualization-specific com-ression of large volume data. In Proc. of Pacific Graphics (Tokyo,apan), pp. 212–222.

Compression of Molecular Structures and Properties471
(2001). Electrostatics of nanosystems: application to microtubulesand the ribosome. Proc. Natl. Acad. Sci. USA 98, 10037–10041.
Baker, T.S., Olson, N.H., and Fuller, S.D. (1999). Adding the thirddimension to virus life cycles: Three-dimensional reconstruction oficosahedral viruses from cryo-electron micrographs. AmericanSoc. Microbiol. 63, 862–922.
Berman, H.M., Westbrook, J., Feng, Z., Gilliland, G., Bhat, T.N.,Weissig, H., Shindyalov, I.N., and Bourne, P.E. (2000). The ProteinData Bank (www.pdb.org). Nucleic Acids Res. 28, 235–242.
Blinn, J.F. (1982). A generalization of algebraic surface drawing.ACM Trans. Graph. 1, 235–256.
Boys, S. (1950). Electronic wave functions. i, a general method ofcalculation for the stationary states of any molecular system. Proc.R. Soc. Lond. A Math. Phys. Sci. 200, 542–554.
Darst, S.A., Polyakov, A., Richter, C., and Zhang, G. (1998). Insightsinto Escherichia coli RNA polymerase structure from a combinationof x-ray and electron crystallography. J. Struct. Biol. 124, 115–122.
Frank, J. (1996). Three-Dimensional Electron Microscope of Macro-molecular Assemblies (San Diego, CA: Academic Press).
Frank, J., Penczek, P., Agrawal, R.K., Grassucci, R.A., and Heagle,A.B. (2000). Three-dimensional cryoelectron microscopy of ribo-somes. Methods Enzymol. 317, 276–291.
Grant, J., and Pickup, B. (1995). A gaussian description of molecu-lar shapes. J. Phys. Chem. 99, 3503–3510.
Heel, M.V., Gowen, B., Matadeen, R., Orlova, E.V., Finn, R., Pape,T., Cohen, D., Stark, H., Schmidt, R., Schatz, M., and Patwardhan,A. (2000). Single-particle electron cryo-microscopy: Towardsatomic resolution. Q. Rev. Biophys. 33, 307–369.
Medalia, O., Weber, I., Frangakis, A.S., Nicastro, D., Gerisch, G.,and Baumeister, W. (2002). Macromolecular architecture in eukary-otic cells visualized by cryoelectron tomography. Science 298,1209–1213.
Mestres, J., Rohrer, D.C., and Maggiora, G.M. (1997). Mimic: A mo-lecular-field matching program. exploiting applicability if molecularsimilarity approaches. J. Comput. Chem. 18, 934–954.
Orlova, E.V., Serysheva, I., Heel, M.V., Hamilton, S.L., and Chiu, W.(1996). Two structural configurations of the skeletal muscle calciumrelease channel. Nat. Struct. Biol. 3, 547–552.
Rossmann, M.G., Bernal, R., and Pletnev, S.V. (2001). Combiningelectron microscopic with x-ray crystallographic structures. J.Struct. Biol. 136, 190–200.
Sali, A., Glaeser, R., Earnest, T., and Baumeister, W. (2003). Fromwords to literature in structural proteomics. Nature 422, 216–225.
Sweldens, W. (1998). The lifting scheme: A construction of secondgeneration wavelets. SIAM J. Math. Anal. 29, 511–546.
Yserentant, H. (1992). Hierarchical bases. ICIAM 91. RE Ed, SIAMPhiladelphia 49, 329–412.
Zhou, Z.H., Baker, M.L., Jiang, W., Dougherty, M., Jakana, J., Dong,G., Lu, G., and Chiu, W. (2001). Electron cryomicroscopy and bioin-formatics suggest protein fold models for rice dwarf virus. Nat.Struct. Biol. 8, 868–873.