in situ macromolecular crystallography using microbeams
TRANSCRIPT

research papers
592 doi:10.1107/S0907444912006749 Acta Cryst. (2012). D68, 592–600
Acta Crystallographica Section D
BiologicalCrystallography
ISSN 0907-4449
In situ macromolecular crystallography usingmicrobeams
Danny Axford,a Robin L. Owen,a
Jun Aishima,a James Foadi,a,b
Ann W. Morgan,c James I.
Robinson,c Joanne E. Nettleship,d
Raymond J. Owens,d Isabel
Moraes,b Elizabeth E. Fry,e
Jonathan M. Grimes,e Karl
Harlos,e Abhay Kotecha,e
Jingshan Ren,e Geoff Sutton,e
Thomas S. Walter,e David I.
Stuarta,e and Gwyndaf Evansa*
aLife Science Division, Diamond Light Source,
Harwell Science and Innovation Campus,
Didcot, Oxfordshire OX11 0DE, England,bMembrane Protein Laboratory, Imperial
College, London SW7 2AZ, England, cNIHR–
Leeds Musculoskeletal Biomedical Research
Unit and Leeds Institute of Molecular Medicine,
University of Leeds, Leeds LS9 7FT, England,dOPPF-UK, Research Complex at Harwell,
Rutherford Appleton Laboratory R92, Didcot,
Oxfordshire OX11 0DE, England, and eDivision
of Structural Biology, Wellcome Trust Centre of
Human Genetics, University of Oxford,
Roosevelt Drive, Oxford OX3 7BN, England
Correspondence e-mail:
# 2012 International Union of Crystallography
Printed in Singapore – all rights reserved
Despite significant progress in high-throughput methods in
macromolecular crystallography, the production of diffraction-
quality crystals remains a major bottleneck. By recording
diffraction in situ from crystals in their crystallization plates
at room temperature, a number of problems associated with
crystal handling and cryoprotection can be side-stepped.
Using a dedicated goniometer installed on the microfocus
macromolecular crystallography beamline I24 at Diamond
Light Source, crystals have been studied in situ with an intense
and flexible microfocus beam, allowing weakly diffracting
samples to be assessed without a manual crystal-handling step
but with good signal to noise, despite the background scatter
from the plate. A number of case studies are reported: the
structure solution of bovine enterovirus 2, crystallization
screening of membrane proteins and complexes, and structure
solution from crystallization hits produced via a high-
throughput pipeline. These demonstrate the potential for in
situ data collection and structure solution with microbeams.
Received 18 October 2011
Accepted 14 February 2012
1. Introduction
The mounting of crystals in loops or on meshes and their
cryoprotection remains a manual and often painstaking
process in macromolecular crystallography (MX), in contrast
to the successful automation of many other steps in the
sequence-to-structure pipeline. Some years ago, the
measurement of diffraction data from crystals at room
temperature within the crystallization trays used for their
growth was shown to be feasible on a bending-magnet
beamline (Jacquamet et al., 2004). Jacquamet and coworkers
demonstrated that a large defocused X-ray beam of �1 mm
in size could be used to provide useful information about the
diffraction quality of crystals within a drop. In certain cases,
diffraction data sets could also be measured from crystals of
a few hundred micrometres in size. More recently, ligand-soak
experiments have been performed in situ (le Maire et al.,
2011), and at the Swiss Light Source a crystallization facility
now adjoins a beamline capable of in situ data collection
(Bingel-Erlenmeyer et al., 2011). These implementations use a
robotic arm to support and manipulate crystallization plates in
order to perform measurements. The positional resolution and
repeatability of these robotic arms limit their usefulness for
crystal and X-ray beam sizes much less than 20 mm, sizes that
are typical for a microfocus beamline such as I24.
Many of the most challenging targets in structural biology
yield small and weakly diffracting crystals, and the ability
to record in situ diffraction from such crystals is essential if
electronic reprint

the method is to have an impact on these problems. In this
manuscript, we highlight three areas where in situ measure-
ments with microbeams can have a particularly strong impact:
diffraction screening of crystallization experiments in
membrane-protein crystallography, data collection from
virus crystals and structure solution to complement high-
throughput crystallization pipelines. The advent of crystal-
lization facilities such as the Membrane Protein Laboratory
(MPL; http://www.diamond.ac.uk/Home/MPL.html) and the
Oxford Protein Production Facility (OPPF-UK; http://
www.oppf.ox.ac.uk/OPPF/) at Diamond Light Source is
attractive because the production of diffraction-quality crys-
tals remains a significant bottleneck (Geerlof et al., 2006)
and bringing together crystallization and X-ray diffraction
screening may assist in crystal optimization and structure
solution. In recent years, the use of robots to prepare high-
density (usually 96-well SBS-format) plates using nanolitre
volumes in each drop has lead to a rapid increase in the
number of crystallization drops, and hence potential crystals,
handled in many laboratories. The typically small size of the
crystals produced from nanodrop crystallization (Santarsiero
et al., 2002) means that the magnitude of diffuse X-ray scatter
from both the tray and the mother liquor surrounding the
crystal is comparable to, or greater than, that of Bragg
diffraction from the crystal, so that potential data could be
obscured by noise. Thus, although laboratory-based plate-
screening X-ray sources are available (for example, the PX
Scanner; Agilent Technologies; http://www.chem.agilent.com),
these systems are limited in the information that they can
provide owing to modest flux coupled with a relatively large
(250 mm) beam size. As a result, experimenters continue to
mount and cryocool putative crystals individually for screening
either on a home source or at a synchrotron beamline. The
ability to collect high-quality data directly from crystallization
drops in situ raises the prospect of providing immediate
unambiguous feedback on the nature of newly formed crystals.
The manipulation and cryocooling of membrane-protein,
virus and other large complex crystals is a challenging and
time-consuming process. For membrane-protein crystals
grown in mesophase this is even trickier, since visualization of
the crystals is difficult. Solubilization and stabilization are key
to the success of membrane-protein crystallization; therefore,
the use of detergent plays an important role. However, the
presence of detergent micelles covering most of the hydro-
phobic surface of the protein reduces protein–protein contacts,
resulting in crystal lattices with high solvent content. Conse-
quently, membrane-protein crystals initially tend to be small,
extremely fragile, sensitive to temperature variation, poorly
ordered (often having a high mosaic spread) and very sensitive
to radiation damage. To improve crystal quality, many crys-
tallization conditions have to be explored, increasing the
number of crystals produced. Handling a large number of
small fragile crystals can be problematic and often leads to
false negatives, which complicate crystal optimization. In situ
X-ray data collection of membrane-protein crystals effectively
eliminates many of these challenges. Similarly, and out of
necessity, virus crystallography is often conducted using room-
temperature samples owing to the deleterious effect of cryo-
cooling on crystal mosaic spread, leading to the overlap of
diffraction spots from adjacent layers of the reciprocal lattice.
In addition, the strain introduced into the crystal frequently
eliminates the high-resolution diffraction. This problem is
most severe when the unit cell is very large. Collecting
diffraction data in situ avoids this problem and maintains the
integrity of crystals which are often very fragile and do not
respond well to traditional handling methods. An additional
consideration in virus crystallography is the very real disease-
security problem inherent in collecting data from open loops
or grids. This may be overcome by mounting crystals in sealed
thin-walled capillaries (Fry et al., 1993). However, this is time-
consuming and impractical for the most delicate crystals, so
that crystal growth directly in capillaries has sometimes been
used (Cockburn et al., 2003). In situ analysis in sealed plates
provides a safe alternative for pathogenic samples.
In situ data collection has not yet emerged as a routine
method. This is principally owing to the radiation-sensitivity of
protein crystals at room temperature, where the crystal life-
time is typically two orders of magnitude less than at 100 K
(Southworth-Davies et al., 2008), but also reflects a lack of
goniometry optimized for handling crystallization plates with
high precision, the rotational restrictions and the unsuitability
of most crystallization plates for diffraction measurements.
However, reflecting the current interest in the field, several
dedicated plates are now commercially available, such as the
Topaz 1.96 DC (Fluidigm; http://www.fluidigm.com), Crystal-
Harp (SWISSCI; http://www.swissci.com) and CrystalQuick X
(Greiner Bio-One; http://www.greinerbioone.com), or have
recently been described (Soliman et al., 2011; Kisselman et al.,
2011). Desirable properties of the plate design include a low
physical profile maximizing the achievable rotation range, a
wide solid opening angle for exiting diffraction onto the
detector and thin well bases to minimize both X-ray scatter
and refraction effects when rotating samples. A comparison of
plate types is reported in Bingel-Erlenmeyer et al. (2011). The
CrystalQuick X plate has a reduced thickness of the base of
each well: reduced from �1 mm to 250–300 mm. Angled walls
to each reservoir allow a potential 80� angular range for data
collection. Topaz 1.96 DC chips have a base thickness of
200 mm and an even greater angular range since the design
does not require reservoir wells.
Here, we describe a high-precision goniometer that is
capable of holding crystallization plates mounted on the MX
beamline I24 at Diamond Light Source and presenting each
of the crystallization drops to the microfocus X-ray beam. We
also present some of the results obtained whilst bringing this
device into routine use.
2. Materials and methods
2.1. Experimental apparatus
The in situ screening setup utilizes much of the existing
sample-environment apparatus at I24. This includes the
sample !-rotation stage, the on-axis sample-viewing micro-
research papers
Acta Cryst. (2012). D68, 592–600 Axford et al. � In situ crystallography using microbeams 593electronic reprint

scope, scatter guards and beam stop (Fig. 1). The typical I24
beam size of <10 mm and its ability to routinely record data
from frozen crystals of <10 mm in size (Ji et al., 2010) led us
to develop a solution for holding and positioning plates in the
X-ray beam using high-precision linear stages mounted on
the existing high-precision ! axis (Aerotech ABRS-250MP),
ensuring that high-quality diffraction data can be measured
from small crystals in plates.
The standard I24 sample-centring stage is replaced by one
capable of holding most SBS-format crystallization plates in
portrait orientation. This stage is capable of manipulating
plates so that crystals in any drop can be accurately positioned
on the rotation axis. The vertical axis (Heason/Nanomotion)
provides 150 mm of travel, while the axis parallel to the X-ray
beam (Attocube) provides 12 mm of travel. Movement of the
plate horizontally perpendicular to the beam is accomplished
using a long travel stage beneath the ! axis. The mechanical
resolution of positioning is better than 0.1 mm and the
repeatability is better than 0.5 mm. The limited angular range
used by the plate goniometer means that it does not suffer
greatly from errors arising from changes in gravitational load
across the axes as they rotate. In comparison, the regular
goniometer head (Maatel) has a resolution of <0.25 mm and a
repeatability of <2 mm across a full 360� rotation.
As far as possible, the amount of equipment around the
sample stage has been minimized, in particular above and
below the rotation axis. The remaining spatial limitations
result in an available rotation range of �25�: effort was not
made to increase the range further, as beyond angles of �25�
refractive effects make the visualization of crystals difficult.
Plates are currently manually transferred to the goniometer,
but automated transfer from a ‘plate hotel’ at the beamline
using the CATS robot is under development.
2.2. Handling of crystallization-plate optical effects
For conventional single-crystal diffraction experiments at
Diamond the sample is typically viewed using an on-axis
microscope and aligned optically with the centre of rotation
in two orthogonal directions (the rotation axis is pre-aligned
so that it intersects the X-ray beam at the focal plane of the
sample-viewing optics). This ensures that the sample stays
centred on the rotation axis at all possible angles. This simple
procedure becomes more challenging for microcrystals, where
optical refraction effects in the material surrounding the
crystals can shift the apparent position of the crystal(s).
Diffraction methods are routinely used in these cases to locate
and centre samples (Song et al., 2007; Aishima et al., 2010), but
the principle of centring in two orthogonal directions remains
the same.
The precise alignment of crystal samples with the rotation
axis when they are held within a crystallization plate cannot
be performed in the same way. It is not possible to perform
alignment with the axis of rotation by turning through 90�
owing to the size and shape of the crystallization plate. One
centring option is to rely on the narrow depth of the focal
plane of the on-axis microscope: crystals can be aligned with
the rotation axis by bringing them into focus. However, we
have observed that in addition to adding to background X-ray
scatter, the plate shifts the focal plane away from the viewing
optics. If a crystal is to remain within the beam during rotation,
the rotation axis must be shifted to correct for this optical
effect. This is essential for in situ microcrystallography because
a 2� rotation can result in as much as a 14 mm lateral motion
(full details are given in the Supplementary Material1).
Tray-induced optical effects can be illustrated through use
of the diffraction grid scan tool available at I24. The case of
a standard-format Greiner CrystalQuick SW crystallization
plate is shown in Fig. 2. In Fig. 2(a) the sample is not coin-
cident with the axis of rotation, but appears stationary from
the point of view of the observer when the plate is rotated.
When the tray is rotated by �3� the grid scan shows that the
crystal position shifts by 20 mm. When a sample is coincident
with the axis of rotation, as confirmed by the grid scan
(Fig. 2b), it appears through the sample-viewing optics to be
translating vertically when rotated.
Knowledge of the appropriate offset for a given plate can be
included in the experimental setup, allowing samples to be
aligned accurately when the plate is perpendicular to the
viewing optics. However, two further complications have been
observed. Firstly, crystals do not always rest on the plate
surface but may be suspended within the crystallization drop:
the likelihood of this increases when the plate is held vertically
research papers
594 Axford et al. � In situ crystallography using microbeams Acta Cryst. (2012). D68, 592–600
Figure 1Photograph of the I24 sample-environment setup used for in situ datacollection. The translation axes enable any position within the crystal-lization plate to be centred onto the !-rotation axes. The Oz axis enablesthe rotation axis to be translated along the direction of the beam andpositioned at the focal point of the on-axis viewing system. Thus,movement along this axis can correct for changes in the focal length of theviewing system owing to the plate-refraction effects described in x2.2. Thetranslations Sx, Sy and Sz, with ranges of travel of 80, 150 and 12 mm,respectively, are used to bring a crystal to the centre of rotation and intothe X-ray beam. The scatter guard, beamstop and on-axis microscope areused as part of the setup for standard data collections. The gripper iscapable of holding most SBS-format plates, including glass LCP plates.
1 Supplementary material has been deposited in the IUCr electronic archive(Reference: TZ5002). Services for accessing this material are described at theback of the journal.
electronic reprint

for data collection. Offset of the crystal from the plate results
in further displacement of the focal plane (Supplementary
Fig. S1) and this must also be accounted for. Secondly, some
crystallization plates have curved well bottoms, resulting in
optical displacement in both the horizontal and the vertical
directions (an example is shown in Fig. 6b). Correction for this
requires knowledge of the exact position of the well and its
curvature relative to the viewing optics. This correction is not
currently made at I24 and alignment must be carried out using
diffraction grid scanning, with the deleterious side effect of
irradiating crystals before data collection. Use of the grid scan
has also proven to be useful for the detection of protein
crystals within opaque lipidic phases which can hinder visual
alignment. In practice, it has been found that offset of the
rotation axis is sufficient for alignment of crystals in most
cases and this correction has proven to be essential for the
successful alignment of microcrystals.
We have found that the position and the shape of drops
within a plate are stable on mounting in a vertical orientation.
On occasion, we observe crystals moving under gravity and
coming to rest at the bottom of a drop. The likelihood of
movement as a function of sample size and shape has not yet
been quantified. It is possible to collect data from crystals that
have moved, with no apparent effect on data quality.
2.3. Sample preparation
Crystallization experiments for bovine enterovirus 2 (BEV2;
a virus that requires no disease precautions and that was
grown and purified in the Department of Microbiology,
University of Leeds by Professor D. Rowlands) were set up in
96-well Greiner CrystalQuick SW and CrystalQuick X plates
using a Cartesian robot (approximately 10 ml BEV2 at a
concentration of 7 mg ml�1 per plate; Walter et al., 2005).
The sitting drops were formed from 100 nl virus solution plus
100 nl precipitant in 1:1, 2:1 and 1:2 ratios. The bar-coded trays
were sealed with Greiner VIEWseal tapes and stored at
293.5 K. Crystals of bipyramidal morphology (space group
F23, unit-cell parameter a ’ 437 A) grew in many conditions
in both plate types.
A protein–DNA–peptide complex was purified at Cancer
Research UK (Lincoln’s Inn Fields, London). Initial crystal-
lization trials with different-sized DNA oligomers were carried
out at the London site using MRC-format (SWISSCI) plates
research papers
Acta Cryst. (2012). D68, 592–600 Axford et al. � In situ crystallography using microbeams 595
Figure 2Sample positions within a crystallization plate as determined using X-ray diffraction grid scans (the contour plots represent crystal X-ray diffractionstrength) and using visible light through the on-axis microscope, which is subject to refraction effects that systematically shift the apparent crystallocation. (a) and (b) show series of three images recorded with ! equal to �3�, 0� and 3�. The images in (a) were recorded with the sample-rotation axisposition in the nominal OAV focal plane, whereas the images in (b) were recorded with the axis of rotation translated 400 mm downstream into the newfocal plane of the OAV–plate combination. Note that in (a) the crystal appears visually to remain centred when rotated, but the diffraction data confirmthat it is in fact drifting off-axis. In (b) the crystal appears to translate vertically when rotated, but X-ray diffraction confirms that is correctly centred onthe axis of rotation.
electronic reprint
with a protein concentration of 10 mg ml�1. Many small
crystals grew over a two-week period. Further crystallization
trials subsequent to initial in situ testing used Greiner
CrystalQuick X plates and were set up at the MPL using a
Mosquito robot (TTP LabTech).
Crystals of three membrane proteins were generated at the
MPL. A bacterial membrane-anchor cytochrome protein was
expressed and purified at the Instituto De Tecnologia Quimica
e Biologica (ITQB) in Portugal. Crystallization experiments
were set up at the MPL in 96-well Greiner CrystalQuick X
plates. Triangular bipyramid crystals grew within a week in
300 nl sitting drops. A bacterial membrane protein was
expressed and purified as two separate domains at the ITQB,
concentrated to �30 mg ml�1 and then transported to the
MPL for crystal growth and optimization as a complex of
the two domains in MRC-format (SWISSCI) plates. Crystals
appeared in 1 d and grew over 7 d into hexagonal plates. A
human G-protein-coupled receptor (GPCR) was expressed in
Sf9 cells at Evotec (UK). Purification and crystallization trials
were performed at the MPL in lipid cubic phase (LCP) and
small needle-shaped crystals appeared within one week.
Two polymorphic variants of Fc�RIIIA, 7040 and 7041, were
expressed, purified and crystallized at OPPF-UK (Research
Complex at Harwell). 7040 differs from 7041 by a single
amino-acid substitution: F158V (Ravetch & Perussia, 1989).
Full details of sample preparation and structure determination
will be published elsewhere. Crystallization followed similar
protocols to those for BEV2, using Greiner CrystalQuick SW
plates. 7040 crystals were typically �30 � 30 � 30 mm in size;
they were of multiple morphologies and were often fused
together in clusters. Crystals of polymorph 7041 grew under
identical crystallization conditions and were of similar size and
morphology.
2.4. Data collection
For all experiments, plates were manually mounted in the
plate holder and initially centred on a drop containing crystals.
The rotation axis was offset according to the tray type to allow
accurate crystal centring. For larger crystals it was often
possible to collect data from more than one position, as shown
in Fig. 3. For logistical efficiency in locating crystals, optical
images of all drops containing crystals obtained from the
crystal imagers (Daniel et al., 2011) were viewed alongside the
image from the beamline camera. All data were collected on a
research papers
596 Axford et al. � In situ crystallography using microbeams Acta Cryst. (2012). D68, 592–600
Figure 3Four images of a BEV2 crystal during data collection. (a) Prior to anyexposure. (b) After a 0.5 s exposure. (c) After a second 0.5 s exposure. (d)After a third 0.5 s exposure. The beam cross-section of 20 � 20 mm isshown.
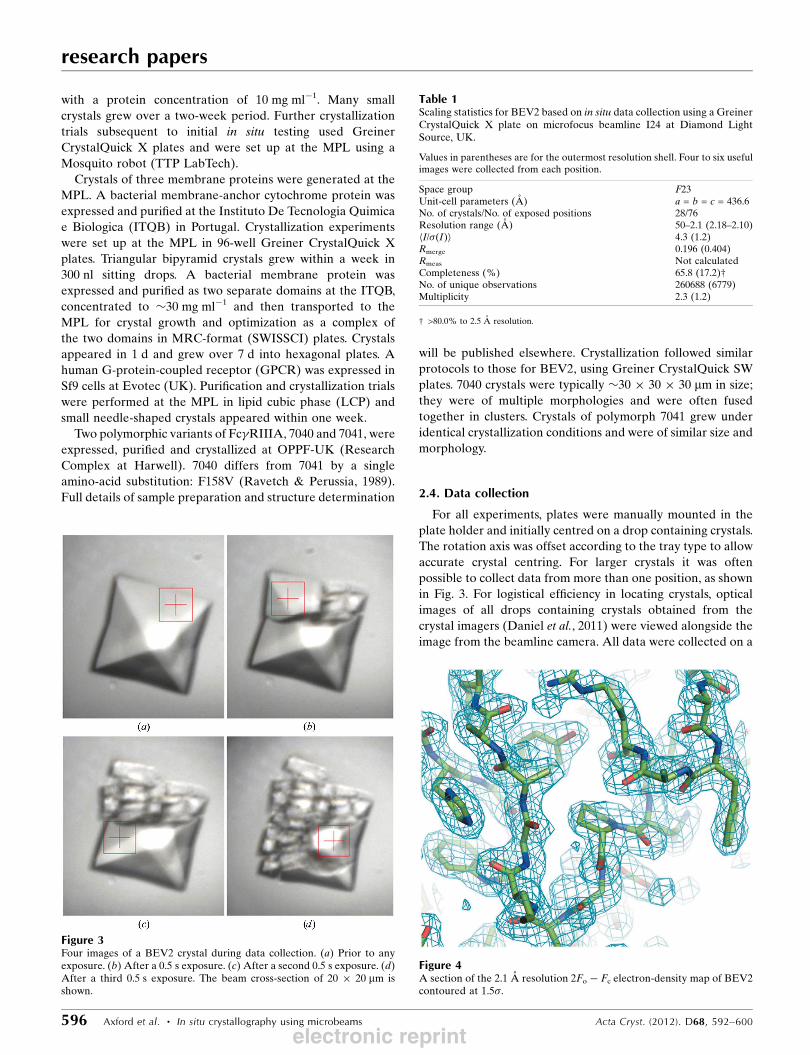
Figure 4A section of the 2.1 A resolution 2Fo � Fc electron-density map of BEV2contoured at 1.5�.
Table 1Scaling statistics for BEV2 based on in situ data collection using a GreinerCrystalQuick X plate on microfocus beamline I24 at Diamond LightSource, UK.
Values in parentheses are for the outermost resolution shell. Four to six usefulimages were collected from each position.
Space group F23Unit-cell parameters (A) a = b = c = 436.6No. of crystals/No. of exposed positions 28/76Resolution range (A) 50–2.1 (2.18–2.10)hI/�(I)i 4.3 (1.2)Rmerge 0.196 (0.404)Rmeas Not calculatedCompleteness (%) 65.8 (17.2)†No. of unique observations 260688 (6779)Multiplicity 2.3 (1.2)
† >80.0% to 2.5 A resolution.
electronic reprint

Pilatus 6MF detector operating in shutterless mode at 294 K,
the ambient temperature of the beamline.
For BEV2, individual frames comprised either 0.1� or 0.05�
and exposure times close to the minimum allowed by the
frame rate of the detector (typically 0.1 s or less), as long as this
regime led to data of sufficient strength for relatively routine
processing. Under the regime described here the crystal life-
time was typically �0.4 s; the effects of radiation damage were
clearly visible (Fig. 3). For this reason, data were generally
collected at 12.8 keV (chosen to allow the U21 undulator to be
operated at close to its minimum gap, maximizing the photon
flux to >1012 photons s�1 at the sample in a beam size of 20 �20 mm). CrystalQuick X plates gave superior data to standard
Greiner CrystalQuick SW plates, enabling data extending
to 2.1 A resolution to be collected (Supplementary Material).
Background scatter was reduced by around a factor of 2.5 on
moving to the X-ray-specific plate type. The CrystalQuick X
plates gave a comparable background to a conventional loop
at low (>10 A) resolution and high (<2.5 A) resolution, but
have a peak in background around 5 A that is approximately
three times that of a loop. The data presented were gathered
from a single CrystalQuick X plate in a
single session on I24.
For Fc�RIIIA, diffraction data were
recorded from 66 crystals of 7040 using
12.68 keV X-rays, a beam size of 20 �20 mm and a photon flux attenuated to
�5 � 1011 photons s�1 at the sample. A
partial data set consisted of approxi-
mately ten 0.5� oscillation images each
of 0.1 s duration. Using the same
experimental strategy, diffraction data
were also collected from 120 crystals of
7041.
2.5. Data processing
Data frames of BEV2 were indexed
and integrated with HKL-2000. The
mosaic spread of each data wedge was
refined using the first three frames and
was then fixed during integration (this
procedure is stable but not ideal, since
the mosaic spread can increase during
irradiation). Data wedges were scaled
and merged using SCALEPACK, with
the mosaic spread fixed and partially
recorded reflections from contiguous
frames merged.
In the case of Fc�RIIIA, data were
integrated using XDS (Kabsch, 2010).
Sequences of blank images or extremely
weak diffraction arising from radiation-
damage-induced decay or the crystal
rotating out of the beam were rejected
manually before integration with XDS.
3. Results
3.1. Data collection from BEV2 crystals
Data-collection and processing statistics are given in Table 1.
Data from 28 crystals of �50–60 mm in size were merged to
yield a data set more than 80% complete to 2.5 A resolution.
The structure was solved by molecular replacement using
the BEV1 structure (PDB entry 1bev; Smyth et al., 1995),
averaged (GAP; D. I. Stuart, J. M. Grimes & J. Diprose,
unpublished work) and refined (CNS; Brunger et al., 1998)
using strict noncrystallographic symmetry constraints. Sample
electron density is shown in Fig. 4; details of the structure
solution and the structure will be published elsewhere.
3.2. Comparison of data from a multi-component complexunder cryogenic conditions and in situ
Diffraction data obtained in situ extended to a higher
resolution than could be observed from the same samples
under cryogenic conditions. Fig. 5 shows the example of two
crystals of a 48 kDa protein–DNA–peptide complex obtained
from identical crystallization conditions. The respective
research papers
Acta Cryst. (2012). D68, 592–600 Axford et al. � In situ crystallography using microbeams 597
Figure 5Comparison of in situ and frozen data collection from crystals of a protein–DNA complex. View of acrystal in a drop within a crystallization plate (a) and the diffraction obtained from this sample (b).Spots were observed to 10 A resolution. A crystal grown in identical conditions was mounted in afibre loop and cryocooled to 100 K (c). The resulting diffraction extended no further than 35 Aresolution (d) from the cryocooled crystal despite it being a larger size. In situ data collection allowsa much more accurate assessment of crystallization conditions during the process of crystallizationoptimization.
electronic reprint

diffraction images in Figs. 5(b) and 5(d) show that despite their
smaller size, diffraction from in situ crystals extends further (9
versus 36 A) with a lower mosaic spread. In this example, the
improved diffraction results allowed differences to be resolved
in the quality of crystals from the different conditions, whereas
all crystals yielded a similar diffraction limit of around 36 A at
100 K. The information from the in situ analysis was used to
select the most promising conditions for further optimization.
3.3. Membrane-protein crystal screening
Results from the three examples taken from the MPL
membrane-protein crystallization optimization program are
shown in Fig. 6. In each case, in situ diffraction screening
facilitated a significant saving of time and manual effort by
avoiding manual handling. Additionally, more samples could
be tested in situ since typically only one crystal could be
removed from each drop before any remaining crystals melted.
In Fig. 6(a) the crystal is in an LCP-specific plate which would
require the breaking of a glass cover slip for the crystal to
be mounted in a loop. The associated diffraction image in
Fig. 6(d), despite attenuation from the glass cover slip,
confirms that the crystal is protein and allows a unit-cell
dimension to be measured. In Fig. 6(b), despite the refractive
effects of a curved bottomed plate, following crystal location
using the grid scan diffraction could be measured to 9.5 A
resolution. In Fig. 6(c), crystals contained in Greiner Crystal-
Quick X plates and with a largest dimension of <20 mm
demonstrated diffraction to 10 A resolution. In both Figs. 6(e)
and 6(f) the extent of measurable diffraction allowed a rapid
ranking of different crystallization conditions.
3.4. Structure solution from high-throughput pipeline initialcrystal hits
For Fc�RIIIA, data from all diffraction wedges were merged
using the CCP4 program POINTLESS (Evans, 2011). Owing
to the short lifetime of each crystal, a robust strategy capable
of producing a final data set of acceptable quality and
completeness was devised (Fig. 7). SCALA (Evans, 2006) was
run iteratively until an optimized data set was obtained. In
early iterations the scale factors had to be fixed to allow
all weak data to be included. Outlier images (those with the
largest batch Rmerge) were successively excluded. After 6–8
cycles the data could be scaled using default parameters. After
18 (7040 polymorph) and 12 (7041 polymorph) iterations the
metrics I/�(I) and Rmeas showed only minor improvement
as further images were excluded from scaling, while the
completeness began to fall. An optimal data set was chosen
based on comparison of I/�(I), Rmeas and completeness. As a
research papers
598 Axford et al. � In situ crystallography using microbeams Acta Cryst. (2012). D68, 592–600
Figure 6On-axis microscope images of crystal hits and in situ diffraction patterns from three example membrane proteins. (a, d) A G-protein-coupled receptorprotein crystallized in lipid cubic phase. (b, e) A complex of two domains of a bacterial membrane protein (the apparent misalignment of the beam centreand crystal in this case is a consequence of large refraction effects induced by the use of curved bottomed wells). (c, f) A bacterial membrane-anchorcytochrome protein. In (a), (b) and (c) the square box and cross-hair represent the beam size and position, respectively. In each case the size was 10 �10 mm.
electronic reprint

rule of thumb and a basis for automating this process we
anticipate removing a certain percentage of images per cycle
until the proportionate decrease in completeness exceeds
the proportionate decrease in Rmeas. However, formalizing
thresholds for these statistical measures will need to be
appropriate for the aim of the experiment. The optimized data
set was then used for molecular replacement with MOLREP
(Vagin & Teplyakov, 2010) using the 3.2 A resolution crystal
structure of the human IgG1 Fc fragment–Fc� receptor III
complex (PDB entry 1e4j; Sondermann et al., 2000) as a search
model. The solution was refined using REFMAC (Murshudov
et al., 2011), PHENIX (Adams et al., 2010) and Coot (Emsley
et al., 2010). The resulting electron density was easily inter-
pretable (Supplementary Fig. S3). Scaling and refinement
statistics are given in Table 2.
4. Discussion
The ability to obtain information on the diffraction quality of
crystallization hits in situ has proved particularly valuable
in overcoming the challenges of membrane-protein crystal-
lization and cocrystallizations to produce complexes, in which
the effective search space for optimum conditions is greatly
increased with each additional component. Indeed, in situ
characterization is now a routine part of the optimization
pipeline for the MPL, with regular access on a roughly monthly
basis subject to the operations schedule as part of the beam-
line user time. To date, it has been applied to over a dozen
MPL projects. This method of data collection typically allows
the experimenter to record improved diffraction data, reduces
the risk of false negatives, enables a faster progression of
crystallization optimization and eliminates crystal manipula-
tion. What the early experiments have shown strikingly is that
in addition to this role in screening crystallization hits, in situ
data collection can yield data sets of high quality and may
offer an attractive path to routine structure determination for
certain potentially challenging structures.
By eliminating crystal handling, plate-based data collection
allows modern synchrotron beamlines to take advantage of
the inherently low mosaic spread of many virus crystals and
provides a safe platform for the analysis of pathogenic parti-
cles. The current generation of purpose-designed crystal-
lization plates (such as the Greiner CrystalQuick X and the
DC version of Fluidigm chips) allow data to be collected with
modest background and good signal to noise. The net result is
that even at this early stage of development (where there is
still great scope for improvement) it is possible to routinely
collect sufficient data to solve a virus structure at room
temperature and at high resolution from crystals of 50 mm or
less in size from a single 96-well plate with a few hours of
beamtime, as demonstrated by the experiment recorded in
Table 1. The method described here is now in routine use and
has led to over a dozen virus structures (data not shown) from
crystals belonging to rhombohedral, cubic and orthorhombic
space groups.
In the case of Fc�RIIIA, using a relatively simple iterative
scaling strategy it was possible to merge weak diffraction data
from a large number of small data sets of less than 4� each.
This protocol is quite different to current practice for
macromolecular crystallography, in which single crystals are
normally removed manually from the crystallization drop and
(either before or after removal from the drop) cryoprotected
before cooling to 100 K. Advantages of the in situ protocol
are as follows. Firstly, it becomes possible to complete high-
throughput gene-to-structure pipelines with automated
diffraction data collection, circumventing the, as yet, almost
exclusively manual crystal-mounting stage. Secondly, the
method of merging many thin wedges of weak data has direct
applications in several challenging situations, including micro-
crystallography, where the expected lifetime of a crystal can be
less than ten images even at 100 K (Evans et al., 2011), forcing
experimenters to merge data from an increasingly large
number of crystals for structure solution (see, for example, Ji
et al., 2012).
Subsequent to the iterative scaling step for 7040 and 7041,
structure solution and refinement progressed as normal. The
large attrition rate for images (<20% contributing to the final
merged data sets) can be attributed in part to the refractive
effect described in x2.2, which was still being characterized
during this experiment. Images obtained with the crystal
partially out of the beam were discarded during these steps.
research papers
Acta Cryst. (2012). D68, 592–600 Axford et al. � In situ crystallography using microbeams 599
Figure 7Strategy used for obtaining a data set from a large number of thin wedges(0.5–1.5�) of diffraction data.
Table 2Scaling and refinement statistics for the 7040 and 7041 polymorphs ofFc�RIIIA.
Values in parentheses are for the outermost resolution shell.
7040 7041
Space group P6122 P6122Unit-cell parameters (A) a = b = 65.34,
c = 178.31a = b = 60.6,c = 213.8
No. of crystals used 44 72Resolution range (A) 57–2.4 (2.53–2.40) 57–2.4 (2.53–2.40)Initial No. of images integrated 527 514No. of images forming final data set 87 97No. of scaling cycles required 18 12hI/�(I)i 5.3 (1.9) 4.7 (1.6)Rmerge 0.180 (0.783) 0.231 (0.878)Rmeas 0.201 (0.870) 0.256 (0.970)Completeness (%) 95.5 (97.0) 98.3 (99.0)No. of unique observations 8941 (1290) 9613 (1362)Multiplicity 4.6 (4.8) 5.1 (5.4)
electronic reprint

Although the scaling statistics are inferior to those expected
from single crystals at 100 K, the electron density was readily
interpretable and novel features such as bound N-acetyl-
d-glucosamine could be easily observed.
4.1. General outlook
The introduction of tray hotels at beamlines such as I24,
coupled with the availability of dedicated tray-capable gonio-
meters, will make high-throughput diffraction screening of
microcrystals a reality. Furthermore, it is clear from our initial
results that advances in automated data processing will make
the analysis of diffraction data from such crystals a routine
crystallographic method, enabling not only crystal character-
ization but also structure solution from crystals held in trays
at room temperature. These hardware and software develop-
ments are essential if what is currently a niche method, used
by a small but growing number of groups, is to be transformed
into one which is widely used.
The ongoing development of crystallization plates is also
key to the development of in situ MX. While the simplest
approach to reducing the scatter of plates is to make wells of
ever thinner materials, the choice of material is also important
if scatter in the resolution ranges of interest is to be mini-
mized. For weakly diffracting samples even the scattering
power of the sealing tape should be considered for optimal
measurements. Well shape is also important: a curved well
base may be preferable for liquid handling, but it introduces
unwanted refraction effects making crystal alignment difficult.
In addition to the established issues of microcrystal sample
centring, there is an immediate need for specific software tools
to aid data collection in situ. For example, to achieve efficient
thoughput, a robust method to feed positional coordinates
of crystals recorded from laboratory crystallization systems
directly into the beamline goniometer position would greatly
speed up sample location and centring for data collection and
could even lead to a completely automated system. When
collecting data from multiple samples within one drop it is
essential to be able to efficiently track which crystals and
which subvolumes of larger samples have been exposed (at
least in the case of samples not suffering visible radiation
damage). Additionally, the automation of data integration and
merging for multi-crystal data collection will save the experi-
menter considerable time. Indeed, near-real-time assessments
of the data quality and completeness will provide quantitative
feedback on when to conclude a data collection and move on
to the next project.
We would like to thank Professor D. Rowlands (University
of Leeds) for providing samples of BEV2, Dr Richard
Treisman and Dr Anastasia Mylona (Cancer Research UK),
Dr Margarida Archer, Dr Miguell Pessanha and Mr
Przemyslaw Nogly (IQTB, Portugal) and Dr Mark Brooks and
Dr John Barker (Evotec) for providing the samples to the
MPL. The MPL is supported by Wellcome Trust grant No.
062164/Z/00/Z. OPPF-UK is supported by the MRC and
BBSRC. DIS, EEF, TSW, KH and GS are supported by the
MRC. AM and JR are supported by Arthritis Research UK
grants 13569 and 18066 and the National Institute for Health
Research. AK and JR are supported by the Wellcome Trust.
Development work in Oxford was supported by P-CUBE, EU
grant No. 227764.
References
Adams, P. D. et al. (2010). Acta Cryst. D66, 213–221.Aishima, J., Owen, R. L., Axford, D., Shepherd, E., Winter, G., Levik,
K., Gibbons, P., Ashton, A. & Evans, G. (2010). Acta Cryst. D66,1032–1035.
Bingel-Erlenmeyer, R., Olieric, V., Grimshaw, J. P. A., Gabadinho, J.,Wang, X., Ebner, S. G., Isenegger, A., Schneider, R., Schneider, J.,Glettig, W., Pradervand, C., Panepucci, E. H., Tomizaki, T., Wang,M. & Schulze-Briese, C. (2011). Cryst. Growth Des. 11, 916–923.
Brunger, A. T., Adams, P. D., Clore, G. M., DeLano, W. L., Gros, P.,Grosse-Kunstleve, R. W., Jiang, J.-S., Kuszewski, J., Nilges, M.,Pannu, N. S., Read, R. J., Rice, L. M., Simonson, T. & Warren, G. L.(1998). Acta Cryst. D54, 905–921.
Cockburn, J. J. B., Bamford, J. K. H., Grimes, J. M., Bamford, D. H. &Stuart, D. I. (2003). Acta Cryst. D59, 538–540.
Daniel, E., Lin, B., Diprose, J. M., Griffiths, S. L., Morris, C., Berry,I. M., Owens, R. J., Blake, R., Wilson, K. S., Stuart, D. I. & Esnouf,R. M. (2011). J. Struct. Biol. 175, 230–235.
Emsley, P., Lohkamp, B., Scott, W. G. & Cowtan, K. (2010). ActaCryst. D66, 486–501.
Evans, P. (2006). Acta Cryst. D62, 72–82.Evans, P. R. (2011). Acta Cryst. D67, 282–292.Evans, G., Axford, D., Waterman, D. & Owen, R. L. (2011).Crystallogr. Rev. 17, 105–142.
Fry, E., Acharya, R. & Stuart, D. (1993). Acta Cryst. A49, 45–55.Geerlof, A. et al. (2006). Acta Cryst. D62, 1125–1136.Jacquamet, L., Ohana, J., Joly, J., Borel, F., Pirocchi, M., Charrault, P.,
Bertoni, A., Israel-Gouy, P., Carpentier, P., Kozielski, F., Blot, D. &Ferrer, J.-L. (2004). Structure, 12, 1219–1225.
Ji, X., Sutton, G., Evans, G., Axford, D., Owen, R. & Stuart, D. I.(2010). EMBO J. 29, 505–514.
Ji, X., Sutton, G., Evans, G., Axford, D., Owen, R. L. & Stuart, D.(2012). In preparation.
Kabsch, W. (2010). Acta Cryst. D66, 125–132.Kisselman, G., Qiu, W., Romanov, V., Thompson, C. M., Lam, R.,
Battaile, K. P., Pai, E. F. & Chirgadze, N. Y. (2011). Acta Cryst. D67,533–539.
Maire, A. le, Gelin, M., Pochet, S., Hoh, F., Pirocchi, M., Guichou,J.-F., Ferrer, J.-L. & Labesse, G. (2011). Acta Cryst. D67, 747–755.
Murshudov, G. N., Skubak, P., Lebedev, A. A., Pannu, N. S., Steiner,R. A., Nicholls, R. A., Winn, M. D., Long, F. & Vagin, A. A. (2011).Acta Cryst. D67, 355–367.
Ravetch, J. V. & Perussia, B. (1989). J. Exp. Med. 170, 481–497.Santarsiero, B. D., Yegian, D. T., Lee, C. C., Spraggon, G., Gu, J.,
Scheibe, D., Uber, D. C., Cornell, E. W., Nordmeyer, R. A., Kolbe,W. F., Jin, J., Jones, A. L., Jaklevic, J. M., Schultz, P. G. & Stevens,R. C. (2002). J. Appl. Cryst. 35, 278–281.
Smyth, M., Tate, J., Hoey, E., Lyons, C., Martin, S. & Stuart, D. (1995).Nature Struct. Biol. 2, 224–231.
Soliman, A. S. M., Warkentin, M., Apker, B. & Thorne, R. E. (2011).Acta Cryst. D67, 646–656.
Sondermann, P., Huber, R., Oosthuizen, V. & Jacob, U. (2000). Nature(London), 406, 267–273.
Song, J., Mathew, D., Jacob, S. A., Corbett, L., Moorhead, P. & Soltis,S. M. (2007). J. Synchrotron Rad. 14, 191–195.
Southworth-Davies, R. J., Medina, M., Carmichel, I. & Garman, E.(2008). Structure, 12, 1531–1541.
Vagin, A. & Teplyakov, A. (2010). Acta Cryst. D66, 22–25.Walter, T. S. et al. (2005). Acta Cryst. D61, 651–657.
research papers
600 Axford et al. � In situ crystallography using microbeams Acta Cryst. (2012). D68, 592–600
electronic reprint