diffraction cartography: applying microbeams to macromolecular crystallography sample evaluation and...
TRANSCRIPT
electronic reprintActa Crystallographica Section D
BiologicalCrystallography
ISSN 0907-4449
Editors: E. N. Baker and Z. Dauter
Diffraction cartography: applying microbeams tomacromolecular crystallography sample evaluation and datacollection
Matthew W. Bowler, Matias Guijarro, Sebastien Petitdemange, IsabelBaker, Olof Svensson, Manfred Burghammer, ChristophMueller-Dieckmann, Elspeth J. Gordon, David Flot, Sean M. McSweeneyand Gordon A. Leonard
Acta Cryst. (2010). D66, 855–864
Copyright c© International Union of Crystallography
Author(s) of this paper may load this reprint on their own web site or institutional repository provided thatthis cover page is retained. Republication of this article or its storage in electronic databases other than asspecified above is not permitted without prior permission in writing from the IUCr.
For further information see http://journals.iucr.org/services/authorrights.html
Acta Crystallographica Section D: Biological Crystallography welcomes the submission ofpapers covering any aspect of structural biology, with a particular emphasis on the struc-tures of biological macromolecules and the methods used to determine them. Reportson new protein structures are particularly encouraged, as are structure–function papersthat could include crystallographic binding studies, or structural analysis of mutants orother modified forms of a known protein structure. The key criterion is that such papersshould present new insights into biology, chemistry or structure. Papers on crystallo-graphic methods should be oriented towards biological crystallography, and may includenew approaches to any aspect of structure determination or analysis.
Crystallography Journals Online is available from journals.iucr.org
Acta Cryst. (2010). D66, 855–864 Bowler et al. · Diffraction cartography

research papers
Acta Cryst. (2010). D66, 855–864 doi:10.1107/S0907444910019591 855
Acta Crystallographica Section D
BiologicalCrystallography
ISSN 0907-4449
Diffraction cartography: applying microbeams tomacromolecular crystallography sample evaluationand data collection
Matthew W. Bowler,a* Matias
Guijarro,a Sebastien
Petitdemange,b Isabel Baker,a,c
Olof Svensson,a Manfred
Burghammer,b Christoph
Mueller-Dieckmann,a Elspeth J.
Gordon,a David Flot,a Sean M.
McSweeneya and Gordon A.
Leonarda
aStructural Biology Group, European
Synchrotron Radiation Facility, 6 Rue Jules
Horowitz, F-38043 Grenoble, France, bStructure
of Soft Matter Group, European Synchrotron
Radiation Facility, 6 Rue Jules Horowitz,
F-38043 Grenoble, France, and cDepartment of
Biology and Biochemistry, University of Bath,
Claverton Down, Bath BA2 7AY, England
Correspondence e-mail: [email protected]
# 2010 International Union of Crystallography
Printed in Singapore – all rights reserved
Crystals of biological macromolecules often exhibit consider-
able inter-crystal and intra-crystal variation in diffraction
quality. This requires the evaluation of many samples prior to
data collection, a practice that is already widespread in
macromolecular crystallography. As structural biologists move
towards tackling ever more ambitious projects, new auto-
mated methods of sample evaluation will become crucial to
the success of many projects, as will the availability of
synchrotron-based facilities optimized for high-throughput
evaluation of the diffraction characteristics of samples. Here,
two examples of the types of advanced sample evaluation that
will be required are presented: searching within a sample-
containing loop for microcrystals using an X-ray beam of 5 mmdiameter and selecting the most ordered regions of relatively
large crystals using X-ray beams of 5–50 mm in diameter. A
graphical user interface developed to assist with these
screening methods is also presented. For the case in which
the diffraction quality of a relatively large crystal is
probed using a microbeam, the usefulness and implications
of mapping diffraction-quality heterogeneity (diffraction
cartography) are discussed. The implementation of these
techniques in the context of planned upgrades to the ESRF’s
structural biology beamlines is also presented.
Received 9 March 2010
Accepted 25 May 2010
1. Introduction
It is very common for crystals of biological macromolecules,
even when obtained under apparently identical conditions, to
show variation in the quality of their diffraction. This variation
is almost certainly the result of the intrinsic physical properties
of the systems being studied. The molecules involved are often
flexible, leading to conformational heterogeneity. In the case
of complexes of several proteins there is also the possibility of
compositional heterogeneity, in which some complexes within
the crystal have lost components (see, for example, Cramer et
al., 2000; Wimberly et al., 2000). Moreover, as crystals of
biological macromolecules are often mechanically fragile and
therefore susceptible to damage during transfer (from crys-
tallization trays to sample holders) or essential cryoprotection
steps, diffraction quality can vary within a crystal. This is
especially evident when diffraction is probed with a micro-
metre X-ray beam (Cusack et al., 1998; Higuchi et al., 1996;
Sanishvili et al., 2008). It is therefore not uncommon that
a large number of samples, often thousands, have to be
electronic reprint

evaluated to find the crystals, or regions of crystals, with the
diffraction properties required to answer the biological
question being asked. To increase the chances of a successful
outcome of a diffraction data-collection experiment, particu-
larly in the study of more problematic systems, sample
evaluation (Leslie et al., 2002) has become widespread and
automated in macromolecular crystallography (MX; Arzt et
al., 2005; Zhang et al., 2006; Okazaki et al., 2008; Snell et al.,
2004; Soltis et al., 2008; McPhillips et al., 2002). Indeed, the
automation of beam delivery (Nurizzo et al., 2006; Gabadinho
et al., 2010; McPhillips et al., 2002), sample mounting (Cipriani
et al., 2006; Ohana et al., 2004; Snell et al., 2004), crystal
centring in the X-ray beam (Lavault et al., 2006; Pothineni et
al., 2006) and sample evaluation and ranking (Incardona et al.,
2009; Leslie et al., 2002; Popov & Bourenkov, 2003) has
allowed the evaluation of numbers of samples that were
unimaginable only five years ago and has led to a fundamental
change in the way that structural biology beamlines are used.
At the ESRF, a dramatic increase in the number of samples
that are tested for diffraction quality before any complete data
collections are carried out has been observed (Fig. 1). More-
over, the success of many high-profile projects has been
dependent on the evaluation of many thousands of samples
before data sets are collected (Selmer et al., 2006; Warne et al.,
2008; Ben-Shem et al., 2003; Sibanda et al., 2010) and access to
highly automated high-throughput evaluation facilities, with
the additional possibility of then transferring the best crystals
to another beamline optimized for data collection, will
become an increasingly important element for success in
structural biology. This implies the need for increasingly
sophisticated hardware and software to evaluate, track, sort
and redistribute samples and will rely heavily on develop-
ments to be made to databases such as ISPyB (Beteva et al.,
2006), sample-handling robots and evaluation software such as
EDNA (Incardona et al., 2009).
As sample evaluation, automation and microbeams have
become more widely available, more advanced screening
methods have evolved. These include locating the best region
of a crystal on which to perform data collection (Higuchi et al.,
1996; Sanishvili et al., 2008), locating and evaluating the
diffraction properties of crystals in crystallization drops
(Jacquamet et al., 2004, 2009) and locating and evaluating the
diffraction properties of very small crystals contained in large
sample mounts (Cherezov et al., 2009). These types of sample
evaluation are already performed empirically by many crys-
tallographers. However, at the ESRF we seek to formalize and
automate these procedures, as we have done for other
processes in MX experiments, and thus allow them to become
routine. To achieve this goal requires the combination of
current ‘line’ and ‘mesh’ scans (see Song et al., 2007) with
diffraction-quality characterization and experiment planning
(Incardona et al., 2009; Leslie et al., 2002; Popov & Bourenkov,
2003) and ‘playback’ centring. Significant modifications to
current sample-evaluation pipelines and to information-
research papers
856 Bowler et al. � Diffraction cartography Acta Cryst. (2010). D66, 855–864
Figure 1MX sample evaluation and data collection at the ESRF (data harvested from the ISPyB database). (a) The total numbers of collections, screenings anddata sets are shown in the bar chart. The percentage of samples from which data were eventually collected is shown as a black line. An increase in thenumber of evaluations and a decrease in the percentage of samples from which data were collected is observed upon the introduction of the SC3 andMXCuBE (2005). (b) Beamlines ID14-1, ID14-2 and ID14-3 (ID14-3 was recommissioned as a bio-SAXS beamline at the end of 2007; therefore,statistics for 2008 and 2009 are for ID14-1 and ID14-2 only). These beamlines are heavily used for sample evaluation. The percentage of samples fromwhich full data sets are collected has fallen steadily to 10% in 2009 (screens are defined as �4 images and a data set is defined as �30 images).
electronic reprint
management systems such as ISPyB (Beteva et al., 2006) will
also be required. Such modifications will form a central part of
the developments to be made during the forthcoming upgrade
of the ESRF’s MX facilities (http://go.esrf.eu/Upgrade), in
particular the provision of a set of beamlines optimized for
high-throughput automated sample evaluation: the Massively
Automated Sample Selection Integrated Facility (MASSIF).
Here, we describe significant advances in the automation of
two of the techniques referred to above: locating and identi-
fying microcrystals within a large loop and locating the best
part of a large crystal on which to collect diffraction data.
Building on the developments made at the ESRF microfocus
beamline ID13 (Cusack et al., 1998; Moukhametzianov et al.,
2008; Riekel et al., 2005), software
developed to assist in these types of
screening is presented.
2. Experimental procedures andresults
2.1. Lilliput: finding and identifying
microcrystals in an opaque glass
For many projects, particularly those
initially producing microcrystals, rapid
identification of crystallization condi-
tions that yield protein crystals is a
considerable advantage. However,
locating microcrystals within a much
larger loop is problematic. Here, we
describe the use of a mesh scan to locate
and evaluate microcystals of E. coliATP
synthase.
2.1.1. Crystallization and prepara-tion. The unc� strain of Escherichia coli
DK8, bearing the plasmid pFV2
containing a cysteine-less ATP synthase,
was kindly provided by Professor
Stephen Vik (Department of Biological
Sciences, Southern Methodist Univer-
sity, Dallas, USA). ATP synthase was
expressed and purified by nickel-affinity
chromatography as described pre-
viously (Ishmukhametov et al., 2005).
The protein was concentrated to
10 mg ml�1 and set up in sitting-drop
crystallization trays. Crystals (10 mm in
the largest dimension) appeared after
one week (Fig. 2a); full experimental
details will be described elsewhere. As
the crystals were too small to allow
normal handling, they were therefore
cryocooled directly from the mother
liquor and were not explicitly cryopro-
tected. To harvest crystals, the crystal-
lization drops were swept with
micromeshes (MiTeGen, Ithica, New
York, USA), which were then plunged into liquid nitrogen and
stored at 100 K. This procedure produced an opaque glass
containing several microcrystals (Figs. 2b and 3a).
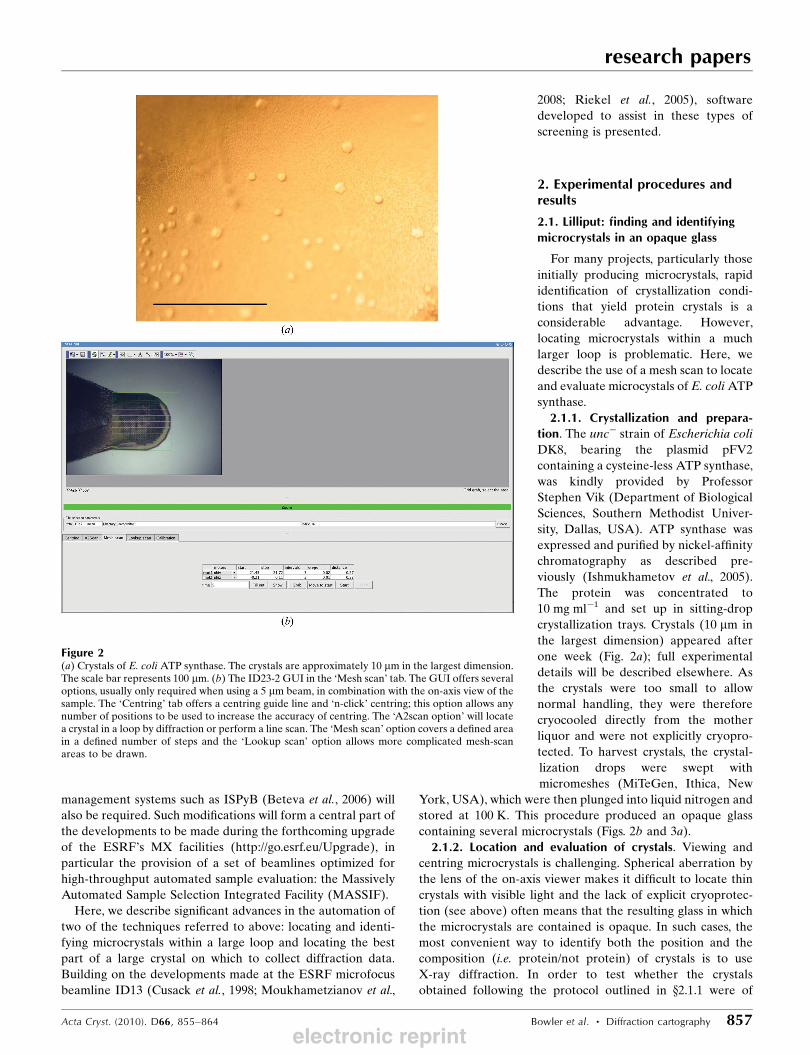
2.1.2. Location and evaluation of crystals. Viewing and
centring microcrystals is challenging. Spherical aberration by
the lens of the on-axis viewer makes it difficult to locate thin
crystals with visible light and the lack of explicit cryoprotec-
tion (see above) often means that the resulting glass in which
the microcrystals are contained is opaque. In such cases, the
most convenient way to identify both the position and the
composition (i.e. protein/not protein) of crystals is to use
X-ray diffraction. In order to test whether the crystals
obtained following the protocol outlined in x2.1.1 were of
research papers
Acta Cryst. (2010). D66, 855–864 Bowler et al. � Diffraction cartography 857
Figure 2(a) Crystals of E. coliATP synthase. The crystals are approximately 10 mm in the largest dimension.The scale bar represents 100 mm. (b) The ID23-2 GUI in the ‘Mesh scan’ tab. The GUI offers severaloptions, usually only required when using a 5 mm beam, in combination with the on-axis view of thesample. The ‘Centring’ tab offers a centring guide line and ‘n-click’ centring; this option allows anynumber of positions to be used to increase the accuracy of centring. The ‘A2scan option’ will locatea crystal in a loop by diffraction or perform a line scan. The ‘Mesh scan’ option covers a defined areain a defined number of steps and the ‘Lookup scan’ option allows more complicated mesh-scanareas to be drawn.
electronic reprint

protein or not, still diffraction images were collected at each
point on a user-defined grid, taking advantage of the mesh-
scan capability (dmesh) available in the low-level beamline-
control software SPEC (Certified Scientific Software; http://
www.certif.com). The scan was carried out on ESRF beamline
ID23-2 (Flot et al., 2010) using an X-ray beam of dimensions 7
� 5 mm. A graphical user interface (GUI) has been imple-
mented to make this process user-friendly (Fig. 2b). In the
sample-display area of the GUI, the limits of the grid are
drawn using the mouse and a step size for sampling the grid is
chosen. In the software each position in the grid is associated
with a specific coordinate [expressed as the position of the
motors phiz (vertical translation of the goniometer axis) and
phiy (horizontal translation)] so that once a crystal has been
located the position can easily be returned to. As a large
number of crystals were present in the loop and to limit data-
collection time, a rough scan using a step size of 40 mm was
chosen for this experiment. After the scan was completed,
approximately 100 images for each loop had been collected.
Diffraction spots indicating that the samples were protein and
that at least one crystallization condition was worth pursuing
were observed in four of the images taken from one loop
(Fig. 3).
2.2. Brobdingnag: diffraction cartography of large crystals
At modern synchrotron sources crystallographers are often
provided with a beam that is smaller than the largest dimen-
sion of the crystal. This presents the problem of finding the
best position within the crystal to centre to the X-ray beam.
Here, we describe the use of a mesh scan combined with
online data analysis and the intuitive presentation of the data
to systematically define the most ordered part of a crystal.
2.2.1. Test-crystal preparation. Crystals of bovine mito-
chondrial F1-ATPase, grown as described previously (Lutter et
al., 1993) with the exception that azide was omitted from all
buffers, were kindly provided by Mr Martin Montgomery and
Professor Sir John Walker (MRCMitochondrial Biology Unit,
Cambridge, England). Several of these crystals with approx-
imate dimensions of 500 � 400 � 50 mm were mounted on
micromesh loops (MiTeGen, Ithica, New York, USA) and
conditioned with the HC1b humidity-control device (Sanchez-
Weatherby et al., 2009) mounted on ESRF beamline ID14-2,
using conditions previously established for maximum
improvement in crystal diffraction properties (Bowler et al.,
2006b). Crystals were cryocooled directly after conditioning
without any cryoprotectant.
Crystals of thermolysin were grown according to estab-
lished protocols (Mueller-Dieckmann et al., 2005). Briefly,
B. thermoproteolyticus thermolysin (Sigma, St Louis, USA)
was dissolved in 50 mM MES pH 6.0 and 45% DMSO and
adjusted to a concentration of 50 mg ml�1. This solution was
then mixed in a 1:1 ratio with a solution consisting of 50 mM
MES pH 6.0, 1 M NaCl and 45% DMSO and equilibrated
against a reservoir buffer consisting of 35% saturated
ammonium sulfate in hanging drops. Large crystals appeared
after a few days and were cryoprotected in paraffin oil.
Crystals of �1-andregenic G-protein-coupled receptor from
turkey, prepared as described by Warne et al. (2008), were
kindly provided by Dr Tony Warne and Dr Chris Tate (MRC
Laboratory of Molecular Biology, Cambridge, England).
2.2.2. Intra-crystal diffraction heterogeneity of a crystal of
bovine mitochondrial F1-ATPase. Crystals of bovine mito-
chondrial F1-ATPase tend to diffract rather weakly (dmin ’3 A) and demonstrate considerable variation in the quality of
their diffraction. Conditioning these crystals by controlled
dehydration reduces the unit-cell volume by 20% and signif-
research papers
858 Bowler et al. � Diffraction cartography Acta Cryst. (2010). D66, 855–864
Figure 3Locating and evaluating 10 mm crystals in an opaque solution. (a) A grid screen was implemented in the ID23-2 GUI and diffraction images wereobtained for each position. (b) One of four images that demonstrated weak diffraction, defining the location of crystals and indicating that the samplescontained protein.
electronic reprint
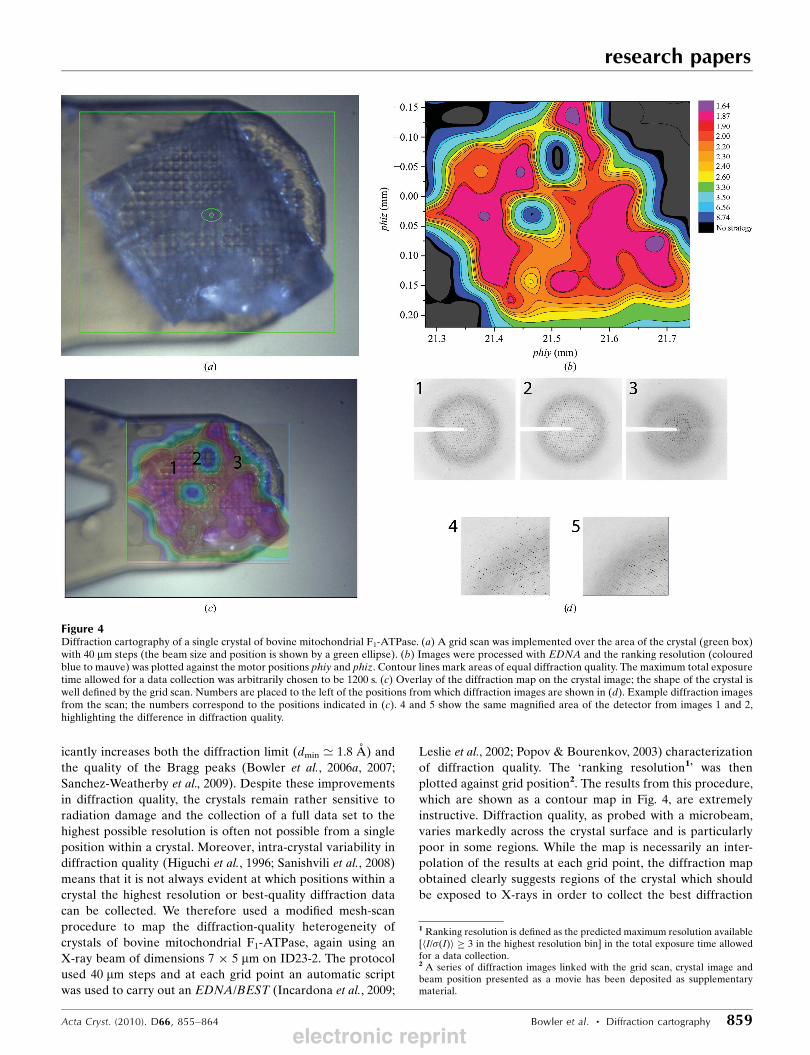
icantly increases both the diffraction limit (dmin ’ 1.8 A) and
the quality of the Bragg peaks (Bowler et al., 2006a, 2007;
Sanchez-Weatherby et al., 2009). Despite these improvements
in diffraction quality, the crystals remain rather sensitive to
radiation damage and the collection of a full data set to the
highest possible resolution is often not possible from a single
position within a crystal. Moreover, intra-crystal variability in
diffraction quality (Higuchi et al., 1996; Sanishvili et al., 2008)
means that it is not always evident at which positions within a
crystal the highest resolution or best-quality diffraction data
can be collected. We therefore used a modified mesh-scan
procedure to map the diffraction-quality heterogeneity of
crystals of bovine mitochondrial F1-ATPase, again using an
X-ray beam of dimensions 7 � 5 mm on ID23-2. The protocol
used 40 mm steps and at each grid point an automatic script
was used to carry out an EDNA/BEST (Incardona et al., 2009;
Leslie et al., 2002; Popov & Bourenkov, 2003) characterization
of diffraction quality. The ‘ranking resolution1’ was then
plotted against grid position2. The results from this procedure,
which are shown as a contour map in Fig. 4, are extremely
instructive. Diffraction quality, as probed with a microbeam,
varies markedly across the crystal surface and is particularly
poor in some regions. While the map is necessarily an inter-
polation of the results at each grid point, the diffraction map
obtained clearly suggests regions of the crystal which should
be exposed to X-rays in order to collect the best diffraction
research papers
Acta Cryst. (2010). D66, 855–864 Bowler et al. � Diffraction cartography 859
Figure 4Diffraction cartography of a single crystal of bovine mitochondrial F1-ATPase. (a) A grid scan was implemented over the area of the crystal (green box)with 40 mm steps (the beam size and position is shown by a green ellipse). (b) Images were processed with EDNA and the ranking resolution (colouredblue to mauve) was plotted against the motor positions phiy and phiz. Contour lines mark areas of equal diffraction quality. The maximum total exposuretime allowed for a data collection was arbitrarily chosen to be 1200 s. (c) Overlay of the diffraction map on the crystal image; the shape of the crystal iswell defined by the grid scan. Numbers are placed to the left of the positions from which diffraction images are shown in (d). Example diffraction imagesfrom the scan; the numbers correspond to the positions indicated in (c). 4 and 5 show the same magnified area of the detector from images 1 and 2,highlighting the difference in diffraction quality.
1 Ranking resolution is defined as the predicted maximum resolution available[hI/�(I)i � 3 in the highest resolution bin] in the total exposure time allowedfor a data collection.2 A series of diffraction images linked with the grid scan, crystal image andbeam position presented as a movie has been deposited as supplementarymaterial.
electronic reprint
data. It is interesting to note that the areas exhibiting the
highest ranking resolution also tend to share similar unit-cell
parameters (Fig. S13). The b and c unit-cell parameters vary
considerably across the crystal (probably owing to incomplete
phase transitions induced by dehydration) but are very similar
in highly ordered areas, regardless of their physical location.
While this does not necessarily indicate isomorphism between
different regions of the crystal, it does suggest that data could
be merged from the multiple sites of similar diffraction quality
to obtain a complete data set.
When developing the protocol described above, consider-
able thought was given as to the best criterion to use as an
indicator of diffraction quality. In the diffraction-based
centring protocol developed by Song et al. (2007), the number
of ‘good’ diffraction spots observed inside a limited resolution
range was used. In our experience, however, such a criterion
does not exclude positions in a crystal which exhibit multiple
lattices. We have thus chosen to execute a full EDNA/BEST
characterization of the diffraction quality at each grid point in
the scan and to use the ‘ranking resolution’ as the criterion for
ranking diffraction quality. While this approach is slower (�5 s
per image for a full characterization) than spot-finding-based
algorithms, such a strategy has a number of advantages:
regions in a crystal which exhibit multiple lattices result in a
failure at the autoindexing stage (as a result of too high an
r.m.s. deviation between calculated and observed spot posi-
tions); the resulting ‘diffraction-quality’ map allows the
ranking of different regions of the crystal and makes multi-
position data-collection strategies feasible; the maps also
highlight larger areas of similar diffraction quality which could
be used to determine a region of a crystal in which ‘helical’
data-collection protocols (Flot et al., 2010) could be most
usefully employed.
The diffraction-quality map shown in Fig. 4 was obtained in
only one orientation: with the smallest dimension of the
crystal perpendicular to the X-ray beam. While such a map
would be useful for planning data-collection strategies for
crystals with high-symmetry space groups, it is clear that for
crystals of lower symmetry the computation of diffraction-
quality maps in two mutually perpendicular orientations is
required. We therefore carried out mesh scans on a smaller
crystal of bovine F1-ATPase (�200 mm in the largest dimen-
sion) in two dimensions (Fig. 5). These scans used a 50 mmaperture on beamline ID29 with a 50 mm step size and were
therefore of a much lower spatial resolution than those
obtained using a smaller beam. The characterization of images
also included an exposure time limited by the maximum X-ray
dose calculated by RADDOSE (Paithankar et al., 2009).
Scanning a second dimension shows that the best position in
one dimension does not necessarily overlap with that in the
second.
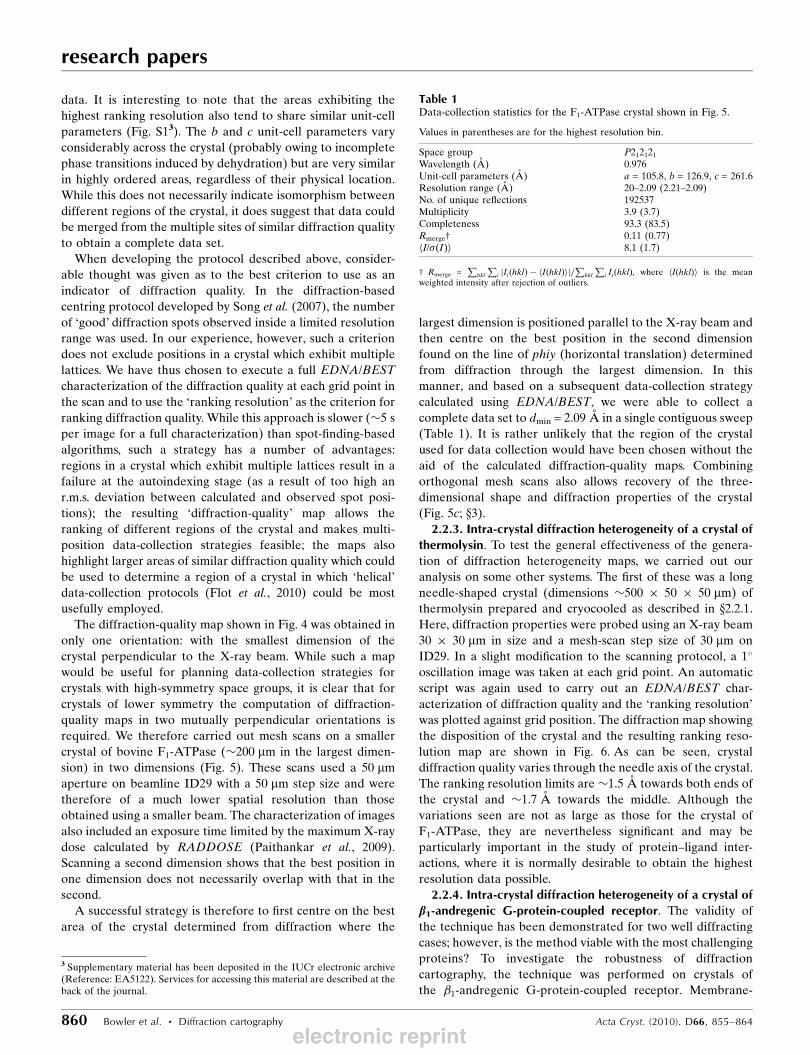
A successful strategy is therefore to first centre on the best
area of the crystal determined from diffraction where the
largest dimension is positioned parallel to the X-ray beam and
then centre on the best position in the second dimension
found on the line of phiy (horizontal translation) determined
from diffraction through the largest dimension. In this
manner, and based on a subsequent data-collection strategy
calculated using EDNA/BEST, we were able to collect a
complete data set to dmin = 2.09 A in a single contiguous sweep
(Table 1). It is rather unlikely that the region of the crystal
used for data collection would have been chosen without the
aid of the calculated diffraction-quality maps. Combining
orthogonal mesh scans also allows recovery of the three-
dimensional shape and diffraction properties of the crystal
(Fig. 5c; x3).2.2.3. Intra-crystal diffraction heterogeneity of a crystal of
thermolysin. To test the general effectiveness of the genera-
tion of diffraction heterogeneity maps, we carried out our
analysis on some other systems. The first of these was a long
needle-shaped crystal (dimensions �500 � 50 � 50 mm) of
thermolysin prepared and cryocooled as described in x2.2.1.Here, diffraction properties were probed using an X-ray beam
30 � 30 mm in size and a mesh-scan step size of 30 mm on
ID29. In a slight modification to the scanning protocol, a 1�
oscillation image was taken at each grid point. An automatic
script was again used to carry out an EDNA/BEST char-
acterization of diffraction quality and the ‘ranking resolution’
was plotted against grid position. The diffraction map showing
the disposition of the crystal and the resulting ranking reso-
lution map are shown in Fig. 6. As can be seen, crystal
diffraction quality varies through the needle axis of the crystal.
The ranking resolution limits are �1.5 A towards both ends of
the crystal and �1.7 A towards the middle. Although the
variations seen are not as large as those for the crystal of
F1-ATPase, they are nevertheless significant and may be
particularly important in the study of protein–ligand inter-
actions, where it is normally desirable to obtain the highest
resolution data possible.
2.2.4. Intra-crystal diffraction heterogeneity of a crystal of
b1-andregenic G-protein-coupled receptor. The validity of
the technique has been demonstrated for two well diffracting
cases; however, is the method viable with the most challenging
proteins? To investigate the robustness of diffraction
cartography, the technique was performed on crystals of
the �1-andregenic G-protein-coupled receptor. Membrane-
research papers
860 Bowler et al. � Diffraction cartography Acta Cryst. (2010). D66, 855–864
Table 1Data-collection statistics for the F1-ATPase crystal shown in Fig. 5.
Values in parentheses are for the highest resolution bin.
Space group P212121Wavelength (A) 0.976Unit-cell parameters (A) a = 105.8, b = 126.9, c = 261.6Resolution range (A) 20–2.09 (2.21–2.09)No. of unique reflections 192537Multiplicity 3.9 (3.7)Completeness 93.3 (83.5)Rmerge† 0.11 (0.77)hI/�(I)i 8.1 (1.7)
† Rmerge =P
hkl
Pi jIiðhklÞ � hIðhklÞij=Phkl
Pi IiðhklÞ, where hI(hkl)i is the mean
weighted intensity after rejection of outliers.
3 Supplementary material has been deposited in the IUCr electronic archive(Reference: EA5122). Services for accessing this material are described at theback of the journal.
electronic reprint

protein crystals usually have very weak interactions between
molecules and, coupled with the dynamic nature of G-protein-
coupled receptors, this leads to considerable variation
between and within crystals that diffract very poorly (Gether
et al., 1997; Warne et al., 2008). The crystals are thin plates with
approximate dimensions of 200 � 100 � 10 mm. A scan was
launched on a single crystal of �1-andregenic G-protein-
coupled receptor (Fig. 7a) using an X-ray beam 15 � 15 mmin size and a mesh-scan step size of 15 mm on ID29. The
diffraction patterns were analysed using EDNA/BEST;
however, the diffraction in most areas was very poor and to
low resolution. As BEST is unable to determine the B factor
from test images showing diffraction below 6 A resolution,
this led to a failure to calculate a ranking resolution in most
areas. Therefore, the mosaic spread was used to map crystal
order and shape (Figs. 7b and 7c). Again, the diffraction map
defines the shape of the crystal and considerable variation in
the quality of the diffraction was observed, with large areas in
which indexing was not possible. Nevertheless, strategies could
be calculated for four positions within the crystal with ranking
resolutions of 2.78, 6.26, 3.47 and 6.63 A, clearly identifying
the best area for data collection.
3. Discussion
Above, we present two means of exploiting the micro and mini
X-ray beams now routinely available to structural biologists at
synchrotron sources when combined with mesh-scanning
procedures. The first of these is the automatic location of
microcrystals in large loops. An increasingly important
requirement in MX is the identification of initial crystal-
lization hits. This identification procedure falls into two
research papers
Acta Cryst. (2010). D66, 855–864 Bowler et al. � Diffraction cartography 861
Figure 5Diffraction-quality maps calculated in two orthogonal orientations for a crystal of F1-ATPase. (a, b) The maps are superimposed on the crystal as seenfrom the point of view of the X-ray beam. Larger representations of the two maps obtained are also shown. For data collection the crystal was centred atthe two positions marked. EDNA/BEST characterization at each grid point was carried out with a total exposure time calculated using the programRADDOSE. (c) Combining the orthogonal maps allows recovery of the three-dimensional shape and diffraction properties of the crystal.
electronic reprint

categories: whether the objects are protein and which of the
conditions provides the best diffracting sample. The
pre-screening of microcrystals obtained from robotic crystal-
lization trials, either in loops or the crystallization drop itself,
will become more important in the future in order to feed
information back into crystallization experiments. The
combination of micrometre-sized beams and high levels of
automation will be essential to such crystal-identification
protocols.
The second technique we outline is the mapping of the
intra-crystal diffraction heterogeneity of large (relative to the
beam size) crystals; we call this diffraction cartography.
Microbeams are increasingly being exploited for larger crys-
tals to try to alleviate the fundamental problem of radiation
damage in MX as they allow the possibility of collecting
complete data sets by exposing multiple parts of the same
crystal or multiple crystals within the same loop. In cases
where diffraction quality varies significantly within the crystal
research papers
862 Bowler et al. � Diffraction cartography Acta Cryst. (2010). D66, 855–864
Figure 7Diffraction cartography of a crystal of �1-andregenic G-protein-coupledreceptor. A grid scan was implemented over the area of the crystal (a)with 15 mm steps and a diffraction map (b) was calculated as before butusing the mosaic spread values (black to red) rather than the rankingresolution. There is significant variation in the quality of the crystal, withlarge areas in the middle in which indexing failed. The map again definesthe location and shape of the crystal (c); a 15 mm red spot marks theposition with a ranking resolution of 2.78 A.
Figure 6Diffraction cartography of a crystal of thermolysin. A grid scan wasimplemented over the area of the crystal (green box) (a) with 30 mm stepsand a contour map was calculated as before (b). While the variation indiffraction is not as large as observed in F1-ATPase, there is neverthelesssignificant variation, particularly in the area in contact with the mount.The map also defines the location and shape of the crystal (c).
electronic reprint

they are also being used to pick out the ‘best’ part of a larger
crystal in order to improve the quality of the diffraction data
obtainable. However, while the evaluation of sample diffrac-
tion quality using software packages such as DNA/EDNA is
now routine, the use of such tools tends to be carried out on
(at most) a relatively small number of positions on any given
crystal and current methods of diffraction-quality screening
are not suited to a systematic analysis of the diffraction
landscape of a crystal or of a loop containing several micro-
crystals. Combining the use of microbeams with mesh scans
and diffraction-quality characterization software such asDNA
and EDNA allows diffraction landscapes to be calculated.
Analysis of these landscapes makes the choice of regions in a
large crystal from which to collect data no longer a matter of
chance as diffraction quality at hundreds of positions within a
crystal can be evaluated. The routine calculation of diffraction
landscapes should result in a more efficient use of synchrotron
beam time because complete data sets can be collated by
collecting from as few regions as possible to the highest
possible resolution from any given crystal. Faced with a crystal
larger than the X-ray beam, most crystallographers would
centre the middle of the crystal in the beam or at another
position that seems to be morphologically best suited. The
results from the examples presented here show that in many
cases this may not produce the best possible data set from the
sample.
The fast visualization of the diffraction-quality map of a
crystal increases the possibilities available concerning data
collection: a single grid point can be quickly selected for a
single-sweep data collection, a larger area of similar diffrac-
tion quality can be used in conjunction with ‘helical’ data-
collection protocols (Flot et al., 2010) to produce a data set
with minimized radiation damage and a full data set can be
collated from partial data sets collected at various previously
identified positions within a crystal. Work is under way to
incorporate both the ID23-2 GUI and software enabling the
online analysis of images and display of diffraction-quality
maps into MxCuBE (Gabadinho et al., 2010). The results of
the intra-crystal characterization, mesh-scan motor positions
and diffraction maps will be stored in ISPyB.
Diffraction cartography not only provides a useful map of
crystal quality but also (as is the case for diffraction-based
crystal-centring protocols; Song et al., 2007) defines the shape
of the crystal (Figs. 4, 5, 6 and 7). This can be useful in the
implementation of absorption-correction protocols. While
X-ray tomography (Brockhauser et al., 2008) and reconstruc-
tion of optical images (Leal et al., 2008) have also been used to
define crystal shape, these methods require time-consuming
rearrangements of the beamline, special detectors and/or
specialized reconstruction programs and do not provide
information regarding the diffraction characteristics of all or
a region of a crystal. Diffraction cartography provides infor-
mation on both the internal order and the physical shape of a
crystal in a single experiment using the hardware generally
available on a modern MX beamline. Clearly, the resolution of
the crystal shape recovered depends on both the beam and the
mesh-scan step size. Experiments are under way to determine
the usefulness of crystal-shape determination using mesh
scans in absorption-correction protocols.
Both of the methods we describe above represent new
advanced methods of sample evaluation. These methods, and
the sophisticated multisweep multicrystal data-collection
strategies that will in many cases result from these protocols,
will place much greater emphasis on the use of experimental
metadata. The challenges presented by advanced sample
evaluation to synchrotron hardware and software will be
tackled by the MASSIF project. These beamlines, proposed as
part of the ESRF Upgrade, will provide a set of highly auto-
mated beamlines optimized for high-throughput sample
evaluation and the types of advanced screening described
above. Three stations will directly address the fundamental
problem of inter-sample and intra-sample variability in
structural biology and will have different beam sizes: two
stations with a 100 mm beam diameter and one microbeam
station with a beam size 10–20 mm in diameter. Sample
handling and transfer will be based on a moving-arm robot
(Ohana et al., 2004) in order to increase the capacity,
throughput and types of compatible crystal mount (e.g. crys-
tallization trays) of the beamlines. The ‘outsourcing’ of sample
evaluation to these specialized beamlines will free time, of
both scientists and beamlines, to be spent on collecting better
quality data on beamlines optimized for specific requirements
such as low signal-to-noise anomalous scattering experiments,
large unit cells or microbeam MAD experiments.
After visiting Lilliput and Brobdingnag, Gulliver is rescued
by the Kingdom of Laputa, a land dedicated to the study of
science and the arts but completely unable to make practical
use of their developments. Here, we hope that the integration
of advanced screening techniques into the automated envir-
onment developed for MX experiments at the ESRF will allow
highly challenging experiments to become practical by making
these experiments routine rather than unusual.
The mesh scans and GUI described here were initially
developed as part of a Long Term Project at the ESRF
beamline ID13 awarded to Dr Christien Riekel (ESRF,
Grenoble, France) and Professor Gebhard Schertler (MRC-
LMB, Cambridge, UK) partly funded by a Human Frontiers
Science Program Award. We thank Professor Sir John Walker
and Mr Martin Montgomery (MRC Mitochondrial Biology
Unit, Cambridge, England) and Dr Tony Warne and Dr Chris
Tate (MRC Laboratory of Molecular Biology, Cambridge,
England) for the very generous supply of crystals. We also
thank Professor Stephen Vik (Southern Methodist University,
Dallas, USA) for the unc� strain of E. coli DK8 bearing the
plasmid pFV2 containing a cysteine-less ATP synthase.
References
Arzt, S. et al. (2005). Prog. Biophys. Mol. Biol. 89, 124–152.Ben-Shem, A., Frolow, F. & Nelson, N. (2003). Nature (London), 426,630–635.
Beteva, A. et al. (2006). Acta Cryst. D62, 1162–1169.Bowler, M. W., Montgomery, M. G., Leslie, A. G. W. & Walker, J. E.(2006a). Proc. Natl Acad. Sci. USA, 103, 8646–8649.
research papers
Acta Cryst. (2010). D66, 855–864 Bowler et al. � Diffraction cartography 863electronic reprint

Bowler, M. W., Montgomery, M. G., Leslie, A. G. W. & Walker, J. E.(2006b). Acta Cryst. D62, 991–995.
Bowler, M. W., Montgomery, M. G., Leslie, A. G. W. & Walker, J. E.(2007). J. Biol. Chem. 282, 14238–14242.
Brockhauser, S., Di Michiel, M., McGeehan, J. E., McCarthy, A. A. &Ravelli, R. B. G. (2008). J. Appl. Cryst. 41, 1057–1066.
Cherezov, V., Hanson, M. A., Griffith, M. T., Hilgart, M. C., Sanishvili,R., Nagarajan, V., Stepanov, S., Fischetti, R. F., Kuhn, P. & Stevens,R. C. (2009). J. R. Soc. Interface, 6, S587–S597.
Cipriani, F. et al. (2006). Acta Cryst. D62, 1251–1259.Cramer, P., Bushnell, D. A., Fu, J., Gnatt, A. L., Maier-Davis, B.,Thompson, N. E., Burgess, R. R., Edwards, A. M., David, P. R. &Kornberg, R. D. (2000). Science, 288, 640–649.
Cusack, S., Belrhali, H., Bram, A., Burghammer, M., Perrakis, A. &Riekel, C. (1998). Nature Struct. Biol. 5, 634–637.
Flot, D., Mairs, T., Giraud, T., Guijarro, M., Lesourd, M., Rey, V., vanBrussel, D., Morawe, C., Borel, C., Hignette, O., Chavanne, J.,Nurizzo, D., McSweeney, S. & Mitchell, E. (2010). J. SynchrotronRad. 17, 107–118.
Gabadinho, J. et al. (2010). J. Synchrotron Rad. 17, doi:10.1107/S0909049510020005.
Gether, U., Ballesteros, J. A., Seifert, R., Sanders-Bush, E., Weinstein,H. & Kobilka, B. K. (1997). J. Biol. Chem. 272, 2587–2590.
Higuchi, Y., Okamoto, T. & Yasuoka, N. (1996). J. Cryst. Growth, 168,99–105.
Incardona, M.-F., Bourenkov, G. P., Levik, K., Pieritz, R. A., Popov,A. N. & Svensson, O. (2009). J. Synchrotron Rad. 16, 872–879.
Ishmukhametov, R. R., Galkin, M. A. & Vik, S. B. (2005). Biochim.Biophys. Acta, 1706, 110–116.
Jacquamet, L., Joly, J., Bertoni, A., Charrault, P., Pirocchi, M.,Vernede, X., Bouis, F., Borel, F., Perin, J.-P., Denis, T., Rechatin,J.-L. & Ferrer, J.-L. (2009). J. Synchrotron Rad. 16, 14–21.
Jacquamet, L., Ohana, J., Joly, J., Borel, F., Pirocchi, M., Charrault, P.,Bertoni, A., Israel-Gouy, P., Carpentier, P., Kozielski, F., Blot, D. &Ferrer, J.-L. (2004). Structure, 12, 1219–1225.
Lavault, B., Ravelli, R. B. G. & Cipriani, F. (2006). Acta Cryst. D62,1348–1357.
Leal, R. M. F., Teixeira, S. C. M., Rey, V., Forsyth, V. T. & Mitchell,E. P. (2008). J. Appl. Cryst. 41, 729–737.
Leslie, A. G. W., Powell, H. R., Winter, G., Svensson, O., Spruce, D.,McSweeney, S., Love, D., Kinder, S., Duke, E. & Nave, C. (2002).Acta Cryst. D58, 1924–1928.
Lutter, R., Abrahams, J. P., van Raaij, M. J., Todd, R. J., Lundqvist, T.,Buchanan, S. K., Leslie, A. G. W. & Walker, J. E. (1993). J. Mol.Biol. 229, 787–790.
McPhillips, T. M., McPhillips, S. E., Chiu, H.-J., Cohen, A. E., Deacon,A. M., Ellis, P. J., Garman, E., Gonzalez, A., Sauter, N. K.,
Phizackerley, R. P., Soltis, S. M. & Kuhn, P. (2002). J. SynchrotronRad. 9, 401–406.
Moukhametzianov, R., Burghammer, M., Edwards, P. C., Petitde-mange, S., Popov, D., Fransen, M., McMullan, G., Schertler, G. F. X.& Riekel, C. (2008). Acta Cryst. D64, 158–166.
Mueller-Dieckmann, C., Panjikar, S., Tucker, P. A. & Weiss, M. S.(2005). Acta Cryst. D61, 1263–1272.
Nurizzo, D., Mairs, T., Guijarro, M., Rey, V., Meyer, J., Fajardo, P.,Chavanne, J., Biasci, J.-C., McSweeney, S. & Mitchell, E. (2006). J.Synchrotron Rad. 13, 227–238.
Ohana, J., Jacquamet, L., Joly, J., Bertoni, A., Taunier, P., Michel, L.,Charrault, P., Pirocchi, M., Carpentier, P., Borel, F., Kahn, R. &Ferrer, J.-L. (2004). J. Appl. Cryst. 37, 72–77.
Okazaki, N., Hasegawa, K., Ueno, G., Murakami, H., Kumasaka, T. &Yamamoto, M. (2008). J. Synchrotron Rad. 15, 288–291.
Paithankar, K. S., Owen, R. L. & Garman, E. F. (2009). J. SynchrotronRad. 16, 152–162.
Popov, A. N. & Bourenkov, G. P. (2003). Acta Cryst. D59, 1145–1153.Pothineni, S. B., Strutz, T. & Lamzin, V. S. (2006). Acta Cryst. D62,1358–1368.
Riekel, C., Burghammer, M. & Schertler, G. (2005). Curr. Opin.Struct. Biol. 15, 556–562.
Sanchez-Weatherby, J., Bowler, M. W., Huet, J., Gobbo, A., Felisaz, F.,Lavault, B., Moya, R., Kadlec, J., Ravelli, R. B. G. & Cipriani, F.(2009). Acta Cryst. D65, 1237–1246.
Sanishvili, R., Nagarajan, V., Yoder, D., Becker, M., Xu, S., Corcoran,S., Akey, D. L., Smith, J. L. & Fischetti, R. F. (2008). Acta Cryst.D64, 425–435.
Selmer, M., Dunham, C. M., Murphy, F. V. IV, Weixlbaumer, A., Petry,S., Kelley, A. C., Weir, J. R. & Ramakrishnan, V. (2006). Science,313, 1935–1942.
Sibanda, B. L., Chirgadze, D. Y. & Blundell, T. L. (2010). Nature(London), 463, 118–121.
Snell, G., Cork, C., Nordmeyer, R., Cornell, E., Meigs, G., Yegian, D.,Jaklevic, J., Jin, J., Stevens, R. C. & Earnest, T. (2004). Structure, 12,537–545.
Soltis, S. M. et al. (2008). Acta Cryst. D64, 1210–1221.Song, J., Mathew, D., Jacob, S. A., Corbett, L., Moorhead, P. & Soltis,S. M. (2007). J. Synchrotron Rad. 14, 191–195.
Warne, T., Serrano-Vega, M. J., Baker, J. G., Moukhametzianov, R.,Edwards, P. C., Henderson, R., Leslie, A. G. W., Tate, C. G. &Schertler, G. F. (2008). Nature (London), 454, 486–491.
Wimberly, B. T., Brodersen, D. E., Clemons, W. M. Jr, Morgan-Warren, R. J., Carter, A. P., Vonrhein, C., Hartsch, T. &Ramakrishnan, V. (2000). Nature (London), 407, 327–339.
Zhang, Z., Sauter, N. K., van den Bedem, H., Snell, G. & Deacon,A. M. (2006). J. Appl. Cryst. 39, 112–119.
research papers
864 Bowler et al. � Diffraction cartography Acta Cryst. (2010). D66, 855–864
electronic reprint