comprehensive bioinformatic analysis of kinesin classification
TRANSCRIPT

Comprehensive bioinformatic analysis of kinesin
classification and prediction of structural changes from a
closed to an open conformation of the motor domain
Dissertation
Presented by
Xiao Liu
Institute of Cell Biology
Ludwig-Maximilians-University Munich
Submitted on 26.08.2009
Co-Supervisors: Prof. Dr. Manfred Schliwa and Prof. Dr. John Parsch

Promotionsgesuch eingereicht am 26.08.2009
Die Arbeit wurde angeleitet und betreut von Prof. Manfred Schliwa
Pruefungsausschuss: Vorsitz: Prof. Manfred Schliwa
1. Gutachter: Prof. John Parsch
2. Gutachter: Prof. Michael Schleicher
3. Protokoll: Prof. Dirk Metzler
Tag der muendlichen Pruefung: 26.11.2009
Zusammenfassung
Die Kinesine sind eine von den drei grossen Motorproteinfamilien in eukaryotischen
Zellen und spielen eine bedeutende Rolle fuer vielfaeltige intrazellulaere
Transportvorgaenge von den Zellbaustoffen. Die Kinesine sind ATPasen, welche die
durch Spaltung von ATP freigesetzte chemische Energie in mechanische Energie
umwandeln und sich entlang der Mikrotubuli bewegen. Nicht nur eine grosse Menge
von Organellen, Proteinkomplexen und mRNA werden von den Kinesinen
transportiert, sondern auch die Bildung des Spindelaparates ist von den Kinesinen
abhaengig.
Die bisherige phylogenetische Analyse fuehrte zu dem Ergebnis, dass die
Kinesin-Superfamilie vierzehn Unterfamilien enthaelt. Ob diese Anzahl an
Unterfamilien der Realitaet entspricht oder weitere Klassen existieren ist noch
fraglich, da bisherige Analysen auf einem relative kleinen Datensatz von
Kinesin-Sequenzen (<600) basieren. In diesem Projekt wurden umfangreiche
bioinformatische Analysen fuer eine grossen Kinesindatensatz (2530 Sequenzen)
ausgefuehrt.
Sechzehn konservierte Motive wurden durch die Sequenzenanalysen in der
Motordomaene identifiziert. Waehrend das ATP-Bindemotif und das
Mikrotubuli-Bindemotif eine wichtige Rolle fuer die Enzymfunktion der Kinesine
spielen, sind die anderen Motive fuer die Stabilisierung und Konformationsaenderung
der Motordomaene von grosser Bedeutung.
Eine hochqualitativer phylogenetischer Baum mit 2530 Sequenzen wurde mit einer
Maximum-likelihood Methode konstruiert. Die Qualitaet des Baumes wurde mit einer
neuen Methode zur Bestimmung der Datenverlaesslichkeit berechnet. Die
phylogenetische Analyse hat alle vierzehn Kinesinunterfamilien bestaetigt. Dreizehn
davon werden von dem phylogenetischen Baum gut unterstuetzt (>90%). Der
Konfidenzwert von dem Kinesin-12 Teilbaum ist zwar nur 73%, aber die
Taxaverteilung zeigt eindeutig, dass dieser Teilbaum eine Unterfamilie bildet.
Zusaetzlich wird ein automatisches profibasiertes Klassifikationsprogramm
implementiert und ist online benutzbar. Die Genauigkeit der Programme liegt bei 85%.
Das erleichtert die Erkennung und Klassifikation von neuen Kinesinsequenzen.
Kinesin-1, auch konventionelles Kinesin genannt, ist das am besten studierte Kinesin.
Interesanterweise bewegt sich das fungale Kinesin-1 4-5 mal schneller als das
tierische Kinesin-1. Geschwindigkeitsbestimmende Faktoren sind ein interessantes
Thema. Fruehere Experimente mit Proteinchimaeren haben gezeigt, dass die
Motordomaene die Geschwindigkeit kontrolliert. Weitere Mutageneseuntersuchungen
von der Motordomaene waeren nicht sinnvoll, da es immer noch unbekannt ist, ob es
sich bei dem Faktor um eine bestimmte Aminosaeure oder eine komplexe
Kombination von mehreren Aminosaeueren handelt.
Mit den komparativen Sequenzanalysen von Pilzkinesin-1 und tierischem Kinesin-1
wurden viele gruppenspezifische Aminosaeuren identifiziert. Viele davon befinden
sich in den funktionellen Motiven, wie z.B. das ATP-bindende Motiv und das
Mikrotubuli-bindende Motiv. Solche Aminosaeuren sind anscheinend fuer die
Funktionsunterschiede verantwortlich. Die anderen sind in weiteren wesentlichen
struktuellen Elementen verstreut.
Der Vergleich der gruppenspezifischen Aminosaeuren in den dreidimensionalen
Strukturen (1BG2 und 1GOJ) fuehrte zu der Entdeckung wichtiger
Konformationsaenderungen zwischen einer geoeffneten und einer geschlossenen
Komformation von der Motordomaene. Die meisten der gruppenspezifischen
Aminosaeuren sind an den raeumlichen Interaktionen mit anderen
gruppenspezifischen oder konservaierten Aminosaeuren beteiligt. Viele solche
Interaktionen sind nur in der geschlossenen Konformation zu beobachten. Die
funktionellen Motive, wie z.B. Switch-I, Loop-11, β5 usw. sind dadurch mit dem
β-Kern der Motordomaene verbunden. In der geoeffneten Konformation sind solche
Bindungen geloest und somit werden die funktionellen Motiven frei fuer die Bindung
an Mikrotubuli. Andererseits kommen neue Bindungen zustande, welche verhindern,
dass die Struktur der Motordomaene in der geoeffneten Konformation
auseinanderfaellt.
Die die Konformationsaenderung kontrollierenden Bindungen haben wertvolle
Hinweise fuer das Zusammenspiel von Funktion und Struktur geliefert und neue
Einblicke in die Geschwindigkeitskontrolle von Kinesin-1 gegeben. Insbesondere sind
die Bindungen in der ATP-Bindungstasche von grosser Bedeutung, weil hier die
Energie, welche die Motilitaet der Motordomaene antreibt, generiert wird. Die
Strukture der ATP-Bindungstaschen von Pilz und Tier sind sehr aehnlich bis auf
einige gruppenspezifische Aminosaeuren. Diese sind zwar wichtig fuer die
Regulierung der ATP-Hydrolyse, aber nicht ausreichend fuer die
Geschwindigkeitskontrolle. Einige weitere Bindungen zwischen der ersten und der
zweiten Lage von Aminosaeuren in der ATP-Bindungstasche wurden entdeckt. Alle
solche Bindungen koennen als Hinweise fuer die Planung zukuenftiger Experimente
dienen und letztendlich helfen, den Mechanismus der Kinesinmotilitaet zu verstehen.
Mit dem rasanten Wachstum des Proteindatensatzes in den oeffentlichen Datenbanken
kommen immer mehr neue Kinesine ins Spiel. Um einen aktuellen Ueberblick ueber
die Gesamtheit der Kinesinsequenzen zu ermoeglichen, wurde ein Kinesin Webserver
aufgebaut. Neue Kinesine werden automatisch gesammelt und klassifiziert. Die
Benutzer koennen die in den Webserver integrierten Programme benutzen, wie z.B.
classification, conservation calculation, motif search, discriminating residues search,
3D structure analyses, um die inder Datenbank vordefinierten Kinesinunterfamilien
oder eigene Sequenzvergleiche zu analysieren.
Die in dieses Projekt verwendeten Methoden sind nicht nur fuer Kinesinanalysen
geeignet, sondern auch fuer alle anderen Proteinfamilien. Dazu sind einige weitee
Programme auch in den Webserver integriert. Der Webserver findet sind unter
www.bio.uni-muenchen.de/~liu/kinesin_new.
I
Summary
Kinesins form a large microtubule-associated motor protein super-family that can be
found in every eukaryotic genome sequenced so far. Not only is the translocation of a
large number of organelles, protein complexes and mRNAs carried out by them, but
also the formation of the meiotic spindle and mitotic spindle integrity are strongly
dependent on the kinesins.
Fourteen different sub-families of kinesin have been reported. However, previous
analyses were based on a relatively small number of selected kinesins (<600
sequences). Whether new classes of kinesin exist or the old classification system will
hold as new sequence data become available is unknown.
In this project, comprehensive computational analyses were performed on a large
kinesin dataset (2,530 sequences). Sixteen conserved motifs were identified within the
motor domain, including the ATP-binding motifs, microtubule-binding interface and
many conserved secondary structural elements. Phylogenetic analysis confirmed the
fourteen sub-family classification scheme. Thirteen of sub-families were well defined
and statistically supported. The kinesin-12 sub-family had less support, with a clade
confidence of 73%.
In addition, a profile-based, automatic classification program was implemented
according to the fourteen kinesin sub-groups. The accuracy of the program is over 85%,
which makes the detection and classification of new kinesin sequences fast and easy.
Kinesin-1, formerly known as conventional kinesin, is the best-studied member of the
kinesin super-family. Motility studies have revealed an interesting phenomenon that
the fungal kinesin-1s move 4-5 times faster than the animal kinesin-1s in general.
Determining the sequence and structural factors that are responsible for the velocity
difference is a topic of current research. Previous protein-chimera experiments have
determined that the motor domain is essential for speed control. However, detailed
analyses of the motor domain through mutagenesis have presented many challenges to
biologists, because it is still unknown whether the speed is controlled by one particular
amino acid residue or by a complex combination of several residues.
With comparative analyses of the primary sequences of fungal and animal kinesin-1s,
many group-specific residues were identified. Several of them are located inside
II
functionally important motifs such as the ATP-binding pocket and potential
microtubule binding motifs, which appear to be responsible for the functional
differences. The others are widely distributed in many important secondary structural
elements.
The mapping of these residues onto the fungal and animal three-dimensional crystal
structures (1BG2 and 1GOJ) has led to the discovery of several structural changes from
a closed to an open conformation of the motor domain. Most of the group-specific
residues are involved in the spatial interactions with other group-specific residues or
conserved residues. Many of these interactions can be detected only in the closed
conformation. They contain functional elements, such as the switch-I, loop-11, β5 etc
that lie within the core structure of the motor domain. When the structure changes into
the open conformation, these elements are released and become active for binding to
the microtubule. At the same time, many new interactions made by the group-specific
residues are formed for the stabilization of the motor domain.
These structurally crucial interaction-pairs of residues and the group specific residues
found in the ATP-binding pocket provide insight into the potential control of kinesin
velocity. The different structures of the fungal and animal ATP-binding pockets appear
to be vital for ATP hydrolysis, but cannot control the velocity by itself. Some of the
detected combinations of residues must interact within the ATP-binding pocket. They
could be used as guidance for the biologists to design experiments to eventually
discover the mechanism of velocity control.
Methods developed in this work have proven to be useful for analyzing the kinesins.
Analyses of kinesin-1 are only the first step to understand the kinesin super-family.
These methods can be applied to other kinesin sub-families. On the other hand, the
number of kinesin sequences in public databases is increasing rapidly. In this project, a
kinesin web-server has been developed to assist with further research of the kinesins. It
stores and classifies all currently identified kinesins and is automatically updated to
keep all kinesin ssequences up-to-date. Many useful methods are implemented in the
web-server, such as a classification tool, a conservation calculation tool, a motif search
tool, and a discriminating residues (group-specific residues) search tool. The user can
use these tools to analyze pre-defined kinesin sub-families or user-defined sequences or
alignments. In addition, the group-specific residues can be mapped onto user selected
III
3D structures for direct visual comparison. The web-server is accessible at
http://www.bio.uni-muenchen.de/~liu/kinesin_new/
IV
Acknowledgements
I would like to express my deepest gratitude to Prof. Manfred Schliwa, my supervisor,
for leading me into the world of motor proteins and for his valuable recommendations
and suggestions. Without his constant encouragement and guidance, this project could
not have been accomplished.
My heartfelt gratitude goes to Prof. John Parsch. He has walked me through all of the
stages of my study at the LMU. With his help I have successfully finished my Diploma
in bioinformatics and got the chance to start my Ph.D research. He has given me full
support and helped me to complete this dissertation.
I particularly wish to thank Anna Gabrenya and Marija Vukailovic for critical reading
of the manuscript and helping me with the revising of this dissertation.
I am also indebted to Dr. Guenther Woehlke, who has given me much professional
guidance for presenting the results.
Last, I especially would like to thank my beloved family for their deep love and great
confidence in me all through these years.
V
Ehrenwörtliche Versicherung
Hiermit versichere ich ehrenwoertlich, dass die vorgelegte Dissertation von mir
selbstaendig und ohne unerlaubte Hilfe angefertigt ist.
München, den17, August 2009
Xiao Liu
Erklärung über frühere Promotionsversuche
Hiermit bestätige ich, dass ich vor dieser Arbeit keine anderen Promotionsversuche
unternommen habe. Dies ist meine erste Dissertation.
München, den17, August 2009
Xiao Liu
1 Introduction ............................................................................................................ 1
1.1 Biological background ................................................................................................. 1
1.1.1 Motor proteins ....................................................................................................... 1
1.1.1.1 Dynein .............................................................................................. 1
1.1.1.2 Myosin .............................................................................................. 2
1.1.1.3 Kinesin .............................................................................................. 3
1.2 Bioinformatics and protein research ............................................................................. 5
1.2.1 Sequence databases ............................................................................................... 6
1.2.2 Homology search via Basic Local Alignment Search Tool (BLAST) .................. 6
1.2.3 Comparative proteomics ........................................................................................ 8
1.2.4 Phylogeny estimations ........................................................................................... 8
1.2.5 Reconstruction of the ancestral state of a protein ................................................ 11
1.2.6 Investigation of the evolutionary pathway .......................................................... 13
1.2.7 Structure comparison ........................................................................................... 13
1.3 kinesin-1 project ......................................................................................................... 14
1.3.1 kinesin super-family ............................................................................................ 14
1.3.2 kinesin-1 sub-family ............................................................................................ 16
1.3.3 Dichotomy of kinesin-1 in phylogeny and in motility......................................... 17
1.3.4 Previous laboratory research on motility ............................................................. 18
1.3.5 Attempts by Bioinformatics ................................................................................ 21
1.3.5.1 Comparative approaches ................................................................. 21
1.3.5.2 Resurrecting ancestral kinesin-1 proteins ....................................... 23
1.3.6 Goals of the work ................................................................................................ 24
2 Materials and methods .......................................................................................... 26
2.1 Data collection ............................................................................................................ 26
2.1.1 NCBI RefSeq database ........................................................................................ 26
2.1.2 Kinesins in the RefSeq database .......................................................................... 27
2.1.3 PSI-BLAST search against the RefSeq database................................................. 28
2.2 Classification of kinesin sequences ............................................................................ 29
2.2.1 NCBI CDD classification method ....................................................................... 29
2.2.2 Hidden Markov model classification ................................................................... 30
2.2.3 Significance test ................................................................................................... 30
2.2.3.1 E-value threshold cutoff ................................................................. 30
2.2.3.2 Likelihood ratio test ........................................................................ 31
2.2.4 Automatic classification of kinesin sequences .................................................... 32
2.2.5 Nomenclature of kinesins .................................................................................... 33
2.3 Automatic update of the kinesin database .................................................................. 33
2.4 Multiple sequence alignments .................................................................................... 34
2.5 Comparative proteomics ............................................................................................. 34
2.5.1 Conserved amino acids in kinesin sequences ...................................................... 35
2.5.2 Identifying conserved sequence motifs ............................................................... 37
2.5.3 Finding known motifs in proteins ........................................................................ 39
2.5.4 Discriminating amino acids ................................................................................. 40
2.6 Phylogeny reconstruction ........................................................................................... 40
2.6.1 Methods ............................................................................................................... 40
2.6.2 Visualization ........................................................................................................ 41
2.7 Reconstruction of ancestral kinesins .......................................................................... 41
2.8 Structural comparison ................................................................................................. 41
2.9 Web server .................................................................................................................. 42
2.9.1 MySQL database ................................................................................................. 42
2.9.2 Web interface....................................................................................................... 43
3 Results .................................................................................................................. 45
3.1 Statistics of kinesin sequence data ............................................................................. 45
3.1.1 Kinesin sequences in the RefSeq database .......................................................... 45
3.1.2 Organisms which contain kinesins ...................................................................... 48
3.2 Conservation analyses ................................................................................................ 51
3.2.1 Common conserved residues in the kinesin super-family ................................... 51
3.2.2 Common motifs of kinesins ................................................................................. 57
3.2.2.1 ATP-binding pocket ....................................................................... 58
3.2.2.2 Switch I and switch II motifs .......................................................... 59
3.3 Phylogenetic analysis and kinesin classification ........................................................ 60
3.3.1 Classification based on the Conserved Domain Database ................................... 61
3.3.2 Phylogenetic tree of the kinesin super family...................................................... 61
3.3.3 Evolution of kinesins ........................................................................................... 64
3.4 Kinesin-1 .................................................................................................................... 66
3.4.1 Sequence data ...................................................................................................... 66
3.4.2 Conservation of kinesin-1 .................................................................................... 68
3.4.3 Motif structure of the kinesin-1 sub-family ......................................................... 72
3.4.4 Phylogeny of kinesin-1 ........................................................................................ 75
3.4.5 Fungal vs animal kinesin-1 .................................................................................. 76
3.4.6 Ancestral kinesin-1 prediction ............................................................................. 78
3.4.7 Discriminating positions in fungal and animal kinesin-1 .................................... 82
3.4.8 Discriminating residues and the motor domain structure .................................... 85
3.4.8.1 The bond between 204E and 257K in NcK1 .................................. 86
3.4.8.2 Residue 203Q in switch I of NcK1 ................................................. 87
3.4.8.3 Residues 91, 92, 95, 96 in the ATP-binding pocket of NcK1 ........ 88
3.4.8.4 Residue 243 in NcK1 ...................................................................... 89
3.4.8.5 Microtubule binding sites ............................................................... 90
3.4.8.6 Residues I130 and V173 in the HsK1 ............................................ 93
3.4.8.7 Residues K226 and D288 in the HsK1 ........................................... 93
3.4.8.8 Residues S266 and R321 in the HsK1 ............................................ 95
3.4.8.9 V148 and D144 in the HsK1 .......................................................... 95
3.4.9 Putative cooperative residues combinations ........................................................ 97
3.4.9.1 The second layer of the ATP-binding pocket ............................... 100
3.4.10 Conjecture about the velocity controller ....................................................... 101
3.4.10.1 ATP-binding pocket could be one candidate ................................ 101
3.4.10.2 Other potential factors for the velocity difference ........................ 102
4 Conclusion and discussion.................................................................................. 104
4.1 Confidence evaluation of the phylogenetic tree ....................................................... 104
4.2 The 14th kinesin sub-family ...................................................................................... 105
4.3 Bioinformatic approaches to study on kinesin-1 velocity ........................................ 107
4.4 Outlook ..................................................................................................................... 108
5 Appendix ............................................................................................................ 109
5.1 Web-server ............................................................................................................... 109
5.1.1 Classification of user defined sequence ............................................................. 109
5.1.2 Conservation calculation tool ............................................................................ 110
5.1.3 Motif search ....................................................................................................... 111
5.1.4 Pattern search for known motifs ........................................................................ 112
5.1.5 Discriminating residues search tool ................................................................... 113
5.1.6 Displaying discriminating residues in 3D structures ......................................... 113
5.1.7 Basic information of the kinesins ...................................................................... 114
6 Bibliography ....................................................................................................... 118
6.1 Publications .............................................................................................................. 123
7 Curriculum Vitae ................................................................................................ 124
1
1 Introduction
1.1 Biological background
1.1.1 Motor proteins
Motor proteins make up a large protein family of ATPases. This family contains some
of the most important proteins required for life and is essential for most eukaryotic
organisms. As the name implies, motor proteins work like motors, generating
mechanical energy from chemical energy released by the hydrolysis of ATP to power
movement. Generation of force for muscle contractions, transport of different
organelles along microtubules within a cell, and generation of energy for mitosis and
meiosis are some examples of essential functions that require motor proteins [1].
There are three groups of motor proteins, myosins, dyneins and kinesins. Myosins are
actin associated motor proteins, while dyneins and kinesins are microtubule associated.
The biochemical and mechanical properties of motor proteins can be measured
precisely. The major functions and structure of these motor proteins were discovered
after decades of intensive research. However, many other fundamental questions still
remain unanswered. For example, how is the chemical energy transformed into
mechanical force? What is the relationship between motility and structure?
With the help of bioinformatics and the continual sequencing of genes, we can better
investigate the evolution of the structure and function of each motor protein and
eventually address the mechanism of motion of motor proteins.
1.1.1.1 Dynein
Dynein is a microtubule associated motor protein. It is a large molecular protein
complex, which has a mass of over one megadalton and consists of 9 to 12 polypeptide
chains. Most of the polypeptide chains are common components, although some are
unique subunits to specialized dyneins. Depending on the location of action, dynein is
classified into two major groups, cytoplasmic dynein and axonemal dynein. Axonemal
dynein was first discovered in 1963 and is responsible for movement of cilia and
2
flagella. Cytoplasmic dynein was isolated and identified 20 years later and is essential
for the positioning and transportation of various organelles needed for cellular function
[2].
Axonemal dynein can be found only in cells that have axonemes of cilia and flagella,
while cytoplasmic dynein is expressed in almost all animal cells. It is involved in
organelle transport, centrosome assembly and mitosis. [2].
Cytoplasmic dynein is thought to help the Golgi apparatus to position and transport
other vesicles made by the endoplasmic reticulum, endosomes and lysosomes to
various destinations in the cell in order to perform cellular functions. Cytoplasmic
dynein is also crucial in the movement of chromosomes and positioning of mitotic
spindles for cell division [2].
In vitro experiments indicate that dynein is a minus-end directed motor, which means it
transports cargo along microtubules towards the minus end of the microtubule to the
cell center.
1.1.1.2 Myosin
Myosin is a large protein family, and many divergent myosin genes have been found
throughout eukaryotic phyla. Alone in human, there are more than 40 different myosin
genes.
The term myosin was originally used to describe a group of similar, but non-identical
ATPases found in striated and smooth muscle cells [3]. Unlike dynein, myosin is an
actin associated motor protein. Myosins are mainly responsible for muscle
contractions.
Currently, 18 different classes of myosin are known [4]; however, other researchers
claim that there are over 30 different classes [5]. Despite the differences in
nomenclature, myosins share highly similar structures; most contain a head, a neck and
a tail domain. The head domain of myosin is highly conserved, while the tail region is
rather divergent. This phenomenon can be explained by the different functions of the
domains. The head domain is essential for actin binding, force generation and
movement along actin. Its role in these common functions is thought to be the main
reason why the structure of the head domain is so well-conserved. On the other hand,
3
the tail is responsible for cargo binding. Variability in the tail domain is proportional to
the number of dissimilar cargoes.
Myosin is involved in many major cellular functions. For example, Myosin II is
responsible for muscle contraction, myosin I, IV and V function in vesicle transport and
myosin VII is required for spermatogenesis or stereocilia formation [6]. However, the
functions of most myosins, as well as their structures, remain unknown.
1.1.1.3 Kinesin
In the mid 1980s, scientists discovered the existence of a group of proteins that can
hydrolyze ATP and function as transporters in cells. One of these proteins was dynein.
The existence of other motor proteins was unknown at that time. Lasek and Brady
(1985) published an article entitled ‗Attachment of transported vesicles to
microtubules in axoplasm is facilitated by AMP-PNP‘ in Nature [7]. They reported that
AMP-PNP, a non-hydrolysable analogue of ATP, can inhibit vesicle transport in
axoplasm. Relatively stable complexes were formed by vesicles and microtubules,
which indicate significantly different enzymatic machinery in the dynein-microtubule
system. This motor protein was then partially purified from axoplasm in the squid giant
axon by Vale and Reese soon after in the same year [8]. They found that this soluble
protein induces movement of microtubules on glass, latex beads on microtubules and
axoplasmic organelles on microtubules. The protein had an apparent molecular weight
of 600 kilodaltons and contained 110-120 and 60-70 kilodalton polypeptides, which
were distinct in both molecular weight and enzymatic behavior from dynein and
myosin. Therefore, they claimed that a novel class of force generating molecules was
found and named them kinesin [8].
Kinesin is the third class of motor proteins that was isolated and is also the first large
protein family to be identified in mammals. Kinesins are key players in the
intracellular transport system, which is essential for cellular function and morphology.
The most important functions of kinesin have been uncovered through numerous
molecular biological and genetic approaches during the last few decades.
Kinesins are critical for cellular morphogenesis, functioning and survival. They
transport various organelles like mitochondria and Golgi apparati, as well as protein
complexes and mRNAs. Recent research also indicates that they are involved in
4
different fundamental processes of life such as brain wiring, memory, learning,
activity-dependent neuronal survival during brain development, left-right asymmetry
formation, and suppression of tumorigenesis [9].
Similar to dynein, kinesin is also a microtubule associated ATPase. That is, it binds to
the microtubule and converts chemical energy released by hydrolysis of ATP to
mechanical force in order to walk along the microtubule. In contrast to dynein, the
movement on the microtubule is plus-end directed and transports cargo from the cell
center to periphery. A known exception is members of the kinesin-14 sub-family,
which move toward the minus-end like dynein [10].
Kinesins typically have a common structure that is characterized by a dimer with a
motor domain, coiled coil stalk and light chain. Similar to the motor domain in dynein
and myosin, the head domain is responsible for microtubule binding [11], ATP binding
and hydrolysis [12]. The sequence of the head domain shows a high level of
conservation while the tail domain shows great variability due to the diversity of cargo.
The location of the motor domain varies among kinesins. For example, kinesin-1 has
an N-terminal motor domain, while kinesin-14 has a C-terminal motor domain.
One-headed kinesins also exist. An example is KIF1A, which shows similar motility
properties to other two-headed kinesins [13].
The kinesin super-family of molecular motors can be subdivided into 14 sub-families
based on sequence features and cellular function [14]. Miki (2005) generated a kinesin
family tree using about 600 sequences and supported the 14 sub-family classification
systems of kinesins [16], while Wickstead and Gull claimed that there were new
kinesin sub-families in their ‗holistic‘ kinesin phylogeny [17]. With the growth of
sequence databases, the number of available kinesin sequences is expanding rapidly. It
is now possible to recreate a reliable phylogenetic tree for the kinesin super-family with
a vast number of sequences and settle issues related to kinesin sub-family
classification.
Although we know the basic functions and structure of kinesins, many details are yet to
be understood. For example, studies have revealed the location of ATP binding sites but
not how ATP hydrolysis causes conformational changes. It is also known that kinesins
can move progressively along microtubules, but we still do not know the details of this
5
progress. Kinesins transport various cargoes, but we do not know how the tail domain
binds its cargo. Finally, we know that some kinesins move fast while some move
slowly, but we do not know what aspects of the sequence or structure are responsible
for this phenomenon.
1.2 Bioinformatics and protein research
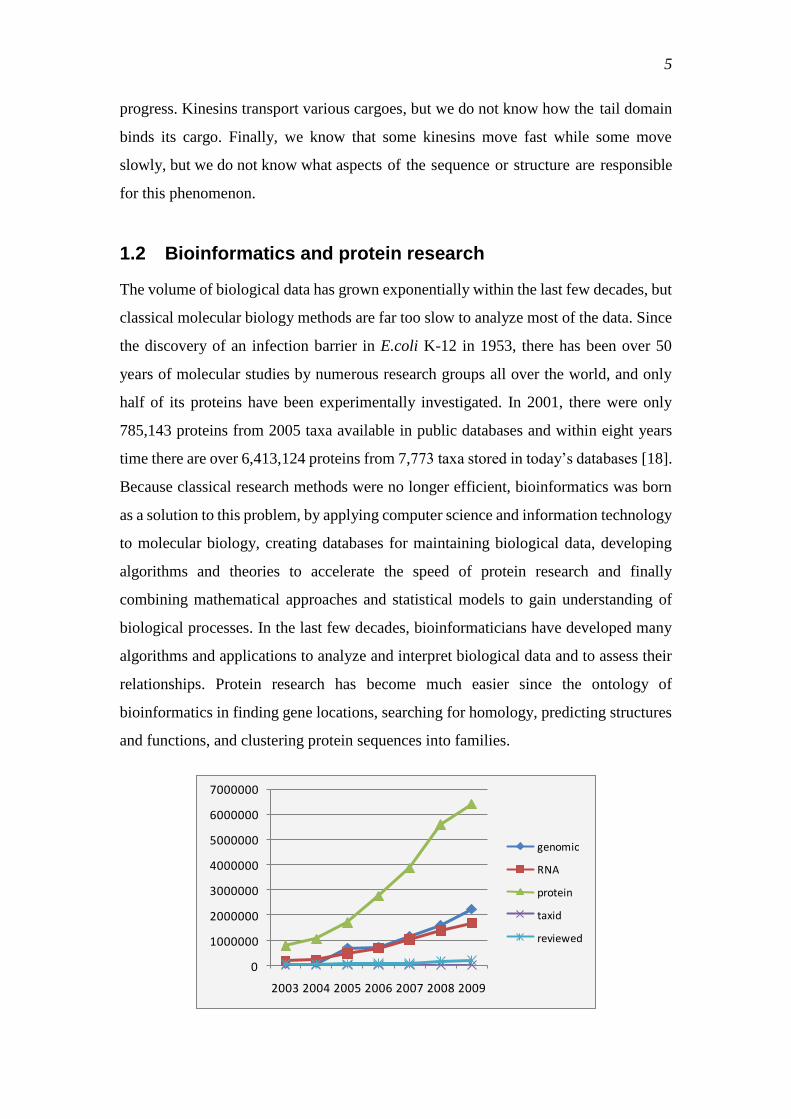
The volume of biological data has grown exponentially within the last few decades, but
classical molecular biology methods are far too slow to analyze most of the data. Since
the discovery of an infection barrier in E.coli K-12 in 1953, there has been over 50
years of molecular studies by numerous research groups all over the world, and only
half of its proteins have been experimentally investigated. In 2001, there were only
785,143 proteins from 2005 taxa available in public databases and within eight years
time there are over 6,413,124 proteins from 7,773 taxa stored in today‘s databases [18].
Because classical research methods were no longer efficient, bioinformatics was born
as a solution to this problem, by applying computer science and information technology
to molecular biology, creating databases for maintaining biological data, developing
algorithms and theories to accelerate the speed of protein research and finally
combining mathematical approaches and statistical models to gain understanding of
biological processes. In the last few decades, bioinformaticians have developed many
algorithms and applications to analyze and interpret biological data and to assess their
relationships. Protein research has become much easier since the ontology of
bioinformatics in finding gene locations, searching for homology, predicting structures
and functions, and clustering protein sequences into families.
0
1000000
2000000
3000000
4000000
5000000
6000000
7000000
2003 2004 2005 2006 2007 2008 2009
genomic
RNA
protein
taxid
reviewed
6
Figure 1. Increase in number of biological entries in the NCBI RefSeq database from release 1 published
in 2003 to release 33 published in January,.2009. The number of proteins increases exponentially, while
reviewed protein changes increase almost linearly.
1.2.1 Sequence databases
With the ever-increasing production of genomic data, such as DNA sequences and
amino acid sequences, creation and maintenance of biological databases has become
essential for scientists to access existing data as well as submit new data and revise data.
Much of a bioinformaticians‘ work is concerned with databases. These databases can
be public like GenBank [20] or Protein Data Bank (PDB) [21], or private databases that
are created by research groups.
A few popular databases are GenBank from the National Center for Biotechnology
Information (NCBI) [22], SwissProt from the Swiss Institute of Bioinformatics [23],
the Protein information resource (PIR) [24] and the European Molecular Biology
Laboratory (EMBL) nucleotide sequence database [25]. NCBI and EMBL are two
major nucleotide databases, which collaborate and synchronize their data. These
databases are updated on a daily basis, but still many mistakes can be found in the
databases due to a high rate of increase in data volume. Common errors are duplicated
sequences, sequencing errors and missing or incorrect annotations. In order for
researchers to use data from a database, data quality has to be of top priority. Data need
to be examined either in the database itself or by cross checking the experimental
references available in other databases.
1.2.2 Homology search via Basic Local Alignment Search Tool (BLAST)
Sequence homology refers to sequence similarity due to evolution from a common
ancestor. An interspecific or intraspecific gene comparison can show similarities in
protein functions or relations between species. There are two types of homology:
orthology and paralogy. Sequences are orthologous if they were separated by a
speciation event and paralogous if they are separated by a gene duplication event.
Computer programs such as BLAST [26] scan large databases with incredible speed
and high sensitivity. Before BLAST was developed, database scanning was very time
7
consuming. BLAST uses a heuristic approach that approximates the Smith-Waterman
algorithm to match subsequences in the database to subsequences in the query.
The algorithm of BLAST is described briefly as follows [27]:
1. Remove low complexity regions or sequence repeats in the query sequence.
2. Make a k-letter word list of the query sequence
3. List the possible matching words
4. Organize the remaining high-scoring words into an efficient search tree
5. Repeats step 1 to 4 for each 3-letter word in the query sequence
6. Scan the database sequences for an exact match with the remaining high-scoring
words
7. Extend the exact matches to high-scoring segment pairs (HSPs)
8. List all of the HSPs in the database whose score is higher than a given cutoff
9. Evaluate the significance of the HSP score
10. Combine two or more HSP regions into a longer alignment
11. Show the gapped Smith-Waterman local alignments of the query and each of the
matched database sequences
12. Report matches whose expected score is lower than a threshold parameter e-value.
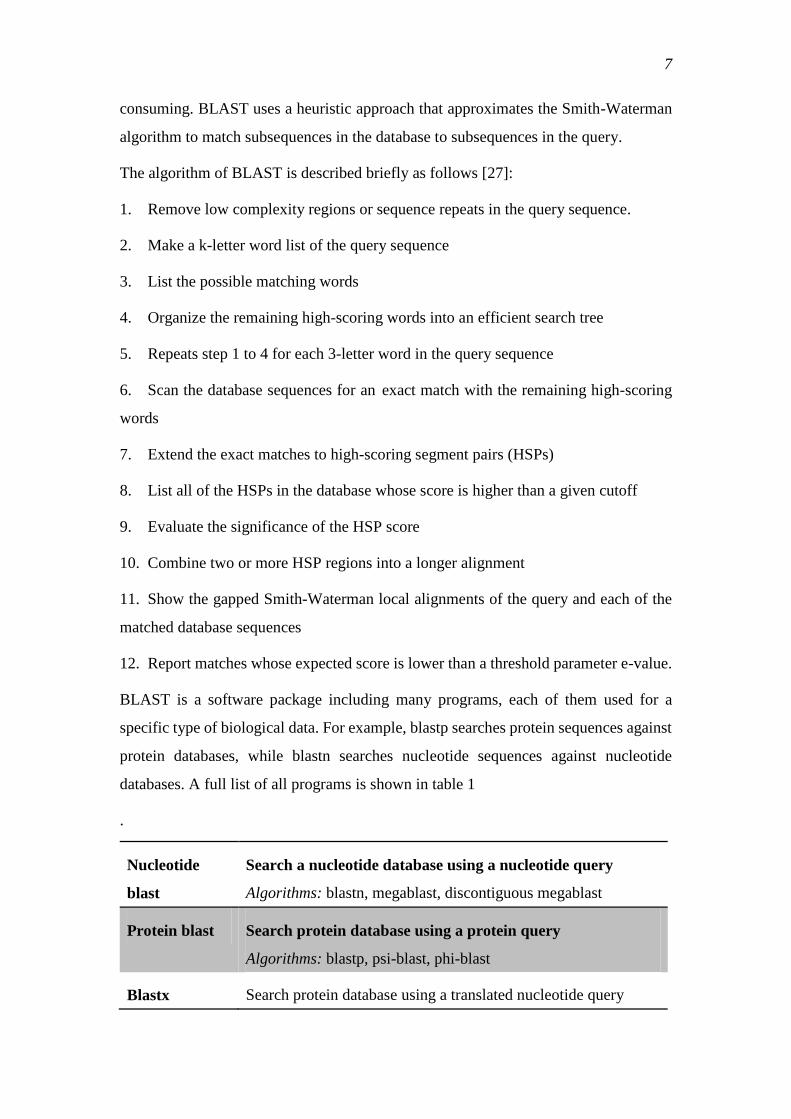
BLAST is a software package including many programs, each of them used for a
specific type of biological data. For example, blastp searches protein sequences against
protein databases, while blastn searches nucleotide sequences against nucleotide
databases. A full list of all programs is shown in table 1
.
Nucleotide
blast
Search a nucleotide database using a nucleotide query
Algorithms: blastn, megablast, discontiguous megablast
Protein blast Search protein database using a protein query
Algorithms: blastp, psi-blast, phi-blast
Blastx Search protein database using a translated nucleotide query
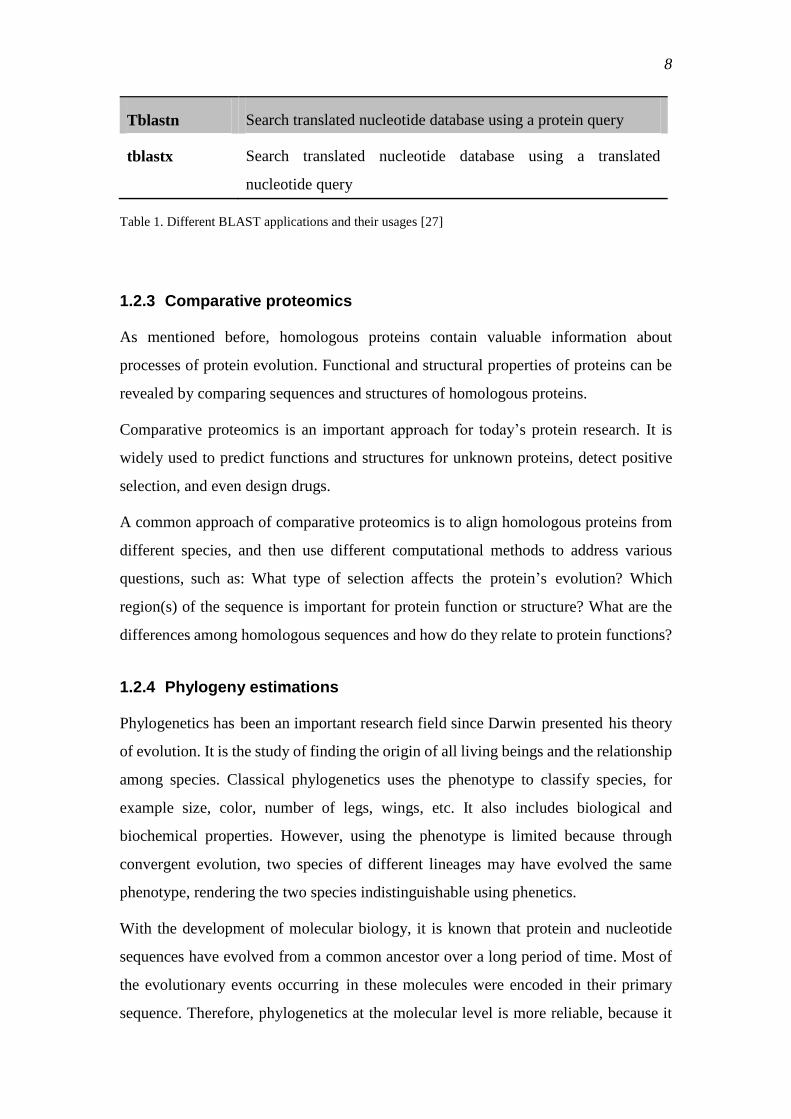
8
Tblastn Search translated nucleotide database using a protein query
tblastx Search translated nucleotide database using a translated
nucleotide query
Table 1. Different BLAST applications and their usages [27]
1.2.3 Comparative proteomics
As mentioned before, homologous proteins contain valuable information about
processes of protein evolution. Functional and structural properties of proteins can be
revealed by comparing sequences and structures of homologous proteins.
Comparative proteomics is an important approach for today‘s protein research. It is
widely used to predict functions and structures for unknown proteins, detect positive
selection, and even design drugs.
A common approach of comparative proteomics is to align homologous proteins from
different species, and then use different computational methods to address various
questions, such as: What type of selection affects the protein‘s evolution? Which
region(s) of the sequence is important for protein function or structure? What are the
differences among homologous sequences and how do they relate to protein functions?
1.2.4 Phylogeny estimations
Phylogenetics has been an important research field since Darwin presented his theory
of evolution. It is the study of finding the origin of all living beings and the relationship
among species. Classical phylogenetics uses the phenotype to classify species, for
example size, color, number of legs, wings, etc. It also includes biological and
biochemical properties. However, using the phenotype is limited because through
convergent evolution, two species of different lineages may have evolved the same
phenotype, rendering the two species indistinguishable using phenetics.
With the development of molecular biology, it is known that protein and nucleotide
sequences have evolved from a common ancestor over a long period of time. Most of
the evolutionary events occurring in these molecules were encoded in their primary
sequence. Therefore, phylogenetics at the molecular level is more reliable, because it
9
uses information encoded directly in protein sequences as properties of a species. The
basic theory of molecular phylogeny is based on evolution; the number of changes
among sequences is positively correlated with the time since their divergence from a
common ancestor. In other words, distantly related organisms show greater
dissimilarity in sequences, while more closely related organisms show a greater degree
of similarity.
In general, phylogenic reconstruction is based on the molecular clock hypothesis,
which states that the evolutionary rate of a biological molecule is constant over time.
This hypothesis was first proposed by Emile Zuckerkandl and Linus Pauling in 1962,
who estimated from fossil evidence that the number of amino acid differences in
hemoglobin between different lineages roughly correlated with their divergence [28].
Later in 1963, the phenomenon of genetic equidistance was noted by comparing the
number of amino acid differences among cytochrome C of several species [29]. The
discovery of the molecular clock has provided a powerful way to time the processes of
molecular evolution. Information obtained from molecular genetics can be used in the
formation of phylogenetic trees, establishing the dates of evolutionary events such as
gene duplication, and discovering the divergence times of genes or taxa. However, the
reliability of the molecular clock can be limited by many factors such as generation
time, population size, species-specific differences, positive selection, etc. These
limitations should be considered, especially when studying long timescales [30].
A classical phylogenetic tree is an acyclic connected graph consisting of a set of linked
nodes that represent the evolutionary relationship of a set of biological units, such as
DNA sequences, protein sequences, or species. The external nodes of the tree represent
species or genes/proteins. Internal nodes represent the hypothetical most recent
common ancestor of its descendants and show the time point when an evolutionary
event like speciation or gene duplication occurred. Branches between nodes indicate
the relationship of linked biological data by using the branch length to represent the
number of changes in a molecular sequence a lineage has acquired.
A phylogenetic tree can be rooted or unrooted. When rooted, the root of the tree
represents the common ancestor; evolutionary pathways can be estimated from this
kind of tree. The path between any node and the root should indicate the evolutionary
time or evolutionary distance. An unrooted tree shows only the relationship between
10
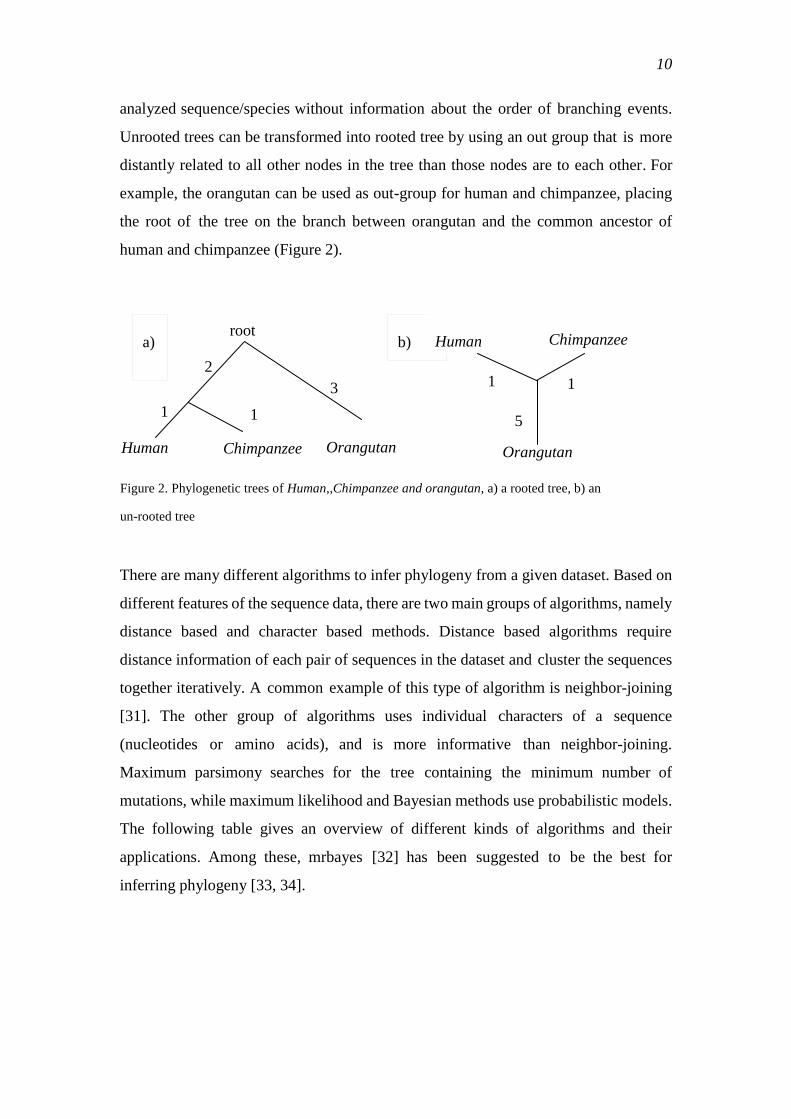
analyzed sequence/species without information about the order of branching events.
Unrooted trees can be transformed into rooted tree by using an out group that is more
distantly related to all other nodes in the tree than those nodes are to each other. For
example, the orangutan can be used as out-group for human and chimpanzee, placing
the root of the tree on the branch between orangutan and the common ancestor of
human and chimpanzee (Figure 2).
There are many different algorithms to infer phylogeny from a given dataset. Based on
different features of the sequence data, there are two main groups of algorithms, namely
distance based and character based methods. Distance based algorithms require
distance information of each pair of sequences in the dataset and cluster the sequences
together iteratively. A common example of this type of algorithm is neighbor-joining
[31]. The other group of algorithms uses individual characters of a sequence
(nucleotides or amino acids), and is more informative than neighbor-joining.
Maximum parsimony searches for the tree containing the minimum number of
mutations, while maximum likelihood and Bayesian methods use probabilistic models.
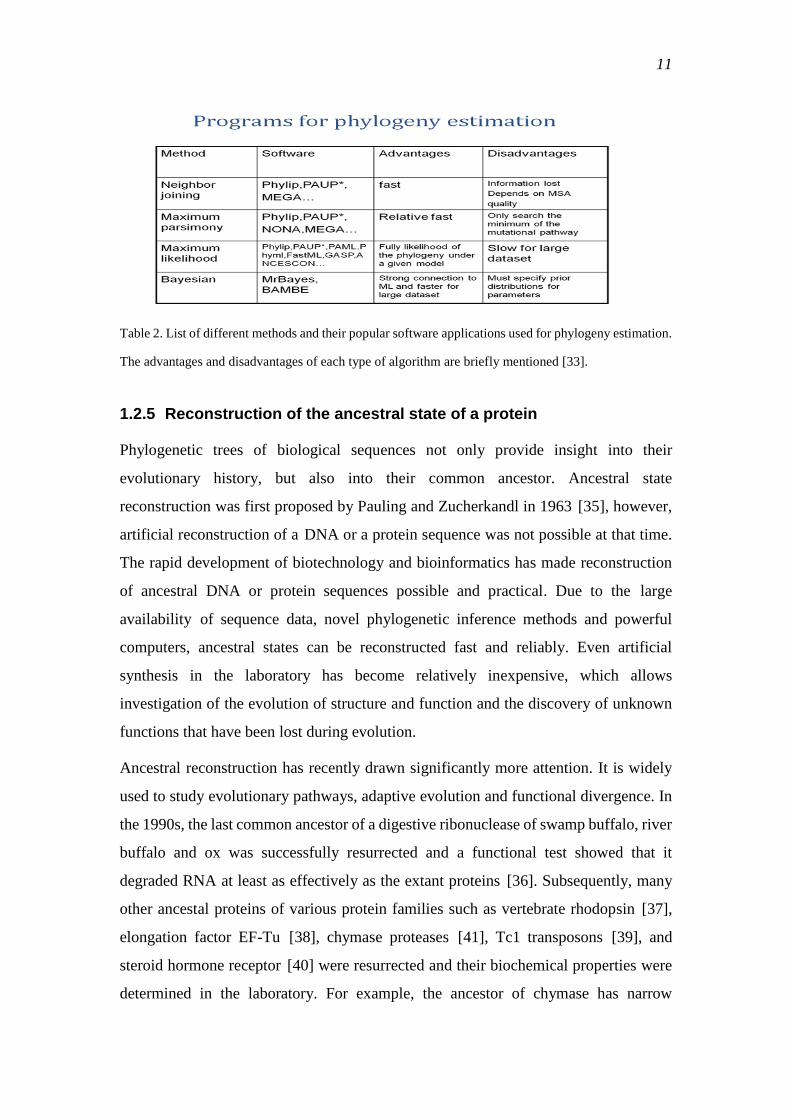
The following table gives an overview of different kinds of algorithms and their
applications. Among these, mrbayes [32] has been suggested to be the best for
inferring phylogeny [33, 34].
root
Orangutan
a)
Chimpanzee
b) Human Chimpanzee
1 1
2
3 1 1
5
Orangutan Human
Figure 2. Phylogenetic trees of Human,,Chimpanzee and orangutan, a) a rooted tree, b) an
un-rooted tree
11
Table 2. List of different methods and their popular software applications used for phylogeny estimation.
The advantages and disadvantages of each type of algorithm are briefly mentioned [33].
1.2.5 Reconstruction of the ancestral state of a protein
Phylogenetic trees of biological sequences not only provide insight into their
evolutionary history, but also into their common ancestor. Ancestral state
reconstruction was first proposed by Pauling and Zucherkandl in 1963 [35], however,
artificial reconstruction of a DNA or a protein sequence was not possible at that time.
The rapid development of biotechnology and bioinformatics has made reconstruction
of ancestral DNA or protein sequences possible and practical. Due to the large
availability of sequence data, novel phylogenetic inference methods and powerful
computers, ancestral states can be reconstructed fast and reliably. Even artificial
synthesis in the laboratory has become relatively inexpensive, which allows
investigation of the evolution of structure and function and the discovery of unknown
functions that have been lost during evolution.
Ancestral reconstruction has recently drawn significantly more attention. It is widely
used to study evolutionary pathways, adaptive evolution and functional divergence. In
the 1990s, the last common ancestor of a digestive ribonuclease of swamp buffalo, river
buffalo and ox was successfully resurrected and a functional test showed that it
degraded RNA at least as effectively as the extant proteins [36]. Subsequently, many
other ancestal proteins of various protein families such as vertebrate rhodopsin [37],
elongation factor EF-Tu [38], chymase proteases [41], Tc1 transposons [39], and
steroid hormone receptor [40] were resurrected and their biochemical properties were
determined in the laboratory. For example, the ancestor of chymase has narrow
12
substrate specificity as in alpha chymase [41]. The ancestor of eubacterial EF-Tu was a
thermophile, not a mesophile or hyperthermophile, because its temperature optimum
was 55-65oC [38]. The ancestor of rhodopsin in birds and other dinosaurs supported
dim-light vision, which suggests that the first dinosaurs might have been nocturnal
rather than diurnal [37, 42, 43]
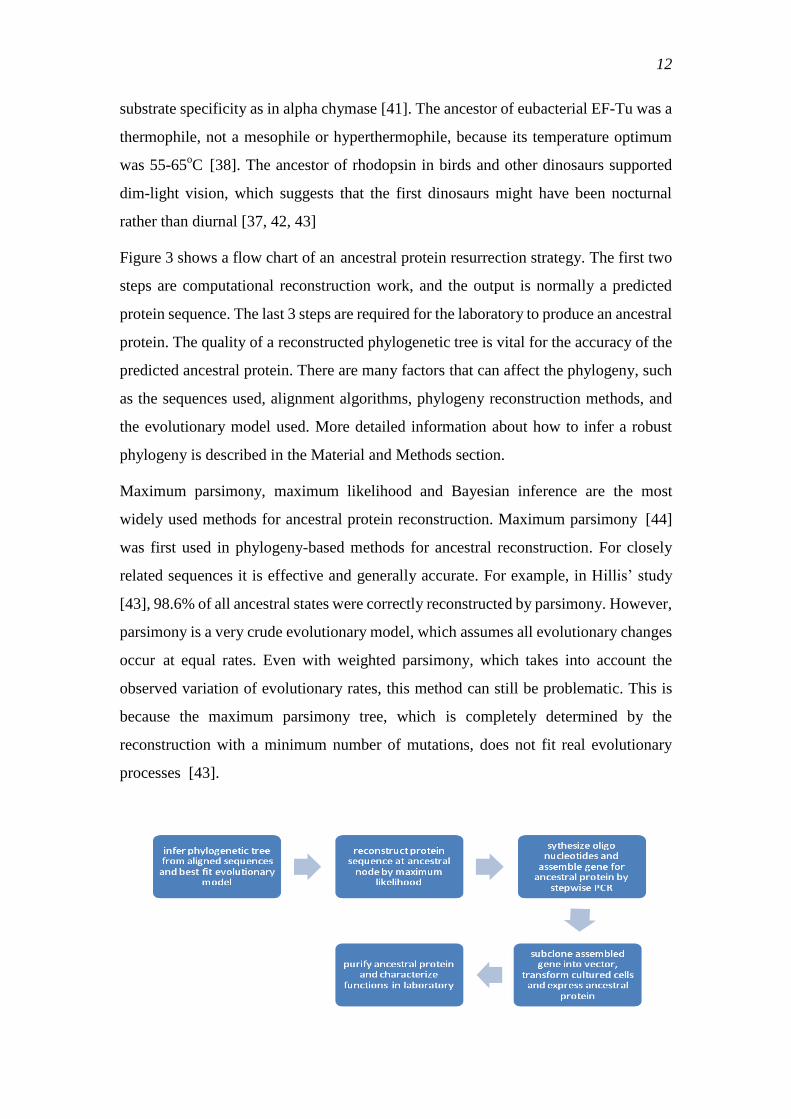
Figure 3 shows a flow chart of an ancestral protein resurrection strategy. The first two
steps are computational reconstruction work, and the output is normally a predicted
protein sequence. The last 3 steps are required for the laboratory to produce an ancestral
protein. The quality of a reconstructed phylogenetic tree is vital for the accuracy of the
predicted ancestral protein. There are many factors that can affect the phylogeny, such
as the sequences used, alignment algorithms, phylogeny reconstruction methods, and
the evolutionary model used. More detailed information about how to infer a robust
phylogeny is described in the Material and Methods section.
Maximum parsimony, maximum likelihood and Bayesian inference are the most
widely used methods for ancestral protein reconstruction. Maximum parsimony [44]
was first used in phylogeny-based methods for ancestral reconstruction. For closely
related sequences it is effective and generally accurate. For example, in Hillis‘ study
[43], 98.6% of all ancestral states were correctly reconstructed by parsimony. However,
parsimony is a very crude evolutionary model, which assumes all evolutionary changes
occur at equal rates. Even with weighted parsimony, which takes into account the
observed variation of evolutionary rates, this method can still be problematic. This is
because the maximum parsimony tree, which is completely determined by the
reconstruction with a minimum number of mutations, does not fit real evolutionary
processes [43].
13
Figure 4. Flow chart of stages required for ancestral protein resurrection. Protein sequences are favored
over DNA sequences because they are less noisy. Maximum likelihood or Bayesian inference methods
are used to build the best phylogeny [43]
In contrast to parsimony, maximum likelihood [45] and Bayesian inference methods
[46] result in a more reliable and accurate ancestral reconstruction [43]. These methods
are based on a more realistic evolutionary model, in which multiple mutation events at
the same site are taken into account, and all possible evolutionary pathways that are
compatible with the data are considered. Compared to parsimony estimation, maximum
likelihood and Bayesian methods are more accurate, especially for a highly-divergent
set of sequences. Ancestral states that are ambiguous under parsimony can be estimated
well by maximum likelihood.
1.2.6 Investigation of the evolutionary pathway
Evolutionary information is encoded in genetic material. Mutations accumulate from
generation to generation and may cause loss or gain of functions. By using comparative
proteomics and phylogenetic reconstruction, tracing evolutionary history has become
possible and is now an important part of protein studies. On one hand, sequence
elements important for function or structure in present-day proteins can be detected,
which is important for studying selection and adaptation. On the other hand,
information about the creation, expansion and extinction of both proteins and species
can elucidate the evolutionary mechanisms responsible for the incredible diversity of
life on earth.
1.2.7 Structure comparison
The PDB database provides a large number of high resolution three dimensional crystal
structures of various proteins. Searching for kinesin structure, for example, gives 77
different kinesin structures in different states, such as nucleotide-free state, ADP
binding, AMPNP binding, and even in complex with a microtubule. This enables a
direct study of the structures by comparing the same protein in different states. Many
important features, such as the structural conformation and protein-protein interactions
14
can be discovered in this way. However, the comparison may be difficult because of the
high complexity of the protein structure.
With the help of bioinformatics, similar structures can be aligned and visualized. The
structural alignments can expose the positions, where potential conformational changes
take place. These regions are normally under purifying selection. Thus, a local high
sequence similarity can be observed. This makes it possible to use comparative analysis
to study functional regions of proteins and to make predictions about conformational
changes.
1.3 kinesin-1 project
1.3.1 kinesin super-family
Since kinesin was first purified and named in 1985, over 3,500 kinesin research papers
have been published. Various types of kinesins have been detected and the kinesin
super-family is thought to be subdivided into 14 sub-families, which was shown by the
work of Lawrence et al. [14]. This result was supported by the work of Miki et al. [16]
who analyzed over 600 kinesin sequences. However, depending on the number of
kinesins sampled and the methods used for tree construction, the phylogenetic trees can
differ substantially. For example, the sister group most closely related to the kinesin-1
family is kinesin-3 (formerly KRP85/85) in one tree (Figure 5) and kinesin-14
(formerly C-terminal kinesins) in another [14]. The aberrant kinesin SMY1 of
Saccharomyces cerevisiae is a distant outgroup for all kinesins in one reconstruction
[15] but a member of the kinesin-1 family in another [14].
As more and more genomes have been sequenced and have been made available in the
public databases, the number of kinesin sequences has increased to over 2,000. In this
project, the kinesin sequence database is expanded and a new phylogenetic tree of the
entire kinesin super-family is constructed using an evolutionary model based
maximum likelihood algorithm. This allows the previously defined kinesin families
and their relationships to be tested with a much larger dataset and with more realistic
phylogenetic models.
15
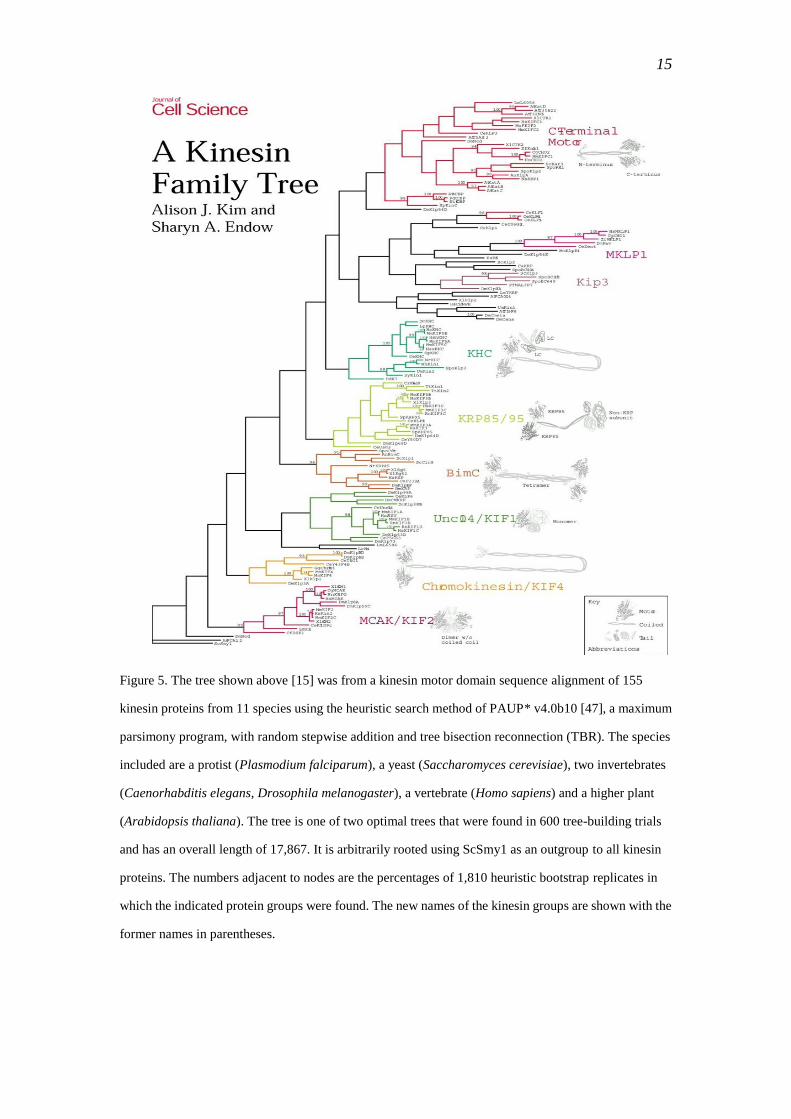
Figure 5. The tree shown above [15] was from a kinesin motor domain sequence alignment of 155
kinesin proteins from 11 species using the heuristic search method of PAUP* v4.0b10 [47], a maximum
parsimony program, with random stepwise addition and tree bisection reconnection (TBR). The species
included are a protist (Plasmodium falciparum), a yeast (Saccharomyces cerevisiae), two invertebrates
(Caenorhabditis elegans, Drosophila melanogaster), a vertebrate (Homo sapiens) and a higher plant
(Arabidopsis thaliana). The tree is one of two optimal trees that were found in 600 tree-building trials
and has an overall length of 17,867. It is arbitrarily rooted using ScSmy1 as an outgroup to all kinesin
proteins. The numbers adjacent to nodes are the percentages of 1,810 heuristic bootstrap replicates in
which the indicated protein groups were found. The new names of the kinesin groups are shown with the
former names in parentheses.
16
Until now, the classification of kinesin sequences has been based on phylogeny. For
new kinesin sequences, using phylogeny to assign them to their corresponding groups
is time-consuming and is strongly dependent on the quality of the phylogenetic tree.
However, the phylogeny can vary according to the size of the dataset and range of taxa
sampled.
A phylogenetic tree with a large number of kinesin sequences enables the creation of
reliable character state models for each kinesin sub-family in order to classify new
kinesin sequences quickly and correctly. An automatic classification tool is
implemented in this project and integrated in the web server to make it accessible to
kinesin researchers.
Together with the standard evolutionary tree of life, the kinesin distribution in
organisms the evolutionary history of the kinesin is investigated briefly. When did a
new kinesin group come into existance? How many common kinesin groups are there
in one particular taxonomic group? How many kinesin groups differ among taxa. All of
these questions are addressed in this project.
It is known that the motor domain of kinesin is highly conserved. A previous study has
identified eight functional and structural motifs. However, because this analysis was
based on only 106 sequences, it is questionable whether these motifs will be detectable
as the number of sequences increases. In this project, a relatively robust set of motifs
within the kinesin motor domain has been determined. It is used to predict functional
and structural elements of the kinesin motor domain.
1.3.2 kinesin-1 sub-family
Kinesin-1, formerly called conventional kinesin, comprises kinesins involved in the
transport of cargo through the cytoplasm. It is known that kinesin-1 can be found in all
cell types and is expressed throughout cell development. Most kinesin-1s are located in
the cytoplasm without binding cargo, while some transport various cargoes toward
microtubule plus ends. Experimental tests with kinesin-1 antibodies have shown the
inhibition of movement of tubular lysosomes, Golgi-derived transport vesicles,
membrane bounded pigments and intermediate filament networks. Inhibition of
kineisn-1 mRNA with complementary antisense oligonucleotides inhibits
transportation of various proteins in axons [48-51].
17
In the presence of ATP, kinesin-1 can bind to microtubules for movement; however, the
mechanism of converting energy from ATP hydrolysis into mechanical force is still
unknown.
Kinesin-1 is a dimer formed by two identical chains, each chain consisting of a heavy
chain, a coiled coil stalk and a light chain. The heavy chain is composed of the motor
domain, normally about 325 amino acids long, and a short neck linker, 10 to 15 amino
acids long, which is directly connected with the motor domain and binds the coiled coil
stalk. The coiled coil stalk is linked to the tail region formed by the light chain, which is
involved in cargo binding and appears to have regulatory functions.
1.3.3 Dichotomy of kinesin-1 in phylogeny and in motility
The development of in vitro motility assays, combined with very sensitive
displacement and force measuring apparatus, has enabled direct monitoring of
kinesin-1 motility in cell free assays by observation under the light microscope.
Motile properties of kinesin-1 from different species have been determined.
Intriguingly, it was found that all tested animal kinesin-1 are slow motors (~0.6µm sec-1
)
with comparatively low ATPase rates in the motor domain (kcat 60-80 sec-1
) [52],
whereas the fungal kinesins are ―fast‖ motors (~2.5 µm sec-1
) with high ATPase
activity (kcat ~260 sec-1
) [53].
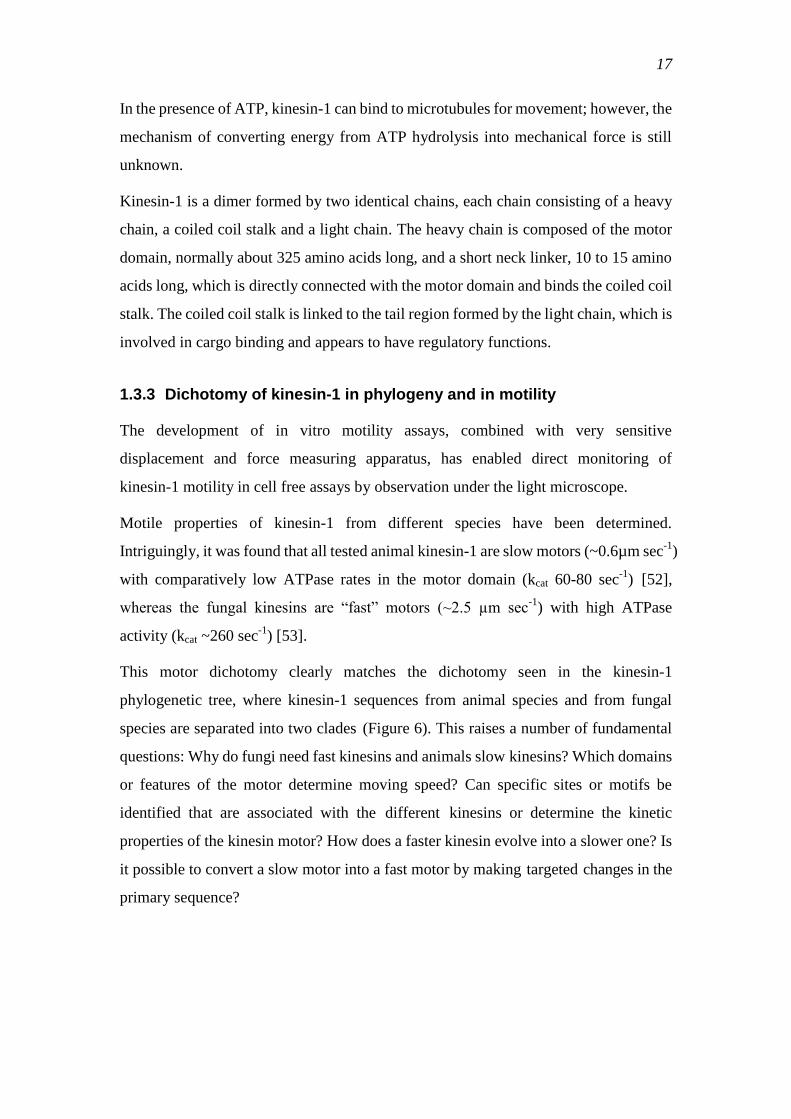
This motor dichotomy clearly matches the dichotomy seen in the kinesin-1
phylogenetic tree, where kinesin-1 sequences from animal species and from fungal
species are separated into two clades (Figure 6). This raises a number of fundamental
questions: Why do fungi need fast kinesins and animals slow kinesins? Which domains
or features of the motor determine moving speed? Can specific sites or motifs be
identified that are associated with the different kinesins or determine the kinetic
properties of the kinesin motor? How does a faster kinesin evolve into a slower one? Is
it possible to convert a slow motor into a fast motor by making targeted changes in the
primary sequence?
18
1.3.4 Previous laboratory research on motility
In the past decade, the enzymatic and kinetic properties of kineisn-1 of both fungal
species and animal species have been characterized; some of them are listed in (Table
3). The tree groups ascomyceta, basidiomyceta, zygomyceta together, although they
are actually rather evolutionary divergent. This is also seen among animals from highly
divergent groups including insecta, vetebrata and mollusca. All five fungal kinesins
show gliding velocities of between 1.8 and 3.4µm sec-1
, while all animal kinesin-1s
show gliding velocities in the range 0.4-0.9µm sec-1
(Table 3).
Fungal kinesin-1
Species Group Speed Reference
Neurospora crassa Ascomyceta 2.5µm sec-1
[53]
Aspergillus nidulans Ascomyceta 2.01µm sec-1
[54]
Syncephalastrum
racemosum
Zygomyceta 2.1–3.4µm sec
-1
[55]
Ustilago maydis Basidiomyceta 1.8µm sec-1
[56]
Animal kinesin-1
Drosophila melanogaster Insecta 0.9µm sec-1
[57]
Homo sapiens vetebrata 0.45µm sec-1
[58]
L. pealii Mollusc 0.5µm sec-1
[59]
Table 3. List of kinesins that have been experimentally studied their taxonomic group and velocity.
Figure 6. The kinesin-1 family tree built by Kim and Endow [15] using
14 sequences is clearly subdivided into an upper ‗animal‘ branch
(green) and a lower ‗fungal‘ branch (black).
19
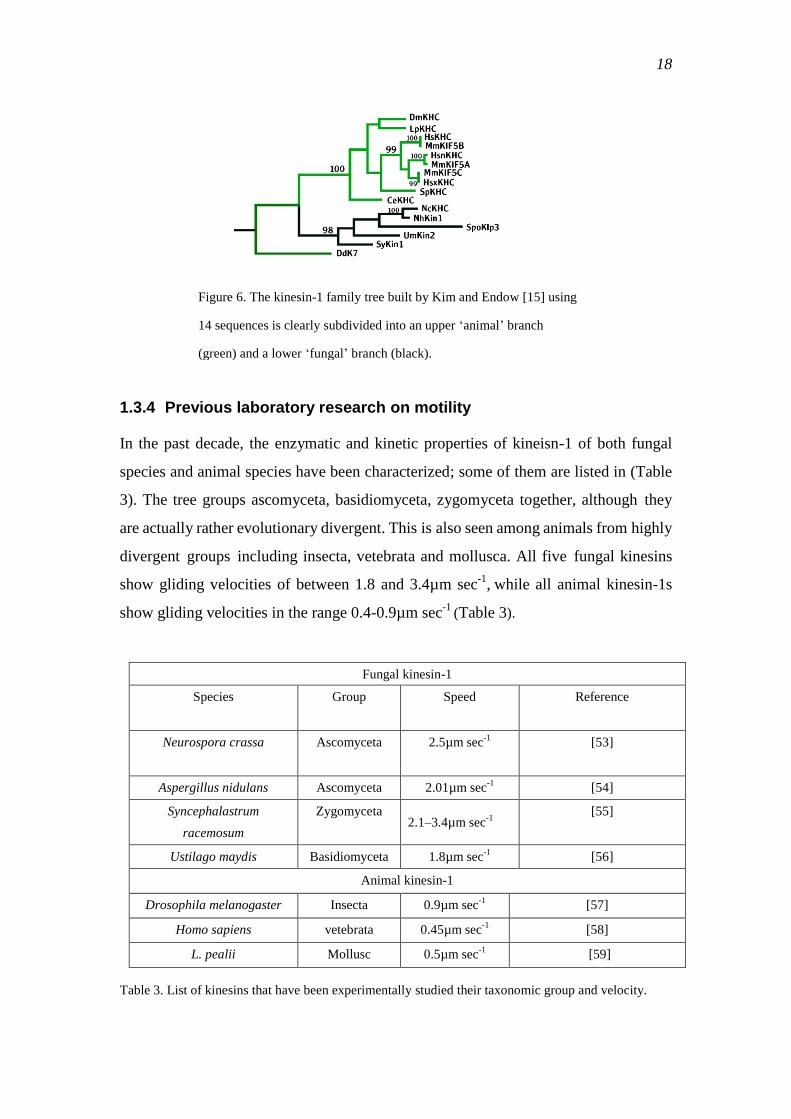
To address the question of how structure determines motor velocity, there have been
many experimental attempts over the years. For example, chimeras of Neurospora
kinesin-1 and human kinesin-1 were generated where the neck and hinge domains of
Neurospora kinesin, which are important for motor function (kallipolitou et al. 2001)
[60], were replaced by the corresponding human kinesin domains (Figure 7).
Construct Velocity
____________________________________________________________
HsKin546 0.40.1
NcKinhtail 2.70.3
NcKinneck384 2.20.3
NcKinhead 2.30.3
head neck hinge stalk
Figure 7. Motor speed of chimeric constructs as measured in gliding assays. Red indicates Neurospora
kinesin-1 and green to human kinesin-1. The neck construct was extended by 5 amino acids into the
hinge since the hinge tryptophan 384 has been demonstrated to be crucial for dimerization of the
Neuropora kinesin-1 neck [58].
These experiments indicate that the gliding velocity is exclusively determined by the
motor domain (unpublished observations by F.Bathe, Ph.D thesis, 2004), but not the
neck and hinge domain, which were demonstrated to be important for motor activity by
many studies [55, 58, 60]. Replacement of the neck, hinge and stalk domains of slow
motors in the human kinesin-1 (see Figure 8) did not affect kinesin velocity.
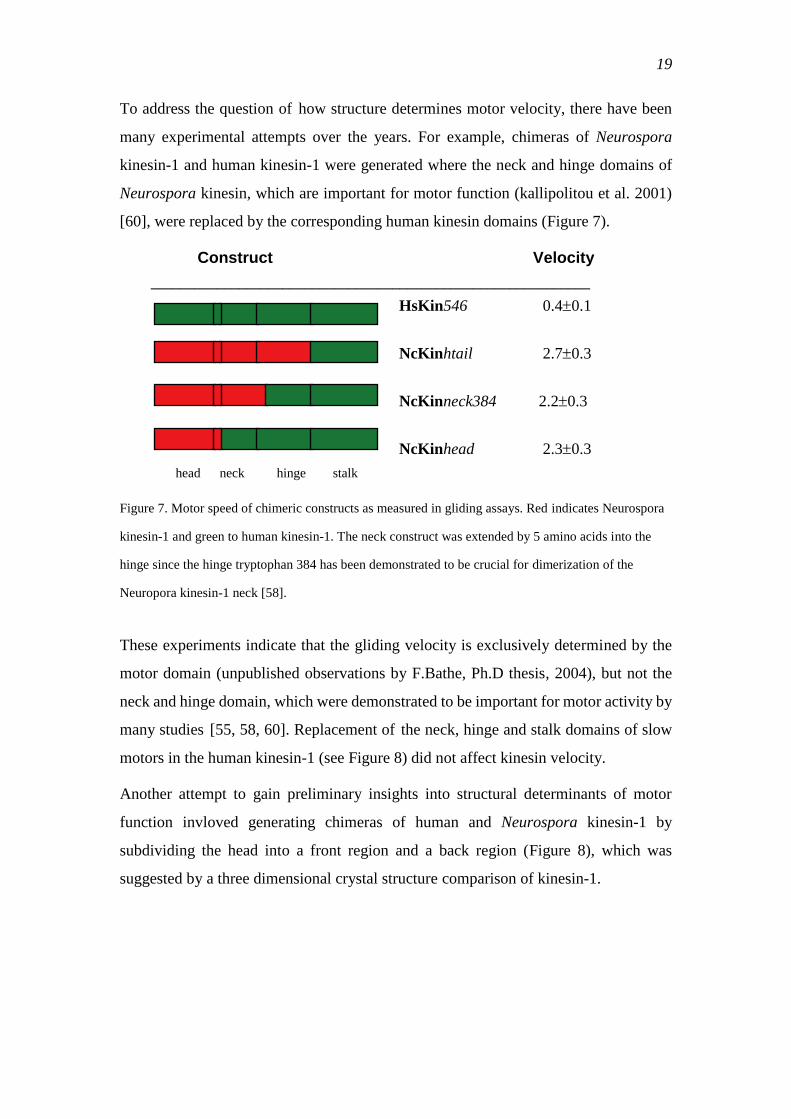
Another attempt to gain preliminary insights into structural determinants of motor
function invloved generating chimeras of human and Neurospora kinesin-1 by
subdividing the head into a front region and a back region (Figure 8), which was
suggested by a three dimensional crystal structure comparison of kinesin-1.
20
Figure 8. Motor domain chimeras of human kinesin-1 (green) and Neurospora kinesin-1 (red). The rest
of the construct was derived from human kinesin
This experiment showed that a simple rearrangement of structural domains between a
fast and a slow motor (third chimera in Figure 8), does not result in higher motor
velocity. In contrast, the second chimera in Figure 8 actually slows down the motor
(unpublished; A. Kallipolitou, PhD thesis, 2001).
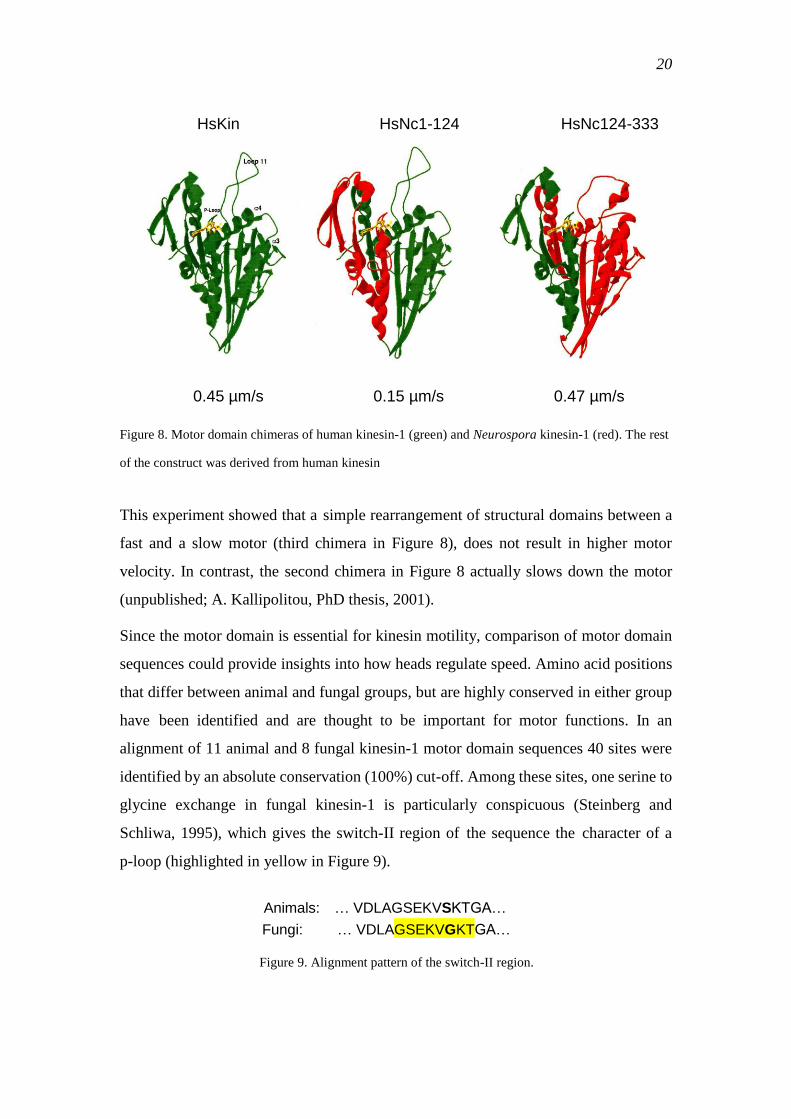
Since the motor domain is essential for kinesin motility, comparison of motor domain
sequences could provide insights into how heads regulate speed. Amino acid positions
that differ between animal and fungal groups, but are highly conserved in either group
have been identified and are thought to be important for motor functions. In an
alignment of 11 animal and 8 fungal kinesin-1 motor domain sequences 40 sites were
identified by an absolute conservation (100%) cut-off. Among these sites, one serine to
glycine exchange in fungal kinesin-1 is particularly conspicuous (Steinberg and
Schliwa, 1995), which gives the switch-II region of the sequence the character of a
p-loop (highlighted in yellow in Figure 9).
Animals: … VDLAGSEKVSKTGA…
Fungi: … VDLAGSEKVGKTGA…
Figure 9. Alignment pattern of the switch-II region.
HsKin HsNc1-124 HsNc124-333
0.45 µm/s 0.15 µm/s 0.47 µm/s
21
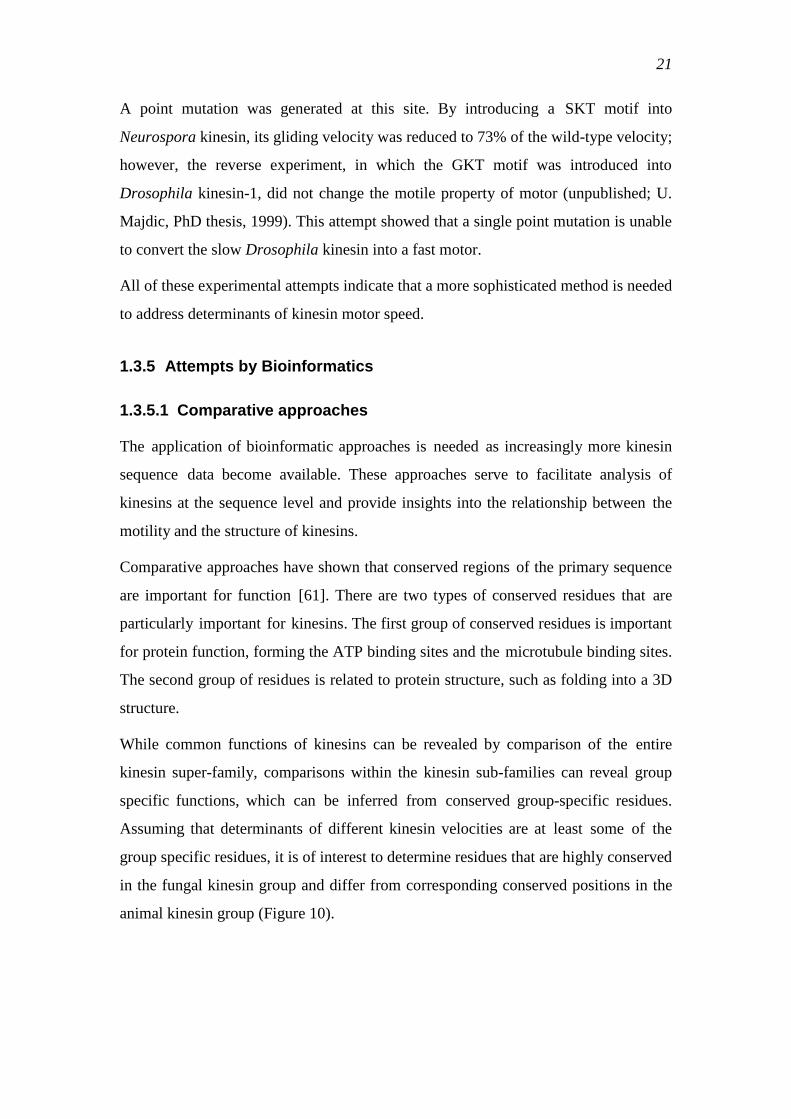
A point mutation was generated at this site. By introducing a SKT motif into
Neurospora kinesin, its gliding velocity was reduced to 73% of the wild-type velocity;
however, the reverse experiment, in which the GKT motif was introduced into
Drosophila kinesin-1, did not change the motile property of motor (unpublished; U.
Majdic, PhD thesis, 1999). This attempt showed that a single point mutation is unable
to convert the slow Drosophila kinesin into a fast motor.
All of these experimental attempts indicate that a more sophisticated method is needed
to address determinants of kinesin motor speed.
1.3.5 Attempts by Bioinformatics
1.3.5.1 Comparative approaches
The application of bioinformatic approaches is needed as increasingly more kinesin
sequence data become available. These approaches serve to facilitate analysis of
kinesins at the sequence level and provide insights into the relationship between the
motility and the structure of kinesins.
Comparative approaches have shown that conserved regions of the primary sequence
are important for function [61]. There are two types of conserved residues that are
particularly important for kinesins. The first group of conserved residues is important
for protein function, forming the ATP binding sites and the microtubule binding sites.
The second group of residues is related to protein structure, such as folding into a 3D
structure.
While common functions of kinesins can be revealed by comparison of the entire
kinesin super-family, comparisons within the kinesin sub-families can reveal group
specific functions, which can be inferred from conserved group-specific residues.
Assuming that determinants of different kinesin velocities are at least some of the
group specific residues, it is of interest to determine residues that are highly conserved
in the fungal kinesin group and differ from corresponding conserved positions in the
animal kinesin group (Figure 10).
22
HsKHC SKPYAFDRVFQSSTSQEQVYNDCAKKIVKDVLEGYNGTIFAYGQTSSGKTHTMEGK-LHDPEGMGIIPRIVQDIFNYIYS
DmKHC GKVYLFDKVFKPNASQEKVYNEAAKSIVTDVLAGYNGTIFAYGQTSSGKTHTMEGV-IGDSVKQGIIPRIVNDIFNHIYA
CeKHC GKVYVFDKVFKPNTTQEQVYKGAAYHIVQDVLSGYNGTVFAYGQTSSGKTHTMEGV-IGDNGLSGIIPRIVADIFNHIYS
LpKHC GKVFVFDKVLKPNVSQEYVYNVGAKPIVADVLSGCNGTIFAYGQTSSGKTHTMEGV-LDKPSMHGIIPRIVQDIFNYIYG
MmKIF5a GKPYVFDRVFPPNTTQEQVYHACAMQIVKDVLAGYNGTIFAYGQTSSGKTHTMEGK-LHDPQLMGIIPRIARDIFNHIYS
SpKHC GKLNMFDRIFKPNTTQEEVYNKAARQIVKDVLDGYNGTIFAYGQTSSGKTFTMEGV-MGNPQYMGIIPRIVQDIFNHIYQ
NcKHC QGSFTFDRVFDMSCKQSDIFDFSIKPTVDDILNGYNGTVFAYGQTGAGKSYTMMGTSIDDPDGRGVIPRIVEQIFTSILS
NhKin1 QGSFTFDRVFDMACKQQDIFDFSIRSTVDDILNGYNGTVFAYGQTGAGKSYTMMGTNIDDDDGRGVIPRIVEQIFASIMS
SpoKLP3 SGNFVFDRVFHPSSTLNDIFSYSIESTVDDLFLGYNGTVLAYGQTGSGKTYTMMGI-ENNFEKEGMTPRMLRRIFDKIRD
SyKin1 KGNFNFDKVFGMNTAQKDVFDYSIKTIVDDVTAGYNGTVFAYGQTGSGKTFTMMGADIDDEKTKGIIPRIVEQIFDSIMA
UmKin2 AGGFVFDKVFPMNTMQRDVFEFGIKETVEDVLNGYNGTIFAYGQTGSGKTFTMMGSDIDNDNLKGIIPRITEQIFENIMA
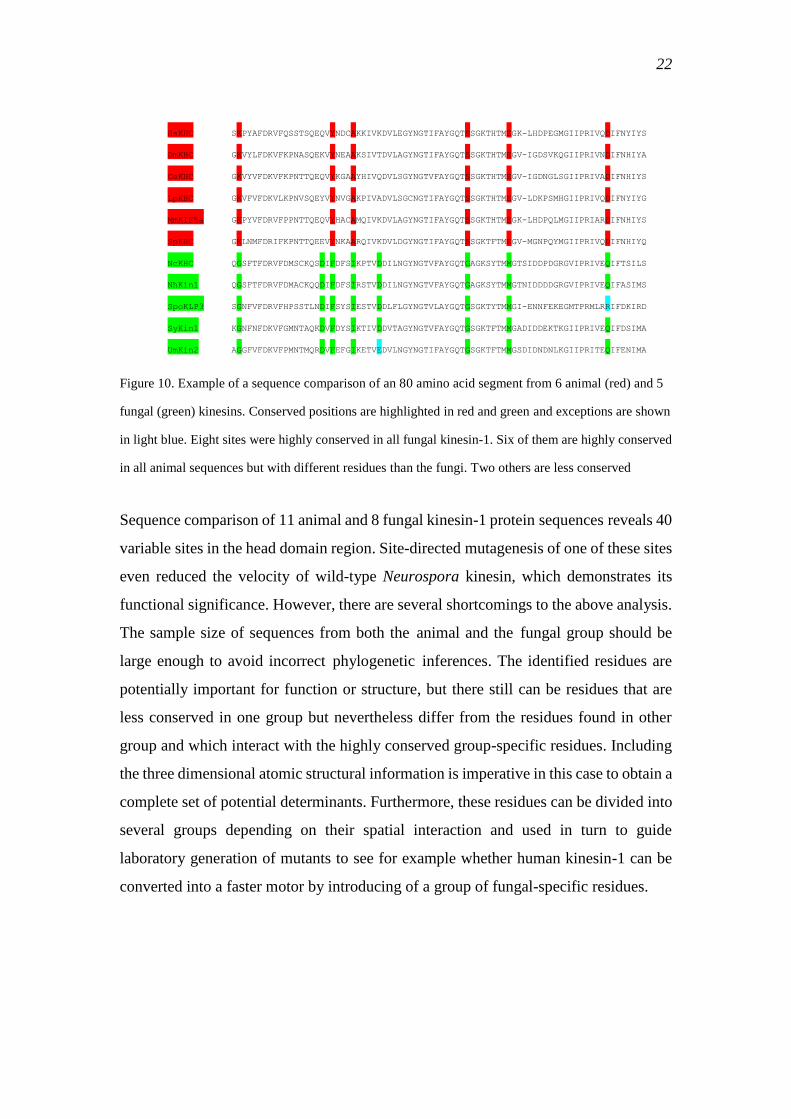
Figure 10. Example of a sequence comparison of an 80 amino acid segment from 6 animal (red) and 5
fungal (green) kinesins. Conserved positions are highlighted in red and green and exceptions are shown
in light blue. Eight sites were highly conserved in all fungal kinesin-1. Six of them are highly conserved
in all animal sequences but with different residues than the fungi. Two others are less conserved
Sequence comparison of 11 animal and 8 fungal kinesin-1 protein sequences reveals 40
variable sites in the head domain region. Site-directed mutagenesis of one of these sites
even reduced the velocity of wild-type Neurospora kinesin, which demonstrates its
functional significance. However, there are several shortcomings to the above analysis.
The sample size of sequences from both the animal and the fungal group should be
large enough to avoid incorrect phylogenetic inferences. The identified residues are
potentially important for function or structure, but there still can be residues that are
less conserved in one group but nevertheless differ from the residues found in other
group and which interact with the highly conserved group-specific residues. Including
the three dimensional atomic structural information is imperative in this case to obtain a
complete set of potential determinants. Furthermore, these residues can be divided into
several groups depending on their spatial interaction and used in turn to guide
laboratory generation of mutants to see for example whether human kinesin-1 can be
converted into a faster motor by introducing of a group of fungal-specific residues.
23
1.3.5.2 Resurrecting ancestral kinesin-1 proteins
Comparative approaches can reveal functionally important residues, including residues
that control kinesin velocity. However, testing and confirming these predictions will be
clearly both labor and cost intensive.
With the increasing number of genetic sequences and sophisticated evolutionary
model-based phylogeny inference algorithms, reconstruction of reliable phylogenies of
protein super-families is becoming increasingly common and crucial for the study of
molecular evolution. It not only exposes the relationship of extant proteins, but also
makes it possible to reconstruct ancestral proteins and to apply statistical methods to
estimate past evolutionary changes to a sequence that occurred at any internal node in
the phylogenetic tree.
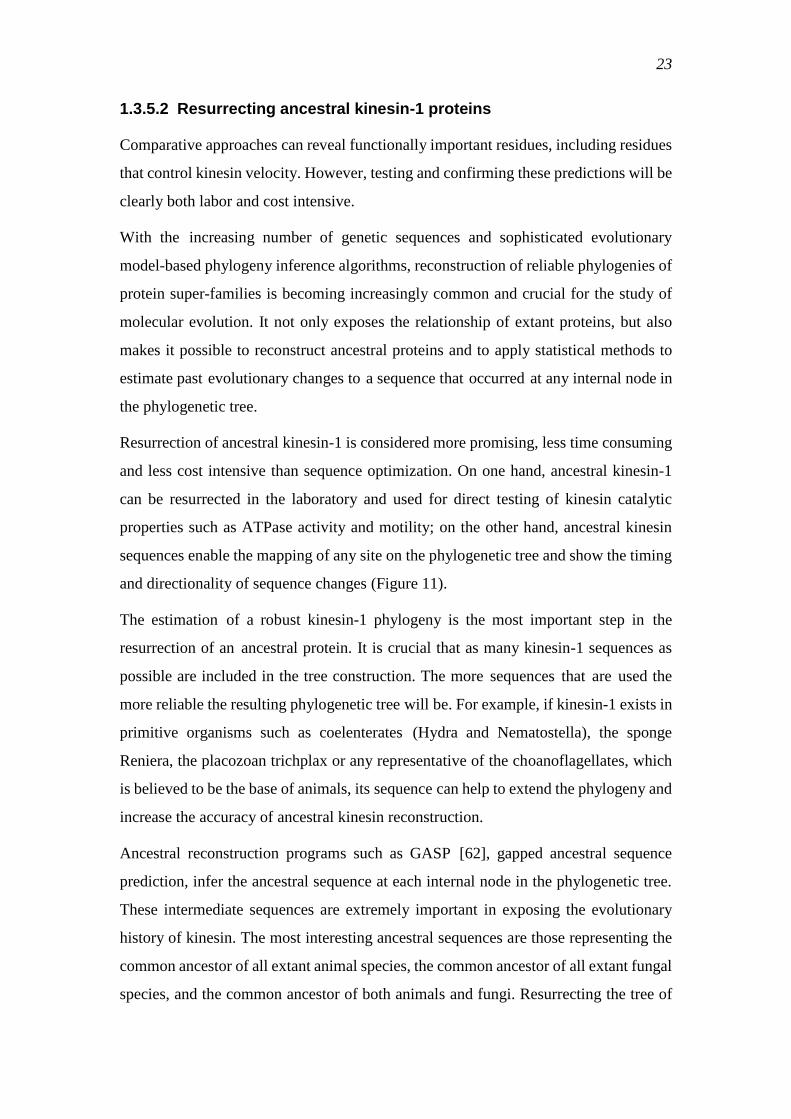
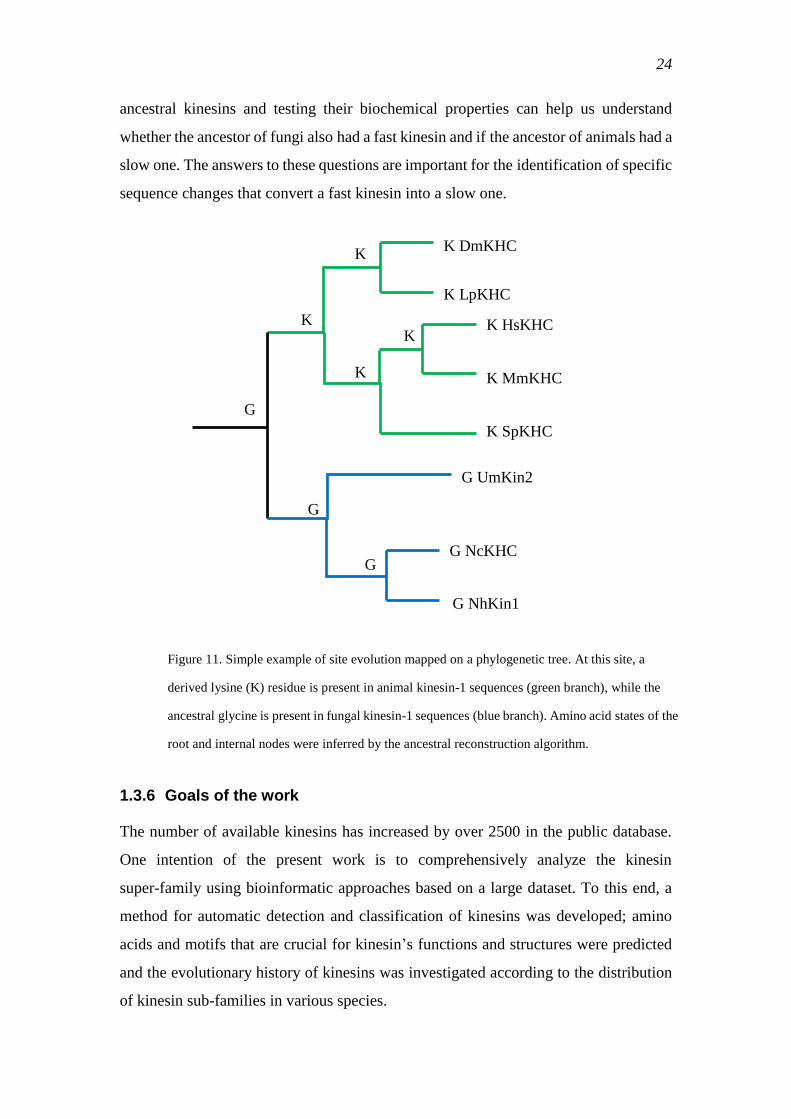
Resurrection of ancestral kinesin-1 is considered more promising, less time consuming
and less cost intensive than sequence optimization. On one hand, ancestral kinesin-1
can be resurrected in the laboratory and used for direct testing of kinesin catalytic
properties such as ATPase activity and motility; on the other hand, ancestral kinesin
sequences enable the mapping of any site on the phylogenetic tree and show the timing
and directionality of sequence changes (Figure 11).
The estimation of a robust kinesin-1 phylogeny is the most important step in the
resurrection of an ancestral protein. It is crucial that as many kinesin-1 sequences as
possible are included in the tree construction. The more sequences that are used the
more reliable the resulting phylogenetic tree will be. For example, if kinesin-1 exists in
primitive organisms such as coelenterates (Hydra and Nematostella), the sponge
Reniera, the placozoan trichplax or any representative of the choanoflagellates, which
is believed to be the base of animals, its sequence can help to extend the phylogeny and
increase the accuracy of ancestral kinesin reconstruction.
Ancestral reconstruction programs such as GASP [62], gapped ancestral sequence
prediction, infer the ancestral sequence at each internal node in the phylogenetic tree.
These intermediate sequences are extremely important in exposing the evolutionary
history of kinesin. The most interesting ancestral sequences are those representing the
common ancestor of all extant animal species, the common ancestor of all extant fungal
species, and the common ancestor of both animals and fungi. Resurrecting the tree of
24
ancestral kinesins and testing their biochemical properties can help us understand
whether the ancestor of fungi also had a fast kinesin and if the ancestor of animals had a
slow one. The answers to these questions are important for the identification of specific
sequence changes that convert a fast kinesin into a slow one.
1.3.6 Goals of the work
The number of available kinesins has increased by over 2500 in the public database.
One intention of the present work is to comprehensively analyze the kinesin
super-family using bioinformatic approaches based on a large dataset. To this end, a
method for automatic detection and classification of kinesins was developed; amino
acids and motifs that are crucial for kinesin‘s functions and structures were predicted
and the evolutionary history of kinesins was investigated according to the distribution
of kinesin sub-families in various species.
K DmKHC
K LpKHC
K HsKHC
K MmKHC
K SpKHC
G UmKin2
G NcKHC
G NhKin1
K
K K
K
G
G
G
Figure 11. Simple example of site evolution mapped on a phylogenetic tree. At this site, a
derived lysine (K) residue is present in animal kinesin-1 sequences (green branch), while the
ancestral glycine is present in fungal kinesin-1 sequences (blue branch). Amino acid states of the
root and internal nodes were inferred by the ancestral reconstruction algorithm.
25
Another aspect of the work is to infer a high-quality phylogenetic tree of the kinesin
super-family and recheck the standard kinesin sub-family classification scheme. The
maximum likelihood method was used instead of the neighbor-joining method to
avoid information loss. A new method was developed to test the reliability of the
inferred tree, because the classic bootstrap test was very CPU-time consuming for
large datasets. Based on the new phylogenetic tree, the classification scheme was
confirmed.
Furthermore, this work aims to explain why fungal and animal kinesin-1s have very
different velocities. Programs were implemented for detecting group-specific residues.
The mapping of these residues onto the fungal and animal three-dimensional crystal
structures (1BG2 and 1GOJ) has led to the discovery of several structural changes from
a closed to an open conformation of the motor domain. Possible combinations of
residues that could impact the velocity were predicted.
In addition, ancestors of fungal and animal kinesins were reconstructed in order to
understand the velocity difference by studying the evolution of velocity
At last, a kinesin web-server was constructed. It automatically detects and classifies
new kinesins and stores then in the database. It provides not only useful tools for
analyzing kinesins from sequence to structure, but also tools that can be applied to
any other protein dataset.
26
2 Materials and methods
2.1 Data collection
2.1.1 NCBI RefSeq database
The RefSeq database, started on October 9th
, 2002, is a continuing project of the
National Center for Biotechnology Information (NCBI), which aims to provide a
non-redundant collection of well-annotated DNA, RNA, and protein sequences from
diverse taxa.
Compared to other databases, RefSeq provides unique, curated sequences in addition to
rich and accurate information. Sequences from the RefSeq database are derived from
GenBank records, however, unlike GenBank, which is an archive of sequences and
annotations supplied by original authors and cannot be altered by others, each RefSeq
represents a synthesis of the primary information that is generated and submitted by a
person or group. This results in an accurate annotation of each molecule with the
organism name, strain, gene symbol and protein name by either NCBI staff or extensive
collaboration with authoritative groups.
RefSeq sequences can be easily accessed by many web sources, such as BLAST results,
Conserved Domain Database (CDD) [63], HomoloGene, UniGene and Clusters of
Orthologous Groups of protein (COG) [64], which implies that a huge information
network can be linked via RefSeq records.
RefSeq is not only accessible online, but also has a flat file format, which can be
downloaded via FTP to a local workstation. The records of RefSeq have a similar
format to the GenBank records from which they are derived, but with many novel
attributes, such as a unique accession prefix, a comment field that indicates the RefSeq
status and a source of the sequence information.
RefSeq updates are provided daily, including new entries added to the collection or
records updated to reflect sequence or annotation changes. The daily update file is also
provided at the NCBI FTP site.
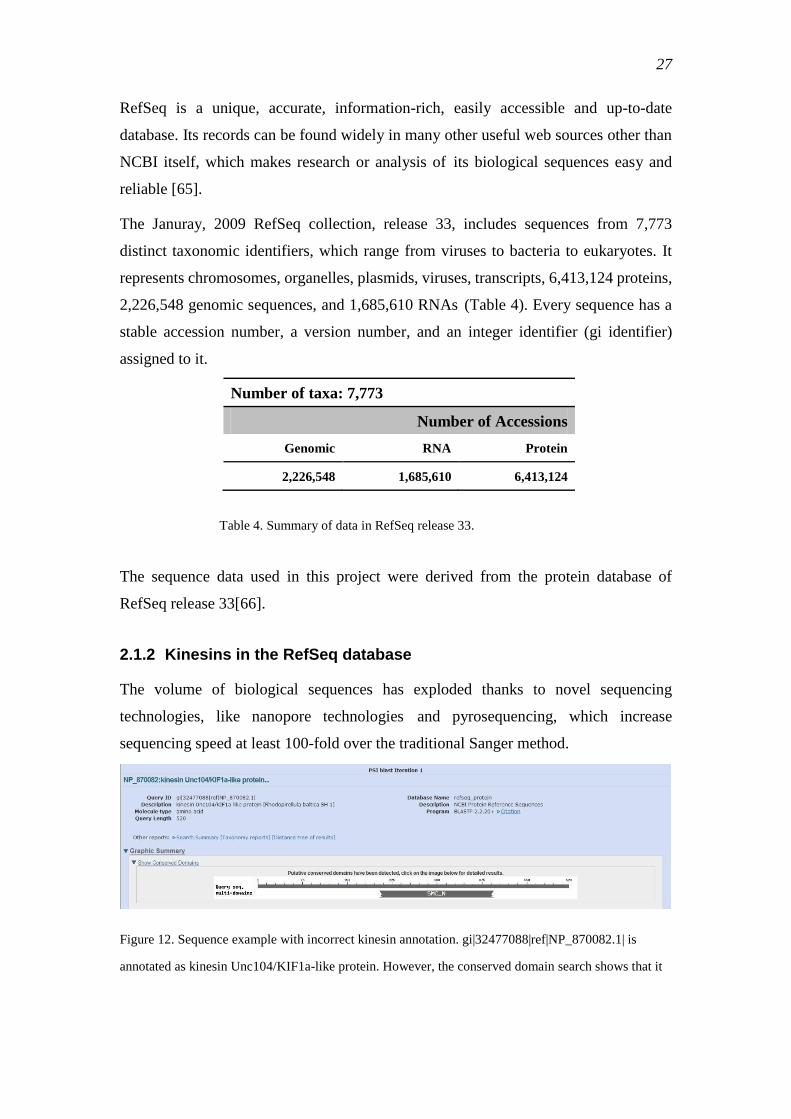
27
RefSeq is a unique, accurate, information-rich, easily accessible and up-to-date
database. Its records can be found widely in many other useful web sources other than
NCBI itself, which makes research or analysis of its biological sequences easy and
reliable [65].
The Januray, 2009 RefSeq collection, release 33, includes sequences from 7,773
distinct taxonomic identifiers, which range from viruses to bacteria to eukaryotes. It
represents chromosomes, organelles, plasmids, viruses, transcripts, 6,413,124 proteins,
2,226,548 genomic sequences, and 1,685,610 RNAs (Table 4). Every sequence has a
stable accession number, a version number, and an integer identifier (gi identifier)
assigned to it.
Table 4. Summary of data in RefSeq release 33.
The sequence data used in this project were derived from the protein database of
RefSeq release 33[66].
2.1.2 Kinesins in the RefSeq database
The volume of biological sequences has exploded thanks to novel sequencing
technologies, like nanopore technologies and pyrosequencing, which increase
sequencing speed at least 100-fold over the traditional Sanger method.
Figure 12. Sequence example with incorrect kinesin annotation. gi|32477088|ref|NP_870082.1| is
annotated as kinesin Unc104/KIF1a-like protein. However, the conserved domain search shows that it
Number of taxa: 7,773
Number of Accessions
Genomic RNA Protein
2,226,548 1,685,610 6,413,124
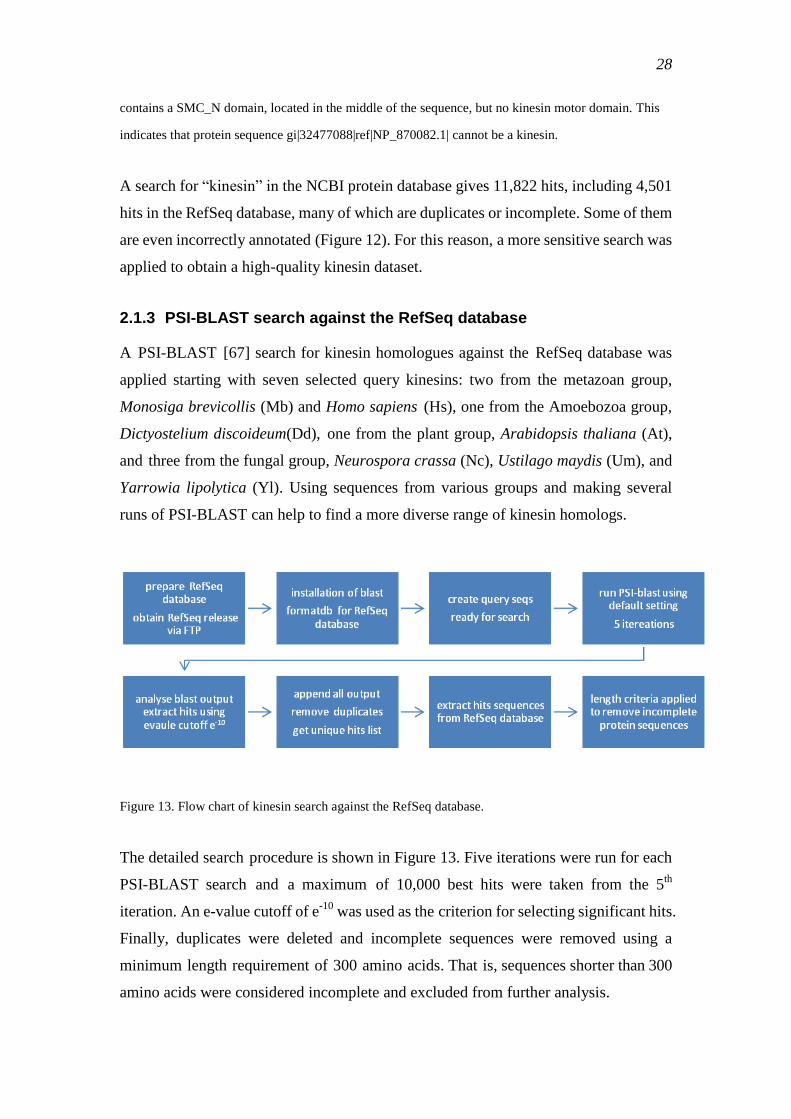
28
contains a SMC_N domain, located in the middle of the sequence, but no kinesin motor domain. This
indicates that protein sequence gi|32477088|ref|NP_870082.1| cannot be a kinesin.
A search for ―kinesin‖ in the NCBI protein database gives 11,822 hits, including 4,501
hits in the RefSeq database, many of which are duplicates or incomplete. Some of them
are even incorrectly annotated (Figure 12). For this reason, a more sensitive search was
applied to obtain a high-quality kinesin dataset.
2.1.3 PSI-BLAST search against the RefSeq database
A PSI-BLAST [67] search for kinesin homologues against the RefSeq database was
applied starting with seven selected query kinesins: two from the metazoan group,
Monosiga brevicollis (Mb) and Homo sapiens (Hs), one from the Amoebozoa group,
Dictyostelium discoideum(Dd), one from the plant group, Arabidopsis thaliana (At),
and three from the fungal group, Neurospora crassa (Nc), Ustilago maydis (Um), and
Yarrowia lipolytica (Yl). Using sequences from various groups and making several
runs of PSI-BLAST can help to find a more diverse range of kinesin homologs.
Figure 13. Flow chart of kinesin search against the RefSeq database.
The detailed search procedure is shown in Figure 13. Five iterations were run for each
PSI-BLAST search and a maximum of 10,000 best hits were taken from the 5th
iteration. An e-value cutoff of e-10
was used as the criterion for selecting significant hits.
Finally, duplicates were deleted and incomplete sequences were removed using a
minimum length requirement of 300 amino acids. That is, sequences shorter than 300
amino acids were considered incomplete and excluded from further analysis.
29
2.2 Classification of kinesin sequences
Kinesins are a large protein family and studies have shown that there are about 14
different kinesin sub-families, which vary in both structure and function. However, a
fixed nomenclature is not used when annotating kinesins in the public database, which
makes it difficult to group kinesins into sub-families. Classification of kinesins has
been a stumbling-block for many analyses of particular kinesin sub-families.
Many classification criteria have been developed in the past years, such as sequence
similarity classification, functional classification, structural classification, profile
classification, phylogenetic classification, etc. Kinesins are multi-domain proteins that
typically share high similarity in the motor domain region, but otherwise vary in shape
and function. Classification based on simple criteria such as similarity or structure can
results in a loss of accuracy because of shared common features between groups. In this
case, the profile classification and phylogenetic classification methods can better
classify the kinesins.
2.2.1 NCBI CDD classification method
NCBI provides a conserved domain database (CDD), which is a collection of multiple
sequence alignments for ancient domains and full-length proteins in the form of
position specific score matrices (PSSMs) [68]. The reverse position-specific BLAST
(RPS-BLAST) [63] search method is used to scan the CDD database for query
sequences and e-values are obtained similarly to PSI-BLAST. Unlike other models
(like pfam, smart or COG), CDD detects evidence for duplication and functional
divergence in domain families by using phylogenetic information. Kinesin has a
structure as described by a set of 14 explicit PSSM models. When scanning a kinesin
protein query sequence against CDD kinesin models, a region of query sequence may
hit more than one overlapping motif. The hits with the best score or lowest e-value
provided by one of the 14 kinesin models suggests which sub-family the query
sequence most likely belongs to. When the best hit does not match any of the 14 models,
the query sequence is considered as a kinesin homolog but not a true kinesin because it
lacks crucial amino acids required to be a functional kinesin.
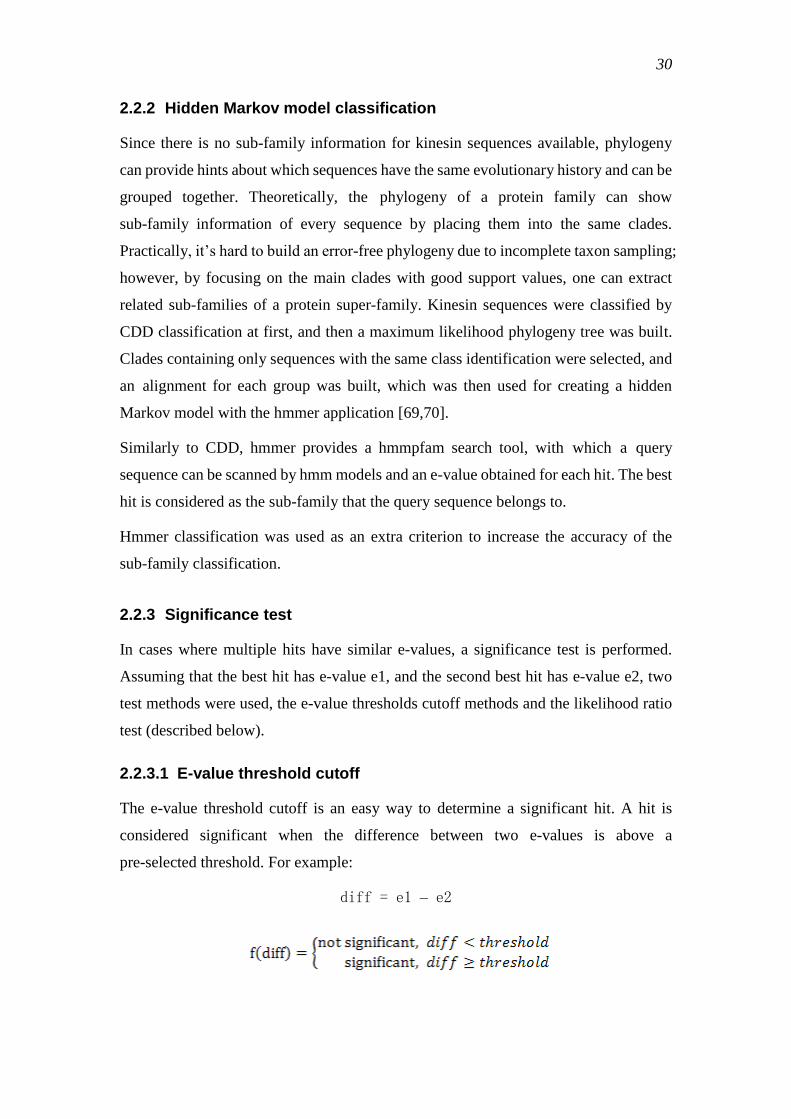
30
2.2.2 Hidden Markov model classification
Since there is no sub-family information for kinesin sequences available, phylogeny
can provide hints about which sequences have the same evolutionary history and can be
grouped together. Theoretically, the phylogeny of a protein family can show
sub-family information of every sequence by placing them into the same clades.
Practically, it‘s hard to build an error-free phylogeny due to incomplete taxon sampling;
however, by focusing on the main clades with good support values, one can extract
related sub-families of a protein super-family. Kinesin sequences were classified by
CDD classification at first, and then a maximum likelihood phylogeny tree was built.
Clades containing only sequences with the same class identification were selected, and
an alignment for each group was built, which was then used for creating a hidden
Markov model with the hmmer application [69,70].
Similarly to CDD, hmmer provides a hmmpfam search tool, with which a query
sequence can be scanned by hmm models and an e-value obtained for each hit. The best
hit is considered as the sub-family that the query sequence belongs to.
Hmmer classification was used as an extra criterion to increase the accuracy of the
sub-family classification.
2.2.3 Significance test
In cases where multiple hits have similar e-values, a significance test is performed.
Assuming that the best hit has e-value e1, and the second best hit has e-value e2, two
test methods were used, the e-value thresholds cutoff methods and the likelihood ratio
test (described below).
2.2.3.1 E-value threshold cutoff
The e-value threshold cutoff is an easy way to determine a significant hit. A hit is
considered significant when the difference between two e-values is above a
pre-selected threshold. For example:
diff = e1 – e2
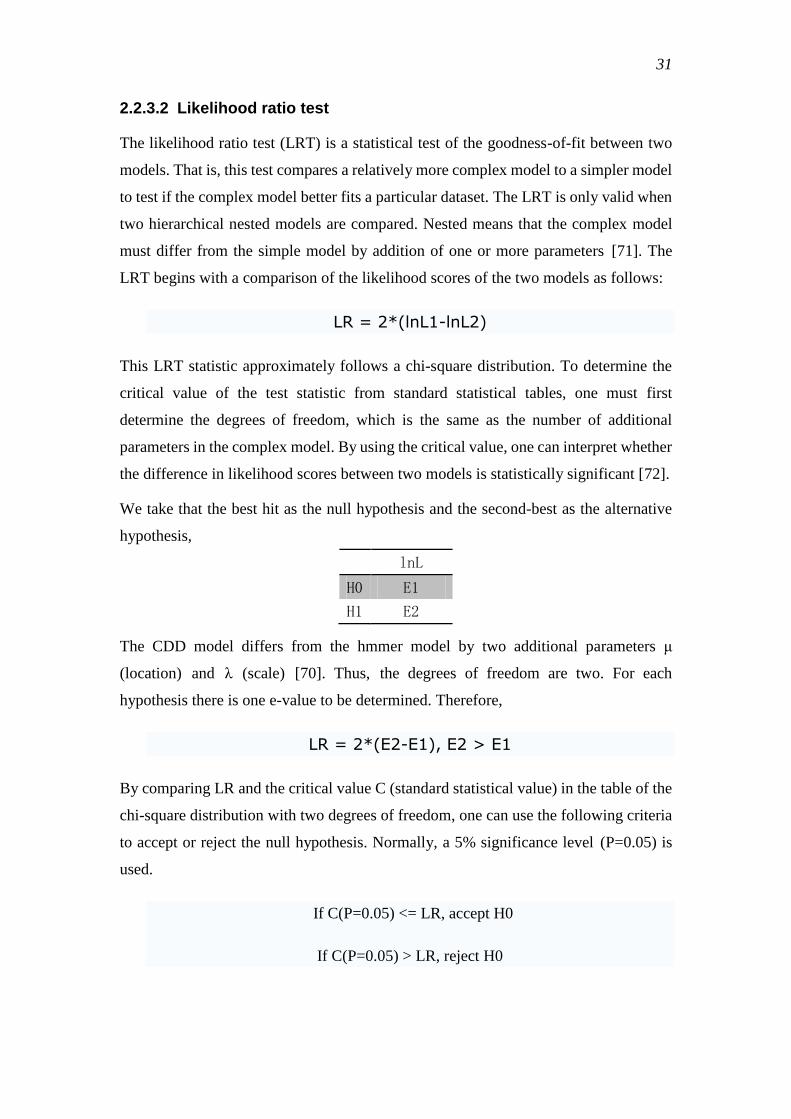
31
2.2.3.2 Likelihood ratio test
The likelihood ratio test (LRT) is a statistical test of the goodness-of-fit between two
models. That is, this test compares a relatively more complex model to a simpler model
to test if the complex model better fits a particular dataset. The LRT is only valid when
two hierarchical nested models are compared. Nested means that the complex model
must differ from the simple model by addition of one or more parameters [71]. The
LRT begins with a comparison of the likelihood scores of the two models as follows:
LR = 2*(lnL1-lnL2)
This LRT statistic approximately follows a chi-square distribution. To determine the
critical value of the test statistic from standard statistical tables, one must first
determine the degrees of freedom, which is the same as the number of additional
parameters in the complex model. By using the critical value, one can interpret whether
the difference in likelihood scores between two models is statistically significant [72].
We take that the best hit as the null hypothesis and the second-best as the alternative
hypothesis,
lnL
H0 E1
H1 E2
The CDD model differs from the hmmer model by two additional parameters μ
(location) and λ (scale) [70]. Thus, the degrees of freedom are two. For each
hypothesis there is one e-value to be determined. Therefore,
LR = 2*(E2-E1), E2 > E1
By comparing LR and the critical value C (standard statistical value) in the table of the
chi-square distribution with two degrees of freedom, one can use the following criteria
to accept or reject the null hypothesis. Normally, a 5% significance level (P=0.05) is
used.
If C(P=0.05) <= LR, accept H0
If C(P=0.05) > LR, reject H0
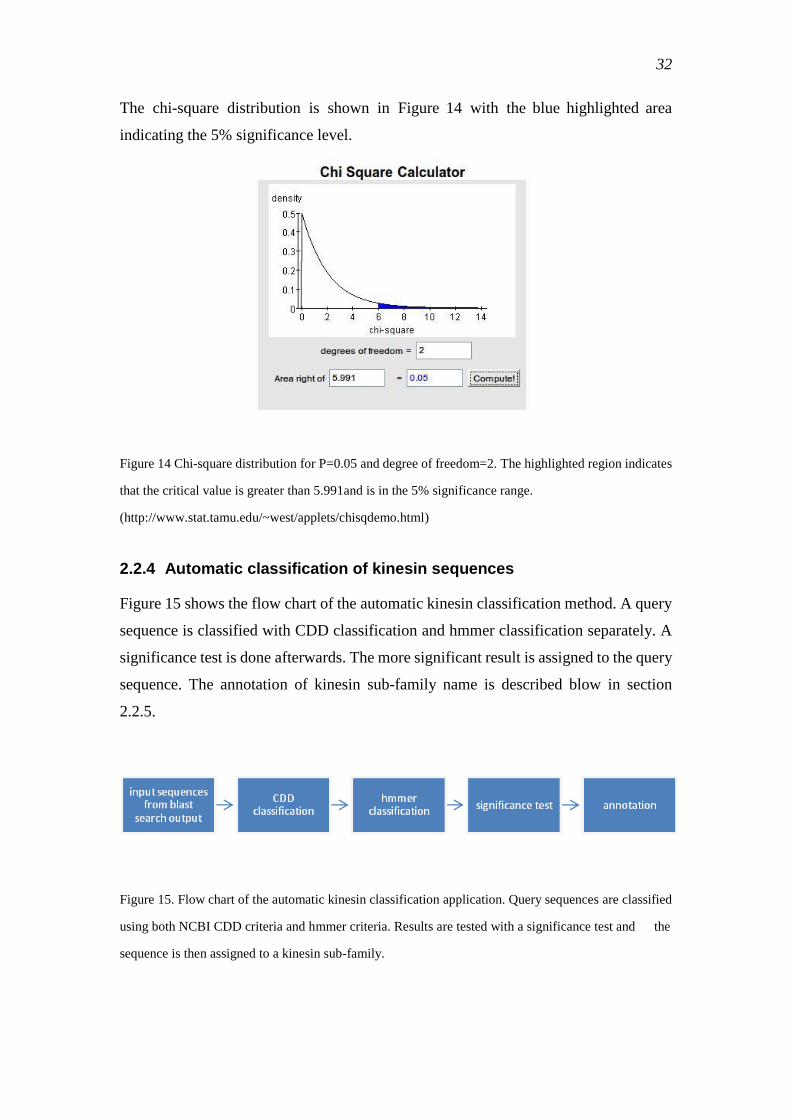
32
The chi-square distribution is shown in Figure 14 with the blue highlighted area
indicating the 5% significance level.
Figure 14 Chi-square distribution for P=0.05 and degree of freedom=2. The highlighted region indicates
that the critical value is greater than 5.991and is in the 5% significance range.
(http://www.stat.tamu.edu/~west/applets/chisqdemo.html)
2.2.4 Automatic classification of kinesin sequences
Figure 15 shows the flow chart of the automatic kinesin classification method. A query
sequence is classified with CDD classification and hmmer classification separately. A
significance test is done afterwards. The more significant result is assigned to the query
sequence. The annotation of kinesin sub-family name is described blow in section
2.2.5.
Figure 15. Flow chart of the automatic kinesin classification application. Query sequences are classified
using both NCBI CDD criteria and hmmer criteria. Results are tested with a significance test and the
sequence is then assigned to a kinesin sub-family.
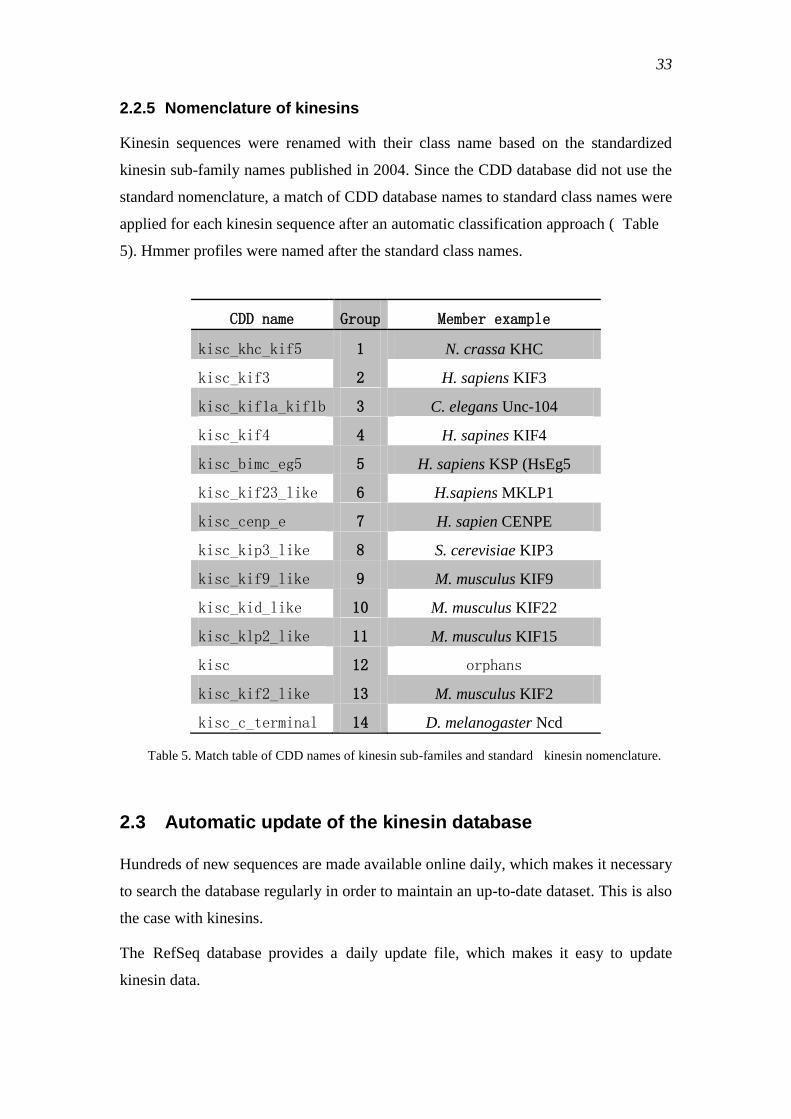
33
2.2.5 Nomenclature of kinesins
Kinesin sequences were renamed with their class name based on the standardized
kinesin sub-family names published in 2004. Since the CDD database did not use the
standard nomenclature, a match of CDD database names to standard class names were
applied for each kinesin sequence after an automatic classification approach ( Table
5). Hmmer profiles were named after the standard class names.
CDD name Group Member example
kisc_khc_kif5 1 N. crassa KHC
kisc_kif3 2 H. sapiens KIF3
kisc_kif1a_kif1b 3 C. elegans Unc-104
kisc_kif4 4 H. sapines KIF4
kisc_bimc_eg5 5 H. sapiens KSP (HsEg5
kisc_kif23_like 6 H.sapiens MKLP1
kisc_cenp_e 7 H. sapien CENPE
kisc_kip3_like 8 S. cerevisiae KIP3
kisc_kif9_like 9 M. musculus KIF9
kisc_kid_like 10 M. musculus KIF22
kisc_klp2_like 11 M. musculus KIF15
kisc 12 orphans
kisc_kif2_like 13 M. musculus KIF2
kisc_c_terminal 14 D. melanogaster Ncd
Table 5. Match table of CDD names of kinesin sub-familes and standard kinesin nomenclature.
2.3 Automatic update of the kinesin database
Hundreds of new sequences are made available online daily, which makes it necessary
to search the database regularly in order to maintain an up-to-date dataset. This is also
the case with kinesins.
The RefSeq database provides a daily update file, which makes it easy to update
kinesin data.
34
The daily update file is available at: [ftp://ftp.ncbi.nih.gov/RefSeq/daily/]. This file is
used to create a daily database for a blast search with the formatdb [26]. A psi-blast
search similar to the one described above is used to obtain new kinesin hits. After the
refinement, a fasta format sequence file is generated and is ready for classification. All
kinesin homologues are removed and only the true kinesins are assigned with a unique
class name and saved in the database.
2.4 Multiple sequence alignments
For the kinesin sequences dataset, the clustalw program [73], version 2, was used to
generate alignments. Muscle version 3.6 is an alternative choice, which generally
performs better than other alignment programs [74]; however, clustalw provides better
alignment quality when comparing several motifs within kinesin sequences.
Alignment of all kinesins was generated by the clustalw2 using the default settings. An
automatic refinement of the alignment was done with Rascal [75] with five iterations.
Alignments were generated for each kinesin sub-family to perform a sub-family
orientated analysis, such as a specific motif pattern search, and a sub-family
phylogenetic ancestral protein sequence reconstruction. Alignments for each pair of
sub-family combinations were made by profile alignments to examine variation
between sub-families, such as sub-family specific amino acids, motifs and structures.
Alignment of the entire kinesin super-family was used to create a super-family
phylogeny to reveal the relationship between sub-families and the evolutionary history
of kinesins.
The alignment of all kinesins is updated when new kinesins become available by a
sequences-profile alignment. The alignments are accessible at the website
[www.bio.uni-muenchen.de/~liu/kinesin_new/]
2.5 Comparative proteomics
Amino acids are the building blocks of proteins. The proteins aid in controlling almost
every biochemical reaction within the cell. Understanding functions of proteins and
how they work is the key to addressing questions about how cells function and evolve.
35
With computational approaches and the explosion of biological data resources,
prediction of protein functions and structures is no longer mission impossible.
Comparative genomics is a new approach to understand how life changes over time on
the molecular level. That is, to infer the evolutionary pathways of proteins by
comparing their sequence and structural similarities and differences in different
organisms and exposing the relationship between protein structure and function across
various species.
2.5.1 Conserved amino acids in kinesin sequences
Proteins that have similar functions and structures in different species are expected
share high sequence similarity. Thus, the conservation of sequence blocks across
species can be used to identify regions of a protein that are important for function and
structure. Kinesins share high sequence similarity in their motor domain and a blast
search can successfully extract thousands of kinesin candidates from the millions of
known proteins. Some regions of the protein sequence differ among kinesins that
differ in function and these regions can be used for classification of kinesins into
different sub-families.
Therefore, it is very important to identify the conserved positions in kinesins. These
positions contain information about both functions and structures of kinesin such as the
active center, protein-DNA interaction positions, protein-protein interaction positions,
structure building etc.
The degree of conservation can be determined from protein sequence alignments. The
following are guidelines on how to define and quantify conservation among species.
How is conservation defined?
The calculation of conservation at the amino acid level uses an alignment of protein
sequences. Assuming C is one column in an alignment of n proteins, conservation can
be defined in various ways by using different features of amino acids. Three definitions
of conservation are presented here.
absolute conservation
Conservation is defined as the occurrence of the same amino acid in the
same position of proteins. Conservation of amino acid a is calculated as
follows:
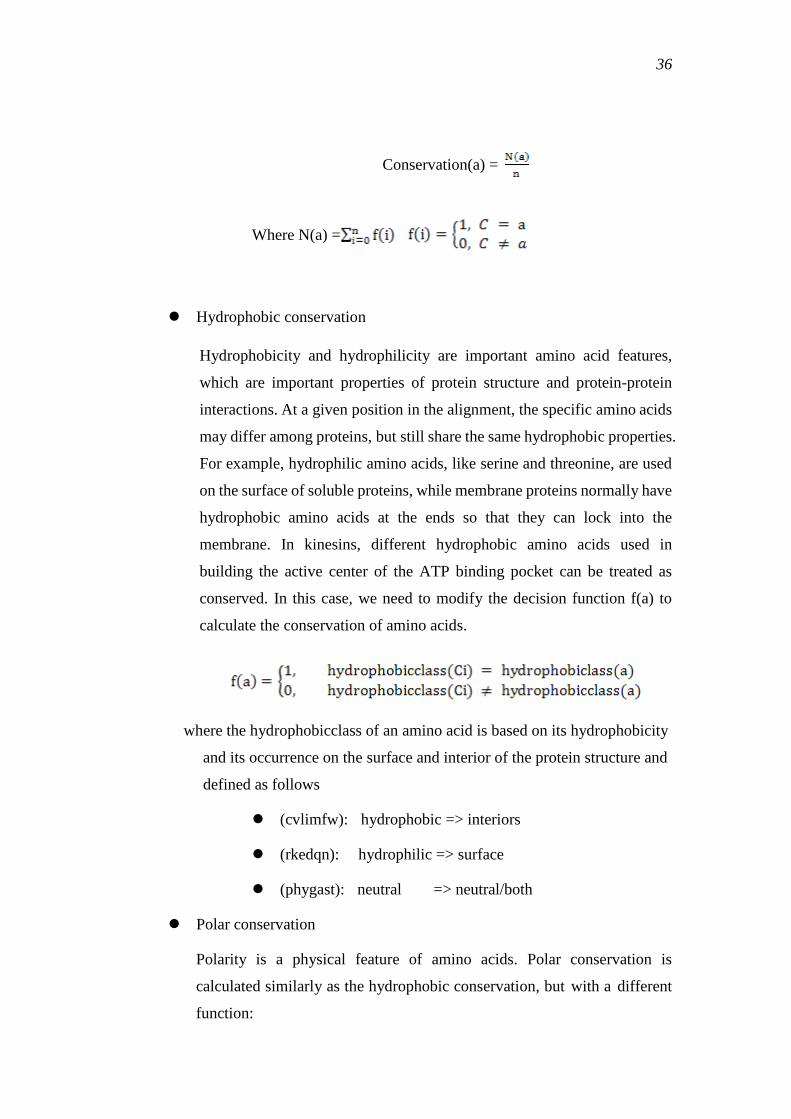
36
Conservation(a) =
Where N(a) =
Hydrophobic conservation
Hydrophobicity and hydrophilicity are important amino acid features,
which are important properties of protein structure and protein-protein
interactions. At a given position in the alignment, the specific amino acids
may differ among proteins, but still share the same hydrophobic properties.
For example, hydrophilic amino acids, like serine and threonine, are used
on the surface of soluble proteins, while membrane proteins normally have
hydrophobic amino acids at the ends so that they can lock into the
membrane. In kinesins, different hydrophobic amino acids used in
building the active center of the ATP binding pocket can be treated as
conserved. In this case, we need to modify the decision function f(a) to
calculate the conservation of amino acids.
where the hydrophobicclass of an amino acid is based on its hydrophobicity
and its occurrence on the surface and interior of the protein structure and
defined as follows
(cvlimfw): hydrophobic => interiors
(rkedqn): hydrophilic => surface
(phygast): neutral => neutral/both
Polar conservation
Polarity is a physical feature of amino acids. Polar conservation is
calculated similarly as the hydrophobic conservation, but with a different
function:
37
where the polar class of an amino acid is based on its polarity and defined as
follows
(gavlipfwm): non-polar
(scnqyt): polar-uncharged
(edhrk): polar-charged
Which alignment should be used to calculate conservation?
After defining how conservation should be calculated, one must specify an alignment.
The alignment can be built with a single sub-family, a combination of sub-families or a
super-family. The choice of sequence breadth will vary depending on the questions
investigated. For example, when studying ATP binding sites of the kinesin-1
sub-family, an alignment of the kinesin-1 sub-family should be used to calculate
conservation. Afterwards, in order to compare conservation of ATP binding sites
within kinesin-1 with the conservation of ATP binding sites all over the kinesins, a
recalculation of the conservation with the alignment of all kinesin sequences should be
performed.
With pre-created alignments for every combination of kinesin sub-families, the
investigation of conservation of any important amino acids within various sets of
kinesin sequences becomes an easy task.
2.5.2 Identifying conserved sequence motifs
Finding conservation of individual amino acids is important in revealing functional
positions within a sequence. However, to better understand elements that are
functionally or structurally important, we need to place these amino acids into larger
sequence patterns, which are known as sequence motifs.
A simple and effective tool was developed to scan the alignment for potential motifs.
This method is based on the conservation level of amino acids. A sequence motif in a
protein sequence can either be a functional motif or a structural motif. A functional
motif has a biological significance like DNA binding, protein interaction, activation of
protein etc. A structural motif is formed by the three dimensional arrangement of amino
38
acids and is important for determining protein structure. Functional or structural motifs
are usually conserved within a particular protein set. They can sometimes vary in
length and contain gaps. Each motif should contain at least one conserved amino acid.
That is, finding a motif is the same as starting with a conserved amino acid and
extending from both sides until a convergence criterion is reached. To avoid high
computing time, a linear pattern scan algorithm with linear running time is employed
(Kadane's algorithm) [107]. The motif scan program works as follows:
Setting up parameters:
1. A conservation cutoff, which defines the conservation level of a motif.
A lower boundary of the cutoff is defined as the average conservation of an
alignment. Columns in the alignments with more than 90% gaps are excluded from
the conservation calculation. A pattern, whose conservation level is above the
cutoff, is considered a significant motif.
2. Gap length
A gap length is the maximum length of gaps allowed between two conserved
amino acids or patterns, in order to define the endpoint of a motif. A position with
conservation level less than the average is defined as a gap. In the motifs these gaps
are represented as X.
Scanning the alignment:
1. The scan starts from the first position of a given alignment. The conservation
level of each position in the alignment is calculated. The consensus amino acid is
the amino acid that has the maximum conservation score for that column of the
alignment.
2. Scanning the alignment
a) The conservation score and the maximally conserved amino acid are stored
in an array in the 1st step.
b) The average conservation score is subtracted from every array element, so
that the significant conserved positions have positive values, while the others have
negative values. The motif finding problem is reduced into a maximum subarray
problem in this way. The average conservation score can be user-defined.
Otherwise, the average conservation score of the alignment is calculated
automatically by the program. Empty columns (over 90% gaps) are excluded.
c) A motif starts from a positive position and extends by adding its right-hand
neighbor. The motif is terminated when either the average conservation score of
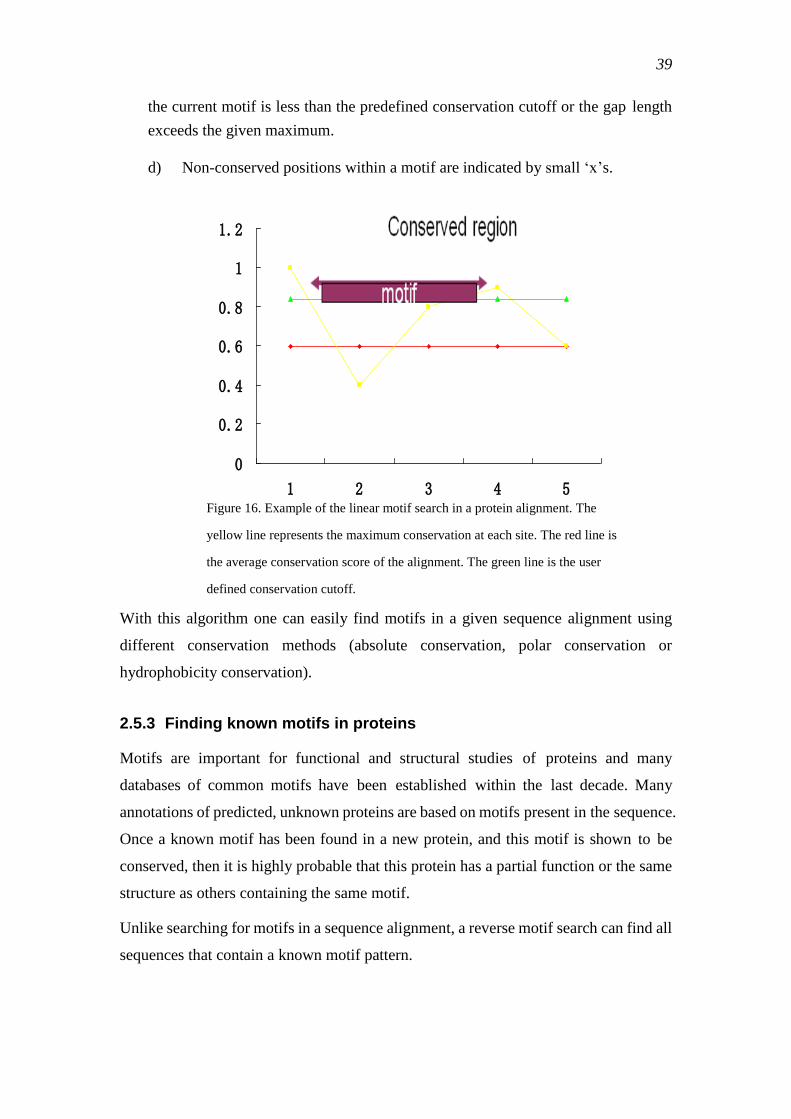
39
0
0.2
0.4
0.6
0.8
1
1.2
1 2 3 4 5
0
0.2
0.4
0.6
0.8
1
1.2
1 2 3 4 5
the current motif is less than the predefined conservation cutoff or the gap length
exceeds the given maximum.
d) Non-conserved positions within a motif are indicated by small ‗x‘s.
With this algorithm one can easily find motifs in a given sequence alignment using
different conservation methods (absolute conservation, polar conservation or
hydrophobicity conservation).
2.5.3 Finding known motifs in proteins
Motifs are important for functional and structural studies of proteins and many
databases of common motifs have been established within the last decade. Many
annotations of predicted, unknown proteins are based on motifs present in the sequence.
Once a known motif has been found in a new protein, and this motif is shown to be
conserved, then it is highly probable that this protein has a partial function or the same
structure as others containing the same motif.
Unlike searching for motifs in a sequence alignment, a reverse motif search can find all
sequences that contain a known motif pattern.
Figure 16. Example of the linear motif search in a protein alignment. The
yellow line represents the maximum conservation at each site. The red line is
the average conservation score of the alignment. The green line is the user
defined conservation cutoff.
40
A known motif is given in the form of a regular expression notation [76]. It is then
converted into a mysql [77] search pattern and finally used to scan the entire sequence
database. The mysql implemented pattern-matching algorithm ‗REGEXP‘ is used for
the search [77]. The search returns all sequences that contain the given motif. The
conservation score of each motif is then calculated using the sub-family alignment to
which the sequence belongs.
2.5.4 Discriminating amino acids
It is known that different kinesin sub-families have various functions. The amino acid
residues responsible for the divergence between sub-families are called discriminating
amino acids. It is assumed that they help the protein perform sub-family specific
functions rather than general biological functions common to all sub-families.
Discriminating amino acids can also be detected within a sub-family. For example,
the fungal kinesin-1s move four times faster than animal kinesin-1s. A discriminating
residue shows a significantly higher conservation level in one sub-group (for example
fungi) than in other sub-groups (for example animals).
Assume that an alignment consists of two different sub-groups. While looking at one
column of this alignment, a maximally conserved residue for each group can be
determined. When the maximally conserved amino acids differ between groups and
their conservation difference is significant, then this position is called a discriminating
position and the amino acid residue used by one group is called a discriminating amino
acid.
A computational automatic detection approach has been developed to find
discriminating amino acids. It takes alignments of two or more sub-groups as input.
The conservation score is calculated for each sub-group. When the conservation of any
sub-group is over 80%, the residue is identified as a potential discriminating residue.
2.6 Phylogeny reconstruction
2.6.1 Methods
RaxML, a maximum likelihood implementation for phylogeny inferrence, was used to
generate a large phylogenetic tree for the entire kinesin super-family. The tree was
41
generated from a random starting tree, using the blosum62 matrix as the amino acid
substitution model with a gamma-distributed model for rate heterogeneity. By default,
four discrete rate categories were used [78].
2.6.2 Visualization
Phylogenetic trees created by mrbayes were visualized by using forester version 4.1
[79], software libraries for evolutionary biology and comparative genomics research,
and FigTree version 1.2.1 [80]. Sub-families were highlighted with different colors.
2.7 Reconstruction of ancestral kinesins
Ancestral protein reconstruction is a method to infer the common ancestor of a set of
sequences using a statistical model. Tracing the extant proteins back to a common
ancestor is challenging because it is impossible to know the exact sequence changes
that occurred on the evolutionary pathway from the ancestor to the current state.
Currently, more realistic algorithms, such as the stochastic model, maximum
likelihood, are being used to solve this problem. Given a phylogenetic tree, one can
start from the leaves to calculate the likelihood of all possible changes of the internal
nodes and then iteratively repeat this until root is reached. Therefore, the quality of the
estimation should strongly depend on the given phylogenetic tree. GASP [62], gapped
ancestral sequence prediction, version 1.3, and was used for kinesin ancestor
reconstruction. GASP is advantageous because it can use a user-defined phylogeny in
contrast to rather than other applications, which normally only use the alignment to
estimate the phylogeny by their internally implemented algorithm. These algorithms
create different phylogenies in general and consequently lead to inaccurate estimation
of ancestors.
2.8 Structural comparison
Experimentally determined molecular structures of kinesin proteins were obtained
from the PDB database. Each kinesin protein sequence was classified by the kinesin
classification tool. Structures were visualized by RasMol [81]. The comparison was
done for two kinesin-1 proteins: the Neurospora crassa motor domain 1GOJ and the
Homo sapiens motor domain 1BG2.
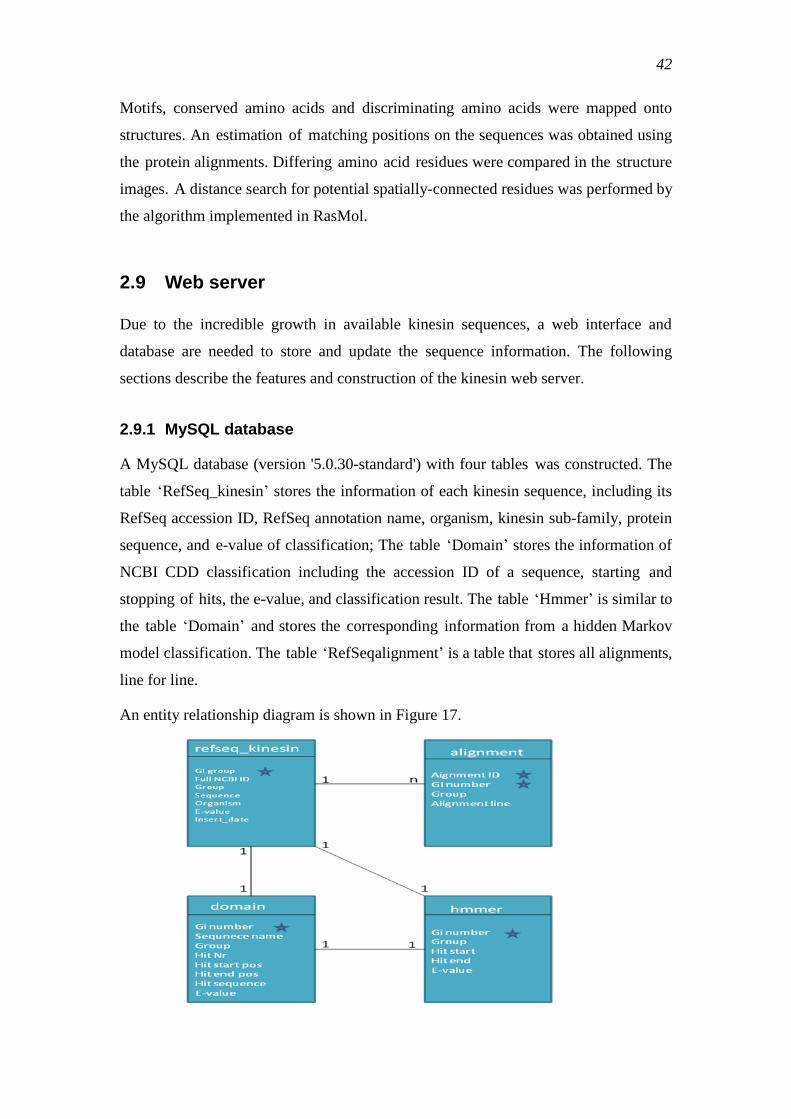
42
Motifs, conserved amino acids and discriminating amino acids were mapped onto
structures. An estimation of matching positions on the sequences was obtained using
the protein alignments. Differing amino acid residues were compared in the structure
images. A distance search for potential spatially-connected residues was performed by
the algorithm implemented in RasMol.
2.9 Web server
Due to the incredible growth in available kinesin sequences, a web interface and
database are needed to store and update the sequence information. The following
sections describe the features and construction of the kinesin web server.
2.9.1 MySQL database
A MySQL database (version '5.0.30-standard') with four tables was constructed. The
table ‗RefSeq_kinesin‘ stores the information of each kinesin sequence, including its
RefSeq accession ID, RefSeq annotation name, organism, kinesin sub-family, protein
sequence, and e-value of classification; The table ‗Domain‘ stores the information of
NCBI CDD classification including the accession ID of a sequence, starting and
stopping of hits, the e-value, and classification result. The table ‗Hmmer‘ is similar to
the table ‗Domain‘ and stores the corresponding information from a hidden Markov
model classification. The table ‗RefSeqalignment‘ is a table that stores all alignments,
line for line.
An entity relationship diagram is shown in Figure 17.
43
2.9.2 Web interface
A web interface supported by LMU Biocenter web server can be accessed at
www.bio.uni-muenchen.de/~liu/kinesin_new/. It provides up-to-date kinesin information,
and many useful data analysis tools.
The main features of the web interface are listed as below:
Table of kinesin sub-families
Number of kinesin sequences currently in the RefSeq database
Number of species that contain kinesins
Number of copies of kinesin in each sub-family in the corresponding
species
The distribution of kinesins in species
Overview of kinesins in various species with the following information
NCBI access number and name
Sub-family classification with e-value
Motor domain start and end positions in the sequence
Protein sequence and amino acid usage distribution
Highlighted view of the motor domain
Link to protein conservation information
Link to alignment viewer
Conservation information of a protein sequence in both absolute
conservation and polar conservation in which amino acids are highlighted
in different colors depending on their conservation score
Figure 17. Entity model of the MySQL database. Four tables were created for saving general
information on sequences and alignments. Each table is linked with a unique RefSeq accession ID: the
gi number. Information stored in each table can be combined and used for generation of other results
via external scripts.
44
The classification engine can classify a given protein sequence that is
provided in FASTA sequence format. Both NCBI CDD and hmmer
classifier results are supported with e-values provided
Known sequence motifs can be searched against the entire kinesin
sequence database
The motif search tool can be used to scan sequence motifs in kinesin sub-
families or the kinesin super-family
Alignments of kinesin sub-families or combinations of sub-families can be
viewed in full length or in selected regions with options that allow
conservation highlighting or mutational focusing
The discriminating residue search tool calculates the discriminating
residues by comparing alignments of two groups of sequences. The
alignments can be user-defined or pre-calculated alignments of kinesin
sub-families
The resulting discriminating residues can be viewed on a 3D structure of
the motor domain
PDB entries of kinesin are assigned on corresponding sub-families. A
conventional website with Jmol [106] was implemented to let users view
the structure directly online
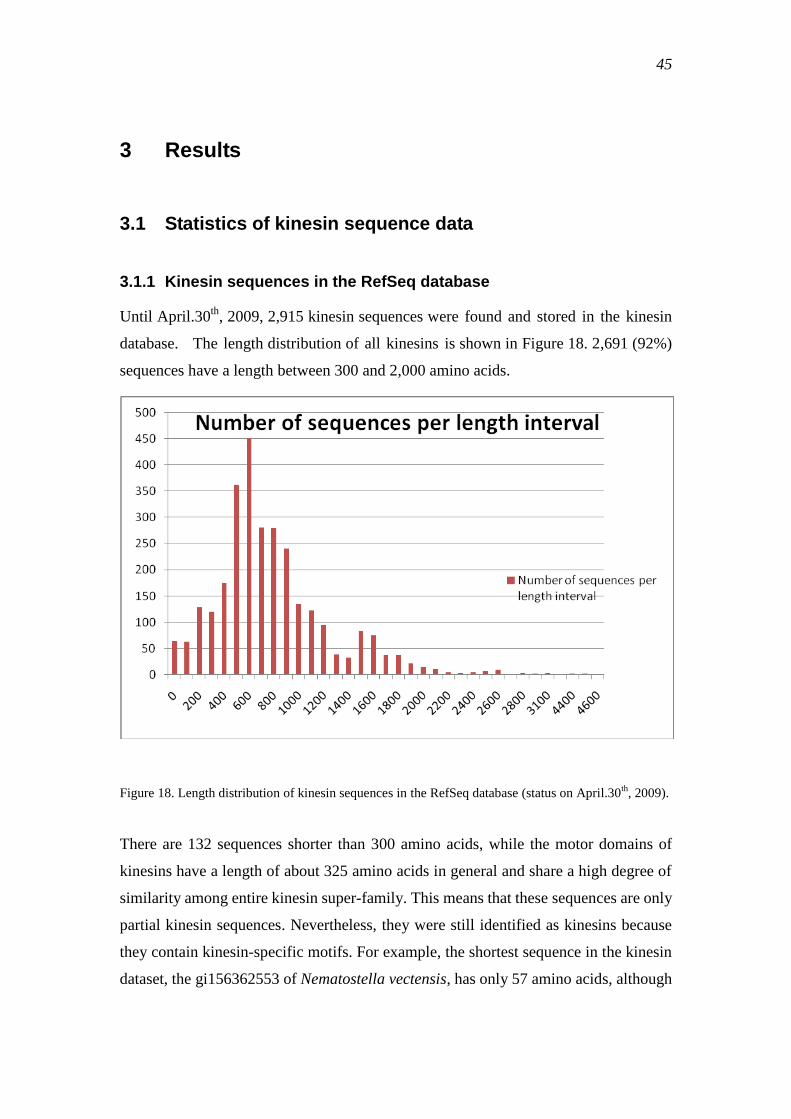
45
3 Results
3.1 Statistics of kinesin sequence data
3.1.1 Kinesin sequences in the RefSeq database
Until April.30th
, 2009, 2,915 kinesin sequences were found and stored in the kinesin
database. The length distribution of all kinesins is shown in Figure 18. 2,691 (92%)
sequences have a length between 300 and 2,000 amino acids.
Figure 18. Length distribution of kinesin sequences in the RefSeq database (status on April.30th
, 2009).
There are 132 sequences shorter than 300 amino acids, while the motor domains of
kinesins have a length of about 325 amino acids in general and share a high degree of
similarity among entire kinesin super-family. This means that these sequences are only
partial kinesin sequences. Nevertheless, they were still identified as kinesins because
they contain kinesin-specific motifs. For example, the shortest sequence in the kinesin
dataset, the gi156362553 of Nematostella vectensis, has only 57 amino acids, although
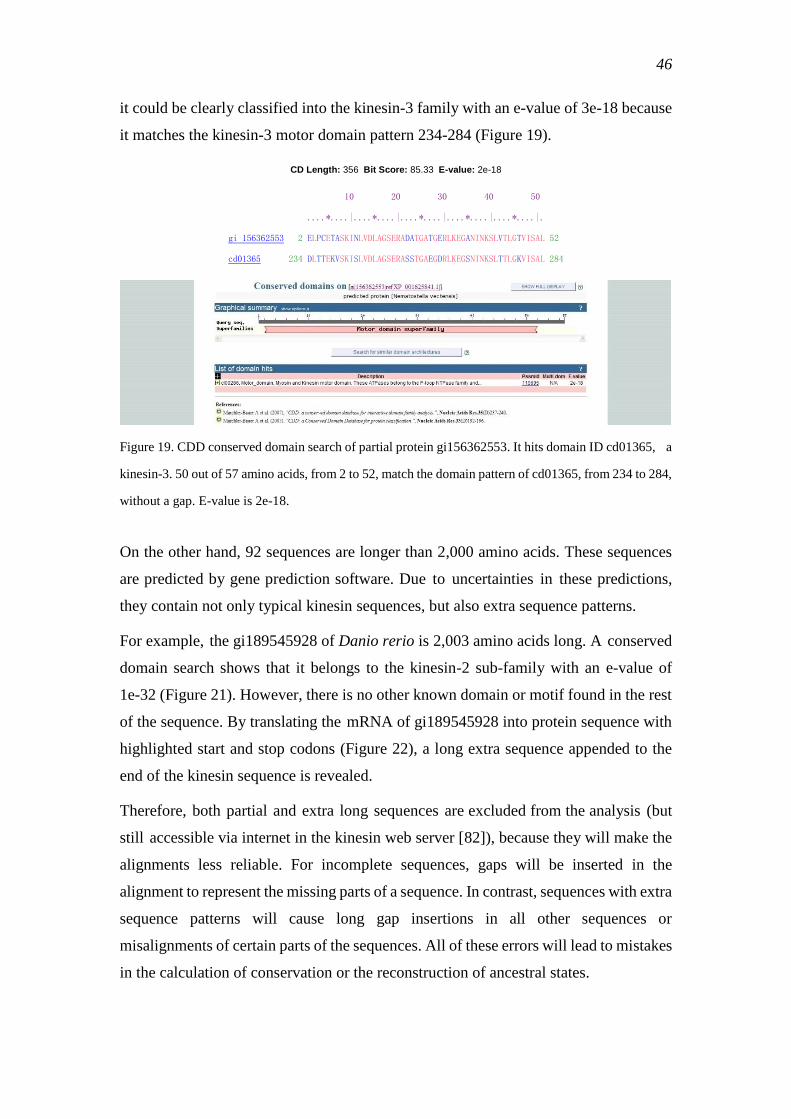
46
it could be clearly classified into the kinesin-3 family with an e-value of 3e-18 because
it matches the kinesin-3 motor domain pattern 234-284 (Figure 19).
CD Length: 356 Bit Score: 85.33 E-value: 2e-18
10 20 30 40 50
....*....|....*....|....*....|....*....|....*....|.
gi 156362553 2 ELPCETASKINLVDLAGSERADATGATGERLKEGANINKSLVTLGTVISAL 52
cd01365 234 DLTTEKVSKISLVDLAGSERASSTGAEGDRLKEGSNINKSLTTLGKVISAL 284
Figure 19. CDD conserved domain search of partial protein gi156362553. It hits domain ID cd01365, a
kinesin-3. 50 out of 57 amino acids, from 2 to 52, match the domain pattern of cd01365, from 234 to 284,
without a gap. E-value is 2e-18.
On the other hand, 92 sequences are longer than 2,000 amino acids. These sequences
are predicted by gene prediction software. Due to uncertainties in these predictions,
they contain not only typical kinesin sequences, but also extra sequence patterns.
For example, the gi189545928 of Danio rerio is 2,003 amino acids long. A conserved
domain search shows that it belongs to the kinesin-2 sub-family with an e-value of
1e-32 (Figure 21). However, there is no other known domain or motif found in the rest
of the sequence. By translating the mRNA of gi189545928 into protein sequence with
highlighted start and stop codons (Figure 22), a long extra sequence appended to the
end of the kinesin sequence is revealed.
Therefore, both partial and extra long sequences are excluded from the analysis (but
still accessible via internet in the kinesin web server [82]), because they will make the
alignments less reliable. For incomplete sequences, gaps will be inserted in the
alignment to represent the missing parts of a sequence. In contrast, sequences with extra
sequence patterns will cause long gap insertions in all other sequences or
misalignments of certain parts of the sequences. All of these errors will lead to mistakes
in the calculation of conservation or the reconstruction of ancestral states.
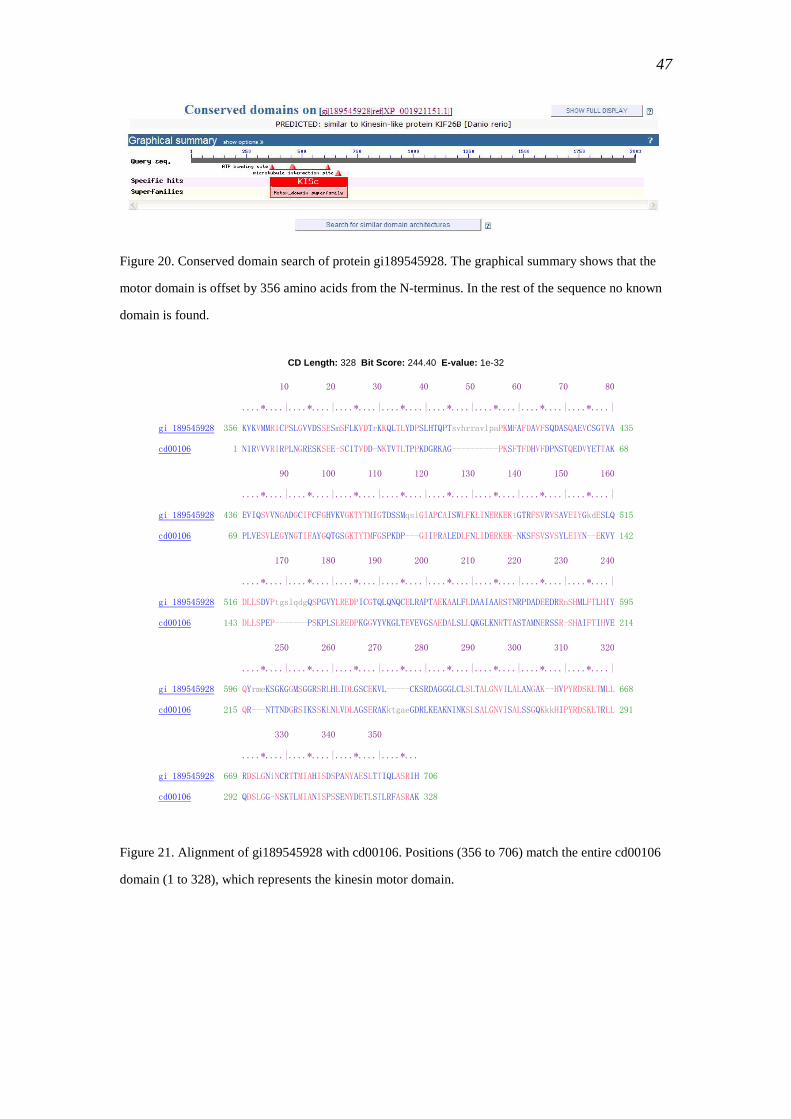
47
Figure 20. Conserved domain search of protein gi189545928. The graphical summary shows that the
motor domain is offset by 356 amino acids from the N-terminus. In the rest of the sequence no known
domain is found.
CD Length: 328 Bit Score: 244.40 E-value: 1e-32
10 20 30 40 50 60 70 80
....*....|....*....|....*....|....*....|....*....|....*....|....*....|....*....|
gi 189545928 356 KVKVMMRICPSLGVVDSSESmSFLKVDTrKKQLTLYDPSLHTQPTsvhrravlpaPKMFAFDAVFSQDASQAEVCSGTVA 435
cd00106 1 NIRVVVRIRPLNGRESKSEE-SCITVDD-NKTVTLTPPKDGRKAG----------PKSFTFDHVFDPNSTQEDVYETTAK 68
90 100 110 120 130 140 150 160
....*....|....*....|....*....|....*....|....*....|....*....|....*....|....*....|
gi 189545928 436 EVIQSVVNGADGCIFCFGHVKVGKTYTMIGTDSSMqslGIAPCAISWLFKLINERKEKtGTRFSVRVSAVEIYGkdESLQ 515
cd00106 69 PLVESVLEGYNGTIFAYGQTGSGKTYTMFGSPKDP---GIIPRALEDLFNLIDERKEK-NKSFSVSVSYLEIYN--EKVY 142
170 180 190 200 210 220 230 240
....*....|....*....|....*....|....*....|....*....|....*....|....*....|....*....|
gi 189545928 516 DLLSDVPtgslqdgQSPGVYLREDPICGTQLQNQCELRAPTAEKAALFLDAAIAARSTNRPDADEEDRRnSHMLFTLHIY 595
cd00106 143 DLLSPEP-------PSKPLSLREDPKGGVYVKGLTEVEVGSAEDALSLLQKGLKNRTTASTAMNERSSR-SHAIFTIHVE 214
250 260 270 280 290 300 310 320
....*....|....*....|....*....|....*....|....*....|....*....|....*....|....*....|
gi 189545928 596 QYrmeKSGKGGMSGGRSRLHLIDLGSCEKVL-----CKSRDAGGGLCLSLTALGNVILALANGAK--HVPYRDSKLTMLL 668
cd00106 215 QR---NTTNDGRSIKSSKLNLVDLAGSERAKktgaeGDRLKEAKNINKSLSALGNVISALSSGQKkkHIPYRDSKLTRLL 291
330 340 350
....*....|....*....|....*....|....*...
gi 189545928 669 RDSLGNiNCRTTMIAHISDSPANYAESLTTIQLASRIH 706
cd00106 292 QDSLGG-NSKTLMIANISPSSENYDETLSTLRFASRAK 328
Figure 21. Alignment of gi189545928 with cd00106. Positions (356 to 706) match the entire cd00106
domain (1 to 328), which represents the kinesin motor domain.
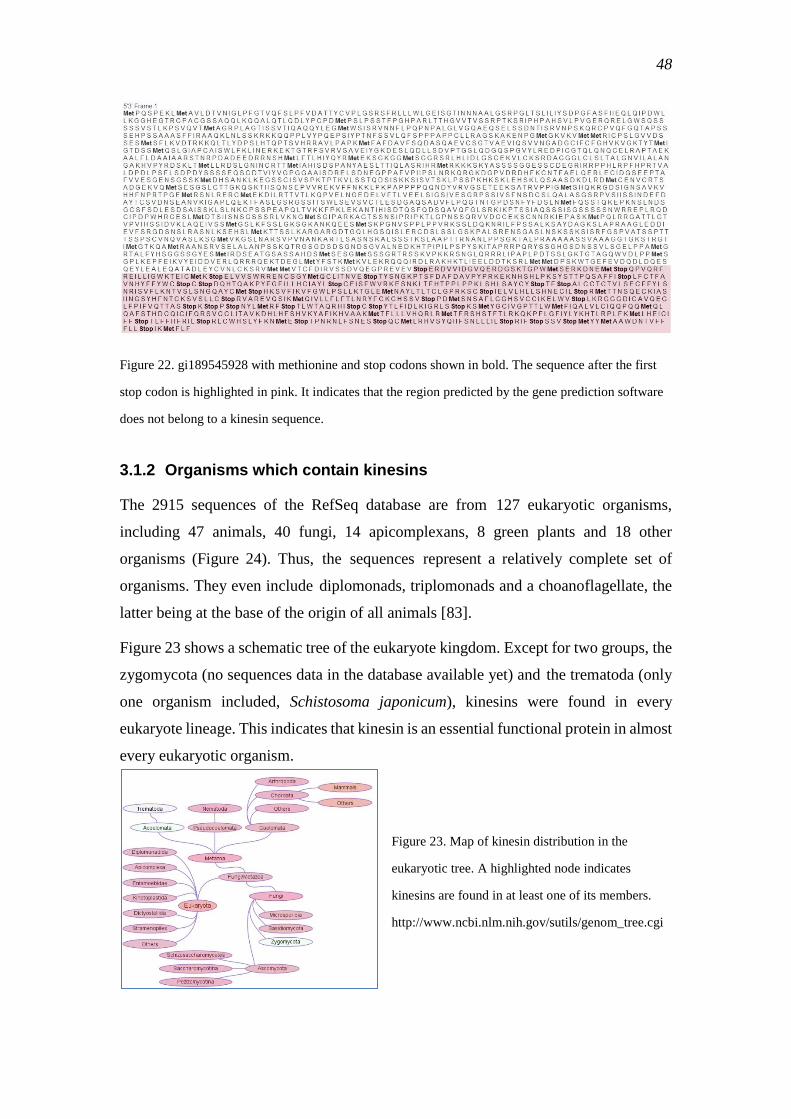
48
Figure 22. gi189545928 with methionine and stop codons shown in bold. The sequence after the first
stop codon is highlighted in pink. It indicates that the region predicted by the gene prediction software
does not belong to a kinesin sequence.
3.1.2 Organisms which contain kinesins
The 2915 sequences of the RefSeq database are from 127 eukaryotic organisms,
including 47 animals, 40 fungi, 14 apicomplexans, 8 green plants and 18 other
organisms (Figure 24). Thus, the sequences represent a relatively complete set of
organisms. They even include diplomonads, triplomonads and a choanoflagellate, the
latter being at the base of the origin of all animals [83].
Figure 23 shows a schematic tree of the eukaryote kingdom. Except for two groups, the
zygomycota (no sequences data in the database available yet) and the trematoda (only
one organism included, Schistosoma japonicum), kinesins were found in every
eukaryote lineage. This indicates that kinesin is an essential functional protein in almost
every eukaryotic organism.
Figure 23. Map of kinesin distribution in the
eukaryotic tree. A highlighted node indicates
kinesins are found in at least one of its members.
http://www.ncbi.nlm.nih.gov/sutils/genom_tree.cgi
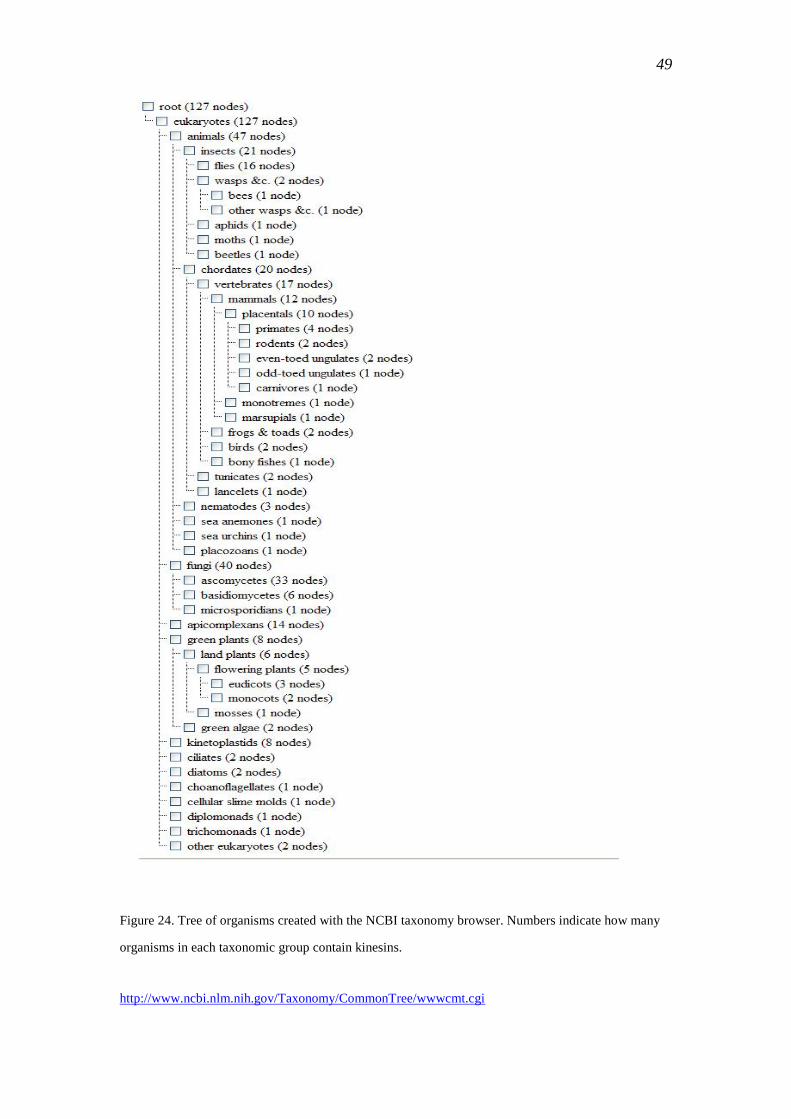
49
Figure 24. Tree of organisms created with the NCBI taxonomy browser. Numbers indicate how many
organisms in each taxonomic group contain kinesins.
http://www.ncbi.nlm.nih.gov/Taxonomy/CommonTree/wwwcmt.cgi
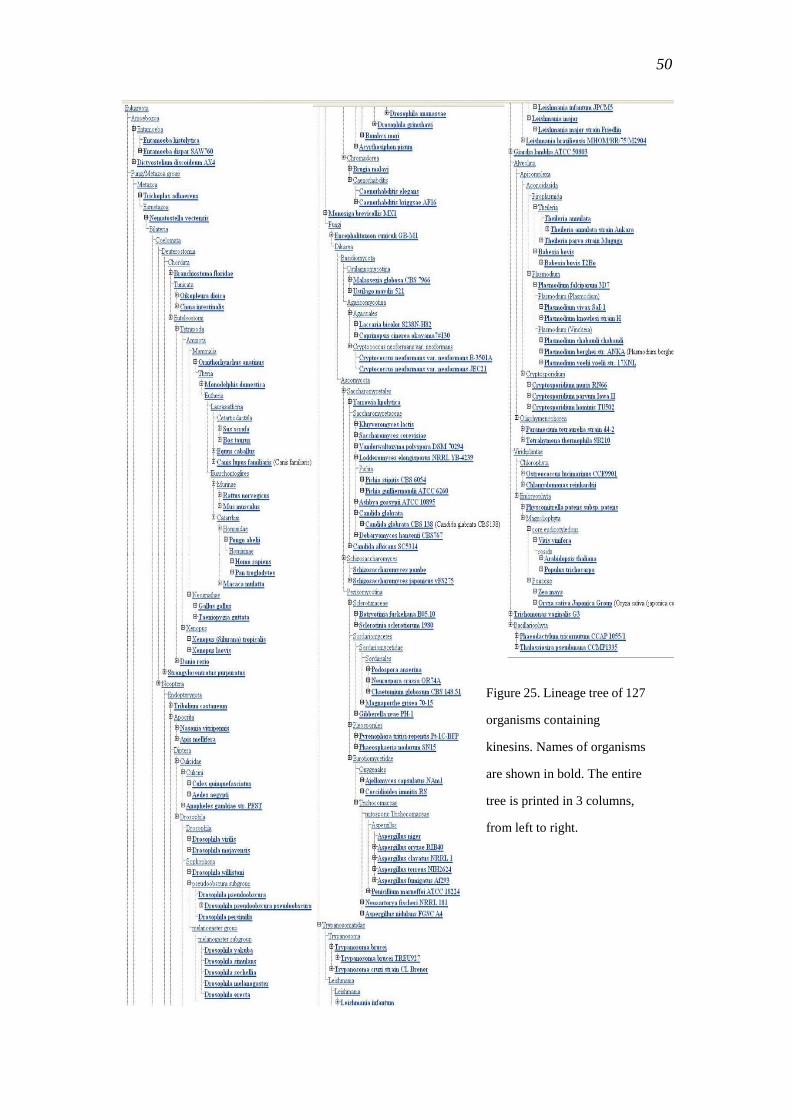
50
Figure 25. Lineage tree of 127
organisms containing
kinesins. Names of organisms
are shown in bold. The entire
tree is printed in 3 columns,
from left to right.
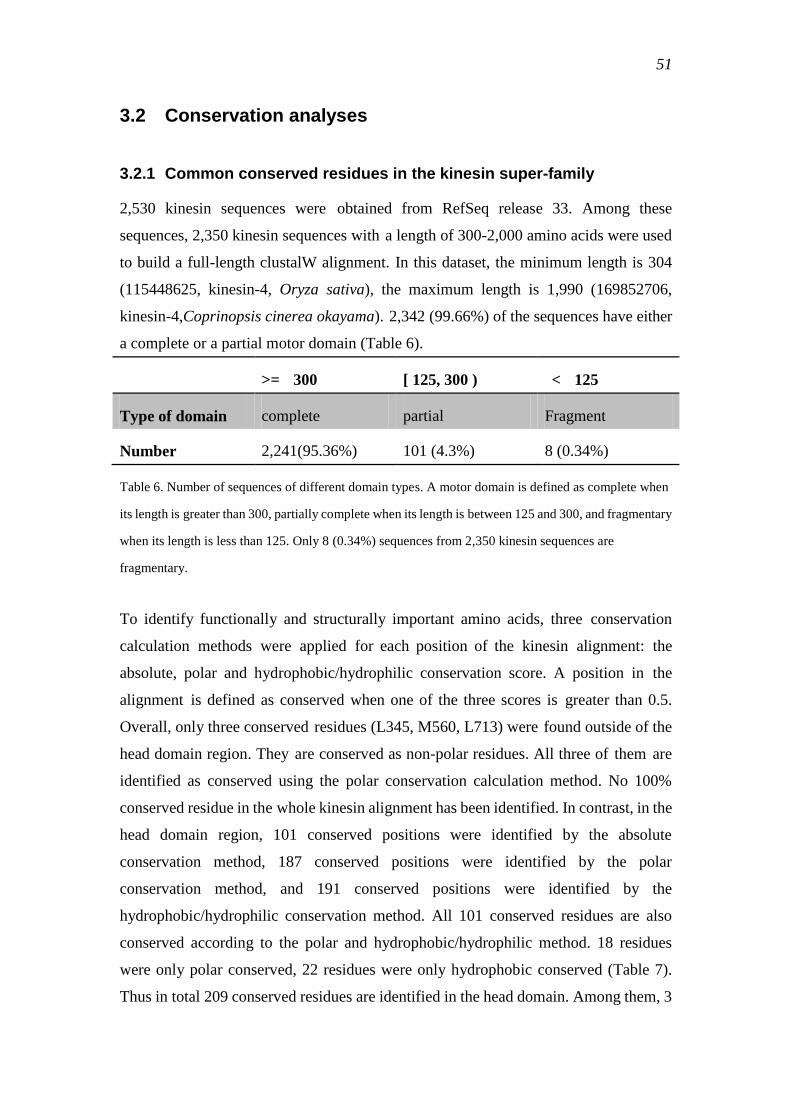
51
3.2 Conservation analyses
3.2.1 Common conserved residues in the kinesin super-family
2,530 kinesin sequences were obtained from RefSeq release 33. Among these
sequences, 2,350 kinesin sequences with a length of 300-2,000 amino acids were used
to build a full-length clustalW alignment. In this dataset, the minimum length is 304
(115448625, kinesin-4, Oryza sativa), the maximum length is 1,990 (169852706,
kinesin-4,Coprinopsis cinerea okayama). 2,342 (99.66%) of the sequences have either
a complete or a partial motor domain (Table 6).
>= 300 [ 125, 300 ) < 125
Type of domain complete partial Fragment
Number 2,241(95.36%) 101 (4.3%) 8 (0.34%)
Table 6. Number of sequences of different domain types. A motor domain is defined as complete when
its length is greater than 300, partially complete when its length is between 125 and 300, and fragmentary
when its length is less than 125. Only 8 (0.34%) sequences from 2,350 kinesin sequences are
fragmentary.
To identify functionally and structurally important amino acids, three conservation
calculation methods were applied for each position of the kinesin alignment: the
absolute, polar and hydrophobic/hydrophilic conservation score. A position in the
alignment is defined as conserved when one of the three scores is greater than 0.5.
Overall, only three conserved residues (L345, M560, L713) were found outside of the
head domain region. They are conserved as non-polar residues. All three of them are
identified as conserved using the polar conservation calculation method. No 100%
conserved residue in the whole kinesin alignment has been identified. In contrast, in the
head domain region, 101 conserved positions were identified by the absolute
conservation method, 187 conserved positions were identified by the polar
conservation method, and 191 conserved positions were identified by the
hydrophobic/hydrophilic conservation method. All 101 conserved residues are also
conserved according to the polar and hydrophobic/hydrophilic method. 18 residues
were only polar conserved, 22 residues were only hydrophobic conserved (Table 7).
Thus in total 209 conserved residues are identified in the head domain. Among them, 3
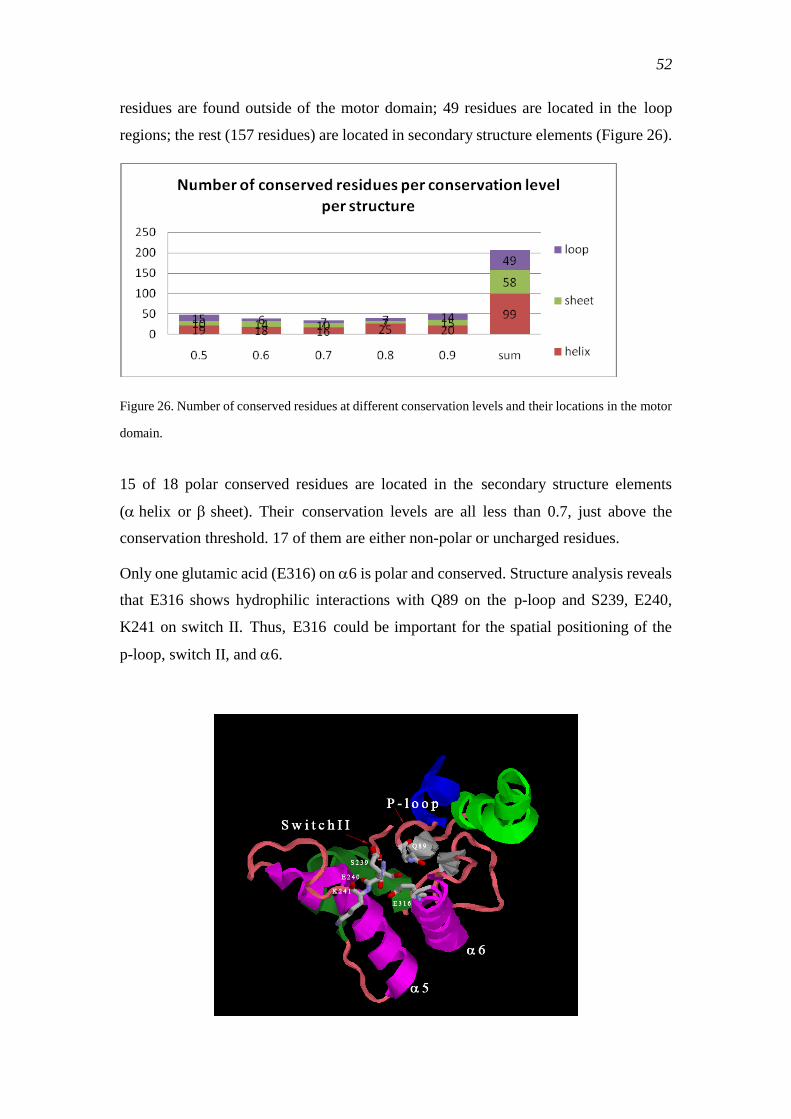
52
residues are found outside of the motor domain; 49 residues are located in the loop
regions; the rest (157 residues) are located in secondary structure elements (Figure 26).
Figure 26. Number of conserved residues at different conservation levels and their locations in the motor
domain.
15 of 18 polar conserved residues are located in the secondary structure elements
(helix or sheet). Their conservation levels are all less than 0.7, just above the
conservation threshold. 17 of them are either non-polar or uncharged residues.
Only one glutamic acid (E316) on 6 is polar and conserved. Structure analysis reveals
that E316 shows hydrophilic interactions with Q89 on the p-loop and S239, E240,
K241 on switch II. Thus, E316 could be important for the spatial positioning of the
p-loop, switch II, and 6.
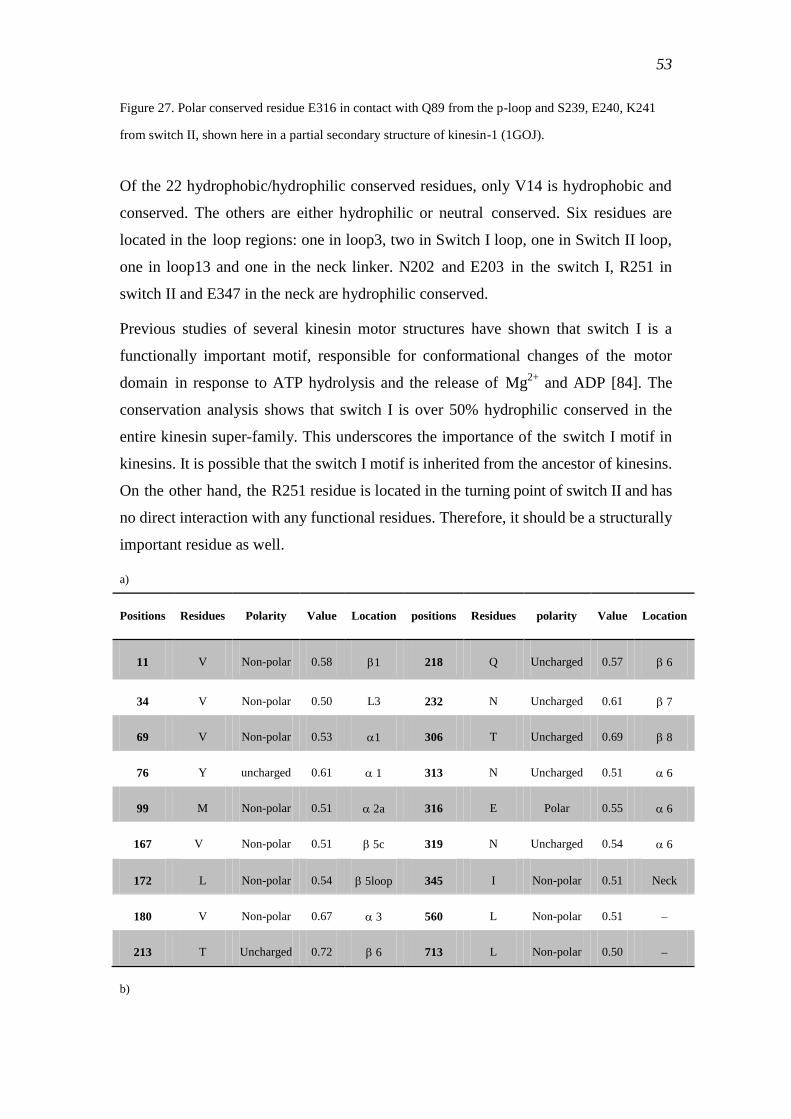
53
Figure 27. Polar conserved residue E316 in contact with Q89 from the p-loop and S239, E240, K241
from switch II, shown here in a partial secondary structure of kinesin-1 (1GOJ).
Of the 22 hydrophobic/hydrophilic conserved residues, only V14 is hydrophobic and
conserved. The others are either hydrophilic or neutral conserved. Six residues are
located in the loop regions: one in loop3, two in Switch I loop, one in Switch II loop,
one in loop13 and one in the neck linker. N202 and E203 in the switch I, R251 in
switch II and E347 in the neck are hydrophilic conserved.
Previous studies of several kinesin motor structures have shown that switch I is a
functionally important motif, responsible for conformational changes of the motor
domain in response to ATP hydrolysis and the release of Mg2+
and ADP [84]. The
conservation analysis shows that switch I is over 50% hydrophilic conserved in the
entire kinesin super-family. This underscores the importance of the switch I motif in
kinesins. It is possible that the switch I motif is inherited from the ancestor of kinesins.
On the other hand, the R251 residue is located in the turning point of switch II and has
no direct interaction with any functional residues. Therefore, it should be a structurally
important residue as well.
a)
Positions Residues Polarity Value Location positions Residues polarity Value Location
11 V Non-polar 0.58 1 218 Q Uncharged 0.57 6
34 V Non-polar 0.50 L3 232 N Uncharged 0.61 7
69 V Non-polar 0.53 1 306 T Uncharged 0.69 8
76 Y uncharged 0.61 1 313 N Uncharged 0.51 6
99 M Non-polar 0.51 2a 316 E Polar 0.55 6
167 V Non-polar 0.51 5c 319 N Uncharged 0.54 6
172 L Non-polar 0.54 5loop 345 I Non-polar 0.51 Neck
180 V Non-polar 0.67 3 560 L Non-polar 0.51
213 T Uncharged 0.72 6 713 L Non-polar 0.50
b)
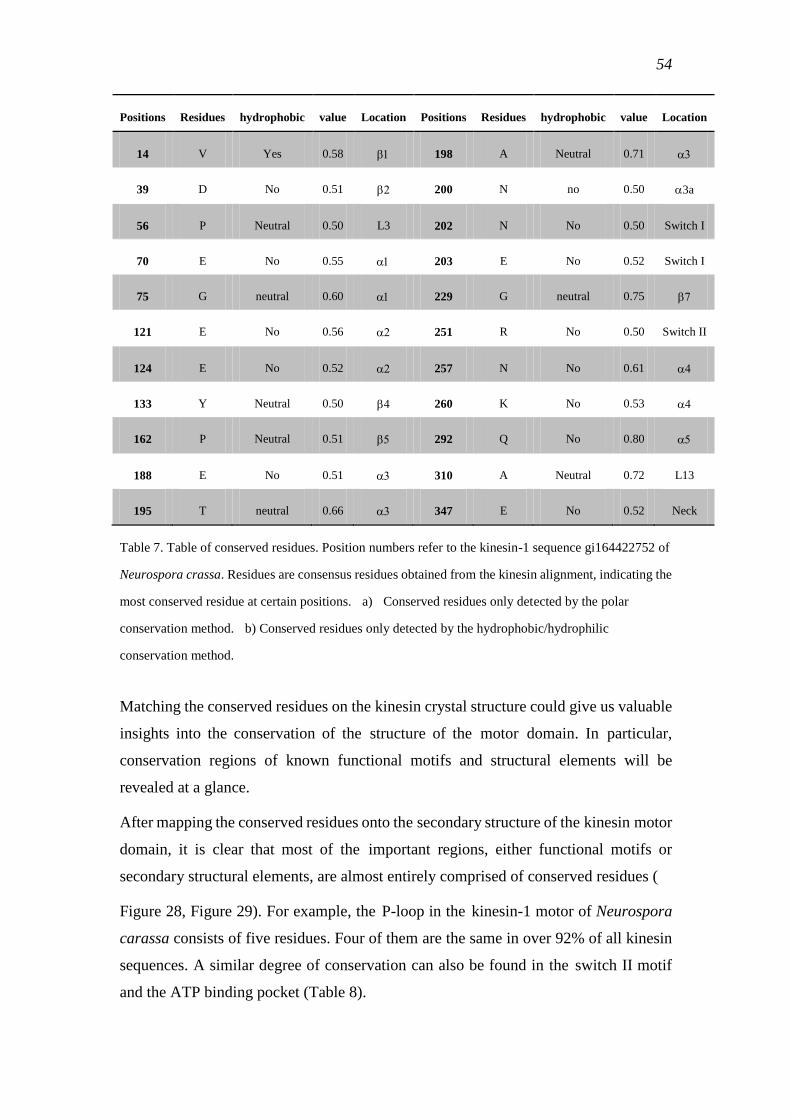
54
Positions Residues hydrophobic value Location Positions Residues hydrophobic value Location
14 V Yes 0.58 198 A Neutral 0.71
39 D No 0.51 200 N no 0.50 3a
56 P Neutral 0.50 L3 202 N No 0.50 Switch I
70 E No 0.55 203 E No 0.52 Switch I
75 G neutral 0.60 229 G neutral 0.75
121 E No 0.56 251 R No 0.50 Switch II
124 E No 0.52 257 N No 0.61
133 Y Neutral 0.50 260 K No 0.53
162 P Neutral 0.51 292 Q No 0.80
188 E No 0.51 310 A Neutral 0.72 L13
195 T neutral 0.66 347 E No 0.52 Neck
Table 7. Table of conserved residues. Position numbers refer to the kinesin-1 sequence gi164422752 of
Neurospora crassa. Residues are consensus residues obtained from the kinesin alignment, indicating the
most conserved residue at certain positions. a) Conserved residues only detected by the polar
conservation method. b) Conserved residues only detected by the hydrophobic/hydrophilic
conservation method.
Matching the conserved residues on the kinesin crystal structure could give us valuable
insights into the conservation of the structure of the motor domain. In particular,
conservation regions of known functional motifs and structural elements will be
revealed at a glance.
After mapping the conserved residues onto the secondary structure of the kinesin motor
domain, it is clear that most of the important regions, either functional motifs or
secondary structural elements, are almost entirely comprised of conserved residues (
Figure 28, Figure 29). For example, the P-loop in the kinesin-1 motor of Neurospora
carassa consists of five residues. Four of them are the same in over 92% of all kinesin
sequences. A similar degree of conservation can also be found in the switch II motif
and the ATP binding pocket (Table 8).
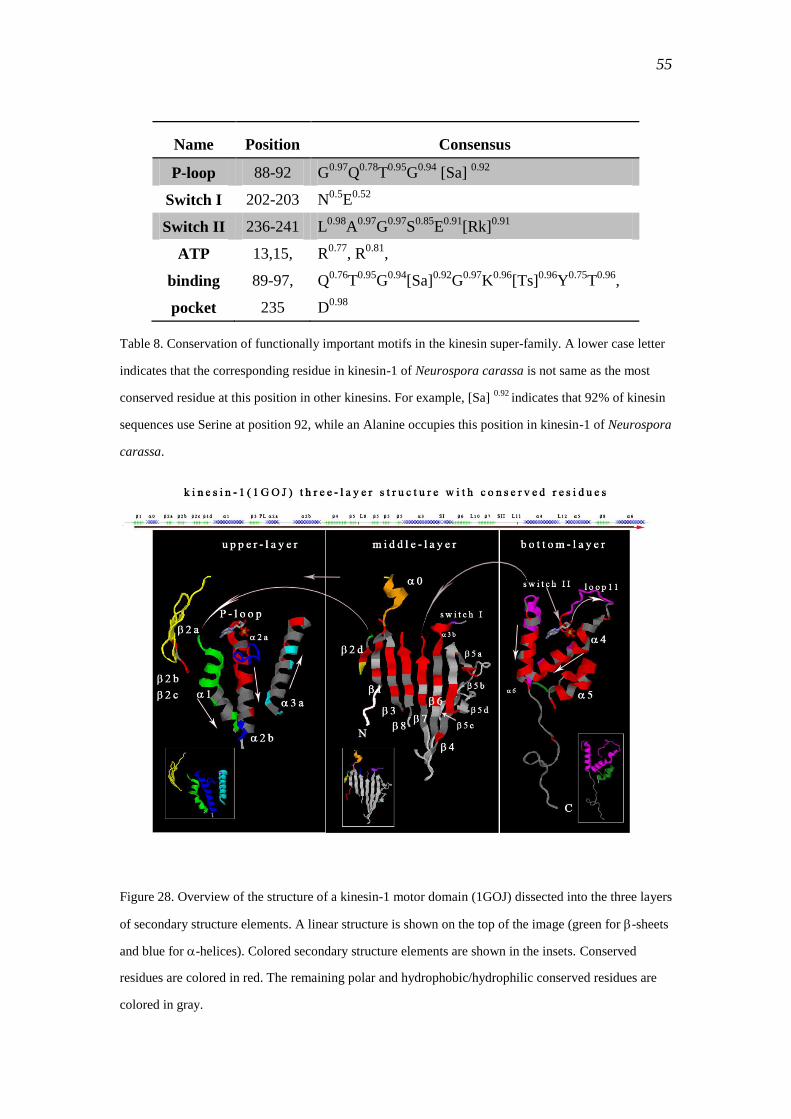
55
Name Position Consensus
P-loop 88-92 G0.97
Q0.78
T0.95
G0.94
[Sa] 0.92
Switch I 202-203 N0.5
E0.52
Switch II 236-241 L0.98
A0.97
G0.97
S0.85
E0.91
[Rk]0.91
ATP
binding
13,15,
89-97,
235
R0.77
, R0.81
,
Q0.76
T0.95
G0.94
[Sa]0.92
G0.97
K0.96
[Ts]0.96
Y0.75
T0.96
,
D0.98
Table 8. Conservation of functionally important motifs in the kinesin super-family. A lower case letter
indicates that the corresponding residue in kinesin-1 of Neurospora carassa is not same as the most
conserved residue at this position in other kinesins. For example, [Sa] 0.92
indicates that 92% of kinesin
sequences use Serine at position 92, while an Alanine occupies this position in kinesin-1 of Neurospora
carassa.
Figure 28. Overview of the structure of a kinesin-1 motor domain (1GOJ) dissected into the three layers
of secondary structure elements. A linear structure is shown on the top of the image (green for -sheets
and blue for -helices). Colored secondary structure elements are shown in the insets. Conserved
residues are colored in red. The remaining polar and hydrophobic/hydrophilic conserved residues are
colored in gray.
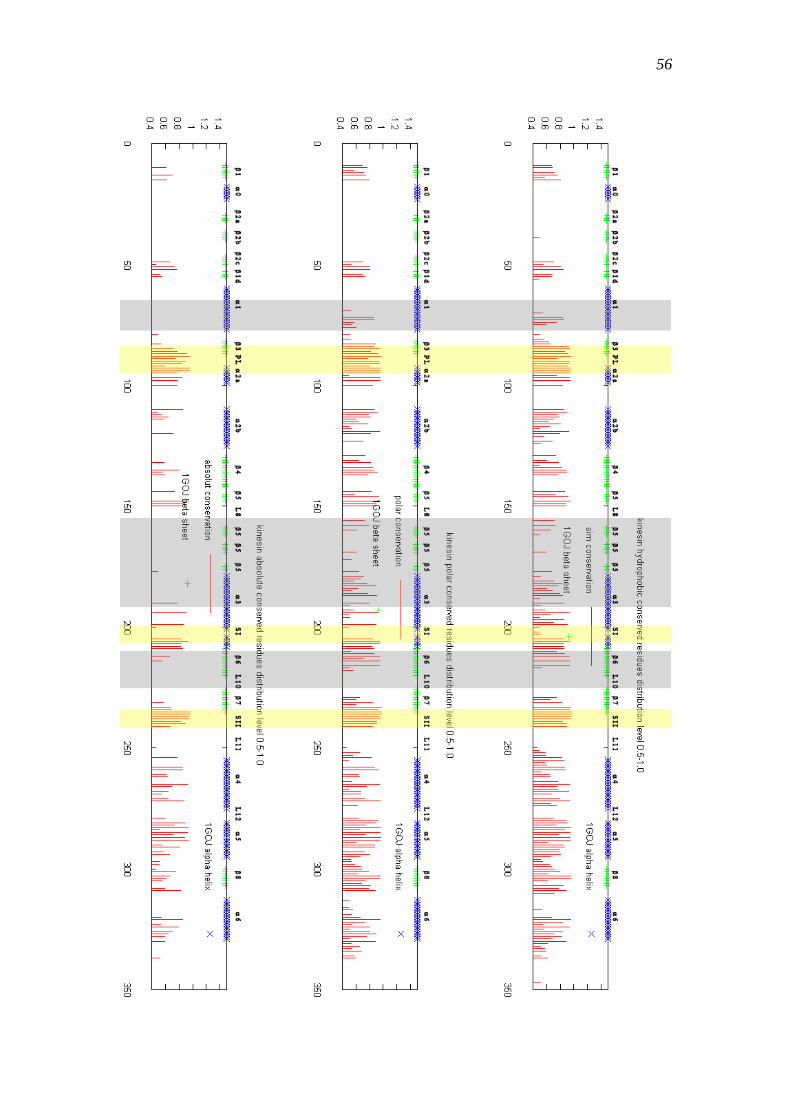
56

57
Figure 29. Global conservation of the kinesin super family. The graph shows the hydrophobic, polar, and
absolute conservation of the motor domain, respectively. Secondary structure of 1GOJ (Neurospora
crassa kinesin-1) is shown with colored dots, green dots indicate sheets, blue dots indicate helices.
Conservation scores of amino acids are indicated with red impulses, less than 50% conserved residues
are not shown. The regions highlighted in yellow indicates the p-loop, switch-I and switch-II motifs. In
the regions highlighted in gray no absolute conservation but polar and hydrophobic/hydrophilic
conservation has been found.
3.2.2 Common motifs of kinesins
Based on 106 complete kinesin motor domain sequences, previous studies have
identified six highly conserved motifs (named A-F) and two additional motifs (named
X,Y) [http://www.proweb.org/kinesin], which are found in most kinesins. All of them
have been found by the motifscan program (see methods). Many positions in the motifs
have now been updated and refined: Some residues previously believed to be conserved
cannot be confirmed in the large kinesin dataset. For example, the motif X
[IxVxCRCRPxxxxE] is updated to [IxVxVRxRP], where the Glutamic acid at the end
of the motif X and the cysteine at position 8 are not conserved any more. At position 5,
valine replaced cysteine as the most conserved residue.
Eight more motifs have been noted in addition, because their conservation levels are all
above the average conservation level (31.56%) of the entire kinesin family (Table 9).
These motifs represent important structure elements in the motor domain, such as loop3
linked with α1, loop8, α6, the end of the motor domain, and the neck linker. These 16
motifs well describe the kinesin motor domain structure (Figure 30).
Figure 30. Motif structure of the kinesin super-family. 16 motifs have been detected in the large kinesin
dataset with 2,350 sequences. In addition to the 8 motifs detected earlier (in green), 8 additional motifs
have been identified (in light blue). All are located in the head domain region.
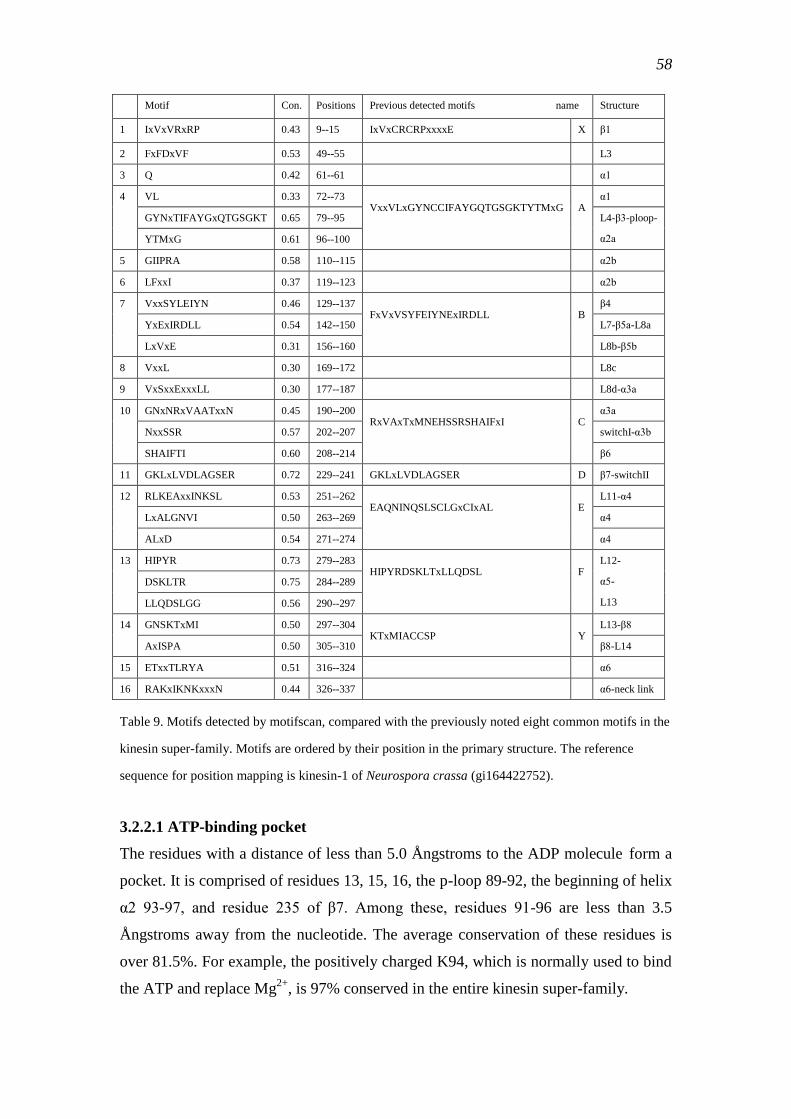
58
Motif Con. Positions Previous detected motifs name Structure
1 IxVxVRxRP 0.43 9--15 IxVxCRCRPxxxxE X β1
2 FxFDxVF 0.53 49--55 L3
3 Q 0.42 61--61 α1
4 VL 0.33 72--73 VxxVLxGYNCCIFAYGQTGSGKTYTMxG A
α1
GYNxTIFAYGxQTGSGKT 0.65 79--95 L4-β3-ploop-
α2a YTMxG 0.61 96--100
5 GIIPRA 0.58 110--115 α2b
6 LFxxI 0.37 119--123 α2b
7 VxxSYLEIYN 0.46 129--137 FxVxVSYFEIYNExIRDLL B
β4
YxExIRDLL 0.54 142--150 L7-β5a-L8a
LxVxE 0.31 156--160 L8b-β5b
8 VxxL 0.30 169--172 L8c
9 VxSxxExxxLL 0.30 177--187 L8d-α3a
10 GNxNRxVAATxxN 0.45 190--200 RxVAxTxMNEHSSRSHAIFxI C
α3a
NxxSSR 0.57 202--207 switchI-α3b
SHAIFTI 0.60 208--214 β6
11 GKLxLVDLAGSER 0.72 229--241 GKLxLVDLAGSER D β7-switchII
12 RLKEAxxINKSL 0.53 251--262 EAQNINQSLSCLGxCIxAL E
L11-α4
LxALGNVI 0.50 263--269 α4
ALxD 0.54 271--274 α4
13 HIPYR 0.73 279--283 HIPYRDSKLTxLLQDSL F
L12-
α5-
L13
DSKLTR 0.75 284--289
LLQDSLGG 0.56 290--297
14 GNSKTxMI 0.50 297--304 KTxMIACCSP Y
L13-β8
AxISPA 0.50 305--310 β8-L14
15 ETxxTLRYA 0.51 316--324 α6
16 RAKxIKNKxxxN 0.44 326--337 α6-neck link
Table 9. Motifs detected by motifscan, compared with the previously noted eight common motifs in the
kinesin super-family. Motifs are ordered by their position in the primary structure. The reference
sequence for position mapping is kinesin-1 of Neurospora crassa (gi164422752).
3.2.2.1 ATP-binding pocket
The residues with a distance of less than 5.0 Ångstroms to the ADP molecule form a
pocket. It is comprised of residues 13, 15, 16, the p-loop 89-92, the beginning of helix
α2 93-97, and residue 235 of β7. Among these, residues 91-96 are less than 3.5
Ångstroms away from the nucleotide. The average conservation of these residues is
over 81.5%. For example, the positively charged K94, which is normally used to bind
the ATP and replace Mg2+
, is 97% conserved in the entire kinesin super-family.
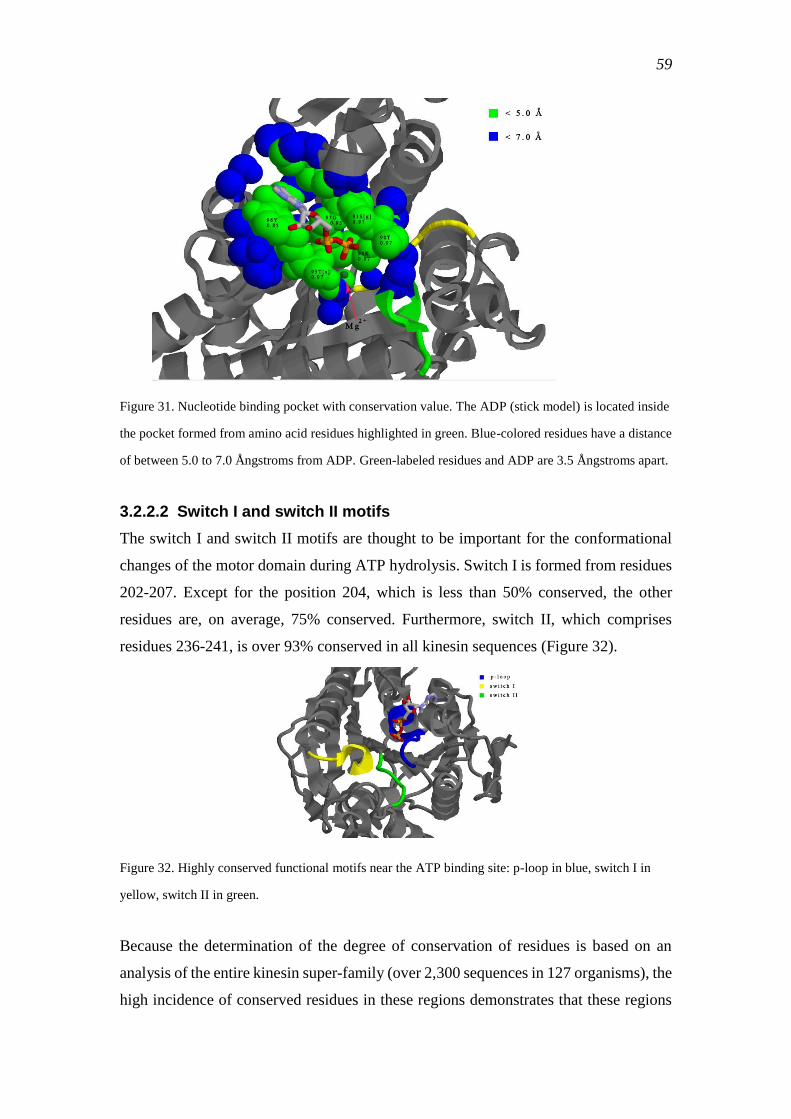
59
Figure 31. Nucleotide binding pocket with conservation value. The ADP (stick model) is located inside
the pocket formed from amino acid residues highlighted in green. Blue-colored residues have a distance
of between 5.0 to 7.0 Ångstroms from ADP. Green-labeled residues and ADP are 3.5 Ångstroms apart.
3.2.2.2 Switch I and switch II motifs
The switch I and switch II motifs are thought to be important for the conformational
changes of the motor domain during ATP hydrolysis. Switch I is formed from residues
202-207. Except for the position 204, which is less than 50% conserved, the other
residues are, on average, 75% conserved. Furthermore, switch II, which comprises
residues 236-241, is over 93% conserved in all kinesin sequences (Figure 32).
Figure 32. Highly conserved functional motifs near the ATP binding site: p-loop in blue, switch I in
yellow, switch II in green.
Because the determination of the degree of conservation of residues is based on an
analysis of the entire kinesin super-family (over 2,300 sequences in 127 organisms), the
high incidence of conserved residues in these regions demonstrates that these regions
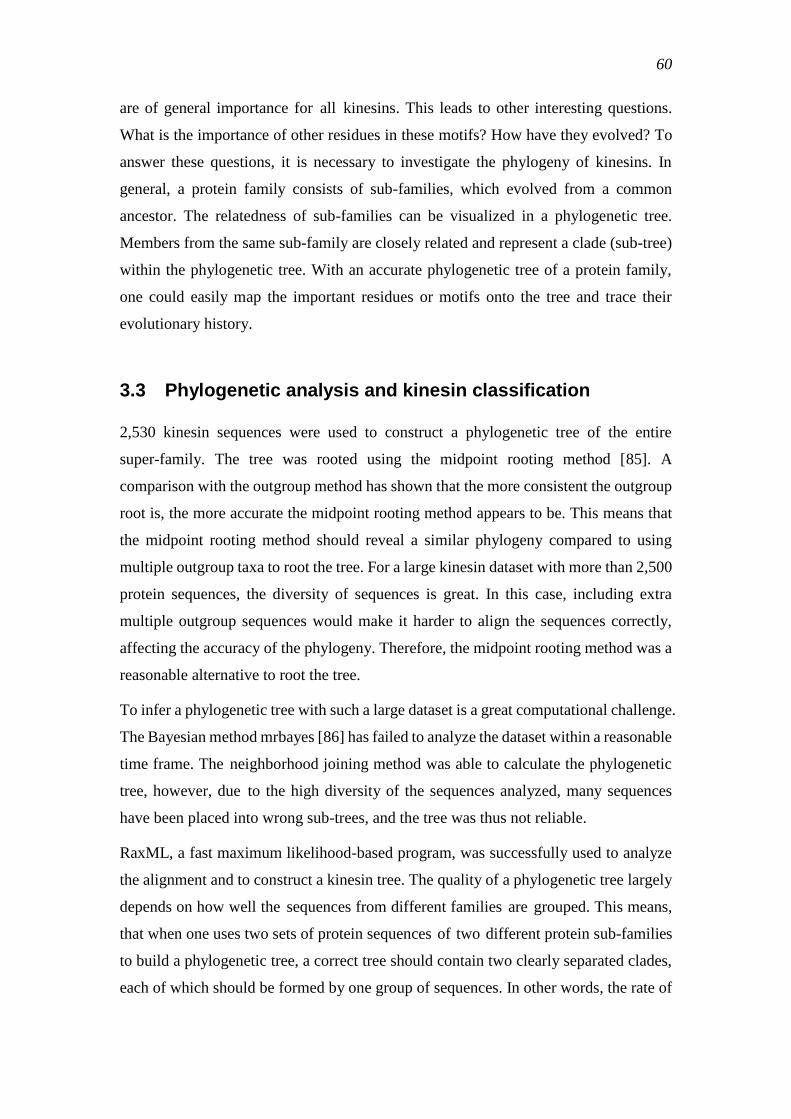
60
are of general importance for all kinesins. This leads to other interesting questions.
What is the importance of other residues in these motifs? How have they evolved? To
answer these questions, it is necessary to investigate the phylogeny of kinesins. In
general, a protein family consists of sub-families, which evolved from a common
ancestor. The relatedness of sub-families can be visualized in a phylogenetic tree.
Members from the same sub-family are closely related and represent a clade (sub-tree)
within the phylogenetic tree. With an accurate phylogenetic tree of a protein family,
one could easily map the important residues or motifs onto the tree and trace their
evolutionary history.
3.3 Phylogenetic analysis and kinesin classification
2,530 kinesin sequences were used to construct a phylogenetic tree of the entire
super-family. The tree was rooted using the midpoint rooting method [85]. A
comparison with the outgroup method has shown that the more consistent the outgroup
root is, the more accurate the midpoint rooting method appears to be. This means that
the midpoint rooting method should reveal a similar phylogeny compared to using
multiple outgroup taxa to root the tree. For a large kinesin dataset with more than 2,500
protein sequences, the diversity of sequences is great. In this case, including extra
multiple outgroup sequences would make it harder to align the sequences correctly,
affecting the accuracy of the phylogeny. Therefore, the midpoint rooting method was a
reasonable alternative to root the tree.
To infer a phylogenetic tree with such a large dataset is a great computational challenge.
The Bayesian method mrbayes [86] has failed to analyze the dataset within a reasonable
time frame. The neighborhood joining method was able to calculate the phylogenetic
tree, however, due to the high diversity of the sequences analyzed, many sequences
have been placed into wrong sub-trees, and the tree was thus not reliable.
RaxML, a fast maximum likelihood-based program, was successfully used to analyze
the alignment and to construct a kinesin tree. The quality of a phylogenetic tree largely
depends on how well the sequences from different families are grouped. This means,
that when one uses two sets of protein sequences of two different protein sub-families
to build a phylogenetic tree, a correct tree should contain two clearly separated clades,
each of which should be formed by one group of sequences. In other words, the rate of
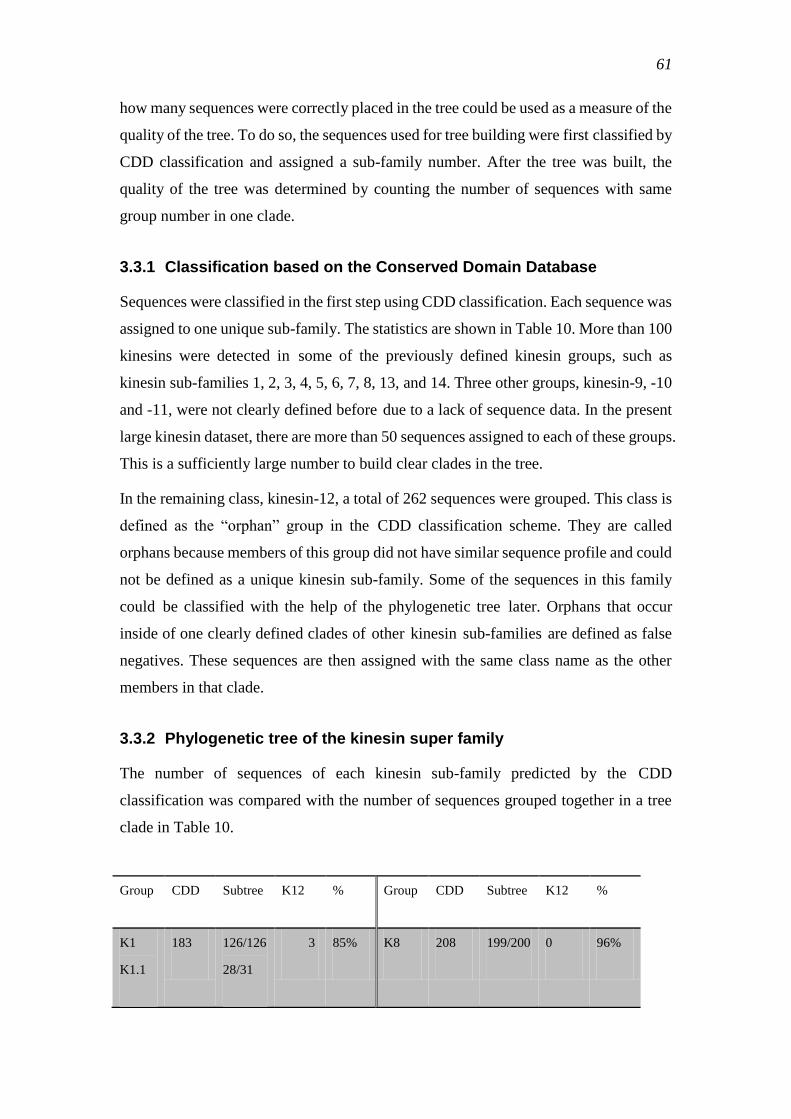
61
how many sequences were correctly placed in the tree could be used as a measure of the
quality of the tree. To do so, the sequences used for tree building were first classified by
CDD classification and assigned a sub-family number. After the tree was built, the
quality of the tree was determined by counting the number of sequences with same
group number in one clade.
3.3.1 Classification based on the Conserved Domain Database
Sequences were classified in the first step using CDD classification. Each sequence was
assigned to one unique sub-family. The statistics are shown in Table 10. More than 100
kinesins were detected in some of the previously defined kinesin groups, such as
kinesin sub-families 1, 2, 3, 4, 5, 6, 7, 8, 13, and 14. Three other groups, kinesin-9, -10
and -11, were not clearly defined before due to a lack of sequence data. In the present
large kinesin dataset, there are more than 50 sequences assigned to each of these groups.
This is a sufficiently large number to build clear clades in the tree.
In the remaining class, kinesin-12, a total of 262 sequences were grouped. This class is
defined as the ―orphan‖ group in the CDD classification scheme. They are called
orphans because members of this group did not have similar sequence profile and could
not be defined as a unique kinesin sub-family. Some of the sequences in this family
could be classified with the help of the phylogenetic tree later. Orphans that occur
inside of one clearly defined clades of other kinesin sub-families are defined as false
negatives. These sequences are then assigned with the same class name as the other
members in that clade.
3.3.2 Phylogenetic tree of the kinesin super family
The number of sequences of each kinesin sub-family predicted by the CDD
classification was compared with the number of sequences grouped together in a tree
clade in Table 10.
Group CDD Subtree K12 % Group CDD Subtree K12 %
K1
K1.1
183 126/126
28/31
3 85% K8 208 199/200 0 96%
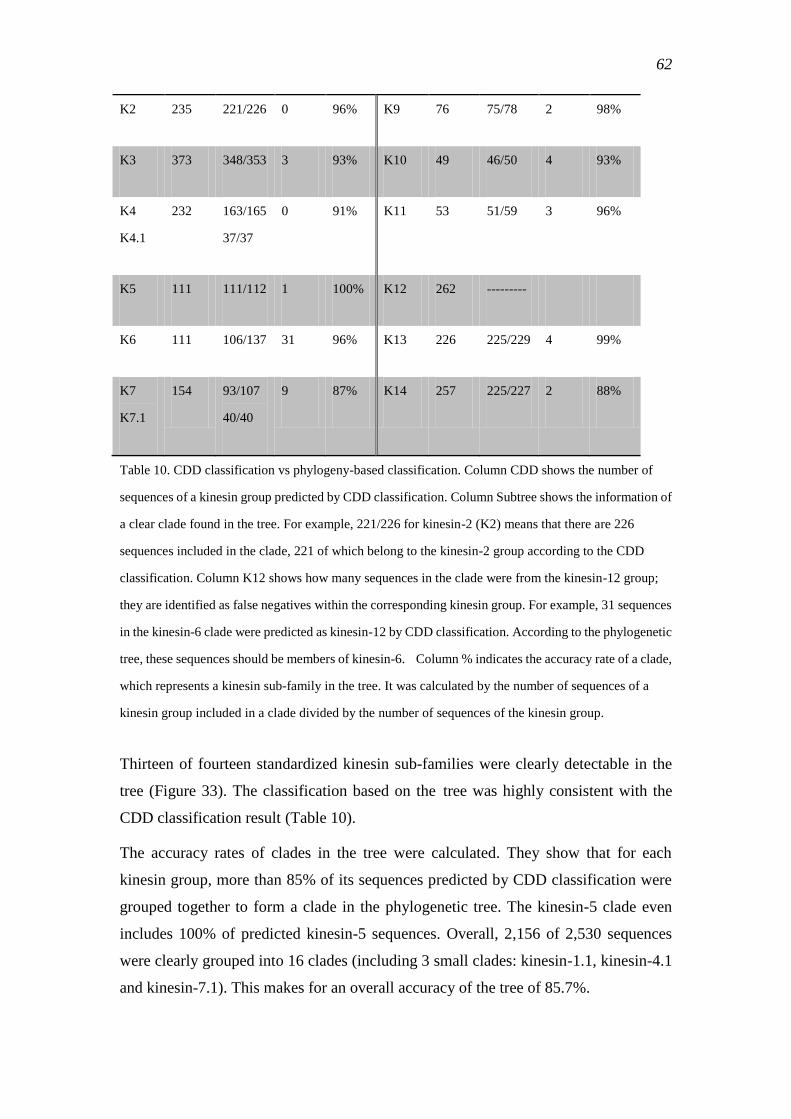
62
K2 235 221/226 0 96% K9 76 75/78 2 98%
K3 373 348/353 3 93% K10 49 46/50 4 93%
K4
K4.1
232 163/165
37/37
0 91% K11 53 51/59 3 96%
K5 111 111/112 1 100% K12 262 ---------
K6 111 106/137 31 96% K13 226 225/229 4 99%
K7
K7.1
154 93/107
40/40
9 87% K14 257 225/227 2 88%
Table 10. CDD classification vs phylogeny-based classification. Column CDD shows the number of
sequences of a kinesin group predicted by CDD classification. Column Subtree shows the information of
a clear clade found in the tree. For example, 221/226 for kinesin-2 (K2) means that there are 226
sequences included in the clade, 221 of which belong to the kinesin-2 group according to the CDD
classification. Column K12 shows how many sequences in the clade were from the kinesin-12 group;
they are identified as false negatives within the corresponding kinesin group. For example, 31 sequences
in the kinesin-6 clade were predicted as kinesin-12 by CDD classification. According to the phylogenetic
tree, these sequences should be members of kinesin-6. Column % indicates the accuracy rate of a clade,
which represents a kinesin sub-family in the tree. It was calculated by the number of sequences of a
kinesin group included in a clade divided by the number of sequences of the kinesin group.
Thirteen of fourteen standardized kinesin sub-families were clearly detectable in the
tree (Figure 33). The classification based on the tree was highly consistent with the
CDD classification result (Table 10).
The accuracy rates of clades in the tree were calculated. They show that for each
kinesin group, more than 85% of its sequences predicted by CDD classification were
grouped together to form a clade in the phylogenetic tree. The kinesin-5 clade even
includes 100% of predicted kinesin-5 sequences. Overall, 2,156 of 2,530 sequences
were clearly grouped into 16 clades (including 3 small clades: kinesin-1.1, kinesin-4.1
and kinesin-7.1). This makes for an overall accuracy of the tree of 85.7%.
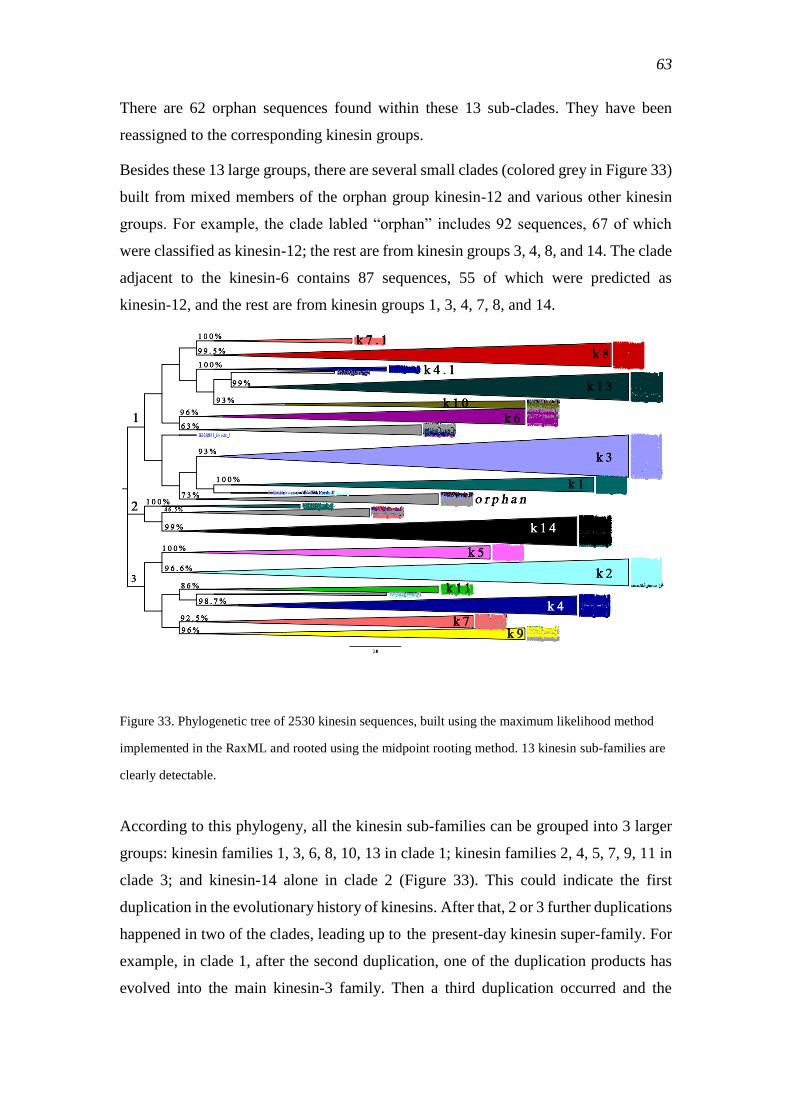
63
There are 62 orphan sequences found within these 13 sub-clades. They have been
reassigned to the corresponding kinesin groups.
Besides these 13 large groups, there are several small clades (colored grey in Figure 33)
built from mixed members of the orphan group kinesin-12 and various other kinesin
groups. For example, the clade labled ―orphan‖ includes 92 sequences, 67 of which
were classified as kinesin-12; the rest are from kinesin groups 3, 4, 8, and 14. The clade
adjacent to the kinesin-6 contains 87 sequences, 55 of which were predicted as
kinesin-12, and the rest are from kinesin groups 1, 3, 4, 7, 8, and 14.
Figure 33. Phylogenetic tree of 2530 kinesin sequences, built using the maximum likelihood method
implemented in the RaxML and rooted using the midpoint rooting method. 13 kinesin sub-families are
clearly detectable.
According to this phylogeny, all the kinesin sub-families can be grouped into 3 larger
groups: kinesin families 1, 3, 6, 8, 10, 13 in clade 1; kinesin families 2, 4, 5, 7, 9, 11 in
clade 3; and kinesin-14 alone in clade 2 (Figure 33). This could indicate the first
duplication in the evolutionary history of kinesins. After that, 2 or 3 further duplications
happened in two of the clades, leading up to the present-day kinesin super-family. For
example, in clade 1, after the second duplication, one of the duplication products has
evolved into the main kinesin-3 family. Then a third duplication occurred and the
64
kinesin-1 class evolved from one of the duplication products of kinesin-3. The other
branch of the second duplication underwent further duplication events, leading to the
formation of the kinesin classes 6, 8, 10 and 13. In clade 3, three additional duplications
can be observed. The kinesin classes 2, 4, 5, 7, 9 and 11 have evolved from these
duplication events. In clade 2, after two duplications, no new kinesin sub-family has
formed and kinesin-14 has become the major member in this clade.
Expanded views of the kinesin sub-family trees from kinesin-1 to kinesin-14 are
accessible online at [www.bio.uni-muenchen.de/~liu/kinesin_new/phylogeny.php].
3.3.3 Evolution of kinesins
With the classification of kinesins in hand, it is easy to determine how many kinesin
sub-families an organism has. In combination with a taxonomic tree, the evolutionary
history of kinesins among species can be uncovered. Figure 34 shows the mapping of
the kinesin groups of each species on the standard taxonomy tree provided by the
NCBI.
It is noteworthy that all kinesin families are represented in Trichoplax adhaerens and
Nematostella vectensis, the roots of the metazoan group in this dataset, and in most of
the mammalian species. Only kinesin-7 is not found in Bos taurus, indicating the loss of
an entire group in this group of animals during evolution. The full compelment of
kinesin super-family members is also found in the sea urchin Strongylocentrotus
purpuratus. But in other species from the deuterostomia group, the loss of one or more
kinesin sub-families is rather widespread. For example, there is no kinesin-8 in Ciona
intestinalis, there is no kinesin-7 or kinesin-11 found in Danio rerio, and there is no
kinesin-9 in Xenopus. Kinesin-10 and kinesin-11 are lost in the entire neuroptera group.
Except for Apis mellifera, no kinesin-9 is found in other insects.
On the other hand, representatives of kinesin-2, kinesin-9 and kinesin-11 are not
present in the current fungal dataset. Kinesin-13 is often lost in members of the
basidiomycota group. Kinesin-6 is not found in any species from the ascomycota group.
Moreover, kinesin-10 and kinesin-13 are lost in both saccharomycetales and
schizosaccharomyces.
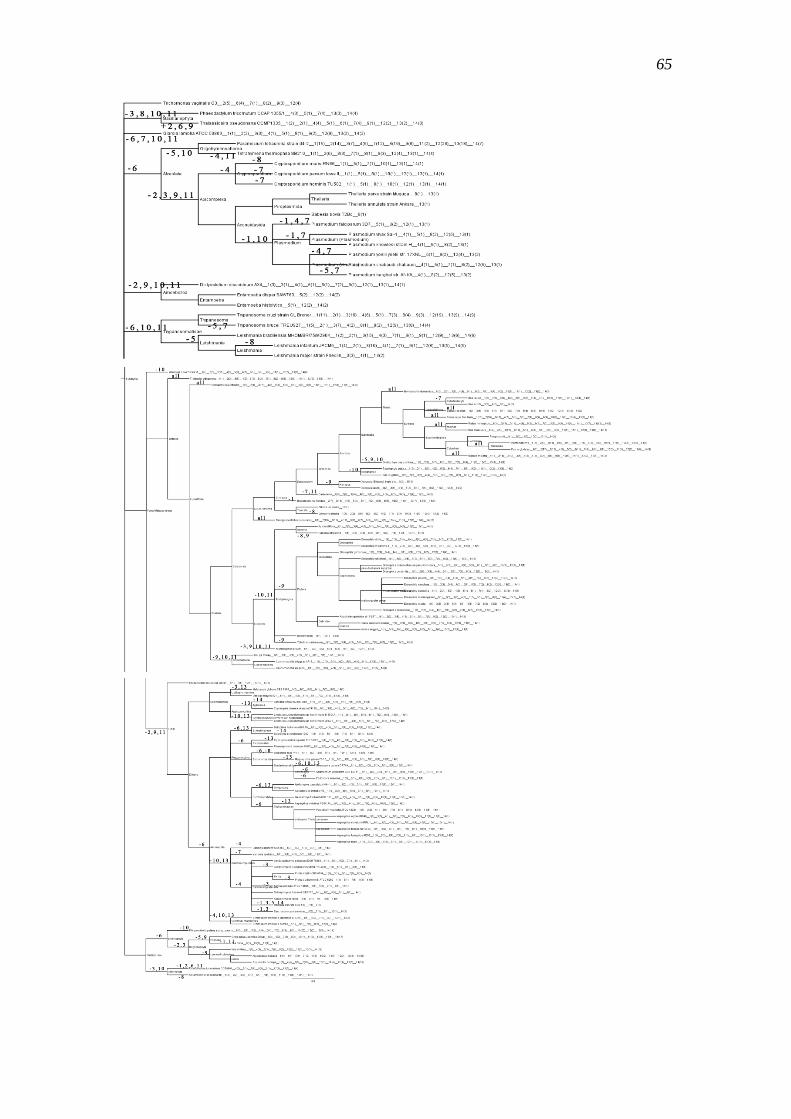
65
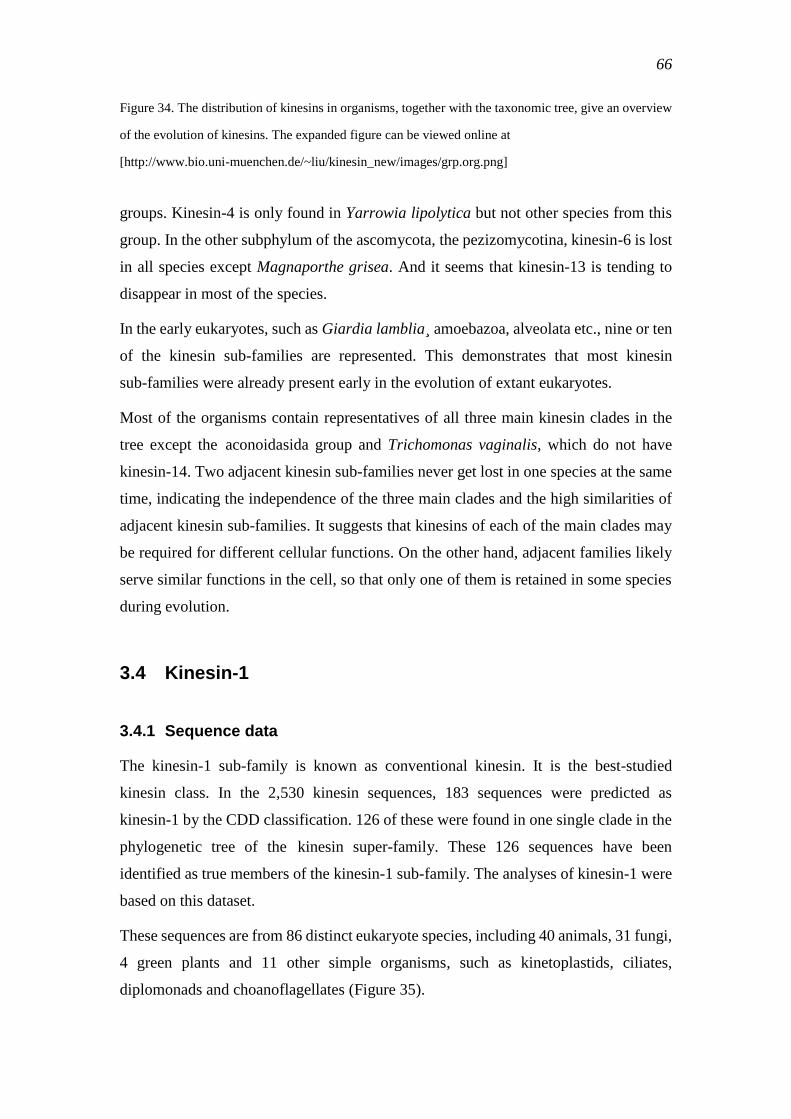
66
Figure 34. The distribution of kinesins in organisms, together with the taxonomic tree, give an overview
of the evolution of kinesins. The expanded figure can be viewed online at
[http://www.bio.uni-muenchen.de/~liu/kinesin_new/images/grp.org.png]
groups. Kinesin-4 is only found in Yarrowia lipolytica but not other species from this
group. In the other subphylum of the ascomycota, the pezizomycotina, kinesin-6 is lost
in all species except Magnaporthe grisea. And it seems that kinesin-13 is tending to
disappear in most of the species.
In the early eukaryotes, such as Giardia lamblia ̧amoebazoa, alveolata etc., nine or ten
of the kinesin sub-families are represented. This demonstrates that most kinesin
sub-families were already present early in the evolution of extant eukaryotes.
Most of the organisms contain representatives of all three main kinesin clades in the
tree except the aconoidasida group and Trichomonas vaginalis, which do not have
kinesin-14. Two adjacent kinesin sub-families never get lost in one species at the same
time, indicating the independence of the three main clades and the high similarities of
adjacent kinesin sub-families. It suggests that kinesins of each of the main clades may
be required for different cellular functions. On the other hand, adjacent families likely
serve similar functions in the cell, so that only one of them is retained in some species
during evolution.
3.4 Kinesin-1
3.4.1 Sequence data
The kinesin-1 sub-family is known as conventional kinesin. It is the best-studied
kinesin class. In the 2,530 kinesin sequences, 183 sequences were predicted as
kinesin-1 by the CDD classification. 126 of these were found in one single clade in the
phylogenetic tree of the kinesin super-family. These 126 sequences have been
identified as true members of the kinesin-1 sub-family. The analyses of kinesin-1 were
based on this dataset.
These sequences are from 86 distinct eukaryote species, including 40 animals, 31 fungi,
4 green plants and 11 other simple organisms, such as kinetoplastids, ciliates,
diplomonads and choanoflagellates (Figure 35).
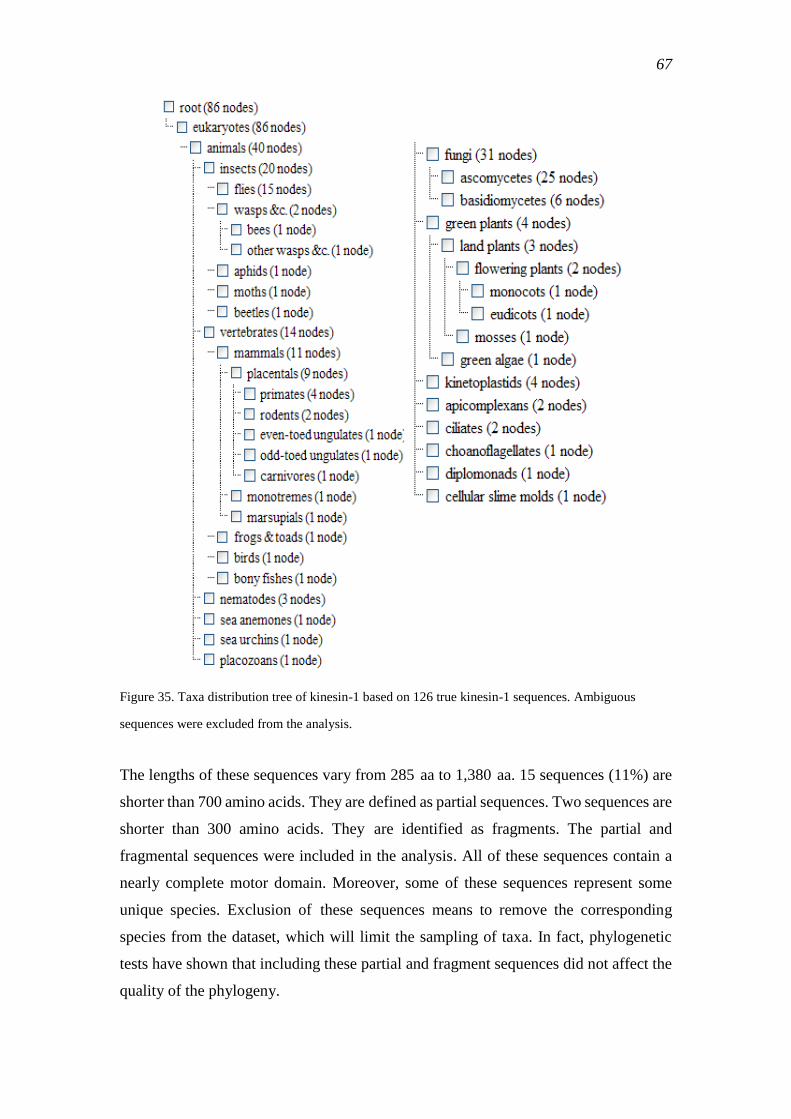
67
Figure 35. Taxa distribution tree of kinesin-1 based on 126 true kinesin-1 sequences. Ambiguous
sequences were excluded from the analysis.
The lengths of these sequences vary from 285 aa to 1,380 aa. 15 sequences (11%) are
shorter than 700 amino acids. They are defined as partial sequences. Two sequences are
shorter than 300 amino acids. They are identified as fragments. The partial and
fragmental sequences were included in the analysis. All of these sequences contain a
nearly complete motor domain. Moreover, some of these sequences represent some
unique species. Exclusion of these sequences means to remove the corresponding
species from the dataset, which will limit the sampling of taxa. In fact, phylogenetic
tests have shown that including these partial and fragment sequences did not affect the
quality of the phylogeny.
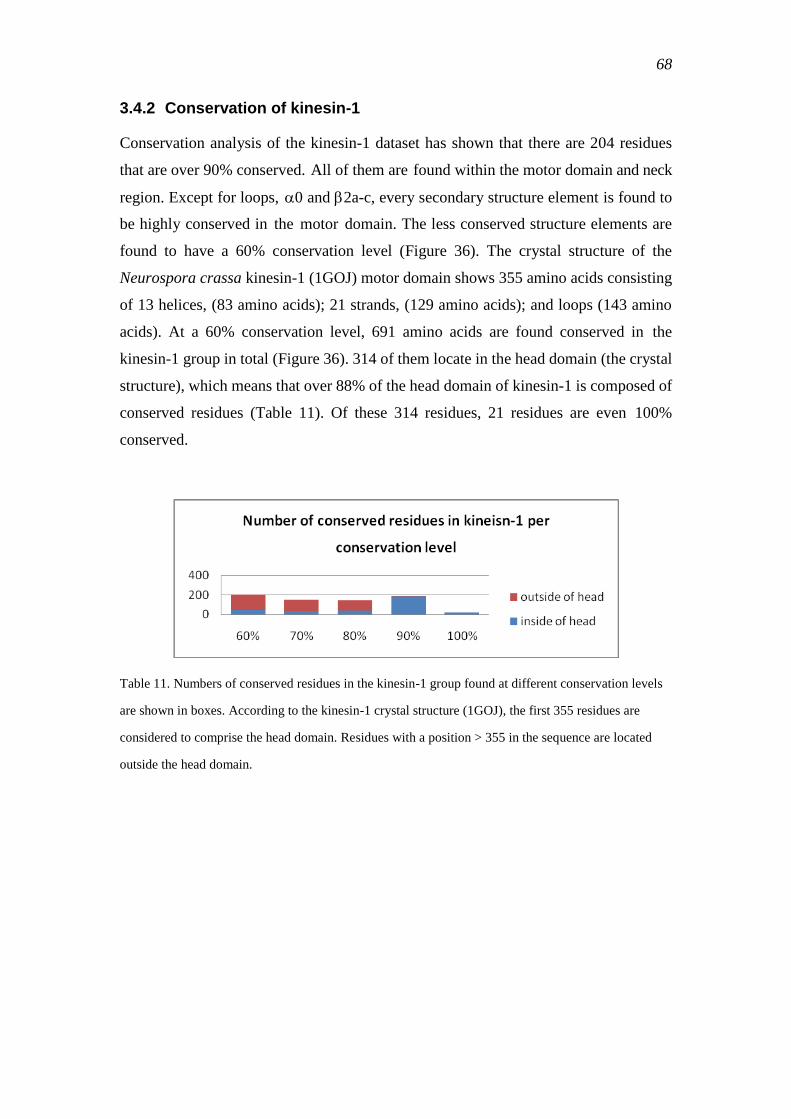
68
3.4.2 Conservation of kinesin-1
Conservation analysis of the kinesin-1 dataset has shown that there are 204 residues
that are over 90% conserved. All of them are found within the motor domain and neck
region. Except for loops, 0 and 2a-c, every secondary structure element is found to
be highly conserved in the motor domain. The less conserved structure elements are
found to have a 60% conservation level (Figure 36). The crystal structure of the
Neurospora crassa kinesin-1 (1GOJ) motor domain shows 355 amino acids consisting
of 13 helices, (83 amino acids); 21 strands, (129 amino acids); and loops (143 amino
acids). At a 60% conservation level, 691 amino acids are found conserved in the
kinesin-1 group in total (Figure 36). 314 of them locate in the head domain (the crystal
structure), which means that over 88% of the head domain of kinesin-1 is composed of
conserved residues (Table 11). Of these 314 residues, 21 residues are even 100%
conserved.
Table 11. Numbers of conserved residues in the kinesin-1 group found at different conservation levels
are shown in boxes. According to the kinesin-1 crystal structure (1GOJ), the first 355 residues are
considered to comprise the head domain. Residues with a position > 355 in the sequence are located
outside the head domain.
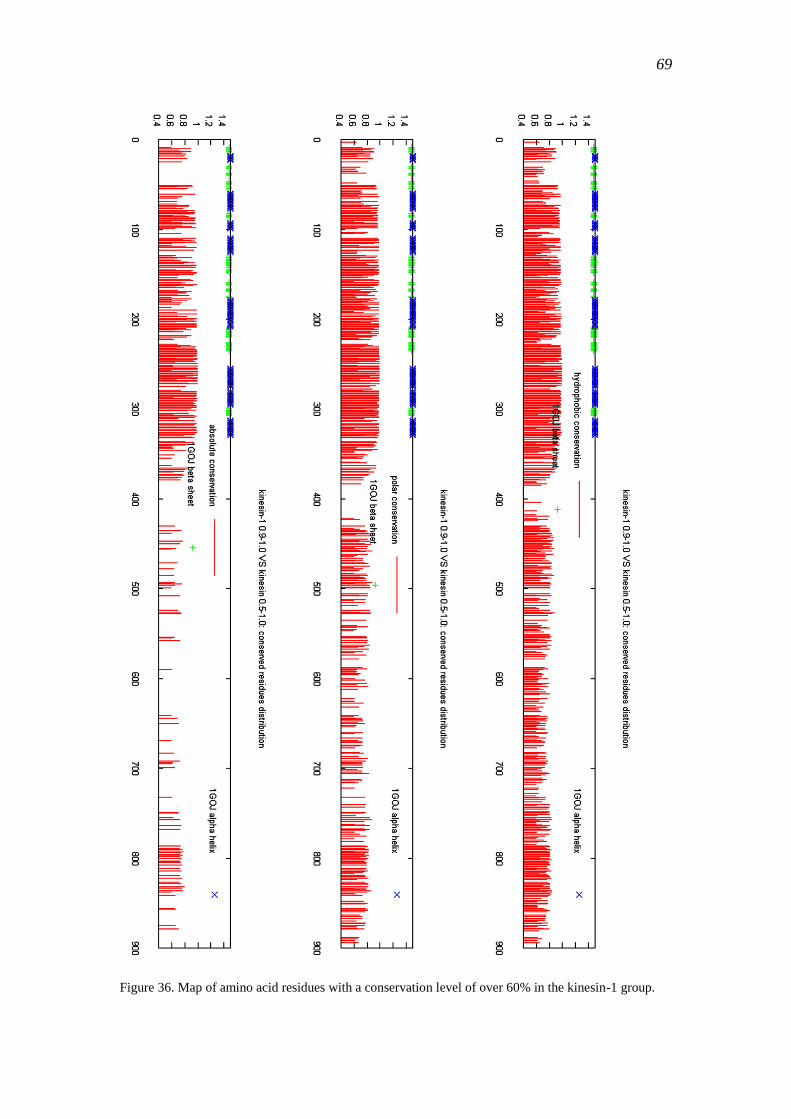
69
Figure 36. Map of amino acid residues with a conservation level of over 60% in the kinesin-1 group.
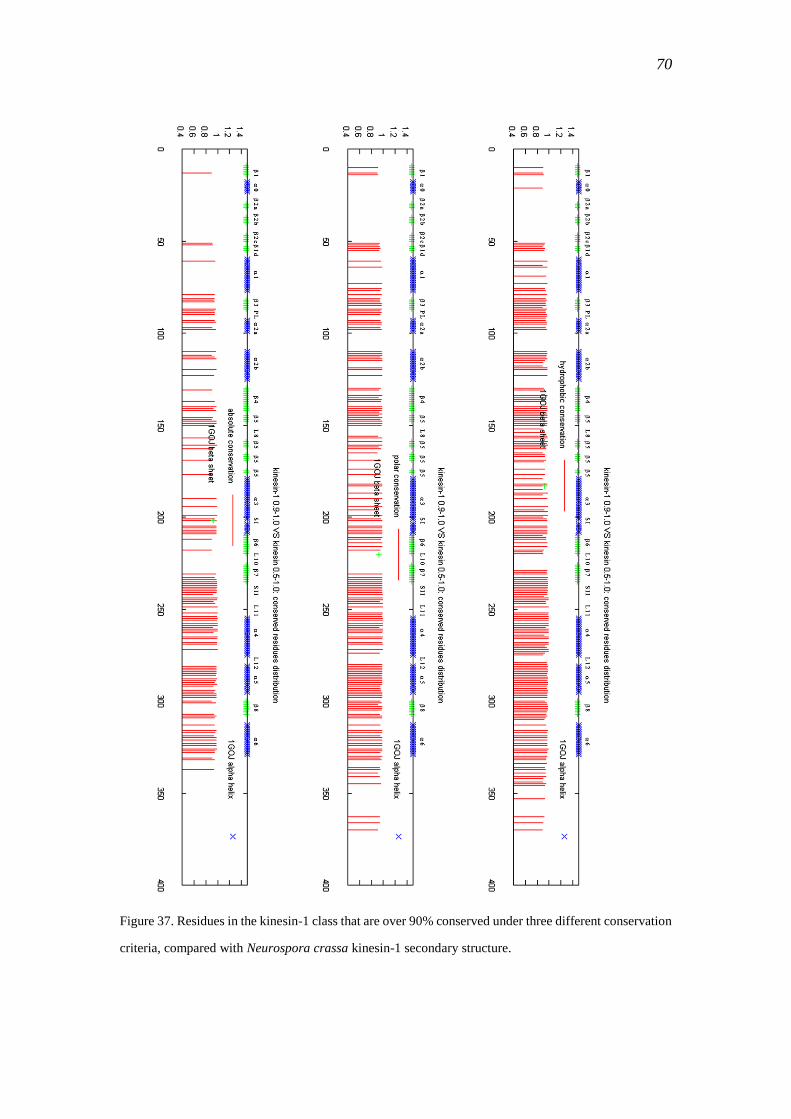
70
Figure 37. Residues in the kinesin-1 class that are over 90% conserved under three different conservation
criteria, compared with Neurospora crassa kinesin-1 secondary structure.
71
Of the 21 residues that are 100% conserved, 10 are 100% absolute conserved, 9 are
100% hydrophobic conserved and the other 2 are 100% non-polar conserved. They are
all found in the microtubule-binding-associated structure elements loop-11 (7 residues),
residues)and residue)Table 12
Structure Position*Residue (100% conserved criteria)
Loop 11 242V(non-polar), 244K(hydrophilic, polar charged, absolute), 245T(neutral, polar
uncharged), 247A(non-polar), 249G(neutral, non-polar, absolute), 252L(hydrophobic,
non-polar, absolute), 254E(hydrophilic)
255A (neutral, non-polar, absolute),256L(hydrophilic, polar charged),
258I(hydrophobic, non-polar, absolute), 259N(hydrophilic, polar uncharged, absolute),
261S(neutral, polar uncharged, absolute), 262L(hydrophobic, non-polar, absolute),
263S(neutral), 265L(hydrophobic, non-polar, absolute), 266G(neutral),
268V(hydrophobic),
269I(hydrophobic, non-polar), 272L(hydrophobic, non-polar, absolute), 273T(neutral)
326R( hydrophilic)
Table 12. List of 100% conserved residues found in the kinesin-1 group. Residues are mapped with their
corresponding structure and shown in the form position*residue (100% conserved criteria). For example,
244K (hydrophilic, polar charged, absolute) indicates the lysine at position 244 is 100% conserved under
all 3 conservation criteria: hydrophilic, polar charged and absolute. Absolute conservation means that all
observed kinesin-1 sequences have the same residue at this position.
These three secondary structure elements are believed to interact directly with the
microtubule [87-91]. The 100% conservation observed in these regions indicates that
loop-11 and are strongly under positive selection. The helix comprises 20
residues in the Neurospora crassa kinesin-1 sequence. 13 of them are found 100%
conserved, while the rest are conserved at 80% -- 90%. The high conservation level of
the helix could be due to the need to interact with the microtubule surface. As the
primary and secondary structure of microtubules is highly conserved at the interaction
site, so are the corresponding interaction sites in the kinesin motor domain. In other
words, these residues have to be 100% conserved in order to create the tightest binding
with the microtubule.
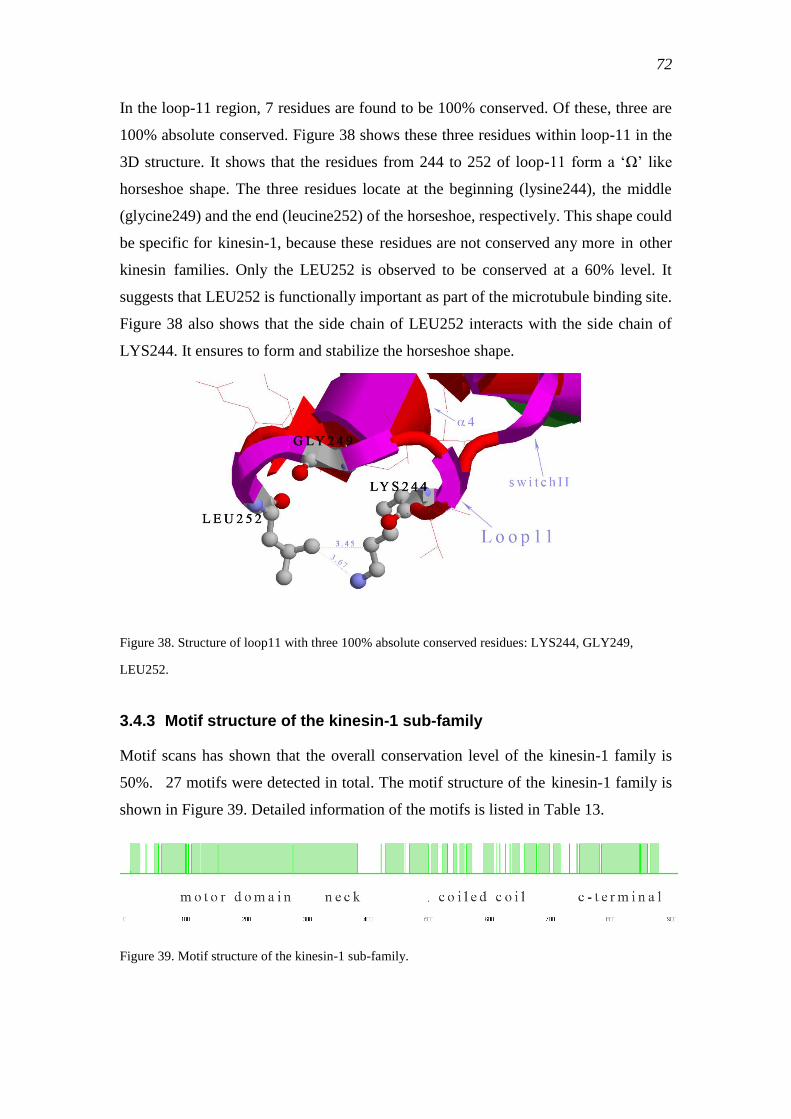
72
In the loop-11 region, 7 residues are found to be 100% conserved. Of these, three are
100% absolute conserved. Figure 38 shows these three residues within loop-11 in the
3D structure. It shows that the residues from 244 to 252 of loop-11 form a ‗Ω‘ like
horseshoe shape. The three residues locate at the beginning (lysine244), the middle
(glycine249) and the end (leucine252) of the horseshoe, respectively. This shape could
be specific for kinesin-1, because these residues are not conserved any more in other
kinesin families. Only the LEU252 is observed to be conserved at a 60% level. It
suggests that LEU252 is functionally important as part of the microtubule binding site.
Figure 38 also shows that the side chain of LEU252 interacts with the side chain of
LYS244. It ensures to form and stabilize the horseshoe shape.
Figure 38. Structure of loop11 with three 100% absolute conserved residues: LYS244, GLY249,
LEU252.
3.4.3 Motif structure of the kinesin-1 sub-family
Motif scans has shown that the overall conservation level of the kinesin-1 family is
50%. 27 motifs were detected in total. The motif structure of the kinesin-1 family is
shown in Figure 39. Detailed information of the motifs is listed in Table 13.
Figure 39. Motif structure of the kinesin-1 sub-family.
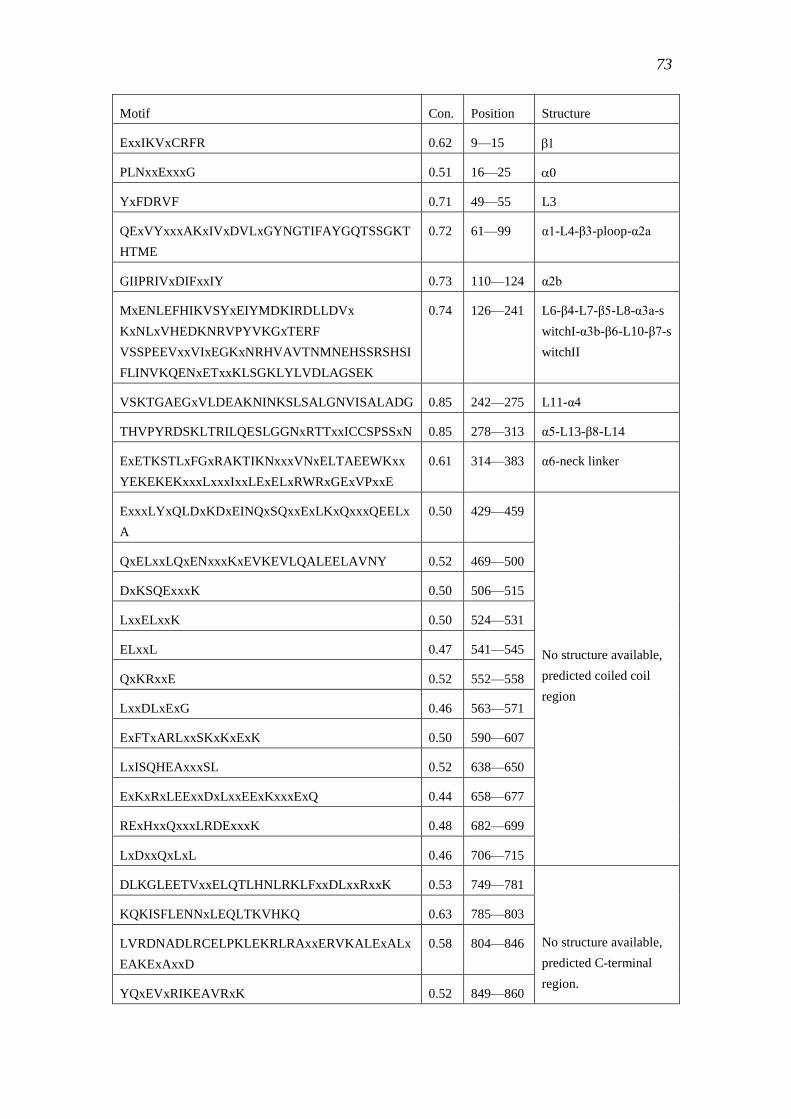
73
Motif Con. Position Structure
ExxIKVxCRFR 0.62 9—15
PLNxxExxxG 0.51 16—25
YxFDRVF 0.71 49—55 L3
QExVYxxxAKxIVxDVLxGYNGTIFAYGQTSSGKT
HTME
0.72 61—99 α1-L4-β3-ploop-α2a
GIIPRIVxDIFxxIY 0.73 110—124 α2b
MxENLEFHIKVSYxEIYMDKIRDLLDVx
KxNLxVHEDKNRVPYVKGxTERF
VSSPEEVxxVIxEGKxNRHVAVTNMNEHSSRSHSI
FLINVKQENxETxxKLSGKLYLVDLAGSEK
0.74 126—241 L6-β4-L7-β5-L8-α3a-s
witchI-α3b-β6-L10-β7-s
witchII
VSKTGAEGxVLDEAKNINKSLSALGNVISALADG 0.85 242—275 L11-α4
THVPYRDSKLTRILQESLGGNxRTTxxICCSPSSxN 0.85 278—313 α5-L13-β8-L14
ExETKSTLxFGxRAKTIKNxxxVNxELTAEEWKxx
YEKEKEKxxxLxxxIxxLExELxRWRxGExVPxxE
0.61 314—383 α6-neck linker
ExxxLYxQLDxKDxEINQxSQxxExLKxQxxxQEELx
A
0.50 429—459
No structure available,
predicted coiled coil
region
QxELxxLQxENxxxKxEVKEVLQALEELAVNY 0.52 469—500
DxKSQExxxK 0.50 506—515
LxxELxxK 0.50 524—531
ELxxL 0.47 541—545
QxKRxxE 0.52 552—558
LxxDLxExG 0.46 563—571
ExFTxARLxxSKxKxExK 0.50 590—607
LxISQHEAxxxSL 0.52 638—650
ExKxRxLEExxDxLxxEExKxxxExQ 0.44 658—677
RExHxxQxxxLRDExxxK 0.48 682—699
LxDxxQxLxL 0.46 706—715
DLKGLEETVxxELQTLHNLRKLFxxDLxxRxxK 0.53 749—781
No structure available,
predicted C-terminal
region.
KQKISFLENNxLEQLTKVHKQ 0.63 785—803
LVRDNADLRCELPKLEKRLRAxxERVKALExALx
EAKExAxxD
0.58 804—846
YQxEVxRIKEAVRxK 0.52 849—860
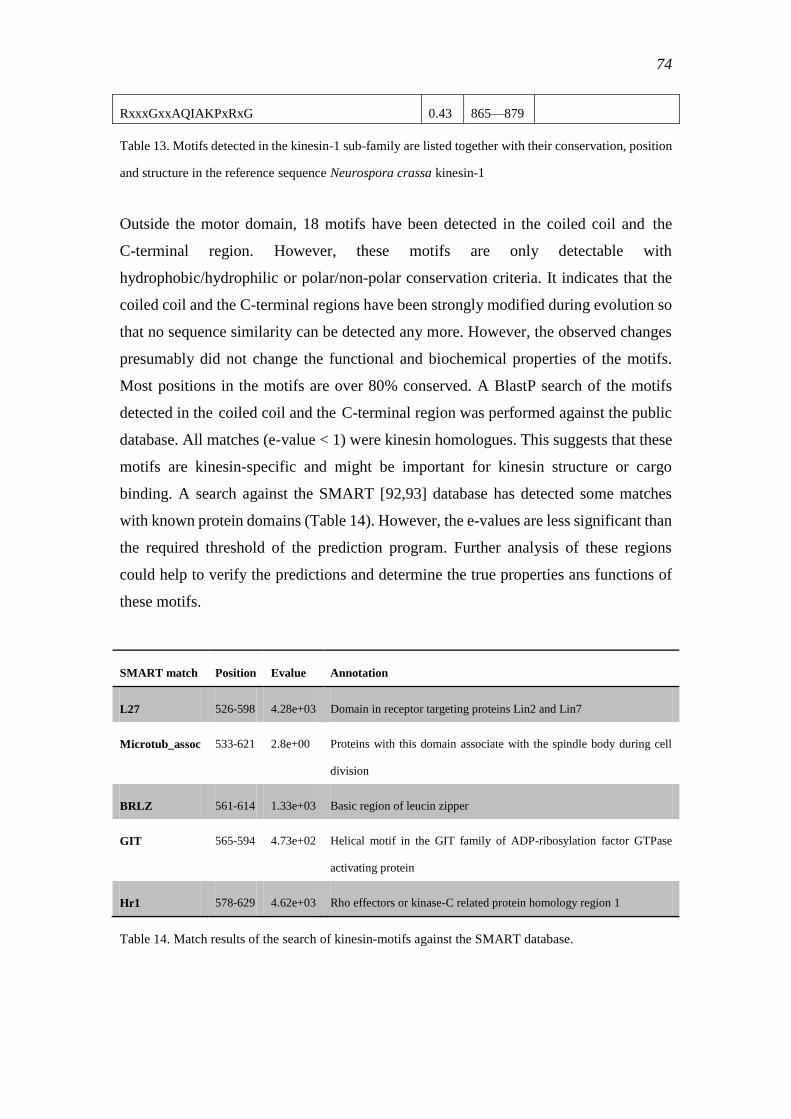
74
RxxxGxxAQIAKPxRxG 0.43 865—879
Table 13. Motifs detected in the kinesin-1 sub-family are listed together with their conservation, position
and structure in the reference sequence Neurospora crassa kinesin-1
Outside the motor domain, 18 motifs have been detected in the coiled coil and the
C-terminal region. However, these motifs are only detectable with
hydrophobic/hydrophilic or polar/non-polar conservation criteria. It indicates that the
coiled coil and the C-terminal regions have been strongly modified during evolution so
that no sequence similarity can be detected any more. However, the observed changes
presumably did not change the functional and biochemical properties of the motifs.
Most positions in the motifs are over 80% conserved. A BlastP search of the motifs
detected in the coiled coil and the C-terminal region was performed against the public
database. All matches (e-value < 1) were kinesin homologues. This suggests that these
motifs are kinesin-specific and might be important for kinesin structure or cargo
binding. A search against the SMART [92,93] database has detected some matches
with known protein domains (Table 14). However, the e-values are less significant than
the required threshold of the prediction program. Further analysis of these regions
could help to verify the predictions and determine the true properties ans functions of
these motifs.
SMART match Position Evalue Annotation
L27 526-598 4.28e+03 Domain in receptor targeting proteins Lin2 and Lin7
Microtub_assoc 533-621 2.8e+00 Proteins with this domain associate with the spindle body during cell
division
BRLZ 561-614 1.33e+03 Basic region of leucin zipper
GIT 565-594 4.73e+02 Helical motif in the GIT family of ADP-ribosylation factor GTPase
activating protein
Hr1 578-629 4.62e+03 Rho effectors or kinase-C related protein homology region 1
Table 14. Match results of the search of kinesin-motifs against the SMART database.
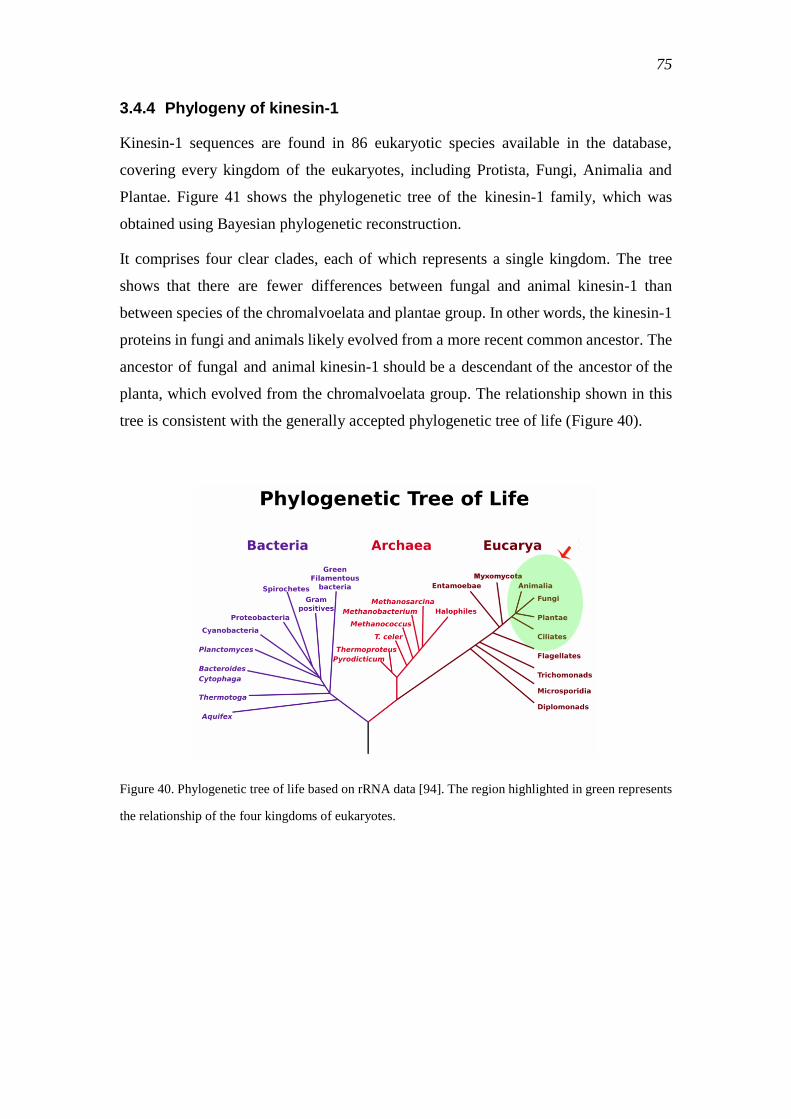
75
3.4.4 Phylogeny of kinesin-1
Kinesin-1 sequences are found in 86 eukaryotic species available in the database,
covering every kingdom of the eukaryotes, including Protista, Fungi, Animalia and
Plantae. Figure 41 shows the phylogenetic tree of the kinesin-1 family, which was
obtained using Bayesian phylogenetic reconstruction.
It comprises four clear clades, each of which represents a single kingdom. The tree
shows that there are fewer differences between fungal and animal kinesin-1 than
between species of the chromalvoelata and plantae group. In other words, the kinesin-1
proteins in fungi and animals likely evolved from a more recent common ancestor. The
ancestor of fungal and animal kinesin-1 should be a descendant of the ancestor of the
planta, which evolved from the chromalvoelata group. The relationship shown in this
tree is consistent with the generally accepted phylogenetic tree of life (Figure 40).
Figure 40. Phylogenetic tree of life based on rRNA data [94]. The region highlighted in green represents
the relationship of the four kingdoms of eukaryotes.
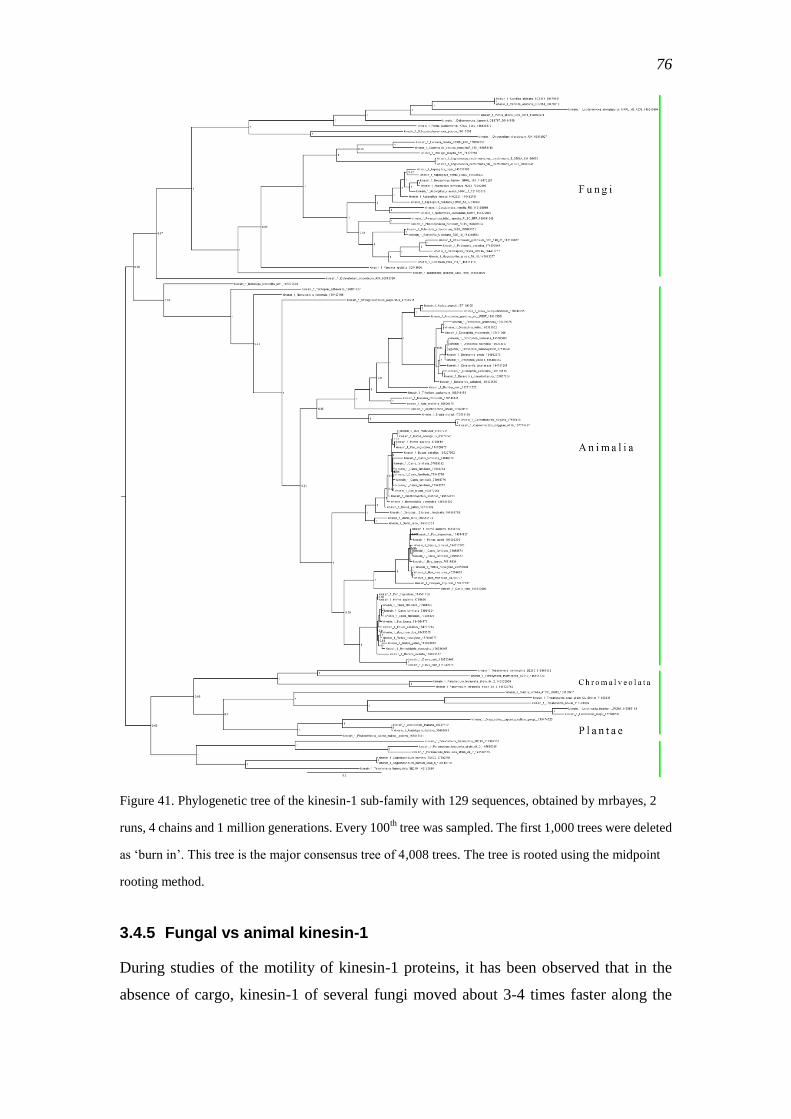
76
Figure 41. Phylogenetic tree of the kinesin-1 sub-family with 129 sequences, obtained by mrbayes, 2
runs, 4 chains and 1 million generations. Every 100th
tree was sampled. The first 1,000 trees were deleted
as ‗burn in‘. This tree is the major consensus tree of 4,008 trees. The tree is rooted using the midpoint
rooting method.
3.4.5 Fungal vs animal kinesin-1
During studies of the motility of kinesin-1 proteins, it has been observed that in the
absence of cargo, kinesin-1 of several fungi moved about 3-4 times faster along the
77
microtubule than animal kinesins. The phylogenetic tree indicates that kinesin-1 has
split into several classes during evolution. Subsequently, these kinesins have been
modified into group-specific proteins and they have become orthologs. The
group-specific functions have been fixed in each group by a series of specific mutations,
deletions or insertions during the evolutionary process. It is plausible that the difference
in the motility of fungal and animal kinesin-1 is caused by some group-specific
modifications of a common ancestor. During evolution, fungi required fast kinesin-1s
for some reason, while the animals needed a slower version of kinesin-1. These
requirements have been realized by specific modifications that became fixed within the
members of each group. To recover these special modifications and eventually to find
the trigger which controls the velocity of kinesin-1, it is necessary to do a
comprehensive comparison of fungal and animal kinesin-1s.
Previous experimental evidence has suggested that the trigger is located inside the
motor domain. Since a half-fungi/half-animal chimera of the motor domain did not
change the animal slow kinesin-1 to a faster one, it is suggested that the trigger is more
complex and presumably involves coordinated changes of several amino acids.
Closer inspection of the kinesin-1 phylogeny (Figure 42) shows that the sequences are
grouped pretty much according to their taxonomic relationship. For example, in the
animal group, insects and vertebrates fall into two clearly separated clades. In the
vertebrate clade, three sub-clades can be observed. This strongly suggests a threefold
duplication event within the vertebrate group. On the other hand, kinesin-1 sequences
have been found in two of the fungal subkingdoms, namely the basidiomycota and
ascomycota. The sequences belonging to the same class are clustered together as a
sub-clade in the phylogeny. Intriguingly, the pezizomycotina, one subphylum of
ascomycota, is more related to the basidiomycota than to the other two subphyla of
ascomycota, the saccharomycetales and the Schizosaccharomyces pombe. They form a
sister-clade to the pezizomycotina and basidiomycota. This association is supported by
a significant posterior probability. It indicates that the tree is well supported and of high
quality.
This tree was used as a guide tree for the prediction of ancestral sequences.
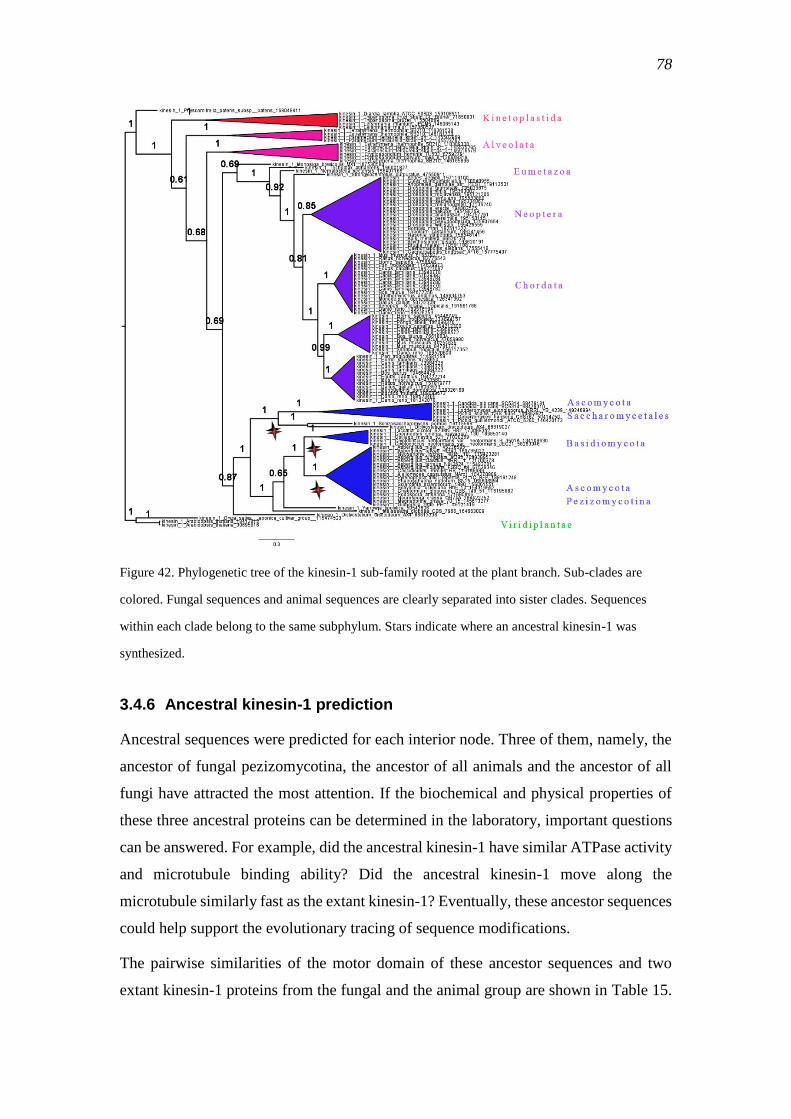
78
Figure 42. Phylogenetic tree of the kinesin-1 sub-family rooted at the plant branch. Sub-clades are
colored. Fungal sequences and animal sequences are clearly separated into sister clades. Sequences
within each clade belong to the same subphylum. Stars indicate where an ancestral kinesin-1 was
synthesized.
3.4.6 Ancestral kinesin-1 prediction
Ancestral sequences were predicted for each interior node. Three of them, namely, the
ancestor of fungal pezizomycotina, the ancestor of all animals and the ancestor of all
fungi have attracted the most attention. If the biochemical and physical properties of
these three ancestral proteins can be determined in the laboratory, important questions
can be answered. For example, did the ancestral kinesin-1 have similar ATPase activity
and microtubule binding ability? Did the ancestral kinesin-1 move along the
microtubule similarly fast as the extant kinesin-1? Eventually, these ancestor sequences
could help support the evolutionary tracing of sequence modifications.
The pairwise similarities of the motor domain of these ancestor sequences and two
extant kinesin-1 proteins from the fungal and the animal group are shown in Table 15.
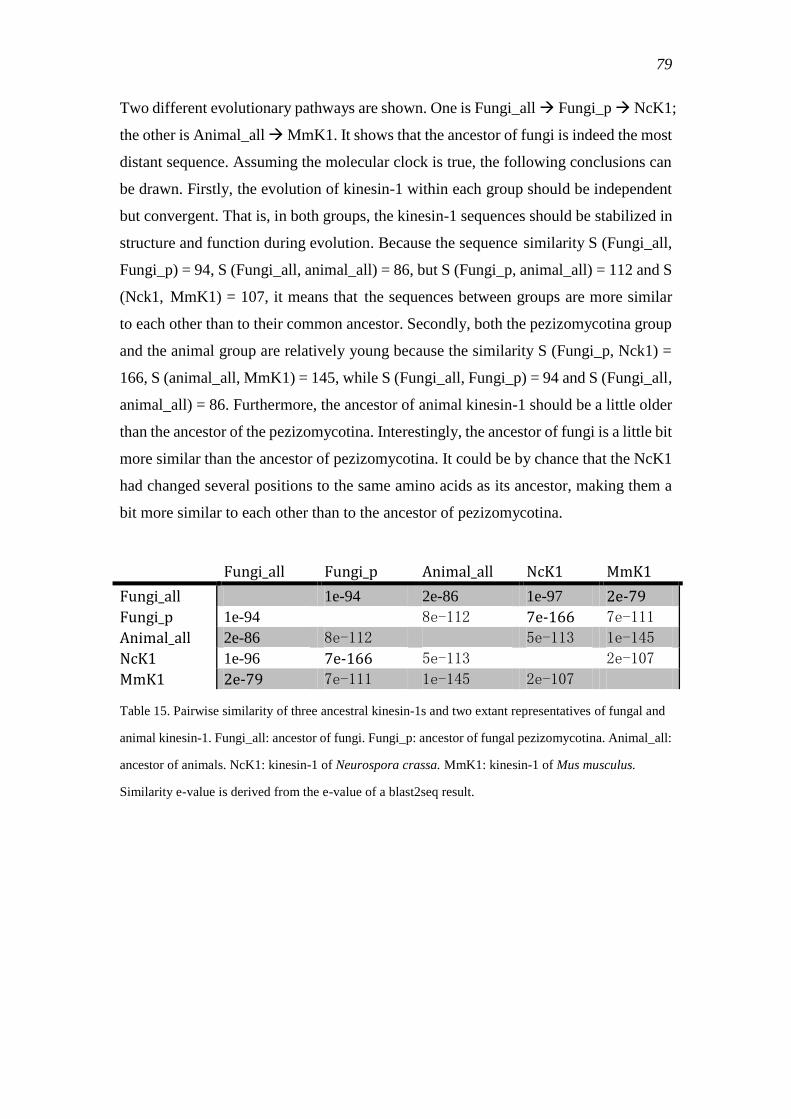
79
Two different evolutionary pathways are shown. One is Fungi_all Fungi_p NcK1;
the other is Animal_all MmK1. It shows that the ancestor of fungi is indeed the most
distant sequence. Assuming the molecular clock is true, the following conclusions can
be drawn. Firstly, the evolution of kinesin-1 within each group should be independent
but convergent. That is, in both groups, the kinesin-1 sequences should be stabilized in
structure and function during evolution. Because the sequence similarity S (Fungi_all,
Fungi_p) = 94, S (Fungi_all, animal_all) = 86, but S (Fungi_p, animal_all) = 112 and S
(Nck1, MmK1) = 107, it means that the sequences between groups are more similar
to each other than to their common ancestor. Secondly, both the pezizomycotina group
and the animal group are relatively young because the similarity S (Fungi_p, Nck1) =
166, S (animal_all, MmK1) = 145, while S (Fungi_all, Fungi_p) = 94 and S (Fungi_all,
animal_all) = 86. Furthermore, the ancestor of animal kinesin-1 should be a little older
than the ancestor of the pezizomycotina. Interestingly, the ancestor of fungi is a little bit
more similar than the ancestor of pezizomycotina. It could be by chance that the NcK1
had changed several positions to the same amino acids as its ancestor, making them a
bit more similar to each other than to the ancestor of pezizomycotina.
Fungi_all Fungi_p Animal_all NcK1 MmK1
Fungi_all 1e-94 2e-86 1e-97 2e-79
Fungi_p 1e-94 8e-112 7e-166 7e-111
Animal_all 2e-86 8e-112 5e-113 1e-145
NcK1 1e-96 7e-166 5e-113 2e-107
MmK1 2e-79 7e-111 1e-145 2e-107
Table 15. Pairwise similarity of three ancestral kinesin-1s and two extant representatives of fungal and
animal kinesin-1. Fungi_all: ancestor of fungi. Fungi_p: ancestor of fungal pezizomycotina. Animal_all:
ancestor of animals. NcK1: kinesin-1 of Neurospora crassa. MmK1: kinesin-1 of Mus musculus.
Similarity e-value is derived from the e-value of a blast2seq result.
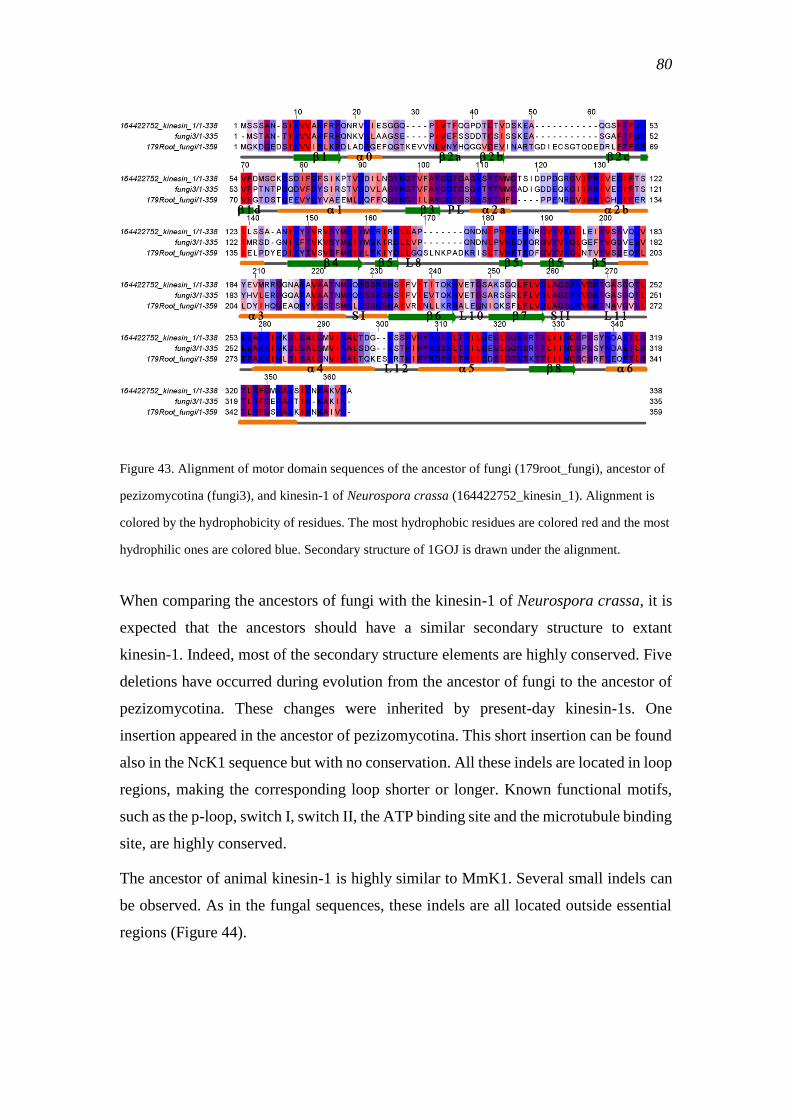
80
Figure 43. Alignment of motor domain sequences of the ancestor of fungi (179root_fungi), ancestor of
pezizomycotina (fungi3), and kinesin-1 of Neurospora crassa (164422752_kinesin_1). Alignment is
colored by the hydrophobicity of residues. The most hydrophobic residues are colored red and the most
hydrophilic ones are colored blue. Secondary structure of 1GOJ is drawn under the alignment.
When comparing the ancestors of fungi with the kinesin-1 of Neurospora crassa, it is
expected that the ancestors should have a similar secondary structure to extant
kinesin-1. Indeed, most of the secondary structure elements are highly conserved. Five
deletions have occurred during evolution from the ancestor of fungi to the ancestor of
pezizomycotina. These changes were inherited by present-day kinesin-1s. One
insertion appeared in the ancestor of pezizomycotina. This short insertion can be found
also in the NcK1 sequence but with no conservation. All these indels are located in loop
regions, making the corresponding loop shorter or longer. Known functional motifs,
such as the p-loop, switch I, switch II, the ATP binding site and the microtubule binding
site, are highly conserved.
The ancestor of animal kinesin-1 is highly similar to MmK1. Several small indels can
be observed. As in the fungal sequences, these indels are all located outside essential
regions (Figure 44).
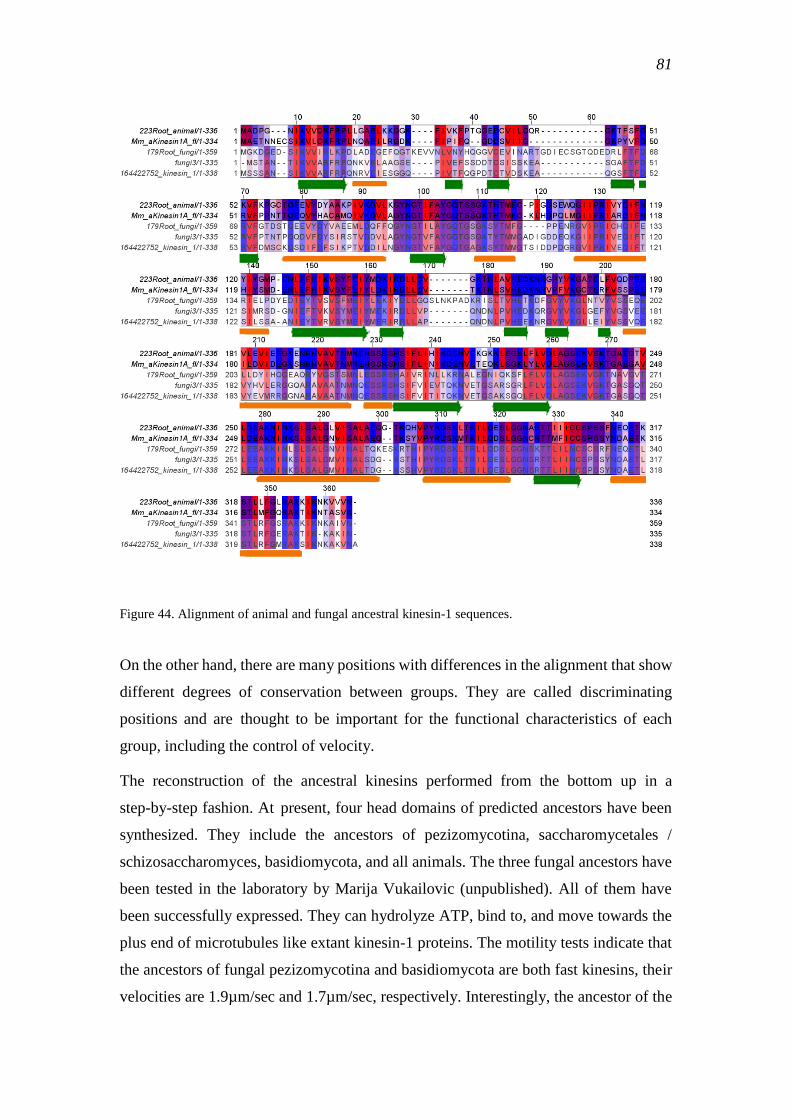
81
Figure 44. Alignment of animal and fungal ancestral kinesin-1 sequences.
On the other hand, there are many positions with differences in the alignment that show
different degrees of conservation between groups. They are called discriminating
positions and are thought to be important for the functional characteristics of each
group, including the control of velocity.
The reconstruction of the ancestral kinesins performed from the bottom up in a
step-by-step fashion. At present, four head domains of predicted ancestors have been
synthesized. They include the ancestors of pezizomycotina, saccharomycetales /
schizosaccharomyces, basidiomycota, and all animals. The three fungal ancestors have
been tested in the laboratory by Marija Vukailovic (unpublished). All of them have
been successfully expressed. They can hydrolyze ATP, bind to, and move towards the
plus end of microtubules like extant kinesin-1 proteins. The motility tests indicate that
the ancestors of fungal pezizomycotina and basidiomycota are both fast kinesins, their
velocities are 1.9µm/sec and 1.7µm/sec, respectively. Interestingly, the ancestor of the
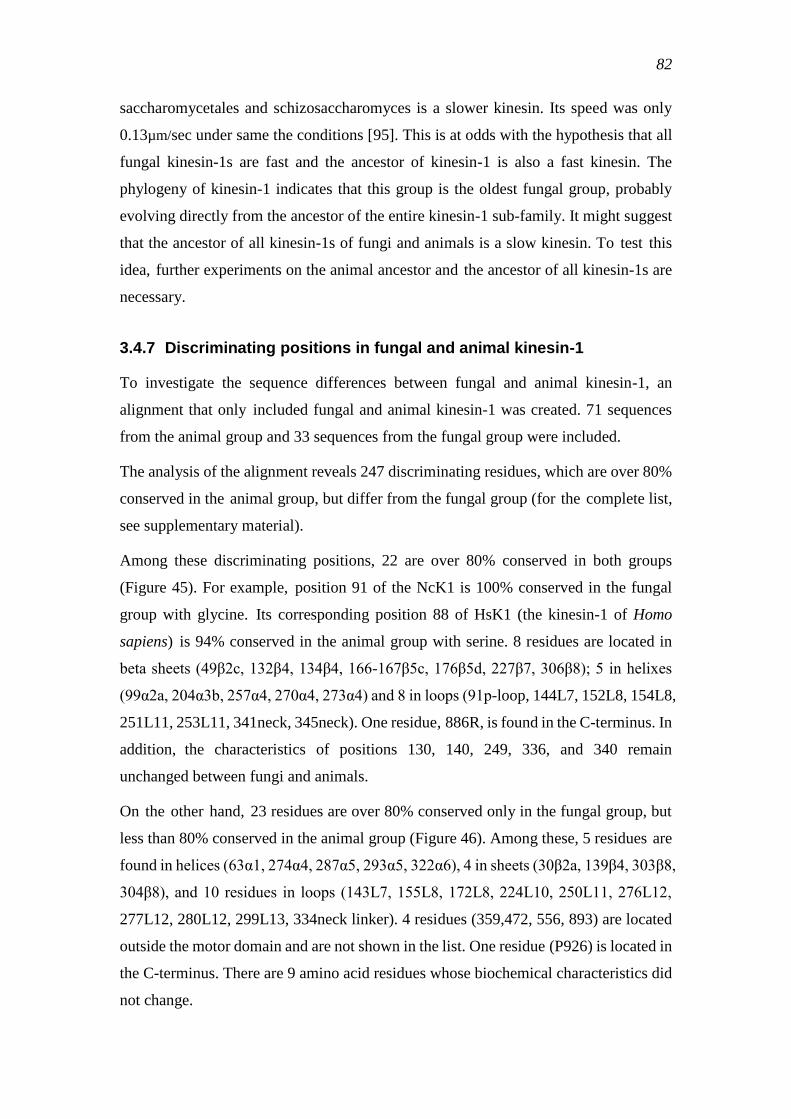
82
saccharomycetales and schizosaccharomyces is a slower kinesin. Its speed was only
0.13µm/sec under same the conditions [95]. This is at odds with the hypothesis that all
fungal kinesin-1s are fast and the ancestor of kinesin-1 is also a fast kinesin. The
phylogeny of kinesin-1 indicates that this group is the oldest fungal group, probably
evolving directly from the ancestor of the entire kinesin-1 sub-family. It might suggest
that the ancestor of all kinesin-1s of fungi and animals is a slow kinesin. To test this
idea, further experiments on the animal ancestor and the ancestor of all kinesin-1s are
necessary.
3.4.7 Discriminating positions in fungal and animal kinesin-1
To investigate the sequence differences between fungal and animal kinesin-1, an
alignment that only included fungal and animal kinesin-1 was created. 71 sequences
from the animal group and 33 sequences from the fungal group were included.
The analysis of the alignment reveals 247 discriminating residues, which are over 80%
conserved in the animal group, but differ from the fungal group (for the complete list,
see supplementary material).
Among these discriminating positions, 22 are over 80% conserved in both groups
(Figure 45). For example, position 91 of the NcK1 is 100% conserved in the fungal
group with glycine. Its corresponding position 88 of HsK1 (the kinesin-1 of Homo
sapiens) is 94% conserved in the animal group with serine. 8 residues are located in
beta sheets (49β2c, 132β4, 134β4, 166-167β5c, 176β5d, 227β7, 306β8); 5 in helixes
(99α2a, 204α3b, 257α4, 270α4, 273α4) and 8 in loops (91p-loop, 144L7, 152L8, 154L8,
251L11, 253L11, 341neck, 345neck). One residue, 886R, is found in the C-terminus. In
addition, the characteristics of positions 130, 140, 249, 336, and 340 remain
unchanged between fungi and animals.
On the other hand, 23 residues are over 80% conserved only in the fungal group, but
less than 80% conserved in the animal group (Figure 46). Among these, 5 residues are
found in helices (63α1, 274α4, 287α5, 293α5, 322α6), 4 in sheets (30β2a, 139β4, 303β8,
304β8), and 10 residues in loops (143L7, 155L8, 172L8, 224L10, 250L11, 276L12,
277L12, 280L12, 299L13, 334neck linker). 4 residues (359,472, 556, 893) are located
outside the motor domain and are not shown in the list. One residue (P926) is located in
the C-terminus. There are 9 amino acid residues whose biochemical characteristics did
not change.
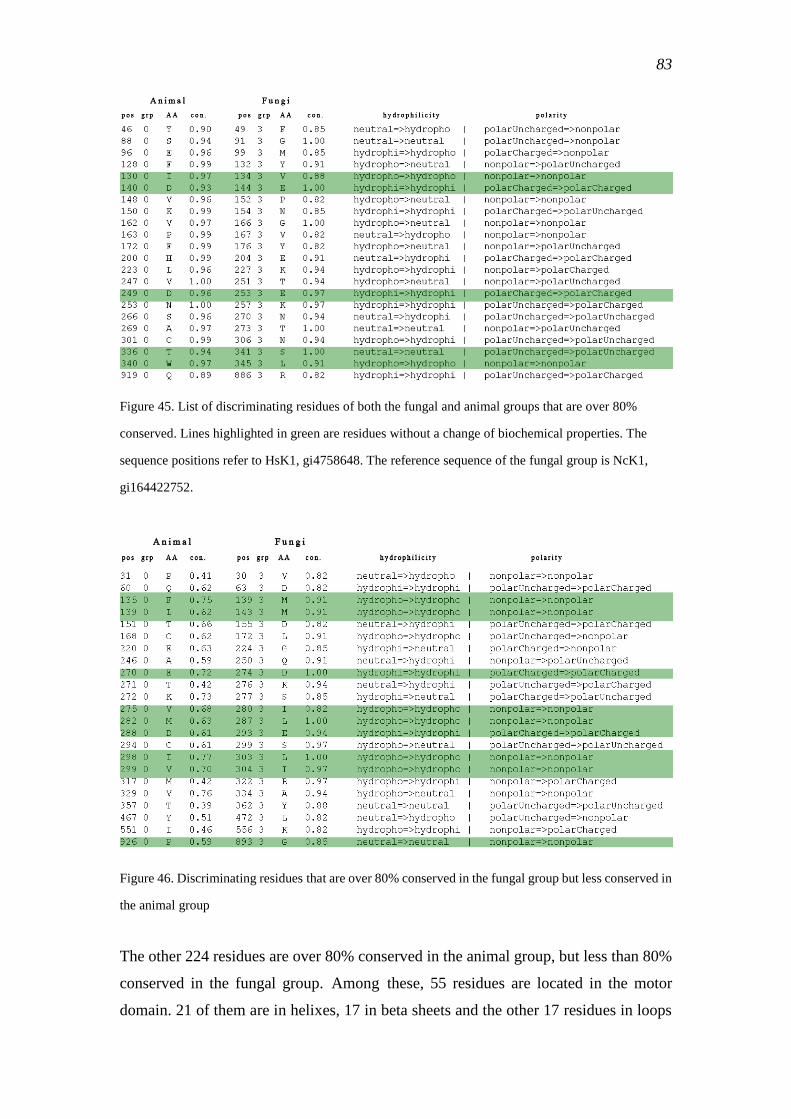
83
Figure 45. List of discriminating residues of both the fungal and animal groups that are over 80%
conserved. Lines highlighted in green are residues without a change of biochemical properties. The
sequence positions refer to HsK1, gi4758648. The reference sequence of the fungal group is NcK1,
gi164422752.
Figure 46. Discriminating residues that are over 80% conserved in the fungal group but less conserved in
the animal group
The other 224 residues are over 80% conserved in the animal group, but less than 80%
conserved in the fungal group. Among these, 55 residues are located in the motor
domain. 21 of them are in helixes, 17 in beta sheets and the other 17 residues in loops
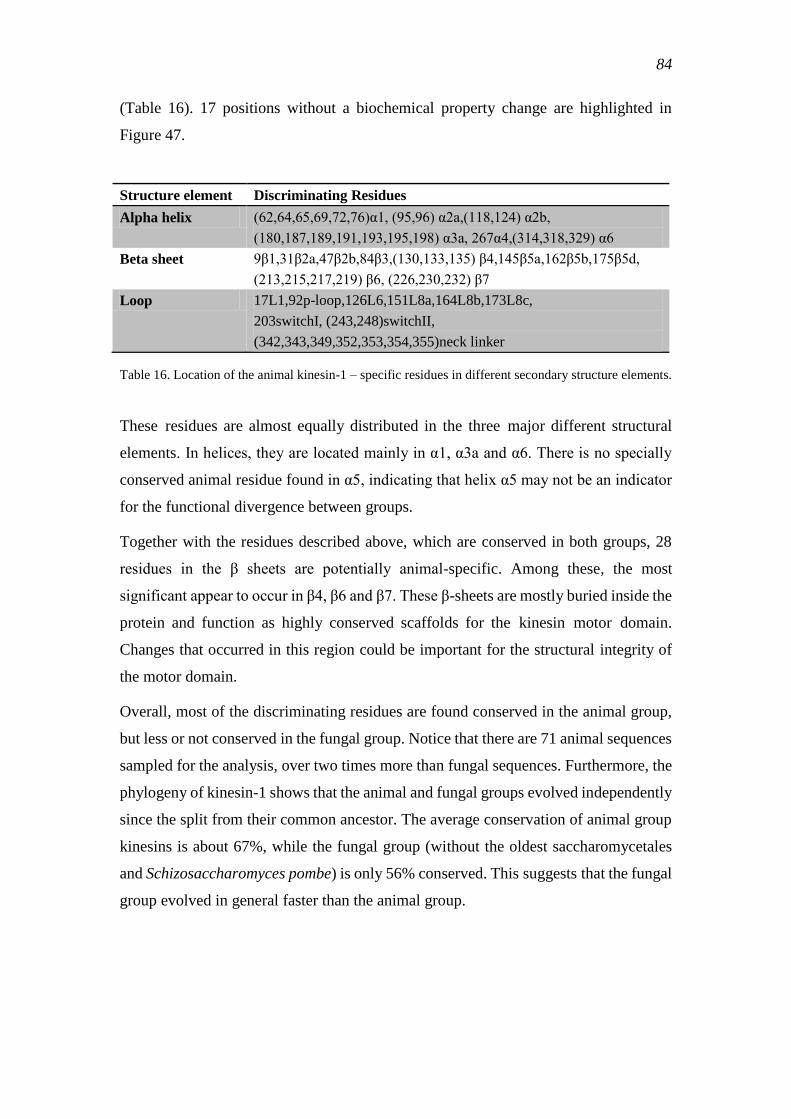
84
(Table 16). 17 positions without a biochemical property change are highlighted in
Figure 47.
Structure element Discriminating Residues
Alpha helix (62,64,65,69,72,76)α1, (95,96) α2a,(118,124) α2b,
(180,187,189,191,193,195,198) α3a, 267α4,(314,318,329) α6
Beta sheet 9β1,31β2a,47β2b,84β3,(130,133,135) β4,145β5a,162β5b,175β5d,
(213,215,217,219) β6, (226,230,232) β7
Loop 17L1,92p-loop,126L6,151L8a,164L8b,173L8c,
203switchI, (243,248)switchII,
(342,343,349,352,353,354,355)neck linker
Table 16. Location of the animal kinesin-1 – specific residues in different secondary structure elements.
These residues are almost equally distributed in the three major different structural
elements. In helices, they are located mainly in α1, α3a and α6. There is no specially
conserved animal residue found in α5, indicating that helix α5 may not be an indicator
for the functional divergence between groups.
Together with the residues described above, which are conserved in both groups, 28
residues in the β sheets are potentially animal-specific. Among these, the most
significant appear to occur in β4, β6 and β7. These β-sheets are mostly buried inside the
protein and function as highly conserved scaffolds for the kinesin motor domain.
Changes that occurred in this region could be important for the structural integrity of
the motor domain.
Overall, most of the discriminating residues are found conserved in the animal group,
but less or not conserved in the fungal group. Notice that there are 71 animal sequences
sampled for the analysis, over two times more than fungal sequences. Furthermore, the
phylogeny of kinesin-1 shows that the animal and fungal groups evolved independently
since the split from their common ancestor. The average conservation of animal group
kinesins is about 67%, while the fungal group (without the oldest saccharomycetales
and Schizosaccharomyces pombe) is only 56% conserved. This suggests that the fungal
group evolved in general faster than the animal group.
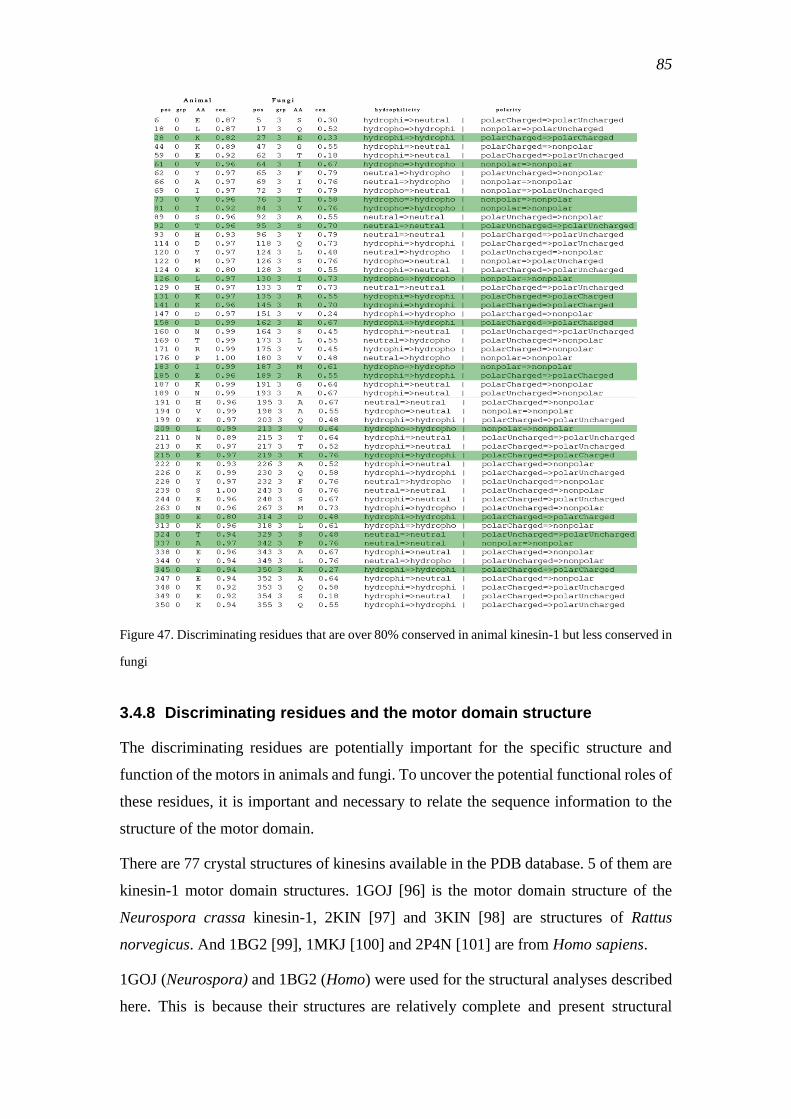
85
Figure 47. Discriminating residues that are over 80% conserved in animal kinesin-1 but less conserved in
fungi
3.4.8 Discriminating residues and the motor domain structure
The discriminating residues are potentially important for the specific structure and
function of the motors in animals and fungi. To uncover the potential functional roles of
these residues, it is important and necessary to relate the sequence information to the
structure of the motor domain.
There are 77 crystal structures of kinesins available in the PDB database. 5 of them are
kinesin-1 motor domain structures. 1GOJ [96] is the motor domain structure of the
Neurospora crassa kinesin-1, 2KIN [97] and 3KIN [98] are structures of Rattus
norvegicus. And 1BG2 [99], 1MKJ [100] and 2P4N [101] are from Homo sapiens.
1GOJ (Neurospora) and 1BG2 (Homo) were used for the structural analyses described
here. This is because their structures are relatively complete and present structural
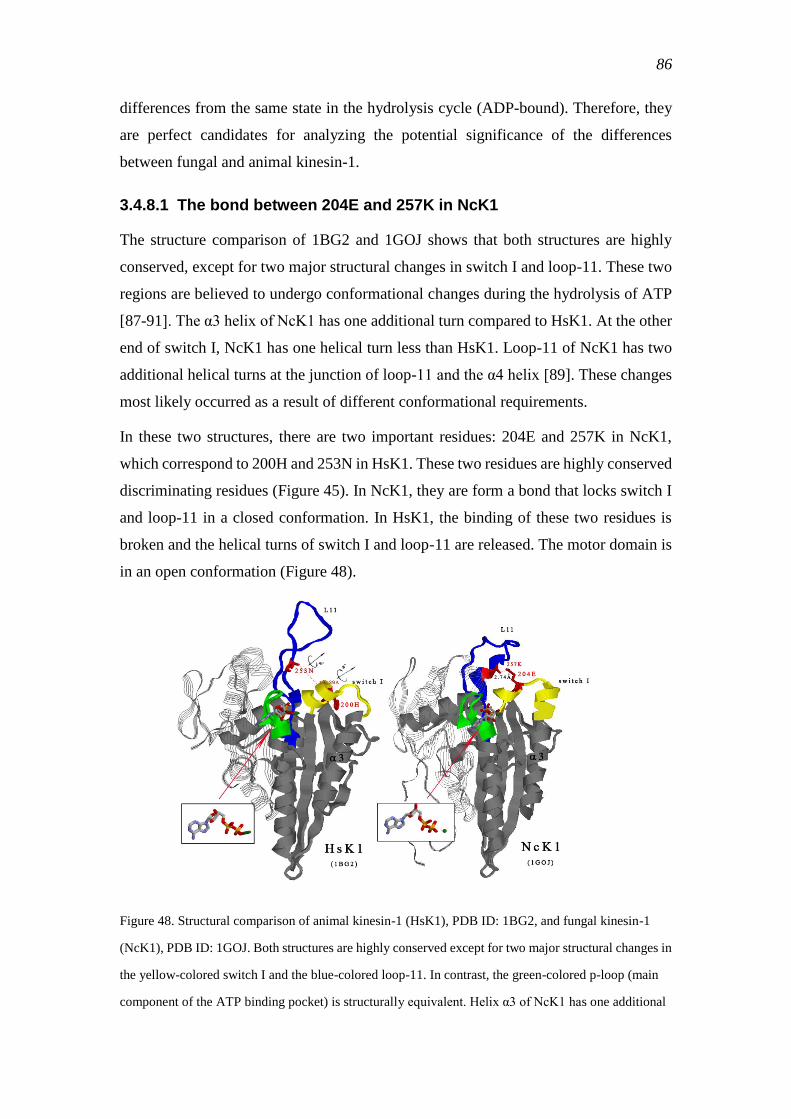
86
differences from the same state in the hydrolysis cycle (ADP-bound). Therefore, they
are perfect candidates for analyzing the potential significance of the differences
between fungal and animal kinesin-1.
3.4.8.1 The bond between 204E and 257K in NcK1
The structure comparison of 1BG2 and 1GOJ shows that both structures are highly
conserved, except for two major structural changes in switch I and loop-11. These two
regions are believed to undergo conformational changes during the hydrolysis of ATP
[87-91]. The α3 helix of NcK1 has one additional turn compared to HsK1. At the other
end of switch I, NcK1 has one helical turn less than HsK1. Loop-11 of NcK1 has two
additional helical turns at the junction of loop-11 and the α4 helix [89]. These changes
most likely occurred as a result of different conformational requirements.
In these two structures, there are two important residues: 204E and 257K in NcK1,
which correspond to 200H and 253N in HsK1. These two residues are highly conserved
discriminating residues (Figure 45). In NcK1, they are form a bond that locks switch I
and loop-11 in a closed conformation. In HsK1, the binding of these two residues is
broken and the helical turns of switch I and loop-11 are released. The motor domain is
in an open conformation (Figure 48).
Figure 48. Structural comparison of animal kinesin-1 (HsK1), PDB ID: 1BG2, and fungal kinesin-1
(NcK1), PDB ID: 1GOJ. Both structures are highly conserved except for two major structural changes in
the yellow-colored switch I and the blue-colored loop-11. In contrast, the green-colored p-loop (main
component of the ATP binding pocket) is structurally equivalent. Helix α3 of NcK1 has one additional
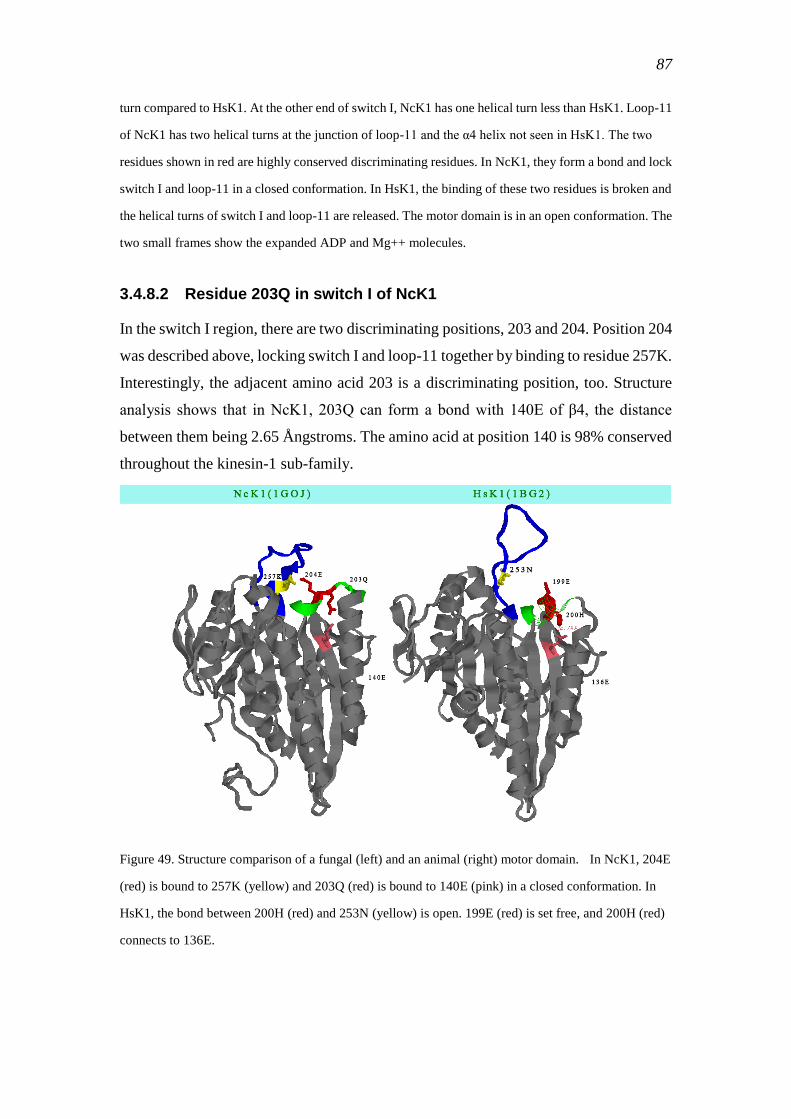
87
turn compared to HsK1. At the other end of switch I, NcK1 has one helical turn less than HsK1. Loop-11
of NcK1 has two helical turns at the junction of loop-11 and the α4 helix not seen in HsK1. The two
residues shown in red are highly conserved discriminating residues. In NcK1, they form a bond and lock
switch I and loop-11 in a closed conformation. In HsK1, the binding of these two residues is broken and
the helical turns of switch I and loop-11 are released. The motor domain is in an open conformation. The
two small frames show the expanded ADP and Mg++ molecules.
3.4.8.2 Residue 203Q in switch I of NcK1
In the switch I region, there are two discriminating positions, 203 and 204. Position 204
was described above, locking switch I and loop-11 together by binding to residue 257K.
Interestingly, the adjacent amino acid 203 is a discriminating position, too. Structure
analysis shows that in NcK1, 203Q can form a bond with 140E of β4, the distance
between them being 2.65 Ångstroms. The amino acid at position 140 is 98% conserved
throughout the kinesin-1 sub-family.
Figure 49. Structure comparison of a fungal (left) and an animal (right) motor domain. In NcK1, 204E
(red) is bound to 257K (yellow) and 203Q (red) is bound to 140E (pink) in a closed conformation. In
HsK1, the bond between 200H (red) and 253N (yellow) is open. 199E (red) is set free, and 200H (red)
connects to 136E.
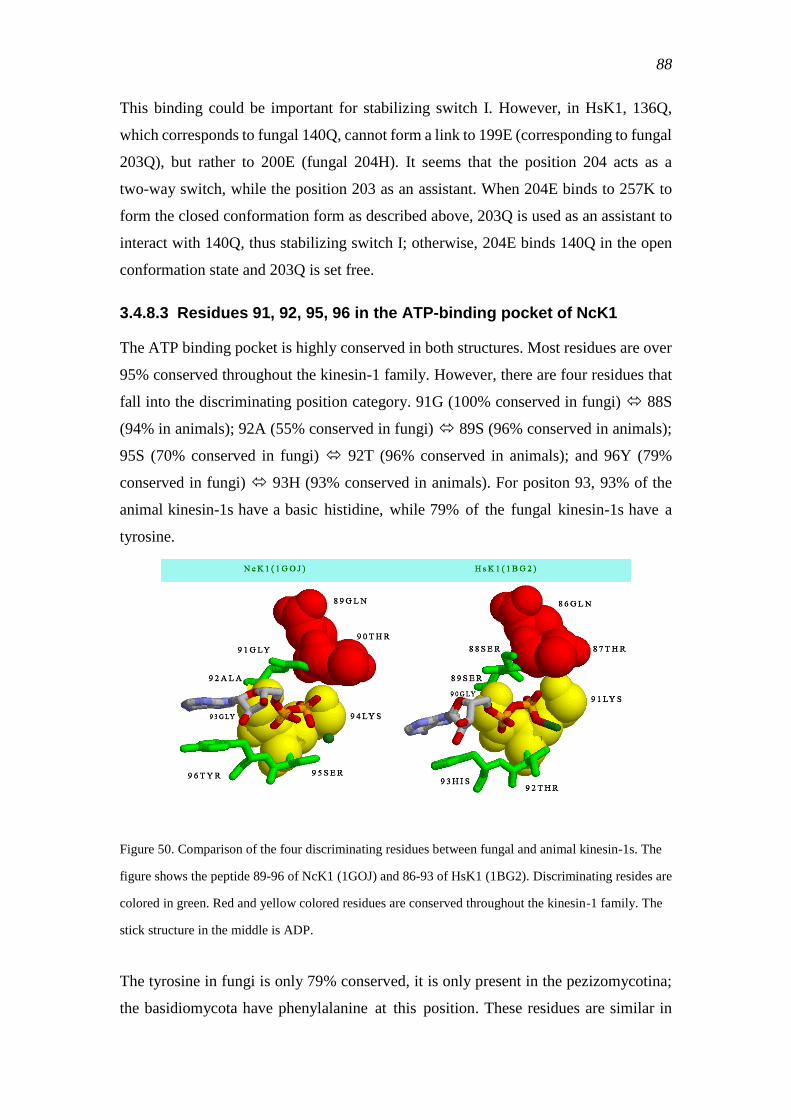
88
This binding could be important for stabilizing switch I. However, in HsK1, 136Q,
which corresponds to fungal 140Q, cannot form a link to 199E (corresponding to fungal
203Q), but rather to 200E (fungal 204H). It seems that the position 204 acts as a
two-way switch, while the position 203 as an assistant. When 204E binds to 257K to
form the closed conformation form as described above, 203Q is used as an assistant to
interact with 140Q, thus stabilizing switch I; otherwise, 204E binds 140Q in the open
conformation state and 203Q is set free.
3.4.8.3 Residues 91, 92, 95, 96 in the ATP-binding pocket of NcK1
The ATP binding pocket is highly conserved in both structures. Most residues are over
95% conserved throughout the kinesin-1 family. However, there are four residues that
fall into the discriminating position category. 91G (100% conserved in fungi) 88S
(94% in animals); 92A (55% conserved in fungi) 89S (96% conserved in animals);
95S (70% conserved in fungi) 92T (96% conserved in animals); and 96Y (79%
conserved in fungi) 93H (93% conserved in animals). For positon 93, 93% of the
animal kinesin-1s have a basic histidine, while 79% of the fungal kinesin-1s have a
tyrosine.
Figure 50. Comparison of the four discriminating residues between fungal and animal kinesin-1s. The
figure shows the peptide 89-96 of NcK1 (1GOJ) and 86-93 of HsK1 (1BG2). Discriminating resides are
colored in green. Red and yellow colored residues are conserved throughout the kinesin-1 family. The
stick structure in the middle is ADP.
The tyrosine in fungi is only 79% conserved, it is only present in the pezizomycotina;
the basidiomycota have phenylalanine at this position. These residues are similar in
89
structure: a ring which forms a pi-interaction with the adenine ring of the ATP (Figure
50).
Phenylalanine and tyrosine are non-polar aromatic amino acids. It is known that
tyrosine is derived from phenylalanine by hydroxylation in the para position.
Hydrophobic tyrosine is significantly more soluble than phenylalanine, and its phenolic
hydroxyl group is significantly acidic. When buried inside a protein, the ionization will
yield an exceedingly unstable phenolate anion. Histidine has a positively charged
imidazole group. It is used by many proteins in enzyme-catalyzed regulatory
mechanisms, changing the conformation and behavior of the polypeptide in acidic
regions [102]. It could probably be the reason why the histidine is fixed in the animal
group, while the fungal kinesin-1s favor the tyrosine and phenylalanine.
The analysis of the velocities of fungal ancestor sequences synthesized in vitro showed
that the ancestors of fungal basidiomycota and pezizomycotina are both fast. In these
two groups, the sequence of the peptide containing the four discriminating positions (91,
92, 95, 96) in the ATP binding pocket is GSGKTF and GSGKTY, respectively. A
comparison with NcK1, which has a GAGKSY motif, shows that the mutational
combinations Y96F, (A91S, S95T) or (A91S, S95T, Y96F) do not lead to a slowing
down of kinesin-1. This suggests that the velocity control is more complex and involves
additional changes unrelated to the ATP binding pocket. In general, it is believed that a
high ATPase activity can accelerate the ADP release step and thus lead to a high
enzymatic velocity [96]. The changes in the four discriminating amino acids could
work together to build a more stable ATP-binding pocket to slow down the ADP
release and consequently affect the velocity of kinesin-1.
3.4.8.4 Residue 243 in NcK1
A previous study (unpublished; U. Majdic, PhD thesis 1999) has discovered a
noteworthy difference in the switch II region between fungal and animal kinesin-1,
where the glycine in fungal sequences is replaced by a serine in animal sequences
(residue 243 in Neurospora kinesin-1). In a mutational analysis, a point mutation was
introduced in NcK1 in this position, substituting the glycine with serine, the
corresponding amino acid in animal kinesins. The gliding velocity of NcK1 with the
animal SKT-motif was reduced to 73% of the wild-type velocity, whereas the motile
behaviour of a Drosophila kinesin with the (fungal) GKT-motif was unchanged.
Notice that residue 243 is located in a relatively open loop structure, where it has no
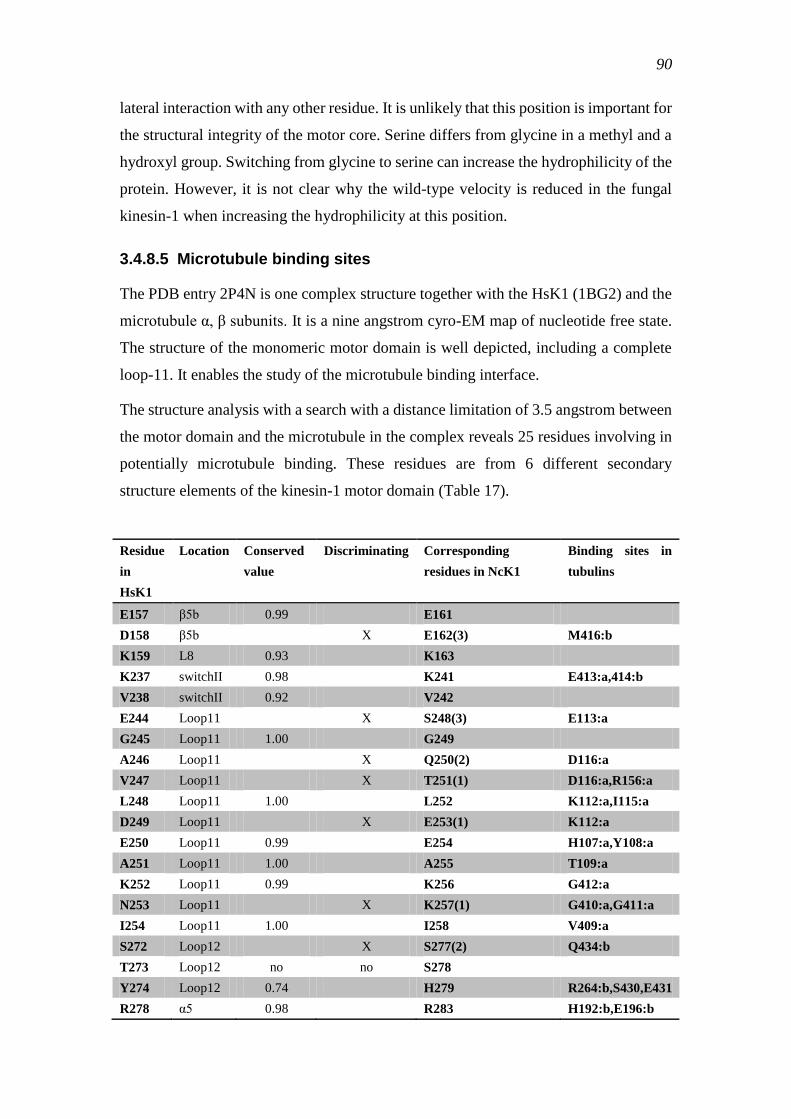
90
lateral interaction with any other residue. It is unlikely that this position is important for
the structural integrity of the motor core. Serine differs from glycine in a methyl and a
hydroxyl group. Switching from glycine to serine can increase the hydrophilicity of the
protein. However, it is not clear why the wild-type velocity is reduced in the fungal
kinesin-1 when increasing the hydrophilicity at this position.
3.4.8.5 Microtubule binding sites
The PDB entry 2P4N is one complex structure together with the HsK1 (1BG2) and the
microtubule α, β subunits. It is a nine angstrom cyro-EM map of nucleotide free state.
The structure of the monomeric motor domain is well depicted, including a complete
loop-11. It enables the study of the microtubule binding interface.
The structure analysis with a search with a distance limitation of 3.5 angstrom between
the motor domain and the microtubule in the complex reveals 25 residues involving in
potentially microtubule binding. These residues are from 6 different secondary
structure elements of the kinesin-1 motor domain (Table 17).
Residue
in
HsK1
Location Conserved
value
Discriminating Corresponding
residues in NcK1
Binding sites in
tubulins
E157 β5b 0.99 E161
D158 β5b X E162(3) M416:b
K159 L8 0.93 K163
K237 switchII 0.98 K241 E413:a,414:b
V238 switchII 0.92 V242
E244 Loop11 X S248(3) E113:a
G245 Loop11 1.00 G249
A246 Loop11 X Q250(2) D116:a
V247 Loop11 X T251(1) D116:a,R156:a
L248 Loop11 1.00 L252 K112:a,I115:a
D249 Loop11 X E253(1) K112:a
E250 Loop11 0.99 E254 H107:a,Y108:a
A251 Loop11 1.00 A255 T109:a
K252 Loop11 0.99 K256 G412:a
N253 Loop11 X K257(1) G410:a,G411:a
I254 Loop11 1.00 I258 V409:a
S272 Loop12 X S277(2) Q434:b
T273 Loop12 no no S278
Y274 Loop12 0.74 H279 R264:b,S430,E431
R278 α5 0.98 R283 H192:b,E196:b
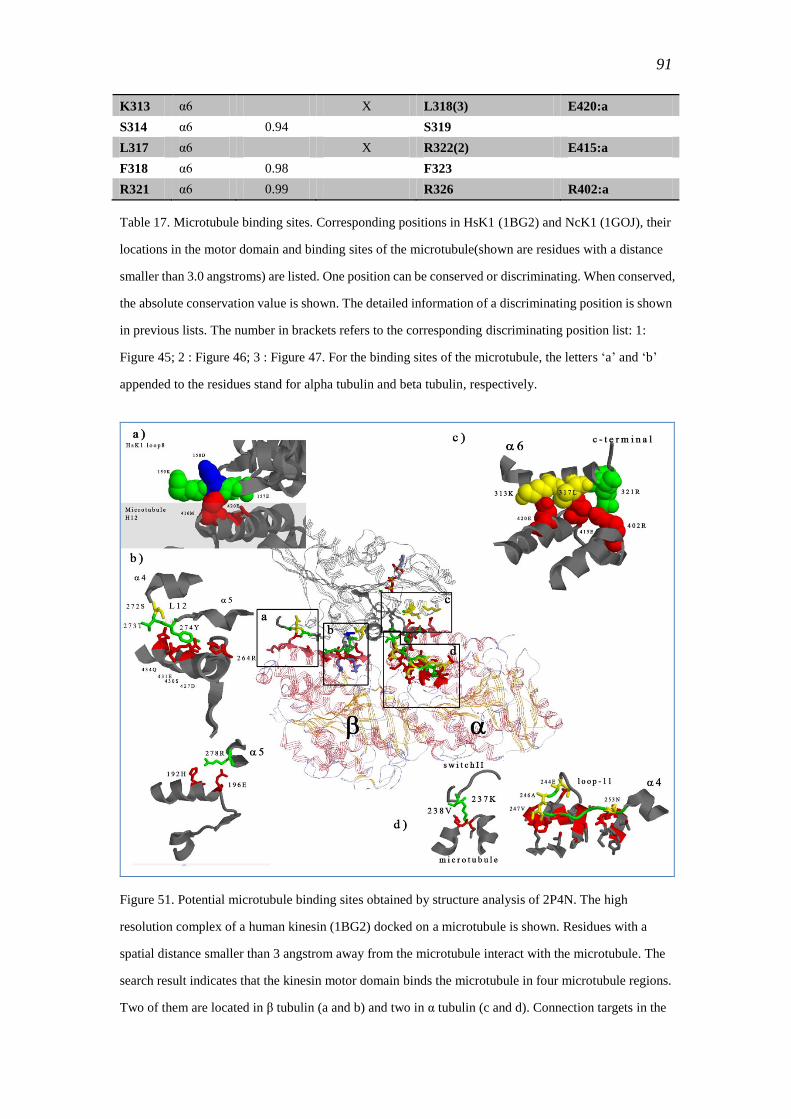
91
K313 α6 X L318(3) E420:a
S314 α6 0.94 S319
L317 α6 X R322(2) E415:a
F318 α6 0.98 F323
R321 α6 0.99 R326 R402:a
Table 17. Microtubule binding sites. Corresponding positions in HsK1 (1BG2) and NcK1 (1GOJ), their
locations in the motor domain and binding sites of the microtubule(shown are residues with a distance
smaller than 3.0 angstroms) are listed. One position can be conserved or discriminating. When conserved,
the absolute conservation value is shown. The detailed information of a discriminating position is shown
in previous lists. The number in brackets refers to the corresponding discriminating position list: 1:
Figure 45; 2 : Figure 46; 3 : Figure 47. For the binding sites of the microtubule, the letters ‗a‘ and ‗b‘
appended to the residues stand for alpha tubulin and beta tubulin, respectively.
Figure 51. Potential microtubule binding sites obtained by structure analysis of 2P4N. The high
resolution complex of a human kinesin (1BG2) docked on a microtubule is shown. Residues with a
spatial distance smaller than 3 angstrom away from the microtubule interact with the microtubule. The
search result indicates that the kinesin motor domain binds the microtubule in four microtubule regions.
Two of them are located in β tubulin (a and b) and two in α tubulin (c and d). Connection targets in the
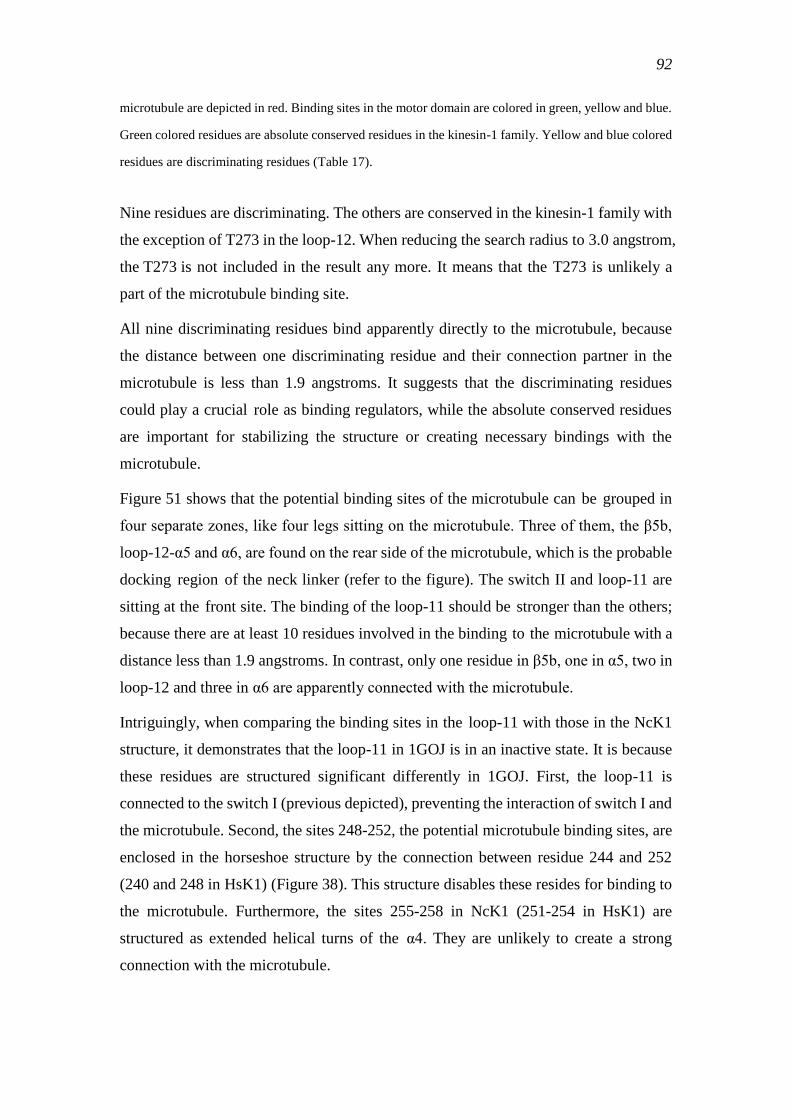
92
microtubule are depicted in red. Binding sites in the motor domain are colored in green, yellow and blue.
Green colored residues are absolute conserved residues in the kinesin-1 family. Yellow and blue colored
residues are discriminating residues (Table 17).
Nine residues are discriminating. The others are conserved in the kinesin-1 family with
the exception of T273 in the loop-12. When reducing the search radius to 3.0 angstrom,
the T273 is not included in the result any more. It means that the T273 is unlikely a
part of the microtubule binding site.
All nine discriminating residues bind apparently directly to the microtubule, because
the distance between one discriminating residue and their connection partner in the
microtubule is less than 1.9 angstroms. It suggests that the discriminating residues
could play a crucial role as binding regulators, while the absolute conserved residues
are important for stabilizing the structure or creating necessary bindings with the
microtubule.
Figure 51 shows that the potential binding sites of the microtubule can be grouped in
four separate zones, like four legs sitting on the microtubule. Three of them, the β5b,
loop-12-α5 and α6, are found on the rear side of the microtubule, which is the probable
docking region of the neck linker (refer to the figure). The switch II and loop-11 are
sitting at the front site. The binding of the loop-11 should be stronger than the others;
because there are at least 10 residues involved in the binding to the microtubule with a
distance less than 1.9 angstroms. In contrast, only one residue in β5b, one in α5, two in
loop-12 and three in α6 are apparently connected with the microtubule.
Intriguingly, when comparing the binding sites in the loop-11 with those in the NcK1
structure, it demonstrates that the loop-11 in 1GOJ is in an inactive state. It is because
these residues are structured significant differently in 1GOJ. First, the loop-11 is
connected to the switch I (previous depicted), preventing the interaction of switch I and
the microtubule. Second, the sites 248-252, the potential microtubule binding sites, are
enclosed in the horseshoe structure by the connection between residue 244 and 252
(240 and 248 in HsK1) (Figure 38). This structure disables these resides for binding to
the microtubule. Furthermore, the sites 255-258 in NcK1 (251-254 in HsK1) are
structured as extended helical turns of the α4. They are unlikely to create a strong
connection with the microtubule.
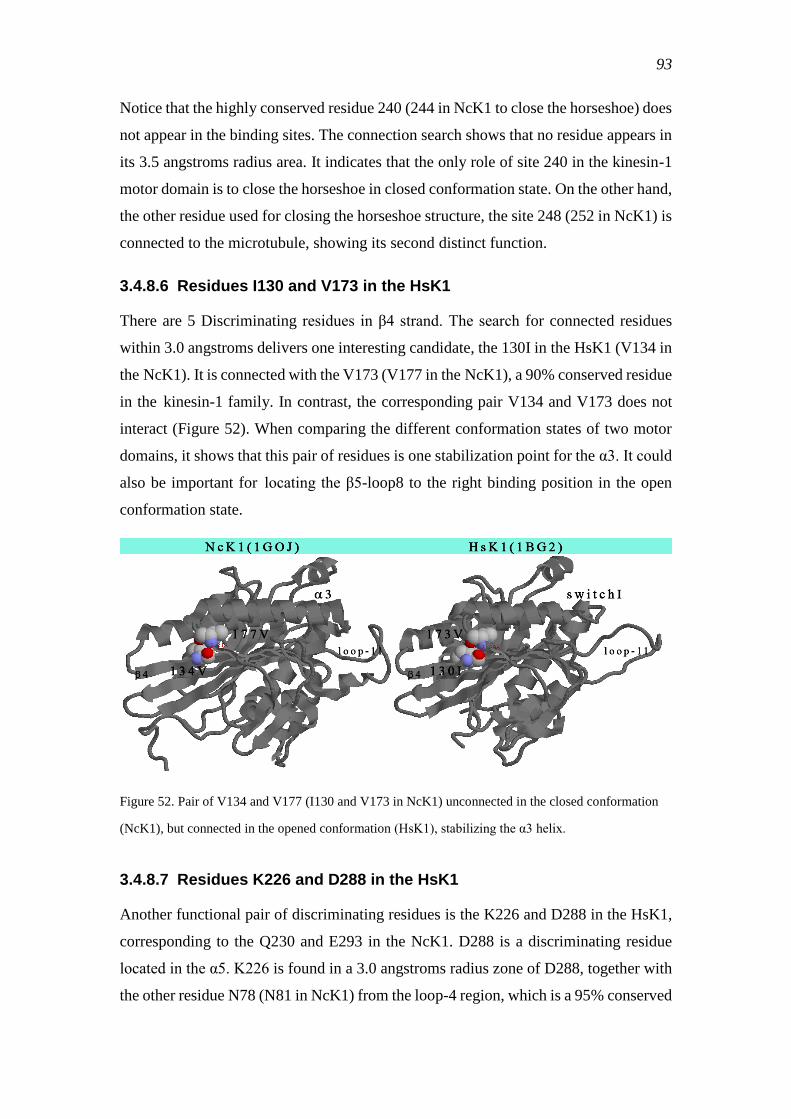
93
Notice that the highly conserved residue 240 (244 in NcK1 to close the horseshoe) does
not appear in the binding sites. The connection search shows that no residue appears in
its 3.5 angstroms radius area. It indicates that the only role of site 240 in the kinesin-1
motor domain is to close the horseshoe in closed conformation state. On the other hand,
the other residue used for closing the horseshoe structure, the site 248 (252 in NcK1) is
connected to the microtubule, showing its second distinct function.
3.4.8.6 Residues I130 and V173 in the HsK1
There are 5 Discriminating residues in β4 strand. The search for connected residues
within 3.0 angstroms delivers one interesting candidate, the 130I in the HsK1 (V134 in
the NcK1). It is connected with the V173 (V177 in the NcK1), a 90% conserved residue
in the kinesin-1 family. In contrast, the corresponding pair V134 and V173 does not
interact (Figure 52). When comparing the different conformation states of two motor
domains, it shows that this pair of residues is one stabilization point for the α3. It could
also be important for locating the β5-loop8 to the right binding position in the open
conformation state.
Figure 52. Pair of V134 and V177 (I130 and V173 in NcK1) unconnected in the closed conformation
(NcK1), but connected in the opened conformation (HsK1), stabilizing the α3 helix.
3.4.8.7 Residues K226 and D288 in the HsK1
Another functional pair of discriminating residues is the K226 and D288 in the HsK1,
corresponding to the Q230 and E293 in the NcK1. D288 is a discriminating residue
located in the α5. K226 is found in a 3.0 angstroms radius zone of D288, together with
the other residue N78 (N81 in NcK1) from the loop-4 region, which is a 95% conserved
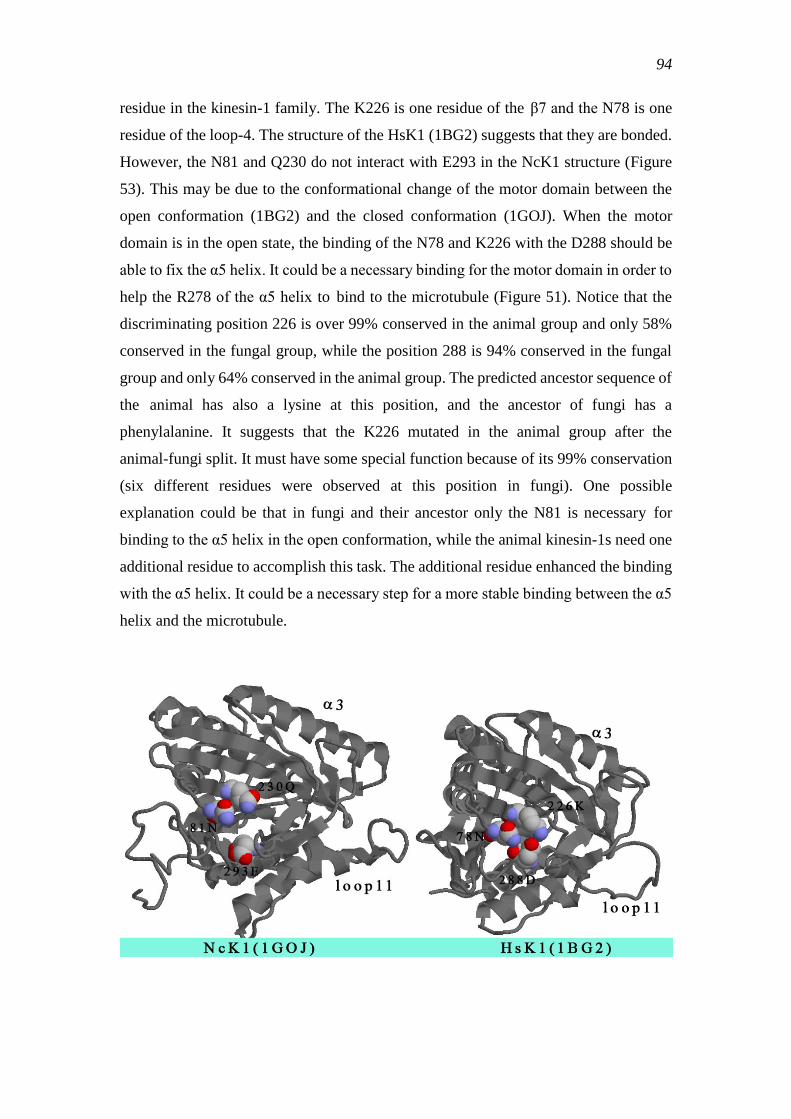
94
residue in the kinesin-1 family. The K226 is one residue of the β7 and the N78 is one
residue of the loop-4. The structure of the HsK1 (1BG2) suggests that they are bonded.
However, the N81 and Q230 do not interact with E293 in the NcK1 structure (Figure
53). This may be due to the conformational change of the motor domain between the
open conformation (1BG2) and the closed conformation (1GOJ). When the motor
domain is in the open state, the binding of the N78 and K226 with the D288 should be
able to fix the α5 helix. It could be a necessary binding for the motor domain in order to
help the R278 of the α5 helix to bind to the microtubule (Figure 51). Notice that the
discriminating position 226 is over 99% conserved in the animal group and only 58%
conserved in the fungal group, while the position 288 is 94% conserved in the fungal
group and only 64% conserved in the animal group. The predicted ancestor sequence of
the animal has also a lysine at this position, and the ancestor of fungi has a
phenylalanine. It suggests that the K226 mutated in the animal group after the
animal-fungi split. It must have some special function because of its 99% conservation
(six different residues were observed at this position in fungi). One possible
explanation could be that in fungi and their ancestor only the N81 is necessary for
binding to the α5 helix in the open conformation, while the animal kinesin-1s need one
additional residue to accomplish this task. The additional residue enhanced the binding
with the α5 helix. It could be a necessary step for a more stable binding between the α5
helix and the microtubule.
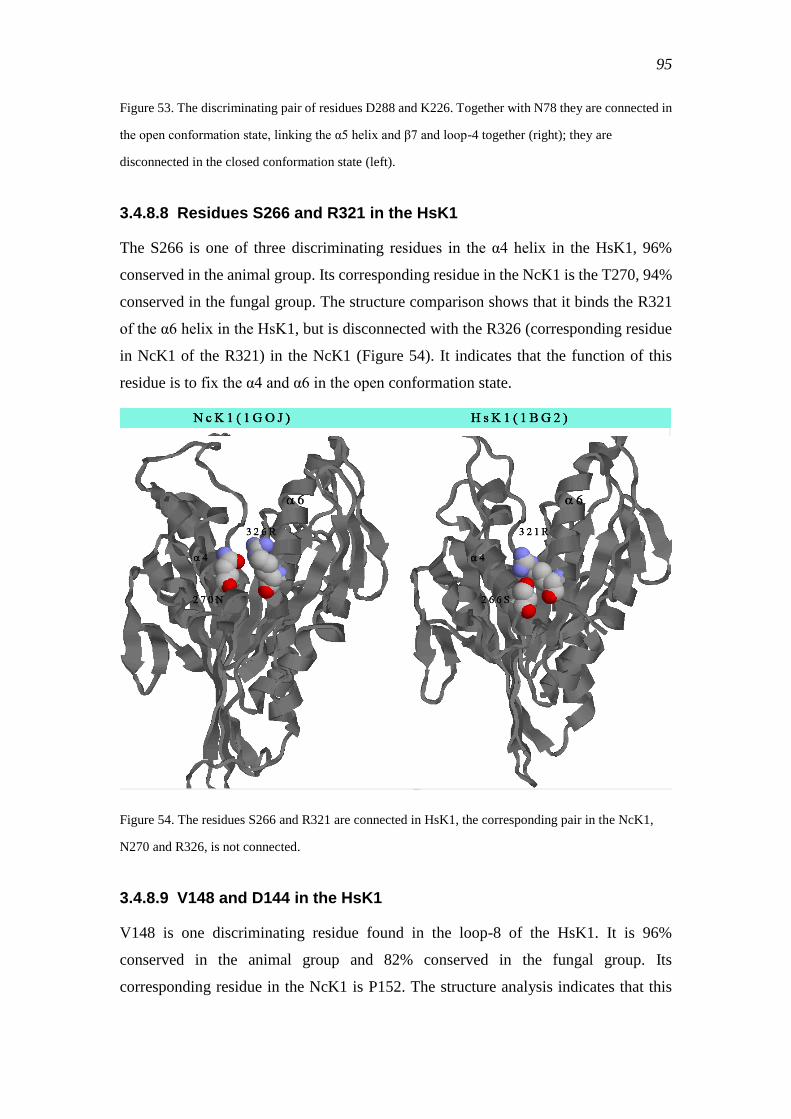
95
Figure 53. The discriminating pair of residues D288 and K226. Together with N78 they are connected in
the open conformation state, linking the α5 helix and β7 and loop-4 together (right); they are
disconnected in the closed conformation state (left).
3.4.8.8 Residues S266 and R321 in the HsK1
The S266 is one of three discriminating residues in the α4 helix in the HsK1, 96%
conserved in the animal group. Its corresponding residue in the NcK1 is the T270, 94%
conserved in the fungal group. The structure comparison shows that it binds the R321
of the α6 helix in the HsK1, but is disconnected with the R326 (corresponding residue
in NcK1 of the R321) in the NcK1 (Figure 54). It indicates that the function of this
residue is to fix the α4 and α6 in the open conformation state.
Figure 54. The residues S266 and R321 are connected in HsK1, the corresponding pair in the NcK1,
N270 and R326, is not connected.
3.4.8.9 V148 and D144 in the HsK1
V148 is one discriminating residue found in the loop-8 of the HsK1. It is 96%
conserved in the animal group and 82% conserved in the fungal group. Its
corresponding residue in the NcK1 is P152. The structure analysis indicates that this
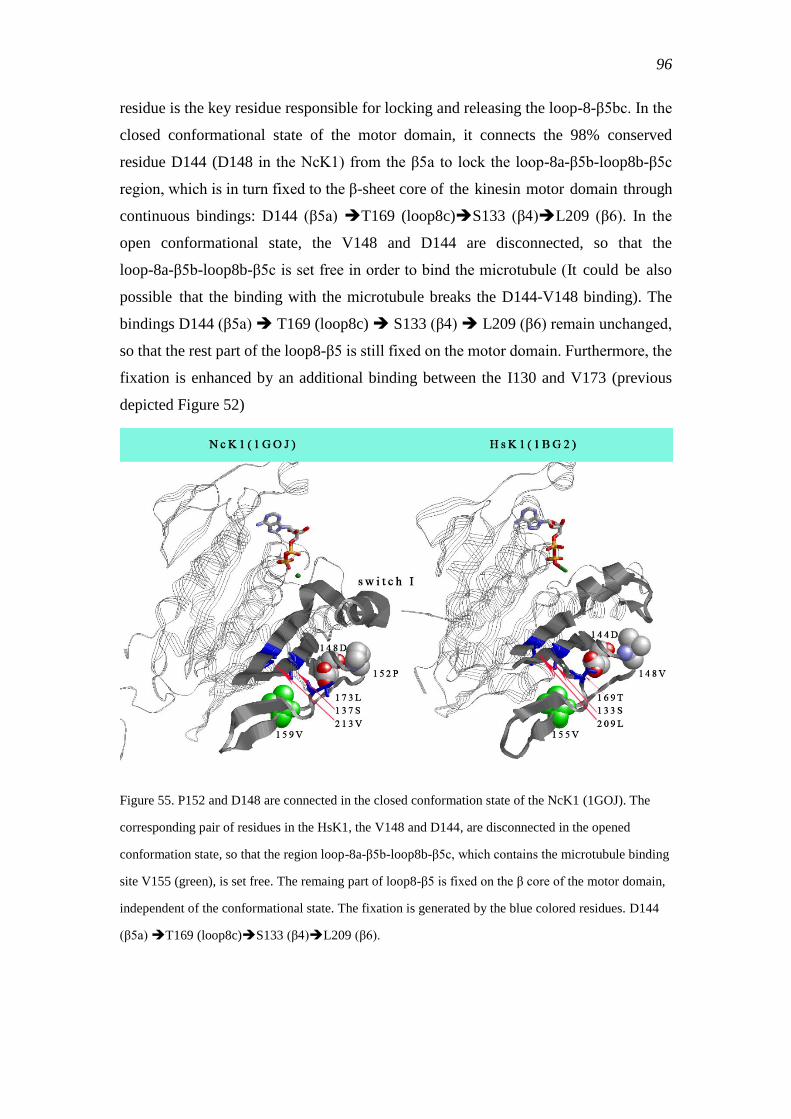
96
residue is the key residue responsible for locking and releasing the loop-8-β5bc. In the
closed conformational state of the motor domain, it connects the 98% conserved
residue D144 (D148 in the NcK1) from the β5a to lock the loop-8a-β5b-loop8b-β5c
region, which is in turn fixed to the β-sheet core of the kinesin motor domain through
continuous bindings: D144 (β5a) T169 (loop8c)S133 (β4)L209 (β6). In the
open conformational state, the V148 and D144 are disconnected, so that the
loop-8a-β5b-loop8b-β5c is set free in order to bind the microtubule (It could be also
possible that the binding with the microtubule breaks the D144-V148 binding). The
bindings D144 (β5a) T169 (loop8c) S133 (β4) L209 (β6) remain unchanged,
so that the rest part of the loop8-β5 is still fixed on the motor domain. Furthermore, the
fixation is enhanced by an additional binding between the I130 and V173 (previous
depicted Figure 52)
Figure 55. P152 and D148 are connected in the closed conformation state of the NcK1 (1GOJ). The
corresponding pair of residues in the HsK1, the V148 and D144, are disconnected in the opened
conformation state, so that the region loop-8a-β5b-loop8b-β5c, which contains the microtubule binding
site V155 (green), is set free. The remaing part of loop8-β5 is fixed on the β core of the motor domain,
independent of the conformational state. The fixation is generated by the blue colored residues. D144
(β5a) T169 (loop8c)S133 (β4)L209 (β6).
97
3.4.9 Putative cooperative residues combinations
The chimera experiments (see introduction) have shown that the velocity of the animal
kinesin-1 motor domain did not change by substituting its second half (including the
microtubule binding interface, switch I and II) of the fungal kinesin-1 motor domain.
However, the reverse chimera (fungal first half+ animal second half) did reduce the
motor‘s velocity. The first experiment indicates that the velocity is not controlled by the
second half of the motor. It should behave similar like the animal‘s second half.
However, the latter one demonstrates that the first half of the motor is not able to
control the velocity alone. The reduced speed of the chimera motor suggests that
substituting of the fungal first half could break some important structure bindings, so
that the motor domain cannot efficiently change the conformation like the wild type and
does not become faster as expected, but even slower.
It demonstrates that there should be some important interaction between the first half
and the second half of the motor domain, making the structure compact and function
most efficient.
A search for such possible interactions was done for both NcK1 and HsK1 motor
domains. The results are shown in Table 18. The putative connection pairs are grouped
into three different classes: NcK1 only, HsK1 only or both together.
Eleven connections are found only in the NcK1. Six of them are located in the motor
domain. The other 5 are found in the neck linker region; however, this part of the
structure is missing in the HsK1 structure so that no comparison could be done for
these five residues. The six connected pairs in the NcK1 are found in the HsK1
disconnected. For example, the corresponding pairs of pair 184-117 and pair 188-104
in the HsK1 are disconnected. It suggests that these two pairs are the linkages of the α3a
helix and α2 helix (loop5 locates inside of α2) in the closed conformation. Another
interesting pair is the 236-94, because the 236 is located in the switch II and the 94 is in
the ATP binding pocket. In the closed conformation, the distance between them is 2.9
angstroms, while in the open conformation, the distance becomes 3.14 angstroms. It
indicates that the structure of the motor domain becomes looser when the conformation
changes from the closed state to the open state. Similar change can be observed for the
connection pair 84-232-82. It is a β sheet bond between β3 and β7, the distance between
them is changed from 2.8 angstroms to 3.1 angstroms.
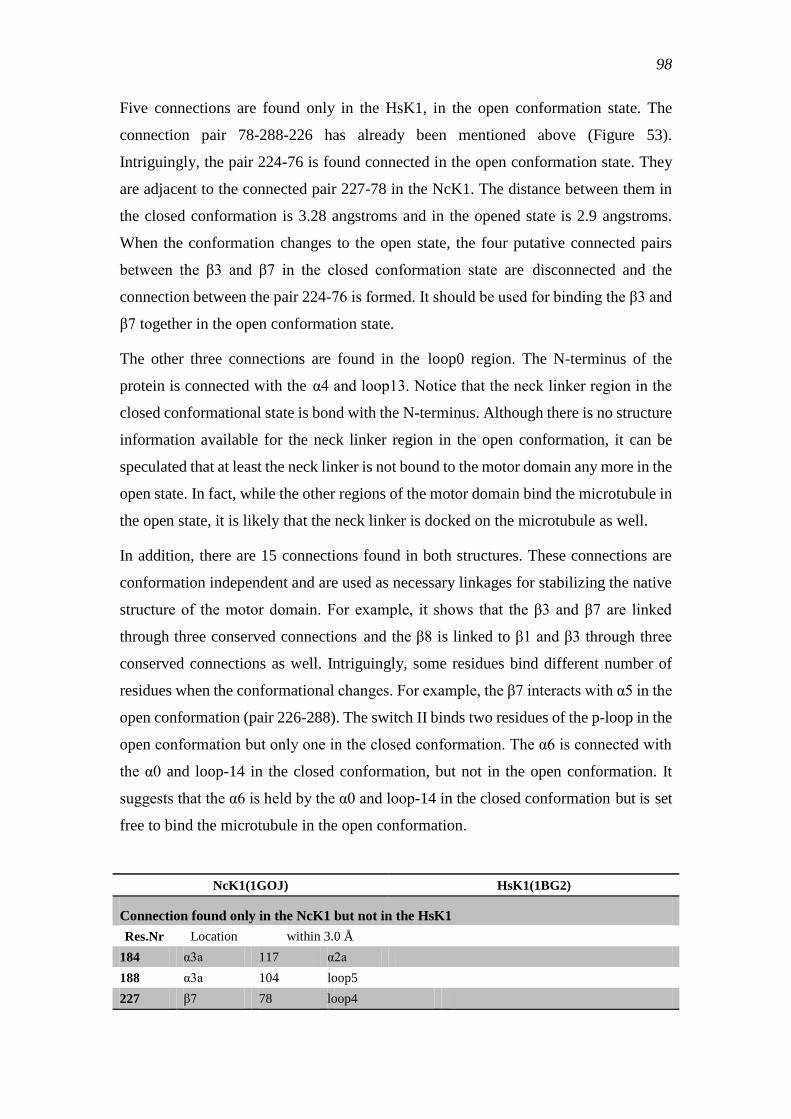
98
Five connections are found only in the HsK1, in the open conformation state. The
connection pair 78-288-226 has already been mentioned above (Figure 53).
Intriguingly, the pair 224-76 is found connected in the open conformation state. They
are adjacent to the connected pair 227-78 in the NcK1. The distance between them in
the closed conformation is 3.28 angstroms and in the opened state is 2.9 angstroms.
When the conformation changes to the open state, the four putative connected pairs
between the β3 and β7 in the closed conformation state are disconnected and the
connection between the pair 224-76 is formed. It should be used for binding the β3 and
β7 together in the open conformation state.
The other three connections are found in the loop0 region. The N-terminus of the
protein is connected with the α4 and loop13. Notice that the neck linker region in the
closed conformational state is bond with the N-terminus. Although there is no structure
information available for the neck linker region in the open conformation, it can be
speculated that at least the neck linker is not bound to the motor domain any more in the
open state. In fact, while the other regions of the motor domain bind the microtubule in
the open state, it is likely that the neck linker is docked on the microtubule as well.
In addition, there are 15 connections found in both structures. These connections are
conformation independent and are used as necessary linkages for stabilizing the native
structure of the motor domain. For example, it shows that the β3 and β7 are linked
through three conserved connections and the β8 is linked to β1 and β3 through three
conserved connections as well. Intriguingly, some residues bind different number of
residues when the conformational changes. For example, the β7 interacts with α5 in the
open conformation (pair 226-288). The switch II binds two residues of the p-loop in the
open conformation but only one in the closed conformation. The α6 is connected with
the α0 and loop-14 in the closed conformation, but not in the open conformation. It
suggests that the α6 is held by the α0 and loop-14 in the closed conformation but is set
free to bind the microtubule in the open conformation.
NcK1(1GOJ) HsK1(1BG2)
Connection found only in the NcK1 but not in the HsK1
Res.Nr Location within 3.0 Å
184 α3a 117 α2a
188 α3a 104 loop5
227 β7 78 loop4
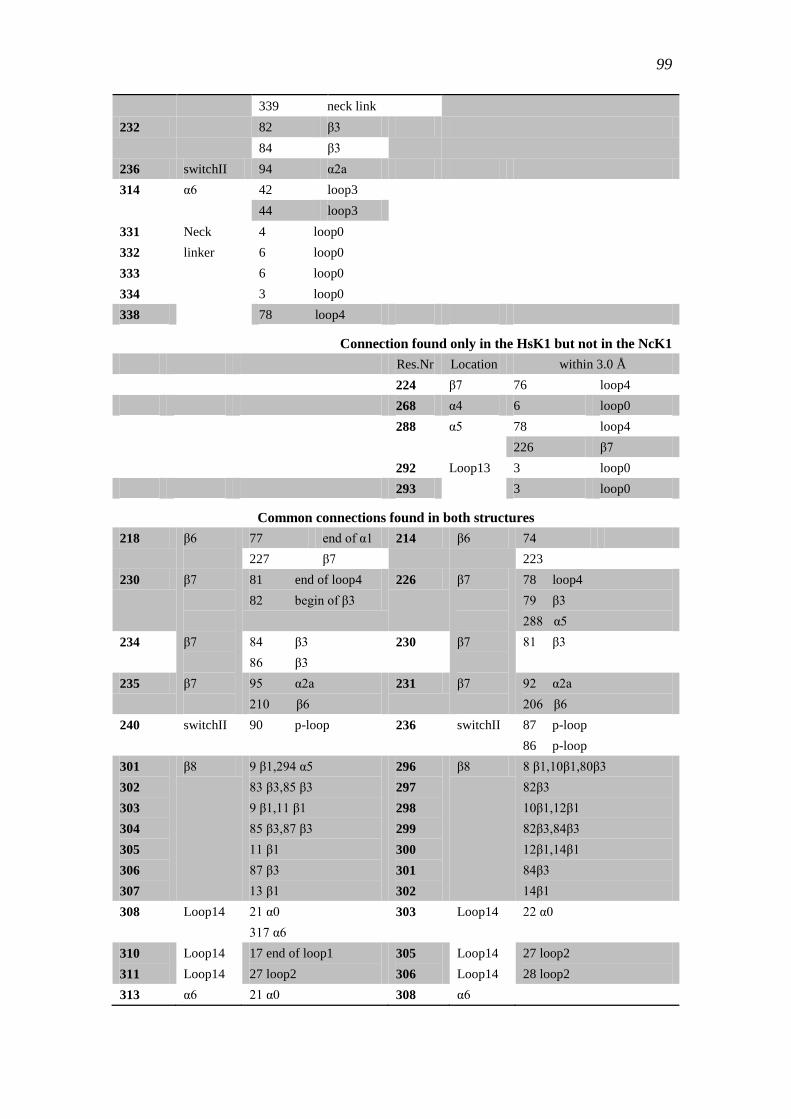
99
339 neck link
232 82 β3
84 β3
236 switchII 94 α2a
314 α6 42 loop3
44 loop3
331
332
333
334
Neck
linker
4 loop0
6 loop0
6 loop0
3 loop0
338 78 loop4
Connection found only in the HsK1 but not in the NcK1
Res.Nr Location within 3.0 Å
224 β7 76 loop4
268 α4 6 loop0
288 α5 78 loop4
226 β7
292 Loop13 3 loop0
293 3 loop0
Common connections found in both structures
218 β6
77 end of α1 214 β6 74
227 β7 223
230 β7
β7
β7
81 end of loop4
82 begin of β3
226 β7
β7
β7
78 loop4
79 β3
288 α5
234 84 β3
86 β3
230 81 β3
235 95 α2a
210 β6
231 92 α2a
206 β6
240 switchII 90 p-loop 236 switchII 87 p-loop
86 p-loop
301
302
303
304
305
306
307
β8 9 β1,294 α5
83 β3,85 β3
9 β1,11 β1
85 β3,87 β3
11 β1
87 β3
13 β1
296
297
298
299
300
301
302
β8 8 β1,10β1,80β3
82β3
10β1,12β1
82β3,84β3
12β1,14β1
84β3
14β1
308 Loop14
Loop14
Loop14
21 α0
317 α6
303 Loop14
Loop14
Loop14
22 α0
310
311
17 end of loop1
27 loop2
305
306
27 loop2
28 loop2
313 α6 21 α0 308 α6
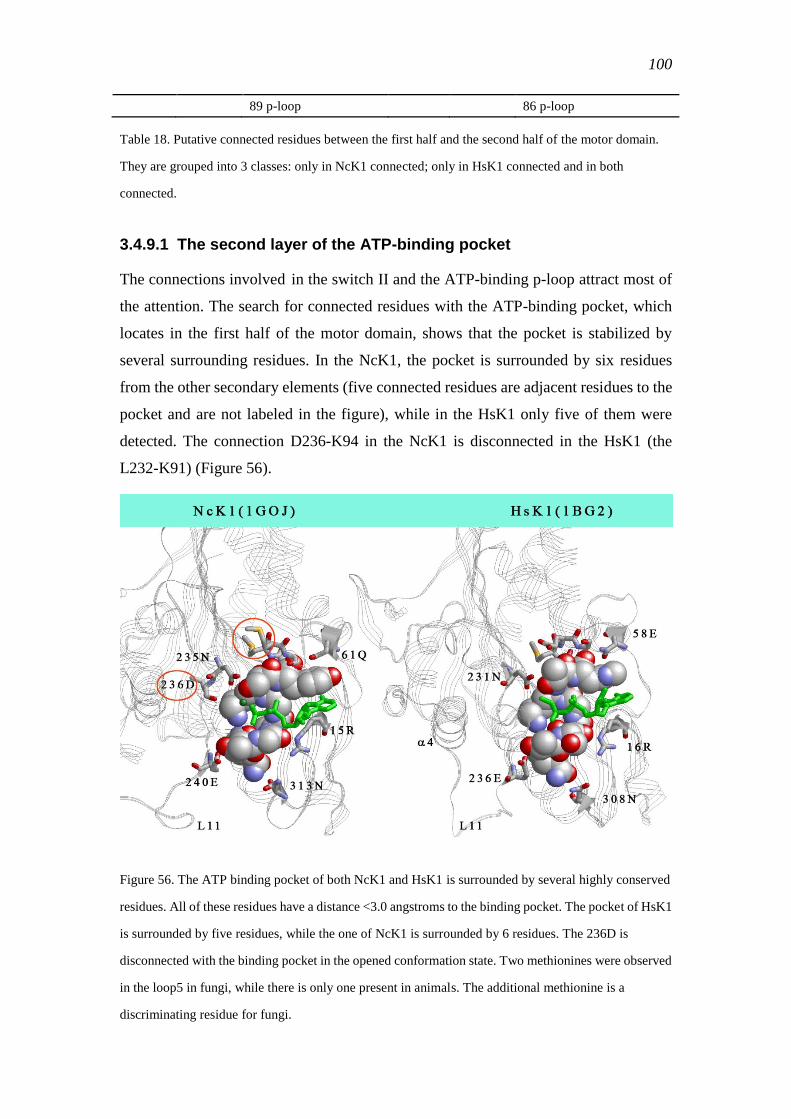
100
89 p-loop 86 p-loop
Table 18. Putative connected residues between the first half and the second half of the motor domain.
They are grouped into 3 classes: only in NcK1 connected; only in HsK1 connected and in both
connected.
3.4.9.1 The second layer of the ATP-binding pocket
The connections involved in the switch II and the ATP-binding p-loop attract most of
the attention. The search for connected residues with the ATP-binding pocket, which
locates in the first half of the motor domain, shows that the pocket is stabilized by
several surrounding residues. In the NcK1, the pocket is surrounded by six residues
from the other secondary elements (five connected residues are adjacent residues to the
pocket and are not labeled in the figure), while in the HsK1 only five of them were
detected. The connection D236-K94 in the NcK1 is disconnected in the HsK1 (the
L232-K91) (Figure 56).
Figure 56. The ATP binding pocket of both NcK1 and HsK1 is surrounded by several highly conserved
residues. All of these residues have a distance <3.0 angstroms to the binding pocket. The pocket of HsK1
is surrounded by five residues, while the one of NcK1 is surrounded by 6 residues. The 236D is
disconnected with the binding pocket in the opened conformation state. Two methionines were observed
in the loop5 in fungi, while there is only one present in animals. The additional methionine is a
discriminating residue for fungi.
101
Of the six connections, two of them are from the first half, and the other four from the
second half of the motor domain. All of them are highly conserved in the kinesin-1
family. Moreover, two residues of the p-loop, the A92 and G93 (S89 and G90 in the
HsK1) have no contact with any residues from other structure elements except the
p-loop itself. The second layer structure of the ATP-binding pocket suggests the
internal compact interactions of entire motor domain structure.
In addition, there are apparently four residues in the neighboring loop5 connected to the
pocket. In the NcK1, there are two methionines present, while in the HsK1 there is only
one. The one present in both structures is 97% conserved. The other one is a
discriminating residue, which is 90% conserved in the fungal group as methionine (M)
and 96% conserved in the animal group as glutamic acid (E). It changed from a
hydrophobic and non-polar (M) to hydrophilic and polar-charged (E) amino acid. The
side chain of methionine is hydrophobic and the sulfur can react with electrophilic
centers. It is known that the side chain of methionine is unbranched, providing
considerable conformational flexibility [103]. The fungal kinesin-1 has two conserved
methionines in the loop5, which could provide a larger non-polar surface and could be
important for enzymatic functions.
3.4.10 Conjecture about the velocity controller
The p-loop is located in the first half of the kinesin-1 motor domain (1-124 of the
HsK1). It is the main component of the ATP-binding pocket. The second half of the
motor domain (125-325) contains the switch I and switch II motifs. The analysis of the
microtubule binding sites indicates that all four putative microtubule binding regions
locate in the second half of the structure (Table 17). This suggests that the first half is
responsible for the ATP activity, while the second half is relevant for the microtubule
binding and conformational changes.
3.4.10.1 ATP-binding pocket could be one candidate
It is believed that the ADP releasing speed determines the motor velocity. Thus, the
ATP-binding pocket should be the first candidate to be considered for the speed control.
To change the animal ATP-binding pocket to fungal one, the four discriminating
residues should be relevant. The analysis showed that although all four residues are
96% conserved in the animal group, only the position S88 is also highly conserved in
the fungal group. For the position S89, 45% of the fungal sequences have the same
102
residue, the serine, at the corresponding position. For the position T92, 30% of the
fungal sequences also have threonine at the corresponding position. And for the
position H93, 79% of fungal sequences contain tyrosine and the others phenylalanine.
Thus, the S88 and the H93 should be the most relevant residues responsible for the
difference of the binding pocket. Mutating these two residues can easily switch the
animal ATP-binding pocket to the fungal one.
The analysis of the ATP binding pocket shows that the pocket is actually supported by a
second layer comprising six residues (Figure 56). These residues could be important for
stabilizing the pocket structure (discussed above). Because these residues are all highly
conserved in the kinesin-1 sub-family, substituting one or few residues of the ATP
binding pocket should have no consequence for the binding pocket structure.
Furthermore, one discriminating residue is found in the loop5 at position 99 in the
NcK1 (96 in the HsK1). This position is hydrophobic and non-polar in the fungal
kinesin-1s (mainly methionine and leucine), but is hydrophilic and polar charged in the
animal kinesin-1s. It could be important for the ATP binding or have an enzymatic
function. Thus, this residue should be considered in order to obtain the full functional
ATP binding pocket when doing mutagenesis.
3.4.10.2 Other potential factors for the velocity difference
The protein chimera experiments suggest that the second half of the motor domain
alone is unlikely to be responsible for the different velocity between fungi and animals,
because the chimera constructed from the first half of animal and the second half of
fungi had similar speed like the wild type animal kinesin-1. On the other hand, the
speed of the chimera‘s motor was reduced significantly by exchange of the first half of
the animal motor domain with the fungal one.
One possible explanation could be that the supporting bindings with the second layer
could be destroyed, although the main structure of the fungal ATP binding pocket
remains unchanged. In this case, the binding pocket could become unstable without the
full supporting of the second layer, causing an inefficient ATP binding and hydrolysis
and affecting the velocity. If this is not the case, assuming that the structure of the ATP
binding pocket did not change, the reducing of the speed indicates that the second half
of the animal motor domain may control the speed because it can make a fast kinesin
slow. The site-mutation experiment of G243S in the NcK1 motor domain has supported
103
this hypothesis, in which the speed of the fungal mutant reduced to 73% of the wild
type. However, introducing the entire fungal second half into the animal motor domain
could not make the animal kinesin-1 faster. It suggests that the fungal ATP-binding
pocket should be also necessary for controlling the speed.
In conclusion, the velocity controller should be a complicated cooperation of the
ATP-binding pocket and the other important motifs. The fungal version of the ATP
binding pocket is necessary for making the kinesin fast. Moreover, many special
mutations in other functional or structural motifs may be effective too, such as the
G243S in the NcK1.
Potential amino acid positions with goroup-specific functions (discriminating residues)
are listed in Figure 45, Figure 46 and Figure 47. Figure 45 contains discriminating
residues important for both groups. Figure 46 and Figure 47 contain fungal specific
residues and animal specific residues respectively. These residues normally work in
cooperation with other residues, such as the 204-257 connect switch I and loop-11
together.
Furthermore, several important pairs have been detected. They play important roles
during the conformation change. It should possible to guide mutagenesis experiments
in the future to test various combinations involved in velocity control.
104
4 Conclusion and discussion
4.1 Confidence evaluation of the phylogenetic tree
In this project, the dataset of kinesin sequences was expanded to over 2900. 2530
kinesin sequences were used for large phylogenetic tree estimation. For this large
dataset, phylogeny inference is really a computational challenge.
Neighbor joining (NJ) [104] was used for similar work in other studies. For example,
the myosin family tree with about 2,200 sequences was generated by this method [105].
However, the quality of tree inferred by this method is strongly dependent on the
dataset, because the algorithm is based on the evolutionary distances between
sequences. The distance between sequences is often related to the observed changes
within the sequences. However, the observed mismatches between sequences do not
always equal to their evolutionary distance. For example, multiple mutations could
occur at the same site and make the sequences appear ‗similar‘ to each other. In the case
of kinesins, the motor domains are highly conserved, but still divergent to each other.
The chance that two sequences are improperly clustered together is relatively high,
especially for a large dataset. Therefore, the NJ method is unable to infer a correct
phylogeny for the entire kinesin super-family.
In contrast, the maximum likelihood method and the alternative Bayesian inference
method provide more realistic models for discovering the evolutionary relationships
between sequences that have been separated for a long time. However, these methods
are very time consuming and require a lot of computational resources. In practice, it
has not been possible to use Bayesian methods such as mrbayes, to generating such a
large phylogeny.
In this word, a phylogenetic tree has been successfully constructed by using RaxML, a
maximum likelihood method implementation. However, no confidence testing like
bootstrapping was applied to the tree. In this case, a confidence test of the tree was done
by comparing the tree clades with the profile classification results.
To do so, the sequences were classified using position specific profile matrixes. The
classification results were mapped on the tree, so that it is possible to calculate a
105
relative quality score for each clade. The likelihood of a clade can be described by the
proportion of sequences in that are from the same class. (See result).
This confidence measurement indicates that most clades of the tree were correctly
estimated and the overall accuracy of the phylogenetic tree is about 85.7%.
4.2 The 14th kinesin sub-family
The standard nomenclature claims that there are 14 sub-families of kinesin. Another
study has even found 17 different classes of kinesin based on a phylogenetic tree of
about 400 sequences [17].
13 families are clearly supported by the large phylogenetic tree. Besides that, there are
several small clades present in the tree. For example, the clades kinesin1.1, kinesin4.1
and kinesin7.1 are 100% supported, but do not fall into the same clade of their main
classes. Intriguingly, all of the 31 sequences of the kinesin1.1 clade belong to the oldest
eukaryotes, such as the kinetoplastids, green plants and giardia lamblia etc. The
relationships among these sequences are consistent with the standard taxonomic tree.
The 37 sequences of the kinesin4.1 clade are from the kinetoplastids and fungi, while
the main clade of kinesin4 does not contain these two groups. It is the same case for the
kinesin7. The clade kinesin7.1 is a pure fungal branch, which is lacking in the main
clade of the kinesin7. Several phylogenetic attempts with other algorithms were
applied on these parts of the dataset, but the relationships of these clades remain
robust among all trees. It could indicate the splitting events in the early stage of these
kinesin sub-families.
The other small clades are formed mainly by the sequences of kinesin-12, but also
many members of other groups. When the 14th
family of kinesin exists, it must be a part
of the kinesin12 and forms a single clade with good support value in the first place.
Additionally, the members of that clade should able to represent the distribution of the
kinesin family among species.
The best supported clade is adjacent to the kinesin1. It is comprised of 92 sequences, 67
(73%) of them are from the kinesin-12 sub-family. The members are relatively
widespread in the kinetoplastids, plants, and metazoa. No fungal species is found in this
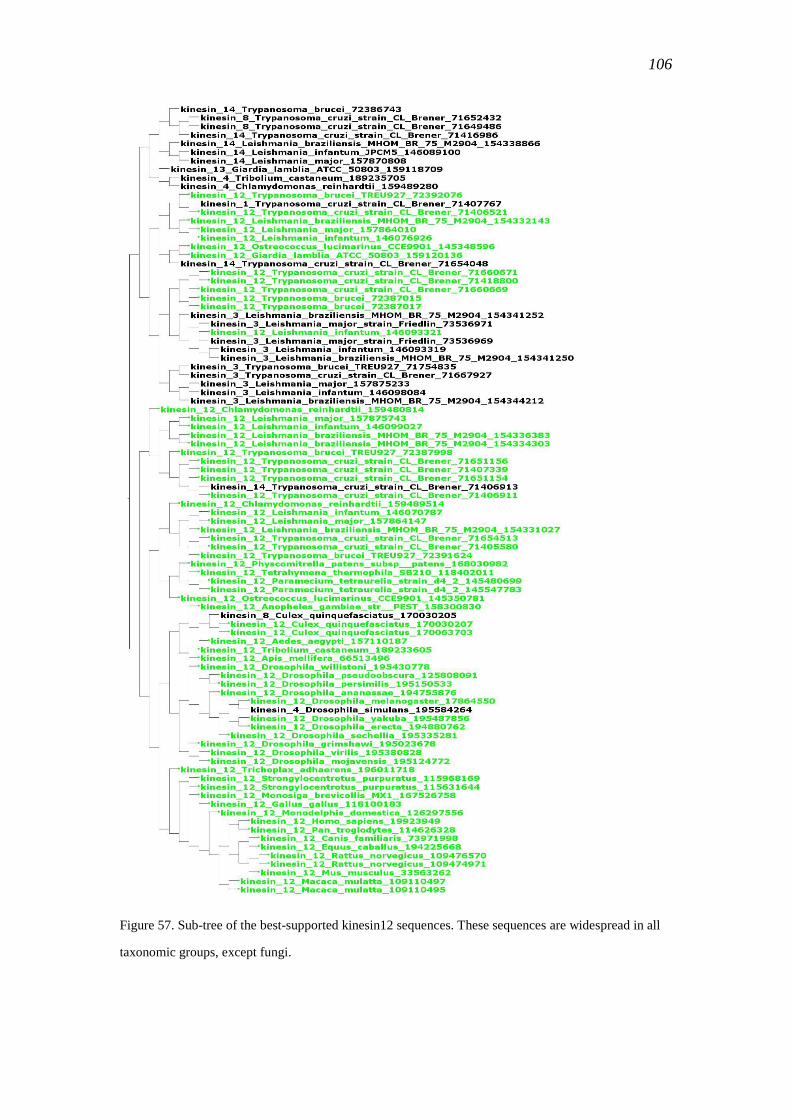
106
Figure 57. Sub-tree of the best-supported kinesin12 sequences. These sequences are widespread in all
taxonomic groups, except fungi.
107
clade. All of these fit to the criteria of defining a distinct kinesin family. Thus, this clade
likely represents the 14th
kinesin sub-family (Figure 57). The other sequences, which
do not belong to the kinesin12 in this clade, are probably false positives predicted by
the CDD classification.
4.3 Bioinformatic approaches to study on kinesin-1 velocity
The significant difference in velocity between the fungal and animal kinesin-1 attracts
a lot of attention from kinesin researchers. Many experiments, such as site mutagenesis
and chimeric protein construction have been done in order to find out what controls the
velocity. Although it has been not yet been possible to convert an animal slow kinesin
into a fast one, it has been demonstrated that the velocity-control region is located
inside the motor domain. Experiments have shown that many residues could be
involved in controlling the velocity. However, to examining all possible combinations
of residues is an unrealistic mission without the assistance of bioinformatics.
The dataset of kinesin-1 contains more than 120 sequences from 89 distinct species,
which cover all kingdoms of the eukaryotes. Therefore, it is a rich dataset enough for
analyzing discriminating positions between the fungal and animal sequences.
Analyses have revealed 100 discriminating positions inside the motor domain with over
80% conservation. Among these positions, 22 of them conserved in both groups, 23 are
only conserved in the fungi, while the other 55 are only conserved in the animals. With
the help of the high resolution crystal structures of the motor domain, two significant
structural conformation changes have been determined. When mapping the
discriminating positions onto the structures, many crucial combinations of residues
have been exposed. These pairs seem to be important for controlling the conformation
changes and binding with the microtubule. For example, position 204 of the switch I in
the NcK1 motor domain contacts position 257 in the closed conformational state,
preventing loop11, a main microtubule binding interface, from interacting with the
microtubule. At the same time, the switch-I is fixed on the β4 with the 203-140 binding.
In the open conformational state, the structure analysis shows that the 204-257 binding
is broken and loop11 is bound to the microtubule. Intriguingly, the switch-I is still
connected with the β4; however, not with the 203-140 binding any more, but with the
204-140 binding. Moreover, the discriminating residues are also responsible for the
108
ordered structure of the loop11 in the closed conformational state; holding and
releasing the β5 and many other internal structure changes while the conformation
changes.
Furthermore, the chimera experiments have provided a clue about the combination of
residues. This suggest that the ATP-binding pocket could be crucial for controlling the
velocity and the structural interaction between the first half and the second half of the
motor domain could work in cooperation with the ATP-binding pocket in order to keep
the structure in the most efficient state for energy conversion.
4.4 Outlook
Bioinformatic analyses have shown great power in studying both kinesin super-family
and kinesin-1 sub-families. The approaches can be easily applied to other kinesin
sub-families. For example, the discriminating-position-search tool can be used for
studying the differences between sub-families such as kinesin-14 and kinesin-5, which
in turn could be responsible for their different functions.
The methods also can be applied to other protein families, such as myosin and dyneins.
Furthermore, the evolutionary history of an entire motor protein family can be
investigated.
The structural analyses of the kinesin-1 motor domain have shown the importance of
the discriminating residues. Together with the conserved residues, the important
structural changes from a closed to an open conformation of the motor domain have
been discovered in this work. The success of this method provides a useful way to study
protein structures.
Ancestral protein reconstruction is useful for understanding the evolution of a protein
family. The ancestors of three fungal kinesin-1 sub-groups were successfully expressed
and functionally tested. They provide new clues about the evolution of the velocity of
kinesin-1. For example, the ancestor of all fungal kinesin-1s could be a slow kinesin
rather than a fast one. When the ancestors of the animal kinesin-1 and the whole
kinesin-1 sub-family are functionally characterized, we will have a better
understanding of the evolution of the velocity of kinesin-1.
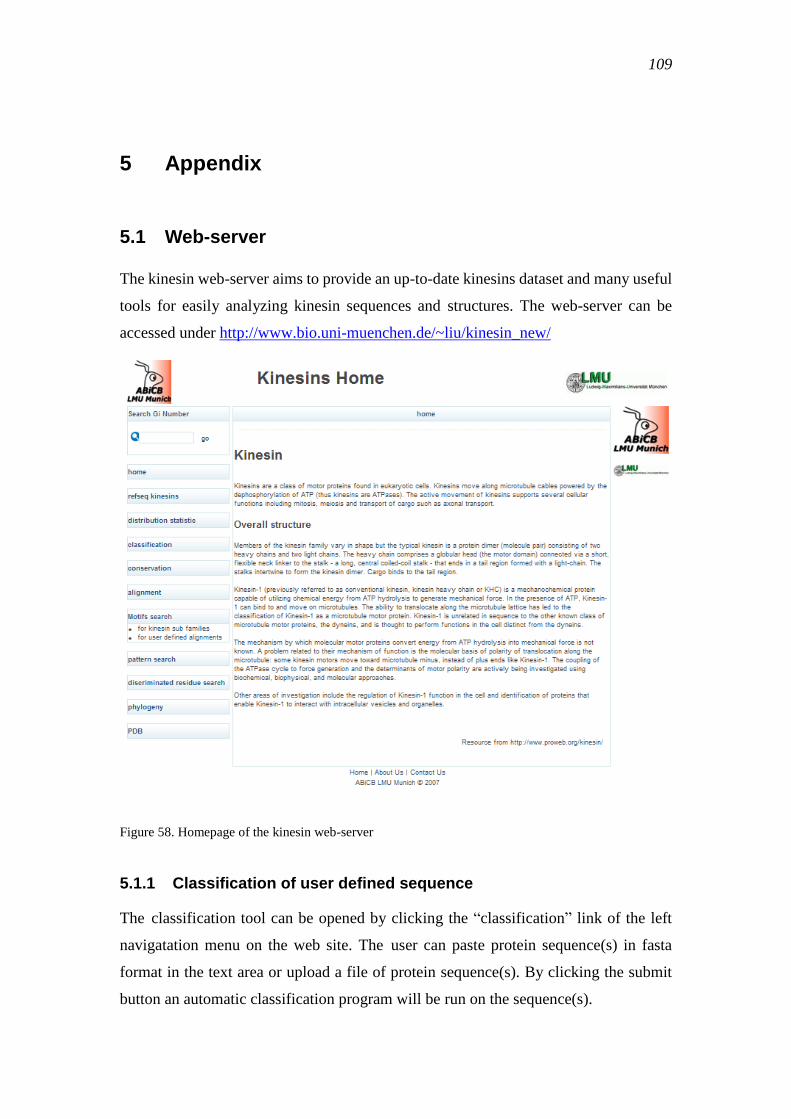
109
5 Appendix
5.1 Web-server
The kinesin web-server aims to provide an up-to-date kinesins dataset and many useful
tools for easily analyzing kinesin sequences and structures. The web-server can be
accessed under http://www.bio.uni-muenchen.de/~liu/kinesin_new/
Figure 58. Homepage of the kinesin web-server
5.1.1 Classification of user defined sequence
The classification tool can be opened by clicking the ―classification‖ link of the left
navigatation menu on the web site. The user can paste protein sequence(s) in fasta
format in the text area or upload a file of protein sequence(s). By clicking the submit
button an automatic classification program will be run on the sequence(s).
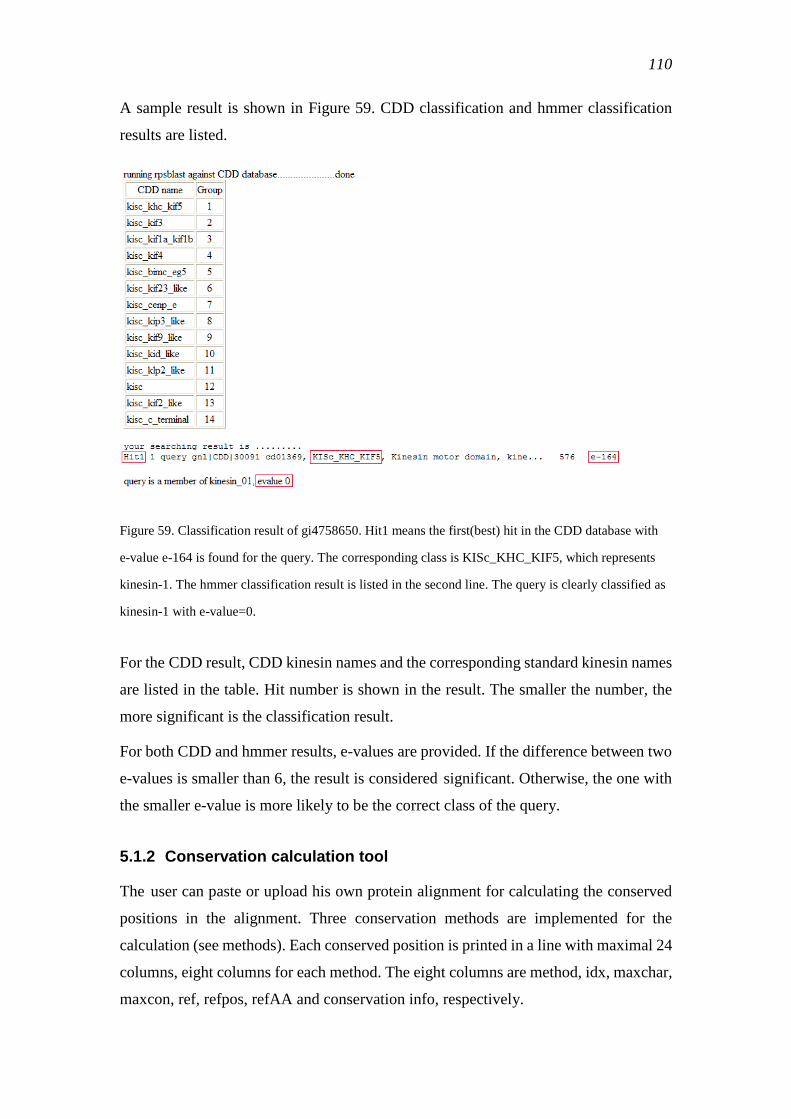
110
A sample result is shown in Figure 59. CDD classification and hmmer classification
results are listed.
Figure 59. Classification result of gi4758650. Hit1 means the first(best) hit in the CDD database with
e-value e-164 is found for the query. The corresponding class is KISc_KHC_KIF5, which represents
kinesin-1. The hmmer classification result is listed in the second line. The query is clearly classified as
kinesin-1 with e-value=0.
For the CDD result, CDD kinesin names and the corresponding standard kinesin names
are listed in the table. Hit number is shown in the result. The smaller the number, the
more significant is the classification result.
For both CDD and hmmer results, e-values are provided. If the difference between two
e-values is smaller than 6, the result is considered significant. Otherwise, the one with
the smaller e-value is more likely to be the correct class of the query.
5.1.2 Conservation calculation tool
The user can paste or upload his own protein alignment for calculating the conserved
positions in the alignment. Three conservation methods are implemented for the
calculation (see methods). Each conserved position is printed in a line with maximal 24
columns, eight columns for each method. The eight columns are method, idx, maxchar,
maxcon, ref, refpos, refAA and conservation info, respectively.
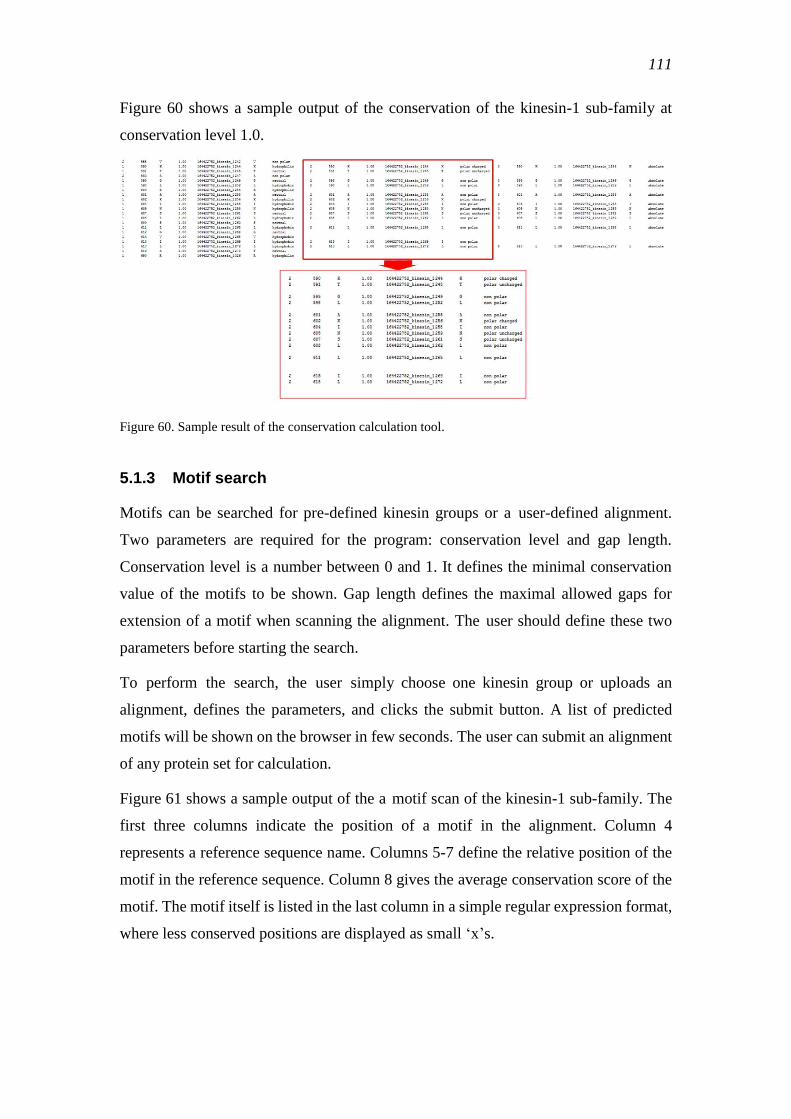
111
Figure 60 shows a sample output of the conservation of the kinesin-1 sub-family at
conservation level 1.0.
Figure 60. Sample result of the conservation calculation tool.
5.1.3 Motif search
Motifs can be searched for pre-defined kinesin groups or a user-defined alignment.
Two parameters are required for the program: conservation level and gap length.
Conservation level is a number between 0 and 1. It defines the minimal conservation
value of the motifs to be shown. Gap length defines the maximal allowed gaps for
extension of a motif when scanning the alignment. The user should define these two
parameters before starting the search.
To perform the search, the user simply choose one kinesin group or uploads an
alignment, defines the parameters, and clicks the submit button. A list of predicted
motifs will be shown on the browser in few seconds. The user can submit an alignment
of any protein set for calculation.
Figure 61 shows a sample output of the a motif scan of the kinesin-1 sub-family. The
first three columns indicate the position of a motif in the alignment. Column 4
represents a reference sequence name. Columns 5-7 define the relative position of the
motif in the reference sequence. Column 8 gives the average conservation score of the
motif. The motif itself is listed in the last column in a simple regular expression format,
where less conserved positions are displayed as small ‗x‘s.
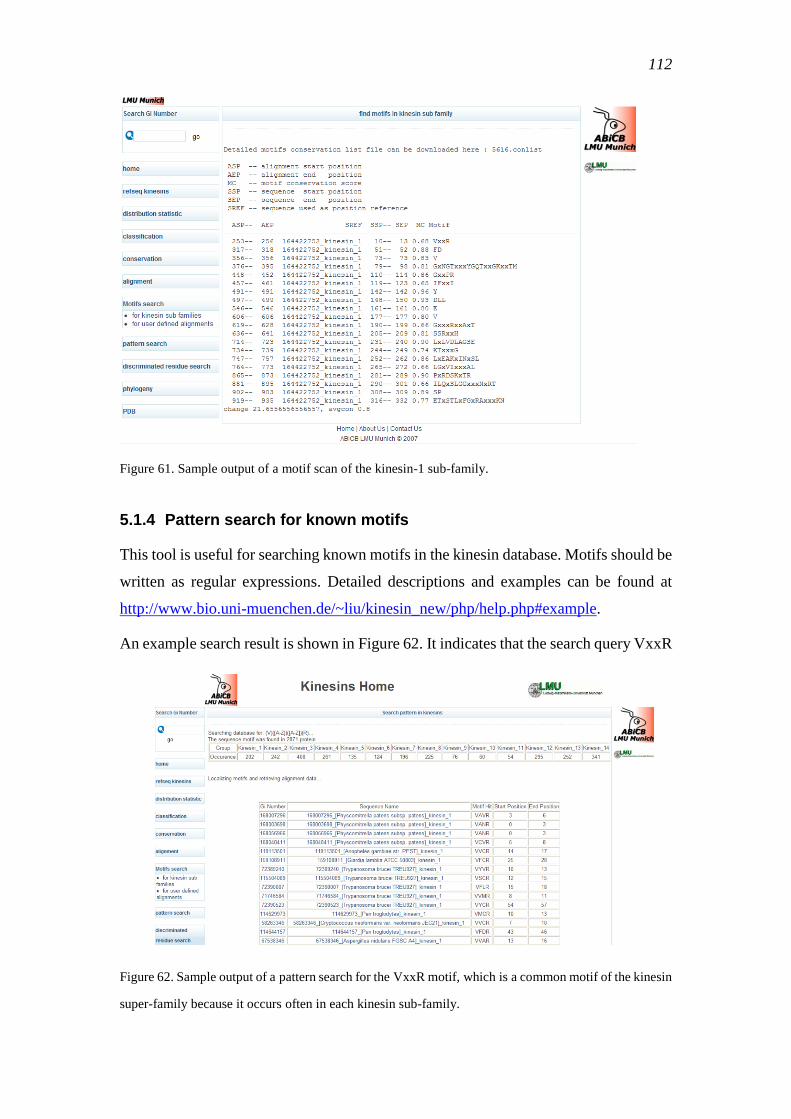
112
Figure 61. Sample output of a motif scan of the kinesin-1 sub-family.
5.1.4 Pattern search for known motifs
This tool is useful for searching known motifs in the kinesin database. Motifs should be
written as regular expressions. Detailed descriptions and examples can be found at
http://www.bio.uni-muenchen.de/~liu/kinesin_new/php/help.php#example.
An example search result is shown in Figure 62. It indicates that the search query VxxR
Figure 62. Sample output of a pattern search for the VxxR motif, which is a common motif of the kinesin
super-family because it occurs often in each kinesin sub-family.
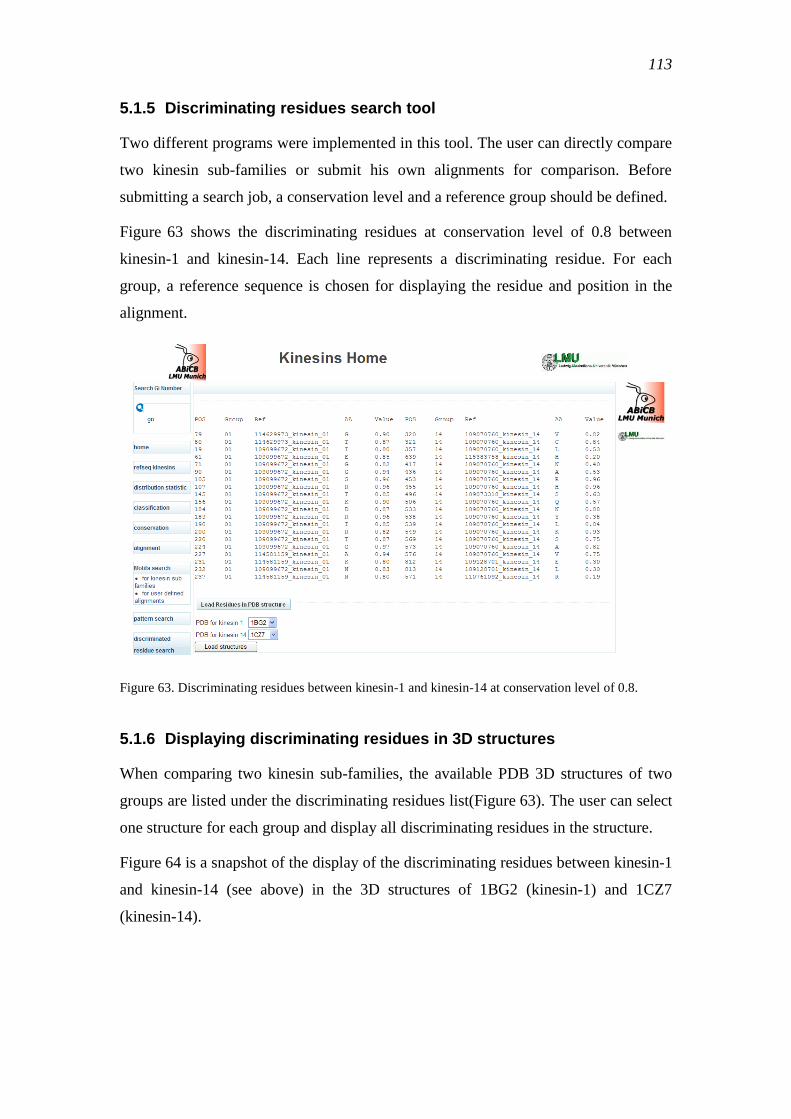
113
5.1.5 Discriminating residues search tool
Two different programs were implemented in this tool. The user can directly compare
two kinesin sub-families or submit his own alignments for comparison. Before
submitting a search job, a conservation level and a reference group should be defined.
Figure 63 shows the discriminating residues at conservation level of 0.8 between
kinesin-1 and kinesin-14. Each line represents a discriminating residue. For each
group, a reference sequence is chosen for displaying the residue and position in the
alignment.
Figure 63. Discriminating residues between kinesin-1 and kinesin-14 at conservation level of 0.8.
5.1.6 Displaying discriminating residues in 3D structures
When comparing two kinesin sub-families, the available PDB 3D structures of two
groups are listed under the discriminating residues list(Figure 63). The user can select
one structure for each group and display all discriminating residues in the structure.
Figure 64 is a snapshot of the display of the discriminating residues between kinesin-1
and kinesin-14 (see above) in the 3D structures of 1BG2 (kinesin-1) and 1CZ7
(kinesin-14).
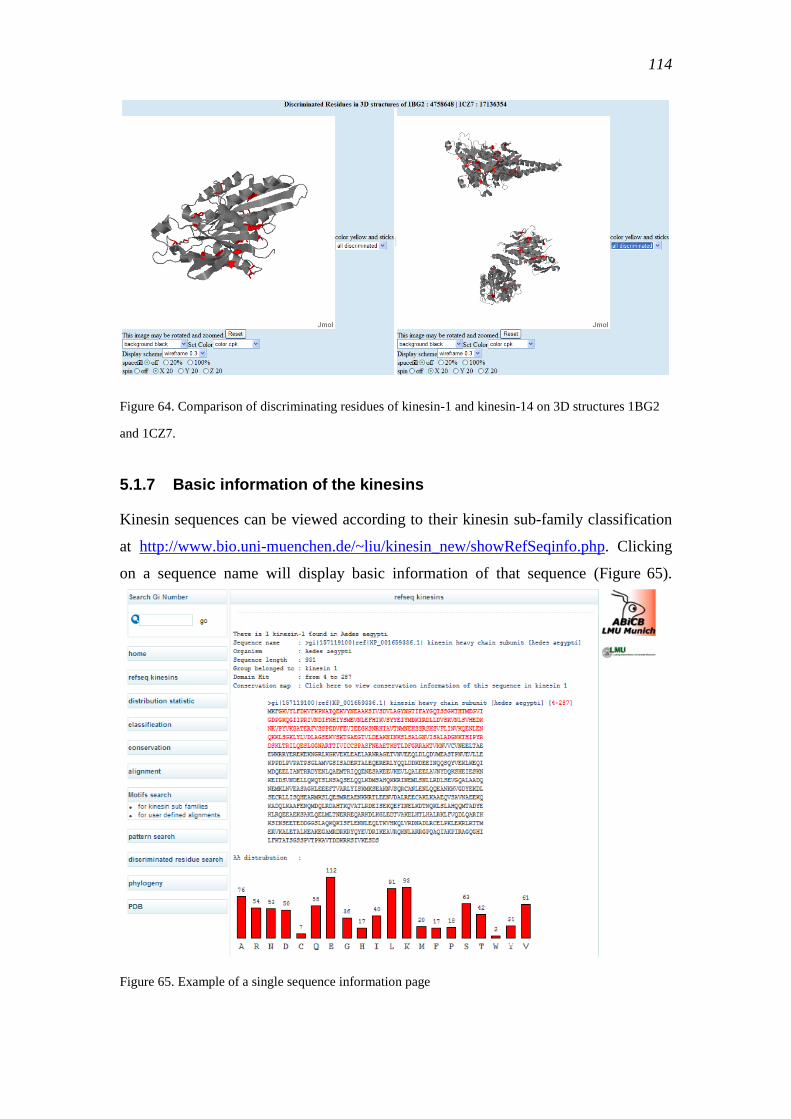
114
Figure 64. Comparison of discriminating residues of kinesin-1 and kinesin-14 on 3D structures 1BG2
and 1CZ7.
5.1.7 Basic information of the kinesins
Kinesin sequences can be viewed according to their kinesin sub-family classification
at http://www.bio.uni-muenchen.de/~liu/kinesin_new/showRefSeqinfo.php. Clicking
on a sequence name will display basic information of that sequence (Figure 65).
Figure 65. Example of a single sequence information page
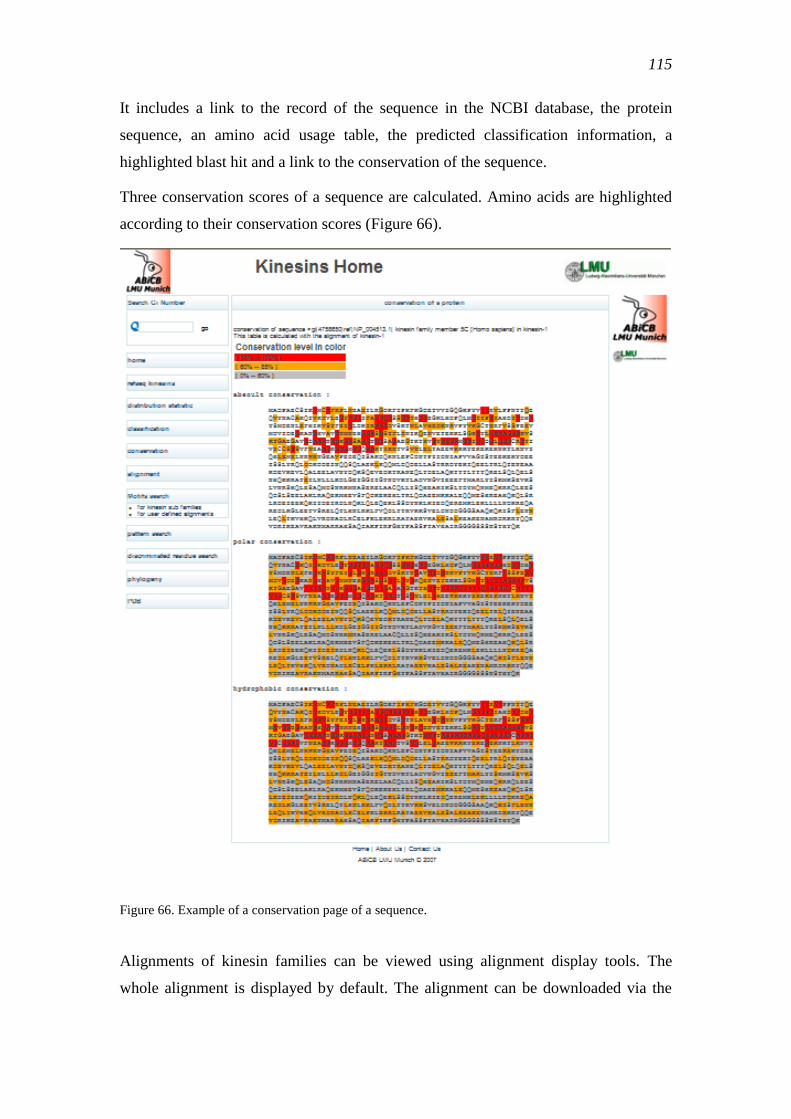
115
It includes a link to the record of the sequence in the NCBI database, the protein
sequence, an amino acid usage table, the predicted classification information, a
highlighted blast hit and a link to the conservation of the sequence.
Three conservation scores of a sequence are calculated. Amino acids are highlighted
according to their conservation scores (Figure 66).
Figure 66. Example of a conservation page of a sequence.
Alignments of kinesin families can be viewed using alignment display tools. The
whole alignment is displayed by default. The alignment can be downloaded via the
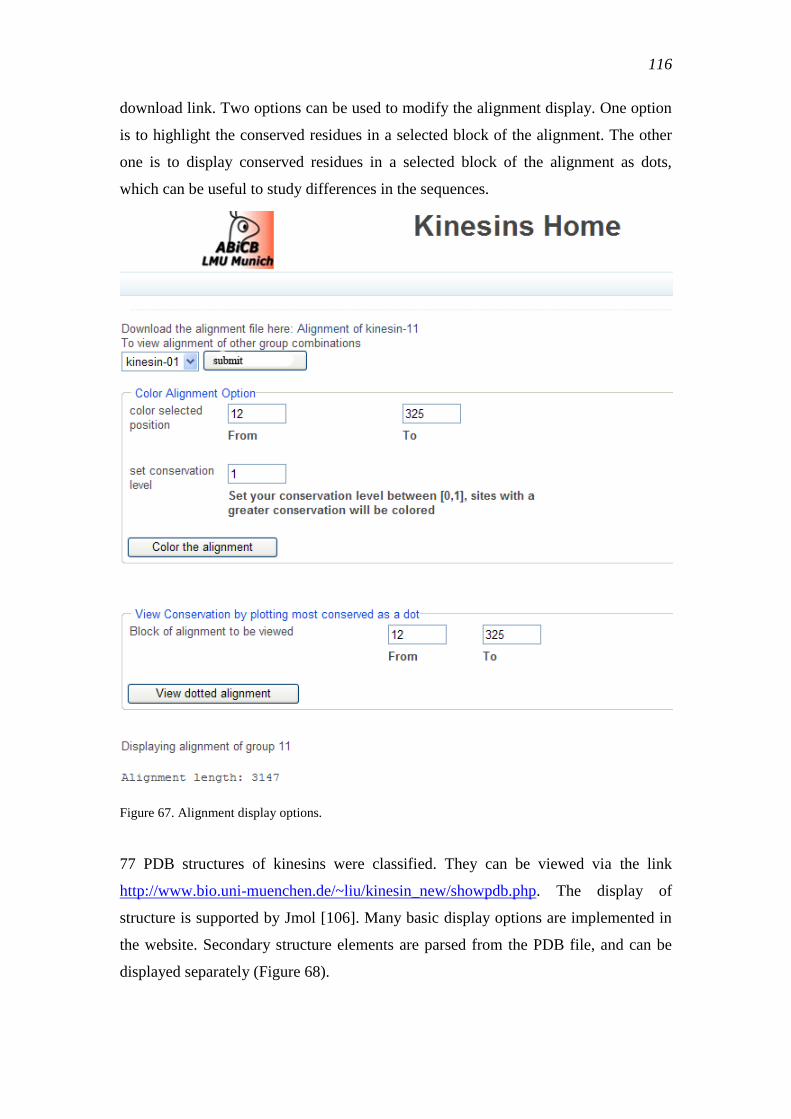
116
download link. Two options can be used to modify the alignment display. One option
is to highlight the conserved residues in a selected block of the alignment. The other
one is to display conserved residues in a selected block of the alignment as dots,
which can be useful to study differences in the sequences.
Figure 67. Alignment display options.
77 PDB structures of kinesins were classified. They can be viewed via the link
http://www.bio.uni-muenchen.de/~liu/kinesin_new/showpdb.php. The display of
structure is supported by Jmol [106]. Many basic display options are implemented in
the website. Secondary structure elements are parsed from the PDB file, and can be
displayed separately (Figure 68).
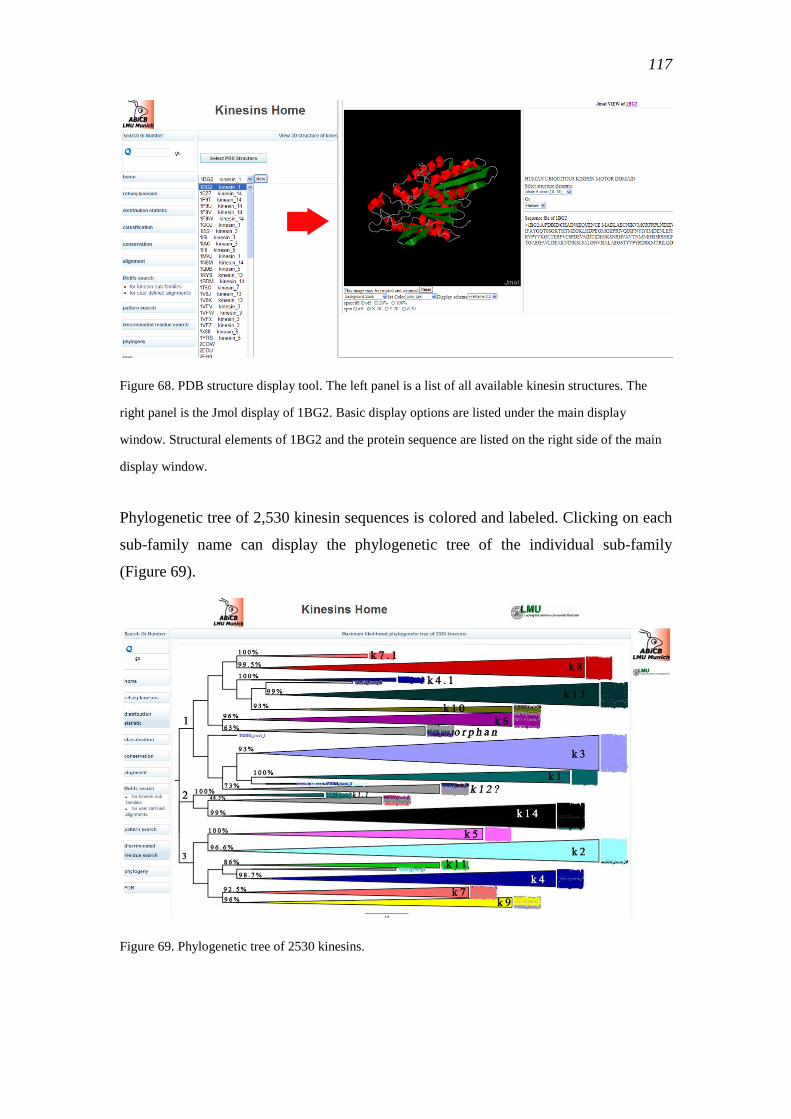
117
Figure 68. PDB structure display tool. The left panel is a list of all available kinesin structures. The
right panel is the Jmol display of 1BG2. Basic display options are listed under the main display
window. Structural elements of 1BG2 and the protein sequence are listed on the right side of the main
display window.
Phylogenetic tree of 2,530 kinesin sequences is colored and labeled. Clicking on each
sub-family name can display the phylogenetic tree of the individual sub-family
(Figure 69).
Figure 69. Phylogenetic tree of 2530 kinesins.
118
6 Bibliography
1. C. Bustamante, Y. R. Chemla, N. R. Forde, D. Izhaky. Mechanical processes in
biology, Annual Review of Biochemistry, 73: 705-48. (2004)
2. Karp G. Cell and Molecular Biology: Concepts and Experiments, Fourth edition, pp.
346-358. John Wiley and Sons, Hoboken, NJ. (2005)
3. Pollard TD, Korn ED. Acanthamoeba myosin. I. Isolation from Acanthamoeba
castellanii of an enzyme similar to muscle myosin. J. Biol. Chem. 248 (13):
4682–90 (1973)
4. Thompson RF, Langford GM. Myosin super-family evolutionary history. Anat Rec
268:276–89 (2002)
5. Odronitz F, Kollmar M. Drawing the tree of eukaryotic life based on the analysis of
2,269 manually annotated myosins from 328 species. Genome Biol.;8(9):R196
(2007).
6. Manfred Schliwa, ed. Molecular Motors. Wiley-VCH. (2003)
7. Lasek RJ, Brady ST. Attachment of transported vesicles to microtubules in
axoplasm is facilitated by AMP-PNP Nature. Aug 15-21;316(6029):645-7 (1985)
8. Vale RD, Reese TS, Sheetz MP. Identification of a novel force-generating protein,
kinesin, involved in microtubule-based motility.Cell. Aug;42(1):39-50. (1985)
9. Hirokawa N, Noda Y. Intracellular transport and kinesin super-family proteins,
KIFs: structure, function, and dynamics. Physiol Rev. Jul;88(3):1089-118 (2008)
10. Walker RA, Salmon ED, Endow SA. The Drosophila claret segregation protein is a
minus-end directed motor molecule. Nature. Oct 25;347(6295):780-2. (1990)
11. Vale RD, Milligan RA. The way things move: looking under the hood of molecular
motor proteins. Science (journal) 288 (5463): 88–95. ( 2000)
12. Schnitzer MJ, Block SM. Kinesin hydrolyses one ATP per 8-nm step. Nature 388:
386–90. (1997)
13. Okada Y, Hirokawa N. A processive single-headed motor: kinesin super-family
protein KIF1A. Science. Feb 19;283(5405):1152-7. (1999)
14. Lawrence C.J., Dawe R.K., Christie K.R., Cleveland D.W., Dawson S.C., Endow S.A.,
Goldstein L.S., Goodson H.V., Hirokawa N., Howard J., Malmberg R.L., McIntosh
J.R., Miki H., Mitchison T.J., Okada Y., Reddy A.S., Saxton W.M., Schliwa M.,
Scholey .J.M, Vale R.D., Walczak C.E., Wordeman L. A standardized kinesin
nomenclature.J. Cell Biol. 167, 19-22 (2004)
15. Kim AJ, Endow SA. A kinesin family tree. Dept of Microbiology, Duke University
Medical Center, Durham, NC 27710, USA.
16. H. Miki, Y. Okada, N. Hirokawa. Analysis of the kinesin super-family: insights into
structure and function. Trends Cell Biol, Vol. 15, No. 9., pp. 467-76 (2005)
17. Wickstead B, Gull K. A "holistic" kinesin phylogeny reveals new kinesin families and
predicts protein functions. Mol Biol Cell. Apr;17(4):1734-43. (2006)
18. RefSeq database statistic, release 33. Jan. 16.2009
19. ftp://ftp.ncbi.nih.gov/RefSeq/release/release-statistics/archive/RefSeq-release3
119
3.01162009.stats.txt
20. Genebank: www.ncbi.nlm.nih.gov/Genbank/
21. PDB: www.rcsb.org/pdb/
22. NCBI: www.ncbi.nlm.nih.gov/
23. Swissport: www.swissport.com
24. PIR: http://pir.georgetown.edu/
25. EMBL: www.ebi.ac.uk/embl/
26. Altschul SF, Gish W, Miller W, Myers EW, Lipman DJ. Basic local alignment search
tool. J Mol Biol 215 (3): 403–10 (1990)
27. D.W. Mount. Bioinformatics: Sequence and Genome Analysis. Cold Spring Harbor
Press. (2004)
28. Zuckerkandl, E. and Pauling, L.B. Molecular disease, evolution, and genetic
heterogeneity. in Kasha, M. and Pullman, B (editors). Horizons in Biochemistry.
Academic Press, New York. pp. 189–225. (1962)
29. Margoliash, E. Primary Structure and Evolution Of Cytochrome C. Proc Natl Acad
Sci U S A 50, 672-79. (1963)
30. Ayala, F.J. Molecular clock mirages. BioEssays 21 (1): 71–75. (1999)
31. Saitou N, Nei M. The neighbor-joining method: a new method for reconstructing
phylogenetic trees. Mol Biol Evol 4 (4): 406-25. (1987)
32. Huelsenbeck JP, Ronquist F. MRBAYES: Bayesian inference of phylogenetic trees.
Bioinformatics. Aug;17(8):754-5. (2001)
33. Mark Holder, Paul O.Lewis. Phylogeny estimation: traditional and bayesian
approaches. Nat Rev Genet. Apr;4(4):275-84. Review. (2003)
34. Alfaro ME, Zoller S, Lutzoni F. Bayes or bootstrap? A simulation study comparing
the performance of Bayesian Markov chain Monte Carlo sampling and
bootstrapping in assessing phylogenetic confidence. Mol Biol Evol.
Feb;20(2):255-66. (2003)
35. Pauling L. and Zuckerkandl E. Chemical paleogenetics, molecular restoration
studies of extinct forms of life. Acta chemica Scandinavica 17 (89): 9–16. (1963)
36. Stackhouse J, Presnell SR, McGeehan GM, Nambiar KP, Benner SA. The
ribonuclease from an extinct bovid ruminant. FEBS Lett. Mar 12;262(1):104-6.
(1990)
37. Chang B.S. et al. Recreating a functional ancestral archosaur visual pigment.
Molecular Biology and Evolution 19 (9): 1483–89. (2002)
38. Gaucher EA, Thomson JM, Burgan MF, Benner SA. Inferring the palaeoenvironment
of ancient bacteria on the basis of resurrected proteins. Nature. Sep
18;425(6955):285-8. (2003)
39. Ivics Z, Hackett PB, Plasterk RH, Izsvák Z. Molecular reconstruction of Sleeping
Beauty, a Tc1-like transposon from fish, and its transposition in human cells. Cell.
Nov 14;91(4):501-10. (1997)
40. Thornton JW, Need E, Crews D. Resurrecting the ancestral steroid receptor: ancient
origin of estrogen signaling. Science. Sep 19;301(5640):1714-7. (2003)
41. Chandrasekharan UM, Sanker S, Glynias MJ, Karnik SS, Husain A.Angiotensin
II-forming activity in a reconstructed ancestral chymase. Science. Jan
120
26;271(5248):502-5. (1996)
42. Hall BG.Simple and accurate estimation of ancestral protein sequences. Proc Natl
Acad Sci U S A. Apr 4;103(14):5431-6. (2006)
43. Thornton JW. Resurrecting ancient genes: experimental analysis of extinct
molecules. Nat Rev Genet. May;5(5):366-75. Review. (2004)
44. Farris, J. S. Methods for computing Wagner trees. Syst. Zool . 19: 83-92. (1970)
45. Maximum likelihood: http://en.wikipedia.org/wiki/Maximum_likelihood
46. Bayesian Inference: http://en.wikipedia.org/wiki/Bayesian_inference
47. PAUP*: http://paup.csit.fsu.edu/
48. Kinesin-1: http://www.proweb.org/kinesin/FxnVessTrans.html
49. Gho M, McDonald K, Ganetzky B, Saxton WM.Effects of kinesin mutations on
neuronal functions. Science. Oct 9;258(5080):313-6. (1992)
50. Hirokawa N.Organelle transport along microtubules - the role of KIFs. Trends Cell
Biol. Apr;6(4):135-41 (1996)
51. Saxton WM, Hicks J, Goldstein LS, Raff EC.Kinesin heavy chain is essential for
viability and neuromuscular functions in Drosophila, but mutants show no defects
in mitosis. Cell. Mar 22;64(6):1093-102. (1991)
52. Berliner E, Young EC, Anderson K, Mahtani HK, Gelles J. Failure of a single-headed
kinesin to track parallel to microtubule protofilaments.Nature. Feb
23;373(6516):718-21. (1995)
53. Steinberg, G., Schliwa, M. Characterization of the biophysical and motility
properties of kinesin from the fungus Neurospora crassa. J. Biol. Chem. 271,
7516-21 (1996)
54. Requena, N., Alberti-Segui, C., Winzenburg, E., Horn, C., Schliwa, M., Philippsen,
P., Liese, R., Fischer, R. Genetic evidence for a microtubule-destabilizing effect of
conventional kinesin and analysis of its consequences for the control of nuclear
distribution in Aspergillus nidulans. Mol. Microbiol. 42, 121-32 (2001)
55. Grummt, M., Pistor, S., Lottspeich, F., Schliwa, M. Cloning and functional
expression of a `fast ́fungal kinesin. FEBS Lett. 427, 79-84 (1998)
56. Lehmler, C., Snetselaar, K., Steinberg, G., Schliwa, M., Kahmann, R., Bölker, M.
Motor proteins and filamentous growth in Ustilago maydis. EMBO J., 16, 3464-73
(1997)
57. Schief WR, Clark RH, Crevenna AH, Howard J. Inhibition of kinesin motility by ADP
and phosphate supports a hand-over-hand mechanism. Proc Natl Acad Sci U S A.
Feb 3;101(5):1183-8. (2004)
58. Schäfer F., Deluca D., Majdic U., Kirchner J., Schliwa M., Moroder L., Woehlke G. A
conserved tyrosine in the neck of a fungal kinesin regulates the catalytic motor
core. EMBO J. 22, 450-8 (2003).
59. Holly V. Goodson, Sang Joon Kang and Sharyn A. Endow2. Molecular phylogeny of
the kinesin family of microtubule motor proteins. Journal of Cell Science 107,
1875-84 (1994)
60. Kallipolitou, A., Deluca, D., Majdic, U., Lakämper, S., Cross, R., Meyhöfer, E.,
Moroder, L., Schliwa, M., Woehlke, G. Unusual properties of the fungal
conventional kinesin neck domain from Neurospora crassa. EMBO J. 20, 6226-35
121
(2001)
61. Liu XI, Korde N, Jakob U, Leichert LI. CoSMoS: Conserved Sequence Motif Search in
the proteome.BMC Bioinformatics. Jan 24;7:37. (2006)
62. Edwards RJ, Shields DC. GASP: Gapped Ancestral Sequence Prediction for
proteins. BMC Bioinformatics. Sep 6;5:123. (2004)
63. Marchler-Bauer A, Panchenko AR, Shoemaker BA, Thiessen PA, Geer LY, and
Bryant SH CDD: a database of conserved domain alignments with links to domain
three-dimensional structure. Nucleic Acids Res.30:281-3. (2002)
64. Tatusov RL, Galperin MY, Natale DA, Koonin EV. The COG database: a tool for
genome-scale analysis of protein functions and evolution. Nucleic Acids Res. Jan
1;28(1):33-6. (2000)
65. Kim Pruitt, Tatiana Tatusova, and Donna Maglott. The Reference Sequence (RefSeq)
Project. Chapter 18. NCBI handbook. October 09, (2002)
66. RefSeq Statistic: ftp://ftp.ncbi.nih.gov/RefSeq/release/release-statistics/
67. S. F. Altschul, T. L. Madden, A. A. Schäffer, J. Zhang, Z. Zhang, W. Miller, D. J.
Lipman Gapped BLAST and PSI-BLAST: a new generation of protein database
search programs Nucl. Acids Res., Vol. 25, No. 17. pp. 3389-402 (1997)
68. Ben-Gal I, Shani A, Gohr A, Grau J, Arviv S, Shmilovici A, Posch S, Grosse I.
Identification of Transcription Factor Binding Sites with Variable-order Bayesian
Networks. Bioinformatics 21 (11): 2657–66. (2005)
69. R. Durbin, S. Eddy, A. Krogh, and G. Mitchison, Biological sequence analysis:
probabilistic models of proteins and nucleic acids, Cambridge University Press,
(1998).
70. Hmmer: http://hmmer.janelia.org/
71. Cox, D. R. and Hinkley, D. V; Theoretical Statistics, Chapman and Hall, (page 92)
(1974)
72. LRT test online http://www.molecularevolution.org/si/resources/lrt.php
73. Larkin MA, Blackshields G, Brown NP, Chenna R, McGettigan PA, McWilliam H,
Valentin F, Wallace IM, Wilm A, Lopez R, Thompson JD, Gibson TJ, Higgins DG.
ClustalW2 and ClustalX version 2. Bioinformatics 23 (21): 2947-48. (2007)
74. Edgar, Robert C. MUSCLE: multiple sequence alignment with high accuracy and
high throughput, Nucleic Acids Research 32(5), 1792-97. (2004)
75. J. D. Thompson , J. C. Thierry and O. Poch. RASCAL: rapid scanning and correction
of multiple sequence alignments. Bioinformatics Vol. 19 no. 9 (2003)
76. CoSMoS: http://www.mcdb.lsa.umich.edu/cosmos/help.php
77. MySQL : http://www.mysql.com/
78. Stamatakis A. RAxML-VI-HPC: maximum likelihood-based phylogenetic analyses
with thousands of taxa and mixed models. Bioinformatics. Nov
1;22(21):2688-90.(2006)
79. Zmasek C.M. and Eddy S.R. ATV: display and manipulation of annotated
phylogenetic trees. Bioinformatics, 17, 383-4 (2001)
80. FigTree: http://tree.bio.ed.ac.uk/software/figtree/ (2009)
81. RasMol: http://www.umass.edu/microbio/rasmol/#rasmol
82. Kinesin web server: http://www.bio.uni-muenchen.de/~liu/kinesin_new/
122
83. Chourrout, Daniel, Philippe, Herve, Delsuc, Frederic, Brinkmann, Henner.
Tunicates and not cephalochordates are the closest living relatives of vertebrates
Nature. Feb 23;439(7079):965-8.(2006)
84. F. Jon Kull1,and Sharyn A. Endow. Kinesin: switch I & II and the motor mechanism.
Journal of Cell Science 115, 15-23 (2002)
85. PABLO N. HESS and CLAUDIA A. DE MORAES RUSSO. An empirical test of the
midpoint rooting method Volume 92 Issue 4, Pages 669 – 74 (2007)
86. Huelsenbeck JP, Ronquist F.MRBAYES: Bayesian inference of phylogenetic trees.
Bioinformatics. Aug;17(8):754-5.(2001)
87. Naber N, Rice S, Matuska M, Vale RD, Cooke R, Pate E. EPR Spectroscopy Shows a
Microtubule-Dependent Conformational Change in the Kinesin Switch 1 Domain
Biophys J. May;84(5):3190-6 (2003)
88. Kull FJ, Endow SA.Kinesin: switch I & II and the motor mechanism Journal of Cell
Science 115, 15-23 (2002)
89. Vinogradova MV, Malanina GG, Reddy VS, Reddy AS, Fletterick RJ. Structural
dynamics of the microtubule binding and regulatory elements in the kinesin-like
calmodulin binding protein. Journal of Structural Biology Vol.163 (2008)
90. Yamada MD, Maruta S, Yasuda S, Kondo K, Maeda H, Arata T. Conformational
dynamics of loops L11 and L12 of kinesin as revealed by spin-labeling EPR.
Biochem Biophys Res Commun. Dec 21;364(3):620-6 (2007)
91. Amos LA, Hirose K. A cool look at the structural changes in kinesin motor domains.
J Cell Sci. Nov 15;120(Pt 22):3919-27 (2007)
92. Schultz J, Milpetz F, Bork P, Ponting CP. SMART, a simple modular architecture
research tool: identification of signaling domains. Proc Natl Acad Sci U S A. 95:
5857–64.(1998)
93. Letunic I, Goodstadt L, Dickens NJ, Doerks T, Schultz J, Mott R, Ciccarelli F, Copley
RR, Ponting CP, Bork P. Recent improvements to the SMART domain-based
sequence annotation resource. Nucleic Acids Res. 30: 242–4. (2002)
94. Phylogenetic tree of life: http://en.wikipedia.org/wiki/Phylogenetic_tree
95. Marija Vukajlovic, Expression und Charakterisierung der
evolutionären Vorläufer von Kinesin-1, (2008)
96. Song YH, Marx A, Müller J, Woehlke G, Schliwa M, Krebs A, Hoenger A, Mandelkow
E. Structure of a fast kinesin: implications for ATPase mechanism and interactions
with microtubules. EMBO J. Nov 15;20(22):6213-25. (2001)
97. Sack S, Müller J, Marx A, Thormählen M, Mandelkow EM, Brady ST, Mandelkow E.
X-ray structure of motor and neck domains from rat brain kinesin. Biochemistry.
Dec 23;36(51):16155-65. (1997)
98. Kozielski F, Sack S, Marx A, Thormählen M, Schönbrunn E, Biou V, Thompson A,
Mandelkow EM, Mandelkow E. The crystal structure of dimeric kinesin and
implications for microtubule-dependent motility. Cell. Dec
26;91(7):985-94.(1997)
99. Kull FJ, Sablin EP, Lau R, Fletterick RJ, Vale RD. Crystal structure of the kinesin
motor domain reveals a structural similarity to myosin. Nature. Apr
11;380(6574):550-5. (1996)
123
100. Sindelar CV, Budny MJ, Rice S, Naber N, Fletterick R, Cooke R. Two
conformations in the human kinesin power stroke defined by X-ray
crystallography and EPR spectroscopy. Nat Struct Biol. Nov;9(11):844-8. (2002)
101. Sindelar CV, Downing KH. The beginning of kinesin's force-generating cycle
visualized at 9-A resolution. J Cell Biol. 2007 May 7;177(3):377-85. Apr 30.
(2007)
102. Baldwin, T and Lapointe, M In The Chemistry of Amino Acids: The Biology
Project, (2003)
103. Gellman SH.On the role of methionine residues in the sequence-independent
recognition of nonpolar protein surfaces. Biochemistry. 1991 Jul 9;30(27):6633-6.
(1991)
104. Saitou N, Nei M. The neighbor-joining method: a new method for
reconstructing phylogenetic trees. Mol Biol Evol 4 (4): 406-25. (1987)
105. Odronitz F, Kollmar M. Drawing the tree of eukaryotic life based on the
analysis of 2,269 manually annotated myosins from 328 species. Genome Biol.
8(9):R196. (2007)
106. Jmol: http://jmol.sourceforge.net/
107. Kadane's Algo http://en.wikipedia.org/wiki/index.html?curid=10575678
6.1 Publications
108. Liu XI, Korde N, Jakob U, Leichert LI. CoSMoS: Conserved Sequence Motif
Search in the proteome.BMC Bioinformatics. Jan 24;7:37. (2006)
109. Röhlk, C., Rohlfs, M., Leier, S., Schliwa, M., Liu, X., Parsch, J., Woehlke, G.
Properties of the Kinesin-1 Motor DdKif3 from Dictyostelium discoideum. Eur. J.
Cell Biol., (2007)
110. Joseph JM, Fey P, Ramalingam N, Liu XI, Rohlfs M, Noegel AA,
Müller-Taubenberger A, Glöckner G, Schleicher M. The actinome of Dictyostelium
discoideum in comparison to actins and actin-related proteins from other
organisms. PLoS One. Jul 9;3(7):e2654. (2008)
124
7 Curriculum Vitae
Dipl.-Bioinf.Univ. Xiao Liu Marsstr.84
80335 Munich
Cell Phone: 0179-7606761
Education
2.2006-present Ph.D student
Cell biology Institute and Department of Biology II
University of Munich (LMU)
9.2001-10.2005 Diploma in Bioinformatics
Munich Technical University (TU) and University of
Munich (LMU)
9.2000-7.2001 University preparatory courses for foreign students
Studienkolleg Munich
9.1998-7.2000 Automotive Engineering
Tongji University in Shanghai
Work Experience
10.2002-7.2004 Large scale EST alignments and clustering
Biomax Informatics AG,
3.2003-10.2003 Optimization of the RNA secondary structure
prediction program ―Piranah―
Biology Department of the University of Munich
(LMU)
Personal Data
Last name : Liu
First name :Xiao
Birthday : Feb.19, 1981
Sex : male
Nationality : Chinese
Email : [email protected]
125
11.2004-3.2005 IT support for Custom information data mining
Robert Wuttka Consulting
3.2005-9.2005 Computational Analysis of Amino Acid Conservation
in Proteins
University of Michigan (USA)
2.2006-present Bioinformatics analysis of kinesin classification and
prediction of structural changes from a closed to an
open conformation of the motor domain
Cell biology Institute and Department of Biology II
University of Munich (LMU)
Publications
2006 Liu XI, Korde N, Jakob U, Leichert LI.
CoSMoS: Conserved Sequence Motif Search in the
proteome.
BMC Bioinformatics. Jan 24;7:37. (2006)
2007 Röhlk, C., Rohlfs, M., Leier, S., Schliwa, M., Liu, X.,
Parsch, J., Woehlke, G.
Properties of the Kinesin-1 Motor DdKif3 from
Dictyostelium discoideum.
Eur. J. Cell Biol., (2007)
2008 Joseph JM, Fey P, Ramalingam N, Liu XI, Rohlfs M,
Noegel AA, Müller-Taubenberger A, Glöckner G,
Schleicher M.
The actinome of Dictyostelium discoideum in
comparison to actins and actin-related proteins from
other organisms.
PLoS One. Jul 9;3(7):e2654. (2008)
Skills & Activities
General Strong aptitude for learning new knowledge and
Team work.
System Windows, Unix, Mac
Programming Perl, PHP, Database, C, Javascript, Java
Software Office, Photoshop etc.
Bioinformatics Phylogenetic, sequence and structural analyses
Webserver and database construction
Bioinformatic algorithms (String
126
Matching,Clustering, Classification, Prediction,
Alignment etc.)
Language fluent in written and spoken Chinese, German,
English
Activities sport, computer games, music, movies
Awards and honors
2005 Diploma Degree in Bioinformatics with the overall
rating ―passed with high distinction‖ and
ECTS-Grade ―excellent‖
Munich Technical University (TU) and University of
Munich (LMU)
2000 Football Championship
The automobile department
Tongji-University, Shanghai, China
1998 Volleyball Championship
High school volleyball cup
Leping High school, Jiangxi, China