comparative terrestrial planet thermospheres: - cedar
TRANSCRIPT
2000 CEDAR WorkshopBoulder, Colorado
June 25-30, 2000
Tutorial Lecture
by Stephen BougherUniversity of Arizona
Comparative Terrestrial Planet Thermospheres:Venus, Earth, and Mars
CEDAR WORKSHOP 2000
COMPARATIVE TERRESTRIAL PLANET THERMOSPHERES:
VENUS, EARTH, AND MARS
I. Introduction
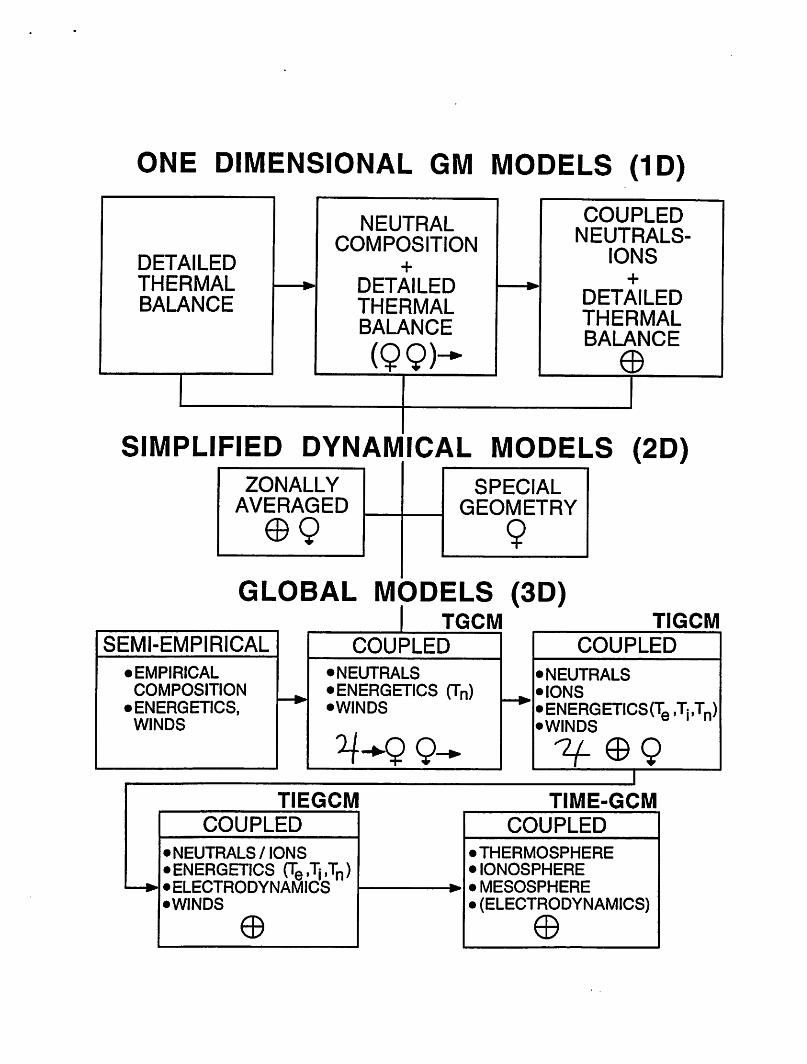
- Basic fundamental planetary parameters and implications- Hierarchy of model development at NCAR (1975-present)
II. Basic Features of Structure and Dynamics of Thermospheres
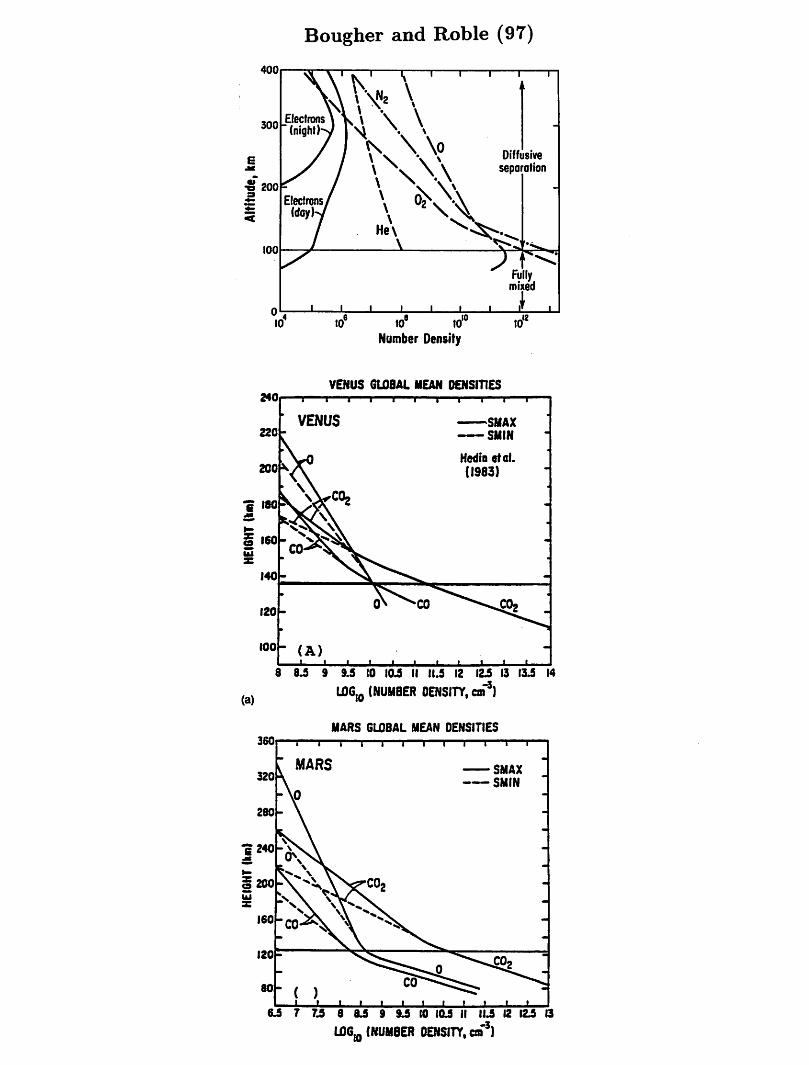
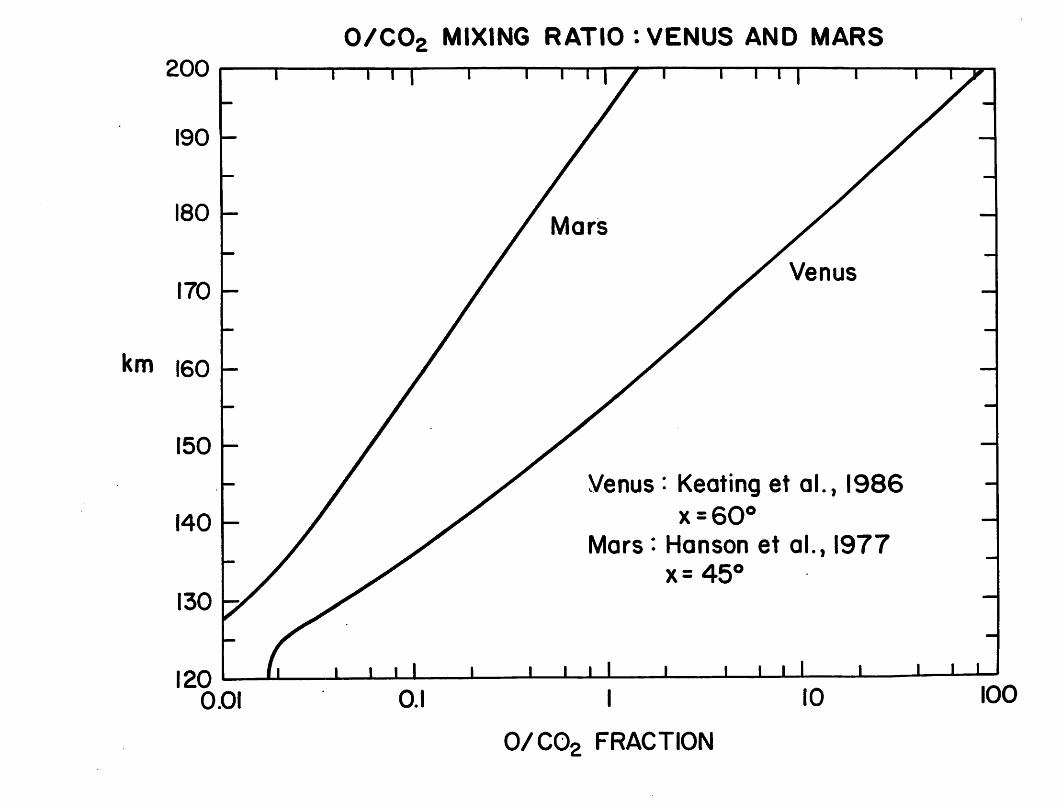
- Vertical temperature structure and global mean composition(over solar cycle)
- Common thermospheric processes and possible thermostatic controls- EUV/UV energy deposition and heating efficiencies- Auroral and joule heating
- 1-D global mean heat balances and implications- Global scale wind patterns
III. Recent (V-M) Thermospheric Data Illustrating Key Features
- Venus and Mars upper atmosphere sampling over past 25 years- Solar cycle (rotational) responses of thermospheric temperatures- Compositional variations (horizontal) from data and empirical models- Storm responses : Mars (dust forcing)
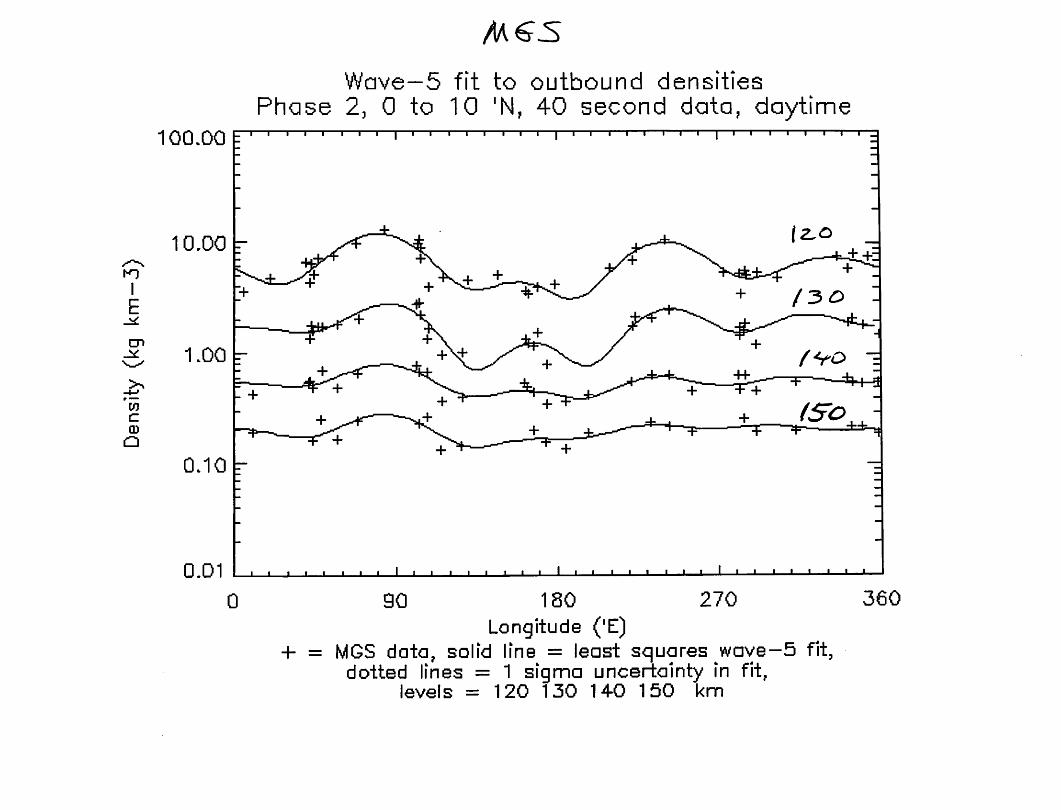
- Mars planetary waves : MGS discovery of longitude fixed waves(diurnal Kelvin wave explanation)
IV. TGCM Modeling Tools (Venus, Earth, and Mars)
- Descriptions of the VTGCM, TIEGCM, and MTGCM
- Common inputs for equinox and solstice, solar cycle simulations
V. TGCM (V-E-M) Simulations for Equinox Conditions
- Global temperature, composition, and wind distributions
(homopause and exobase)- Solar cycle variations of same
- Dayside heat balances (radiative and dynamical)- Time dependent variation of dayside composition and temperatures
- Role of CO2-O cooling as a thermostat controlling temperatures
- Role of global dynamics as a thermostat controlling temperatures
VI. TGCM (E-M) Simulations for Solstice Conditions
- Global temperature, composition, and wind distributions
(homopause and exobase)- Seasonal plus solar cycle variations of same
- Role of orbital eccentricity impacting temperatures
- Mars lower atmosphere dust impacts on its thermosphere
(coupling of atmospheric regions)
VII. Summary and Conclusions
- Key comparative planetary thermosphere problems
- UA website archive of TGCM results

BOUGHER ET AL.: COMPARATIVE PLANETARY THERMOSPHERES C '*7^e7)
Table la. Terrestrial Planet Parameters
Parameter Earth Venus Mars
Gravity, cm/s2 982 888 373
Heliocentric distance AU 1.0 0.72 1.38-1.67
Radius, km 6371 6050 3396
Q, rad/s 7.3(-5) 3.0(-7) 7.1(-5)Magnetic dipole moment (wrt Earth) 1.0 <4.0(-5) <2.5(-5)
Obliquity, deg 23.5 1-3 25.0
Table lb. Implications of Parameters
Effect Earth Venus Mars
Scale heights, km 10-50 4-12 8-22
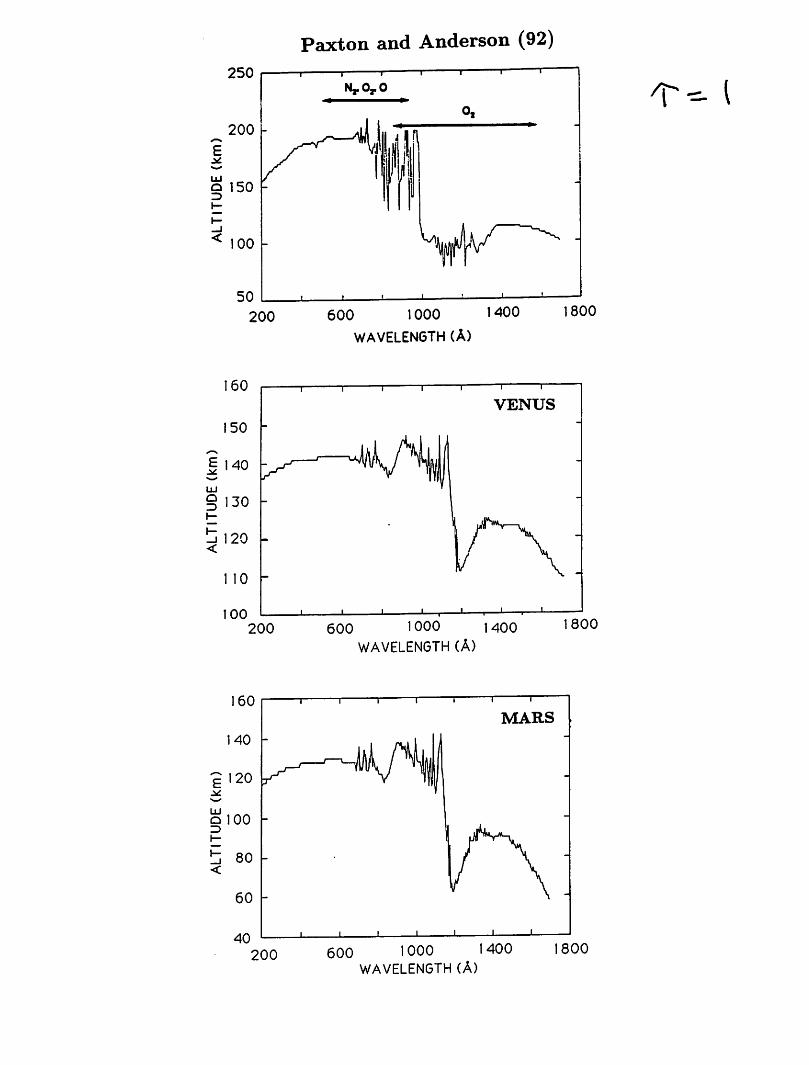
Major EUV heating, km -200-300 -140-160 120-160
broad narrow intermediate
O Abundance (ion peak) -40% -7-20% -1-4%
CO2 15-/mi cooling < 130 km <160 km < 125-130 km
Dayside thermostat conduction CO2 cooling winds/conductionDayside solar cycle T 900-1500 K 230-310 K 220-325 K
Rotational forces important negligible importantCryosphere no yes no
Auroral/Joule heating yes no no
Seasons yes no yes
ONE DIMENSIONAL GM MODELS (1D)
DETAILEDTHERMALBALANCE
NEUTRALCOMPOSITION
+
DETAILEDTHERMALBALANCE
(99H
COUPLEDNEUTRALS-
IONS+
DETAILEDTHERMALBALANCE
e
SIMPLIFIED DYNAMICAL MODELS (2D)ZONALLY
AVERAGED
09
SPECIALGEOMETRY
9
GLOBAL MODELS (3D)TGCM TIGCM
SEMI-EMPIRICAL COU 'LED COUPLED
• EMPIRICALCOMPOSITION
•ENERGETICS,WINDS
•NEUTRALS• ENERGETICS (Tn)•WINDS
•NEUTRALS• IONS• ENERGETICSCL.TpTJ•WINDS
-2f 09
TIEGCM
COUPLED
• NEUTRALS/IONS• ENERGETICS (TeiTj,Tn)•ELECTRODYNAMICS•WINDS
©
TIME-GCM
COUPLED
• THERMOSPHERE• IONOSPHERE•MESOSPHERE• (ELECTRODYNAMICS)
e
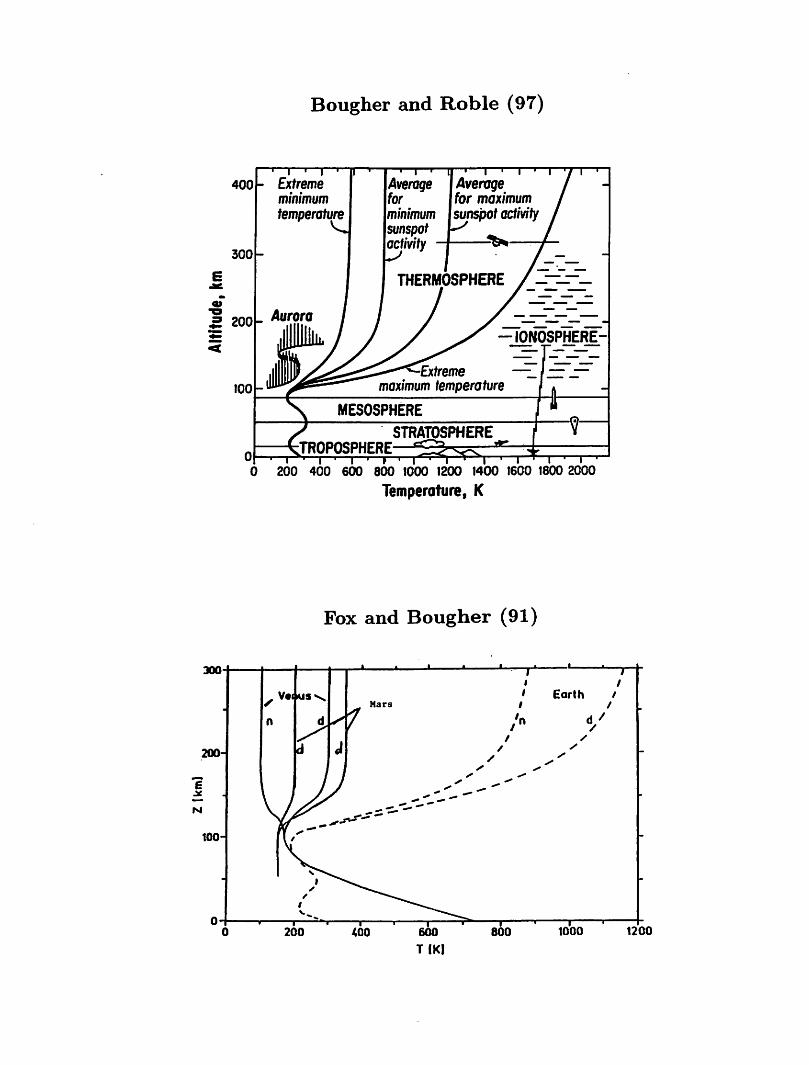
Bougher and Roble (97)
0 200 400 600 800 1000 1200 1400 1600 1800 2000
Temperature, K
Fox and Bougher (91)
1200
400
240
220
100-
Bougher and Roble (97)
10° 10"
Number Density
Diffusiveseparation
VENUS GLOBAL MEAN DENSITIES• i i r
VENUS
(A)_i i t
I I
SMAXSMIN
Media eral.(1983)
• it
(a)
' » ' '
8 8.5 9 9.5 10 10.5 II 11.5 12 I&S 13 13.5 14
LOG,0 (NUMBER DENSITY, an3)
360
MARS GLOBAL MEAN OENSITIES
• i ™^r""™r^^r™™i^^T"^™i™"T^^™^""'™T"
MARS SMAXSMIN
6J 7 7J 8 8J 9 9J 10 IOJ II IIJ 12 I&5 13
LOG^ (NUMBER DENSITY, cm3)
or
<<ZUJ
gor
ozX
M
ooo
oo
op
oo
oo
oo
oO
)0
0Is-
CO
lO<
frro
CJ
CsJ
^n
»
oI-
acr
U-
oo
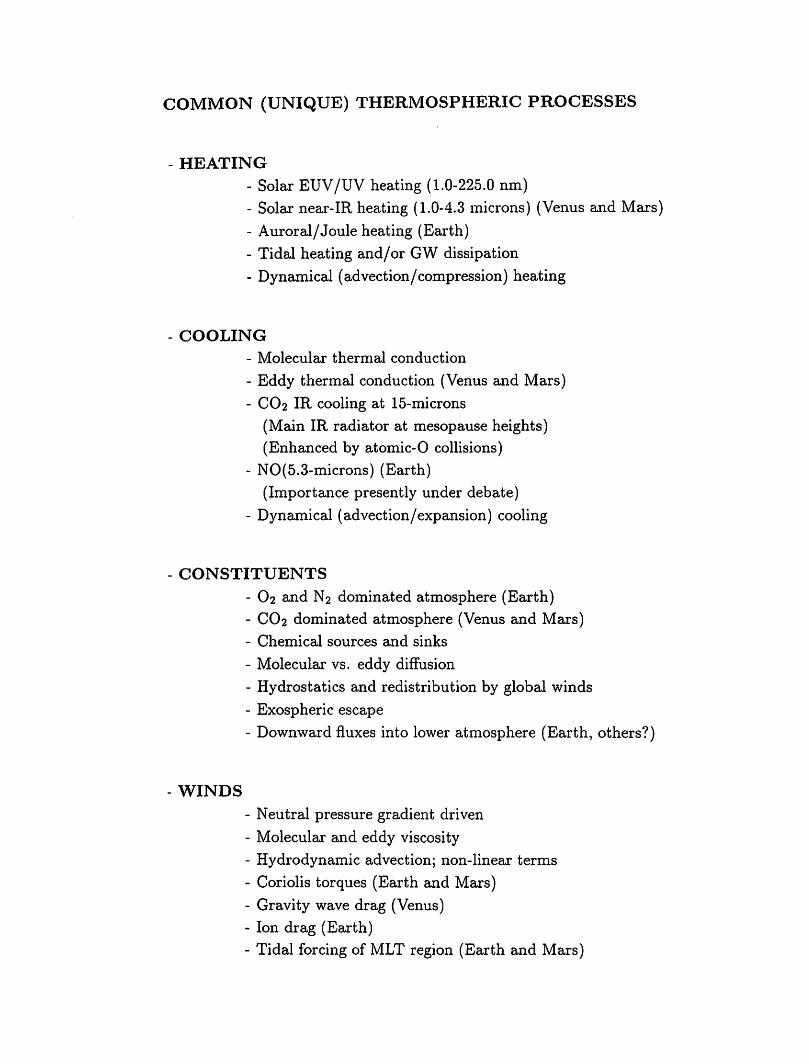
COMMON (UNIQUE) THERMOSPHERIC PROCESSES
HEATING
- Solar EUV/UV heating (1.0-225.0 nm)- Solar near-IR heating (1.0-4.3 microns) (Venus and Mars)- Auroral/Joule heating (Earth)
- Tidal heating and/or GW dissipation
- Dynamical (advection/compression) heating
COOLING
- Molecular thermal conduction
- Eddy thermal conduction (Venus and Mars)
- CO2 IR cooling at 15-microns
(Main IR radiator at mesopause heights)(Enhanced by atomic-0 collisions)
- NO(5.3-microns) (Earth)
(Importance presently under debate)
- Dynamical (advection/expansion) cooling
CONSTITUENTS
- O2 and N2 dominated atmosphere (Earth)- CO2 dominated atmosphere (Venus and Mars)
- Chemical sources and sinks
- Molecular vs. eddy diffusion
- Hydrostatics and redistribution by global winds
- Exospheric escape
- Downward fluxes into lower atmosphere (Earth, others?)
WINDS
- Neutral pressure gradient driven
- Molecular and eddy viscosity
- Hydrodynamic advection; non-linear terms
- Coriolis torques (Earth and Mars)- Gravity wave drag (Venus)- Ion drag (Earth)- Tidal forcing of MLT region (Earth and Mars)
AL
TIT
UD
E(k
m)
AL
TIT
UD
E(k
m)
> <
o o o o
§8 O O C
DO O
AL
TIT
UD
E(k
m)
o oo
ro
K)
oen
oo
o O1
6 O P S3 P-
(D ••J «> O P CD
Is)
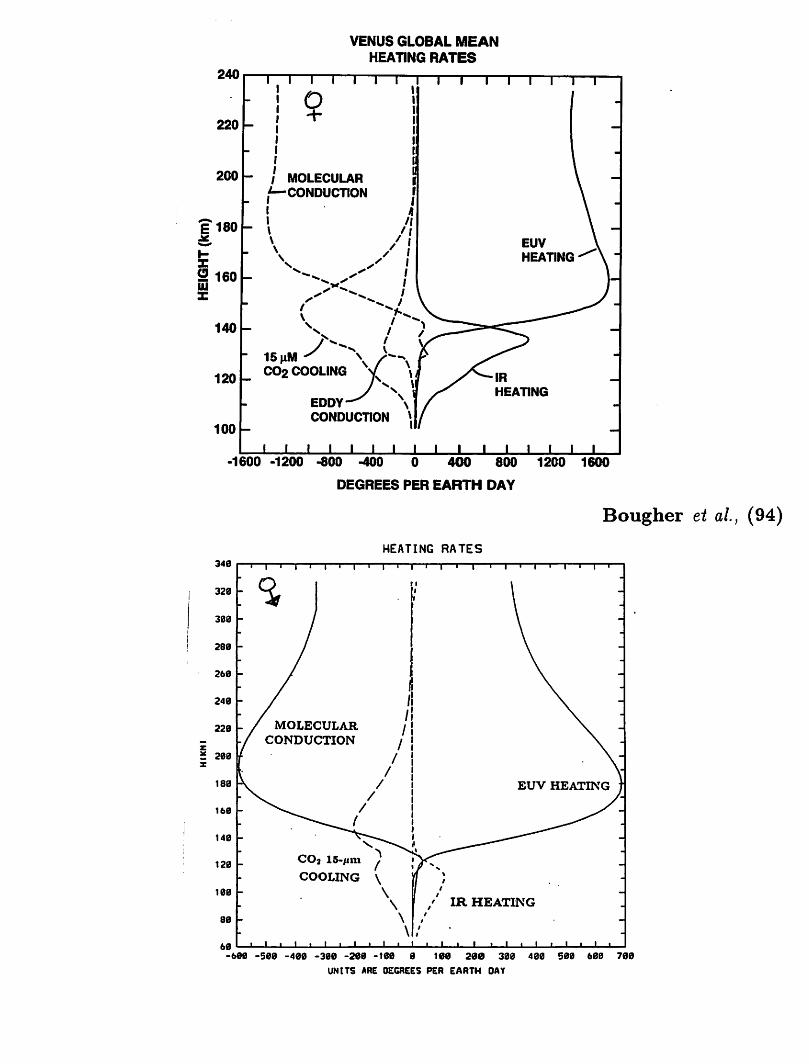
VENUS GLOBAL MEAN
HEATING RATES
240 t—i—i—r
o220
200 - / MOLECULAR'—CONDUCTION
180
2 160
140
15nM S \C02 COOLING
120 IR
HEATINGEDDY
CONDUCTION100 -
-1600J I I I I I I I I I L J L
-1200 -800 -400 0 400 800 1200 1600
DEGREES PER EARTH DAY
340
320
300
280
260
240
220
200
180
160
140
120
100
80
60-600
Bougher tt al, (94)
HEATING RATES
—T 1 ' 1 '
% 1,.,..«-....,..,'" I • «—r
i
i
*
-i—| 1—|—i—i—r- i—i—|—i—
-
\
. \
-
//
/
\
.
_ A/ MOLECULAR \k _
-/ CONDUCTION / \ -
/
/ \ "
-
/V /\^ /
EUV HEATING )
- COj 15-/mi j •-"" "
- COOLING \ 1 ' -
~ \\
J iI /
/ IR HEATING
1 i • i . i , i i i
\\
•
/
/
/
i
• i i i i i t i i i i
-500 -400 -300 -200 -100 0 100 200 300 400 500 600 700
UNITS ARE DEGREES PER EARTH DAY
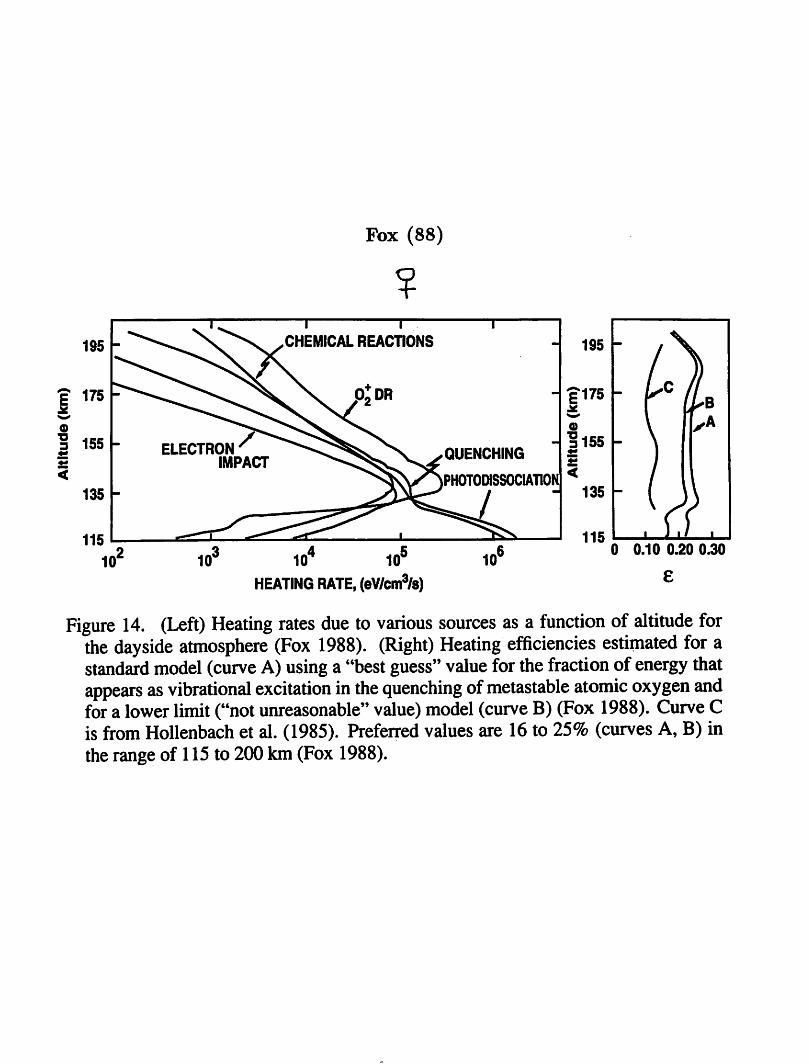
Fox (88)
?1, 1 1 1
195 ^CHEMICAL REACTIONS
I175 *vV y°2DR
T3155 ELECTRON ^
IMPACT^^QUENCHING
< ^^^\^PHOT0DISSOCIATI0N135
111!
10' 10" W W
HEATING RATE, (eV/cm3/s)10'
0.10 0.20 0.30
Figure 14. (Left) Heating rates due to various sources as a function of altitude forthe dayside atmosphere (Fox 1988). (Right) Heating efficiencies estimated for astandard model (curve A) using a"best guess" value for the fraction of energy thatappears as vibrational excitation in the quenching ofmetastable atomic oxygen andfor a lower limit ("not unreasonable" value) model (curve B) (Fox 1988). Curve Cis from Hollenbach et al. (1985). Preferred values are 16 to 25% (curves A, B) inthe range of 115 to 200 km (Fox 1988).
HE
IGH
T(km
)
oo
oo
oo
mo
mo
mo
CO
CO
CM
CM
T"
T~
om
CO
-C
M
!lll|llll|llll|llllm
i"
i'
ii
i1
11
~
i-
-*
-•--
*"8
\/O
~
:-"^—
,,
-0L
_
co
V^k_
:of/o
nI,
—,
V\
-/
zK
"^7^^-
\^
—f
CM
o™
/©
o
-*
/7
NooQ
lV'
xCO
\1
--x
—
i\i
1|
Ii
ii
i
o\
11
l\lIs
Is1
1
—
rC
MC
M
3W
0
OO
OO
Om
om
oin
co
co
CM
CM
i-
CO
CO
dZ
HE
IGH
T(km
)
oodZ
CM
om
-O
_C
M
_C
O
*_
*fr
_m<
o
CO
cdD)
;oOZOOoo
00«
3o
goin
11
11
11
iI
iI
i1
11
11
11
1I
11
-"2
-
~*
~~
.—
-^
—
:n
>z>
UJ
-
--
*
/CO
^fts^g
i1
iI
iI
11
11
11
11
11
11
1
",1. -o
IO*
IOM
-O
-C
MIO
II
Im
idk
Ii
i
>-
ozUJ
oLi_
b_
LU
OoI-
o<
IOU
JI
oCM
400
350
300
250
200
ISO
BOUGHER ET AL.: C02 COOLING ^TERRESTRIAL PLANET THERMOSPHERES
400| 1 1 r
14,619
EMPIRICALM0DEL-VIRA(KEATING el 01.85)
•NCAR 1-0
• AIRGLOW(Lya)O AIRGLOWCKe-5842)
EMPIRICALA MODEL-VTS3
(HEDIN et ol.83)
300-
150
->—J—•—I—•—I—'—T
0 PLASMA(0.8 correction)
NCAR l-D
J i 1 i I i L100130 175 220 265 310 355 400 445
FI0.7 AT VENUS
100 J i L25 35 45 55 65 75 85 95
FI0.7 (it MARS
UJor=>
UJa.
SUJI-
ccUJI0.COoXUJ
ISOO 1 1 1 1 1 i i
1400 <B)
1300
1200 -
EARTH
GM J7J^^f
IIOO
1000 -
MSIS83 ^^ :900 -
-
800
7nn i i i It 1 L
70 90 MO 130 150 170 190 210 230
10.7 cm FLUX
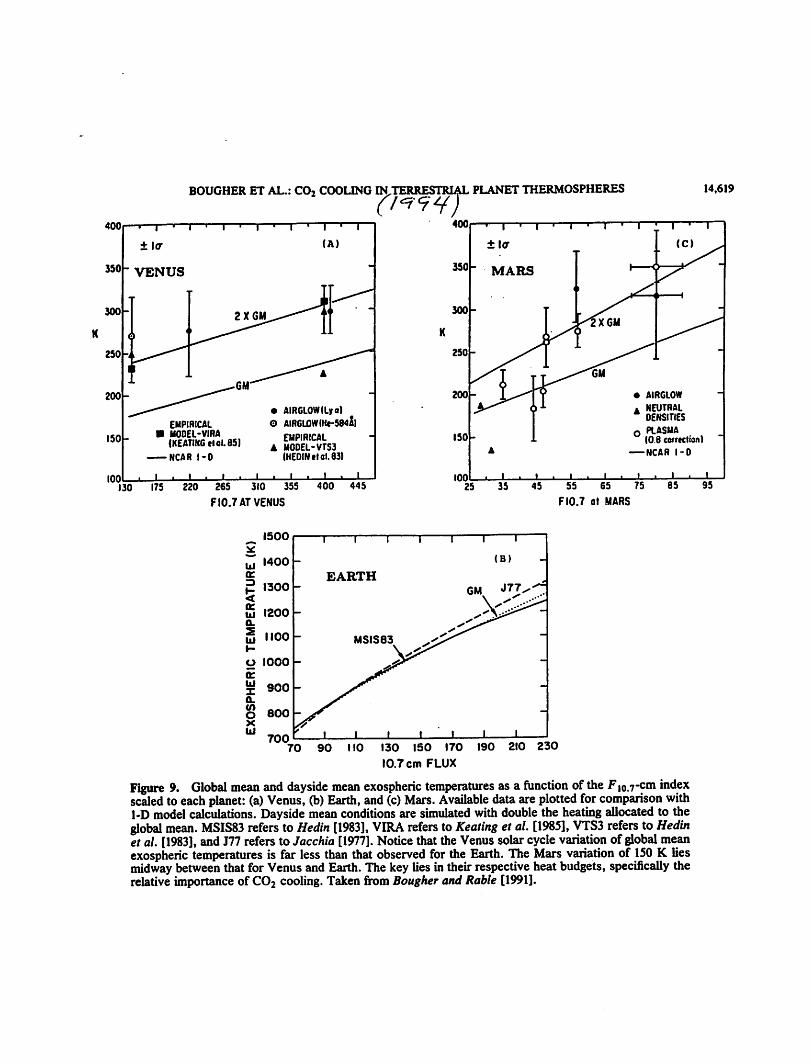
Figure 9. Global mean and dayside mean exospheric temperatures as a function of the F|07-cm indexscaled to each planet: (a) Venus, (b) Earth, and (c) Mars. Available data are plotted for comparison withl-D model calculations. Daysidemeanconditions are simulated with double the heating allocated to theglobal mean. MSIS83 refers to Hedin [1983], VIRArefers to Keating et al. [19851, VTS3 refers to Hedinet al. [1983], and J77 refers to Jacchia [1977]. Notice thattheVenus solar cyclevariation of global meanexospheric temperatures is far less than that observed for the Earth. The Mars variation of 150 K liesmidwaybetween that forVenus and Earth. The key lies in theirrespective heat budgets, specifically therelativeimportance of C02 cooling. Taken from Bougher and Rable [1991].
Mayr et al, (85)
WINDS
NO ROTATION
He SUN
WINDS
ROTATIOA
He SUN
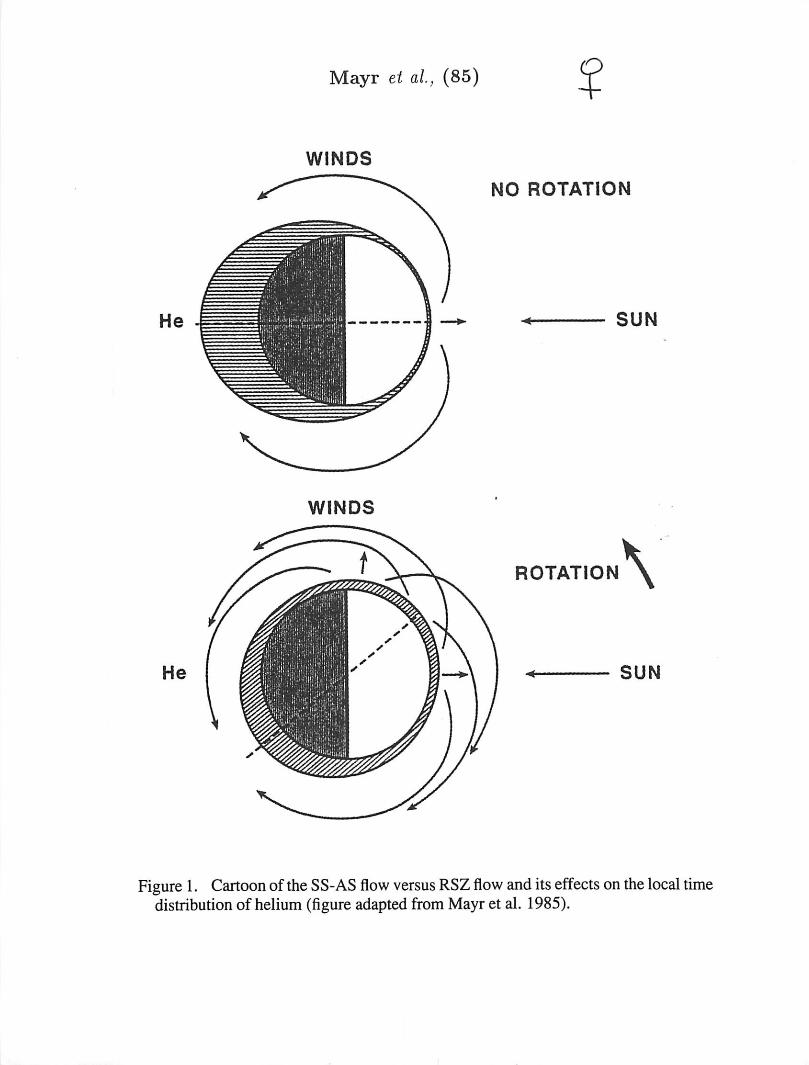
Figure 1. Cartoonof the SS-AS flow versus RSZ flow and its effects on thelocaltimedistribution of helium (figure adapted from Mayr et al. 1985).
Roble (81)
Thermosphere Circulation Modeled &
•
EQUINOX
n—i—i—i i " i i r
-
SOLSTICE
600
500
400
300
200
100
0
i i r > • ™ • • ...
i i I i I i I i I i I—i—I—i—I—I—L
i i l i I i I i I—i 1 • I • j L
fk.XJ-l 'V,^-LJ-Li,
:~^S>:m
Ui /,\i t K
hiiiWillmiHI I
A I, -Hi ; * ( N, \ \ n
n \\H
J L
S 80 60 40 20 0 20 40
LATITUDE (Degrees)
80 N
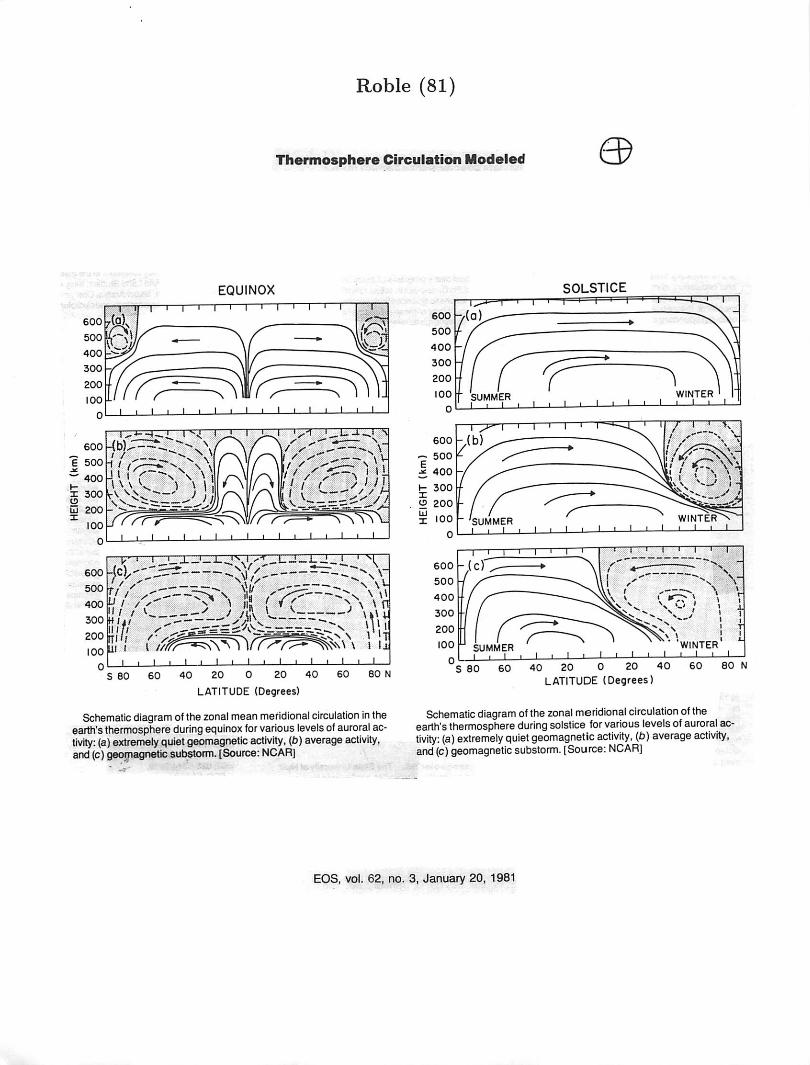
Schematic diagram ofthe zonalmean meridional circulation intheearth'sthermosphereduring equinox forvariouslevelsofauroral activity: (a)extremely quietgeomagnetic activity, (b)average activity,and (c)geomagnetic substorm. [Source: NCAR]
600 -/(a)500
S 80 60 40 20 0 20 40
LATITUDE (Degrees)80 N
Schematic diagram ofthe zonal meridional circulation oftheearth's thermosphere during solstice for various levelsofauroral activity: (a) extremely quiet geomagnetic activity, (6) average activity,and(c)geomagnetic substorm. [Source: NCAR]
EOS, vol. 62, no. 3, January 20, 1981
4001
N
X01
350E£
01
300
< 250
CO
-200
oo>CO
COo
I
150
100
Kasprzak et al, (97)
?— — -Earth based CO microwave
PVO Ultraviolet Spectrometer (UVS)
PVONeutral Mass Spectrometer (NMS)
Atmospheric Drag (AD)Ion Mass Spectrometer (IMS)
• 50CO
78 79 80 81 82 83 84 85 86 87 88 89 90 91 92 93 94
Year
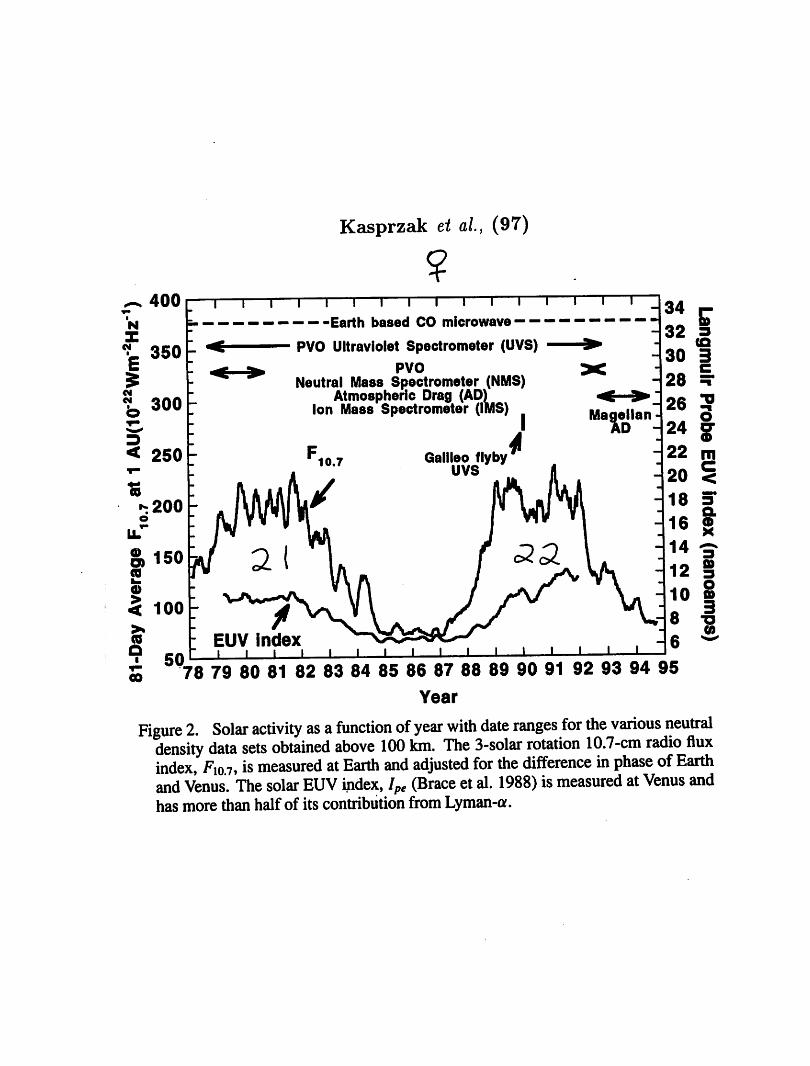
Figure 2. Solar activity as afunction of year with date ranges for the various neutraldensity data sets obtained above 100 km. The 3-solar rotation 10.7-cm radio fluxindex, Fl01, is measured at Earth and adjusted for the difference in phase of Earthand Venus. The solar EUV index, Ipe (Brace et al. 1988) is measured at Venus andhas more than half of its contribution from Lyman-a.
i_
3
2
a.
E0)
gIT
©Q.
E0)
400
350
300 :
250 1
200
150
100
140
130
120
110
100
90
80
50
Kasprzak et al, (97)
DAY
X
O
ft
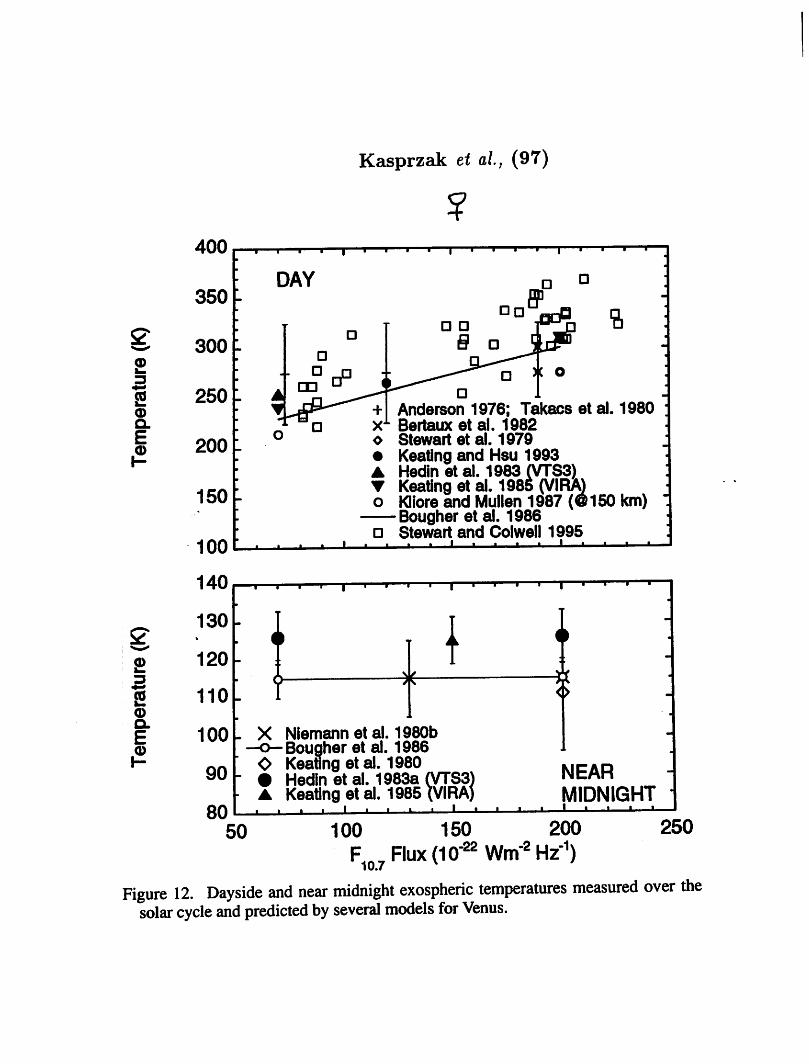
Anderson 1976; Takacs et al. 1980x1 Bertauxetal. 1982o Stewart etal. 1979• Keating and Hsu 1993• Hedin etal. 1983 (VTS3)• Keating et al. 1985 (VIRA)o Kliore and Mullen 1987 (@150 km)
Bougher et al. 1986• Stewart and Colwell 1995
• • • i i i i—i—i—i—i—•—•-
\
Niemann etal. 1980bBougher etal. 1986Keating etal. 1980Hedin etal. 1983a (VTS3)Keating etal. 1985 (VIRA)
» i—i—i—i—«-
NEARMIDNIGHT
100 150 200
F Flux (10*2 Win"8 Hi-1)250
Figure 12. Dayside and near midnight exospheric temperatures measured over thesolar cycle and predicted by several models for Venus.
Kasprzak et al, (97)
$SOLAR ACTIVITY BEHAVIOR OFTHE THERMOSPHERE
360
~ 320 L
£ 280
240T 180
to
i 160> J23 gS t> 140 \-
"o 120"•" 275
\k = 225
"•? 175
• •
•••• •
J L
-cr
•%
J L
_L J. X
ONMSSMAX J
• • •
"V
' ' I L
•jf
*.V
**^e
JL125
ORBIT NO: 355 365 375 385 395 405 415 425 435 445 455 465
LST 6:01 7:05 8:08 9:18 10:18 11:19 12:23 13:28 14:32 15:37 16:48 17:53 HH:MM
15
10
* 5IS 0
-5 Y
-10
LST 7:00 7:00
•••••
'••*
9:00
»••*
v*
11:00
OAD
-••*V.. SMAX•^
-„«'•
13:00 15:00 17:00 HH:MM
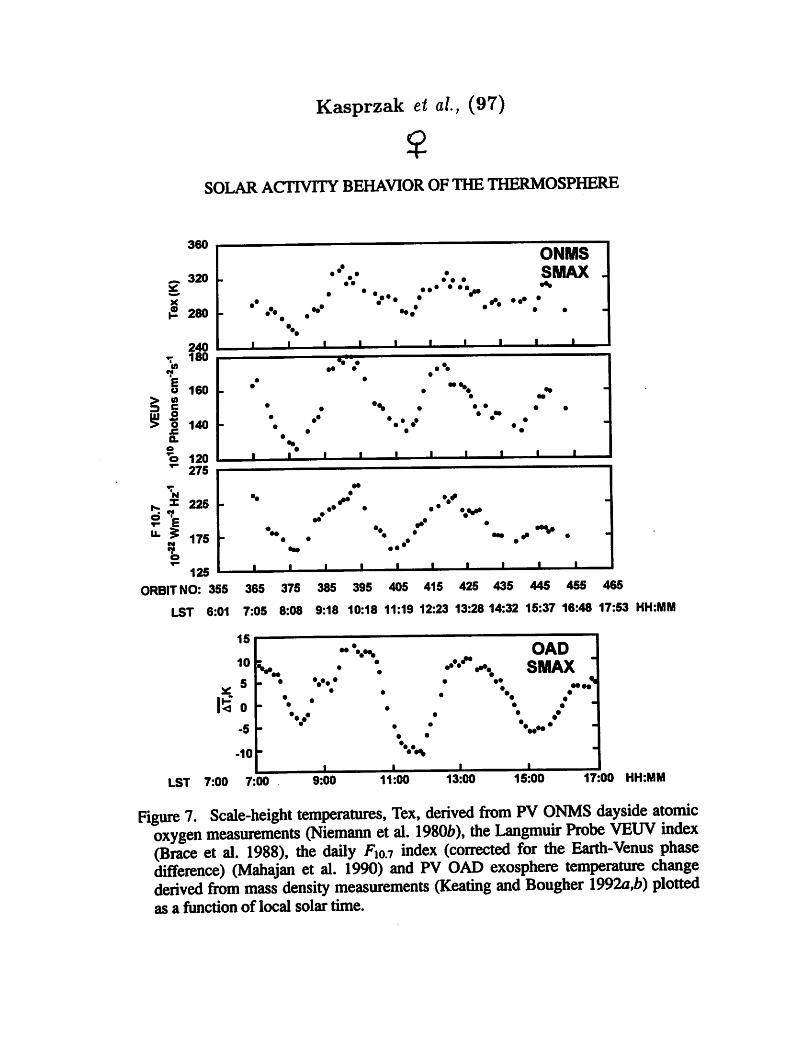
Figure 7. Scale-height temperatures, Tex, derived from PV ONMS dayside atomicoxygen measurements (Niemann et al. 19806), the Langmuir Probe VEUV index(Brace et al. 1988), the daily F10.7 index (corrected for the Earth-Venus phasedifference) (Mahajan et al. 1990) and PV OAD exosphere temperature changederived from mass density measurements (Keating and Bougher 1992a,b) plottedas a function of local solar time.
Hedin et al, (83) VTS3
50 l»i'—"—J—l—i-0 6
i • i i • t i i i i—1_
12 18
HOUR ANGLE (hrs)
24
£ 106
107
105
10d
' i i I i I I I I—I—L
' ' " ' 'iBO'Km'EQUATOR
• ' ' ' I—I—I L
i i i i i I i ' ' i • I i • ' ' ' I ' lAnVr.
EQUATOR.
i j i •• h—r i i I i i • i i T
6 12 18
HOUR ANGLE (hrs)
• ' '-J
24
0
Keating et al, (98) VIRA98
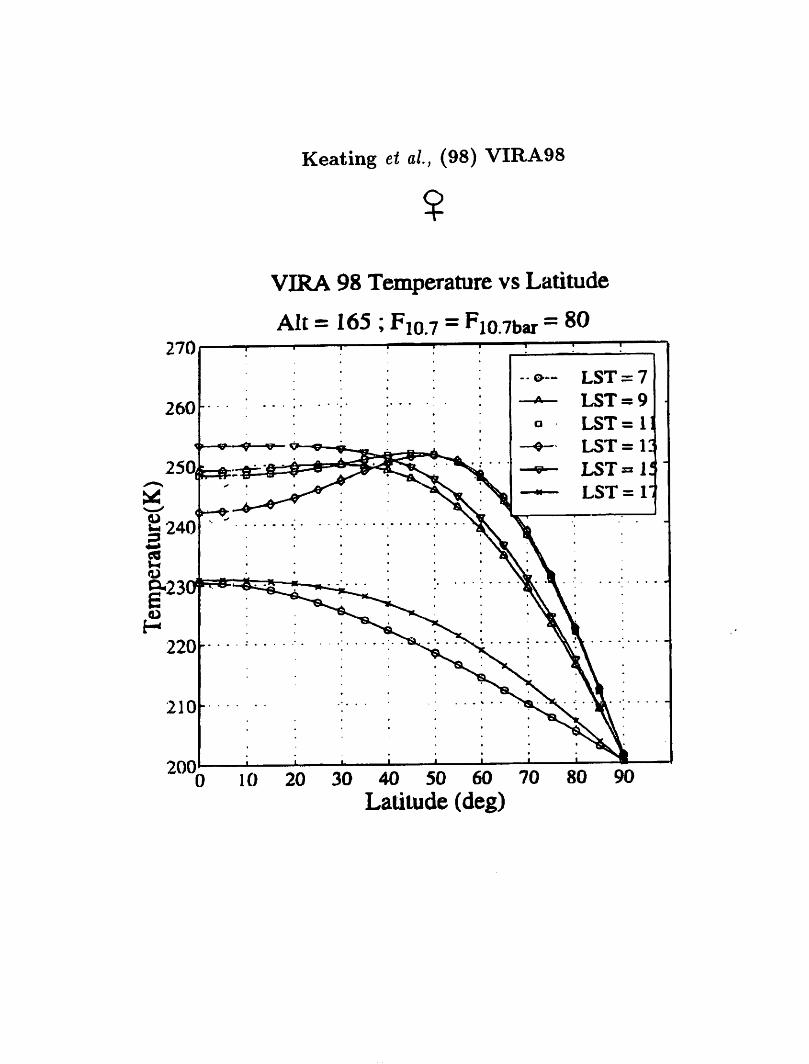
VIRA 98 Temperature vs Latitude
Alt = 165 ; F10.7 = Fi0.7bar = 80
10 20 30 40 50 60 70 80 90
Latitude (deg)
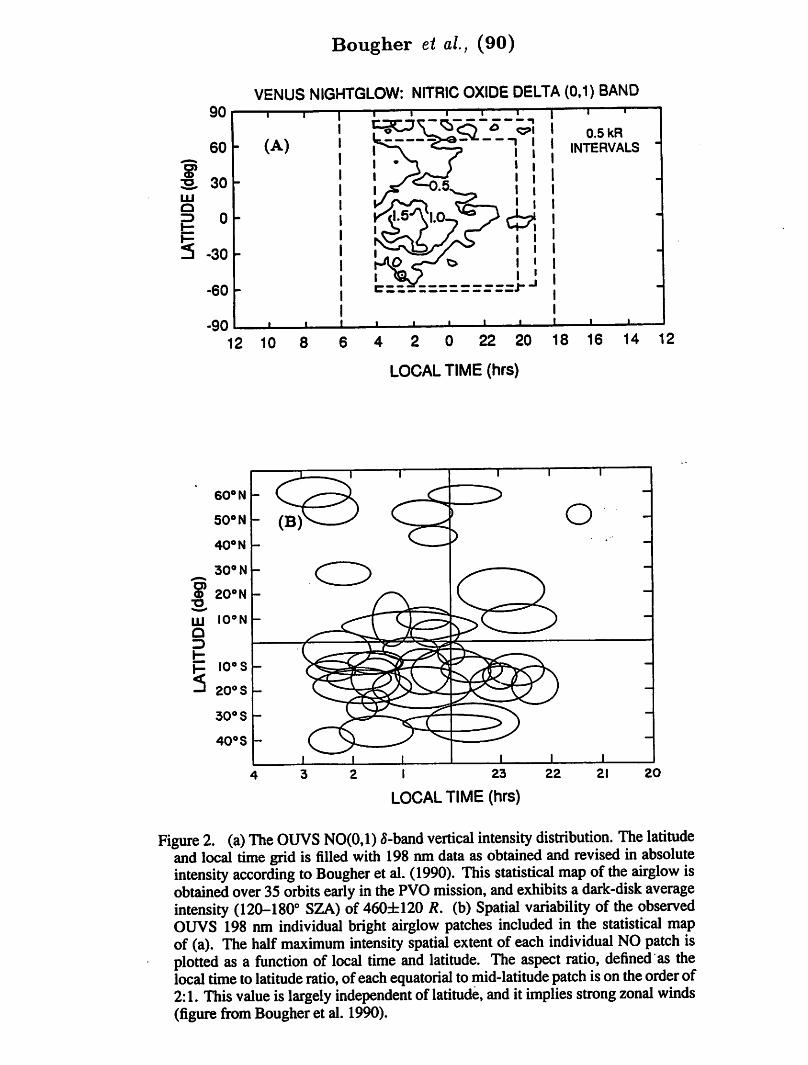
Bougher et al, (90)
VENUS NIGHTGLOW: NITRIC OXIDE DELTA (0,1) BAND
12 10 8 6 4 2 0 22 20 18 16 14 12
LOCAL TIME (hrs)
I 23
LOCAL TIME (hrs)
20
Figure 2. (a) The OUVS NO(0,1) 5-band vertical intensity distribution. The latitudeand local time grid is filled with 198 nm data as obtained and revised in absoluteintensity according to Bougher et al. (1990). This statistical map of the airglow isobtained over 35 orbits early in thePVO mission, and exhibits a dark-disk averageintensity (120-180° SZA) of 460±120 R. (b) Spatial variability of the observedOUVS 198 nm individual bright airglow patches included in the statistical mapof (a). The halfmaximum intensity spatial extent of each individual NO patch isplotted as a function of local time and latitude. The aspect ratio, defined as thelocal timeto latitude ratio, of each equatorial to mid-latitude patch is ontheorder of2:1. This value is largely independent of latitude, and it implies strong zonal winds(figure from Bougher et al. 1990).
I 1.40
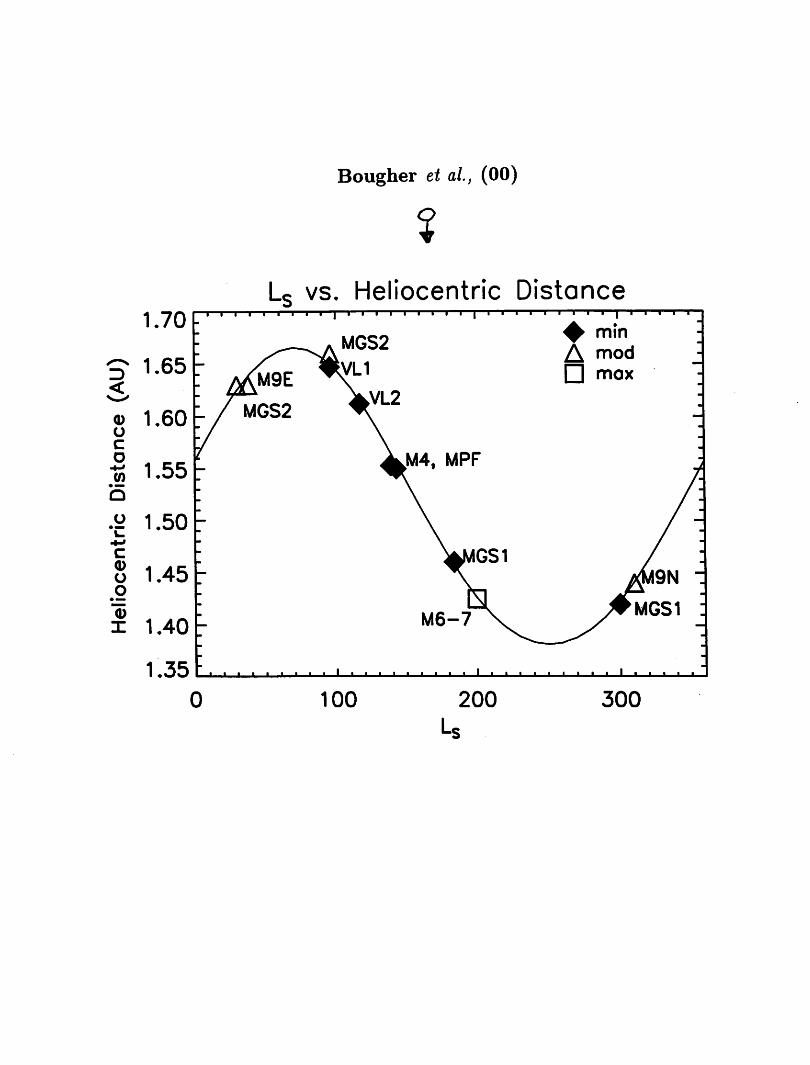
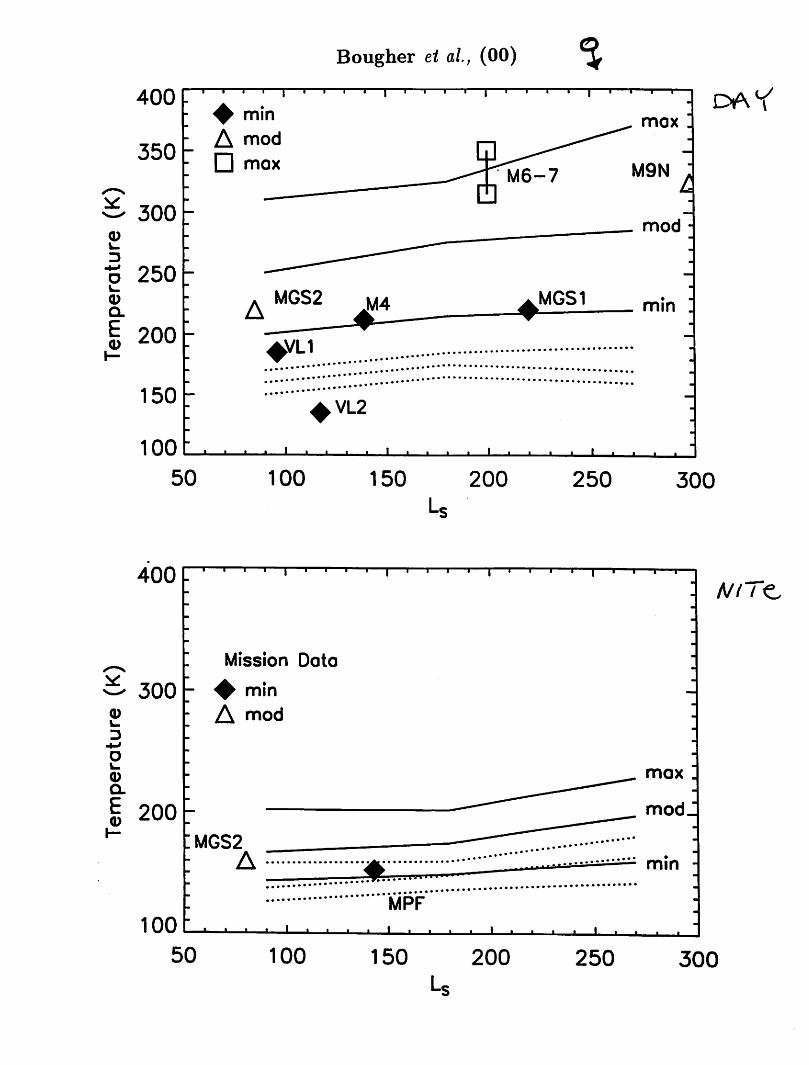
Bougher et al, (00)
%
Ls vs. Heliocentric Distancei i i i i i i i i i i i i i
^ min
• max
i .oo r i i i i i i i—i__i_ * * * —i • • • i . . . .
100 200 300
Booc, he.*- -jA*^2- (Zodo
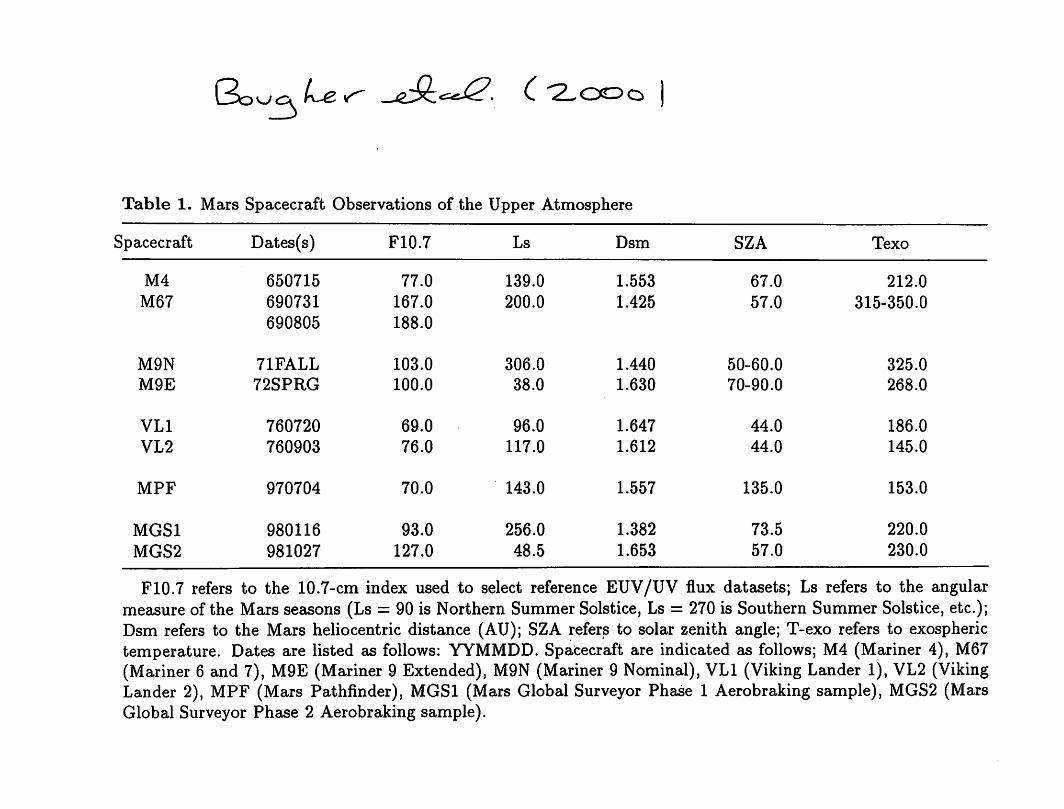
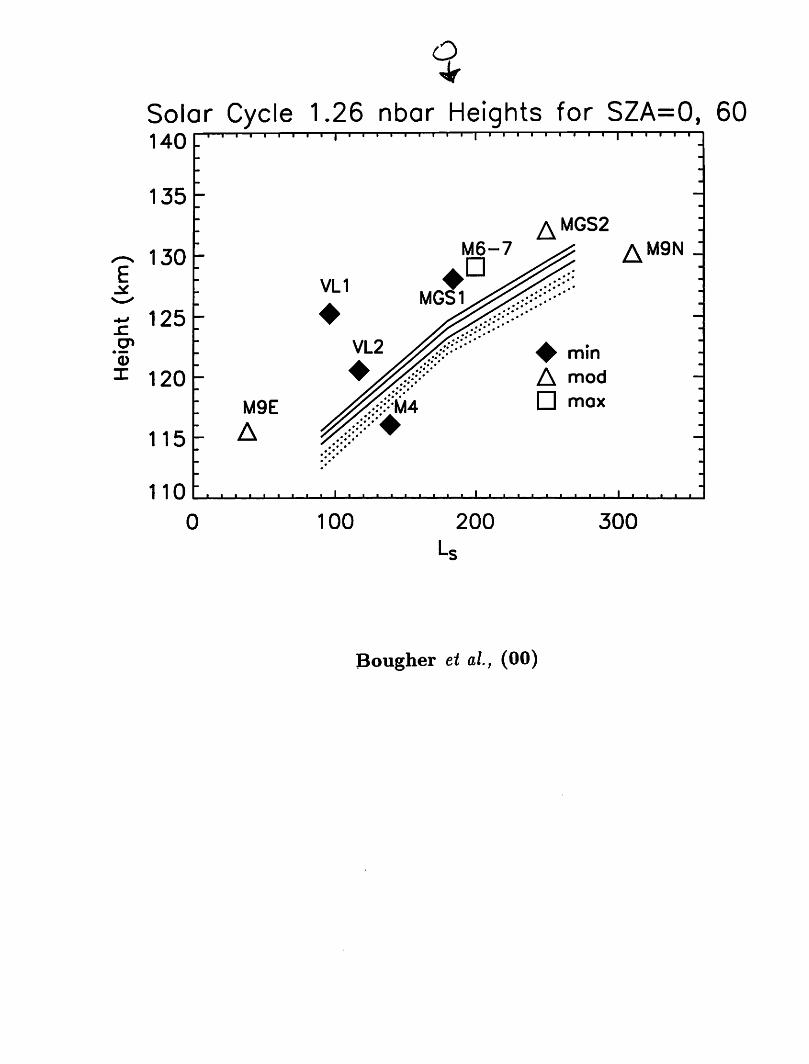
Table 1. Mars Spacecraft Observations of the Upper Atmosphere
Spacecraft Dates(s) F10.7 Ls Dsm SZA Texo
M4 650715 77.0 139.0 1.553 67.0 212.0
M67 690731
690805
167.0
188.0
200.0 1.425 57.0 315-350.0
M9N 71FALL 103.0 306.0 1.440 50-60.0 325.0
M9E 72SPRG 100.0 38.0 1.630 70-90.0 268.0
VLl 760720 69.0 96.0 1.647 44.0 186.0
VL2 760903 76.0 117.0 1.612 44.0 145.0
MPF
MGSl
MGS2
970704
980116
981027
70.0
93.0
127.0
143.0
256.0
48.5
1.557
1.382
1.653
135.0
73.5
57.0
153.0
220.0
230.0
F10.7 refers to the 10.7-cm index used to select reference EUV/UV flux datasets; Ls refers to the angularmeasure of the Mars seasons (Ls = 90 is Northern SummerSolstice, Ls = 270 is Southern Summer Solstice, etc.);Dsm refers to the Mars heliocentric distance (AU); SZA refers to solar zenith angle; T-exo refers to exospherictemperature. Dates are listed as follows: YYMMDD. Spacecraft are indicated as follows; M4 (Mariner 4), M67(Mariner 6 and 7), M9E (Mariner 9 Extended), M9N (Mariner 9 Nominal), VLl (Viking Lander 1), VL2 (VikingLander 2), MPF (Mars Pathfinder), MGSl (Mars Global Surveyor Phase 1 Aerobraking sample), MGS2 (MarsGlobal Surveyor Phase 2 Aerobraking sample).
200 r\f—r
180 h
160
140
120 -
.100 -
80 -
60 -
40
20
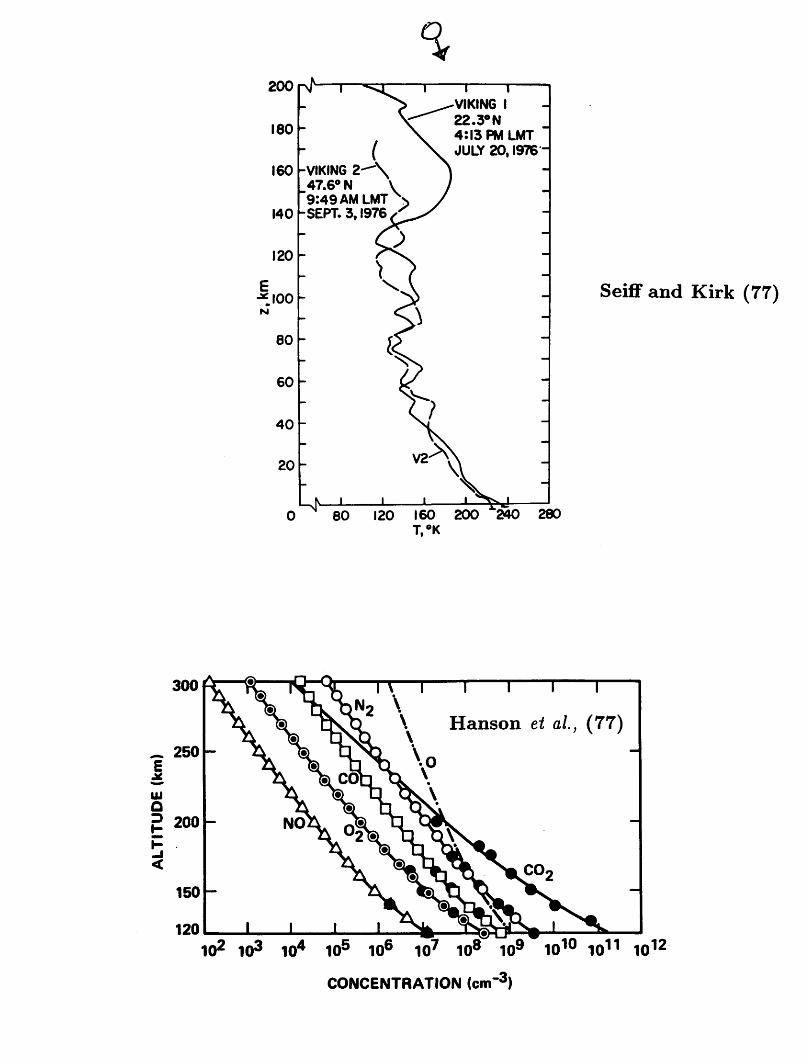
VIKING 2-\47.6° N V9I49AMLMTXSEPT. 3,1976 -'
%~1 1
VIKING I
22.3° N
4:13 PM LMTJULY 20,1976
•^N 60 120 160 200 240 280T,°K
Seiff and Kirk (77)
Hanson et al, (77)
102 IO3 IO4 105 IO6 107 IO8 109 1010 IO11 IO12
CONCENTRATION (cm"3)
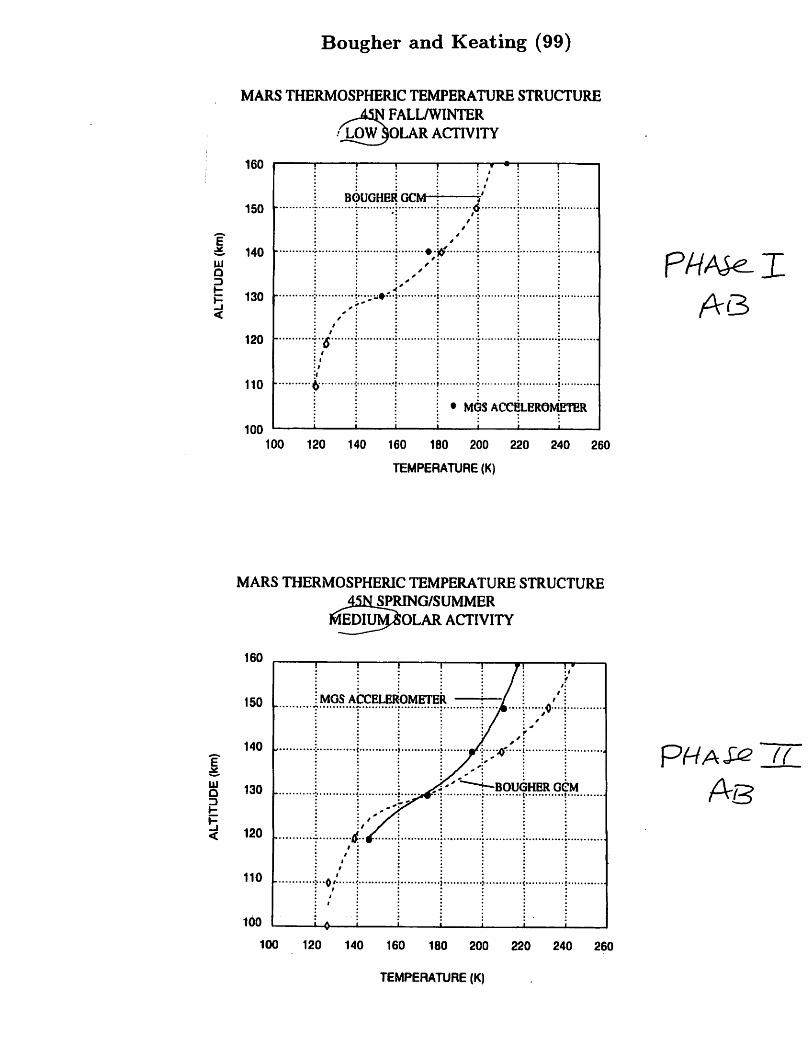
Bougher and Keating (99)
MARS THERMOSPHERIC TEMPERATURE STRUCTURE
^45N FALL/WINTERXOW^OLAR ACTIVITY
160 » f • i
150BOUGHER GCM-
E£. 140UJQD
p 130
kr-
E
UJQDH
H
120
110 •
100
• MGS ACX^LEROMETER
i I i
100 120 140 160 180 200 220 240 260
TEMPERATURE (K)
MARS THERMOSPHERIC TEMPERATURE STRUCTURE
.SPRING/SUMMER
lEDIUMSOLAR ACTIVITY
160
150 .
i ! ! ! "! T 1 »• /
ir•'•
1 '•t '•
*~i
> •
: Mua AL.CIXUKUMC 1 UK ! /
1^^<K '̂"^-BOUCJHER GGM
I !<;/i 1: * : .* : :: i : ; ; ;: » : '. \ :'. ' '. : : :: » : : : :
: i : : ; ;: i ; : ; ;: i : : ; ;
1—A i i i i I i
140 .
130 .
120 .
110 .
100
100 120 140 160 180 200 220 240 260
TEMPERATURE (K)
A3
As
400 r
350
=- 300
I 250u
<DQ.
I 200
150
100
50 100
Bougher et al, (00) ^
VL2
J I L.
150 200
Ls
j L
250
DAYmox .
_ mm .
300
400L " " ' " t—'—«—"—•—r T 1 1 1 1 1 1 1 I I
3
Mission Data
300 h ♦ minA mod
50 100 150 200
L.
N(T^
mm -
i L
250 300
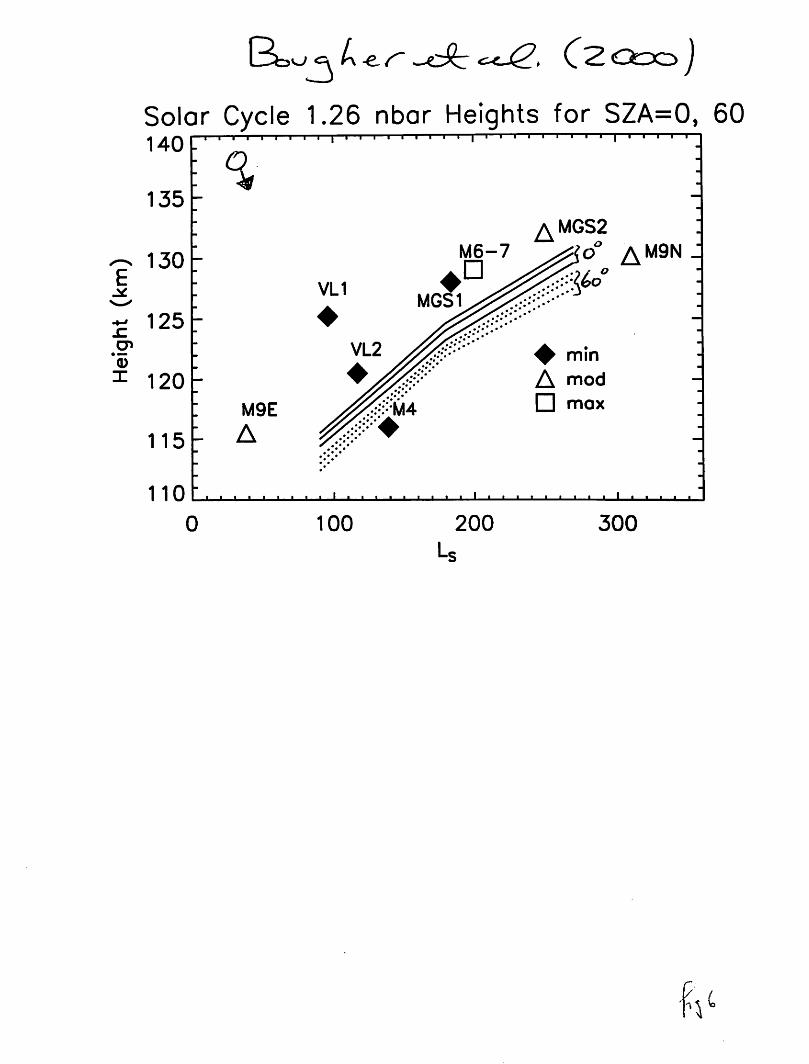
Solar Cycle 1.26 nbar Heights for SZA=0, 60t—i—i—|—i—i—i—i—i—i—i—i—i—|—i—i—i—i—r
E
140
135
130
£ 125
T 120
115
T 1 1 I I I I 1 1 1 I I
M9E
A
unr 1 « • * u_L
0 100 200
MGS2
^M9N J
'•'•'• • -i—L • • • •
300
fa
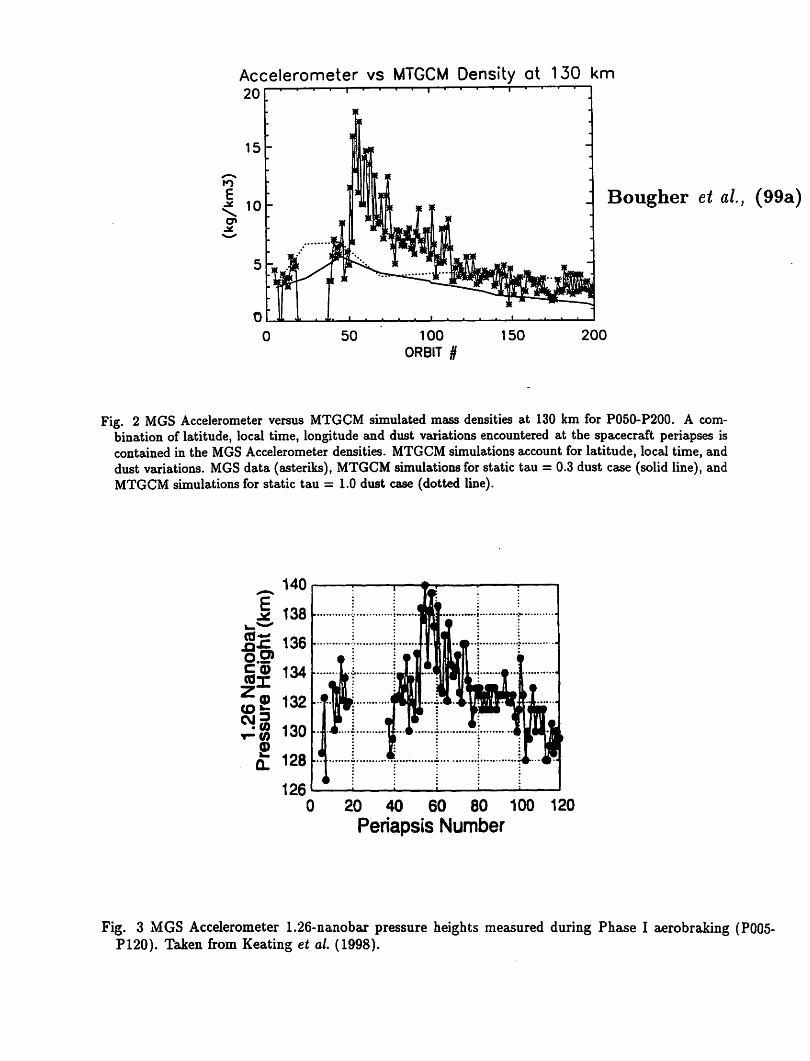
Accelerometer vs MTGCM Density at 130 km20
¥fI
15 1^w ~"
illilL
E
< 102C
-Tl||m -
""""' 5jy i j *uTRfl»flllL ILLw •• ifflU » **»UlT ww
5 —
0
Bougher etf al, (99a)
50 100
ORBIT #150 200
Fig. 2 MGS Accelerometer versus MTGCM simulated mass densities at 130 km for P050-P200. A combination of latitude, local time, longitude and dust variations encountered at the spacecraft periapses iscontained in the MGS Accelerometer densities. MTGCM simulations account for latitude, local time, anddust variations. MGS data (asteriks), MTGCM simulations for static tau = 0.3 dust case (solid line), andMTGCM simulations for static tau =1.0 dust case (dotted line).
20 40 60 80 100 120
Periapsis Number
Fig. 3 MGS Accelerometer 1.26-nanobar pressure heights measured during Phase I aerobraking (P005-P120). Taken from Keating et al. (1998).
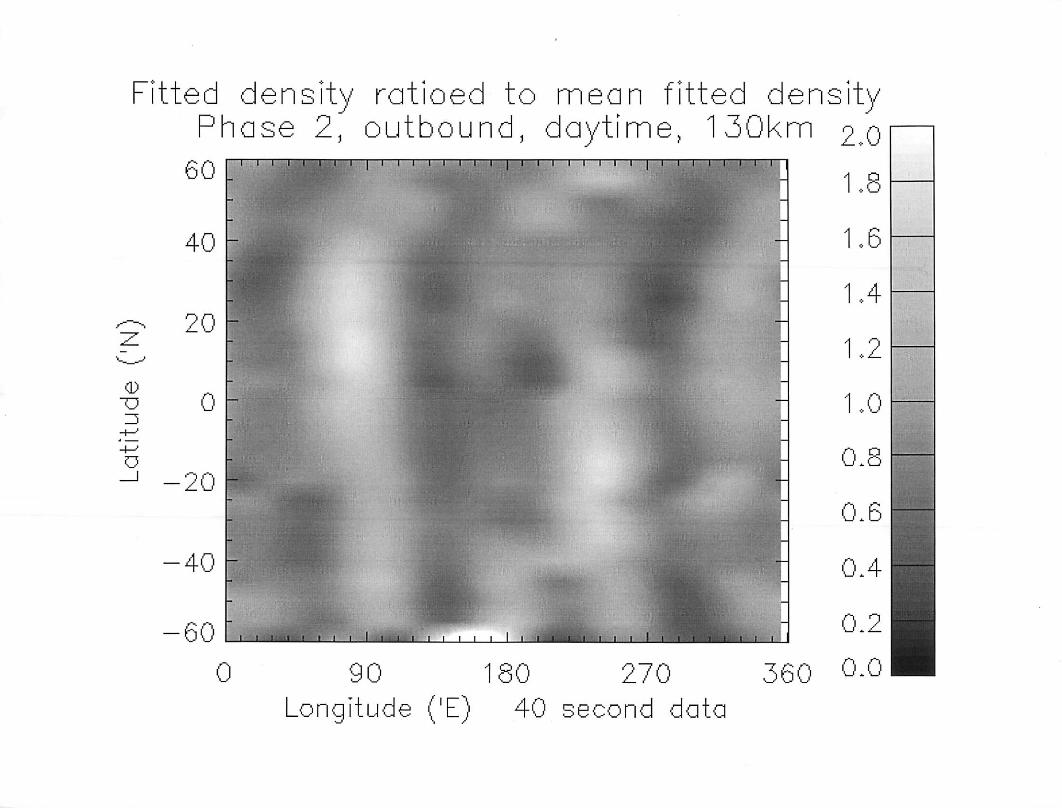
Fitted density ratioed to mean fitted density
CD
13
O
Phase 2, outbound, daytime, 130km 2.060
t~1—r
40
20
0
-20
-40
-60 j 1
—i—I—1—1—1—1—1—1—1—1—1—1—1—1—1—1—1—r
j 1 1 I j 1 1 1 1 1 I 1
1.8
1.6
1.4
1.0
U. O
0.6
0.4
0.2
0 90 180 270 360 °-°Longitude ('E) 40 second data
I
E_*:
en
wcCD
100.00 F
10.00
1.00
0.10
0.01
0
M65
Wave—5 fit to outbound densitiesPhase 2, 0 to 10 'N, 40 second data, daytime
t—i—i—i—i—r t—i—i—i—j—i—i-1—i—i—i—i—i—i—r t—i—i—i—i—i—i—i—z
_!__! I I I I I 1 1 1 1 1 1 1 1 L '•••'• I I I I 1 1 1 1 1 1 1 L
30
+• =
180
Longitude ('E)MGS data, solid line = least squares wave-5 fit,dotted lines = 1 sigma uncertainty in fit,
levels = 120 130 140 150 km
270 360
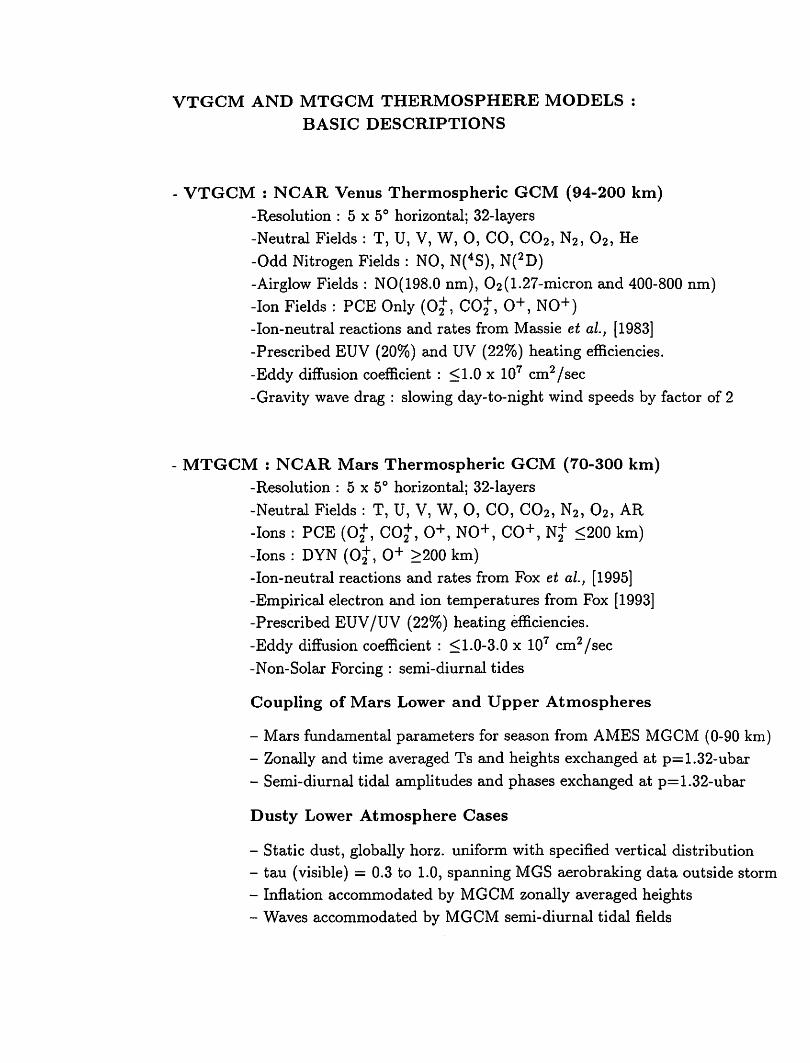
VTGCM AND MTGCM THERMOSPHERE MODELS :
BASIC DESCRIPTIONS
VTGCM : NCAR Venus Thermospheric GCM (94-200 km)-Resolution : 5 x 5° horizontal; 32-layers
-Neutral Fields : T, U, V, W, 0, CO, C02, N2, 02, He
-Odd Nitrogen Fields : NO, N(4S), N(2D)-Airglow Fields : NO(198.0 nm), O2(1.27-micron and 400-800 nm)-Ion Fields : PCE Only (Of, COf, 0+, NO+)-Ion-neutral reactions and rates from Massie et al., [1983]-Prescribed EUV (20%) and UV (22%) heating efficiencies.-Eddy diffusion coefficient : <1.0 x 107 cm2/sec-Gravity wave drag : slowing day-to-night wind speeds by factor of 2
MTGCM : NCAR Mars Thermospheric GCM (70-300 km)
-Resolution : 5 x 5° horizontal; 32-layers
-Neutral Fields : T, U, V, W, 0, CO, C02, N2, 02, AR
-Ions : PCE (Of, COf, 0+, N0+, CO+, Nf <200 km)-Ions : DYN (Of, 0+ >200 km)-Ion-neutral reactions and rates from Fox et al., [1995]-Empirical electron and ion temperatures from Fox [1993]-Prescribed EUV/UV (22%) heating efficiencies.-Eddy diffusion coefficient : <1.0-3.0 x 107 cm2/sec-Non-Solar Forcing : semi-diurnal tides
Coupling of Mars Lower and Upper Atmospheres
- Mars fundamental parameters for season from AMES MGCM (0-90 km)- Zonally and time averaged Ts and heights exchanged at p=1.32-ubar
- Semi-diurnal tidal amplitudes and phases exchanged at p=1.32-ubar
Dusty Lower Atmosphere Cases
- Static dust, globally horz. uniform with specified vertical distribution
- tau (visible) = 0.3 to 1.0, spanning MGS aerobraking data outside storm- Inflation accommodated by MGCM zonally averaged heights
- Waves accommodated by MGCM semi-diurnal tidal fields
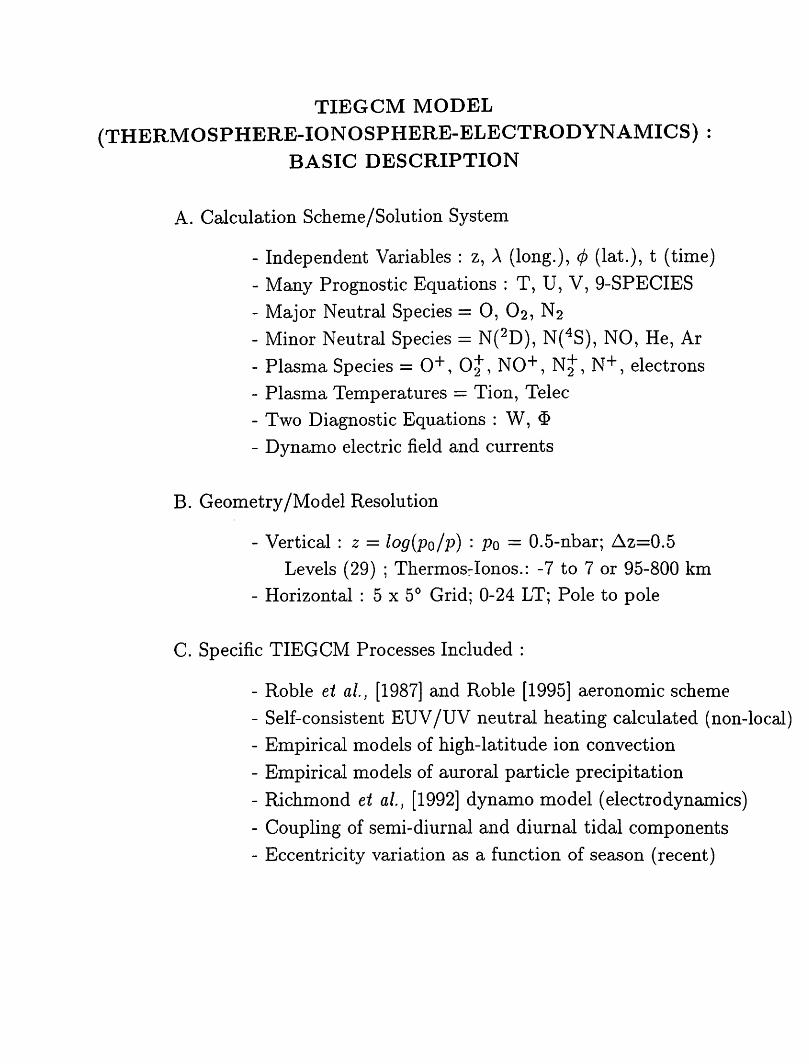
TIEGCM MODEL
(THERMOSPHERE-IONOSPHERE-ELECTRODYNAMICS) :BASIC DESCRIPTION
A. Calculation Scheme/Solution System
- Independent Variables : z, A (long.), 4> (lat.), t (time)- Many Prognostic Equations : T, U, V, 9-SPECIES- Major Neutral Species = 0, O2, N2- Minor Neutral Species = N(2D), N(4S), NO, He, Ar- Plasma Species = 0+, Of, N0+, Nf, N+, electrons- Plasma Temperatures = Tion, Telec
- Two Diagnostic Equations : W, $
- Dynamo electric field and currents
B. Geometry/Model Resolution
- Vertical : z = log(po/p) : po = 0.5-nbar; Az=0.5Levels (29) ; Thermos-Ionos.: -7 to 7 or 95-800 km
- Horizontal : 5 x 5° Grid; 0-24 LT; Pole to pole
C. Specific TIEGCM Processes Included :
- Roble et al, [1987] and Roble [1995] aeronomic scheme- Self-consistent EUV/UV neutral heating calculated (non-local)- Empirical models of high-latitude ion convection
- Empirical models of auroral particle precipitation
- Richmond et al, [1992] dynamo model (electrodynamics)- Coupling of semi-diurnal and diurnal tidal components- Eccentricity variation as a function of season (recent)
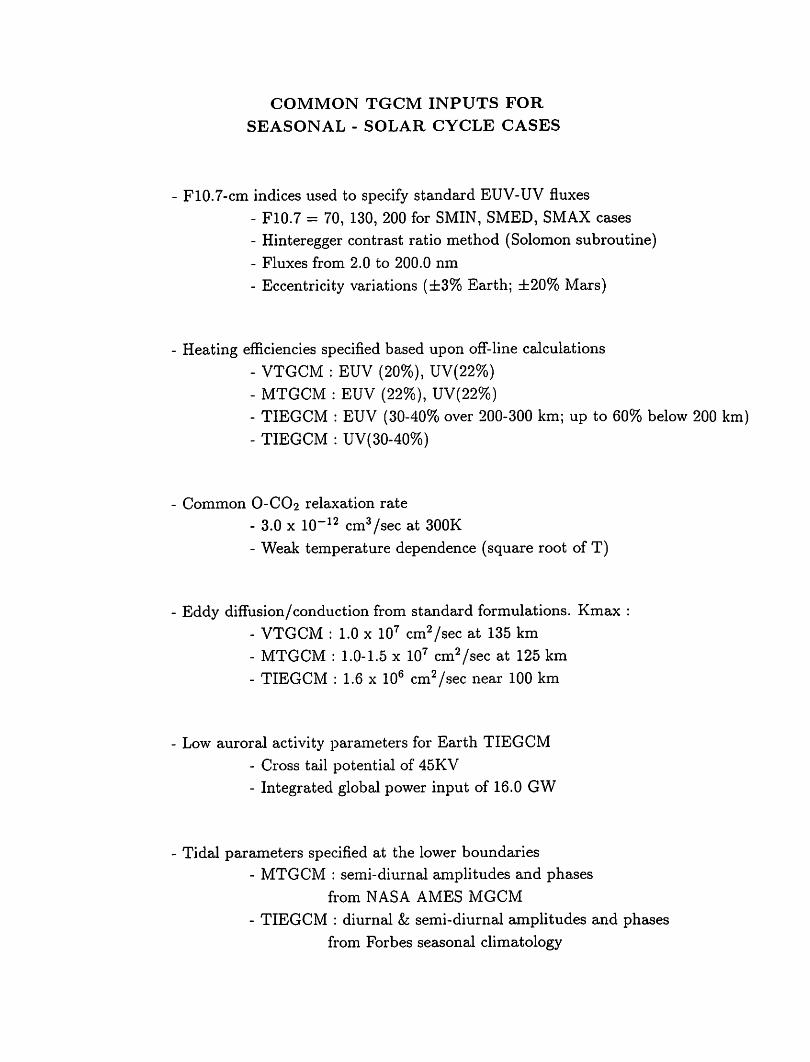
COMMON TGCM INPUTS FOR
SEASONAL - SOLAR CYCLE CASES
F10.7-cm indices used to specify standard EUV-UV fluxes
- F10.7 = 70, 130, 200 for SMIN, SMED, SMAX cases
- Hinteregger contrast ratio method (Solomon subroutine)
- Fluxes from 2.0 to 200.0 nm
- Eccentricity variations (±3% Earth; ±20% Mars)
- Heating efficiencies specified based upon off-line calculations- VTGCM : EUV (20%), UV(22%)- MTGCM : EUV (22%), UV(22%)- TIEGCM : EUV (30-40% over 200-300 km; up to 60% below 200 km)
- TIEGCM : UV(30-40%)
Common O-CO2 relaxation rate
- 3.0 x 10⁻¹² cm3/sec at 300K- Weak temperature dependence (square root of T)
Eddy diffusion/conduction from standard formulations. Kmax
- VTGCM : 1.0 x 107 cm2/sec at 135 km- MTGCM : 1.0-1.5 x 107 cm2/sec at 125 km- TIEGCM : 1.6 x 106 cm2/sec near 100 km
Low auroral activity parameters for Earth TIEGCM
- Cross tail potential of 45KV
- Integrated global power input of 16.0 GW
Tidal parameters specified at the lower boundaries
- MTGCM : semi-diurnal amplitudes and phases
from NASA AMES MGCM
- TIEGCM : diurnal & semi-diurnal amplitudes and phases
from Forbes seasonal climatology
L5o w cu k e. _^£r-o2 . C ( *? 9 <r )
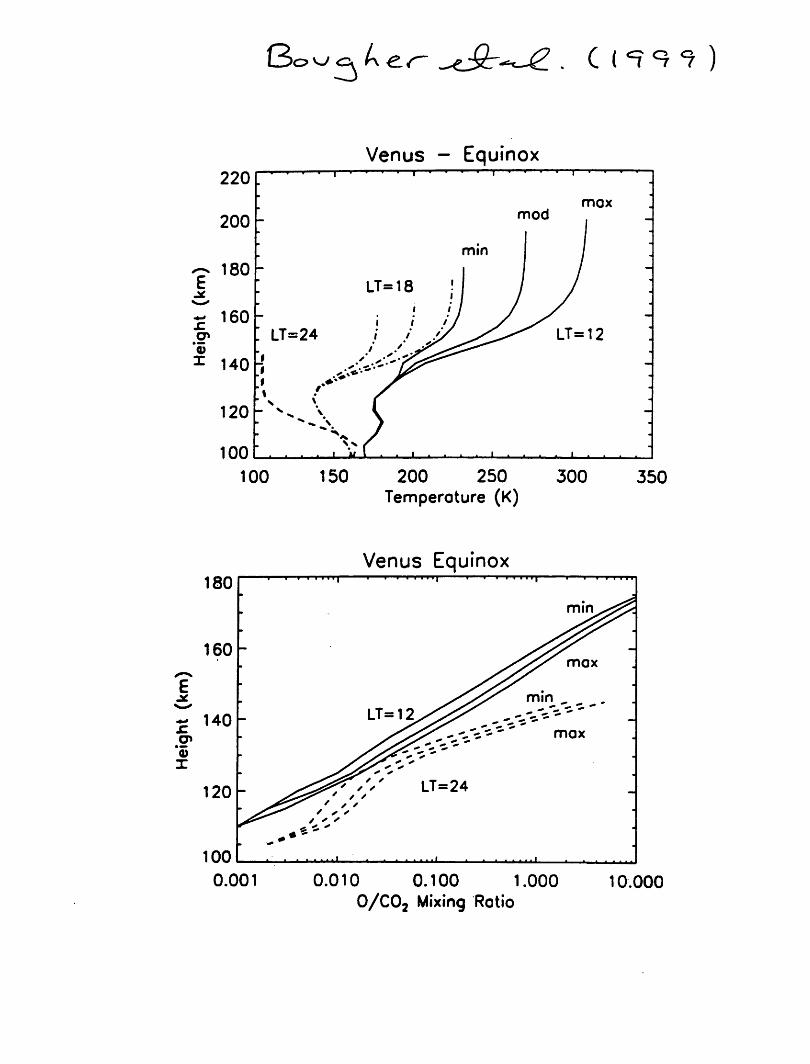
Venus - Equinox220
,....,...
-
•
mox*
200 -
mod-
min /•
*- 180 -
E LT=18 j-
^ 160 -
^
o* : LT=24 i / y ^/^^ LT=12 ]'55 / / y^* .
1 140'%~%
-
120 -
*^ y .
\ x X
100 . i,.. i i 1* I . . 1 . .
100 150 200 250 300
Temperoture (K)350
Venus Equinox180
min^^S
160 .x^^^ —>^/^mox
E
*-«
.C
I
140 -
>^// min „
120 s£&?/'' LT=24
•— / ' '
100
0.001 0.010 0.100 1.000
0/C02 Mixing Rotio10.000
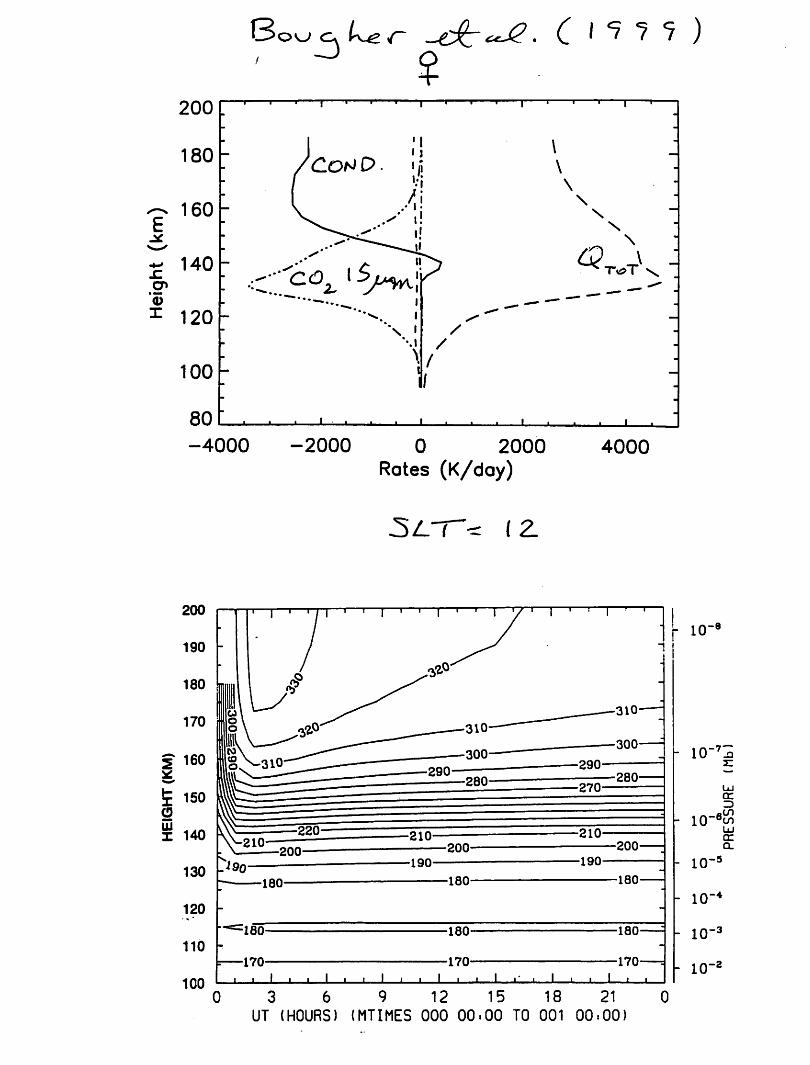
200 1 « """I ' • T-^-T «" '"• r" 1 i i i i i
180 1 I' i :\
/ »:i \
~ 160 - 1 A \
E N.* \
- 140
"55
1 120
^ T<a>T \
's i / -
\i / .
>* 1
\
.
100 - i—
80 —, . . 1_^_,—,__ i ... i _,—J . i
•4000 -2000 0 2000
Rotes (K/day)
Sirr* iz.
4000
i . 1 17-1—1—1—1—j—r
-8r 10
3 6 9 12 15 18 21
UT (HOURS) (MTIMES 000 00.00 TO 001 00.00
-T- 10
- 10
10
10
10
10
crz>COCOLUcr
-6
-5
-4
-3
-2
CDLU
Q
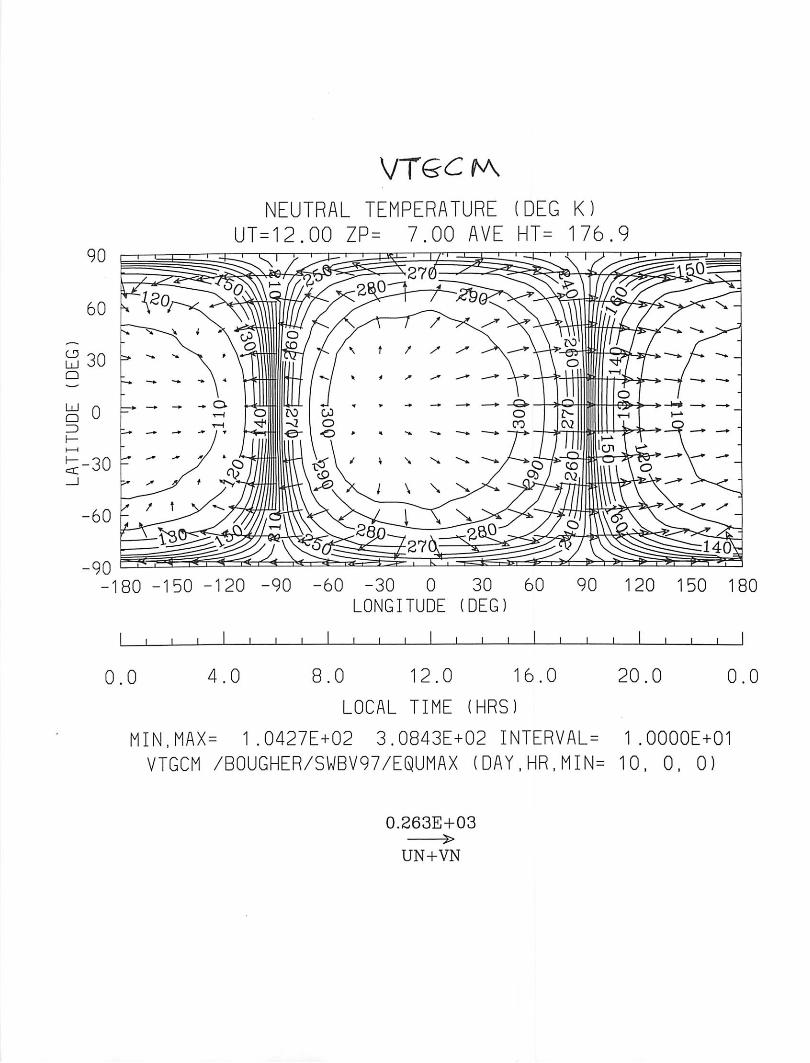
90
60
30
S 0
cC -30 -
-60 -
-90
VTC^fA
NEUTRAL TEMPERATURE (DEG K)
UT=12.00 ZP= 7.00 AVE HT= 176.9
-180 -150 -120 -90 -60 -30 0 30 60 90 120 150 180LONGITUDE (DEG)
J L
0.0 4.0
_| I J L I I I I I l J I L
8.0 12.0 16.0
LOCAL TIME (HRS)
MIN,MAX= 1.0427E+02 3.0843E+02 INTERVAL=
VTGCM /B0UGHER/SWBV97/EQUMAX (DAY,HR,MIN=
0.263E+03>
UN+VN
20.0 0.0
1 .0000E+01
10, 0, 0)
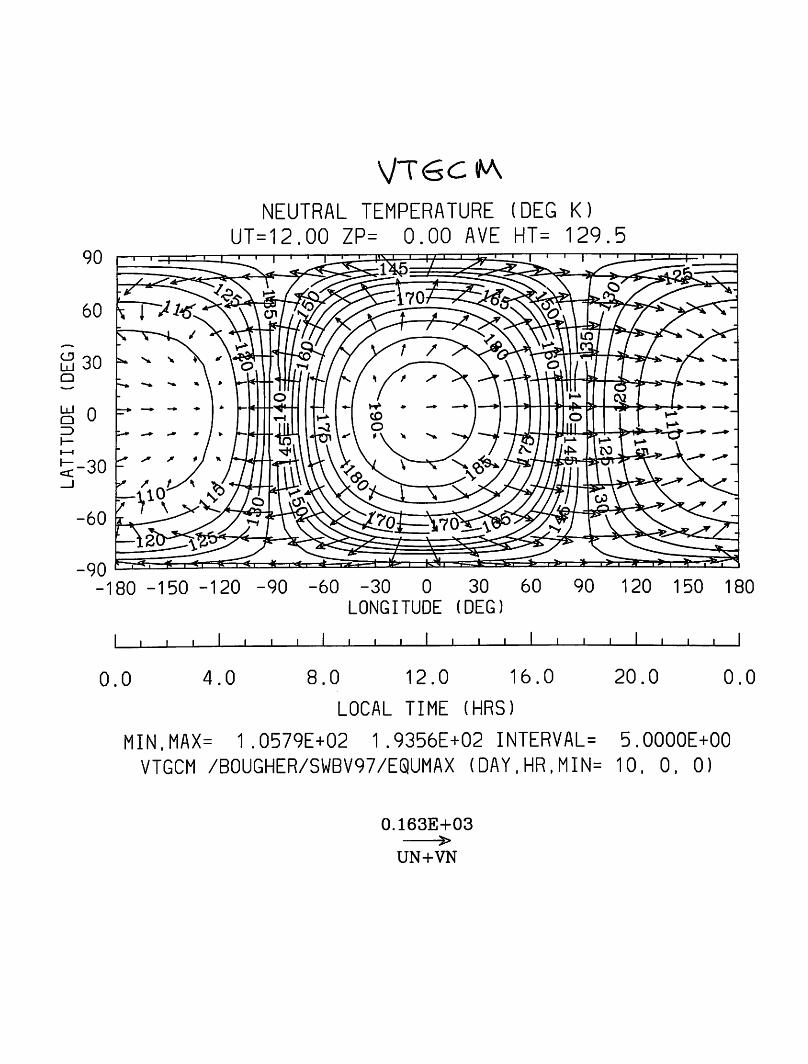
VT6C(^
NEUTRAL TEMPERATURE (DEG K)
UT=12.00 ZP= 0.00 AVE HT= 129.5"1—•—'—I—' L-\ ' t=f:
-180 -150 -120 -90 -60 -30 0 30 60 90 120 150 180LONGITUDE (DEG)
.J I L
0.0 4.0
J I L J I L i I L I I I J L
8.0 12.0 16.0
LOCAL TIME (HRS)
MIN.MAX= 1.0579E+02 1.9356E+02 INTERVAL=VTGCM /B0UGHER/SWBV97/EQUMAX (DAY,HR,MIN=
0.163E+-03s>
UN+VN
20.0 0.0
5.0000E+00
10, 0, 0)
0.0
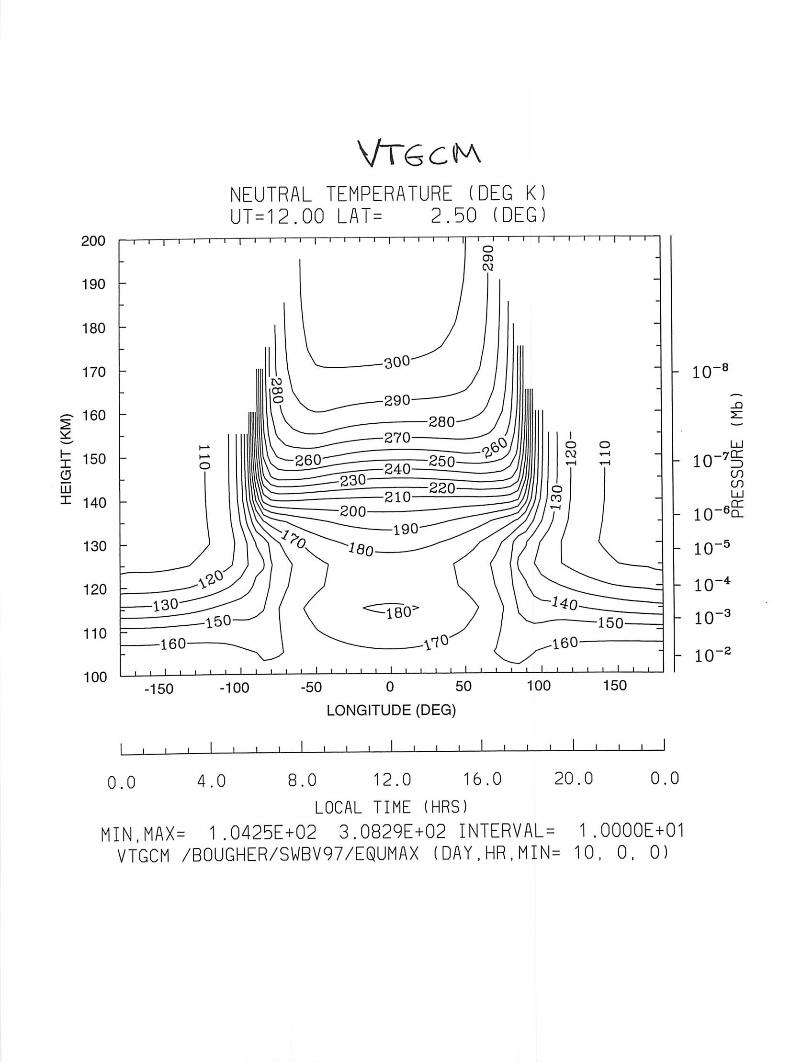
VtgcmNEUTRAL TEMPERATURE (DEG K)UT=12.00 LAT= 2.50 (DEG)
t—i—i—i—|—i—r
LONGITUDE (DEG)
I i i I i i i I I I I I I 1 1 1 1 1 L
4.0 8.0 12.0 16.0
LOCAL TIME (HRS)
MIN,MAX= 1.0425E+02 3.0829E+02 INTERVAL^ 1.0000E+01VTGCM /B0UGHER/SWBV97/EQUMAX (DAY,HR,MIN= 10, 0, 0)
20.0
-8- 10
- 10
J L
0.0
21
LlJ
COCOLd
10"6Q-
10-5
10"4
10"3
10"2
90
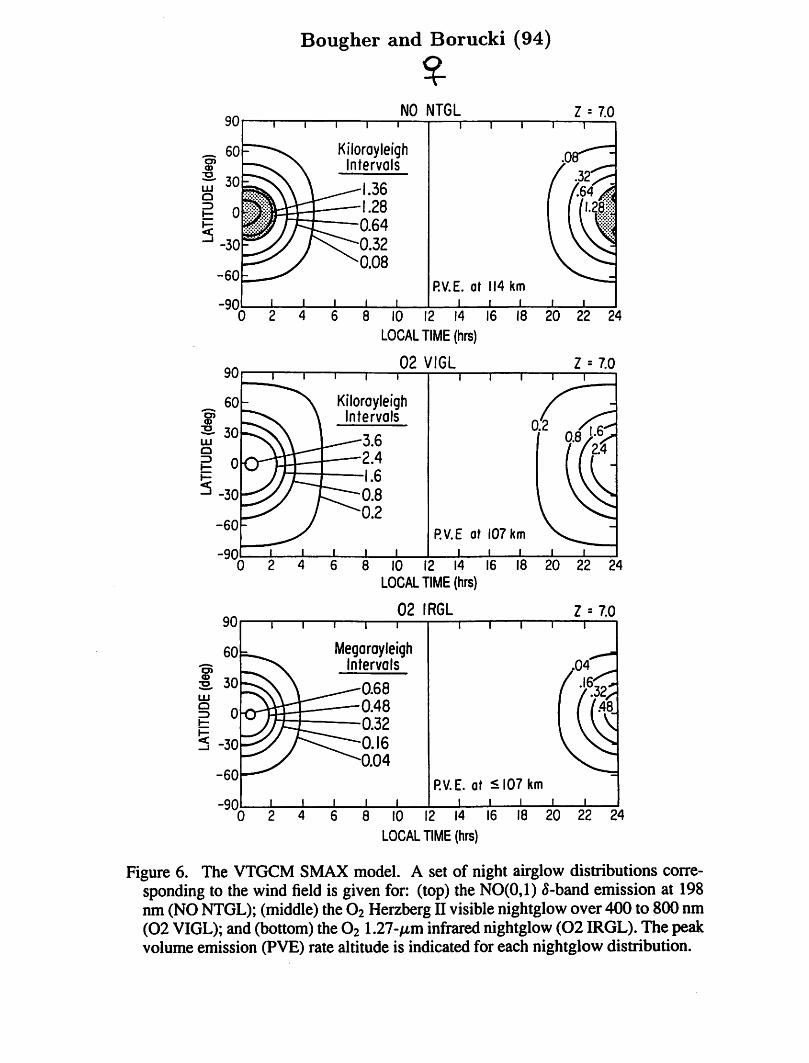
Bougher and Borucki (94)
NO NTGL
KiloroyleighIntervals
P.V.E. at 114 km
I I L.
8 10 12 14 16
LOCAL TIME (hrs)
02 VIGL
KilorayleighIntervals
P.V.E at 107 km
I I l_
8 10 12 14 16
LOCAL TIME (hrs)
02 IRGL
MegarayleighIntervals
18
20
P.V.E. a\ < 107 km
I I I L
6 10 12 14 16 18 20
LOCAL TIME (hrs)
Z* 7.0
22 24
Figure 6. The VTGCM SMAX model. A set of night airglow distributions corresponding to the wind field is given for: (top) the NO(0,1) 5-band emission at 198nm (NO NTGL); (middle) the 02 Herzberg II visible nightglow over 400 to 800 nm(02 VIGL); and(bottom) the 02 1.27-^m infrared nightglow (02 IRGL). The peakvolume emission (PVE) rate altitude is indicated for each nightglow distribution.
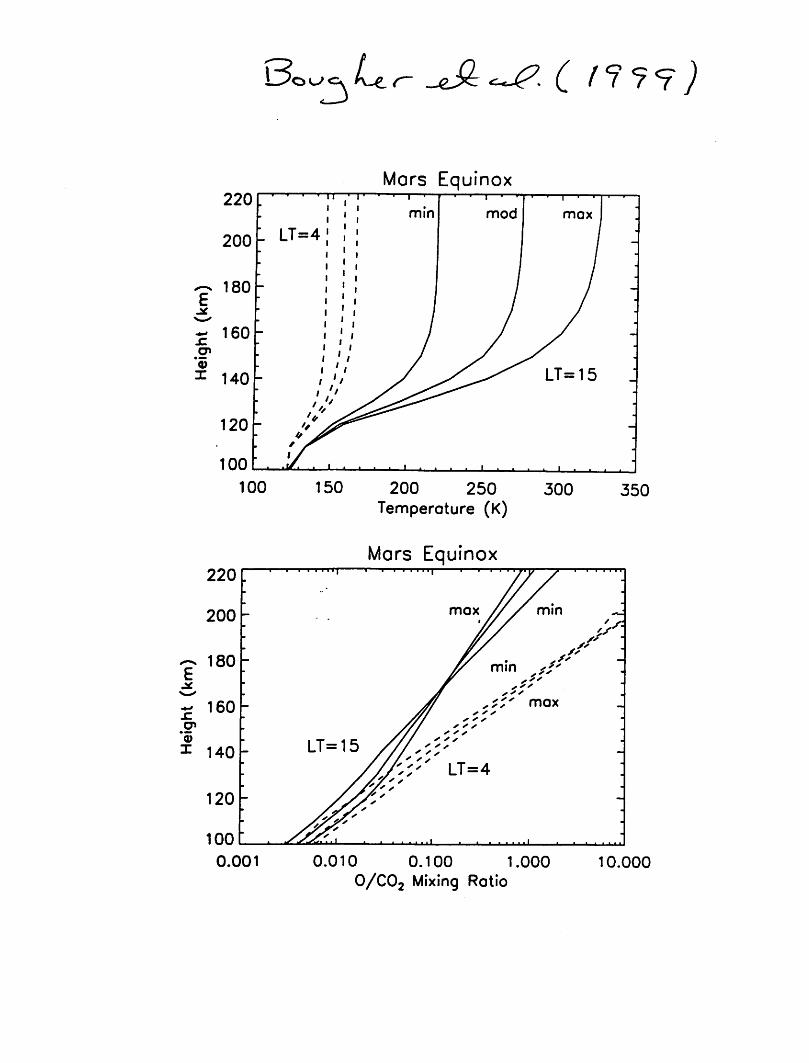
So^^^^7 ( fU^)
220
200 1 LT=4
E180
- 160h
*5>1 140
120
100
Mars Equinox
100 150 200 250
Temperature (K)300 350
220
200
~ 180
£ 160
1 140
120
100
0.001
Mars Equinox• i 11111 'i
LT=15
• ••' '
0.010 0.100 1.000
0/C02 Mixing Ratio
• 1111111
10.000
350 r^-
300
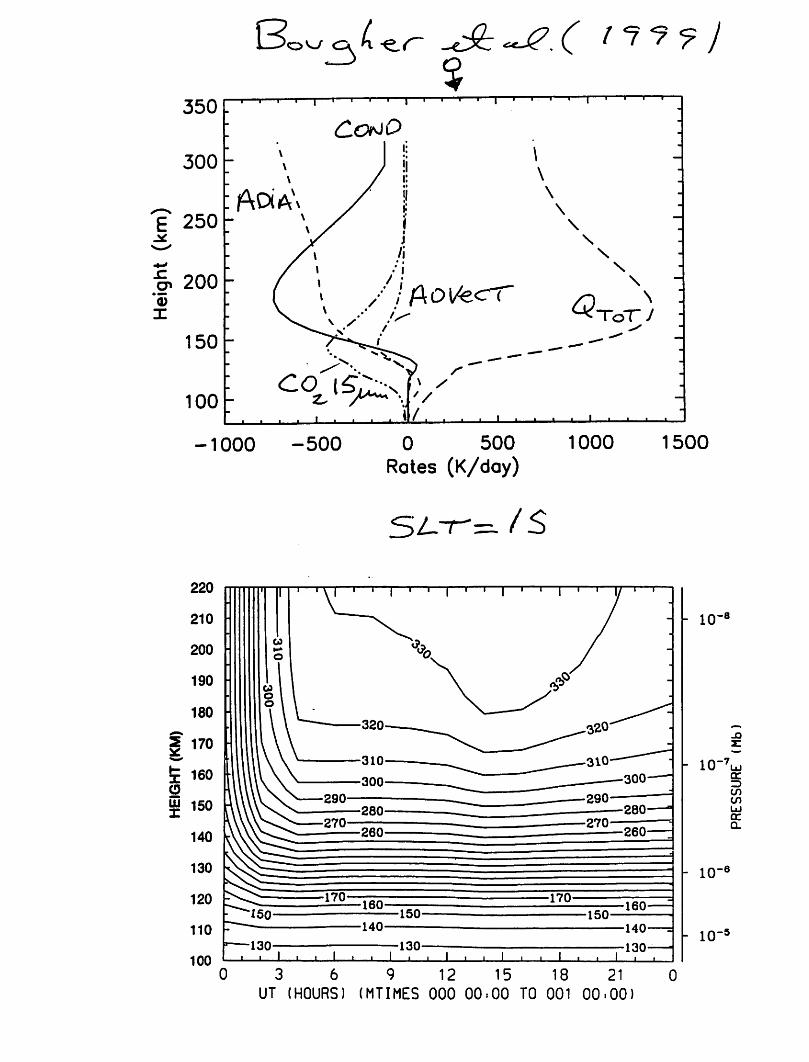
B ooa/-e^ ^$z~J?.( 'It? j%
i i I i
E 250: Acxa\
\\
^ 200"5I
150
100
/ / f\o\/e<rr
...... • il/.
r
\\
\
Q
\
\
\
TdT J
* • » • • * • «
CDUJz
-1000 -500 0 500 1000
Rates (K/day)
-/s
3 6 9 12 15 18 21
UT (HOURS) (MTIMES 000 00.00 TO 001 00.00)
1500
-8- 10
- 10-7.
crz>COCOUJcca.
-6- 10
-5- 10
90
t3 30
£ 0
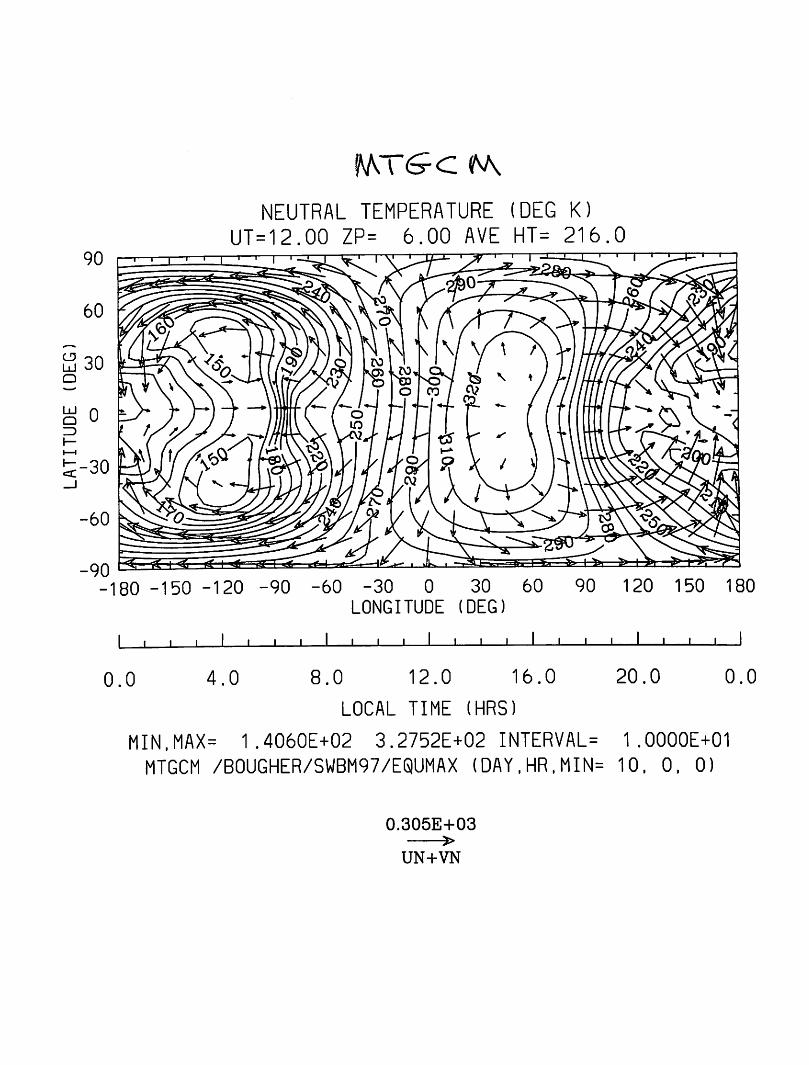
|*AT<^C fV\
NEUTRAL TEMPERATURE (DEG K)
UT=12.00 ZP= 6.00 AVE HT= 216.0
-180 -150 -120 -90 -60 -30 0 30 60 90 120 150 180LONGITUDE (DEG)
I . • l
0.0 4.0
J I L J L J L J L
8.0 12.0 16.0
LOCAL TIME (HRS)
MIN,MAX= 1.4060E+02 3.2752E+02 INTERVAL=MTGCM /B0UGHER/SWBM97/EQUMAX (DAY.HR.MIN=
0.305E+03>
UN+VN
J ' '
20.0 0.0
1.0000E+01
10. 0, 0)
90
60
a 30
£ 0
-30
-60 -
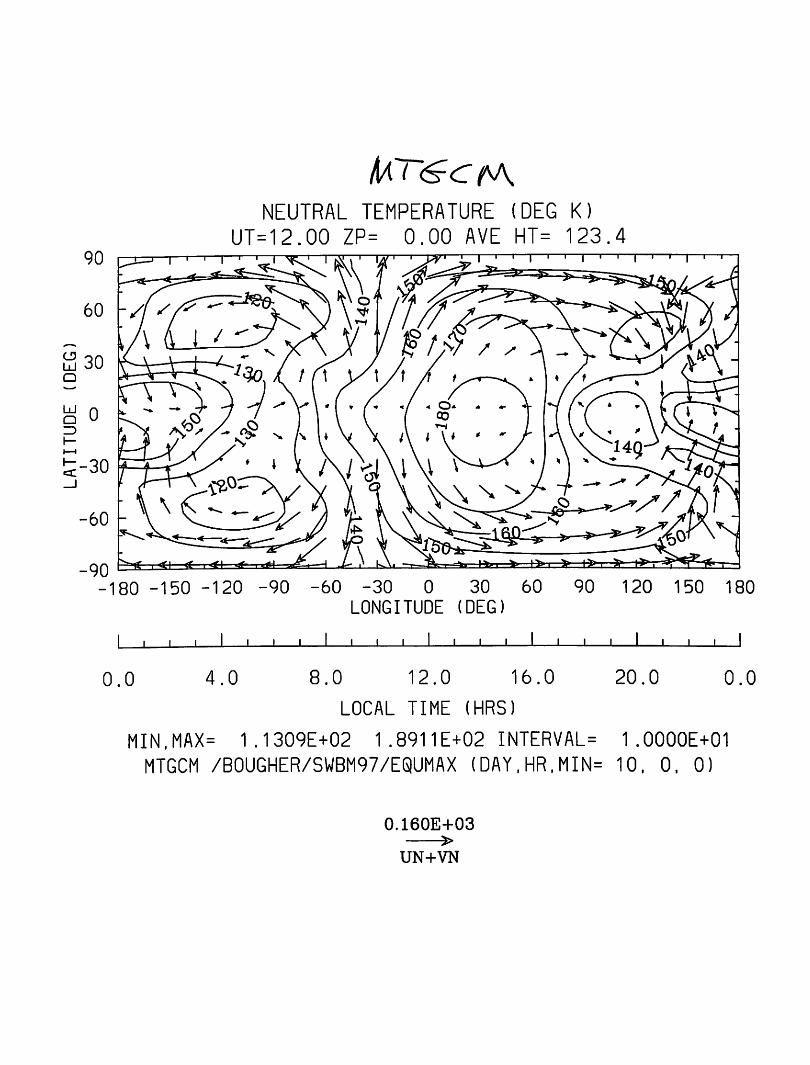
tAf <^CMNEUTRAL TEMPERATURE (DEG K)
UT=12.00 ZP= 0.00 AVE HT= 123.4
-90^<f , <f i <r • rfi rf -,
-180 -150 -120 -90 -60 -30 0 30 60 90 120 150 180LONGITUDE (DEG)
J L
0.0 4.0
J I L J L
8.0 12.0 16.0
LOCAL TIME (HRS)
MIN,MAX= 1.1309E+02 1.8911E+02 INTERVAL=MTGCM /B0UGHER/SWBM97/EQUMAX (DAY,HR,MIN=
0.160E+03>
UN+VN
J L
20.0 0.0
1 .0000E+01
10. 0. 0)
240
0.0
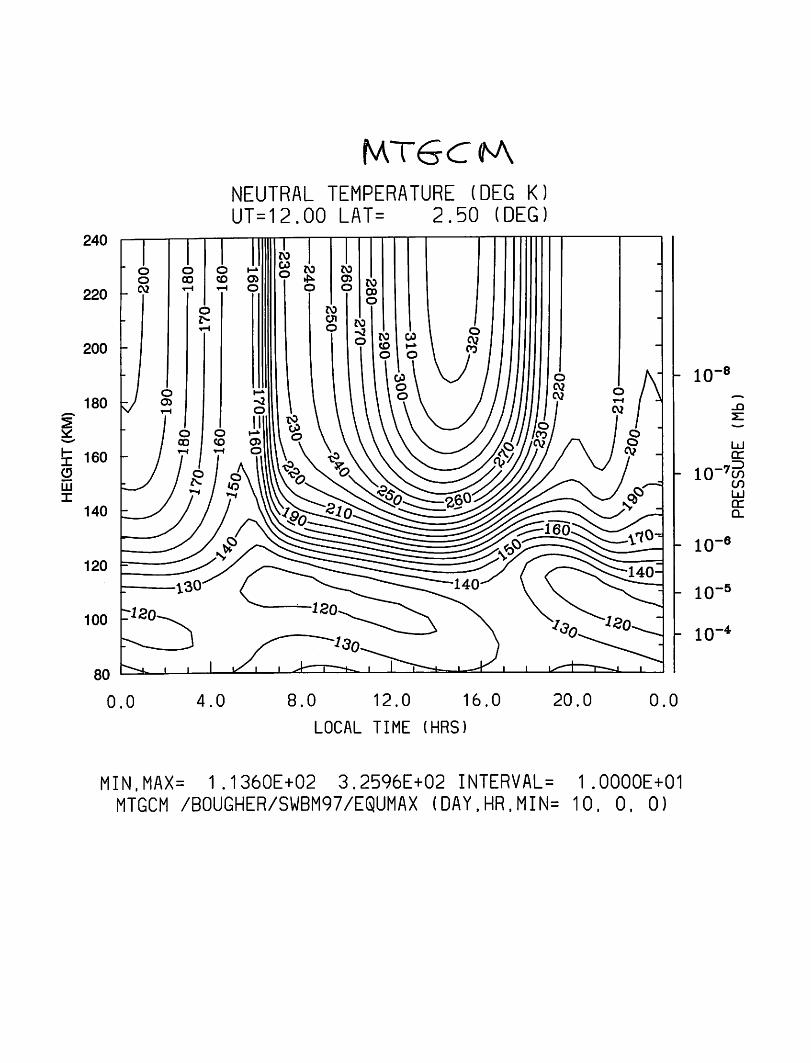
MTGdhANEUTRAL TEMPERATURE (DEG K)UT-12.00 LAT= 2.50 (DEG)
T
4.0 8.0 12.0 16.0
LOCAL TIME (HRS)
20.0 0.0
MIN,MAX= 1.1360E+02 3.2596E+02 INTERVAL= 1.0000E+01MTGCM /B0UGHER/SWBM97/EQUMAX (DAY,HR,MIN= 10, 0, 0)
h 10"8
21
LU
I" 10"lLdcra.
h 10"6
h 10"5
h 10"4
500
400
E
^ 300en
I
200
100 E_
500
400
E
^ 300en
*cdI
200
100
0.1
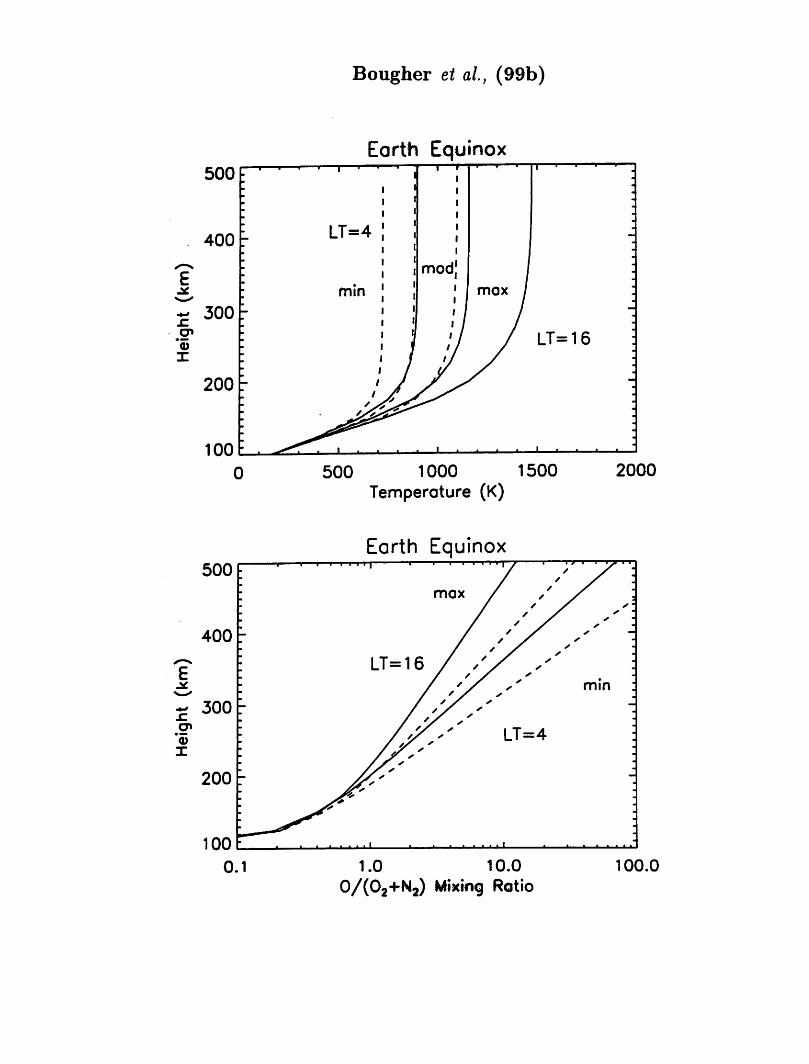
Bougher et al, (99b)
Earth Equinox
LT=16
1 • ...!..«• !••» i
500 1000 1500 2000Temperature (K)
Earth Equinoxi i i i 11111
1.0 10.0
0/(02+N2) Mixing Rotio
mm
* • * * *
100.0
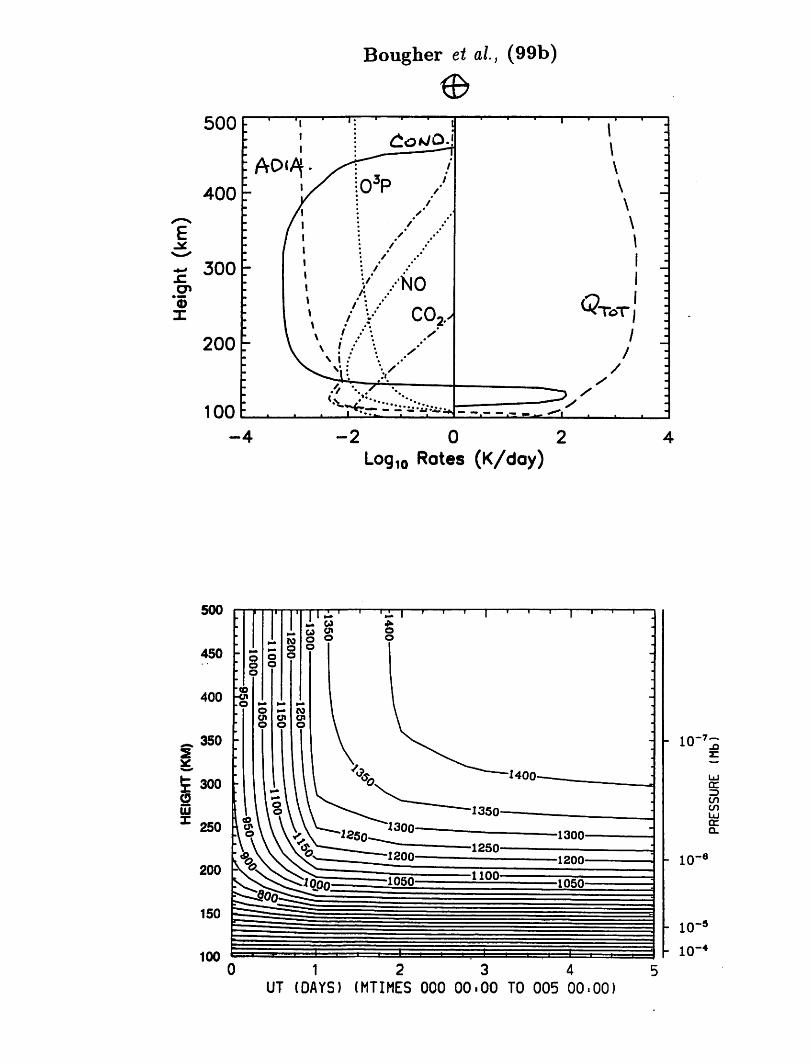
Bougher et al, (99b)
500i—-j. i ••—i—j
r ' :\ :
400
T
:ACM•' |o3p /
: /• /'\ /: /'• /
\ j\ :
\ :\ :
£ 300
X«
W' Mo/ V co2.,
111111111"7
200 - \ Xm: *. ..*v,: \ /
/ :/ :
/ :
W_ V:-....100 • •-= f •— ^*' ^ •
-2 0 2
Log10 Rotes (K/doy)
i—i i
- 10-7—
z:
12 3 4
UT (DAYS) (MTIMES 000 00-00 TO 005 00.00)
cr
enenuicr
-a- 10
h 10~5
h lO"4
90
60
a 30
£ o
-30
-60 r
-90
0.0
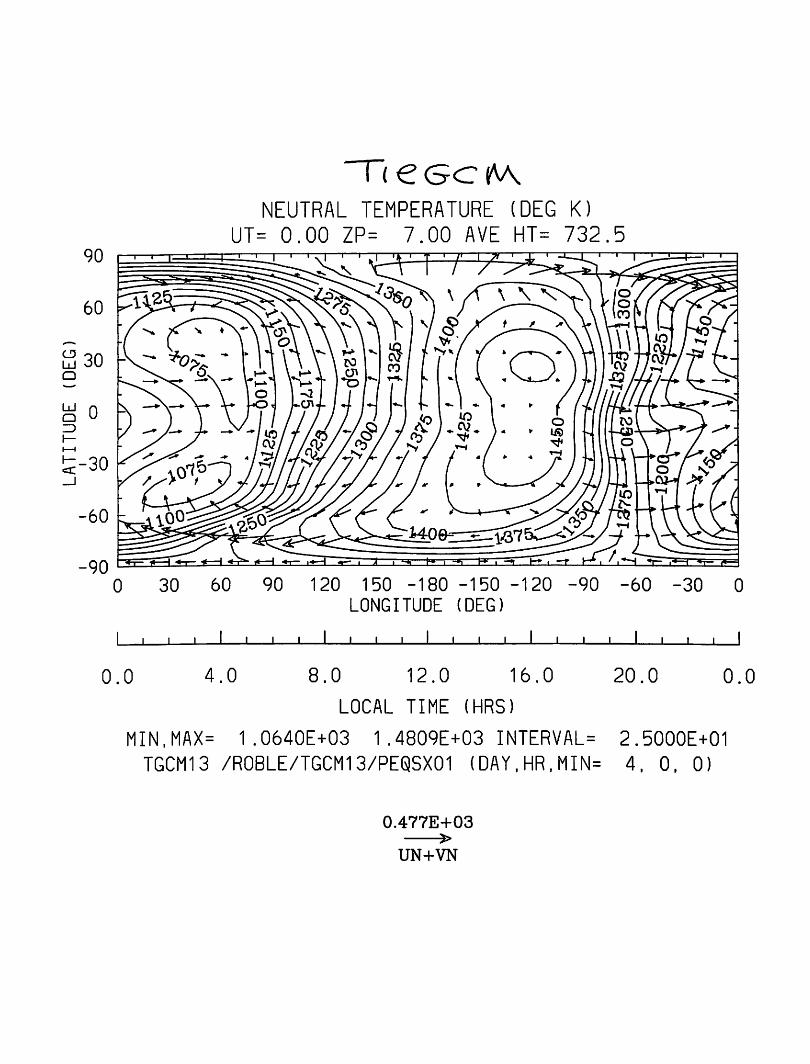
~T< e GO »wNEUTRAL TEMPERATURE (DEG K)
UT= 0.00 ZP= 7.00 AVE HT= 732.5
0 30 60 90 120 150 -180 -150 -120 -90LONGITUDE (DEG)
J I L
4.0
l l l l l l l l l J I
8.0 12.0 16.0
LOCAL TIME (HRS)
MIN,MAX= 1.0640E+03 1.4809E+03 INTERVAL=
TGCM13 /R0BLE/TGCM13/PEQ.SX01 (DAY,HR,MIN=
0.477E+03J>
UN+VN
-60 -30 0
J ' l
20.0 0.0
2.5000E+01
4, 0, 0)
900
0.0
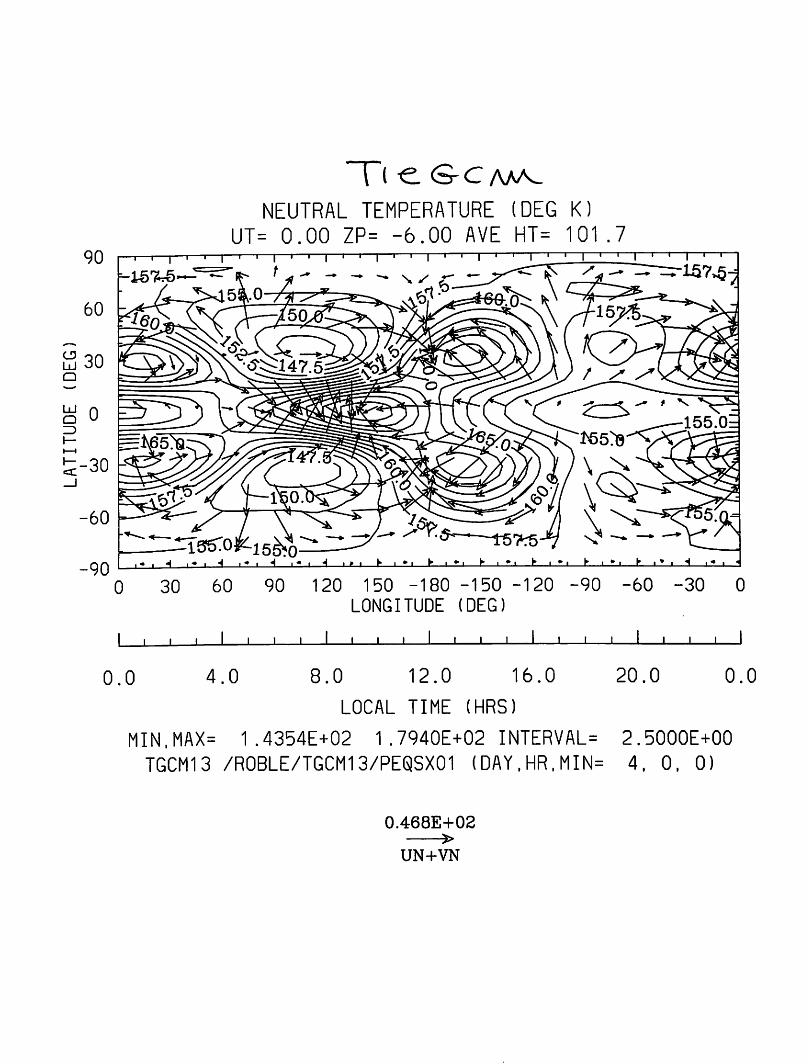
Tl €. S-CAA^NEUTRAL TEMPERATURE (DEG K)
UT= 0.00 ZP= -6.00 AVE HT= 101.7T—i 1—i 1—| 1—I 1—r
i« • * • « • W i_2_i 4 L*_J—i
30 60 90 120 150 -180 -150 -120
LONGITUDE (DEG)
-90 -60 -30 0
J L
4.0
I I I J L J I L I I I J I L
8.0 12.0 16.0
LOCAL TIME (HRS)
MIN,MAX= 1.4354E+02 1.7940E+02 INTERVAL=TGCM13 /ROBLE/TGCM13/PEQSX01 (DAY,HR,MIN=
0.468E+02j>
UN+VN
20.0 0.0
2.5000E+00
4, 0, 0)
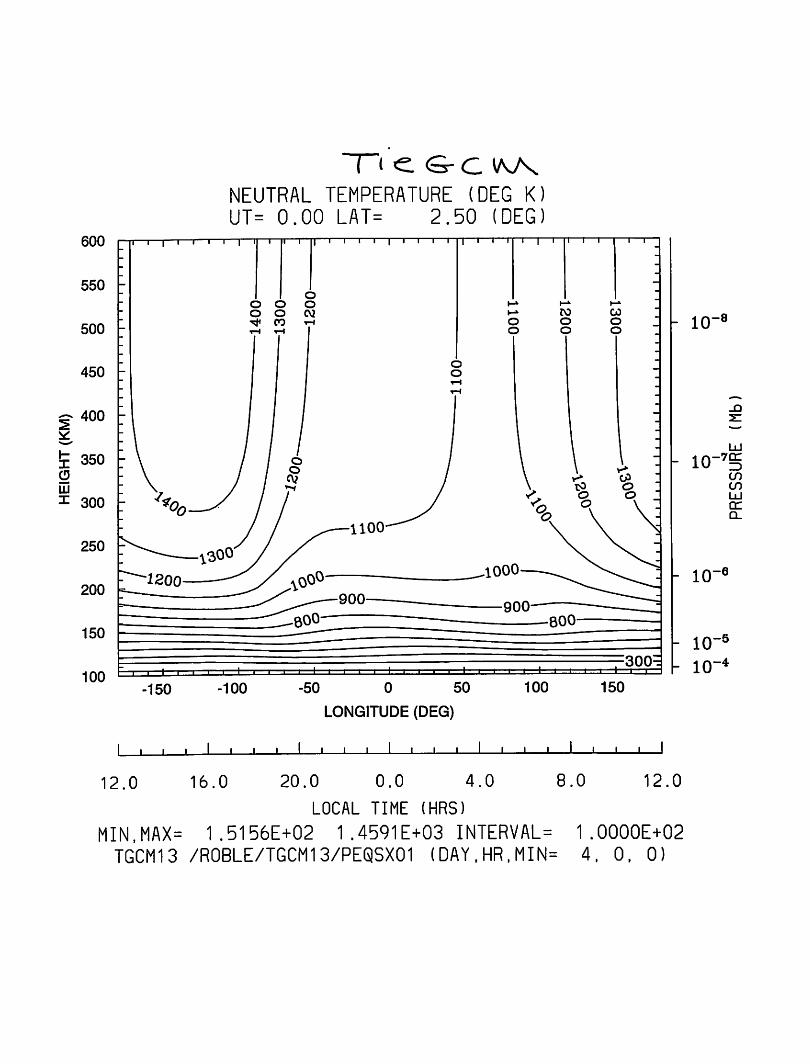
600
100
i—i—|—i—i—i—i—I—r
NEUTRAL TEMPERATURE (DEG K)UT= 0.00 LAT= 2.50 (DEG)
l—n—i—i—i—i—|—i—i—r 1—i—i—ry-i—|—i—p—r
-8- 10
- 10-7tr
Z)COCOLU
QlCL
-6IO
i i i i • i i I i • • •:300=
• » i ' • • • • ' • •
10"5
10"4•150 -100 •50 0 50 100 150
LONGITUDE (DEG)
• i i I i ' i I ' i i I i i i I i i i L J I L J
12.012.0 16.0 20.0 0.0 4.0
LOCAL TIME (HRS)
MIN,MAX= 1.5156E+02 1 .4591E+03 INTERVAL= 1 .0000E+02TGCM13 /R0BLE/TGCM13/PEQSX01 (DAY,HR,MIN= 4, 0, 0)
8.0
Solar Cycle 1.26 nbar Heights for SZA=0, 60140
I I I I I 1 I I I |
E
135
130
- 125hP*
1 120 h
115 -
M9E
A
"I""-^T" ' ' I
I I \J L-l I I I I I I I I I I I I L. I I I I
0 100 200
t—i—i—i i I i i—i—r
MGS2
^M9N J
I I I I I I I I L_J » • »
300
Bougher et al, (00)
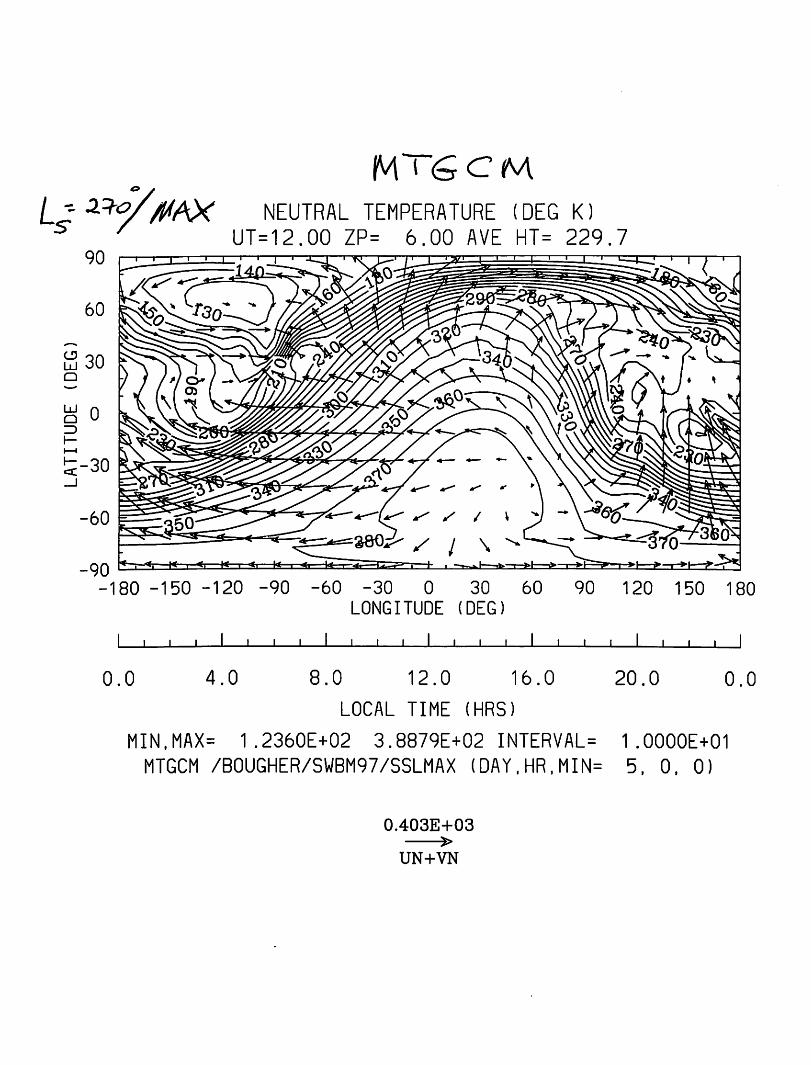
Ls xrf#*xMTSCM
NEUTRAL TEMPERATURE (DEG K)
UT=12.00 ZP= 6.00 AVE HT= 229.7
-180 -150 -120 -90 -60 -30 0 30 60 90 120 150 180LONGITUDE (DEG)
J L
0.0 4.0
I I I l l l
8.0 12.0 16.0
LOCAL TIME (HRS)
MIN,MAX= 1.2360E+02 3.8879E+02 INTERVAL=
MTGCM /B0UGHER/SWBM97/SSLMAX (DAY,HR,MIN=
0.403E+03j>
UN+VN
J L
20.0 0.0
1.0000E+01
5, 0, 0)
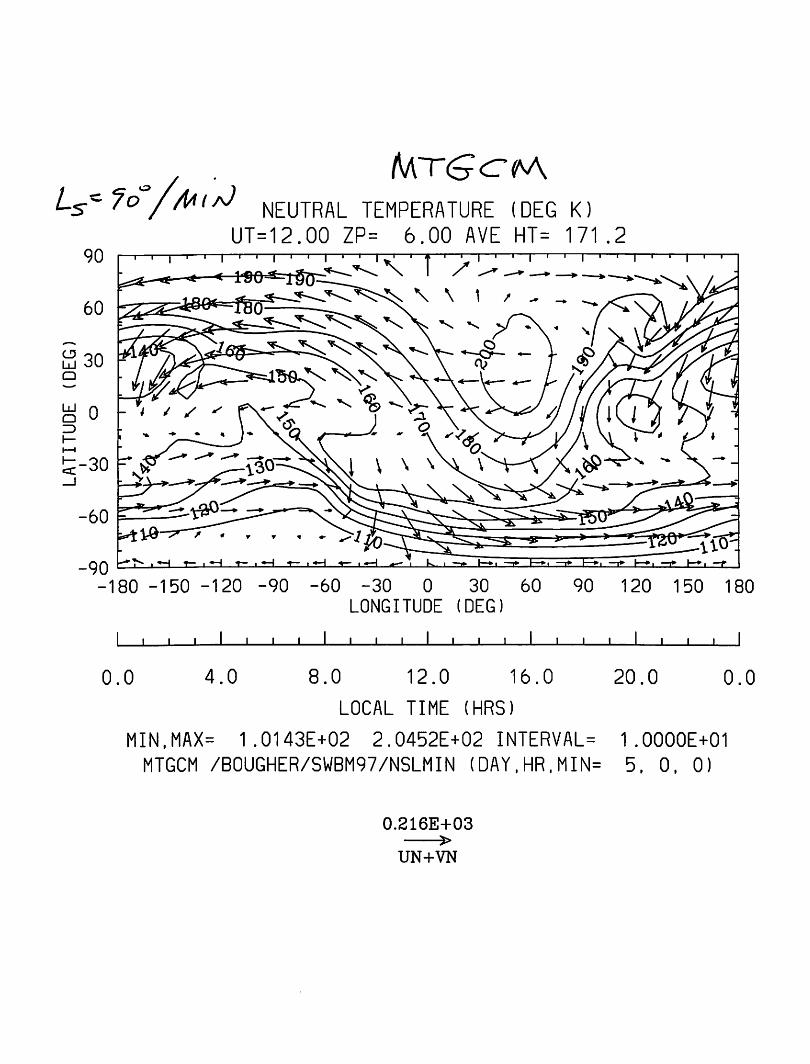
frAT<9<0<hAL^~ Jo'/M i/J NEUTRAL TEMPERATURE (DEG K)
UT=12.00 ZP= 6.00 AVE HT= 171.2-r—i—i i i i i90
60
a 30
< lso^igg-—i—i—i—i—i—
V 1 /
180 -150 -120 -90 -60 -30 0 30 60 90LONGITUDE (DEG)
J L
0.0 4.0
J I L J L J I L
8.0 12.0 16.0
LOCAL TIME (HRS)
MIN,MAX= 1.0143E+02 2.0452E+02 INTERVAL=
MTGCM /B0UGHER/SWBM97/NSLMIN (DAY,HR,MIN=
0.216E+03>
UN+VN
t—'—•—r
120 150 180
I l l
20.0 0.0
1.OOOOE+01
5. 0, 0)
90
l»*K
60 -^-1
a 30
lj 0QID
-30
-60
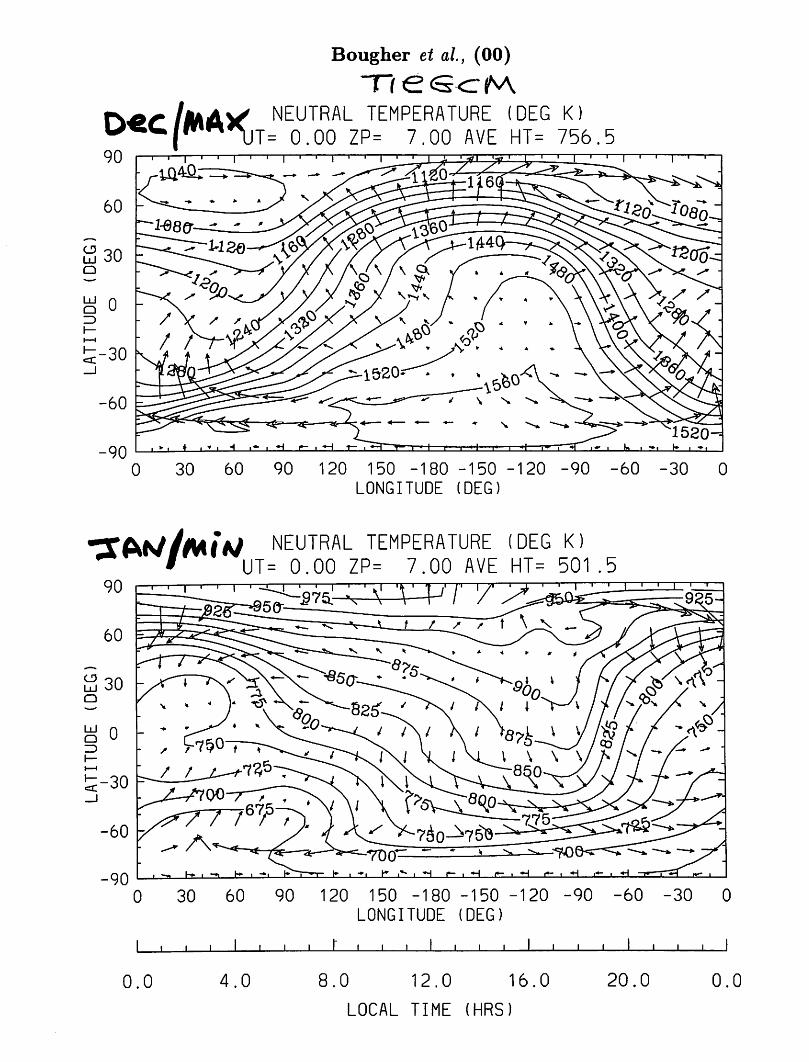
Bougher et al, (00)
NEUTRAL TEMPERATURE (DEG K)
T= 0.00 ZP= 7.00 AVE HT= 756.5
-900 30 60 90 120 150 -180 -150 -120 -90 -60 -30 0
LONGITUDE (DEG)
•3T<W//VUA/ NEUTRAL TEMPERATURE (DEG KUT= 0.00 ZP= 7.00 AVE HT= 501.5
1—•—' ' ' ' r
0 30 60 90 120 150 -180 -150 -120 -90 -60 -30 0LONGITUDE (DEG)
' I L J I L
0.0 4.0
l l l I l l l I I l
8.0 12.0 16.0
LOCAL TIME (HRS)
20.0 0.0
o o 4^
O 00
Cd
r~
LJ
0o
co
Qrq
D>
er
r~
(D H
—i
—*
i—i
12
IV)
pi
mO
**
x
o3D
oCO
o INJ
O O O
LA
TIT
UD
E(D
EG
O
I
OC
Oo
CO
oo
o
CO
o o o o
o o m o m G">
en
o oo
o o o sO
o o CO
o
x—o
'I'll
"/'/
I\
'\I
1I
\'\
11
1I'
l
\i\m
Ii
x/c
ol\
\\
\tl,
MM
-
*""
"""
//
JL\
v>/
'/
III
|O"
/8
»'/
//
M11
,i-
-,'
'///
/'!
J!•
cP\
OI
>V
//i
V/
//
/
/'•,'
'/
COCO
;co
;cj
iIII
'>
'/
I
co
''
11
11
\''
v03
II
^M
II
\IC
OI
J
^-
-""
//
//
^y
II
I'
/^
//
/<Y
/'
CO/
COI
03/
?\
\'
V*
1v
x^
\\
\
\\
\\
\III
\
v\
\
/
'/'/
//
I/H
ii
//
/I
/co
///
/r\
£--
//
COIO
ilI
Ii
/^
11
11
1/
i/
/"^x
JI'm
iI
///-^
""II
I!I
IA
/*\.
-\//////•
CO
/
50/ '/
' tt
\ o
•co
//
\N
\\\\
»o
•I
•I
I^
fxA
^1
\L
_*.
I\
1\1
•I
'11
LA
TIT
UD
E(D
EG
1
nO
1
01
CO
00
0
CO
oo
O
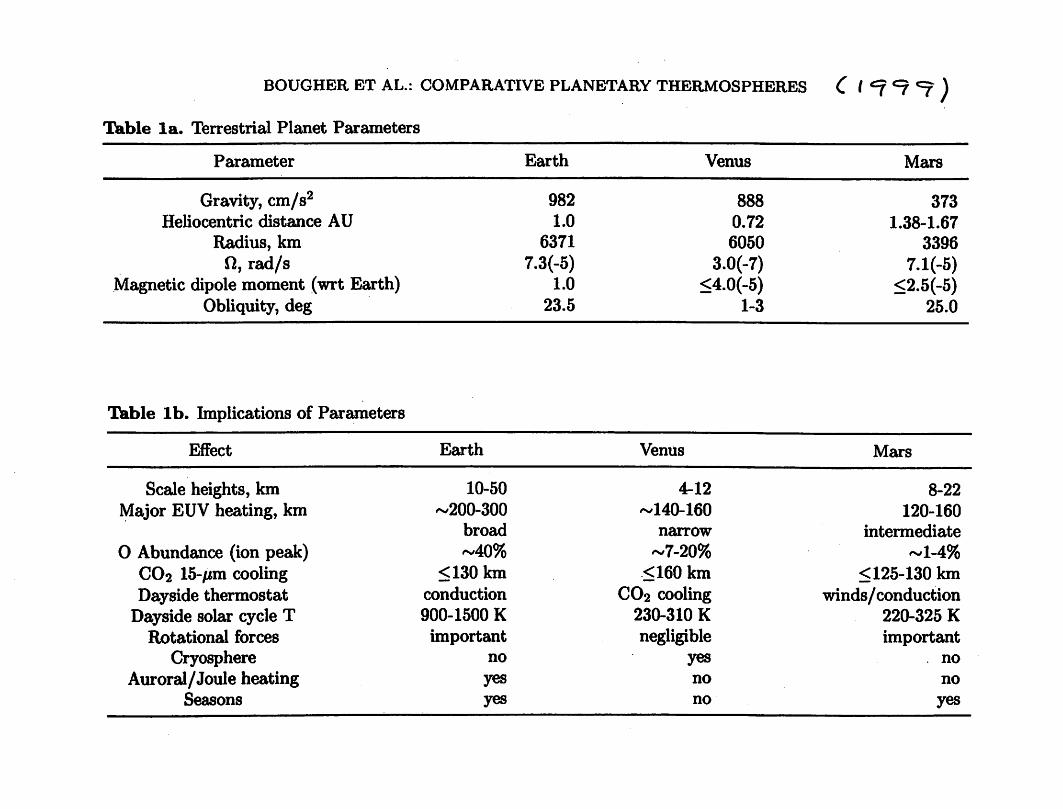
BOUGHER ET AL.: COMPARATIVE PLANETARY THERMOSPHERES C t *? ^7 *f )
Table la. Terrestrial Planet Parameters
Parameter Earth Venus Mars
Gravity, cm/s2 982 888 373
Heliocentric distance AU 1.0 0.72 1.38-1.67
Radius, km 6371 6050 3396
H, rad/s 7.3(-5) 3.0(-7) 7.1(-5)Magnetic dipole moment (wrt Earth) 1.0 <4.0(-5) <2.5(-5)
Obliquity, deg 23.5 1-3 25.0
Table lb. Implications of Parameters
Effect Earth Venus Mars
Scale heights, km 10-50 4-12 8-22
Major EUV heating, km -200-300 -140-160 120-160
broad narrow intermediate
O Abundance (ion peak) -40% -7-20% -1-4%
CO2 15-/mi cooling < 130 km <160 km < 125-130 km
Dayside thermostat conduction CO2 cooling winds/conductionDayside solar cycle T 900-1500 K 230-310 K 220-325 K
Rotational forces important negligible importantCryosphere no yes no
Auroral/Joule heating yes no no
Seasons yes no yes
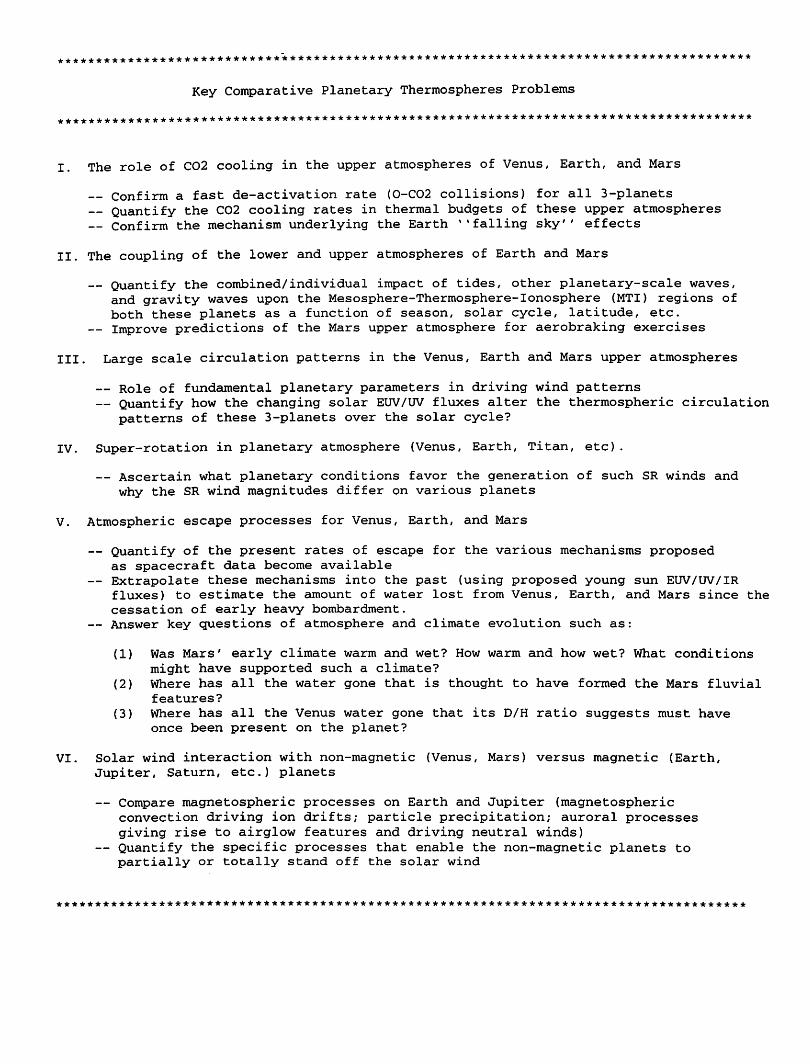
***************************************************************************************
Key Comparative Planetary Thermospheres Problems
***************************************************************************************
I. The role of C02 cooling in the upper atmospheres of Venus, Earth, and Mars
— Confirm a fast de-activation rate (0-C02 collisions) for all 3-planetsQuantify the C02 cooling rates in thermal budgets of these upper atmospheres
— Confirm the mechanism underlying the Earth '* falling sky'' effects
II. The coupling of the lower and upper atmospheres of Earth and Mars
— Quantify the combined/individual impact of tides, other planetary-scale waves,and gravity waves upon the Mesosphere-Thermosphere-Ionosphere (MTI) regions ofboth these planets as a function of season, solar cycle, latitude, etc.
— Improve predictions of the Mars upper atmosphere for aerobraking exercises
III. Large scale circulation patterns in the Venus, Earth and Mars upper atmospheres
— Role of fundamental planetary parameters in driving wind patterns— Quantify how the changing solar EUV/UV fluxes alter the thermospheric circulation
patterns of these 3-planets over the solar cycle?
IV. Super-rotation in planetary atmosphere (Venus, Earth, Titan, etc).
— Ascertain what planetary conditions favor the generation of such SR winds andwhy the SR wind magnitudes differ on various planets
V. Atmospheric escape processes for Venus, Earth, and Mars
— Quantify of the present rates of escape for the various mechanisms proposedas spacecraft data become available
— Extrapolate these mechanisms into the past (using proposed young sun EUV/UV/IRfluxes) to estimate the amount of water lost from Venus, Earth, and Mars since thecessation of early heavy bombardment.
— Answer key questions of atmosphere and climate evolution such as:
(1) Was Mars' early climate warm and wet? How warm and how wet? What conditionsmight have supported such a climate?
(2) Where has all the water gone that is thought to have formed the Mars fluvialfeatures?
(3) Where has all the Venus water gone that its D/H ratio suggests must haveonce been present on the planet?
VI. Solar wind interaction with non-magnetic (Venus, Mars) versus magnetic (Earth,Jupiter, Saturn, etc.) planets
— Compare magnetospheric processes on Earth and Jupiter (magnetosphericconvection driving ion drifts; particle precipitation; auroral processesgiving rise to airglow features and driving neutral winds)
— Quantify the specific processes that enable the non-magnetic planets topartially or totally stand off the solar wind
**************************************************************************************
Archives of Images and Tables for Venus, Earth,and Mars Thermospheres
Dr. Stephen W. BougherLunar and Planetary Laboratory - University of Arizona
Escap«
4Q0Vr»»
•ao&v."*
Solar wind
Ionopause
actions
Upperatmosphere
MGS
Express
• .
Sphere
Gravity Waves
^"•Maiiis
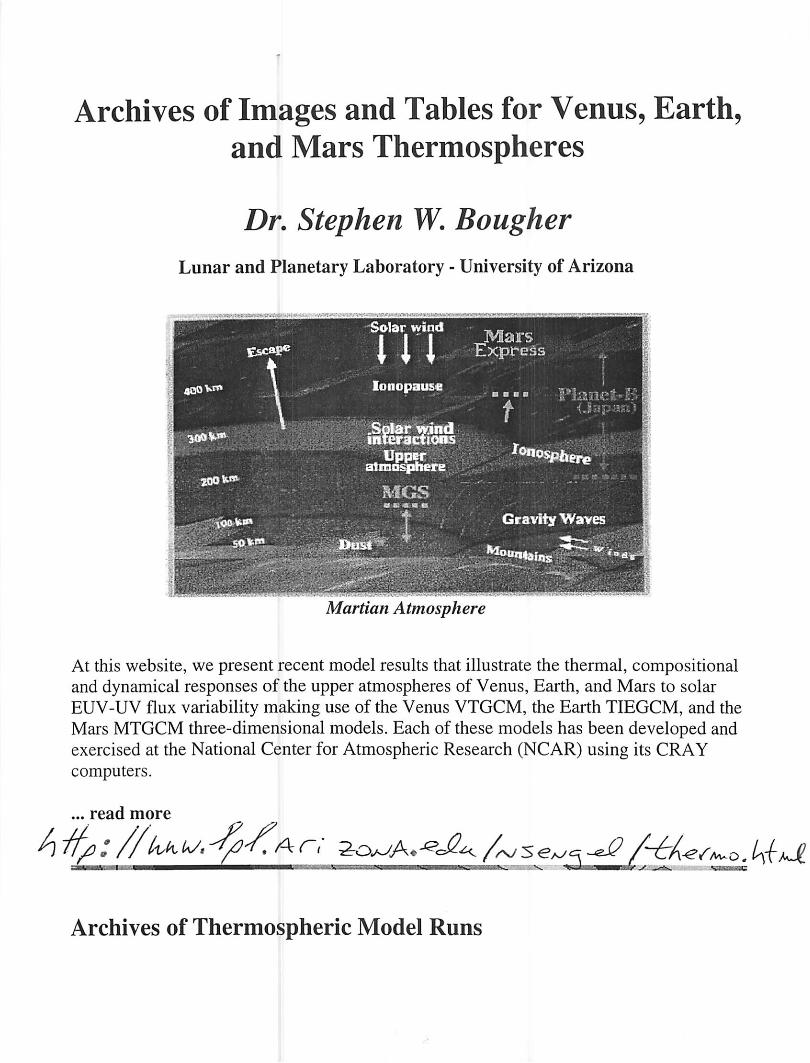
Martian Atmosphere
At this website, we present recent model results that illustrate the thermal, compositionaland dynamical responses of the upper atmospheres of Venus, Earth, and Mars to solarEUV-UV flux variability making use of the Venus VTGCM, the Earth TIEGCM, and theMars MTGCM three-dimensional models. Each of these models has been developed andexercised at the National Center for Atmospheric Research (NCAR) using its CRAYcomputers.
... read more
nBHOEHBBanaHEaans »£-.. •.-.'.•.':.•.%«_ x.
Archives of Thermospheric Model Runs
JOURNAL OF GEOPHYSICAL RESEARCH, VOL. 104, NO. E7, PAGES 16,591-16,611, JULY 25, 1999
Comparative terrestrial planet thermospheres 2. Solarcycle variation of global structure and winds at equinox
S. W. Bougher and S. EngelLunar and Planetary Laboratory, University of Arizona, Tucson
R. G. Roble and B. Foster
National Center for Atmospheric Research, High Altitude Observatory, Boulder, Colorado
Comparative terrestrial planet thermospheres3. Solar cycle variation of global structure and winds atsolstices
S. W. Bougher and S. EngelLunar and Planetary Laboratory, University of Arizona, Tucson, Arizona
R. G. Roble and B. Foster
National Center for Atmospheric Research, High Altitude Observatory, Boulder, Colorado