comparative speed study: a way to improve road safety condition comparative speed study: a way to...
TRANSCRIPT

Seediscussions,stats,andauthorprofilesforthispublicationat:https://www.researchgate.net/publication/281277365
ComparativeSpeedStudy:AWaytoImproveRoadSafetyCondition
ARTICLE·JUNE2015
READS
47
6AUTHORS,INCLUDING:
ShakilM.Rifaat
IslamicUniversityofTechnology
32PUBLICATIONS179CITATIONS
SEEPROFILE
MosabbirPasha
IslamicUniversityofTechnology
7PUBLICATIONS0CITATIONS
SEEPROFILE
SajidurRahmanNafis
LouisianaTechUniversity
1PUBLICATION0CITATIONS
SEEPROFILE
Allin-textreferencesunderlinedinbluearelinkedtopublicationsonResearchGate,
lettingyouaccessandreadthemimmediately.
Availablefrom:ShakilM.Rifaat
Retrievedon:08January2016

IUT JOURNAL OF ENGINEERING AND TECHNOLOGY (JET), VOL. 12, NO. 1, JUNE 2015 41
Comparative Speed Study: A Way to ImproveRoad Safety Condition
Shakil Mohammad Rifaat*, Mosabbir Pasha, Mahmudul Hasan Shovon, Sajidur Rah-man Nafis, and Md. Kamruzzaman Haque Limon
Abstract—With the development of science and tech-nology people experience a large number of motorvehicles which is the main and easier way of travellingfor people and carrying goods from one place to another.Roads, highways and streets are fundamental to trans-portation system and over 70% of passenger travel andmuch of goods mover is over the highways. However,at the same time we are sacrificing a large number ofvaluable human lives or being severely injured each dayaround the world. Road crashes are the major cause forit. It is a leading cause of deaths and serious injuries.Several studies justifies that speed is the major causerelated to the risk of getting involved in a road accident.However, very few speed related studies done in thedeveloping countries context, for example, Bangladesh.Specifically, the road safety authority of this countrydoes not aware how speed data can be effectively usedto enhance safety. This paper investigates the speedscenario of a particular roadway section of Mirpur Roadas a pilot project. The speed data of various types ofvehicles that use this particular roadway were takenfor this study. To get a complete speed scenario of thisroad section data were taken on both weekdays andweekends in four different time periods that includemorning peak (8.00a.m-9.00a.m), off-peak (11.00a.m-12.00p.m), evening peak (6.00p.m-7.00p.m) and nighttime (9.00p.m-10.00p.m). Unpaired T- test analysis wasperformed considering 90% confidence interval for bothequal and unequal variances. It is found that comparedwith other time periods vehicle speed varies in themorning-peak at weekdays and in the evening-peak atweekends. The speed of car, bus and truck significantlyvaries between two different days. Some measures thatdemand priority consideration in improving road safetyare increasing road width, deploying traffic police in
* Corresponding author.Shakil Mohammad Rifaat, Mosabbir Pasha, Mah-
mudul Hasan Shovon, Sajidur Rahman Nafis, and Md. Kam-ruzzaman Haque Limon are with the Civil and EnvironmentalEngineering department of Islamic University of Technology(IUT), Gazipur, Bangladesh. e-mail: [email protected],[email protected], [email protected],kh [email protected] and [email protected].
Manuscript received March 12, 2015; revised May 14, 2015.
particular time periods, build speed bump, provide ad-equate streetlight, installing optimum number of speedlimit sign etc.
Index Terms—Road crashes, Speed, speed bump, t-test, road safety.
I. INTRODUCTION
Road crashes are a leading cause of deaths and seri-ous injuries around the world. According to a statistics[1], worldwide an estimated 1.2 million people arekilled in road accidents each year and as many as50 million are injured. Projections indicate that thesefigures will increase by about 65 percent over thenext 20 years unless there is new commitment toprevention. It also said that road traffic accidents asthe 6th place (was the 9th in 1990) of a major cause ofdeath worldwide, will rise to become the 3rd leadingcause of DALYs (Disability Adjusted Life Years) lostby 2020. Deaths and injuries from road crashes areproblems for both developed and developing countries.However, the road crash scenario of developing coun-try is much worse comparing with this of developedcountries. Over 80% of traffic fatalities occur in socalled developing and emerging countries, even thoughthese countries account only about one third of thetotal motor vehicle fleet. Accident rate in developingcountries are often 10-70 times higher than that ofdeveloped countries [2]. Developing countries sufferstaggering annual loss exceeding US$ 100 billionfor road accidents, which is nearly equivalent to thedouble of all developing assistance [3].
Bangladesh, a developing country, is also facingsevere problems due to loss of life from road crashes.Here more than 2,000 people are killed in road ac-cidents every year, which are about 6 persons everyday [2]. According to Bangladesh Road TransportAuthority (BRTA), Bangladesh has a fatality rate of55 persons per 10,000 vehicles. It is almost 25 timeshigher comparing with that of most of the developed

42 IUT JOURNAL OF ENGINEERING AND TECHNOLOGY (JET), VOL. 12, NO. 1, JUNE 2015
countries, 8 times higher than that of Thailand and 3times higher than that of India [4].
Hoque et al. [5] identified several contributing fac-tors of road crashes in Bangladesh. The most signif-icant factors are adverse roadside environment, poordetailed design of junctions and road sections, ex-cessive speeding, overloading, dangerous overtaking,reckless driving, carelessness of road users, failure toobey mandatory traffic regulations, variety of vehiclecharacteristics and defects in vehicles. BRTA in itsinvestigation identified fifteen major causes of roadtrauma in Bangladesh [6]. Reckless driving and over-speeding have been reported as the most frequentcauses of accident.
A good number of studies have shown that highspeed is one of the major causes of crashes. Abegazet al. [7] identified that over speeding have highesteffects on the occurrence of sever and fatal crashesand termed it a powerful predictor of crash injuryseverity. Knight et al. [8] mentioned that driving athigh speed is often perceived to be less risky than drinkdriving. However, they pointed out that this perceptionabout speeding may contribute to increase the crashrates on rural roads involving young, local drivers.They suggested that interventions are required in formof educational programmes which aim to reduce therural road crash rate. He et al. [9] described thatin Guangdong Province, after using speed detectionequipment, motorway fatalities due to speeding in2005 decreased by 32.5% comparing with 2004. Evans[10] reported that a 1% increase in speed increasesthe fatality risk by 412%. Soole et al. [11] found thatreductions in crash rates have been associated with theenforcement of laws for maintaining suggested speedlimit. Van Petegem and Wegman [12] informed thatabout 50% of all road traffic fatalities and 30% of alltraffic injuries in Netherlands take place on rural roadswith a speed limit of 80 km/h. Quddus [13] observedthat 1% increase in speed variation is associated witha 0.3% increase in accident rates, ceteris paribus.Reduced speed limit also play an important role incrash reduction and their effect are widely discussedin the literature [14-16].
From the above discussion it is clear that highspeed of vehicles plays crucial role on road crashesboth in developed and developing countries context.Despite its importance very few speed related stud-ies have been conducted in Bangladesh for the sakeof improving safety condition. Specifically the road
safety authority in Bangladesh does not know howthe measured speed of vehicles can be effectivelyused for improving road safety scenario. Therefore,the objective of the study is to demonstrate througha case study how the speed measurement of differentvehicles can be used to improve the safety conditionon a particular roadway location.
For developing remedial measures against crashesthe traditional practice is to identify the crash hotspotsor blackspots at first. A good number of studies areobserved in the literature which basically deals withhow these crash blackspots can be identified efficiently[17- 21]. However, the shortcomings of this approachis that you have to wait for the crash occurrences on aparticular location and then implement remedial actionto fix them which is eventually a post active approach.This study, on the other hand, proposes a methodwhich is proactive in nature. That means identify thecrash prone locations before crash occurrences andadopt counter measure based on the finding of com-parative speed study of different vehicles in differenttime periods.
To fulfill the objective, at first the study will showhow the accident prone location can be identified froma particular road segment by rigorous field investiga-tion. As the road safety budget is usually limited for adeveloping country like Bangladesh, priority selectionof critical locations among competing sites is requiredat first. Then following works will be carried out incase of speed measurement:
1) Measuring the speed of different motor vehiclesusing a speed gun at different days.
2) Comparing average speed between different timeperiods in a particular day for all vehicles.
3) Comparison of average speed between days fora particular vehicle.
Finally, different safety measures will be proposedbased on the finding of this study to improve safetyscenario of the selected location. This study willinform the policy makers to show a way how the speeddata can be effectively employed to improve the roadsafety condition of a selected location.
II. METHODOLOGY
A. Site Selection
For better understanding the speeding characteristicsof a roadway it is necessary to study on several road-way segments. However, due to limitation of resources

SHAKIL M RIFAAT et al.: COMPARATIVE SPEED STUDY: A WAY TO IMPROVE ROAD SAFETY CONDITION 43
TABLE 1: Comparison among six survey sites
Parameters Site1 Site2 Site3 Site4 Site5 Site6Street light No No No No No No
Shoulder width Ok Not Ok Not Ok Ok Ok OkSight distance Good Bad Good Bad Good Good
Clear road marking Not visible Not Not Not Visible VisibleSpeed breaker No No No No No NoSharp curve Less risky Risky Less Risky Less Less
Fig. 1: Considered six different sites
we have considered only a single location of a roadwaysegment as a pilot project.
In this pilot project, Mirpur Road, a very im-portant road in Dhaka city road network has beenselected which connects Mirpur area with Dhaka-Mymensingh highway. In the preliminary survey forchoosing site location, we investigated from Kamarpara, near Abdullahpur to Rupnagar Police Station,which is about 11 km. Six locations have been selectedafter comparing with other locations on this road basedon existing safety considerations. For data collectionpurpose a single location has been chosen from thesesix locations. Table 1 shows the comparison among sixsurvey sites. The selection process of the final locationis described in brief below:
There are some common problems in these six sitelocations of the roadway identified:
1) No street lights: There are no street light inthis road, so vehicles have higher chances ofinvolving crashes at night.
2) Less shoulder width: Recommended shoulderwidth is usually as follows:
• At least 10 ft for heavily traveled and highspeed highways.
Fig. 2: Finally selected site for data collection
• At least 4 ft for (preferable 6 to 8 ft) forlow-type highways.
In many places the shoulder width does notabide by recommended width.
3) Short sight distance: There are many sharpcurves in this roadway. Trees at both side of theroad block drivers sight distance.
4) Less distance for perception-reaction: Vehiclesmove at very high speed on this road. There-fore, longer stopping sight distance, breakingdistance, passing sight distance is required.
5) No speed limit signs: The drivers of bus, truckand other vehicles have a tendency to overspeeding on this road as there is no restrictionof speed visible.
6) No road divider: Often the drivers of bus, truckand other vehicles want to overtake illegally.However, no road divider is observed.
7) No speed breaker: Theres not even a singlespeed breaker in the entire roadway which in-creases the over speeding tendency of the driver.
8) Sharp curves: There are many sharp curveswhich drastically reduce the perception reactiondistance.

44 IUT JOURNAL OF ENGINEERING AND TECHNOLOGY (JET), VOL. 12, NO. 1, JUNE 2015
TABLE 2: Data collection schedule
Day Time Time Time TimeSunday(1stWork-ing dayof aweek)
Morningpeak(8.00a.m-9.00a.m)
Off-peak(11.00a.m-12.00p.m)
Eveningpeak(6.00p.m-7.00p.m)
Night(9.00p.m-10.00p.m)
Monday Morningpeak(8.00a.m-9.00a.m)
Off-peak(11.00a.m-12.00p.m)
Eveningpeak(6.00p.m-7.00p.m)
Night(9.00p.m-10.00p.m)
Friday(Week-end)
Morningpeak(8.00a.m-9.00a.m)
Off-peak(11.00a.m-12.00p.m)
Eveningpeak(6.00p.m-7.00p.m)
Night(9.00p.m-10.00p.m)
9) Less visible road marking: In many places of theroad the pavement marking have been erased orbecame less visible due to inadequate mainte-nance.
B. Data Collection
Data has been collected at different hours of a dayand in different days of a week. Table 2 shows thedata collection schedule.
• Using the speed gun, speed of different vehicleshas been measured.
• The work has been carried in 3 different days ina week.
• Two weekdays (Sunday and Monday) and oneweekend (Friday is the weekend in Bangladesh)have been selected for collecting speed data.
C. Statistical Analysis
1) Testing Differences Between Two Means: EqualVariences: There are several hypothesis testing op-tions among them t-test is very much familiar. Themost common test for the difference between twopopulations means µ1 and µ2 is the one presentedbelow where the null hypothesis states that the twomeans are equal.
µ1 , µ2= Average vehicle speed of all vehicles in aparticular time period in a particular day (in case ofTable 3)
µ1 , µ2 = Average vehicle speed of a particularvehicle in a particular day (in case of Table 5)
H0 : µ1 − µ2 = 0 (1)
H1 : µ1 − µ2 ̸= 0 (2)
A test statistic for a difference between two popu-lation means with equal population variances is givenby
t∗ =(X̄1 − X̄2)− (µ1 − µ2)√
s2p(1n1
+ 1n2)
(3)
where the term (µ1 −µ2) is the difference betweenµ1 and µ2 under the null hypothesis. The samplesize of population 1 and population 2 are n1 andn2 respectively. The degrees of freedom of the teststatistic in this equation are (n1 − n2 + 2), whichare the degrees of freedom associated with the pooledestimate of the population variance s2p.
s2p =(n1 − 1)s21 + (n2 − 1)s22
n1 + n2 − 2(4)
The confidence interval for a difference in pop-ulation means is based on the t distribution with(n1 − n2 + 2) degrees of freedom. A (1-α) 100%confidence interval for the difference between twopopulation means ((µ1 − µ2)), assuming equal pop-ulation variances is
(X̄2 − X̄2)± tα
2
√s2p(
1
n1+
1
n2) (5)
2) Testing Differences Between Two Means: Un-equal Variences: The most common test for the dif-ference between two populations means µ1 and µ2,is the one presented below where the null hypothesisstates that the two means are equal,
H0 : µ1 − µ2 = 0 (6)
H1 : µ1 − µ2 ̸= 0 (7)
A test statistic for a difference between two popula-tion means with unequal population variances is givenby
t∗ =(X̄1 − X̄2)− (µ1 − µ2)√
( s21
n1+ s22
n2)
(8)
Where (X̄1 − X̄2) is the average sample differ-ence between the observation 1 and observation 2,s1 and s2 is the sample standard deviations of thesedifferences, and the sample size, n1 and n2 is thenumber of unpaired observations of sample 1 and

SHAKIL M RIFAAT et al.: COMPARATIVE SPEED STUDY: A WAY TO IMPROVE ROAD SAFETY CONDITION 45
sample 2 respectively. Equation 8 has approximatelya t distribution with degrees of freedom given by
df =( s
21
n1+ s22
n2)2
(s21
n1)2
n1−1 +(
s22
n1)2
n2−1
(9)
A (1- α) 100% confidence interval for the meandifference (µ1 − µ2) is
(X̄1 − X̄2)± tα
2
√(s21n1
+s22n2
) (10)
III. DATA ANALYSIS AND DISCUSSION
Speed data has been taken for Car, Microbus,Jeep, CNG Auto rickshaw, Motor cycle, Pickup van,Small bus, Bus and Truck in two weekdays (Sun-day and Monday) and one weekend (Friday). Datawere taken for morning peak (8.00a.m-9.00a.m), off-peak (11.00a.m-12.00p.m), evening peak (6.00p.m-7.00p.m) and night (9.00p.m-10.00p.m) for each day.Taking 90% confidence as the cut point while differ-entiating between means (for both equal and unequalpopulation variances), two analyses is performed:
1) Average speed comparison between differenttime periods in a particular day for all vehicles.
2) Average speed comparison between days for aparticular vehicle.
A. Average Speed Comparison Between DifferentTime Periods
Speed comparison among morning-peak (MP), off-peak (OP), evening-peak (EP) and night (N) are per-formed for Sunday, Monday and Weekend. The com-parison between different time periods of weekdaysand weekend is presented in Table 3.
From Table 3 it is observed that on Sunday, av-erage speed in morning peak varies with the speedof other three time periods. It is because Sunday isthe first working day in Bangladesh. All institutionssuch as schools, colleges, industries, offices resumeafter weekend. Working people and students whosehometown is outside Dhaka (majority from Gazipurand Savar area) use this road to enter Dhaka for jobpurpose. On the contrary, perhaps a person who en-tered Dhaka by using this road at morning peak doesntreturn during evening pick. Also, it has been observedthat in off pick period the traffic volume is light and
in night time the number of trucks increases on theroadway. These entire traffic scenarios probably createthe differences of average speed between morningpeak in Sunday and other time periods.
There is no significant speed variation observedbetween off pick period and night time in all three days(Sunday, Monday and Weekend). Low traffic volumein these two time periods may be the reason of thisfinding.
Average vehicle speed at morning peak on Mondaydiffers from noon/off-peak and evening pick. UnlikeSunday people do not enter Dhaka city after passingweekend at their hometown. However, the traffic vol-ume is still high at morning peak as the peak spreadingis not observed among the commuters. During eveningand at night time people are afraid of using thisroad perhaps because of safety consideration as nostreet light is seen. Moreover, vandalism, burglary andcar hijacking are often reported from the commuters.Therefore, the traffic volume is significantly low inthese two periods.
On weekend, average vehicle speed at evening peakdiffers from morning pick, off pick and night time. Inweekend all the offices are closed. People are usuallyenjoying and relaxing in weekends. Thus, they tend tostays at home in morning and enjoy the evening bygoing outside. Hence, the traffic volume is perhapssignificantly low at evening peak during weekendcomparing with other time of the day which maycreate differences in average speed.
B. Average Speed Comparison Between Days for AParticular Vehicle
For a particular vehicle, comparison among Sunday,Monday and weekend was carried-out. Comparisonamong different days for a particular vehicle is shownin Table 4. Comparison of average speed for each typeof vehicle in different days are shown in Table 5.
There is a change observed in mean speed fordifferent vehicles among Sunday, Monday and week-end. According to the results of t-test, statisticallysignificant differences are observed for speed of somevehicles while comparing average speed between“weekend and Sunday”; “weekend and Monday” and“Sunday and Monday”.
While comparing speed between weekend and Sun-day, significant difference is noticed for car, microbusand motorcycle. The possible reason is that on week-end the road is not used by many commuters especially

46 IUT JOURNAL OF ENGINEERING AND TECHNOLOGY (JET), VOL. 12, NO. 1, JUNE 2015
TABLE 3: Comparison of average speed between different time periods of weekdays and weekend
Time1 vs. Time2(particular day)
MP - Morning PeakOP - Off-peakEP - Evening PeakN - Night
P value*(For equalvariance)
Statically signifi-cant =
√
Statically Insignifi-cant = ×
P value**(For unequalvariance)
Statically signifi-cant =
√
Statically Insignifi-cant = ×
MP vs. OP (Sunday) 0.0027√
0.0029√
MP vs. EP (Sunday) 0.0001√
0.0001√
MP vs. N (Sunday) 0.0001√
0.0001√
OP vs. EP (Sunday) 0.0085√
0.0085√
OP vs. N (Sunday) 0.1344 × 0.1358 ×EP vs. N (Sunday) 0.3295 × 0.3324 ×MP vs. OP(Monday) 0.0097
√0.009
√
MP vs. EP (Monday) 0.0015√
0.0015√
MP vs. N (Monday) 0.8028 × 0.8107 ×OP vs. EP (Monday) 0.5585 × 0.5546 ×OP vs. N (Monday) 0.7922 × 0.8162 ×EP vs. N (Monday) 0.0237
√0.0293
√
MP vs. OP(Weekend) 0.9249 × 0.9281 ×MP vs. EP (Weekend) 0.0547
√0.066
√
MP vs. N (Weekend) 0.4753 × 0.485 ×OP vs. EP (Weekend) 0.0207
√0.0206
√
OP vs. N (Weekend) 0.4228 × 0.4224 ×EP vs. N (Weekend) 0.0432
√0.0411 ×
* H0: average speed time1 = average speed time2** H1: average speed time1 ̸= average speed time2
TABLE 4: Mean speed (km/hr) for each type of vehicles on different days
Days Car Microbus JeepCNG Autorickshaw Motorcycle Pickup Small Bus Bus Truck
Sunday 54.72 57.04 57.47 49.61 57.20 51.00 54.52 58.35 52.39Monday 56.87 54.83 55.19 52.63 51.92 51.61 52.25 52.07 36.06Weekend 57.06 59.90 59.57 48.68 52.14 52.14 55.22 58.55 51.94
office goers. Therefore, the road is free from heavytraffic and other obstructions. Hence the drivers faceno problem to increase speed at that time. As a resultthe drivers of car, microbus and motorcycle usuallyrun at a higher speed than weekdays.
However, the situation is different for Sunday. Sun-
day, being the first working day of the week, thenumber of vehicles increases which carry mostly officecommuters. Therefore the traffic volume is heavywhich hinders the speeding of all vehicles. Manypeople from outside Dhaka spend their weekend intheir hometown and join their job on Sunday using

SHAKIL M RIFAAT et al.: COMPARATIVE SPEED STUDY: A WAY TO IMPROVE ROAD SAFETY CONDITION 47
TABLE 5: Comparison of average speed between days for a particular vehicle
Vehicle Type(Day 1 vs. Day2)S=Sunday, W=Weekend,M=Monday
P-Value* (For
equal variance) Statically signifi-cant = XStatically Insigni-ficant = ×
P value** (For
unequalvariance)
Statically signifi-cant = XStatically Insigni-ficant = ×
Car (S vs. W) 0.0747 X 0.0826 XMicro (S vs. W) 0.0634 X 0.0607 XJeep (S vs. W) 0.2258 × 0.2106 ×CNG (S vs. W) 0.5327 × 0.5347 ×Motor Cycle (S vs. W) 0.0061 X 0.0109 XPickup (S vs. W) 0.4873 × 0.4906 ×Small bus (S vs. W) 0.6737 × 0.6731 ×Bus (S vs. W) 0.8699 × 0.8693 ×Truck (S vs. W) 0.8185 × 0.8153 ×Car (M vs. W) 0.8997 × 0.8987 ×Micro (M vs. W) 0.0006 X 0.0005 XJeep (M vs. W) 0.0234 X 0.023 XCNG (M vs. W) 0.0451 X 0.0444 XMotor Cycle (M vs. W) 0.9147 × 0.9223 ×Pickup (M vs. W) 0.7973 × 0.7918 ×Small bus (M vs. W) 0.0988 X 0.1048 ×Bus (M vs. W) 0.0002 X 0.0004 XTruck (M vs. W) 0.0001 X 0.0001 XCar(S vs. M) 0.1052 × 0.1063 ×Micro(S vs. M) 0.1407 × 0.1422 ×Jeep(S vs. M) 0.2511 × 0.2557 ×CNG (S vs. M) 0.147 × 0.1363 ×Motor Cycle (S vs. M) 0.0501 X 0.043 XPickup (S vs. M) 0.7848 × 0.779 ×Small bus (S vs. M) 0.2356 × 0.234 ×Bus (S vs. M) 0.0003 X 0.0007 XTruck (S vs. M) 0.0001 X 0.0001 X
* H0:average speed day1 = average speed day2** H1: average speed day1 ̸= average speed day2
this route. This large number of people is carried bymainly buses. Movement of these large vehicles on thissingle lane road prevents to maintain design speed.This may be the reason for reducing the speed ofsmaller vehicles.
Again on Monday, being the following day afterSunday, the traffic flow follows a regular pattern whichhelps to increase speed. While comparing the speeddata of microbus, jeep, CNG auto rickshaw, bus andtruck, statistically significant differences are observed.
Particularly in case of buses and trucks, there is ahuge difference in mean speeds between weekend andMonday. On that particular route buses and trucksare always found heavily loaded. During weekdays,their number increases as travel demand increasesfor transporting people and goods. Though the roadsurface condition is good, however, being a two laneroad and having frequent curvature makes delay todetect on coming vehicles from opposite direction.These conditions often forced drivers to reduce their
48 IUT JOURNAL OF ENGINEERING AND TECHNOLOGY (JET), VOL. 12, NO. 1, JUNE 2015
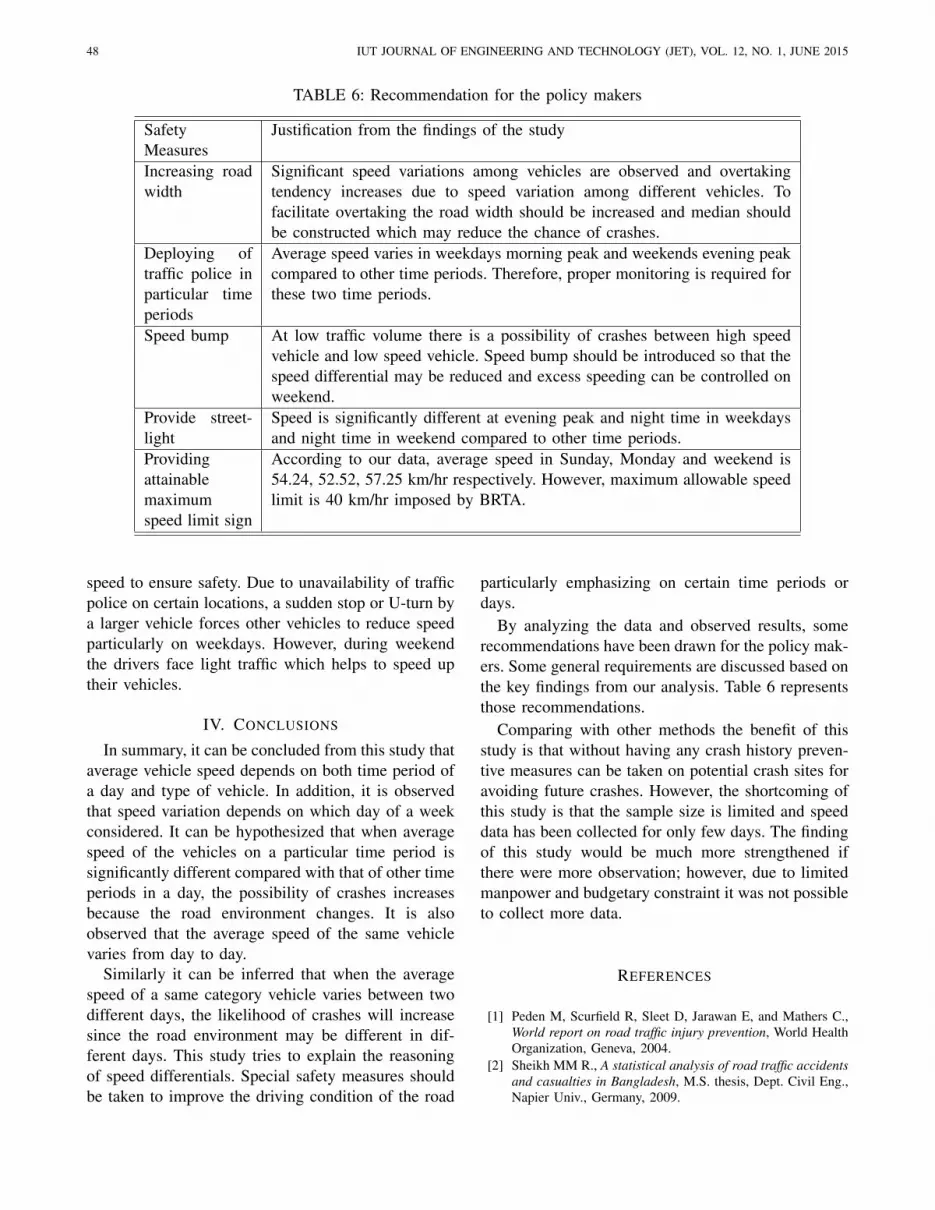
TABLE 6: Recommendation for the policy makers
SafetyMeasures
Justification from the findings of the study
Increasing roadwidth
Significant speed variations among vehicles are observed and overtakingtendency increases due to speed variation among different vehicles. Tofacilitate overtaking the road width should be increased and median shouldbe constructed which may reduce the chance of crashes.
Deploying oftraffic police inparticular timeperiods
Average speed varies in weekdays morning peak and weekends evening peakcompared to other time periods. Therefore, proper monitoring is required forthese two time periods.
Speed bump At low traffic volume there is a possibility of crashes between high speedvehicle and low speed vehicle. Speed bump should be introduced so that thespeed differential may be reduced and excess speeding can be controlled onweekend.
Provide street-light
Speed is significantly different at evening peak and night time in weekdaysand night time in weekend compared to other time periods.
Providingattainablemaximumspeed limit sign
According to our data, average speed in Sunday, Monday and weekend is54.24, 52.52, 57.25 km/hr respectively. However, maximum allowable speedlimit is 40 km/hr imposed by BRTA.
speed to ensure safety. Due to unavailability of trafficpolice on certain locations, a sudden stop or U-turn bya larger vehicle forces other vehicles to reduce speedparticularly on weekdays. However, during weekendthe drivers face light traffic which helps to speed uptheir vehicles.
IV. CONCLUSIONS
In summary, it can be concluded from this study thataverage vehicle speed depends on both time period ofa day and type of vehicle. In addition, it is observedthat speed variation depends on which day of a weekconsidered. It can be hypothesized that when averagespeed of the vehicles on a particular time period issignificantly different compared with that of other timeperiods in a day, the possibility of crashes increasesbecause the road environment changes. It is alsoobserved that the average speed of the same vehiclevaries from day to day.
Similarly it can be inferred that when the averagespeed of a same category vehicle varies between twodifferent days, the likelihood of crashes will increasesince the road environment may be different in dif-ferent days. This study tries to explain the reasoningof speed differentials. Special safety measures shouldbe taken to improve the driving condition of the road
particularly emphasizing on certain time periods ordays.
By analyzing the data and observed results, somerecommendations have been drawn for the policy mak-ers. Some general requirements are discussed based onthe key findings from our analysis. Table 6 representsthose recommendations.
Comparing with other methods the benefit of thisstudy is that without having any crash history preven-tive measures can be taken on potential crash sites foravoiding future crashes. However, the shortcoming ofthis study is that the sample size is limited and speeddata has been collected for only few days. The findingof this study would be much more strengthened ifthere were more observation; however, due to limitedmanpower and budgetary constraint it was not possibleto collect more data.
REFERENCES
[1] Peden M, Scurfield R, Sleet D, Jarawan E, and Mathers C.,World report on road traffic injury prevention, World HealthOrganization, Geneva, 2004.
[2] Sheikh MM R., A statistical analysis of road traffic accidentsand casualties in Bangladesh, M.S. thesis, Dept. Civil Eng.,Napier Univ., Germany, 2009.

SHAKIL M RIFAAT et al.: COMPARATIVE SPEED STUDY: A WAY TO IMPROVE ROAD SAFETY CONDITION 49
[3] Hoque MM, McDonald M, Hall R D., Road safety im-provements in developing countries: Priority issues and op-tions, Proceedings of 20th Australian Road Research Board(ARRB) Conference, 2001.
[4] Jahan A A., Road safety countermeasures and traffic calmingpractices in Roads and Highways Department in Bangladesh,Proc. International Conference on Road Safety in DevelopingCountries, Dhaka, Bangladesh, pp.120-123, 2006.
[5] Hoque MM, Smith G, Hossain D Z, and Mahmud SMS.,Improving highway safety in Bangladesh: Road improvementand the potential application of iRAP, 24th ARRB Confer-ence Building on 50 years of road and transport research,Melbourne, Australia, 13-15 October 2010, pg- 161 (Abstractbook), (CD proceedings).
[6] BRTA Annual Report 2008, Bangladesh Road TransportAuthority, 2009.
[7] Abegaz T, Berhane Y, Worku A, Assrat A, Assefa A., Effectsof excessive speeding and falling asleep while driving oncrash injury severity in Ethiopia: A generalized ordered logitmodel analysis, Accident Analysis and Prevention 71: pp. 15-21, 2014.
[8] Knight PJ, Iverson D, Harris MF., The perceptions of youngrural drivers in NSW, Australia of speeding and associatedrisk: A mixed methods study, Accident Analysis and Preven-tion 55: pp. 172- 177, 2013.
[9] He J, King M, Watson B, Rakotonirainy A, Fleiter J., Speedenforcement in China: National, provincial and city initia-tives and their success, Accident Analysis and Prevention50: pp. 282- 288, 2013.
[10] Evans L., Traffic Safety, Science Serving Society, BloomfieldHills, MI, USA, 2004.
[11] Soole DW, Watson BC, Fleiter JJ., Effects of average speedenforcement on speed compliance and crashes: A review ofthe literature, Accident Analysis and Prevention 54: pp. 46-56, 2013.
[12] Petegem JWH, Wegman F., Analyzing road design riskfactors for run-off-road crashes in the Netherlands with crashprediction models,Journal of Safety Research 49: pp. 121-127, 2014.
[13] Quddus M., Exploring the relationship between averagespeed, speed variation, and accident rates using spatialstatistical models and GIS, Journal of Transportation Safetyand Security 5: pp. 27- 45, 2013.
[14] Retting R, Cheung I., Traffic speeds associated with im-plementation of 80 mph speed limits on West Texas ruralinterstates, Journal of Safety Research 39: pp. 529- 534,2008.
[15] Mussa R, Muchuruza V., Safety analysis of Florida ruralinterstate freeway travel in relation to the 65 kmh (40mihr) minimum speed regulation, Journal of TransportationEngineering 132: pp. 699- 707, 2006.
[16] Wolshon B, Ishak S, Qi Y, Korkut M, Sun X, Alecsandru C.,Trucker perceptions of lane restriction and differential speedlimit policies on freeways, Journal of Transportation Safetyand Security 1: pp. 101- 120, 2009.
[17] Cheng W, Washington SP., Experimental evaluation ofhotspot identification methods, Accident Analysis and Pre-vention 37: pp. 870- 881, 2005.
[18] Elvik R., State- of- the- art approaches to road accidentblack spot management and safety analysis of road network,Institute of Transport Economics, Oslo, 2007.
[19] Geurts K, Wets G, Brijs T, Vanhoof K., Identification and
ranking of black spots: Sensitivity analysis, TransportationResearch Record 1897: pp. 34- 42, 2004.
[20] Washington S, Haque MM, Oh J, Lee D., Applying quantileregression for modeling equivalent property damage onlycrashes to identify accident blackspots, Accident Analysisand Prevention 66: pp. 136- 146, 2014.
[21] Lundberg J, Rollenhagen C, Hollnagel E., What you findis not always what you fixHow other aspects than causesof accidents decide recommendations for remedial actions,Accident Analysis and Prevention 42: pp. 2132- 2139, 2010.
Shakil Mohammad Rifaat was born inDhaka, Bangladesh, in 1976. He receivedhis PhD degree in transportation engineer-ing from the University of Calgary, Al-berta, Canada and Masters degree (Special-ization: Transportation Engineering) fromthe National University of Singapore. Hedid his B.Sc. in Civil Engineering degreefrom Bangladesh University of Engineering
and Technology in 2000. He joined at the Islamic University ofTechnology in 2010 and now is working as an Associate Professorin the Department of Civil & Environmental Engineering . Hismain research interests are Traffic Safety, Transportation DataAnalysis, Econometric Modeling. Dr. Rifaat is the author of severalarticles published in the premium journals.
Mosabbir Pasha was born in Chittagong,Bangladesh, in 1990. He received his B.Sc.degree in civil engineering from the IslamicUniversity of Technology, Board Bazar,Gazipur, in 2012. He is working as a Lec-turer in the Department of Civil & Environ-mental engineering with the Islamic Univer-sity of Technology. His main research inter-ests are Sustainable Transportation System,
Traffic and Pedestrian Safety and Pavement Design.
Mahmudul Hasan Shovon was born inMunshigonj, Bangladesh, in 1991. He re-ceived his B.Sc. degree in civil engineeringfrom the Islamic University of Technology,Board Bazar, Gazipur, in 2013. At present,he is doing M.Sc. in transportation systemsat Technische Universitt Mnchen (TUM)in Munich, Germany. His research interestsinclude Transportation Infrastructure, Re-
source Allocation and Management, Smart Infrastructure System.

50 IUT JOURNAL OF ENGINEERING AND TECHNOLOGY (JET), VOL. 12, NO. 1, JUNE 2015
Sajidur Rahman Nafis was born in Dhaka,Bangladesh, in 1991. He received his B.Sc.degree in civil engineering from the IslamicUniversity of Technology, Board Bazar,Gazipur, in 2013. From 2014, he is work-ing as research assistant at Louisiana TechUniversity in Louisiana, USA. His researchinterests include Transportation Infrastruc-ture, Resource Allocation and Management,
Smart Infrastructure System etc.
Md. Kamruzzaman Haque Limon wasborn in Sirajgonj, Bangladesh, in 1991.He received his B.Sc. degree in civil en-gineering from the Islamic University ofTechnology, Board Bazar, Gazipur, in 2012.He is working as a Lecturer at Departmentof Civil engineering in Stamford Univer-sity, Bangladesh. His main research inter-ests are Integrated Transportation System,
Crash analysis, Traffic safety etc.