combustion fundamentals
TRANSCRIPT
Assessed Coursework Submission
Module U04589 Module Motorsport Engine Technology
Assignment title/No
Coursework 1 Due date:
28/11/2014
Estimated total time spent on 48 Hours
If this is a group assignment, please enter all group members’ numbers, names, andif relevant, group number or name.
StudentNo(s):
Student Name(s):
12019421 Jack Hordley Group: N/A
Statement of Compliance (please tick to indicate that all elements are included)
I/We have enclosed all the required elements of the coursework submission
I/We have attached a completed copy of the relevant mark-scheme for this assignment, showing the overall mark I/we believe this work deserves
I/We declare that the work submitted is my/our own and that the work I/we submit is fully in accordance with the University regulations regarding assessments (www.brookes.ac.uk/uniregulations/current)
Student Signature(s):Date:
FOR SCHOOL USE ONLY
Received Date received by
document.docx Page 1
Notes.
Module U04589 - Motorsport Engine Technology
Course-work 1: Engine test-rig measurements, combustion and performance analysis
Module No. and Name : U04589 Motorsport Engine
Technology
Student Number : 12019421
Student Name : Jack Hordley
Lab Session and Date : Week 4 & Week 8
Report Submission date : 28/11/2014
Total Number of Words(excludes captions, and
: 890
document.docx Page 2
tables)
Mark Scored :
Module Leader: Dr Fabrizio BonatestaRoom R1.05Email: [email protected]
document.docx Page 3
1.0 Introduction
This assignment will look at the working principles and
performance parameters of an internal combustion Si engine.
The engine investigated is a 1.6 Litre Direct injection with
turbocharger and intercooling. This is coupled to a Visio
Schenck eddy dyno to give brake work reading. Sensor include
an optical crank sensor to give engine position, pressure
sensor in cylinder, inlet and exhaust. Thermo coupling sensors
to give air temperatures and fuel meter (400cc capacity) to
give specific fuel consumption. 9 operating condition will be
surveyed with varying load and speed (60, 90 & 120 NM load @
1600, 2300 & 3000 RPM). The data will be analysed and graphs
produced to understand how combustion process and engine
performance varies.
2.0 Methodology
The engine data will be processed in excel to provide graphs
of varying parameters to compare engine indicated and brake
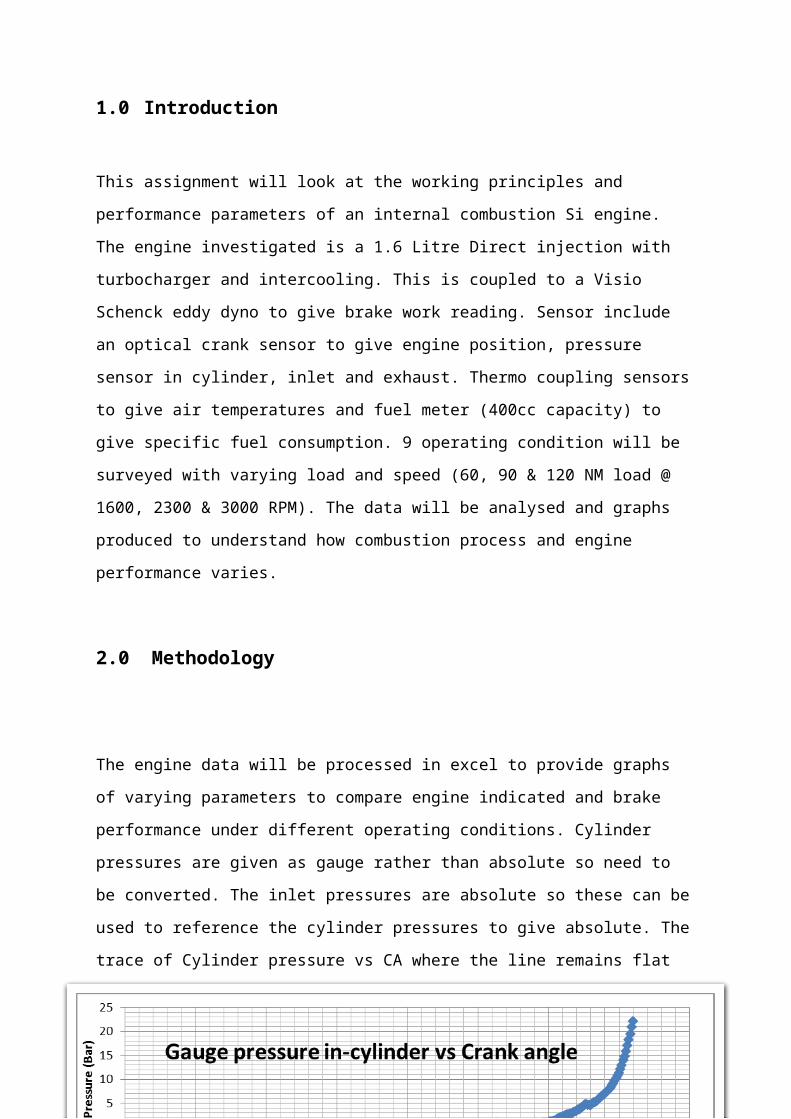
performance under different operating conditions. Cylinder
pressures are given as gauge rather than absolute so need to
be converted. The inlet pressures are absolute so these can be
used to reference the cylinder pressures to give absolute. The
trace of Cylinder pressure vs CA where the line remains flat
document.docx Page 4
before rising is said to be about equal to the mean inlet
pressure. For 1600rpm @ 60N/M AVG Inlet = 0.632767361 and AVG
Pressure from 150-180 CA = -0.398330645. So 0.632767361- -
0.398330645 = 1.0311 Bar.
3.0 Results and Discussion
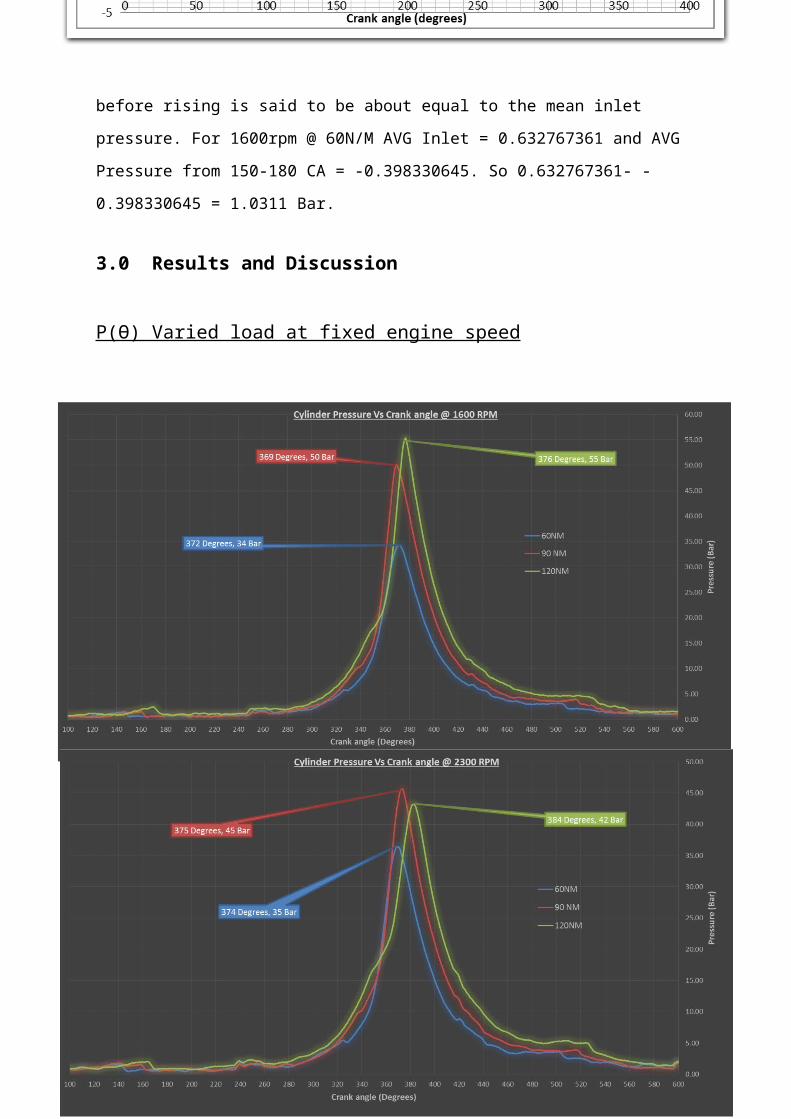
P(Ѳ) Varied load at fixed engine speed
document.docx Page 5

As can be seen from the graphs, peak cylinder pressure occurs
later in the cycle as load increases, this is likely due to
the denser A/F mixture requiring less ignition advance. Also
peak pressure in cylinder increases with load as the cylinder
is more efficiently filled. At 2300 RPM peak pressure is
greatest at 90NM load. It’s possible that air velocity is kept
higher at this speed when the throttle is open less, so
filling the cylinder more efficiently. This combined with
later ignition gives a higher cylinder pressure.
document.docx Page 6
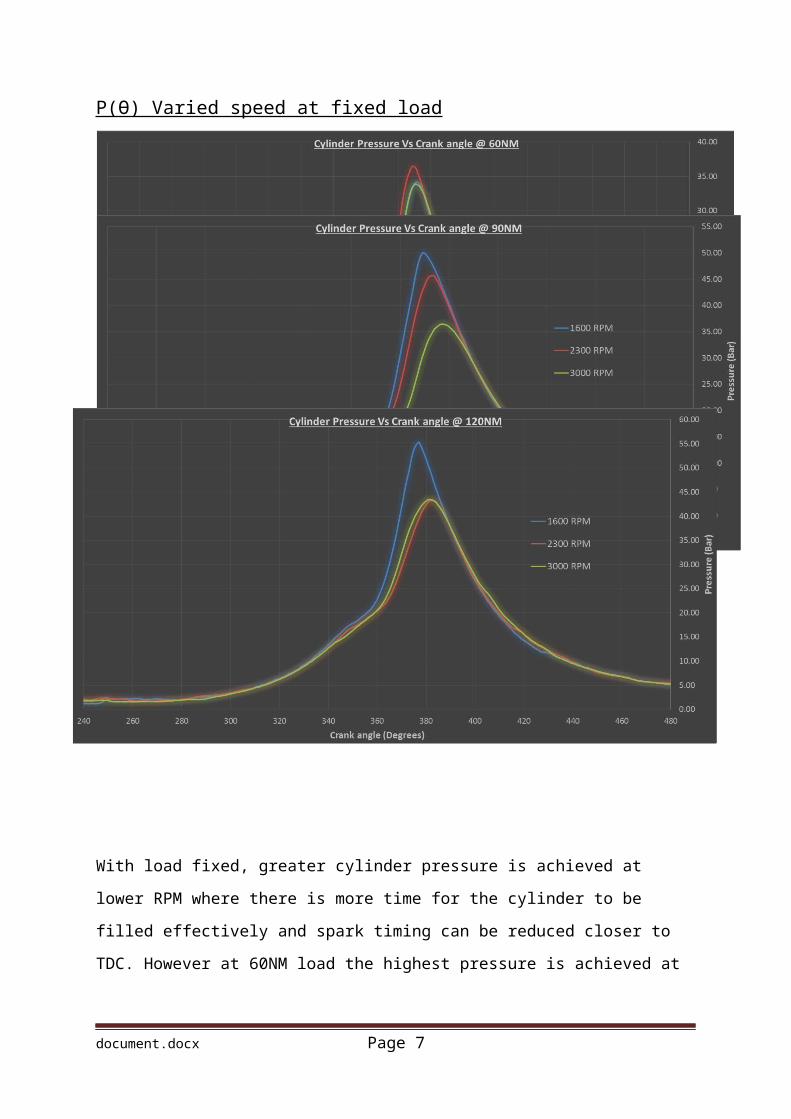
P(Ѳ) Varied speed at fixed load
With load fixed, greater cylinder pressure is achieved at
lower RPM where there is more time for the cylinder to be
filled effectively and spark timing can be reduced closer to
TDC. However at 60NM load the highest pressure is achieved at
document.docx Page 7
2300RPM, this could be a function of camshaft timing providing
better cylinder filling at this speed.
document.docx Page 8
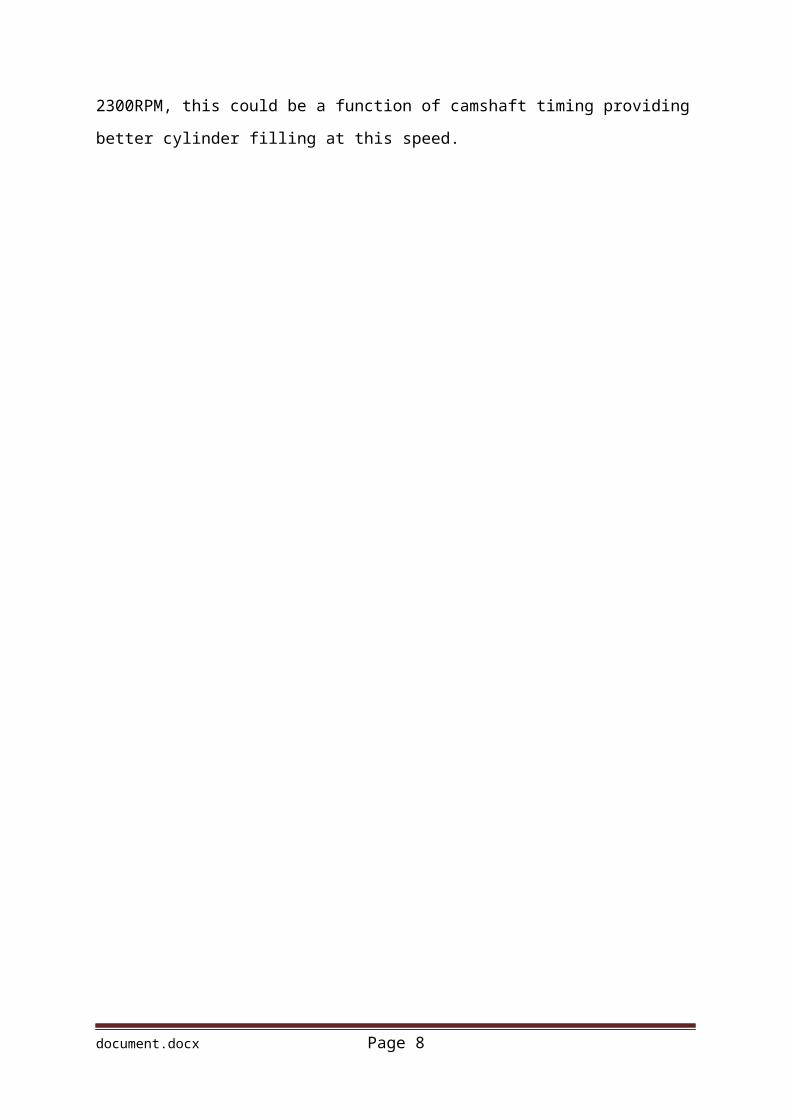
P(V) Fixed speed Varied load
document.docx Page 9

From the graphs it can be seen that at higher load the
positive work (upper loop) is greater and the lower loop
containing pumping losses is reduced. Pumping loop mainly
above atmospheric pressure due to turbocharger.
document.docx Page 10
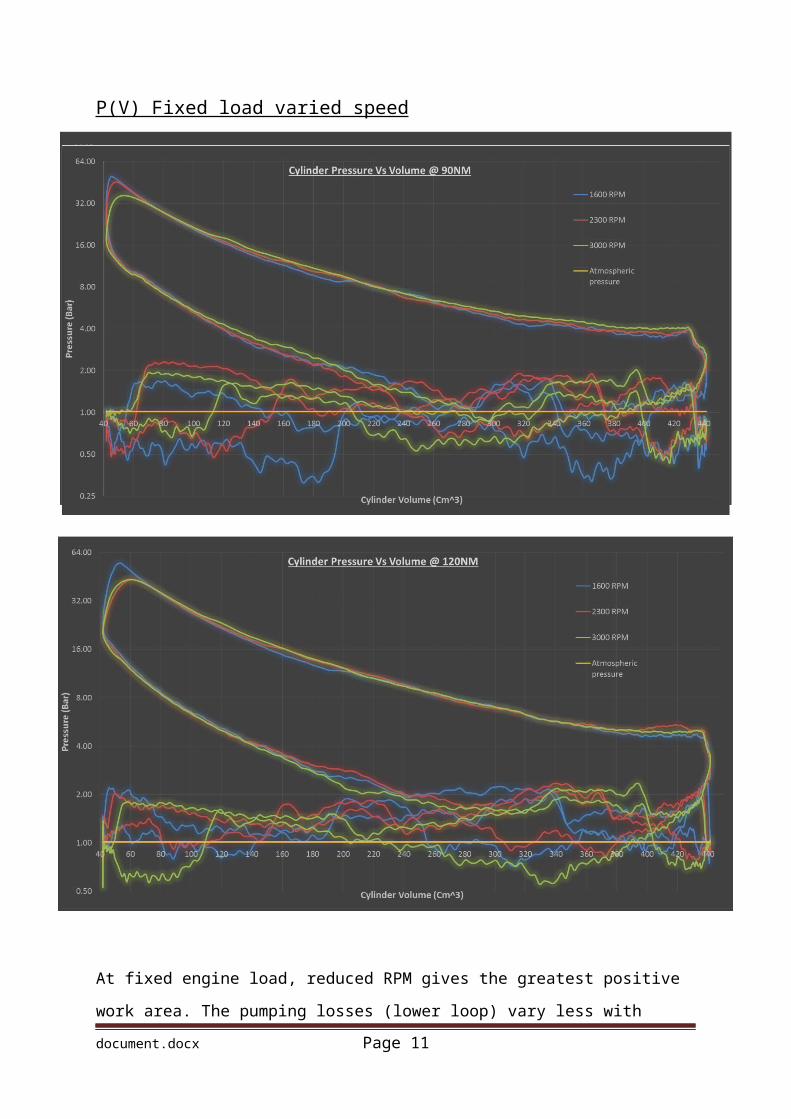
P(V) Fixed load varied speed
At fixed engine load, reduced RPM gives the greatest positive
work area. The pumping losses (lower loop) vary less with document.docx Page 11
engine speed than with load as the throttle position variance
is less. Time losses are also reduced at low RPM so more
positive work can occur just after TDC.
document.docx Page 12
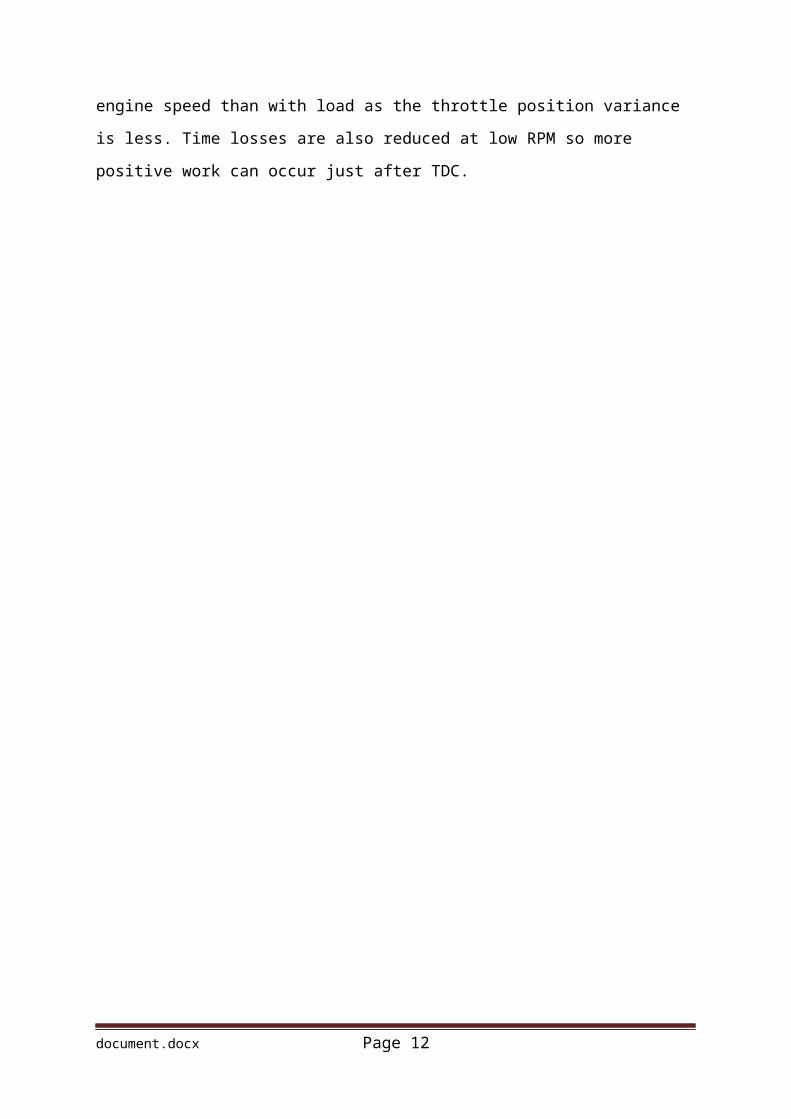
Heat release per crank angle (fixed speed)
document.docx Page 13

At low load more work is produced before TDC (0 degrees) as
ignition has to take place sooner for the lower density charge
to ignite. At high load ignition occurs later in the cycle so
more heat is released on the power stroke, also the denser
charge has a higher energy content so produces more heat.
document.docx Page 14

Heat release per crank angle (fixed load)
document.docx Page 15

At fixed load, peak heat release is highest at low RPM where
ignition time losses are less and time for heat transfer to
take place when the piston is near the top of its stroke
longer. Traces begin to reduce when the flame terminates at
document.docx Page 16
the cylinder wall and heat is lost to the coolant rather than
transferred as positive work to the piston.
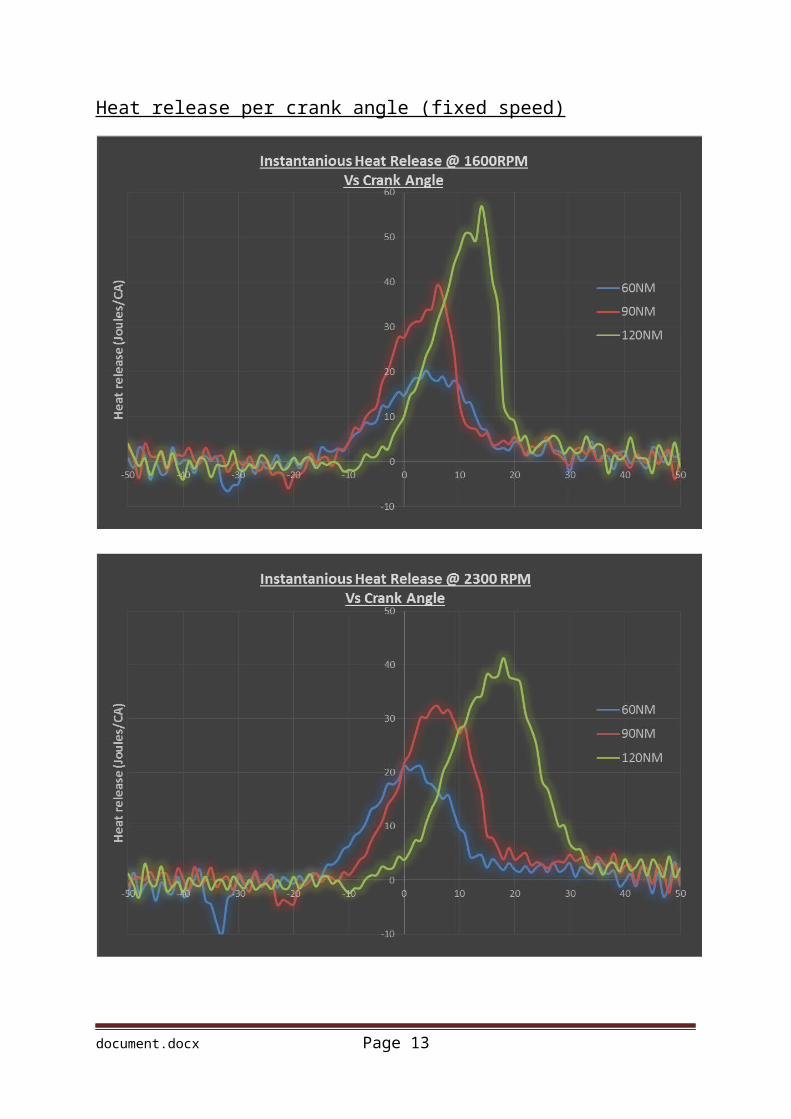
Brake vs Indicated Quantities
Power increases with load and engine speed. Brake power is
less than the indicated power as it does not contain
frictional losses.
document.docx Page 17
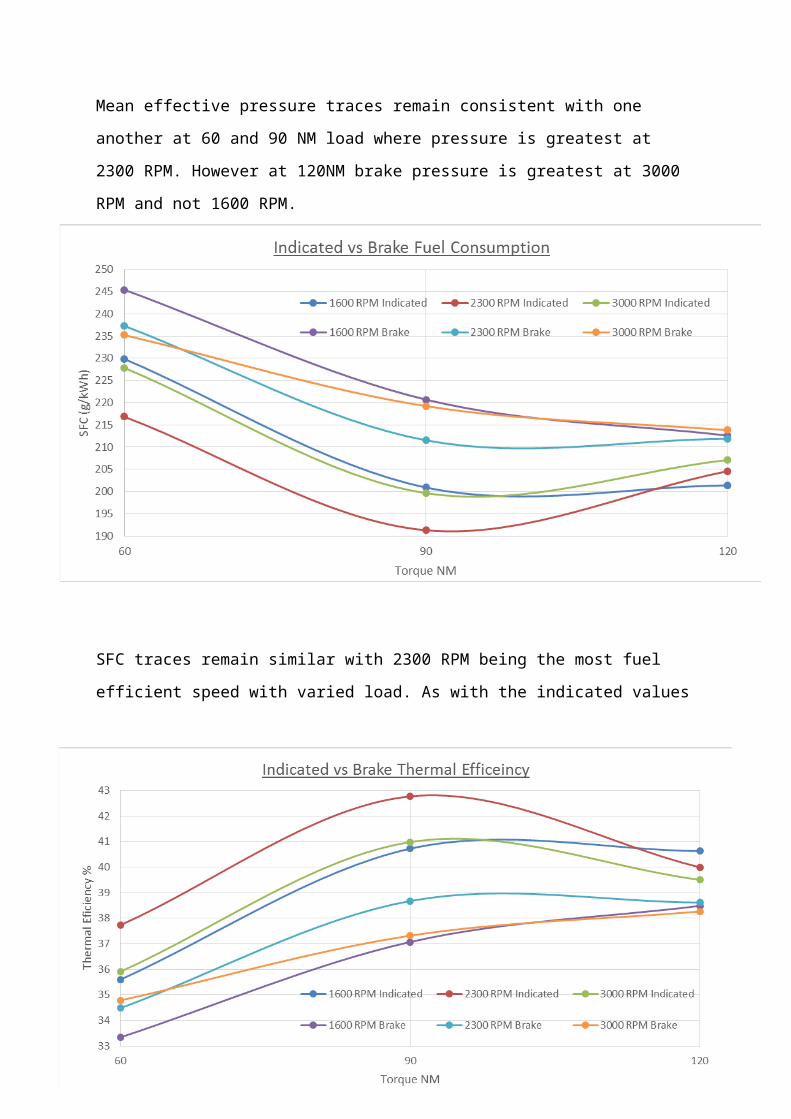
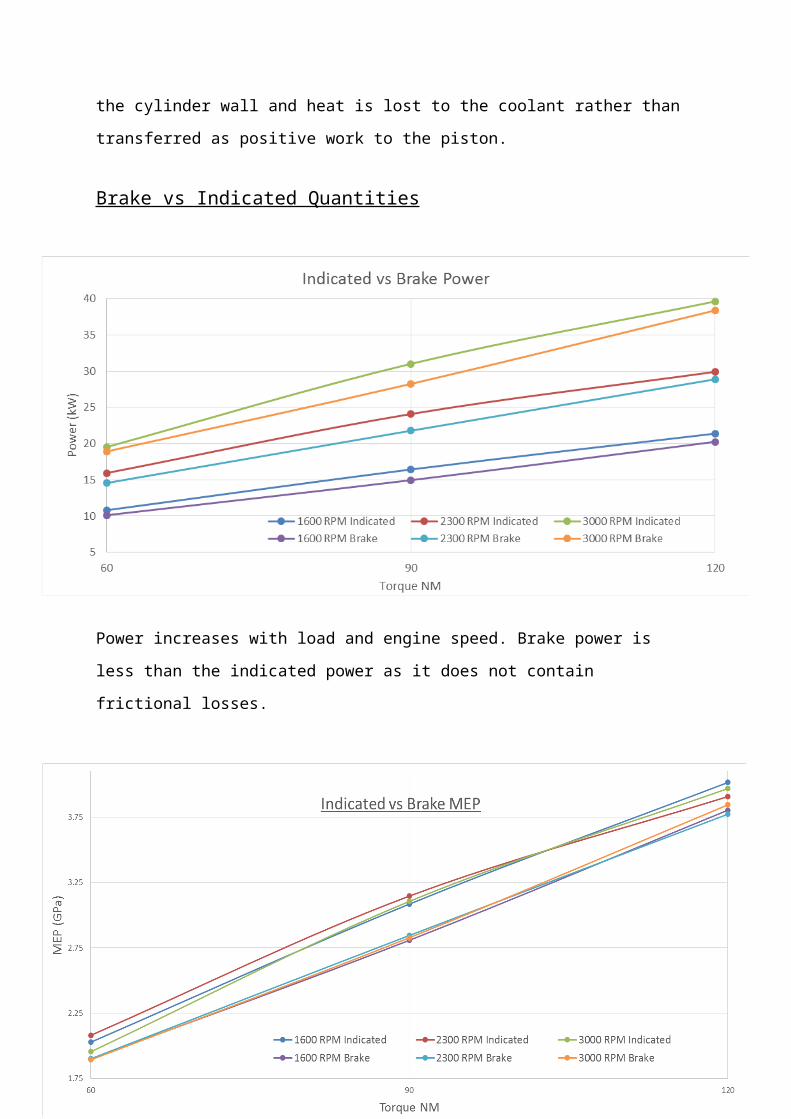
Mean effective pressure traces remain consistent with one
another at 60 and 90 NM load where pressure is greatest at
2300 RPM. However at 120NM brake pressure is greatest at 3000
RPM and not 1600 RPM.
SFC traces remain similar with 2300 RPM being the most fuel
efficient speed with varied load. As with the indicated values
document.docx Page 18
the engine uses less fuel per unit of energy at 3000 RPM than
at 1600 RPM for both 60 and 90 NM load.
Greatest thermal efficiency is achieved at 2300RPM for both
brake and indicated. Thermal efficiency drops off at low load
where pumping losses are increased but friction remains the
same. The brake thermal efficiency does not drop off at the
same rate as the indicated quantities at 120NM load but they
do follow the same trend as efficiency becomes greater at
1600RPM than it does at 3000RPM.
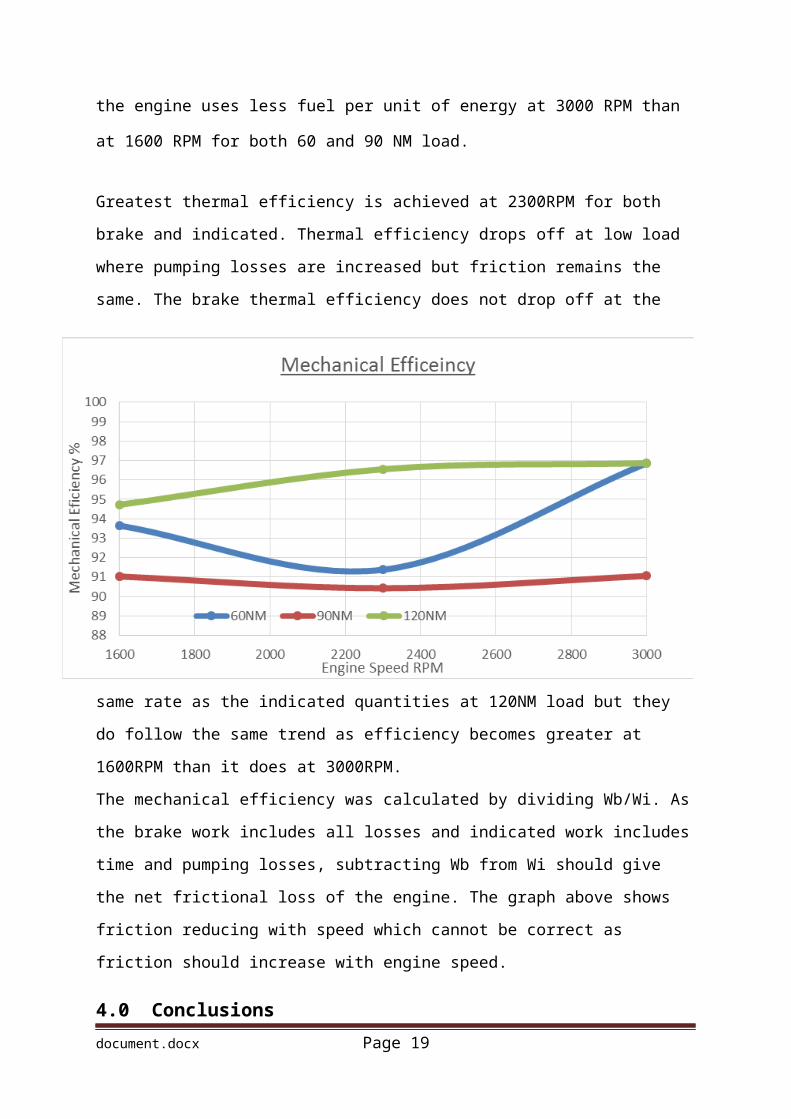
The mechanical efficiency was calculated by dividing Wb/Wi. As
the brake work includes all losses and indicated work includes
time and pumping losses, subtracting Wb from Wi should give
the net frictional loss of the engine. The graph above shows
friction reducing with speed which cannot be correct as
friction should increase with engine speed.
4.0 Conclusionsdocument.docx Page 19
Overall the indicated quantities were very similar to the
brake quantities. Inaccuracies in the combustion data will
come from the fact that the value for gamma was assumed to be
constant. This value would actually vary with combustion
temperature. From analysing the results is can be seen that
the greatest gains in performance and efficiency are to be had
by reducing the pumping losses and time losses in the PV
diagram as frictional losses are minimal.
document.docx Page 20
5.0 References
Collin R.Ferguson & Allan T.Kirkpatrick (2001). Internal Combustion Engines. United kingdom: John Wiley & Sons. 6-14 & 39-53.
E M Goodger (1977). Combustion Calcultions. Surrey: The Macmillan Press LTD. 44-55 & 71-77.
John B. Heywood (1988). Internal Combustion Engine Fundamentals. Ney York: McGraw-Hill Book Company. 508-514.
document.docx Page 21
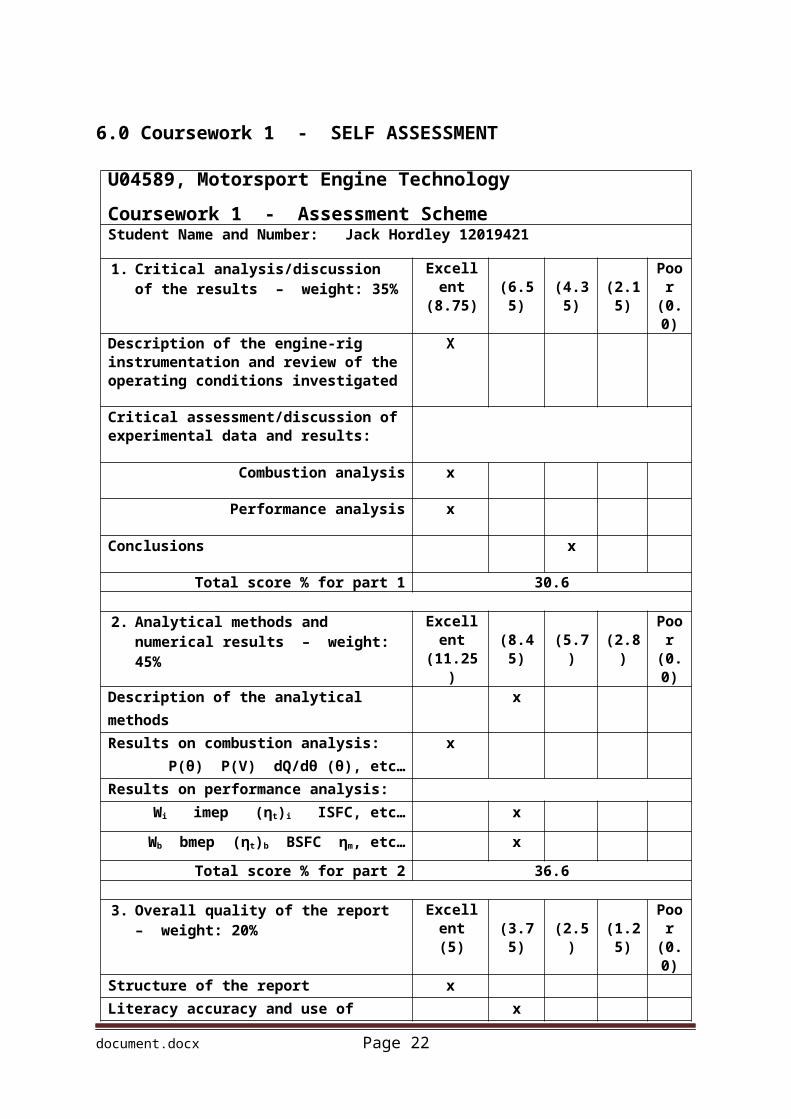
6.0 Coursework 1 - SELF ASSESSMENT
U04589, Motorsport Engine TechnologyCoursework 1 - Assessment SchemeStudent Name and Number: Jack Hordley 12019421
1. Critical analysis/discussion of the results – weight: 35%
Excellent
(8.75)(6.55)
(4.35)
(2.15)
Poor
(0.0)
Description of the engine-rig instrumentation and review of theoperating conditions investigated
X
Critical assessment/discussion ofexperimental data and results:
Combustion analysis x
Performance analysis x
Conclusions x
Total score % for part 1 30.6
2. Analytical methods and numerical results – weight: 45%
Excellent
(11.25)
(8.45)
(5.7)
(2.8)
Poor
(0.0)
Description of the analytical methods
x
Results on combustion analysis:P(θ) P(V) dQ/dθ (θ), etc…
x
Results on performance analysis:Wi imep (ηt)i ISFC, etc… x
Wb bmep (ηt)b BSFC ηm, etc… xTotal score % for part 2 36.6
3. Overall quality of the report – weight: 20%
Excellent(5)
(3.75)
(2.5)
(1.25)
Poor
(0.0)
Structure of the report xLiteracy accuracy and use of x
document.docx Page 22

referencesQuality of language/expression xQuality of visual aids (plots, figures and tables)
x
Total score % for part 3 16.25Total Mark % 83.45%
document.docx Page 23