color segmentation of complex document images
TRANSCRIPT
COLOR SEGMENTATION OF COMPLEX DOCUMENT IMAGES
N. Nikolaou, N. Papamarkos Image Processing and Multimedia Laboratory
Department of Electrical & Computer Engineering Democritus University of Thrace
67100 Xanthi, Greece
Keywords: Color document segmentation, RGB color space, Mean shift, Edge preserving smoothing.
Abstract: In this paper we present a new method for color segmentation of complex document images which can be used as a preprocessing step of a text information extraction application. From the edge map of an image, we choose a representative set of samples of the input color image and built the 3D histogram of the RGB color space. These samples are used to locate a relatively large number of proper points in the 3D color space and use them in order to initially reduce the colors. From this step an oversegmented image is produced which usually has no more than 100 colors. To extract the final result, a mean shift procedure starts from the calculated points and locates the final color clusters of the RGB color distribution. Also, to overcome noise problems, a proposed edge preserving smoothing filter is used to enhance the quality of the image. Experimental results showed the method’s capability of producing correctly segmented complex color documents while removing background noise or low contrast objects which is very desirable in text information extraction applications. Additionally, our method has the ability to cluster randomly shaped distributions.
1 INTRODUCTION
Printed documents in color are very common nowadays. To be able to exploit their textual content, the identification of text regions is substantial. This can lead to built systems capable to index, classify and retrieve them automatically. The transformation of the text into its electronic form via OCR is also a very useful operation.
Objects on printed documents that appear uniform for human perception, become noisy with unwanted variations through the digitization process. So, digitized documents contain thousands of colors and a color reduction preprocessing step is necessary. The purpose is to create a simplified version of the initial image where characters can be extracted as solid items, by utilizing a connected component analysis and labeling procedure.
Various types of methods for color reduction in text information applications have been proposed in the literature. Zhong (1995) used the smoothed RGB color histogram to detect local maxima and segment the color image. Chen’s (1998) work is based on the
YIQ color model and the resulted images contain 42 or less colors. Sobottka (2000) approaches the color segmentation of color documents with a graph-theoretical clustering technique. First the 3D histogram of the RGB color space is built and a pointer to its larger neighbor cell is stored. Chains of cells pointing to the same local maximum are identified and the color clusters are formed. Hase (2001) algorithm is based on the uniform color space CIE L*a*b*. Initially, the method partitions the three axes so that the color space is formed into many cubes. Those with frequency lower than 1/1000 or not larger than their neighbors are rejected. Remaining cubes define the representative colors and through a voronoi tessellation procedure the final color centers are adopted. Strouthopoulos (2002) approach is based on an adaptive color reduction (ACR) method which first obtains the optimal numbers of colors and then segments the image. This is achieved by a self-organized feature map (SOFM) neural network. Wang (2005) uses the same approach as Sobottka (2000). Also, a similar work with the application of this paper (Hase, 2003)
This paper was partially supported by the project Archimedes 04-3-001/4 and Pythagoras 1249-6
220Nikolaou N. and Papamarkos N. (2006).COLOR SEGMENTATION OF COMPLEX DOCUMENT IMAGES.In Proceedings of the First International Conference on Computer Vision Theory and Applications, pages 220-227DOI: 10.5220/0001366202200227Copyright c© SciTePress
is presented from the viewpoint of the influence of resolution to color document analysis.
Dealing with complex color documents such as cover books or journal covers raises some challenging difficulties. Text is overlaid on images or graphics and often it is impossible to spatially define the background.
Generally, a color segmentation algorithm for text information extraction applications must be able to perform its task without oversegmenting characters and still preventing fusion with the background. Additionally, it is desirable to merge low contrast objects with their background and create large compact areas. This will result to a small number of connected components, so the outcome of a text information extraction algorithm will be extensively improved.
2 DESCRIPTION OF THE METHOD
In this paper, we propose an approach which efficiently approximates the RGB color distribution of the image by taking advantage an important property of the edge map. Specifically, we sub sample the image by selecting only those pixels which are local minima in the 8-neighborhood on the edge image. This ensures that the samples are taken from inner points of the objects so fuzzy areas are avoided. Also, all objects will be represented in the obtained sample set. The benefits of this approach are analyzed in section 4.1.
These samples are used in the next step to initially reduce the colors of the input image with a relatively large number of colors, usually no more than 100 (section 4.2). The extracted image at this stage is oversegmented.
The resulted color centers are then used by a mean shift operation (Fukunaga, 1975), (Cheng, 1995), (Comaniciu, 2002) to locate the final points of the RGB color space, on which the algorithm will be based to extract the final result (sections 4.3, 4.4).
In order to deal with noisy cases and to improve the performance of the system, a proposed edge preserving smoothing filter is used (section 3) as a preprocessing step.
The overall process consists of the following stages. 1. Edge preserving smoothing. 2. Color edge detection. 3. RGB color space approximation (Sub sampling). 4. Initial color reduction. 5. Mean shift
6. Finalization of the color reduction process. The method is implemented in a visual
environment and the computer system used for all tests is a PENTIUM 4 PC with 2.4GHz CPU speed and 512MB RAM.
In section 5 of this paper, experimental results are depicted where the efficiency of the method is demonstrated. Computation time is also mentioned.
3 EDGE PRESERVING SMOOTHING
A common technique for removing noise from images is blurring them by replacing the center pixel of a window with the weighted average of the pixels in the window (Mean, Gaussian filters). Through this process valuable information is lost and the details of object boundaries are deformed. A solution to this problem is to use an anisotropic diffusion process (Perona, 1990). In this paper we present a filter which performs as well as anisotropic diffusion but requires less computation time.
First we calculate the Manhattan color distances id between the center pixel ca and the pixels ia in
a 3x3 window. Values are normalized in [0,1]
c i c i c ii a a a a a ad R R G G B B= − + − + − (1)
To compute the coefficients for the convolution mask of the filter the following equation is used.
(1 ) pi ic d= − (2)
In words, ic receives larger values for smaller values of id . This concludes to the following convolution mask
1 2 3
4 58
6 7 81
1 0
ii
c c cc c
c c c c=
⎡ ⎤⎢ ⎥⎢ ⎥⎢ ⎥⎣ ⎦∑
(3)
Factor p in equation (2) scales exponentially the color differences. Thus it controls the amount of blurring performed on the image. As it gets larger, coefficients with small color distance from the center pixel increase their relative value difference from coefficients with large color distance, so the blurring effect decreases. A fixed value 10 is used for all of our experiments since this resulted in very good performance.
COLOR SEGMENTATION OF COMPLEX DOCUMENT IMAGES
221
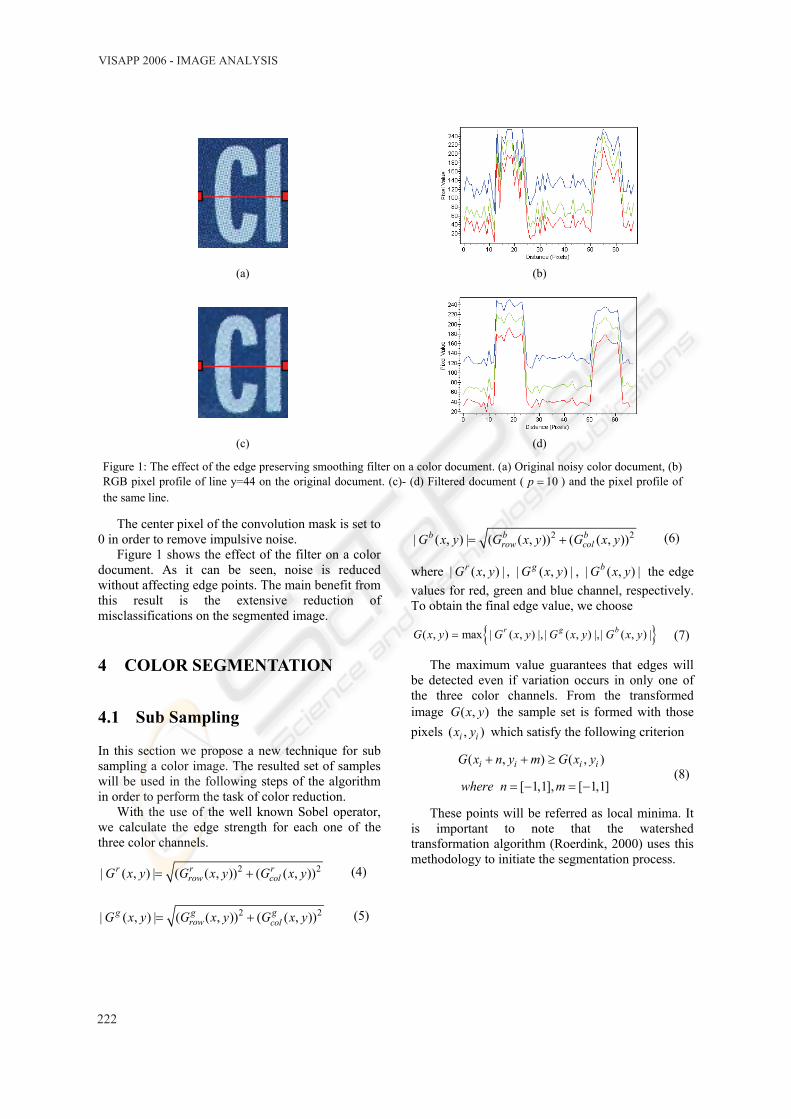
The center pixel of the convolution mask is set to 0 in order to remove impulsive noise.
Figure 1 shows the effect of the filter on a color document. As it can be seen, noise is reduced without affecting edge points. The main benefit from this result is the extensive reduction of misclassifications on the segmented image.
4 COLOR SEGMENTATION
4.1 Sub Sampling
In this section we propose a new technique for sub sampling a color image. The resulted set of samples will be used in the following steps of the algorithm in order to perform the task of color reduction.
With the use of the well known Sobel operator, we calculate the edge strength for each one of the three color channels.
2 2| ( , ) | ( ( , )) ( ( , ))r r rrow colG x y G x y G x y= + (4)
2 2| ( , ) | ( ( , )) ( ( , ))gg grow colG x y G x y G x y= + (5)
2 2| ( , ) | ( ( , )) ( ( , ))b b brow colG x y G x y G x y= + (6)
where | ( , ) |rG x y , | ( , ) |gG x y , | ( , ) |bG x y the edge values for red, green and blue channel, respectively. To obtain the final edge value, we choose
{ }( , ) max | ( , ) |, | ( , ) |, | ( , ) |r g bG x y G x y G x y G x y= (7)
The maximum value guarantees that edges will be detected even if variation occurs in only one of the three color channels. From the transformed image ( , )G x y the sample set is formed with those pixels ( , )i ix y which satisfy the following criterion
( , ) ( , )
[ 1,1], [ 1,1]
i i i iG x n y m G x y
where n m
+ + ≥
= − = − (8)
These points will be referred as local minima. It is important to note that the watershed transformation algorithm (Roerdink, 2000) uses this methodology to initiate the segmentation process.
(a) (b)
(c) (d)
Figure 1: The effect of the edge preserving smoothing filter on a color document. (a) Original noisy color document, (b) RGB pixel profile of line y=44 on the original document. (c)- (d) Filtered document ( 10p = ) and the pixel profile of the same line.
VISAPP 2006 - IMAGE ANALYSIS
222
The resulted set of pixels has some interesting characteristics. – Edge points are not represented in this set so
fuzzy areas are avoided. – Spatially, the samples are always inside the
objects of the image. – Every object’s color is represented in the sample
set. As a conclusion, we can assume that every
member of the local minima based extracted set of samples can be considered as a candidate cluster center. This assumption will be used in the next step of the algorithm to initially reduce the colors.
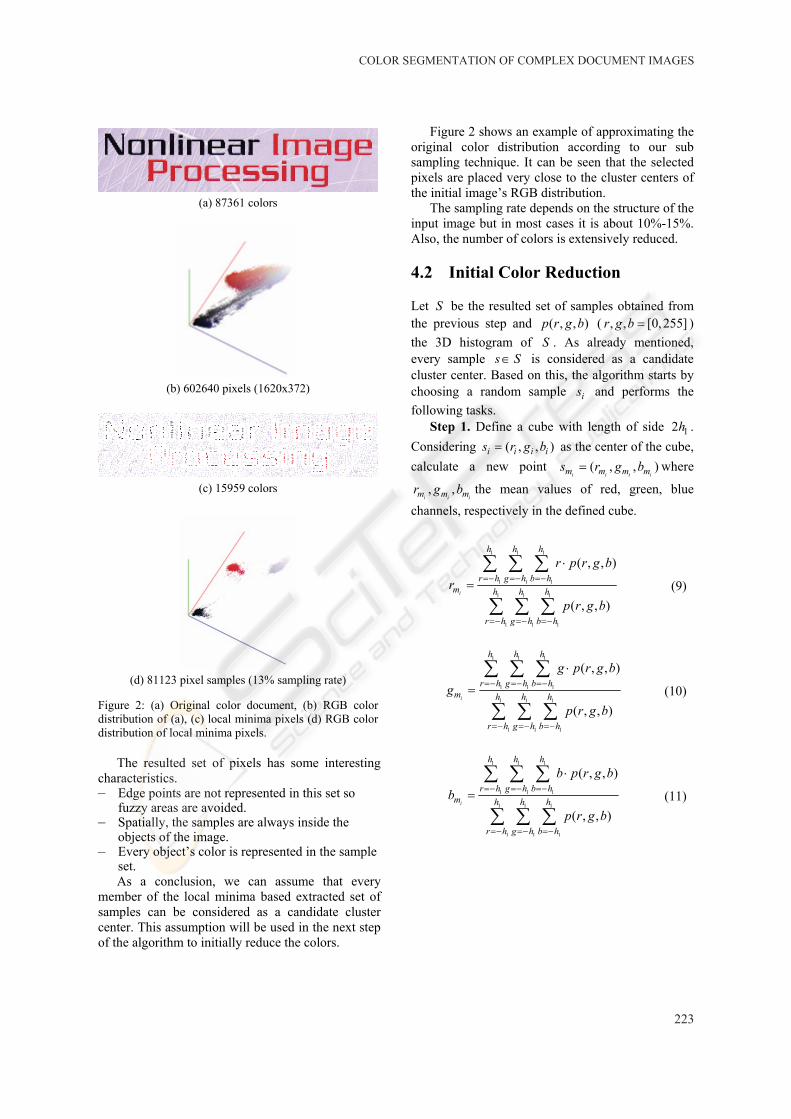
Figure 2 shows an example of approximating the original color distribution according to our sub sampling technique. It can be seen that the selected pixels are placed very close to the cluster centers of the initial image’s RGB distribution.
The sampling rate depends on the structure of the input image but in most cases it is about 10%-15%. Also, the number of colors is extensively reduced.
4.2 Initial Color Reduction
Let S be the resulted set of samples obtained from the previous step and ( , , )p r g b ( , , [0,255]r g b = ) the 3D histogram of S . As already mentioned, every sample s S∈ is considered as a candidate cluster center. Based on this, the algorithm starts by choosing a random sample is and performs the following tasks.
Step 1. Define a cube with length of side 12h . Considering ( , , )i i i is r g b= as the center of the cube, calculate a new point ( , , )
i i i im m m ms r g b= where
, ,i i im m mr g b the mean values of red, green, blue
channels, respectively in the defined cube.
1 1 1
1 1 1
1 1 1
1 1 1
( , , )
( , , )i
h h h
r h g h b hm h h h
r h g h b h
r p r g b
rp r g b
=− =− =−
=− =− =−
⋅
=∑ ∑ ∑
∑ ∑ ∑ (9)
1 1 1
1 1 1
1 1 1
1 1 1
( , , )
( , , )i
h h h
r h g h b hm h h h
r h g h b h
g p r g b
gp r g b
=− =− =−
=− =− =−
⋅
=∑ ∑ ∑
∑ ∑ ∑ (10)
1 1 1
1 1 1
1 1 1
1 1 1
( , , )
( , , )i
h h h
r h g h b hm h h h
r h g h b h
b p r g b
bp r g b
=− =− =−
=− =− =−
⋅
=∑ ∑ ∑
∑ ∑ ∑ (11)
(a) 87361 colors
(b) 602640 pixels (1620x372)
(c) 15959 colors
(d) 81123 pixel samples (13% sampling rate)
Figure 2: (a) Original color document, (b) RGB color distribution of (a), (c) local minima pixels (d) RGB color distribution of local minima pixels.
COLOR SEGMENTATION OF COMPLEX DOCUMENT IMAGES
223
Step 2. Label all points contained in the cube that has been examined.
Step 3. Choose a new unlabeled sample and go to step 1. If all samples are labeled then stop.
The new set of points mS created by the algorithm just described is used to initially reduce the colors of the image (initial clustering). This is done by assigning to the pixels of the original image the color of their nearest neighbor (Euclidean distance) in mS . The size of mS (number of points) depends on the size of the cube, namely on 1h . After several experiments the value of 1h was set to 32. With this value, the number of the obtained colors is relatively large and usually smaller than 100, thus the resulted image is oversegmented.
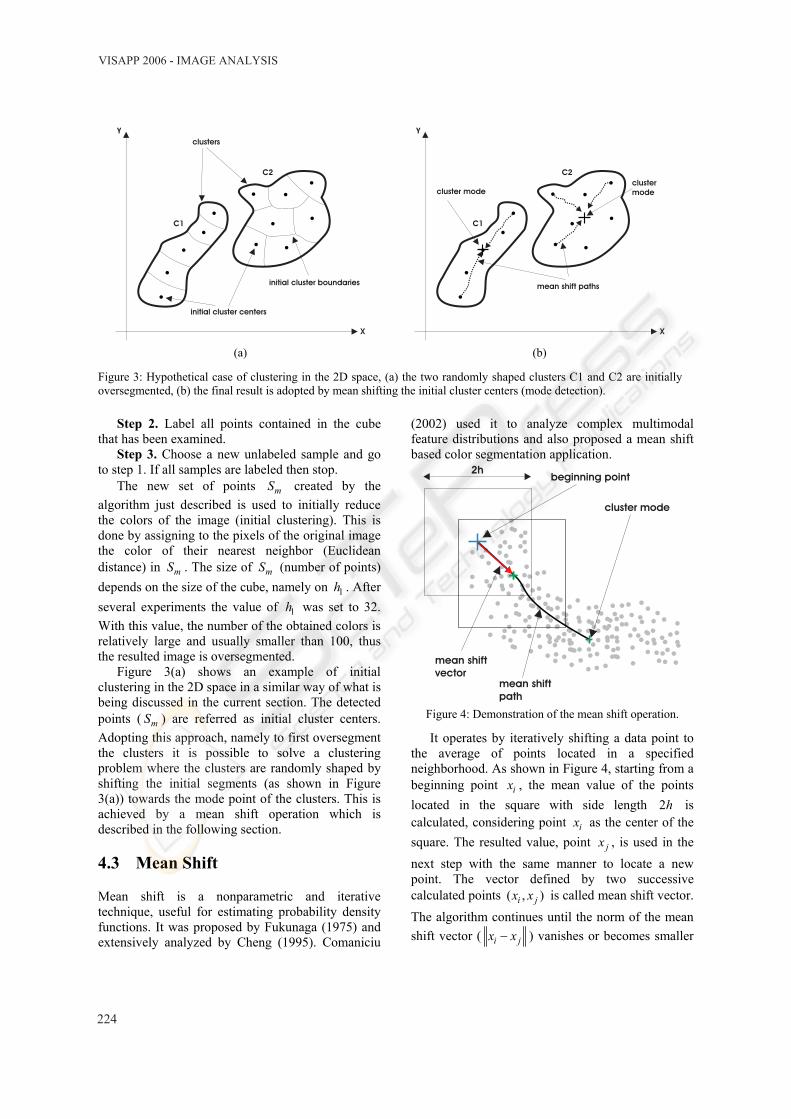
Figure 3(a) shows an example of initial clustering in the 2D space in a similar way of what is being discussed in the current section. The detected points ( mS ) are referred as initial cluster centers. Adopting this approach, namely to first oversegment the clusters it is possible to solve a clustering problem where the clusters are randomly shaped by shifting the initial segments (as shown in Figure 3(a)) towards the mode point of the clusters. This is achieved by a mean shift operation which is described in the following section.
4.3 Mean Shift
Mean shift is a nonparametric and iterative technique, useful for estimating probability density functions. It was proposed by Fukunaga (1975) and extensively analyzed by Cheng (1995). Comaniciu
(2002) used it to analyze complex multimodal feature distributions and also proposed a mean shift based color segmentation application.
cluster mode
mean shift
vector
2h
mean shift
path
beginning point
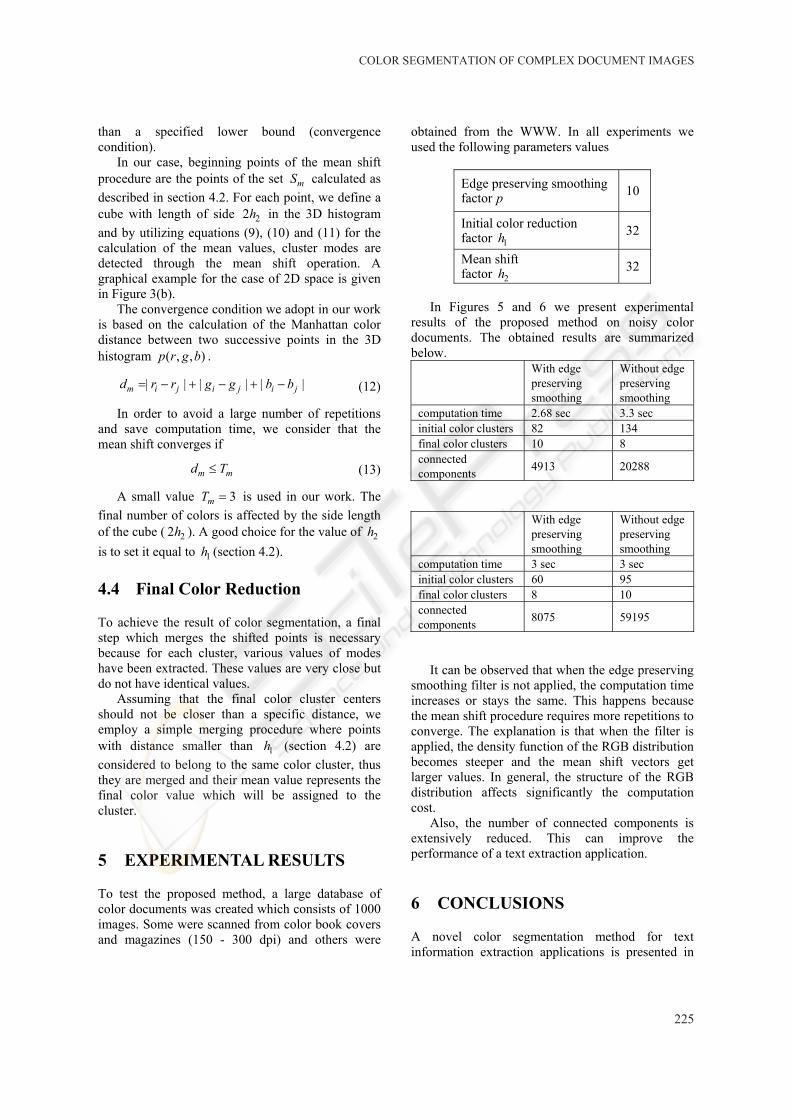
Figure 4: Demonstration of the mean shift operation.
It operates by iteratively shifting a data point to the average of points located in a specified neighborhood. As shown in Figure 4, starting from a beginning point ix , the mean value of the points located in the square with side length 2h is calculated, considering point ix as the center of the square. The resulted value, point jx , is used in the next step with the same manner to locate a new point. The vector defined by two successive calculated points ( , )i jx x is called mean shift vector. The algorithm continues until the norm of the mean shift vector ( i jx x− ) vanishes or becomes smaller
initial cluster centers
X
Y
clusters
C1
C2
initial cluster boundaries
X
Y
C1
C2
mean shift paths
cluster modecluster
mode
(a) (b)
Figure 3: Hypothetical case of clustering in the 2D space, (a) the two randomly shaped clusters C1 and C2 are initially oversegmented, (b) the final result is adopted by mean shifting the initial cluster centers (mode detection).
VISAPP 2006 - IMAGE ANALYSIS
224
than a specified lower bound (convergence condition).
In our case, beginning points of the mean shift procedure are the points of the set mS calculated as described in section 4.2. For each point, we define a cube with length of side 22h in the 3D histogram and by utilizing equations (9), (10) and (11) for the calculation of the mean values, cluster modes are detected through the mean shift operation. A graphical example for the case of 2D space is given in Figure 3(b).
The convergence condition we adopt in our work is based on the calculation of the Manhattan color distance between two successive points in the 3D histogram ( , , )p r g b .
| | | | | |m i j i j i jd r r g g b b= − + − + − (12)
In order to avoid a large number of repetitions and save computation time, we consider that the mean shift converges if
m md T≤ (13)
A small value 3mT = is used in our work. The final number of colors is affected by the side length of the cube ( 22h ). A good choice for the value of 2h is to set it equal to 1h (section 4.2).
4.4 Final Color Reduction
To achieve the result of color segmentation, a final step which merges the shifted points is necessary because for each cluster, various values of modes have been extracted. These values are very close but do not have identical values.
Assuming that the final color cluster centers should not be closer than a specific distance, we employ a simple merging procedure where points with distance smaller than 1h (section 4.2) are considered to belong to the same color cluster, thus they are merged and their mean value represents the final color value which will be assigned to the cluster.
5 EXPERIMENTAL RESULTS
To test the proposed method, a large database of color documents was created which consists of 1000 images. Some were scanned from color book covers and magazines (150 - 300 dpi) and others were
obtained from the WWW. In all experiments we used the following parameters values
Edge preserving smoothing factor p 10
Initial color reduction factor 1h 32
Mean shift factor 2h 32
In Figures 5 and 6 we present experimental
results of the proposed method on noisy color documents. The obtained results are summarized below.
With edge preserving smoothing
Without edge preserving smoothing
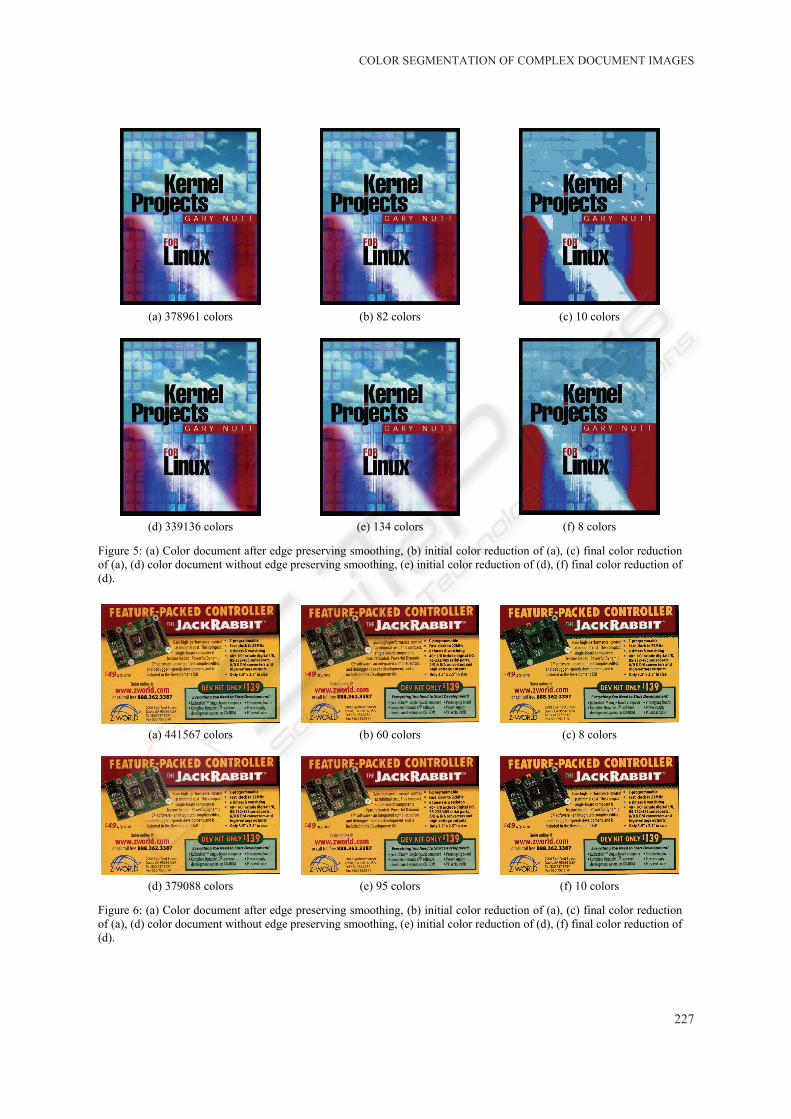
computation time 2.68 sec 3.3 sec initial color clusters 82 134 final color clusters 10 8 connected components 4913 20288
With edge preserving smoothing
Without edge preserving smoothing
computation time 3 sec 3 sec initial color clusters 60 95 final color clusters 8 10 connected components 8075 59195
It can be observed that when the edge preserving
smoothing filter is not applied, the computation time increases or stays the same. This happens because the mean shift procedure requires more repetitions to converge. The explanation is that when the filter is applied, the density function of the RGB distribution becomes steeper and the mean shift vectors get larger values. In general, the structure of the RGB distribution affects significantly the computation cost.
Also, the number of connected components is extensively reduced. This can improve the performance of a text extraction application.
6 CONCLUSIONS
A novel color segmentation method for text information extraction applications is presented in
COLOR SEGMENTATION OF COMPLEX DOCUMENT IMAGES
225
this paper. With an efficient sub sampling technique we first approximate the initial RGB distribution. The obtained samples are used to initially reduce the colors and by a mean shift procedure the final result is produced.
The method has been extensively tested on a large number of color documents and the results showed its capability of producing correct segmentation results where characters are not oversegmented or fused with the background. Also, unwanted low contrast objects are merged with their backgrounds and compact areas are created. These results are very desirable in text information extraction applications.
REFERENCES
Y. Zhong, K. Karu, A.K. Jain, 1995. Locating text in complex color images. Pattern Recognition 28 (10), 1523–1535.
W.Y. Chen and S.Y. Chen, 1998. Adaptive page segmentation for color technical journals’ cover images. Image and Vision Computing 16, 855-877.
K. Sobottka et al, 2000. Text Extraction from Colored Book and Journal Covers. International Journal on Document Analysis and Recognition, vol. 2, No. 4, pp. 163-176.
H. Hase, T. Shinokawa, M. Yoneda, C.Y. Suen, 2001. Character string extraction from color documents. Pattern Recognition 34 (7), 1349–1365.
C. Strouthopoulos, N. Papamarkos and A. Atsalakis, 2002. Text extraction in complex color documents. Pattern Recognition, Vol. 35, Issue 8, pp. 1743-1758.
Hiroyuki Hase, Masaaki Yoneda, Shogo Tokai, Jien Kato and Ching Y. Suen, 2003. Color segmentation for text extraction. International Journal on Document Analysis and Recognition 6(4): 271-284.
Bin Wang, Xiang-Feng Li, Feng Liu and Fu-Qiao Hu, 2005. Color text image binarization based on binary texture analysis. Pattern Recognition Letters, Volume 26, Issue 11, Pages 1650-1657.
Roerdink, J.B.T.M., Meijster, A, 2000. The watershed transform: Definitions, algorithms and parallelization strategies. Fundamenta Informaticae 41, 187–228
P. Perona, J. Malik, 1990. Scale-Space and Edge Detection Using Anisotropic Diffusion. IEEE Trans. Pattern Analysis and Machine Intelligence, Vol. 12, 629-639.
Κ. Fukunaga and L.D. Hostetler, 1975. The Estimation of the Gradient of a Density Function, with Applications in Pattern Recognition. IEEE Trans. Information Theory, vol. 21, pp. 32-40.
Y. Cheng, 1995. Mean Shift, Mode Seeking, and Clustering. IEEE Trans. Pattern Analysis and Machine Intelligence, vol. 17, no. 8, pp. 790-799.
D. Comaniciu and P. Meer, 2002. Mean Shift: A Robust Approach Toward Feature Space Analysis. IEEE
Trans. Pattern Analysis and Machine Intelligence, vol. 24, no. 5, pp. 603-619.
VISAPP 2006 - IMAGE ANALYSIS
226
(a) 378961 colors (b) 82 colors (c) 10 colors
(d) 339136 colors (e) 134 colors (f) 8 colors
Figure 5: (a) Color document after edge preserving smoothing, (b) initial color reduction of (a), (c) final color reduction of (a), (d) color document without edge preserving smoothing, (e) initial color reduction of (d), (f) final color reduction of (d).
(a) 441567 colors (b) 60 colors (c) 8 colors
(d) 379088 colors (e) 95 colors (f) 10 colors
Figure 6: (a) Color document after edge preserving smoothing, (b) initial color reduction of (a), (c) final color reduction of (a), (d) color document without edge preserving smoothing, (e) initial color reduction of (d), (f) final color reduction of (d).
COLOR SEGMENTATION OF COMPLEX DOCUMENT IMAGES
227