classification and idealized limit-equilibrium analyses of dome collapses at soufrière hills...
TRANSCRIPT
www.elsevier.com/locate/jvolgeores
Journal of Volcanology and Geotherm
Classification and idealized limit-equilibrium analyses of dome
collapses at Soufriere Hills volcano, Montserrat, during growth
of the first lava dome: November 1995–March 1998
John Simmons1, Derek Elsworth*, Barry Voight
College of Earth and Mineral Sciences, Penn State University, University Park, PA 16802, United States
Received 17 December 2003; accepted 5 August 2004
Abstract
Styles of dome collapse at Soufriere Hills volcano (SHV; November 1995–March 1998) are classified by relations between
extrusion rate prior to collapse and collapse volume. Four separate modes of collapse behavior are apparent. Notably, moderate
rates of extrusion are shown to result in two disparate modes of collapse: small-to-large collapses on steeply inclined failure
planes that switch to collapse volumes an order of magnitude larger that cut deeply into the dome core. For constant effusion
rates, this bifurcation in behavior is explained by the monotonic growth of a soft core that ultimately promotes the development
of a deep-seated failure over previously favored shallow failure modes. Models are developed to test this hypothesis that first
constrain magnitudes of cohesive and frictional strength with observed dome collapse morphologies and volumes. Evaluations
of dome strengths confirm the important role of a soft core in promoting deep failure. A nested model representing a cohesive
dome core, surrounded by a frictional rind, with constant rate of magma input, confirms the observed bifurcation in behavior,
and for invariant effusive activity. Importantly, failure volumes are shown to increase by close to an order of magnitude for a
few percent change in the proportion of dome core comprising cohesive material. This model is capable of replicating, a
posteriori, the approximate timing of failure for both small (250 m) and large (325 m) domes. The timing and style of the 17
September 1996 and June to November 1997 collapses are honored.
D 2004 Elsevier B.V. All rights reserved.
Keywords: lava dome; collapse; pyroclastic flows; bifurcation
0377-0273/$ - see front matter D 2004 Elsevier B.V. All rights reserved.
doi:10.1016/j.jvolgeores.2004.08.009
* Corresponding author. Fax: +1 814 865 3248.
E-mail addresses: [email protected]
(J. Simmons)8 [email protected] (D. Elsworth)8
[email protected] (B. Voight).1 Current affiliation: ExxonMobil Exploration Company, 233
Benmar, Houston, TX 77060.
1. Introduction
The collapse of lava domes is a complex and
hazardous phenomenon. Associated threats include
generation of pyroclastic flows, the triggering of
subsequent explosive activity that may generate
al Research 139 (2005) 241–258
J. Simmons et al. / Journal of Volcanology and Geothermal Research 139 (2005) 241–258242
column-collapse pyroclastic flows and widespread
ashfall, and the elevated potential for lahars. Erosion
of the carapace, disturbance of the talus shield
providing support for dome lava, and internal dome
forces, especially for the gas-infused Pelean-type
domes, are important contributors to collapse. Poten-
tial mechanisms for these failures include thrust forces
or mass weakness associated with an active lava lobe
intrusion or extrusion (Calder et al., 2002; Watts et al.,
2002; Voight et al., 2002), slope oversteepening by
erosion and piping (Voight and Elsworth, 1997; Fink
and Griffiths, 1998; Sparks et al., 2000), generation of
fluid overpressurization of a weak underlying stratum
(Lopez and Williams, 1993; Voight and Elsworth,
1997; Crowley and Zimbelman, 1997; Watters et al.,
2000), the driving of thermal fractures through the
brittle rind (Yamasato et al., 1998), rainwater vapor-
ization-induced overpressurization of the outer dome
(Matthews and Barclay, 2004; Simmons et al., 2004;
Elsworth et al., in press), and gas overpressurization of
the inner dome itself (Voight and Elsworth, 2000;
Elsworth and Voight, 2001).
The andesite lava dome of Soufriere Hills volcano
(SHV), Montserrat, B.W.I., evolved through several
eruptive styles from November 1995 to March 1998,
each associatedwith a particular style of dome collapse.
A small overall dome volume, relatively low extrusion
rate and relatively lowcollapse volumemarked the early
stage collapses of 1996. Later stage higher-volume
collapses of 1997 resulted in violent explosions. Each
style conforms to a systematic pattern of extrusion rate
and associated collapse volume.
The following provides a classification of dome
collapse styles during times of active lava effusion
based on the dome volume involved. Collapse styles
evolve from relatively innocuous small-to-large fail-
ures, to dangerous and potentially explosive major
failures. All collapse volumes 0–4�106 m3 Dense
Rock Equivalent (DRE) are referred to as small-to-
large collapses, those with volumes of 4–20�106 m3
DRE are termed major collapses, and collapses
involving greater than 20�106 m3 DRE are termed
gigantic collapses (after Calder et al., 2002); all
subsequent volumes will be referred to in terms of
DRE (Calder et al., 2002).
Behavioral signatures are identified for particular
collapse styles of SHV that can aid (and indeed have
aided) in risk assessments, both on Montserrat and at
similar andesite domes elsewhere. These observations
of collapse are supported by a simplified dual-region
limit-equilibrium model of the dome. The simple first-
order model incorporates a cohesive volatile-rich core
encapsulated by a primarily frictional, degassed rind.
Feasible rock mass strengths are defined by back
analysis, to provide a consistent suite of frictional and
cohesive strengths for the dual regions. The model is
applied to a growing dome to define the self-organized
change in collapse style as failure mode bifurcates from
initial shallow surface spalling to switch to a deep-
seated failure that cuts more deeply into the dome core.
Importantly, this occurs as a sudden switch from
shallow to deep, rather than as a progressive deepening
of the initial shallow failures. This behavior is followed
to define the style and approximate timing of major
failures in both relatively small (r=250 m) and large
(r=325 m) domes. The model is subsequently modified
to incorporate retrogressive failure, an alternative
mechanism for the development of major failures, in
an effort to explain long-duration major collapses, e.g.,
the c. 9-h collapse on 17 September 1996.
2. Collapse styles
A variety of styles have been apparent in the
episodic dome collapses observed at SHV in the period
November 1995 to March 1998 (Watts et al., 2002;
Calder et al., 2002). They have ranged from shallow,
small-to-large collapses with relatively lowmobility, to
energetic major collapses that have spontaneously
developed into long-runout pyroclastic flows. One
method of classifying these failures is by collapse size,
e.g., small-to-large/major/gigantic. Another classifica-
tion method is to consider the relationship between
collapse volume and extrusion rate. Extrusion rate and
collapse volume data for 22 collapses recorded in the
period 29 July 1996 to 26 December 1997 (Table 1 of
Calder et al., 2002) are plotted in Fig. 1. In a general
sense, extrusion rates and collapse volumes are
positively correlated; larger extrusion rates result in
larger volumes of unstable material being available to
both drive and to participate in the collapse. Unfortu-
nately, this simplistic observation is confounded by the
presence of a small number of outlier major collapses
that have occurred while preceding extrusion rates
remain low.

Fig. 1. Dome collapse patterns for the period July 1996 to December
1997 (i.e., all collapses of the first lava dome) based on extrusion
rate prior to collapse and corresponding collapse volume (data from
Calder et al., 2002; Table 1). Both collapses resulting in explosive
activity (n) and those not (E) are included. Feasible strengths
obtained from back analyses demonstrate the increasing dominance
of cohesion with increasing collapse volume. Quadrant I: early
stage dome growth, small-to-large collapses (July–early September
1996 and March–April 1997) termed Type I collapses. Quadrant II:
major dome collapses (17 September 1996) termed Type II
collapses. Quadrant III: major dome collapses associated with
rapid extrusion rates. Quadrant IV: small-to-large dome collapses
associated with low viscosity lava with a dpancake-likeT morphol-
ogy (January 1997) termed Type IV collapses.
J. Simmons et al. / Journal of Volcanology and Geothermal Research 139 (2005) 241–258 243
Linking this progression of collapse modes to an
invariant input of fresh magma to the dome is the
focus of this work. Four principal styles of dome
collapse are suggested based on the quadrants of
Fig. 1, defining collapses as either small-to-large or
major in size, and resulting from either slow-to-
moderate (b6 m3/s) or fast (z6 m3/s) extrusion rates.
These broad divisions provide some basis for under-
standing the fundamental mechanisms that ultimately
drive failure.
2.1. Small-to-large collapses at slow-to-moderate
extrusion rate
Slow-to-moderate extrusion rate/small-to-large
volume collapses, here termed Type I collapses
(Quadrant I of Fig. 1), tended to occur during the
lower overall volume (20–45�106 m3 DRE) stages of
dome development (e.g., Fig. 2a), i.e., July to early
September 1996 and March to April 1997 (Calder et
al., 2002). Despite the low volume of the dome, the
small-to-large failures are typically restricted to high-
angle collapses, incapable of transecting the dome and
unroofing the interior system, thus diminishing the
potential for explosive eruption (Robertson et al.,
2000). This style of dome collapse has predominated
during periods of low background extrusion rate.
2.2. Major collapses at slow-to-moderate extrusion
rate
Slow-to-moderate extrusion rate/major collapses
(e.g., Fig. 2b), here termed Type II collapses (Quadrant
II of Fig. 1), are difficult to explain in terms of a direct
progression from Type I collapses. This style corre-
sponds to the 17 September 1996 collapse, which
lasted c. 9 h and removed c. 35% of the dome (Calder
et al., 2002) resulting in sub-Plinian explosive activity
(Robertson et al., 1998). Seven collapses occurred
between 29 July and 3 September 1996; dome
materials were necessarily weak relative to the topo-
graphic setting and stresses, such that instability was
essentially the norm for that period. Considering this,
only subtle deviations from this norm occurred in the
period just prior to 17 September 1996. Extrusion rate
(~2–3 m3/s) and overall dome volume (~26–27�106
m3) stayed relatively constant during the 2 weeks
preceding the collapse (Calder et al., 2002). However,
cyclic deformation (Voight et al., 1998) and hybrid
earthquake swarms (Robertson et al., 1998) increased
during the 2-week precollapse period, and increased
steam and ash venting were observed (McGuire et al.,
1996).
The collapse of 21 September 1997 occurred with
the invigorated onset of a new ~7-week cycle (Voight et
al., 1998), so it is a question of whether the extrusion
rate to apply was that associated with the new cycle, or
the sluggish end of the previous cycle. An arrow on the
point in Fig. 1 indicates that the relevant rate might be
larger. The gigantic collapse on 26 December (Boxing
Day) 1997 is also represented with an arrow on the
point, indicating that its collapse volume (~46�106m3)
is considerably higher than the scale of Fig. 1.
This failure, reviewed extensively in Voight et al.
(2002), was the final and largest collapse event of the
first SHV lava dome. It may be considered an extension
of Type II behavior for the purposes of this bfirstapproximationQ classification scheme.
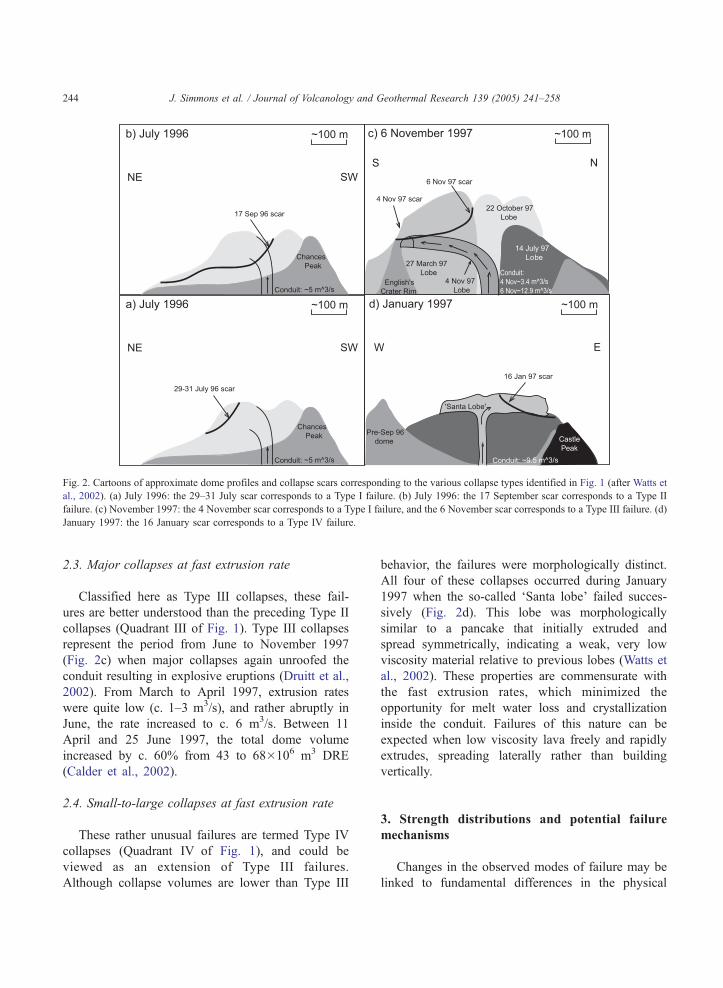
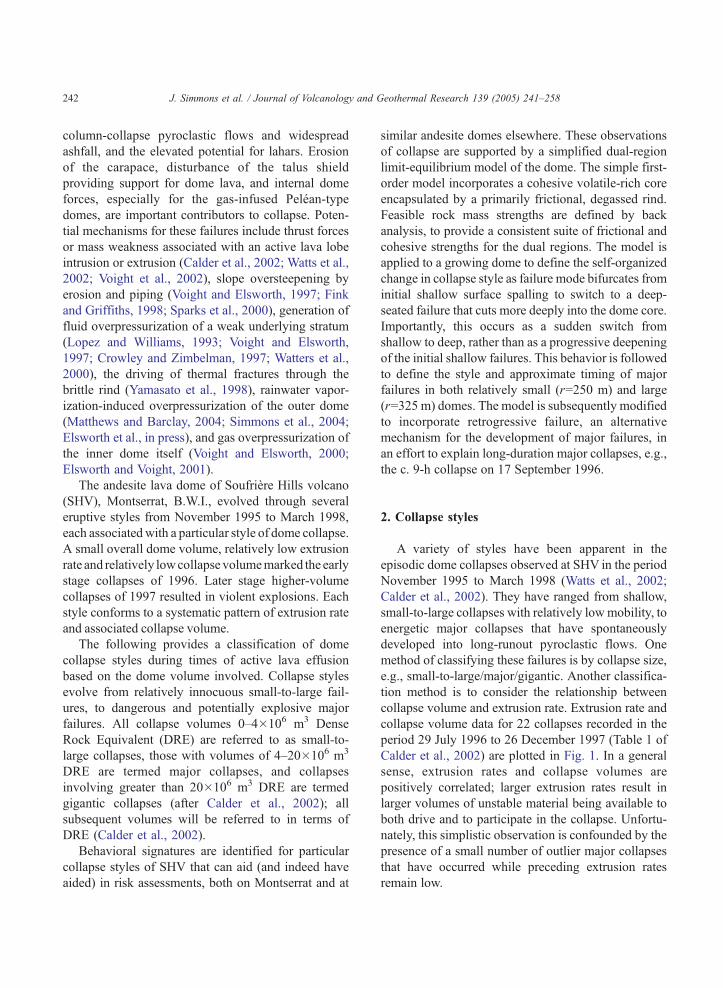
Fig. 2. Cartoons of approximate dome profiles and collapse scars corresponding to the various collapse types identified in Fig. 1 (after Watts et
al., 2002). (a) July 1996: the 29–31 July scar corresponds to a Type I failure. (b) July 1996: the 17 September scar corresponds to a Type II
failure. (c) November 1997: the 4 November scar corresponds to a Type I failure, and the 6 November scar corresponds to a Type III failure. (d)
January 1997: the 16 January scar corresponds to a Type IV failure.
J. Simmons et al. / Journal of Volcanology and Geothermal Research 139 (2005) 241–258244
2.3. Major collapses at fast extrusion rate
Classified here as Type III collapses, these fail-
ures are better understood than the preceding Type II
collapses (Quadrant III of Fig. 1). Type III collapses
represent the period from June to November 1997
(Fig. 2c) when major collapses again unroofed the
conduit resulting in explosive eruptions (Druitt et al.,
2002). From March to April 1997, extrusion rates
were quite low (c. 1–3 m3/s), and rather abruptly in
June, the rate increased to c. 6 m3/s. Between 11
April and 25 June 1997, the total dome volume
increased by c. 60% from 43 to 68�106 m3 DRE
(Calder et al., 2002).
2.4. Small-to-large collapses at fast extrusion rate
These rather unusual failures are termed Type IV
collapses (Quadrant IV of Fig. 1), and could be
viewed as an extension of Type III failures.
Although collapse volumes are lower than Type III
behavior, the failures were morphologically distinct.
All four of these collapses occurred during January
1997 when the so-called dSanta lobeT failed succes-
sively (Fig. 2d). This lobe was morphologically
similar to a pancake that initially extruded and
spread symmetrically, indicating a weak, very low
viscosity material relative to previous lobes (Watts et
al., 2002). These properties are commensurate with
the fast extrusion rates, which minimized the
opportunity for melt water loss and crystallization
inside the conduit. Failures of this nature can be
expected when low viscosity lava freely and rapidly
extrudes, spreading laterally rather than building
vertically.
3. Strength distributions and potential failure
mechanisms
Changes in the observed modes of failure may be
linked to fundamental differences in the physical

Fig. 3. Schematic diagram of an idealized homogeneous hemi
spherical lava dome used to constrain appropriate dome rock mass
strength distributions for Types I–III failures.
J. Simmons et al. / Journal of Volcanology and Geothermal Research 139 (2005) 241–258 245
characteristics of the dome, and their evolution in
time. Magma transport within the conduit and through
the solidifying dome is strongly controlled by
increases in viscosity that accompany degassing and
crystallization of microlites. Degassing also influences
strength of the resulting dome pile, with the highly
crystalline magma becoming less cohesive and more
frictional as it both degasses and cools. The rates of
strength gain, the possible transition from dominantly
cohesive to frictional strengths, and the distribution of
these predominant strength modes within the dome
and its carapace are not well constrained. However,
broad estimates for the magnitude of dome strength
may be determined from the back analysis of observed
failures.
Estimates of feasible cohesion, c, and friction
angle, u, pairs were determined from back analyses
of circular failure surfaces in dry rock slopes (Hoek
and Bray, 1981), assuming that the influence of
interior fluid pressures are minimal. The back
analyses were performed to identify minimum
strength magnitudes necessary to support precollapse
slope angles and heights. The resulting magnitudes of
cohesion and friction angle pairs span the range 0–1.1
MPa and 0–458, respectively, and represent a broad
spectrum of material types from viscous magma to
solidified lava.
With this broad range of strength pairs defined
that prescribe at least minimally stable slopes, the
strength distribution was further narrowed (c–u pairs
of 0.2 MPa–258 to 0.6 MPa–58, see Fig. 4) by
requiring that failure predictions should additionally
honor observed collapse volumes and failure plane
inclinations. This was completed by applying the
broad range of strength pairs to a limit-equilibrium
analysis of a homogeneous hemispherical lava dome
(Eq. (1)) that has been successfully applied to the
study of lava dome collapse driven by interior gas
overpressures (Voight and Elsworth, 2000; Elsworth
and Voight, 2001). Dome profiles from Montserrat
Volcano Observatory (MVO) digital elevation maps
(DEMs; July–September 1996), Fig. 6 (March–April
1997) of Calder et al. (2002), and Fig. 24 (June–
November 1997) of Watts et al. (2002) provide
general slope heights and inclinations for the back
analyses. The Type IV collapses of January 1997 are
omitted as the pancake lobe morphology does not
conform to the hemisphere model.
The factor of safety, FS, is determined for an
idealized homogeneous hemispherical lava dome (Fig.
3) of outer radius r with a failure plane inclined at
angle a that intersects the toe of the slope, as
(Elsworth and Voight, 2001):
FS ¼ cAþWcos að Þtan uð ÞW sin að Þ ; ð1Þ
where A is the contact area of the basal detachment
plane given as:
A ¼ pr2cos2 að Þ; ð2Þ
and W is the weight of the block. The failure block
weight is evaluated through its volume, V, and unit
weight, cR, as:
W ¼ cRV ; ð3Þ
where
V ¼ pZ r
r sin aðr2 � y2Þdy
¼ pr3�� 2
3� sin að Þ
�1� 1
3sin2 að Þ
��:
ð4Þ
Appropriate strength magnitudes for specific
events are constrained by the failure plane inclination
required for a particular collapse volume to be
removed via Eq. (4). The resulting magnitudes of c–
u pairs (Fig. 4) that represent the individual collapse
events of Fig. 1 are linked, enabling the distribution of
critical strength parameters to be overprinted on the
demarcation of collapse styles discussed previously.
-
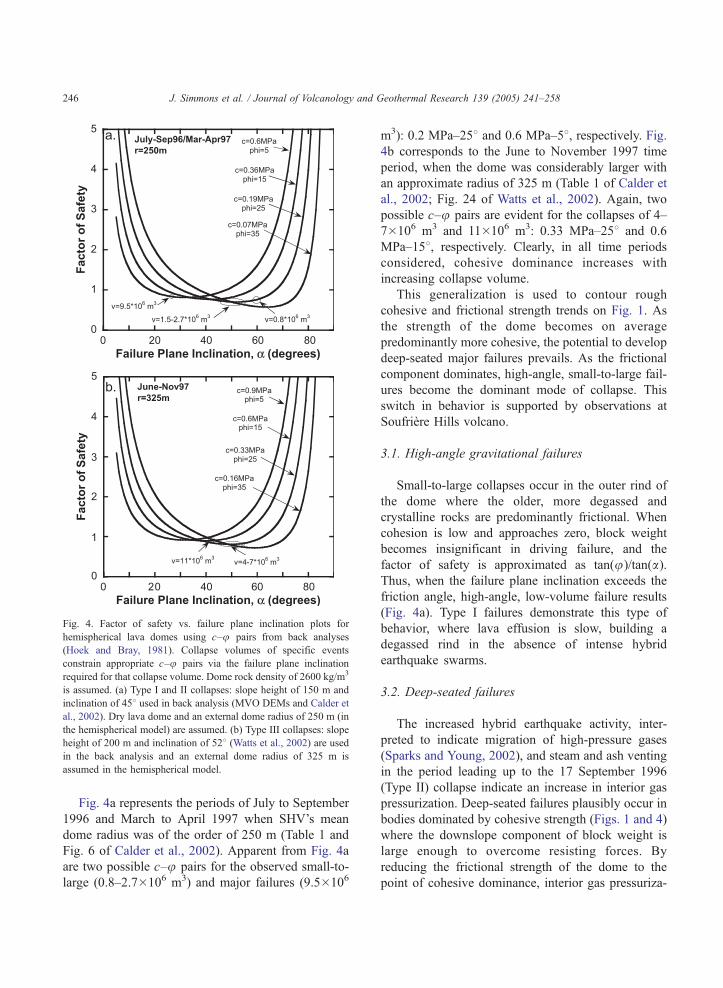
Fig. 4. Factor of safety vs. failure plane inclination plots for
hemispherical lava domes using c–u pairs from back analyses
(Hoek and Bray, 1981). Collapse volumes of specific events
constrain appropriate c–u pairs via the failure plane inclination
required for that collapse volume. Dome rock density of 2600 kg/m3
is assumed. (a) Type I and II collapses: slope height of 150 m and
inclination of 458 used in back analysis (MVO DEMs and Calder et
al., 2002). Dry lava dome and an external dome radius of 250 m (in
the hemispherical model) are assumed. (b) Type III collapses: slope
height of 200 m and inclination of 528 (Watts et al., 2002) are used
in the back analysis and an external dome radius of 325 m is
assumed in the hemispherical model.
J. Simmons et al. / Journal of Volcanology and Geothermal Research 139 (2005) 241–258246
Fig. 4a represents the periods of July to September
1996 and March to April 1997 when SHV’s mean
dome radius was of the order of 250 m (Table 1 and
Fig. 6 of Calder et al., 2002). Apparent from Fig. 4a
are two possible c–u pairs for the observed small-to-
large (0.8–2.7�106 m3) and major failures (9.5�106
m3): 0.2 MPa–258 and 0.6 MPa–58, respectively. Fig.4b corresponds to the June to November 1997 time
period, when the dome was considerably larger with
an approximate radius of 325 m (Table 1 of Calder et
al., 2002; Fig. 24 of Watts et al., 2002). Again, two
possible c–u pairs are evident for the collapses of 4–
7�106 m3 and 11�106 m3: 0.33 MPa–258 and 0.6
MPa–158, respectively. Clearly, in all time periods
considered, cohesive dominance increases with
increasing collapse volume.
This generalization is used to contour rough
cohesive and frictional strength trends on Fig. 1. As
the strength of the dome becomes on average
predominantly more cohesive, the potential to develop
deep-seated major failures prevails. As the frictional
component dominates, high-angle, small-to-large fail-
ures become the dominant mode of collapse. This
switch in behavior is supported by observations at
Soufriere Hills volcano.
3.1. High-angle gravitational failures
Small-to-large collapses occur in the outer rind of
the dome where the older, more degassed and
crystalline rocks are predominantly frictional. When
cohesion is low and approaches zero, block weight
becomes insignificant in driving failure, and the
factor of safety is approximated as tan(u)/tan(a).Thus, when the failure plane inclination exceeds the
friction angle, high-angle, low-volume failure results
(Fig. 4a). Type I failures demonstrate this type of
behavior, where lava effusion is slow, building a
degassed rind in the absence of intense hybrid
earthquake swarms.
3.2. Deep-seated failures
The increased hybrid earthquake activity, inter-
preted to indicate migration of high-pressure gases
(Sparks and Young, 2002), and steam and ash venting
in the period leading up to the 17 September 1996
(Type II) collapse indicate an increase in interior gas
pressurization. Deep-seated failures plausibly occur in
bodies dominated by cohesive strength (Figs. 1 and 4)
where the downslope component of block weight is
large enough to overcome resisting forces. By
reducing the frictional strength of the dome to the
point of cohesive dominance, interior gas pressuriza-

J. Simmons et al. / Journal of Volcanology and Geothermal Research 139 (2005) 241–258 247
tion on the order of 10F5 MPa is capable of driving
deep failure in hemispherical lava domes (Elsworth
and Voight, 2001).
For the Type III collapses, the rapid extrusion rate
suggests that two end-member mechanisms are
feasible in that (1) lava moving more rapidly does
not possess as much time to exsolve volatiles during
ascent, meaning that the dome is likely gas pressur-
ized, and (2) injections of the less viscous volatile-rich
(cohesive) magma causes weakening and local over-
steepening of the heterogeneous dome. Further
supporting the theory of interior gas pressurization
are the occurrences of cyclic tilt and hybrid earth-
quake activity preceding Type III collapses (Voight et
al., 1998). Either the presence of cohesion dominant
lava high in the dome or the occurrence of internal gas
overpressurization may provide the strength reduction
necessary to result in deep-seated, conduit exposing
failures (Elsworth and Voight, 2001; Elsworth et al.,
in press).
Fig. 5. (a) Schematic diagram of an idealized dual-region hemi
spherical lava dome with a purely cohesive, volatile-rich, hemi
spherical core (white) of radius b surrounded by a primarily
frictional degassed rind (gray) of radius r. (b) Schematic of potentia
low and high failure plane orientations in a dome with 37–38% core
by volume. The low angle (338) plane transects the core indicating ahigh probability of explosive activity following collapse.
4. Stability models
With strength trends and collapse styles discussed,
theoretical stability models logically follow. The
stability of lava domes, ignoring external collapse
triggers, such as rainfall-induced overpressures,
depends upon strength magnitudes and distributions
within the dome, failure surface geometry, extent and
composition, failure block weight, and possibly the
influence of magma movement, internal gas pressur-
ization, and seismic acceleration. Because the exact
system parameters are impossible to constrain, an
analytical approach is employed. An idealized hemi-
spherical model is suggested in the following, and its
limiting equilibrium provides good correlation
between observed styles and timing of collapses at
SHV. In addition, some retrogressive limit-equili-
brium failure models are suggested in order to account
for longer duration failures, such as the one that
occurred on 17 September 1996.
4.1. Nested model
Excluding the Type IV collapses, Fig. 1 illustrates
the requirement for a decreasingly frictional failure
surface with increasing collapse volume for a given
extrusion rate. Observations at SHV indicate the
possibility of internal gas pressurization as a source
of both driving forces and cohesive strength domi-
nance (Elsworth and Voight, 2001; Elsworth et al., in
press). Complementary to the internal gas pressuriza-
tion model of Elsworth and Voight (2001), and in
compliance with the aforementioned strength trend
prerequisite, an idealized dual region hemispherical
lava dome model (after Iverson, 1990; Hale and
Wadge, 2003) is proposed to replicate Types I–III
failures: a primarily cohesive (volatile-rich) hemi-
spherical core of radius b surrounded by a primarily
frictional (degassed) rind of outer radius r (Fig. 5).
This involves two main simplifications. (1) The core
and rind are each modeled as homogeneous entities
-
-
l

J. Simmons et al. / Journal of Volcanology and Geothermal Research 139 (2005) 241–258248
when in reality they are both likely to contain
significant inhomogeneities. Unfortunately, few data
exist to characterize their internal strength and
structure, and thus back analysis yields an aggregate
behavior that incorporates both size effects and the
role of inhomogenieties within the dome. Clearly
more elaborate models can be prescribed to represent
this observed response, but their constituent properties
remain speculative given available data. (2) Although
talus generally rings the base of a lava dome, its
mechanical effects are ignored here in order to
simplify the treatment of the problem. This simplifi-
cation is somewhat crude, but it seems reasonable
(Iverson, 1990) because talus slopes are generally
inclined at the angle of repose. They will therefore fail
upon the application of an outward, steepening force.
Consequently, the outward weight component of a
failing block within the quasi-hemispherical dome
structure would likely be little inhibited by the talus
material.
This representation explains how both small-to-
large and major failures occur. Small-to-large fail-
ures, according to this bfirst approximationQ model,
must result from high failure plane inclinations in
order to remove sufficiently low amounts of material,
thus relegating them to the frictional rind and
obeying the trend of Fig. 1. Conversely, major
failures must either occur as singular movements
on failure planes inclined much lower where the
failure plane transects a large proportion of the
cohesive core, or result from the slow retrogression
of a series of Type I failures, gradually increasing the
cohesive dominance of the failure surface, again
satisfying the trend illustrated in Fig. 1. Strength
magnitudes of the two regions are chosen in order to
best replicate the desired behavior described above,
and they are loosely based upon the back analysis
performed here. They also agree well with previous
dome rock strength estimates from Elsworth and
Voight (2001) and Voight and Elsworth (2000). The
resulting roughly prorated strengths are c=0.4 MPa;
u=0 and c=0.2 MPa; u=458 for the core and rind,
respectively. The factor of safety for singular planar
failures is calculated by modifying Eq. (1) to include
the two strength zones as:
FS ¼ ½cCAC� þ ½cRAR þWRcosa tanu R�ðWC þWRÞsina
; ð5Þ
where the subscripts C and R, respectively, corre-
spond to core and rind. The failure surface areas of the
core and rind are:
AC ¼ p b2 � r2sin2a� �
ð6Þ
and
AR ¼ A� AC: ð7Þ
The corresponding weight of material overlying
the core is evaluated through two volumetric regions:
(1) a cap, Vcap, that overlies a (2) cylindrical portion,
Vcyl, as (Fig. 5a):
WC ¼ cR Vcap þ Vcyl
� �ð8Þ
where
Vcap ¼ p
(Z r ffiffiffiffiffiffiffiffiffiffiffiffiffiffiffiffiffiffiffiffiffiffiffir2ð1þsin2aÞ�b2
p�r2 � y2
�dy
)
¼ p
(2
3r3 � r2
ffiffiffiffiffiffiffiffiffiffiffiffiffiffiffiffiffiffiffiffiffiffiffiffiffiffiffiffiffiffiffiffiffiffiffiffir2ð1þ sin2aÞ � b2
q
þ 1
3
ffiffiffiffiffiffiffiffiffiffiffiffiffiffiffiffiffiffiffiffiffiffiffiffiffiffiffiffiffiffiffiffiffiffiffiffiffiffiffiffiffiffi�r2ð1þ sin2aÞ � b2
3q )ð9Þ
and
Vcyl ¼ p
�ðb2� r2sin2aÞ
� ffiffiffiffiffiffiffiffiffiffiffiffiffiffiffiffiffiffiffiffiffiffiffiffiffiffiffiffiffiffiffiffiffiffir2ð1þ sin2aÞ�b2
q
� r sina
��: ð10Þ
Combining Eqs. (8), (9), and (10) provides the
weight overlying the core:
WC ¼ cRp2
3r3 � r2
ffiffiffiffiffiffiffiffiffiffiffiffiffiffiffiffiffiffiffiffiffiffiffiffiffiffiffiffiffiffiffiffiffiffiffiffiffir2 1þ sin2a� �
� b2q��
þ 1
3
ffiffiffiffiffiffiffiffiffiffiffiffiffiffiffiffiffiffiffiffiffiffiffiffiffiffiffiffiffiffiffiffiffiffiffiffiffiffiffiffiffiffiffir2 1þ sin2a� �
� b2� 3q �
þ�
b2 � r2sin2a� �
�ffiffiffiffiffiffiffiffiffiffiffiffiffiffiffiffiffiffiffiffiffiffiffiffiffiffiffiffiffiffiffiffiffiffiffiffiffir2 1þ sin2a� �
� b2q
� r sina
� ���;
ð11Þand the weight of the rind is simply
WR ¼ W �WC: ð12Þ
J. Simmons et al. / Journal of Volcanology and Geothermal Research 139 (2005) 241–258 249
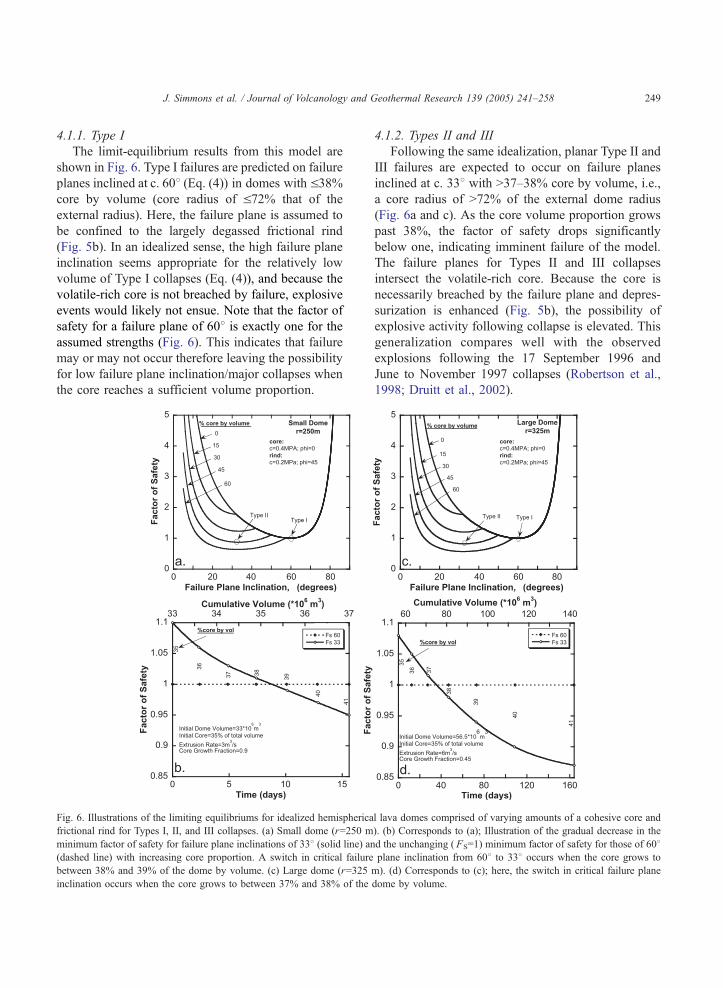
4.1.1. Type I
The limit-equilibrium results from this model are
shown in Fig. 6. Type I failures are predicted on failure
planes inclined at c. 608 (Eq. (4)) in domes with V38%core by volume (core radius of V72% that of the
external radius). Here, the failure plane is assumed to
be confined to the largely degassed frictional rind
(Fig. 5b). In an idealized sense, the high failure plane
inclination seems appropriate for the relatively low
volume of Type I collapses (Eq. (4)), and because the
volatile-rich core is not breached by failure, explosive
events would likely not ensue. Note that the factor of
safety for a failure plane of 608 is exactly one for the
assumed strengths (Fig. 6). This indicates that failure
may or may not occur therefore leaving the possibility
for low failure plane inclination/major collapses when
the core reaches a sufficient volume proportion.
Fig. 6. Illustrations of the limiting equilibriums for idealized hemispherica
frictional rind for Types I, II, and III collapses. (a) Small dome (r=250 m
minimum factor of safety for failure plane inclinations of 338 (solid line) an
(dashed line) with increasing core proportion. A switch in critical failure
between 38% and 39% of the dome by volume. (c) Large dome (r=325
inclination occurs when the core grows to between 37% and 38% of the
4.1.2. Types II and III
Following the same idealization, planar Type II and
III failures are expected to occur on failure planes
inclined at c. 338 with N37–38% core by volume, i.e.,
a core radius of N72% of the external dome radius
(Fig. 6a and c). As the core volume proportion grows
past 38%, the factor of safety drops significantly
below one, indicating imminent failure of the model.
The failure planes for Types II and III collapses
intersect the volatile-rich core. Because the core is
necessarily breached by the failure plane and depres-
surization is enhanced (Fig. 5b), the possibility of
explosive activity following collapse is elevated. This
generalization compares well with the observed
explosions following the 17 September 1996 and
June to November 1997 collapses (Robertson et al.,
1998; Druitt et al., 2002).
l lava domes comprised of varying amounts of a cohesive core and
). (b) Corresponds to (a); Illustration of the gradual decrease in the
d the unchanging ( FS=1) minimum factor of safety for those of 608plane inclination from 608 to 338 occurs when the core grows to
m). (d) Corresponds to (c); here, the switch in critical failure plane
dome by volume.
J. Simmons et al. / Journal of Volcanology and Geothermal Research 139 (2005) 241–258250
4.2. Retrogressive failure
Some of the major failures, discussed previously,
occurred retrogressively, a style not considered in the
single-event planar failures described above. Retro-
gressive instabilities are typified by the collapse of 17
September 1996, which involved repeated failures
occurring over a period of 9 h (Calder et al., 2002).
The following investigates the potential for retrogres-
sive failure both on circular failure surfaces and as
planar slabs, which can ultimately lead to major,
potentially explosive, conduit exposing failures.
4.2.1. Circular failure
For a failure to retrogress, several failure surfaces
must develop in progression, each successively deeper
in the slope than the one preceding. To define the
potential for this mode of failure at SHV, a total stress
analysis is applied to an inclined slope in cohesive
material (u=0) underlain by a rigid base (Taylor’s
method; e.g., Fig. 6.9 in Bromhead, 1992). An initial
high-angle failure is assumed to transect the frictional
rind, and exhume the cohesive core. Subsequent
failures occur along successive circular arcs cutting
progressively deeper into the exposed slope, and
successively flattening the slope face and driving
future failure surfaces deeper. The slope height, H, at
the threshold of instability may be defined as:
H ¼ c
NcRFS
; ð13Þ
where, c is cohesive strength, N is Taylor’s stability
number, cR is the unit weight of the rock, and FS is
the factor of safety, set to unity at the onset of
failure.
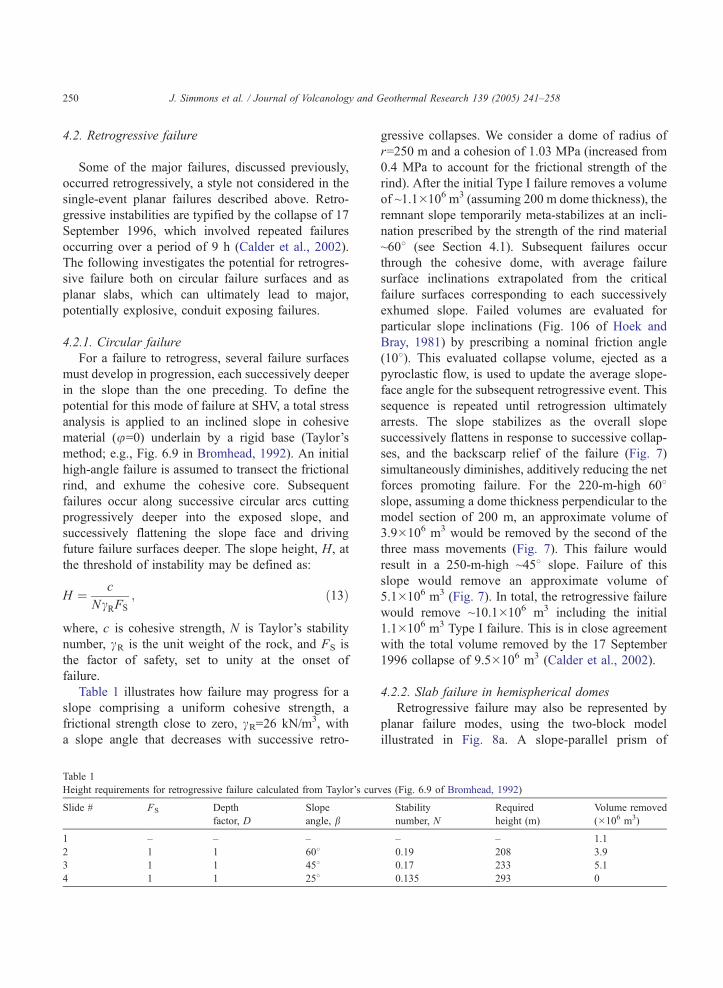
Table 1 illustrates how failure may progress for a
slope comprising a uniform cohesive strength, a
frictional strength close to zero, cR=26 kN/m3, with
a slope angle that decreases with successive retro-
Table 1
Height requirements for retrogressive failure calculated from Taylor’s cur
Slide # FS Depth
factor, D
Slope
angle, b
1 – – –
2 1 1 6083 1 1 4584 1 1 258
gressive collapses. We consider a dome of radius of
r=250 m and a cohesion of 1.03 MPa (increased from
0.4 MPa to account for the frictional strength of the
rind). After the initial Type I failure removes a volume
of ~1.1�106 m3 (assuming 200 m dome thickness), the
remnant slope temporarily meta-stabilizes at an incli-
nation prescribed by the strength of the rind material
~608 (see Section 4.1). Subsequent failures occur
through the cohesive dome, with average failure
surface inclinations extrapolated from the critical
failure surfaces corresponding to each successively
exhumed slope. Failed volumes are evaluated for
particular slope inclinations (Fig. 106 of Hoek and
Bray, 1981) by prescribing a nominal friction angle
(108). This evaluated collapse volume, ejected as a
pyroclastic flow, is used to update the average slope-
face angle for the subsequent retrogressive event. This
sequence is repeated until retrogression ultimately
arrests. The slope stabilizes as the overall slope
successively flattens in response to successive collap-
ses, and the backscarp relief of the failure (Fig. 7)
simultaneously diminishes, additively reducing the net
forces promoting failure. For the 220-m-high 608slope, assuming a dome thickness perpendicular to the
model section of 200 m, an approximate volume of
3.9�106 m3 would be removed by the second of the
three mass movements (Fig. 7). This failure would
result in a 250-m-high ~458 slope. Failure of this
slope would remove an approximate volume of
5.1�106 m3 (Fig. 7). In total, the retrogressive failure
would remove ~10.1�106 m3 including the initial
1.1�106 m3 Type I failure. This is in close agreement
with the total volume removed by the 17 September
1996 collapse of 9.5�106 m3 (Calder et al., 2002).
4.2.2. Slab failure in hemispherical domes
Retrogressive failure may also be represented by
planar failure modes, using the two-block model
illustrated in Fig. 8a. A slope-parallel prism of
ves (Fig. 6.9 of Bromhead, 1992)
Stability
number, N
Required
height (m)
Volume removed
(�106 m3)
– – 1.1
0.19 208 3.9
0.17 233 5.1
0.135 293 0

Fig. 8. Schematic diagram of the two-block stability model for retrogressiv
the forces acting on each block that are used in the stability model develop
region hemispherical dome. (c) The two-block retrogression model embedd
perpendicular tension crack.
Fig. 7. Diagram of predicted retrogressively developed failure
surfaces in a hemispherical dome of r=250 m. Taylor’s curves (Fig.
6.9 of Bromhead, 1992) define heights necessary to drive failure,
while critical failure surfaces are predicted with Fig. 106 of Hoek
and Bray (1981). Area 1 corresponds to the initiating Type I failure.
Areas 2 and 3 are the ensuing failures. Retrogression ceases after the
third failure because the dome height is no longer capable of driving
failure.
J. Simmons et al. / Journal of Volcanology and Geothermal Research 139 (2005) 241–258 251
thickness y, and height H, is released as a toe-block
displaces under gravitational loading. Forces are
transmitted be-tween the upper and lower blocks at
an angle, d, pre-scribed by the strength along the
interface. Limiting equilibrium of the system (see
Appendix A for a de-tailed development) defines a
factor of safety, FS, as:
FS ¼ Vc2L2sind þ sindcos 180� a � dð Þc3L3
þ cos a � 90þ dð Þ c1L1 þ c3L3cosd½ �t
=W2sindsina; ð14Þ
where cohesions, c, act over failure surface lengths,
L1–L3 (Fig. 8a). For a prescribed slope inclination, a
minimum factor of safety is recovered for a critical
interblock force inclination, d, and corresponding to a
critical depth of the slope-parallel failure plane, y. As
each block fails, the collapse material is ejected from
e failure. (a) The free-body diagrams for the two blocks, illustrating
ment. (b) The two-block retrogression model embedded in the dual-
ed in the rectangular shear lobe. Each block is separated by a slope-
J. Simmons et al. / Journal of Volcanology and Geothermal Research 139 (2005) 241–258252
the system due to the likely development of pyro-
clastic flows.
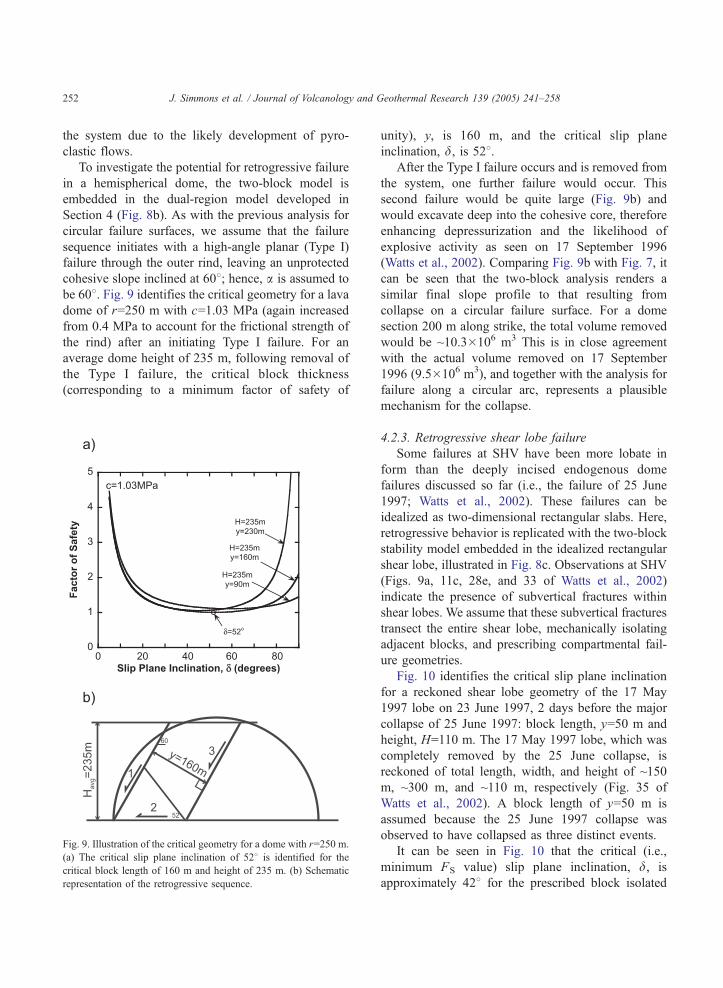
To investigate the potential for retrogressive failure
in a hemispherical dome, the two-block model is
embedded in the dual-region model developed in
Section 4 (Fig. 8b). As with the previous analysis for
circular failure surfaces, we assume that the failure
sequence initiates with a high-angle planar (Type I)
failure through the outer rind, leaving an unprotected
cohesive slope inclined at 608; hence, a is assumed to
be 608. Fig. 9 identifies the critical geometry for a lava
dome of r=250 m with c=1.03 MPa (again increased
from 0.4 MPa to account for the frictional strength of
the rind) after an initiating Type I failure. For an
average dome height of 235 m, following removal of
the Type I failure, the critical block thickness
(corresponding to a minimum factor of safety of
Fig. 9. Illustration of the critical geometry for a dome with r=250 m.
(a) The critical slip plane inclination of 528 is identified for the
critical block length of 160 m and height of 235 m. (b) Schematic
representation of the retrogressive sequence.
unity), y, is 160 m, and the critical slip plane
inclination, d, is 528.After the Type I failure occurs and is removed from
the system, one further failure would occur. This
second failure would be quite large (Fig. 9b) and
would excavate deep into the cohesive core, therefore
enhancing depressurization and the likelihood of
explosive activity as seen on 17 September 1996
(Watts et al., 2002). Comparing Fig. 9b with Fig. 7, it
can be seen that the two-block analysis renders a
similar final slope profile to that resulting from
collapse on a circular failure surface. For a dome
section 200 m along strike, the total volume removed
would be ~10.3�106 m3 This is in close agreement
with the actual volume removed on 17 September
1996 (9.5�106 m3), and together with the analysis for
failure along a circular arc, represents a plausible
mechanism for the collapse.
4.2.3. Retrogressive shear lobe failure
Some failures at SHV have been more lobate in
form than the deeply incised endogenous dome
failures discussed so far (i.e., the failure of 25 June
1997; Watts et al., 2002). These failures can be
idealized as two-dimensional rectangular slabs. Here,
retrogressive behavior is replicated with the two-block
stability model embedded in the idealized rectangular
shear lobe, illustrated in Fig. 8c. Observations at SHV
(Figs. 9a, 11c, 28e, and 33 of Watts et al., 2002)
indicate the presence of subvertical fractures within
shear lobes. We assume that these subvertical fractures
transect the entire shear lobe, mechanically isolating
adjacent blocks, and prescribing compartmental fail-
ure geometries.
Fig. 10 identifies the critical slip plane inclination
for a reckoned shear lobe geometry of the 17 May
1997 lobe on 23 June 1997, 2 days before the major
collapse of 25 June 1997: block length, y=50 m and
height, H=110 m. The 17 May 1997 lobe, which was
completely removed by the 25 June collapse, is
reckoned of total length, width, and height of ~150
m, ~300 m, and ~110 m, respectively (Fig. 35 of
Watts et al., 2002). A block length of y=50 m is
assumed because the 25 June 1997 collapse was
observed to have collapsed as three distinct events.
It can be seen in Fig. 10 that the critical (i.e.,
minimum FS value) slip plane inclination, d, is
approximately 428 for the prescribed block isolated

Fig. 10. Graph used to illustrate the method used to find the critical
interblock slip plane orientation, d, for the block length, y=50 m,
and height, H=110 m, for the two-block model.
J. Simmons et al. / Journal of Volcanology and Geothermal Research 139 (2005) 241–258 253
by the slope-perpendicular vertical fractures. How-
ever, fracture inclinations of 758 return similar results,
indicating a relatively low sensitivity of the a value
(Fig. 10). It is important to note that when cohesion of
the material is assumed to be 0.4 MPa, the minimum
factor of safety is less than one. However, when
cohesion is increased to 1.03 MPa to account for the
frictional rind, as with the previous calculations, the
factor of safety is never less than or equal to one. This
analysis indicates that if c=0.4 MPa, failure could
occur in three blocks of 50 m length, 300 m width
(along strike), and 110 m height each for a total of
5.0�106 m3, and retrogression would terminate due to
the topographic limitations at the end of the lobe.
Again, this closely corresponds with the actual
collapse volume removed on 25 June 1997 of
4.9�106 m3 (Calder et al., 2002).
5. Nested model failure analysis
With failure styles categorized in terms of active
mechanisms and controlling strength distributions, we
attempt to honor these failure modes with a rational
model of dome growth and periodic destruction. We
first prescribe the distribution of new lava into the core
by partitioning the dome growth into two portions; the
fraction effused exogenously to the dome surface, that
solidifies and creates a predominantly frictional rind,
and the endogenous fraction of growth injected as a soft
interior. We then examine stability of the evolving
dome to test whether the observed spontaneous switch-
ing from high-angle small-to-large failures to low-
angle major failures occurs.
5.1. Magma partitioning within the dome
Collapse styles have been shown to switch between
high-angle–low-volume (Type I) and low-angle–high-
volume (Type II–III) failures as the soft-core interior
increases beyond a threshold volumetric proportion.
For the assumed model and strength magnitudes, this
threshold is ~38% core/62% rind. We may represent
growth of the dome by partitioning the distribution of
new magma within the dome, that in turn may
influence the style of collapse, and the additive
involvement of gas overpressures to gravitational
forces in promoting extended runout of pyroclastic
flows (Fink and Kieffer, 1993). The total volumetric
dome-growth rate, E, may be partitioned between the
fraction injected into the core, eC, and the fraction
effused to the rind, eR. Assuming these fractions to
remain constant in time, the dome volume, Vf, may be
defined at any time, Dt, as:
Vf ¼ eC � EE� �
þ eR � EE� ��
Dt � Vcollapse þ Vi;
ð15Þ
in terms of initial volume, Vi, and the volume removed
by periodic collapse, Vcollapse. With the assumptions of
initial core, miC, and rind, mi
R, fractional volume
proportions and actual volumes of core, VcollapseC , and
rind, VcollapseR , removed by failure, it is straightforward
to calculate the final fractional core, mfC, and rind, mf
R,
proportions as:
mCf ¼eC EE� �
� VCcollapse þ mCi Við Þ
h iVf
ð16Þ
and
mRf ¼ 1� mCf : ð17Þ
5.2. Single-event failures in small domes
Fig. 6b illustrates the idealized progression of a
small dome (r=250 m) from Type I failures to Type II

J. Simmons et al. / Journal of Volcanology and Geothermal Research 139 (2005) 241–258254
failures assuming that at an arbitrary time zero the
dome contains 35% core by volume and has a total
volume of 33�106 m3, an extrusion rate of 3 m3/s,
eC=0.9, and no lava is lost due to failures during the
time period. The high value of eC is chosen for two
reasons: (1) failure timing (discussed below) corre-
sponds best with eC=0.9, and (2) Kaneko et al. (2002)
have shown that in general, slow extrusion rates favor
endogenous growth at Unzen volcano in Japan. Watts
et al. (2002) suggest an apparent contradiction of this
for SHV where slow extrusion favors the expulsion of
crystalline rigid lobes. This observation could be
interpreted as slow infusion favoring exogenous
growth; however, the lobe is merely the ultimate
surface expression of infusion of soft volatile-rich
material to the dome core, and is only apparent as the
carapace is ultimately breached. Thus, endogenous
growth can feasibly occur even as lobes simultane-
ously pierce the surface. Even after lobe extrusion, the
root of the shear lobe is shielded from degassing by its
depth within the core, remains soft, and may form the
essential component for a deeply diving shear failure.
Consequently, the observed expulsion of lobes is
compatible with the concurrent growth of the dome
interior that drives this periodic lobe expulsion. Even
as the lobe pushes to the surface, continued endog-
enous growth must continue at least until another
shear lobe is formed, still resulting in a large
proportion of endogenous growth.
Specifically, Fig. 6b shows the gradual decrease in
the factor of safety for failure plane inclinations of 338and the unchanging factor of safety (equal to one) for
failure planes inclined at 608, corresponding to
increasing dome volume and core proportion. As the
dome grows beyond 38% core by volume, the critical
failure mode switches directly from high-angle (608)to low-angle (338) collapse. This results from the low-
angle plane (FSb1) becoming less stable than the
high-angle plane (FS=1) due to the decreased strength
corresponding to the increased core proportion of the
potential 338 failure plane relative to the potential 608failure plane. This drastic change in collapse style
from Type I to Type II failures occurs over a period of
days with no change in behavior on the dome interior,
which qualitatively matches the actual collapse of 17
September 1996. There was a 2-week period prior to
17 September 1996 marked by the absence of
significant collapse activity culminating in the 9-h
continuous collapse that removed c. 35% of the dome
(Watts et al., 2002; Calder et al., 2002).
5.3. Single-event failures in large domes
Fig. 6d illustrates the idealized progression of a
large dome (r=325 m) from Type I to Type III failures
assuming an initial dome volume of 56.5�106 m3, an
extrusion rate of 6 m3/s, eC=0.45, and again with 35%
core by volume initially and no lava lost due to
failures during the time period. The lower value of eCis chosen to best replicate failure timing, but is also
consistent with rapid extrusion rates generally favor-
ing exogenous growth (Kaneko et al., 2002). Here, the
abrupt switch in failure style occurs as the proportion
of soft dome core grows beyond ~37% of the total,
again with no imposed change in growth behavior
(Fig. 6d). Again, there is a qualitative correspondence
with timing of the collapse of 25 June 1997. The time
between the last Type I failure and the first Type III
failure is approximately 1.5 months, which correlates
well with the collapse hiatus between April and June
1997 (Calder et al., 2002).
6. Model implications and limitations
The simple dual region model of a cohesive core
and frictional rind seems to explain how the collapse
mechanism of a lava dome may evolve from high-
angle–low-volume (Type I) collapses to more hazard-
ous low-angle–high-volume (Type II or III) failures
with no change in system forcing, viz., the lava
injection rate. Importantly, because this occurs with
no apparent change in the magma injection rate, the
transformation to a more hazardous collapse style is
not heralded by a precursory signature. For the dual-
region model, the change in collapse style is shown to
evolve naturally as the soft core grows to a critical
volume proportion. For the particular idealization of a
hemispherical dome, and assumed strength magni-
tudes, this threshold core volume is ~37–39% of the
total dome. With little warning, one dominant failure
style can be overcome by another more dramatic and
hazardous style. This transition represents a bifurca-
tion point, where at the threshold geometry both high-
and low-angle failures are equally likely to occur.
Unfortunately, this model does not define a rigorous

J. Simmons et al. / Journal of Volcanology and Geothermal Research 139 (2005) 241–258 255
method to predict failure style because determining
with certainty what portions of growth are adding to
the core and rind is extremely difficult. However, it
does provide a reasonable explanation of past
behavior at SHV.
The dual-region model provides some insight into
how the various recognized collapse styles may
develop; however, it does have some limitations. The
strength magnitudes are approximate and may not
match the strength distributions in actual lava domes.
Sparks et al. (2000) performed creep tests on dome
rocks at 993 8C. The intact samples failed under a load
of 9.1 MPa, which provides an upper strength bound
for the cohesive core material. When this strength is
applied to the core in the dual-region model, low-angle
failure never develops because the rind is always much
weaker, placing the failure plane at 608. Furthermore,
in reality, the SHV lava dome does not typically grow
equidimensionally as a hemisphere as in the model.
Growth generally occurs in focused regions of the
dome, thus the growth rates cause more significant
localized topographic changes in the real dome in a
shorter amount of time than in the model.
Although the retrogressive models involving
circular failure include significant uncertainties, they
provide an important implication. This is that
according to the calculations, in order for retrogres-
sion to develop, local slope height must increase for
each retrogressive episode to develop. With the
hemispherical geometry assumed, this is possible
until the rear scarp of the failure passes beyond the
dome crest, terminating the retrogression. In addi-
tion, the two-block slab models provide quantifica-
tion of another potential retrogressive mechanism.
Importantly, the analyses of retrogressive failure by
both circular and planar modes return similar results;
these qualitatively honor the sequence and style of
collapse events, despite the general lack of available
data on material strengths and individual failure
surface geometries.
All of the analyses neglect the potential for
additional triggering agents, such as lava movement,
internal gas pressurization, seismic acceleration, and
quenching by precipitation. Importantly, these addi-
tional triggers are not needed to cause the observed
and systematic switch in failure mode from shallow to
deep-seated failure, although conceivably they may
act to varying degrees. The observed switching in
failure was not correlated with obvious seismic or
rainfall triggering. Gas pressurization has been shown
to drive a similar transition from shallow to deeper
failures (Voight and Elsworth, 2000; Elsworth and
Voight, 2001), although typically with a related
growth in the intensity of seismic activity immediately
preceding failure. This signature is absent in the
events documented here, and the failures correspond-
ingly occur with little warning and absent significant
precursors.
7. Conclusions
The systematic evolution of dome collapse style
described here facilitates understanding some of the
fundamental processes that take place within an
actively growing andesite lava dome. Although no
simplification of such a complex system can be used
to explain all details, the apparently chaotic behavior
of dome collapses can be explained logically by
relatively simple means. Of the four collapse styles,
Type III collapses are by far the most hazardous as
they occur rapidly and can result in violent explo-
sions, sometimes within minutes after the onset of
collapse. The precursory activity that takes place prior
to Type III collapses, i.e., rapid extrusion, cyclic tilt,
intense hybrid earthquakes, etc., provides clear warn-
ings of forthcoming activity. However, Type II
collapses are rather problematic in that the transition
from Type I is not well defined. Type I collapses are
relatively common and similar in size to the less
common Type IV collapses involving soft pancake-
like lobes. However, their mechanisms seem to be
quite different.
By idealizing lava domes as hemispheres with two
discrete regions, a frictional outer rind surrounding a
cohesive gas-rich core, this work has shown that both
small-to-large and major failures can occur in domes
comprised of nearly equal core/rind volume propor-
tion. Differential growth between the core and rind
allows for the relative growth of one or the other by
only a few percent allowing, again in idealized form,
the various recognized collapse styles to develop.
Importantly, the feasibility of a bifurcation point
between small-to-large and major collapses has been
established, suggesting that indiscernible internal
fluctuations might determine whether small-to-large
J. Simmons et al. / Journal of Volcanology and Geothermal Research 139 (2005) 241–258256
or major collapses will occur when the core comprises
some threshold volume proportion.
Importantly, two end-member styles of major
failure development have been proposed and
explored, i.e., single-event planar failure and multi-
event retrogressive failure. These correspond to
observed short- and long-duration collapses, respec-
tively. The retrogressive models specifically aid in
the explanation of the 17 September 1996 collapse
that occurred over a period of c. 9 h and the 25 June
1997 collapse that is thought to have occurred in
three individual collapses. Two plausible explana-
tions of retrogressive failures have been suggested.
These are the retrogressive failure on circular
detachment planes, driven by increasing slope height,
and ultimately arresting as slope angles flatten and
backscarp elevation ultimately drops. And, the
retrogressive failure of slope-parallel prismatic slabs
that develop on release surfaces provided by slope-
perpendicular release planes. These mechanisms
have not been analyzed rigorously but do provide
some insight into possible retrogressive failure
scenarios.
Symbol explanations
Symbol Property (Units)
c Cohesion (MPa)
cC Cohesion of core material (MPa)
cR Cohesion of rind material (MPa)
u Friction angle (8)uC Friction angle of core material (8)uR Friction angle of rind material (8)FS Factor of safety
r Outer dome radius (m)
b Dome core radius (m)
a Failure plane inclination (8)A Total area of failure plane (m2)
AC Area of failure plane overlying core (m2)
AR Area of failure plane overlying rind (m2)
W Total failure block weight (N)
WC Failure block weight overlying core (N)
WR Failure block weight overlying rind (N)
V Failure block volume (m3)
Vcap Failure block volume overlying core; cap
portion (m3)
Vcyl Failure block volume overlying core; cylin-
drical portion (m3)
cR Unit weight of rock (N/m3)
Dt Elapsed time (days)
E Extrusion rate (m3/s)
eC Proportion of extruding lava accruing to core
eR Proportion of extruding lava accruing to
rind
Vcollapse Volume of dome rock removed by collapse
(m3)
Vi Total initial dome volume (m3)
Vf Total final dome volume (m3)
miC Initial core volume proportion (of total dome
volume)
miR Initial rind volume proportion (of total dome
volume)
VcollapseC Volume of core removed by collapse (m3)
VcollapseR Volume of rind removed by collapse (m3)
mfC Final core volume proportion (of total dome
volume)
mfR Final rind volume proportion (of total dome
volume)
qD Darcian velocity (m/s)
k Bulk permeability (m2)
l Fluid viscosity (Pad s)
Dp Pressure gradient
L Drainage path length (m)
E1 Force acting on block 1 normal to slip plane
(N)
E2 Force acting on block 2 normal to slip plane
(N)
d Slip plane inclination (8)L1 Length along block 1 basal release surface
(m)
L2 Length along block 2 subvertical release
surface (m)
L3 Length of interblock slip plane (m)
c1 Cohesion acting along L1, basal surface
(MPa)
c2 Cohesion acting along L2, subvertical sur-
face MPa)
c3 Cohesion acting along L3, interblock surface
(MPa)
W2 Weight of failure block 2 (N)
V1 Volume of failure block 1 (m3)
V2 Volume of failure block 2 (m3)
Vtotal Total volume of failure blocks 1 and 2 (m3)
N Taylor’s stability number
H Slope height (m)
y Length of blocks (retrogression model) (m)
J. Simmons et al. / Journal of Volcanology and Geothermal Research 139 (2005) 241–258 257
Acknowledgements
This work is a result of partial support by the U.S.
National Science Foundation under grant CMS-
9908590. This support is gratefully acknowledged.
The contribution of Hide Yasuhara to the derivation of
stability relations is gratefully acknowledged.
Appendix A. Development of the two-block
stability model
For the geometry illustrated in Fig. 8a, the forces
acting on block 1 parallel to L1 assuming a purely
cohesive rock mass are:
E1sind ¼ c1L1
FS
þ c3L3cosdFS
; (A-1)
and the forces acting on block 2 parallel to L2 are:
W2sina � E2cos a � 90þ dð Þ
¼ c2L2
FS
þ c3L3cos 180� a � dð ÞFS
; (A-2)
where E1=E2 is the interblock force, FS is the factor of
safety, c is cohesive strength, W is block weight, and
all other symbols are identified in Fig. 8a. Solving for
E1 and E2 gives:
E1 ¼c1L1 þ c3L3cosd
FSsind; (A-3)
and
E2 ¼W2sina � c2L2
FS� c3L3cos 180�a�dð Þ
FS
cos a � 90þ dð Þ : (A-4)
Setting E1 equal to E2 (necessitated by statics) allows
for the true factor of safety to be identified as:
FS ¼ c2L2sind þ sindcos 180� a � dð Þc3L3 þ cos a � 90þ dð Þ c1L1 þ c3L3cosd½ �W2sindsind
:
(A-5)
The lengths L1, L2, and L3 are found trigonometrically
as:
L1 ¼c
sina; (A-6)
L2 ¼H
sina; (A-7)
when db90�a
L3 ¼c
cos 90� að Þ � dð Þ ; (A-8)
and when dz90�a
L3 ¼c
cos d � 90þ að Þ ; (A-9)
where y is the length of the blocks, and H is the slope
height as illustrated in Fig. 8. The weight of block 2 is
calculated through its volume, V2, and unit weight,
cR=26 kN/m3, as:
W2 ¼ cRV2 ¼ cR Vtotal � V1ð Þ; (A-10)
where
Vtotal ¼ yH
sina
� �� y
cosasina
� �� �þ y2
cosasina
� �h i� �� 1 unit thick: ðA-11Þ
When dz90�a
V1 ¼1
2y y
cosasina
� �þ ytan d � 90� að Þð Þ
h i� �� 1 unit thick; ðA-12Þ
and when db90�a
V1 ¼1
2
y
sinay
sin a þ dð Þ sina� �
� 1 unit thick: (A-13)
References
Bromhead, E.N., 1992. The Stability of Slopes. 2nd ed. Blackie
Academic and Professional, London, 411 pp.
Calder, E.S., Luckett, R., Sparks, R.S.J., Voight, B., 2002.
Mechanisms of lava dome instability and generation of rockfalls
and pyroclastic flows at Soufriere Hills Volcano, Montserrat. In:
Druitt, T.H., Kokelaar, B.P. (Eds.), The Eruption of Soufriere
Hills Volcano, Montserrat, from 1995 to 1999. Memoirs.
Geological Society, London, 21, 173–190.
Crowley, J., Zimbelman, D., 1997. Mapping hydrothermally altered
rocks on Mount Rainier, Washington, with Airborne Visible/
Infrared Imaging Spectrometer (AVIRIS) data. Geology 25,
559–562.
J. Simmons et al. / Journal of Volcanology and Geothermal Research 139 (2005) 241–258258
Druitt, T.H., Young, S.R., Baptie, B., Bonadonna, C., Calder,
E.S., Clarke, A.B., Cole, P.D., Harford, C.L., Herd, R.A.,
Luckett, R., Ryan, G., Voight, B., 2002. Episodes of cyclic
Vulcanian explosive activity with fountain collapse at
Soufriere Hills Volcano, Montserrat. In: Druitt, T.H., Kokelaar,
B.P. (Eds.), The Eruption of Soufriere Hills Volcano, Mon-
tserrat, from 1995 to 1999. Memoirs. Geological Society,
London, 21, 173–190.
Elsworth, D., Voight, B., 2001. The mechanics of harmonic gas
pressurization and failure of lava domes. Geophysical Journal
International, Royal Astronomical Society 145, 187–198.
Elsworth, D., Voight, B., Thompson, G., Young, S.R., 2004. A
thermal-hydrologic for rainfall-triggered collapse of lava domes.
Geology, In press, 20 pp.
Fink, J., Griffiths, R., 1998. Morphology, eruption rates, and
rheology of lava domes: insights from laboratory models.
Journal of Geophysical Research 103 (B1), 527–545.
Fink, Kieffer, 1993. Estimate of pyroclastic flow velocities resulting
from explosive decompression of lava domes. Nature 363
(6430), 612–615.
Hale, A., Wadge, G., 2003. Numerical modeling of the growth
dynamics of a simple silicic lava dome. Geophysical Research
Letters 20, 19.
Hoek, E., Bray, J., 1981. Rock Slope Engineering, 3rd ed.
Institution for Mining and Metallurgy, E and FN Spon, 358 pp.
Iverson, R.M., 1990. Lava domes modeled as brittle shells that
enclose pressurized magma, with application to Mount St.
Helens. In: Fink, Jonathan H. (Ed.), Lava Flows and Domes,
Emplacement Mechanisms and Hazard Implications. Springer
Verlag, Berlin, pp. 47–69.
Kaneko, T., Wooster, M., Nakada, S., 2002. Exogenous and
endogenous growth of the Unzen lava dome examined by
satellite infrared image analysis. Journal of Volcanology and
Geothermal Research 116, 151–160.
Lopez, D., Williams, S., 1993. Catastrophic volcanic collapse:
relation to hydrothermal processes. Science 260, 1794–1796.
Matthews, A.D., Barclay, J., 2004. A thermodynamical model for
rainfall-triggered volcanic dome collapse. Geophys. Res. Lett.
31(5), No. L05614 MAR 12 2004.
McGuire, B., Norton, G., Sparks, R.S.J., Robertson, R., Young, S.,
Miller, A., 1996. Report of the Explosive Event of 17–18
September 1996, Montserrat Volcano Observatory Special
Report 1. Montserrat Volcano Observatory, Digital Elevation
Maps from November 1995–March 1998 time period.
Robertson, R., Cole, P., Sparks, R.S.J., Harford, C., Lejeune, A.M.,
McGuire, W., Miller, A., Murphy, M., Norton, G., Stevens, N.,
Young, S., 1998. The explosive eruption of Soufriere Hills
volcano, Montserrat, West Indies, 17 September, 1996. Geo-
physical Research Letters 25, 3429–3432.
Robertson, R., Aspinall, W., Herd, R., Norton, G., Sparks, R.,
Young, S., 2000. The eruption of the Soufriere Hills volcano,
Montserrat, W.I. Philosophical Transactions of the Royal
Society of London 358, 1619–1637.
Simmons, J., Elsworth, D., Voight, B., 2004. Instability of
exogenous lava lobes during intense rainfall. Bull. Volc.
DOI:10.1007/s00445-004-0353-y.
Sparks, R.S.J., Young, S.R., 2002. The eruption of the
Soufriere Hills Volcano, Montserrat (1995–1999): over-
view of scientific results. In: Druitt, T.H., Kokelaar, B.P.
(Eds.), The Eruption of Soufriere Hills Volcano, Montserrat,
from 1995 to 1999, Memoirs, vol. 21. Geological Society,
London, pp. 45–69.
Sparks, R.S.J., Murphy, M.D., Lejeune, A.M., Watts, R.B.,
Barclay, J., Young, S.R., 2000. Control on the emplacement
of the andesite lava dome of the Soufriere Hills Volcano,
Montserrat, by degassing-induced crystallization. Terra Nova
12, 14–20.
Voight, B., Elsworth, D., 1997. Failure of volcano slopes. Geo-
technique 47 (1), 1–31.
Voight, B., Elsworth, D., 2000. Instability and collapse of hazardous
gas-pressurized lava domes. Geophysical Research Letters 27
(1), 1–4.
Voight, B., Hoblitt, R.P., Clarke, A.B., Lockhart, A.B., Miller,
A.D., Lynch, L., McMahon, J., 1998. Remarkable cyclic
ground deformation monitored in real time on Montserrat and
its use in eruption forecasting. Geophysical Research Letters
25, 3405–3408.
Voight, B., Komorowski, J.-C., Norton, G.E., Belousov, A.B.,
Beousova, M., Boudon, G., Francis, P.W., Franz, W., Heinrich,
P., Sparks, R.S.J., Young, S.R., 2002. The 26 December
(Boxing Day) 1997 sector collapse: a case history from
Soufriere Hills Volcano, Montserrat. In: Druitt, T.H., Kokelaar,
B.P. (Eds.), The Eruption of Soufriere Hills Volcano, Mont-
serrat, from 1995 to 1999. Memoirs. Geological Society,
London, 21, 363–407.
Watters, R., Zimbelman, D., Bowman, S., Crowley, J., 2000. Rock
mass strength assessment and significance to edifice stability,
Mount Ranier and Mount Hood, Cascade Range volcanoes.
Pure Applied Geophysics 157, 957–976.
Watts, R.B., Herd, R.A., Sparks, R.S.J., Young, S.R., 2002. Growth
patterns and emplacement of the andesitic lava dome at
Soufriere Hills Volcano, Montserrat. In: Druitt, T.H., Kokelaar,
B.P. (Eds.), The Eruption of Soufriere Hills Volcano, Mont-
serrat, from 1995–1999. Geological Society, London, Memoirs,
21, 115–152.
Yamasato, H., Kitagawa, S., Komiya, M., 1998. Effect of rainfall on
dacitic lava dome collapse at Unzen volcano, Japan. Papers in
Meteorology and Geophysics 48 (3), 73–78.