three-dimensional discrete element simulation of axi-symmetric collapses of granular columns
TRANSCRIPT
Three-Dimensional Discrete Element Simulation of
Axi-symmetric Collapses of Granular Columns
Paul W. Cleary∗ Martin Frank†
June 22, 2006
Abstract
The flow of granular media is both intriguing and up to now barely understood.A recently initiated series of experiments systematically studies granular flow in asimple setting, namely the collapse of a granular column onto a horizontal plane. Inthis paper, we present computational studies of the axi-symmetric collapse of granularcolumns using the three-dimensional Discrete Element Method. We consider a singleexperiment and explore the sensitivity of the result when varying key unknown modeland physical parameters for spherical particles. The observations allow us to give anupper bound on the dynamic friction coefficient.
1 Introduction
Granular media play a very important role in industrial processes and in the environmentalsciences. Industrial applications range from the flow in a silo [12], milling [6] and fluidisedbed combustion to the derivation of pharmaceutical products from powders [13]. An un-derstanding of granular flows is also crucial in the issue of landslides and avalanches [10].
Moreover, granular materials are also interesting from a theoretical point of view. Agranular material can mimic the behavior of a solid, liquid or gas [15]. But in contrast tofluid or gas dynamics, a constitutive equation to describe the dynamics is still absent [15,17, 13]. This has led Kadanoff [17] to state that “the study of granular materials gives onea chance to reinvent statistical mechanics in a new context”.
∗CSIRO Division of Mathematical and Information Sciences, 71 Normanby Road, Clayton VIC 3168,Australia, [email protected]
†CSIRO Division of Mathematical and Information Sciences, 71 Normanby Road, Clayton VIC 3168,Australia and Fachbereich Mathematik, TU Kaiserslautern, Erwin-Schrodinger-Str., 67663 Kaiserslautern,Germany, [email protected]
1

A series of experiments in a simple setting, initiated independently by Lube et al. [23]and Lajeunesse et al. [19], has generated a lot of interest and subsequently many experimen-tal, theoretical and computational studies. Both groups study the collapse of a suddenlyreleased cylindrical column of grains onto a horizontal plane. Both analyze the run-outdistance and the height of the final deposit and establish simple empirical scaling laws.The geometry of the final deposit seems to depend only on the initial aspect ratio a ofthe column, defined as the quotient of its height and its radius. Especially, the result isindependent of the type of grain. In further experiments, Lube et al. [22] and Balmforth &Kerswell [1] studied the release of particulate columns, initially contained in a rectangularbox, into a channel. Lajeunesse et al. [20] investigated both the collapse into a rectangularchannel and that of a semicircular tube of material onto a plane. Siavoshi & Kudrolli [26]studied the collapse of a semi-infinite granular step.
The experimental results could only in part be explained by theoretical studies [21, 18,24].
Computer simulations have been carried out by Staron & Hinch [28, 27]. Zenit [31]reported some preliminary results. In both simulations, the setting was two-dimensional.The particles were modeled as circular discs which is overly idealistic. Up to 10,000 parti-cles were used. The reported results do not quantitatively match the experimental resultsfor the axi-symmetric collapse. They qualitatively agree with quasi two-dimensional ex-periments, such as the release of a rectangular box of grains into a channel [22, 1, 20]. Noeffort has been made to date to quantitatively match the experimental results. As a firststep into this direction, Zenit [31] has investigated two different values of the material’sfriction coefficient and found only a weak dependence of the experimental outcome on thisparameter. Staron & Hinch [27] studied the different friction coefficients and coefficientsof restitution.
In this and further papers, we present a systematic numerical study of the axi-symmetriccollapse of granular columns. It is our purpose to reproduce the experiments quantitatively.Contrary to earlier two-dimensional simulations, we use the three-dimensional Discrete El-ement Method (DEM) and systematically study the sensitivity with respect to the keymodel parameters. As will be explained later, our simulation setup is closer to the experi-ments than previous modeling efforts.
The outline of this paper is as follows. In Section 2, we give an overview over the DEMmethod. Our results are presented in the subsequent sections. First we describe the setupand how we characterize the surface and its properties in Section 3. We also summarizethe experimental results of the axi-symmetric collapse of granular columns so that the datato be compared with is clear. In Section 4 we consider the full three dimensional collapseof granular columns consisting of spherical particles. We then systematically study thesensitivity of the outcome with respect to the variation of several interaction parameters,including friction (static and dynamic), rolling friction, coefficient of restitution and springconstant. Our conclusions and future work are presented in Section 5.
2
2 The Discrete Element Method
In DEM simulation of granular or particulate flows, the philosophy is to model the systemat the micro-mechanical or particle level and to follow the motion of all these particles,including the detection and simulation of all collisional interactions of particles with eachother and with their environment. The intent is to model the system as accurately aspossible, with the particles being represented as realistically as possible (including matchingtheir sizes and preferably their shapes), subject to the computational limit of the method(which is the total number of particles that can be followed in any reasonable time onavailable computers).
The DEM methodology and its variants are now well established and are described inreview articles by Campbell [3], Barker [2] and Walton [29]. Here we use a reasonablyconventional soft particle DEM method. This is essentially a simple method involving thedetection of collisions, (a geometrical problem just made slightly complex by trying to useup to a million particles interacting with complex boundaries and sometimes including non-spherical particle shape). Once detected, collisions are modeled using a contact force law todetermine the transient interaction forces between the particles. These include compressivecollisional forces as well as compressive and tensile cohesive forces. Equations of motionare then solved for the motion of the particles and for the motion of any boundary objectswith which the particles interact.
At the heart of the soft particle DEM is the Contact Force Law. The particles areallowed to overlap slightly and the amount of overlap ∆x (which represents the degree oflocal surface deformation) and the normal vn and tangential vt relative velocities at thepoint of contact determine the collisional forces via a collisional force law. There are arange of possible force models available in the literature. These approximate the collisiondynamics to various extents. We use the simplest and most robust force model, whichinvolves a linear spring-dashpot combination to give the magnitude of the normal force:
Fn = −kn ∆x + Cn vn . (1)
This consists of a spring to provide the repulsive force that pushes particles back apart anda dashpot to dissipate a proportion of the relative kinetic energy. The maximum overlapbetween particles is determined by the stiffness kn of the spring in the normal direction.Typically average overlaps in the range 0.1–1.0% are desirable and the spring constant ischosen to produce particle overlaps in this range.
The normal damping coefficient Cn is chosen to give a required coefficient of restitutionε (defined as the ratio of the post-collisional to pre-collisional normal component of therelative velocity) for the materials involved:
Cn = 2 γ√
mij kn
3
where
γ = −ln(ε)
√
π2 + ln2(ε), and mij =
mi mj
mi + mj
is the reduced mass of particles i and j with masses mi and mj respectively. This arisesfrom the analytic solution of the normal collision equation (1) for two such particles. Thissolution also provides the characteristic timescale for the collision of such particles fromwhich the time step can be set.
The magnitude of the tangential force is given by:
Ft = min{
µFn , | kt
∫
vt dt + Ct vt |}
, (2)
where the integral of the tangential velocity vt over the collision behaves as an incrementalspring that stores energy from the relative tangential motions and represents the elastictangential deformation of the contacting surfaces. Note that this is a vector quantity thatdepends on the direction(s) of motion during loading and unloading of the contact. Thedashpot dissipates energy from the tangential motion and models the tangential plasticdeformation of the contact. The total tangential force (given by the sum of the elastic andplastic components) is limited by the Coulomb frictional limit at which point the surfacecontact shears and the particles begin to slide over each other. For more complex contactforce models see Walton [29] and Schafer et al. [25].
The three key parts of the DEM algorithm are:
1. A search grid is periodically used to construct a particle near-neighbor interactionlist. Using only particle pairs in the near neighbor list reduces the contact detectionto an O(N) operation, where N is the total number of particles. Such an approachallows very large problems to be solved. Problems with up to a million particles arenow easily solvable on moderate speed single processor workstations.
2. The collisional forces for each collision are calculated using the spring-dashpot modelfor each pair of particles in the near-neighbor list.
3. All the collisional and other forces and torques acting on the particles and boundarycomponents are summed to give net forces and torques on each particle. The kineticequation is solved for the position from the velocity whilst Newton’s equations aresolved to give the velocities from the net forces. Similar equations are integrated forthe orientations and the spins from the net torques:
xi = ui , (3)
ui =∑
j
Fij /mi + g , (4)
ωi =∑
j
Mij /Ii , (5)
4
where xi, ui and Fij are the position, velocity and collisional forces on particle i, mi
is its mass and ωi is the vector denoting the particle spin produced by the torques Mij
for a particle with principle moments of inertia Ii. g is the gravity vector. Note thatfor non-spherical particles the torques need to be rotated into the principle frame ofthe particles in order to allow the division by the moments of inertia in equation (5).
The integration scheme used to solve these ordinary differential equations is a secondorder predictor-corrector. Typically, 15 to 25 time steps are required to accuratelyintegrate each collision. This necessitates small time steps (typically 10−4 to 10−6
s, depending on the controlling length and time scales of each problem). If theintegration is accurate then the coefficient of restitution from which the dampingcoefficient was chosen should be recovered.
DEM produces complete information about the particle system at the particle level.Many quantitative predictions of interest can be made by utilizing this data. These include:wear (erosion) rates and distributions on boundaries, collision force/stress (dynamic loads)distributions on boundaries, power consumption of and torque required for machinery, flowrates, sampling statistics, mixing and segregation rates. More details on the simulationmethod and on the data analysis may be found in Cleary [5] and Cleary & Sawley [11].Examples of DEM modeling using this code can be found in Cleary [4] and Cleary & Sawley[12]
3 Simulation Configuration and Surface Characteri-
zation
First, we briefly describe the experimental results that we want to reproduce in this study.These consist basically of the geometry of the final deposit after the collapse. Then weexplain our simulation setup. We also discuss the exact definition of the geometricalquantities we want to determine.
3.1 Experimental Configuration
Although experiments in cylindrical as well as in rectangular geometry have been per-formed, we focus on the cylindrical axi-symmetric collapse in this study, investigated exper-imentally by Lube et al. [23] and Lajeunesse et al. [19]. It has been reasonably questionedwhether the experiments in rectangular channels represent genuinely two-dimensional flows.A recent study [16] indicates that the dynamics are essentially driven by interaction withthe bounding end walls.
In both sets of experiments, a cylindrical column of grains inside a cylindrical tubeis prepared. The initial column has radius ri and height hi. Its aspect ratio is defined
5
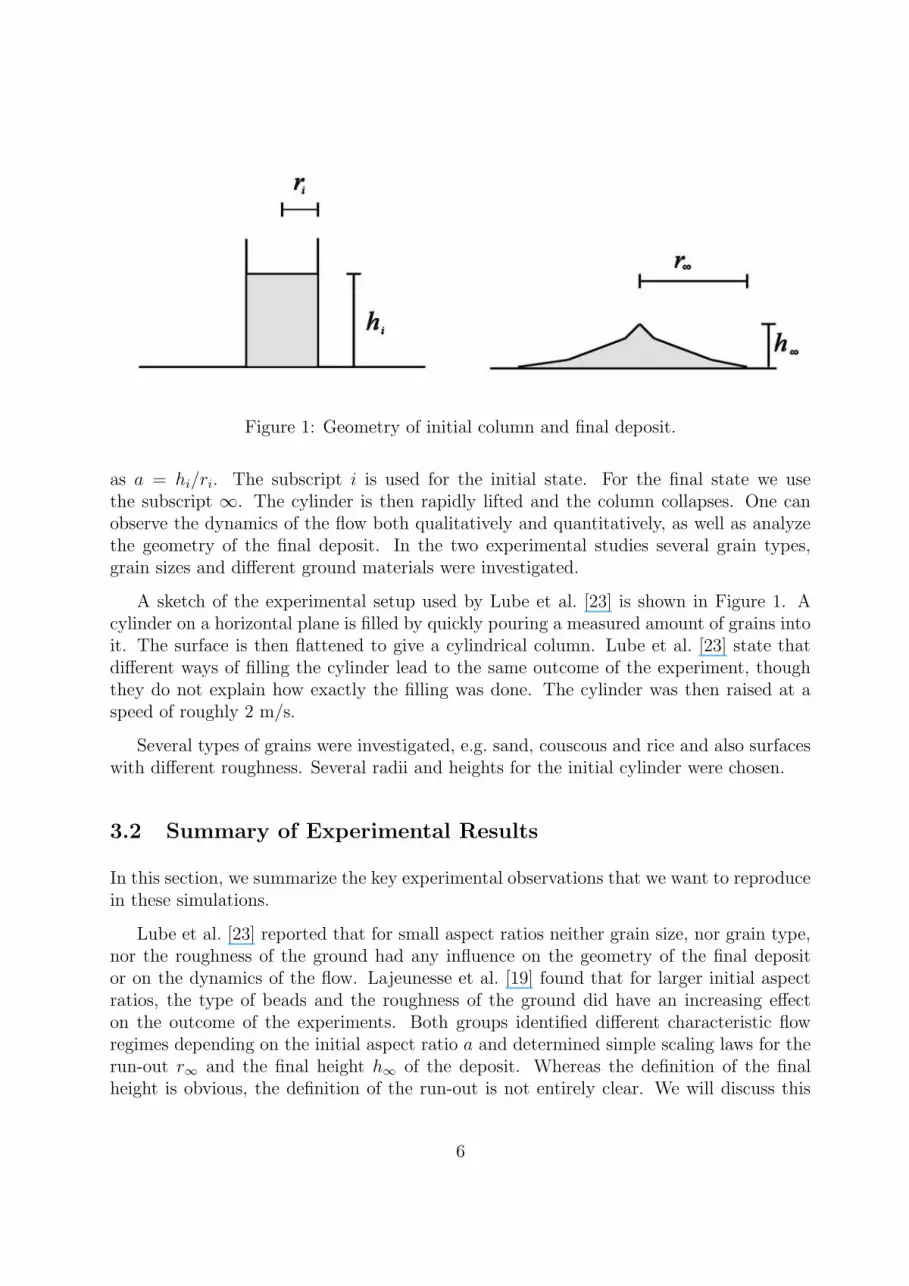
Figure 1: Geometry of initial column and final deposit.
as a = hi/ri. The subscript i is used for the initial state. For the final state we usethe subscript ∞. The cylinder is then rapidly lifted and the column collapses. One canobserve the dynamics of the flow both qualitatively and quantitatively, as well as analyzethe geometry of the final deposit. In the two experimental studies several grain types,grain sizes and different ground materials were investigated.
A sketch of the experimental setup used by Lube et al. [23] is shown in Figure 1. Acylinder on a horizontal plane is filled by quickly pouring a measured amount of grains intoit. The surface is then flattened to give a cylindrical column. Lube et al. [23] state thatdifferent ways of filling the cylinder lead to the same outcome of the experiment, thoughthey do not explain how exactly the filling was done. The cylinder was then raised at aspeed of roughly 2 m/s.
Several types of grains were investigated, e.g. sand, couscous and rice and also surfaceswith different roughness. Several radii and heights for the initial cylinder were chosen.
3.2 Summary of Experimental Results
In this section, we summarize the key experimental observations that we want to reproducein these simulations.
Lube et al. [23] reported that for small aspect ratios neither grain size, nor grain type,nor the roughness of the ground had any influence on the geometry of the final depositor on the dynamics of the flow. Lajeunesse et al. [19] found that for larger initial aspectratios, the type of beads and the roughness of the ground did have an increasing effecton the outcome of the experiments. Both groups identified different characteristic flowregimes depending on the initial aspect ratio a and determined simple scaling laws for therun-out r∞ and the final height h∞ of the deposit. Whereas the definition of the finalheight is obvious, the definition of the run-out is not entirely clear. We will discuss this
6
issue further in the next section. Lube et al. [23] found
r∞ − ri
ri
=
{
1.24a for a < 1.7
1.6a1/2 for a > 1.7(6)
andh∞
ri
=
{
a for a < 1.7
0.88a1/6 for a > 1.7.(7)
Whereas Lajeunesse et al. [19] obtained
r∞ri
=
1
2µr
(
a +√
4µ2r −
a2
3
)
for a < 0.74√
3a0.74
for a > 0.74
(8)
andh∞
ri
=
{
a for a < 0.74
0.74 for a > 0.74.(9)
Here, µr = tan θr, where θr is the material’s angle of repose.
3.3 Simulation Setup
The setup of our simulation is shown in Figure 2. A column is initially filled by free fallingparticles created uniformly across the top of the cylinder and these are then allowed tosettle. The top surface is then trimmed at the desired height. The manner of filling is im-portant since this matches the actual filling process and gives particle packings that shouldbe close to those used in the experiments. Since the key feature we need to predict is thelocation of failure of the particle mass, it is likely to be important to have a microstructurein the simulated material that is as close as possible to the one existing in the experimentalconfiguration.
For the base case above we used about 165,000 spherical particles. The particle diam-eters were uniformly distributed between 1.9 mm and 2.1 mm. The particle filling lastedfor 0.12 s, and the particles settled after 1 s. The column was then trimmed and all ve-locities were set to zero initially to give a stable stationary initial packed mass ready forsimulating the experiments. The mean solid fraction (relative packing density) was 0.62,which coincides with the value given by Lajeunesse et al. [19].
The simulation starts with the lifting of the cylinder at 2 m/s, the value used by Lube etal. [23]. Contrary to the previous simpler computer studies [28, 31] we actually simulate thelifting of the tube. This is important because the walls are rough and the frictional effectslift material near the walls shearing the outer regions of the granular column and potentiallymobilizing larger volumes of the particle microstructure. The grains then collapse underthe influence of gravity and flow radially outward. The flow came to rest before t = 1 s.
7

(a) Empty cylinder. (b) Filling.
(c) Settled mass. (d) Trimmed mass.
Figure 2: Setup of DEM simulation matching the experimental configuration. Particlesare shaded by velocity.
8

height hi radius ri aspect ratio a density ρ mean grain size11.0 cm 5.75 cm 1.91 1390 kg/m3 2 mm
Table 1: Parameters for the base case.
3.4 Characterisation of Collapsing Surface
It is straightforward to define the final height. It is not obvious, how the run-out distanceis best defined. Both experimental studies [23, 19] and the previous 2D simulation [31] giveno definition at all. In the simulation by Staron & Hinch [28], the final run-out distance isdefined by the outmost grain that is connected to the main mass by at least one contact.
We can expect that the identification was visual and that a circle of best fit should beused excluding particles that are not adequately connected to the final deposit. In threedimensions, the rule used by Staron & Hinch [28] is likely to be quite sensitive to thelocations of specific particles which is both undesirable and unlikely to closely match theusual best fit.
Here we modify this rule to determine the best fit radius. Using the center of the pileas the origin, the polar angle around the origin is discretised into bins and the maximumconnected particle in each bin is stored. The maximum radius is determined by averagingthese extreme particles for all the radial directions. The choice of 90 radial bins of 4 degreewidth gave robust and reproducible results.
4 Study of Model Parameters
In this section, we consider a single representative experiment and explore the sensitivityof quantitative prediction while varying key unknown model and physical parameters forspherical particles (the usual particle shape in DEM). We choose a column with initialradius ri = 5.75 cm and height hi = 11 cm. This corresponds to an aspect ratio ofa = 1.91. The parameters are taken from one experiment carried out by Lube et al. [23]and are summarized in Table 1. The maximal run-out distance in this case, computed fromthe scaling law obtained by Lube et al. [23] is r∞ ≈ 18.5 cm, the final height is h∞ ≈ 5.6cm. The scalings obtained by Lajeunesse et al. [19] give r∞ ≈ 16.0 cm and h∞ ≈ 4.3 cm.Lacking an indication of the error of these values, we estimate the accuracy of these valuesby inspection of the figures provided in the articles to be at least 10-15%.
In the following, we describe the parameters we varied and their influence on the out-come. In the standard case, the friction coefficient µ we used was 0.3, the coefficient ofrestitution ε = 0.4 and no rolling friction or spin modification were used.
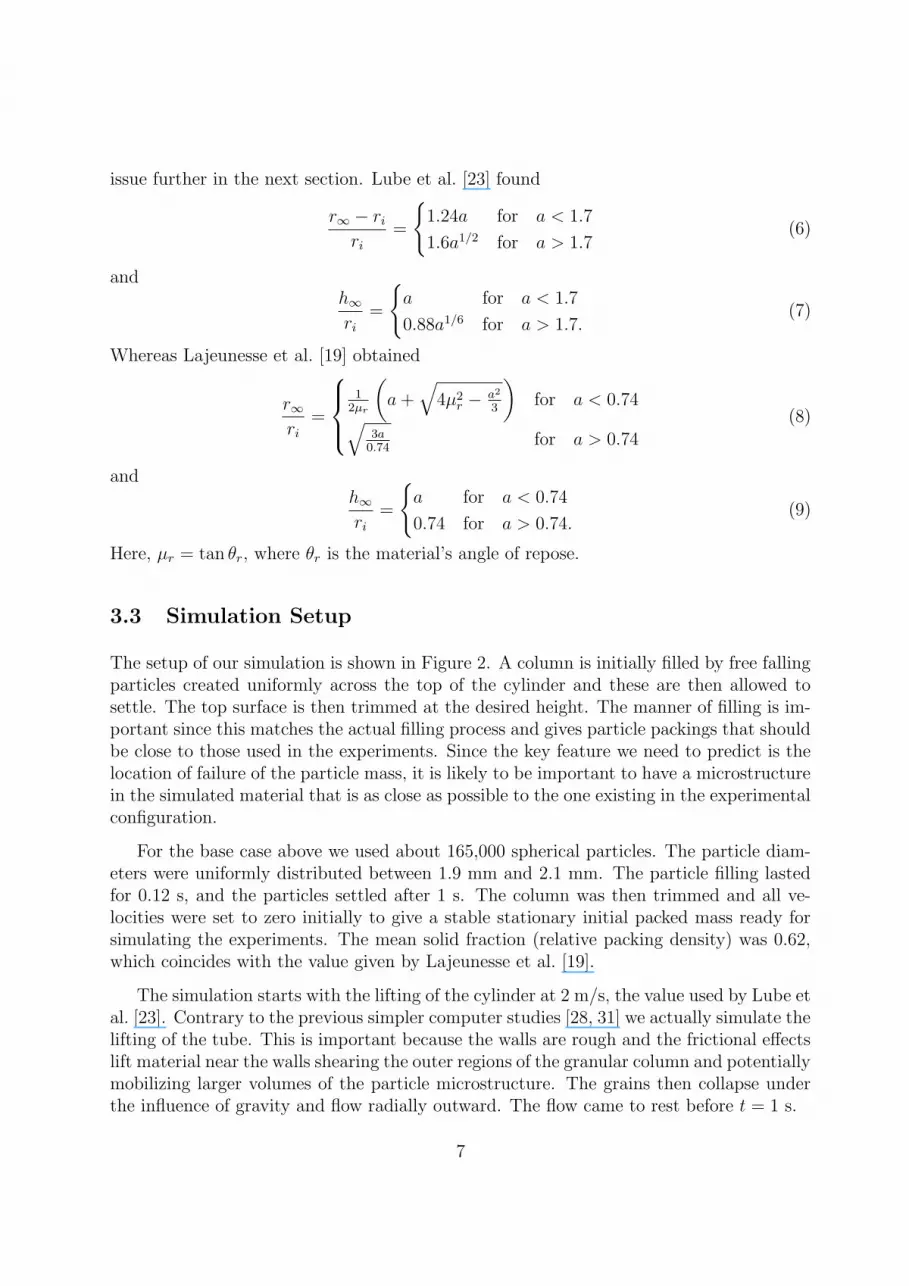
Figures 3 and 4 show the cylinder lifting and particle run-out from two different views.Initially, the lower part of the column spreads out while the upper part remains still.
9

(a) t = 0 s. (b) t = 0.05 s.
(c) t = 0.10 s. (d) t = 0.15 s.
Figure 3: Progress of the collapse of the column with a view from the side. Particles shadedby velocity.
10
(a) t = 0 s. (b) t = 0.05 s.
(c) t = 0.10 s. (d) t = 0.15 s.
Figure 4: Progress of the collapse of the column with an oblique vertical view. Particlesshaded by velocity.
11

Figure 5: Height and radius of collapsing granular column versus time for the base case.
Then the upper part of the column begins to free fall. The upper surface remains almostparallel to the ground with the sharp upper edge of the particle mass being preserved fora significant time. The column continues to spread out with time, becoming progressivelyflatter and lower. The leading edge maintains a very clear circular shape throughout.
The run-out is controlled by:
• The supply of energy to the flow which depends on the initial height of the pile (whichcontrols the initial gravitational potential energy,
• The fraction of the pile that is mobilised and able to dissipate energy
• The rate of dissipation of the energy, which is controlled essentially by the shear ratesin the flow and the particle properties.
Once all the available kinetic energy is dissipated and the pile becomes stable, so that thereis no further failure (or any additional conversion of potential to kinetic energy) the flowstops and a final deposit is obtained.
In the experiments, a static inner cone was observed, from which the particles sliddown In the simulations with spherical particles, the final deposit is broader and muchmore flat. We do not observe any static inner cone, from which the particles slide down,but rather a flattened, rounded central cone. The entire granular column consisting ofspherical particles slumps throughout its depth and there is no stable supportive innerstructure to help hold up the pile. The particles tend to spread out sideways over thewhole height of the cylinder starting from the beginning of the failure. This is not inaccord with the experimental observations.
12
(a) Initial setting. (b) µ = 0.3. (c) µ = 0.4. (d) µ = 0.5.
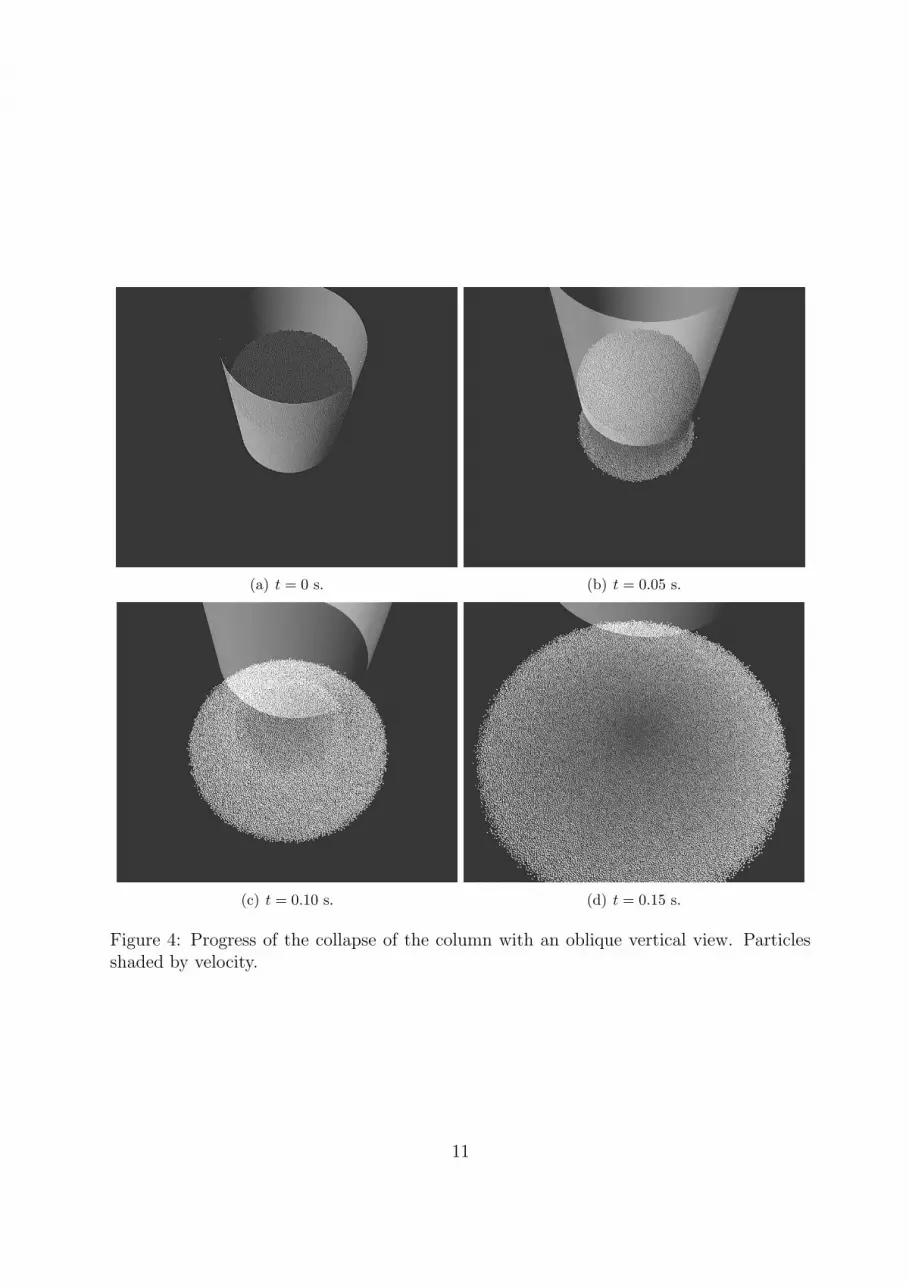
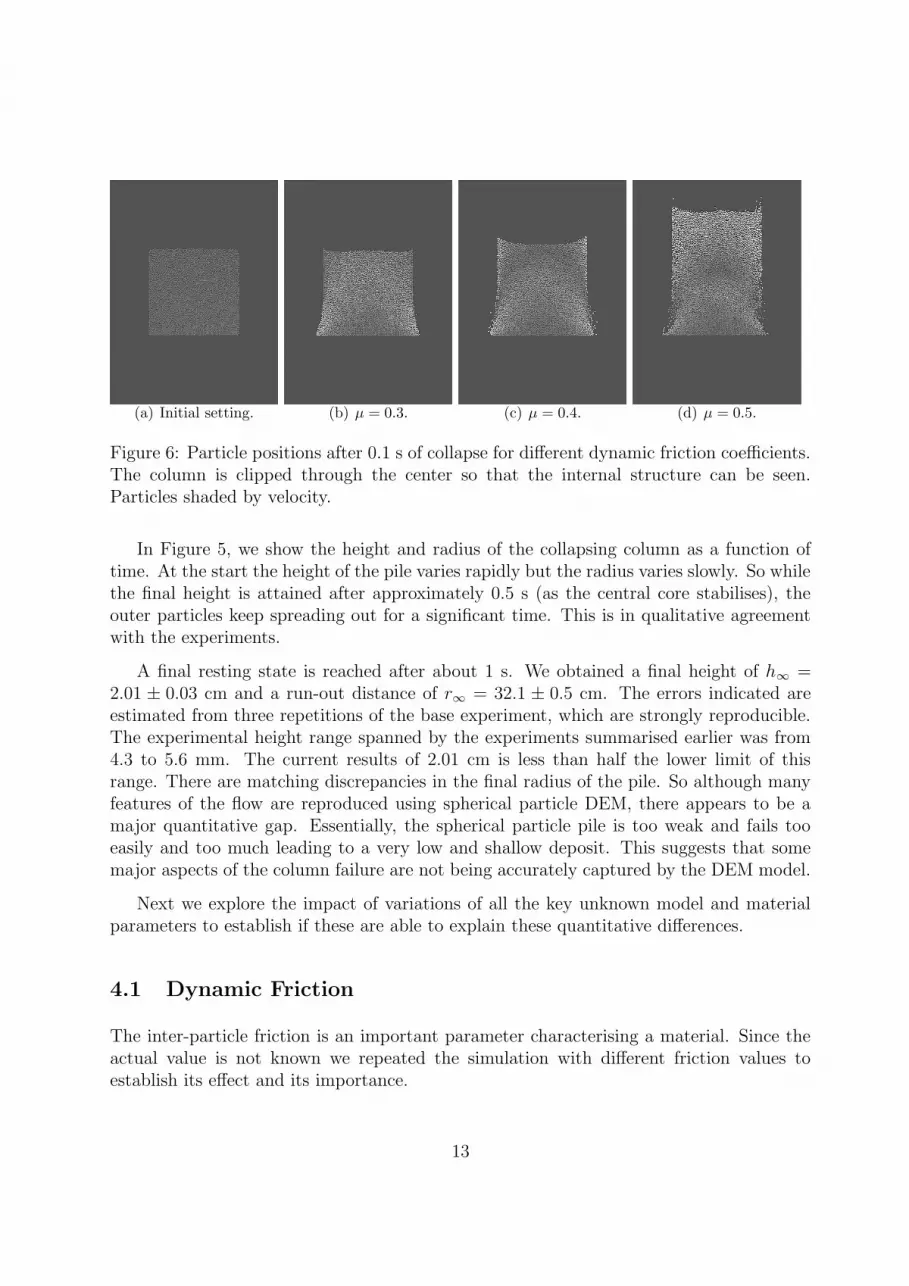
Figure 6: Particle positions after 0.1 s of collapse for different dynamic friction coefficients.The column is clipped through the center so that the internal structure can be seen.Particles shaded by velocity.
In Figure 5, we show the height and radius of the collapsing column as a function oftime. At the start the height of the pile varies rapidly but the radius varies slowly. So whilethe final height is attained after approximately 0.5 s (as the central core stabilises), theouter particles keep spreading out for a significant time. This is in qualitative agreementwith the experiments.
A final resting state is reached after about 1 s. We obtained a final height of h∞ =2.01 ± 0.03 cm and a run-out distance of r∞ = 32.1 ± 0.5 cm. The errors indicated areestimated from three repetitions of the base experiment, which are strongly reproducible.The experimental height range spanned by the experiments summarised earlier was from4.3 to 5.6 mm. The current results of 2.01 cm is less than half the lower limit of thisrange. There are matching discrepancies in the final radius of the pile. So although manyfeatures of the flow are reproduced using spherical particle DEM, there appears to be amajor quantitative gap. Essentially, the spherical particle pile is too weak and fails tooeasily and too much leading to a very low and shallow deposit. This suggests that somemajor aspects of the column failure are not being accurately captured by the DEM model.
Next we explore the impact of variations of all the key unknown model and materialparameters to establish if these are able to explain these quantitative differences.
4.1 Dynamic Friction
The inter-particle friction is an important parameter characterising a material. Since theactual value is not known we repeated the simulation with different friction values toestablish its effect and its importance.
13
(a) µ = 0.2. (b) µ = 0.3.
(c) µ = 0.4. (d) µ = 0.5.
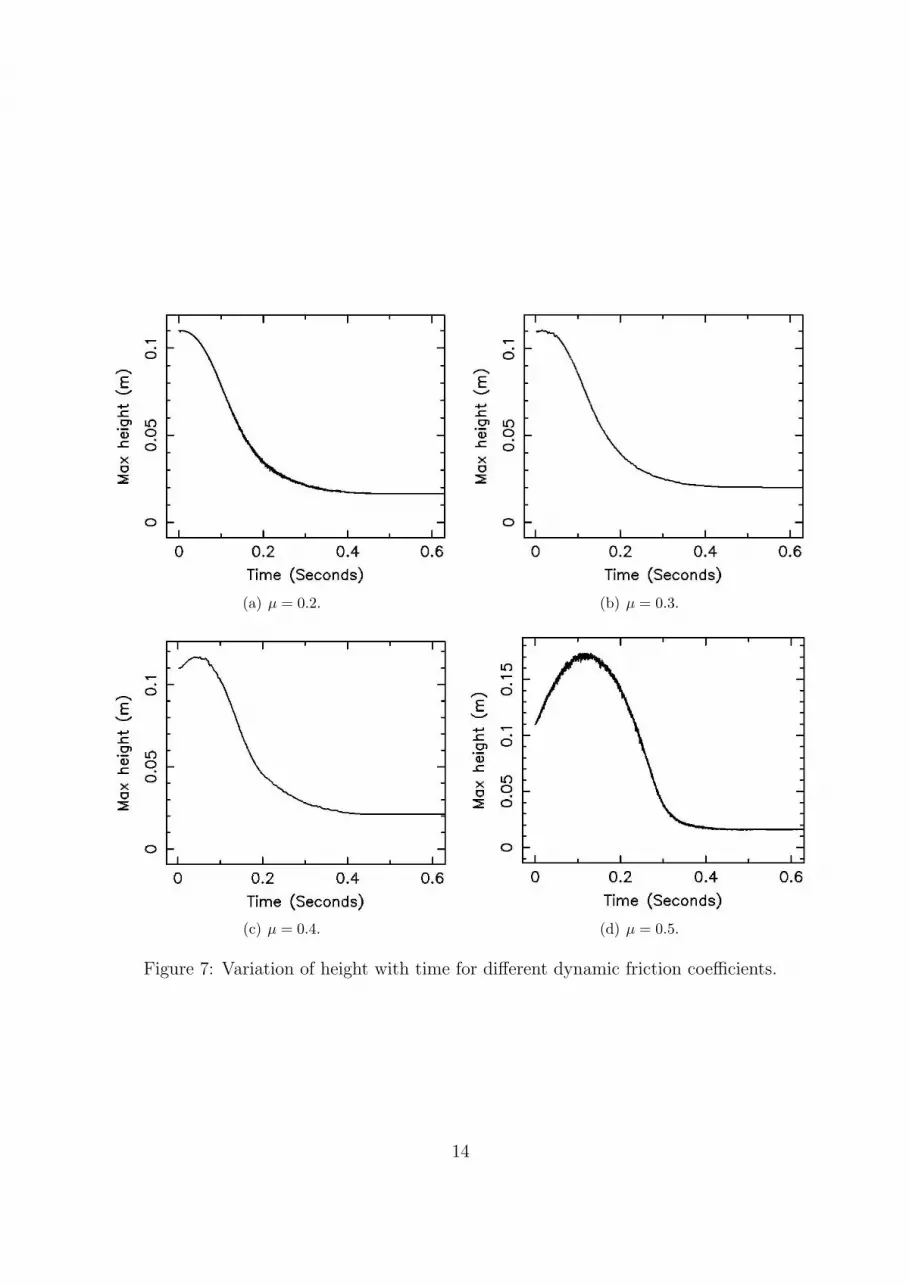
Figure 7: Variation of height with time for different dynamic friction coefficients.
14
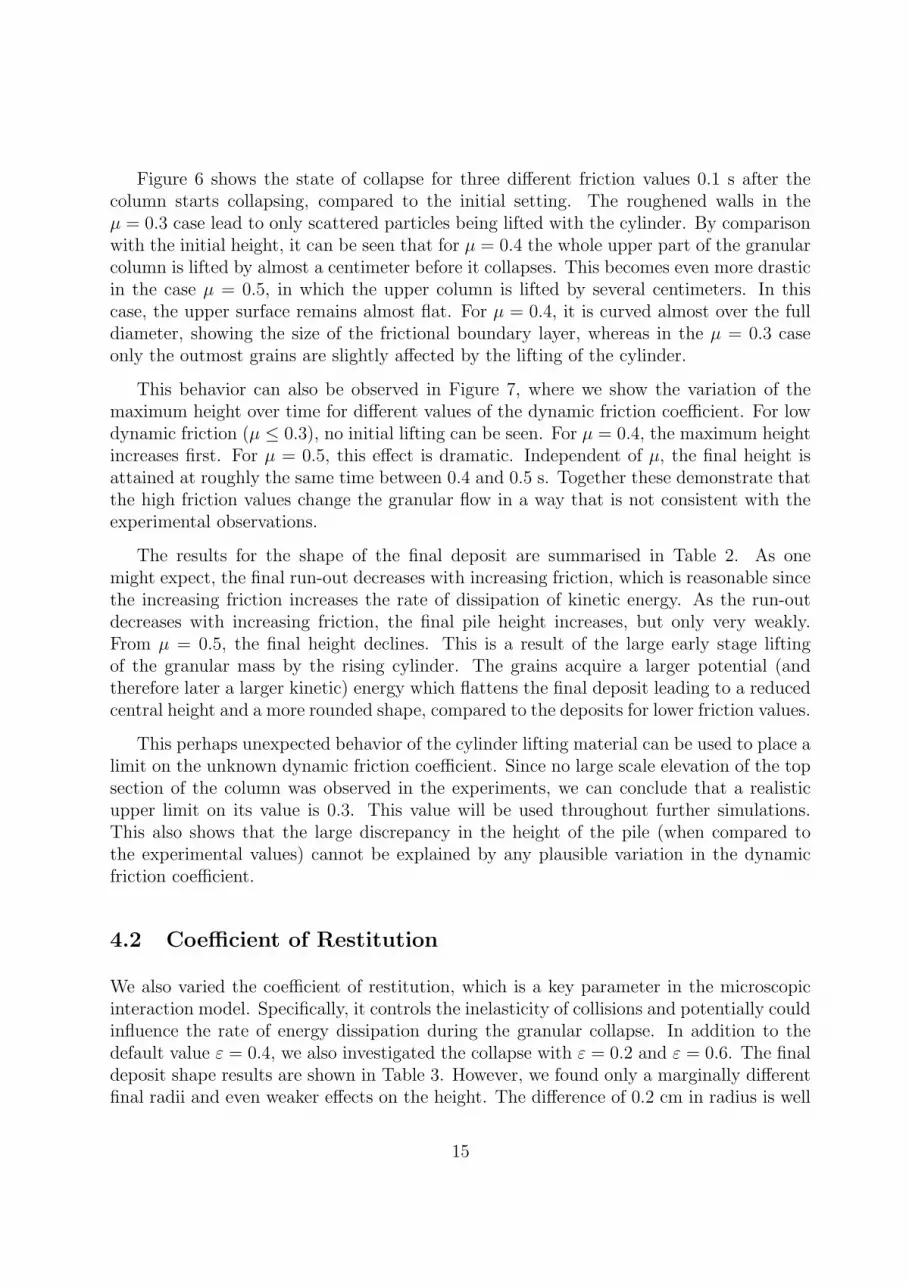
Figure 6 shows the state of collapse for three different friction values 0.1 s after thecolumn starts collapsing, compared to the initial setting. The roughened walls in theµ = 0.3 case lead to only scattered particles being lifted with the cylinder. By comparisonwith the initial height, it can be seen that for µ = 0.4 the whole upper part of the granularcolumn is lifted by almost a centimeter before it collapses. This becomes even more drasticin the case µ = 0.5, in which the upper column is lifted by several centimeters. In thiscase, the upper surface remains almost flat. For µ = 0.4, it is curved almost over the fulldiameter, showing the size of the frictional boundary layer, whereas in the µ = 0.3 caseonly the outmost grains are slightly affected by the lifting of the cylinder.
This behavior can also be observed in Figure 7, where we show the variation of themaximum height over time for different values of the dynamic friction coefficient. For lowdynamic friction (µ ≤ 0.3), no initial lifting can be seen. For µ = 0.4, the maximum heightincreases first. For µ = 0.5, this effect is dramatic. Independent of µ, the final height isattained at roughly the same time between 0.4 and 0.5 s. Together these demonstrate thatthe high friction values change the granular flow in a way that is not consistent with theexperimental observations.
The results for the shape of the final deposit are summarised in Table 2. As onemight expect, the final run-out decreases with increasing friction, which is reasonable sincethe increasing friction increases the rate of dissipation of kinetic energy. As the run-outdecreases with increasing friction, the final pile height increases, but only very weakly.From µ = 0.5, the final height declines. This is a result of the large early stage liftingof the granular mass by the rising cylinder. The grains acquire a larger potential (andtherefore later a larger kinetic) energy which flattens the final deposit leading to a reducedcentral height and a more rounded shape, compared to the deposits for lower friction values.
This perhaps unexpected behavior of the cylinder lifting material can be used to place alimit on the unknown dynamic friction coefficient. Since no large scale elevation of the topsection of the column was observed in the experiments, we can conclude that a realisticupper limit on its value is 0.3. This value will be used throughout further simulations.This also shows that the large discrepancy in the height of the pile (when compared tothe experimental values) cannot be explained by any plausible variation in the dynamicfriction coefficient.
4.2 Coefficient of Restitution
We also varied the coefficient of restitution, which is a key parameter in the microscopicinteraction model. Specifically, it controls the inelasticity of collisions and potentially couldinfluence the rate of energy dissipation during the granular collapse. In addition to thedefault value ε = 0.4, we also investigated the collapse with ε = 0.2 and ε = 0.6. The finaldeposit shape results are shown in Table 3. However, we found only a marginally differentfinal radii and even weaker effects on the height. The difference of 0.2 cm in radius is well
15

Dynamic friction Final height h∞ [cm] Final run-out r∞ [cm]
0.2 1.7 39.40.3 2.0 32.10.4 2.1 27.60.5 1.6 25.6
Lube et al. 5.6 18.5Lajeunesse et al. 4.3 16.0
Table 2: Variation of dynamic friction. Final height and final run-out for a column of fixedaspect ratio a = 1.91 (hi = 5.75 cm, ri = 11 cm).
Coefficient of restitution Final height h∞ [cm] Final run-out r∞ [cm]
0.2 2.1 32.40.4 2.0 32.10.6 2.1 32.5
Lube et al. 5.6 18.5Lajeunesse et al. 4.3 16.0
Table 3: Variation of coefficient of restitution. Final height and final run-out for a columnof fixed aspect ratio a = 1.91 (hi = 5.75 cm, ri = 11 cm).
within the range of the statistical error. Thus we conclude that the result of the collapsesimulation is insensitive to the coefficient of restitution. This result is consistent with thefindings of Staron & Hinch [27], who found that only an unrealistically high coefficient ofrestitution of ε = 1 influences the result.
4.3 Spring Constant
DEM does not model the particles as perfectly rigid. A suitable value of the spring constantin the spring-dashpot model assures that the particles overlap only slightly (i.e. there isonly small deformation at the particle contacts). All simulations reported in this paperwere run with a spring constant kn = 1000 N/m. The base case simulation was repeatedwith a higher spring constant of 5000 N/m to assess sensitivity to this numerical modelparameter. The final height of the deposit, given in Table 4, differed by only 0.05 cm. Theradius of the deposit decreased by around 6% which while larger is still not significant.In the base experiment, the maximum relative overlap between two particles was 0.33%.The average overlap was less than 0.018%. This is consistent with the requirements for arealistic collision model.
16
Spring constant Final height h∞ [cm] Final run-out r∞ [cm]
1000 2.01 32.15000 2.06 29.8
Lube et al. 5.6 18.5Lajeunesse et al. 4.3 16.0
Table 4: Variation of spring constant. Final height and final run-out for a column of fixedaspect ratio a = 1.91 (hi = 5.75 cm, ri = 11 cm).
Rolling friction angle Final height h∞ [cm] Final run-out r∞ [cm]
0 2.0 32.10.01 2.1 31.20.025 2.3 29.3
Lube et al. 5.6 18.5Lajeunesse et al. 4.3 16.0
Table 5: Variation of rolling friction angle. Final height and final run-out for a column offixed aspect ratio a = 1.91 (hi = 5.75 cm, ri = 11 cm).
4.4 Rolling Friction
Rolling friction takes into account that the surfaces of colliding particles are not perfectlyrigid. The deformation of the surface means that the real contact normal is slightly dis-placed from the purely geometric normal connecting the line of centers. When resolvingthe normal force into the local collision frame this means that there is a small componentdirected against the relative motion in the tangential direction. This is termed rollingfriction and is the force responsible for billiard balls slowing down. It is a small but po-tentially important force in partial run-out scenarios. See Witters & Duymelinck [30] formore details of the origin and formulation of this force. Rolling friction is often adoptedin DEM simulation as a partial solution to the idealisation of the particle shape as beingspherical leading to grossly implausible values. Here we will restrict consideration to valuesthat reasonably represent the real rolling friction effect.
We have tested two values, φ = 0.01 and φ = 0.025, with the later one being themaximum value that can still be viewed as being realistic given the materials and loadsinvolved in the flow. The value of the rolling friction angle has no dramatic effect on thedynamics of the collapse. However, it seems to have a moderate effect on the shape ofthe final deposit, as shown in Table 5, with the height increasing by 15% and the radiusdecreasing by about 10%. This effect, while meaningful in size, is certainly not enough toexplain the large discrepancy observed between simulation and experiment.
17

Static friction coefficient Final height h∞ [cm] Final run-out r∞ [cm]
none 2.01 32.10.4 2.13 32.50.65 2.20 32.6
Lube et al. 5.6 18.5Lajeunesse et al. 4.3 16.0
Table 6: Variation of static friction coefficient. Final height and final runout for a columnof fixed aspect ratio a = 1.91 (hi = 5.75 cm, ri = 11 cm).
4.5 Static Friction
The friction experienced between static surfaces is often higher than between the samesurfaces when they are moving. A static friction coefficient higher than the dynamicfriction coefficient could in principle influence the geometry of the final deposit, by makingthe failure of the particle microstructure harder. We therefore used static fiction coefficientsof µs = 0.4 and µs = 0.65 to evaluate their effect on the collapse. The final deposit shaperesults are shown in Table 6. While static friction does not affect the final run-out distance,it does affect the final height. It does this by stabilising an inner static region (which isalso observed in experiments) so that less material flows from the central region leaving amodestly taller pile. Once the particles are in motion, static friction does not apply andso this has no influence on the particles spreading outward or on where they stop. Theseparticles are halted by normal dynamic friction effects.
4.6 Spin Modification
A somewhat crude method sometimes used in DEM to partially take into account theblockiness of particles when actually modeling them as spherical, is to use only a proportionof the torque in the calculation of the spin. This crudely reflects on of the effects of shape,which is that not all the tangential force for a non-spherical particle goes into drivingrotation. If only 50% of the torque is considered, then material has much more torsionalresistance and one might imagine that this would produce a stronger particle microstructurethat was better able to resist failure. The final deposit shape results are shown in Table7. The simulation result changes only slightly with a 10% increase in height and a 6%decrease in radius. If the torque used is reduced further to only 20% of the sphericalparticle value, then no additional increase in final height is observed but the decrease inthe final pile radius increases to 15%. This improvement is still only modest compared tothe large scale of the discrepancy with the experiments and shows that even fairly extreme“modeling corrections” are not able to explain the quantitative errors.
18

Spin modification Final height h∞ [cm] Final run-out r∞ [cm]
1.0 2.01 32.10.5 2.21 29.80.2 2.21 27.2
Lube et al. 5.6 18.5Lajeunesse et al. 4.3 16.0
Table 7: Spin modification. Final height and final run-out for a column of fixed aspectratio a = 1.91 (hi = 5.75 cm, ri = 11 cm).
Final height h∞ [cm] Final run-out r∞ [cm]
base case 2.01 32.1best case 2.43 29.2
Lube et al. 5.6 18.5Lajeunesse et al. 4.3 16.0
Table 8: Best case results versus experiments. Final height and final run-out for a columnof fixed aspect ratio a = 1.91 (hi = 5.75 cm, ri = 11 cm).
4.7 The Most Plausible Spherical Particle Case
Based on the results above, we perform one final simulation in a best case scenario, i.e.we choose realistic parameters to get as close as possible to the experimental result. Thedynamic friction is fixed at its upper limit µ = 0.3, static friction µs = 0.65 and rollingfriction 0.025. Spring constant and coefficient of restitution are kept at their standardvalues. This is the most favorable selection of parameters. Compared to the base case, thegap to the experimental values is not significantly reduced, see Table 8.
5 Conclusions and Future Work
We have explored the axi-symmetric collapse of a granular column using full three-dimensionalDEM simulation with spherical representations of the particles. The flows predicted qual-itatively match those observed in the experiments.
In contrast to previous simpler simulations, we included the actual lifting of the confin-ing cylinder in the simulation. This allowed us to show that the dynamic friction coefficientcan have a large effect on the motion of the granular assembly. By comparison with theexperiments, an upper bound on the value of the dynamic friction coefficient of 0.3 wasestablished.
Systematic study of the effect of the unknown model and physical parameters was per-formed to understand their impact on predictions of the final pile geometry. The collapsesand final pile were found to be insensitive to changes in the coefficient of restitution and
19

the spring constant. Rolling friction had the strongest effect with a 15% increase in pileheight and a 10% decrease in pile diameter. High static friction leads to a 10% increasein pile height by stabilising an inner core of the pile, but has negligible impact on thepile radius. Artificial modification of the spin (as a partial substitute for the shape of theparticles) had limited impact.
The best final height we were able to obtain from the entire range of simulation con-ditions, was h∞ = 2.4 cm, which is only half (or even less than) of what was observed inthe experiments. Lube et al. [23] found h∞ ≈ 5.6 cm, the result obtained by Lajeunesse etal. [19] was h∞ ≈ 4.3 cm. The discrepancy between measured and simulated final radiusis also of the same order as the value itself. From a perspective of wanting to be able toquantitatively accurately predict particle flows using DEM, these errors are significant.
These observations regarding spherical particle DEM are consistent with findings inother flow situations, where poor quantitative agreement has also been found when usingspherical particles even in an otherwise realistic 3D simulations. It was shown in [8] thatcircular particle DEM in 2D predicts the mixing of salt cubes very poorly. The closestmatch that could be achieved with such a model was an error of ten times too slow for themixing rate. This resulted from the circular particle microstructure being far too weak,failing prematurely and leading to the wrong flow pattern and the wrong mixing rate.Cleary & Metcalfe [7] used squarish particles in two dimensions to model the same mixingproblem. The flow pattern then predicted was correct and the mixing rates varied fromagreement with the experiments to 50% error, which was a substantial improvement. Theuse of two dimensional models is expected to be the source of the remaining discrepancies.
Quantitative shoulder and toe positions for a laboratory scale Semi-autogenous Grind-ing (SAG) mill have been compared with experiments in [9]. These showed that circularparticles in two dimensions are again far too weak and that the charge slumps prematurely,giving 10 degree errors in shoulder and toe angles. Inclusion of particle shape in the modelwas able to explain half the shoulder discrepancy. The use of three dimensional DEM leadsto correct prediction of the toe (essentially where the avalanching material comes to rest).This demonstrates that the use of both particle shape and three dimensions in DEM areneeded to obtain quantitative accuracy for this application.
The effect of particle shape on the prediction of discharge from hoppers was investigatedin two dimensions by [12]. Circular particles were found to always lead to mass flow, butthe inclusion of particle shape effects (particularly aspect ratio) significantly strengthenedthe material and increased its effective yield stress leading to caving effects. In threedimensions, this allows prediction of rat-holes and funnel flow.
Debroux & Cleary [14] explicitly evaluated the effect of particle shape attributes in twodimensions on the angle of repose and failure of a granular material. This showed that theblockiness of the material increased resistance to flow and strongly increased both angles.Particle aspect ratio changes lead at first to strong increases in resistance to flow and thento a strong decreases when the elongated particles are able to align with the free surface
20
and therefore flow more easily.
In all these cases, the use of circular particles, particularly in two dimensions leads toa microstructure that is too weak, fails prematurely by rolling and has very low angles ofrepose and failure. These problems are all observed in the current simulations and basedon these previous experiences one could reasonable expect that particle shape will have asignificant quantitative impact on the flow and the final deposit shape.
Staron & Hinch [28] discussed the difference between their numerical results and theexperiment, and also identified the circular particles used in their simulation as one of thereasons. Perfectly spherical particles produce a larger run-out distance and a smaller finalheight than realistic particles. The effect of the spin modification parameter (in this study)also points in this direction.
This study of the model parameters was thus a first step in a systematic study of DEMsimulation of the collapse of granular columns. The next step is to explicitly investigatethe influence of particle shape on the collapse process, which will be done in an upcomingpaper. There we will also compare the results of the DEM simulation with the empiricalscaling laws found in the experiments. For these materials, it is also possible that microliquid bridge cohesion resulting from humidity could also play some part. This will also beexplored in a later paper.
Acknowledgments
This work was supported by German Academic Exchange Service (DAAD) under grantD/05/44710.
References
[1] N.J. Balmforth and R.R. Kerswell, Granular collapse in two dimensions, J. FluidMech. 538 (2005), 399–428.
[2] G.C. Barker, Computer simulations of granular materials, Springer-Verlag, 1994.
[3] C.S. Campbell, Rapid granular flows, Annual Rev. Fluid Mech. 22 (1990), 57–92.
[4] P.W. Cleary, The filling of dragline buckets, Mathematical Engineering in Industry 7
(1998), 1–24.
[5] , Predicting charge motion, power draw, segregation, wear and particle breakage
in ball mills using discrete element methods, Minerals Engineering 11 (1998), 1061–1080.
21

[6] , Recent advances in DEM modelling of tumbling mills, Minerals Engineering14 (2001), 1295–1319.
[7] P.W. Cleary and G. Metcalfe, Quantitative comparison of mixing rates between dem
and experiment in a slowly rotating cylinder, Proc. World Congress Particle Technol-ogy 4, 2002, p. CD paper 550.
[8] P.W. Cleary, G. Metcalfe, and K. Liffman, How well do discrete element granular
flow models capture the essentials of mixing and segregation processes?, Appl. Math.Modelling 22 (1998), 995–1008.
[9] P.W. Cleary, R. Morrison, and S. Morrell, Comparison of dem and experiment for a
scale model SAG mill, Int. J. Min. Processing 68 (2003), 2003.
[10] P.W. Cleary and M. Prakash, Discrete-Element modelling and smoothed particle hy-
drodynamics: potential in the environmental sciences, Phil. Trans. R. Soc. Lond. A362 (2004), 2003–2030.
[11] P.W. Cleary and M.L. Sawley, Three dimensional modelling of industrial granular
flows, Proc. 2nd International Conference on CFD in the Minerals and ProcessingIndustries, 1999, pp. 95–100.
[12] , DEM modelling of industrial granular flows: 3D case studies and the effect
of particle shape on hopper discharge, Appl. Math. Modelling 26 (2002), 89–111.
[13] P.G. de Gennes, Granular matter: a tentative view, Rev. Mod. Phys. 71 (1999), S374–S382.
[14] F. Debroux and P. W. Cleary, Characterising the angles of failure and repose of
avalanching granular material using the discrete element method, Proc. 6th WorldCongress of Chemical Engineering, 2001, p. paper 1537.
[15] H.M. Jaeger, S.R. Nagel, and R.P. Behringer, Granular solids, liquids and gases, Rev.Mod. Phys. 68 (1996), 1259–1273.
[16] P. Jop, Y. Forterre, and O. Pouliquen, Crucial role of sidewalls in granular surface
flows: consequences for the rheology, J. Fluid Mech. 541 (2005), 167–192.
[17] L.P. Kadanoff, Built upon sand: theoretical ideas inspired by granular flows, Rev. Mod.Phys. 71 (1999), 435–443.
[18] R.R. Kerswell, Dam break with Coulomb friction: a model for granular slumping?,Phys. Fluids 17 (2005), 057101.
[19] E. Lajeunesse, A. Mangeney-Castelnau, and J.P. Vilotte, Spreading of a granular mass
on a horizontal plane, Phys. Fluids 16 (2004), 2371–2381.
22

[20] E. Lajeunesse, J.B. Monnier, and G.M. Homsy, Granular slumping on a horizontal
surface, Phys. Fluids 17 (2005), 103302.
[21] E. Larrieu, L. Staron, and E.J. Hinch, Raining into shallow water as a description of
the collapse of a column of grains, J. Fluid Mech. 554 (2006), 255–270.
[22] G. Lube, H.E. Huppert, S.J. Sparks, and A. Freundt, Collapses of two-dimensional
granular columns, Phys. Rev. E 72 (2005), 041301.
[23] G. Lube, H.E. Huppert, S.J. Sparks, and M.A. Hallworth, Axisymmetric collapses of
granular columns, J. Fluid Mech. 508 (2004), 175–199.
[24] A. Mangeney-Castelnau, F. Bouchut, J.P. Vilotte, E. Lajeunesse, A. Aubertin, andM. Pirulli, On the use of Saint Venant equations to simulate the spreading of a granular
mass, J. Geophys. Res. 110 (2005), B09103.
[25] J. Schafer, J. Dippel, and D.E. Wolf, Force schemes in simulation of granular material,J. Phys. I France 6 (1996), 5.
[26] S. Siavoshi and A. Kudrolli, Failure of a granular step, Phys. Rev. E 71 (2005), 051302.
[27] L. Staron and E.J. Hinch, The spreading of a granular mass: role of grain properties
and initial conditions, submitted.
[28] , Study of the collapse of granular columns using two-dimensional discrete-grain
simulation, J. Fluid Mech. 545 (2005), 1–27.
[29] O.R. Walton, Numerical simulation of inelastic frictional particle-particle interaction,ch. 25, pp. 884–911, 1994.
[30] J. Witters and D. Duymelinck, Rolling and sliding resistive forces on balls moving on
a flat surface, Am. J. Phys. 54 (1986), 80–83.
[31] R. Zenit, Computer simulations of the collapse of a granular column, Phys. Fluids 17
(2005), 031703.
23