chpo/1a portolan charts: construction and copying [occam's razor methodology (lex parsimoniae
TRANSCRIPT
ChPo/1a PORTOLAN CHARTS: CONSTRUCTION AND
COPYING [Occam’s Razor Methodology (Lex
parsimoniae)]ABSTRACT.
The subject of the Portolan chart is fraught with difficulty, particularly how were they constructed. This text is the description of a forensic examination of the Jorge de Aguiar Portolan (1492) by redrawing, line by line, from basic principles. Used here-in are also many texts to illustrate preceding research. The conclusion is that they were very simply drawn using a graticule, not generally a circle, and a template or pattern was utilized to draw the map itself.Note, this paper in a basic form was sent for referee’s comments which are included here-in.Key words: Geographical map; Magnetic basis; Graticule; Template;Utilization of Chart; Portolan or Portolano Chart.The text is 23 A4 pages and there are 11 A4 diagrams [7 to 17 of 17 originals, one a double].
ChPo/1a PORTOLAN CHARTS: CONSTRUCTION AND
COPYING [Occam’s Razor Methodology (Lex
parsimoniae)]SUMMARY
1
“For morethan two centuries much has been written about the origin and method of construction of the Mediterranean portolano charts, (yet) still these matters continue to be the objectof some controversy as no one explanation was able to gather unanimous agreement among researchers.” So began Professor J A Gaspar in his 2008 paperregarding Portolano charts and in particular two charts, those of Jorge de Aguiar as Diagram ChPo/1/D07 illustrates and Angelino Dulceto (Dulcert).
His summation is quite daunting, and illustrates that there are divergent schools of thought with very entrenched positions, particularly from historians who have “bought into’ one idea. Butit can be argued that as researchers have not redrawn charts fromfirst principles using the information contained there-on to reconstruct that which is portrayed, they are actually unable to make a considered judgement upon the whole genre. Texts and computers have been used, but not a forensic examination of a Portolan by redrawing. This research does that and illustrates not only the simple methodology involved but also the method whereby the map was superimposed askew upon the wind rose
2
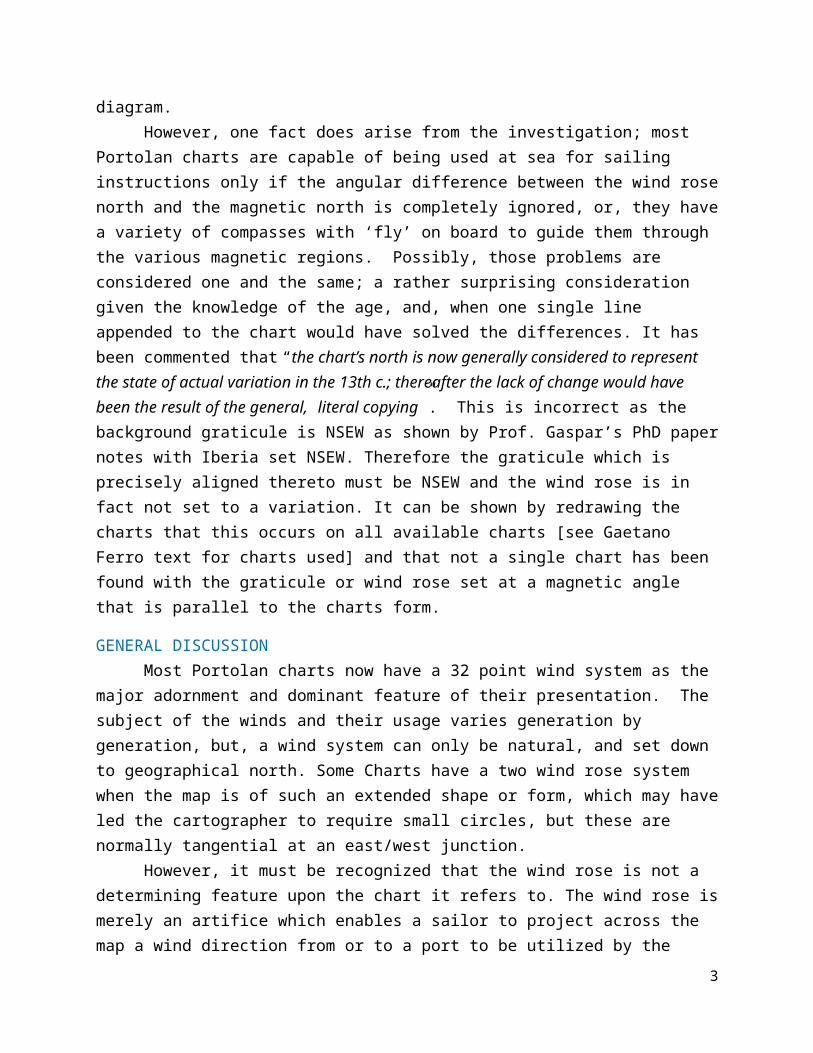
diagram. However, one fact does arise from the investigation; most
Portolan charts are capable of being used at sea for sailing instructions only if the angular difference between the wind rosenorth and the magnetic north is completely ignored, or, they havea variety of compasses with ‘fly’ on board to guide them through the various magnetic regions. Possibly, those problems are considered one and the same; a rather surprising consideration given the knowledge of the age, and, when one single line appended to the chart would have solved the differences. It has been commented that “the chart’s north is now generally considered to represent the state of actual variation in the 13th c.; thereafter the lack of change would have been the result of the general, literal copying”. This is incorrect as the background graticule is NSEW as shown by Prof. Gaspar’s PhD papernotes with Iberia set NSEW. Therefore the graticule which is precisely aligned thereto must be NSEW and the wind rose is in fact not set to a variation. It can be shown by redrawing the charts that this occurs on all available charts [see Gaetano Ferro text for charts used] and that not a single chart has been found with the graticule or wind rose set at a magnetic angle that is parallel to the charts form.
GENERAL DISCUSSIONMost Portolan charts now have a 32 point wind system as the
major adornment and dominant feature of their presentation. The subject of the winds and their usage varies generation by generation, but, a wind system can only be natural, and set down to geographical north. Some Charts have a two wind rose system when the map is of such an extended shape or form, which may haveled the cartographer to require small circles, but these are normally tangential at an east/west junction.
However, it must be recognized that the wind rose is not a determining feature upon the chart it refers to. The wind rose ismerely an artifice which enables a sailor to project across the map a wind direction from or to a port to be utilized by the
3
ship. Therefore, provided there is a wind rose on the Portolan itcan be used. The centre point chosen for the wind rose, some in the middle of a landmass confirms it is merely a design, a methodology to indicate the 32 wind directions. Thus a double wind rose is perhaps merely a visual artifice to enhance the charts beauty, not its usability and in all probability was not required.
However, it must also be quite apparent that on actual charts the littoral of the Mediterranean Sea drawn across the wind rose has no relationship, or readily discernible relationship to that wind rose. The graticule of the wind roseis NSEW and constant, but the map itself is twisted to suit [perhaps] a magnetic variation. Up and down or side to side the actual map may be moved upon the wind rose, but that is not what happens, it is skewed against a NSEW graticule.
That however should not be taken to mean that a hidden relationship cannot exist, but it does prove to be the negating factor in the charts true practical usage as is discussed later.
THE BASIC WIND ROSEA stylization has arisen for the wind rose over the
centuries from a 12 point system to the 16 and 32 point system weuse today. The 12 point wind system is derived from Aristotle’s 10 winds, to which Admiral Timosthenes of Rhodes added two winds to give us the classical 12 wind system used by the Greek and Roman sailors; each of which denoted a geographical direction in navigation. However, gradually in the Mediterranean Sea area the 8/16/32 wind system prevailed and the 32 point compass used for navigation with its 11.25 degree increments. There was then a colour code adopted for the winds by their compass majority; the eight main winds are black; the eight half winds are green and the 16 quarter winds are red. This is in all probability the result of the monastic derivation of the Portolan charts in NW Italy.
But here an anomaly arises; how do you draw the 32 points of4
the compass.The 12 points are derived from a circle where-on the radius is marked off as 6 points (6 x 60) and then one part is subdivided equally and that point used by the compasses to set out the next 6 intermediate points and give 12 x 30 = 360 degrees. Thus only compasses or dividers are requires to establish the wind rose. Ofcourse a protractor, if available, could equally do the job.
The 32 point system is however quite different, the subdivisions being as stated 11.25 degrees and in one quadrant are therefore; 11.25, 22.5, 33.75, 45, 56.25, 67.5, 78.75 and 90 degrees. The compasses can be used to subdivide a quadrant, that is ½ of a ½ of a ½ etc., but it is a laborious technique and task.
If a protractor was available, with the subdivisions engraved then simplicity prevails, but, the 360, 180 or 90 degreeprotractor was not prevalent and would have required each Portolan to have marked positions at 16 points. Thus the oppositequadrant lines are formed by projection through the centre point.This does not appear to have happened. Therefore we must look fora simple but accurate and effective method to construct a 32 point wind rose on vellum, without there being visible traces of that system.
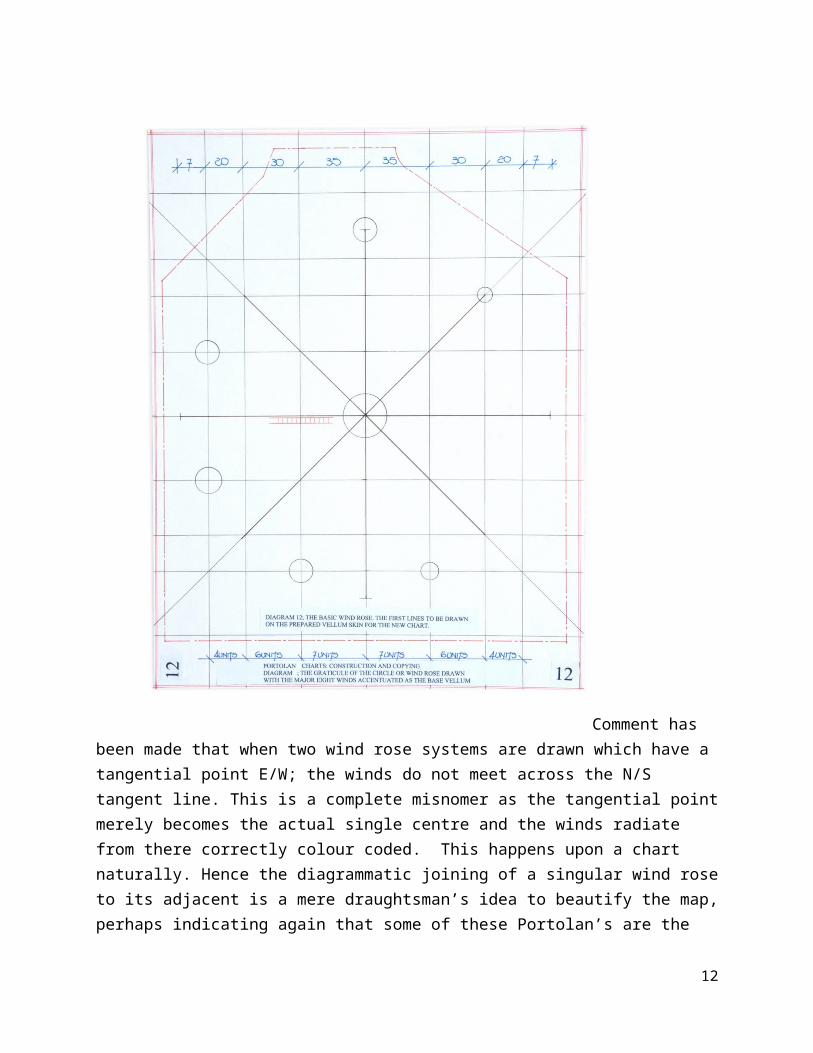
DRAFTSMANSHIP FOR THE WIND ROSE Diagram Ch/Po/1/D12
Although coloured lines which designate the actual winds aregenerally the major feature of a Portolan, in the background are a series of squares and rectangles formed from the natural geometry of the circle. This square/rectangle system locates mostof the wind points on the putative circumference, as diagram Ch/Po/1/D12 illustrates. However it must be recognized that this graticule does not extend to all of the 32 points. Generally the four majors, NSEW, are not co-joined by either vertical or horizontal lines. Therefore it is reasonable to opine that an “imprint” of dividers upon the vellum was to locate these points
5
and probably only these points. Surely if a protractor was available then only an east/west centre line was required and allother wind rose points could be easily marked and the circle, drawn or scribed, would be irrelevant.
But why are the NSEW points omitted from the square? The answer is simple geometry, the subdivision of the circle. The major subdivisions of a 32 point wind rose are the 22.5 degree markers, which are as follows for the N/E Quadrants; (N), NNE, NE, ENE, (E), ESE, SE, SSE, (S). If the corresponding subdivisions are joined by perpendicular lines NS/EW across the four quadrants, squares and rectangles are formed, but the actualNSEW points are not used.
6
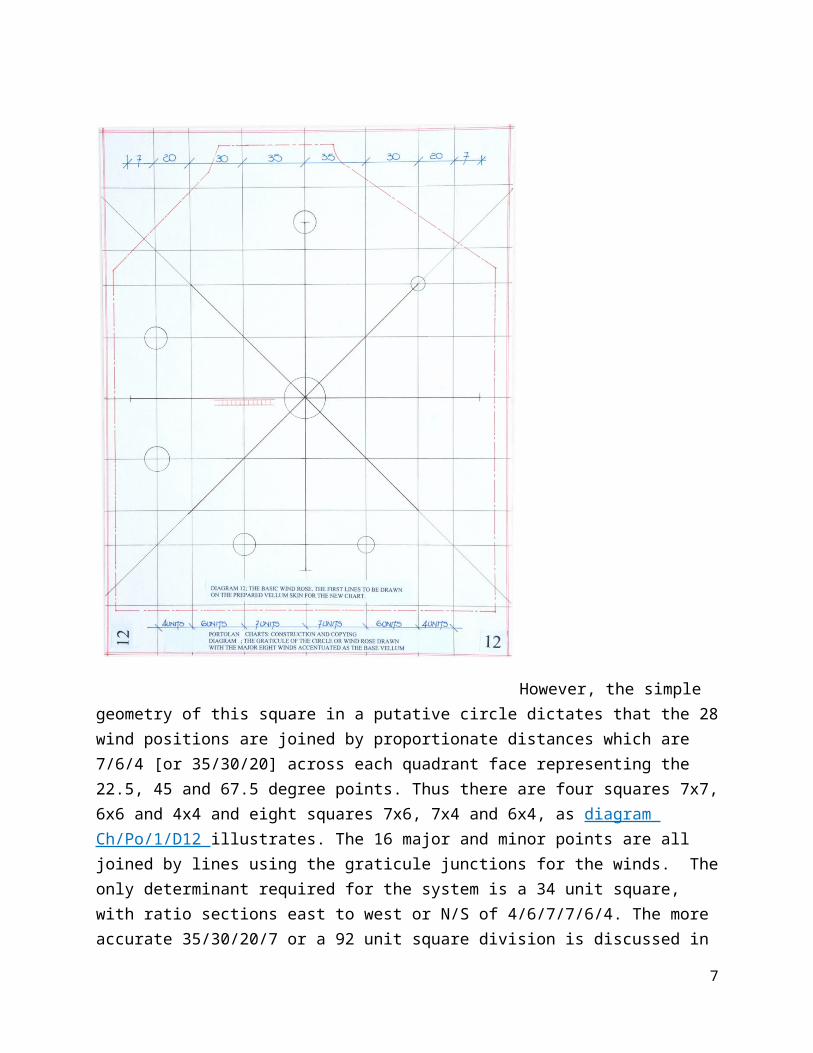
However, the simple geometry of this square in a putative circle dictates that the 28wind positions are joined by proportionate distances which are 7/6/4 [or 35/30/20] across each quadrant face representing the 22.5, 45 and 67.5 degree points. Thus there are four squares 7x7,6x6 and 4x4 and eight squares 7x6, 7x4 and 6x4, as diagram Ch/Po/1/D12 illustrates. The 16 major and minor points are all joined by lines using the graticule junctions for the winds. Theonly determinant required for the system is a 34 unit square, with ratio sections east to west or N/S of 4/6/7/7/6/4. The more accurate 35/30/20/7 or a 92 unit square division is discussed in
7
a later paper, but accuracy is very hard to evaluate on the Portolan’s as will be shown.
The necessity to draw a circle is therefore removed.Thus with only the simplest of tools the whole wind rose can
be constructed, and this is what investigators have inadvertentlynoticed; “Most 14th and 15th century charts- but significantly not all- reveal a ‘hidden circle’ scraped into the vellum with a compass point”.
It has been referee commented that” the scraped hidden [though often visible] circle, on which the intersection points are placed, shows that they DID draw a circle and then subdivide it, somehow. It is often possible to see the hole through the intersection point made with the point of a pair of compasses”. Also that,” it may have had that in some [all?] cases, but no longer be visible except perhaps under special lighting or magnification.
Tony Campbell states it was properly researched under lightsand the circle is not there. The referee is perhaps misguided!
If a chart is drawn using various inks, within a short spaceof time only forensic examination will determine the order of drafting. Thus the investigation by the British Library, as explained by Tony Campbell, HOC p390, that four charts were tested and on three the superimposition was rhumb lines first, followed by the coastal plot. The fourth chart he notes was ambiguous, but appeared to be of a similar base.
But, by measuring the graticules of the charts we can assess those that were measured by the errors that occur in thosemeasurements, which, if a proper circle had been drawn they wouldbe nearly perfect.
Thus the comments given by a referee, as above, contre thistext are not acceptable. Not all of the charts, as Campbell clearly points out have a circle scribed. Therefore there has to have been a fallback position which enables the background graticule to be drawn without the need for compasses. The word ‘often’ as used by the referee obviously provides the answer; “not all of the time”, and the ‘somehow’ shows lack of knowledge.
If not all of them have this feature it is not required and
8
the 34/92 square is all that is required to construct the wind rose. Therefore, the wind rose(s) can be of any size or number upon the chart as they need not be part of the actual map or its scale. But as will be shown they can be to a scale.
However it must be clearly stated that this basic square graticule is hardly ever mentioned by researchers and can be shown in fact to be the basis of the whole Portolan.
R J Pujades i Bataller, (2007), comments that on some chartsthe eight main wind directions, in black or brown, were the firstlines to be drawn, followed by the coasts.
In the following analysis this is the pattern followed to provide a simple overview.
MAGNETIC ALIGNMENT AND CARTOMETRY; EXAMPLES In his 2010 paper, Professor Gaspar states the following
(pp94/95);“Given the little precision of marine compasses of the time, which was certainly reflectedin the accuracy of the directions represented on the charts, the difference between the historical values and the output of the model are not considered critical for the purposeof the present discussion. From the above results, one may then conclude that conditions were favourable during the 14th and 15th centuries for a cartographic representation of the Atlantic coasts of Europe and northern Africa, between the British Isles and the Canary islands, to consolidate. Because the average value of the magnetic declination affecting such representations was relatively small, the resulting charts could easily accommodate a scale of latitudes and be used for supporting astronomicalnavigation, as soon as it was introduced.”
Professor Gaspar has used various charts and superimposed ‘the geographic grid implicit there-on’ which indicates that the Iberian Peninsula, North Africa (Atlantic) and the British Isles are drawn foursquare, NSEW. There is no apparent magnetic deviation.
There is also the distinct possibility that some or perhaps most extant Portolan’s are just “display items” for those who could afford them. The basic form of a Portolan chart has never been established.
This statement appears to be at variance with the financial 9
details provided by R. Pujades i Bataller, e.g. about cheap functional charts. That is because primarily we do not know what a cheap functional chart looked like, nor does Pujades. We have overdeveloped charts and those are being discussed here, as thereis not a single chart which could be considered functional, unless you consider the Carta Pisana as such. That however has been fully researched by this author and the results sent to Ramon Pujades i Bataller to assist his research [I have yet to read his latest paper on the Carta Pisana]. It clearly shows though that it is poorly drawn and has many problems of construction. It could be considered a very poor mariners copy!
But considering charts were sent to Alexandria to be exchanged for pepper, a very pricey commodity, I would have thought the chart maker would get what he could for his work, thegreater price the merrier. However in later years the vellum was worth more than the chart!
THE MAP (CHART) ITSELFBut a map has to be drawn upon this wind rose system
(normally set square to the vellum itself) and thus the wind rosemust be considered the definition of NSEW. North has always beenquite easy to establish using a gnomon and the sun shadow across a circle scribed on the ground (or of course a sundial/scaphe).
However the compass, a magnetic device was to prove problematic for sailors and cartographers in that it did not agree with geographical or stellar north, but it varied its angleto those positions throughout the Mediterranean Sea. Thus any chart which combined the geographical wind rose and the magnetic map angle must have a construct method within.
Magnetic north varied considerably averaging c4 to c11 degrees west of north over several centuries for the Mediterranean itself. HOW THE BASIC CHART OR MAP WAS DRAWN Diagram Ch/Po/1/D12
The cartographer had before him ‘vellum’ which was to be the10
basis of the Portolan. Two or three lines were necessary to commence the work; an east/west central line and one or two north/south lines for the centre point(s) of the wind rose(s). The setting out of the N/S lines is determined by the size of thevellum which thus determines the scale of the chart. Once a perpendicular line is set down the square(s) can be drawn with the 7/6/4 ratio or the more accurate and complete 35/30/20/7 spacing for each quadrant. The winds can then be drawn colour coded as necessary. Diagram Ch/Po/1/D12 has the basic parameters.
11
Comment has been made that when two wind rose systems are drawn which have a tangential point E/W; the winds do not meet across the N/S tangent line. This is a complete misnomer as the tangential pointmerely becomes the actual single centre and the winds radiate from there correctly colour coded. This happens upon a chart naturally. Hence the diagrammatic joining of a singular wind roseto its adjacent is a mere draughtsman’s idea to beautify the map,perhaps indicating again that some of these Portolan’s are the
12
‘library’ versions.But now the cartographer has vellum covered in lines onto
which a map must be drawn. The wind rose is set NSEW, but the map is to be set to the magnetic variation angle or an approximate, or, to any angle, because the cartographer knew of magnetic variation but not of its actuality, and therefore guessed a skewed profile to set the map upon the chart.
It is therefore necessary to align this map across the windrose. To achieve such, guide lines are required to control the N/S and E/W placement of a littoral set at an angle. But, no suchguide lines appear on the Portolan charts. Thus can we be certainthe angle is meaningful?
But in setting down a square as the basis of the wind rose construct our cartographer has provided the means to draw a map angled across the wind rose structure. The cartographer has already used diagonals which illustrate winds and now other diagonals could be used to locate the magnetic variation angle.
By using the major square 7x7 [or 35 x 35] latitudinally anda number of squares and rectangles longitudinally angles such as 4 to 11 degrees can be drawn across the wind rose. If there are two wind roses then the angle possibilities are increased to accommodate any variation. Thus we can assume that the map angle is probably set to the magnetic variation of the cartographer’s home town or that of the client by using the hidden graticule. But it is never noted on the map.
The referee commented “that the simpler explanation is that such alignment by someone trained to copy charts rather than engage in mathematical calculation, just followed that of their model”. But as has been shown no mathematics were required, just the ability to measure and in allprobability that would just have been copying with dividers.
NOTA. It has been implied by various researchers that the generalmariners were not mathematicians. That surely is to be refuted onthe grounds that Andreas Biancho in his “Atlante Nautico” of
13
1436, drew a “circle and square’, the “tondo e quadro” with a list of mathematical tables which could be used to ascertain truecourse when blown by adverse winds off course. Andreas Biancho not only drew his charts but could design a mathematical system based upon Pythagorean triangles to solve the sailing problem of course changes. He also had a methodology for controlling the change of chart scales. My text Ch/Ab/1 fully details the work ofAndreas Biancho in his Atlante Nautico and illustrates the origination of the idea from Ramon Lull.
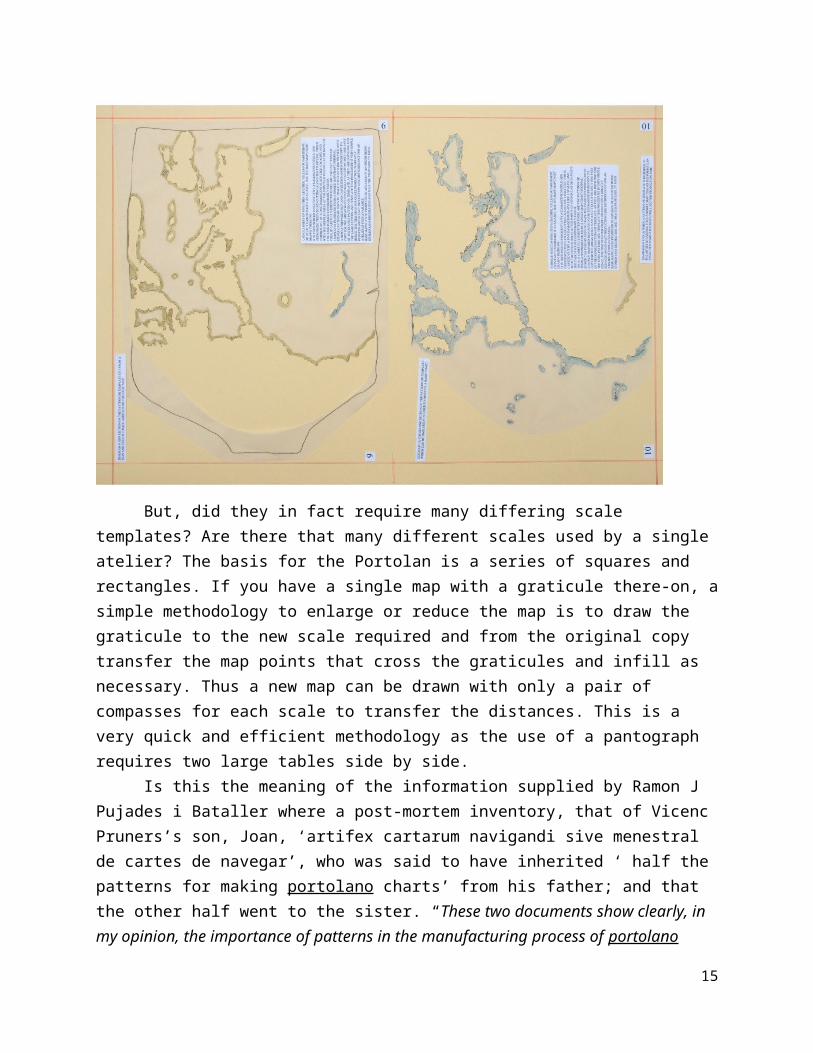
THE MAP TEMPLATE OR PATTERN Diagrams ChPo/1/D08 & ChPo/1/D09/D10
Was there a pattern; a basic map of Europe which could be set on the wind rose to the magnetic angle desired by using the graticule, and then the profile was simply drawn around as one would use a template? Cut out from strong vellum either in a positive or negative forma, it could be drawn onto the wind rose.Both forma’s can be produced from a single cut out. Thus tracing around a forma there would be no mark of its construction, the lines required to draw an accurate map. Did each atelier have itsown template or set of templates for differing scales? If so thenthe drafting of copy maps would have been very easy, and even thefew pin holes observed may have been an additional aid prior to all of the wind rose lines being drawn, but are more likely to bethe result of fixing the template onto the charts surface to allow the profile to be traced. Diagram ChPo/1/D09/D10 is a template for the map which was actually cut out to test the practicality. In fact it produces two templates which are contiguous and equally usable.
14
But, did they in fact require many differing scale templates? Are there that many different scales used by a single atelier? The basis for the Portolan is a series of squares and rectangles. If you have a single map with a graticule there-on, asimple methodology to enlarge or reduce the map is to draw the graticule to the new scale required and from the original copy transfer the map points that cross the graticules and infill as necessary. Thus a new map can be drawn with only a pair of compasses for each scale to transfer the distances. This is a very quick and efficient methodology as the use of a pantograph requires two large tables side by side.
Is this the meaning of the information supplied by Ramon J Pujades i Bataller where a post-mortem inventory, that of Vicenc Pruners’s son, Joan, ‘artifex cartarum navigandi sive menestral de cartes de navegar’, who was said to have inherited ‘ half the patterns for making portolano charts’ from his father; and that the other half went to the sister. “These two documents show clearly, in my opinion, the importance of patterns in the manufacturing process of portolano
15
charts, being carefully divided among the chart maker’s heirs”.Tony Campbell continues;”that no patterns appear to have survived from
the medieval period, unless any of the binding fragments can be identified as such, is hardly surprising. We cannot therefore know exactly what they would have looked like or precisely how they would have been used. We should also be hesitant about assuming that copying procedures described by later writers were necessarily in use on the early charts”.
He continued later with, “the fundamental problem remains that, even ifsome charts appear (or can be proved) to be direct copies, the majority do not seem to be clones, the product of mass production. It is fair to say that we still await a definitive answer to all the questions surrounding portolano chart copying, one that could be replicated in a real test. I do not think this has ever been attempted”.
Tony Campbell lists [see below] what he considers the outstanding questions regarding the copying method, stating that many could best be answered by practical experimentation, or by high resolution Portolan scans if those could be compared, side-by-side on a computer screen via enlarged downloaded details; this of course cannot happen as the pairs do not exist. I have set down the questions as per the original web text, and answeredeach in turn.
1) How was the information conveyed from one table-sized chart to another?Answer; draw the graticule on each to the same scale and use a template.
2) Was a special desk needed? Might there have been customized tables with slots in so that the relevant portion of the model could be brought to the copyist, particularly when entering the names? Or for charts, which would always be rolled inwards, might this have allowed work to continue on a succession of vertical bands? The techniques used for copying books would hardly have been adequate and the 1318 Vesconte illustration (HOC plate 31) probably shows an atlas sheet. Alternatively, would the vellum have had to be tightly stretched so as to present a perfectly flat surface, e.g. for drawing the rhumb lines?Answer; yes, the vellum must be stretched to the drafting board
16
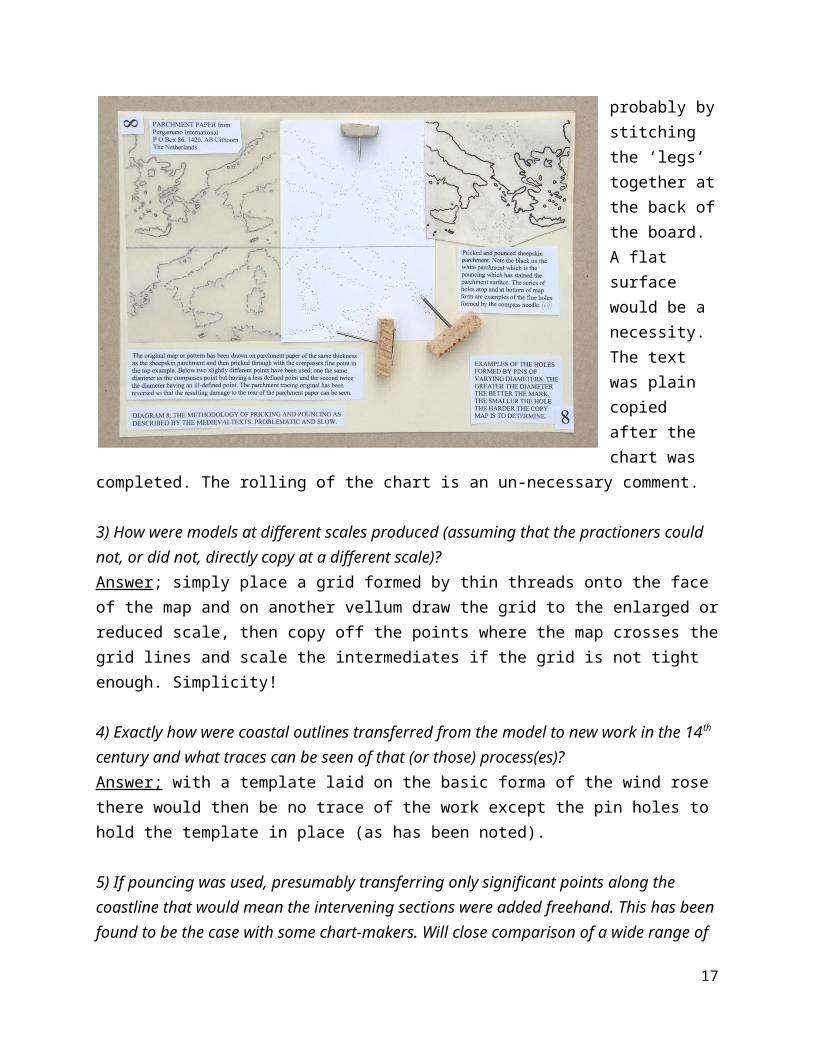
probably bystitching the ‘legs’ together atthe back ofthe board. A flat surface would be a necessity. The text was plain copied after the chart was
completed. The rolling of the chart is an un-necessary comment.
3) How were models at different scales produced (assuming that the practioners could not, or did not, directly copy at a different scale)?Answer; simply place a grid formed by thin threads onto the face of the map and on another vellum draw the grid to the enlarged orreduced scale, then copy off the points where the map crosses thegrid lines and scale the intermediates if the grid is not tight enough. Simplicity!
4) Exactly how were coastal outlines transferred from the model to new work in the 14th century and what traces can be seen of that (or those) process(es)?Answer; with a template laid on the basic forma of the wind rose there would then be no trace of the work except the pin holes to hold the template in place (as has been noted).
5) If pouncing was used, presumably transferring only significant points along the coastline that would mean the intervening sections were added freehand. This has beenfound to be the case with some chart-makers. Will close comparison of a wide range of
17
charts confirm that that was the general rules, at least before the 16th century?Answer; if a template was used then pouncing could be a method oftransferring the coastline to the vellum. It would be far more practical to draw around the cut out profile of the template witha charcoal stick and then over-draw with ink. Thus if the coastline is a Sepia ink, which is not dark enough to cover the black pounce spots, it would not notice. Thus the littoral could be simple or enhanced. Diagram ChPo/1/D08 is a photograph of the pricking and pouncing of part of a map. This small section took 280 holes as the photo indicates, and they were nearly impossibleto follow when it was necessary to draw the coastline from them.
6) What did or did not form part of a coastline model, e.g. which of the islands were traced and which drawn freehand? And was that distinction the same for all chart-makers?Answer; in all probability the smaller islands were just transferred in position by dots through the template, which is sovery easy to do. It is the scale of the map which will determine this.
7) If it proved possible to identify the unique characteristics or signature of a single pattern (perhaps indirectly via cartometric comparison of the placement of a charts nodal points, usually headlands) could successive patterns used by one chart-maker be identified?Answer; undoubtedly as the templates would all be slightly different and thus identifiable. But, cartometric analysis would not help in this investigation; the charts are not that accurate.
8) The 15th-century Benedetto Cotrugli described placing a ruler across a chart, betweenthree specified pairs of places. If no islands intervened the chart was ‘right’; otherwise it was wrong (Falchetta, 2008, p271). Might this be a way to distinguish different patterns,or even different ‘schools’?Answer; doubtful as the test is surely just to indicate that the copyist has not misplaced the island, which with so many lines
18
could be a hazard. It indicates singular copying for islands and is probably an ingenuous methodology as the lines are false to the winds mentioned. Also he qualifies the idea by saying it may not work all of the time. This is 300 years too late.
9) Could cartometric analysis, focusing perhaps on enlarged sections, resolve the pointsabove?Answer; until cartometric analysis can counter the basic errors and distortions on maps made by the cartographers in drafting, surely we have no method to establish exactness. This is a false idea as it promotes the graph model of co-ordinates which produces curved lines, which never appear on a Portolan, and there are insufficient co-ordinates on a Portolan for an accuratecopy.
10) Is it possible to confirm the existence of separate, probably sectioned, toponymic models?Answer; see 7 above
11) If two or more people were working on a chart (sharing the writing, or dividing writing and painting) could they have worked simultaneously (to speed production) and, if so, how did they physically manage (see (2) above)?Answer; it is likely that the system of production is one of the base vellum being lined out by one person, a second tracing the template, a third the scribe, and then the final lines and decoration. This could be two or more people, but surely the question can only be answered if we can establish how large an atelier was, was it family only, several people, or did it employmany artisans and how long were they employed? If it was a monastery, the answer is, as many as you desire! However, the template solution does provide for two systems working at the same time and thus the speed of production is amplified and surely atelier friendly.
19
12) Is it possible to distinguish between the work of someone who had served a chart-making apprenticeship and somebody who was just given a chart to copy, can those differences be codified?Answer; yes, but only briefly, as, if you are a good copyist, (think of all of the engravers who have never drawn a chart as a qualified apprentice, and produce the most excellent items) then the final product, which is generally well adorned, would be hardto spot as master or copyist.
The referee commented as follows; “For this elaborate series of answers to Campbell’s on-line questions to be convincing the author’s practical experiment would need to be carefully demonstrated, via working photographs. It also needs to establish that all the techniques that are described as straightforward really are, and that they make sense in a commercial environment, i.e. time was money for a professional chartmaker”.
How better to respond than to do just that, as the original text and drawings illustrated.
THE BASIC CHART OR MAP AND A PATTERN Diagram ChPo/1/D09/D10
The cartographer had before him vellum which was to be the basis of the Portolan. If we consider the size of the vellum available from each animal, Calf, Goat, Sheep, it has a natural size. Thus the scale of the Portolan is not primarily determined by the mathematics but from what will fit to the standard pelt. Therefore, with many Portolan’s’ having the same size pelt, the scales are nearly identical. The basic facts are re-iterated.
Was there a pattern; a basic map of Europe [diagram ChPo/1/D09 /D10] which could be set on the wind rose to the magnetic angle desired by using the graticule, and then the profile simply drawn around as one would use a template? Cut out from strong vellum either in a positive or negative forma, it could be drawn onto the wind rose. Thus there would be no trace of its construction, the lines required to draw an accurate map.
20
Did each atelier have its own template or set of templates for differing scales? If so then the drafting of copy maps would havebeen very easy, and even the few pin holes observed may have beenan additional aid prior to all of the wind rose lines being drawn, but are more likely to be the result of fixing the template onto the charts surface to allow the profile to be traced.
Is this the meaning of the information supplied by Ramon J Pujades i Bataller where a post-mortem inventory, that of Vicenc Pruners’s son, Joan, ‘artifex cartarum navigandi sive menestral de cartes de navegar’, who was said to have inherited ‘ half the patterns for making portolano charts’ from his father; and that the other halfwent to the sister.
THE SIMPLE METHODOLOGY UTILIZED TO PRODUCE A PORTOLAN CHART
Regardless of the final appearance of a Portolan, one definitive map is required to enable it to be drawn, that of the littoral of the area to be portrayed. The coastline of the intended area to be charted with its cities, towns, ports and other places to be named there-on must be available and complete.The wind rose lines are in fact subordinate to the littoral.Diagram ChPo/1/D11 .
21
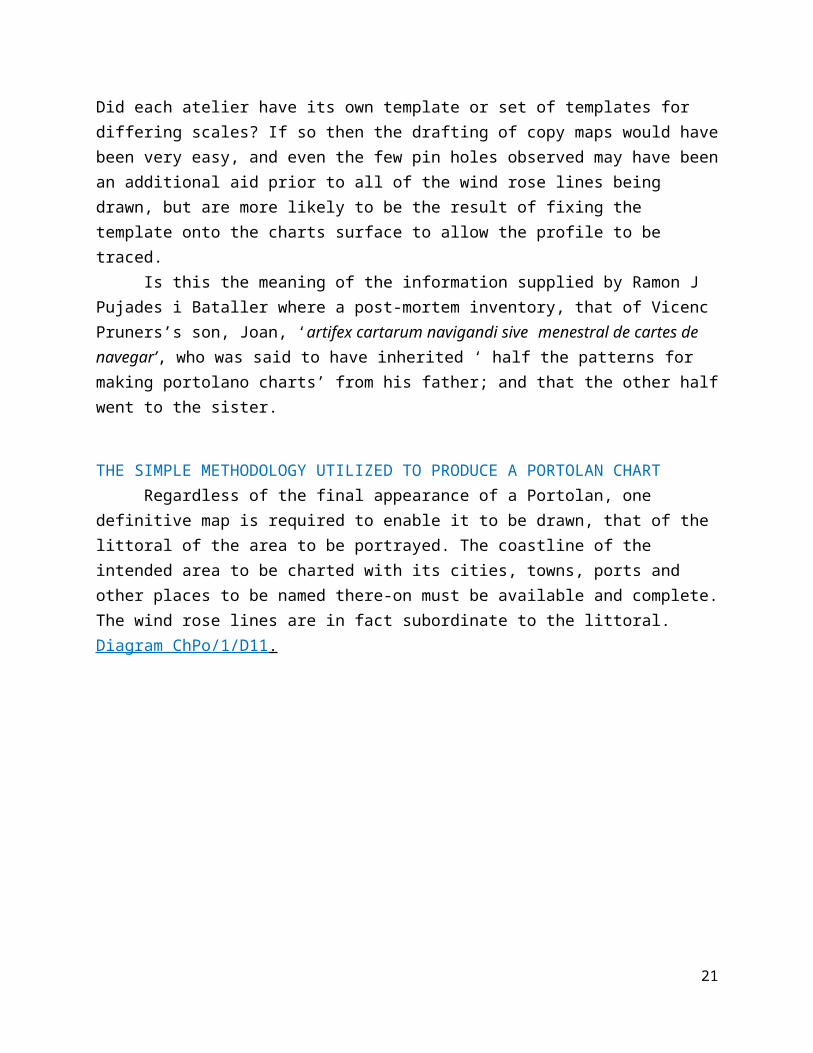
Illustrated is the basic map required to draw the Jorge de AguiarPortolan [diagram ChPo/1/D07]. It is drawn as a flat earth map, with the addition of the longitudinal and latitudinal lines. These are in a simple ratio of 6 to 5 units or 5 to 4 units and represent the 600 and 500 stadia measures of the world. This was confirmed through analysis. The defining accuracy of the map is shown by the longitudes, W0E to 36E which locate the Pillars, Sardinia, Sicily and Britannia correctly and the latitudes set out from 36N which are equally correct. Why would such an accurate map be drawn askew to north as the plot indicates?
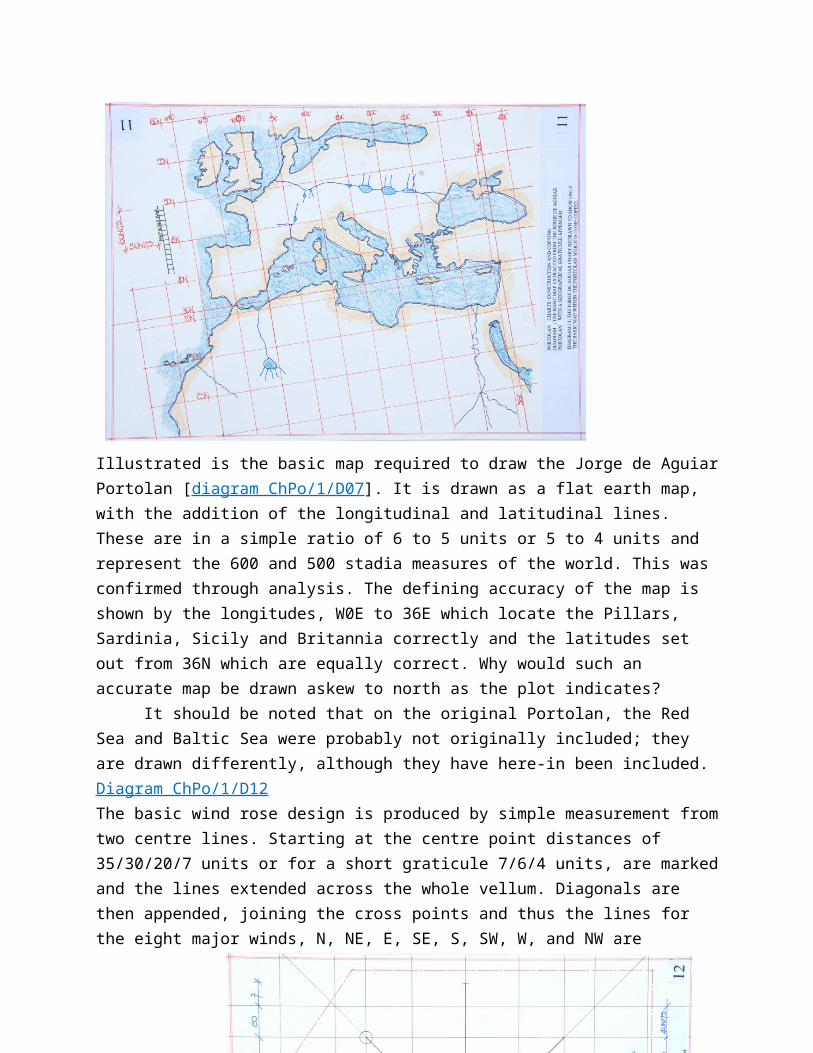
It should be noted that on the original Portolan, the Red Sea and Baltic Sea were probably not originally included; they are drawn differently, although they have here-in been included.Diagram ChPo/1/D12The basic wind rose design is produced by simple measurement fromtwo centre lines. Starting at the centre point distances of 35/30/20/7 units or for a short graticule 7/6/4 units, are markedand the lines extended across the whole vellum. Diagonals are then appended, joining the cross points and thus the lines for the eight major winds, N, NE, E, SE, S, SW, W, and NW are
22
indicated.
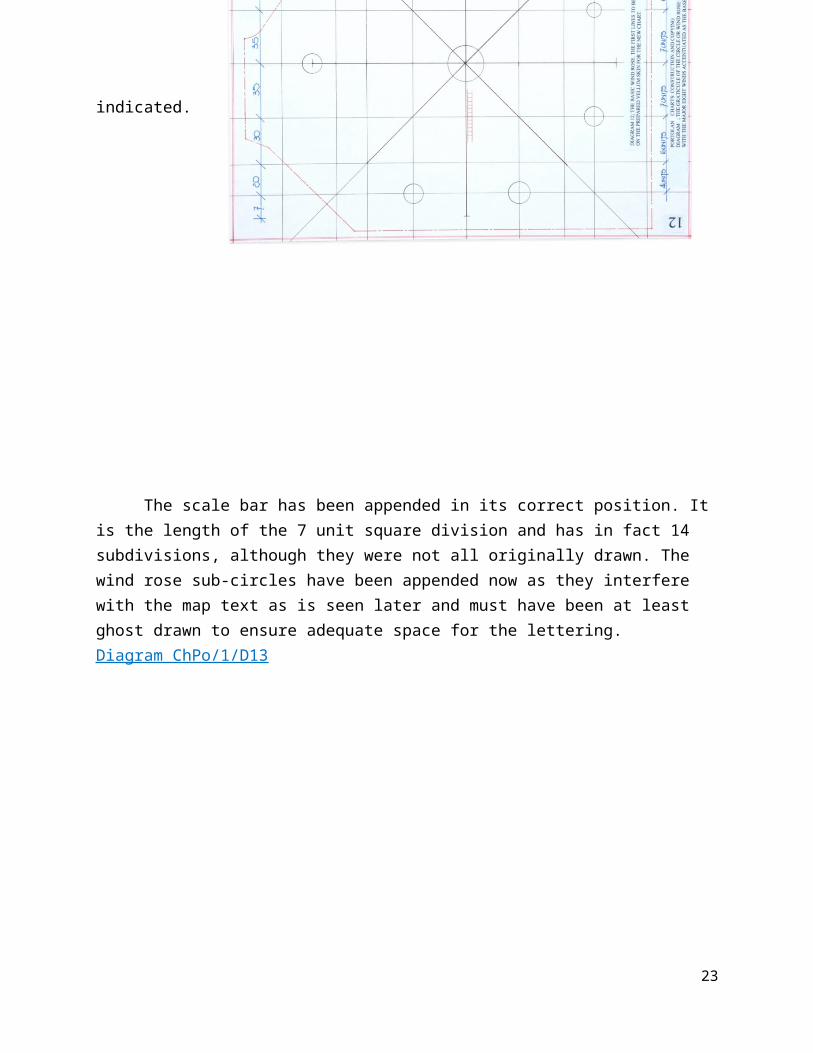
The scale bar has been appended in its correct position. It is the length of the 7 unit square division and has in fact 14 subdivisions, although they were not all originally drawn. The wind rose sub-circles have been appended now as they interfere with the map text as is seen later and must have been at least ghost drawn to ensure adequate space for the lettering.Diagram ChPo/1/D13
23
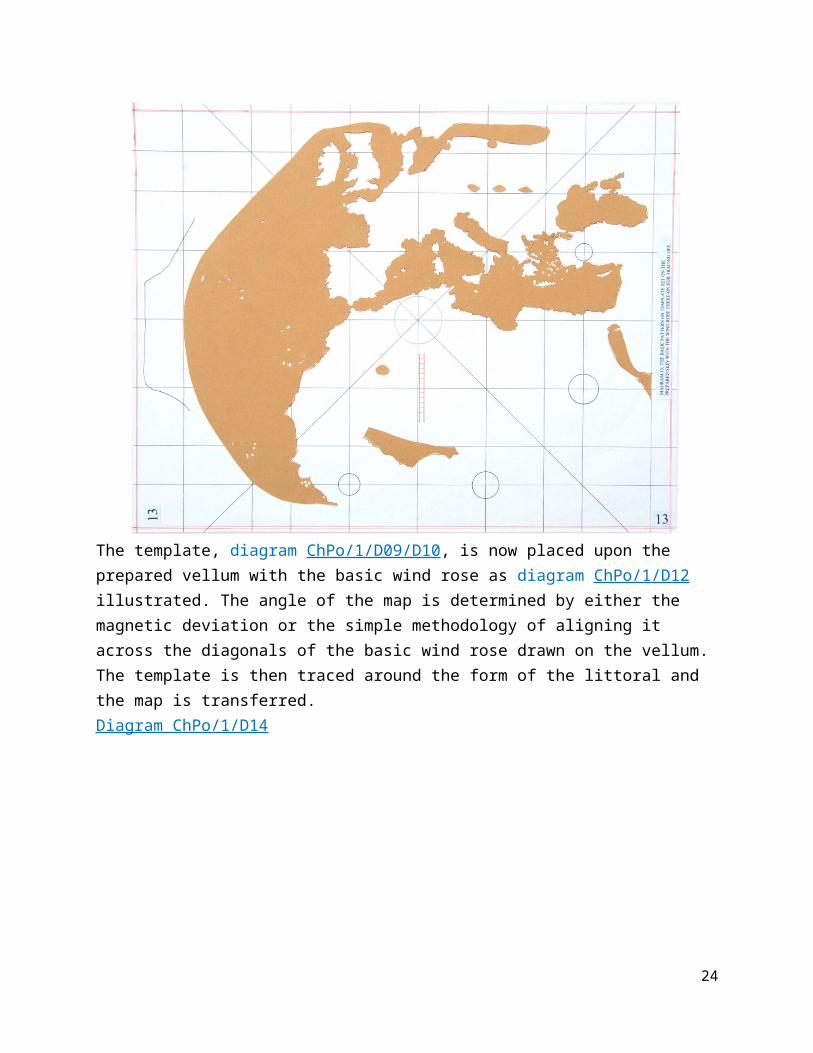
The template, diagram ChPo/1/D09/D10, is now placed upon the prepared vellum with the basic wind rose as diagram ChPo/1/D12 illustrated. The angle of the map is determined by either the magnetic deviation or the simple methodology of aligning it across the diagonals of the basic wind rose drawn on the vellum. The template is then traced around the form of the littoral and the map is transferred.Diagram ChPo/1/D14
24
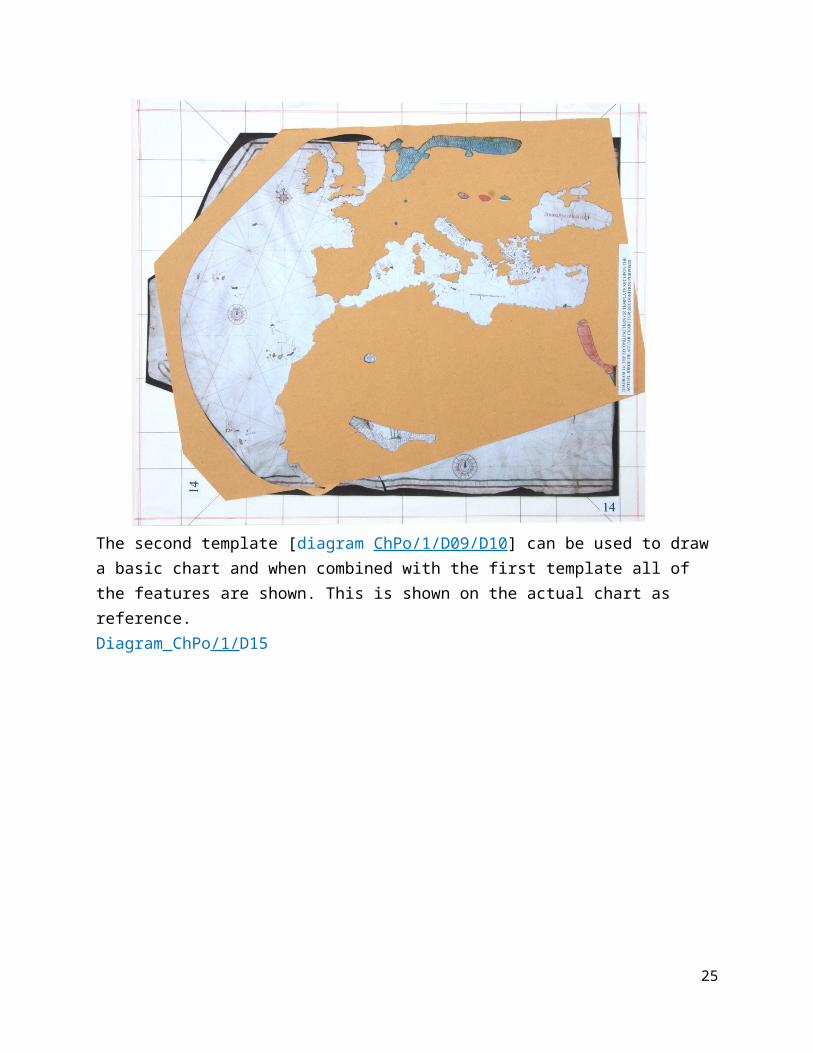
The second template [diagram ChPo/1/D09/D10] can be used to draw a basic chart and when combined with the first template all of the features are shown. This is shown on the actual chart as reference.Diagram ChPo/1/D15
25
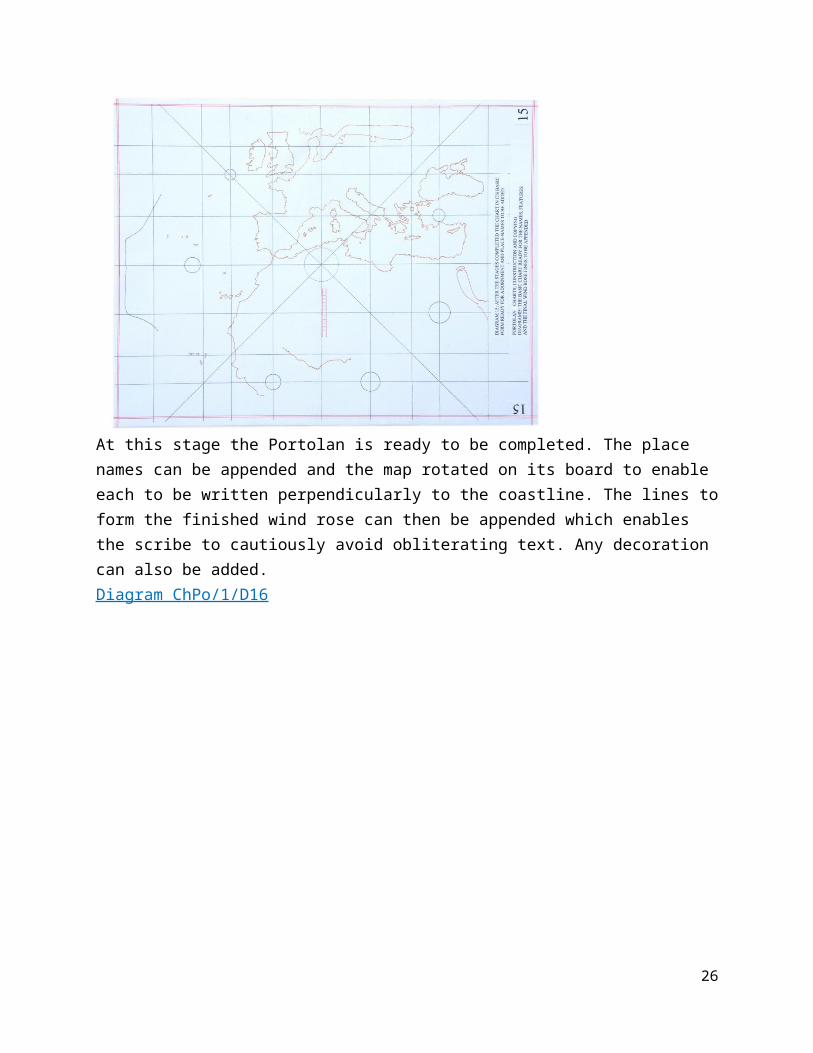
At this stage the Portolan is ready to be completed. The place names can be appended and the map rotated on its board to enable each to be written perpendicularly to the coastline. The lines toform the finished wind rose can then be appended which enables the scribe to cautiously avoid obliterating text. Any decoration can also be added.Diagram ChPo/1/D16
26
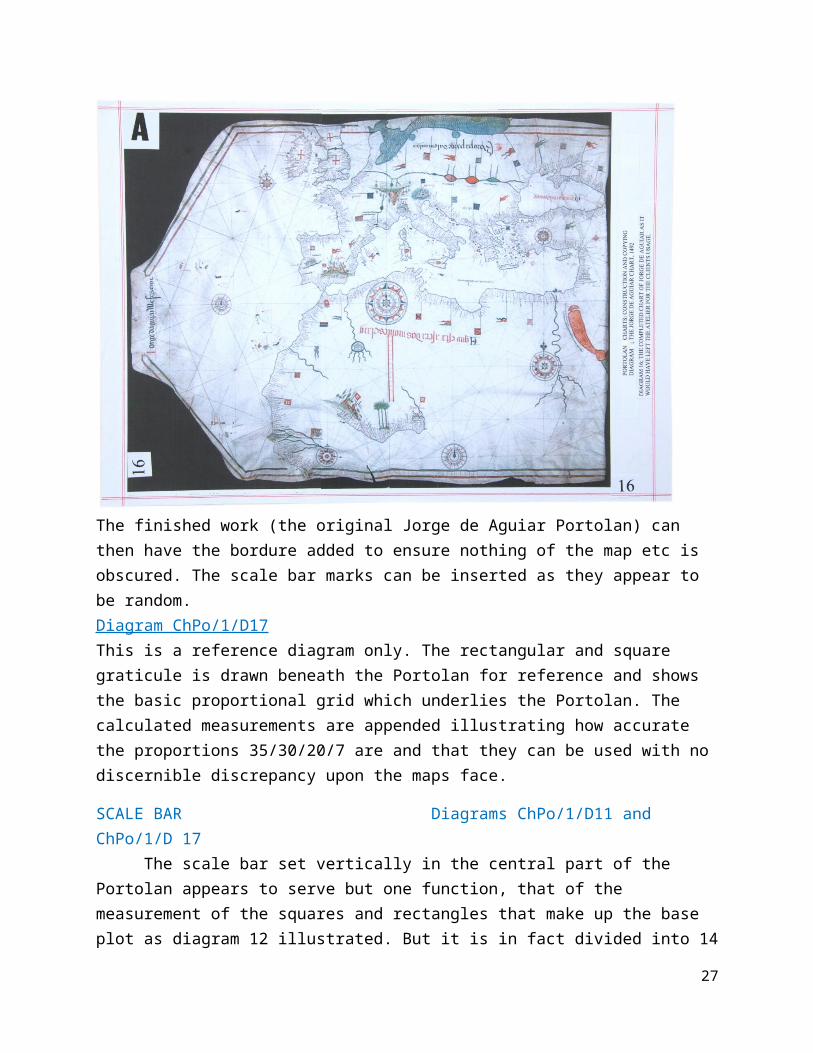
The finished work (the original Jorge de Aguiar Portolan) can then have the bordure added to ensure nothing of the map etc is obscured. The scale bar marks can be inserted as they appear to be random.Diagram ChPo/1/D17This is a reference diagram only. The rectangular and square graticule is drawn beneath the Portolan for reference and shows the basic proportional grid which underlies the Portolan. The calculated measurements are appended illustrating how accurate the proportions 35/30/20/7 are and that they can be used with no discernible discrepancy upon the maps face.
SCALE BAR Diagrams ChPo/1/D11 and ChPo/1/D 17
The scale bar set vertically in the central part of the Portolan appears to serve but one function, that of the measurement of the squares and rectangles that make up the base plot as diagram 12 illustrated. But it is in fact divided into 14
27
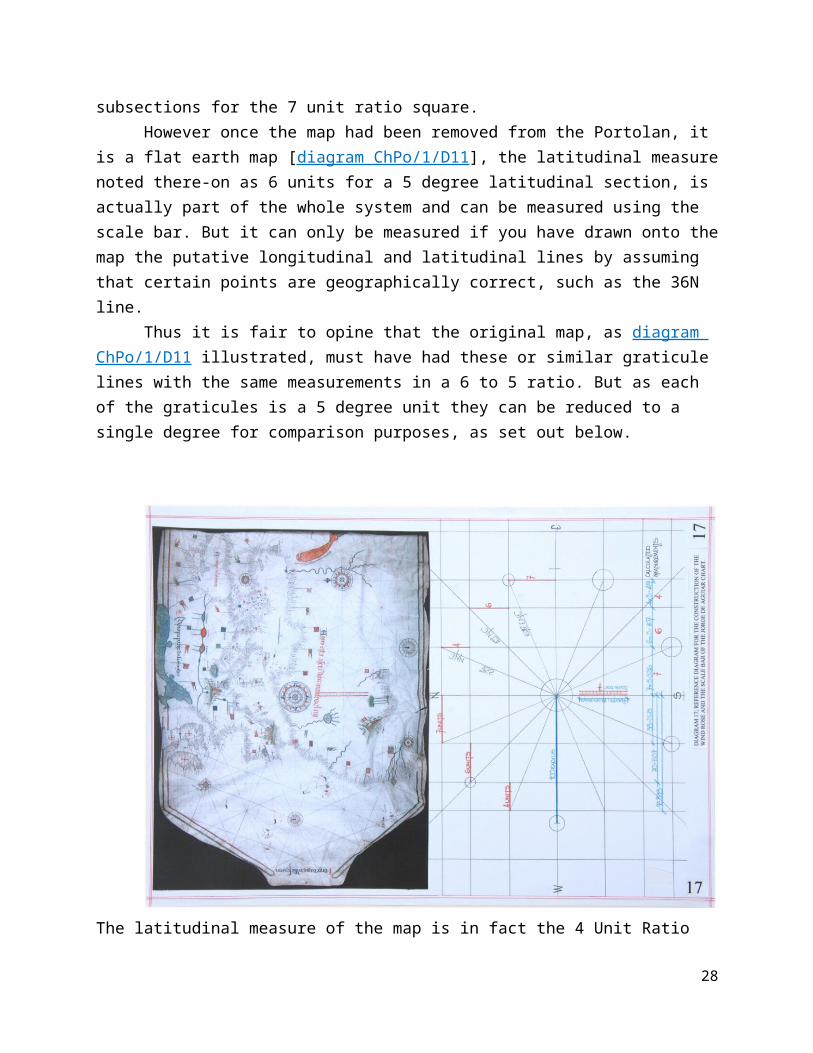
subsections for the 7 unit ratio square.However once the map had been removed from the Portolan, it
is a flat earth map [diagram ChPo/1/D11], the latitudinal measurenoted there-on as 6 units for a 5 degree latitudinal section, is actually part of the whole system and can be measured using the scale bar. But it can only be measured if you have drawn onto themap the putative longitudinal and latitudinal lines by assuming that certain points are geographically correct, such as the 36N line.
Thus it is fair to opine that the original map, as diagram ChPo/1/D11 illustrated, must have had these or similar graticule lines with the same measurements in a 6 to 5 ratio. But as each of the graticules is a 5 degree unit they can be reduced to a single degree for comparison purposes, as set out below.
The latitudinal measure of the map is in fact the 4 Unit Ratio
28
Square of the basic graticule plot on diagram ChPo/1/D17. It has in fact 8 subdivisions of the scale bar for the 5 degree division.
Thus we can state the measurements of the graticule on diagram ChPo/1/D17 are as follows, reduced to a single degree ;4 parts or 8 sections = 1 degree of latitude or 600 stadia (actually 5 degrees or 3000 stadia)6 parts or 12 sections = 1.5 degrees of latitude or 900 stadia (actually 7.5 degrees/4500 stadia)7 parts or 14 sections = 1.75 degrees of latitude or 1050 stadia (actually 8.75degrees/1250 stadia)
Thus 1 part or 2 sections equals 150 stadia, with 1 section of 75 stadia.The length of the Mediterranean Sea is from the Pillars to Issus,5.5W to 36E or 41.5 degrees of 5/6ths parts, that is 500 stadia per part and hence the length is 41.50 x 500 or 20750 stadia.
Geographically the Mediterranean Sea is 41.50 x 488.65 stadia or 20279 stadia.
The original map is therefore of considerable accuracy, compiled no doubt from the Mediterranean Sea being sailed and measured for around a 1000 years.
CONFUSION; HOW MANY SIMPLE PORTOLAN’S WERE THERE?On a Portolan, as has already been shown, the magnetic
variation can be a product of the background graticules, in that the map drawn using the 7 ratio unit and a multiple of the units to give the angle required. It can vary from 4 to 11 degrees. Butwhen a Portolan has both the wind rose, which is actually a NSEW configuration, and a map which is oriented to a magnetic north, which is a variable feast in the Mediterranean Sea area, there isnot only a conflict of direction, but also a conflict of application. Add to this the flowery designs on most examples andin all probability these Portolan’s were drawn to adorn the monastery walls from which they probably started to the wealthy merchants or great families.
29
The referee commented that, “not even ‘most’ surviving examples, and Pujades and Campbell are in agreement that what has survived is overwhelmingly biased in favour of the elaborate over the everyday, possibly at least several hundred lost plain charts to each one that survives, e.g. the contract to Vallseca (see Pujades) to provide 24 ‘good and sufficient navigational charts’ in 6 months.
Firstly the referee should explain his quotes. Pujades actually states on page 498 of ‘Les Cartes Portolanes’, “ The first and most important in terms of what interests us here is that cartographer Gabriel Vallseca’s atelier, active on Majorca for a period of at least 34 years (between 1433 and 1467), from which only three signed charts and a few anonymous ones (all decorated) attributable to the establishment have survived, had the capacity to produce over 24 navigational charts in six months”.
This is of course also a mis-statement from the original Medieval Latin text that is reproduced on pages 497 and 498 of “Les Cartes Portolanes”.
The text that the referee and Pujades quote comes from the protocols on page 497 which acknowledge debt owed by Vallseca andstates (in translation),
“Wherefore, giving up the exception of a said quantity of money not owed by me to you from the aforesaid case and the exception of fraud, I promise and agree in good faith to pay you the aforementioned (weighed-out?) 70 pounds of the said money in the following manner under contract, namely that I am bound and promise to give and deliver to you 28 navigation charts good and sufficient, 4 charts immediately and the remaining 24 charts to make up the said 28 charts in the next 6 months hence, Now these charts you can sell for that price or prices that you realise can be made and from this price held by you from the said charts you can keep back with you the said 70 pounds.”
Thus we read that Gabriel Vallseca was only indicating that he would fulfil his obligation and provide actually the remaining 24out of 28 charts in “6 months hence”.The difference between the Medieval Latin and the book text indicates a lack of proper attention to the reality of the original text. The book text continues as follows; “If we multiply this figure of 68 (34 years each divided intotwo halves), we learn that if the atelier’s pace of production had remained constant
30
throughout that time, 1,500 works of Portolan cartography would have issued through its doors.”
Thus we have the nonsensical guess of several hundred plain charts to one elaborate chart surviving compounded by the nonsensical suggestion that it is satisfactory to just multiply all of the possible figures obtained and decide this could mean 1,500 charts from one atelier.
If you are bankrupt and require a way out, then yes, everybody will work as hard as is necessary to fulfil an obligation. But, to be able to keep it up for 34 years is a very silly suggestion as is the interpretation that it would all be carried out by the one atelier.
Even if as the referee comments, “given that the ornate ones wouldn’thave been taken to sea, why would anyone have preserved a chart sufficiently damagedby water to be unusable: how many old copies of a road atlas?”
Again this must be considered a ridiculous comment that not one of 1500 would last!
But if we look at the whole tenor of the Protocol to understand how the document works there is another strand to consider. It is clear that any shortfall in the price of the mapssold still has to be made up by Vallseca to the full 70 pounds, while any surplus is to be returned to him. That makes sense, butthe clause that prevents him from selling maps or charts to anyone else before fulfilling the 28 charts, ‘except if done to supply his basic needs and those of his family’, is intriguing. We must wonder how flexibly such a clause was interpreted and howmany maps might be needed to generate basic subsistence. It is a pity that there is no further documentation to see if or when he actually cleared the debt. And, what is the chance that, rather than drawing new maps, he tried to acquire existing maps from others to make up the number needed, or to pass off inferior work. There is also the problem of what is a chart? The extant charts by Vallseca are one large and two small charts. We do not
31
know what charts were being discussed, are they the large or small, and if the small charts then Vallseca could easily have drawn those required as well as enough to feed his family. But, the idea of 1500 charts is nonsensical as the production line would have been continuous without allowing for materials or problems.
Thus I completely reject the text and calculations in “Les Cartes Portolanes”.
Yet another assumption without foundation; that, all of the so-called mariner’s sea charts were damaged and thus none survived. If there were so many thousands possibly produced, and there are 47 ateliers noted on page 486/487 by Pujades, the likelihood must be in favour of many more surviving if there werethat many in the first instance. I therefore reject the possibility of there being thousands of charts and consider the idea evolved from mis-information.
But, the utilization of a Portolan as a chart at sea isa fact of life, although it is thought not by many mariners, and it must have been fraught with difficulty. J H Parry in his text,‘The Age of Reconnaissance’, ‘chapter 6, Charts and Maps’, statesthe following;“All charts were drawn to bring the lines indicating magnetic north into the vertical: these lines being parallel in all the compass roses on each chart. The errors arising from this in the Mediterranean area were unimportant, because the range of latitude was small and the convergence of the meridians within the range was relatively slight. The direction lines which radiated across the charts from all the principle points of reference therefore approximated fairly closely to loxodromes or rhumb lines, lines of constant bearing. The slight divergence, over relatively short distances involved, mattered little. The navigator could, with reasonable confidence, read off his course from a ruler laid across the chart, and could steer that course by his compass knowing it would bring him within a few miles of his destination.
Most of the surviving medieval charts are highly decorated examples which probably were never used at sea, but graced the offices of shipping firms or libraries of great men. , no doubt, is why they have survived. They differ from working charts,
32
however, only in their wealth of decorative detail.”But of course we do not know what the ‘working chart’
actually looked like. It is assumed they would not require a wealth of detail and were in fact so very simple in order to reduce costs. The Carta Pisana may be considered an example of a simple chart.
The following is a direct copy of the paper by Piero Falchetta;“The use of Portolan charts in European navigation- that is, within the Mediterranean and along the coasts of northern Europe- has been disputed for a long time on the grounds of relatively little written evidence. The matter was brilliantly summarized and discussed by Tony Campbell (1987) in his well-known study on portolan charts, but his conclusions are far from definitive. Even though there remain few doubts on the presence of nautical charts on board medieval ships, their function and usefulness in calculating routes is unclear. Ten years later(1997), Patrick Gautier Dalche analysed several medieval texts where mention of the portolan charts and their use on board canbe traced. His conclusions tend to rule out an exclusive relationship between navigation,calculation of routes, compass and other instruments on one side, and charts on the other. His position is that the medieval chart is probably an “object” that “sert seulement pour aider a retrouver la route perdue ou pour confirmer la localisation effectuee par des moyens empiriques [---] En un mot, elle sert, parmi d’autres moyens, alocaliser, non a diriger la navigation” and, “La carte marine, dans la majorite des cas, ne procure aucun indice de la localisation precise d’un lieu”.
Such a conclusion seems to clash with the idea that it is generally considered being self-evident that Portolan charts wereinstruments that were absolutely essential for navigation. If they were on board ship and not actually used, the likelihood of much water damage can be discounted and thus if there were that many, many more should have survived.
CONCLUSIONSThe Portolan can be constructed with the simplest of
techniques; that of drawing a graticule for the projection of thewind rose alignments and then using a template to trace or pounce
33
the actual map onto the wind rose diagram. The angle chosen for the map setting down, be it magnetic or not, is then merely a matter of alignment across the graticule that has been drawn.
A simple production line could have been established to produce any number of the portolan’s of a given design, but as wehave no examples of similarity, this is probably an idea without foundation. Variation in size is only determined by the scale of the actual map section of the Portolan and this can be achieved quite simply by grid square transfer. But as the size of the vellum probably dictated the map size and therefore scale, as most animals of a breed tend to be very similar in size, why are we so surprised the scales are so similar?
Unfortunately with no reconciliation line for the two anglesthat of geographical north and magnetic north, the mariners were left to sail a course using more than a little guesswork. And when their chart had three magnetic variations within its design,a few headaches!
This is no doubt how they were drawn; but why, when a simpleline depicting the angle of the actual map could be drawn and resolve the problem, and not leave mariners to struggle with the two (or three) north points and thus up to three deviations in sailing. Why was it allowed to happen? Why did the mariners put up with it? Or were the charts not used because the problems werewell known and the mariners preferred to sail by rote?
But more importantly, why has it taken decades for somebody to attempt to answer the questions raised, and why are historiansunable to draw the charts to answer the questions, and why are the researchers using a computer programme which does not emulatethe Portolan draughtsmanship. Decades of discussion and the main research ignored by experts in the field!
NOTAThe diagrams which were reduced to A4 photographically were researched at full size and 45% scale to fit to an A2 sheet for drawing purposes. The template was drawn and then cut out to
34
simulate the vellum template (pattern) which would have been usedthroughout by the original cartographers. It has, as diagram ChPo/1/D09/D10 illustrates, the capability of being used twofold and thus could increase production significantly, if it were a requirement.
BIBLIOGRAPHYBillion, P, 2011, “Graphische Zeichen auf mittelalterlichen Portolan karten” (Marburg; Tectum Verlag, 2011.) P342.Campbell Tony, 1987. In, “The History of Cartography”, Volume 1,Cartography in Prehistoric, Ancient, and Medieval Europe and the Mediterranean, Edited by J B Harley and David Woodward. Chapter 19, Portolan Charts from the Late Thirteenth Century to 1500. Campbell Tony, http://www.maphistory.info/PortolanFutureResearch.html. Some areas for possible future research into early portolan charts. This is an online paper which updates the HOC chapter 19 and includes discussions and new research up to 2011.Gaspar, Joaquin Alves, 2008, “Dead Reckoning and magnetic declination; unveiling the mystery of portolan charts”. ePerimetron, Vol 3, No 4, 2008, (191-203).Gaspar, Joaquin Alves, 2007, “The Myth of the Square Chart”. ePerimetron, Vol 2 No 2, (66-79)Smith T R, “Rhumb-line Networks on Early Portolan Charts; Speculation regarding construction and function”. University of Kansas. Privately obtained typed copy from archives.Parry J H, 1964, “The Age of Reconnaisance”. Weidenfeld and Nicolson, London. Pp 100-113.Kelley J E jr,1995, “Perspectives on the origins and uses of the Portolan Charts”. Cartographica, vol 32(3), University of Toronto Press.Tobler W R, 1966, “Medieval Distortions: The Projections of Ancient maps”. Annals, Association of American Geographers, 56,2 June 1966 pp 351-360.Falchetta Piero. 2007. “The use of portolan charts in European navigation
35
during the Middle Ages”. Published in Germany, but a private copy hasbeen used here-in.Ferrar, Michael J. 2013. “Portolano Charts: Construction and Copying”. Website paperFerrar, Michael J. 2013. Leather; Vellum; Parchment. Drawing and Copying Maps and Charts.Ferrar, M J website is at http://www.cartographyunchained.com forall papers written.Ferro Gaetano, 1996. “The Genoese Cartographic Tradition and Christopher Columbus”. Instituto Poligafico E Zecca Dello Stato . Libreria Dello Stato, Roma.“Christopher Columbus and the Age of Exploration, An Encyclopedia”. edited by Silvio A Bedini. Simon and Schuster Inc. 1992 and Da Capo Press New York, 1998.Gautier Dalche, Patrick. 1996 and 2001. “Cartes marines, representation du littoral et perception de l’espace au Moyen Age”, in: Castrum 7: Actes du colloque international ‘Zones cotieres littorals dans le monde mediterraneen au Moyen Age’ Rome 2001, p27.Jenny, B. “MapAnalyst- A digital tool for the analysis of the planimetric accuracy of historical maps”. e-Perimetron, Vol 1, No3, 2006 [239-245]Lepore F, Piccardi M, Pranzini E, 2012. “The autumn of medieval portolan charts: Cartometric issues”. e-Perimetron, vol 7, No 1, 2012 [16-27]R Pujades i Bataller, 2007, “Les Cartes Portolanes” (Barcelona, Institut Cartographic de Catalunya) P416, The North of the Italian Peninsula. Page 471, The Production Process.Smith T R, Rhumb-line Networks on Early Portolan Charts; Speculation regarding construction and function. University of Kansas. Privately obtained typed original copy from archives.Antichi planisferi e portolani, Modena, Biblioteca Estense Universtaria. Il Bulino Y Press, 2004.NOTE.A draft copy of this paper was sent to a much respected journal with the express purpose of obtaining a referee’s comments. It was devoid of references and had temporary diagrams; such thatit would be automatically rejected, but actually read and commented upon. Those comments have been incorporated within the text. It should also be noted that I sent a complete set of
36

responses back to the journal and the referee, thus ensuring what is now written was known prior to upload.Lex ParsimoniaeOccam’s Razor is a principle of parsimony, economy or succinctness used in logic and problem solving. It states that among competing hypotheses, the hypothesis with the fewest assumptions should be selected. Plainly put, the simpler the explanation the better.Leonardo da Vinci stated,’ Simplicity is the ultimate sophistication’.
37