chowa adam - university of zimbabwe institutional repository
TRANSCRIPT
UNIVERSITY OF ZIMBABWE
Graduate School of Management
AN ASSESSMENT OF THE FINANCING STRATEGIES EMPLOYED BY SME
REAL ESTATE FIRMS UNDER THE LIQUIDITY CONSTRAINTS I N ZIMBABWE.
A DISSERTATION SUBMITTED IN PARTIAL FULFILMENT OF T HE
REQUIREMENTS OF THE MASTERS IN BUSINESS ADMINISTRAT ION (MBA)
DEGREE
ACADEMIC YEAR 2014
BY
ADAM CHOWA
GRADUATE SCHOOL OF MANAGEMENT
UNIVERSITY OF ZIMBABWE
P.O.BOX MP 167,
Mt. Pleasant, Harare.
Email: [email protected]
SUPERVISOR: DR. G. MUPONDA

i
DECLARATION
I, the undersigned Adam Chowa, do hereby declare that this dissertation is the result
of my own systematic process of collecting and analyzing the information resulting in
an increase of the understanding of financing strategies employed by small to
medium sized real estate firms under the liquidity constraints in Zimbabwe, except to
the extend in the acknowledgements, references and acknowledged sources in my
report, and that it has not been submitted in part or in full for any other degree to any
other University or College.
__________________ _______________
Signature Date
__________________ _______________
Dr. G. Muponda (Supervisor) Date

ii
ACKNOWLEDGEMENTS
I would like to thank all my friends and relatives who encouraged me to do the MBA
programme during my most difficult time of my life following the death of my beloved
wife Ropafadzo. The program really helped me to meet a lot of loving and caring
people who continued to inspire me to forget the past and look forward to new
things.
Special mention goes to my sister Angela and her husband Mr. S. Nyuke for the
encouragement and support. Am very grateful to my daughter Theresa Vimbanayi
who also inspired me to do my studies and who also endured most weekends and
holidays without me.
I would also want to thank my supervisor Dr. G. Muponda for his support, advice and
for being such a committed mentor.
Finally I thank all the Graduate School of Management of the University of
Zimbabwe lecturers who taught me various courses during my studies which
enabled me to finally write this dissertation.

iii
ABSTRACT
The study sought to assess or investigate the financing strategies employed by SME
real estate firms operating under the liquidity constraints in Zimbabwe and the effect
on their growth and success.
The phenomenal growth and contribution to the economy of SME real estate firms is
widely observed in all developing and emerging economies such as Brazil, Russia,
India, China, South Africa and even Zimbabwe. These firms have contributed
towards the creation of employment, value addition, foreign currency and
competition among others.
The study used both quantitative and qualitative methodologies with combined
survey and interview methods. Data was collected from a sample of 110 small and
medium sized firms in Harare out of a population of 227 firms trading in Zimbabwe.
The study arrived at the following conclusions: SME real estate firms lacked
financing strategies; they rely heavily on private equity and leasing finance; they
have little access to bank loans; venture finance and public equity. They also lack
skills, training, technology and markets. However the SMEs have great growth
potential and have the capacity to increase their contribution to GDP.
The study therefore recommended the following: greater use of financing strategies
in their operations; increased access to other sources of finance; skills; training and
markets; increase capacity building initiatives to enhance entrepreneurial leadership
skills; promote business development services; enhance operation effectiveness;
strengthening business associations and increase information sharing or
dissemination on available SME initiatives.
iv
TABLE OF CONTENTS
DECLARATION ........................................................................................................... i
ACKNOWLEDGEMENTS ........................................................................................... ii
ABSTRACT ................................................................................................................ iii
LIST OF TABLES ..................................................................................................... viii
LIST OF FIGURES ..................................................................................................... ix
LIST OF ABBREVIATIONS AND ACRONYMS .......................................................... x
CHAPTER ONE
Introduction to the Study
1.0 Introduction....................................................................................................... 1
1.1 Background to the study ................................................................................... 3
1.2 Macro environmental analysis .......................................................................... 5
1.2.1 Political Issues ........................................................................................... 5
1.2.2 Economic Issues ........................................................................................ 6
1.2.3 Social Issues .............................................................................................. 6
1.2.4 Technological Issues ................................................................................. 7
1.2.5 Ethical Issues ............................................................................................. 8
1.2.6 Legal Issues ............................................................................................... 8
1.3 Doing business in Zimbabwe............................................................................ 9
1.4 Competitive Environment ............................................................................... 11
1.4.1 Threat of substitute products ................................................................... 12
1.4.2 Threat of new entrants ............................................................................. 13
1.4.3 Industry Rivalry ........................................................................................ 13
1.4.4 Bargaining power of suppliers .................................................................. 14
1.4.5 Bargaining power of buyers ..................................................................... 14
1.5 Statement of the problem .............................................................................. 14
1.6 Research objectives ....................................................................................... 15
1.7 Research questions ........................................................................................ 15
1.8 Significance of the study................................................................................. 15
1.9 Scope of the study. ........................................................................................ 16
1.10 Chapter Summary .......................................................................................... 16
1.11 Structure of the study. .................................................................................... 16
v
CHAPTER TWO
Literature Review
2.0 Introduction..................................................................................................... 17
2.1 Definitions of Small to Medium Enterprises ................................................. 18
2.2 Definition of financing strategy .................................................................... 19
2.3 Definition of Business Life Stages ............................................................... 21
2.4 Definition of the liquidity constraints. ........................................................... 21
2.5 Uses of the financing ...................................................................................... 22
2.6 Sources of financing. ...................................................................................... 24
2.6.1 Equity finance (private and public) ........................................................... 25
2.6.2 Venture capital and business angel finance ............................................. 26
2.6.3 Debt financing .......................................................................................... 28
2.6.4 Retained Income ...................................................................................... 28
2.6.5 Leasing finance ........................................................................................ 29
2.7 Preferred capital structure .............................................................................. 30
2.8 Models to be reviewed in assessing financing strategies ............................... 31
2.8.1 The Pecking Order Theory ....................................................................... 32
2.8.2 The BCG Growth-Share Matrix ................................................................ 33
2.8.3 The Growth Life Cycle Model ................................................................... 37
2.8.4 Other strategies ....................................................................................... 38
2.9 Conclusions and recommendations ............................................................... 39
2.10 Chapter Summary .......................................................................................... 41
CHAPTER THREE Research Methodology
3.0 Introduction..................................................................................................... 42
3.1 Research Methodologies .................................................................................... 42
3.1.1 Quantitative Methodology ........................................................................ 42
3.1.2 Qualitative Methodology .......................................................................... 43
3.2 Research methods, instruments and tools. ........................................................ 44
3.3 Study Population ................................................................................................ 44
3.4 Sample Size and Sampling Procedure ........................................................... 45
3.5 Data Collection Tools ..................................................................................... 47
3.5.1 Questionnaire .......................................................................................... 47

vi
3.5.1.1 Components of the Questionnaire ..................................................... 47
3.5.2 Interviews ................................................................................................. 48
3.6 Validity of Data ............................................................................................... 49
3.7 Study Limitations ............................................................................................ 49
3.8 Data Analysis ................................................................................................. 49
3.9 Ethical Consideration ..................................................................................... 49
3.10 Chapter Conclusion .......................................................................................... 50
CHAPTER FOUR
Presentation of Findings
4.0 Introduction ........................................................................................................ 51
4.1 Response rate .................................................................................................... 51
4.2 Demographics Responses ................................................................................. 51
4.2.1 Position in the company ............................................................................... 52
4.2.2 Years in that Position ................................................................................... 52
4.2.3 Highest Educational Qualification ................................................................ 53
4.2.4 Total Numbers of Owners ............................................................................ 53
4.2.5 Company Size ............................................................................................. 53
4.2.6 Place of Occupation ..................................................................................... 53
4.2.7 Years of Operation ....................................................................................... 53
4.2.8 Company Registration Status ...................................................................... 54
4.2.9 Bank Account ............................................................................................... 54
4.2.10 Accounting System .................................................................................... 55
4.3 Financing Strategies .......................................................................................... 55
4.3.1 Start-up Finance of Business ....................................................................... 55
4.3.2 Source of your financing start-up of company.............................................. 56
4.3.3 Interest Charged .......................................................................................... 58
4.3.4 Duration of the Loan .................................................................................... 59
4.3.5 Provision of Collateral .................................................................................. 59
4.3.6 Awareness of Financing Facilities ................................................................ 60
4.3.7 Aware of the Zimbabwe Stock Exchange .................................................... 60
4.3.8 Plan to List on the ZSE ................................................................................ 61
4.4 Working Capital Financing ................................................................................. 62
4.4.1 Type of assistance received ........................................................................ 63
4.4.2 Usage of Loan ............................................................................................. 63
vii
4.5 Investment and Capital Expenditure Financing .................................................. 64
4.5.1 Ownership status ......................................................................................... 64
4.5.2 Loan Received ............................................................................................. 65
4.5.3 Use of the Loan Received ........................................................................... 66
4.6 Marketing Strategies .......................................................................................... 67
4.6.1 Marketing outside Harare ............................................................................ 67
4.6.2 Major competitors. ....................................................................................... 68
4.7 Performance Indicators ...................................................................................... 69
4.7.1 Performance of SMEs .................................................................................. 69
4.8 Business Challenges .......................................................................................... 70
4.9 Conclusion ......................................................................................................... 71
CHAPTER FIVE
Conclusions and Recommendations
5.0 Introduction ........................................................................................................ 72
5.1 Conclusions ........................................................................................................ 72
5.2 Recommendations ............................................................................................. 74
5.2.1 Proper financing and marketing strategies formulation ............................ 75
5.2.2 Acquisition of skills, technology, training and development ..................... 76
5.2.3 Improve information dissemination .......................................................... 77
5.2.4 Strengthening business associations ....................................................... 79
5.2.5 Promote business monitoring and development services. ....................... 79
5.2.6 Greater access to market and avoid competition. .................................... 79
5.3 Area of Further Study ......................................................................................... 80
References ............................................................................................................... 81
Appendix A: Introductory Letter ................................................................................ 91
Appendix B: Questionnaire....................................................................................... 92
viii
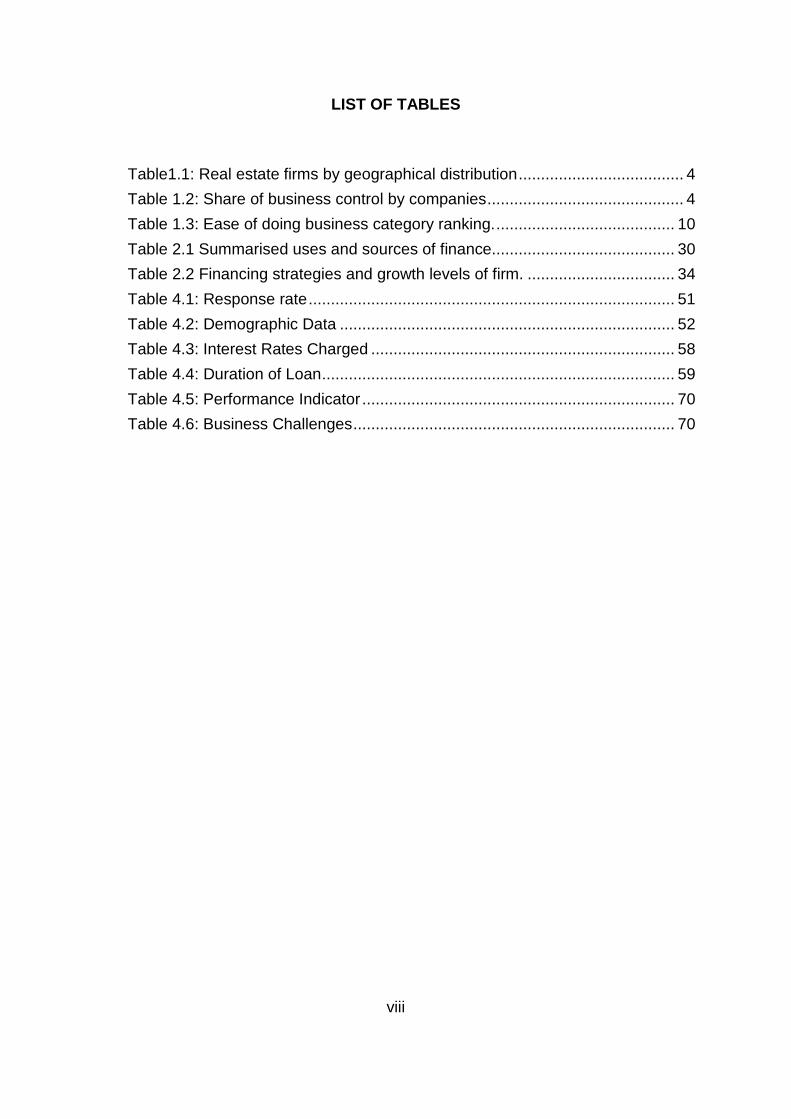
LIST OF TABLES
Table1.1: Real estate firms by geographical distribution ..................................... 4
Table 1.2: Share of business control by companies ............................................ 4
Table 1.3: Ease of doing business category ranking. ........................................ 10
Table 2.1 Summarised uses and sources of finance. ........................................ 30
Table 2.2 Financing strategies and growth levels of firm. ................................. 34
Table 4.1: Response rate .................................................................................. 51
Table 4.2: Demographic Data ........................................................................... 52
Table 4.3: Interest Rates Charged .................................................................... 58
Table 4.4: Duration of Loan ............................................................................... 59
Table 4.5: Performance Indicator ...................................................................... 70
Table 4.6: Business Challenges ........................................................................ 70
ix
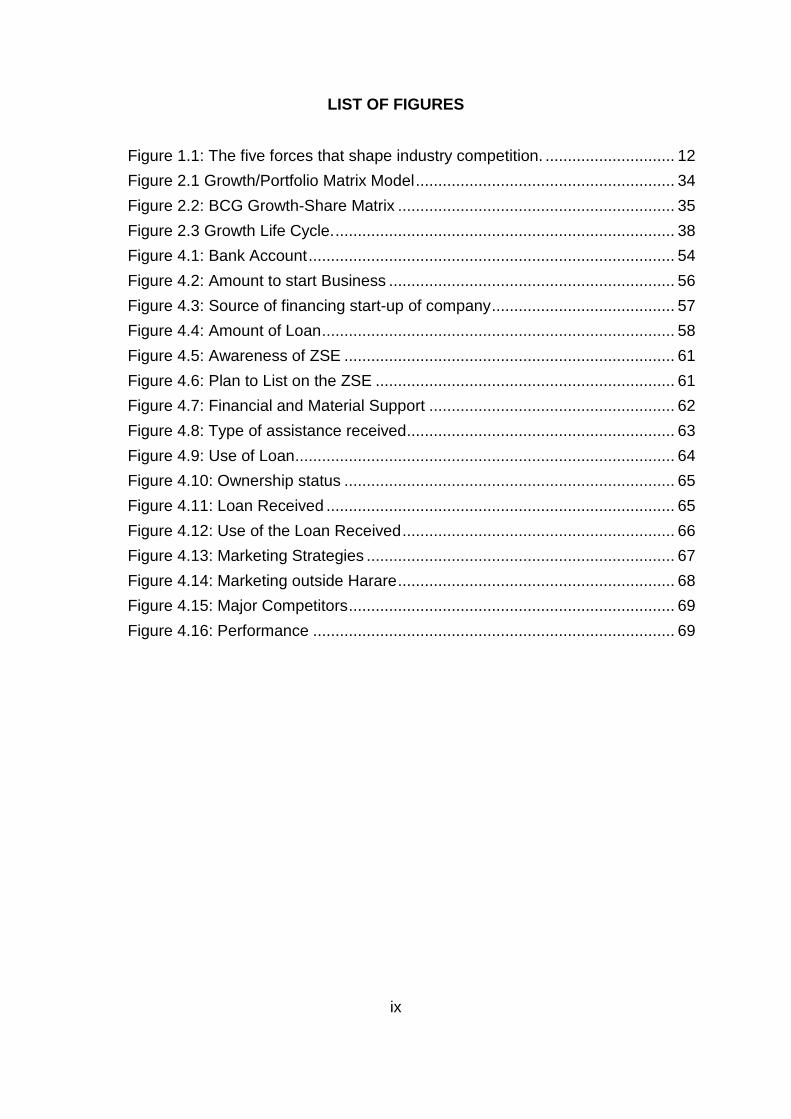
LIST OF FIGURES
Figure 1.1: The five forces that shape industry competition. ............................. 12
Figure 2.1 Growth/Portfolio Matrix Model .......................................................... 34
Figure 2.2: BCG Growth-Share Matrix .............................................................. 35
Figure 2.3 Growth Life Cycle. ............................................................................ 38
Figure 4.1: Bank Account .................................................................................. 54
Figure 4.2: Amount to start Business ................................................................ 56
Figure 4.3: Source of financing start-up of company ......................................... 57
Figure 4.4: Amount of Loan ............................................................................... 58
Figure 4.5: Awareness of ZSE .......................................................................... 61
Figure 4.6: Plan to List on the ZSE ................................................................... 61
Figure 4.7: Financial and Material Support ....................................................... 62
Figure 4.8: Type of assistance received ............................................................ 63
Figure 4.9: Use of Loan ..................................................................................... 64
Figure 4.10: Ownership status .......................................................................... 65
Figure 4.11: Loan Received .............................................................................. 65
Figure 4.12: Use of the Loan Received ............................................................. 66
Figure 4.13: Marketing Strategies ..................................................................... 67
Figure 4.14: Marketing outside Harare .............................................................. 68
Figure 4.15: Major Competitors ......................................................................... 69
Figure 4.16: Performance ................................................................................. 69

x
LIST OF ABBREVIATIONS AND ACRONYMS
AIDS Anti Immune Deficient Syndrome BCG Boston Consulting Group CIFOZ Construction Industry Federation Of Zimbabwe CSO Central Statistical Office EACZ Estate Agents Council of Zimbabwe FSS Forum for Social Studies GDP Gross Domestic Product GFC Global Financial Crisis GJBR Global Journal for Business Research HIV Human Immune Virus HRD Human Resources Department IAS International Accounting Standard ICT Information and Communication Technology IFC International Finance Corporation ILO International Labour organisation IRR Internal Rate of Return JIT Just In Time MNE Multi National Enterprise NGO Non Governmental Organisation NPV Net Present Value GLC Growth Life Cycle POT Pecking Order Theory RBZ Reserve Bank of Zimbabwe ROI Return On Investment SME Small to Medium Enterprise SPSS Statistical Package for Social Sciences TIMP Third Industrial Master Plan UNCTAD United Nations Conference on Trade and Development USA United States of America VC Venture capital WB World Bank ZETDCO Zimbabwe Electricity Transmission and Distribution company ZSE Zimbabwe Stock Exchange

1
Chapter One
Introduction to the study
1.0 Introduction
The real estate business primarily deals with the ownership and transfer of
physical or immovable properties. Other activities include: management;
valuation; auctioneering and development of the immovable properties.
Almost all the real estate agents in Zimbabwe provide some common real estate
services, which are designed to identify, anticipate and satisfy the needs of the
customers. Some of the essential real estate services provided by these real
estate agents are: property sales; property valuation; property management;
property auctioning; property development and property advisory services.
According to Ackerman et al (2002), Cooter and Ulen (2003) and Epstein (2007),
property sales include the selling of immovable property, advising clients on real
estate matters like property transfer and bond registration and property
inspections. Property valuation consists of the valuation of land, buildings, plant,
machinery and all other immovable properties, for the purposes of selling and
purchasing properties, mortgage and loans financing, accounting and taxation,
municipal rating, estate duty, leasing and insurance purposes. Property
management is concerned with the activities regarding management of clients’
residential, commercial, farming and industrial property, including negotiation of
leases, collection and disbursements of rentals and payment of levies, utility bills
and service bills. Property auctioneering is primarily concerned with the
auctioning of immovable and movable properties in Zimbabwe under various
conditions such as open markets sales or forced sales. Property development is
part of real estate which basically deals with the activities such as property
appraisals, evaluation and design of properties (subdivisions and consolidations),
policy analysis, urban planning analysis, research analysis and preparation of
development plans. This is mainly done by large property companies with
adequate capital to buy farms, survey the land, subdivide the land, service the
land and sells as serviced small plots or serviced stands. The above listed
2
activities are mainly regulated or governed by the Estate Agents Act (Chapter
27:17) and the Valuers’ Act (Chapter 27:18) in Zimbabwe.
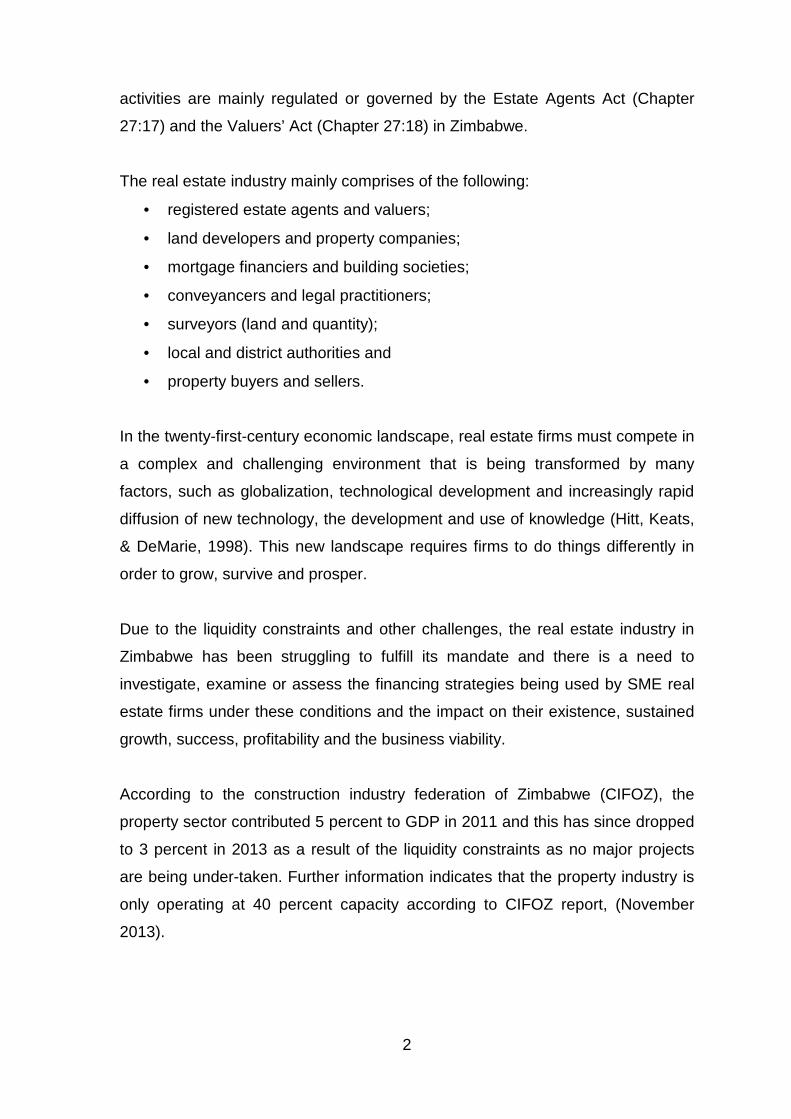
The real estate industry mainly comprises of the following:
• registered estate agents and valuers;
• land developers and property companies;
• mortgage financiers and building societies;
• conveyancers and legal practitioners;
• surveyors (land and quantity);
• local and district authorities and
• property buyers and sellers.
In the twenty-first-century economic landscape, real estate firms must compete in
a complex and challenging environment that is being transformed by many
factors, such as globalization, technological development and increasingly rapid
diffusion of new technology, the development and use of knowledge (Hitt, Keats,
& DeMarie, 1998). This new landscape requires firms to do things differently in
order to grow, survive and prosper.
Due to the liquidity constraints and other challenges, the real estate industry in
Zimbabwe has been struggling to fulfill its mandate and there is a need to
investigate, examine or assess the financing strategies being used by SME real
estate firms under these conditions and the impact on their existence, sustained
growth, success, profitability and the business viability.
According to the construction industry federation of Zimbabwe (CIFOZ), the
property sector contributed 5 percent to GDP in 2011 and this has since dropped
to 3 percent in 2013 as a result of the liquidity constraints as no major projects
are being under-taken. Further information indicates that the property industry is
only operating at 40 percent capacity according to CIFOZ report, (November
2013).

3
1.1 Background to the study
Globally, the real estate firms operate real estate businesses without any
constraints or challenges as firms are large and have full boards of directors to
supervise their strategy formulation and operations and have full support from the
banking institutions to promote mortgage financing. Firms have highly trained
and skilled personnel working as consultants and with limited competition and
are listed on the various stock exchanges, thereby having access to vast
amounts of capital, skills and exposure to strategies that can create competitive
and comparative advantages and enhance growth and survival of the
businesses. Businesses are also able to access cheap, flexible and long-term
finance and are exposed to international financial strategies that promote growth
and expansion into entire world. The global financial crisis (G.F.C) of 2007 to
2009 was partly caused by subprime loans given to undeserving home owners,
(www.canstar.com.au/home-loans/global-financial-crisis), and thus a clear
demonstration of support of the real estate industry.
In Zimbabwe, the real estate or property industry is mainly dominated by
companies that have links with the developed world companies and these
companies operate as subsidiary companies of multi-national enterprises
(MNEs). Some of the companies such as Old Mutual Zimbabwe Limited, Pearl
Properties Limited, Zimre Holdings Limited, Mashonaland Holdings Limited and
Dawn Properties are listed on the Zimbabwe Stock Exchange and they control
the majority of real estate business in Zimbabwe (estimated at 80 percent)
according to the Estate Agents Council of Zimbabwe (E.A.C.Z) 2013 report.
Small to medium sized companies that number around 230 companies (Estate
Agents Council of Zimbabwe list 2013) are then left with only 20 percent of the
market to compete for and share.
Table 1.1 below shows the geographical distribution of the real estate firms that
are operating in Zimbabwe. The table further shows that approximately 86
percent of the real estate businesses are based in Harare, while approximately 7
percent only are based in Bulawayo and the remaining 7 percent operating in

4
other cities or towns in Zimbabwe. This shows that most of the small to medium
sized real estate business is located in Harare.
Table 1.1: Real estate firms by geographical distri bution
Place of Operation Number of Companies
Harare 196
Bulawayo 15
Mutare 7
Gweru 3
Masvingo 2
Kadoma/Kwekwe 2
Ruwa/Rusape 2
Total 227
Source: Estate Agents Council of Zimbabwe List July 2013
Table 1.2 below shows share of business control by real estate firms that are
operating in Zimbabwe. The table further shows that approximately 80 percent of
the real estate business is controlled by major companies that are also based in
Harare, while approximately 20 percent only is controlled by small to medium
sized firms operating in various towns in Zimbabwe.
Table 1.2: Share of business control by companies
Name of Company % of Market Share
Old Mutual Properties P/L 35
Zimre Holdings P/L 15
Pearl Properties P/L 10
Mashonaland Holdings P/L 8
Dawn Properties P/L 7
Other companies 5
SME Firms (225) 20
Total 100
Source: Estate Agents Council of Zimbabwe List July 2013 (estimates).

5
Tables 1.1 and 1.2 above can be used to conclude that the majority of the real
estate business is based in Harare and further that the bulk of the business is
controlled by large property firms. It is for this reason that the study wishes to
assess the financing strategies employed by small real estate firms in Harare, as
they join and grow in the industry under the current liquidity constraints and other
challenges in Zimbabwe.
1.2 Macro environmental analysis
The macro environmental issues affecting the real estate industry in Zimbabwe
include: political; economic; social; technological; ethical and legal.
1.2.1 Political Issues
The political environment in Zimbabwe has resulted in a number of legislations
that have negatively impacted on real estate business. These laws have been
enacted to address the imbalances that existed in the economy. Some of these
laws include the Land Acquisition Act (Chapter 20:10) and the Indigenisation and
Economic Empowerment Act (Chapter 14:33).
The Land Acquisition Act (Chapter 20:10 p2), allows the government to acquire
land and other immovable property compulsorily in certain circumstances; to
make special provision for the compensation payable for land acquired for
various resettlement purposes, through a preliminary notice of compulsory
acquisition in the gazette. This provision has reduced property rights and any
business dealings in land or farms have to be approved by Government first and
“a fair compensation for improvements” will be paid by government.
The Indigenisation and Economic Empowerment Act (Chapter 14:33 p3) Section
3 empowers the government to ensure that, at least fifty-one percent of the
shares of every public company and any other business shall be owned by
indigenous Zimbabweans and further restricts mergers, restructurings,
acquisitions, unbundling or demergers approvals unless fifty-one percent is
owned by indigenous companies. This legislation has scared away investors
from Zimbabwe who would have established their businesses by acquiring real
estate properties to trade their businesses. These policies have not helped to
6
attract foreign investors with the much needed capital to boost operations and
improve the liquidity economic situation prevailing in Zimbabwe.
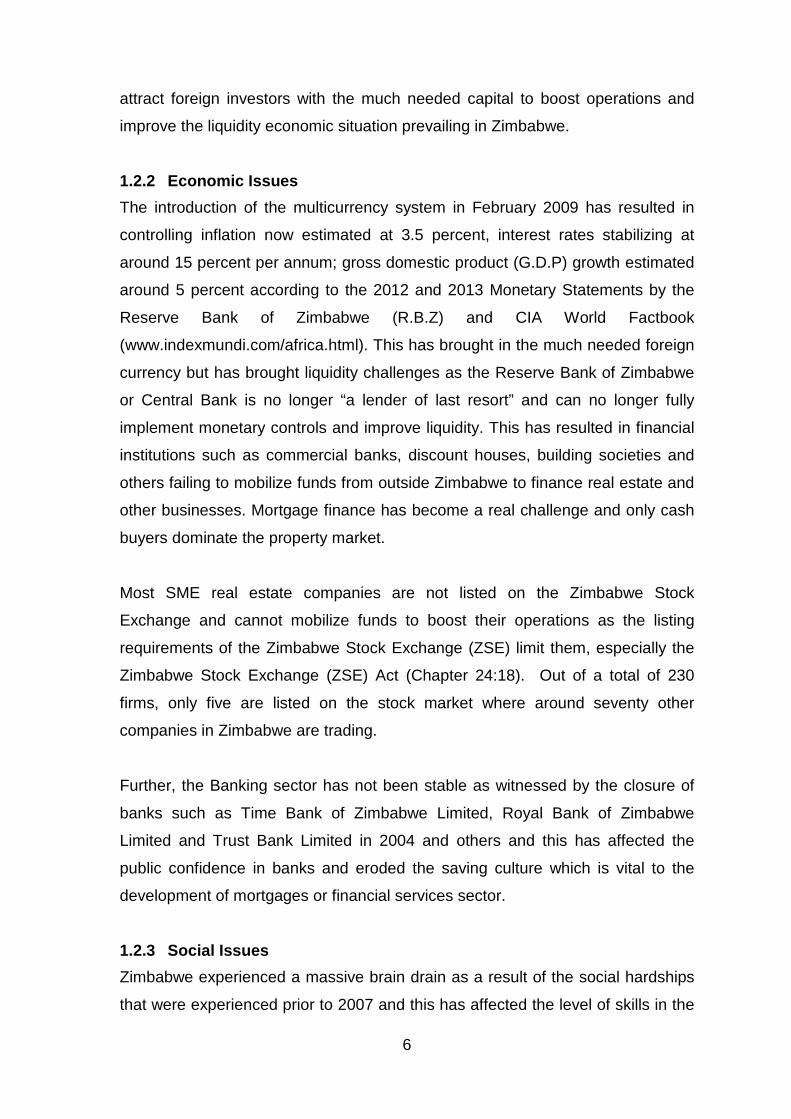
1.2.2 Economic Issues
The introduction of the multicurrency system in February 2009 has resulted in
controlling inflation now estimated at 3.5 percent, interest rates stabilizing at
around 15 percent per annum; gross domestic product (G.D.P) growth estimated
around 5 percent according to the 2012 and 2013 Monetary Statements by the
Reserve Bank of Zimbabwe (R.B.Z) and CIA World Factbook
(www.indexmundi.com/africa.html). This has brought in the much needed foreign
currency but has brought liquidity challenges as the Reserve Bank of Zimbabwe
or Central Bank is no longer “a lender of last resort” and can no longer fully
implement monetary controls and improve liquidity. This has resulted in financial
institutions such as commercial banks, discount houses, building societies and
others failing to mobilize funds from outside Zimbabwe to finance real estate and
other businesses. Mortgage finance has become a real challenge and only cash
buyers dominate the property market.
Most SME real estate companies are not listed on the Zimbabwe Stock
Exchange and cannot mobilize funds to boost their operations as the listing
requirements of the Zimbabwe Stock Exchange (ZSE) limit them, especially the
Zimbabwe Stock Exchange (ZSE) Act (Chapter 24:18). Out of a total of 230
firms, only five are listed on the stock market where around seventy other
companies in Zimbabwe are trading.
Further, the Banking sector has not been stable as witnessed by the closure of
banks such as Time Bank of Zimbabwe Limited, Royal Bank of Zimbabwe
Limited and Trust Bank Limited in 2004 and others and this has affected the
public confidence in banks and eroded the saving culture which is vital to the
development of mortgages or financial services sector.
1.2.3 Social Issues
Zimbabwe experienced a massive brain drain as a result of the social hardships
that were experienced prior to 2007 and this has affected the level of skills in the

7
industry and its performance. According to Zimbabwe national human resources
(ZNHR) survey of 2010, scientific industrial research and development centre
(SIRDC) report of 2003 and CIA World Factbook (2013) most skilled personnel
left the country to the United States, Britain, Australia, New Zealand, South
Africa, Botswana, Zambia and other countries to pursue greener pastures,
resulting in a net migration rate of 23.77 migrants per every 1000 population.
According to the CIA World Factbook (2013), 95 percent of the country’s
population is unemployed or underemployed and further 65 percent of the
population is living below the poverty datum line estimated at US$550.00 per
month by the central statistics office (C.S.O) of Zimbabwe.
The situation has further been worsened by the prevalence of diseases such as
HIV/AIDS estimated, by the central statistics office (2013 report), to be affecting
1.2 million people in Zimbabwe. According to Ellmies, Hahn and Mufenda (2005),
shortages of basic necessities such as proper basic infra-structure such as the
provision of roads, electricity, and water and sewerage system in both urban and
rural areas have also affected the majority of the population. This has resulted in
little disposable income available for saving and investing in immovable property
or real estate.
1.2.4 Technological Issues
Technological advances have greatly assisted property businesses as better
analysis models can now be applied in investment appraisals of various options
available on property investments. Comparisons can now be made between
returns offered in different markets such as equities, bonds and property markets
before investment decisions are made.
The process of sale and transfer of property has also greatly improved due to the
computerization of various organizations or entities or government departments
that deal with property sales, transfer and ownership such as local authorities,
deeds offices and survey offices among the host of these organizations.
Zimbabwe is now ranked 85 out of 185 economies in the property transfer
category, according to the International Finance Corporation (I.F.C) and the
World Bank (W.B), Doing Business report of 2013.

8
The new technology has had a negative impact on the level of employment as
machines can now produce subdivision drawings with little human involvement.
Accounting packages such as Pastel have also replaced the need to do manual
accounting, preparation of financial statements and auditing of the financial
accounts.
1.2.5 Ethical Issues
Operations in property business are mainly guided by the Estate Agents Act
(Chapter 27:17), the Valuers’ Act (Chapter 27:18), the Companies Act (Chapter
24:03), the Urban Councils Act (Chapter 29:15), the Ministry of Lands
Development and Public Construction together with city and district bye-laws
which regulate the conduct and operations of real estate businesses. This also
ensures that companies’ operations are done in an ethical manner and also with
due regard to the environment and society at large.
Section 3 of the Estate Agents Act (Chapter 27:17), gives power to the council to
monitor and take action against non complying real estate firms engaged in
unethical and unprofessional conduct. An established compensation fund also
provides relief to members of the public who suffer some loss as a result of any
misconduct or unprofessional conduct by registered members in the real estate
industry.
1.2.6 Legal Issues
Legal uncertainty has greatly affected real estate business in Zimbabwe as too
many policy changes have resulted in weak institutions, limited rule of law and
reduced property rights. Some policies such as the Land Acquisition Act (Chapter
20:10) and the Indigenous and Economic Empowerment Act (Chapter 14:33) and
the Urban Councils Act (Chapter 29:15) and Housing and Building Act (Chapter
22:07), have conflicts on the land use of acquired farms for immediate urban
settlement. The Urban Councils Act (Chapter 29:15), requires the land to be
serviced first before any settlement or change of land use. These may need to be
aligned, clarified and be operated outside the political environment and also in
view of the new constitution of Zimbabwe. The Land Acquisition Act (Chapter
9
20:10) allows compulsory acquisition of land for resettlement, while the
Indigenization and Economic Empowerment Act (Chapter 14:33) requires foreign
owned companies (even in farming sector) to cede 51% of their shareholding to
local Zimbabwean firms, while the Urban Councils Act (Chapter 29:15) requires
certain conditions to be met before any change in land use and land ownership
can be effected.
The quality of government, mainly indicated by the institutions, respect for the
rule of law and the property rights need to be improved, as these affect the
investment business in real estate. Political risk also affects the long-term
investment policies and the ability of local businesses to mobilize international
capital, according to a World Bank report (2013), on doing business in
Zimbabwe. The World Bank report (2013), further noted that the absence of
government decisiveness on the resolution of both the country’s domestic and
international debt, estimated at $10 billion, as well as the continued less than
satisfactory record regarding Zimbabwe’s adherence to the widely held virtues of
upholding property rights and transparently enforcing commercial contracts is
detrimental to efforts by real estate firms to grow and operate profitably.
1.3 Doing business in Zimbabwe
The Doing Business Report of 2013, compiled by the International Finance
Corporation (IFC) and The World Bank (WB), shows how easy or difficult it is for
a local entrepreneur to open and run a small to medium-size business when
complying with relevant regulations. These are levels of doing business out of a
total of 185 economies ranked in different categories in the following eleven
areas in the life cycle of a business: starting a business; dealing with construction
permits; getting electricity; registering property; getting credit; protecting
investors; paying taxes; trading across borders; enforcing contracts; resolving
insolvency and employing workers. In almost all the categories, Zimbabwe is
ranked above 100 places out of a total of 185 economies. This measure is mainly
used by international investors when choosing investment destinations.
10
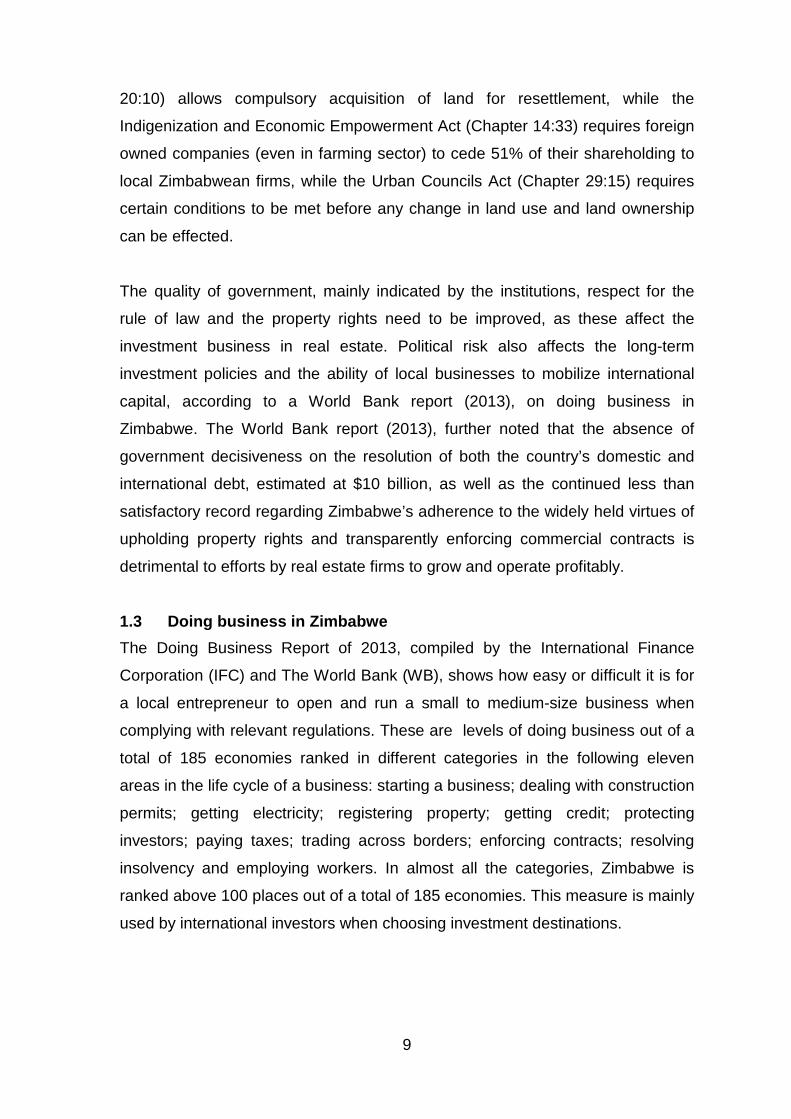
Table 1.3 below summarises ranking information.
Table 1.3: Ease of doing business category ranking.
Category of Ranking Rank out of 185
Starting a business 143
Dealing with construction permits 170
Getting electricity 157
Registering property 85
Getting credit 129
Protecting investors 128
Paying taxes 134
Trading across borders 167
Enforcing contracts 111
Resolving insolvency 169
Source: Doing business in Zimbabwe: IFC and World B ank (2013).
Table 1.3 above shows that registering a property in Zimbabwe is fairly easy,
with Zimbabwe being ranked at 85 out of the 185 economies, due to the
advancement in technology in the deeds office and the highly skilled
conveyancers or lawyers in the country. In terms of resolving insolvency and
dealing in construction contracts, Zimbabwe is ranked 169 and 170 respectively
to the detriment of the real estate industry.
Zimbabwe’s overall global ranking on the ease of doing business dropped in
2013 to 172 out of 185 countries, according to the World Bank (2013). Zimbabwe
is ranked at number 172 against an average of 140 in the Sub-Saharan African
region. This shows that doing business in Zimbabwe is difficult and expensive
and the country’s low credit rating means it is difficult to attract foreign direct
investments (F.D.I). Table 1.4 below shows Sub-Saharan African countries levels
of doing business in general with South Africa ranked 39, Botswana ranked 59,
Namibia ranked 87 and Zimbabwe ranked 172 out of 185 economies together
with Angola.

11
Table 1.4: Ease of doing business country ranking.
Country Ranking
South Africa 39
Botswana 59
Namibia 87
Swaziland 123
Lesotho 136
Regional Average 140
Zimbabwe 172
Angola 172
Source: Doing business in Zimbabwe: IFC and World B ank (2013).
The Doing Business Report summarizes the conditions under which small and
medium real estate firms have to operate under the liquidity constraints prevailing
in the country.
1.4 Competitive Environment
Another way of assessing the business environment and operations of the SME
real estate firms operations under the liquidity constraints and other challenges is
to use Porter’s five forces model (Porter, 1985). The model identifies and
analyzes five competitive forces that shape every industry, and helps determine
an industry's weaknesses and strengths. Once the five competitive forces are
identified, strategies should be adopted to capitalise on the strengths while
minimising the impact of the weaknesses.
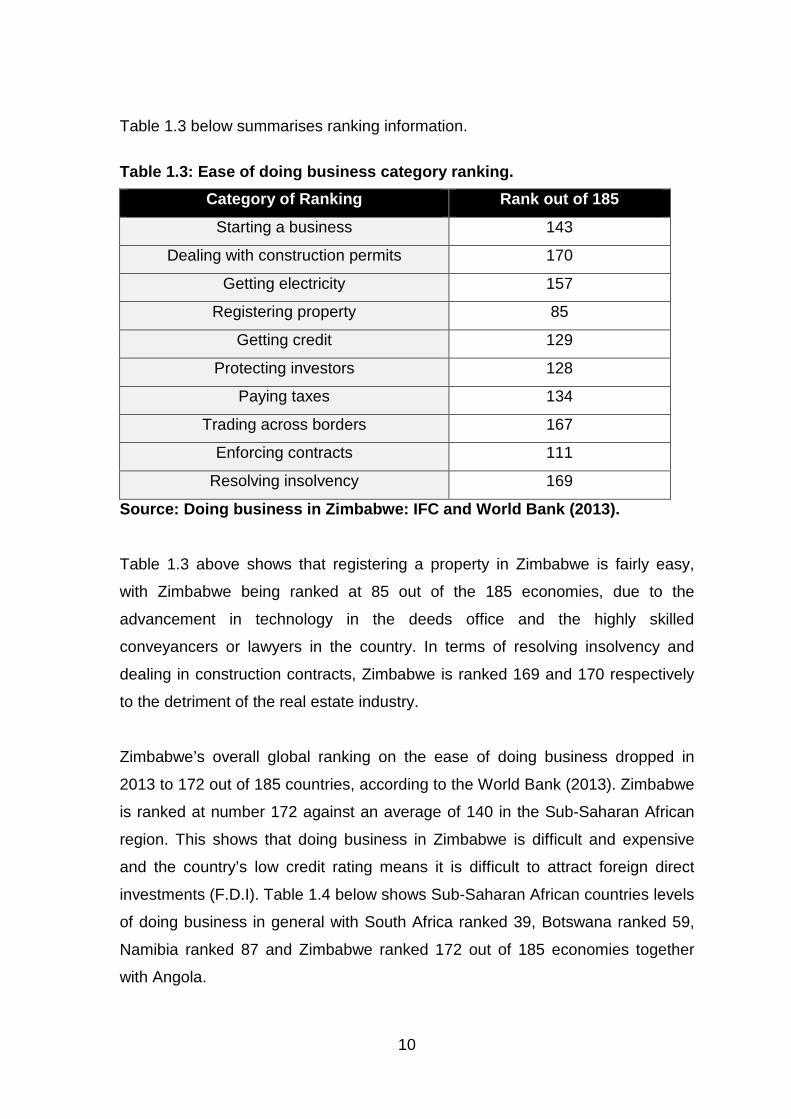
The five forces identified by Porter (1985) look at five areas of competition in the
marketplace or industry and these are as follows:
• threats of substitute products;
• threats of new entrants;
• nature of rivalry in industry;
• bargaining power of suppliers and
• bargaining power of buyers.
12
Figure 1.1 below is the diagrammatic presentation of the five forces that shape
industry competition.
Figure 1.1: The five forces that shape industry com petition.
Source: Adapted from Porter (2008)
1.4.1 Threat of substitute products
Porter (1985) suggested that, customers can easily switch to other competitors
products if they are not satisfied with a certain product or service offering. Thus,
a company needs to be aware of substitute products that are available in the
market that can compete with the company’s products or markets as well as to
dilute market share. Substitute products not only limit profits in normal times but
can also reduce the benefits an industry can reap, Porter (1979). In the real
estate industry, the services being offered are homogeneous and companies
compete on the quality of service delivery in order to gain market share. All
companies offer property sales, property management, property valuation,
property auctioneering and property development services. Therefore this force
will not exert much pressure on the competitive environment but SME real estate
firms need to be aware of its possible impact and be innovative in doing
business.
Threat of New Entrants
Rivalry among existing
competitors
Bargaining powers of sellers
Bargaining powers of buyers
Threat of substitute products
13
1.4.2 Threat of new entrants
The large property companies such as Old Mutual Properties, Pearl Properties,
Zimre Property Holdings, and Dawn Properties, listed on the Zimbabwe Stock
Exchange, have tried to create barriers so that small to medium companies will
struggle to enter the industry. The large property companies are aware that the
entrance of a new competitor into the industry or market increases competition,
brings new capacity, increases the desire to gain market share and often
substantial loss of resources.
The regulatory barriers to entry into the real estate industry are low and most
SME firms intending to join the industry can manage to comply with the
registration and entry requirements. These include a registration fee of
US$1000.00 to be paid to the Estate Agents Council of Zimbabwe (E.A.C.Z) and
the need to employ a registered estate agent to operate the trust account.
Section 25 of the Estate Agents Act (Chapter 27:17) sets the minimum age of 18
years, minimum qualification of passing the institute examination, practical
experience of 3 years and level of honesty for a person to become a registered
estate agent and be capable of operating a real estate firm.
1.4.3 Industry Rivalry
An industry’s profit potential is largely determined by the intensity of the
competitive rivalry within that industry. Industry rivalry means the intensity of
competition among the existing competitors in the market and depends on the
number of competitors and their capabilities. Industry rivalry is high when there
are a number of small or equal competitors and less when there is a clear market
leader, customers have low switching costs, industry is growing, exit barriers are
high and rivals stay and compete and fixed costs are high resulting in huge
production and reduction in prices.
The Estate Agents Rules of professional conduct as governed by the Estate
Agents Act (Chapter 27:17) regarding advertising for business, holding of sole
mandates, commission to be charged and conduct towards each other, reduces
the intensity of rivalry among firms and try to maintain a fair business
environment for firms in the industry. The Act further provides, in Part V sections
14
31 to section 35, for the cancellation and suspension of registration and
disciplinary powers given to the council in the event of unfair competition and
dishonesty among and by members.
1.4.4 Bargaining power of suppliers
Sellers of immovable properties are not powerful as they offer different properties
to an almost equal number of buyers and the laws of supply and demand at any
given time will determine the price. When the supply of immovable property is
high and their demand is low, then their prices will be low and conversely when
the supply is low and the demand is high, the prices will be high. This results in
the sellers’ market or buyers’ market respectively.
1.4.5 Bargaining power of buyers
Buyers in the real estate industry will only influence the price of immovable
properties if and only if there is high supply and low demand of properties. The
liquidity constraints prevailing whereby very little finance is obtainable from
financial institutions means that cash buyers will determine the price of properties
and sellers will have no option but to accept the terms and conditions being
offered by the buyers.
The understanding of the above five forces together with government policies,
will help real estate firms to develop successful financing strategies to overcome
their weaknesses and threats, thereby maximize on their strengths and take
advantage of opportunities in the industry.
1.5 Statement of the problem
The small to medium sized real estate firms in Zimbabwe are facing existence,
growth, survival and success challenges emanating from the unfavourable
external environment, industry competitive forces, difficulty and costly way of
doing business and the liquidity conditions prevailing in the country resulting in
low sales, high operating costs and contracting market share.
These key issues affecting the SME real estate firms can also be grouped into
four: unfriendly business environment; poor funding; low management skill and
15
lack of access to technology (FSS 2020 SME Sector Report, 2007). Among
these, shortage of finance occupies a central position. The purpose of this study
was therefore to assess the financing strategies being employed or implemented
by these small to medium enterprises (SMEs) real estate companies in
Zimbabwe during the liquidity constrained period.
1.6 Research objectives
The study had two objectives. Firstly, to assess the financing strategies being
employed by these small to medium real estate companies and their impact on
the existence, growth, success or maturity and possibly decline, in view of the
numerous challenges, during the life cycle of the real estate businesses in
Zimbabwe. Secondly, to establish the sources, structures and uses of finances
used in the SME real estate businesses.
1.7 Research questions
The study was based on the following questions:
1. What are the financing strategies being employed by small real estate
companies?
2. What are the sources, uses, cost and structures of finances used by small
real estate companies?
3. What are the financing challenges faced by small real estate companies in
Zimbabwe?
1.8 Significance of the study.
The significance of the study was that it led to greater understanding of financing
strategies of small to medium real estate firms operating under the liquidity
constraints in Zimbabwe. This study eventually led to conclusions and
recommendations that can be adopted by management to improve on financing
strategies and enhance the growth of their businesses.
Therefore this study contributed to the understanding of the financing strategies
in real estate business, the establishment of the sources of finance, cost of
finance and uses of finance used in the business and recommending of strategic
16
initiatives to address any of these challenges in a suitable, feasible and
acceptable way. (Johnson and Scholes 1992).
1.9 Scope of the study.
The study focused on small to medium sized real estate companies not listed on
the Zimbabwe Stock Exchange (ZSE), operating in Harare. This was due to the
fact that most of the small to medium sized real estate business is located in
Harare.
1.10 Chapter Summary
The real estate business has been defined as those including: property sales;
property management; property valuation; property auctioneering and property
development mainly done by registered estate agents; land developers;
mortgage financiers; surveyors; lawyers; conveyancers; buyers and sellers.
As at July 2013 there were 227 companies operating real estate business in
Zimbabwe with 196 based in Harare. The industry was dominated by about 5 big
companies which controlled approximately 80 percent of the industry.
The problem of operating challenges has resulted in contracting market share
and decreasing sales volume and thus the need to assess the financing
strategies employed by the small to medium real estate firms operating in
Harare, Zimbabwe.
1.11 Structure of the study.
The rest of the study consists of four chapters. Chapter two reviews literature on
the financing strategies used by companies in the real estate business. Chapter
three describes the methodology used in the study and issues such as research
methods, research tools, and sources of data, its collection and analysis. Chapter
four presents and analyses the findings of the study. Finally, Chapter five
concludes the study and makes specific recommendations on financing and
other strategies suitable for small to medium real estate firms operating in
Zimbabwe. The chapter also makes some recommendations on areas that may
require further study.
17
Chapter Two
Literature review
2.0 Introduction
The purpose of the study was to assess whether the small to medium real estate
firms have any financing strategies in place to promote the existence and growth
and recommend suitable strategies that can be adopted by such firms under the
current economic conditions in Zimbabwe. Secondly, the study also sought to
establish the sources of finance and structure of finance, cost of finance, tenor of
finance and uses of finance used in the small to medium businesses.
The purpose of this chapter is to review all the relevant literature on the financing
strategies of real estate firms. The small to medium enterprise business model
tends to be flexible, experimental and short term, (Johnson and Scholes (1984).
They have difficulties in accessing finance and new markets due to high
competition from established firms, lack the necessary skills and are faced with
high administrative costs and poor supporting infrastructures (Chan et al, 2005).
The chapter brings out financing challenges that real estate companies face and
ways they need to adopt in a way to improve on growth, viability and run
companies in a professional manner and thereby gain market share, reduce
operating costs and increase revenue.
The Governor of the Reserve Bank of Zimbabwe (RBZ), Monetary Statements of
2005 to 2012 has identified real estate as one of the areas that have capacity to
grow and sustain the economy. The RBZ estimated that SMEs contribute 50% to
gross domestic product (G.D.P) and 80% to employment in Zimbabwe. The small
and medium enterprises sector is estimated to contribute between 65% and 95%
of economic activities in developing and emerging economies, (Fan, 2003,
Goriwondo, 2011). According to Schlogl (2004), small and medium-sized firms
dominate economies in terms of employment and number of companies, yet their
full potential remains remarkably untapped. Contribution to gross domestic
product (G.D.P), employment creation, value addition, foreign currency,
18
improvement of local technology, output diversification, development of
indigenous entrepreneurship, forward integration with large scale industries and
competition are among the contributions made by SME companies.
Although the role of small to medium firms in various economic activities is widely
acknowledged, they are perceived to have a very high risk profile by financial
institutions resulting in firms or companies within the sector having limited access
to finance and being charged higher interest rates compared to larger firms. This
unnecessarily increases operating costs and reduces their competitiveness,
(Kaplan and Zingales 2000). They further noted that the SMEs have inadequate
or poor record keeping, lack immovable assets and collateral sufficient enough to
enable them to obtain credit. Management skills in handling finances and other
technical requirements are often very limited, (Johnson and Scholes (1992).
2.1 Definitions of Small to Medium Enterprises
In order to come up with a proper definition of SME, there is need to really
understand the industry it is operating in, period the company has been in
existence, the market being served and the country of operation, among a host of
factors, McLagan (1989).
According to Schlogl (2004), broadly SME firms can be defined according to the
following:
• number of employees in the company, (1-50);
• sales or turnover of the company, (below $10m per annum and
• total assets owned by company (below $100m).
There is no one widely accepted definition of SMEs (Hooi, 2006). Broadly, the
definitions are solely based on a fixed quantitative measure such as the total
number of workers, the total amount of capital, total assets and lately by
determining sales turnover (Hashim and Abdullah, 2000). This definition by Hooi
(2006) and supported by Hashim and Abdullah (2000) however fails to take into
consideration other factors such as the sector of firm, the country of enterprise,
the age of enterprise, the export levels, the gender of entrepreneur and other
qualitative aspect such as membership to trade organisations.
19
According to McLagan (1989) and Saleh and Ndubisi (2006), SMEs in the real
estate, manufacturing and agricultural sectors in developing and underdeveloped
countries are defined as those enterprises with full time employees not
exceeding 50 or annual sales turnover not exceeding US$10million whereas
SMEs in the services and ICT sectors are enterprises with full time employees
not exceeding 25 or annual sales turnover not exceeding $5million. These SMEs
are further categorized into medium-sized enterprises, small enterprises and
micro-enterprises.
A study done by Lawless et al (2012) also revealed that financial institutions
classify SMEs according to loan size and income to the bank, over and above the
number of employees, sales turnover and capital base criterion. This shows that
there is no accepted worldwide definition of SMEs as argued by (Hooi, 2006).
Any company that employs less than 50 employees including the owner is
regarded as small to medium enterprise. This definition may however not hold
true in some instances where the bulk of the employees may be highly skilled or
where firms are highly mechanized or computerized. Generally any companies
whose sales are below $10m per annum are regarded as SME depending on the
economic conditions prevailing (Hooi, 2006). In unfavourable conditions in
various countries such as Zimbabwe, large companies may be operating at 40%
capacity and generate less than $10m per annum, thus turnover may fail to
reflect the correct categorizing of these SME firms. The total asset base is
another measure that can be used to classify companies as it is generally
accepted that large companies especially in agriculture, mining and
manufacturing have massive capital equipment necessary to undertake their
operations. However there are companies in service consultancy and real estate
that do not require large equipment but generate massive sales, (Lawless et al
2012)
2.2 Definition of financing strategy
Harvey (2008), Wheellen and Hunger (2006), and David (1999), say that strategy
is the plan of action an organization prepares in response to, or anticipation of,
the changes in its external environment. It is differentiated tactics or operational

20
actions by its nature of being premeditated and well thought. It deals with three
questions: where the organization is at this moment in time; where the
organization wants to be in a particular length of time and how to get there?
Thus, strategy is designed to transform the firm from the present position to the
new position described by objectives, subject to constraints of the capabilities or
the potential.
Moore (1992) also views strategy as the unity, coherence and internal
consistency of a company’s strategic decisions that position a company in its
environment and give the firm its identity, its power to mobilize its strengths, and
its likelihood of success in the market. Andrews (1980) further outlines the
following three elements which should be present when implementing strategy:
appropriate organizational structure; organizational processes and leadership.
There are a number of definitions of financing, strategy and business financing
from various studies, (Khan and Jain 2007; Wheeler 2009; Parhter and Wert
2009 and López 2006) and they generally agree that finance strategies are
broadly about raising funds to operate businesses. Financing strategies can be
used to identify and exploit value-creating opportunities. These are strategies to
obtain funding and managing funding within an organisation and must add value
to shareholders wealth.
According to Khan and Jain (2007), finance is the art and science of managing
money and Wheeler (2009) defines business finance as that business activity
which concerns with the acquisition and conversion of capital funds in meeting
financial needs and overall objectives of a business enterprise. This view was
further consolidated by Parhter and Wert (2009), business finance deals primarily
with raising, administering and disbursing funds by privately owned business
units operating in nonfinancial fields of industry. Financial strategies are goals,
patterns or alternatives designed to improve and optimize financial management
in order to achieve corporate results (López, 2006).
According to a number of studies (Ibarra, 1995; Van Auken and Howard, 1993),
the importance of financial decisions in business is evident, since many of the
21
factors that contribute to small businesses failure can be managed properly with
strategies and financial decisions that drive growth and the organization’s
objectives. The main causes of business failures are the lack of financial
planning, limited access to funding, lack of capital, unplanned growth, low
strategic and financial projection, excessive fixed-asset investment and capital
mismanagement.
2.3 Definition of Business Life Stages
Any business passes though the following widely agreed stages: existence
stage; growth stage; maturity stage and decline stage, (Neil, Churchill and Lewis
(1983). Existence, growth and survival stages are when a company is able to
move through its life cycle from introduction or existence, growth and maturity
stages and possibly avoid decline. These stages require different sources, uses
and structures of financing to be analysed later in the chapter.
In Zimbabwe, the small to medium real estate businesses have only managed to
pass through the existence stage and very few have managed to grow because
of the unfavourable macroeconomic environment, industry competition and costly
and difficult way of doing business. The lack of financing and marketing
strategies is another possible reason which may be causing the lack of success
and the decline of the real estate businesses.
2.4 Definition of the liquidity constraints.
According to Hurst (2003) and Adams (2009), a constraint is an element, factor,
or subsystem that works as a bottleneck. It restricts an entity, project, or system
(such as a manufacturing or decision making process) from achieving its
potential (or higher level of output) with reference to its goal. Further Cole-man
(1996), Kiyotaki and Moore (2008), and Lagos (2007) explains that liquidity
constraints is the restrictions on the use of assets or availability of capital or
finance to finance any new or existing business or needs for consumption or any
business capital investment. This has negative impact on the growth and survival
of businesses. Moore (2008) further defines liquidity constraints as that inability
to obtain adequate and reasonably priced capital needed in a business and is of
the biggest hurdles to starting and growing a new business. Given the above
22
definition it then demonstrates that any organization operating under liquidity and
financial constraint will be limited in its growth and performance.
Modigliani and Miller (1958) have also added that liquidity constraints depend on
size of firm, emerging competition, internationalization and access to capital.
Cosh and Hughes (1994) also supported this view. This argument will however
not be pursued any further as the various assumptions used are mainly
theoretical and do not apply in real world situations. Some of the assumptions
such as asymmetric information, shareholder liquidity, no transaction costs, no
taxes and markets being perfectly integrated and efficient are not applicable in
real world, more so in Zimbabwe. Further the theory that firms can borrow can
not apply as the market under examination is not liquid.
2.5 Uses of the financing
According to various studies, (Hisrich and Jankowics, 1990; Ross et al, 2000;
Mallette, 2006; Barton et al, 2006; and Valencial et al, 2006); one area that has
received little attention is the establishment of financing strategies, especially in
the study of small and medium-sized enterprises, even though it is a determinant
of business success. Financial analysis and planning, which represent basic
features that support organizational strategy, are nonetheless virtually non-
existent in small to medium enterprises, which impose a constraint on the kind of
financial decisions businesspeople can take. Financial strategy represents a path
to achieve and maintain business competitiveness and position a company as a
world-class organization.
Financial strategy consists of three interrelated kinds of decisions: investment;
funding and working capital decisions (Ross, Westerfield & Jordan, 2000).
Investment decisions relate to the allocation of capital to carry out investment
opportunities that are valuable (bring value) to the company, taking into account
the magnitude, opportunity and risk of the future cash flows of investment.
Funding decisions concern the specific mix of long-term debt and capital that the
company uses to finance its operations, that is, optimal capital structure.
Working-capital decisions include the management of short-term assets and
liabilities in a way that ensures the adequacy of resources for company
23
operations. According to Ward and Ruth (2009) the following financing strategies
are generally known and applicable to SME businesses: Working capital
decisions; capital expenditure decision and investment decisions. Assuming the
corporate aim is to maximize profits, setting the agency problem aside, it is
important for businesses to seek the optimum combination of the three kinds of
financial decisions (Holmes and Kent 1991). Mallette (2006) argues that an
organization's financial strategy is so important to the company that it must be
evaluated and adjusted as frequently as the operational strategy.
In general, working capital requirements are mainly financed by a mixture of
long-term funds and short-term resources. Long-term sources of funds consist of
capital (equity from owners) and long-term debt, which only provide for a
relatively small portion of the working capital requirement. Finance theory
dictates that only the permanent portion of working capital should be supported
by long-term financing (Gitman, 2000). On the other hand, the short-term sources
of working capital funding consist of trade credit, short-term loans, bank
overdrafts, tax provisions and other current liabilities that can be used to finance
temporary working capital needs.
When businesses have financial information, they are also able to analyze
investment needs (considering cost-yield) to determine the optimal capital
structure, to set dividend policy and to define funding strategy. It is also
necessary to apply cash management techniques and establish credit policies
and inventory policies through the analysis of the organization’s operating cycle,
(Tyebjee & Bruno, 1984 and Hisrich & Jankowicz, 1990).
SME real estate firms’ failures can be successfully managed with suitable
financing strategies developed and implemented by the organization. However,
the study of financial decisions has been, for a long time, limited to large
corporations, about which extensive research has been published. One of the
main features of small real estate businesses is that they do not have useful
financial information to make financing decisions.
24
2.6 Sources of financing.
There are various sources available for financing of SMEs which can be grouped
into debt or equity financing (Muktar, 2009 and Ewiwile et al, 2011). The following
are widely used sources of financing: owner’s capital or private equity; venture
capital; loans or debt from banks or lending institutions or small business lending
institutions; equity from capital markets; retained income; leasing; hire purchase
and factoring. According to (López et al, 2006), the sources or categories of
finance for SME growing into large companies were: own resources from
entrepreneur; venture capital; loan and debt and finally equity finance as the
company grows to finance working capital, capital expenditure and investment
finance. Further research done by López et al (2006), noted financing strategy
helps to achieve and maintain business competitiveness and these are goals,
patterns or alternatives designed to improve and optimize financial management
in order to achieve corporate results. The study will assess use of equity, venture
capital, debt, retained income, and leasing finance as these are commonly used
by SME real estate firms in Zimbabwe.
Financing strategies and decisions are critical to small firm’s competitiveness
especially small businesses that are faced by financial limitations to be highly
efficient in the allocation of scarce resources in order to ensure existence,
survival and maturity and generate sufficient cash flow and profits.
The financial decision-making processes and techniques used by a firm to make
decisions on capital budget, financing costs and sources, and dividends are
closely related to funding opportunities. Companies do have an optimal debt and
equity ratio that minimise costs and maximize returns at minimum risk. With
regard to dividends decisions, present and future earnings represent the most
relevant factors enterprises consider when deciding on dividend policy.
Several studies, (Ross, Westerfield & Jordan, (2000); Ward and Ruth (2009)
Mallette (2006); Barton et al (1989); Muktar (2009); Jensen and Meckling (1976);
Ewiwile et al. (2011); Lopes et al (2006) and Porter (1987) seem to agree on
uses of finance. Lopes et al (2006) also brought out the main aspects of
financing strategy but failed to differentiate the type of financing needed at every
25
stage of business development and the risk associated with type of financing.
The model is applicable to large organisations only.
The quantitative methodology used in the various studies was appropriate for the
type of studies as well as the analysis techniques. The sample sizes used were
large enough to be reflective of the SMEs financing strategies.
2.6.1 Equity finance (private and public)
Equity finance represents a personal investment by the owner of the business
and sometimes called risk capital as investors assume the risk of losing their
investment if business fails. The family; friends and own resources are a major
source of start up businesses. Business risk will be high thus the need to use
own finance and limit the financing risk.
Use of shares in their various forms (ordinary; preference; debentures and
others) is another way of financing a business but has fixed costs to be made.
These sources have costs; limitations and advantages but are mainly available to
large companies with low business risk and with capacity to absorb the high
financing risk involved. Small firms can tap into other informal sources of finance
instead of relying solely on financial institutions and government agencies for
capital. A small business itself has the capacity to generate capital. This type of
financing, called bootstrap financing, is available to virtually every small business
and includes a combination of social and economic transactions; for example,
buying low-cost equipment and having family members help during peak periods.
Bootstrap financing also encompasses factoring, leasing, the use of credit cards
and the frugal management of the business. (Paul et al. 2007and Muktar, 2009)
Zimbabwe’s capital market became fully fledged with the inception of the
Zimbabwe Stock Exchange (ZSE). However, most SMEs cannot take advantage
of the Exchange because of listing rules regarding disclosure requirements,
which require companies to provide credible information to investors. The
banking sector has offered equity financing to a few successful SMEs.
26
SMEs may also prefer debt to equity when seeking external funding because
they are much more familiar with banks and other sources of debt finance and a
wide variety of debt products are available (KPMG Consulting, 2002).
In a survey done on equity financing pattern among Australian companies,
Foresaith et al (1993) concluded that SME firms have a target debt to equity ratio
but use more private equity finance from restricted sources such as directors and
relatives, a view shared by Scott (1972). Private equity finance is important for
young, high growth and potentially high-risk enterprises.
SME real estate firms start their businesses with very low capital which then limit
them to use private equity finance. This form of finance is the most appropriate
one as business risk will be high thus the need to avoid financing risk. Public
equity finance is used at the maturity and decline stages of business when
business risk will be low. It is also used as an exit strategy by private equity
shareholders.
2.6.2 Venture capital and business angel finance
Most of the literature which addresses the start-up investment decision process
has focused on how venture companies make investment decisions. (Elitzur and
Gavious, 2003, Keushnigg 1998 and Mason and Harrison, 2002). Venture
capitalists play a critical role in reducing information asymmetries through the
collection of critical and private information. In perfect financial markets, funds
are always available for value creating investment projects and financing
decisions can be separated from investment decisions (Modigliani and Miller,
1958).
Depending upon their stage of growth, the most appropriate form of finance for
SME development is frequently venture capital rather than debt then
complimented by public equity finance, (Kamath, 1997 and Jordanet al, 1998).
In Zimbabwe, venture capital has become an established investment vehicle in
various sectors of the economy and is becoming increasingly popular in other
developing economies too. Venture capital involves the provision of investment
finance to SMEs in the form of equity or quasi-equity instruments not traded on a

27
recognised stock exchange. It is long-term risk finance whose primary return to
the investor is capital gains rather than income. Venture capital investors actively
get involved in the management of the companies that they invest in to ensure
the success of the venture.
Cosh and Hughes (1994) found that venture capital provided only a small
proportion of the equity funding of SMEs. Moreover, they found that business
angels’ finance was concentrated on small enterprises while that from formal
venture capital funds went mainly to medium sized enterprises. They show that
venture capital funds are not interested in providing the small amounts of funding
sought by many small enterprises. Cressy (1993) found that fewer than 1% of UK
start-ups had financial input from venture capitalists with larger start-ups being
more likely to use venture capital funding.
Cressy and Olofsson (1997) found that formal venture capital funds were not
favoured as equity partners by SME firms. These firms felt the time horizons of
these funds were too short and that their demands were unreasonable. Hence,
they preferred business angels or other companies in the same industry as
equity partners.
Consequently, venture capital fund investments in Latin America have been
generally directed to more advanced stages of the life cycle of firms and are very
cautious about potential innovations in their initial stages, where risk is
substantially higher (Gombers 1995), Berger and Udell (1998) found that angel
finance and venture capital were minor providers of funding to USA enterprises in
the 1994 to 1998 period. In Zimbabwe, under the current conditions, SME real
estate companies do not make use of such venture capital or credit schemes as
the requirements to access them are stringent. The timeframes are short-term
and interest rates too high for small businesses.
The methodology used during the study by Cressy and Olofsson (1997) of
venture capital financing was quantitative and it applied longitudinal survey over
4 years from 1994 to 1998 with a large population of 13000 businesses. They
used questionnaires to collect data through a consultant company.

28
2.6.3 Debt financing
These are loans from private, commercial or institutional lenders. Debt financing
has negative effect on profitability since it has binding interest and capital
repayments to be made regularly. This form of financing must be avoided during
the early life of companies as cash flows will be negative and business risk very
high. Debt financing is cheaper in that the interest payable is tax deductible. SME
real estate firms fail to access this type of finance as they lack collateral security
and proper records to support their loan applications. Amounts accessed are also
limited as well as the duration due to the liquidity constrained environment.
Interest rates are also too high for the SME real estate firms.
In Zimbabwe, the banking sector financing is low as country is operating under
liquidity constraint environment. Several banks have closed due to failure to meet
minimum capital requirements set by the Reserve bank of Zimbabwe. The few
banks that are funding the operations tend to favour large agricultural, mining
and manufacturing companies with little emphasis on construction or real estate
industry. Further, SME real estate firms are not able to access this type of
funding due to lack of collateral and proper accounting records.
Micro financing has proved to be a reliable delivery vehicle for financial services
to SMEs. The licensed institutions such as SEDCO, NGOs, pension funds and
building societies offer loans to SMEs. Their service delivery is flexible and easy
for small firms to access loans. Some of the institutions rely on donor or RBZ or
government funding. Most SME real estate firms have managed to access
funding from these institutions. These institutions need to be capitalised fully in
order for them to fully service the SME firms.
2.6.4 Retained Income
Retained income from previous year or years can be used to finance company
operations during the maturity and decline stages as company would normal had
accumulated some surplus income. The strategy has no financial risk as there
are no charges associated with the source. Business risk will also be low as
company would have matured in the industry. This is a major source of finance
for SME real estate firms from the growth stages where the profits are used to
finance the working capital and funding requirements of firms.

29
This is a major source of funding for the few real estate companies that are in the
growth stage. They rely on surplus income from previous months to finance their
working capital requirements.
2.6.5 Leasing finance
Worldwide, the SMEs have been accepted as the engine of economic growth
and for promoting equitable development. Without finance, SMEs cannot acquire
or absorb new technologies nor can they expand to compete in global markets or
even strike business linkages with larger firms (UNCTAD June 2011). A major
barrier to rapid development of the SMEs sector is a shortage of both debt and
equity financing (Idol F.C 2010). Globally, leasing is another widely-used service
for SMEs, although the lack of leasing law is constraining development of this
sector in Zimbabwe
Leasing is another way for SMEs to expand their access to short- and medium-
term financing. From an economic perspective, leasing can be defined as “a
contract between two parties where one party (the lessor) provides an asset for
usage to another party (the lessee) for a specified period of time, in return for
specified payments” (Fletcher et. al., 2005). According to the Accounting
Standard IAS 17 “a lease arrangement is an agreement whereby the lessor
conveys to the lessee in return for a payment or series of payments the right to
use an asset for an agreed period of time.”
Leasing is referred to as asset based financing. As lessor retains ownership of
the assets they lease throughout the life of the contract, these leased assets are
therefore an inherent form of collateral in such contracts, (compared to traditional
bank lending), which will either be unsecured or make use of different types of
collateral and typically not physical assets such as equipment; motor vehicles or
computers which are inherent in leases. Conventional bank lending focuses on
the loan repayment by the borrower from two sources: a primary source, the
cash flow generation, and a secondary source, credit enhancements and
collateral. Leasing is focused on the lessee’s ability to generate cash flows from
the business operations to service the lease payments (Gallardo, 1997), as the
lessor retains legal ownership of the asset. Ownership of the asset may or may
not pass to the customer at the end of the lease contract.
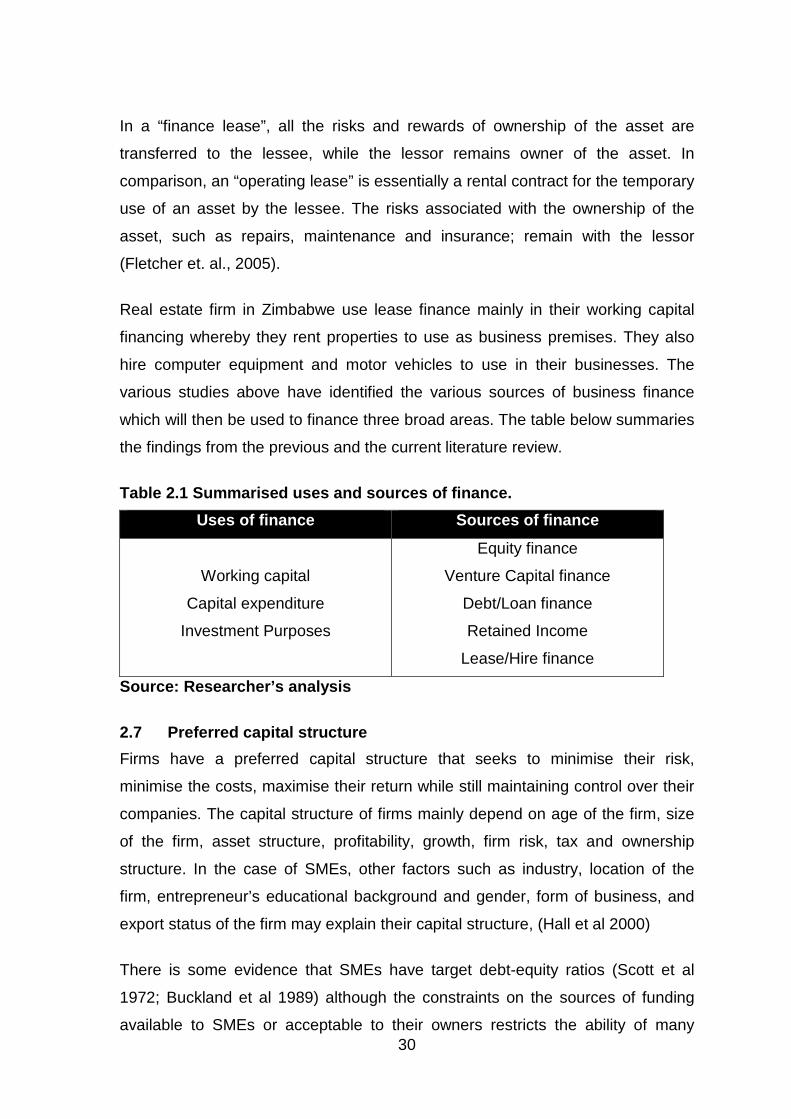
30
In a “finance lease”, all the risks and rewards of ownership of the asset are
transferred to the lessee, while the lessor remains owner of the asset. In
comparison, an “operating lease” is essentially a rental contract for the temporary
use of an asset by the lessee. The risks associated with the ownership of the
asset, such as repairs, maintenance and insurance; remain with the lessor
(Fletcher et. al., 2005).
Real estate firm in Zimbabwe use lease finance mainly in their working capital
financing whereby they rent properties to use as business premises. They also
hire computer equipment and motor vehicles to use in their businesses. The
various studies above have identified the various sources of business finance
which will then be used to finance three broad areas. The table below summaries
the findings from the previous and the current literature review.
Table 2.1 Summarised uses and sources of finance.
Uses of finance Sources of finance
Working capital
Capital expenditure
Investment Purposes
Equity finance
Venture Capital finance
Debt/Loan finance
Retained Income
Lease/Hire finance
Source: Researcher’s analysis
2.7 Preferred capital structure
Firms have a preferred capital structure that seeks to minimise their risk,
minimise the costs, maximise their return while still maintaining control over their
companies. The capital structure of firms mainly depend on age of the firm, size
of the firm, asset structure, profitability, growth, firm risk, tax and ownership
structure. In the case of SMEs, other factors such as industry, location of the
firm, entrepreneur’s educational background and gender, form of business, and
export status of the firm may explain their capital structure, (Hall et al 2000)
There is some evidence that SMEs have target debt-equity ratios (Scott et al
1972; Buckland et al 1989) although the constraints on the sources of funding
available to SMEs or acceptable to their owners restricts the ability of many

31
SMEs to pursue target capital structures. Rather they obtain funding from the
restricted and private sources that are available and that are acceptable to them.
Bates (1971) reported that small enterprises in the UK are more reliant on equity
financing and on own funding than large enterprises. Directors’ loans were
identified as an important source of funds.
An additional factor impacting on the financial structure of SMEs is the limited
availability of certain sources of funding to SMEs. External equity finance in the
form of venture capital is generally unavailable to SMEs without strong growth
prospects. This includes both venture capital funds and wealthy individual
investors known as business angels. Widespread access to external equity
through public listing on the stock exchange is unavailable until the firm is
relatively large and is able to meet the minimum size requirements for listing. For
most SMEs, the only feasible source of external equity funding is from relatives
and friends. This further constrains the applicability of the pecking order theory to
SMEs.
The additional sources of finance available to growth SMEs, coupled with the
different objectives and aspirations of the owners of these enterprises, may lead
them to make different financing decisions from the traditional SME which has, at
most, capped growth objectives. In particular, growth SMEs may take on more
external equity finance and may be less highly leveraged than many non-growth
enterprises. Hall et al (2000) found a significant relationship between industry
sector and long-term leverage ratios and that long-term leverage was positively
related to firm size as measured by assets.
Real estate firms in Zimbabwe are owner managed and directors prefer own
private equity to finance the operations of their companies. They miss out on
growth opportunities as they restrict themselves to internal or private financing.
2.8 Models to be reviewed in assessing financing st rategies
A review of the three most applicable business models will be done to illustrate
the choice and application of financing strategies being employed by SME real
estate firms. The models highlight the financing preferences, levels of control,
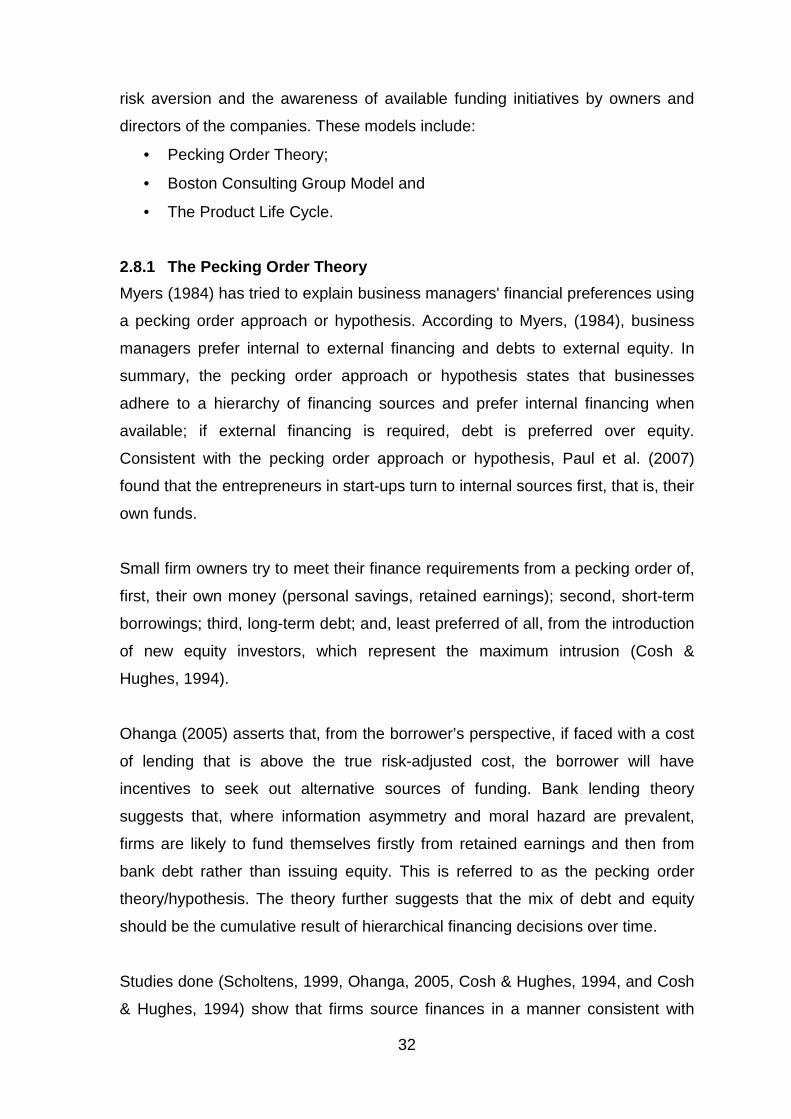
32
risk aversion and the awareness of available funding initiatives by owners and
directors of the companies. These models include:
• Pecking Order Theory;
• Boston Consulting Group Model and
• The Product Life Cycle.
2.8.1 The Pecking Order Theory
Myers (1984) has tried to explain business managers' financial preferences using
a pecking order approach or hypothesis. According to Myers, (1984), business
managers prefer internal to external financing and debts to external equity. In
summary, the pecking order approach or hypothesis states that businesses
adhere to a hierarchy of financing sources and prefer internal financing when
available; if external financing is required, debt is preferred over equity.
Consistent with the pecking order approach or hypothesis, Paul et al. (2007)
found that the entrepreneurs in start-ups turn to internal sources first, that is, their
own funds.
Small firm owners try to meet their finance requirements from a pecking order of,
first, their own money (personal savings, retained earnings); second, short-term
borrowings; third, long-term debt; and, least preferred of all, from the introduction
of new equity investors, which represent the maximum intrusion (Cosh &
Hughes, 1994).
Ohanga (2005) asserts that, from the borrower’s perspective, if faced with a cost
of lending that is above the true risk-adjusted cost, the borrower will have
incentives to seek out alternative sources of funding. Bank lending theory
suggests that, where information asymmetry and moral hazard are prevalent,
firms are likely to fund themselves firstly from retained earnings and then from
bank debt rather than issuing equity. This is referred to as the pecking order
theory/hypothesis. The theory further suggests that the mix of debt and equity
should be the cumulative result of hierarchical financing decisions over time.
Studies done (Scholtens, 1999, Ohanga, 2005, Cosh & Hughes, 1994, and Cosh
& Hughes, 1994) show that firms source finances in a manner consistent with
33
Myers’ (1984) pecking order theory, highlighting the importance of profitability in
funding in the sector. Firms with a high level of fixed assets overcome problems
of asymmetric information by pledging collateral to secure debt finance. When
there are insufficient firm assets to secure business loans, the personal assets of
the firm owner are an important source of collateral.
The application of the pecking order theory to small and medium firms needs to
be qualified by the stage of the firm’s life-cycle (Scholtens, 1999). Younger firms,
which are generally smaller firms, are less able to generate sufficient retained
earnings for internal sources to adequately finance an expansion of operations.
This source of funding is more readily available for more mature firms. Capital
structure, therefore, will vary over the life-cycle of the small enterprise (Ang
1991).
2.8.2 The BCG Growth-Share Matrix
The BCG Growth-Share Matrix is a portfolio planning model developed in the
early 1970's by the Boston Consulting Group. The model is based on the
observation that a company's business units can be classified into four
categories based on combinations of market growth and market share relative to
the largest competitor, hence the name "growth-share". Market growth serves as
a proxy for industry attractiveness, and relative market share serves as a proxy
for competitive advantage. The growth-share matrix thus maps the business unit
positions within these two important determinants of profitability.
Enterprises with growth prospects could increase their use of both debt and
equity. Funding their expansion is likely to require resort to external financing and
the pecking order theory indicates that their preference will be for debt rather
than equity capital. However, growth firms will be more attractive to investors
such as business angels and venture capital funds. Moreover, banks will require
sufficient equity to be in place if they are to increase their funding of the
enterprise.
The table 2.2 and figure 2.1 below illustrates the relationships between the
strategies and growth level of firms and how these strategies impact on the

34
overall financing strategies. The financing strategies are linked to the growth
stages of a firm which can then be linked to the BCG growth model. The
introductory stage of a firm is the question marks in the BCG model and the
financing strategy is to use borrowings from family, friends and own private
equity or private capital as figure 2.2 combines them all together with risks
associated at each stage.
Table 2.2 Financing strategies and growth levels of firm.
Financing Strategy Firm growth levels
Borrowings from family, friends and own capital. Introductory stage
Loans from Financial Institutions or Venture Capital. Growth/Survival stage
Retained Income and Equity from Capital Markets Maturity stage/Success
Equity and Capital Markets/Venture finance Decline Stage
Source: Adopted from Ward and Bender (2009)
Figure 2.1 Growth/Portfolio Matrix Model
Source: Adopted from Ward and Bender, 2009
Boston Consulting Group have identified the business stages of development
and managed to match the relevant financing needs and sources in order to
minimise financing risk and maximise business growth. The B.C.G. matrix was

35
further linked to the product life cycle showing growth is sales, profitability and
liquidity of the firm over time.
A main assumption is that a growing market requires investment in assets to
increase capacity and therefore results in the consumption of cash. Thus the
position of a business on the growth-share matrix provides an indication of its
cash generation and its cash consumption.
The BCG Growth-Share Matrix show that the cash required by rapidly growing
business units could be obtained from the firm's other business units that were at
a more mature stage and generating significant cash. By investing to become the
market share leader in a rapidly growing market, the business unit could move
along the experience curve and develop a cost advantage, (Ward and Bender
2009).
Below is a figure showing the various business stages, financing risks, sources of
financing, profitability and cash-flow levels in various stages of company growth.
Figure 2.2: BCG Growth-Share Matrix
Stars
Need development & investment.
Have more liquidity.
Owner’s Equity financing
appropriate.
Bank or Commercial loans.
Financial Risk low.
Business Risk high
Question Marks
Need to develop liquidity.
Negative cashflows and profits.
Owner’s Equity financing
appropriate.
Venture financing can be used.
Financial Risk very low.
Business Risk very high
Cash cows
Have greater liquidity.
Finance other activities.
Can use Retained Income.
Financial risk medium.
Business Risk low
Dogs
Very Low Liquidity.
Use public equity finance
A declining market share.
Financial risk very high.
Business Risk very low
Strong Market share Weak
Source: Adopted from Ward and Bender (2009)
Low
M
arke
t G
row
th R
ate
H
igh

36
The four categories are explained below:
Question marks are rapidly growing businesses or units and thus consume large
amounts of cash to promote the business, but because they have low market
shares they do not generate much cash. The result is large net cash
consumption resulting in negative cashflows and losses. A question mark has the
potential to gain market share and become a star, and eventually a cash cow
when the market growth slows. If the question mark does not succeed in
becoming the market leader, then after perhaps years of cash consumption it will
degenerate into a dog when the market growth declines. Owners’ equity finance
is the main source of finance, complimented by venture capital, as company will
still be new with high business risk and credit lines will be limited.
Stars generate large amounts of cash because of their strong relative market
share, but also consume large amounts of cash because of their high growth
rate; therefore the cash inflows and outflows will be the same. If a star can
maintain its large market share, it will become a cash cow when the market
growth rate declines. The portfolio of a diversified company always should have
stars that will become the next cash cows and ensure future cash generation. At
this level the business can finance its operations.
Cash cows develop when business units or firm become leaders in a mature
market, cash cows earn a return on assets that is greater than the market growth
rate, and thus generate more cash. Such business units should be "milked",
extracting the profits and investing as little cash as possible. Cash cows provide
the cash required to turn question marks into market leaders, to cover the
administrative costs of the company, to fund research and development, to
service the corporate debt, and to pay dividends to shareholders.
Dogs have low market share and a low growth rate and thus neither generate nor
consume a large amount of cash. However, dogs are cash traps because of the
money tied up in a business that has little potential.
Under the growth-share matrix model, as an industry matures and its growth rate
declines, a business unit will become either a cash cow or a dog, determined

37
solely by whether it had become the market leader during the period of high
growth.
While originally developed as a model for resource allocation among the various
business units in a corporation, the growth-share matrix can also be used for
resource allocation or financing among products or services within a single
business unit.
While its importance has diminished, the BCG matrix still can serve as a simple
tool for viewing a corporation's business portfolio at a glance, and may serve as a
starting point for discussing financial resource allocation among strategic
business units.
The small to medium real estate businesses in Zimbabwe have great potential to
rapidly growing businesses or units but consume large amounts of cash to
promote the business, advertise the products, and pay other administrative costs
but because they have low market shares they do not generate much cash.
There is need for financing strategies to finance these activities.
2.8.3 The Growth Life Cycle Model
An assessment of financing strategies in isolation of marketing strategies will
result in lost opportunities by firms. Marketing strategy and financing strategies
are closely linked and major challenges of SME firms are their failure to identify
and utilise the linkages. (Ward and Bender, 2009 and Watson, Hanks et al,
1993).
Figure 2.3 below shows the growth stages of sales in any organisation which
then have impact on the financing strategies of any firm. At the development and
introductory stages cash-flows are negative due to business risk. The financing
strategy will be to raise cheap finances to promote growth.
38
Figure 2.3 Growth Life Cycle.
Source: Adopted from Kotler 2004
The growth life cycle passes through a number of stages from development,
introduction, growth, maturity and decline. These various stages require different
financing levels as sales levels will be different. These stages can be linked to
the BCG growth matrix. SME real estate firms need to identify the link between
growth models and avoid the application of pecking order approach or hypothesis
when sourcing for funding.
2.8.4 Other strategies
SME development strategies will necessarily be country and context specific and
each country will have its own challenges, opportunities for the SME firms.
Resources available for implementation will vary by country, so that results
achieved will also be different. Then, emphasis changed to one of achieving
international competitiveness and programs encouraging business growth,
support for technology based businesses and creation of an enterprise culture
Dev
elop
men
t
Intr
oduc
tion
Gro
wth
Mat
urit
y
Dec
line
Time
Sale
s V
olum
e
39
within the society started to gain in importance (Sawy, Malhotra, Gosain and
Young, 1999).
The SME development strategy has to be inclusive and build on a consensus on
SME challenges, goal and broad policy direction among key SME stakeholders.
The strategy has to concert and coordinate efforts of institutional structures that
make or affect policy (the parliament, provincial councils and political parties), the
administrators of policy (line ministries, local government authorities and
regulatory structures), and public support organizations (SME, export,
investment, regional development, public sector education and training
institutions and financial institutions). The private sector’s roles and
responsibilities have to integrate into the strategy through business membership
organizations, organizations of business development service and private
financial service, (Khan and Khan, (1992) and Chen, (1993).
It must also be clear that inserting an arbitrary notion of “SME” into the national
development framework or into an existing private sector development strategy
would not be sufficient. Anti-SME biases must be assessed in detail within the
context of the country: as to the legal, regulatory frameworks and administrative
practices, in access to finance, in respect of entrepreneurial support structures
and infrastructure, and with a genuine concern for effective use of human and
natural resources (Khan and Khan, 1992; Chen,1993).
The models applicable to the majority were the Boston Consulting Group (BCG)
life Matrix, the pecking Order Matrix (POM) and the growth life cycle (GLC)
model. Studies were in broad agreement on the existence of financing strategies
for the SMEs and different strategies were applicable for different stages of
business life.
2.9 Conclusions and recommendations
The key findings from this literature review can be summarized as follows:
• Only a small proportion of SMEs real estate firms ever undertake new equity
financing, suggesting that this is not a popular financing alternative. Debt

40
financing appears to dominate the balance sheets of these firms at maturity
and decline stages.
• Most SMEs are predominantly closely-held concerns with controlling
interests in the hands of founding directors or working owners. Any new
equity financing is likely to be undertaken in manner that maintains this
situation (Pecking Order Theory).
• When new equity financing is undertaken by SMEs, the amounts raised
seem to be significant relative to their existing equity base. Thus, when
undertaken, such equity capital raisings appear to be important financing
initiatives.
• Smaller enterprises tend to have a more limited equity financing base, they
appear to rely more heavily on working owners for any equity financing they
do have.
• Greater enterprise growth tends to be more evident amongst SMEs that are
more willing and more able to employ new equity financing.
In order to make a meaningful contribution to local and national economic
development and prosper, SMEs require a favourable business and regulatory
environment, access to appropriate business development services and support,
and easy access to finance at reasonable rates.
SMEs, however, are typically opaque and suffer from weak entrepreneurial skills
while financial institutions generally display very stringent lending criteria and a
low risk appetite. This situation is further exacerbated by SME support and
development organisations, especially government funded organisations, whose
strategies and interventions have not yielded the intended results. So, while
SMEs normally complain of a lack of access to finance, financial institutions
complain of a dearth of entrepreneurs. Both arguments are equally valid.
A number of recommendations need to be adopted by the SME real estate firms
if they are to grow, succeed and survive in the current conditions. These
recommendations include: Adoption of the BCG growth model. This model is a
decision making model that allows a firm to identify its growth potential and its
position in the market and formulate proper financing strategy that incorporates
all business risk elements and combine them with marketing strategies to grow.
41
On the other hand the pecking order theory (P.O.T) limits firms’ access to various
financing options available with its preference to internal sources at the expense
of external sources.
2.10 Chapter Summary
This chapter has defined small and medium sized firms, liquidity constraints and
impact of financing strategy on the performance of SME real estate firms in
general and those operating in Zimbabwe specifically during the liquidity
constrained period. The various sources of financing and their structures have
been analyzed. The Pecking Order Theory, the Boston Consulting Group Matrix
and the Product Life Cycle have been combined to come up with a detailed
growth share matrix combining the various financing components that also
include the risks and returns associated with the financing strategies. The
literatures has shown that performance under liquidity constraints suffer due to
the inability to properly implement financing strategy, resulting in the need to
adopt various strategies or models such as:
• Pecking Order Theory;
• Boston Consulting Group Model;
• The Growth Life Cycle and
• Comprehensive Growth- Share Matrix.
These will ensure that businesses apply these strategies to obtain working
capital, finance capital expenditure and undertake future investments.
The next chapter will describes the research methodology adopted in the study,
the methods used in data collection and analysis in the study, the target
population, the sampling procedures and sample size of the study. The data
collection instruments used and issues pertaining to its validity and reliability and
the statistical techniques used to analyze the data during the study.

42
Chapter Three
Research methodology
3.0 Introduction
The purpose of the study was to assess or investigate the financing strategies
employed by small real estate firms in Zimbabwe. The study also sought to
establish the sources of finance, cost of finance, tenor of finance and uses of
finance used in the business. Recommendations were made regarding various
challenges facing the small to medium real estate firms as a result of financing
strategy assessment from the survey.
This chapter describes the research methodology, methods used in the study,
target population, sampling procedures and sample size of the study. The data
collection instruments used and issues pertaining to its validity and reliability and
the statistical techniques used to analyze the data during the study were
discussed. The study limitations and data analysis strategy will also be outlined
in this chapter. A quantitative methodology was adopted in the study and relevant
methods such as surveys and interviews using questionnaire and interview
guides were used to collect and analyze the data.
3.1 Research Methodologies
A research methodology is a plan of how the researcher will go about answering
the research question or questions, (Saunders, Lewis and Thornhill, 1997).
Easterby-Smith (2002) defines a research design or methodology as the overall
configuration of a piece of research. It is a model or framework applied in a
research project to illustrate relationships between important variables. It can
also be described as the theoretical paradigm used by the researcher in a study.
Saunders et al (1997) note that there are two approaches to research, positivism
and phenomenology. Two methodologies then arise from the definitions above
and these are quantitative methodology and qualitative methodology.
3.1.1 Quantitative Methodology
The quantitative methodology was predominantly used in this study. Quantitative
(positivist) study shows trends that explain phenomena that occur generally.

43
They communicate phenomena from within a sample that represent the wider
population. According to Westhizen and Abraham (2002), “its structure, process
and theoretical background offered the bases for the development and practice
of standards for the methods of the social sciences.” Cassell and Symon (1995,
p.2) states that, “the assumption behind the positivist paradigm is that there is an
objective truth existing in the world which can be revealed and measuring
relationships between variables systematically and statistically.”
The ideological basis of the school of thought are positivism, quantitativism and
behaviourism in nature and now being supported by advanced statistical models
such as statistical packages for social sciences (SPSS) and NU Dust. The
positivist paradigm argues that one should be able to explain phenomena in
terms of what causes the behaviour we observe. The cause and effect ideology
underpins the positivist methodology. Positivism prefers working with an
observable social reality and that the end product of such research can be law-
like generalizations similar to those produced by the physical and natural
scientists (Oppenheim, 1986). The positivist approach assumes an external
world determining behaviour strives for explanation, prediction, and control by
dividing into parts, and isolating them, mechanistic processes for explaining
social behaviour. The researcher will be very objective in his assessment. It only
allows the truth to be confined on empirical evidence; it is deductive and normally
uses quantitative data (Saunders et al, 1997).
The quantitative methodology has been chosen because it is able to statistically
analyse the relationships between variables and in the current study it is the
relationship that exist between financing strategies in small to medium real estate
firms.
3.1.2 Qualitative Methodology
The qualitative methodology (phenomenology) is done in the natural settings or
field of activities thus greater communication between researcher and
respondents. Process is communication based and flexible in the choice of
research instruments and research procedures. Phenomenology focuses on the
social process and how individuals interpret the social world. It is a research

44
approach where social reality is multiple, divergent and interrelated, analysis
from the actor’s own perspective, human behaviour is how people define their
own world and reality is the meaning attributed to experience and is not the same
for everyone (Shadish et al, 2002).
3.2 Research methods, instruments and tools.
For quantitative methodology, the methods used to collect data were surveys
combined with interviews and questionnaires and interview guides were used as
the main instruments or tools for this study. In-depth interviews with directors or
top management of small to medium sized real estate companies and the
secretary or chairperson of the Estate Agents Council of Zimbabwe provided
some useful information on financing strategies used by small to medium real
estate firms. Others issues such as: marketing strategies; access to markets and
competition; access to skills and technology; regulatory framework and
supporting infrastructures in place were briefly assessed in order to come up with
useful recommendations.
3.3 Study Population
Sekaran (2001:27) defines a population as “the entire group of people, events or
things of interest that the researcher wishes to investigate.” The study targeted
directors, managers and employees of small to medium sized real estate
companies operating in Harare, Zimbabwe. These were either individuals,
companies and even those banks or building societies that have ventured into in-
house property sales, management, valuation, auctioneering and development.
According to the database provided by the Estate Agents Council of Zimbabwe,
there are 227 companies operating in the sector as at 31 July 2013. The study
concentrated with 196 SME companies operating in Harare. Below is a table
showing the geographical distribution of real estate firms in Zimbabwe.
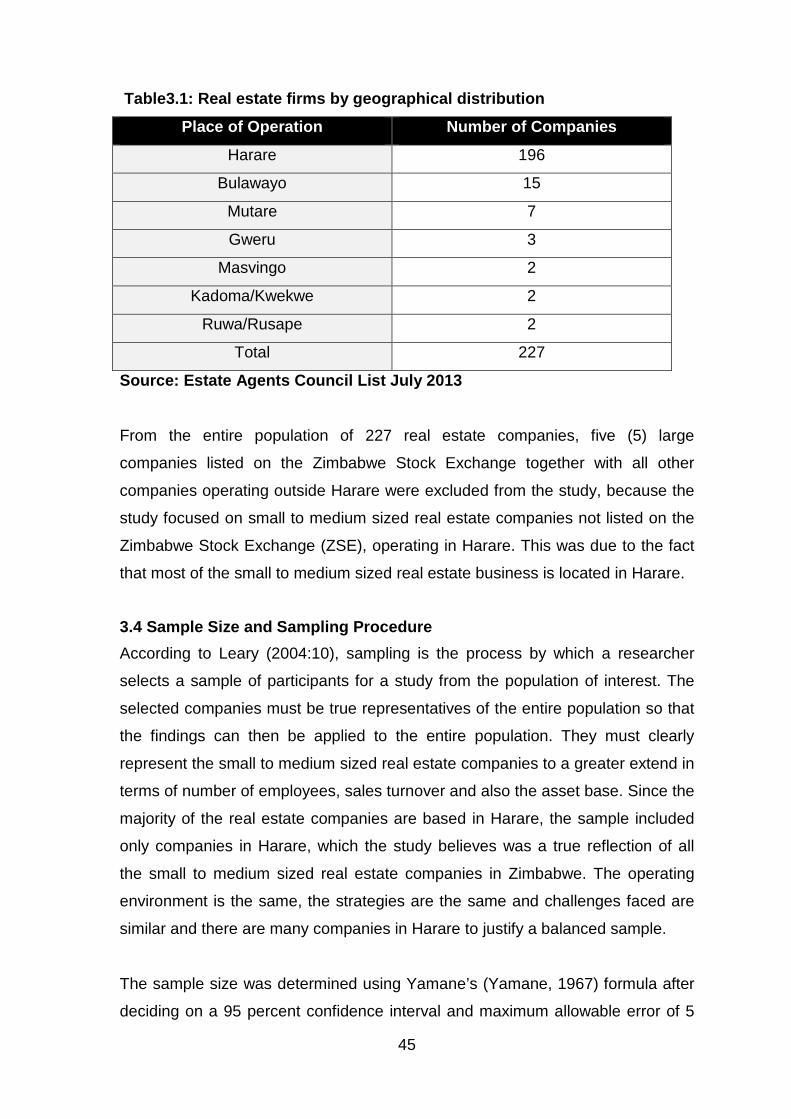
45
Table3.1: Real estate firms by geographical distrib ution
Place of Operation Number of Companies
Harare 196
Bulawayo 15
Mutare 7
Gweru 3
Masvingo 2
Kadoma/Kwekwe 2
Ruwa/Rusape 2
Total 227
Source: Estate Agents Council List July 2013
From the entire population of 227 real estate companies, five (5) large
companies listed on the Zimbabwe Stock Exchange together with all other
companies operating outside Harare were excluded from the study, because the
study focused on small to medium sized real estate companies not listed on the
Zimbabwe Stock Exchange (ZSE), operating in Harare. This was due to the fact
that most of the small to medium sized real estate business is located in Harare.
3.4 Sample Size and Sampling Procedure
According to Leary (2004:10), sampling is the process by which a researcher
selects a sample of participants for a study from the population of interest. The
selected companies must be true representatives of the entire population so that
the findings can then be applied to the entire population. They must clearly
represent the small to medium sized real estate companies to a greater extend in
terms of number of employees, sales turnover and also the asset base. Since the
majority of the real estate companies are based in Harare, the sample included
only companies in Harare, which the study believes was a true reflection of all
the small to medium sized real estate companies in Zimbabwe. The operating
environment is the same, the strategies are the same and challenges faced are
similar and there are many companies in Harare to justify a balanced sample.
The sample size was determined using Yamane’s (Yamane, 1967) formula after
deciding on a 95 percent confidence interval and maximum allowable error of 5
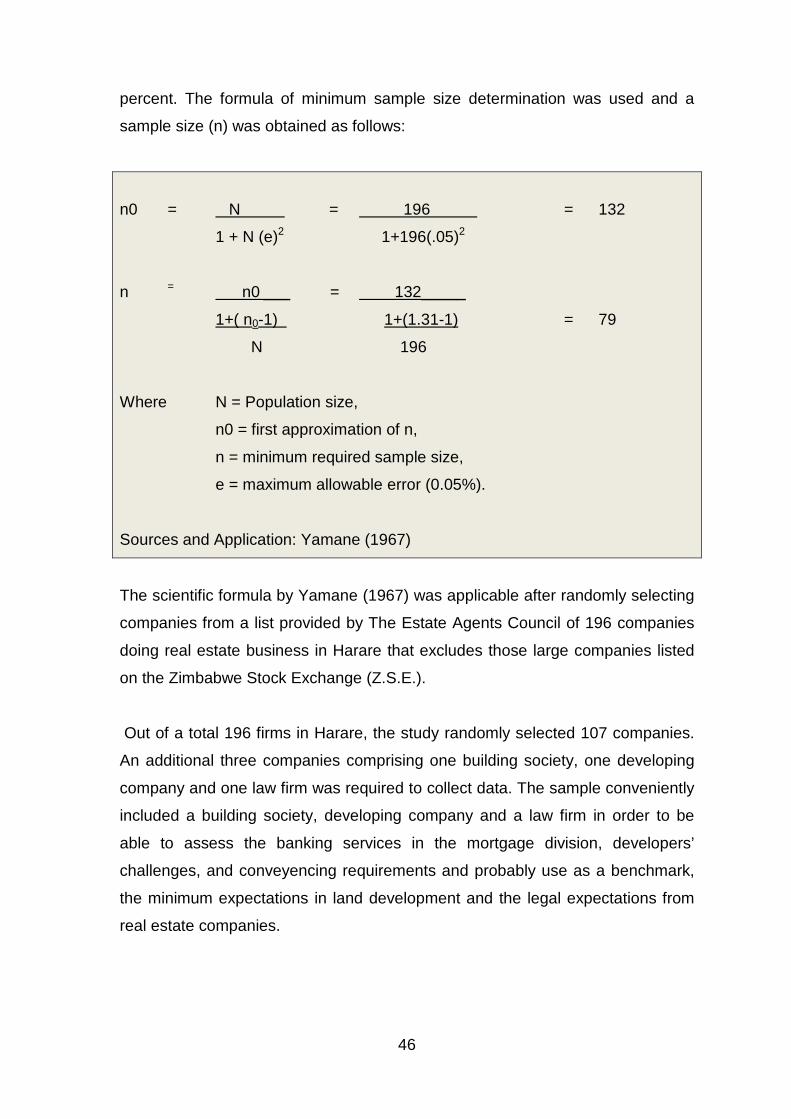
46
percent. The formula of minimum sample size determination was used and a
sample size (n) was obtained as follows:
n0 = N = 196 = 132
1 + N (e)2 1+196(.05)2
n = n0 ___ = 132_____
1+( n0-1) 1+(1.31-1) = 79 N 196
Where N = Population size,
n0 = first approximation of n,
n = minimum required sample size,
e = maximum allowable error (0.05%).
Sources and Application: Yamane (1967)
The scientific formula by Yamane (1967) was applicable after randomly selecting
companies from a list provided by The Estate Agents Council of 196 companies
doing real estate business in Harare that excludes those large companies listed
on the Zimbabwe Stock Exchange (Z.S.E.).
Out of a total 196 firms in Harare, the study randomly selected 107 companies.
An additional three companies comprising one building society, one developing
company and one law firm was required to collect data. The sample conveniently
included a building society, developing company and a law firm in order to be
able to assess the banking services in the mortgage division, developers’
challenges, and conveyencing requirements and probably use as a benchmark,
the minimum expectations in land development and the legal expectations from
real estate companies.
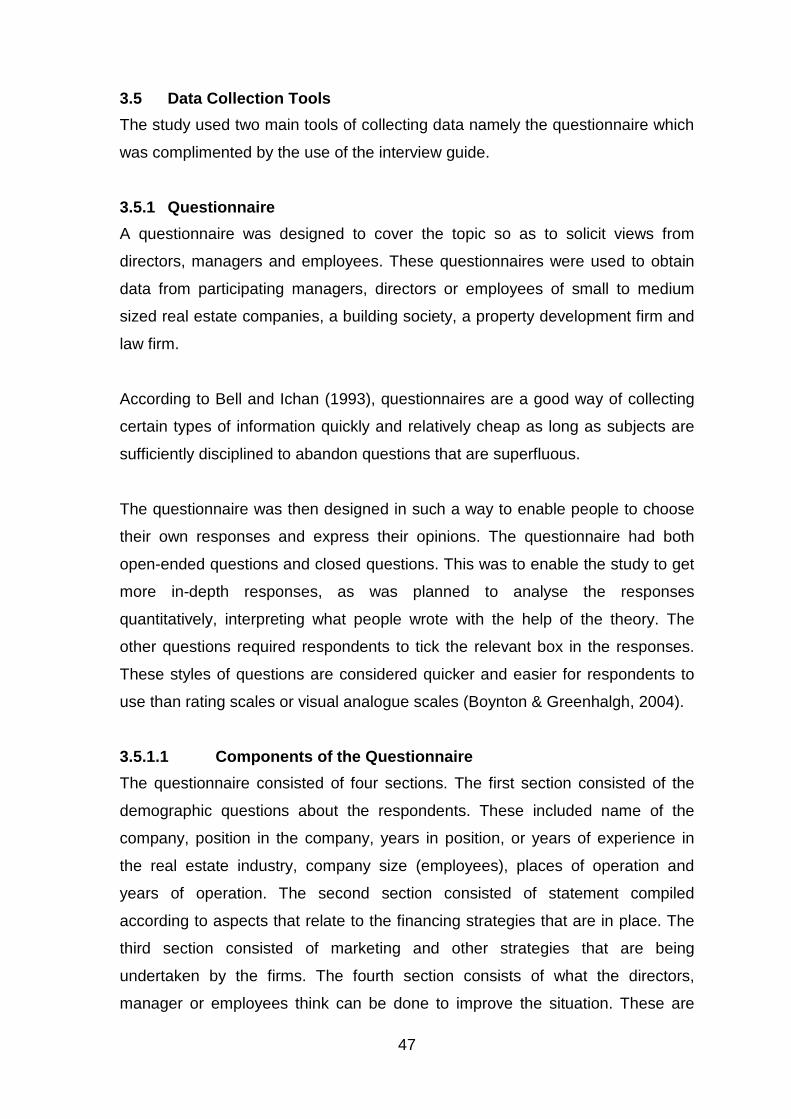
47
3.5 Data Collection Tools
The study used two main tools of collecting data namely the questionnaire which
was complimented by the use of the interview guide.
3.5.1 Questionnaire
A questionnaire was designed to cover the topic so as to solicit views from
directors, managers and employees. These questionnaires were used to obtain
data from participating managers, directors or employees of small to medium
sized real estate companies, a building society, a property development firm and
law firm.
According to Bell and Ichan (1993), questionnaires are a good way of collecting
certain types of information quickly and relatively cheap as long as subjects are
sufficiently disciplined to abandon questions that are superfluous.
The questionnaire was then designed in such a way to enable people to choose
their own responses and express their opinions. The questionnaire had both
open-ended questions and closed questions. This was to enable the study to get
more in-depth responses, as was planned to analyse the responses
quantitatively, interpreting what people wrote with the help of the theory. The
other questions required respondents to tick the relevant box in the responses.
These styles of questions are considered quicker and easier for respondents to
use than rating scales or visual analogue scales (Boynton & Greenhalgh, 2004).
3.5.1.1 Components of the Questionnaire
The questionnaire consisted of four sections. The first section consisted of the
demographic questions about the respondents. These included name of the
company, position in the company, years in position, or years of experience in
the real estate industry, company size (employees), places of operation and
years of operation. The second section consisted of statement compiled
according to aspects that relate to the financing strategies that are in place. The
third section consisted of marketing and other strategies that are being
undertaken by the firms. The fourth section consists of what the directors,
manager or employees think can be done to improve the situation. These are
48
other factors that the directors, senior management or employees are expected
to adopt in order to increase profitability and viability.
The questionnaire was pretested at three real estate companies to test this
research instrument. A pre-test is a trial run with a group of respondents, used to
find problems with the questionnaire design (Zigmund, 2003:209). Thereafter the
questionnaire was modified accordingly and used during survey and interviews
with the respondents.
Once the final version of the questionnaire was completed, the questionnaires
were then distributed to the respondents. Of the various method of questionnaire
distribution, the research team would have preferred to use the group method,
where the respondents are brought together to complete the questionnaires. The
method is inexpensive and has high response rate (Whityeley, 2002 p377).
However, envelops were used to cover the questionnaires and were addressed
and delivered by hand with signed cover letters, to make the questionnaire more
personal. Edwards et al (2001) argued that personalised questionnaires are
associated with a higher response rate.
In this study the questionnaires were physically distributed to the respondents.
The researcher got a database from 227 firms and extracted companies that are
operating in Harare in terms of their physical address and contact numbers. The
demographics were important in the final sampling process as the study targeted
small to medium real estate firms in Harare.
3.5.2 Interviews
According to Wegner, (1993), interviews solicit primary data responses through
direct questioning. It is the most common form of data collection in the field of
marketing and market research. However, Fraenkel and Wallen (1996) pointed
out that interviews consume time as compared to questionnaires. In this study,
interviews were done with key stakeholders in the sector.
The Registrar of the Estate Agents Council of Zimbabwe provided very detailed
data regarding the operation of real estate firms which was vital during the

49
conclusions and recommendations in chapter four and five. The conveyencing
firm and the property developer also provided the other challenges being
experienced by the small to medium sized firms.
3.6 Validity of Data
“Validity relates to the extent to which a measure, indicator or method of data
collection possesses the quality of being sound or true as far as can be judged”
(Jary & Jary, 1995:p714).
In this study validity and reliability was observed by adapting tools which have
been successfully used before. Validity and reliability was also enhanced through
pre-testing the questionnaire in the pilot study. Factors affecting reliability like
clarity, specificity of items on the questionnaire and the length of the
questionnaire were considered. Items were made as simple as possible and to
the point. For validity, pre-testing helped to ensure the thoroughness and
completeness of the questionnaire and the follow-up interview schedules.
3.7 Study Limitations
These will be discussed in the final chapter. However it is important to highlight at
this stage that use of questionnaire has its own limitations.
3.8 Data Analysis
“Data processing begins with data editing and coding and data analysis is a
process of inspecting, cleaning, transforming, and modelling data with the goal of
highlighting useful information, suggesting conclusions, and supporting decision
making” (Zigmund, 2003:73). Once the questionnaires were picked they were
screened for anomalies. The questionnaires were then coded with numbers
assigned to each. The data was processed by using a statistical package called
statistical package for social sciences (SPSS).
3.9 Ethical Consideration
The research was done in line with ethical guidelines to ensure that participation
was voluntary, no harm or risk to accrue to participants, participants were also to
derive some benefits from participating, privacy and confidentiality was
50
guaranteed as participants’ identity were anonymous. Richardson and Godfrey
(2003); Saunders et al (2007) and Sekeran (2001) highly recommend the ethical
approach in data collection. The study was done in a way that none of the
participating organisations and that of the University of Zimbabwe were to be
harmed. The directors, managers and employees were free to participate or not
to participate. The responses were kept as confidential as possible and no
names were asked for the respondents to avoid intimidation of managers or
employees.
3.10 Chapter Conclusion
The chapter has restated the study objectives of assessing the financing
strategies, discussed the research methodology (quantitative) used in the study,
stated the reason for choice of methodology, has reviewed concepts and
literature regarding study population, sampling techniques, research methods
and research instruments, data collection and analysis techniques. Ethical
Considerations were highly considered in the process and the chapter concluded
by highlighting the research limitations.

51
Chapter Four
Presentation of Findings
4.0 Introduction The study sought to assess the financing strategies implemented by SME real
estate firms in Zimbabwe during the liquidity constrained period. Secondly, to
establish the sources and structure of finance, cost of finance, tenor of finance
and uses of finance used in the business. Data was gathered from managers of
the firms or their owners or directors. The findings and conclusions of the study
are presented in this chapter. The findings are presented in the sequence of the
research instrument questions. The presentation format firstly highlights the
question asked in the questionnaire; explains the purpose of the question;
presents findings of the study as they are; deduces the meaning or implications
of the findings and then discusses these.
4.1 Response rate
A total of 79 questionnaires out of 110 questionnaires distributed were returned,
represents a response rate of 72%. This response rate is high enough to warrant
validity and reliability of the research findings.
Table 4.1: Response rate
Details of participants
Questionnaire s sent
Questionnaire s responded
Response rate
Management 50 36 72%
Owners 60 43 72%
Total 110 79 72%
4.2 Demographics Responses
A summary of the respondents obtained from owners and managers of small to
medium sized firms is outlined in table 4.2 below. These responses provided very
useful insights into the financing strategies, marketing strategies and other
business challenges faced by the firms. The majority of the firms are owner
managed with less than 5 years in the industry
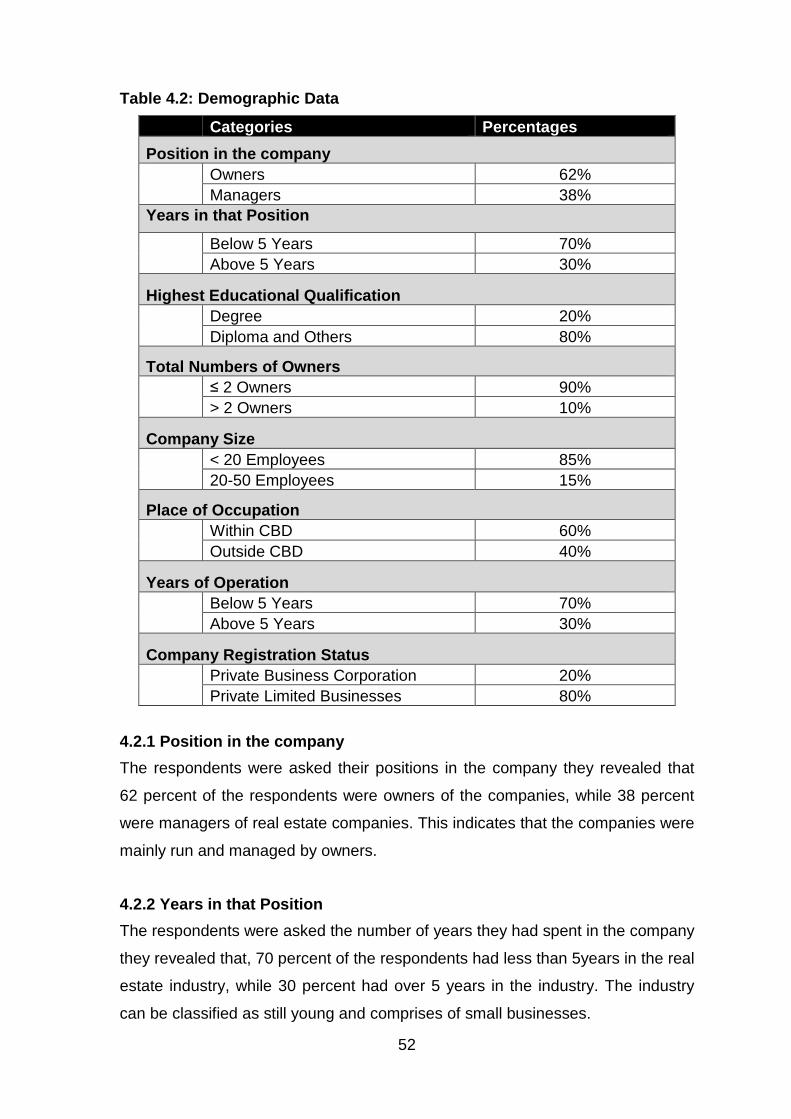
52
Table 4.2: Demographic Data
Categories Percentages
Position in the company Owners 62% Managers 38%
Years in that Position
Below 5 Years 70% Above 5 Years 30%
Highest Educational Qualification Degree 20% Diploma and Others 80%
Total Numbers of Owners ≤ 2 Owners 90% > 2 Owners 10%
Company Size < 20 Employees 85% 20-50 Employees 15%
Place of Occupation Within CBD 60% Outside CBD 40%
Years of Operation Below 5 Years 70% Above 5 Years 30%
Company Registration Status Private Business Corporation 20% Private Limited Businesses 80%
4.2.1 Position in the company
The respondents were asked their positions in the company they revealed that
62 percent of the respondents were owners of the companies, while 38 percent
were managers of real estate companies. This indicates that the companies were
mainly run and managed by owners.
4.2.2 Years in that Position
The respondents were asked the number of years they had spent in the company
they revealed that, 70 percent of the respondents had less than 5years in the real
estate industry, while 30 percent had over 5 years in the industry. The industry
can be classified as still young and comprises of small businesses.
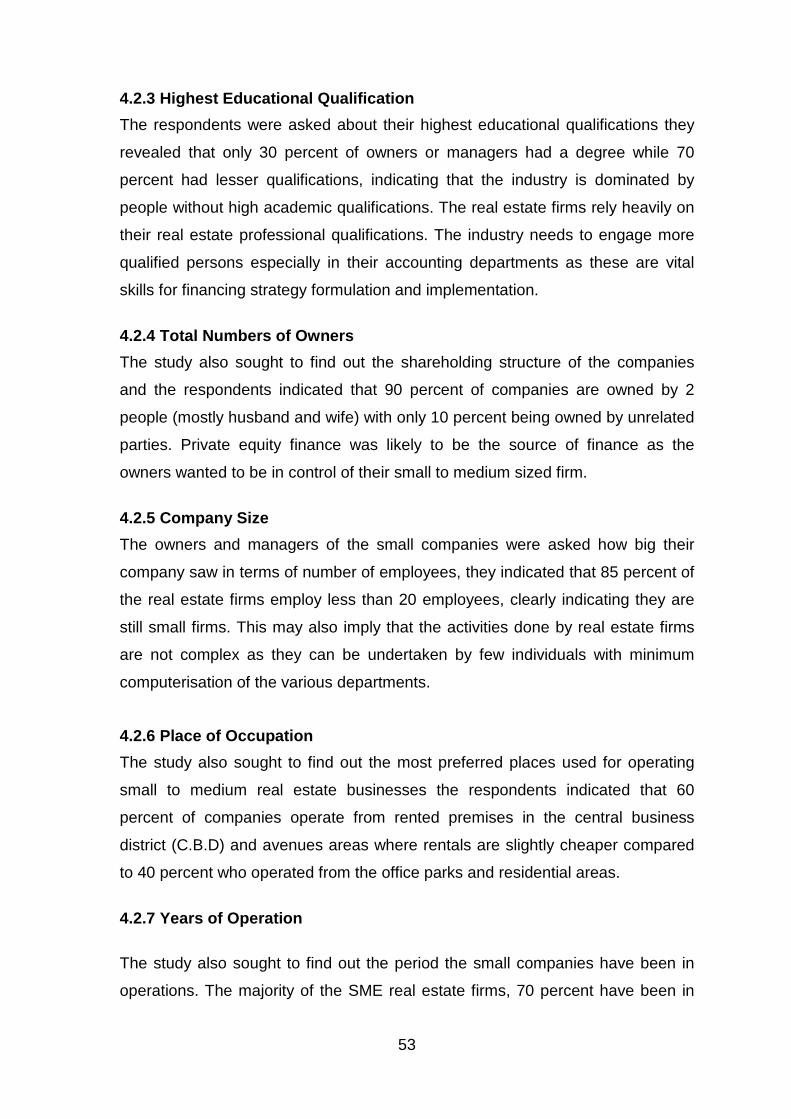
53
4.2.3 Highest Educational Qualification
The respondents were asked about their highest educational qualifications they
revealed that only 30 percent of owners or managers had a degree while 70
percent had lesser qualifications, indicating that the industry is dominated by
people without high academic qualifications. The real estate firms rely heavily on
their real estate professional qualifications. The industry needs to engage more
qualified persons especially in their accounting departments as these are vital
skills for financing strategy formulation and implementation.
4.2.4 Total Numbers of Owners
The study also sought to find out the shareholding structure of the companies
and the respondents indicated that 90 percent of companies are owned by 2
people (mostly husband and wife) with only 10 percent being owned by unrelated
parties. Private equity finance was likely to be the source of finance as the
owners wanted to be in control of their small to medium sized firm.
4.2.5 Company Size
The owners and managers of the small companies were asked how big their
company saw in terms of number of employees, they indicated that 85 percent of
the real estate firms employ less than 20 employees, clearly indicating they are
still small firms. This may also imply that the activities done by real estate firms
are not complex as they can be undertaken by few individuals with minimum
computerisation of the various departments.
4.2.6 Place of Occupation
The study also sought to find out the most preferred places used for operating
small to medium real estate businesses the respondents indicated that 60
percent of companies operate from rented premises in the central business
district (C.B.D) and avenues areas where rentals are slightly cheaper compared
to 40 percent who operated from the office parks and residential areas.
4.2.7 Years of Operation
The study also sought to find out the period the small companies have been in
operations. The majority of the SME real estate firms, 70 percent have been in
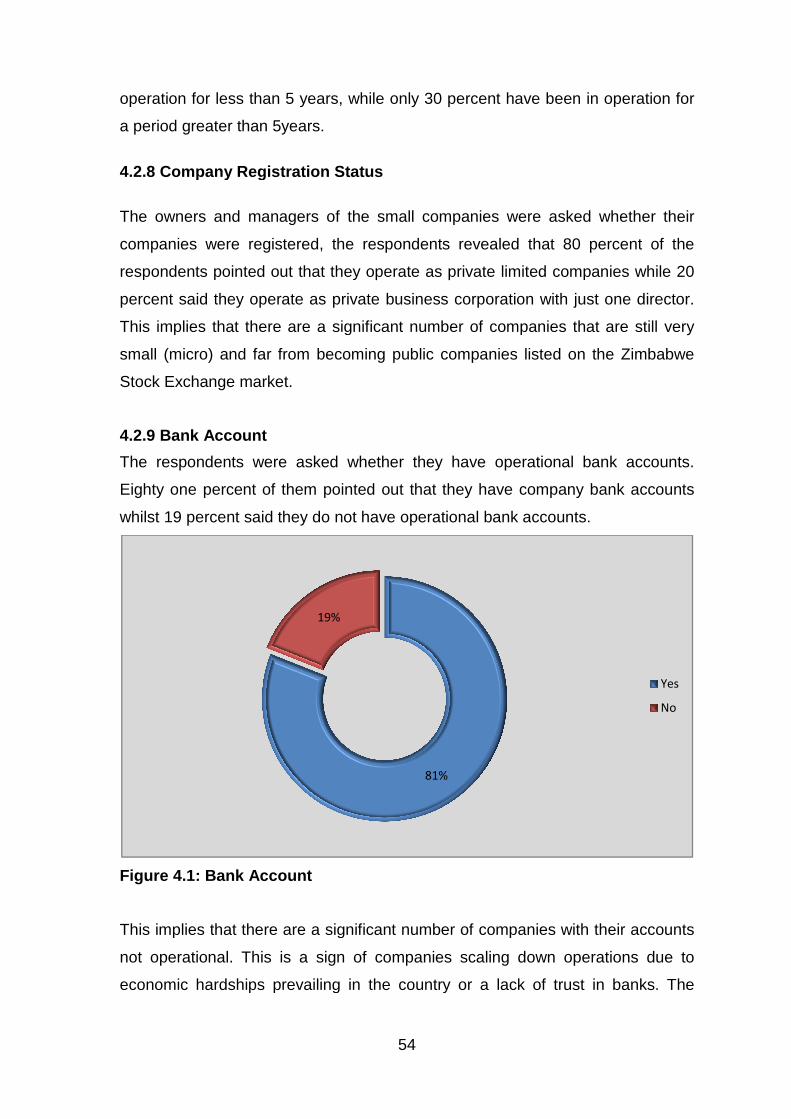
operation for less than 5 years
a period greater than 5years.
4.2.8 Company Registration Status
The owners and managers of the small companies were asked whether their
companies were registered,
respondents pointed out that they
percent said they operate as private business
This implies that there are a significant number of companies
small (micro) and far from becoming
Stock Exchange market.
4.2.9 Bank Account
The respondents were asked whether they have operational bank accounts
Eighty one percent of them pointed out that they have company bank accounts
whilst 19 percent said they do not have operational bank a
Figure 4.1 : Bank Account
This implies that there are a significant number of companies with their accounts
not operational. This is a sign of companies
economic hardships prevailing in the country or a lack of tru
54
operation for less than 5 years, while only 30 percent have been in operation for
r than 5years.
Company Registration Status
The owners and managers of the small companies were asked whether their
companies were registered, the respondents revealed that 80
respondents pointed out that they operate as private limited companies
operate as private business corporation with just one director.
This implies that there are a significant number of companies
and far from becoming public companies listed on the Z
market.
The respondents were asked whether they have operational bank accounts
percent of them pointed out that they have company bank accounts
whilst 19 percent said they do not have operational bank accounts.
: Bank Account
This implies that there are a significant number of companies with their accounts
not operational. This is a sign of companies scaling down operations due to
economic hardships prevailing in the country or a lack of trust in banks.
81%
19%
have been in operation for
The owners and managers of the small companies were asked whether their
revealed that 80 percent of the
ed companies while 20
with just one director.
This implies that there are a significant number of companies that are still very
listed on the Zimbabwe
The respondents were asked whether they have operational bank accounts.
percent of them pointed out that they have company bank accounts
ccounts.
This implies that there are a significant number of companies with their accounts
down operations due to
st in banks. The
Yes
No
55
implication of this analysis is that only 19 percent of the small to medium firms do
their transaction through the formal bank sector.
4.2.10 Accounting System
The respondents were asked whether they have a manual or computerised
accounting system and they revealed that 60 percent of the participating
companies have their accounting system operating on manual whilst 40 percent
have it computerized. This generally shows that most of the real estate firms do
not have computerized systems running their accounts as they try to reduce
operation costs. The firms also lack skills to operate the accounting packages.
4.3 Financing Strategies
The respondents were asked to explain the financing strategies that they used
and they said that various strategies as detailed below. About 67 percent of
respondents said they used less than US$5000.00 to start their business and
most of it was from own savings. Those who got loan from banks were charged
an average interest rate of 15 percent with an average duration of 4 years.
4.3.1 Start-up Finance of Business
The respondents were asked to explain how much they had used to start their
real estate business and 67 percent of respondents said they used an amount
less than US$5000.00, 28 percent had used amount above US$5000.00 but
below US$10 000.00 and only 5 % to had used an amount above US$10 000.00
to start their business. This shows that the majority of organisations in this sector
are small and that they do not need a lot of capital to start their business

Figure 4.2 : Amount to start Business
It is interesting to note that venture capital funds are not interested in providing
the small amounts of funding sought by many small enterprises. Cress
found that fewer than one percent of
venture capitalists with larger start
funding. In the case of Zimbabwe, real estate firms do not use venture capital as
it requires formalised business operations with operational bank
computerised accounting system.
4.3.2 Source of your financing start
The respondents were asked to explain the source of start up financing of their
real estate business and 39 percent of respondents said they used their own
savings while 28percent used bank loans and 20percent managed to get some
lease financing. This implies that until such a time when real estate firms have
established relationship with banks, they preferred to use own resources. Banks
on the other hand consid
during their early years of trading.
0%
10%
20%
30%
40%
50%
60%
70%
Capital<$5000
67%
56
: Amount to start Business
It is interesting to note that venture capital funds are not interested in providing
the small amounts of funding sought by many small enterprises. Cress
found that fewer than one percent of UK start-ups had financial input from
venture capitalists with larger start-ups being more likely to use venture capital
In the case of Zimbabwe, real estate firms do not use venture capital as
it requires formalised business operations with operational bank
computerised accounting system.
2 Source of your financing start -up of company
The respondents were asked to explain the source of start up financing of their
real estate business and 39 percent of respondents said they used their own
ings while 28percent used bank loans and 20percent managed to get some
lease financing. This implies that until such a time when real estate firms have
established relationship with banks, they preferred to use own resources. Banks
on the other hand consider small firms as too risk financing
during their early years of trading.
Capital<$5000 Capital>$5000 Capital>$10 000
28%
5%
It is interesting to note that venture capital funds are not interested in providing
the small amounts of funding sought by many small enterprises. Cressy (1993)
had financial input from
ups being more likely to use venture capital
In the case of Zimbabwe, real estate firms do not use venture capital as
it requires formalised business operations with operational bank accounts and
The respondents were asked to explain the source of start up financing of their
real estate business and 39 percent of respondents said they used their own
ings while 28percent used bank loans and 20percent managed to get some
lease financing. This implies that until such a time when real estate firms have
established relationship with banks, they preferred to use own resources. Banks
financing their operations
Capital>$10 000
Figure 4.3: Source of financing start
KPMG Consulting, (2002) pointed out that SMEs may also prefer debt to equity
when seeking external funding bec
and other sources of debt finance and a wide variety of debt products are
available.
The own source or private equity is supported by López et al, (2006), the
categories of finance for SME growing into large co
resources from entrepreneur, venture capital, loan and debt and finally equity
finance as the company grows to finance working capital, capital expenditure and
investment finance.
For the 28 percent who used bank loans to start their bus
on to investigate the amounts of loans which they got from banks.
0% 5%
Own Savings
Bank Loan
Lease finance
Others
57
financing start -up of company
KPMG Consulting, (2002) pointed out that SMEs may also prefer debt to equity
when seeking external funding because they are much more familiar with banks
and other sources of debt finance and a wide variety of debt products are
The own source or private equity is supported by López et al, (2006), the
categories of finance for SME growing into large companies were: Own
resources from entrepreneur, venture capital, loan and debt and finally equity
finance as the company grows to finance working capital, capital expenditure and
who used bank loans to start their businesses, the
on to investigate the amounts of loans which they got from banks.
5% 10% 15% 20% 25% 30%
28%
20%
13%
KPMG Consulting, (2002) pointed out that SMEs may also prefer debt to equity
ause they are much more familiar with banks
and other sources of debt finance and a wide variety of debt products are
The own source or private equity is supported by López et al, (2006), the
mpanies were: Own
resources from entrepreneur, venture capital, loan and debt and finally equity
finance as the company grows to finance working capital, capital expenditure and
inesses, the study went
on to investigate the amounts of loans which they got from banks.
35% 40%
39%
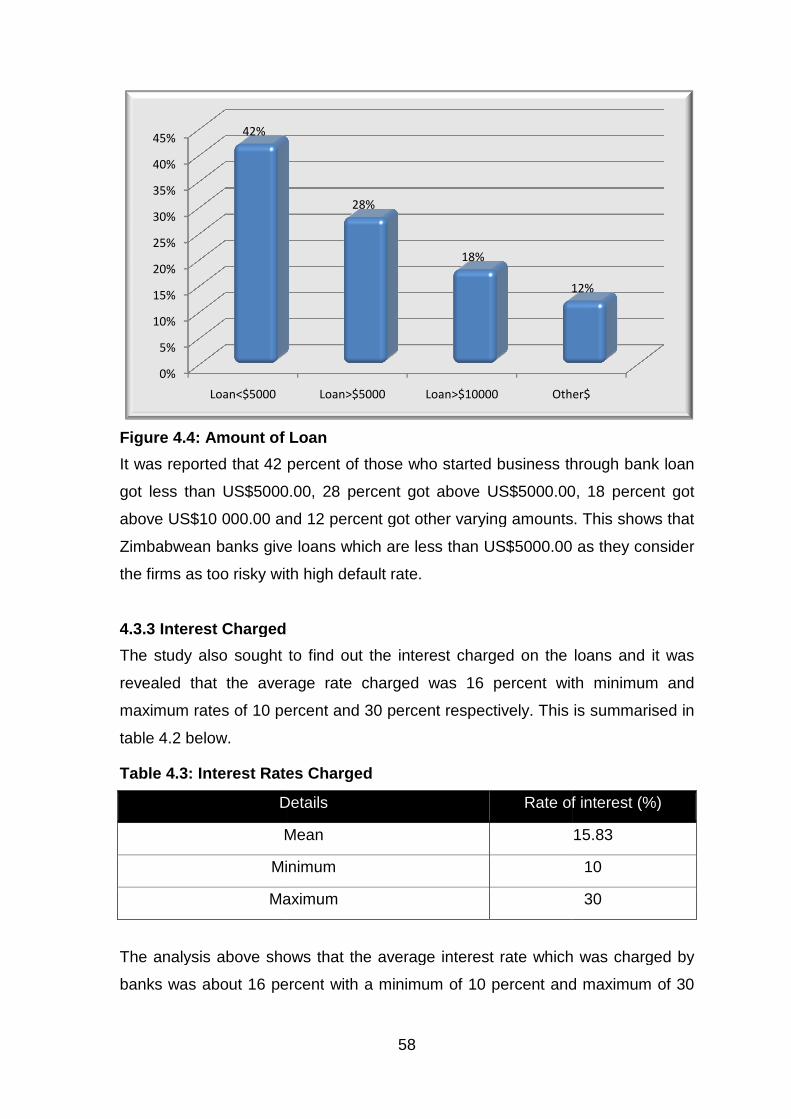
Figure 4.4 : Amount of Loan
It was reported that 42
got less than US$5000
above US$10 000.00 and 12
Zimbabwean banks give loans which are less than US$
the firms as too risky with high default rate
4.3.3 Interest Charged
The study also sought to find out the interest charged on the loans and it was
revealed that the average rate charged was 16 percent with minimum and
maximum rates of 10 percent and 30 percent respectively. This is
table 4.2 below.
Table 4.3: Interest Ra tes
Details
Mean
Minimum
Maximum
The analysis above shows that the average interest rate which was charged by
banks was about 16 percent
0%
5%
10%
15%
20%
25%
30%
35%
40%
45%
Loan<$5000
42%
58
: Amount of Loan
percent of those who started business through bank loan
5000.00, 28 percent got above US$5000.00, 18
and 12 percent got other varying amounts. This shows that
ve loans which are less than US$5000.00 as they consider
the firms as too risky with high default rate.
Interest Charged
so sought to find out the interest charged on the loans and it was
revealed that the average rate charged was 16 percent with minimum and
maximum rates of 10 percent and 30 percent respectively. This is
tes Charged
Details Rate of interest (%)
Mean
Minimum
Maximum
The analysis above shows that the average interest rate which was charged by
percent with a minimum of 10 percent and maximum of 30
Loan>$5000 Loan>$10000 Other$
28%
18%
12%
of those who started business through bank loan
00, 18 percent got
got other varying amounts. This shows that
.00 as they consider
so sought to find out the interest charged on the loans and it was
revealed that the average rate charged was 16 percent with minimum and
maximum rates of 10 percent and 30 percent respectively. This is summarised in
Rate of interest (%)
15.83
10
30
The analysis above shows that the average interest rate which was charged by
and maximum of 30
Other$
12%
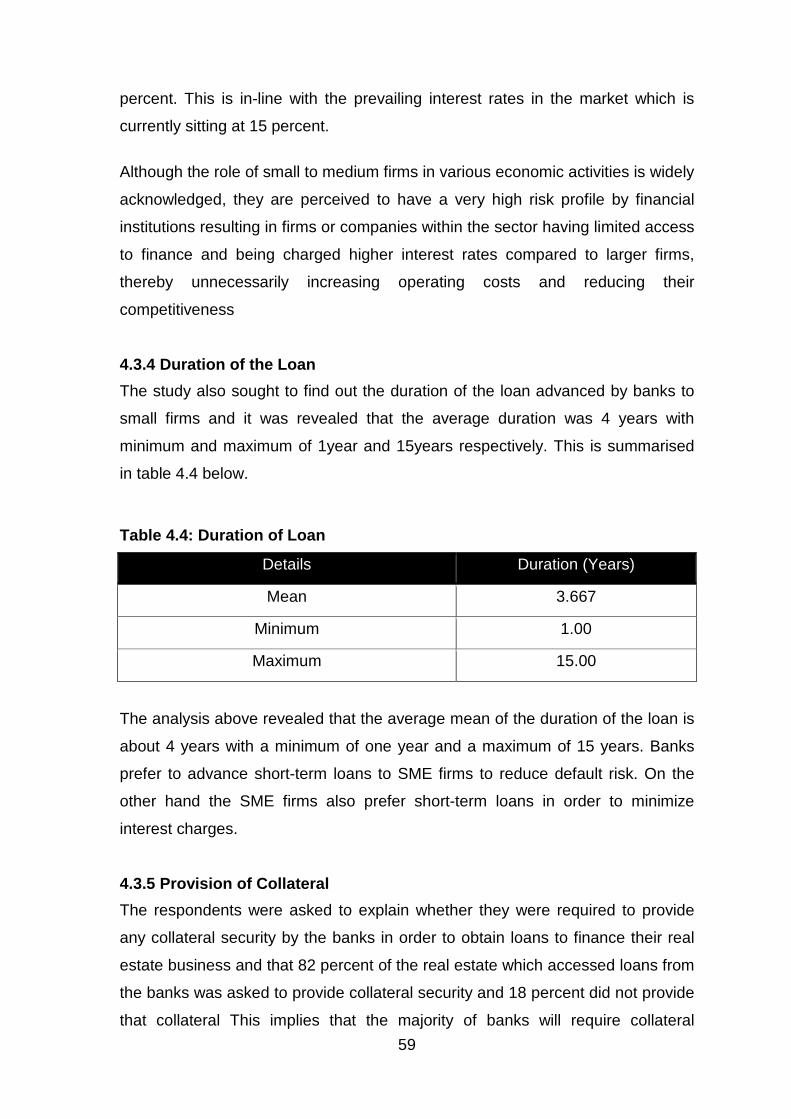
59
percent. This is in-line with the prevailing interest rates in the market which is
currently sitting at 15 percent.
Although the role of small to medium firms in various economic activities is widely
acknowledged, they are perceived to have a very high risk profile by financial
institutions resulting in firms or companies within the sector having limited access
to finance and being charged higher interest rates compared to larger firms,
thereby unnecessarily increasing operating costs and reducing their
competitiveness
4.3.4 Duration of the Loan
The study also sought to find out the duration of the loan advanced by banks to
small firms and it was revealed that the average duration was 4 years with
minimum and maximum of 1year and 15years respectively. This is summarised
in table 4.4 below.
Table 4.4: Duration of Loan
Details Duration (Years)
Mean 3.667
Minimum 1.00
Maximum 15.00
The analysis above revealed that the average mean of the duration of the loan is
about 4 years with a minimum of one year and a maximum of 15 years. Banks
prefer to advance short-term loans to SME firms to reduce default risk. On the
other hand the SME firms also prefer short-term loans in order to minimize
interest charges.
4.3.5 Provision of Collateral
The respondents were asked to explain whether they were required to provide
any collateral security by the banks in order to obtain loans to finance their real
estate business and that 82 percent of the real estate which accessed loans from
the banks was asked to provide collateral security and 18 percent did not provide
that collateral This implies that the majority of banks will require collateral
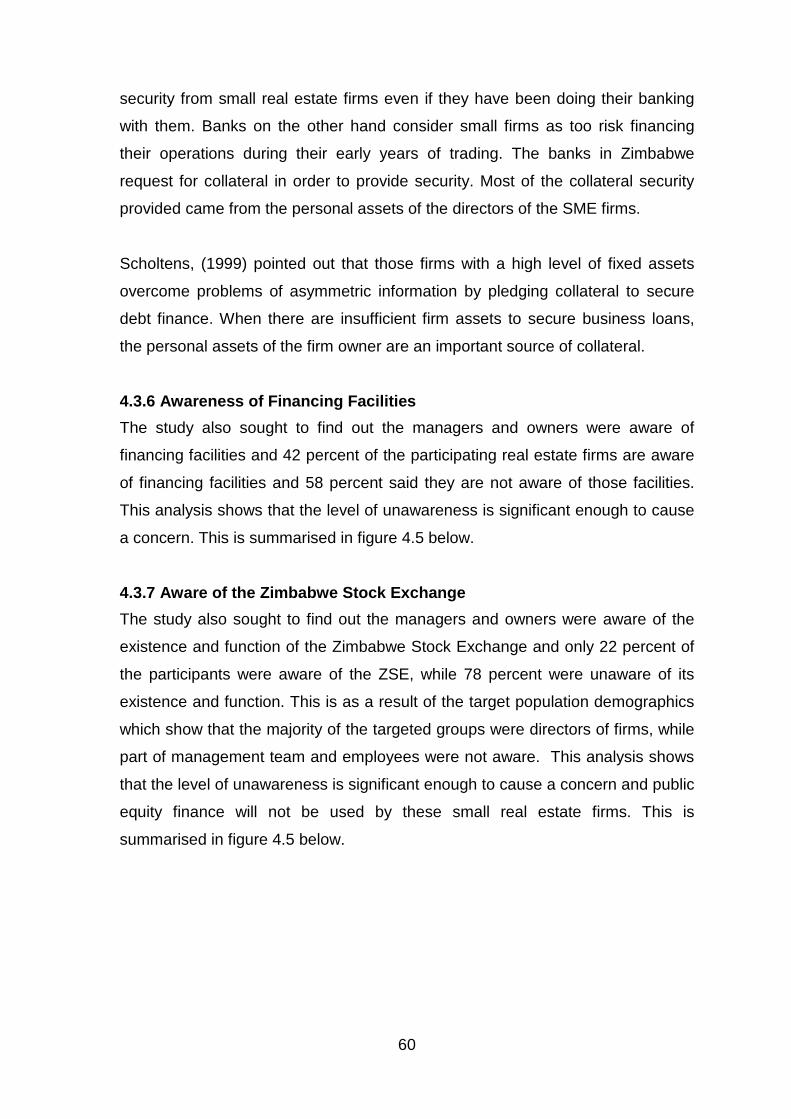
60
security from small real estate firms even if they have been doing their banking
with them. Banks on the other hand consider small firms as too risk financing
their operations during their early years of trading. The banks in Zimbabwe
request for collateral in order to provide security. Most of the collateral security
provided came from the personal assets of the directors of the SME firms.
Scholtens, (1999) pointed out that those firms with a high level of fixed assets
overcome problems of asymmetric information by pledging collateral to secure
debt finance. When there are insufficient firm assets to secure business loans,
the personal assets of the firm owner are an important source of collateral.
4.3.6 Awareness of Financing Facilities
The study also sought to find out the managers and owners were aware of
financing facilities and 42 percent of the participating real estate firms are aware
of financing facilities and 58 percent said they are not aware of those facilities.
This analysis shows that the level of unawareness is significant enough to cause
a concern. This is summarised in figure 4.5 below.
4.3.7 Aware of the Zimbabwe Stock Exchange
The study also sought to find out the managers and owners were aware of the
existence and function of the Zimbabwe Stock Exchange and only 22 percent of
the participants were aware of the ZSE, while 78 percent were unaware of its
existence and function. This is as a result of the target population demographics
which show that the majority of the targeted groups were directors of firms, while
part of management team and employees were not aware. This analysis shows
that the level of unawareness is significant enough to cause a concern and public
equity finance will not be used by these small real estate firms. This is
summarised in figure 4.5 below.

Figure 4.5 : Awareness of ZSE
4.3.8 Plan to List on the ZSE
The study also sought to find out
had plans to list on the Zimbabwe Stock Exchange and shows that 85
the participants do not have any plans of listing on the ZSE as opposed to only
15 percent who had the plans to list on the stock exchange.
closely own and control their real estate firms especially if they are the registered
estate agents as the issue of tr
properly done by the owner. Figure 4.
diagrammatically.
Figure 4.6 : Plan to List on the ZSE
0
20
40
60
80
100
YES
61
: Awareness of ZSE
.8 Plan to List on the ZSE
The study also sought to find out from the managers and owners whether they
had plans to list on the Zimbabwe Stock Exchange and shows that 85
the participants do not have any plans of listing on the ZSE as opposed to only
who had the plans to list on the stock exchange. Owners preferred
closely own and control their real estate firms especially if they are the registered
s the issue of trust account control is crucial and can only be
properly done by the owner. Figure 4.6 below illustrate the findings
: Plan to List on the ZSE
22%
78%
YES NO
YES NO
15
85
owners whether they
had plans to list on the Zimbabwe Stock Exchange and shows that 85 percent of
the participants do not have any plans of listing on the ZSE as opposed to only
Owners preferred to
closely own and control their real estate firms especially if they are the registered
t account control is crucial and can only be
below illustrate the findings

4.4 Working Capital Financing
The study also sought to find out the managers and owners had r
material or financial support to finance your day to day operations
Figure 4.7 : Financial and Material Sup
Figure 4.7 above shows that 58
survey indicated that they did not receive any material or financial support to
finance day to day and 42
results are consistent with the figure 4.
were used to start the real estate companies operating in Zimbabwe.
Sawy, Malhotra, Gosain and Young, (1999) indicated that f
expansion is likely to require resort to ext
theory indicates that their preference will be for debt rather than equity capital.
0%
10%
20%
30%
40%
50%
60%
62
Working Capital Financing The study also sought to find out the managers and owners had r
material or financial support to finance your day to day operations
: Financial and Material Sup port
above shows that 58 percent of the real estate participating in the
survey indicated that they did not receive any material or financial support to
finance day to day and 42 percent said they got some form of assistance. These
e consistent with the figure 4.3 which shows the sources of funds which
were used to start the real estate companies operating in Zimbabwe.
Sawy, Malhotra, Gosain and Young, (1999) indicated that f
expansion is likely to require resort to external financing and the pecking order
theory indicates that their preference will be for debt rather than equity capital.
No
Yes
58%
42%
The study also sought to find out the managers and owners had received any
material or financial support to finance your day to day operations.
of the real estate participating in the
survey indicated that they did not receive any material or financial support to
said they got some form of assistance. These
which shows the sources of funds which
were used to start the real estate companies operating in Zimbabwe.
Sawy, Malhotra, Gosain and Young, (1999) indicated that funding their
ernal financing and the pecking order
theory indicates that their preference will be for debt rather than equity capital.
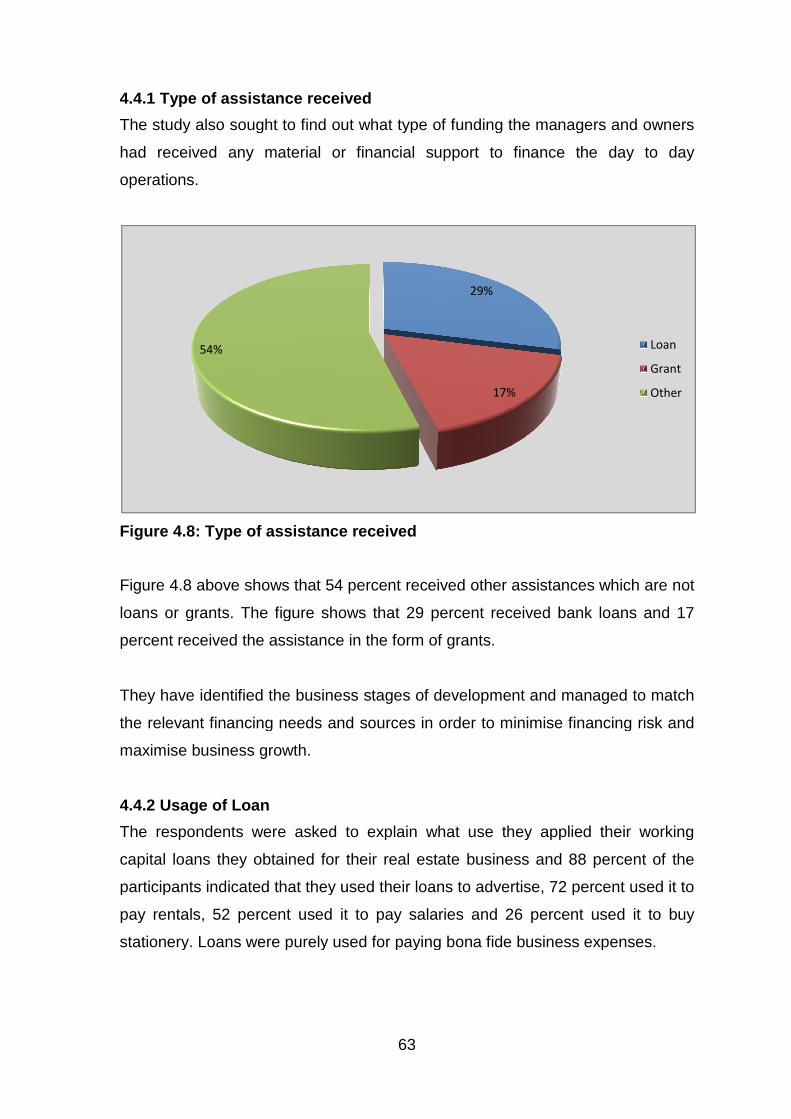
4.4.1 Type of assistance received
The study also sought to find out what type of funding the managers and owners
had received any mat
operations.
Figure 4.8 : Type of assistance received
Figure 4.8 above shows that 54
loans or grants. The figure shows that 29
percent received the assistance in the form of grants.
They have identified the business stages of development and managed to match
the relevant financing needs and sources in order to minimise financing risk and
maximise business growth.
4.4.2 Usage of Loan
The respondents were asked to explain wh
capital loans they obtained for
participants indicated that they used their loans to advertise, 72
pay rentals, 52 percent
stationery. Loans were purely used for paying bona fide business expenses.
54%
63
Type of assistance received The study also sought to find out what type of funding the managers and owners
had received any material or financial support to finance the day to day
: Type of assistance received
above shows that 54 percent received other assistances which are not
loans or grants. The figure shows that 29 percent received bank lo
received the assistance in the form of grants.
They have identified the business stages of development and managed to match
the relevant financing needs and sources in order to minimise financing risk and
maximise business growth.
The respondents were asked to explain what use they applied their working
capital loans they obtained for their real estate business and 88
participants indicated that they used their loans to advertise, 72 percent
percent used it to pay salaries and 26 percent
stationery. Loans were purely used for paying bona fide business expenses.
29%
17%
The study also sought to find out what type of funding the managers and owners
erial or financial support to finance the day to day
received other assistances which are not
received bank loans and 17
They have identified the business stages of development and managed to match
the relevant financing needs and sources in order to minimise financing risk and
at use they applied their working
and 88 percent of the
percent used it to
percent used it to buy
stationery. Loans were purely used for paying bona fide business expenses.
Loan
Grant
Other
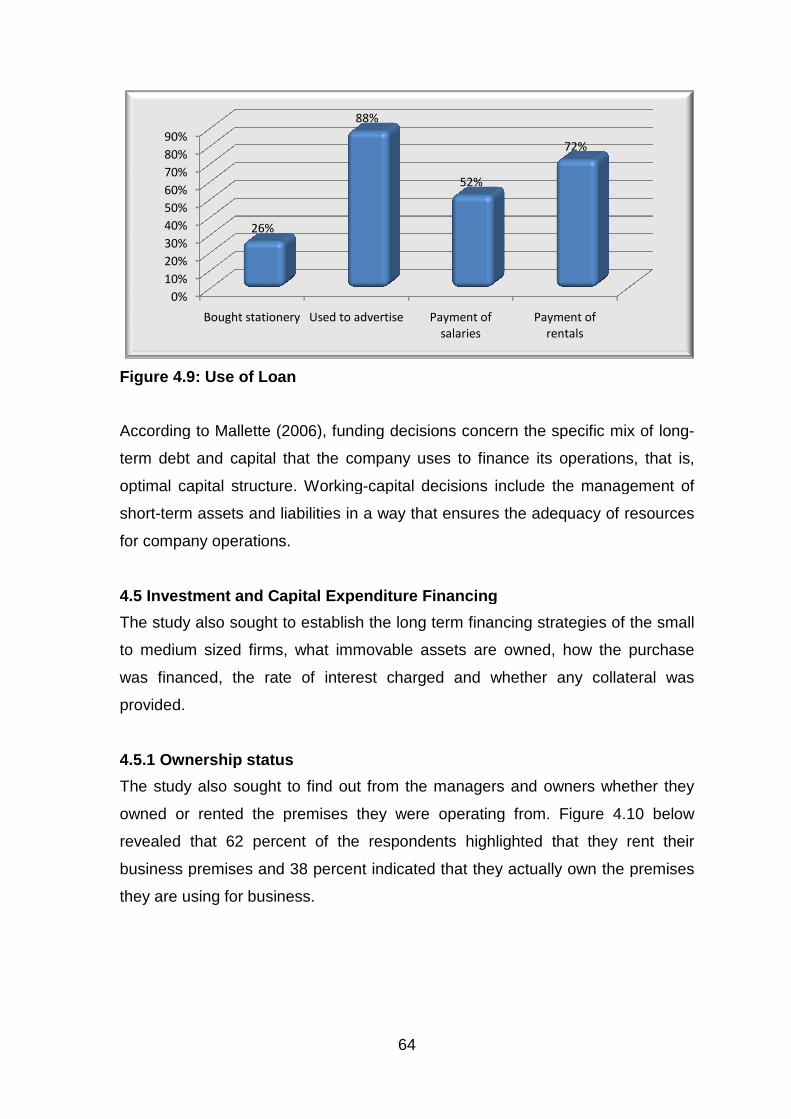
Figure 4.9 : Use of Loan
According to Mallette (2006), funding decisions concern the specific mix o
term debt and capital that the company uses to finance its operations,
optimal capital structure. Working
short-term assets and liabilities in a way that ensures the adequacy of resources
for company operations.
4.5 Investment and Capital Expenditure Financing
The study also sought to es
to medium sized firms, what immovable assets are owned
was financed, the rate of interest
provided.
4.5.1 Ownership status
The study also sought to find out from the managers and owners whether they
owned or rented the premises they were operating from. Figure 4.1
revealed that 62 percent
business premises and 38
they are using for business.
0%
10%
20%
30%
40%
50%
60%
70%
80%
90%
Bought stationery
26%
64
: Use of Loan
According to Mallette (2006), funding decisions concern the specific mix o
term debt and capital that the company uses to finance its operations,
optimal capital structure. Working-capital decisions include the management of
term assets and liabilities in a way that ensures the adequacy of resources
any operations.
Investment and Capital Expenditure Financing
The study also sought to establish the long term financing strategies of the small
to medium sized firms, what immovable assets are owned, how the purchase
was financed, the rate of interest charged and whether any collateral was
Ownership status
The study also sought to find out from the managers and owners whether they
owned or rented the premises they were operating from. Figure 4.1
percent of the respondents highlighted that they rent their
business premises and 38 percent indicated that they actually own the premises
they are using for business.
Bought stationery Used to advertise Payment of
salaries
Payment of
rentals
88%
52%
72%
According to Mallette (2006), funding decisions concern the specific mix of long-
term debt and capital that the company uses to finance its operations, that is,
capital decisions include the management of
term assets and liabilities in a way that ensures the adequacy of resources
tablish the long term financing strategies of the small
how the purchase
and whether any collateral was
The study also sought to find out from the managers and owners whether they
owned or rented the premises they were operating from. Figure 4.10 below
respondents highlighted that they rent their
indicated that they actually own the premises
Payment of
rentals
72%

65
Figure 4.10: Ownership status
This implies that despite the fact that the small to medium sized firms’ core
business was immovable property; the majority of them could not afford to buy
their own business properties.
4.5.2 Loan Received
The study also sought to find out from the managers and owners of those who
owned the premises they were operating from, the amount of long-term funding.
Figure 4.11 below summarises the responses.
Figure 4.11: Loan Received
38%
62%
Own
Rent
64%
28%
8%
Loan<$50 000
Loan>$50 000
Loan>$100 000
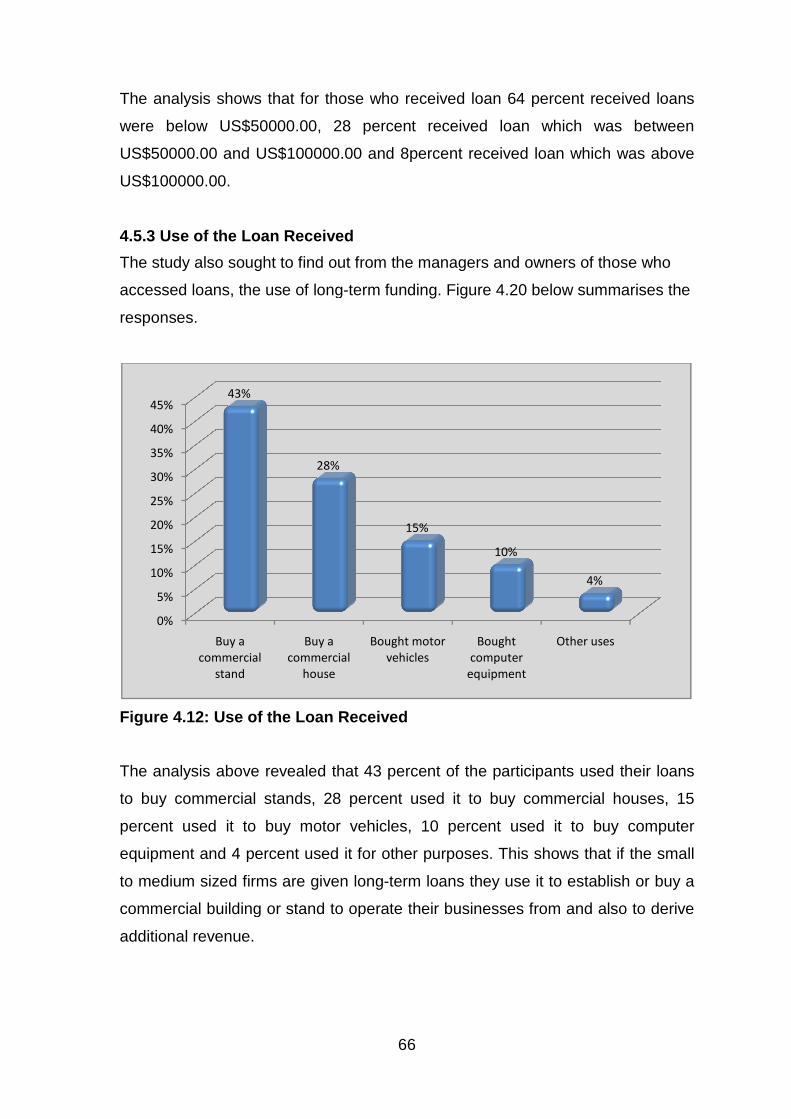
The analysis shows that for those who received loan 64
were below US$50000
US$50000.00 and US$
US$100000.00.
4.5.3 Use of the Loan Received
The study also sought to find out from the managers and owners of those who
accessed loans, the use of long
responses.
Figure 4.12 : Use of the Loan Received
The analysis above revealed that 43
to buy commercial stands, 28
percent used it to buy m
equipment and 4 percent
to medium sized firms are given long
commercial building or stand to operate the
additional revenue.
0%
5%
10%
15%
20%
25%
30%
35%
40%
45%
Buy a
commercial
stand
43%
66
The analysis shows that for those who received loan 64 percent
50000.00, 28 percent received loan which was be
.00 and US$100000.00 and 8percent received loan which was above
Use of the Loan Received
The study also sought to find out from the managers and owners of those who
accessed loans, the use of long-term funding. Figure 4.20 below summarises the
: Use of the Loan Received
The analysis above revealed that 43 percent of the participants used their loans
to buy commercial stands, 28 percent used it to buy commercial houses, 15
used it to buy motor vehicles, 10 percent used it to buy computer
percent used it for other purposes. This shows that if
to medium sized firms are given long-term loans they use it to establish or buy a
commercial building or stand to operate their businesses from and also to derive
Buy a
commercial
house
Bought motor
vehicles
Bought
computer
equipment
Other uses
28%
15%
10%
percent received loans
eived loan which was between
eceived loan which was above
The study also sought to find out from the managers and owners of those who
20 below summarises the
of the participants used their loans
used it to buy commercial houses, 15
used it to buy computer
This shows that if the small
term loans they use it to establish or buy a
ir businesses from and also to derive
Other uses
4%
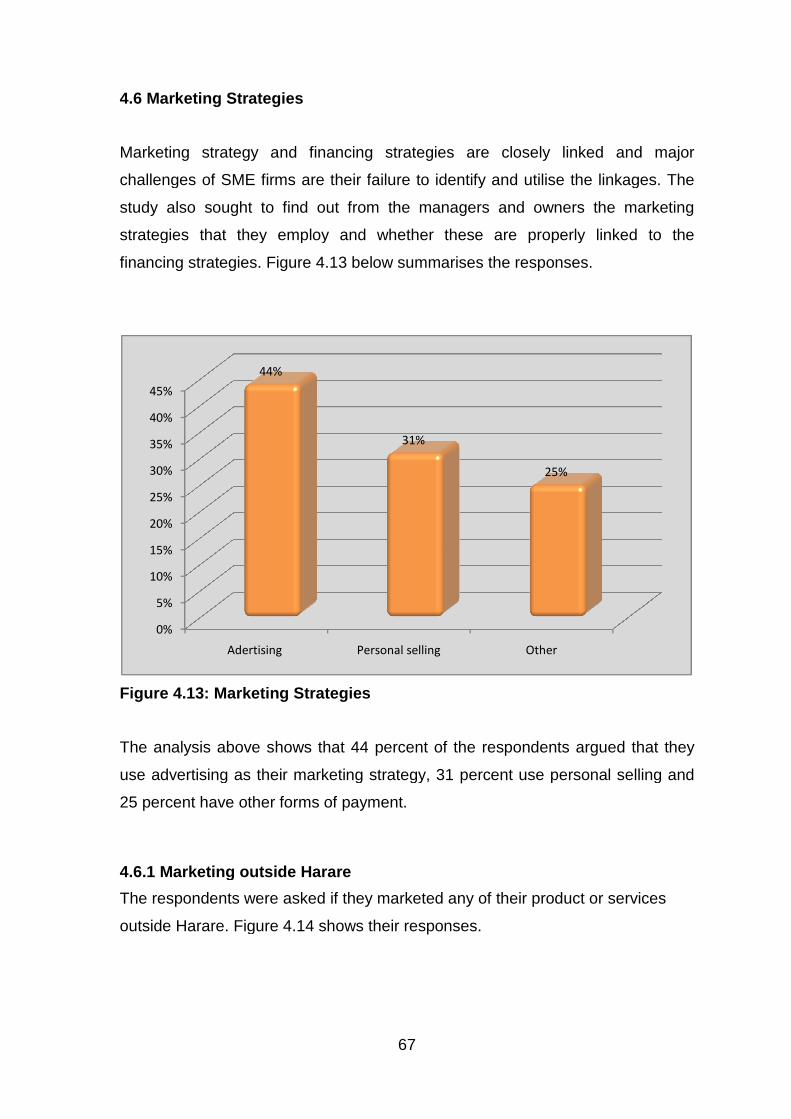
4.6 Marketing Strategies
Marketing strategy and financing strategies are closely linked and major
challenges of SME firms are their failure to identify and utilise the linkages.
study also sought to find out from the managers and owners the marketing
strategies that they employ and whether these are properly linked to the
financing strategies. Figure 4.
Figure 4.13 : Marketing Strategies
The analysis above shows that 44
use advertising as their marketing strategy, 31
25 percent have other forms of payment.
4.6.1 Marketing outside Harare
The respondents were asked
outside Harare. Figure 4.
0%
5%
10%
15%
20%
25%
30%
35%
40%
45%
Adertising
44%
67
Marketing Strategies
Marketing strategy and financing strategies are closely linked and major
challenges of SME firms are their failure to identify and utilise the linkages.
ought to find out from the managers and owners the marketing
strategies that they employ and whether these are properly linked to the
financing strategies. Figure 4.13 below summarises the responses.
: Marketing Strategies
ve shows that 44 percent of the respondents argued that they
use advertising as their marketing strategy, 31 percent use personal selling and
have other forms of payment.
Marketing outside Harare
The respondents were asked if they marketed any of their product or
Harare. Figure 4.14 shows their responses.
Personal selling Other
31%
25%
Marketing strategy and financing strategies are closely linked and major
challenges of SME firms are their failure to identify and utilise the linkages. The
ought to find out from the managers and owners the marketing
strategies that they employ and whether these are properly linked to the
below summarises the responses.
of the respondents argued that they
use personal selling and
ted any of their product or services
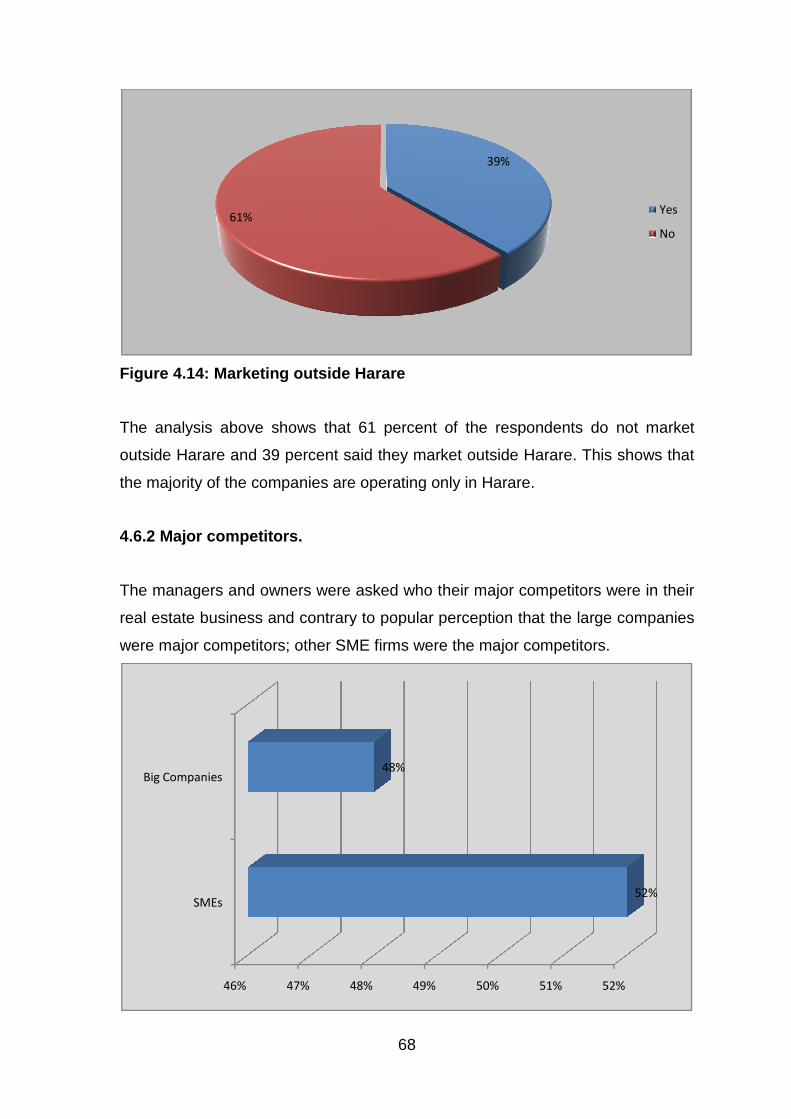
Figure 4.14 : Marketing outside Harare
The analysis above shows that 61
outside Harare and 39 percent
the majority of the companies are operating only in Harare.
4.6.2 Major competitors.
The managers and owners were asked who their major competitors were in their
real estate business and contrary to popular perception that the
were major competitors;
61%
46%
SMEs
Big Companies
68
: Marketing outside Harare
The analysis above shows that 61 percent of the respondents do not market
percent said they market outside Harare. This shows that
the majority of the companies are operating only in Harare.
.2 Major competitors.
The managers and owners were asked who their major competitors were in their
business and contrary to popular perception that the
competitors; other SME firms were the major competitors.
39%
47% 48% 49% 50% 51%
48%
of the respondents do not market
e Harare. This shows that
The managers and owners were asked who their major competitors were in their
business and contrary to popular perception that the large companies
other SME firms were the major competitors.
Yes
No
52%
52%

Figure 4.15 : Major Competitors
The Figure 4.15 shows
competition from SMEs and 48
big companies such as Old Mutual Properties, Pearl Properties, Zimre Property
Holdings, and Dawn Properties, listed on the Zimbabwe Stock Exchange.
4.7 Performance Indicators
The study also sought to find out from the managers and owners of
estate firms how their companies were perfo
joining the rapidly growing real estate industry.
the responses.
4.7.1 Performance of SMEs
Figure 4.16 : Performance
Figure 4.16 above shows
organisations have been performing very poorly, 29
performing poorly and 9
also shows that 8 percent
percent said it was good. This generally shows that the performance which has
been coming from small real estate firms has been poor
are low.
0%
5%
10%
15%
20%
25%
30%
35%
40%
Very good
8%
69
: Major Competitors
shows that 52 percent of the respondents are experiencing
competition from SMEs and 48 percent are experiencing the competi
big companies such as Old Mutual Properties, Pearl Properties, Zimre Property
Holdings, and Dawn Properties, listed on the Zimbabwe Stock Exchange.
Performance Indicators
The study also sought to find out from the managers and owners of
estate firms how their companies were performing as many companies were
joining the rapidly growing real estate industry. Figure 4.16 below summarises
.1 Performance of SMEs
: Performance
above shows that 39 percent of the respondents indicated that their
organisations have been performing very poorly, 29 percent
performing poorly and 9 percent were not sure about the performance. The figure
percent said they experienced very good performance and 15
said it was good. This generally shows that the performance which has
been coming from small real estate firms has been poor and growth prospects
Good Not sure Poor Very Poor
15%
9%
29%
of the respondents are experiencing
are experiencing the competition from the
big companies such as Old Mutual Properties, Pearl Properties, Zimre Property
Holdings, and Dawn Properties, listed on the Zimbabwe Stock Exchange.
The study also sought to find out from the managers and owners of the real
ming as many companies were
below summarises
of the respondents indicated that their
percent have been
were not sure about the performance. The figure
y good performance and 15
said it was good. This generally shows that the performance which has
and growth prospects
Very Poor
39%
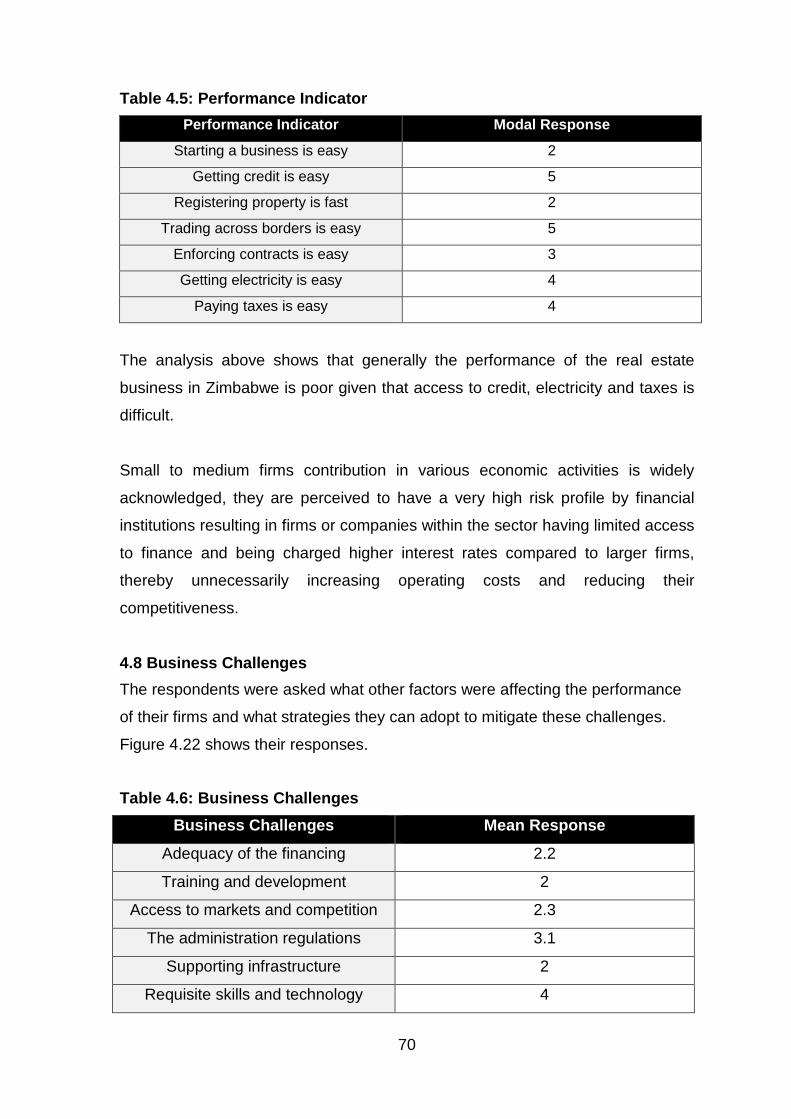
70
Table 4.5: Performance Indicator
Performance Indicator Modal Res ponse
Starting a business is easy 2
Getting credit is easy 5
Registering property is fast 2
Trading across borders is easy 5
Enforcing contracts is easy 3
Getting electricity is easy 4
Paying taxes is easy 4
The analysis above shows that generally the performance of the real estate
business in Zimbabwe is poor given that access to credit, electricity and taxes is
difficult.
Small to medium firms contribution in various economic activities is widely
acknowledged, they are perceived to have a very high risk profile by financial
institutions resulting in firms or companies within the sector having limited access
to finance and being charged higher interest rates compared to larger firms,
thereby unnecessarily increasing operating costs and reducing their
competitiveness.
4.8 Business Challenges
The respondents were asked what other factors were affecting the performance
of their firms and what strategies they can adopt to mitigate these challenges.
Figure 4.22 shows their responses.
Table 4.6: Business Challenges
Business Challenges Mean Response
Adequacy of the financing 2.2
Training and development 2
Access to markets and competition 2.3
The administration regulations 3.1
Supporting infrastructure 2
Requisite skills and technology 4

71
The analysis above shows that small to medium real estate companies were
adversely affected by the inadequacy of financing, marketing strategies, access
to markets and competition, lack of training and development and supporting
infrastructure. The analysis also shows that the issue of skills availability did not
adversely affect real estate business in Zimbabwe.
Strategies that can be adopted in the sector to increase business viability in light
of liquidity constraints are presented in the next chapter.
4.9 Conclusion
This chapter has analysed the demographic background of SME real estate firms
and results show that the majority if the firms are owner managed by founding
directors. The sources of funding used to start up, pay working capital expenses
and other long-term requirements is internally generated with minimum bank
loans, micro financing and venture capital. The directors are aware of the
existence of the Zimbabwe stock exchange and the huge potential available if
they access the capital markets but they are just not yet prepared to have their
shareholding diluted. Their marketing strategy is still limited to advertising and
personal selling, in Harare, of their real estate products. The owners have also
highlighted other challenges they face due to the macro environment, business
environment and industry competitive environment.

72
Chapter Five
Conclusions and Recommendations
5.0 Introduction The study sought to assess the financing strategies implemented by SME real
estate firms in Zimbabwe during the liquidity constrained period. This chapter
provides the conclusions and recommendations based on the research findings
and discussions from the preceding chapter. Data was gathered from owners
and management. The conclusions and recommendations of the study are
presented in this chapter. The conclusions are presented in the sequence of the
research instrument questions. The presentation format highlights the question
asked in the questionnaire, explains the purpose of the question; presents
conclusions from the study as they are and make recommendations.
The rest of this chapter comprises of three major sections. These sections are:
the conclusions from study findings; specific and general recommendations to be
adopted by SME real estate firms and other SMEs in general and areas of further
study.
5.1 Conclusions
Lack of financing strategies negatively affects the SME activities in real estate
business and many other SME activities in general. There are other challenges
faced by SME firms but are centered on financing strategies. SME firms lack
financial intelligence to operate firms even where funding is provided. In view of
the challenges faced in accessing funding, firms should strive to operate using
own resources or internal resources before looking for external financing.
SME firms lack proper knowledge of financing requirements at every stage of
business growth resulting in firms borrowing long to finance short term working
capital requirements. They have also used short term finance to buy capital items
or do long-term investments resulting in them failing to meet their repayment
obligations. Some business funds were also used to finance personal or non core
business activities.

73
SME firms should try to access cheap funding from government facilities or other
facilities that are availed through the normal banking systems. They can also
make use of private equity funds, venture capital finance or cheap funds from
renaissance funds or insurance companies.
Since the listing minimum requirements of the Zimbabwe Stock Exchange are
too high, SME firms need to approach the relevant authority to establish an
alternative investment market (A.I.M) where they can easily list and obtain the
much needed capital and unlock their business potential.
Besides lack of financing strategies, SMEs need to develop strategies for
international competitiveness and programs encouraging business growth using
appropriate technology and proper corporate governance culture.
In light of the above, further research on stakeholder collaboration (within the
framework of improving SME access to finance) is proposed. Further research
should be directed at investigating the impact of stakeholder collaboration
initiatives, different stakeholder collaboration models and approaches, and the
participatory experiences of various stakeholders involved in these initiatives.
SMEs in the real estate business used less that US$5000.00 to start up their
businesses. It was concluded that, they do not need a lot of capital to start their
business; own savings is the main source of funding for SMEs operating in this
sector. Other sources were concluded to be loans or debt from banks; equity;
retained income; leasing or hire purchase and factoring.
The study concluded that SMEs have got varying amounts of loans to start their
businesses which start from USD5000.00 to USD10000.00. The study concluded
that small to medium are perceived to have a very high risk profile by financial
institutions resulting in firms or companies within the sector having limited access
to finance.
The study found that the majority of real estate firms which accessed loans from
the banks were asked to provide collateral security. When there are insufficient
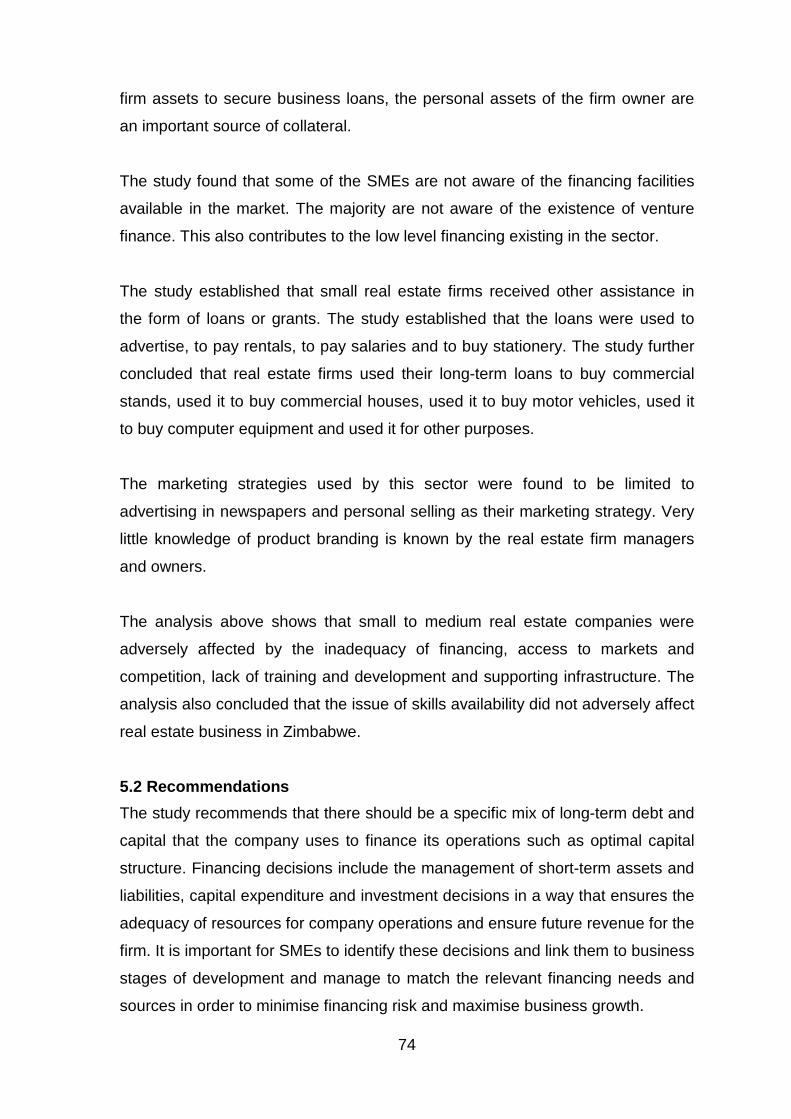
74
firm assets to secure business loans, the personal assets of the firm owner are
an important source of collateral.
The study found that some of the SMEs are not aware of the financing facilities
available in the market. The majority are not aware of the existence of venture
finance. This also contributes to the low level financing existing in the sector.
The study established that small real estate firms received other assistance in
the form of loans or grants. The study established that the loans were used to
advertise, to pay rentals, to pay salaries and to buy stationery. The study further
concluded that real estate firms used their long-term loans to buy commercial
stands, used it to buy commercial houses, used it to buy motor vehicles, used it
to buy computer equipment and used it for other purposes.
The marketing strategies used by this sector were found to be limited to
advertising in newspapers and personal selling as their marketing strategy. Very
little knowledge of product branding is known by the real estate firm managers
and owners.
The analysis above shows that small to medium real estate companies were
adversely affected by the inadequacy of financing, access to markets and
competition, lack of training and development and supporting infrastructure. The
analysis also concluded that the issue of skills availability did not adversely affect
real estate business in Zimbabwe.
5.2 Recommendations
The study recommends that there should be a specific mix of long-term debt and
capital that the company uses to finance its operations such as optimal capital
structure. Financing decisions include the management of short-term assets and
liabilities, capital expenditure and investment decisions in a way that ensures the
adequacy of resources for company operations and ensure future revenue for the
firm. It is important for SMEs to identify these decisions and link them to business
stages of development and manage to match the relevant financing needs and
sources in order to minimise financing risk and maximise business growth.

75
It is recommended that SME real estate firms must ensure that their financing
strategies and marketing strategy are closely linked and major challenges of
SME firms are their failure to identify and utilise these linkages. The study
recommends that SME’s failures can be successfully managed with financial
strategies developed and implemented by the organization.
The study recommends that SMEs must consider debt to equity when seeking
external funding because they are much more familiar with banks and other
sources of debt finance and a wide variety of debt products are available. Public
equity is difficult to obtain as the listing requirements are too numerous and to
high for small to medium real estate firms.
The study recommends that since financing strategy is the major plan of action
an organization prepares in response to, or anticipation of, changes in its
external environment, it must be fully implemented as this strategy helps to
achieve and maintain business competitiveness. These financing strategies are
the goals, patterns or alternatives designed to improve and optimize financial
management in order to achieve corporate results.
The following strategies or best models were recommended for adoption by SME
real estate firms in order to improve their access to finance. These
recommendations need to be adopted by the SME real estate firms if they are to
survive in the current conditions. These recommendations include:
• Proper financing and marketing strategies formulation;
• Increase skills, technology, training and development;
• Improve information dissemination;
• Strengthening business associations,
• Promote business monitoring and development services;
• Greater access to market and avoid competition;
5.2.1 Proper financing and marketing strategies for mulation
Proper strategies that are suitable to every stage of business development must
be adopted. Since the majority of SMEs are still in their introductory and growth
76
stages, their business risk is still high so they need to minimise their finance risk
by using cheap equity funding and more venture financing and retained income.
Limited or no dividend payments should be made to shareholders. Issuing of
debentures should be avoided as the fixed interest payments can reduce the
cash-flows of a company and may result in liquidation in event of failure to repay.
The use or issue of ordinary shares with discretionary dividend payment and no
legal recourse should be promoted.
5.2.2 Acquisition of skills, technology, training a nd development
According to Schlogl (2004) small sized firms failed to improve the basic
infrastructure like expanding broadband and secure servers. These factors have
impacts on the small sized firms to turn to e-business approach. One of the main
reasons is cost. In addition, the SMEs frequently cannot afford or find qualified e-
business staff to operate the business.
These major impediments for smaller firms simply lengthen the usual problems
relating to trust, traction security and, crucially concerns about violations of
intellectual property rights. Therefore, HRD is the solutions for training the staff to
be more equipped with knowledge and skills on handling e-business.
In the current development, changes in the environment such as globalization,
political, social, economic and technological occurred surrounding the
organizations. The changes in environment pose a challenge to the SMEs, which
limits their abilities to maintain their position against larger organizations.
Accordingly Snell and Lau (1994) found that more management competencies
are required for growth in small organization compared to larger organizations. In
this situation, small organization failed to develop skills, knowledge and
competencies among workers in the small organization. This is mainly because
of financial constraints and insufficient training. According to Gupta and Cawthon
(1996) argued that small organization especially managers required the most
training. Therefore, training is an essential tool for developing employees and the
organizations.

77
5.2.3 Improve information dissemination
Regulatory burdens remain a major obstacle for SMEs as these firms tend to be
poorly equipped to deal with the problems arising from regulations. Access to
information about regulations should be made available to SMEs at minimum
cost. Policy makers must ensure that the compliance procedures associated
with, research and development (R & D) and new technology are not
unnecessarily costly, complex or lengthy.
Transparency is of particular importance to SMEs, and information technology
has great potential to narrow the information gap. It would be of great help to set
up a “one-stop-shop system”, where all the necessary information which affects
firm strategies and decisions is made available in one place, as exists already in
some countries.
Regulation is said to have occurred when a government exerts control over the
activity of individuals and firms. It may also be defined as a government action to
manipulate prices, quantities and the quality of products. Regulation provides the
means by which government can manage the economy to achieve sustainable
social and economic outcomes. It also serves as a means of protecting and
assisting small businesses. However, for regulation to have the greatest impact
possible, it should be based on careful estimates of the cost of regulation to
firms.
In assessing the impact of regulation on competition and SME development, it is
important to take cognisance of the fact that the impact of regulation depends on
the size of a firm. Small firms require protection against unlawful behaviour of
others and it is important that governments, in formulating regulatory policies
should take into consideration the different size categories of firms. SMEs face
unique challenges and their development path is usually different from that of
large-scale enterprises. Besides, they have fewer internal resources to draw on,
their operational dynamics are more personalised and their decision-making
practises are less formalised. Hence, the design of intervention programmes to
promote the growth and development of the SME sector should be distinctly
different from those policies targeting large-scale enterprises.
78
SMEs are necessary engines for achieving national development goals such as
economic growth, poverty alleviation, democratization and economic
participation, employment creation, strengthening the industrial base and local
production structure. However, the ability of SMEs to realize these economic and
social objectives depends on the regulatory and policy environment within which
they operate (ILO, 2000). More often than not, regulatory policies often aimed at
developing other sectors of the economy have unintended negative impact on
SMEs. For instance, trade liberalization intended to boost export revenue often
stifles local production due to the increased imports of cheap local substitutes.
However, in assessing the impact of regulation on SMEs, it is necessary to
recognize that the impact will vary according to firm size. Whereas larger firms
may appoint a member of staff to perform the administrative role and compliance
associated with regulation, an SME may simply not have the resources to do so.
Even when they have the resources, their size puts them at a disadvantaged
position. In other words, meeting regulatory requirements raises transactions
costs of SMEs and puts them at a disadvantaged position as compared to large
domestic enterprises and foreign firms that may not be operating under
excessively restrictive regulatory regimes. In such regimes, transaction costs are
high and for SMEs, they form a greater proportion of total costs than for large
firms.
Regulatory compliance involves time and money, which imposes significant costs
on SMEs. Besides the costs of regulatory compliance and inertia, the direct costs
of payments such as licensing fees, represents a significant cost of doing
business. Holden, Sobokta and Locklin (1998) argued that payments made to
avoid detection of non-compliance, or payoffs to government officials are the
costs of operating in the informal sector.
Requirements on collateral and security are restrictive policies that hinder SME
development. Since the SME sector has generally been considered as risky,
financial institutions demand collateral from entrepreneurs often in the form of
landed property prior to the granting of a loan or credit facility. Whereas this
serves as a form of security to the institutions, it seriously hinders SME

79
entrepreneurs from obtaining credit for start-up, expansion or working capital
purposes.
Administrative Regulation is often instituted to control how governments collect,
manage and appropriate revenue and property. The principal objective of such
controls is to promote administrative efficiency of the public and private sectors. It
includes taxation patent protection for interventions, designs and products,
copyright protection, trademarks protection and bankruptcy acts.
5.2.4 Strengthening business associations
Business associations offer a platform through which businesses persons can
share information. Through these associations, individual business persons may
be able to identify key players along its value chain economic activities such as
its suppliers, complimentary, competitors and many others. This information is
very critical for business growth since strategic alliances, business co-operations
and clustering arrangements can be designed from these associations.
Membership to associations such as Institute of Directors (I.O.D) can also
promote the adoption of good corporate governance practices.
5.2.5 Promote business monitoring and development s ervices.
Besides lack of financing strategies, SMEs need to develop strategies for
international competitiveness and programs encouraging business growth using
appropriate technology and proper corporate governance culture. These
development strategies must be in line with the challenges, goals and broad
policy direction among key SME stakeholders through business membership
organizations, organizations of business development and private financial
services (Khan and Khan, 1992; Chen 1993).
5.2.6 Greater access to market and avoid competitio n.
Competition from established firms such as Old Mutual Zimbabwe Limited, Dawn
Properties Limited, FML Properties means SME real estate firms have to adopt
the Blue Ocean Strategy according to Chan et al, (2005) whereby they must
make competition irrelevant by creating own markets not dominated by large
firms. Barriers are created in order to minimize entry by new competitors and can
80
take various forms such as creating high switching costs by established firms,
huge capital base for entry and lack of economies of scale for newly established
firms.
According to Chan et al, (2005) and his Blue Ocean Strategy model, upcoming
businesses should not engage in direct competition with established businesses.
They need to be guided by the value innovation which underlies the Blue Ocean
Strategy to create an uncontestable market and make competition irrelevant,
create and capture new demand and break the value-cost trade-off. Sarasvathy
further argues that upcoming businesses need to find ways of working with the
market, competitors and suppliers as part of their business development
initiatives.
Sarasvathy (1998) in his model argues that SME firms should or need to avoid
operating in the suicide quadrant of new product and new market if they are to
grow their business, get financing and avoid competition from established firms.
The model is based on the concepts/principles of experimentation, flexibility,
affordable loss and pre-commitments. The Model further consolidates the need
for appropriate skills to become entrepreneurs and gives advice on how to work
with the market, competitors and suppliers.
5.3 Area of Further Study
The researcher proposes a further study to evaluate the other challenges being
experienced by SMEs in Real Estate business in delivering efficient service.
These areas include: marketing strategies of organizations; training and
development; requisite skills and technology; administration regulations and
power shortages challenges.
81
References
Ackerman, B., Ellickson R. and C.M. Rose, (2002), “Perspectives on Property
Law”, 3rd ed. Aspen Law and Business.
Admati, A.R. and Pfleider P. (1994), “Robust financial contracting and the role of
venture capitalists”, Journal of Finance, 49(2); 371-402.
Amit, R, Brander J and Zott C. (1998), “Why do venture capital firms exists?
Theory and Canadian evidence”, Journal business Venturing, 13;
441-466.
Ang, J. S. (1991), “Small business uniqueness and the theory of financial
management”, Journal of Small Business Finance, 1(1), 1-13.
Australian Bureau of Statistics (2000), “Small Business in Australia (1999)”,
Commonwealth of Australia, Canberra.
Barton, S. L. and Matthews, C. H. (1989), “Small firm financing: implications from
a strategic management perspective”, Journal of Small Business
Management, 27(1), 1-7.
Bates, J. (1971), “The Financing of Small Business”, 2nd
Ed, Sweet and Maxwell,
London.
Berger, A.N.., and G.F Udell. (1998), “The economics of small business finance;
the roles of private equity and debt markets in the financial growth
cycle.” Journal Banking and Finance, 22(6-8): 613-673.
Bolton, J. (1970), “Report of the Committee of Inquiry on Small Firms, Bolton
Report”, HMSO, London.
Boston Consulting Group. “Perspectives on experience”, Boston: The Boston
Consulting Group, 1968.
Bronwyn, Allan (1995), “Venture Capital Funding. Paper prepared for
presentation at the President’s Conference on Small Business”.
South Africa, July 1995.
Bryman, A. and Bell E. (2003), “Business Research Methods”, Oxford, Oxford
University Press.
82
Buckland, R., Davis, E. W. and Yeomans, K. A. (1989), “Debt management by
companies entering the unlisted securities market”, Accounting and
Business Research, 19(74), 99-111.
Building and Housing Act (Chapter 22.07).
Cassar, G. and Holmes, S. (2001), “Capital structure and financing of SMEs:
Australian evidence”, paper presented to the Annual Conference of
the Accounting Association of Australia and New Zealand,
Auckland.
CIA World factbook (2012), (www.indexmundi.com/africa.html), accessed on 23
August 2013.
Cochran W.G. (1963), “Sampling Techniques”, 2nd Edition New York: John
Wileys and Sons Inc.
Construction Industry Federation of Zimbabwe (CIFOZ) (2013), General Report
for 2013. Harare, Zimbabwe.
Cooper R.D. and Schindler P.S. (2011), “Business Research Methods”. McGraw
Hill International, New York.
Cooter R. and Ulen T. (2003), “Law and Economics”, 4th Edition. Addison-
Wesley. Chapters 4 and 5. Easier text.
Cosh, A. and Hughes, A. (1994), “Size, financial structure and profitability: UK
companies in the 1980s”, in A. Hughes and D. J. Storey (eds),
Finance and Small Firms, Routledge, London.
Cressy R and Olofsson C (1997), “European SME financing: an overview”, Small
Business Economics Journal 9, 87-96.
Diamond, D (1991), “Monitoring and reputation: the choice between bank loan
and directly placed debt.” Journal of political Economy, 99 (4): 689-
721.
Dooley D. (1995), “Social Research Methods”, Prentice Hall, New Delhi.
Ellickson, R. (1993), “Property in Land”, Yale Law Journal 102: 1315-1400.
Estate Agents Act (Chapter 27:17).

83
Fan Q (2003), “Creating A Conducive Legal and Regulatory Framework for Small
and Medium Enterprise Development in Russia, A Policy Dialogue
Workshop”, St. Petersburg, Russia September 14-16, 2003
Importance of SMEs and the Role of Public Support in Promoting
SME Development, World Bank.
Fluck, Z., D. Holtz –Eakin and H S Rosen, H.S (1998), “Where does the money
come from? The financing of small entrepreneurial enterprises.”
New York University.
Forsaith, D.M. McMahon, R.G.P., Holmes, S., Hutchinson and P.J. (1993),
“Small Enterprise Financial Management: Theory and Practice”,
Sydney, New South Wales: Harcourt Brace.
Forum for Social Sciences 2020 SME Sector Report, 2007.
Gompers, P.A. (1995), “Optimal Investment, Monitoring, and the staging of
Venture Capital”, Journal of Finance 50(5): 1461-1489.
Gono G. (2012), “Monetary Policy Statement issued in terms of Reserve Bank of
Zimbabwe Act (Chapter 22:15, July”.
Goriwondo, W.M. (2008), “Small to Medium Enterprises (SMEs)’s critical role in
the economy”. http://ir.nust.ac.zw downloaded on 29 November
2013.
Gupta, M., & Cawthon, G. (1996), “Managerial implication of flexible
manufacturing for small or medium enterprises”. The International
Journal of Technological Innovation, Entrepreneurships and
Technology Development, Vol. 16, No. 2, pp.77-83.
Hall, G., Hutchinson, P. and Michaelas, N. (2000), “Industry effects on the
determinants of unquoted SMEs’ capital structure”, International
Journal of the Economics of Business, 7(3), 297-312.
Hanks, S.H., Watson, C.J., Jansen, E. and Chandler, G.N. (1993), “Tightening
the Life-Cycle Construct: A Taxonomic Study of Growth Stage
Configurations in High-Technology Organizations”,
Entrepreneurship Theory and Practice, 18 (2), 5-29.
84
Hashim, M.K. and Abdullah, M.S. (2000c), “Developing SMEs taxonomies in
Malaysia”. Malaysian Management Journal, June/Dec, 4(1), pp.43-
50.
Hashim, M.K. and Wafa, S.A. (2002), “Small and medium sized enterprises in
Malaysia: Development issues”, Petaling Jaya: Prentice Hall.
Hisrich D. R. and Peters P. M. (2002), “Entrepreneurship”, McGraw – Hill
Publishing Co. Ltd, New York.
Hitt, M. A., Keats, B. W. and DeMarie, S. M. (1998), “Navigating in the New
Competitive Landscape: Building Strategic Flexibility and Competitive
Advantage in the 21st Century”, Academy of Management Executive
12(4): 22-42.
Holmes, S. and Kent, P. (1991), “An empirical analysis of the structure of small
and large Australian manufacturing firms”, Journal of Small
Business Finance, 1, 141-154.
Hooi, L.W. (2006), “Implementing e-HRM: The readiness of SME manufacturing
company in Malaysia”. Asia Pacific Business Review, Vol.12, No.4,
465-485.
Hughes, A., & Storey, D. J. (1994), Finance and the small firm. London:
Routledge.
Indigenisation and Economic Empowerment Act (Chapter 14:33).
International Finance Corporation and Global Partnership for Financial Inclusion
(2011), SME Finance Policy Guides, October 2011.
International Finance Corporation and World Bank: Doing Business Report 2013.
Jensen, M. C. and Meckling, W. (1976), “Theory of the firm: Managerial
behaviour, agency costs and capital structure”, Journal of Financial
Economics, 3(4). 305-360.
Johnson G. and Scholes K. (1984), Exploring Corporate Strategy, London: Prentice Hall, International.
Jordan, J., Lowe, J. and Taylor, P. (1998), “Strategy and financial policy in UK
small firms”, Journal of Business, Finance and Accounting, 25(1),
1-27.
85
Kamath, R. (1997), “Long Term Financing Decisions: View and Practices of
Financial Managers of NYSE Firms”, The Financial Review, vol.
32(2), p. 331-356.
Kaplan, S. and Zingales L. (1997). “Do Financing Constraints Explain why
Investment is Correlated with Cash Flow?” Quarterly Journal of
Economics 112: 169-215.
Kaplan, S. and Zingales, L. (2000), “Investment-Cash Flow Sensitivities are not
Valid
Keushnigg, C. (1998), “Venture Capital, A case for Investment Promotion
Discussion Paper No 1887”. London: Centre for Economic Policy
Research.
Khairuddin, H. (2000), “Redefining SMEs in Malaysia: One Industry One
Definition”. Asian Academy of Management Journal, Jan–June,
2000.
Khan and Khan (2007), International Journal of Quantitative Methods 6 (2) June
2007.
Kotler, P. & Armstrong, G. (2004), “Marketing: An Introduction”, Paperback,
Subsequent Edition
Kotler, P. (1997), “Marketing Management”, Prentice-Hall, Inc. New Jersey.
KPMG Consulting presentation (2002).
Land Acquisition Act (Chapter 20.10).
Lawless M.E et al (2012), International Global Journal of Finance, volume 5,no 5
of September 2012, pp 1-5.
Lawless, M., McCann, F. and T. McIndoe-Calder (2012), “SMEs in Ireland:
Stylised facts from the real economy and credit market”, Quarterly
Bulletin Articles, Central Bank of Ireland, pages 99-123.
Le Cornu, M. R., McMahon, R. G. P., Forsaith, D. M. and Stanger, A. M. J.
(1996), “The Small Enterprise Financial Objective Function”,
Journal of Small Business Management, 34(3), 1-14.

86
Lerner, J. (1999), “The government as venture capitalist: the long –run impact of
the SBIR program.” Journal of Business. 72(3): 285-318.
Levin, R. I. And Travis, V. R. (1987), “Small business finance: what the banks
don’t say”, Harvard Business Review, 65(6), 30-32.
Lopes A.S et al (2012), Global Journal for Business Research, volume 6 no. 2 of
2012, pages 93-103.
López Moreno, I. (2006), “Introducción a las Finanzas”. Retrieved October 10,
2013, from
http://www.universidadabierta.edu.mx/Biblio/L/Lopez%20Isaac-
Finanzas.htm.
Mallette, F. (2006), “A Framework for Developing your Financial Strategy”,
Corporate Financial Review, vol. 10 (5), p. 11-20.
Manigart, S. K., Baeyens and I Verschueren (2003), “Financing and Investment
interdependencies of unquoted Belgian companies: the role of
venture capital”. Business Review Belgium.
Matthews, C. H., Vasudevan, D. P., Barton, S. L. and Apana, R. (1994), “Capital
structure decision making in privately held firms: beyond the
finance paradigm”, Family Business Review, winter.
McLagan, P. (1989), “Models for HRD Practice”, ASTD Press, St. Paul, Ministry
of International Trade and Industry Malaysia, The Third Industrial
Master Plan (IMP3), 2006.
Measures of Financing Constraints”, The Quarterly Journal of Economics 115:
707-712.
Michaelas, N., Chittenden, F. and Poutziouris, P. (1999), “Financial policy and
capital structure choice in UK SMEs: Empirical evidence from
company panel data”, Small Business Economics, 12, 113-130.
Modigliani, F. and Miller, M. (1958), “The cost of capital, corporation finance and
the theory of investment”. American Economic Review, 48(3): 261-
297.
Myers, S. (1984), “The capital structure puzzle”, Journal of Finance, 39, 575-592.

87
Myers, S. C. and Majluf, N.S. (1984), “Corporate financing and investment
decisions when firms have information that investors don’t have”,
Journal of Financial Economics, 13, 187-221.
Nepachem et al (2010), “Zimbabwe national human resources (Z.N.H.R) survey
of 2010”.
Norton, E. (1991), “Similarities and differences in small and large corporations
beliefs about capital structure policy”, Small Business Economics,
2, 229-245.
Norton, E. (1991), Capital structure and small growth firms. Journal of Small
Business Finance, 1(2), 161−177.
Pettit, R. R. and Singer, R. F. (1985), “Small business finance: a research
agenda”, Financial Management, 14(3), 47-60.
Porter, M.E. (1979), “How Competitive Forces Shape Strategy”, Harvard
Business Review, March/April 1979.
Porter, M.E. (1980), “Competitive Advantage: Creating and Sustaining Superior
Performance” Harvard business Review, January 1980.
Porter, M.E. (2008), “The Five Competitive Forces That Shape Strategy”,
Harvard business Review, January 2008.
Republic of Kenya (2005), “Sessional Paper No. 2 of 2005 on Development of
Micro and small Enterprises for wealth and Employment Creation
for poverty Reduction”. Government Printers, Nairobi.
Reserve Bank of Zimbabwe, “Monetary Policy Statements 2005-2012”.
Richard Epstein, ed., (2007), “Economics of Property Law”. Edward Elgar. An
anthology of articles, mostly from the law literature.
Richardson, J.C. and B.S. Godfrey (2003), “Towards ethical practice in the use of
archived transcripted interview” International Journal of Social
Research Methodology 6(4); 347-355.
Rigg, C., & Trehan. K. (2002), “Do they or don’t they? A comparison of traditional
and discourse perspective of HRD in SMEs”. Education & Training,
Vol. 44, No. 8/9, pp. 388-397.

88
Ross, S. et al (1977), “The determination of financial structure: the incentive
signalling approach”, Bell Journal of Economics, 8, 23-40.
Saleh, A.S. and Ndubisi N.O. (2006), “An Evaluation of SME Development in
Malaysia”. International Review of Business Research Papers, Vol.
2, 1, pp. 1-14.
Saru, E. (2007), “Organizational learning and HRD: how appropriate are they are
for small firms?” Journal of European Industrial Training, Vol. 31,
No. 1, pp. 36-51.
Saunders, MP. Lewis, at al. (2007), “Research Methods for Business Students”.
Fourth edition, Harlow, England, FT Prentice Hall, Pearson
Education.
Schlogl, H. (2004), “Small and medium enterprises: Seizing the potential”.
Organizational for Economic Cooperation and Development,
International Journal of Management and business‚ Vol.4 No. 10,
October 209 pp. 2.
Scholtens, B. (1999), “Analytical issues in external financing alternatives for
SBEs”, Small Business Economics, 12(5), 137-148.
Scott, D. F., Gray, O. L. and Bird, M. M. (1972), “Investment and financing of
small manufacturing firms”, MSU Business Topics, 29(3), 29-38.
Sekaran. U. (2001), “Research methods for Business, A skill building approach”, 2nd
Edition, USA, John Wiley & Sons Inc.
Shane S (2009), “International Journal of Business & Management No. 10 of
October 2009”.
Snell, R. & Lau, A. (1994), “Exploring Local Competencies salient for expanding
small businesses”. Journal of Management Development, Vol. 13,
No. 4, pp. 4-15.
Storey, D.J. (1994), “Understanding the Small Business Sector”, London,
England: Routledge.
Strauss, A. and J. Corbin (1998), “Basics of qualitative research: Technique and
procedures for Developing grounded theory”, Thousand Oaks, CA,
Sage Publications.
89
Sutton, R.I. (2004), “Prospecting for valuable evidence: why scholarly research
can be a goldmine for managers”. Strategy and Leadership
32(1):27-33.
Taylor B., Sinha G. & Ghoshal T. (2009), “Research Methodology: A Guide for
Researchers in Management & Social Sciences”. PHI Learning
(Pvt) Ltd, New Delhi.
Tom Bethell, (1998), “Noblest Triumph: Property and Prosperity through the
Ages”. St Martin's Press. For lay people.
Valencia, H., Nava, N., Dubcovsky, G. & Gómez, J. (2006), “Prácticas
Financieras en las Empresas de México”, X Annual Congress
ACACIA.
Valuers Act (Chapter 27:18).
Van Auken, P. & Howard, E. (1993), “A factor analytic study of the perceived
causes of small business failure”, Journal of Small Business
Management, vol. 31(4), p. 23-31.
Walker, D. A. (1989), “Financing the small firm”, Small Business Economics, 1,
285-296.
Westhead, P. and Storey, D. (1996), “Management training and small firm
performance: why is the link so weak?” International Small
Business Journal, Vol. 14, No. 4, pp.13-19.
Wilson, H. (1979), “The Financing of Small Firms: Interim Report of the
Committee to Review the Functioning of Financial Institutions”,
CMND 7503, HMSO, London.
www.canstar.com.au/home-loans/global-financial-crisis accessed on 19 August
2013.
www.doingbusiness.org/data accessed on 28 October 2013.
www.imf.org/external/pubs/ft/dp/2010 accessed on 28 October 2013.
Yamane, T. (1967), “Statistics: An Introductory Analysis”, 2nd Ed., New York:
Harper and Row.
90
Zigmund, W.G. (2003), “Business Research Methods”, 7th Ed, Thomson, South-
Western, Australia.
Zimbabwe Stock Exchange Act (Chapter 24.18).
Zopounidis, C. Y. and Doumpos, M. (2002), “Multi-Criteria Decision Aid in
Financial Decision Making: Methodologies and Literature
Review”, Journal of Multicriteria Decision Analysis, vol. 11 (4-5), p.
167-186.
Zoppa, A., & McMahon, R. (2002), Pecking order theory and the financial
structure of manufacturing SMEs from Australia's business
longitudinal survey. Research paper series: 02–1, The Flinders
University of South Australia.
91
APPENDIX A: INTRODUCTORY LETTER
02 December 2013
No. 8 Bedford Road
Avondale
Harare.
Cell: 0772 392 288
To Whom It May Concern.
Ref: Masters Degree in Business Administration Rese arch Study.
As part of my Masters in Business Administration Degree programme with
the Graduate School of Management at the University of Zimbabwe, I am
conducting a research study with the topic “an assessment of the financing
strategies employed by SME real estate firms under liquidity constraint
in Zimbabwe”.
I am therefore kindly appealing for your assistance by providing information
through this questionnaire. It is hoped that the results of this research will be
of great importance to all stakeholders operating in the real estate industry in
Zimbabwe. The research will also be of great importance to the academic
community. Your response will be treated as confidential and will not be used
for purposes other than those intended for this research.
For any clarifications regarding this study do not hesitate to contact the
researcher on the above stated contact details.
Yours faithfully
Adam Chowa
(Masters in Business Administration Degree Student)
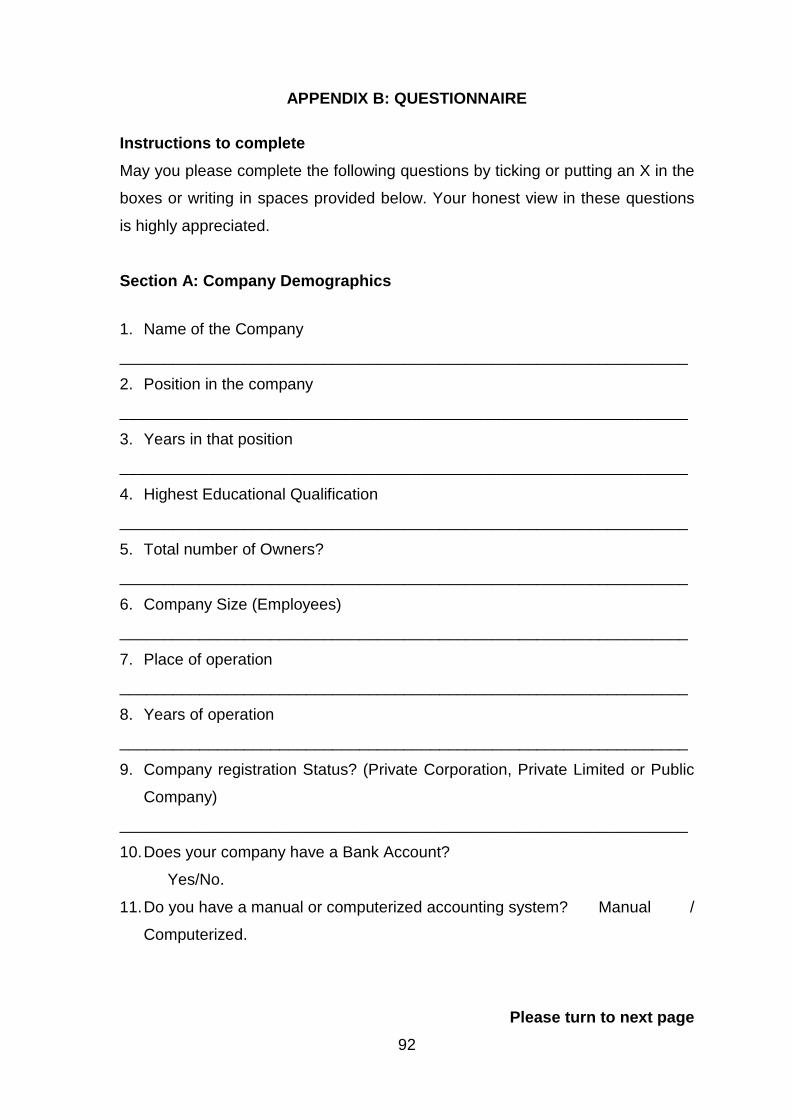
92
APPENDIX B: QUESTIONNAIRE
Instructions to complete
May you please complete the following questions by ticking or putting an X in the
boxes or writing in spaces provided below. Your honest view in these questions
is highly appreciated.
Section A: Company Demographics
1. Name of the Company
________________________________________________________________
2. Position in the company
________________________________________________________________
3. Years in that position
________________________________________________________________
4. Highest Educational Qualification
________________________________________________________________
5. Total number of Owners?
________________________________________________________________
6. Company Size (Employees)
________________________________________________________________
7. Place of operation
________________________________________________________________
8. Years of operation
________________________________________________________________
9. Company registration Status? (Private Corporation, Private Limited or Public
Company)
________________________________________________________________
10. Does your company have a Bank Account?
Yes/No.
11. Do you have a manual or computerized accounting system? Manual /
Computerized.
Please turn to next page

93
SECTION B: FINANCING STRATEGIES.
(a) START UP FINANCE OF BUSINESS.
1. How much did you use to start your business?
Capital<$5000 Capital>$5000 Capital>$10 000 Other$
2. What was the source of your financing when you started the company?
Own Savings Bank Loan Lease finance Others
3. Did you get any loan from any institution?
Yes/No
4. If yes how much did you get as loan?
Loan<$5000 Loan>$5000 Loan>$10000 Other$
5. What was the interest charged on the loan?
10% 15% 20% 25% 30% other
6. What was the duration of the loan?
1yr 2yrs 5yrs 10yrs 15yrs other
7. Did you provide any collateral security on the loan?
YES/NO
8. Are you aware of any other financing facilities available?
YES/NO
9. If Yes which one did you use?
Internal/External
10. Do you know anything about the Zimbabwe Stock Exchange?
YES/NO
11. If Yes, do you have plans to list on the Zimbabwe Stock Exchange?
YES/NO
12. If Yes, do you have any idea of the listing requirements of Zimbabwe
Stock Exchange?
YES/NO
Please turn to next page

94
(b) WORKING CAPITAL FINANCING.
13. Have you received any material or financial support or assistance from
any institution or bank to finance your day to day operations?
Yes………………. No…………………….
If yes, what type of assistance did you receive?
1. Loan ………………………………………..….……
2. Grant ……………………………….……….……….
3. Other ………………………..……………………….
14. If loan, what did you use the loan for?
1. Bought stationery ……………….……………...……….
2. Used to advertise ………………….……….………..…..
3. Payment of salaries ……………….…………………….…
4. Payment of rentals ……………………………….……….
(c) INVESTMENT AND CAPITAL EXPENDIUTRE FINAN CING
15. Do you own or rent the premises you operate from?
Own ………….. Rent …………..
16. If own, have you applied for any mortgage finance to buy own building?
Yes/No
17. Did you get any loan from any institution?
Yes/No
18. If yes how much did you get as loan?
19. Loan<$50 000 Loan>$50 000 Loan>$100 000 Other$
20. What was the interest charged on the loan?
10% 15% 20% 25% 30% other
21. What was the duration of the loan?
1yr 2yrs 5yrs 10yrs 15yrs other
22. Did you provide any collateral security on the loan?
YES/NO
Please turn to next page
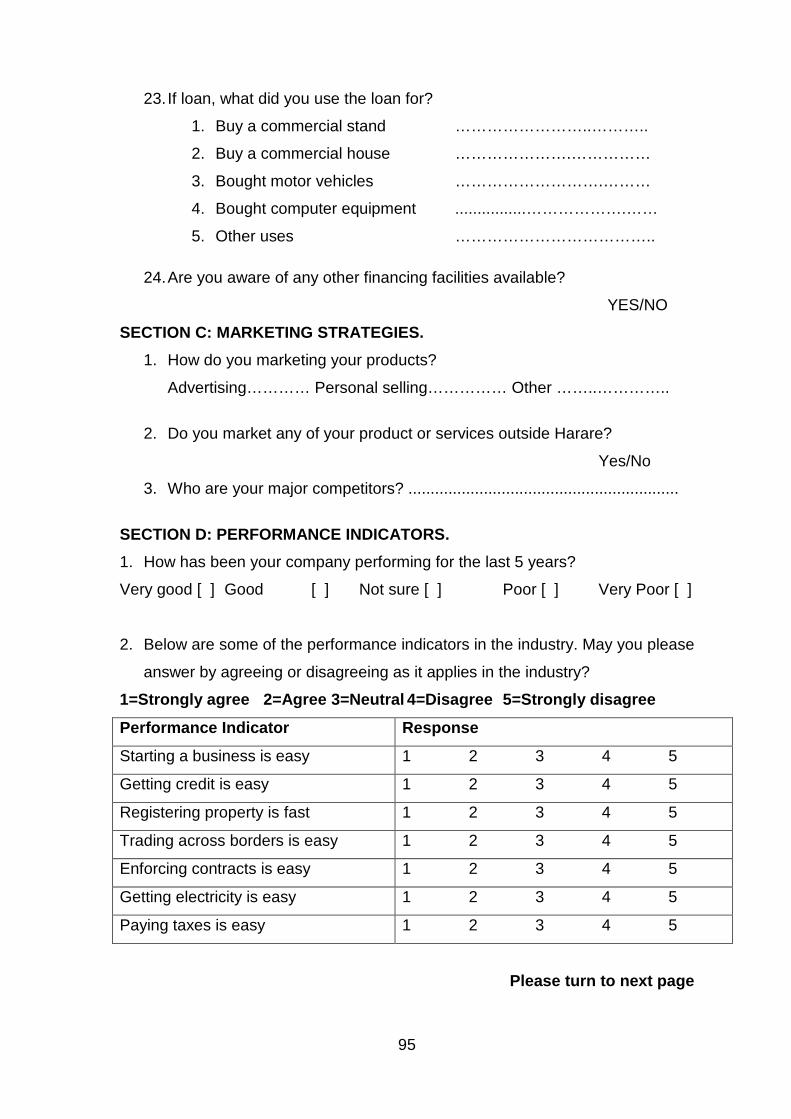
95
23. If loan, what did you use the loan for?
1. Buy a commercial stand ……………………..………..
2. Buy a commercial house ………………….……………
3. Bought motor vehicles ……………………….………
4. Bought computer equipment ................……………….……
5. Other uses ………………………………..
24. Are you aware of any other financing facilities available?
YES/NO
SECTION C: MARKETING STRATEGIES.
1. How do you marketing your products?
Advertising………… Personal selling…………… Other ……..…………..
2. Do you market any of your product or services outside Harare?
Yes/No
3. Who are your major competitors? .............................................................
SECTION D: PERFORMANCE INDICATORS.
1. How has been your company performing for the last 5 years?
Very good [ ] Good [ ] Not sure [ ] Poor [ ] Very Poor [ ]
2. Below are some of the performance indicators in the industry. May you please
answer by agreeing or disagreeing as it applies in the industry?
1=Strongly agree 2=Agree 3=Neutral 4=Disagree 5=Str ongly disagree
Performance Indicator Response
Starting a business is easy 1 2 3 4 5
Getting credit is easy 1 2 3 4 5
Registering property is fast 1 2 3 4 5
Trading across borders is easy 1 2 3 4 5
Enforcing contracts is easy 1 2 3 4 5
Getting electricity is easy 1 2 3 4 5
Paying taxes is easy 1 2 3 4 5
Please turn to next page

96
SECTION E: BUSINESS CHALLENGES.
1. Our company’s performance is being adversely affected by the following
factors?
1=Strongly agree 2=Agree 3=Neutral 4=Disagree 5= Strongly disagree
a. Adequacy of the financing
1 2 3 4 5
b. Training and development
1 2 3 4 5
c. Access to markets and competition
1 2 3 4 5
d. The administration regulations
1 2 3 4 5
e. Supporting infrastructure
1 2 3 4 5
f. Requisite skills and technology
1 2 3 4 5
2. What strategies do you think can be adopted in the sector to increase
business viability in light of liquidity constraints?
______________________________________________________________
______________________________________________________________
______________________________________________________________
______________________________________________________________
______________________________________________________________
End of Questionnaire
Thank you for your effort and time.