choice overload and purchase intention among millennial
TRANSCRIPT
CHOICE OVERLOAD AND PURCHASE INTENTION AMONG
MILLENNIAL RURAL AND URBAN CONSUMERS
by
Soumya Mohan
A Dissertation
Submitted to the Faculty of Purdue University
In Partial Fulfillment of the Requirements for the degree of
Doctor of Philosophy
Department of Consumer Science
West Lafayette, Indiana
May 2020
2
THE PURDUE UNIVERSITY GRADUATE SCHOOL
STATEMENT OF COMMITTEE APPROVAL
Dr. Sandra S. Liu, Chair
Department of Consumer Science
Dr. Sharon Christ, Chair
Department of Statistics
Dr. Richard Feinberg
Department of Consumer Science
Dr. James G. Anderson
Department of Sociology
Approved by:
Dr. Sandra S. Liu
3
Dedicated to my parents, whose persistent “reminders” motivated me to complete my graduate
studies, my brother, whose complete lack of interest in my studies helped me to maintain my
sanity at home, and my spouse, who always supported me through the tough times during the
program.
4
ACKNOWLEDGMENTS
First and foremost, I would like to thank my advisor, Dr. Sandra S. Liu, for all the
support she has provided during my Ph.D. program. I would not be here without her guidance
and knowledge. In addition to my advisor, I would like to thank my committee members: Dr.
Richard Feinberg, Dr. Sharon Christ, and Dr. James G. Anderson, for all of their insights and
encouragement.
5
TABLE OF CONTENTS
LIST OF TABLES ......................................................................................................................7
ABSTRACT ...............................................................................................................................8
CHAPTER 1. INTRODUCTION ................................................................................................9
Problem Statement ................................................................................................................. 10
Contribution to Field .............................................................................................................. 12
CHAPTER 2. LITERATURE REVIEW.................................................................................... 13
Information Overload ............................................................................................................. 13
Choice Overload .................................................................................................................... 14
Meta-Analytic Studies of Choice Overload......................................................................... 17
Rurality .................................................................................................................................. 20
Millennial Purchase ................................................................................................................ 22
Online Purchase Behavior ...................................................................................................... 23
CHAPTER 3. METHODOLOGY ............................................................................................. 24
Overview ............................................................................................................................... 24
Quantitative Study .................................................................................................................. 24
Participants ........................................................................................................................ 24
Inclusion criterion .............................................................................................................. 24
Instrumentation .................................................................................................................. 25
Product Familiarity .......................................................................................................... 25
Choice Overload .............................................................................................................. 25
Procedure ........................................................................................................................... 26
Product Variety ................................................................................................................ 26
Product Offerings............................................................................................................. 26
Correlation ......................................................................................................................... 27
Mean Comparisons............................................................................................................. 27
Repeated measures analysis ................................................................................................ 28
Observational unit ............................................................................................................ 28
Dependent variable .......................................................................................................... 28
Rurality ............................................................................................................................ 29
6
Sex .................................................................................................................................. 29
White ............................................................................................................................... 29
Many ............................................................................................................................... 29
Type ................................................................................................................................ 30
Buy .................................................................................................................................. 30
Interaction terms .............................................................................................................. 30
Model .............................................................................................................................. 30
Qualitative Study.................................................................................................................... 31
Participants ........................................................................................................................ 31
Procedure ........................................................................................................................... 32
CHAPTER 4. RESULTS .......................................................................................................... 35
Quantitative Study .................................................................................................................. 35
Respondents ....................................................................................................................... 35
Correlational and mean Comparison Results ...................................................................... 35
Multi-level Model Results .................................................................................................. 36
Qualitative Study.................................................................................................................... 38
Theme 1: Extensive options need as an outcome of the product price ................................. 38
Theme 2: Purchase intention based on the current necessity for product ............................. 39
Theme 3: Option availability in online versus physical stores ............................................. 40
Theme 4: Extensive options and level of expertise/interest ................................................. 41
Theme 5: Internet as a research and/or purchase medium ................................................... 42
Theme 6: Internet versus physical store preference ............................................................. 43
Theme 7: Limited product options lead to experiencing negative emotions......................... 43
Discussion .............................................................................................................................. 44
Implications ........................................................................................................................... 51
Limitations and Future Directions .......................................................................................... 52
CHAPTER 5. CONCLUSION .................................................................................................. 56
APPENDIX .............................................................................................................................. 59
REFERENCES ......................................................................................................................... 83

7
LIST OF TABLES
Table 1 Survey Results .............................................................................................................. 36
Table 2 Results from Hierarchical Linear Model ....................................................................... 37
8
ABSTRACT
Many researchers have studied the interaction between choice overload and purchase
intention resulting in mixed and sometimes contradictory results. This study extended the current
knowledge and examined how rurality (rural vs. urban/suburban) among millennial consumers
influences choice overload and purchase intention when presented with extensive or limited
options. Using both quantitative survey data and qualitative interviews, the author studied
consumer experiences to understand choice overload and purchase intention better. Overall, some
of the results suggest a statistical difference between rural and urban/suburban participants in their
feelings of choice overload. However, many of the results were small and unlikely to be of practical
significance. Additionally, the interviews were analyzed and multiple themes emerged, including
possible factors that may support prior meta-analytic conclusions about the nuance of choice
overload.
9
CHAPTER 1. INTRODUCTION
The United States contains large swaths of rural areas (Hawk, 2013; United States Census
Bureau, 2013). Rural areas afford many advantages to those who live there: clean air, clear skies,
and tight-knit communities. These advantages come with some severe disadvantages, including
decreased access to information, goods, and services (Kaufman, Macdonald, & Lutz, 1997). It is
this lack of access to information that is of potential interest to businesses who wish to sell them
goods and researchers in the field of consumer science who study choice overload.
Choice overload refers to the cognitive difficulty of making a decision when offered an
overwhelming amount of information related to a decision goal. Choice overload is a contentious
construct among scholars in the field of consumer behavior (McShane & Bockenholt, 2018;
Chernev et al., 2015; Scheibehenne et al., 2010). Lack of conclusive evidence and uncertainty
about the role of moderating and dependent variables in influencing choice overload and purchase
behavior leaves the door open for new paths of research. One such unexamined channel in choice
overload is the role of millennial rural and urban/suburban consumers, who will be significant
purchasers for years to come. Additionally, new paths of shopping have emerged with the advent
of the internet. Online purchasing is common, but results may vary compared to in-person
shopping (Koufaris, 2002).
This dissertation examined the role of option variety and choice overload on purchase
behavior of millennial rural and non-rural consumers. This study investigated the extent to which
product options differently influenced purchase likelihood between rural and non-rural millennials
as well as potential moderating factors motivating these differences between the two groups. It
was also designed to understand how option variety influenced online and in-person purchase
behavior. Overall, this research was intended to argue that rural and urban consumers differ in
their propensity to buy or not buy a product when presented with either “extensive” or “limited”
options.
These questions were answered using a mixed-methods approach, utilizing both a
quantitative survey and qualitative interview. The survey assessed the role of option variety in the
likelihood of purchasing a product among millennial rural and urban consumers. Additionally, the
questionnaire also studied the role of product price and purchase frequency in influencing purchase
likelihood. Similar to the quantitative survey, the qualitative interview was designed to help
10
understand purchase propensity between the two groups when presented with a dual set of options.
Furthermore, the strength of the interviews lies in its ability to delve deeper into the consumers'
past, emotions, thought process, and various other factors to better understand significant
influencers of purchase decision making and subsequent purchase behavior.
Businesses should value this information because understanding purchase behavior
differences between the groups allots them an edge over their competition. Specifically, their
profits may be influenced by the quantity of products they present to each group if the number of
products influences purchase likelihood. The ability to predict how consumers will respond to
product options will help a company make sustainable business decisions regarding optimal option
offerings to provide diverse groups of customers to maximize profit potential. Furthermore, having
the ability to anticipate the behavior of the shopper can help the company target buyers using the
ideal variety of products to increase sales/profits. Additionally, cognitive dissonance associated
feelings of choice overload could result in negative word of mouth/reviews, leading to a reduction
in earnings for the company.
On the other hand, consumers and businesses can use this information to tailor
countermeasures to decrease or prevent the incidence of overload. For example, if certain groups
are found to be less likely to purchase when presented with more product options, they may opt to
visit stores or online stores that offer limited variety to increase the likelihood of purchasing or
curb unnecessary purchasing. Beyond businesses/companies, the knowledge gained from this
study will benefit many entities seeking to influence the purchase behavior of rural or urban
millennial consumers. Additionally, the outcomes of this study will add to the current knowledge
about choice overload and option variety.
Problem Statement
Consumers' cognitive resources are limited, and when consumption surpasses this limit,
decision quality could suffer (Fiske & Taylor, 1984; Park, Hill, & Bonds-Raacke, 2015). When
consumers are presented with a large amount of information from which to make a purchase
decision, their cognitive resources may be surpassed, leading to information overload. Numerous
studies support the influence of information overload on online purchase decision-making
behavior (Gao, Zhang, Wang, & Ba, 2012). However, few studies have examined the impact
11
consumer background, specifically rural or urban/suburban locations, have on online purchase
decision-making.
Furthermore, more and more companies are engaging in online sales. However, current
understanding of online consumer behavior continues to be in its infancy (Dennis, Merrilees,
Jayawardhena, & Wright, 2009). Additionally, online purchase behavior does not necessarily
result in the same outcomes as traditional shopping behaviors (Koufaris, 2002). With the advent
of the internet and computer, information search has become more accessible. Consumer's use of
technology, particularly in the search step of purchase decision-making, results in varying degrees
of cognitive effort expenditures.
Rural and urban consumers have shown significant differences in their purchase history
resulting from differences in product and assortment availability (Liu, Shively, & Binkley, 2013).
Product options were previously limited for rural consumers, but technological improvements have
resulted in greater access to and use of the Internet for both rural and urban consumers (Mangold
& Smith, 2012; Perrin & Duggan, 2015). Furthermore, millennials have grown up making
purchases online. Nonetheless, current knowledge about online purchase behavior remains in its
formative years (Dennis, Merrilees, Jayawardhena, & Wright, 2009), and purchase behavior online
may differ from traditional shopping behavior outcomes (Koufaris, 2002). Several findings
substantiate the influence of information overload on purchase decision-making behavior online
(Gao, Zhang, Wang, & Ba, 2012). Nevertheless, studies on the impact of rural and urban
consumer’s backgrounds on online purchase decision-making are lacking. With the increase in
online shopping by both rural and urban consumers, this research intends to address this gap and
add to the knowledge about how extensive or limited options will alter rural and urban millennial’s
purchase behavior. Millennials are an essential group for businesses to understand because of their
current and future purchase potential for several decades to come.
This study seeks to address the deficiency in information about the differences in purchase
behavior of rural and urban millennials when presented with extensive or limited purchase options.
Millennial’s future purchase potential makes this group exceptionally important for companies to
understand better. Furthermore, advancing technology has allowed consumers of various
backgrounds to have access to the internet and, consequently, online shopping (Mangold & Smith,
2012; Perrin & Duggan, 2015). As such, internet shopping and technology are critical in the
millennial’s life, thus worth exploring further.
12
Contribution to Field
This study contributes to existing knowledge concerning the influence of a diverse number
of product options on purchase behavior. Previous researchers have described the power of a
varying number of product varieties on the decision to purchase (Dhar, 1997; Hoch, Bradlow, &
Wansink, 1999; Kahn, 1998). However, researchers have not examined how this decision to
purchase differs between millennial rural and nonrural consumers. Additionally, this study will
add to the existing evidence on the influence of several factors on purchase behavior when
consumers are provided limited and extensive product options.
Beyond this study's contribution to existing scholarly knowledge, this information may
also inform marketers and business executives in developing and implementing new strategies,
particularly when considering rural and urban millennial consumers. Specifically, the data may
inform companies about the ideal variety of products to offer each customer segment to increase
purchase potential while minimizing purchase deferral, consequently maximizing profits. Based
on the findings of the study, businesses can optimize the quality of the information presented to
consumers to minimize the likelihood of feeling overloaded (Eppler & Mengis, 2004). Improving
the quality of the information can aid consumer processing capacity, so they are better able to use
the information quickly and efficiently. Furthermore, this study supplements existing evidence of
the influence of price and other factors on purchase deferral among millennial urban and rural
consumers presented with limited or extensive product options to aid companies in optimizing
profits.
13
CHAPTER 2. LITERATURE REVIEW
Information Overload
A standardized definition of information overload is absent across disciplines (Roetzel,
2019). Generally speaking, information load refers to the number and types of stimuli the recipient
must attend (Jacoby, 1977). Information overload indicates the limits on the ability of a person to
process information given an individual’s processing capacity (Roetzel, 2019; Eppler & Mengis,
2004). When too much information is presented to the person, surpassing their processing limits,
they are considered “overloaded.” Once overloaded, consumers experience anxiety and decision-
making becomes less accurate and effective. Studies suggest that the overabundance of
information is not only disruptive to personal life, including adverse effects on emotions and
perceived physical health, but also work-life, mainly inefficiency through wasted productive time
(Hemp, 2009; Roetzel, 2019). When the quantity of information exceeds processing capabilities,
the consumer displays difficulty in their ability to identify relevant evidence, ignores important
information, takes more time to make a decision, and decision accuracy suffers (Eppler & Mengis,
2004). With the evolution of technology, information, in the form of text messages, e-mails, social
media, etc., are at our fingertips every second of our lives. Additionally, decision-makers have
access to a wealth of information in very little time, leading to more information than they can
evaluate (Roetzel, 2019). However, some consumers may not feel overwhelmed by the surplus of
information and, instead, feel stimulated, which could be suggestive of information addiction
(Hemp, 2009).
Research on information overload peaked in the 1980s and 1990s (Roetzel, 2019). Several
early works suggest that providing consumers with too much information could result in negative
consequences (Jacoby, 1974; Jacoby, 1977; Jacoby, Speller, & Kohn, 1974). Scammon’s (1977)
experimental study concluded that increasing the amount of information presented led to
information overload because participants were forced to divide their processing time among the
various pieces of information. Malhotra (1982) added further support to previous findings on
information overload by concluding that consumers can be overloaded with information in
experimental settings when presented with too much information. However, the same year, the
author criticized Jacoby, Speller, & Kohn’s findings on information overload (Malhotra, Jain, &
14
Lagakos, 1982). The author goes on to re-analyze the previous researchers' findings and concludes
that consumers can process large amounts of information. In response, Jacoby (1984) criticized
Malhotra’s conclusions determining that while consumers can become overloaded, they may not
become overloaded because consumers will be selective about the information, preventing
themselves from reaching levels of overload. Keller & Staelin (1987) showed that decision
effectiveness was negatively affected when the quantity of information increased. The significance
of these findings in a marketplace is vital for marketers and businesses (Malhotra, 1984).
Consumers attempt to limit the amount of information they must process when they encounter
overwhelming amounts of information, however, their processing ability becomes overloaded
when they must process the large quantity of data in a limited time. When presented with too much
information, consumers may opt to use heuristics or may ignore certain information when making
decisions, possibly resulting in suboptimal decisions.
Current research on consumer information overload has primarily focused on online settings.
In an effort to increase buyers, many online retailers provide a large amount of product information
online (Lee & Lee, 2004). This can include several different models, each with a large number of
attributes for the products they offer. Studies confirm that the vast quantities of information
presented to consumers result in consumers experiencing information overload (Lee & Lee, 2004;
Chen, Shang, & Kao, 2009). The information overload experienced by the buyers, resulted in less
satisfaction, less confidence, distrust, and confusion for the buyers (Lee & Lee, 2004; Moon,
Costello, & Koo, 2016). Their negative experience with too much information may also result in
higher negative word of mouth, which may severely impact a business’s future profits. However,
studies suggest that buyers with online shopping experience may process product information
more efficiently and effectively, resulting in lower reported experiencing information overload
(Moon, Costello, & Koo, 2016). Their findings suggest that consumers who grew up making
purchases online may be less likely to be stressed when choosing from a large number of product
options and possibly less negatively influenced by higher product options.
Choice Overload
This study focused on choice overload. Choice overload is one of the terms used to describe
the experience that comes with decision-making in the presence of extensive options/choices
(Iyengar & Lepper, 2000). The over choice concept has been traced back to Jean Buridan, a French
15
philosopher who theorized that when people are presented two equally attractive options, they will
delay choosing (Scheibehenne, Greifeneder, & Todd, 2010). The assumption was confirmed in
1944, by Miller, in an experiment that reported that surrendering an attractive alternative for other
options could lead to procrastination and conflict. In the 1950s, researchers noticed that when
consumers were required to choose between two similar options, conflict increased (Festinger,
1957; Lewin, 1951). In fact, as alternatives become more and more alike, yet mutually exclusive,
it leads to more conflict. As the number of options increases, so did the choice conflict, leading to
confusion, anxiety, and inability to choose (Lipowski, 1970).
Recent studies lend further support to the idea that choosing from larger assortments of
products leads to less satisfaction and unfavorable behavioral responses (Dhar, 1997; Iyengar &
Lepper, 2000; Sloot, Fok, & Verhoef, 2006). Lower satisfaction and decreased purchase outcomes
were found in a study when buyers were provided jams or chocolates for purchase (Iyengar &
Lepper, 2000). Fewer shoppers purchased the jams or chocolate when the varieties of jams or
chocolates were increased from 6 to 24 or 30. Not only were the consumers more likely to buy the
jam or chocolate when there were fewer options to choose from, but the participants subsequently
reported greater satisfaction with their selection as well. Shah and Wolford (2007) found a
curvilinear relationship between the number of pen choices and buying behavior. Specifically, they
found that participants were more likely to buy a pen when presented with a small variety of
options (8-10) compared to a large variety (16-20). Reutskaja and Hogarth (2009) presented
participants with a range of gift boxes to choose from. Comparable to the previous findings,
participants reported lower levels of satisfaction when they were required to choose from a larger
number of boxes (30) or a minimal number of options (5) and highest when presented with a
medium number of options (10-15). Overall, wide variance exists in the literature concerning the
likelihood of experiencing overload.
Buyers were also more likely not to buy or defer purchases when they were presented with a
large assortment of products. Tversky and Shafir (1992) showed an increase in the tendency to
postpone purchase decisions when an attractive alternative was added, creating additional conflict
for the buyer. Dhar (1997) lends further support with his study reporting that the number of
participants deferring the purchase decision increased when a second attractive option was added
to the choice set. In the previously mentioned Iyengar and Lepper (2000) study, not only were
participants less satisfied with their selection when presented with a large assortment of jams (24
16
or 30), but buyers were also less likely to purchase one of the jams when presented with a large
variety. Furthermore, participation rates among employees in retirement plans, 401(k), fell as the
number of fund options increased (Iyengar, Jiang, & Huberman, 2004). Overall, the findings
suggest that consumers are more likely not to buy or defer the purchase of a product or service
when presented with an extensive option.
Analysis of empirical data showed similar findings in terms of the negative consequences of
large assortments. Broniarczyk, Hoyer, and McAlister (1998) showed that merchants could
decrease the number of product options, specifically eliminating low-preference products, without
adversely affecting store preference or assortment perceptions. Boatwright and Nunes (2001)
found that reducing the number of stock-keeping units (SKU) for an online retailer, increased sales
by an average of 11% in 42 categories. Two-thirds of the categories experienced an increase in
sales, and almost half experienced an increase of 10% or more. Another study with a major Dutch
retailer, found that an assortment reduction attracted new buyers to the category, partially
offsetting sales losses (Sloot, Fok, & Verhoef, 2006). Finally, using household-level market data,
researchers found that the number of SKU’s per brand, sizes per brand, and proportion of SKU’s,
that are unique to the store, harmed store choice (Briesch, Chintagunta, & Fox, 2009). That said,
not all studies have found evidence of choice overload.
In a qualitative study with 19 participants, Sthapit (2018) did not find evidence of choice
overload. Study participants were presented with either 20 or 50 souvenir choices and then asked
questions about their purchase regret. Study participants did not express evidence of choice
overload or disappointment. Additionally, online settings have also not aligned with choice
overload theory. Aparicio and Prelec (2018) examined the internet browsing behavior of
individuals when presented with potential choice overload situations when using the internet.
Contrary to what was expected, the authors found that more choices increased engagement. In
other words, having more links on a page was related to a participant more likely to click a link
than if there were only a few links.
Finally, in the first of its kind study, Reutskaja, Lindner, Nagel, Andersen, and Camerer (2018)
examined participants’ brains while presented with varying numbers of choices. Their purpose was
to find if there was neurological evidence for choice overload. The authors found that choice
overload was likely not a dichotomous situation where an individual could be overwhelmed with
many choices. Instead, the authors described the neurological evidence for a “U-shape” of choice
17
overload. Participants' brains responded best under the middle choice condition (12 choices) and
negatively to the too few (6) or too many (24) conditions.
In summary, evidence for choice overload varied from more choices leading to less
participation (Iyengar, Jiang, & Huberman, 2004) to more choices leading to greater participation
(Aparicio and Prelec, 2018). In other words, no one study provided conclusive evidence explaining
choice overload. In response to this lack of scholarly consensus, scholars turned to meta-analytic
techniques to aggregate findings across the field (Chernev, Böckenholt, & Goodman, 2015;
McShane & Böckenholt, 2018; Scheibehenne, Greifeneder, & Todd; 2010).
Meta-Analytic Studies of Choice Overload
Varying results on choice overload have led researchers to provide overviews of the field
in the form of meta-analyses. A meta-analysis is a quantitative overview of a subject that
synthesizes the results from multiple studies (Borenstein, Hedges, Higgins, & Rothstein, 2011).
An effect size is calculated for each study, and then those effect sizes are averaged with weighting
by sample size to create an overall effect size that is intended to be more representative of the
population.
In a comprehensive meta-analysis, Scheibehenne, Greifeneder, and Todd (2010)
aggregated the results from 50 published and unpublished randomized experimental studies on
choice overload. Furthermore, the authors found no moderating conditions that were significant
influencers of choice overload. The authors found no effect size across the studies but noted that
there existed a large amount of variance among study effect sizes. This variance was not randomly
distributed, and the authors suggested that the underlying issue in understanding the phenomena
of choice overload was likely due to how relative versus absolute evaluations, maximizing, and
choice justification were operationalized.
Chernev, Böckenholt, and Goodman (2015) argued that the meta-analytic approach taken
by Scheibehenne et al. (2010) was flawed. Chernev et al. (2015) claimed that the meta-analytic
approach taken by Scheibehenne et al. (2010) masked the effect of choice overload. In designing
their own meta-analysis, Chernev et al. (2015) followed the approach of Scheibehenne et al. (2010)
with two exceptions. Chernev et al. (2015) tightened the inclusion criteria for study inclusion
within their meta-analysis. In contrast to Scheibehenne et al. (2010), Chernev did not include
conference proceedings or doctoral/masters’ theses. The author argued that including only peer-
18
reviewed journal articles would lead to a higher increase in the quality of studies within the meta-
analysis. Additionally, the Chernev et al. (2015) study included a broader sampling of the
literature.
The second, and according to Chernev et al. (2015), more substantial difference was in the
construction of the regression model used to calculate the mean effect size of choice overload and
the influence of moderators. Of particular importance, Chernev et al. (2015) used a hierarchical
model to control for dependence between effect sizes drawn from the same study. The authors
speculate that this lack of control led to biased estimates in the Scheibehenne et al. (2010) study.
Using this different methodological approach, Chernev et al. (2015) found significant
effects on choice overload. The authors found that across studies, when participants were faced
with a large number of choices, in relation to moderating effects, the phenomena of choice
overload was present. These four moderating factors were “choice set complexity, decision task
difficulty, preference uncertainty, and decision goal” (Chernev et al., 2015, pg. 344). Choice set
complexity refers to the lack or presence of an attractive alternative and the similarity between
options. Decision task difficulty is described as attributes that increase the difficulty of choice, e.g.,
time constraints and consequences of choice. Preference uncertainty represents the presence of
whether the consumer already has a predefined preference. Finally, the decision goal refers to the
need to reduce cognitive effort (Chernev et al., 2015). In other words, the presence of choice
overload is predicted by the stakes of choice. A shopper grabbing a soft drink in an aisle filled with
choices during a leisurely Sunday is unlikely to face choice overload. In contrast, a consumer faced
with having to buy a computer a week before their university classes begin is more likely to face
choice overload under Chernev et al.’s model (2015).
McShane and Böckenholt (2018) further refined the approach of Scheibehenne et al. (2010)
and Chernev et al. (2015) with their meta-analysis. The authors claimed that the meta-analytic
techniques used by Scheibehenne et al. (2010) and Chernev et al. (2015) did not accurately capture
the complexity of choice overload. In response, McShane and Böckenholt (2018) used a multilevel
multivariate meta-analytic technique to incorporate all possible statistical information in studies.
The authors used the same 21 papers that Scheibehenne et al. (2010) and Chernev et al. (2015)
used in their meta-analysis. Their answer to the question of whether or not choice overload was a
real phenomenon was “it depends.”
19
The authors found that choice overload varies depending on what the dependent measure
is and what is the moderating factor. For example, choice overload was evident when the
dependent variable was regret when moderated by having a decision goal but was not evident when
moderated by decision task difficulty. Even in the presence of no moderator, choice overload
varied by the dependent variable. When the dependent variable is option selection, there is a more
significant effect of choice overload than when the dependent variable is satisfaction. McShane
and Böckenholt (2018) were not the first to demonstrate the nuance in choice overload using meta-
analytic techniques. Hwang and Lin (1999), in their meta-analysis examining bankruptcy
prediction studies, found that information overload fell into two categories: the breadth of the
information being given, and how often the information was repeated.
Though not written for the explicit purpose of a meta-analysis on choice overload, a case
study used in a methodological brief provided further meta-analytic evidence for the existence of
the choice overload phenomena. In a methodological brief illustrating the use of single-paper meta-
analyses, McShane and Böckenholt (2017) used a study on choice overload as one of their three
case examples. The authors use the data within the paper to rerun its analysis and find that the
original authors had likely overestimated their effect. The authors found that low choice difficulty
leads to consumer satisfaction, where few choices lead to less satisfaction. Further, when
consumers faced few choices with low choice difficulty, they were further dissatisfied. McShane
and Böckenholt (2017) found that the effect direction that the author reported was correct, but the
size of the effect was likely over-estimated.
Finally, researchers outside of the field conducted systematic reviews of choice
overload. Upon learning of the controversy surrounding meta-analyses of choice overload,
Simonsohn, Nelson, and Simmons (2014) reexamined the body of literature using a p-curve
analysis. Researchers employing a p-curve analysis examine the distribution of p-values in a body
of published literature. If the curve of the plotted p-values is flat or left-skewed, then this strongly
suggests publication bias. In comparison, a right-skewed p-curve suggests a true effect. In their
analysis of choice overload, Simonsohn et al. (2014) found that the published literature for more
choice having a negative outcome displayed a flat curve while the published literature suggesting
that more choice had a positive outcome had a right-skewed curve. Simonsohn et al. (2014)
interpreted this as providing evidence that there likely existed publication bias within the choice
20
overload literature. On the whole, there does not seem to be conclusive evidence for the existence
of choice overload as a construct.
The meta-analytic studies provide a controversial picture of the existence of choice
overload as a genuine phenomenon. Where Scheibehenne et al. (2010) found no meaningful effect
in their meta-analytic results, Chernev et al. (2015) did. Chernev et al. (2015) was critical of the
methodological approach of Scheibehenne et al. (2010). In turn, McShane and Böckenholt (2018)
were critical of both prior meta-analyses. That said, rather than providing conclusive evidence one
way or the other for the existence of choice overload, McShane and Böckenholt (2018) provided
a complex picture of choice overload. In conclusion, the meta-analytic evidence for the existence
of choice overload is mostly inconclusive.
Rurality
According to the Census Bureau, urban areas are dense territories that include residential,
commercial, and other non-residential land uses (United States Census Bureau, 2013). The U.S.
Census Bureau defines Urbanized Areas as 50,000+ people and Urban Clusters as at least 2,500
but less than 50,000 people (U.S. Department of Health and Human Services, 2013). While the
Census does not clearly define “rural,” it includes all population, houses, and territories not
included in the urban areas. However, since this definition does not follow any city or country
boundaries, it can sometimes be difficult to accurately determine whether a particular area is
considered urban or rural by their definition. One other important caveat to this is that researchers
found significant variation within federal definitions of rurality (Puryear & Kettler, 2017). Rural
communities closer to urban centers tend to have characteristics more similar to suburban
communities than to rural communities further away from urban centers (Puryear & Kettler, 2017).
Access to the goods and services afforded by urban centers likely leads to variance in
characteristics in rural communities.
In 2010, 71.2% of the U.S. population resided in urban locations, with 28.8% in rural parts
of the nation (United States Census Bureau, 2013). A 12.1% increase in urban population growth
occurred from 2000 to 2010, with 9.7% growth in the U.S. Hence, while the majority of the U.S.
population resides in urban communities, a significant portion (28.8%) reside in rural areas.
Additionally, though about 72% of the U.S. population resides in urban/suburban areas,
this only accounts for 10% of the country in terms of land area, meaning rural areas account for
21
roughly 90% of the country (United States Census Bureau, 2013). While land is a scarce
commodity at a premium cost in urban areas, rural areas are ripe with land waiting to be acquired
and used by businesses (Hawk, 2013). The possible savings on land and materials in rural
communities may make up for the low consumer population presence. Thus, it may be beneficial
for businesses to start or expand their commerce to rural areas. However, before making this drastic
transition, businesses must better understand the differences between rural and urban consumers.
Rural and urban/suburban populations differ in their access to goods and services (Kaufman,
Macdonald, & Lutz, 1997). Low-income residents are less likely to live in suburban households
where the consumers have greater access to a wider variety of food, including a greater range of
brands, qualities, and package sizes. Furthermore, rural consumers have reduced access to both
supermarkets and large grocery stores (Kaufman P. K., 1999). Supermarkets, in these
neighborhoods, generally are smaller in size and carry a narrower range of product assortments.
Even when these consumers have access to supermarkets, rural supermarkets have prices that are
about 4% higher, further limiting access to goods due to affordability. While many factors may
contribute to this phenomenon, Krebs-Smith & Kantor’s (2001) also showed that urban residents
have greater access to an ever-expanding variety of products such as food compared to their rural
counterparts.
Liese et al. (2007)’s study examined the accessibility to different food stores and assortment
availability in these stores. The findings suggest that rural communities have lower access to food
stores. Furthermore, food store distribution was heavily weighted towards convenience stores
(74%) versus larger supermarkets and grocery stores (16% and 10% respectively) in rural
communities. On the other hand, Urban communities reported a higher proportion of grocery stores
and supermarkets (36%-57%) compared to convenience stores (8%-41%). These findings are
notable because supermarkets and grocery stores sell a more considerable assortment of products
compared to convenience stores.
When analyzing grocery baskets of customers, scholars found that, on average, urban
consumers had more diverse food baskets compared to their rural counterparts (Liu, Shively, &
Binkley, 2013). Even when it comes to technology, there exists a wide gap in access to electricity,
television, radio, cell phones etc. among households in urban and rural areas of Tanzania
(Audience Scapes, 2013). The above findings suggest that rural and urban populations differ in the
amount of variety and options available to each population when purchasing products. Overall,
22
rural consumers tend to have less access to products and services compared to their urban
counterparts.
Previous studies report that rural consumers are accustomed to fewer assortments of product
options, which could result in a proclivity not to buy or defer purchasing a product when presented
with a large assortment of products. On the other hand, urban/suburban consumers are accustomed
to a greater variety of product options, possibly inoculating them to the effects of choice overload
on purchase behavior. Based on the above studies, this study will examine the differences between
rural and urban consumers in the likelihood to purchase products when presented with a large or
small assortment of options.
Millennial Purchase
Specifically, this study examines millennial’s (rural and non-rural) purchase behavior.
Millennials are an essential group for businesses to understand because of their current and future
purchase potential for several decades to come. Furthermore, advances in technology have led to
greater access to and use of the internet for both rural and urban consumers (Perrin & Duggan,
2015). From 2000 to 2015, internet use increased from 56%, 53%, and 42% to 85%, 85%, and 78%
for suburban, urban, and rural residents, respectively. Millennials are a technology-savvy group
who have grown up making purchases online, and technology is an everyday tool for them
(Mangold & Smith, 2012). Since shopping, internet shopping, and technology are significant in
the millennial’s life, this study explored differences in purchase behavior among rural and urban
millennials when presented with extensive or limited options.
Based on the above literature, the following research questions and hypotheses were tested:
• RQ1: To what extent do millennial rural and urban consumers differ in intention to
purchase products when they encounter limited options or an extensive number of options.
• H1: Rural consumers are more likely to purchase the product when they are
presented with limited options.
• H2: Urban consumers are more likely to purchase the product when they are
presented with extensive options.
• H3: Choice overload is negatively correlated with purchase intention.
• H4: Choice overload’s negative correlation with purchase intention is more
pronounced with rural consumers.
23
• RQ2: What thought processes and/or emotions come into play when millennial rural/urban
consumers encounter a large assortment of products?
• RQ3: What thought processes and/or emotions come into play when millennial rural/urban
consumers encounter small assortments of product?
• RQ4: When millennial rural/urban consumers encounter extensive or limited product
varieties, what influences their decision to purchase or defer the purchase of the product?
Online Purchase Behavior
Though an increasing number of businesses are participating in online sales, current
understanding of online consumer behavior continues to be in its infancy (Dennis, Merrilees,
Jayawardhena, & Wright, 2009). With the advent of the internet and computer, information search
has become more accessible (Park, Hill, & Bonds-Raacke, 2015). Consumers' use of technology,
particularly in the search step of purchase decision-making, results in varying degrees of cognitive
effort expenditures. These cognitive resources are limited, and when consumption surpasses this
limit, decision quality could suffer (Fiske & Taylor, 1984; Park, Hill, & Bonds-Raacke, 2015).
Additionally, studies suggest that online purchase behavior does not necessarily result in the same
outcomes as traditional shopping behaviors (Koufaris, 2002).
Internet use, even general internet use, is associated with higher amounts of product
purchases on the internet (Citrin, Sprott, Silverman, & Stem Jr., 2000). Other studies lend further
support claiming that the percentage of panelists purchasing products online increased as time
spent on the internet increased (Lohse, Bellman, & Johnson, 2000). The length of time spent on
the internet, including the number of months spent on the internet, number of hours per week spent
online, hours per week spent working online, time spent searching for products on the internet,
and believing that emails are crucial were all a significant predictor of online purchasing behavior
for 79 percent of the sample (Bellman, Lohse, & Johnson, 1999).
The above findings suggest a need to differentiate between online and offline purchase
behavior when trying to understand the consumer decision-making process.
• RQ5: What factors influence purchase decision-making in online situations, and how does
it differ from brick-and-mortar purchases?
• RQ7: How do small and large product assortments influence purchase decisions online?
• RQ6: How do these factors differ among millennial rural and urban consumers?
24
CHAPTER 3. METHODOLOGY
Overview
The purpose of this study was to explore the factors that influence millennial consumer’s
decision to buy or not buy when presented with extensive or limited product varieties. This study
used a mixed-methods approach, qualitative interviews, and quantitative survey instruments.
Quantitative Study
Participants
Participants were solicited via recruitment flyers and emails through the Midwestern
University listserv. Recruitment flyers were posted throughout the Midwestern University campus
by the researcher. Permission was obtained from the Office of the Registrar at the Midwestern
University to use the campus-wide student list-serve. The researcher then drafted an email
containing details about the study and a link to the survey and completed the Midwestern
University Registrar’s (DSE) Direct Student Email Request Form, which sends out emails to
specific students on campus. The Office of the Registrar then sent the email to all domestic students
attending the Midwestern University during the Spring 2017 semester (n = 31,145). The researcher
collected responses between April 27, 2017 and May 9, 2017. Of the eligible students, 1940
participated in the survey. This constitutes a 6.22% response rate. Previous studies that examined
purchase decision-making tended to have between 200 and 500 participants (Chernev, Böckenholt,
& Goodman, 2015). However, the model used in this study is relatively simple/small, necessitating
only between 125-200 participants.
Inclusion criterion
The Midwestern University students were selected as participants for the study owing to
easy access and because they are part of the millennial population. Additionally, the researcher
was only interested in examining U.S. consumer behavior and did not need to include samples
from other countries. As such, the researcher only included domestic students in the survey and
included an exclusion criterion for all international students. Furthermore, millennial students will
25
soon graduate and are expected to become consumers in the marketplace for decades to come,
making them a valuable population for businesses to understand when implementing new
strategies for products and services. Understanding these consumers' purchase decision-making
process will give stakeholders an edge in the U.S. consumer market.
Of the total participants, not all respondents fully completed the survey. In order for a
response to be included in the study, the participant must have stated whether they were from a
rural or urban/suburban local. Additionally, to be included, respondents must have completed the
portion of the questionnaire detailing purchase behavior. After considering these criteria, 233
responses were excluded from the final analysis.
Instrumentation
The researcher used several established survey questionnaires as a basis to assess different
factors that may influence purchase decisions: Park et al.’s Product Familiarity scale (1994) and
Hunter and Goebel’s scale of Information Overload (2008). Questions from these measures were
used to assess each items’ influence as a moderating factor between rural and non-rural groups.
The questions from the surveys were altered to fit the framework of the study better (see appendix
A.). The questionnaire surveyed participants on product familiarity and choice overload.
Product Familiarity
A self-assessed product familiarity scale, based on Park et al.’s (1994) assessment, was
administered to the participants to assess their level of familiarity with the products. The
standardized alpha for the original measure is .91 with a total item correlation ranging from .82
to .83. The questions were slightly altered to include the name of the product the participant is to
report on (see appendix A.).
Choice Overload
The choice overload scale is based on Hunter and Goebel’s (2008) scale of information
overload. The original scale reported reliability of .82. The questions were slightly altered to be
relevant to this study (see appendix A.).
26
Procedure
The researcher invited participants to complete an online survey/questionnaire, via
Qualtrics, that gathered data on their demographics (gender, age, rural or urban home town, etc.),
purchase intention, and other factors that may play a role in their online purchase decision-making
process. Additionally, the participants completed questionnaires about various background factors
that examined mediating effects on the model. The variables examined in this study include: choice
overload and product familiarity. After completing the demographic and background information
(including zip code and self-reporting of the location to differentiate rural and urban participants),
the researcher randomly assigned participants to purchase option groups (extensive options or
limited options) with information about the products. They were then asked about their intention
to purchase or defer the purchase of a product or products based on the information provided.
Product Variety
Several researchers have studied the influence of small versus large options varieties on
purchase behavior (Iyengar & Lepper, 2000; Reutskaja & Hogarth, 2009; Shah & Wolford,
2007). Previous researchers have operationalized the terms limited options to signify less than 10
products, usually between 5-8 varieties. Wide varieties were typically greater than 16, usually
around 25-30 product options. This was described as realistically large but not an unusually large
number of options. Based on the methods of previous researchers, this study presented 5 or fewer
options in the limited option group and between 25-30 options in the extensive option group.
Product Offerings
The researcher offered several products to the participants to examine the influence that
the number of options has on purchase decisions. First, the researcher asked the participants to
decide on purchase likelihood from a product they regularly purchase from the grocery store,
which is relatively inexpensive. The researcher presented participants with different varieties of
ice cream or potato chips. Only one brand of the product was used to prevent choice due to brand
preference. In this study, Haagen-Daz was the ice cream brand, and Lay’s was the potato chip
brand. These brands were selected because of the large variety of flavor options available for
27
purchase. The “average” flavors, such as chocolate, vanilla, plain potato chips, etc. were removed
to prevent the participant from choosing based on a pre-existing favorite.
The researcher asked participants about their purchase intention of a high-priced product
that is irregularly purchased. In this study, laptops were the product. Images of various brands of
windows laptops were presented to the consumer, with information detailing the product name,
price, storage space, ram, video card, graphics card, display size, battery life, keyboard size,
number of ports, dimensions, weight, and processor speed. The price of the laptops was limited to
a range of $300-900 because these represent low to mid-range laptop prices (Cavallo, 2017).
Multiple brands were used because no one brand had sufficient varieties of laptops within this
price range.
Finally, the researcher asked participants to select the likelihood of purchase from a product
that was low priced and infrequently purchased. In this study, Sandisk jump drives were presented
to the participants. They were presented with an image of the jump drive and informed that it was
120 GB size.
Correlation
Data were analyzed using R 3.3.1 software (Rstudio, 2016). An overall Spearman’s
correlation was calculated between respondents purchase intention and their reported feelings of
choice overload. A Spearman’s correlation is used because the measures that are being correlated
are ordinal data. This makes a parametric correlation inappropriate (Faraway, 2016).
Mean Comparisons
Initially, a series of mean comparison tests were run to analyze the difference between
treatment groups. Since the data is in the form of a Likert scale, the parametric studentized T test
is inappropriate to use as a test statistic (Faraway, 2016). One of the assumptions of a T test is
that the data is normally distributed (Faraway, 2016). Likert scale data is ordinal rather than
continuous. Due to this, the assumption of normality is violated (Boone & Boone, 2012). Boone
and Boone (2012) suggested the use of a non-parametric test. Given this, the Mann-Whitney U
test was used in this analysis. In essence, a Mann-Whitney U test is a non-parametric version of
the T test (Mann & Whitney, 1947).
28
The data uses multiple tests upon the same dataset. This can increase the likelihood of
committing a Type I error. McDonald (2012) suggests the use of the Hommel correction when
making a multiple comparison test. McDonald (2012) noted that a traditional p-value adjustment,
such as the Bonferroni, can be overly conservative.
Repeated measures analysis
A multi-level model was used to assess differences in choice overload between rural and
non-rural individuals. Individuals were tasked with assessing their purchase intention across four
sets of items. This design constitutes a nested design where individuals are repeatedly measured.
In these cases, a multi-level model is appropriate in order to control for the lack of independence
of observational units (Raudenbush & Bryk, 2002).
Observational unit
The observational unit for this analysis was the item conditions for each participant. Each
participant observed four conditions: ice-cream, potato chips, laptops, and flash drives. A set of
three questions were provided to the individual to assess their feelings of purchase overload.
Dependent variable
The dependent variable in this analysis was the purchase overload composite score. There
are four purchase overload composite scores associated with each participant. The four composites
are associated with each of the items that participants were surveyed on: ice-cream, potato chips,
laptops, and flash drives.
To calculate the composite score, the average of the three purchase overload Likert scale
questions associated with a single item was taken. For example, the composite purchase overload
score for an individual’s response to the ice cream condition was taken by adding the Likert scale
scores of the responses to the questions “The number of products available makes me feel
overwhelmed?”, “The volume of product information that I must choose from is frustrating?”, and
“The number of products available is stressful?”.
29
Rurality
The primary independent variable of this study is rurality. Study participants indicated
whether they were from a rural or non-rural locale. This variable was coded as a binary variable
where 1 indicated that the participant self-reported being from a rural locale. Of those surveyed,
26.86% self-reported being from a rural locale.
Sex
Self-reported sex was one of two covariates included in the model. Participants were asked
to self-report their sex. This variable was coded as a binary variable where 1 indicated that the
participant self-reported being a male. 37.65% of the participants indicated that they were male.
White
White was the second of two covariates in the model. Initially, this variable was coded as
a set of dummy variables that included other races/ethnicities besides White. Since 82.64% of the
sample indicated that they were White, the remaining subgroups comprised only 17.36%. Given
the lack of balance, Faraway (2016) suggested that it would be inappropriate to try to make
conclusions about a relatively small group of students. For example, Black students were only
2.42% of the sample (n = 43). Given these relatively small group sizes, the non-White subgroups
were combined into a single subgroup. Finally, this variable was coded as a binary variable where
1 indicated that the participant self-reported being White.
Many
This variable is an experimental condition used within the survey. This variable is a binary
variable where 1 indicates that the associated composite score is from the experimental condition
where the participant was asked to choose one item from the extensive choice set. In the other case,
0 indicates that the associated composite score is from the experimental condition where the
participant was asked to choose one item from a limited number of choices.

30
Type
This variable is an experimental condition used within the survey. This is a categorical
variable that denotes the item viewed by a participant from where the associated composite score
was calculated. There is one category associated with each of the four conditions: ice cream, potato
chips, laptops, and flash drives.
Buy
A final variable was included in the model that denotes whether a participant indicated that
they would purchase an item. This variable was dummy coded as a binary variable where 1
indicated that the participant indicated that they would purchase an item from the group presented
to them in the experimental condition.
Interaction terms
Three interaction terms were included in the model. The first was the interaction between
Rurality and Many. The second was the interaction between Rurality and Type. The third
interaction term was the interaction between Rurality and Buy. The interactions were chosen to
provide clarity between the relationship of rurality and purchase overload.
Model
Two models were used in this analysis. The first was a model containing only the main
effects. The second model added interaction effects. Both models were multi-level models. The
main effect model used in the analysis is as follow:
Choice overload = Rurality + Many + Type + Buy + White + Sex
+ Random Participant Intercept.
This model states that the composite score for an individual's self-reported indicators of purchase
overload is predicted by being from a rural local, the number of items they were presented, the
type of items they were presented, whether the participant intended to purchase an item, whether
31
they are White, and their self-reported gender. Further, the intercept varies in the model by
participant.
The second model contained all main effects but included the interactions between rurality,
the experimental conditions, and a participants intention to make a purchase. The model also
included a term for the random intercept. The model used in the second analysis is as follows:
Choice overload = Rurality + Many + Type + Buy + White + Sex + Rurality x Many +
Rurality x Type + Rurality x Buy + Random Participant Intercept.
The analysis was conducted using the lme4 package for R (Bates, Sarkar, Bates, & Matrix,
2007). The lme4 package does not calculate p-values. The p-values shown in the analysis were
calculated using the lmerTest package for R (Kuznetsova, Brockhoff, & Christensen, 2017). The
lmerTest calculates model p-values by using a Sattherwaite approximation to calculate error
degrees of freedom. These degrees of freedom are then used to obtain a p-value in conjunction
with the Wald T statistic provided by the lme4 package. Finally, model assumptions were checked
using R.
Qualitative Study
Participants
The study primarily interviewed undergraduate and graduate Midwestern University
students whose hometown was in either rural or urban/suburban locations. Only domestic students
were invited to participate because this study is primarily examining U.S. rural and urban
consumers. This research compares the differences between rural and non-rural consumers in
purchase decision-making. Since we are researching millennial purchase behavior, college
students are adequate participants for the interviews. Additionally, college students are easy to
access since the study was completed on a college campus in the Midwest. The solicitation
continued until 12 participants completed the interviews. A sample of 12 participants were used
because 12 participants provide sufficient information to achieve qualitative research goals (Patton,
2002). Although wide variability exists among scholars on the number of participants needed to
achieve saturation, previous studies have concluded that saturation occurred within the first 12
32
interviews (Guest, Bunce, & Johnson, 2006). Additionally, the goal was to get close to equal
numbers of both genders and geographic locations because this will help compare between the
groups (Englander, 2012).
Procedure
The initial respondents were screened to confirm their backgrounds. This was
accomplished by asking the participants to complete a short, initial survey. The interviewees were
asked to provide zip codes for their hometown, whether they were primarily raised in a rural or
urban/suburban location, whether they are domestic students, and if they are over the age of 18.
Students who were under 18 and who were international students were disqualified from
participating in the interviews because the study only researched the purchase behavior of U.S
millennial participants. Of the remaining participants, the students were sent an email indicating
that they were selected based on their responses to the initial screening process. The e-mails
provided them further information about the study and invited the students to schedule a time for
the interviews. The interviews were conducted in a reserved, private room in one of the buildings
on campus. The interviewee’s participated in an in-depth, semi-structured interview asking about
their purchasing behaviors, current and past. Before agreeing to participate in the study, the
students were informed that the interview will be semi-structured and may take up to 2 hours. They
were also informed that the interview would be audio recorded. Once the students have agreed to
participate, a time and location were set up based on the participant’s convenience.
On the day of the interview, the researchers elaborated on some basic information about
the study and its purpose. The researcher also explained the confidentiality policy with the
participant. The participant was, once again, reminded that the interview would be audio-recorded
and later transcribed. Once the participant understood the agreement and purpose of the study,
he/she was asked to sign the consent form, agreeing to participate in the study.
After the formalities were completed, the interview process began. Consistent with
Moustakas’s (1994) approach to phenomenological interviewing, the interview was completed via
systematic steps. The phenomena of interest for this study are factors that play a role in the
consumer’s decision to buy or not buy products. Such factors could include emotions at the time
of purchase, environmental influencers, upbringing, etc. The questions targeted the participants'
lived experiences with purchase decisions while removing the researchers own experiences from
33
the equation. Although removed from the study, the researcher still played the role of a guide to
direct participants in expressing their experience of the purchase decision-making process (Angen,
2000; Guba, 1996).
The interview/think-aloud protocols were structured to gather information about the
participant and his/her past environment. This can include the environment they grew up in,
including descriptions of the stores they frequented. Based on the participant’s responses to the
above questions, further questions were asked to delve deeper into the answers, focusing on
questions that solicited descriptions of the experiences to better understand the shared experiences
in decision-making between rural consumers and between urban consumers.
Based on information gathered, the interviewer delved deeper into the participants'
shopping experience both in brick-and-mortar stores and online. They then asked probing
questions about the influence that the number of options available for a product played in the
consumer purchase decision.
All the recordings were then transcribed and analyzed for themes.
Analysis. After the interviews, either the researcher or an outside transcription service transcribed
the recordings so the researcher can analyze the resulting text. In-line with the constructivism
(interpretive) paradigm, through analysis of the data, the researcher’s goal was to gain a better
understanding of people’s subjective understanding of the decision-making process and its link to
the participants' decision behavior (Moustakeas, 1994). To accomplish this goal phenomenological
approach was used to analyze the transcriptions. Similar to the interview process in
phenomenology, it is crucial for the researcher to detach their own judgment and preconceived
notions when analyzing the data (Holroyd, 2001). Essentially, they must, once again, separate
themselves from the data to understand only the participant’s experience of the phenomenon
without the interference of researcher bias.
In the phenomenological approach, several stages exist in analyzing the data (Holroyd,
2001). The first step is to intuitively understand the data, which may involve repeatedly reading
and rereading the transcriptions. Next, the researcher constructed a constituent profile by
summarizing the raw data of each participant; this is the movement of objects as facts to essences
(Holroyd, 2001; Creswell, 2007). This is accomplished by extracting natural meaning units
(NMUs), which are discrete expressions of a participant’s experiences of the decision-making
process. These NMU’s are condensed to identifiable sentences that communicate a distinct
34
expression of the experience, referred to as a central theme. Finally, reconstituting the central
themes to remove irrelevant or repeating statements delivering a non-repetitive list of descriptive
statements for each participant completes the constituent profile.
The constituent profiles were then used to form a thematic index for rural participants and
one for urban participants, which highlights major themes that appear in the data. First, repeating
and irrelevant statements were removed from the constituent profile statements, similar to what
was done to create the constituent profile. Next, a search was completed to find referents within
the profiles that were then isolated and listed separately. Referents were specific terms that
emphasize the meaning of the experience in the purchase decision-making process. Finally, the
thematic index contains the constituent’s profiles, statements, themes, and referents that can be
used to collectively examine the data and compare the rural and urban populations.
This enables the ability to compare profiles, statements, themes, and referents to create
interpretive themes with attention on data that reveals the meaning of experience and the distinctive
information that emerges for rural and urban consumers. These interpretive themes were used to
find meanings ascribed to the phenomenon. In this case, it is the purchase decision-making process,
which was then summarized to provide an in-depth representation of the participants’ and each
groups’ experience of the decision-making event. Subsequently, it is possible to examine the
experience of the phenomenon for each of the groups, rural and urban. Then, the researcher was
able to pinpoint significant differences that were revealed. An additional step, coined by Moustaka
(1994), involves including the researchers' own experiences as well as the contexts influencing
said experiences.
35
CHAPTER 4. RESULTS
Quantitative Study
Respondents
In total, 1,940 respondents participated in the survey. Of those, 1,706 completed all
portions of the survey and were included in the analysis. Of those, 458 indicated that they were
from rural locals, and 1,248 indicated they were from non-rural locales.
Correlational and mean Comparison Results
The full results of the survey can be seen in Table 1. The overall correlation between
purchase intent and choice overload across respondents was -.14. This provides evidence that there
is a small negative correlation. Due to its small size, though, it is likely not practically significant.
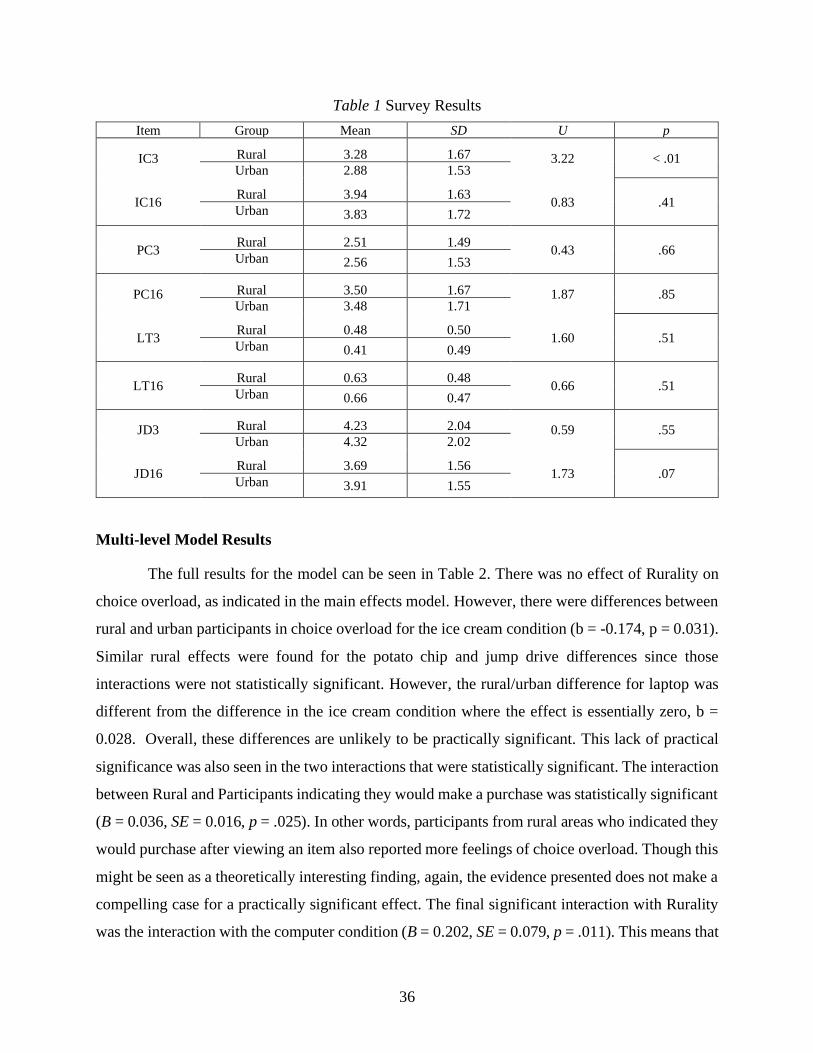
Of the mean comparisons conducted, seven of the eight questions on the survey provided
evidence that there was no difference between rural and non-rural respondents. Extensive choices
for ice cream had a mean group difference of 0.11 (U = .83, p = .41). Limited choices for potato
chips had a mean group difference of 0.05 (U = .43, p = .66) where many choices for potato chips
had a mean group difference of 0.02 (U = 0.19, p = .85). For infrequent purchases that are high
priced, group differences were not significant when faced with few choices (U = 1.60, p = .11) or
many choices (U = 0.66, p = .51). Similarly, for infrequent purchases that are low priced, group
differences were not significant when faced with few choices (U = 0.59, p = .55) or many choices
(U = 1.73, p = .07).
Only one item in the survey showed a significant difference between groups. For an ice
cream with few choices, the groups were statistically different (U = 3.22, p < .01). Given the fact
that only one of the items showed a significant group difference, caution should be used in
interpreting this result. Rather than there being a meaningful effect, it is possible that this result is
due to chance. Calculating Cohen’s d (Faraway, 2014) provides an effect size difference between
the groups of .26. This effect size difference does not lead to an interpretation of practical
significance between the groups. Thus, with the combined evidence of being the only item with
statistical significance and a relatively small effect size, these results suggest that the group
difference likely stems from statistical noise.
36
Table 1 Survey Results
Item Group Mean SD U p
IC3 Rural 3.28 1.67 3.22 < .01 Urban 2.88 1.53
IC16 Rural 3.94 1.63
0.83 .41 Urban 3.83 1.72
PC3 Rural 2.51 1.49
0.43 .66 Urban 2.56 1.53
PC16 Rural 3.50 1.67 1.87 .85 Urban 3.48 1.71
LT3 Rural 0.48 0.50
1.60 .51 Urban 0.41 0.49
LT16 Rural 0.63 0.48
0.66 .51 Urban 0.66 0.47
JD3 Rural 4.23 2.04 0.59 .55 Urban 4.32 2.02
JD16 Rural 3.69 1.56
1.73 .07 Urban 3.91 1.55
Multi-level Model Results
The full results for the model can be seen in Table 2. There was no effect of Rurality on
choice overload, as indicated in the main effects model. However, there were differences between
rural and urban participants in choice overload for the ice cream condition (b = -0.174, p = 0.031).
Similar rural effects were found for the potato chip and jump drive differences since those
interactions were not statistically significant. However, the rural/urban difference for laptop was
different from the difference in the ice cream condition where the effect is essentially zero, b =
0.028. Overall, these differences are unlikely to be practically significant. This lack of practical
significance was also seen in the two interactions that were statistically significant. The interaction
between Rural and Participants indicating they would make a purchase was statistically significant
(B = 0.036, SE = 0.016, p = .025). In other words, participants from rural areas who indicated they
would purchase after viewing an item also reported more feelings of choice overload. Though this
might be seen as a theoretically interesting finding, again, the evidence presented does not make a
compelling case for a practically significant effect. The final significant interaction with Rurality
was the interaction with the computer condition (B = 0.202, SE = 0.079, p = .011). This means that
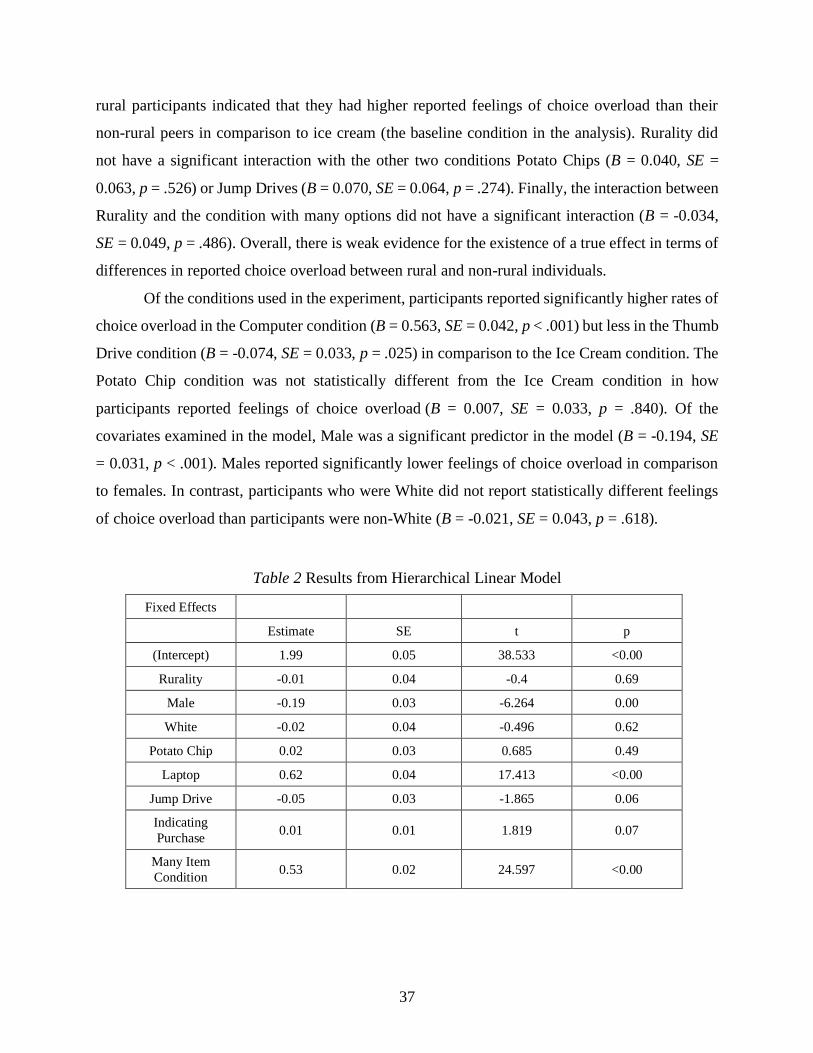
37
rural participants indicated that they had higher reported feelings of choice overload than their
non-rural peers in comparison to ice cream (the baseline condition in the analysis). Rurality did
not have a significant interaction with the other two conditions Potato Chips (B = 0.040, SE =
0.063, p = .526) or Jump Drives (B = 0.070, SE = 0.064, p = .274). Finally, the interaction between
Rurality and the condition with many options did not have a significant interaction (B = -0.034,
SE = 0.049, p = .486). Overall, there is weak evidence for the existence of a true effect in terms of
differences in reported choice overload between rural and non-rural individuals.
Of the conditions used in the experiment, participants reported significantly higher rates of
choice overload in the Computer condition (B = 0.563, SE = 0.042, p < .001) but less in the Thumb
Drive condition (B = -0.074, SE = 0.033, p = .025) in comparison to the Ice Cream condition. The
Potato Chip condition was not statistically different from the Ice Cream condition in how
participants reported feelings of choice overload (B = 0.007, SE = 0.033, p = .840). Of the
covariates examined in the model, Male was a significant predictor in the model (B = -0.194, SE
= 0.031, p < .001). Males reported significantly lower feelings of choice overload in comparison
to females. In contrast, participants who were White did not report statistically different feelings
of choice overload than participants were non-White (B = -0.021, SE = 0.043, p = .618).
Table 2 Results from Hierarchical Linear Model
Fixed Effects
Estimate SE t p
(Intercept) 1.99 0.05 38.533 <0.00
Rurality -0.01 0.04 -0.4 0.69
Male -0.19 0.03 -6.264 0.00
White -0.02 0.04 -0.496 0.62
Potato Chip 0.02 0.03 0.685 0.49
Laptop 0.62 0.04 17.413 <0.00
Jump Drive -0.05 0.03 -1.865 0.06
Indicating
Purchase 0.01 0.01 1.819 0.07
Many Item
Condition 0.53 0.02 24.597 <0.00
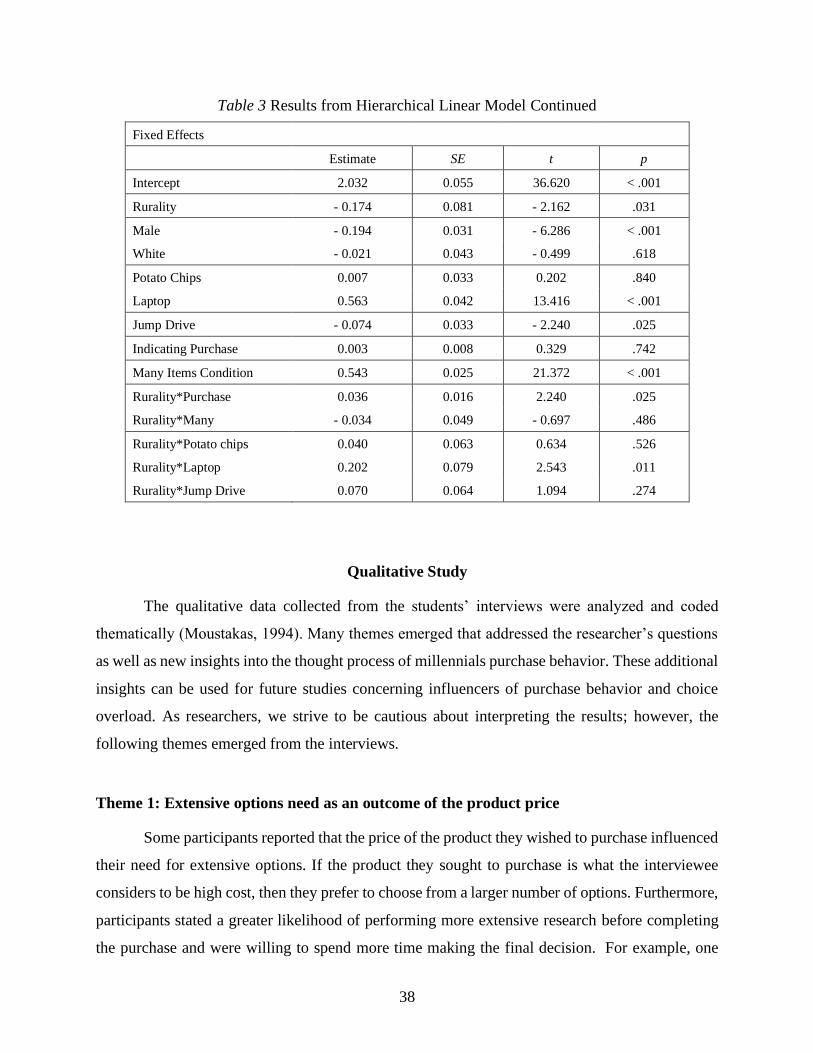
38
Table 3 Results from Hierarchical Linear Model Continued
Fixed Effects
Estimate SE t p
Intercept 2.032 0.055 36.620 < .001
Rurality - 0.174 0.081 - 2.162 .031
Male - 0.194 0.031 - 6.286 < .001
White - 0.021 0.043 - 0.499 .618
Potato Chips 0.007 0.033 0.202 .840
Laptop 0.563 0.042 13.416 < .001
Jump Drive - 0.074 0.033 - 2.240 .025
Indicating Purchase 0.003 0.008 0.329 .742
Many Items Condition 0.543 0.025 21.372 < .001
Rurality*Purchase 0.036 0.016 2.240 .025
Rurality*Many - 0.034 0.049 - 0.697 .486
Rurality*Potato chips 0.040 0.063 0.634 .526
Rurality*Laptop 0.202 0.079 2.543 .011
Rurality*Jump Drive 0.070 0.064 1.094 .274
Qualitative Study
The qualitative data collected from the students’ interviews were analyzed and coded
thematically (Moustakas, 1994). Many themes emerged that addressed the researcher’s questions
as well as new insights into the thought process of millennials purchase behavior. These additional
insights can be used for future studies concerning influencers of purchase behavior and choice
overload. As researchers, we strive to be cautious about interpreting the results; however, the
following themes emerged from the interviews.
Theme 1: Extensive options need as an outcome of the product price
Some participants reported that the price of the product they wished to purchase influenced
their need for extensive options. If the product they sought to purchase is what the interviewee
considers to be high cost, then they prefer to choose from a larger number of options. Furthermore,
participants stated a greater likelihood of performing more extensive research before completing
the purchase and were willing to spend more time making the final decision. For example, one
39
24-year-old rural participant reflected, “I think if something is higher priced I would want more
options but I would also spend a lot more time making a decision. So I think with something like
a light bulb if it doesn’t like really matter because it is low cost and all I need like a specific watt
that doesn’t really matter I would go and grab whatever is the cheapest one of the type of light
bulb I want. But as far as a phone definitely more options and would be better and I would do a lot
more research about it. I would spend a lot more time deciding.”
Additionally, participants stated that they would be meticulous about a product and its
qualities when the product was higher cost. For instance, a freshman, suburban participant stated
that “If it is high priced I would be more particular about it.” The interviewees also indicated that
they would be less likely to purchase the product if it was expensive and the retailer offered few
selections. For example, the same participant responded she was “less likely to buy if too few” and
another suburban, graduate student responded that “but maybe for something like that where it's
high priced, I don't know much about it, probably not stressful but a little more like I'm a little
more cautious. I want to make the right decisions and not the right decision but one that makes
sense for the situation.” Overall, the responses indicate that consumers prefer a greater variety of
options when purchasing high-cost items. Additionally, participants also reported that they are
willing to expend more effort to research and are more selective when purchasing expensive
products compared to less expensive items.
Theme 2: Purchase intention based on the current necessity for product
Several participants reported that the need for a particular product influenced their decision
to purchase the product versus deferring the purchase. If the item in question is one that is a
necessity, the participants were more likely to purchase the product versus going elsewhere or
purchasing the item at a later date. This was reported by a suburban graduate student who stated
that “I needed them and I didn't have time to go somewhere else.” and a rural undergraduate who
discussed her reasoning for purchasing a computer by stating “yeah, I needed one for school, so.”
However, if the product was not essential or was not required for an extended time period,
then the participants reported that they were likely to defer the purchase until a later time or were
willing to search a different venue. For instance, a suburban undergraduate participant reflected
on her experience while purchasing a pair of jeans by stating, “sometimes I would just say oh go
40
home maybe I will like maybe buy another time and just forget about it because I don’t really need
it that much.”
Additionally, when the product was not essential, the participants were more likely to
choose based on other factors, particularly price. The interviewees reported usually purchasing the
cheaper of the options presented. For example, a rural undergraduate interviewee reflected that “if
I were in a hurry I would be most likely to grab the cheapest one.” However, another participant
reflected on their decision to purchase lunch meat, saying, “I bought one of them, yeah. Because I
needed it and I was like, "well, I just have to pick one," and so I just picked the biggest package
that they had.” Finally, another suburban, undergraduate student revealed his experience buying a
computer part stating, “well I needed it and I chose the better of the two that and the price were
very different from one another.” In summary, the current necessity for a product dictated purchase
behavior. When participants had an immediate need for the product, they reported more
willingness to purchase a product immediately rather than shop around at other markets. On the
other hand, when an item was not immediately needed, participants reported more willingness to
choose items based on other variables, predominantly price.
Theme 3: Option availability in online versus physical stores
The participants explained how their purchase behavior differs in online situations
compared to physical stores. A number of participants explained that they are more willing to
purchase a product when they encounter limited options in a brick-and-mortar store, compared to
online stores, because they would have to physically go to another store to find additional or
different options. This was illustrated by a suburban graduate student vocalizing her thoughts when
comparing online vs. in-person purchase behavior stating, “I think if I'm in a store, I think I'm
likely to get something because I don't want it to be wasted time either. If I'm online I know that
if sometimes just I've given up because online it's easy just to go back to it.” However, if they are
shopping online, it is much more efficient to go to another website to search for more product
options than to travel to another store. For instance, participants expressed that “online it is easier
to compare all the different options” and in a physical store “you have would have to leave and go
to another store whereas online you could just check other sites and that is a lot easier.”
Furthermore, participants reported a greater desire for more options online because “online it is
easier to compare all the different options.” As such, limited option availability was a more
41
significant deterrent to purchase intention online as opposed to in-store. Generally, the participants
conveyed a greater willingness to shop multiple vendors online rather than physical stores due to
ease and convenience.
Theme 4: Extensive options and level of expertise/interest
The majority of the interviewees experienced unfavorable feelings when they encountered
an extensive assortment of options. In particular, the participants reported feeling overwhelmed.
For example, one rural graduate student reported how he felt “there was at least 500 choices and
it was overwhelming” and another suburban graduate student reported feeling “really confused
because there is just so many different things that are the same, where it's just stressful” regarding
the number of vitamin options to choose from.
However, after speaking with the participants, it became clear that the feelings experienced
correlated with other factors. The main factors being the level of interest and level of expertise
about the particular product.
The consumer's level of knowledge and interest appears to play a critical role in the need
for extensive options. Participants preferred a higher number of options when purchasing a product
they were more knowledgeable about and/or more interested in. One participant, with interest in
computers, explained, “at least with technology, I prefer more options than not. Just because then
you can compare and contrast all sorts of things.” and how “if there were too few options, that
would have been more annoying than too many options. In that specific case.” For this particular
participant, his explanation was grounded in the fact that computers/technology is something he is
very knowledgeable about/interested in.
Additionally, these participants stated experiencing fewer negative emotions
(overwhelmed) when presented with a higher number of options for products they were
knowledgeable about compared to purchasers presented with little or no expertise in the product.
This was expressed by an urban undergraduate discussing his feelings about purchasing sewing
supplies by stating that “I would feel, honestly, overwhelmed on that one. Just because I don't
know a lot about it, so I literally just basing everything by the box. And so I feel like I would have
definitely a tougher time.”
42
Overall, the participants indicated feeling fewer negative emotions and a greater desire for
extensive options when purchasing goods they had extensive knowledge or interest in versus
consumers with little or no interest or knowledge about the product.
Theme 5: Internet as a research and/or purchase medium
Interviewees also reported using the internet as a research resource while purchasing the
product in a physical store. The consumers were able to research and compare reviews, product
options, product prices, etc., online before or during their visit to a storefront. An example is a
suburban graduate student who explained that he “looked online first. But then I went to brick and
mortar” and another rural graduate student who explained that for big purchases, she “might look
online just to check things out. But then I would probably buy it in person, yeah.” Additionally,
another participant expressed her research habits about an unfamiliar product explaining, “I was
also trying to research about it online like look up reviews while I was shopping”. In contrast,
another student explained his process when discussing purchasing a product he is very familiar
with by stating, “Yeah, I would probably look online to see what the options-- what are they
making? It's been a while, so what are they making now?... I could probably search the price
online”. Overall, multiple participants expressed a desire to use the internet for research purposes,
regardless of where they purchased the product.
However, participants also reported the ease of internet purchases, mainly when presented
with extensive options, due to the online stores' ability to filter. Specifically, participants can filter
products based on various criteria to narrow down options, making a large number of products
easier to digest. For example, one interviewee explained how he used the internet as a research
tool when purchasing a computer stating, “on the internet you can narrow down your specifications.
Say I want a screen that is between 13 and 17 inches and only display and keep adding a criterion.
So, more options are good in that case for me.” In summary, the participants expressed their use
of the internet as a research tool and to help narrow down options whether they ultimately purchase
the item online or in-person.
43
Theme 6: Internet versus physical store preference
Although many millennials prefer purchasing some products online, there are some who
prefer purchasing products in the store. Specifically, the consumers want to purchase certain
products in-store because it provides them the opportunity to interact with the good in question.
Products included electronics, clothes, and enthusiast products. For example, a participant
explained their process in purchasing a computer expressing, “I’ll do research using both formats.
But when it comes to final purchasing, I will most likely go to the physical store itself.” He goes
on to explain his reasoning, stating that in a physical store, a person can “touch and feel. Mess
around with it.” Another respondent reported that she “don’t really like buying online because I
can’t try them on” when discussing sweaters.
The need to interact with the product appears to be particularly crucial with high-cost
products such as electronics. Consumers reported the necessity to manipulate the good to have a
better understanding of how it feels and looks. For instance, one rural undergraduate stated, “I'd
probably prefer to get them at a store, because with a bat, if I'm going to-- the good bats are 250,
300 bucks each, you're shelling out an investment. You can use them for several years, but it's a
still a lot of money to drop at one time. So I prefer to be able to hold it and swing it and know how
it's going to feel,”. Yet another participant reported, “…..I would go to the store and feel them,
basically. Touch the ones that I was interested in, and then with phones nowadays, I could probably
search the price online, and if it's not I'll just determine which one based on the touching and how
it looks and how does it look in person, how big it is…..” when discussing rock climbing equipment.
Overall, the interviewee’s reported preference for in-person purchase for expensive, enthusiast,
and specific other goods where interacting with the product was essential to making the final
purchase decision.
Theme 7: Limited product options lead to experiencing negative emotions
When the participants encountered limited options, many reported experiencing negative
emotions, including frustration and disappointment. One respondent said, “can we go negative,
because I was very annoyed” when discussing the limited vegetable options available to her.
However, another participant said, “so I was frustrated by the other two options weren’t what I
wanted” due to the limited variety of stock available for purchase.
44
Additionally, participants reported fewer negative emotions and higher positive emotions
when encountering products they are less familiar with or less knowledgeable about. In other
words, when presented with a product, the participant was less knowledgeable about, almost all
of the participants reported negative feelings if they encountered extensive product options.
However, more than half of the participants reported neutral or positive feelings when presented
with the limited product options. For example, one of the participants said, “as an engineer also,
just how I am. How I am wired to get the specifics of that. Because I am like I want to walk in
and grab the thing and leave. When there are more options and I don’t know exactly what they
want. That is when I like ahh. Sheesh” when attempting to purchase ranch dressing for his
mother.
In conclusion, experiencing negative emotions when presented with limited options is
very nuanced. According to the responses, other factors play a role in how options variety
influences feelings of choice overload and purchase.
Discussion
Scholars have debated the extent that choice overload influences purchase behavior
(McShane & Bockenholt, 2018). The findings from this study provide evidence that the number
of options available to consumers influences purchase decisions and satisfaction, but this effect is
moderated by several factors. For example, when a product was considered expensive, consumers
preferred a higher number of options. Additionally, consumers were also willing to devote more
time to extensively research these high-cost products prior to making the final purchase decision.
In this chapter, for each research question, I discuss the results from the study in the context
of my hypotheses. Further, I describe how the results of this study fit into the existing body of
literature on purchase behavior and how it extends the current literature. I conclude with a
summary of the findings and the overall theme of those findings.
Overall, the results demonstrate a statistical difference between rural and non-rural
participants in their reported feelings of choice overload for some product conditions. When
interaction effects are not in the model, the results do not support a difference between rural and
non-rural consumers in their feelings of choice overload. Rurality by itself did not predict choice
overload. Rurality, when faced with many choices or when presented with the laptop condition,
helped predict the experience of choice overload. Overall, the findings suggest that rurality is a
45
better predictor of choice overload when moderated by other conditions, specifically, number of
options and type of good, in this study. These findings align with the results of Chernev,
Böckenholt, & Goodman (2015) and McShane & Bockenholt (2018) that experiencing choice
overload is moderated by various other factors. However, the overall effect is small and suggests
that findings represent a statistical difference but may not be practically significant. Additionally,
the data support both statistical and practical significance, the existence of choice overload in two
of the conditions measured. First, when consumers were presented with a wide variety of options,
the participants reported more feelings of choice overload. This was consistent in both rurality
groups; no differences were present between the rural and urban sample population. Second, when
participants were presented the laptop option in the extensive option set, participants were more
likely to report feelings of choice overload. Additionally, rural participants reported greater
feelings of overload than their non-rural counterparts, only on the Laptop condition. However,
since these results were not replicated in the other conditions, these findings should be approached
with caution since it is difficult to determine if this is due to the high cost associated with the
Laptop or due to rurality. This is consistent with prior research by Chernev et al., 2015 suggesting
that decision task difficulty is a moderating factor in choice overload. Specifically, since laptops
are considered high-cost items, participants were more likely to experience feelings of choice
overload. Similarly, these results were consistent among both groups, rural and urban.
• RQ1: To what extent do millennial rural and urban consumers differ in intention to
purchase products when they encounter limited options or an extensive number of options.
• H1: Rural consumers are more likely to purchase the product when they are
presented with limited options.
• H2: Urban consumers are more likely to purchase the product when they are
presented with extensive options.
The quantitative study examined the extent to which millennial rural and urban consumers
differed in intention to purchase various types of products when presented with limited or
extensive options.
I hypothesized that urban consumers would be more likely to purchase the product when
they are presented with extensive options and that rural consumers are more likely to purchase the
product when they are presented with limited options. Overall, the quantitative evidence from my
46
study does not support this hypothesis. Of the 8 items, only one was statistically different between
groups. The low cost, frequently purchased item (ice cream) was statistically different between
groups. However, the other low cost, frequently purchased item (potato chips) was not. This
suggests that the observed group difference between rural and urban millennial purchasers was
likely due to chance rather than an inherent and practical group difference. This result extends the
work of McShane & Bockenhold (2018), by providing more context that one of the variables that
likely do not influence purchase behavior is rurality. One important caveat to this finding is that
this study only examined millennials. Differences in purchase behavior may exist among rural or
non-rural locals among non-millennials. Scheibehenne et al. (2010), Chernev et al. (2015), and
McShane and Böckenholt (2018) suggest that different moderating and dependent variables may
influence the final result. As such, rurality might play a role in purchase intention but not in this
specific study design. Furthermore, the 2010 decade gave rise to various arguments by researchers
concerning the existence and influence of choice overload. However, the multiple meta-analysis
provided inconclusive evidence concerning choice overload as a phenomenon.
• H3: Choice overload is negatively correlated with purchase intention.
The hypothesis stated that choice overload would negatively correlate with purchase
intention. The results support the hypothesis because choice overload and purchase intention are
weakly negatively correlated. Further, participants experienced more feelings of choice overload
when exposed to the extensive option criteria in comparison to the limited option criteria. While
the finding was statistically significant, it does not appear to be practically significant. These
findings align with meta-analysis results of Chernev et al. (2015) and McShane and Böckenholt
(2018) that choice overload is contingent on both moderating variables and the dependent variable.
In this study, when participants were exposed to the extensive option criteria, participants were
more likely to experience choice overload. These results are supported by Chernev et al. (2015)
and McShane and Böckenholt (2018), who argued that choice overload is a very nuanced variable
dependent on several factors. Overall, meta-analytic studies failed to provide conclusive support
for the existence of choice overload. While Scheibehenne et al. (2010) failed to find a meaningful
effect, Chernev et al. (2015) appeared to find an effect. Furthermore, Scheibehenne et al. (2010)
and McShane and Böckenholt (2018) were both disparaging of prior meta-analysis on the subject.
47
• H4: Choice overload’s negative correlation with purchase intention is more pronounced
with rural consumers.
Similarly, it was hypothesized that choice overload’s negative correlation with purchase
intention would be more prominent in the rural population compared to the urban population. The
research findings did not lend support to the hypothesis. When rural consumers were presented
with extensive option criteria, data suggests they were less likely to report feelings of choice
overload, but the results were not statistically significant. However, in the laptop condition, rural
participants reported higher feelings of overwhelm than their non-rural counterparts. The results
of the study appear to line up with previous meta-analysis results of Simonsohn et al. (2014),
Chernev et al. (2015), and McShane and Böckenholt (2018) because the results do not provide
conclusive results. The researchers discovered that choice overload varied significantly with both
the dependent measure and moderating factors. As such, evidence of choice overload may change
if the study examined different dependent variables or included other moderating variables. The
findings of this study suggest that one such factor could be price, as laptops are higher priced than
the other options in this study. Additionally, even examining previously published results
suggested the existence of publication bias when more choices had positive outcomes (Simonsohn
et al. 2014). Consequently, it is difficult to support the theory of choice overload conclusively.
• RQ2: What thought processes and/or emotions develop when millennial rural/urban
consumers encounter a large assortment of products?
This study examined the thought processes and/or emotions develop when millennial
rural/urban consumers encounter a large assortment of products. The interviews suggest that price
influenced participants need for extensive options. This was particularly true for high-cost products
where participants preferred a greater number of options when making their selection. Additionally,
interviewees reported a higher likelihood of completing an extensive search on the product and
spending more time deciding on the final choice.
Price being a primary influencer is not unexpected since the participants in this study were
all college students, both graduate and undergraduate, and reported that they were limited in cash.
Additionally, high-cost items tend to be items that are consumed over extended periods of time.
These may be products the participants will use for several years, if not more, such as laptop
48
computers, television, car, couch, etc. Also, these are not products that can be easily replaced when
limited in funds. As such, participants were more likely to demand a broader assortment of options
and to scrutinize the availability of warranty and reviews on reliability.
Another factor that influenced purchase decision-making was the level of interest/expertise
in the product. Specifically, when participants sought to purchase a product that they reported a
high level of knowledge about, they were more likely to report neutral or positive emotions when
they encountered a wider variety of product options. On the opposite end of the spectrum, when
an extensive set of options for products were presented to the interviewees, that they were less
knowledgeable about, they reported a higher likelihood of feeling negative emotions. In other
words, the results suggest that participants prefer extensive product options for items they possess
greater interest in/knowledge about. Previous research supports the belief that personality traits,
including personal skills and level of experience, influence the feelings of overload (Eppler &
Mengis, 2004). McShane & Bockenholt (2018) noted in their meta-analysis a similar phenomenon.
Across studies, in their meta-analysis, participants that were presented with a combination of
numerous options of unfamiliar products, they experienced choice overload. In contrast, when they
were presented with many products of which they were familiar with, they did not experience
choice overload. McShane & Bockenholt (2018) believed that the participants were able to rely
upon prior knowledge to help them narrow down the choices quickly.
• RQ3: What thought processes and/or emotions come into play when millennial rural/urban
consumers encounter small assortments of product?
Similar to extensive option criteria, the level of knowledge/interest about a good influenced
their purchase decision process. However, when participants were shopping for commodities they
were unfamiliar with, they were more likely to report pleasant reactions when presented with fewer
product options and more likely to convey unpleasant impressions when presented with extensive
product options. These findings align with and extend the findings by McShane & Bockenhold
(2018), which examined moderating factors in choice overload.
• RQ4: When millennial rural/urban consumers encounter extensive or limited product
varieties, what influences their decision to purchase or defer the purchase of the product?
49
When millennial rural/urban consumers discussed purchasing from an extensive/limited
variety of goods, several factors influenced their willingness to buy the product. First, consumers
reported a need for more options when seeking a high priced good/service. High priced items are
a long-term investment asset dictating the need to have access to all possible choices to help make
a more informed decision. Additionally, not only did consumers report completing a more
extensive investigation of the good, but they were particular about the product and the product's
qualities. Overall, both groups (rural and urban/suburban) reported similar findings. These results
align with previous studies backing an increasingly similar purchasing experience between the
millennial groups (Mangold & Smith, 2012; Perrin & Duggan, 2015; Dennis, Merrilees,
Jayawardhena, & Wright, 2009). However, the findings do not support a difference between the
groups when presented with extensive/limited options when purchasing high-cost goods.
• RQ5: What factors influence purchase decision-making in online situations, and how does
it differ from brick-and-mortar purchases?
Millennials enjoy the ease and convenience of online purchasing. However, certain
situations necessitate a preference for in-person purchases among some millennials. For example,
respondents preferred in-person shopping because it gave them the opportunity to interact with the
products. This was particularly true for certain products, including electronics, apparel, and
enthusiast goods, since it gave the participants the ability to interact with the product, particularly
touch. Additionally, participants stressed the importance of in-person interaction for goods that
were high cost since these purchases were considered such a substantial investment. These results
agree with the findings of Koufaris (2002) that online and traditional purchases can result in
different outcomes and Gao, Zhang, Wang, & Ba (2012) that “experience products” such as
apparel are challenging to assess due to its innate complex nature necessitating the need to interact
with the product in person.
• RQ7: How do small and large product assortments influence purchase decisions online?
Interviewees described a greater willingness to purchase limited option goods in a physical
store versus online because of the need to travel to another store to search for products. When
purchasing goods online, the ease of researching another website for additional or variant options
allowed participants to defer/not purchase products. As such, when one website did not offer an
50
appropriate number of options that met the participants' requirements, it was easy for the purchaser
to move on to another website to find similar products. They were limited by the cost and time
associated with physically traveling to another store. Moreover, participants also reported the
ability to “filter” items when they felt overloaded with products in online stores, a feature not
available in physical stores. If a customer were to visit a brick-and-mortar store and were presented
with an overwhelming number of options, they would have little recourse to remedy the situation.
However, when the same participant visited an online establishment and were presented with an
overwhelming number of options, they have the ability to “filter” or remove products that do not
meet specific criteria, giving them the ability to choose between fewer and more manageable,
number of options. This ability to “filter” improved the participants' ability to manage the negative
consequences associated with a large variety of options.
Studies support the filtering countermeasure to help alleviate feelings of overload
experienced by individuals presented with overwhelming amounts of information (Eppler &
Mengis, 2004; Roetzel, 2019). Additionally, these results support previous research findings by
Koufaris (2002) that online shopping behavior does not result in the same outcomes as traditional
shopping. However, these results are contrary to Gao, Zhang, Wang, & Ba (2012) that online
purchase behavior, when presented with a large assortment of products, leads to negative
experiences on the part of the consumer. Interviewee responses suggest that many consumers may
experience more positive results when purchasing products online compared to brick-and-mortar.
• RQ6: How do these factors differ among millennial rural and urban consumers?
Overall, my results failed to show a significant difference in purchase behavior between
rural and urban millennial consumers when presented with extensive or limited options.
Furthermore, factors that influence purchase decisions were also quite similar between the two
groups. This is understandable since both groups are in similar life situations. Specifically,
participants are college students living on a limited income, making price or price v. quality a
predominant factor influencing all/most purchase decisions, according to interview results.
Additionally, with the expansion of technology, rural consumers have better access to the internet,
increasing the influencing power of reviews in the purchase decision-making process comparable
among the two groups (Mangold & Smith, 2012; Perrin & Duggan, 2015). Furthermore, equal
access to the internet between the two groups could also lead to closing the gap that resulted from
51
lower product/store variety experienced by rural consumers, leading to more similar behavior
pattern when presented with purchase options (Liu, Shively, & Binkley, 2013; Kaufman,
Macdonald, & Lutz, 1997; Kaufman P. K., 1999; Krebs-Smith & Kantor’s, 2001). Notably, rural
consumers may not be more likely to experience cognitive overload when presented with extensive
options because of more experience with similar purchase options as urban consumers as a result
of an increase in access to various goods and services.
Overall, findings in the qualitative and quantitative portions of the study interconnect and
support one another as well as prior findings from other researchers. Overall, the surveys did not
provide conclusive support for differences in purchase behavior between rural and urban
millennial consumers when presented with limited or extensive options. This could be due to the
nuanced nature of choice overload and purchase behavior, as presented by previous researchers’
meta-analyses (McShane & Bockenholt, 2018; Chernev et al., 2015; Scheibehenne et al., 2010).
The interview results lend further support to the nuanced nature of choice overload and purchase
behavior. For example, interview participants reported the level of interest/expertise and cost of
product dictated need for extensive options and likelihood of choice overload. When examining
costly items, interviewees also stated the desire for in-person product purchases when searching
for high-cost items. They portrayed a desire to interact with the merchandise before making the
final decision. The in-person purchase also influenced the consumers' likelihood to purchase
products when less than an optimal number of options were presented due to the inefficiency
associated with physically traveling to another store to search for the products.
Finally, “need”/decision goal was also reported to dictate the buyer’s probability of
purchasing a product when presented with a non-optimal number of product options. Overall, these
variables could have significantly influenced the experience of choice overload and the likelihood
of purchase in our survey study. Future surveys should structure the research to understand the
interaction effects of these factors on the likelihood of experiencing choice overload and
purchasing the item.
Implications
While the results of this study lend support to the existence of choice overload for high-
risk items and extensive option criteria, the results failed to support a significant, practical
difference between rural and urban consumer purchase behavior when presented with extensive or
52
limited options. However, the interview results suggest that other factors might play a role in
purchase intention/behavior. Further studies should examine these factors, including interest, time,
price, expertise, product type etc. and their influence on purchase behavior and choice overload. It
would be wise of businesses to note these consumer factors when deciding how many varieties to
offer to customers. Depending on these factors, fewer or larger varieties can bring about different
results in terms of purchase behavior. Producers can also tie these factors to different product types
as different factors were differentially important for different product classes.
Furthermore, the price was a critical variable for millennial purchases. Vendors should
consider including additional, lower-cost options around areas that show a greater density of
millennials, specifically college students. While price plays a crucial role in millennials' decision
to purchase a product, price versus quality is also a significant contributor for many. Producers
should research the implications to uncover the optimal price vs. quality criteria for specific
consumables targeted toward millennial consumers.
Limitations and Future Directions
The results of this study offer several implications for companies and other stakeholders to
sell various products to millennial consumers but are not free of limitations.
One such glaring limitation is that the study was conducted with participants from a single,
mid-western university. As such, the results may have limited generalizability among the
millennials in other parts of the United States or other countries. Additionally, since the study
examined the purchase intentions of only millennial populations, it will be challenging to apply
the results to other generations, both older and younger. Further, examining different class cohorts
(freshmen, sophomore, junior, etc.) may result in different outcomes. First-year students, who are
new to the university setting, may display a greater difference between rural and non-rural groups,
since much of their experience derive from their home and upbringing. Seniors, who have spent
more time away from home may have conformed more to their peers and current lifestyles,
resulting in greater similarity between rural and non-rural participants. Additionally, future studies
should expand the population subset to include participants from all over the United States and
additional age groups.
The response rate was low for this study when taking into account the overall population
size of students at the Mid-Western University. Future studies may benefit from ways to increase
53
the response rate among the population of the study. Methods of accomplishing this goal might be
to increase the benefits gained from participating in the study, such as an increase in monetary
gifts or a higher win rate among participants. Additionally, emailing surveys can be sent multiple
times, instead of one, to increase participation by reminding students multiple times about the
availability of the study. However, this could lead to frustration by the population as many students
may see these surveys as “SPAM.”
Additionally, researchers who study choice overload may view the online nature of this
study as a possible limitation. However, this study was artificial and different from both online
and in-store settings. That said, the format of the study may generalize better to an online vs. a
brick-and-mortar store setting.
A possible methodological limitation was on the definition of rurality used within this study.
Study participants were asked to indicate whether or not they were from a rural local. Since this
variable is self-reported, there is the possibility that not all participants conceptualized rurality in
the same way. As such, the construct of rurality is likely not as well defined as if this study had
used a more well-described definition. It is possible that using a non-self reported definition of
rurality would have produced different results. For example, using the study participants zip code
of their home address, a federal definition could have been utilized to more precisely define rurality.
However, previous researchers found significant differences within the federal definitions of
rurality (Puryear & Kettler, 2017). Rural areas that reside closer to urban areas display
characteristics more similar to suburban communities than rural locations further away from urban
areas (Puryear & Kettler, 2017). Overall, the concept of rural is very nuanced.
Another methodological limitation of the study was the analysis design of the qualitative
portion of the study. Due to limited staff and funding, only one researcher interpreted the
qualitative interview to uncover the various themes. Single-coder interpretation disallows for
measuring of inter-coder reliability and agreement (Campbell, Quincy, Osserman, & Pedersen,
2013). Words may hold multiple meanings, and interpretation may be context-dependent. Limited
guidance exists in the literature for establishing reliability in single-coder situations with semi-
structured interviews.
Also, the influence of the level of expertise on the likelihood of experiencing choice
overload appears to be incongruent between interview and survey findings. The survey results
suggest that consumers who reported higher levels of expertise with the products (the laptop or the
54
jump drive) reported a higher likelihood of experiencing choice overload. On the other hand, the
interview respondents reported they were less likely to experience feelings of overwhelm when
presented extensive options for products they were more familiar with. While several causes can
lead to these contradictory results, one such cause could be that the scale is not properly measuring
the condition it is intended to measure. Additionally, levels of expertise could be an influential
factor in experiencing choice overload but varies based on the product type. In other words, higher
levels of expertise may not mitigate the likelihood of experiencing feelings of overwhelm equally
for all product types. Further, the level of familiarity was only measured for the jump drive and
laptop products among millennial consumers in the midwest. Expanding the product categories
and the subject pool may yield different results in the experience of choice overload based on the
level of familiarity with the product. Finally, the results from the interviews may not be
generalizable.
Furthermore, the qualitative interviews provided great insight into other factors that play a
crucial role in purchase intention when presented with extensive or limited options. Future research
can use information gained from interviews to design and complete a quantitative study to validate
the results of the interviews further. For example, previous studies suggest that time-constraints
influence feelings of overload when making purchase decisions (Roetzel, 2019). Researchers can
investigate how time-constraints, specifically the necessity to purchase products within a specific
time-frame, influence purchase behavior among different groups when presented with extensive
or limited options. Moreover, the investigation can also examine how the various factors may
influence each other in the purchase process when presented with extensive or limited product
varieties. For instance, how does time-constraint and expertise/interest influence each other when
presented with various amounts of product options? Will expertise/interest help mitigate any stress
associated with the time-constraint, leading to a higher likelihood of product purchase?
Future studies should also investigate how the results vary with expanded product types
outside of those tested in this study. Expansion can include goods such as articles of clothing, fresh
fruits/vegetables, cosmetics, etc. The results could be different for “experience” products Gao,
Zhang, Wang, & Ba (2012) and other products. Additionally, product type results could also vary
by age group due to each group's experience purchasing products online or brick-and-mortar.
Beyond expanding product categories, future research can also examine choice overload
in additional settings (Roetzel, 2019). With the advances in technology, many consumers have
55
limitless access to the internet, including social media, e-mail, text messages, etc. Prospective
studies can examine the influence of extensive and limited product information on consumers
feelings of overload and intention to purchase on various internet-based platforms.
Finally, future researchers can focus on specific countermeasures to help alleviate the
experience of overload among consumers (Eppler & Mengis, 2004; Roetzel, 2019). Explicitly, the
studies can test different approaches businesses can employ to minimize consumers experience of
overload. Researchers can also assess the solutions under several conditions examined within this
study and outside of the study, including different age ranges, rurality, interest level, product type,
price ranges etc.
56
CHAPTER 5. CONCLUSION
The results of the study support previous research/meta-analytic research on choice overload and
purchase behavior (Chernev, Böckenholt, & Goodman, 2015; McShane & Bockenholt, 2018;
Scheibehenne, Greifeneder, & Todd, 2010).The findings are suggestive of a difference between
rural and urban/suburban consumers, but while the data are statistically significant, they are not
practically significant. In turn, care must be taken in interpreting and using these findings.
Two conditions measured in this study resulted in both statistical and practical significance.
First, participants presented with the extensive variety option reported higher impressions of
choice overload regardless of rurality. Next, participants presented with the laptop option in the
extensive criteria described higher likelihood of feeling choice overload. Notably, in the laptop
condition, rural participants displayed greater feelings of overload than their urban/suburban
matches. Nevertheless, the study failed to replicate these results in other conditions. As such, these
conclusions should be approached with care because it is difficult to establish whether this is due
to the high price of laptops or due to rurality.
Moreover, the findings of this study show that choice overload is negatively correlated
when participants were presented with the extensive option set and positively correlated when
presented with the limited option set. Once again, both are statistically significant, but neither was
practically significant. Previous researchers have shown that choice overload is contingent on other
moderating variables (Chernev, Böckenholt, & Goodman, 2015; McShane & Bockenholt, 2018).
Therefore, care must be taken in interpreting and using these findings.
Specifically examining rural and non-rural consumers, the findings suggest that choice
overload is negatively correlated with purchase intention and is more prominent in the rural
population. However, these results were statistically, yet not practically, significant except in the
laptop condition. In the laptop setting, rural participants displayed more feelings of overload than
non-rural participants. Simonsohn et al. (2014), Chernev et al. (2015), and McShane and
Böckenholt (2018) also reported inconclusive results and suggested that choice overload varied
based on moderating factors and dependent measures. According to the findings of this study, the
price could be one such moderating factor among consumers in measuring choice overload.
Consequently, it is difficult to determine if the difference between rural and urban consumers'
57
feelings of overload is due to rurality or price. Further studies should be conducted to answer this
question conclusively.
The interview results further support prior meta-analysis by Simonsohn et al. (2014),
Chernev et al. (2015), and McShane and Böckenholt (2018), suggesting that choice overload
fluctuated based on moderating factors and dependent measures. Among millennial rural and non-
rural participants, the price was described as a noteworthy influencer in purchase decisions.
Participants reported a greater need for extensive options and a higher likelihood of completing
extensive research when purchasing high priced items. However, these findings may not generalize
well to the overall population since most students live on substantially less income compared to
other members of society.
Next, participants level of interest/expertise about a product dictated the likelihood of
experiencing choice overload. Specifically, when encountering extensive selection of options
about a product they showed high levels of knowledge/interest, participants were more likely to
report neutral or positive emotions. On the other hand, when participants were presented with
extensive options of products, they were less familiar with, they were more likely to describe
feeling negative emotions. Consequently, the level of interest/expertise may be another variable
dictating feelings of choice overload and should be further examined (Chernev, Böckenholt, &
Goodman, 2015; McShane & Bockenholt, 2018).
Additionally, when examining online purchase behavior among millennial consumers,
participants reported enjoying the ease and convenience of online shopping. However, specific
conditions necessitated a predilection for in-person shopping. There was a need to interact with
the product, which varied with participants, including when purchasing high-value items,
enthusiast goods, electronics, apparel, etc. What products necessitate a need for interaction among
specific groups is in need of further research.
Furthermore, interviewees stated a greater inclination to buy products when offered limited
options in a physical store rather than online due to the inconvenience of driving to another store.
Online shopping allows consumers to easily visit other stores/websites when presented with non-
optimal purchase options. Participants also reported the ease of “filtering” items when presented
with too many options in online settings leading to a lower likelihood of experiencing overload.
While the study fails to provide an overwhelming amount of conclusive evidence that is
sorely lacking in the field of choice overload, the study provides much support to the findings of
58
previous studies as well as new, potential variables involved in the experience of choice overload
(Chernev, Böckenholt, & Goodman, 2015; McShane & Bockenholt, 2018). Previous researchers
have suggested the role of moderating and dependent factors in choice overload, but research is
still lacking in conclusively determining what these variables may be. This study provides a host
of new factors that appear to influence choice overload and purchase behavior.
Overall, the findings of this study provide researchers with a host of opportunities to further
their goal of uncovering determinative factors influencing choice overload. Additionally,
merchants can use the above information to target consumers to increase sales and revenue. By
understanding the factors that influence purchase among various groups, companies can use the
optimal method to maximize benefits.
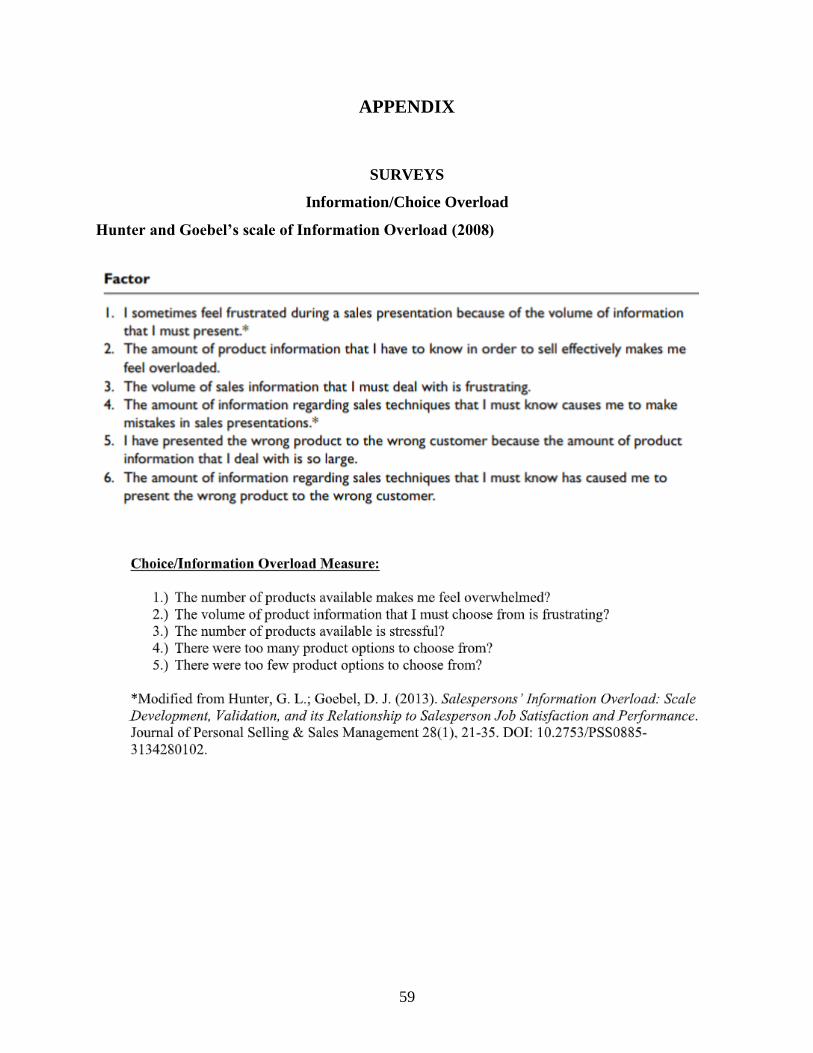
59
APPENDIX
SURVEYS
Information/Choice Overload
Hunter and Goebel’s scale of Information Overload (2008)
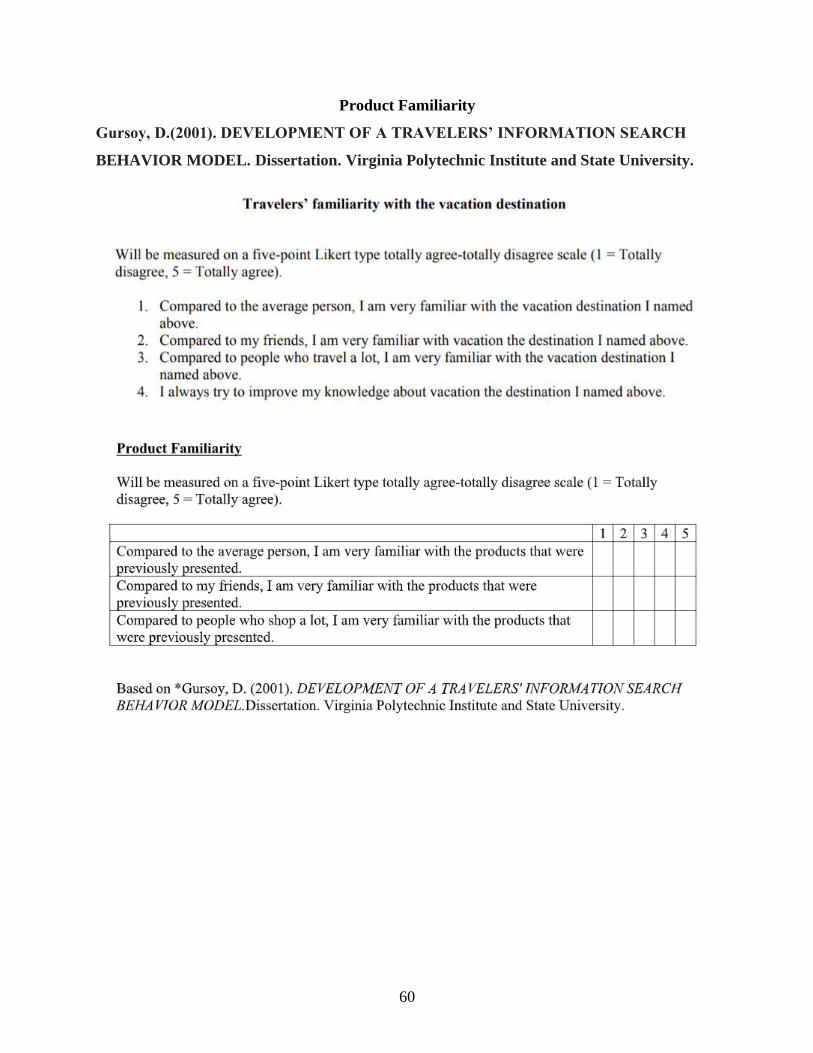
60
Product Familiarity
Gursoy, D.(2001). DEVELOPMENT OF A TRAVELERS’ INFORMATION SEARCH
BEHAVIOR MODEL. Dissertation. Virginia Polytechnic Institute and State University.
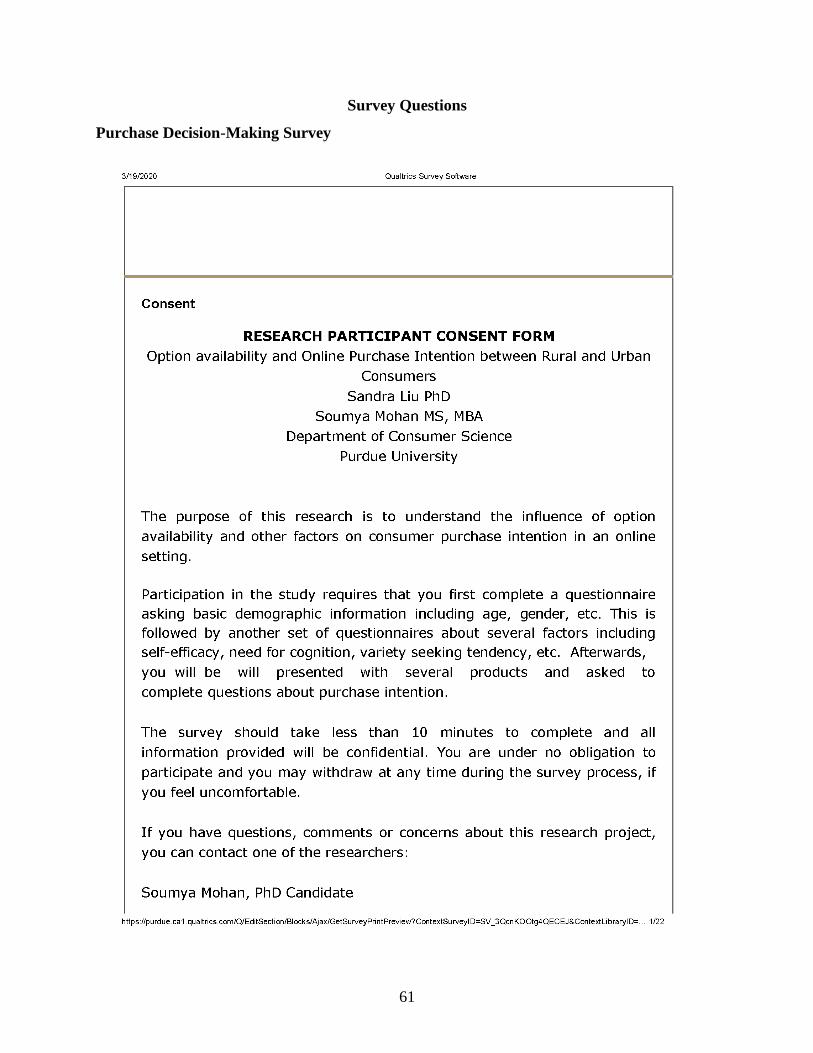
61
Survey Questions
Purchase Decision-Making Survey
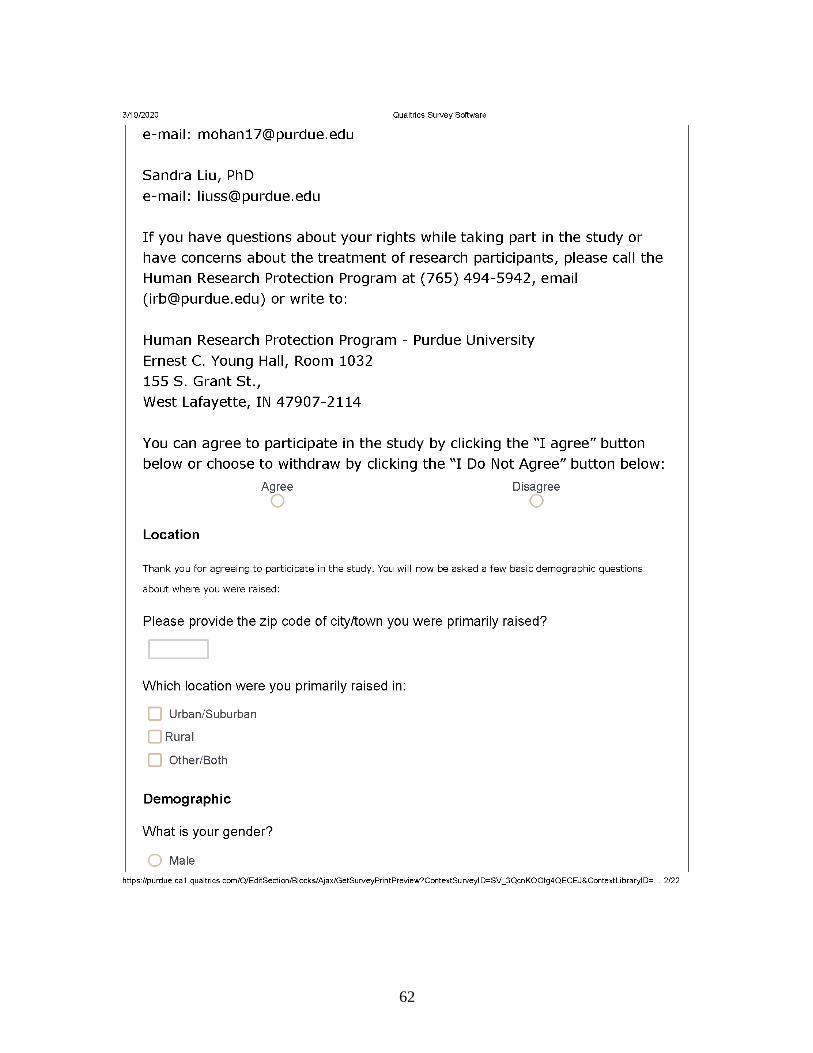
62
63
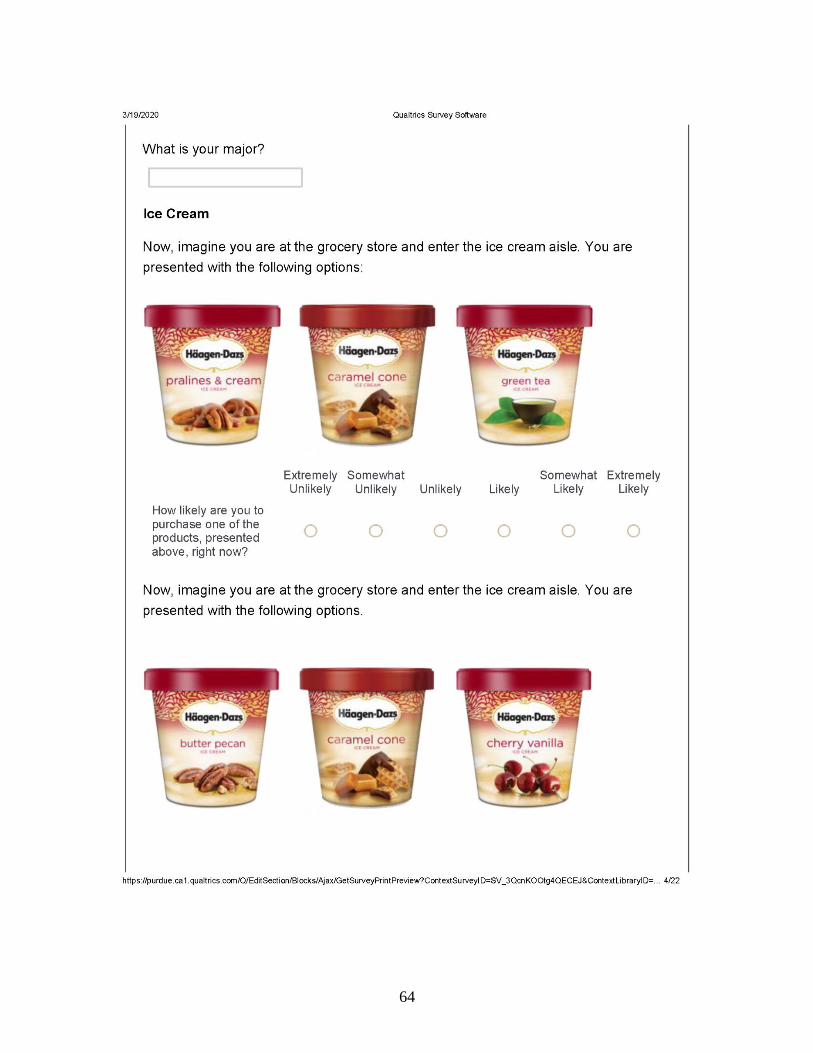
64
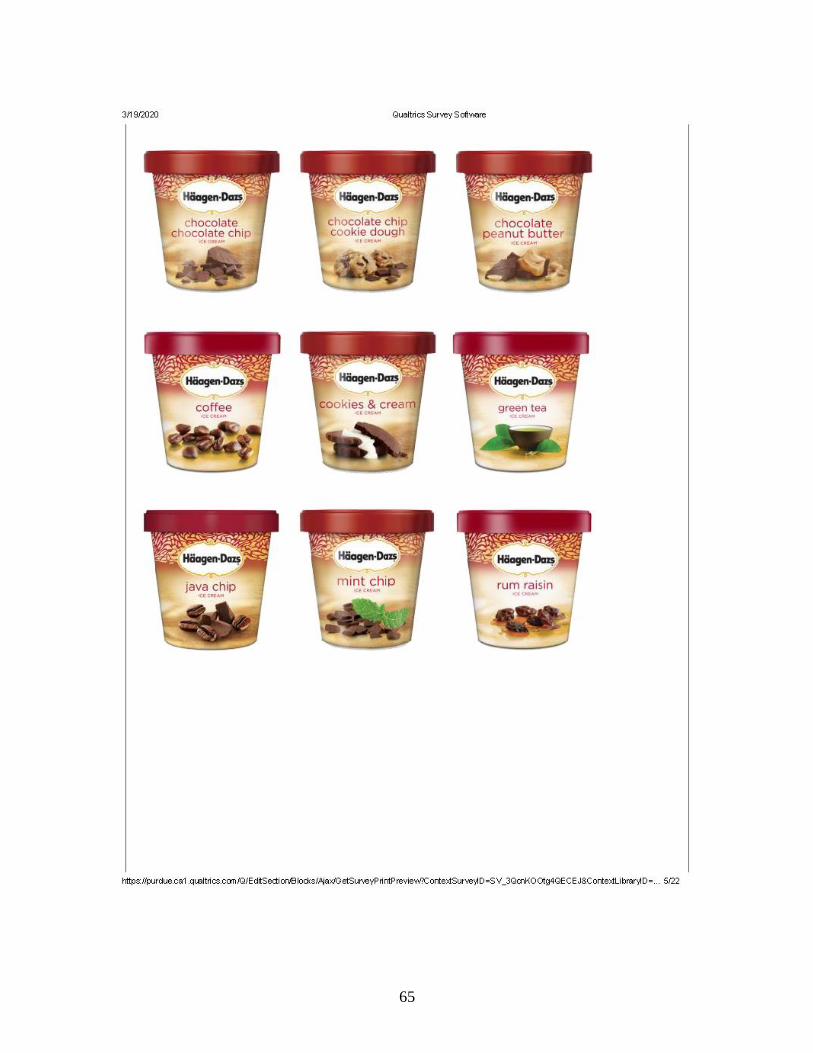
65
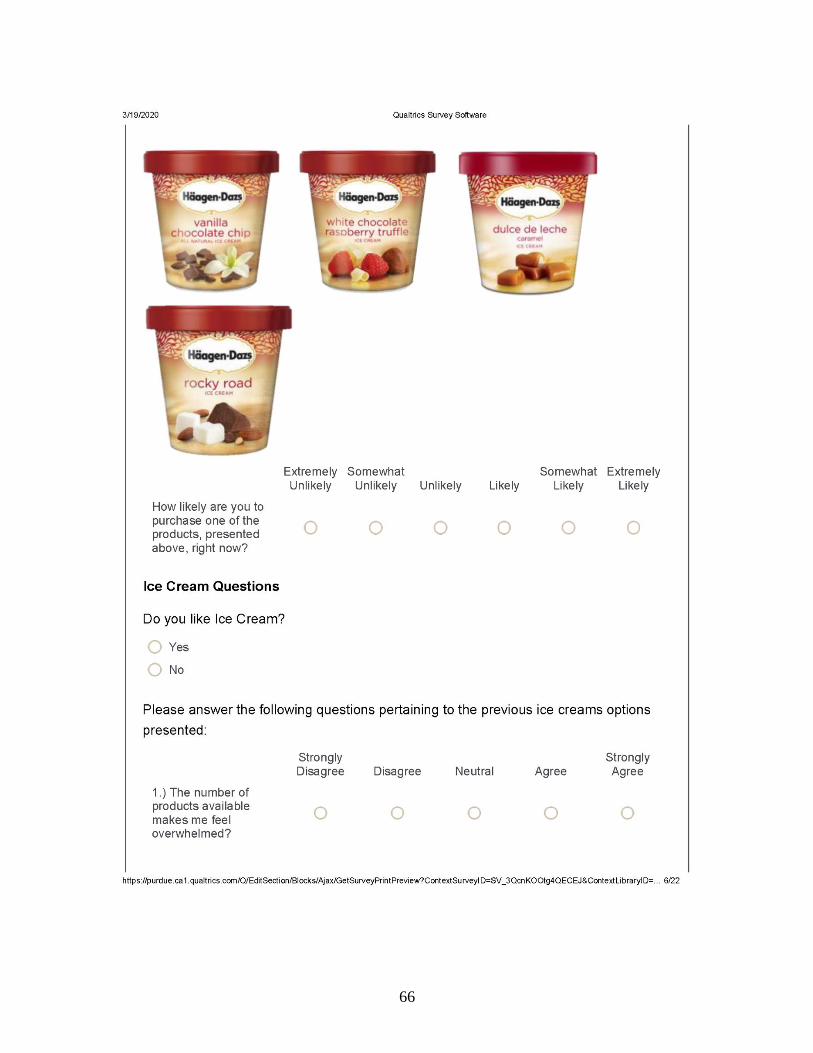
66
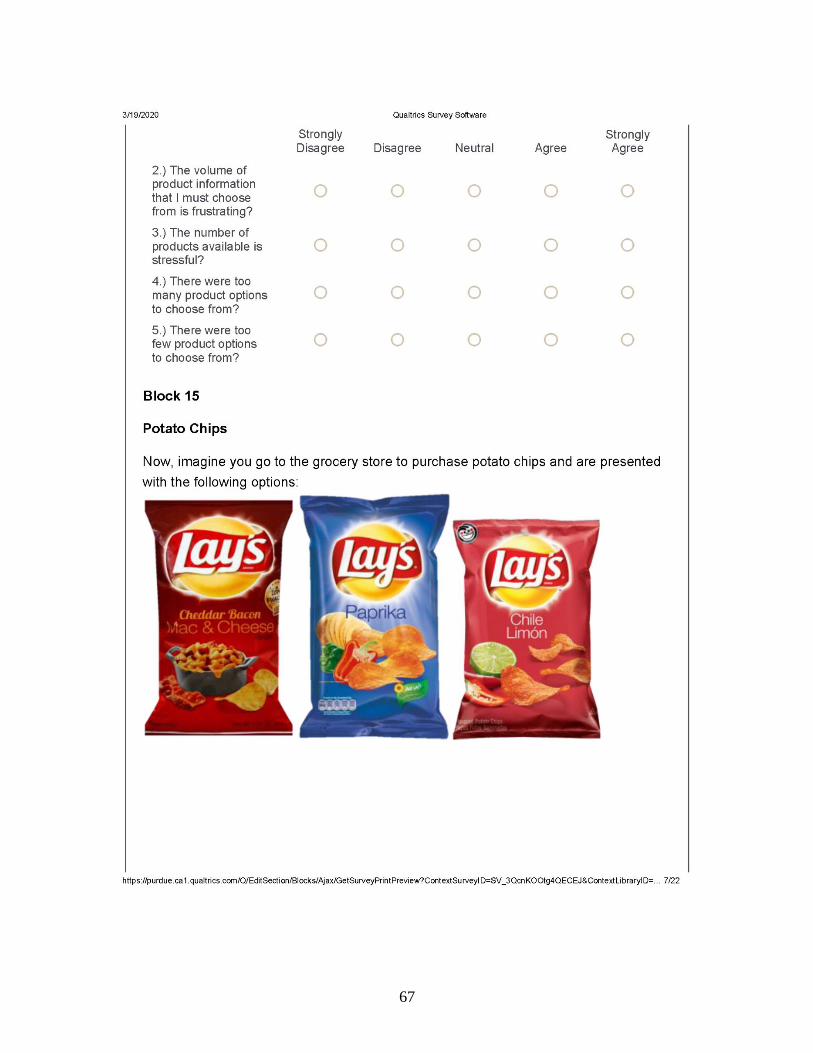
67
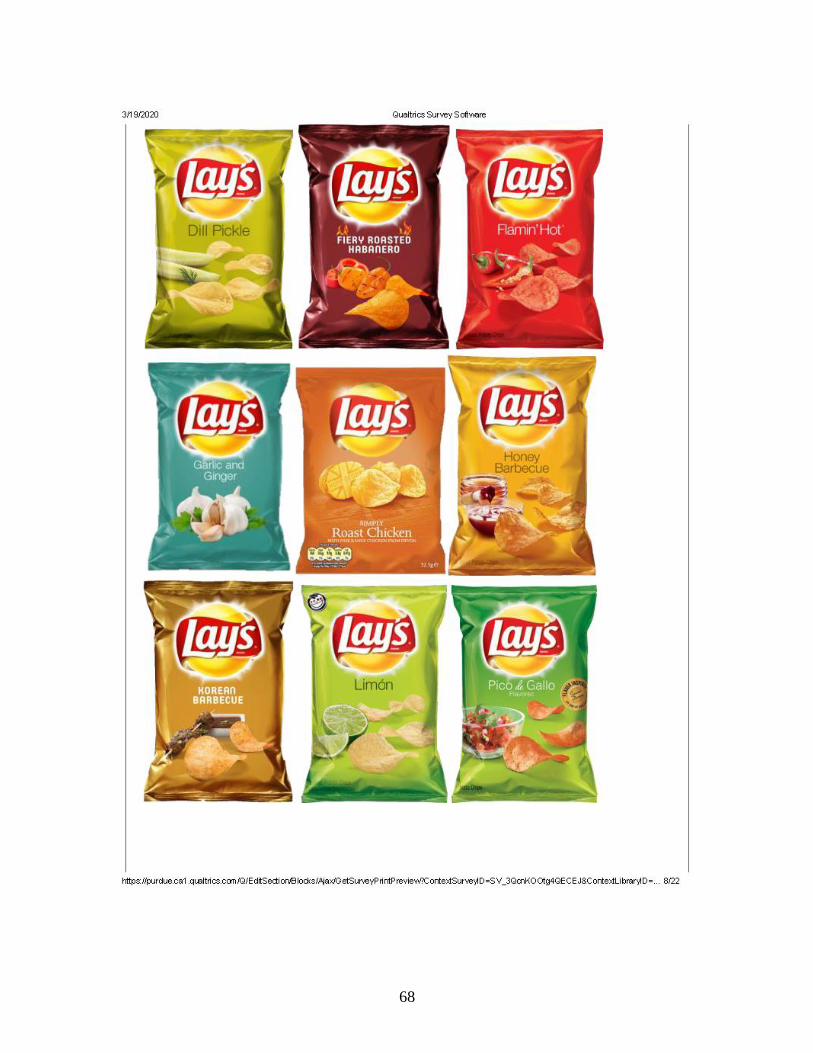
68
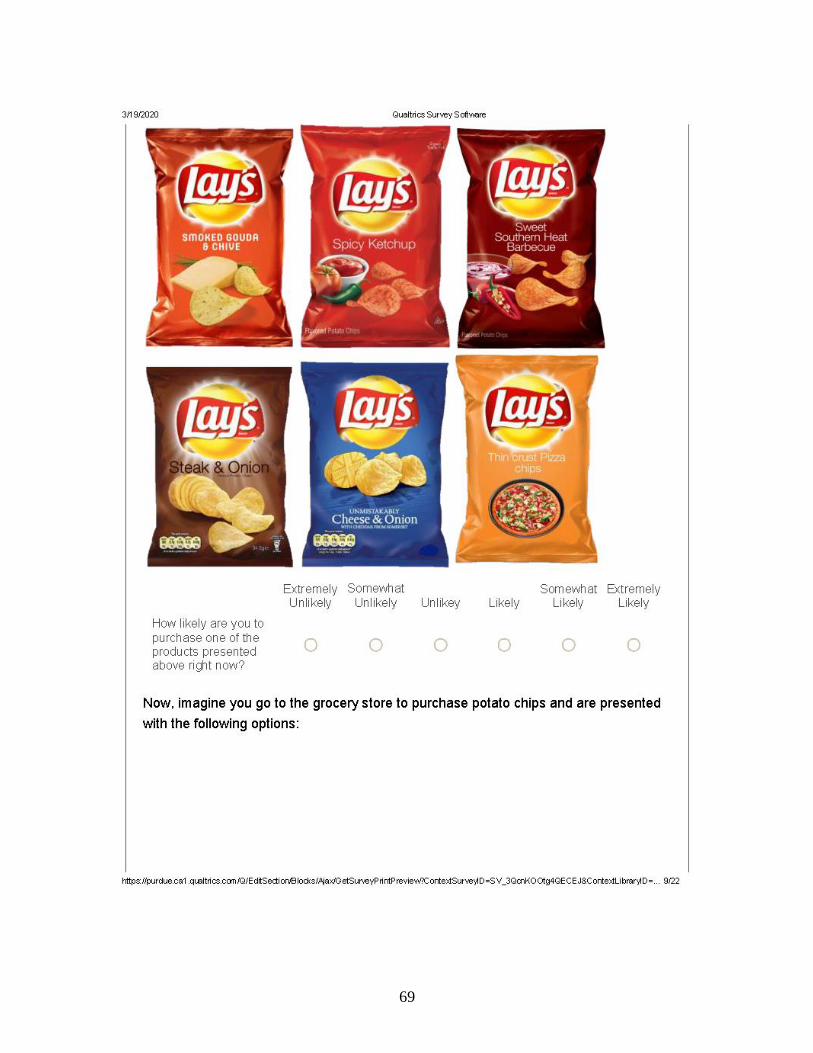
69
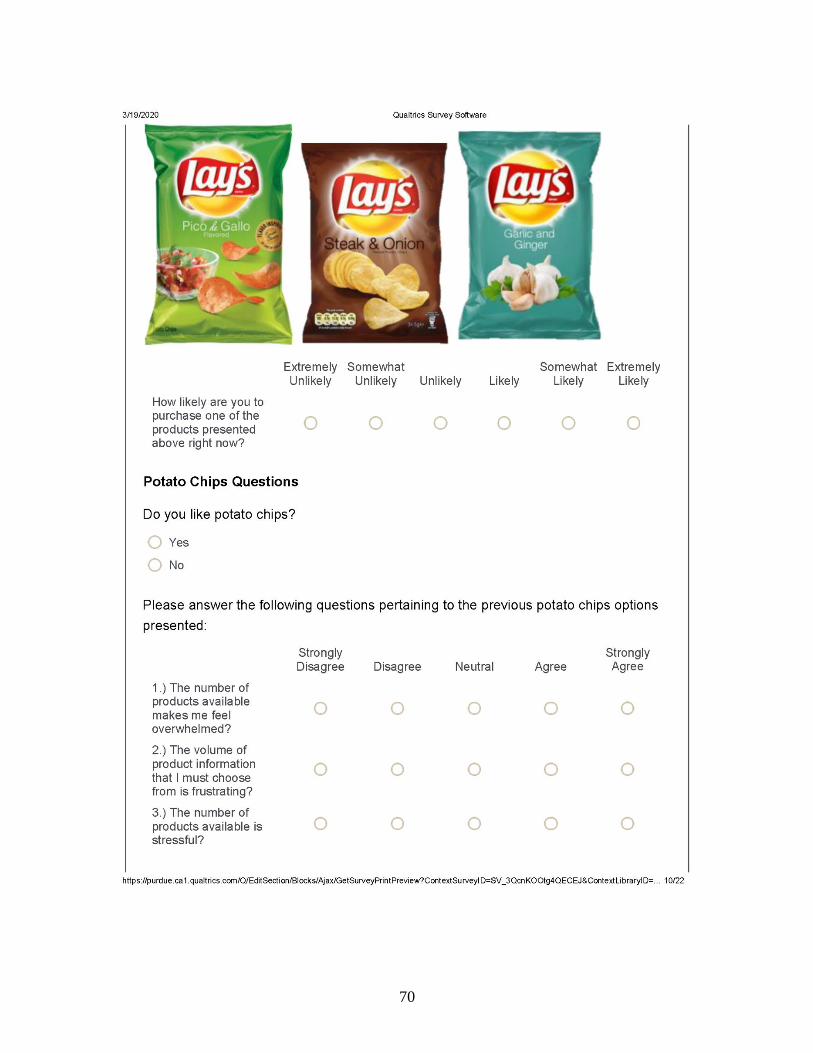
70
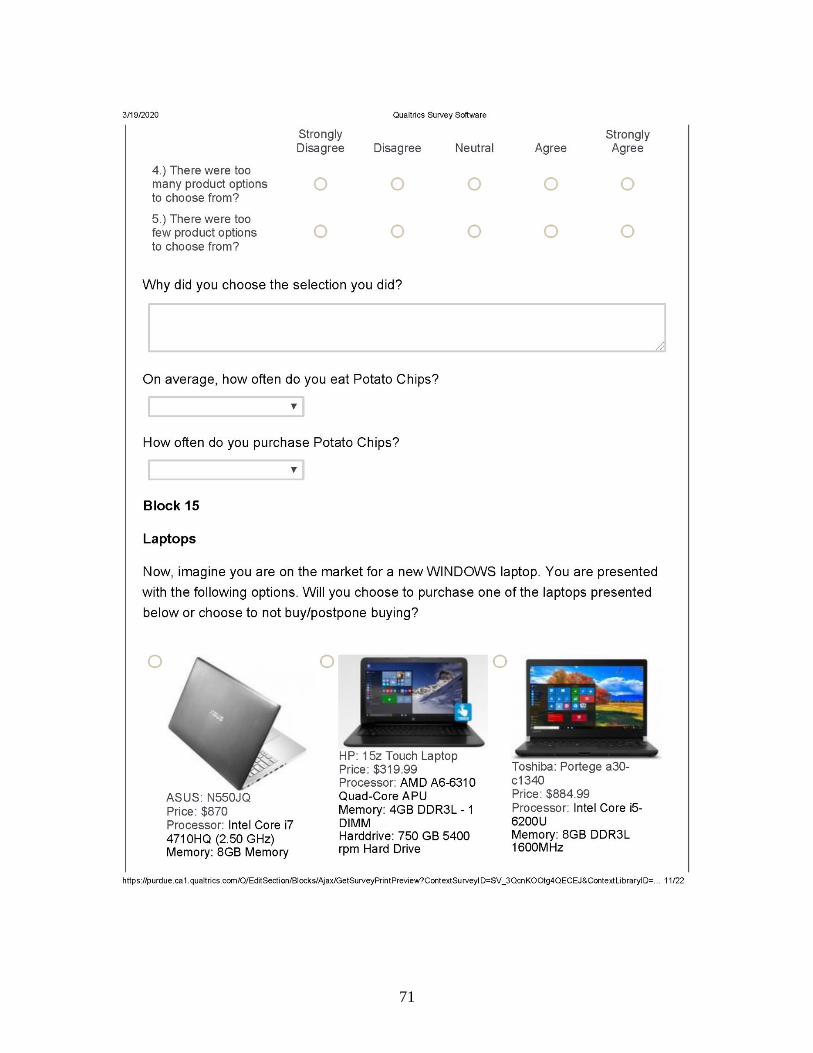
71
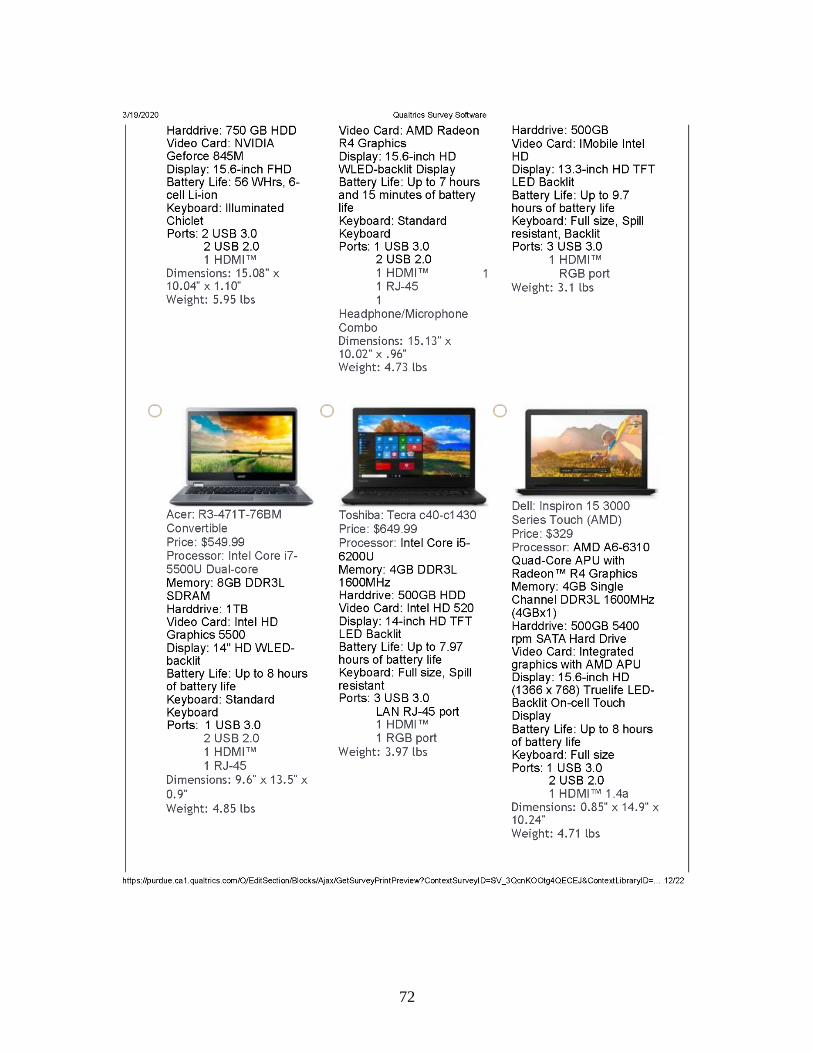
72
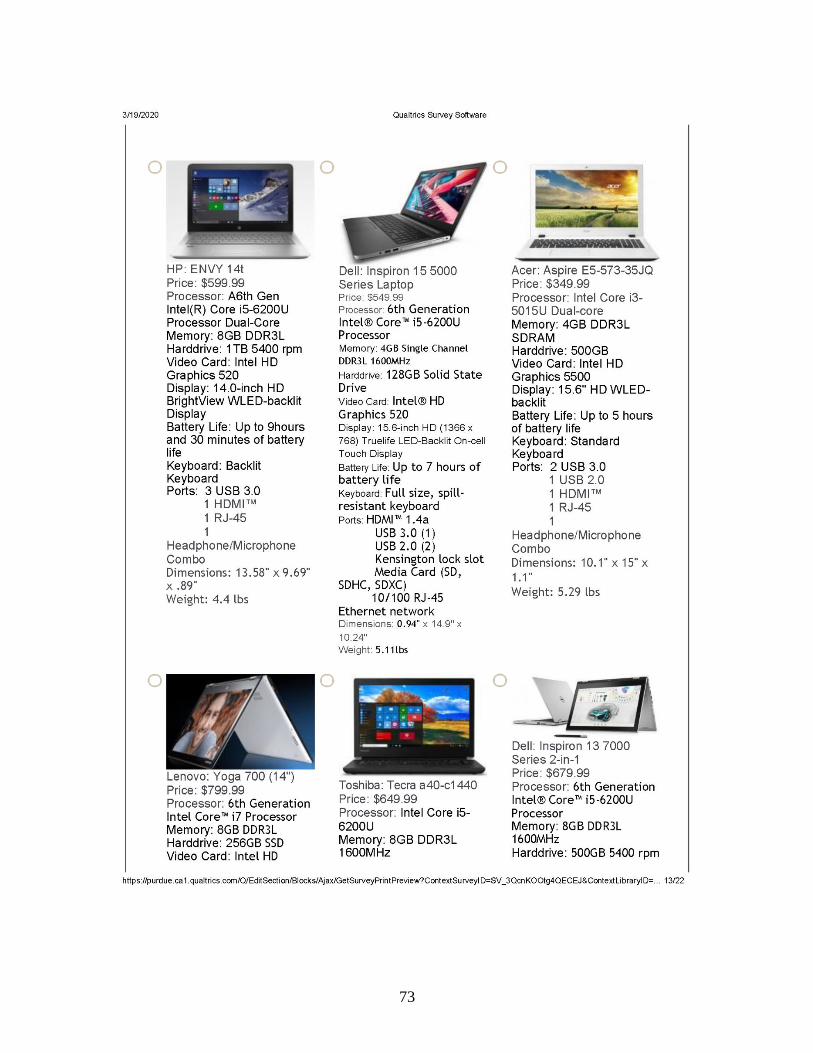
73
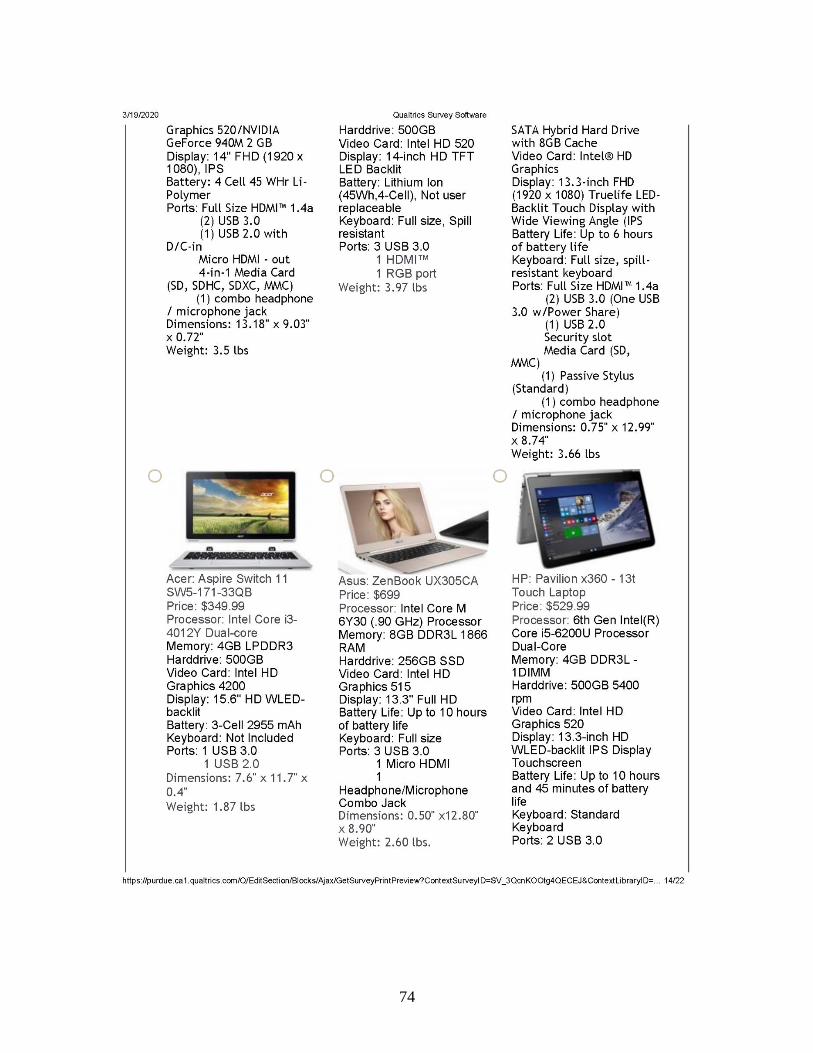
74
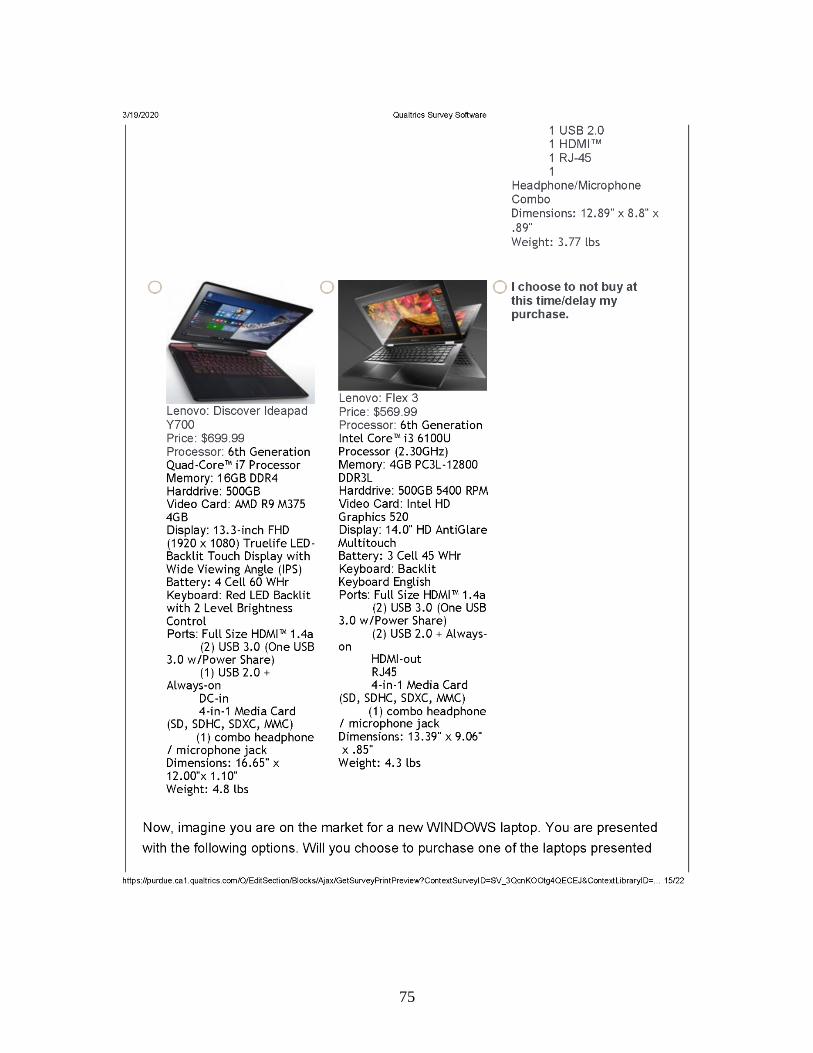
75
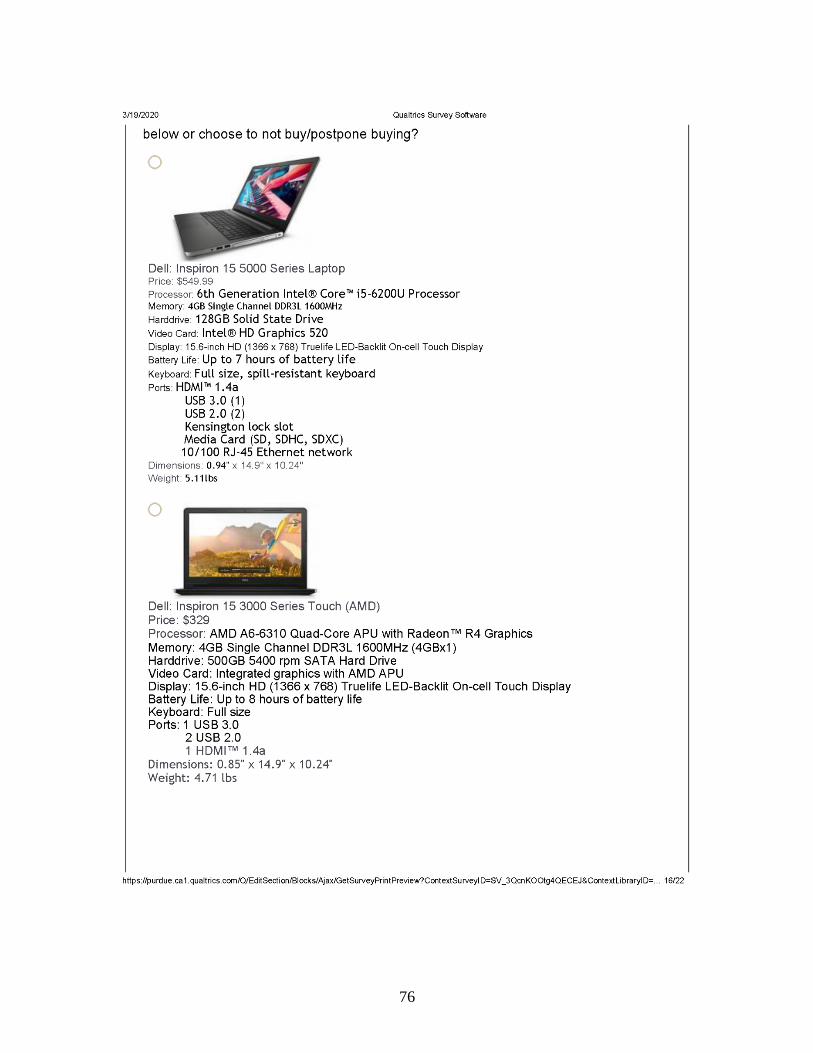
76
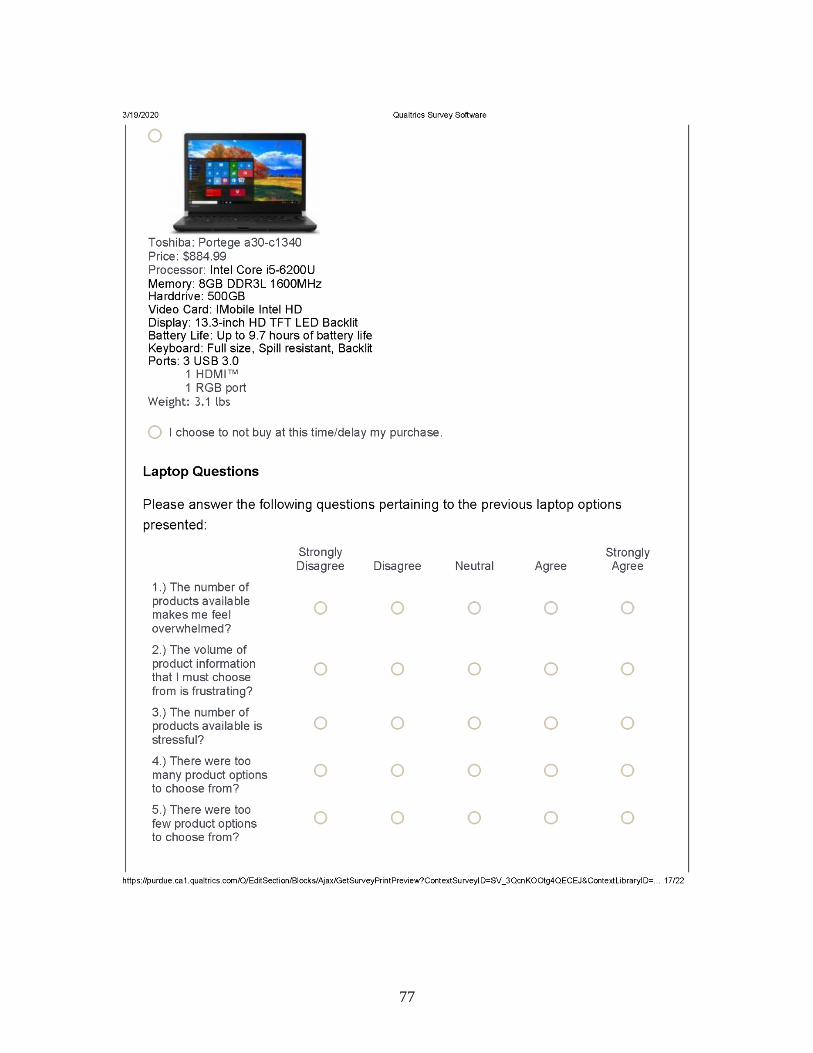
77
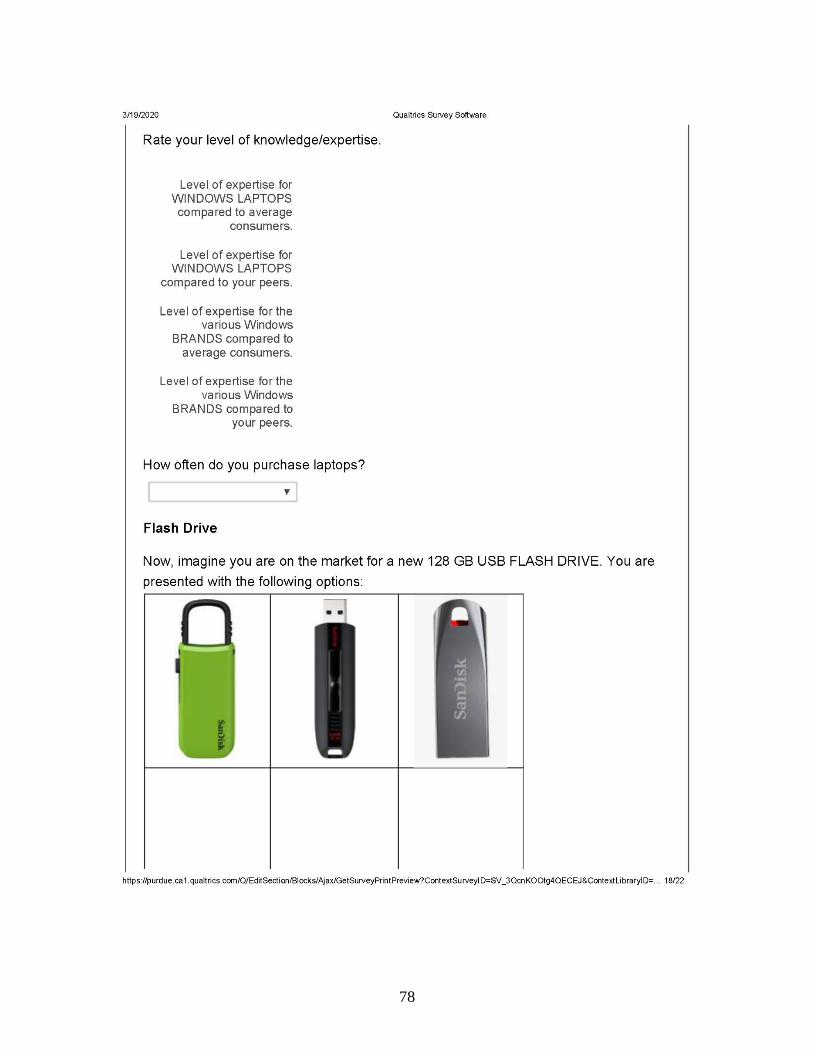
78
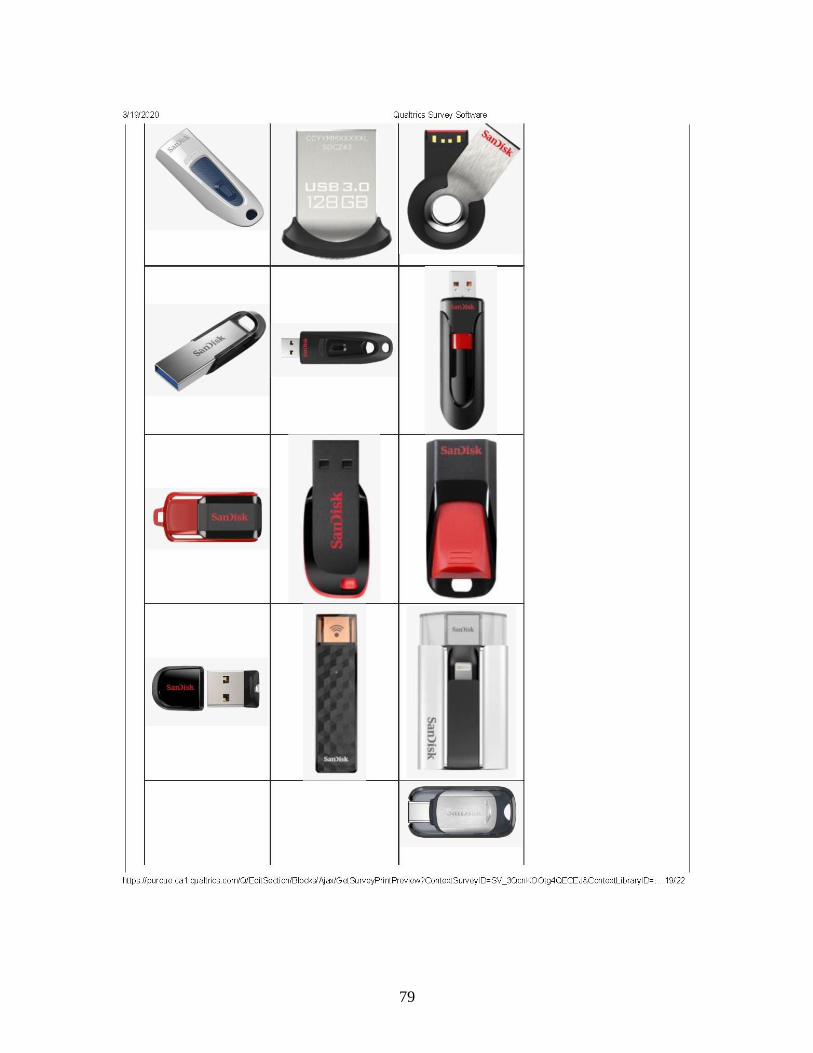
79
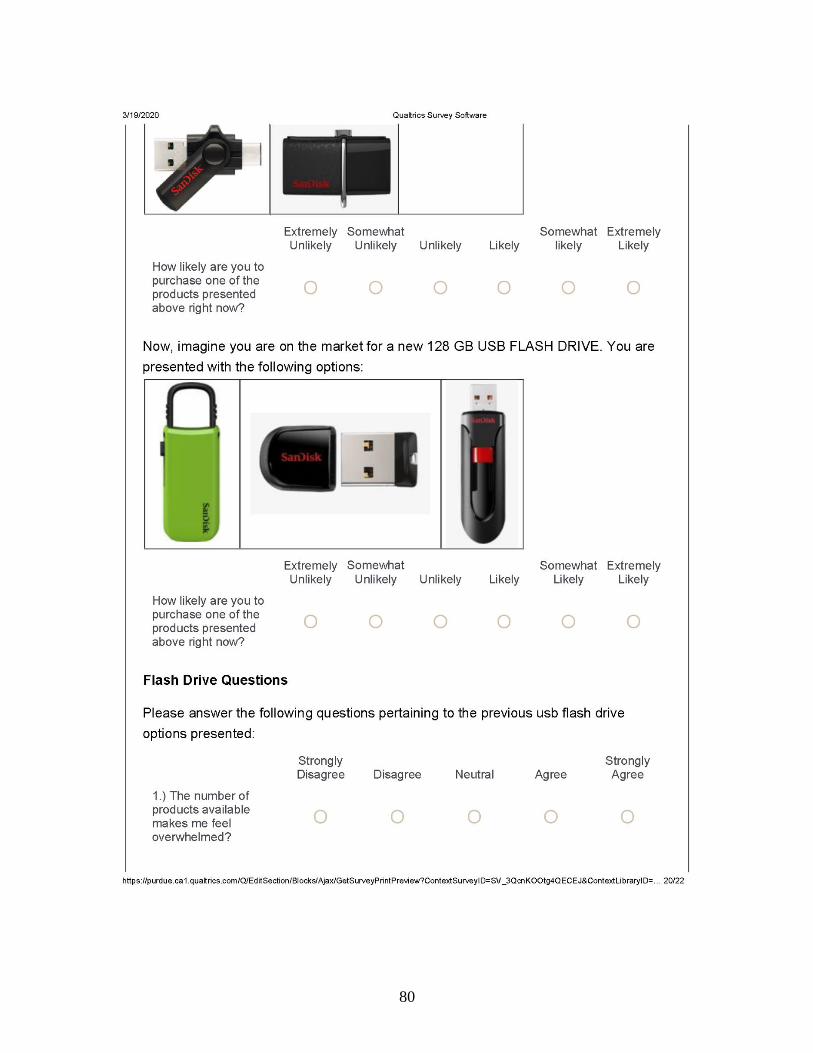
80
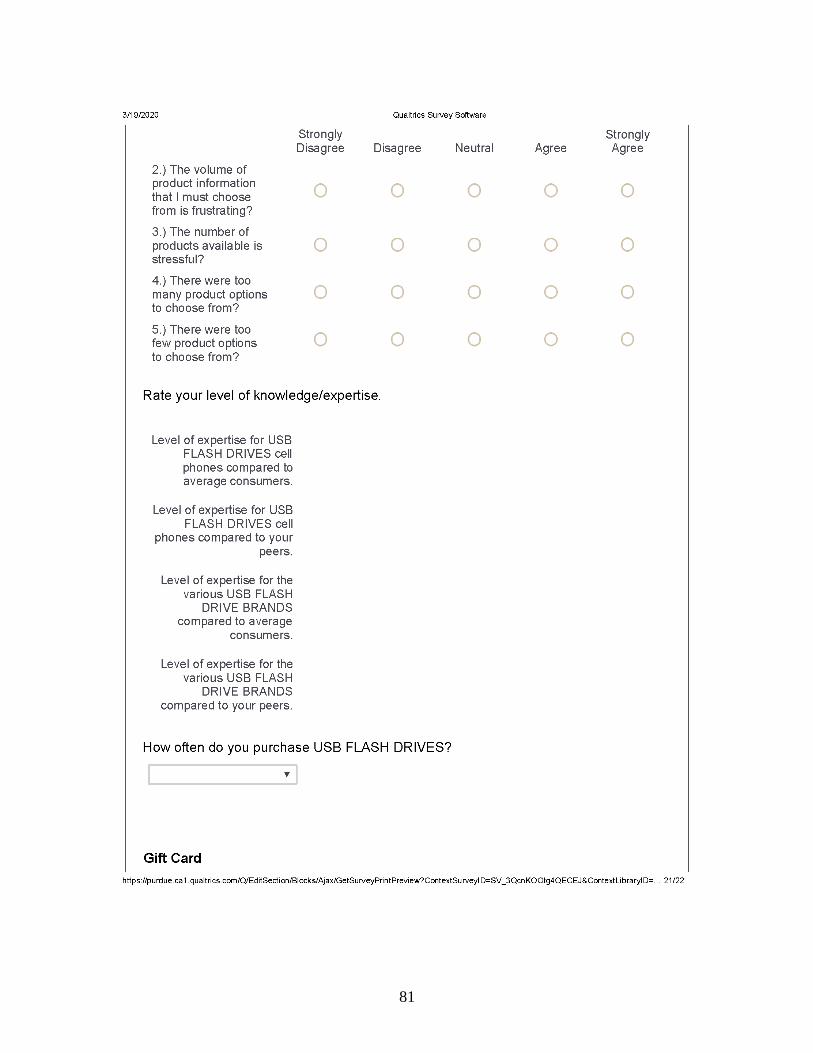
81
82
83
REFERENCES
Anand, P., & Sternthal, B. (1989). Strategies for designing persuasive messages: Deductions
from the resource matching hypothesis. In P. Cafferata, & A. M. Tybout, Cognitive and
affective responses to advertising (pp. 135-169). Lexington: MA: Health.
Anderson, L. K., Taylor, J. T., & Holloway, R. J. (1966). The Consumer and His Alternatives:
An Experimental Approach. Journal of Marketing Research, 3(1), 62-67.
Angen, M. J. (2000). Evaluating interpretive inquiry: Reviewing the validity debate and opening
the dialogue. Qualitative Health Research, 10(3), 378-395.
Aparicio, D., & Prelec, D. (2018). Choice overload in online platforms. . SSRN 3044096.
Arnold, S. J., Oum, T. H., & Tigert, T. J. (1983). Determinant Attributes in Retail Patronage:
Seasonal, Temporal, Regional, and International Comparisons. Journal of Marketing
Research, 20(2), 149-157.
Audience Scapes. (2013, November 15). AudienceScapes. Retrieved from AudienceScapes Web
Site: http://www.audiencescapes.org/country-profiles/tanzania/communication-habits-
demographic-group/urban-rural/urban-rural-88
Bates, D., Sarkar, D., Bates, M. D., & Matrix, L. (2007). The lme4 Package. R Package Version,
pp. 2(1), 74.
Baumol, W. J., & Ide, E. A. (1956). Variety in Retailing . Management Science, 3(1), 93-101.
Bellman, S., Lohse, G. L., & Johnson, E. J. (1999). Predictors of online buying behavior.
Communications of the ACM, 42(12), 32-38.
Bettman, J. R., Luce, M. F., & Payne, J. W. (1998). Constructive Consumer Choice Processes .
Journal of Consumer Research , 25(3), 187-217.
Bloch, P. H. (1995). Seeking the Ideal Form: Product Design and Consumer Response. Journal
of Marketing, 59(3), 16-29.
Boatwright, P., & Nunes, J. C. (2001). Reducing Assortment: An Attribute-Based Approach.
Journal of Marketing, 65(3), 50-63.
Boatwright, P., & Nunes, J. C. (2001). Reducing Assortment: An Attribute‐Based Approach.
Journal of Marketing, 65(3), 50-63.
Boone, H. N., & Boone, D. A. (2012). Analyzing likert data. Journal of extension, 50(2), 1-5.
Borenstein, M., Hedges, L., Higgins, J., & Rothstein, H. (2011). Introduction to meta-analysis.
John Wiley & Sons.
Bown, N. J., Read, D., & Summers, B. (2003). The Lure of Choice. Journal of Behavioral
Decision Making, 16(4), 297-308.
84
Briesch, R. A., Chintagunta, P. K., & Fox, E. J. (2009). How Does Assortment Affect Grocery
Store Choice? Journal of Marketing Research, 46(2), 176-189.
Broniarczyk, S. M., Hoyer, W. D., & McAlister, L. (1998). Consumers' Perceptions of the
Assortment Offered in a Grocery Category: The Impact of Item Reduction. Journal of
Marketing Research, 35(2), 166-176.
Bui, M., Kemp, E., & Hamilton, M. (2015). The Power of Promoting Healthy Brands:
Familiarity in Healthy Product Decision Making. Journal of Promotion Management,
21(6), 739-759.
Cacioppo, J. T., Petty, R. E., & Feng Kao, C. (1984). The Efficient Assessment of Need for
Cognition. Journal of Personality Assessment, 48(3), 306-307.
Cacioppo, J. T., Petty, R. E., & Hogan, R. (1982). The need for cognition. Journal of Personality
and Social Psychology, 42(1), 116-131.
Cacioppo, J. T., Petty, R. E., & Morris, K. J. (1983). Effects of need for cognition on message
evaluation, recall, and persuasion. Journal of Personality and Social Psychology, 45(4),
805-818.
Campbell, M. C., & Keller, K. L. (2003). Brand familiarity and advertising repetition effect.
Journal of Consumer Research, 30(2), 292-304.
Cavallo, A. (2017). Are online and offline prices similar? Evidence from large multi-channel
retailers. The American Economic Review, 107(1), 283-303.
Chaiken, S., Liberman, A., & Eagly, A. H. (1989). Heuristic and systematic information process
in within and beyond the persuasion context. New York, NY: Guilford.
Chen, Y., Shang, R., & Kao, C. (2009). The effects of information overload on consumers’
subjective state towards buying decision in the internet shopping environment .
Electronic Commerce Research and Applications, 8(1), 48-58.
Chernev, A. (2003). When More Is Less and Less Is More: The Role of Ideal Point Availability
and Assortment in Consumer Choice . Journal of Consumer Research, 30(2), 170-183.
Chernev, A., Bockenhold, U., & Goodman, J. (2015). Choice overload: A conceptual review and
meta-analysis. Journal of Consumer Psychology, 25(2), 333-358.
Chernev, A., Böckenholt, U., & Goodman, J. (2015). Choice overload: A conceptual review and
meta-analysis. Journal of Consumer Psychology, 25(2), 333-359.
Citrin, A. V., Sprott, D. E., Silverman, S. N., & Stem Jr., D. E. (2000). Adoption of Internet
shopping: the role of consumer innovativeness. Industrial Management & Data Systems,
100(7), 294 - 300.
Constantinides, E. (2004). Influencing the online consumer's behavior: the Web experience.
Internet Research, 14(2), 111-126.
85
Creswell, J. W. (2007). Qualitative Inquiry and Research Design: Choosing Among Five
Approaches. Thousand Oaks: Sage Publications Inc.
Creusen, M. E., & Schoormans, J. P. (2005). The Different Roles of Product Appearance in
Consumer Choice. Journal of Product Innovation Management, 22(1), 63-81.
Dawar, N., & Parker, P. (1994). Marketing Universals: Consumers' Use of Brand Name, Price,
Physicai Appearance, and Retailer Reputation as Signais of Product Quality. Journal of
Marketing, 58(2), 81-95.
Delgado-Ballester, E., Navarro, A., & Sicilia, M. (2012). Revitalising brands through
communication messages: the role of brand familiarity. European Journal of Marketing,
46(1/2), 31-51.
Dennis, C., Merrilees, B., Jayawardhena, C., & Wright, L. T. (2009). E-consumer behaviour.
European Journal of Marketing, 43(9/10), 1121-1139.
Dhar, R. (1997). Consumer Preference for a No-Choice Option. Journal of Consumer Research,
24(2), 215-231.
Durvasula, S., Lysonski, S., & Andrews, J. C. (1993). Cross-cultural generalizability of a scale
for profiling consumers' decision-making styles. The Journal of consumer affairs, 27(1),
55-65.
Englander, M. (2012). The Interview: Data Collection in Descriptive Phenomenological Human
Scientific Research. Journal of Phenomenological Psychology, 43, 13-35.
Faraway, J. J. (2016). Extending the linear model with R: generalized linear, mixed effects and
nonparametric regression models. Chapman and Hall/CRC.
Farmer, J., Iverse, L., Campbell, N., Guest, C., Chesson, R., Deans, G., & MacDonald, J. (2006).
Rural/urban Differences in Accounts of Patients' Initial Decisions to Consult Primary
Care. Health & Place, vol 12, is2, 210-221.
feef. (1953). fefaef. fefaf: feafea.
Festinger, L. (1957). A Theory of Cognitive Dissonance. Stanford, CA: Stanford University
Press.
Fiske, S. T., & Taylor, S. E. (1984). Social Cognition. Reading: Addison-Wesley.
Fournier, S. (1998). Consumers and their brands: developing relationship theory in consumer
research. Journal of Consumer Research, 24, 343-373.
Gao, J., Zhang, C., Wang, K., & Ba, S. (2012). Understanding online purchase decision making:
The effects of unconscious thought, information quality, and information quantity.
Decision Support Systems, 53(4), 772-781.
Garber, L. (1995). The Package Appearance in Choice. Advances in Consumer Research, 22(1),
653-660.
86
Godey, B., Pederzoli, D., Aiello, G., Donvito, R., Chan, P., Oh, H., . . . Weitz, B. (2012). Brand
and country-of-origin effect on consumers' decision to purchase luxury products. Journal
of Business Research, 65(10), 1461-1470.
Guba, E. G. (1996). What happened to me on the road to Damascus. In L. Heshusius, & K.
Ballard, From positivism to interpretivism and beyond: Takes of transformation in
educational and social research (pp. 43-49). New York: Teachers College Press.
Guest, G., Bunce, A., & Johnson, L. (2006). How Many Interviews Are Enough? An Experiment
with Data Saturation and Variability. Field Methods, 18, 59-82.
Hawk, W. (2013, February). Expenditures of urban and rural households in 2011. U.S. Bureau of
Labor and Statistics, 2(5), pp. 1-7. Retrieved March 5, 2016, from Bureau of Labor and
Statistics: http://www.bls.gov/opub/btn/volume-2/expenditures-of-urban-and-rural-
households-in-2011.htm
Hoch, S. J., Bradlow, E. T., & Wansink, B. (1999). The Variety of an Assortment . Marketing
Science, 18(4), 527-546.
Holbrook, M. (1979). Some Preliminary Notes on Research in Consumer Esthetics. Advances in
Consumer Research, 7, 104.
Holroyd, C. (2001). Phenomenological Research Method, Design and Procedure: A
Phenomenological Investigation of the Phenomenon of Being-in-Community as
Experienced by Two Individuals Who Have Participated in a Community Building
Workshop. Indo-Pacific Journal of Phenomenology, 1(1), 1-10.
Hölscher, C., & Strube, G. (2000). Web search behavior of Internet experts and newbies.
Computer Networks, 33(1), 337-346.
Huffman, C., & Kahn, B. E. (1998). Variety for Sale: Mass Customization or Mass Confusion? .
Journal of Retalllng, 74(4), 491-513.
Hunter, G. L., & Goebel, D. J. (2008). Salespersons’ Information Overload: Scale Development,
Validation, and its Relationship to Salesperson Job Satisfaction and Performance. Journal
of Personal Selling & Sales Management, 28(1), 21-35.
Hurt, H. T., Joseph, K., & Cook, C. D. (1977). Scales for the Measurement of Innovativeness.
Human Communication Research, 4(1), 58-65.
Iyengar, S. S., & Lepper, M. R. (2000). When choice is demotivating: Can one desire too much
of a good thing? Journal of Personality and Social Psychology, 79(6), 995-1006.
Iyengar, S. S., Jiang, W., & Huberman, G. (2004). How Much Choice is Too Much?:
Contributions to 401(k) Retirement Plans. In O. S. Mitchell, & S. P. Utkus, Pension
Design and Structure: New Lessons from Behavioral Finance (pp. 83-95). Oxford:
Oxford University Press.
87
Jacoby, J. (1974). Consumer Reaction to Information Displays: Packaging and Advertising.
Advertising and Public Interest, 101-118.
Jacoby, J. (1977). Information Load and Decision Quality: Some Contested Issues. Journal of
Marketing Research, 14(4), 569-573.
Jacoby, J., Speller, D. E., & Kohn, C. A. (1974). Brand Choice Behavior as a Function of
Information Load. Journal of Marketing Research, 11(1), 63-69.
Kahn, B. E. (1998). Dynamic Relationships Witii Customers: Higii-Variety Strategies. Journal
of the Academy of Marketing Science, 26(1), 45-53.
Karmarkar, U. R., Shiv, B., & Knutson, B. (2015). Cost Conscious? The Neural and Behavioral
Impact of Price Primacy on Decision Making. Journal of Marketing Research, 52(4),
467-481.
Kaufman, P. K. (1999). The Rural Poor's Access to Supermarkets and Large Grocery Stores.
Family Economics and Nutrition Review, 13, 90.
Kaufman, P., Macdonald, J., & Lutz, S. (1997). Do the Poor Pay More for Food? Item Selection
and Price Differences Affect Low-Income Household Food Costs. IDEAS Working Paper
Series from RePEc.
Keller, K. L., & Staelin, R. (1987). Effects of quality and quantity of informationon decision
effectiveness. Journal of Consumer Research, 14(2), 200-213.
Kim, D. J., Ferrin, D. L., & Rao, H. R. (2008). A trust-based consumer decision-making model
in electronic commerce: the role of trust, perceived risk, and their antecedents. Decision
Support Systems, 44(2), 544-564.
Kitchen, P. J., Kerr, G., Schultz, D. E., McColl, R., & Pals, H. (2014). The elaboration likelihood
model: review, critique and research agenda. European Journal of Marketing, 48(11/12),
2033-2050.
Kotler, P., & Keller, K. L. (2012). Chapter 6: ANALYZING CONSUMER MARKETS. In P.
Kotler, & K. L. Keller, Marketing Management (pp. 151-180). New Jersey: Prentice Hall.
Koufaris, M. (2002). Applying the technology acceptance model and flow theory to online
consumer behavior. Information Systems Research, 13(2), 205-223.
Krebs-Smith, S., & Kantor, L. (2001). Choose a variety of fruits and vegetables daily:
understanding the complexities. Journal of Nutrition, ;131:487S-501S.
Kreps, D. M. ( 1979). A Representation Theorem for "Preference for Flexibility". Econometrica,
47(3), 565-577.
Kuznetsova, A., Brockhoff, P. B., & Christensen, R. H. (2017). lmerTest package: tests in linear
mixed effects models. Journal of statistical software, 82(13).
88
Lee, B., & Lee, W. (2004). The Effect of InformationOverload on ConsumerChoice Quality in
anOn-Line Environment. Psychology & Marketing, 21(3), 159-183.
Lee, Y. (2013). THE INFLUENCE OF PERSONALITY TRAITS, HEALTH KNOWLEDGE,
AND PRODUCT ATTRIBUTES ON INTENT TO PURCHASE TAIWAN'S
HEALTHCARE TOURISM PRODUCTS. Social Behavior & Personality: an
international journal, Vol. 41 Issue 3, p395-409.
Lewin, K. (1951). Field Theory in Social Science. New York: Harper & Row.
Liese, A. D., Weis, K. E., Pluto, D., Smith, E., & Lawson, A. (2007). Food Store Types,
Availability, and Cost of Foods in a Rural Environment. Journal of the American Dietetic
Association, 107(11), 1916-1923.
Lin, C., & Wu, P. (2006). The Effect of Variety on Consumer Preferences: the Role of Need for
Cognition and Recommended Alternatives. Social Behavior and Personality, 34(7), 865-
876.
Lipowski, Z. (1970). The Conflict of Buridan’s Ass or Some Dilemmas of Affluence: The
Theory of Attractive Stimulus Overload. American Journal of Psychiatry, 127(3), 273-
279.
Liu, J., Shively, G., & Binkley, J. (2013). Dietary Diversity in Urban and Rural China: An
Endogenous Variety Approach . Agricultural & Applied Economics Association.
Lohse, G. L., Bellman, S., & Johnson, E. J. (2000). Consumer buying behavior on the Internet:
findings from panel data. Journal of Interactive Marketing, 14(1), 15-29.
Loken, B. (2006). CONSUMER PSYCHOLOGY: Categorization, Inferences, Affect, and
Persuasion. Annual Review Psychology, 57, 453-485.
Malhotra, N. K. (1982). Information Load and Consumer Decision Making. Journal of
Consumer Research, 8, 419-430.
Malhotra, N. K. (1984). Reflections on the Information Overload Paradigm in Consumer
Decision Making. Journal of Consumer Research, 10(4), 436-440.
Malhotra, N. K., Jain, A. K., & Lagakos, S. (1982). The Information Overload Controversy: An
Alternative Viewpoint. Journal of Marketing, 46(2), 27-37.
Mandl, M., Felfernig, A., Teppan, E., & Schubert, M. (2010). Consumer decision making in
knowledge-based recommendation. Journal of Intelligent Information Systems, 37(1), 1-
22.
Mangold, W. G., & Smith, K. T. (2012). Selling to Millennials with online reviews. Business
Horizons, 55(2), 141-153.
Mann, H., & Whitney, D. (1947). On a test of whether one of two random variables is
stochastically larger than the other. The annals of mathematical statistics, 50-60.
89
Martin, H. S., & Herrero, A. (2012). Influence of the user’s psychological factors on the online
purchase intention in rural tourism: Integrating innovativeness to the UTAUT framework.
Tourism Management, 33(2), 341-350.
McAlister, L. (1982). A Dynamic Attribute Satiation Model of Variety-Seeking Behavior.
Journal of Consumer Research, 9(2), 141-150.
McCammon, I. (2004). Heuristic traps in recreational avalanche accidents. Avalanche News, 68,
1-4.
McShane, B., & Bockenhold, U. (2017). Single-paper meta-analysis: Benefits for study
summary, theory testing, and replicability. Journal of Consumer Research, 43(6), 1048-
1063.
McShane, B., & Bockenholt, U. (2018). Multilevel multivariate meta-analysis with application to
choice overload. Psychometrika, 83(1), 255-271.
Miller, N. E. (1944). Experimental Studies of Conflict. In J. M. Hunt, Personality and the
Behavior Disorders (pp. 431-465). New York: Ronald Press.
Moon, S., Costello, J. P., & Koo, D. (2016). The impact of consumer confusion from eco-
labelson negative WOM, distrust, and dissatisfaction. International Journal of
Advertising, 1-26.
Morrin, M., Broniarczyk, S. M., & Inman, J. J. (2012). Plan Format and Participation in 401(k)
Plans: The Moderating Role of Investor Knowledge. . Journal of Public Policy &
Marketing, 31(2), 254-268.
Morris, J. D., Singh, A. J., & Woo, C. (2005). Elaboration likelihood model: A missing intrinsic
emotional implication. Journal of Targeting, Measurement and Analysis for Marketing,
14(1), 79-98.
Moustakeas, C. (1994). Phenomenological Research Methods. Thousand Oaks: Sage
Publications.
Pammi, V., & Srinivasan, N. (2013). Preface. In V. Pammi, & N. Srinivasan, Progress in Brain
Research: Decision Making Neural and Behavioural Approaches (pp. xi-xii). Kidlington:
Elsevier B.V.
Park, C. W., Mothersbaugh, D. L., & Feick, L. (1994). Consumer Knowledge Assessment.
Journal of Consumer Research, 21, 71-82.
Park, J., Hill, W. T., & Bonds-Raacke, J. (2015). Exploring the relationship between cognitive
effort exertion and regret in online vs. offline shopping. Computers in Human Behavior,
49, 444-450.
Perrin, A., & Duggan, M. (2015, June 26). Americans’ Internet Access: 2000-2015. Retrieved
April 20, 2016, from Pew Research CenterInternet, Science & Tech:
http://www.pewinternet.org/2015/06/26/americans-internet-access-2000-2015/
90
Peterson, S., Heesacker, M., Schwartz, R. C., & Marsh, R. D. (2000). PREDICTORS OF
DECISION-MAKING STYLE AMONG CANCER PATIENTS: AN EMPIRICAL
TEST OF THEORY. Psychology & Health., 15(5), 663-675.
Petty, R. E., & Cacioppo, J. T. (1986). The Elaboration Likelihood Model of Persuasion.
Advances in Experimental Social Psychology, 19, 123-205.
Petty, R. E., Cacioppo, J. T., & Goldman, R. (1981). Personal involvement as a determinant of
argument-based persuasion. Journal of Personality and Social Psychology, 41(5), 847-
855.
Reutskaja, E., & Hogarth, R. M. (2009). Satisfaction in Choice as a Function of the Number of
Alternatives: When 'Goods Satiate. Psychology and Marketing, 26(3), 197-203.
Reutskaja, E., Lindner, A., Nagel, R., Andersen, R., & Camerer, C. F. (2018). Choice overload
reduces neural signatures of choice set value in dorsal striatum and anterior cingulate
cortex. Nature Human Behaviour, 2(12), 925.
Rohm, A. J., & Swaminathan, V. (2004). A typology of online shoppers based on shopping
motivations. Journal of Business Research, 57(7), 748-757.
Scammon, D. L. (1977). "Information Load" and Consumers. Journal of Consumer Research,
14(3), 148-155.
Scammon, D. L. (1977). "Information Load" and Consumers. Journal of Consumer Research,
4(3), 148.
Scheibehenne, B., Greifeneder, R., & Todd, P. M. (2010). Can There Ever Be Too Many
Options? A Meta‐Analytic Review of Choice Overload. Journal of Consumer Research,
37(3), 409-425.
Shah, A. M., & Wolford, G. (2007). Buying Behavior as a Function of Parametric Variation of
Number of Choices. Psychological Science, 18(5), 369-370.
Simon, H. A. (1956). Rational choice and the structure of the environment. Psychological
Review, 63, 129-138.
Simonsohn, U., Nelson, L. D., & Simmons, J. P. (2014). p-curve and effect size: Correcting for
publication bias using only significant results. Perspectives on Psychological Science,
9(6), 666-681.
Sloot, L. M., Fok, D., & Verhoef, P. C. (2006). The Short‐ and Long‐Term Impact of an
Assortment Reduction on Category Sales. Journal of Marketing Research, 43(4), 536-
554.
Steenkamp, J. E., & Baumgartner, H. (1995). Development and cross-cultural validation of a
short form of CSI as a measure of optimum stimulation level. International Journal of
Research in Marketing, 12(2), 97-104.
91
Sthapit, E. (2018). The more the merrier: Souvenir shopping, the absence of choice overload
preferred attributes. Tourism management perspectives, 25, 126-134.
U.S. Department of Health and Human Services. (2013, November 17). Health Resource and
Services Administration. Retrieved from HRSA:
http://www.hrsa.gov/ruralhealth/policy/definition_of_rural.html
United States Census Bureau. (2013, November 21). United States Census Bureau. Retrieved
from United States Census Bureau: http://www.census.gov/
Walters, A., & Long, M. (2012). he Effect of Food Label Cues on Perceptions of Quality and
Purchase Intentions among High-Involvement Consumers with Varying Levels of
Nutrition Knowledge. Journal of Nutrition Education and Behavior, 44(4), 350–354.
Walters, A., & Long, M. (2012). The Effect of Food Label Cues on Perceptions of Quality and
Purchase Intentions among High-Involvement Consumers with Varying Levels of
Nutrition Knowledge. Journal of Nutrition Education and Behavior, 44(4), 350–354.
Warner, B., & Leukefeld, C. (2001). Rural-Urban Differences in Substance use and Treatment
Utilization Among Prisoners. American Journal of Drug and Alcohol Abuse, Vol 27,
265-280.
Weitzman, M. L. (1979). Optimal Search for the Best Alternative. Econometrica, 47 (3), 641–54.
Wray, H. (2010, October 10). Observer. Retrieved March 6, 2016, from Association for
Psychological Science:
http://www.psychologicalscience.org/index.php/publications/observer/2010/october-
10/heuristics-revealed.html
Zhu, D. H., Chang, Y. P., & Ya, P. (2015). EFFECTS OF INTERACTIONS AND PRODUCT
INFORMATION ON INITIAL PURCHASE INTENTION IN PRODUCT
PLACEMENT IN SOCIAL GAMES: THE MODERATING ROLE OF PRODUCT
FAMILIARITY. Journal of Electronic Commerce Research, 16(1), 22-33.