factors influencing policy researchersbehavioral intention
TRANSCRIPT
FACTORS INFLUENCING POLICY RESEARCHERSBEHAVIORAL IN TENTION
TO USE OPEN DATA TECHNOLOGIES IN NAIROBI, KENYA
CECILIA WANGECI MUIGA
A Research Project submitted to the School of Computing and Informatics-University
of Nairobi, in partial fulfillment of the requireme nts for the award of Masters of Science
in Information Technology Management
2016
ii
DECLARATION
This research project is my original work and to the best of my knowledge, has not been
presented to any other university for the award of a degree.
Signature …………………………..… Date ……………………………
Student: Cecilia Wangeci Muiga
Registration Number: P54/72777/2014
This research project has been submitted for examination with my approval as University
Supervisor.
Signature …………………………..… Date ……………………………
Supervisor: Dr. Robert Oboko
School of Computing and Informatics
University of Nairobi

iii
DEDICATION
This work is dedicated to my parents and siblings for their moral and financial support, and
continuous belief in me. My dedication also goes to my adorable friends for inspiring and
challenging me throughout this journey. In all your endeavors, remember that in life
achievers rarely sit back and let things happen to them, they go out and make things happen.
Thank you and God bless you all abundantly.

iv
ACKNOWLEDGEMENT
Special thanks and acknowledgements are extended to my supervisor Dr. Robert Oboko for
his encouragement, vital guidance, knowledge, availability and willingness to assist me in
successfully conducting this study, despite his tight schedules. My appreciation also extends
to all the lecturers of School of Computing and Informatics at University of Nairobi, for
providing the foundational knowledge necessary for making this research successful. To all
my fellow classmates, thank you for your knowledge contributions, your company and co-
operation made my studies enjoyable. All of you are blessed.
v
Table of Contents Page
Declaration...................................................................................................................................... ii
Dedication ...................................................................................................................................... iii
Acknowledgement ......................................................................................................................... iv
List of Tables ................................................................................................................................ vii
List of Figures ............................................................................................................................... vii
List of Appendices ......................................................................................................................... ix
Acronyms and Abbreviations ......................................................................................................... x
Abstract ......................................................................................................................................... xii
CHAPTER ONE: INTRODUCTION
1.1. Background of the Study ........................................................................................................ 1
1.1.1 History of Open Government Data ....................................................................................... 1
1.1.2 Open data technology ........................................................................................................... 2
1.1.3 Use of Open data technology................................................................................................ 3
1.1.4 Open data technology for Policy Research........................................................................... 4
1.2. Research Problem ................................................................................................................... 5
1.3. Research Objectives................................................................................................................ 6
1.4. Hypotheses.............................................................................................................................. 6
1.5. Significance of the Study........................................................................................................ 7
1.6. Scope of the Study .................................................................................................................. 7
1.7. Limitations and Assumptions ................................................................................................. 8
1.8. Definition of terms.................................................................................................................. 8
CHAPTER TWO: LITERATURE REVIEW
2.1. Theoretical Review ................................................................................................................. 9
2.1.1. Theory of Reasoned Action .................................................................................................. 9
2.1.2. Theory of Planned Behaviour ............................................................................................. 10
2.1.3. Technology Acceptance Model ......................................................................................... 10
vi
2.1.4. Unified Theory of Acceptance and Use of Technology .................................................... 12
2.2. Empirical Review.................................................................................................................. 13
2.2.1. Influence of Performance Expectancy............................................................................... 13
2.2.2. Influence of Effort Expectancy.......................................................................................... 14
2.2.3. Influence of Social Influence ............................................................................................. 15
2.2.4. Influence of Facilitating Conditions .................................................................................. 16
2.2.5. Moderators Effects............................................................................................................. 17
2.2.6. Critique of Existing Literature ........................................................................................... 18
2.3. Research Gap ........................................................................................................................ 18
2.4. Conceptual Framework......................................................................................................... 18
CHAPTER THREE: RESEARCH METHODOLOGY
3.1. Research Design.................................................................................................................... 20
3.1.1 Research Philosophy........................................................................................................... 20
3.2. Target Population.................................................................................................................. 21
3.3. Sampling ............................................................................................................................... 22
3.3.1. Sample Size........................................................................................................................ 22
3.3.2. Sampling Technique .......................................................................................................... 22
3.4. Data Collection ..................................................................................................................... 23
3.4.1. Instruments......................................................................................................................... 23
3.4.2. Procedure ........................................................................................................................... 24
3.5. Pilot Test ............................................................................................................................... 24
3.5.1. Validity .............................................................................................................................. 24
3.5.2. Reliability........................................................................................................................... 24
3.6. Data Analysis and Presentation ............................................................................................ 25
CHAPTER FOUR: RESEARCH FINDINGS AND DISCUSSION
4.1. Response Rate....................................................................................................................... 26
4.2. Demographic Characteristics ................................................................................................ 26
vii
4.2.1Gender................................................................................................................................... 26
4.2.2Age........................................................................................................................................ 27
4.2.3 Experience............................................................................................................................ 27
4.2.4Level of Education................................................................................................................ 28
4.2.5Nature of Organization ......................................................................................................... 28
4.2.6Sources of Kenya Open Data................................................................................................ 29
4.2.7Use of Kenya Open Data Platform ....................................................................................... 29
4.2.8 Kenya Open Data Platform Tools........................................................................................ 30
4.2.9Open Data Challenges........................................................................................................... 31
4.3. Behavioral Intention.............................................................................................................. 32
4.4. Performance Expectancy ...................................................................................................... 36
4.5. Effort Expectancy ................................................................................................................. 37
4.6. Social Influence .................................................................................................................... 38
4.7. Facilitating Conditions.......................................................................................................... 39
4.8. Moderating Effects of Gender Age and Experience ............................................................. 40
4.9. UTAUT Model in the Context of Open data technology ..................................................... 44
4.10. Hypothesis Testing Summary.............................................................................................. 45
4.11. Optimal Model ..................................................................................................................... 46
CHAPTER FIVE: CONCLUSIONS AND RECOMMENDATIONS
5.1. Summary Findings ................................................................................................................. 47
5.2. Recommendations for practice .............................................................................................. 47
5.2.1. Emphasis on benefits and improved performance .............................................................. 47
5.2.2 Effort expectancy strategies................................................................................................ 48
5.2.3 Social strategies .................................................................................................................. 48
5.2.4 Support as a facilitating condition ....................................................................................... 48
5.2.5 Heterogeneity of users ......................................................................................................... 49
5.3. Recommendations for further research.................................................................................. 49
viii
5.3.1. Actual use and voluntariness of use.................................................................................... 49
5.3.2. Facilitating conditions in developing countries .................................................................. 49
5.3.3. Theories specific to the open data context.......................................................................... 50
5.4. Conclusion ............................................................................................................................. 50
References List.............................................................................................................................. 51
Appendices.................................................................................................................................... 59
ix
List of Tables
Table 3.1 Target Population………………………………………………………………….21
Table 3.2 Sample Size………………………………………………………………………..23
Table 3.3 Reliability Coefficients……………………………………………………………25
Table 4.1Response Rate …………………………………………........................................ 26
Table 4.2 Gender of Respondents ………………………………………...............................26
Table 4.3Age of Respondents……………………………………….....................................27
Table 4.4 Experience in using technical tools……………………..........................................27
Table 4.5 Highest Academic Qualification………………………..........................................28
Table 4.6Nature of Organization…………………………………….....................................28
Table 4.7Source of Kenya Public Sector Open Data...…………….......................................29
Table 4.8Use of Kenya Open Data Platform…………………………...................................30
Table 4.9Respondents Opinion on Usefulness of Open Data Tools………………………...31
Table 4.10 Kenya Public Sector Open Data Challenges……………………………………..32
Table 4.11 Respondents Opinion on Behavioral Intention…………………………………..32
Table 4.12 Summary of Correlations….…………………………..........................................33
Table 4.13 Regression Analysis Results…………………………..........................................34
Table 4.14 Regression Coefficients of all variables……………………………….................35
Table 4.15Respondents Opinion on Performance Expectancy………...................................36
Table 4.16Respondents Opinion on Effort Expectancy …………………….........................37
Table 4.17Respondents Opinion on Social Influence…………….........................................38
Table 4.18Respondents Opinion on Facilitating Conditions……..........................................39
x
Table 4.19 Moderating Effects of Gender………………………...........................................40
Table 4.20Moderating Effects of Age……………………………........................................41
Table 4.21Moderating Effects of Experience …………………………………....................42
Table 4.22 Regression analysis for the modified UTAUT model………………...................44
Table 4.23 Hypothesis Testing Results…………...................................................................45
xi
List of Figures
Figure 1.1 Open Data Platform Infrastructure……………………………………………….2
Figure 2.1 Theory of Reasoned Action……………………………………………………....9
Figure 2.2 Theory of Planned Behavior……………………………………………………..10
Figure 2.3 Technology Acceptance Model………………………………………………… 11
Figure 2.4 Technology Acceptance Model 2………………………………………………..11
Figure 2.5 Unified Theory of Acceptance and Use of Technology………………………….12
Figure 2.6 Conceptual Framework…………………………………………………………..19
Figure 4.1Optimal Model ……….………………………………………………………….53

xii
List of Appendices
Appendix I: Introduction Letter……………………………………………………………...59
Appendix II: Questionnaire………………………………………………………………......60

xiii
Acronyms and Abbreviations
KODI Kenya Open Data Initiative
OGD Open Government Data
UTAUT Unified Theory of Acceptance and Use of Technology
ICT Information Communication Technology
CKAN Comprehensive Knowledge Archive Network
API Application Programming Interface
xiv
ABSTRACT
With the growing open government movement, governments have put effort to open their
data, and provide it through open data technology. One important determinant of the success
of open data initiatives is the extent to which the data and its related technologies are made
use of. Kenya launched its open data initiative in July 2011 and previous research cited low
usage of the open data platform. Methodical research that uses rigorous theoretical bases
about use of technology is also deficient. It has not yet been clear which theories are most
applicable. This study explored factors which influence behavioral intention of policy
researchers to use open data technology, guided by UTAUT theory. The target population
was 110 policy researchers drawn from ten research organizations and think tanks, in Nairobi
County, Kenya. Out of the sample size of 52, 45 responded giving a response rate of 86.5%.
Questionnaires were used as the data collection instrument, and a pilot test was undertaken to
confirm their reliability, and validity. Regression analysis results indicated that performance
expectancy, social influence, and effort expectancy were significant in determining policy
researchers’ intention to use open data technology. Facilitating conditions and the
moderators; age, gender, and experience were found to be insignificant. The modified
UTAUT model was found to account for a significant variance (86.6%) of the behavioral
intention to make use of open data technology.
Keywords: Open data, UTAUT, Open government, use, Open data technology

1
CHAPTER ONE
INTRODUCTION
1.1. Background of the Study
1.1.1. History of Open Government
The widely used definition of open data is adapted from the Open Definition project of the
Open Knowledge Network. Open data is referred to as raw data that can be used or reused
freely, and can also be redistributed (Open Knowledge Foundation, 2007). In turn, Open
Government Data(OGD) is such open data that is produced or commissioned by a
government and any other public body. Open Government Data is a key enabler of the open
government concept (Open Government Data, 2016).
According to Tauberer (2014), open government data began to really take off in 2009 when
the first two transparency camp conferences were held. He further notes that the OGD
movement was also stimulated by United States’ (US) President Obama’s Open Government
Directive in December, 2009, to use open data for transparency, participation and
collaboration. The same year, the US launched Data.gov portal.
In 2010, the United Kingdom (UK), followed suit by launching data.gov.uk. In the same year,
the World Bank launched its own open data initiative. Then in 2011, the Open Government
Partnership (OGP) was launched. Its intention was to ensure that governments are
increasingly open and more accountable to their citizens. Today, the OGP consists of more
than 69 member countries with Kenya being one of them (Tauberer, 2014).
In Africa, open data has rapidly been gaining momentum. The Africa Data Consensus by
African Union was developed in March 2015. Later in September 2015, the Inaugural Africa
Open Data Conference was held in Tanzania. Other noteworthy initiatives include Open Data
for Africa initiative by African Development Bank (AfDB) and Open Africa by Code for
Africa. Code for Africa is an umbrella body for a series of open data initiatives including
Code for Kenya, Code for Ghana, Code for Nigeria, Code for South Africa, and incubated
initiatives in Morocco, Rwanda, Senegal, Tanzania, Tunisia, and Uganda.
2
Kenya was the 22nd country worldwide, second in Africa after Morocco and first in Sub-
Saharan Africa to join the open government movement. Kenya’s initiative, named the Kenya
Open Data Initiative (KODI), was launched in 2011(Majeed, 2012). Tunisia launched its
initiative in 2012, Edo State in Nigeria in 2013 and Ghana in 2012. Other countries in Africa
such as Ghana, Uganda, Rwanda and Tanzania followed suit, and they have made significant
effort to open up their government data (Brown, 2013) The second version of Kenya’s portal
was launched in July 2015 (ICT Authority, 2016).
1.1.2. Open data technology
ICT has been pivotal in open government initiatives all over the world. Robinson and Yu
(2012), note how the power of the Internet to avail government information in the last several
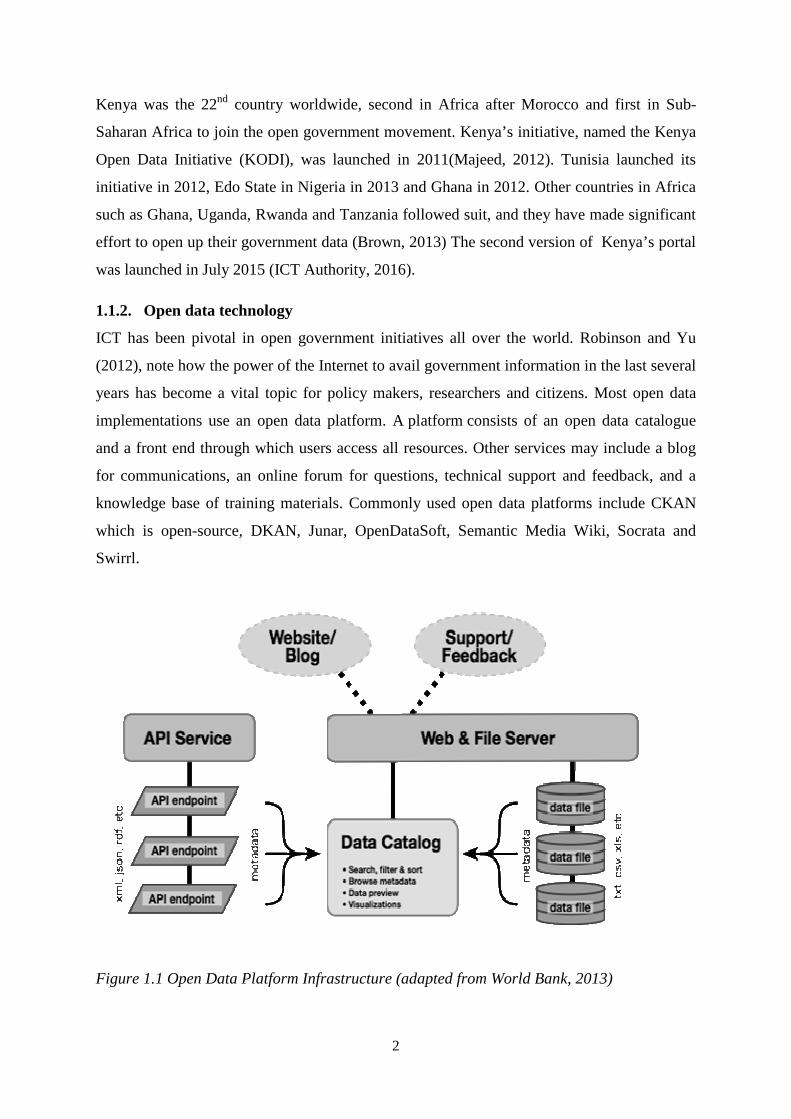
years has become a vital topic for policy makers, researchers and citizens. Most open data
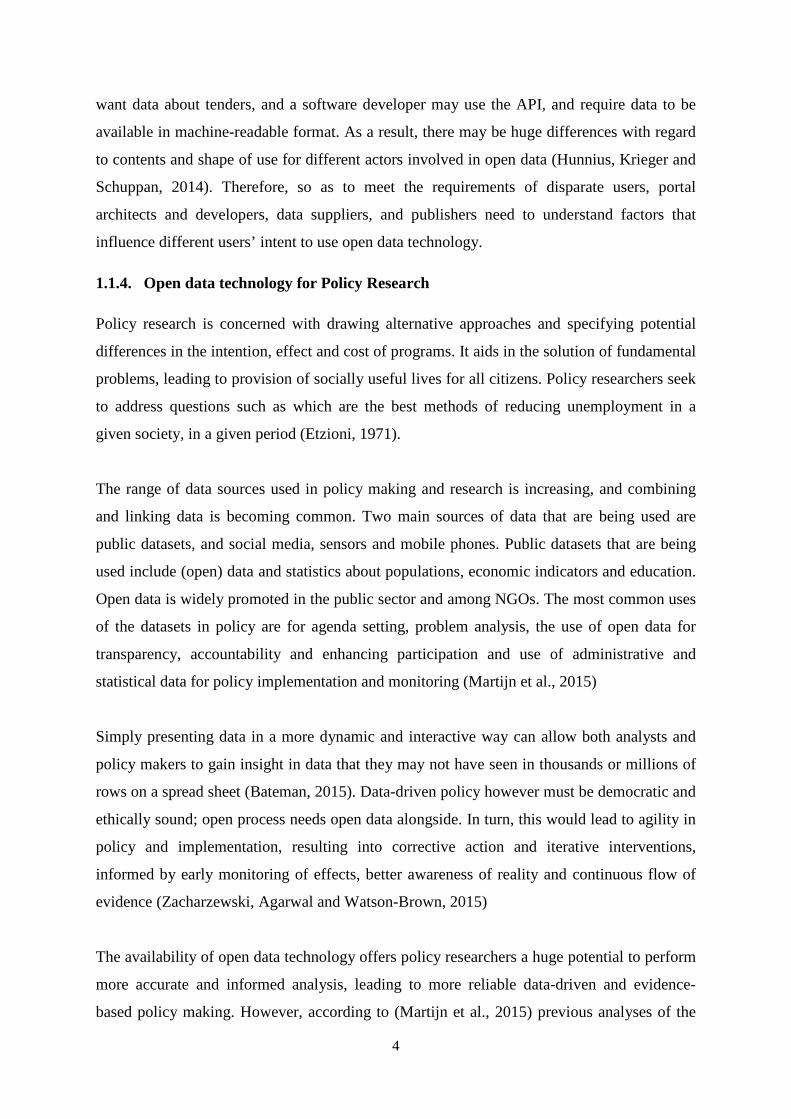
implementations use an open data platform. A platform consists of an open data catalogue
and a front end through which users access all resources. Other services may include a blog
for communications, an online forum for questions, technical support and feedback, and a
knowledge base of training materials. Commonly used open data platforms include CKAN
which is open-source, DKAN, Junar, OpenDataSoft, Semantic Media Wiki, Socrata and
Swirrl.
Figure 1.1 Open Data Platform Infrastructure (adapted from World Bank, 2013)
3
Data itself can also be viewed as a digital object (Lindman, Rossi and Tuunainen, 2013)
Computer science conceptualizes a dichotomy of data and application, whereby data is used
for storage, and applications are used for different operations based on data. Data can thus be
presented for processing. The main difference between open data and open source concepts is
that open data is about the openness of data, while open source is about the openness of
applications and their source code (Lindman, Rossi and Tuunainen, 2013).
The Kenya Open Data Initiative (KODI) uses Socrata, which is a cloud-based Software-as-a-
Service platform (World Bank, 2013) In this study, open data technology with regards to
Kenya’ open data platform will refer to; national government datasets, county datasets, files
and documents, maps, visualizations (graphs/charts), filtered user views, Application
Programming Interface, open budget, open data blog, embed code, forms, data request or
suggestion function, filter function, discuss function, data export function and other basic
website functions such as Sign Up and Login (KODI, 2014)
1.1.3. Use of Open data technology
Open data on its own has little intrinsic value if it’s not used. Open data should not just be
published, but rather it should be accompanied by an infrastructure that can handle it in a way
that makes it easy for users to use it. Open data technology is essential for not only
publishing, but also making use of open data. For instance, a usage process may consist of
discovery of a dataset, then using visualization tools to process and evaluate the data (Janssen
et al., 2012)
According to GovDelivery (2015), despite open data being a potentially powerful tool in the
public sector, its power is unlocked when its audiences use it. Use of open data, for instance
by analyzing a dataset, and then visualizing the results, may provide significant benefits.
These benefits include increased transparency and accountability by a government to its
citizens (Parsons et al., 2011; Bertot, Jaeger and Grimes, 2010). This in turn encourages more
citizen participation in government issues. Open data technology can also be used by both
businesses and individual citizens to create innovative products and services (Robinson et al.,
2009; Janssen, 2011; Robinson and Yu, 2012; Palka et al., 2013;Veenstra and Broek, 2013).
Users of open data technology may be varied and with different needs. For example, an
individual citizen might expect to find dataset on national budget spending, a business may
4
want data about tenders, and a software developer may use the API, and require data to be
available in machine-readable format. As a result, there may be huge differences with regard
to contents and shape of use for different actors involved in open data (Hunnius, Krieger and
Schuppan, 2014). Therefore, so as to meet the requirements of disparate users, portal
architects and developers, data suppliers, and publishers need to understand factors that
influence different users’ intent to use open data technology.
1.1.4. Open data technology for Policy Research
Policy research is concerned with drawing alternative approaches and specifying potential
differences in the intention, effect and cost of programs. It aids in the solution of fundamental
problems, leading to provision of socially useful lives for all citizens. Policy researchers seek
to address questions such as which are the best methods of reducing unemployment in a
given society, in a given period (Etzioni, 1971).
The range of data sources used in policy making and research is increasing, and combining
and linking data is becoming common. Two main sources of data that are being used are
public datasets, and social media, sensors and mobile phones. Public datasets that are being
used include (open) data and statistics about populations, economic indicators and education.
Open data is widely promoted in the public sector and among NGOs. The most common uses
of the datasets in policy are for agenda setting, problem analysis, the use of open data for
transparency, accountability and enhancing participation and use of administrative and
statistical data for policy implementation and monitoring (Martijn et al., 2015)
Simply presenting data in a more dynamic and interactive way can allow both analysts and
policy makers to gain insight in data that they may not have seen in thousands or millions of
rows on a spread sheet (Bateman, 2015). Data-driven policy however must be democratic and
ethically sound; open process needs open data alongside. In turn, this would lead to agility in
policy and implementation, resulting into corrective action and iterative interventions,
informed by early monitoring of effects, better awareness of reality and continuous flow of
evidence (Zacharzewski, Agarwal and Watson-Brown, 2015)
The availability of open data technology offers policy researchers a huge potential to perform
more accurate and informed analysis, leading to more reliable data-driven and evidence-
based policy making. However, according to (Martijn et al., 2015) previous analyses of the
5
quality of freely available open government datasets has shown that heterogeneity of datasets
is still an issue. Also, some datasets are semi-open, requiring some kind of pre-requisite
registration. Open data technology support open policy making. Open policy making involves
developing and delivering policy in a fast-paced and increasingly networked and digital
world (Gov.uk, 2016)
1.2. Research Problem
Locally in Kenya, low usage of open data technology has been noted. For instance, a year
after the launch of Kenya open data portal, it was noted that the portal was not being used as
broadly as it had been anticipated (Majeed, 2012; Mutuku and Colaco,2012). Low usage of
the Kenya open data technology had also been cited by Hammer (2013), Mutuku and Mahihu
(2014), and Muigai (2014).
In their research study, Mutuku and Mahihu (2014) noted that low usage may be attributed to
low quality of the available data i.e. irrelevant data, out-dated data and poorly structured data,
plus difficulty in navigating the open data platform. This is despite there being an active
communications office on the Kenya open data initiative, and numerous awareness activities
with different parts of the ecosystem (Muigai, 2014).
Policy research done using open data technology can subsequently be used in better policy-
making, which is evidence-based and data-driven. This in-turn can lead to achievement of
some of the initial goals of the Kenya open data initiative such as increased transparency and
more citizen participation. This study then, aimed to assess factors that influence policy
researchers’ behavioral intention to use open data technology in Nairobi, Kenya.
Open data research is still in its early stages. As a result, existing literature uses limited
application and development of theory and it is also not yet clear which theories are most
relevant, nor whether a single theory or integrated theory is required (Zuiderwijk et al., 2014).
By using UTAUT theory construct this research study would increase the amount of open
data literature that uses theory.
6
1.3. Research Objectives
The overall objective of the study was to assess factors that influence policy researchers’
intention to make use of Kenya open data technology in Nairobi, Kenya. The study was
guided by the following specific objectives:
i. To establish what influence performance expectancy has on policy researchers’
intention to make use of open data technology in Nairobi, Kenya.
ii. To establish what influence effort expectancy has on policy researchers’ intention to
make use of open data technology in Nairobi, Kenya.
iii. To examine what influence social influence has on policy researchers’ intention to
make use of open data technology in Nairobi County, Kenya.
iv. To examine what influence facilitating conditions has onpolicy researchers’ intention
to make use of open data technology in Nairobi, Kenya.
v. To explore the moderating effects of age, gender, and experience.
vi. To examine UTAUT model in the open data technology context.
1.4. Hypotheses
The hypotheses were;
1) H1: Performance expectancy positively influences policy researchers’ intention to
make use of open data technology.
2) H1a: Gender moderates the influence of performance expectancy on policy
researchers’ intention to make use of open data technology.
3) H1b: Age moderates the influence of performance expectancy on policy researchers’
intention to make use of open data technology.
4) H1c: Experience moderates the influence of performance expectancy on policy
researchers’ intention to make use of use open data technology.
5) H2: Effort expectancy negatively influences policy researchers’ intention to make use
of open data technology.
6) H2a: Gender moderates the influence of effort expectancy on policy researchers’
intention to make use of open data technology.
7) H2b: Age moderates the influence of effort expectancy on policy researchers’
intention to make use of open data technology.
8) H2c: Experience moderates the influence of effort expectancy on policy researchers’
intention to make use of use open data technology.
7
9) H3: Social influence positively influences policy researchers’ intention to make use of
open data technology.
10) H3a: Gender moderates the influence of social influence on policy researchers’
intention to make use of open data technology.
11) H3b: Age moderates the influence of social influence on policy researchers’ intention
to make use of open data technology.
12) H3c: Experience moderates the influence of social influence on policy researchers’
intention to make use of use open data technology.
13) H4: Facilitating conditions positively influence policy researchers’ intention to make
use of open data technology.
14) H4a: Gender moderates the influence of facilitating conditions on policy researchers’
intention to make use of open data technology.
15) H4b: Age moderates the influence of facilitating conditions on policy researchers’
intention to make use of open data technology.
16) H4c: Experience moderates the influence of facilitating conditions on policy
researchers’ intention to make use of open data technology.
17) H5: UTAUT accounts for a significant variance (R2) of intention to make use of open
data technology.
1.5. Significance of the Study
This study contributes to open government data literature and its findings may be used in
future by other academic researchers in the open data space. By understanding factors that
influence intention to make use of open data technology, then developers of such
technologies can better understand user needs that can be used to develop better platforms, or
enhance existing ones. Insights from this study can be used to understand usage of open data
technology from the context of a developing country. Developing countries owned 12 out of
the 41 national open government data portals launched by 2013 (Mutuku and Mahihu, 2014).
1.6. Scope
Respondents were selected from Nairobi County, Kenya. The target population was policy
researchers based in ten think tanks in Nairobi, Kenya. Though there are other open data
initiatives by the private sector and civil society organizations in Kenya, our research focused
on the Kenya government’s open data initiative.
8
1.7. Limitations and Assumptions
It was difficult to ascertain who actually uses the Kenya open data portal. Our experience is
supported by the views of Johnson, Zheng, and Padman (2014). They posit that measuring
real usage of technology is usually challenging, and such kind of information is usually
inaccessible by researchers. Therefore, our study focused on behavioral intention, rather than
actual usage. Also, our sample size was small and considered only policy researchers based in
research institutes; there could be policy researchers in other types of organisations.
1.8. Definition of terms
Performance expectancy indicated the extent to which a policy researcher supposed that
making use of open data technology would lead to improved performance in their work.
Effort expectancy was used to mean the perceived extent of ease of use of open data
technology, by a policy researcher.
Social influence was used to mean the extent to which a policy researcher supposed that other
people believed that the researcher should make use of open data technology.
Facilitating conditions meant the extent of a policy researcher’s belief that organizational
support, and technical infrastructure to enable them use open data technology, existed.
Behavioral intention was used to mean a policy researcher’s future plan or intention of
making use of open data technology.
Age referred to the number of years lived, gender as either male or female, and experience in
using open data tools was categorized into either conversant or not conversant.
Open data technology was used to mean national datasets, county datasets, files and
documents, maps, visualizations (graphs/charts), filtered user views, Application
Programming Interface, open budget, open data blog, embed code, forms, data request or
suggestion function, filter function, discuss function, data export function and general website
functions such as About, Contact Us, Home, Partners, Terms of Use, Sign Up, Login.
9
CHAPTER TWO
LITERATURE REVIEW
2.1. Theoretical Review
A theoretical framework refers to how the researcher develops thoughts on what the possible
answers could be to the research problem. These thoughts and theories are then clustered into
themes that frame the subject (Kothari, 2008).Technology acceptance models explore factors
which influence adoption of technologies, the aim usually being to promote technology use
(Kripanont, 2007).Several of these models have been developed. They include; Theory of
Reasoned Action, Technology Acceptance Model, Theory of Planned Behavior, Diffusion of
Innovations theory, and Unified Theory of Acceptance and Use of Technology. We reviewed
theories that explicitly have behavioral intention as a construct.
2.1.1. Theory of Reasoned Action
This theory was originally drawn from social psychology. It is one of the most prominent
theories in behavioural and social sciences, and information systems (Sheppard, Hartwick,
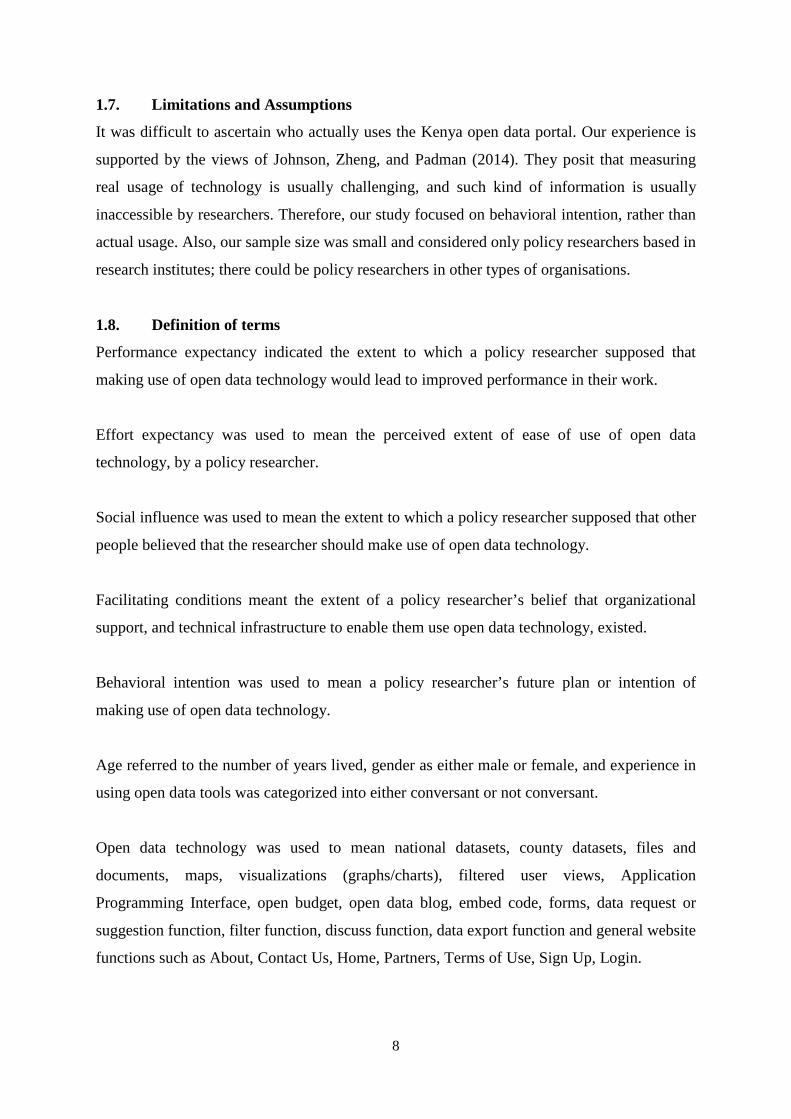
and Warshaw, 1988; Venkatesh, et al., 2003). TRA is concerned with predicting behaviour on
the basis of the suggested associations between behaviour, behavioral intentions, and
attitudes.
Fig.2.1 Theory of Reasoned Action (adapted from Fishbein and Ajzen, 1975).
Behavioural intention is defined as a “person’s subjective probability that he or she will
perform some behaviour” (Fishbein and Ajzen, 1975, p. 288). It is determined by the attitude
towards behaviour and subjective norm. Attitude is a positive or negative feeling about
performing certain behaviour, while subjective norm is a person’s perception that most
people who are important to them think they should or should not perform certain behaviour
(Fishbein and Ajzen, 1975)
10
Attitudes arise as a result of beliefs about the perceived consequences of a given action. A
subjective norm is more related to a person’s motivation or normative beliefs about
conforming to the perceived normative standards (Ajzen, 1991; Fishbein and Ajzen, 1975). In
technology acceptance research, TRA has been used widely, both directly to explain
acceptance, and to advance new models (Venkatesh, et al., 2003).
2.1.2. Theory of Planned Behaviour
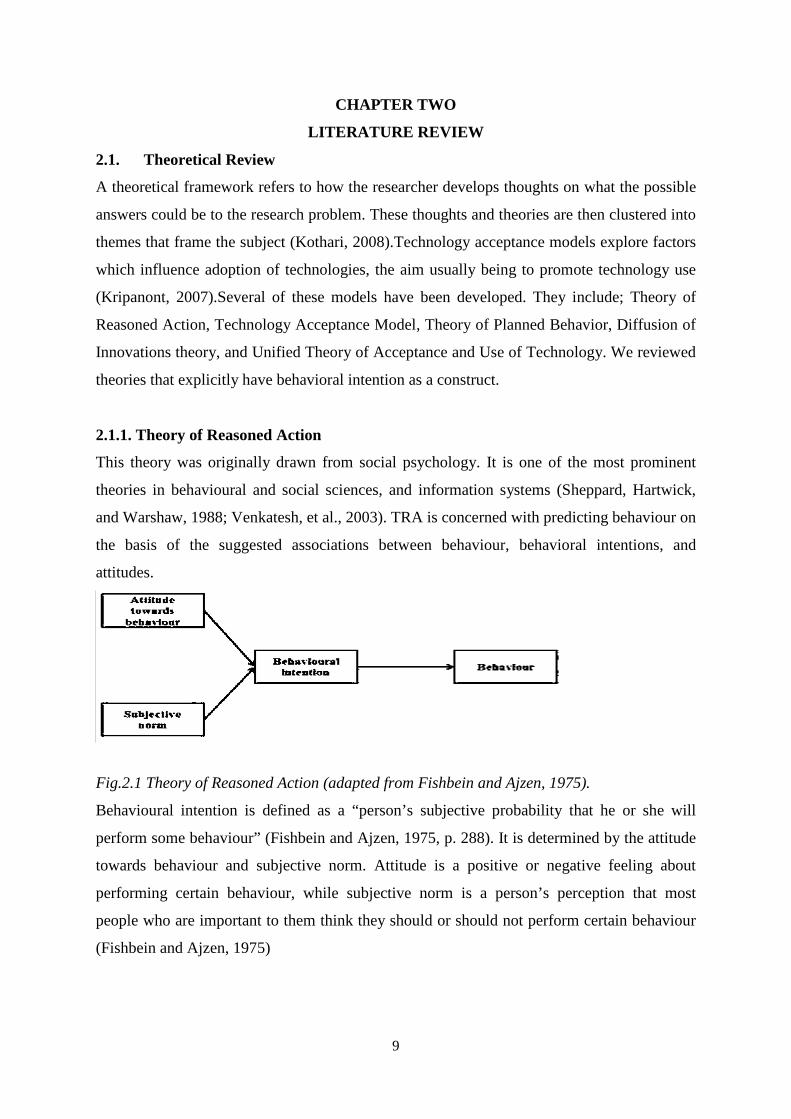
TPB is a descendent of TRA where there is always a need to provide a more detailed
explanation for the complex human behaviour (Ajzen, 1991). It has the additional construct
of perceived behaviour control, and additional correlations between the antecedents of
behavioural intention. Perceived behavioural control represents the extent to which the
resources and opportunities available to a person dictate their likelihood of behavioral
achievement. It also influences both behaviour and behavioural intention (Ajzen, 1991).
Fig. 2.2 Theory of Planned Behaviour (adapted from Ajzen, 1991, p. 182).
2.1.3. Technology Acceptance Model
TAM is an adaptation and technology-oriented contextualisation of the social psychological
TRA (Davis, 1986; Fishbein and Ajzen, 1975). Original TAM was then extended by
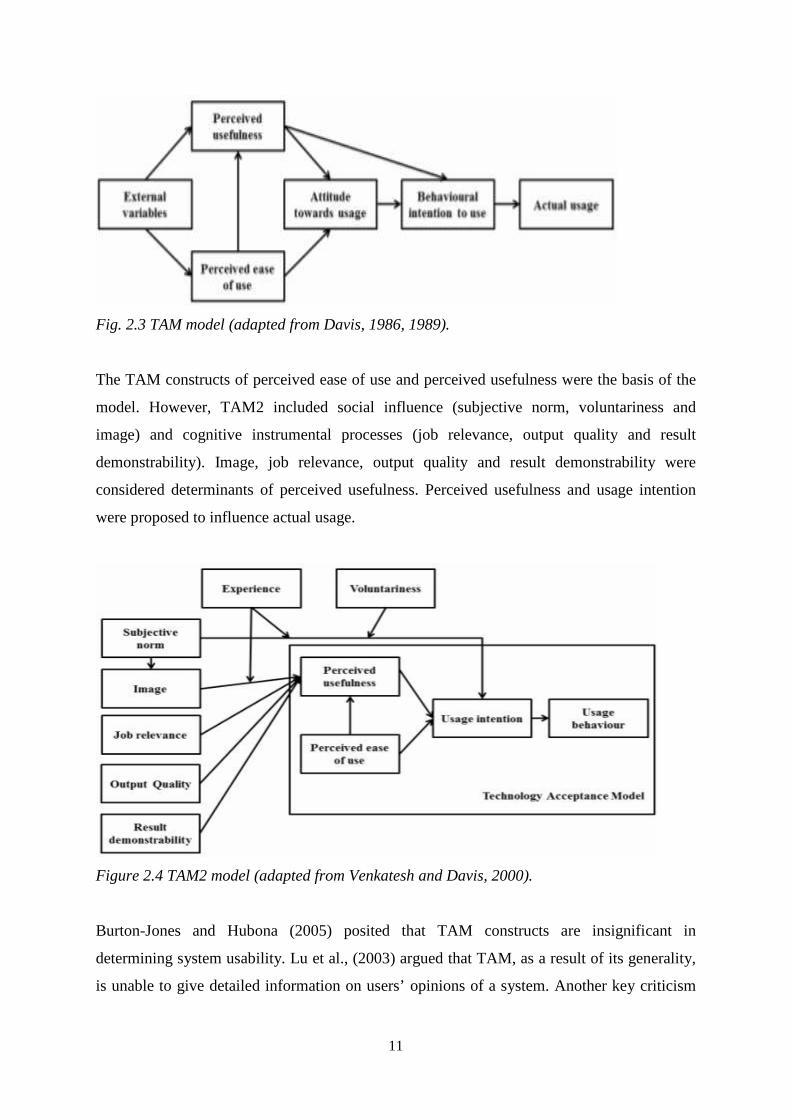
Venkatesh and Davis (2000) to contain social and organisational factors, resulting to TAM2.
11
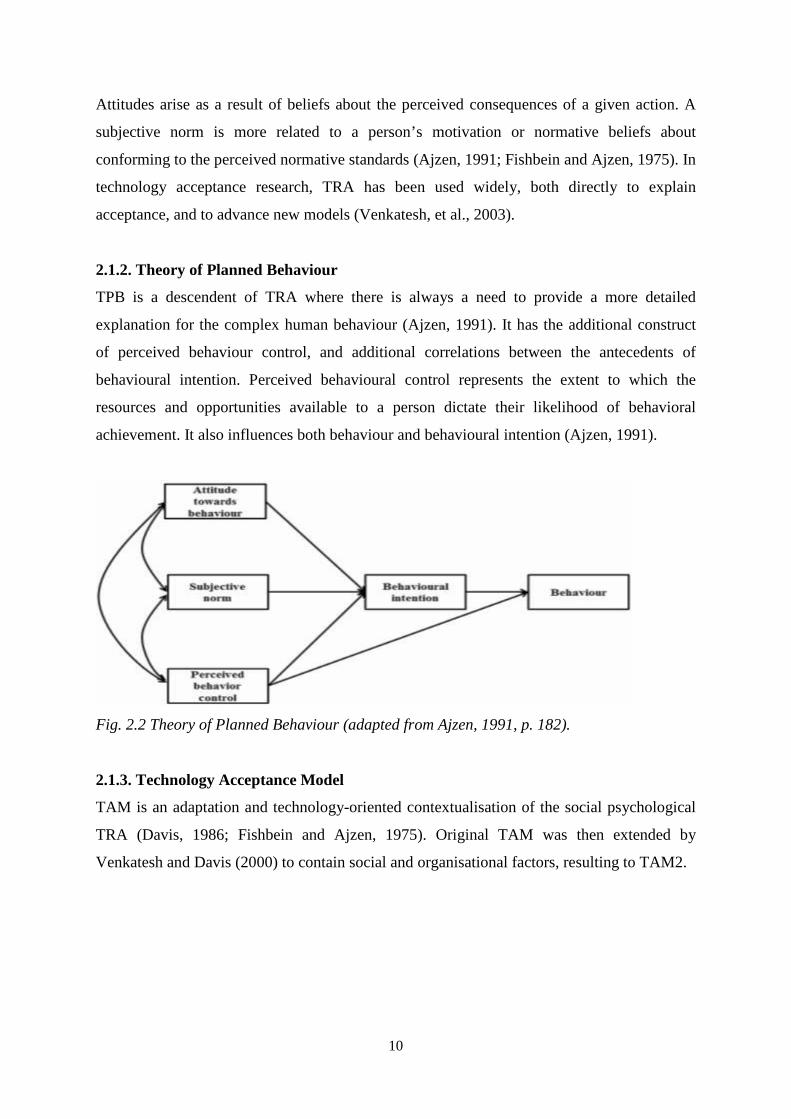
Fig. 2.3 TAM model (adapted from Davis, 1986, 1989).
The TAM constructs of perceived ease of use and perceived usefulness were the basis of the
model. However, TAM2 included social influence (subjective norm, voluntariness and
image) and cognitive instrumental processes (job relevance, output quality and result
demonstrability). Image, job relevance, output quality and result demonstrability were
considered determinants of perceived usefulness. Perceived usefulness and usage intention
were proposed to influence actual usage.
Figure 2.4 TAM2 model (adapted from Venkatesh and Davis, 2000).
Burton-Jones and Hubona (2005) posited that TAM constructs are insignificant in
determining system usability. Lu et al., (2003) argued that TAM, as a result of its generality,
is unable to give detailed information on users’ opinions of a system. Another key criticism
12
mentioned by Legris et al. (2003) is that TAM should have included social and organisational
factors which are important factors for determining technology acceptance.
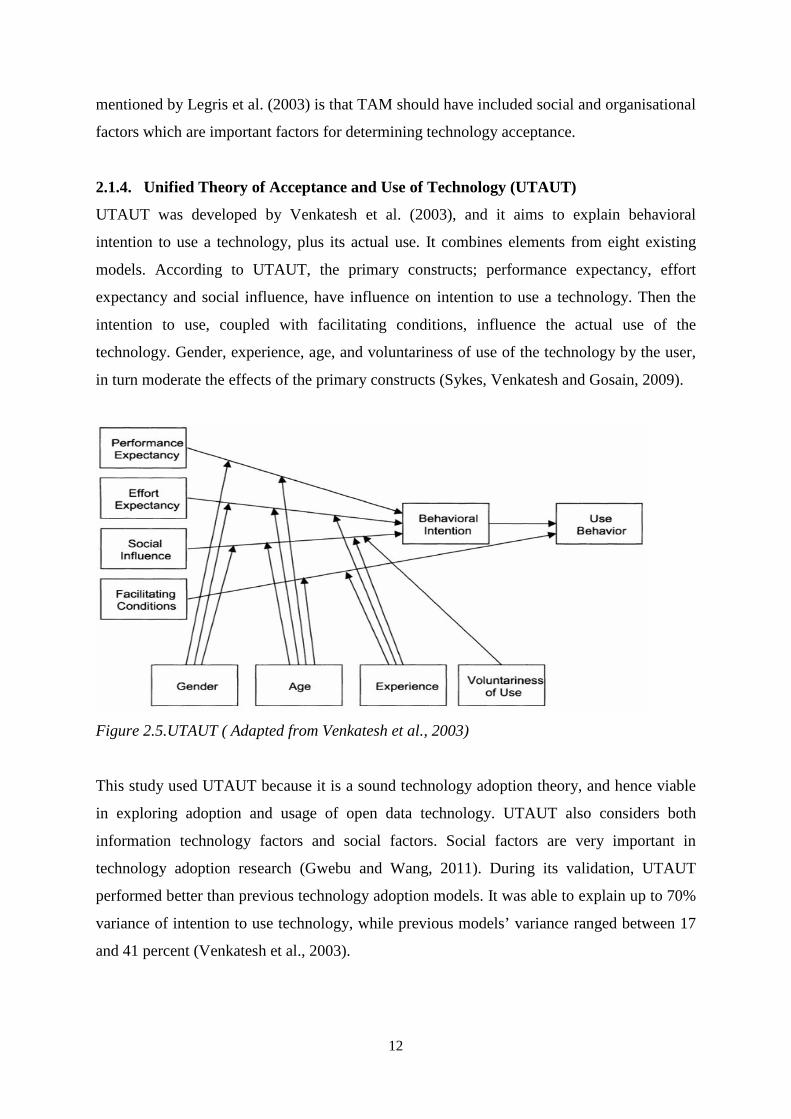
2.1.4. Unified Theory of Acceptance and Use of Technology (UTAUT)
UTAUT was developed by Venkatesh et al. (2003), and it aims to explain behavioral
intention to use a technology, plus its actual use. It combines elements from eight existing
models. According to UTAUT, the primary constructs; performance expectancy, effort
expectancy and social influence, have influence on intention to use a technology. Then the
intention to use, coupled with facilitating conditions, influence the actual use of the
technology. Gender, experience, age, and voluntariness of use of the technology by the user,
in turn moderate the effects of the primary constructs (Sykes, Venkatesh and Gosain, 2009).
Figure 2.5.UTAUT ( Adapted from Venkatesh et al., 2003)
This study used UTAUT because it is a sound technology adoption theory, and hence viable
in exploring adoption and usage of open data technology. UTAUT also considers both
information technology factors and social factors. Social factors are very important in
technology adoption research (Gwebu and Wang, 2011). During its validation, UTAUT
performed better than previous technology adoption models. It was able to explain up to 70%
variance of intention to use technology, while previous models’ variance ranged between 17
and 41 percent (Venkatesh et al., 2003).

13
2.2. Empirical Review
2.2.1. Influence of performance expectancy on intention to use open data technology
Performance expectancy indicated the extent to which a policy researcher supposed that
making use of open data technology would lead to improved performance in their work. For
instance, people may opt to use the normal sources of public sector data which they are used
to, if they perceive that using open data technology will not lead to any better performance.
Previous research shows that performance expectancy is one of the highest determinants of
intention to use a technology (Duyck et al., 2008).
According to Carter and Bélanger (2005), most existing open government initiatives often
lack adequate motivations to make users want to use them. This view is supported by
Weinstein and Goldstein (2012), who note that the accomplishment of open government
initiatives is contingent upon the public’s willingness to use and further exploit these data
sets. Ntale et al. (2014) carried out a study whose aim was to understand the specific efforts
required to ensure effective use of open data, with Kenya and Uganda as case studies. One of
their research findings was that lack of adequate quality data is a barrier to the demand for
and use of open data. They posited that low quality data on the portals would discourage
users from the portal again after first attempts.
Other significant factors that influence usage of e-government services are information
quality, efficiency, relevancy, completeness, accuracy, precision and timeliness
(Wangpipatwong, Chutimaskul and Papasratorn, 2005). Thus, if use of open data technology
would lead to better efficiency, then users are more likely to use and accept these
technologies. According to Dimitrova and Chen (2006), supposed usefulness, and previous
interest in government influenced intention to use e-government services. Another significant
factor is frequency and continuity of data delivery, which is a factor that has kept many
businesses from depending merely on government data (Kaasenbroon, 2013). We anticipated
that performance expectancy would have positive influence on behavioral intention.
H1: Performance expectancy positively influences policy researchers’ intention to make use
of open data technology.
H1a: Gender moderates the influence of performance expectancy on policy researchers’
intention to make use of open data technology.
14
H1b: Age moderates the influence of performance expectancy on policy researchers’
intention to make use of open data technology.
H1c: Experience moderates the influence of performance expectancy on policy researchers’
intention to make use of use open data technology.
2.2.2. Influence of effort expectancy on intention to use open data technology
Effort expectancy was used to mean the perceived extent of ease of use of open data
technology, by a policy researcher. If the effort required to use a technology is perceived as
too high, then the user may not use it, despite perceiving the technology as useful. Zuiderwijk
et al. (2012) posited that some relevant determinants of usage of open data technology
include availability of data, ease of finding the data, ease of comprehending the data, ease of
utilizing the data in ways such as linking datasets and comparing datasets.
Data should not only be published, its use should also be encouraged. The publicizing of data
needs to be accompanied by an infrastructure which is able to handle the data in an easy-to-
use way to lower the user threshold (Janssen et al., 2012).Open Data Barometer (2015)
suggests that in order to increase the availability of open data and increase the power of
citizens to use this data effectively, resources need to be dedicated to capacity-building. They
opine that enhancing the capacity of data users both inside and outside the government is
critical to maintaining a supply-demand data balance. This can be accomplished through
trainings and adapting open data tools to local needs.
Mutuku and Mahihu (2014) also noted that despite their findings that well-designed and
implemented technology intermediaries would enhance access and usability of open data,
most open data applications had been abandoned by their developers. The developers cited
low quality of open data and low demand and usage of the applications as the main reasons.
Low quality data was defined as that which is irrelevant i.e. data supplied mismatching data
in demand, irregularly updated data, poorly structured data that had to be refined before use
in their applications.
H2: Effort expectancy negatively influences policy researchers’ intention to make use of open
data technology.
H2a: Gender moderates the influence of effort expectancy on policy researchers’ intention to
make use of open data technology.
15
H2b: Age moderates the influence of effort expectancy on policy researchers’ intention to
make use of open data technology.
H2c: Experience moderates the influence of effort expectancy on policy researchers’
intention to make use of use open data technology.
2.2.3. Social influence’ influence on usage of open data technology
Social influence was used to mean the extent to which a policy researcher supposed that other
people believed that the researcher should make use of open data technology. Social
influence may be from peers at work or other people such as friends and family. The
important role of peers in organizations is highlighted by Talukder and Quazi (2010). For
instance, peers can be involved in discussions about an individual’s performance. Thus, one’s
peers’ perceptions about the value of a certain technology are important. Talukder et al.,
(2008) posit that perception of value of a technology can be created through the messages and
signals delivered by peers.
Most employees within organizations are interested in what their fellow colleagues are doing,
and they then tend to replicate those same activities (Frambach and Schillewaert, 2002).
Effective communication between colleagues of an organization that leads to powerful
synergies can lead to better adoption of technologies. External pressure from colleagues can
also be categorized as social influence and for technological innovations to be successful,
there needs to be quality communication and interaction between employees and their peers
(Sykes et al., 2009). Another factor is the importance attached to certain individuals within an
organization. We posited that if a colleague is perceived as being a key person within the
organization, and as having significant influence on other members within the organization,
then their attitude towards a certain technology would likely influence others’ attitude
towards the same technology. Our view is corroborated by (Sarker et al., 2011).
Apart from fellow colleagues in an organizational setting, friends and family may also be
significant influencers. These two groups are treated separately because voluntariness or lack
thereof is an important factor. If open data technology use is urged by fellow work colleagues
such as senior management, then use may not be voluntary. However, when use is as a result
of recommendations by friends and family, then it is seen as more voluntary (Conradie and
Choenni, 2012; Zuiderwijk et al., 2015).
16
H3: Social influence positively influences policy researchers’ intention to make use of open
data technology.
H3a: Gender moderates the influence of social influence on policy researchers’ intention to
make use of open data technology.
H3b: Age moderates the influence of social influence on policy researchers’ intention to
make use of open data technology.
H3c: Experience moderates the influence of social influence on policy researchers’ intention
to make use of use open data technology.
2.2.4. Influence of facilitating condition on intention to make use open data technology
Facilitating conditions meant the extent of a policy researcher’s belief that organizational
support, and technical infrastructure to enable them use open data technology, existed.
Several previous studies had shown facilitating conditions to be an insignificant determinant
of intention to use technology (Zuiderwijk et al., 2015; Rana et al., 2011).However, other
studies such as one by Choudrie and Dwivedi, (2005), showed facilitating condition to be a
significant factor, despite the fact that their study was carried out in a developed country. We
can argue then that there is contention as to the significance of facilitating conditions.
Kenya is a developing country and thus has limited resources. We anticipated facilitating
conditions would be a very significant determinant of policy researchers’ intention to make
use of open data technology. Such kinds of resources include internet access and availability
of support. Ahmad et al. (2012), opined that unawareness, lack of helpand guidelines,
influenced adoption of e-government services in Pakistan, which is also a developing
country. Similar findings have been conveyed by other studies carried out in developing
countries such as AlAwadhi, (2008) in Kuwait and Colesca and Dobrica (2008) in Romania.
Awareness about open data is a key factor that would lead to higher intention to make use of
open data technology in Kenya. Ideally, awareness about existence of a technology precedes
usage of the technology. Ntale et al. (2014) carried out a study whose aim was to understand
the specific efforts required to ensure effective use of Kenya open data. One of their findings
was that most Kenyans in the grassroots do not know of Kenya Open Data Initiative, and
hence have not used it.
17
Mutuku and Mahihu (2014) from iHub Research carried out an early-impact analysis of
Kenya open data applications and services. Key findings of their research were that there is
demand for government data, and citizens obtained it mostly from media followed by online
resources but very few knew about KODI. Following these claims, we posited that
facilitating conditions in terms of awareness and provision of support by government would
be significant factors.
To make use of open data, the availability of technical infrastructure in form of devices such
as computers and internet-enabled phones, and access to internet are very important factors.
According to the Kenya National Bureau of Statistics economic survey 2015, Kenya’s
internet penetration stood at 54.8% (KNBS, 2015). These numbers place Kenya in a
comparatively good position to avail open data via online means. We posited that people with
internet access are more likely to have higher intention to make use of open data technology.
H4: Facilitating conditions positively influence policy researchers’ intention to make use of
open data technology.
H4a: Gender moderates the influence of facilitating conditions on policy researchers’
intention to make use of open data technology.
H4b: Age moderates the influence of facilitating conditions on policy researchers’ intention
to make use of open data technology.
H4c: Experience moderates the influence of facilitating conditions on policy researchers’
intention to make use of open data technology.
2.2.5. Moderator Effects
It is vital to explore potential moderating variables in studies on technology acceptance (Sun
and Zhang, 2006). In this study, we designed hypotheses for three moderating variables;
gender of respondent, age of respondent and technical experience of respondent. We sought
to understand the moderating effects of the three variables, on the direct effects of
performance expectancy, social influence, facilitating conditions, and effort expectancy, on
the behavioral intention of policy researcher to use open data technology.
18
2.2.6. Critique of Existing Literature
Some previous research studies (Zuiderwijk et al., 2015; Rana et al., 2011) indicated that
facilitating conditions was an insignificant determinant of intention to make use of an open
technology while others (Choudrie and Dwivedi, 2005) indicated that it was significant.
There was thus need to investigate this variable further. This study was also carried out in
Kenya, which is a developing country and thus has limited resources; meaning facilitating
conditions may be a highly significant factor.
Two of the major open data studies carried out in Kenya; Mutuku and Mahihu (2014) and
Ntale et al. (2014), were donor-funded. Though we did not seek evidence of existence of bias,
we posited that there is a risk of these studies having had funding or sponsorship bias,
intentional or unintentional. Bias is any deviation from the reality in research that can lead to
incorrect conclusions, and can occur either intentionally or unintentionally (Gardenier and
Resnik, 2002).
2.3. Research Gap
Open data research is still in its infancy stages, and theoretical contributions in particular, are
limited (Magalhaes, Roseira, and Manley, 2014). Theories that can be appropriately applied
to open data are yet to be identified or developed. It is also not clearly known whether single
or unified theories should be applied (Zuiderwijk et al., 2014). Our study helped in gathering
insight as to the appropriateness of UTAUT as a theory.
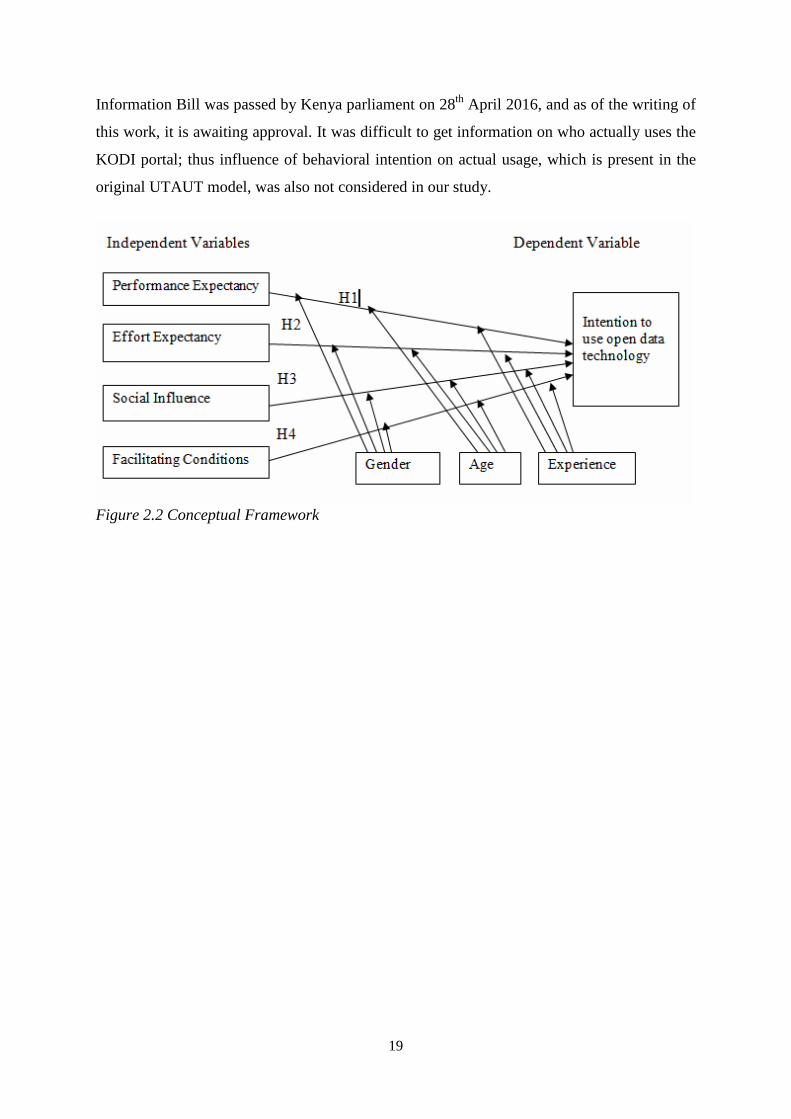
2.4. Conceptual Framework
According to Mugenda (2008), a conceptual framework is the brief description of the concept
under study, along with a graphical structure. It illustrates the researcher’s view of the
relationships between the variables being studied, based on guiding theories and existing
literature. Kothari (2008) explains that independent variables, also called predictor variables,
are factors that may cause, influence, or affect another variable, while the dependent variable
is influenced or changed by independent variable.
Our study was based on the UTAUT model. Voluntariness of use moderator was not
considered in our study. This is because currently, there is no Freedom of Information law in
Kenya. With the lack of a legislative framework and policies, use is only voluntary, thus
policy researchers are not obliged to use them. It is worth noting however, that the Access to
19
Information Bill was passed by Kenya parliament on 28th April 2016, and as of the writing of
this work, it is awaiting approval. It was difficult to get information on who actually uses the
KODI portal; thus influence of behavioral intention on actual usage, which is present in the
original UTAUT model, was also not considered in our study.
Figure 2.2 Conceptual Framework
20
CHAPTER THREE
RESEARCH METHODOLOGY
In this chapter, methods and processes which were employed to execute the study to achieve
its objectives are outlined. Mugenda (2008) observes that social science researchers routinely
collect data for both quantitative and qualitative analysis to establish the ‘cause and effect’
relationships between variables in an attempt to analyze and understand human beings’ social
life. They use various research designs, tools and procedures to achieve this objective.
3.1. Research Design
Descriptive and correlational research designs were used. Mugenda and Mugenda (2003)
argue that descriptive designs provide important clues regarding the issues that the
investigator should focus on. Kothari (2008) observes that a descriptive research design is
used to get information on the current status of people and their attitude, opinions and habits.
On the other hand, correlational research focuses on the relationships among variables. If a
statistically significant relationship exists between two variables, then it is possible to predict
one variable using the information available on the other variable (Mugenda, 2008).
3.1.1. Research Philosophy
Research philosophy refers to a researchers’ view of the relationship between knowledge and
the process by which it is developed (Saunders, Lewis and Thornhill, 2009). In this study we
used positivist philosophy, because the study is mainly quantitative. According to Mugenda
(2008), the positivist’s paradigm assumption is that there is a single tangible reality that can
be studied independent of human actors, and variables can be studied independent of each
other, and also related to each other using expressions. Interpretivist philosophy is based
upon the ontological assumption that reality and our knowledge thereof are social
constructions, incapable of being studied independent of the social actors that construct and
make sense of this reality. Pragmatist philosophy argues that the most important thing is the
research question, and that it is perfectly possible to work with variations in one’s views
(Saunders, Lewis and Thornhill, 2009). The research approach was deductive, and the
research strategy was a survey, with questionnaires used for data acquisition.
21
3.2. Target Population
Mugenda (2008) explains that population is the whole group of individuals, having mutual
observable characteristics, from where a sample is drawn for the study. On the other hand, a
target population refers to the specific population about which information is desired and
results generalized (Kothari, 2008). Ideal respondents for this study would be actual users of
the KODI portal. Previous research on open data in Kenya has cited not only low usage of
data on the portal, but also low awareness about existence of the initiative.
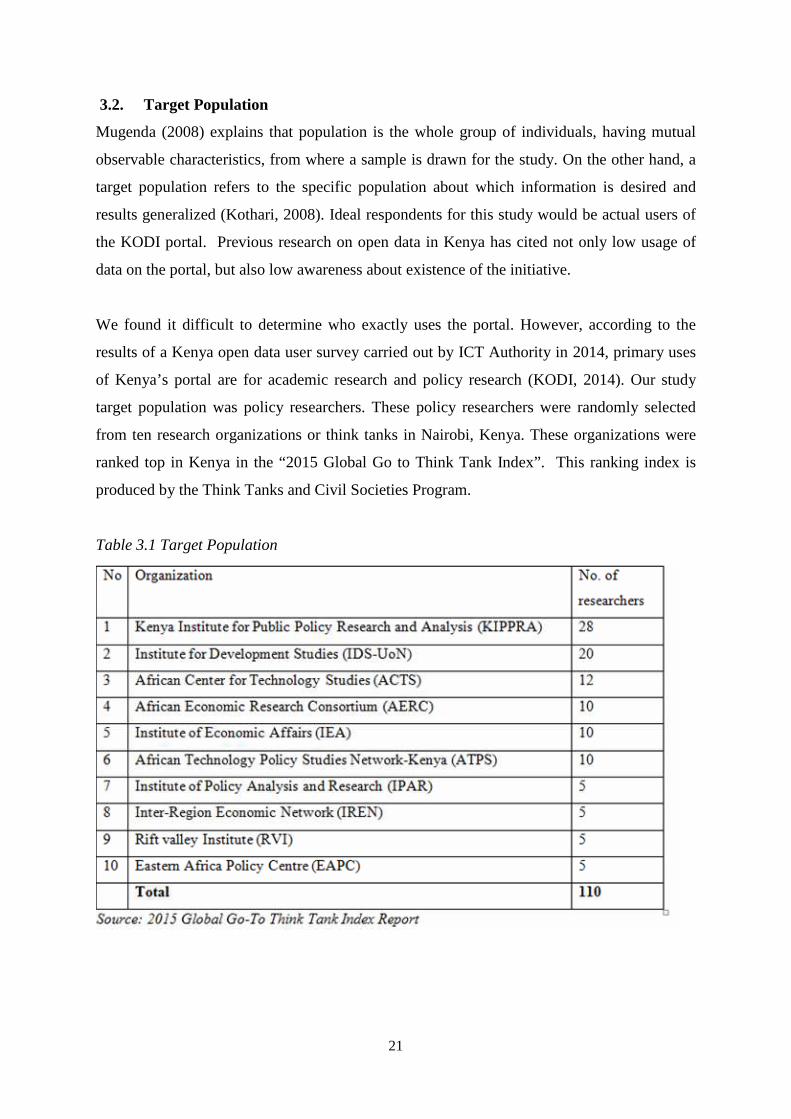
We found it difficult to determine who exactly uses the portal. However, according to the
results of a Kenya open data user survey carried out by ICT Authority in 2014, primary uses
of Kenya’s portal are for academic research and policy research (KODI, 2014). Our study
target population was policy researchers. These policy researchers were randomly selected
from ten research organizations or think tanks in Nairobi, Kenya. These organizations were
ranked top in Kenya in the “2015 Global Go to Think Tank Index”. This ranking index is
produced by the Think Tanks and Civil Societies Program.
Table 3.1 Target Population

22
3.3. Sampling
3.3.1. Sample Size
According to Mugenda and Mugenda (2003), a sample is a portion of the population of
researcher’s interest. The purpose of sampling is to gain an understanding about some
attributes of the whole population centred on characteristics of sample. According to
Mugenda (2008), sample size of at least 30 % is a good representation of the target
population since it allows for reliable levels of accuracy for testing significance. Slovin’s
sample size determination formula was used (Altares et al., 2003).
Slovin’s formula:
Whereby; N = population, e = error tolerance, n = sample size
The confidence level of this study is 90%, which gives a margin of error of 0.1
Therefore, using e=0.1 and N= 110, we calculated the sample size n as follows;
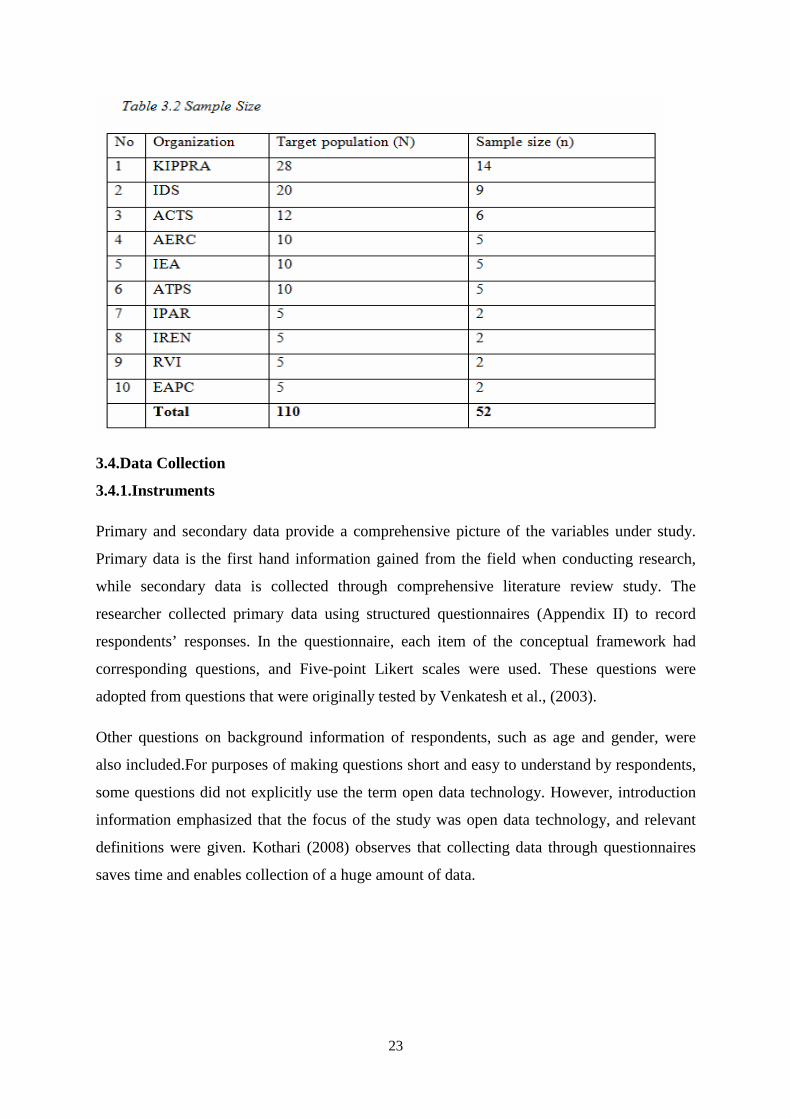
n =110 / (1+110*0.12) =110/ 2.1= 52.38= 52 researchers.
Our sample size of 52 researchers represented 47% of our target population.
3.3.2. Sampling Technique
A sampling technique is a technique of selecting subjects that will be part of the sample size
of 52 with the aim of making sure the sample is representative. These subjects are selected
from the sampling frame (Mugenda and Mugenda, 2003). To determine the sample size,
stratified random sampling was used. This form of sampling ensures that existing sub-groups
in the target population are fairly and randomly represented in the sample (Mugenda, 2008).
The following formula was used; ni = n/N) Ni ,Where; ni= sample size of the strata, n=total
sample size, N= total population size, Ni=number of individuals in every strata i.e. each
organization. The stratified sample size per organization is shown in the table below.
23
3.4.Data Collection
3.4.1.Instruments
Primary and secondary data provide a comprehensive picture of the variables under study.
Primary data is the first hand information gained from the field when conducting research,
while secondary data is collected through comprehensive literature review study. The
researcher collected primary data using structured questionnaires (Appendix II) to record
respondents’ responses. In the questionnaire, each item of the conceptual framework had
corresponding questions, and Five-point Likert scales were used. These questions were
adopted from questions that were originally tested by Venkatesh et al., (2003).
Other questions on background information of respondents, such as age and gender, were
also included.For purposes of making questions short and easy to understand by respondents,
some questions did not explicitly use the term open data technology. However, introduction
information emphasized that the focus of the study was open data technology, and relevant
definitions were given. Kothari (2008) observes that collecting data through questionnaires
saves time and enables collection of a huge amount of data.
24
3.4.2. Procedure
An introduction letter was presented to each organization and individual respondents, and the
researcher explained the purpose of the study and confirmed respondents’ willingness to
participate. The respondents were then given two weeks to fill. The researcher clarified any
questions or issues raised by a respondent. After the two weeks were over, the researcher
collected the filled questionnaires for data analysis. Where it was difficult to physically reach
a respondent, the questionnaire was disseminated online through email.
3.5. Pilot Test
A pilot study was first carried out. This was done to ensure that items in the questionnaire
were as understandable as possible, not ambiguous or insufficient. It also provided data to
check for reliability of the questionnaires.
3.5.1. Validity
Validity is the ability of a questionnaire to accurately measure that which it claims to
measure. Validity of the draft questionnaire was established by getting opinion from research
experts and a field test. Based on experts’ input, the draft questionnaire was reworded,
resulting to a final questionnaire whose reliability was later tested through a pilot test.
Mugenda (2008) define validity as the accuracy, significance and representativeness of
content based on the research objectives.
3.5.2. Reliability
Mugenda and Mugenda (2003) indicate that prior to the main study, a pilot study consisting
of at least 10% of the target population should be carried out to ascertain the reliability of
instruments. Reliability measures internal consistency of the measuring instrument. To
measure reliability of the final questionnaire, data collected through the pilot test was
analysed using SPSS to obtain the Cronbach’s Alpha values. Cronbach’s Alpha values are
used to measure internal consistency. According to Kothari (2008) an alpha coefficient of
0.70 or higher indicates a relatively high internal consistency and is generally acceptable. The
closer the coefficient is to1, the greater the consistency of the items in a scale. All the study
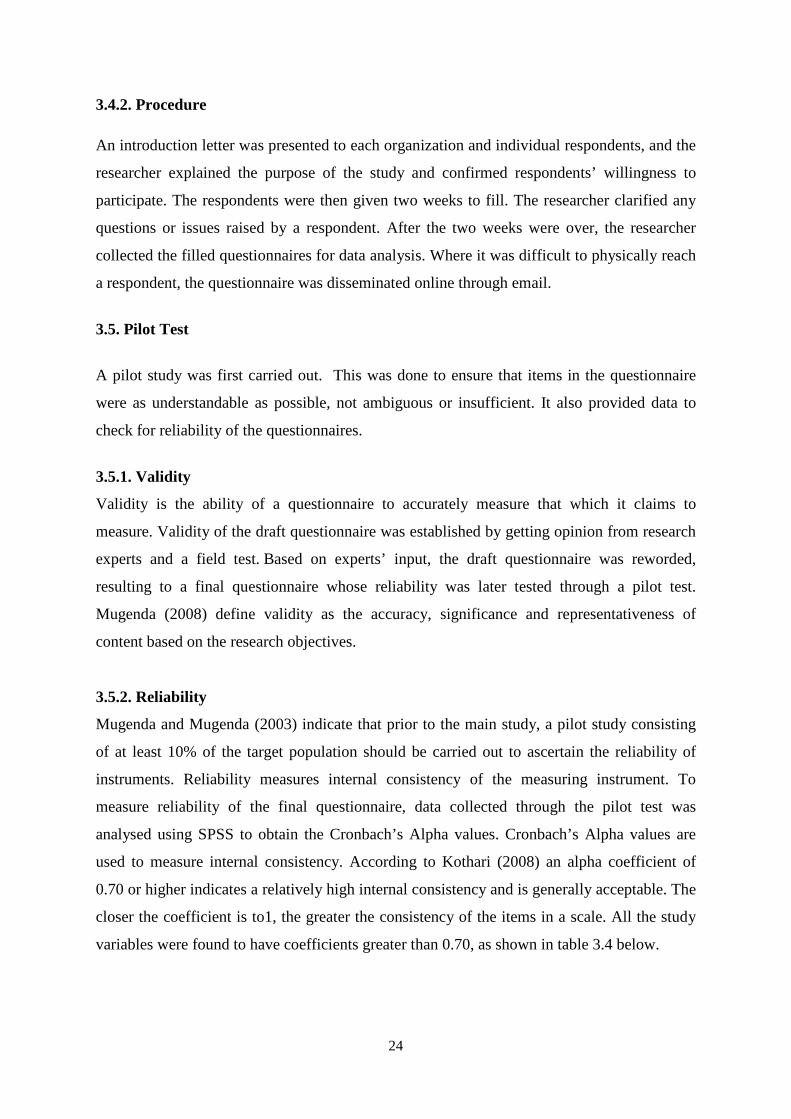
variables were found to have coefficients greater than 0.70, as shown in table 3.4 below.
25
Table 3.3: Reliability Coefficients
Social Influence had the highest reliability at 0.87 among the independent variables of the
study, closely followed by facilitating conditions at 0.83, effort expectancy at 0.82 and
performance expectancy at 0.80. Behavioral intention, which is the dependent variable of the
study, had a reliability of 0.75.
3.6. Data Analysis and Presentation
After data collection, the questionnaires were coded, and then edited to detect errors and
omission to enhance accuracy and precision. Using SPSS v20, correlation and multiple
regression analysis were used to analyse data. Correlation analysis was used to establish the
nature of the existing relationships, while multiple regression analysis was used to determine
statistical significance and influence or effect of the independent variables. After data
analysis, we derived the research findings from the evidence obtained. Then, guided by the
objectives of the study, we made conclusions and gave recommendations. Mugenda and
Mugenda (2003) explain that recommendations must be consistent with the purpose of the
study and its objectives.
26
CHAPTER FOUR
RESEARCH FINDINGS AND DISCUSSION
Response rate, demographic data of respondents, distribution of data for the variables, and
hypotheses testing are discussed in this chapter. The study was based on variables from the
UTAUT model, and descriptive and inferential statistics were used for data analysis.
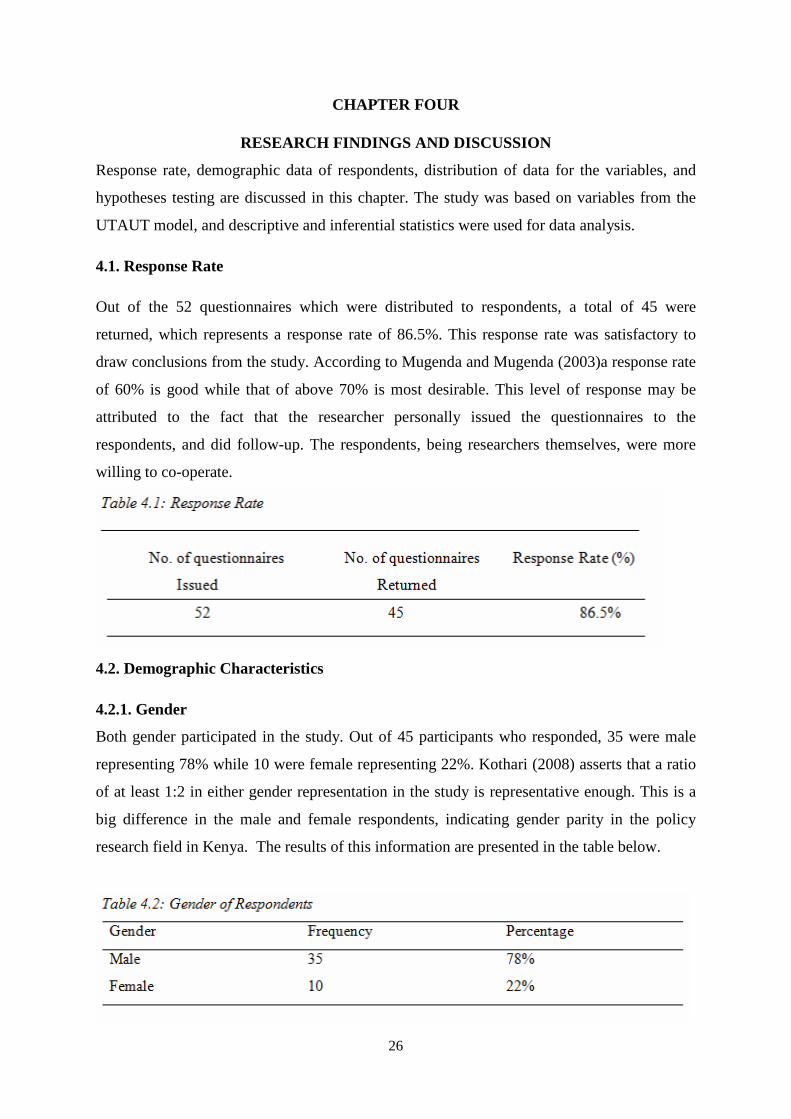
4.1. Response Rate
Out of the 52 questionnaires which were distributed to respondents, a total of 45 were
returned, which represents a response rate of 86.5%. This response rate was satisfactory to
draw conclusions from the study. According to Mugenda and Mugenda (2003)a response rate
of 60% is good while that of above 70% is most desirable. This level of response may be
attributed to the fact that the researcher personally issued the questionnaires to the
respondents, and did follow-up. The respondents, being researchers themselves, were more
willing to co-operate.
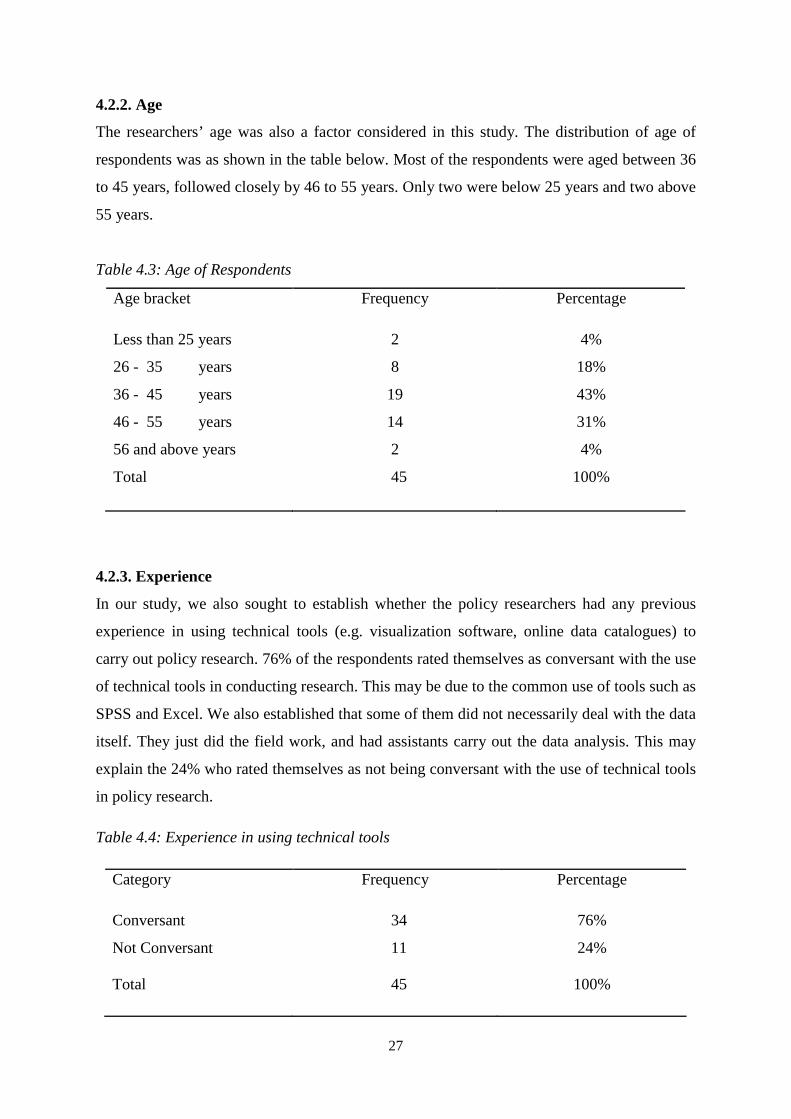
4.2. Demographic Characteristics
4.2.1. Gender
Both gender participated in the study. Out of 45 participants who responded, 35 were male
representing 78% while 10 were female representing 22%. Kothari (2008) asserts that a ratio
of at least 1:2 in either gender representation in the study is representative enough. This is a
big difference in the male and female respondents, indicating gender parity in the policy
research field in Kenya. The results of this information are presented in the table below.
27
4.2.2. Age
The researchers’ age was also a factor considered in this study. The distribution of age of
respondents was as shown in the table below. Most of the respondents were aged between 36
to 45 years, followed closely by 46 to 55 years. Only two were below 25 years and two above
55 years.
Table 4.3: Age of Respondents
Age bracket Frequency Percentage
Less than 25 years
26 - 35 years
36 - 45 years
46 - 55 years
56 and above years
2
8
19
14
2
4%
18%
43%
31%
4%
Total 45 100%
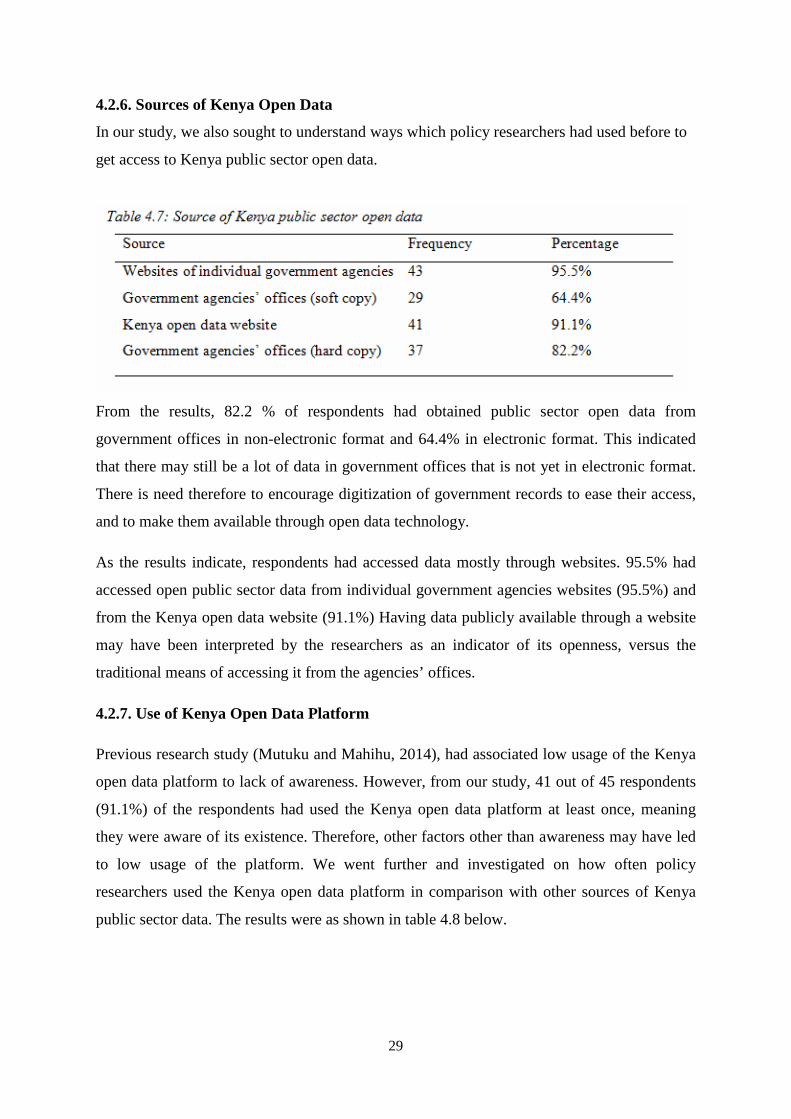
4.2.3. Experience
In our study, we also sought to establish whether the policy researchers had any previous
experience in using technical tools (e.g. visualization software, online data catalogues) to
carry out policy research. 76% of the respondents rated themselves as conversant with the use
of technical tools in conducting research. This may be due to the common use of tools such as
SPSS and Excel. We also established that some of them did not necessarily deal with the data
itself. They just did the field work, and had assistants carry out the data analysis. This may
explain the 24% who rated themselves as not being conversant with the use of technical tools
in policy research.
Table 4.4: Experience in using technical tools
Category Frequency Percentage
Conversant
Not Conversant
34
11
76%
24%
Total 45 100%
28
4.2.4. Level of Education
Most of the respondents had Master’s degree, at 58 %. 24% had PhD and 18% had degree.
The high number of post-graduate degree could be attributed to the nature of the field, and
the fact that their work was mostly research-oriented, thus a research degree being preferable.
Table 4.5: Highest academic qualification
Academic Qualification Frequency Percentage
Degree 8 18%
Masters 26 58%
PhD 11 24%
Total 45 100%
4.2.5. Nature of Organization
In our study, we also sought to establish the nature of the organization in which the
respondents’ worked in. As shown in table 4.6 below, most (56%) were working in civil
society organizations or non-governmental organizations, followed by public sector (33%),
and then the private sector (11%). This may be attributed to the fact that there is a lot of
policy research done by civil society organizations and NGOs. Policy work is also very
prevalent and vital in the public sector.
Table 4.6: Nature of organization
Sector Frequency Percentage
Public 15 33%
Private 4 11%
CSO/NGO 26 56%
Total 45 100%
29
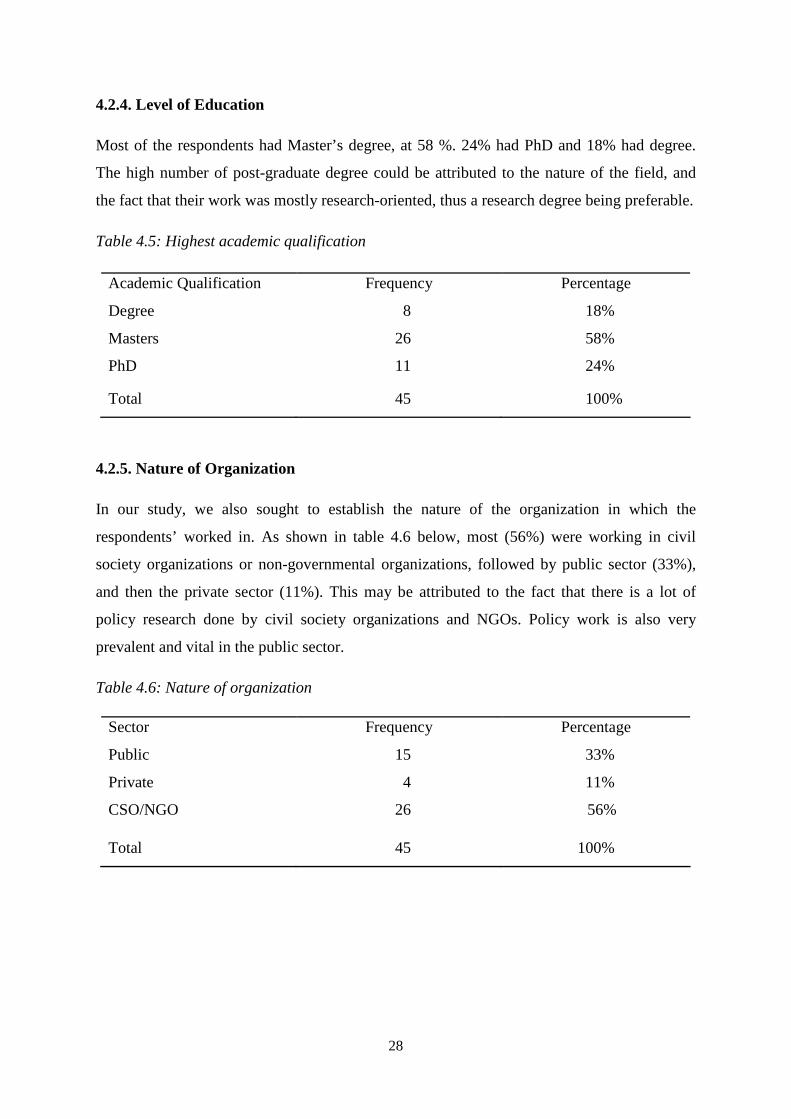
4.2.6. Sources of Kenya Open Data
In our study, we also sought to understand ways which policy researchers had used before to
get access to Kenya public sector open data.
From the results, 82.2 % of respondents had obtained public sector open data from
government offices in non-electronic format and 64.4% in electronic format. This indicated
that there may still be a lot of data in government offices that is not yet in electronic format.
There is need therefore to encourage digitization of government records to ease their access,
and to make them available through open data technology.
As the results indicate, respondents had accessed data mostly through websites. 95.5% had
accessed open public sector data from individual government agencies websites (95.5%) and
from the Kenya open data website (91.1%) Having data publicly available through a website
may have been interpreted by the researchers as an indicator of its openness, versus the
traditional means of accessing it from the agencies’ offices.
4.2.7. Use of Kenya Open Data Platform
Previous research study (Mutuku and Mahihu, 2014), had associated low usage of the Kenya
open data platform to lack of awareness. However, from our study, 41 out of 45 respondents
(91.1%) of the respondents had used the Kenya open data platform at least once, meaning
they were aware of its existence. Therefore, other factors other than awareness may have led
to low usage of the platform. We went further and investigated on how often policy
researchers used the Kenya open data platform in comparison with other sources of Kenya
public sector data. The results were as shown in table 4.8 below.
30
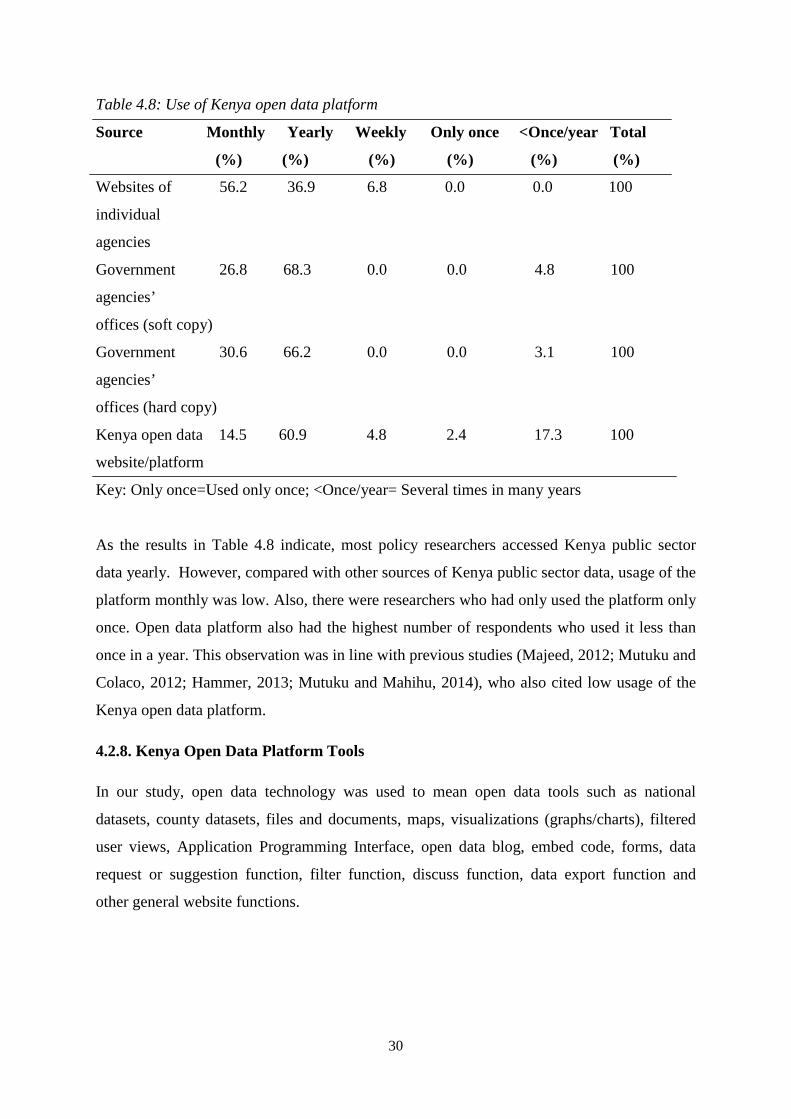
Table 4.8: Use of Kenya open data platform
Source Monthly Yearly Weekly Only once <Once/year Total
(%) (%) (%) (%) (%) (%)
Websites of 56.2 36.9 6.8 0.0 0.0 100
individual
agencies
Government 26.8 68.3 0.0 0.0 4.8 100
agencies’
offices (soft copy)
Government 30.6 66.2 0.0 0.0 3.1 100
agencies’
offices (hard copy)
Kenya open data 14.5 60.9 4.8 2.4 17.3 100
website/platform
Key: Only once=Used only once; <Once/year= Several times in many years
As the results in Table 4.8 indicate, most policy researchers accessed Kenya public sector
data yearly. However, compared with other sources of Kenya public sector data, usage of the
platform monthly was low. Also, there were researchers who had only used the platform only
once. Open data platform also had the highest number of respondents who used it less than
once in a year. This observation was in line with previous studies (Majeed, 2012; Mutuku and
Colaco, 2012; Hammer, 2013; Mutuku and Mahihu, 2014), who also cited low usage of the
Kenya open data platform.
4.2.8. Kenya Open Data Platform Tools
In our study, open data technology was used to mean open data tools such as national
datasets, county datasets, files and documents, maps, visualizations (graphs/charts), filtered
user views, Application Programming Interface, open data blog, embed code, forms, data
request or suggestion function, filter function, discuss function, data export function and
other general website functions.
31
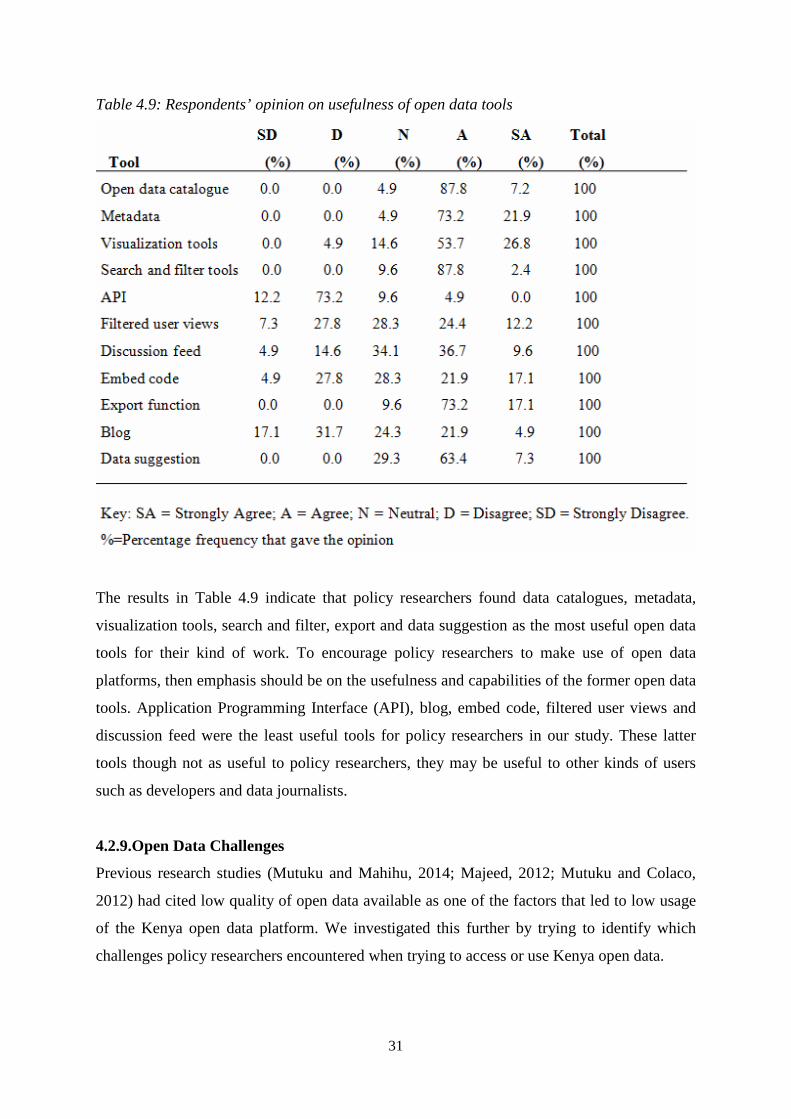
Table 4.9: Respondents’ opinion on usefulness of open data tools
The results in Table 4.9 indicate that policy researchers found data catalogues, metadata,
visualization tools, search and filter, export and data suggestion as the most useful open data
tools for their kind of work. To encourage policy researchers to make use of open data
platforms, then emphasis should be on the usefulness and capabilities of the former open data
tools. Application Programming Interface (API), blog, embed code, filtered user views and
discussion feed were the least useful tools for policy researchers in our study. These latter
tools though not as useful to policy researchers, they may be useful to other kinds of users
such as developers and data journalists.
4.2.9.Open Data Challenges
Previous research studies (Mutuku and Mahihu, 2014; Majeed, 2012; Mutuku and Colaco,
2012) had cited low quality of open data available as one of the factors that led to low usage
of the Kenya open data platform. We investigated this further by trying to identify which
challenges policy researchers encountered when trying to access or use Kenya open data.
32
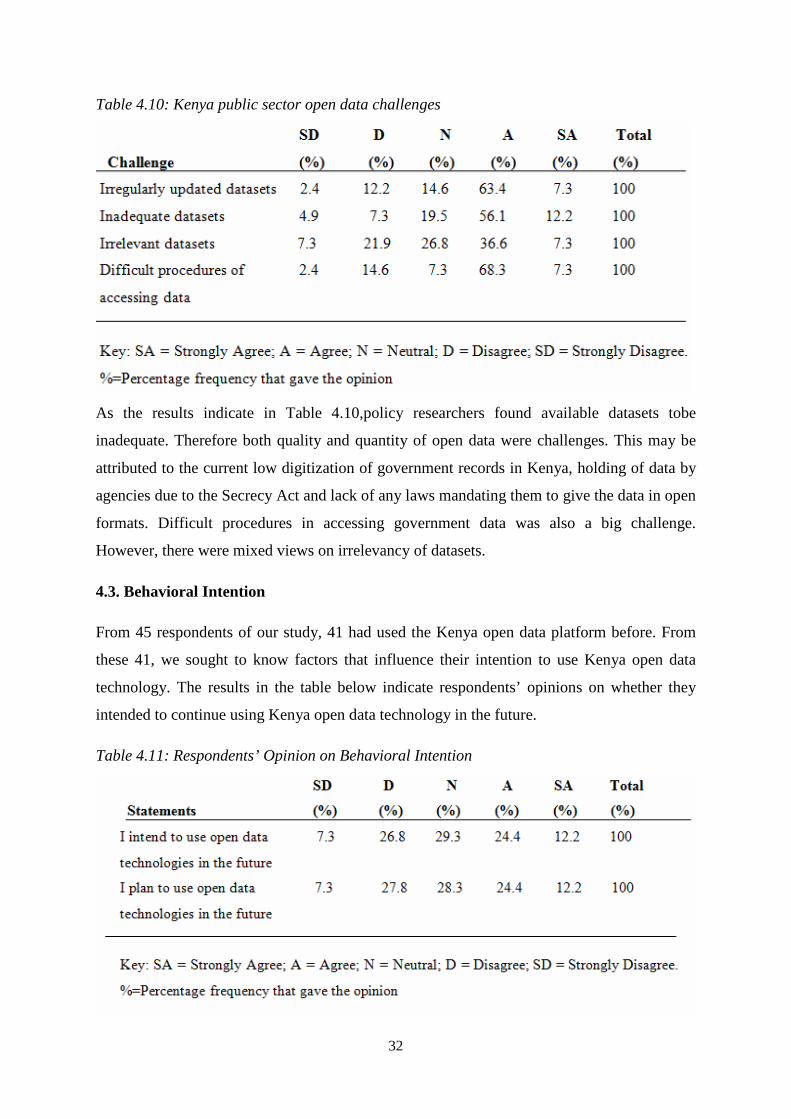
Table 4.10: Kenya public sector open data challenges
As the results indicate in Table 4.10,policy researchers found available datasets tobe
inadequate. Therefore both quality and quantity of open data were challenges. This may be
attributed to the current low digitization of government records in Kenya, holding of data by
agencies due to the Secrecy Act and lack of any laws mandating them to give the data in open
formats. Difficult procedures in accessing government data was also a big challenge.
However, there were mixed views on irrelevancy of datasets.
4.3. Behavioral Intention
From 45 respondents of our study, 41 had used the Kenya open data platform before. From
these 41, we sought to know factors that influence their intention to use Kenya open data
technology. The results in the table below indicate respondents’ opinions on whether they
intended to continue using Kenya open data technology in the future.
Table 4.11: Respondents’ Opinion on Behavioral Intention
33
Most respondents 29.3% were neutral to the statements that they intended to make use of
Kenya open data technology in future, while 6.8% disagreed, 24.4% agreed, 12.2% strongly
agreed, and 7.3% strongly disagreed. This meant that most were not yet sure whether they
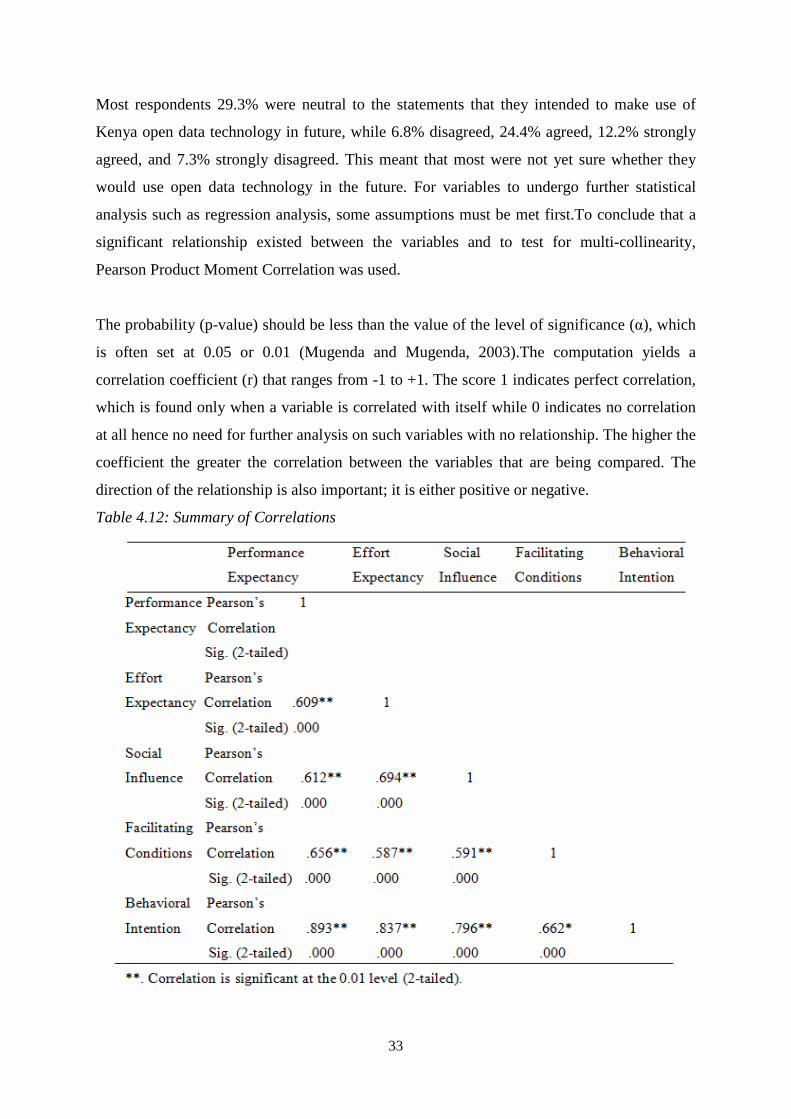
would use open data technology in the future. For variables to undergo further statistical
analysis such as regression analysis, some assumptions must be met first.To conclude that a
significant relationship existed between the variables and to test for multi-collinearity,
Pearson Product Moment Correlation was used.
The probability (p-value) should be less than the value of the level of significance (α), which
is often set at 0.05 or 0.01 (Mugenda and Mugenda, 2003).The computation yields a
correlation coefficient (r) that ranges from -1 to +1. The score 1 indicates perfect correlation,
which is found only when a variable is correlated with itself while 0 indicates no correlation
at all hence no need for further analysis on such variables with no relationship. The higher the
coefficient the greater the correlation between the variables that are being compared. The
direction of the relationship is also important; it is either positive or negative.
Table 4.12: Summary of Correlations
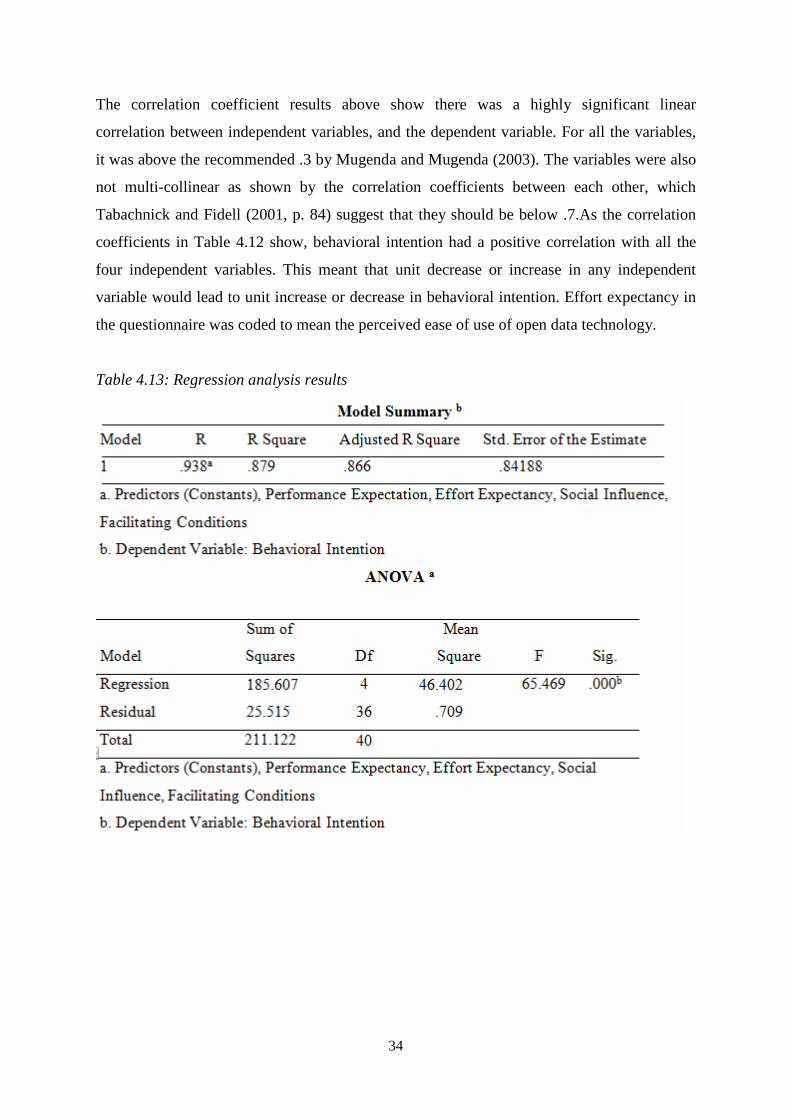
34
The correlation coefficient results above show there was a highly significant linear
correlation between independent variables, and the dependent variable. For all the variables,
it was above the recommended .3 by Mugenda and Mugenda (2003). The variables were also
not multi-collinear as shown by the correlation coefficients between each other, which
Tabachnick and Fidell (2001, p. 84) suggest that they should be below .7.As the correlation
coefficients in Table 4.12 show, behavioral intention had a positive correlation with all the
four independent variables. This meant that unit decrease or increase in any independent
variable would lead to unit increase or decrease in behavioral intention. Effort expectancy in
the questionnaire was coded to mean the perceived ease of use of open data technology.
Table 4.13: Regression analysis results
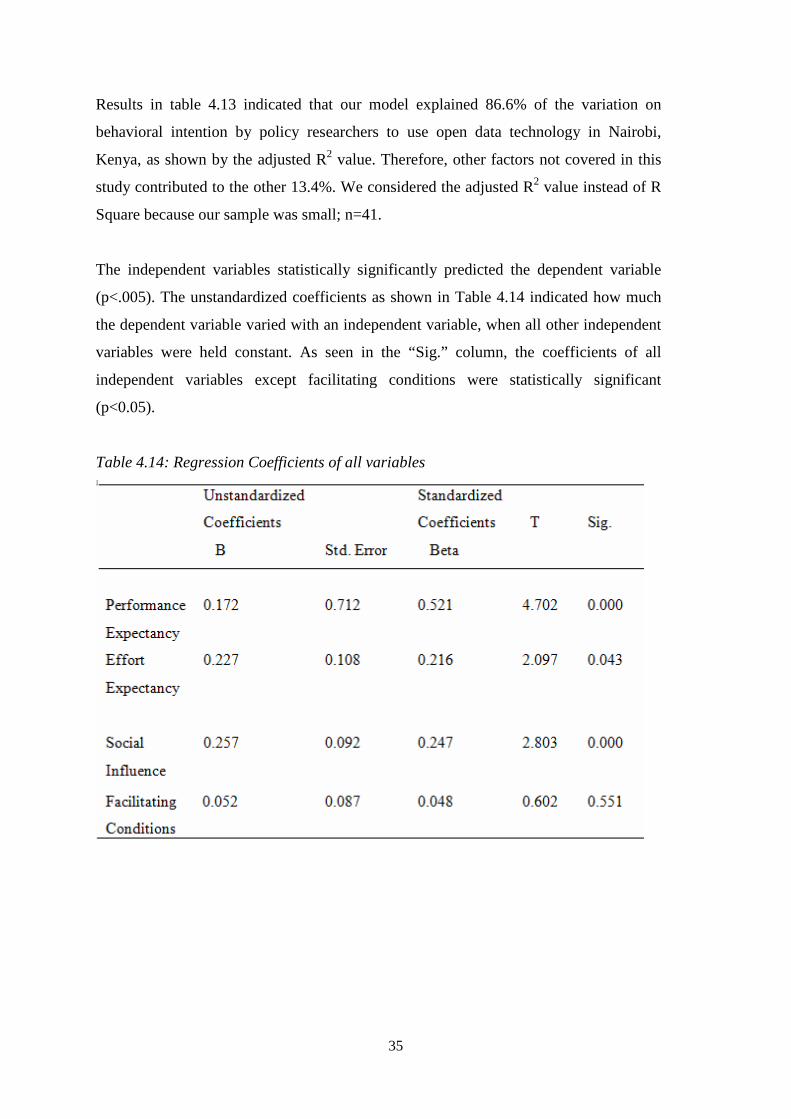
35
Results in table 4.13 indicated that our model explained 86.6% of the variation on
behavioral intention by policy researchers to use open data technology in Nairobi,
Kenya, as shown by the adjusted R2 value. Therefore, other factors not covered in this
study contributed to the other 13.4%. We considered the adjusted R2 value instead of R
Square because our sample was small; n=41.
The independent variables statistically significantly predicted the dependent variable
(p<.005). The unstandardized coefficients as shown in Table 4.14 indicated how much
the dependent variable varied with an independent variable, when all other independent
variables were held constant. As seen in the “Sig.” column, the coefficients of all
independent variables except facilitating conditions were statistically significant
(p<0.05).
Table 4.14: Regression Coefficients of all variables
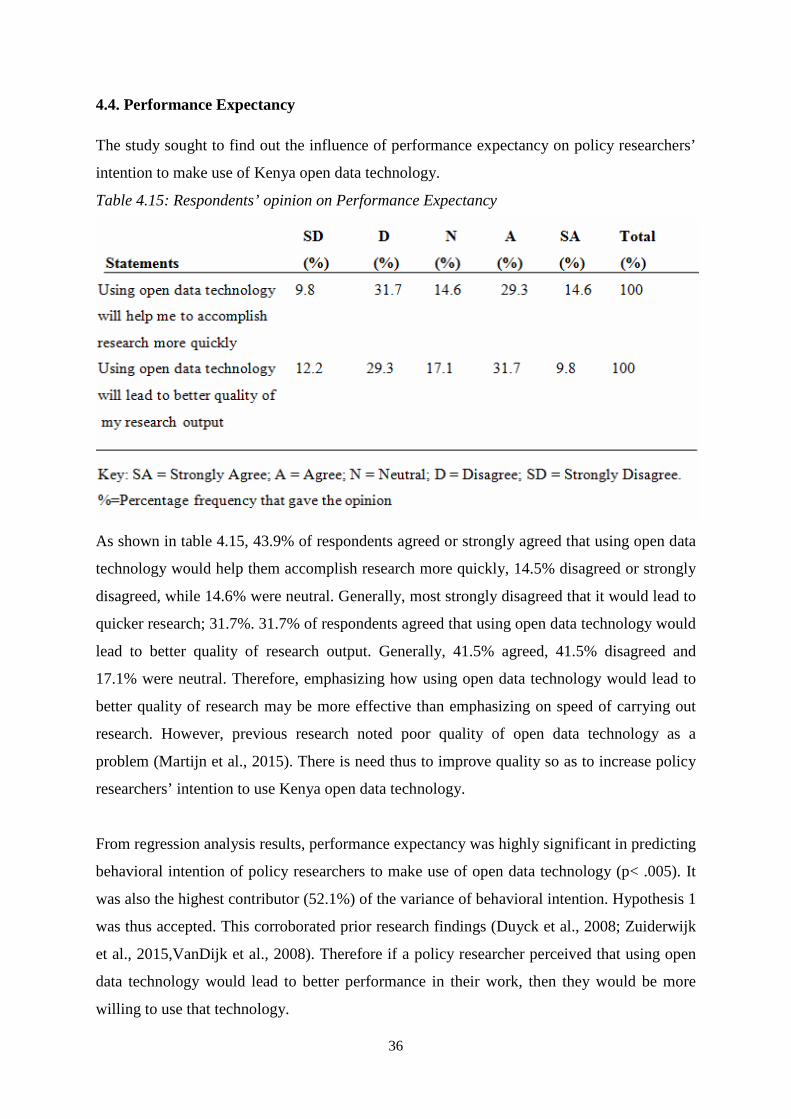
36
4.4. Performance Expectancy
The study sought to find out the influence of performance expectancy on policy researchers’
intention to make use of Kenya open data technology.
Table 4.15: Respondents’ opinion on Performance Expectancy
As shown in table 4.15, 43.9% of respondents agreed or strongly agreed that using open data
technology would help them accomplish research more quickly, 14.5% disagreed or strongly
disagreed, while 14.6% were neutral. Generally, most strongly disagreed that it would lead to
quicker research; 31.7%. 31.7% of respondents agreed that using open data technology would
lead to better quality of research output. Generally, 41.5% agreed, 41.5% disagreed and
17.1% were neutral. Therefore, emphasizing how using open data technology would lead to
better quality of research may be more effective than emphasizing on speed of carrying out
research. However, previous research noted poor quality of open data technology as a
problem (Martijn et al., 2015). There is need thus to improve quality so as to increase policy
researchers’ intention to use Kenya open data technology.
From regression analysis results, performance expectancy was highly significant in predicting
behavioral intention of policy researchers to make use of open data technology (p< .005). It
was also the highest contributor (52.1%) of the variance of behavioral intention. Hypothesis 1
was thus accepted. This corroborated prior research findings (Duyck et al., 2008; Zuiderwijk
et al., 2015,VanDijk et al., 2008). Therefore if a policy researcher perceived that using open
data technology would lead to better performance in their work, then they would be more
willing to use that technology.
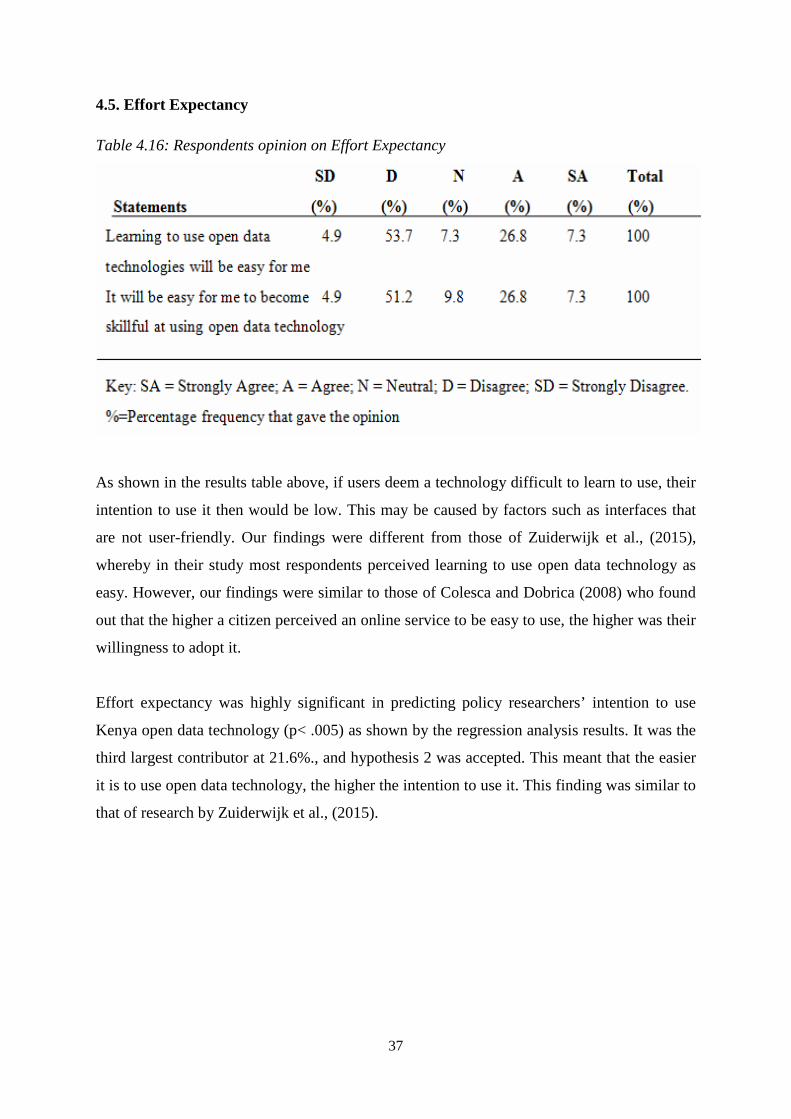
37
4.5. Effort Expectancy
Table 4.16: Respondents opinion on Effort Expectancy
As shown in the results table above, if users deem a technology difficult to learn to use, their
intention to use it then would be low. This may be caused by factors such as interfaces that
are not user-friendly. Our findings were different from those of Zuiderwijk et al., (2015),
whereby in their study most respondents perceived learning to use open data technology as
easy. However, our findings were similar to those of Colesca and Dobrica (2008) who found
out that the higher a citizen perceived an online service to be easy to use, the higher was their
willingness to adopt it.
Effort expectancy was highly significant in predicting policy researchers’ intention to use
Kenya open data technology (p< .005) as shown by the regression analysis results. It was the
third largest contributor at 21.6%., and hypothesis 2 was accepted. This meant that the easier
it is to use open data technology, the higher the intention to use it. This finding was similar to
that of research by Zuiderwijk et al., (2015).
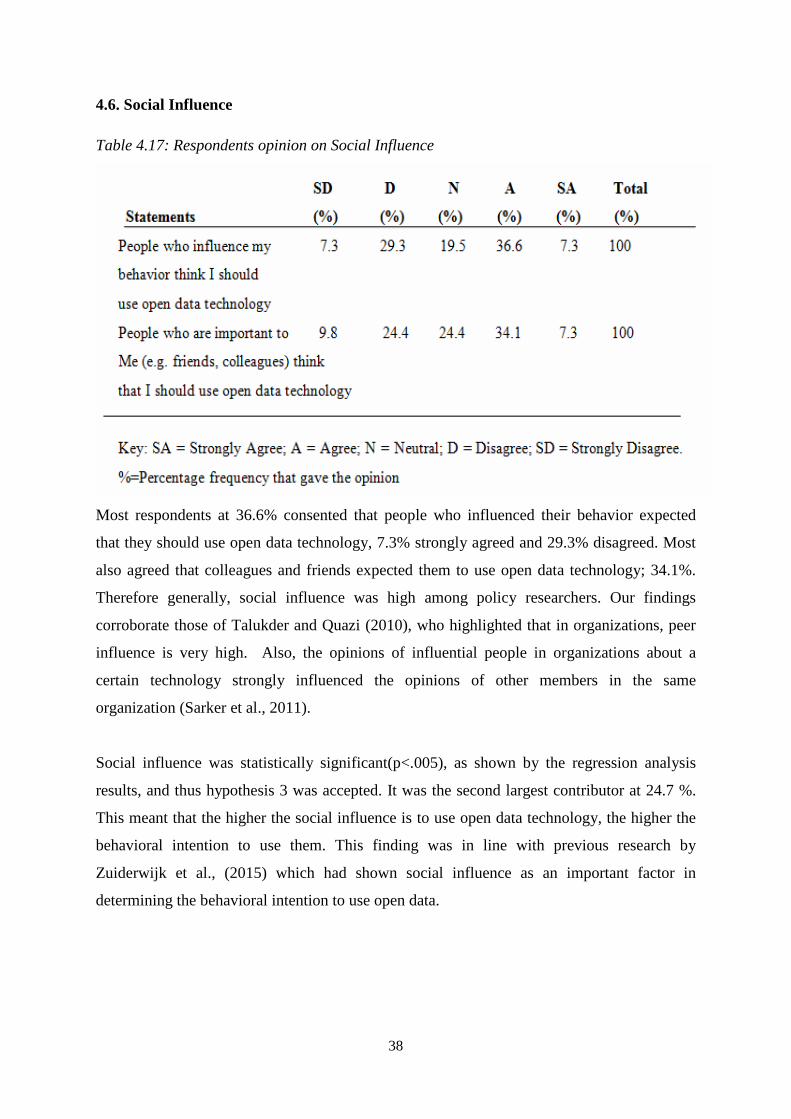
38
4.6. Social Influence
Table 4.17: Respondents opinion on Social Influence
Most respondents at 36.6% consented that people who influenced their behavior expected
that they should use open data technology, 7.3% strongly agreed and 29.3% disagreed. Most
also agreed that colleagues and friends expected them to use open data technology; 34.1%.
Therefore generally, social influence was high among policy researchers. Our findings
corroborate those of Talukder and Quazi (2010), who highlighted that in organizations, peer
influence is very high. Also, the opinions of influential people in organizations about a
certain technology strongly influenced the opinions of other members in the same
organization (Sarker et al., 2011).
Social influence was statistically significant(p<.005), as shown by the regression analysis
results, and thus hypothesis 3 was accepted. It was the second largest contributor at 24.7 %.
This meant that the higher the social influence is to use open data technology, the higher the
behavioral intention to use them. This finding was in line with previous research by
Zuiderwijk et al., (2015) which had shown social influence as an important factor in
determining the behavioral intention to use open data.
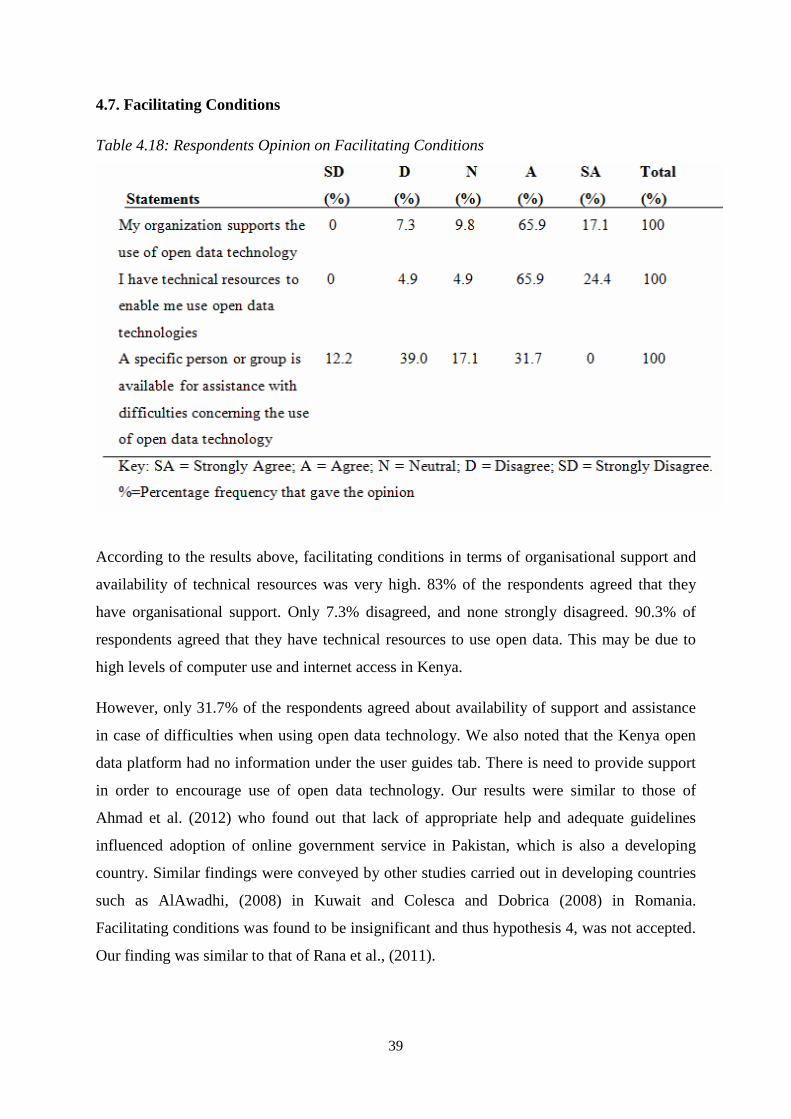
39
4.7. Facilitating Conditions
Table 4.18: Respondents Opinion on Facilitating Conditions
According to the results above, facilitating conditions in terms of organisational support and
availability of technical resources was very high. 83% of the respondents agreed that they
have organisational support. Only 7.3% disagreed, and none strongly disagreed. 90.3% of
respondents agreed that they have technical resources to use open data. This may be due to
high levels of computer use and internet access in Kenya.
However, only 31.7% of the respondents agreed about availability of support and assistance
in case of difficulties when using open data technology. We also noted that the Kenya open
data platform had no information under the user guides tab. There is need to provide support
in order to encourage use of open data technology. Our results were similar to those of
Ahmad et al. (2012) who found out that lack of appropriate help and adequate guidelines
influenced adoption of online government service in Pakistan, which is also a developing
country. Similar findings were conveyed by other studies carried out in developing countries
such as AlAwadhi, (2008) in Kuwait and Colesca and Dobrica (2008) in Romania.
Facilitating conditions was found to be insignificant and thus hypothesis 4, was not accepted.
Our finding was similar to that of Rana et al., (2011).
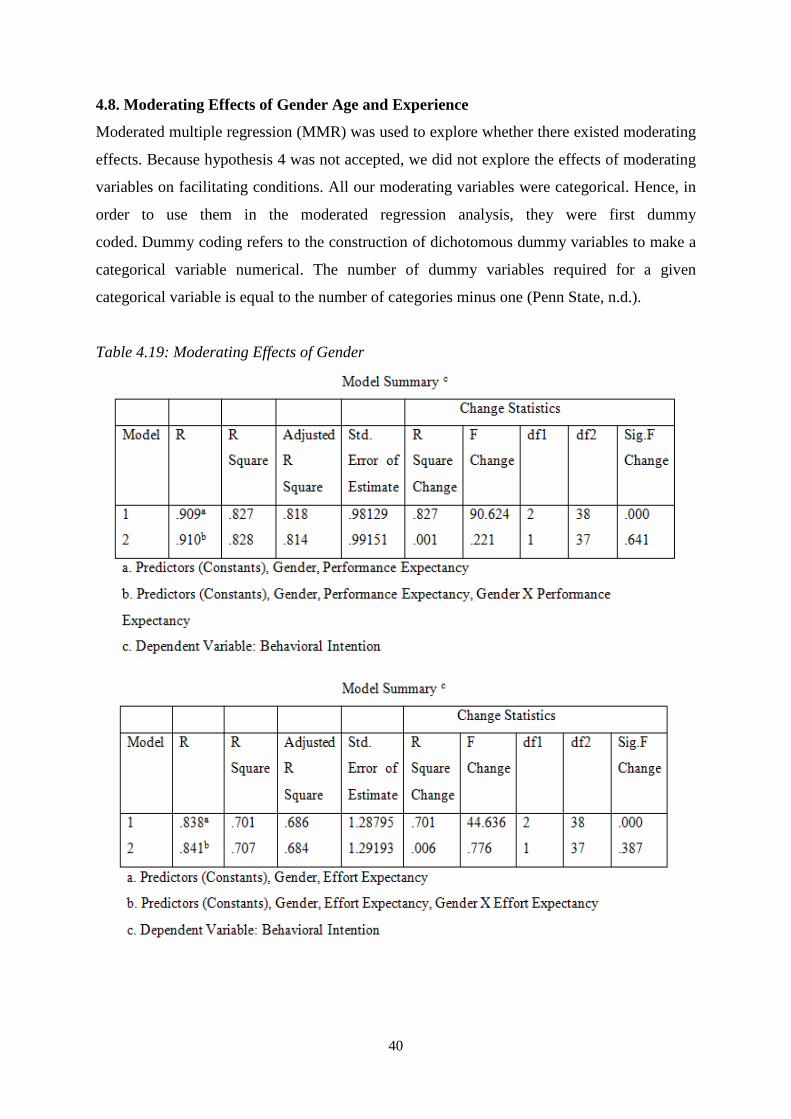
40
4.8. Moderating Effects of Gender Age and Experience
Moderated multiple regression (MMR) was used to explore whether there existed moderating
effects. Because hypothesis 4 was not accepted, we did not explore the effects of moderating
variables on facilitating conditions. All our moderating variables were categorical. Hence, in
order to use them in the moderated regression analysis, they were first dummy
coded. Dummy coding refers to the construction of dichotomous dummy variables to make a
categorical variable numerical. The number of dummy variables required for a given
categorical variable is equal to the number of categories minus one (Penn State, n.d.).
Table 4.19: Moderating Effects of Gender
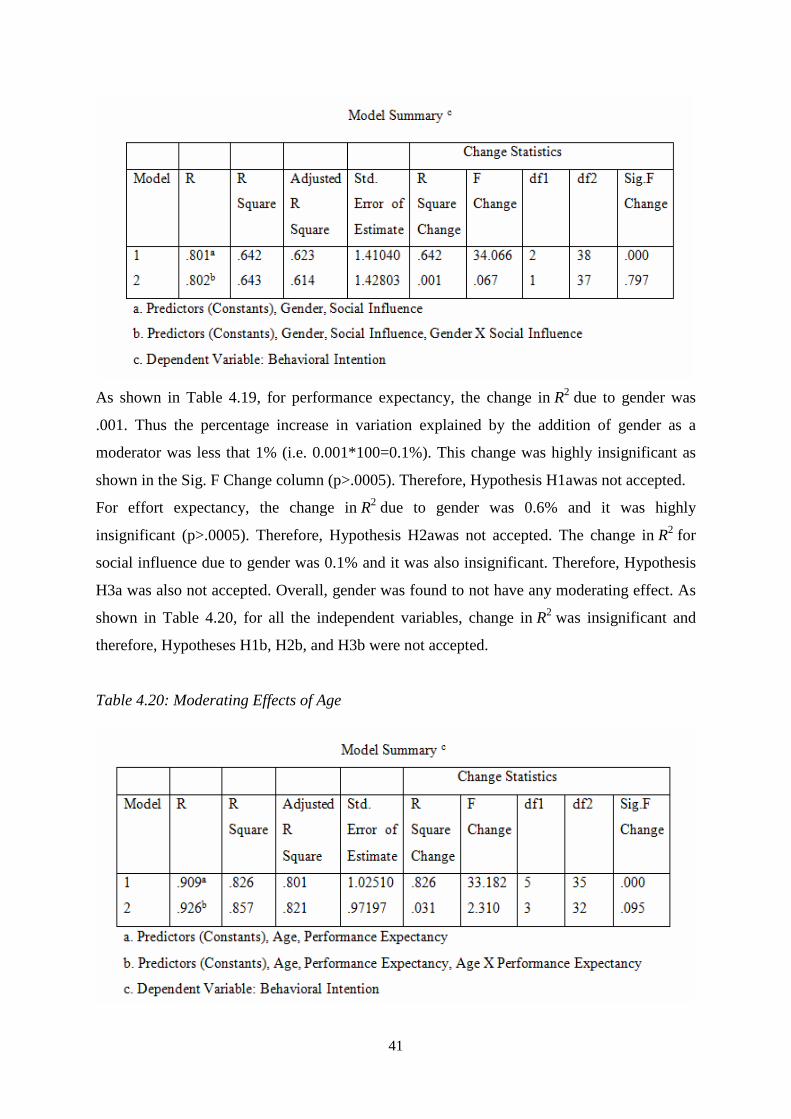
41
As shown in Table 4.19, for performance expectancy, the change in R2 due to gender was
.001. Thus the percentage increase in variation explained by the addition of gender as a
moderator was less that 1% (i.e. 0.001*100=0.1%). This change was highly insignificant as
shown in the Sig. F Change column (p>.0005). Therefore, Hypothesis H1awas not accepted.
For effort expectancy, the change in R2 due to gender was 0.6% and it was highly
insignificant (p>.0005). Therefore, Hypothesis H2awas not accepted. The change in R2 for
social influence due to gender was 0.1% and it was also insignificant. Therefore, Hypothesis
H3a was also not accepted. Overall, gender was found to not have any moderating effect. As
shown in Table 4.20, for all the independent variables, change in R2 was insignificant and
therefore, Hypotheses H1b, H2b, and H3b were not accepted.
Table 4.20: Moderating Effects of Age
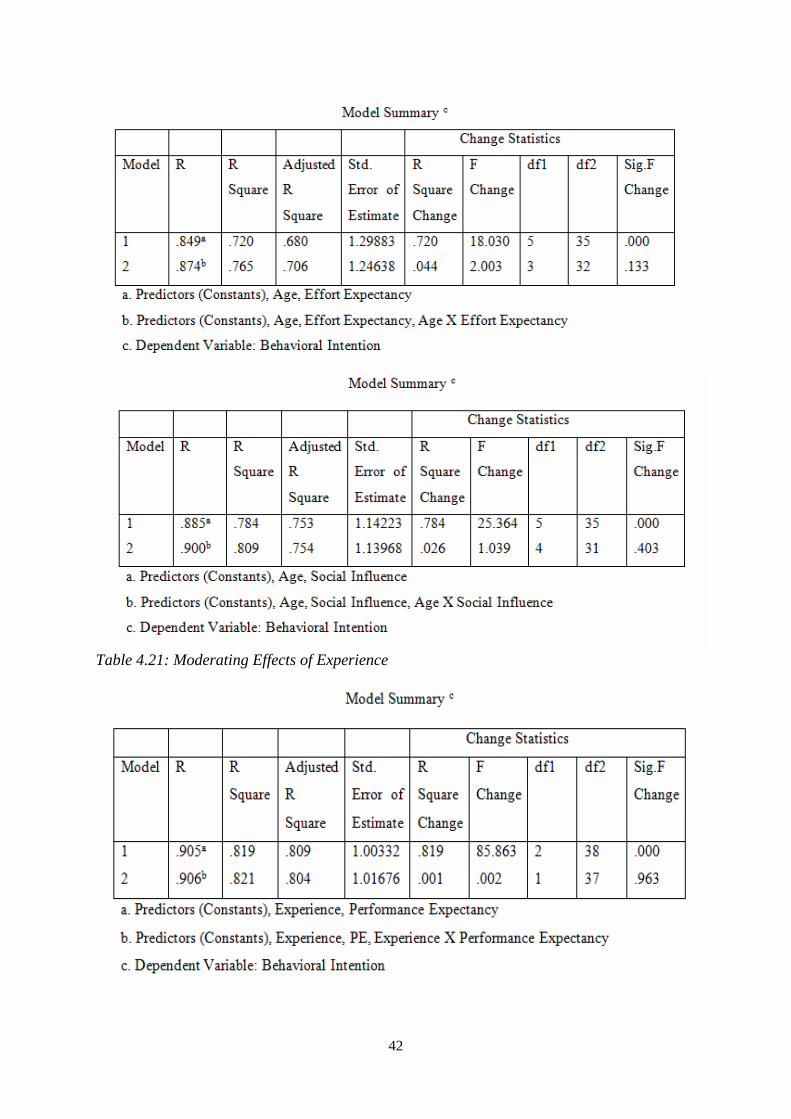
42
Table 4.21: Moderating Effects of Experience
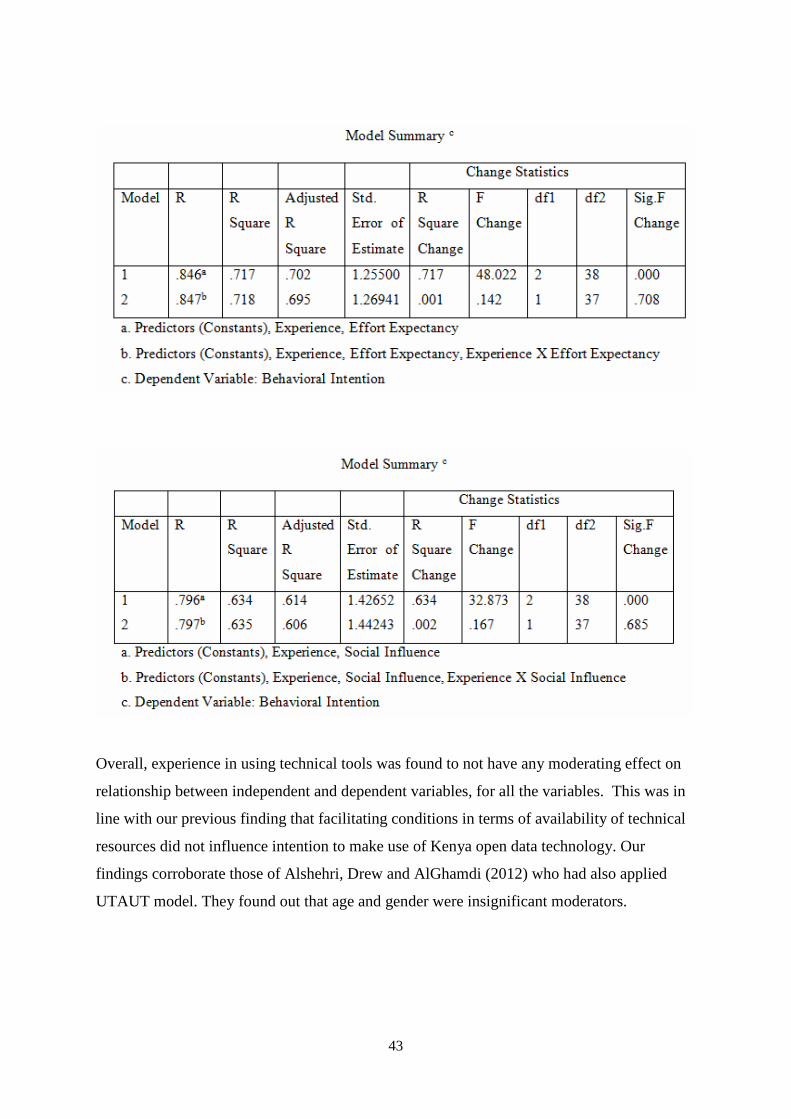
43
Overall, experience in using technical tools was found to not have any moderating effect on
relationship between independent and dependent variables, for all the variables. This was in
line with our previous finding that facilitating conditions in terms of availability of technical
resources did not influence intention to make use of Kenya open data technology. Our
findings corroborate those of Alshehri, Drew and AlGhamdi (2012) who had also applied
UTAUT model. They found out that age and gender were insignificant moderators.
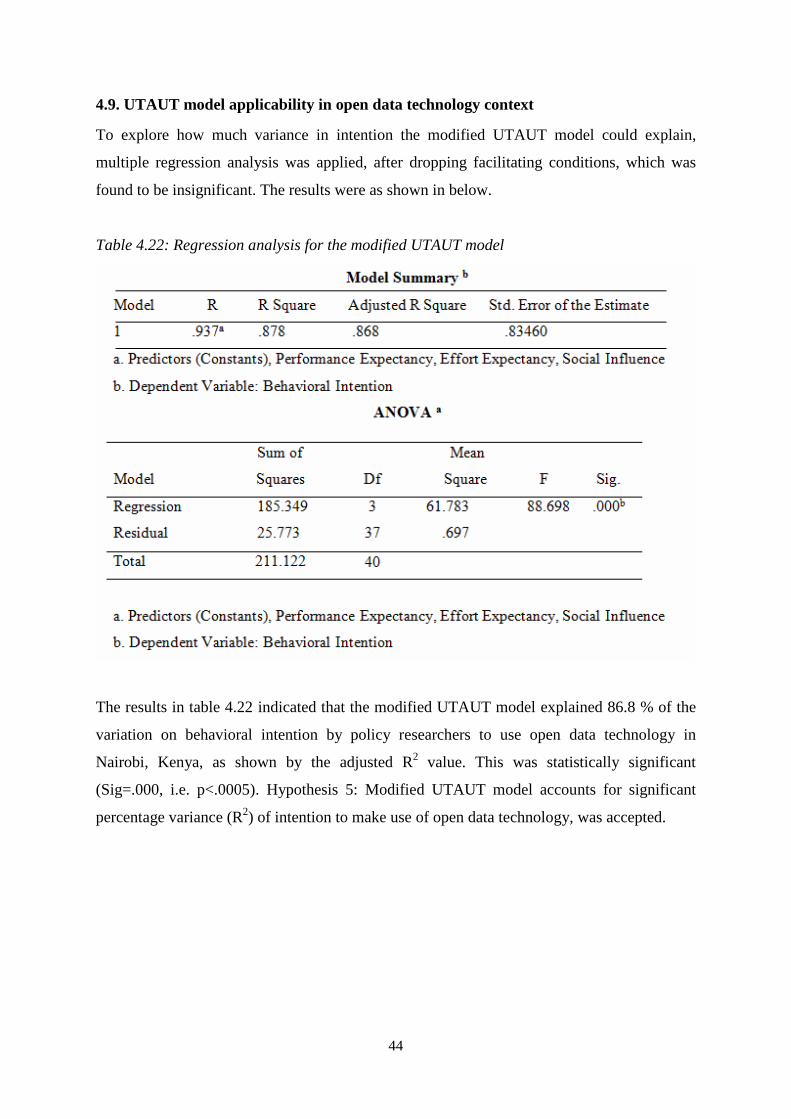
44
4.9. UTAUT model applicability in open data technology context
To explore how much variance in intention the modified UTAUT model could explain,
multiple regression analysis was applied, after dropping facilitating conditions, which was
found to be insignificant. The results were as shown in below.
Table 4.22: Regression analysis for the modified UTAUT model
The results in table 4.22 indicated that the modified UTAUT model explained 86.8 % of the
variation on behavioral intention by policy researchers to use open data technology in
Nairobi, Kenya, as shown by the adjusted R2 value. This was statistically significant
(Sig=.000, i.e. p<.0005). Hypothesis 5: Modified UTAUT model accounts for significant
percentage variance (R2) of intention to make use of open data technology, was accepted.
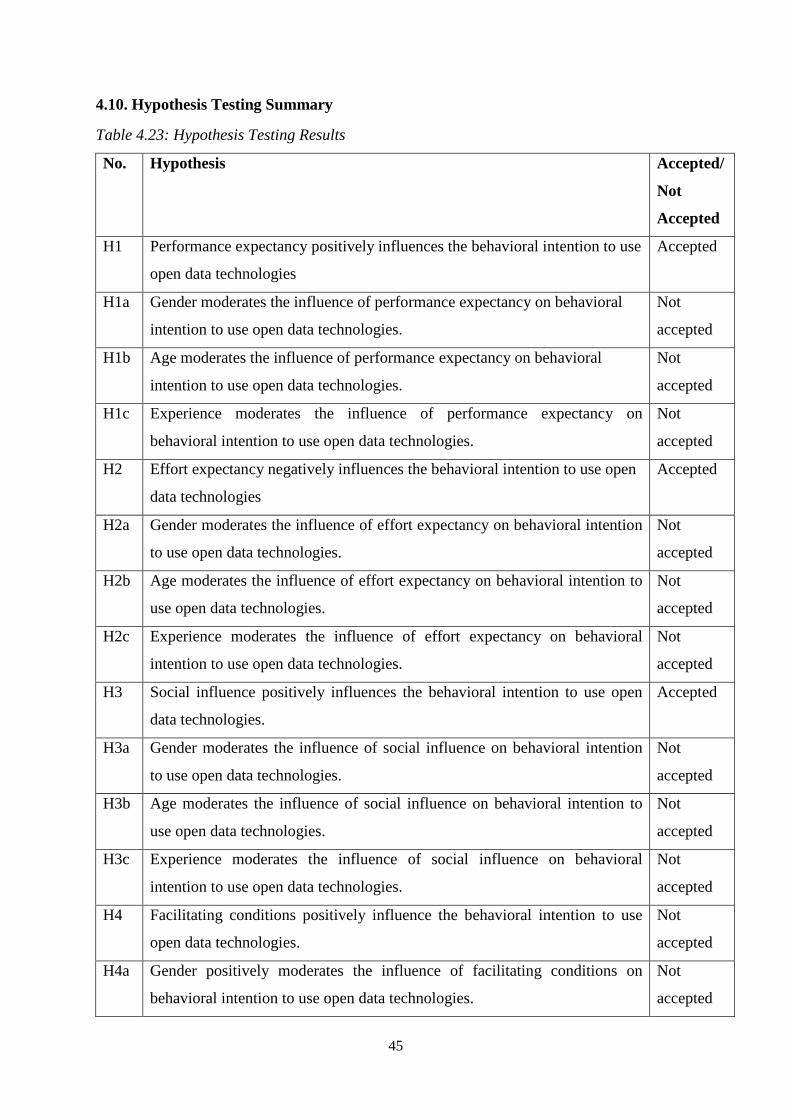
45
4.10. Hypothesis Testing Summary
Table 4.23: Hypothesis Testing Results
No. Hypothesis Accepted/
Not
Accepted
H1 Performance expectancy positively influences the behavioral intention to use
open data technologies
Accepted
H1a Gender moderates the influence of performance expectancy on behavioral
intention to use open data technologies.
Not
accepted
H1b Age moderates the influence of performance expectancy on behavioral
intention to use open data technologies.
Not
accepted
H1c Experience moderates the influence of performance expectancy on
behavioral intention to use open data technologies.
Not
accepted
H2 Effort expectancy negatively influences the behavioral intention to use open
data technologies
Accepted
H2a Gender moderates the influence of effort expectancy on behavioral intention
to use open data technologies.
Not
accepted
H2b Age moderates the influence of effort expectancy on behavioral intention to
use open data technologies.
Not
accepted
H2c Experience moderates the influence of effort expectancy on behavioral
intention to use open data technologies.
Not
accepted
H3 Social influence positively influences the behavioral intention to use open
data technologies.
Accepted
H3a Gender moderates the influence of social influence on behavioral intention
to use open data technologies.
Not
accepted
H3b Age moderates the influence of social influence on behavioral intention to
use open data technologies.
Not
accepted
H3c Experience moderates the influence of social influence on behavioral
intention to use open data technologies.
Not
accepted
H4 Facilitating conditions positively influence the behavioral intention to use
open data technologies.
Not
accepted
H4a Gender positively moderates the influence of facilitating conditions on
behavioral intention to use open data technologies.
Not
accepted
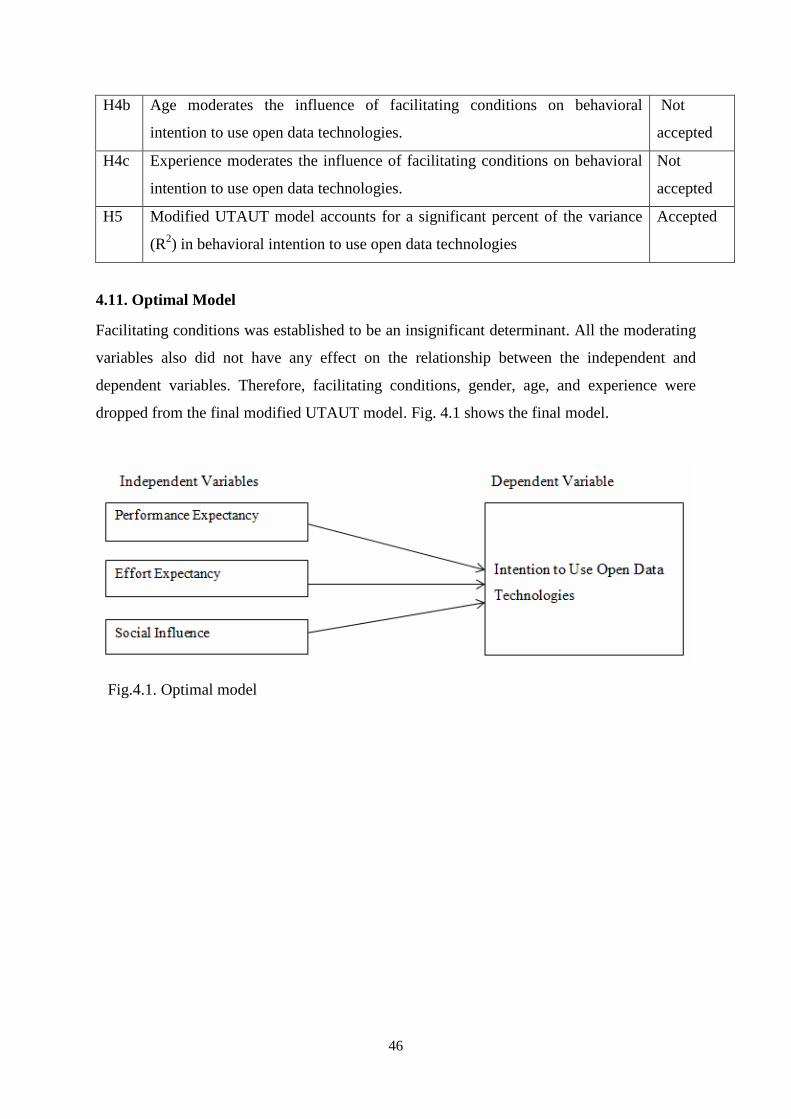
46
H4b Age moderates the influence of facilitating conditions on behavioral
intention to use open data technologies.
Not
accepted
H4c Experience moderates the influence of facilitating conditions on behavioral
intention to use open data technologies.
Not
accepted
H5 Modified UTAUT model accounts for a significant percent of the variance
(R2) in behavioral intention to use open data technologies
Accepted
4.11. Optimal Model
Facilitating conditions was established to be an insignificant determinant. All the moderating
variables also did not have any effect on the relationship between the independent and
dependent variables. Therefore, facilitating conditions, gender, age, and experience were
dropped from the final modified UTAUT model. Fig. 4.1 shows the final model.
Fig.4.1. Optimal model
47
CHAPTER FIVE
CONCLUSIONS AND RECOMMENDATIONS
5.1. Summary Findings
The main objective was to determine factors that influence intention of policy researchers in
Nairobi, Kenya, to use the Kenya government open data platform. The study used variables
from the UTAUT model. The findings indicated that up to 86.6% variance of intention to
make use of open data technology by policy researchers in Nairobi, Kenya, could be
attributed to the combined effects of all the variables in the modified UTAUT. Performance
expectancy was the highest predictor. The second highest predictor was social influence, and
then effort expectancy, while facilitating conditions was found to be insignificant.
5.2. Recommendations for practice
5.2.1. Performance expectancy strategies
Performance expectancy was found to be the best motivator for use. Efforts to encourage use
of open data technology should therefore focus most on their usefulness and the value they
would bring. Governments can increase performance by having initiatives such as training
and awareness programs that can illustrate case studies and success stories of how use of
open data platforms have been used, and other potential ways of using these technologies.
In our research, policy researchers consented that making use of open data technology may
lead to quicker achievement of their research goals, but not necessarily better quality of
research. There were concerns that most data availed by government was just basic statistical
data. As much as this data was useful as demographic data for their studies, they were more
interested in detailed data that could help them answer their research questions, and they
obtained this data by carrying out field research themselves. There is thus need to consider
use scenarios of different kinds of users during development of open data initiatives.
Different users may require different kinds of data, in different formats, and presented in
different ways through open data platforms. For instance, policy researchers may be
interested in detailed data while software developers may be interested in machine-readable
data. Considering then that different users have different needs, there is need to explore ways
in which all these requirements can be integrated in a single technical platform. This may be
achieved by incorporating these requirements into the design stage of these technologies, and
also during their use when the data is being published.
48
5.2.2. Effort expectancy strategies
Open data platforms need to be user-friendly for instance, by having robust search capability
and easy navigation. Other strategies may include providing online guides and helpdesk.
Effort expectancy of open data users might also be influenced by availability or lack thereof
of facilitating conditions. This includes technical devices, internet speeds, and availability of
organizational technical support.
Another way of increasing ease of use is through establishment of effective open data
ecosystems and governance. From the results of our study, most policy researchers indicated
that they accessed this basic statistical data mostly from government agencies’ websites and
specific government departments, followed by obtaining it from government offices in hard
copy. There is need therefore to encourage digitization of government records to ease their
access, and to make them available through open data technology.
Government agencies can collaborate in their open data efforts to create an effective and
efficient eco-system. There is need to build capacity to enable each government agency have
its own open data initiative and platform, and then the national government can have an
overall platform where data from the agencies’ platforms is aggregated to provide overall
insights. This may achieved by having open data policies and standards, and an open data
governance structure that is effective even in the grassroots.
5.2.3. Social strategies
Social influence was the second strongest predictor after performance expectancy. This
finding shows that there is need to focus not only on the technology aspect, but also on social
factors. This can be achieved by building open data user communities. Other social strategies
may include use of success stories and case studies. These may then be shared via social
media such as Twitter, Facebook, and on blogs that are regularly accessed by a certain group
of potential open data users.
5.2.4. Support as a facilitating condition
Facilitating conditions in terms of availability of organisational support and technical
resources was found to be very high. This may be due to high levels of digital literacy among
policy researchers, availability of computing devices, and adequate internet access. However,
respondents cited low availability of support and assistance in case of difficulties when using
49
open data technology. We also noted that the Kenya open data platform had no information
under the user guides tab. Therefore, there is need to train technical staff who can provide
support to open data users. Other strategies may be availability of open data e-learning
platforms, online guides and helpdesk.
5.2.5. Considering developing country context
For our study, the research organizations were located in urban settings. However, there is a
lot of work done in the field, where there is limited internet access. Open data technology that
requires internet access may be not effective or they may be too expensive to use in such
contexts. There is need then to consider developing open-source open data technology that
can be accessed offline. In a context like Kenya’s where most people access internet via
mobile phones, design of open data portals should lay emphasis on mobility. There is
generally need to develop open data platforms that are customized to a developing country
context, taking into consideration issues such as mode of access, capacity of users and
affordability.
5.3. Recommendations for research
5.3.1. Actual use and voluntariness of use
In this study, we did explore how intention to use open data technology influences actual use.
We also did not explore the influence of voluntariness of use as a moderator as there was no
yet any open data law or policies in Kenya. If mandatory use of open data technology in
Kenya emerges, voluntariness of use can be explored in future open data research in Kenya.
Future research can also explore applicability of UTAUT model in the context of actual use.
5.3.2. Facilitating conditions in developing countries
Our study was carried out in Kenya, which is a developing country. Contrary to our
hypothesis, facilitating conditions was established to be highly insignificant. This may be
attributed to the fact that most policy researchers may be tech-savvy. Majority of the
respondents were able to access and use computers, mobile phones and tablets. This may be
attributed to increasing availability of affordable gadgets and cheaper internet access in
Kenya, plus that their organisations freely availed these resources. However, this may not be
the case for all citizens or potential users of open data platforms especially those in rural
50
areas and low-income earners. There is thus need to explore further whether facilitating
conditions may be a significant factor when other kinds of users are considered.
5.3.3. Theories specific to the open data context
It is important to consider the context of a system and conditions specific to it (Orlikowski,
2000). Therefore, there is need of research that addresses the distinctive and diverse
characteristics of open data such as legal and economic aspects, institutional complexity and
heterogeneity of users. Thus, there is need to develop adoption theories specific to the open
data context. Open data is an ecosystem incorporating diverse fields and thus multi-
disciplinary research would be very useful.
5.4. Conclusion
Many governments around the world have made significant progress in ensuring that
government datasets are availed through technologies such as open data platforms. However,
these platforms and the open data in it have little intrinsic value if they are not used. There
needs to be more focus not only on provision, but also on usage of these technologies. By
using the UTAUT model this study assessed factors that influence policy researchers’
intention to use open data technology in Nairobi, Kenya. Benefits gained from using open
data platforms, such as improved performance at work, were found to be the best motivator to
use these technologies. Other highly significant factors were social and peer influence, and
ease of use. Overall, it was established that open data technology are useful, but more effort
is needed to encourage their use.
51
References List
Ahmad et al. 2012. Factors influencing the adoption of e-government services in Pakistan.
European, Mediterranean & Middle Eastern Conference on Information Systems. Munich,
Germany. June 7-8. Available at: <
https://www.researchgate.net/publication/260344620_Factors_influencing_the_adoption_
of_e-government_services_in_Pakistan > [Accessed 5 April 2016].
Ajzen, I., 1991. The theory of planned behavior. Organizational Behavior and Human
Decision Processes, 50(2), pp.179–211.
AlAwadhi, S. and Morris, A. 2008. The use of the UTAUT Model in adoption of e-
government services in Kuwait. Proceedings of the 41st Hawaii International Conference
on System Sciences.
Alshehri, M., Drew, S. and AlGhamdi, R. 2012. Analysis of citizens’ acceptance for e-
government services: Applying the UTAUT model. IADIS International Conferences
Theory and Practice in Modern Computing and Internet Applications and Research,
Lisbon.
Altares, P., Copo, A., Gabuyo, Y., Laddaran, A., Mejia, L., Polocarpio, I., Sy, E., Tizon, H.
and Yao, A. 2003. Elementary Statistics: a Modern Approach'2003 Ed. Manila: Rex
Bookstore Inc.
Alomari, M. K., Woods, P. and Sandhu, K. 2009. E-government adoption in the Hashemite
Kingdom of Jordan: factors from social perspectives. Internet Technology and Secured
Transactions, 2009.ICITST, London, 9-12 Nov 2009. New Jersey, USA: IEEE.
Al-Shafi, S., Vishanth, W. and Marijn, J. 2009.Investigating the Adoption of e-Government
Services in Qatar Using the UTAUT Model. AMCIS 2009 Proceedings, [online] Available
at: <http://aisel.aisnet.org/amcis2009/260> [Accessed 10 March 2016]
Bateman, S. 2015. Data science in government - the benefits and challenges of implementing
new analytical techniques and technologies in government, Data for policy 2015, p.38.
Brown, G., 2013. “Why Kenya’s open data portal is failing – and why it can still succeed”
[online] Available at: <https://sunlightfoundation.com/blog/2013/09/23/why-kenyas-open-
data-portal-is-failing-and-why-it-can-still-succeed/> [Accessed 28 January 2016]
52
Bertot, J. C., Jaeger, P. T., and Grimes, J. M. 2010.Using ICTs to create a culture of
transparency: e-government and social media as openness and anti-corruption tools for
societies. Government Information Quarterly, 27(3), pp.264–271.
Bertot, J. C., McDermott, P., and Smith, T. 2012. Measurement of open government: metrics
and process. Paper presented at the 45th Hawaii International Conference on System
Sciences. Hawaii: U.S.A.
Carlsson et al. 2006.Adoption of Mobile Devices/Services - Searching for Answers with the
UTAUT. Proceedings of the 39th Hawaii International Conference on System Sciences,
USA, 4-7 Jan 2006.USA: IEEE.
Carter, L. and Belanger, F. 2003. Diffusion of innovation & citizen adoption of e-
government. The Fifth International Conference on Electronic Commerce (ICECR-5),
Montreal, Canada, 23-27 October 2002. Pittsburg, PA.
Carter, L. and Belanger F. 2005. The utilization of e-government services: citizen trust,
innovation and acceptance factors. Information Systems Journal, 15(1), pp.5-25.
Choudrie, J. and Dwivedi, K. 2005. A Survey of Citizens’ Awareness and Adoption of E -
Government Initiatives, the ‘Government Gateway’: A United Kingdom Perspective.
Proceedings of the E-Gov. 2005 Workshop, Brunel University, London: UK.
Colesca, S.E. and Dobrica, L. 2008. Adoption and use of e-government services: the case of
Romania. Journal of Applied Research and Technology, pp.204-217.
Conradie, P. and Choenni, S. 2012. Exploring process barriers to release public sector
information in local government.6th international conference on theory and practice of
electronic governance. New York: USA.
Cronbach, L. J. 1975. Research for tomorrow’s schools: Disciplined inquiry for education.
New York: Macmillan.
Davies, T. 2012. How might open data contribute to good governance? Commonwealth
Governance Handbook, 2012/2013, pp.148-150.
Davis, F. D. 1989. Perceived usefulness, perceived ease of use, and user acceptance of
information technology. MIS Quarterly, 13(3), pp.319–340.
53
Dimitrova, D.V. and Chen Y.C. 2006.Profiling the adopters of e-government information and
services: the influence of psychological characteristics, civic mindedness, and information
channels. Social Science Computer Review, 24(2), pp.172-188.
Duyck, et al. 2008.User acceptance of a picture archiving and communication system.
Applying the unified theory of acceptance and use of technology in a radiological setting.
Methods of Information in Medicine.47(2), pp.149–156.
Etzioni, A. 1971.Policy Research. The American Sociologist, vol 6, pp.8-12. [online]
Available at :<http://www.jstor.org/stable/27701831> [Accessed 2 March 2016]
Field, A. 2005.Discovering statistics using SPSS. London: SAGE Publications.
Fishbein, M. and Ajzen, I.1975. Belief, attitude, intention and behavior: An introduction to
theory and research. Massachusetts: Addison-Wesley.
Frambach, R.T. and Schillewaert, N. 2002. Organizational innovation adoption a multi-level
framework of determinants and opportunities for future research. Journal of Business
Research, 55(2), pp.163-176.
Foulonneau, M., Martin, S., and Turki, S. 2014. How open data are turned into services?
Exploring services science, pp.31–39, Geneva: Springer International Publishing.
Gasco, M. 2014. Special issue on open government: an introduction. Social Science
Computer Review, [online] Available at: <http://dx.doi.org/10.1177/0894439314560676>
[Accessed 10 March 2016]
Gardenier, J. S. and Resnik, D. B. 2002. The misuse of statistics: concepts, tools, and a
research agenda. Account Res.2002; 9: pp.65–74.
Gov.uk. 2016. Open Policy Making toolkit, [online] Available at: <Error! Hyperlink reference
not valid. [Accessed 2 April 2016].
GovDelivery.2015. 5 ways to build engaged communities around open data. Available at:
<http://www.govdelivery.com/blog/2015/01/5-ways-to-build-engagedcommunities-
around-open-data/> [Accessed 6 March 2016]
Gwebu, K. L. and Wang, J. 2011. Adoption of open source software: the role of social
identification. Decision Support Systems, 51(1), pp.220–229.
Hammer, C. 2013. Open data has little value if people can't use it. Harvard
Business Review, [online] Available at: <https://hbr.org/2013/03/open-data-has-little-
value-if> [Accessed 13 February 2016]
54
Hunnius, S., Krieger, B. and Schuppan, T. 2014. Providing, guarding, shielding: Open
Government Data in Spain and Germany. European Group for Public Administration
Annual Conference, Speyer, Germany.
ICT Authority, 2016 [online] Available at :<http://www.icta.go.ke/kenya-open-data-
initiative-kodi>/ [Accessed 10 May 2016]
Il.,et al. 2010. An international comparison of technology adoption: Testing the UTAUT
model. Journal of Information and Management, 48 (11), pp.1-8.
Janssen, K. 2011. The influence of the PSI directive on open government data: An overview
of recent developments. Government Information Quarterly, 28, pp.446–456.
Janssen, M., Charalabidis, Y. and Zuiderwijk, A. 2012. Benefits, adoption barriers and myths
of open data and open government. Information Systems Management, 29(4), pp.258-268.
Johnson, M. P., Zheng, K. and Padman, R. 2014. Modeling the longitudinality of user
acceptance of technology with an evidence-adaptive clinical decision support system.
Decision Support Systems, 57(1), pp.444–453.
Kapchanga, M. 2013. Kenyans not using the state data portal. The Standard
Newspaper,[online], Available at:
<http://www.standardmedia.co.ke/?articleID=2000093448&story_title=surveykenyans-
not-using-state-data-portal&pageNo=1> [Accessed 15 March 2016].
Kaasenbrood, M. 2013. Contributing to the improvement of governmental policies by
examining the current use of open government data by private organisations in The
Netherlands. Master thesis The Netherlands. Delft: Delft University of Technology.
KNBS, 2015. Economic Survey Highlights, [online] Available at:
<http://www.knbs.or.ke/index.php?option=com_phocadownload&view=category&id=16
&Itemid=508> [Accessed 14 April 2016].
KODI, 2014. Open Data Survey 2014 AutoGenerate,[online], Available at
<http://fs12.formsite.com/ICTAuthorityKE/OpenData2014/index.html> [Accessed 18
May 2016]
Kothari, C. R. 2008. Research methodology: Methods and Techniques. New Delhi: New Age
International Publishers.
Kripanont, N. 2006. Using Technology Acceptance Model to Investigate Academic
Acceptance of Internet. Journal of Business Systems, Governance and Ethics,1(2),pp13-
28.
55
Lindman, J., Rossi, M. and Tuunainen, V. 2013. Open Data Services: Research Agenda.2013
46th Hawaii International Conference on System Sciences. pp. 1239-1246.
Magalhaes, G., Roseira, C. and Manley, L. 2014. Business models for open government data.
International Conference on Theory and Practice of Electronic Governance, Portugal.
Majeed, R. 2012. Disseminating the power of information: Kenya Open Data Initiative,
2011-2012. Innovations for Successful Societies, [online]Available at:
<http://successfulsocieties.princeton.edu/publications/disseminating-powerinformation-
kenya-open-data-initiative-2011-2012> [Accessed 1 May 2016].
Manyika, et al. 2013. Lions go digital: The Internet’s transformative potential in Africa.
McKinsey & Company.
Martin, C. 2014. Barriers to the open government data agenda: taking a multi-level
perspective.Polymer International, 6(3), pp.217–240.
Martijn, P., Schroederb, R., Trepermana, J., Rubinsteinb, M., Meyerb, E., Mahieua, B.,
Scholtena, C., and Svetachovaa, M., 2015. Data for Policy: Report about the State-of-the-
Art, Oxford Internet Institute, [online] Available at<http://www.data4policy.eu/#!state-of-
the-art-report/cjg9> [Accessed 10 March 2016].
McDermott, P. 2010. Building open government. Government Information Quarterly,
27(4), pp.401–413.
McGann, J. G. 2016. 2015 Global Go To Think Tank Index Report, [online] Available at:
<http://repository.upenn.edu/cgi/viewcontent.cgi?article=1009&context=think_tanks>
[Accessed 5 May 2016]
Muigai, A. 2014.A look back at Kenya's open data journey. International Conference for E-
Democracy and Open Government 2014(CeDEM14), Krems, Austria.
Mugenda, A. G., 2008. Social Science Research: Theory and Principles. Kenya: ACTS.
Mugenda, O. M. and Mugenda, A. G., 2003.Research Methods: Quantitative and Qualitative
Approaches. Nairobi: ACTS Press.
Mutuku, L., and Colaco, J. 2012.Increasing Kenyan open data consumption: a design
thinking approach. Proceedings of the 6th International Conference on Theory and
Practice of Electronic Governance(ICEGOV2012), New york:USA,pp.18-21
Mutuku, L., Colaco, J., and Omenya, R. 2013. An Evaluation Report on the Open Data Pre-
Incubator, iHub Research, Nairobi.
Mutuku, L. and Mahihu, C. 2014. Understanding the impacts of Kenya open data
applications and services. Open Data Research Network, [online] Available at:
<http://www.opendataresearch.org/project/2013/ihub> [Accessed 10 January 2016].
56
Ntale et al. 2014. Understanding how open data could impact resource allocation for poverty
eradication in Kenya and Uganda .Open Data Research Network, [online] Available at:
<http://www.opendataresearch.org/content/2014/683/understanding-how-open-data-could-
impact-resource-allocation-poverty-eradication> [Accessed 8 February 2016].
Open Government Data, 2016. What is Open Government Data? [online] Available at:
<http://opengovernmentdata.org/> [Accessed 5 January 2016].
Open Government Partnership, 2011. Open Government Declaration, [online] Available at:
<http://www.opengovpartnership.org/about/open-government-declaration> [Accessed 5
January 2016].
Open Knowledge Foundation, 2007. The Open Definition, [online] Available at:
<http://opendefinition.org/> [Accessed 3 January 2016].
Orlikowski,W. J. 2000. Using technology and constituting structures: a practice lens for
studying technology in organizations. Organization Science, 11(4), pp.404–428.
Palka,W., Jurisch, M., Leicht, M., Wolf, P., and Krcmar, H. 2013.Classification Schemes for
Open Government Data Provision, 13th European Conference on e-Government (ECEG),
Como, Italy.
Parsons, M. A., Godoy, O., Le Drew, E., de Bruin, T. F., Danis, B., Tomlinson, S., and
Carlson, D. 2011.A conceptual framework for managing very diverse data for complex,
interdisciplinary science. Journal of Information Science, 37(6), pp.555–569.
Pattuelli, M. C. 2012. Personal name vocabularies as linked open data: a case study of
jazz artist names. Journal of Information Science, 38(6), pp.558–565.
PennState University, P. (n.d.). Dummy Coding Using Software [online] PennStateEberly
College of Science [online] Available at:
<https://onlinecourses.science.psu.edu/stat200/node/86> [Accessed 5 Sep. 2016].
Rana, et al.2011. Theories and theoretical models for examining the adoption of e-
government services, e-Service Journal, 8(2), pp.26–55.
Robinson, et al.2009. Government data and the invisible hand. Yale Journal of Law and
Technology, 11(1), [online] Available at:
<http://digitalcommsons.law.yale.edu/yjolt/vol11/iss1/4> [Accessed 9 March 2016]
Robinson, D.G. and Yu, H. 2012. The new ambiguity of Open Government. UCLA Law
Review Discourse, 59(11),pp.178-230 [online] Available
at:<http://www.uclalawreview.org/pdf/discourse/59-11.pdf> [Accessed 10 April 2016].
Rogers, E. M. 1995. Diffusion of innovations (4th ed.). New York: Free Press.
57
Sarker, et al.2011. The role of communication and trust in global virtual teams: A social
network perspective. Journal of Management Information Systems, 28, pp.273-310. DOI:
10.2753/MIS0742-1222280109.
Saunders, M., Lewis, P. and Thornhill, A. 2009.Research methods for business students. New
York: Prentice Hall.
Sun, H., and Zhang, P. 2006. The role of moderating factors in user technology acceptance,
International Journal of Human Computer Studies, 64(2), pp.53–78
Sykes, T.A., V. Venkatesh and Gosain, S. 2009. Model of acceptance with peer support: A
social network perspective to understand employees’ system use. MIS Q, 33 pp.371-393
Tabachnick, G. and Fidell, L. 2001.Using multivariate statistics (4th ed). New York: Harper
Collins.
Tauberer, J. 2014. Open government data: The book (2nd ed) [online] Available at:
<https://opengovdata.io/> [Accessed 23 February 2016].
Talukder, M., Harris, H and Mapunda, G. 2008. Adoption of innovations by individuals
within organizations: An Australian study. Asia Pacific Management. Rev,13 pp.463-480.
Talukder, M. and Quazi, A. 2010. Exploring the factors affecting employees’ adoption and
use of innovation. Australian Journal of Information systems, pp.1-29.
Veenstra, F., and Broek, T. 2013. Opening moves. Drivers, enablers and barriers of open data
in a semi-public organization.12th Electronic Government Conference, Koblenz, Germany.
VanDijk, M., Peters, O., and Ebbers, W. 2008.Explaining the acceptance and use of
government internet services: a multivariate analysis of 2006 survey data in The
Netherlands. Government Information Quarterly, 25(3) pp.379–399.
Venkatesh,V., Morris, M., Gordon, B and Davis, F. 2003. User Acceptance of Information
Technology: Toward a Unified View, MIS Quarterly, 27(3), pp.425-478 [online]
Available at: <http://misq.org/user-acceptance-of-information-technology-toward-a-
unified-view.html?SID=2lu3qv2nkbq134c41n8fte6tq5> [Accessed 18 February 2016].
Wangpipatwong, S., Chutimaskul, W. and Papasratorn, B.2005. A Pilot Study of Factors
Affecting the Adoption of Thai e-Government Websites, Proceedings of the International
Workshop on Applied Information Technology, Bangkok, Thailand,pp.15-21.
Wonderlich, J. 2010. Sunlight Foundation: Ten principles for opening up government
information, [online] Available at: <http://sunlightfoundation.com/policy/documents/ten-
open-data-principles/> [Accessed 26 January 2016].
58
World Bank, 2013.Technology options, [online] Available at:
<http://opendatatoolkit.worldbank.org/en/technology.html#platforms> [Accessed 9 March
2016]
Zacharzewski, A., Agarwal, P., and Watson-Brown, A. 2015. Democracy and data: how
data-driven policy making can avoid technocracy, Data for policy 2015, p.75.
Zuiderwijk, A., Janssen, M., Choenni, S., Meijer, R. and Alibaks, R. 2012.Socio-technical
impediments of open data, Electronic Journal of e-Government, 10(2), pp.156–172.
Zuiderwijk, A., Helbig, Natalie, Gil-García, Ramón, J. and Janssen, M. 2014. Special Issue
on Innovation through Open Data: Guest Editors' Introduction. Journal of theoretical and
applied electronic commerce research, 9(2)
Zuiderwijk, A., Janssen, M., and Dwivedi, K. 2015. Acceptance and use predictors of open
data technology: Drawing upon the unified theory of acceptance and use of technology.
Government Information Quarterly, 32(4), pp. 429–440.

59
APPENDICES
APPENDIX I: Introduction Letter
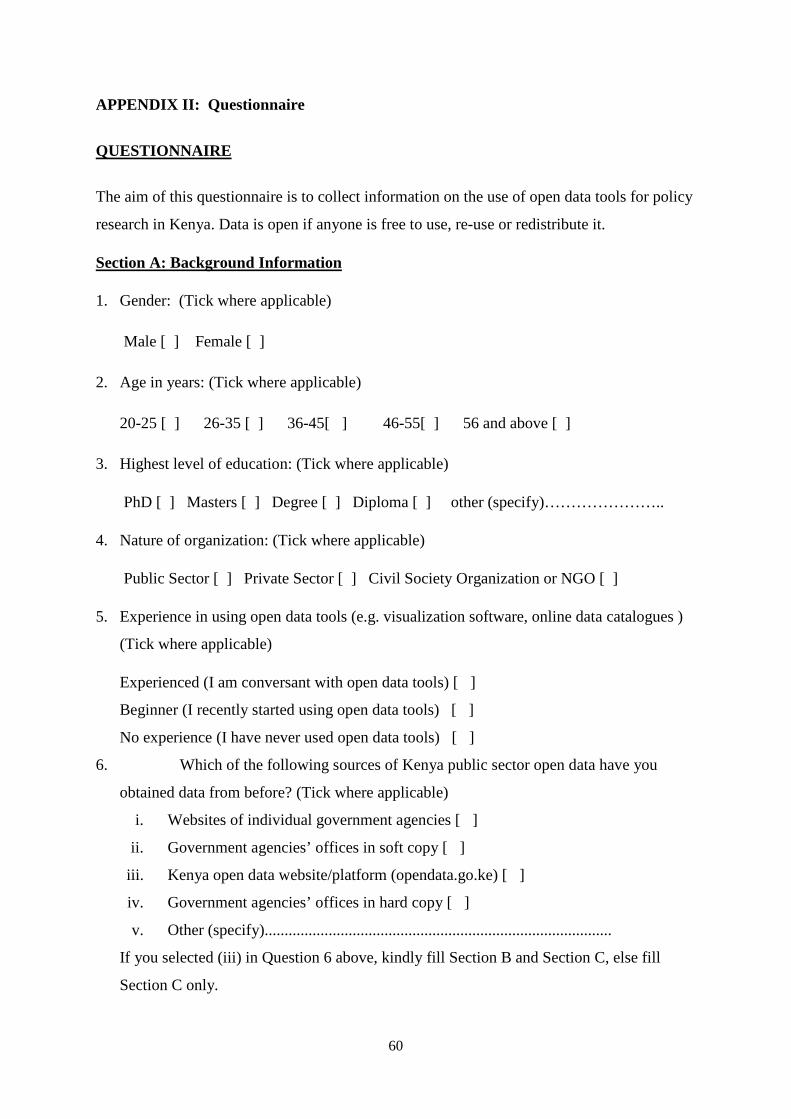
60
APPENDIX II: Questionnaire
QUESTIONNAIRE
The aim of this questionnaire is to collect information on the use of open data tools for policy
research in Kenya. Data is open if anyone is free to use, re-use or redistribute it.
Section A: Background Information
1. Gender: (Tick where applicable)
Male [ ] Female [ ]
2. Age in years: (Tick where applicable)
20-25 [ ] 26-35 [ ] 36-45[ ] 46-55[ ] 56 and above [ ]
3. Highest level of education: (Tick where applicable)
PhD [ ] Masters [ ] Degree [ ] Diploma [ ] other (specify)…………………..
4. Nature of organization: (Tick where applicable)
Public Sector [ ] Private Sector [ ] Civil Society Organization or NGO [ ]
5. Experience in using open data tools (e.g. visualization software, online data catalogues )
(Tick where applicable)
Experienced (I am conversant with open data tools) [ ]
Beginner (I recently started using open data tools) [ ]
No experience (I have never used open data tools) [ ]
6. Which of the following sources of Kenya public sector open data have you
obtained data from before? (Tick where applicable)
i. Websites of individual government agencies [ ]
ii. Government agencies’ offices in soft copy [ ]
iii. Kenya open data website/platform (opendata.go.ke) [ ]
iv. Government agencies’ offices in hard copy [ ]
v. Other (specify).......................................................................................
If you selected (iii) in Question 6 above, kindly fill Section B and Section C, else fill
Section C only.
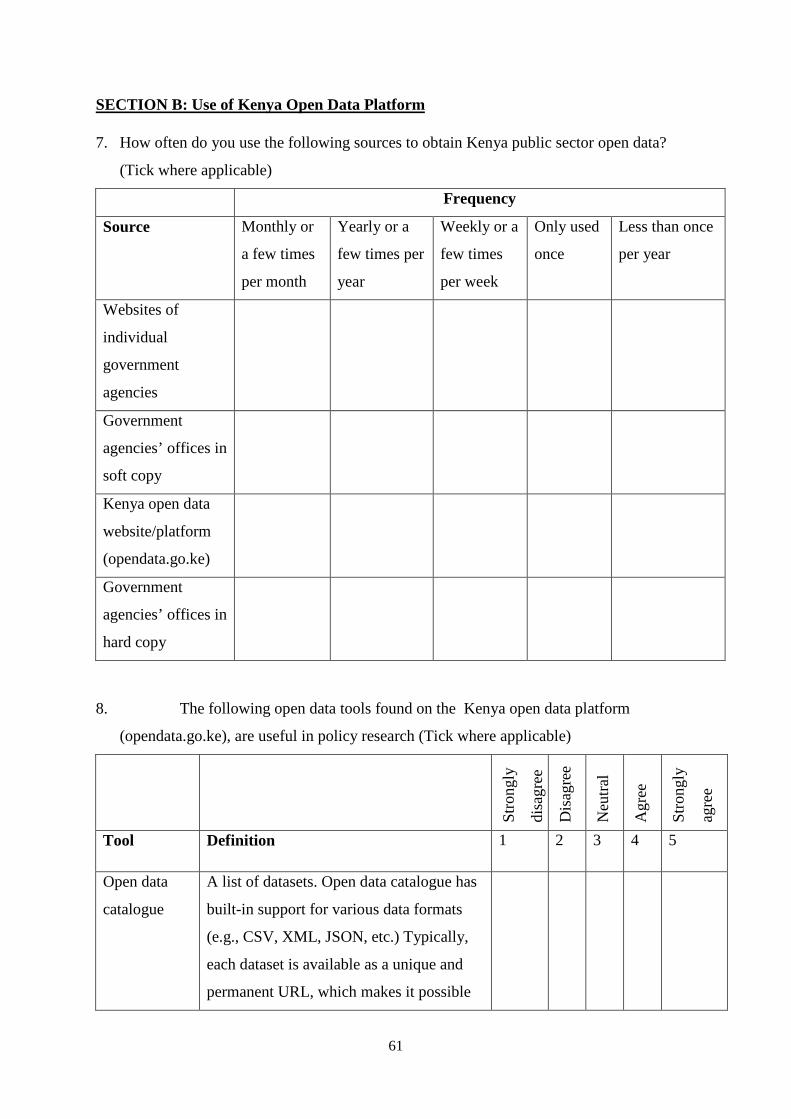
61
SECTION B: Use of Kenya Open Data Platform
7. How often do you use the following sources to obtain Kenya public sector open data?
(Tick where applicable)
Frequency
Source Monthly or
a few times
per month
Yearly or a
few times per
year
Weekly or a
few times
per week
Only used
once
Less than once
per year
Websites of
individual
government
agencies
Government
agencies’ offices in
soft copy
Kenya open data
website/platform
(opendata.go.ke)
Government
agencies’ offices in
hard copy
8. The following open data tools found on the Kenya open data platform
(opendata.go.ke), are useful in policy research (Tick where applicable)
Str
ongl
y
disa
gree
Dis
agre
e
Neu
tral
Agr
ee
Str
ongl
y
agre
e
Tool Definition 1 2 3 4 5
Open data
catalogue
A list of datasets. Open data catalogue has
built-in support for various data formats
(e.g., CSV, XML, JSON, etc.) Typically,
each dataset is available as a unique and
permanent URL, which makes it possible
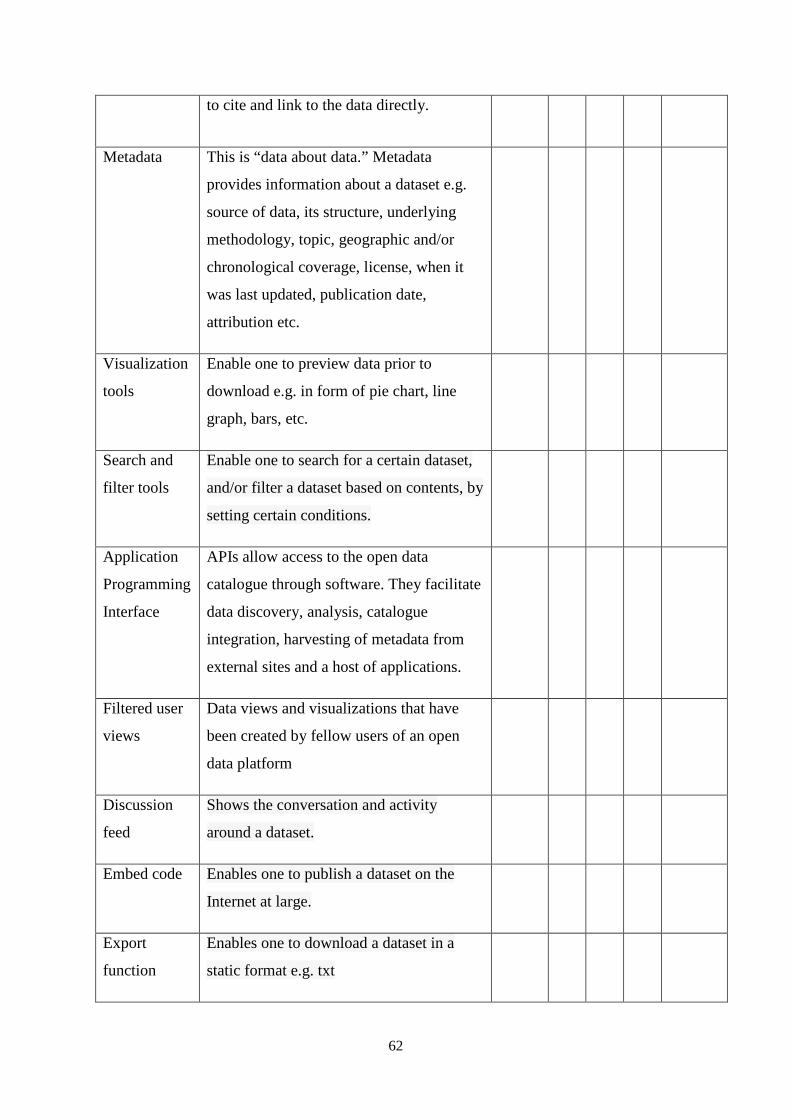
62
to cite and link to the data directly.
Metadata This is “data about data.” Metadata
provides information about a dataset e.g.
source of data, its structure, underlying
methodology, topic, geographic and/or
chronological coverage, license, when it
was last updated, publication date,
attribution etc.
Visualization
tools
Enable one to preview data prior to
download e.g. in form of pie chart, line
graph, bars, etc.
Search and
filter tools
Enable one to search for a certain dataset,
and/or filter a dataset based on contents, by
setting certain conditions.
Application
Programming
Interface
APIs allow access to the open data
catalogue through software. They facilitate
data discovery, analysis, catalogue
integration, harvesting of metadata from
external sites and a host of applications.
Filtered user
views
Data views and visualizations that have
been created by fellow users of an open
data platform
Discussion
feed
Shows the conversation and activity
around a dataset.
Embed code Enables one to publish a dataset on the
Internet at large.
Export
function
Enables one to download a dataset in a
static format e.g. txt
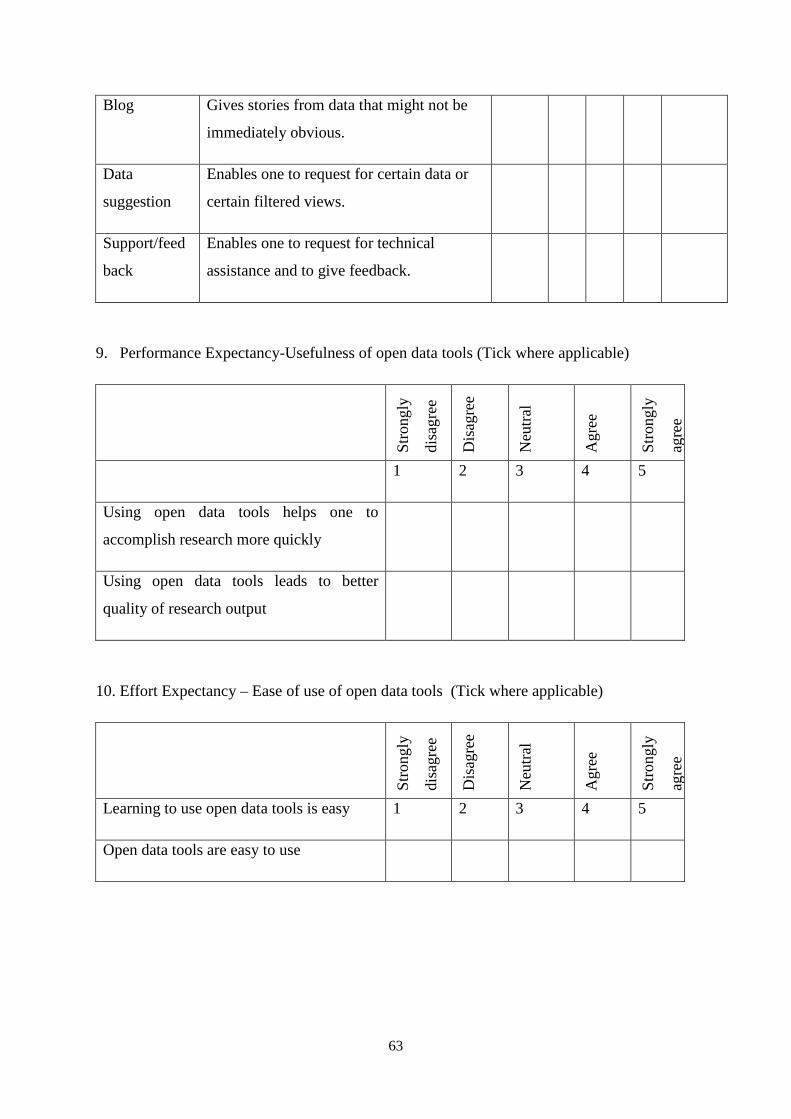
63
Blog Gives stories from data that might not be
immediately obvious.
Data
suggestion
Enables one to request for certain data or
certain filtered views.
Support/feed
back
Enables one to request for technical
assistance and to give feedback.
9. Performance Expectancy-Usefulness of open data tools (Tick where applicable)
S
tron
gly
disa
gree
Dis
agre
e
Neu
tral
Agr
ee
Str
ongl
y
agre
e
1 2 3 4 5
Using open data tools helps one to
accomplish research more quickly
Using open data tools leads to better
quality of research output
10. Effort Expectancy – Ease of use of open data tools (Tick where applicable)
Str
ongl
y
disa
gree
Dis
agre
e
Neu
tral
Agr
ee
Str
ongl
y
agre
e
Learning to use open data tools is easy 1 2 3 4 5
Open data tools are easy to use
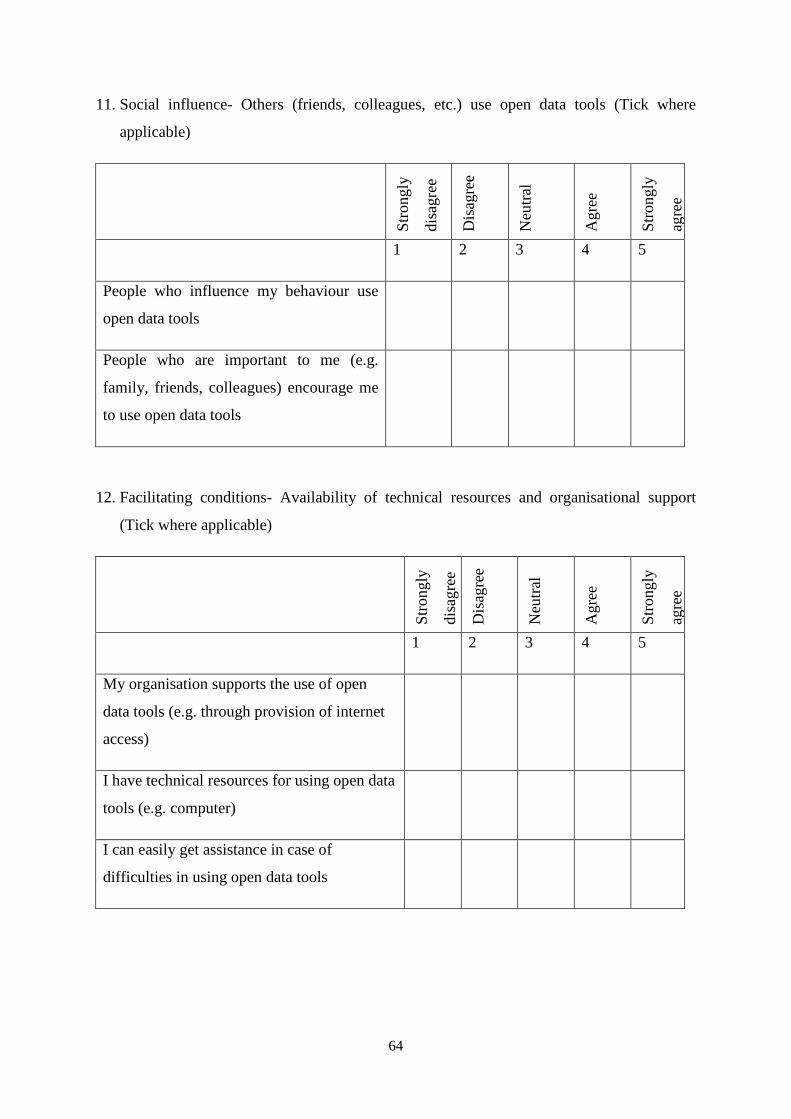
64
11. Social influence- Others (friends, colleagues, etc.) use open data tools (Tick where
applicable)
Str
ongl
y
disa
gree
Dis
agre
e
Neu
tral
Agr
ee
Str
ongl
y
agre
e
1 2 3 4 5
People who influence my behaviour use
open data tools
People who are important to me (e.g.
family, friends, colleagues) encourage me
to use open data tools
12. Facilitating conditions- Availability of technical resources and organisational support
(Tick where applicable)
Str
ongl
y
disa
gree
Dis
agre
e
Neu
tral
Agr
ee
Str
ongl
y
agre
e
1 2 3 4 5
My organisation supports the use of open
data tools (e.g. through provision of internet
access)
I have technical resources for using open data
tools (e.g. computer)
I can easily get assistance in case of
difficulties in using open data tools
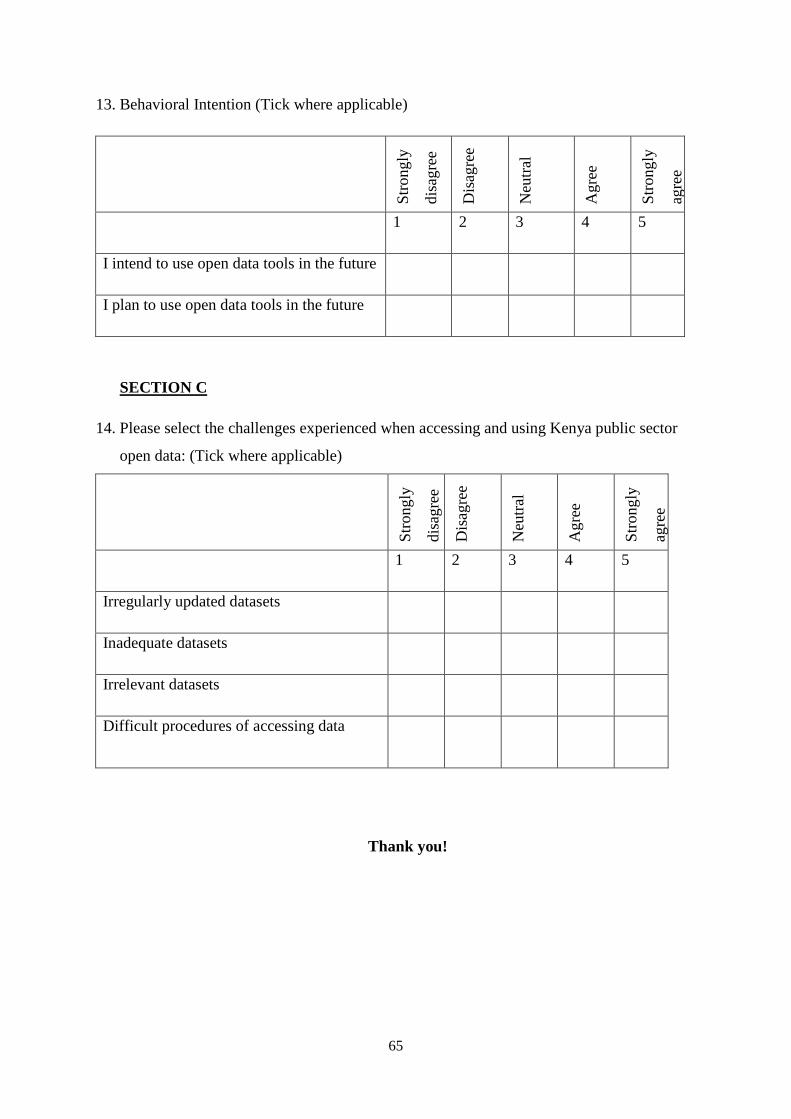
65
13. Behavioral Intention (Tick where applicable)
Str
ongl
y
disa
gree
Dis
agre
e
Neu
tral
Agr
ee
Str
ongl
y
agre
e
1 2 3 4 5
I intend to use open data tools in the future
I plan to use open data tools in the future
SECTION C
14. Please select the challenges experienced when accessing and using Kenya public sector
open data: (Tick where applicable)
Str
ongl
y
disa
gree
Dis
agre
e
Neu
tral
Agr
ee
Str
ongl
y
agre
e
1 2 3 4 5
Irregularly updated datasets
Inadequate datasets
Irrelevant datasets
Difficult procedures of accessing data
Thank you!