a study of millennial female youth in nairobi
TRANSCRIPT
AUDIENCE RESPONSE TO STYLE IN PRINT MEDIA ADVERTISING: A
STUDY OF MILLENNIAL FEMALE YOUTH IN NAIROBI COUNTY,
KENYA
BY
OKWIRI, FRANCISCA OBIERO
A THESIS SUBMITTED IN PARTIAL FULFILMENT OF THE
REQUIREMENTS FOR THE AWARD OF THE DEGREE OF DOCTOR OF
PHILOSOPHY IN COMMUNICATIONS
IN THE DEPARTMENT OF PUBLISHING, JOURNALISM AND
COMMUNICATION STUDIES,
SCHOOL OF INFORMATION SCIENCES,
MOI UNIVERSITY
SEPTEMBER, 2020

ii
DECLARATION
This thesis is my original work and has not been presented for a degree in any other
university. No part of this thesis may be reproduced without the prior written
permission of the author and/or Moi University.
_____________________________ _____________________
OKWIRI, FRANCISCA Date
SHRD/D.PHIL/02/09
DECLARATION BY SUPERVISORS:
This thesis has been submitted for examination with our approval as University
Supervisors.
_____________________________ _____________________
PROF. PAUL KIPROP CHEPKUTO Date
Department of Publishing, Journalism and Communication Studies,
Moi University, Eldoret, Kenya
_____________________________ _____________________
DR. LUMALA MASIBO Date
Department of Publishing, Journalism and Communication Studies,
Moi University, Eldoret, Kenya
iii
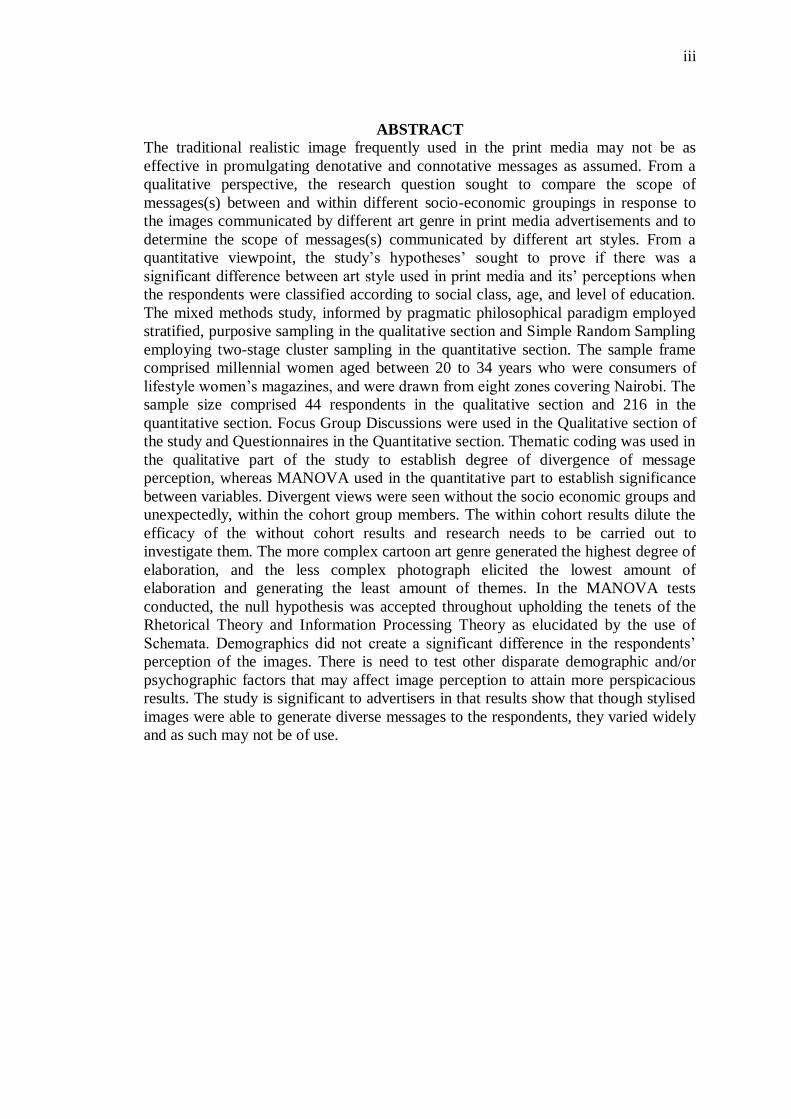
ABSTRACT The traditional realistic image frequently used in the print media may not be as
effective in promulgating denotative and connotative messages as assumed. From a
qualitative perspective, the research question sought to compare the scope of
messages(s) between and within different socio-economic groupings in response to
the images communicated by different art genre in print media advertisements and to
determine the scope of messages(s) communicated by different art styles. From a
quantitative viewpoint, the study’s hypotheses’ sought to prove if there was a
significant difference between art style used in print media and its’ perceptions when
the respondents were classified according to social class, age, and level of education.
The mixed methods study, informed by pragmatic philosophical paradigm employed
stratified, purposive sampling in the qualitative section and Simple Random Sampling
employing two-stage cluster sampling in the quantitative section. The sample frame
comprised millennial women aged between 20 to 34 years who were consumers of
lifestyle women’s magazines, and were drawn from eight zones covering Nairobi. The
sample size comprised 44 respondents in the qualitative section and 216 in the
quantitative section. Focus Group Discussions were used in the Qualitative section of
the study and Questionnaires in the Quantitative section. Thematic coding was used in
the qualitative part of the study to establish degree of divergence of message
perception, whereas MANOVA used in the quantitative part to establish significance
between variables. Divergent views were seen without the socio economic groups and
unexpectedly, within the cohort group members. The within cohort results dilute the
efficacy of the without cohort results and research needs to be carried out to
investigate them. The more complex cartoon art genre generated the highest degree of
elaboration, and the less complex photograph elicited the lowest amount of
elaboration and generating the least amount of themes. In the MANOVA tests
conducted, the null hypothesis was accepted throughout upholding the tenets of the
Rhetorical Theory and Information Processing Theory as elucidated by the use of
Schemata. Demographics did not create a significant difference in the respondents’
perception of the images. There is need to test other disparate demographic and/or
psychographic factors that may affect image perception to attain more perspicacious
results. The study is significant to advertisers in that results show that though stylised
images were able to generate diverse messages to the respondents, they varied widely
and as such may not be of use.
iv
TABLE OF CONTENTS
CHAPTER ONE - INTRODUCTION............................................................................................. 1
1.0 Introduction ............................................................................................................................ 1
1.1 Background............................................................................................................................. 1
1.2 Statement of Problem ............................................................................................................. 7
1.3 Research Questions and Hypotheses ...................................................................................... 9
1.4 Justification of Study ............................................................................................................ 10
1.5 Significance of the Study ...................................................................................................... 15
1.6 Scope and Limitations of the Study ...................................................................................... 18
1.7 Definition of Terms ............................................................................................................... 21
1.8 Assumptions .......................................................................................................................... 27
1.9 Chapter Summary ................................................................................................................ 27
2 CHAPTER TWO – REVIEW OF RELATED LITERATURE ........................................... 29
2.0 Introduction .......................................................................................................................... 29
2.1 Visual rhetoric ...................................................................................................................... 29
2.2 Situating advertising communication within mass communication..................................... 30
2.3 Situating Visual Rhetoric within Communication Studies .................................................. 30
2.4 Situating Visual Rhetoric within Advertising Communication ........................................... 31
2.5 Rhetoric as a Perspective ...................................................................................................... 32 2.5.1 Elements of design as a form of rhetoric......................................................................... 33
2.6 Related Literature ................................................................................................................ 34
2.7 Research Gap ........................................................................................................................ 44
2.8 Conceptual Framework ........................................................................................................ 47
2.9 TheoreticalFramework…………………………………………………………………………48 2.9.1 Information-Processing Theories ................................................................................... 48 2.9.2 Rhetorical Theory .......................................................................................................... 51 2.9.3 The Copy Theory........................................................................................................... 54
2.10 Theory for Consumer Response to Advertising Images ....................................................... 55 2.10.1 Information Processing and Schema Theory ................................................................... 57 2.10.2 Other Theories employed in studying consumer response to images ............................... 59 2.10.3 Theory of Visual Rhetoric .............................................................................................. 60
v
2.10.4 Art Infusion Effect ......................................................................................................... 61
2.11 Defining the Key Variables ................................................................................................... 61 2.11.1 Art style and expression ................................................................................................. 62 2.11.2 Demographics ............................................................................................................... 65
2.12 Operationalisation of Stylistic Properties in a Visual Image ............................................... 66
2.13 Millennial Generation ........................................................................................................... 70
2.14 Professional use of Rhetorical Theory in Communication ................................................... 71
2.15 Chapter Summary ................................................................................................................ 73
3 CHAPTER THREE – RESEARCH METHODOLOGY .........................................................75
3.0 Introduction .......................................................................................................................... 75
3.1 Research Paradigm ............................................................................................................... 76 3.1.1 Ontology ....................................................................................................................... 76 3.1.2 Epistemology ................................................................................................................ 77 3.1.3 Pragmatism ................................................................................................................... 77
3.2 Research Approach .............................................................................................................. 78
3.3 Study Area and Study Population ........................................................................................ 79 3.3.1 Location and size ........................................................................................................... 79
3.4 Qualitative Population and Sampling .................................................................................. 82 3.4.1 Qualitative Population and Sampling ............................................................................. 82 3.4.2 Quantitative Population and Sampling ........................................................................... 83
3.5 Data Collection Instruments ................................................................................................. 86 3.5.1 Selecting advertisement and product categories .............................................................. 89 3.5.2 Selection of featured Art Styles ...................................................................................... 92 3.5.3 Focus Group Discussions ............................................................................................... 93 3.5.4 Questionnaire ................................................................................................................ 97
3.6 Data Analysis ........................................................................................................................ 98 3.6.1 Qualitative Data Analysis .............................................................................................. 99 3.6.2 Quantitative Data Analysis ........................................................................................... 100
3.7 Validity and Reliability ........................................................................................................ 101 3.7.1 Validity ........................................................................................................................ 102 3.7.2 Reliability .................................................................................................................... 103 3.7.3 Generalisability ............................................................................................................ 105
3.8 Ethical Considerations ......................................................................................................... 105 3.8.1 Research respondents and participants........................................................................... 105
3.9 Chapter Summary ............................................................................................................... 107
4 CHAPTER FOUR - DATA PRESENTATION AND ANALYSIS ..................................... 109
4.0 Introduction ......................................................................................................................... 109
vi
4.1 Findings and Analysis for Focus Group Discussions: Qualitative Data Focus Group Key
Themes - Presentation of Findings ............................................................................................... 109 4.1.1 Themes Generated from Focus Groups 1 and 2, Face and Food ..................................... 110
FREQUENCY OF SIMILAR THEMATIC RESPONSE(S) FOCUS GROUPS 1 AND 2, FACE
…………………………………………………………………………………………………..116
FREQUENCY OF SIMILAR THEMATIC RESPONSE(S) FOCUS GROUPS 1 AND 2, FOOD
…………………………………………………………………………………………………..124 4.1.2 Synopsis of Face and Food Results between Demographic Groupings ........................... 126 4.1.3 Variety of themes within the same social class .............................................................. 127 4.1.4 Degree of Overall Elaboration dependent on Art Genre ................................................. 130 4.1.5 Degree of Specific Cohort demographic Elaboration dependent on image art genre........ 131 4.1.6 More visually complex art styles elicit more elaboration................................................ 134
4.2 Findings from Questionnaires ............................................................................................. 135 4.2.1 Inferential Statistics Tests: Results of Descriptive, Box’s and Multivarite Tests ............. 136 4.2.2 Social Class and Face Cartoon Art Style results from MANOVA .................................. 138 4.2.3 Social class and Face Abstract Painting Art Style results from MANOVA ..................... 139 4.2.4 Social class and Face Photograph Art Style results from MANOVA .............................. 141 4.2.5 Social Class and Food Cartoon Art Style Results from MANOVA ................................ 143 4.2.6 Social Class and Food Abstract Art Style Results from MANOVA ................................ 144 4.2.7 Social Class and Food Photograph Art Style Results from MANOVA ........................... 146 4.2.8 Age and Face Cartoon Art Style Results from MANOVA ............................................. 147 4.2.9 Age and Face Abstract Art Style Results from MANOVA ............................................. 149 4.2.10 Age and Face Photograph Art Style Results from MANOVA ........................................ 150 4.2.11 Age and Food Cartoon Art Style Results from MANOVA ............................................. 152 4.2.12 Age and Food Abstract Art Style Results from MANOVA ............................................ 153 4.2.13 Age and Food Photograph Art Style Results from MANOVA ....................................... 155 4.2.14 Education Level and Face Cartoon Art Style Results from MANOVA ........................... 156 4.2.15 Education Level and Face Abstract Art Style results from MANOVA ........................... 158 4.2.16 Education Level and Face Photograph Art Style results from MANOVA ....................... 159 4.2.17 Education Level and Food Cartoon Art Style results from MANOVA ........................... 161 4.2.18 Education Level and Food Abstract Art Style Results from MANOVA.......................... 163 4.2.19 Education Level and Food Photograph Art Style Results from MANOVA ..................... 164
4.3 Chapter Summary ............................................................................................................... 166
5 CHAPTER FIVE - DISCUSSION OF FINDINGS ............................................................. 167
5.0 Introduction ......................................................................................................................... 167 5.0.1 Scope of message(s) communicated between socio-economic groupings in response to
different art genre in print media advertisements. ........................................................................ 167 5.0.2 Scope of message(s) communicated among members of the same socio-economic group in response to different art genre in print media advertisements. ...................................................... 169 5.0.3 Scope of message(s) communicated by different art styles. ............................................ 172
5.1 Selection of questions for quantitative research .................................................................. 176
5.2 Inferential Statistics ............................................................................................................. 180 5.2.1 Information Processing Theory as pertains to inter and intra social class perception of art
styles 182 5.2.2 The Rhetorical Theory and the relationship between the respondents’ perception of various
art styles used in print media advertising and social class ............................................................ 184 5.2.3 Copy Theory and the relationship between the respondents’ perception of various art styles
used in print media advertising and social class........................................................................... 185
vii
5.3 Theoretical Implications Hypothesis ................................................................................... 186
5.4 Proposed Framework .......................................................................................................... 188
5.5 Policy Implications............................................................................................................... 191
5.6 Delimitations ........................................................................................................................ 192
5.7 Chapter Summary ............................................................................................................... 193
6 CHAPTER SIX - CONCLUSIONS AND RECOMMENDATIONS FOR FUTURE
RESEARCH .................................................................................................................................. 195
6.0 Introduction ......................................................................................................................... 195
6.1 Conclusions .......................................................................................................................... 196
6.2 Contribution to knowledge .................................................................................................. 198
6.3 Recommendations ................................................................................................................ 199
6.4 Chapter Summary ............................................................................................................... 200
REFERENCES ............................................................................................................................. 201
APPENDIX I: Informed Consent Forms ..................................................................................... 217
APPENDIX II: Infotrak LSM Descriptor .................................................................................... 221
APPENDIX III: Focus Group Discussion Guide 1 ....................................................................... 223
APPENDIX IV: Focus Group Discussion Guide 2 ....................................................................... 228
APPENDIX V: Questionnaires ..................................................................................................... 232
APPENDIX VI: Face and Food Images for Interpretation.......................................................... 243
APPENDIX VII: Summary of Generated Themes Focus Group 1 and 2, Face and Food
(Amalgamation of AB, C1, and C2) .............................................................................................. 244
APPENDIXVIII: Research Permit ............................................................................................... 255
APPENDIX IX: Map of Nairobi County ...................................................................................... 256
viii
LIST OF TABLES
Table 1 Zones and Subzones in Nairobi, Kenya ....................................................................................81
Table 2 Distribution of Focus Group Discussion respondents by their Social Class ...............................83
Table 3 Respondents' current area of residence .....................................................................................85
Table 4 Distribution of the Respondents by Social Class .......................................................................86
Table 5 Age Bracket of respondents .....................................................................................................86
Table 6 The Distribution of respondents by level of education ..............................................................86
Table 7 Categorised Total of Collective Comprehensive List of Advertisements in Magazines. .............91
Table 8 Product brand qualities ............................................................................................................93
Table 4.1 Frequency of similar thematic responses(s); Focus Group 1; Face Cartoon ........................ 116
Table 4.2 Frequency of similar thematic response(s); Focus Group 2; Face Cartoon ............................ 116
Table 4.3 Frequency of similar thematic responses(s); Focus Group 1; Face Abstract .......................... 116
Table 4.4 Frequency of similar thematic response(s); Focus Group 2; Face Abstract ........................... 117
Table 4.5 Frequency of similar thematic responses(s); Focus Group 1; Face Photograph ..................... 117
Table 4.6 Frequency of similar thematic response(s); Focus Group 2; Face Photograph....................... 117
Table 35 Frequency of similar thematic response(s); Focus Group 1; Food Cartoon ............................ 124
Table 36 Frequency of similar thematic response(s); Focus Group 2; Food Cartoon ............................ 124
Table 37 Frequency of similar thematic response(s); Focus Group 1; Food Abstract............................ 124
Table 38 Frequency of similar thematic response(s); Focus Group 2; Food Abstract............................ 125
Table 39 Frequency of similar thematic response(s); Focus Group 1; Food Photograph ....................... 125
Table 40 Frequency of similar thematic response(s); Focus Group 2; Food Photograph ....................... 125
Table 41 Face and Food Summary for number of different themes mentioned by Social Class............. 127
Table 42 Infotrak LSM Descriptor: Social Grading System................................................................. 221
ix
LIST OF FIGURES
Figure 2-1 Advertisements showing photographic, electronically altered and watercolour renditions
(Miller & Stoica, 2003, p. 16) ..............................................................................................................36
Figure 2-2 Expressionism.....................................................................................................................72
Figure 2-3 Pop Art ...............................................................................................................................73
Figure 2-4 Realism ..............................................................................................................................73
Figure 4-1 Consensus in Response to Face Image Groups 1 and 2, Classes AB, C1, and C2 ................ 115
Figure 4-2 Consensus in Response to Food Image Groups 1 and 2, Classes AB, C1, and C2................ 123
Figure 8 Face and Food Images for Interpretation ............................................................................... 243
Figure 9 Research Permit ................................................................................................................. 255
Figure 10 Map of Research Zones in Nairobi ..................................................................................... 256

x
LIST OF ABBREVIATIONS
ANOVA Analysis of Variance
MANOVA Multiple Analysis of Variance
QUAL Qualitative
QUAN Quantitative
Ad Advertisement
SRS Simple Random Sampling
Undergrad Undergraduate
1
CHAPTER ONE - INTRODUCTION
1.1 Introduction
This chapter begins with a background to the study. It lays out the concepts supporting
the study as a whole and the research premise. This gives way to the research questions
and the hypotheses that outline what the research will attempt to comprehend. The
statement of the problem follows next to delineate which aspects of the question at
hand constitute a problem. The significance of the study then follows to tell for whom
and why the study is of importance. It clarifies the study’s use to the industry. The
conceptual framework proceeds to give an outline of the course the study will follow.
After this, comes the Theoretical Framework which examines the information-
processing theories, rhetorical theory and the converse theory to the study, the copy
theory. It seeks to scrutinise these theories in relation to the study at hand, as well as
delve into their strengths and weaknesses. The Definition of Terms used in the study is
then put forward. Assumptions that are held as part of the study are outlined. It is
finally rounded off by the Scope and Limitations of the study.
1.2 Background
When designing advertising images for magazines, the communication abilities
afforded by a magazines must be taken into consideration. Consumers traditionally
spend time reading through magazines in their leisure time pouring over details that
they diligently analyse, including the advertisements and images on offer time.
Magazines are an ideal medium for promoting high-involvement, products that a
2
consumer expends time reflecting on and are more likely to regard on an emotional
level (Arens & Weigold, 2017, p. 402).
In the capitalist economy that was introduced into Nairobi in the early part of the last
century, the camera proved to be unquestionably indispensable for sellers of consumer
goods. Marketers embraced the potential of photographs in advertisements to exploit
the belief among the consumer buying public that photographs portrayed that which
was real and true about products. The images they used in print media portraying the
goods for sale assisted them convince buyers new to consumer goods that what was
being purveyed was desirable. To date, advertisers have overwhelmingly relied on
realistic photographic images expending several techniques often led by ephebism.
With time, marketers would increasingly found themselves in a more competitive,
visually swamped advertising field as the range of similar consumer goods increased
and monopolies no longer held sway (Rothkopf, 2014; Zarzosa & Luna-Nevarez,
2011). There was need to differentiate products that were analogous from each other.
However, the brute reality recorded and offered by realistic photography did not lend
itself to the dissemination of subjective emotional rumination needed to generate
independent thoughts, conclusions and decisions. In order to do this, it was necessary to
inject subjectivism into the consumer mode of product selection and move away from
rationalisation. Product advertisers adapted the use of applied psychology in visual
advertising to attract viewers and stimulate buyer intent. Lejarean a Hiller, a trained
illustrator realised that lending design principles to the creation of advertising images
would encourage elaboration and by extension development of subjective thoughts. He
was one of the first advertising photographers to do this, and others quickly followed
3
suit. He employed illustration to act as receptacles of psychological aspirations,
permitting and promoting consumer product longing fantasies. Hiller begun composing
images created by collaging a variety of photographs that were then heavily touched up
with brush and paint and then re-photographed. These fantasy images were very
successful in promoting the mass-produced consumer goods they set out to idealise
(Brown, December 2000; Wharton, 2013).
This train of argument, was further endorsed by luminaries such as Walter Dill Scott,
who was a pioneering Advertising Psychologist. With time, advertisers acquiesced that
the conceptual qualities of an illustration that were blended with the factual qualities of
a photograph formed a compatible, expressive mid-ground that was suited to the
developing needs of consumer advertising (Brown, December 2000; Wharton, 2013).
Advertisements in the print media in Nairobi still overwhelmingly rely on realistic
images to convey their messages. This may be because photo realistic pictures are
viewed as ‘fixed’ imagery, whose message is prescribed, predetermined, singular and
undeviating. As such, it is believed that this ‘visual Esperanto’, “a universally
comprehensible pictorial language” (Kaindl, 2004, p. 183), understood by all,
(Heffernan, 2006, p. 16), can be used to put across a precise message, as passed on by
their encoder (Heffernan, 2006, p. 16; Mulken, Rob, & Forceville, 2010, p. 3420).
Theory, research and application in print media images have in the past hinged on this
very European premise(Scott, 1994). This view does not take into consideration a rich
pool of communication possibilities opened by the use of stylisation of images
(Pauwels, 2008). The pervasive increased use of pictures has seen the amplified use of
complex images and lesser use of copy in advertisements (Phillips & McQuarrie,
4
2014). Not considered, is that photographs, should be viewed as representations that
reflect the decisions and personality of the photographer, as well as the technology used
by the photographer. The variety of issues that skew the creative decisions applied
when fashioning the image go on to include but are not limited to the mores and
requirements of the industry concerning the phenomenon the picture depicts (Schroeder
J. E., 2008, p. 280).
It is time to consider new image development strategies such as stylisation that enable
them stand out and be noticed by consumers. There is need to adapt to developing
consumer perception traits in style, theme and semiotics that embrace emotionalism and
intellectualism in visual communication (Simonson & Schmitt, 1997, pp. 125, 159).
Though the copy in a print advertisement is important, it is the image that creates the
primary impression. As such, the image should be wrought with rich communicative
abilities.
It is widely acknowledged that artful deviances in advertising images created by
manipulating the elements and principles of design, do have an effect on visual
rhetoric. They succeed in doing this by moving away from merely showing an object as
it appears to the eye to making conspicuous what may otherwise have remained
obscure. The rhetorical theory supports this in that it promulgates that visual rhetorical
artefacts can be employed to influence another by encoding it in a manner that enables
them transmit messages to gain effect. Stylistic deviations from realism enhance the
showcasing of emotions and feelings, and make contemplation desirable (Mohanty &
Ratneshwar, 2014). Not only do these stylistic variations communicate, they serve to
convince the reader that the encoder created the deviance to communicate a specific
5
message that they must decipher (McQuarrie & Mick., 1999). This is particularly true
when the viewer of the advertisement is familiar with advertising norms as found in
magazines. MacInnis and Price, (1987) posit that unusual images tended to boost a
consumers’ ability to follow a mental path of thought that lead to their remembering
past information stored in memory. It may also be the case that unusual images
encourage a higher level of elaboration and by extension increase the level of interest
commanded, enhancing superior communication without necessarily interfering with
the underlying message offered by the image (McQuarrie & Mick., 1999). This is
because the extent to which a consumer processes images, a factor influenced by their
socio-demographic background, affects the number and type of inferences drawn
(McQuarrie & Mick., 1999; Mulken M. v., 2003, p. 114; Phillips & McQuarrie, 2014).
As such, choice of advertising approach should be tempered to suit the local market
culture, the consumers’ social class and the product in questions’ market position and
category (Elarmany, Abdellatif, & Mohamed, 2019).
According to McQuarrie and Mick (2003), the view that the meaning an image conveys
is not static was propagated in Miniard, Bhatla, Lord, Dickson, and Unnava(1991), and
Mitchell and Olson (1981). Progressively, it has been shown that depending on how
they are executed, images can depict both denotative and connotative meaning.
Denotative images are universal in the messages they rely transmitting similar fixed
meaning to all viewers. Connotative images on the other hand are subjective. They
carry variable meaning and can be interpreted based on viewers’ individual parameters.
These ideas are echoed by McQuail (2005, p. 348), Mick and Politi (1989) as well as
Scott (1994). It is widely postulated that most people viewing a denotative image
within a homogenous cultural background, will extract the same meaning from it.
6
However, because connotative interpretations are influenced by both cultural mores and
individual make-up, their interpretation is far more varied and personal. The Schema
theory which supports this premise intimates that constituent elements of cognition can
be employed in organising knowledge using information derived and processed from
prior experiences.
Bulmer and Buchanan-Oliver(2006a)as well as Scott and Batra (2003)explain that, for
example, there can be no fixed picture of a sunset as such, only a depiction of the
sunset in one style or another. “A sunset in the travel poster style will lead to one kind
of reading and one set of associations, whereas one in the New Age style will be
assimilated to a different stock of cultural knowledge and will point the reader in a
different direction when constructing meanings (McQuarrie & Mick, 2003b, p. 194).”
However for this to happen, the consumer must perceive the images’ art style as a work
of art, an artful deviation so to speak, as opposed to an aberration of reality (Hagtvedt
& Patrick, 2008, p. 381)
The use of stylisation of images aimed at the Millennial Generation in magazines
distributed in Nairobi remains infrequent. However, stylisation is a fairly common
practise in the West (Hetsroni & Tukachinsky, 2005). In the American edition of
“Vogue” Magazine, a publication which was accessed by one in ten women,
postmodern thematic stylisation of the hyper-reality and pastiche genre increased.
Between 1995 and 2000, 63% of ads had no or low inclination towards realism. By the
era between 2005 and 2010, this had risen to 39% (Zarzosa & Luna-Nevarez, 2011).
Though there are no statistics from refereed sources to back this statement as far as the
Kenyan situation is concerned, content analysis of the period through January,
7
February, March, April, May and June 2011 editions of leading high-end glossy
magazines on Nairobi’s newsstands such as ‘True Love’ and ‘Drum,’ show a 100% use
of realistic photographic images in advertising whose sizes range from quarter to full
page.
The traditional photograph as is frequently used in advertising, may not be as effective
in promulgating notions as assumed, an image type that is capable of transmitting
visual concepts to an audience is needed (Bulmer & Margo, 2006b; Hatfield, Hinck, &
Birkhoht, 2007; Muers & Aristoff, 2009). This is a sentiment echoed by local
advertisers who decry weaker generation of buyer intent garnered from print
advertisements. This is reflected by a flight from print media to other media such as
digital, and billboards (Kenya National Bureau of Statistics, 2018). In an advertising
market that is rich in visual environmental stimuli, where viewers are increasingly
distracted and time limited (Albakry & Daimin, 2014, p. 28), it is necessary that images
not only catch the eye of the target audience but also communicate the prescribed
message to them succinctly (Coulter, 2005; Malmelin, 2010).
1.3 Statement of Problem
Millennial female lifestyle magazine consumers in Nairobi across different ages, social
classes and levels of education do not necessarily perceive the same message from
realistic, photographic images published in print media (Scott, 1994). Yet,
advertisements in Kenyan magazine publications are rife with mimesis. Photographic
images as used in print media advertising largely seek to depict an object as it is, albeit
employing ephebism. They have been viewed by designers as transmitting advertising
8
messages effectively, with no research backing this widely held thought. However,
these images are fairly neutral and do not stimulate the viewer to break from habitual
perception patterns of that which is portrayed literally, missing out on the opportunity
to catch their attention and stimulate elaboration that would enable an advertiser
transmit an ancillary, eloquent message to a consumer. Lack of an advertisement’s
ability to convey messages optimally creates communication impediments in
contemporary society where there is high competition from advertisements seeking the
attention of a viewer, with the need to impart a message with speed, concisely.
The designer must understand and create visual imagery that the target audience can
relate to, to enable triggering of sensual perception, so as to stimulate rhetorical-
discourse. The concepts employed to do so may differ depending on a viewer’s cultural
and demographic background. The exploitation of rhetorical figures in visual
communication may give visual designers tools by which to explore and encourage
lateral thinking, so as to alleviate loss of information. Despite these assertions and their
machinations, limited research on the exact effects of visual rhetoric has been carried
out in Western, European countries but is hard to come by, particularly as concerns
African or the Nairobi, female, millennial audience (Pettersson, 2013). In the former
countries, the use of varied art genre, though not delineated using demographics, has
been shown to result in heightened understanding of the advertiser’s message (Miller &
Stoica, 2003; Scott & Vargas, 2007)
Though it is necessary to understand the viewers’ perception of stylised images so as to
generate images in advertising that communicate the intended message, care must be
taken when using style to communicate. McQuarrie and Mick (1992)show that while a
9
certain degree of deviation enhances communication, beyond a certain scale, deviation
begins to confuse and create misunderstanding (Pettersson, 2013). This information
should be of interest to advertisers who seek to communicate effectively and efficiently
with their target audience(s) as it is not acceptable to concoct images that purport to
communicate based on “executive experience and intuition” (Orth & Malkewitz, 2008,
p. 67) of a design team. It is necessary to explore the response to images of varied art
genre of audiences within and without different demographic groupings, as well as the
nature and extent of communication conveyed by varied art genre.
The purpose of this study is to describe and compare the response of millennial females
of different and similar social classes, age and level of education, aged 20 – 34 to pop
art, expressionism and realism images used in advertisements targeted at them in
women’s lifestyle magazines in the print media. Qualitative methods will be used to
gain in-depth insight into the effects of social class on art genre. The data will be
contextualised with a review of literature on rhetorical response and the workings of
schema in visual communications as found in images. Under Quantitative methods,
using statistical analysis, the research will measure the demographic effects of age,
social class, and level of education on the perception of different art genre.
1.4 Research Questions and Hypotheses
This study in visual communication looks into female millennial generations’
perception of an image and delves into their response to it based on its’ stylistic
qualities. It looks at the variety of messages an image conveys to viewers as well as
their subsequent responses as influenced by demographic background. The overarching
10
question is therefore, what is the effect of demographic groupings on the degree of
elaboration, and therefore scope of message(s) communicated by different art styles in
print media advertisement?
Research Questions
1. How do different art genre in print media advertisements influence the degree of
consensus of message(s) communicated between demographic groupings?
2. How do different art genre in print media advertisements influence the degree of
consensus of message(s) communicated among members of the same
demographic grouping?
3. How do the different art style influence the degree of elaboration of message(s)
communicated?
Hypotheses
1. There is no significant difference between art style used in print media
and its’ perceptions by respondents’ from diverse social classes.
2. There is no significant difference between art style used in print media
and its’ perception by respondents’ from diverse age groups.
3. There is no significant difference between art style used in print media
and its’ perception by respondents’ from diverse levels of education.
1.5 Justification of Study
It has been argued that research on visual persuasion “has been fundamentally
misdirected because consumer researchers have not engaged the image (Larsen, Luna,
& Peracchio, 2004, p. 102).” As a result of this, the information available on images
used in advertising is incomplete and often disjointed, which does not augur well for
11
knowledge and development of the discipline. Though research is thin, (Mick & Politi,
1989; Pettersson, 2013), say that it has increased (Bulmer & Buchanan, 2006a;
McQuarrie & Mick., 2003; Phillips, 1997). However, this does not mean that there has
been a deluge in research specifically related to images and the elements and principles
of design, and how they affect the elucidation of information imbibed from them
(Bulmer & Buchanan, 2006a; Bulmer & Buchanan-Oliver, 2006b; MacInnis,
Moorman, & Jaworski, 1991; Miniard, Bhatla, Lord, Dickson, & Unnava, 1991;
Phillips, 1997; Scott, 1994). Budding research “is now characterised by conceptual and
methodological diversity with a variety of new propositions and findings emerging
(McQuarrie & Mick., 1999).”
Information on the female millennials perception of art genre as could be used in print
media lifestyle magazines is necessary for its development. When asked if she thought
millennials’ perception of the messages put forward in Kenyan advertisements would
be enhanced and improved by the use of expressionism and pop art Lilac Osanjo a
leading academician and designer posited that it would. Celestine Wamiru, a renown
practising illustrator, cartoonist and animator concurred and explained that if targeted at
mostly younger and urban audiences the artsy creative twist of pop art and
expressionism that would get noticed by progressive audiences in today’s din of visual
communication. Teresa Lubano, a leading experiential design specialist goes on to say
that applied in interesting, imaginative contexts within the communication, advertising
may become reinvigorating, stand out and compel positive reactions from the audience.
She advances that sample testing may need to be applied before launching
communication with such visual styles to mitigate against adding ‘perceived’
complexity to the message which may inhibit full comprehension of what the ad is
12
trying to communicate. This is fundamental to the success of introducing art genre to
advertising images. Research has to be done to generate a verifiable, accurate
methodology which designers can apply to produce effective work.
On whether or not the target audience will be capable of perceiving the message put
forward to them, Teresa Lubano, a reputable designer with years of experience in
experiential design postulated that the majority of the Kenyan public may not recognize
expressionism and / or pop art as a style, let alone its application to an advertisements’
messaging, but they did appreciate captivating art direction styles. She went on to
clarify that when it came to the urban setting/ audience, there was a distinct difference.
Due to this audience being exposed to different forms of media and travel, there were
urban Kenyans who are discerning enough to recognize and interrogate visual styles
embedded in advertising and even pure forms of pop art and expressionism.
Lubano propounds that Kenyans have become more discerning and demanding due to
globalization, technology and the real-time world offered through the mobile phone.
This has given them a window through which they can experience a plethora of
engaging, eloquent visuals. Communication operatives need to elevate their craft and
generate advertisements that trigger the intended reaction. Adapt or perish. As such, it
is necessary that a procedure that can assist Creatives in their bid communicate more
effectively using art genre is provided.
Scott (1994)speaks of images, produced for some past experiments carried out to gauge
audience perceptions of advertising as using very amateurish line drawings. They do
not communicate as sophisticated photographs as actual advertisements do. As such, it
13
is unlikely that these line drawings are comparable to actual advertisements or
communicate in the same manner, or at the same level under experimental conditions.
The use of crude drawings for advertisement experiments may actually stem from the
assumption that style does not in any way affect attitude towards images, so that the
style used in experiments is irrelevant. This may have come from the school of thought
that only semiotics are important.
McQuarrie and Mick (1999), postulate that a reader views pictures in advertisements as
complex texts that can be deciphered to convey information, and create or contribute to
meaning in a communication. “Consumers read [visual] ad texts for style, […] a
manipulation of style should have a predictable impact on consumer response”
(McQuarrie & Mick., 1999, p. 38). This reality has profound implications for
professional pictorial communicators who produce works to be used in advertising. The
importance of style in image production not being emphasised, or taken up much in
research activities may be due to inherent thought that style does not impact on
perception as much as the pictured object (Bulmer & Buchanan, 2006a; Scott, 1994;
Larsen, 2008, p. 69). What has thus been created in academic literature is a deeper
understanding of the mind and processes it engages in to comprehend an advertisement,
but not how the actual advertisement itself is formulated and the theory behind the
creation and structuring of an advertisement image, and how a viewer responds to an
image type or style. Bulmer and Buchanan-Oliver, (2006a, p. 57)submit that the nature,
meaning and variations of rhetorical impact in advertisements, should be explored as
“factors that impact on meaning production are under-theorised at present.” They
further state that a study of visual rhetoric in advertising may convey a “clearer
understanding of the actual bodies of knowledge that contribute most to interpretation
14
in certain advertisements (Bulmer & Buchanan, 2006a, p. 57).” Veronica Smith (2008,
p. 45)states that though earnest research into visual communication started mid last
century, until recently, not much has been achieved in the way of developing new
frameworks within which advertising in its’ current state can be studied (Hatfield,
Hinck, & Birkhoht, 2007). Advertisers need to understand “how consumers behave in
their roles as recipients of communication” (Malmelin, 2010). Research conducted
should take into consideration socio-demographic attributes of the target audience, as
well as product types.
The advertiser must strive to defamiliarise an image and produce images that make the
familiar, unfamiliar and hence stand out (Mohanty & Ratneshwar, 2014; Schroeder J.
E., 2002; Scott, 1994; Heiser, Sierra, & Torres, 2008, p. 75). Images that are visually
unusual create greater elaboration, which means that a viewer investigates the
advertisements’ message more deeply and is more likely to decode and/ or decipher the
message being transmitted by the marketer, unless it is too complicated and they chose
to opt out (Mulken, Rob, & Forceville, 2010, p. 3421; Albakry & Daimin, 2014, p. 31).
It is also posited by Phillips and McQuarrie (2014) that when a consumer spends more
time trying to decipher the meaning of a complex visual image, they have less time to
counter any negative thoughts or reservations they may have about the product or
service being advertised. As such, they are far more likely to be accepting of the
message being proffered (Walters, Sparks, & Herington, 2007). A verbal message must
first be translated into a visual, and then processed. A message pre-encoded in visual
form does not have to go through this step making processing and grasping the message
easier for the consumer as much less is lost in the mental process of translating one
form of communication to another. Visual images have the “potential for semantic
15
condensation”(Kjeldsen, 2012, p. 241), large messages can be succinctly condensed
into smaller packages that a viewer is able to take in more easily, particularly if a
viewer does not want or have the time to invest in investigating a message.
1.6 Significance of the Study
The Consumer Magazine Publishing Market in Kenya is a fairly large market involving
millions of Shillings. “Consumer Magazine revenues stood at US$72 million in 2014
and will rise to US$85 million in 2019. [This represents] a Compound Annual Growth
Rate (CAGR) of 3.1%” (Ovum, September 2015, p. 167).
In the crowded field that is advertising, ninety percent of the readers first consider the
images in an advertisement. Sixty five percent will go further in an attempt to process
what the graphics convey, and only two percent of the readers will process the
typography (Muers & Aristoff, 2009). In order to make advertising viable and increase
the return on investment, there is a need to engage in developing tools that aid in the
elevation of persuasion as transmitted via imagery in advertising as it has a significant
positive impact on consumerism and the economy as well as contemporary culture. A
robust visual identity and language gained through the development of a substantial
visual rhetoric culture promotes message communication in advertisements that
enhances consumer response to advertising images. Developing an understanding of
persuasion and its application in visual rhetoric will spearhead the creation of a wide-
ranging theory whose application should promote comprehensible and persuasive
advertising imagery. Studies have been done on the development of visual rhetorical
content in Malaysia to show that implementation of a strong visual communication
16
system helps boost a country’s economy. It follows that Nairobi, a developing city,
would stand to benefit it advertisements were able to transmit messages to a targeted
consumer audience as desired by advertising messages encoders. However, no
empirical studies have been done that can support this premise.
For Academicians and Researchers, this study is significant in that it hopes to
contribute towards the development of an imagery formulation framework by initiating
growth in understanding the design elements and principles that lend to constructing
meaning. (Albakry & Daimin, 2014, p. 30). In pursuit of this, the researcher gives
cognisance to the contribution of culture and semiotics to visual rhetoric in the quest for
the development of the tools of persuasion.
For Advertising practitioners, the study the study is significance in that it hopes to
confirm or repudiate existing theoretical guidelines that help practitioners use the
influence of the elements and principles of design as incorporated in visual imagery to
create brand awareness among consumers. Further to this, to make available relevant
theoretical guidelines in a bid to assist promote the creation of images that intensify and
reinforce messages about products.
Visuals and visual rhetoric are increasingly becoming a major part of communication in
our world. For a citizen to live effectively and efficiently and be capable of
manoeuvring in todays’ society, the ability to read and interpret visual texts is as
necessary as the ability to read and interpret verbal texts. Similar to verbal rhetoric,
visual rhetoric employs conventions such as enthymemes, metaphors, and has
traditional ways of organizing a composition governed by the elements and principals
17
of design. These conventions cause serious interpretive challenges to those not
schooled in their usage, because they are external to the original community that
generated them.
In response to this traditionally, the government seeks to create an inclusive society
where all citizens are capable of achieving equality and are given a chance to thrive. To
this end, providing universal education that enlightens a citizen on how to survive has
been a major tool. If visual literacy is a requirement for existence, then teaching it is a
necessity. This study hopes to provide information on the communicative abilities of
the conventions of imagery and how these enhance visual communication. It is hoped
that this knowledge enlightens design policy makers on the potency of ability to read
visuals as a tool ripe for use in national development and to include it in the education
system.
For consumers, the study is significance in that the creation of imagery that
communicates effectively and efficiently endorses consumer products. This stimulates
the purchase goods and promotes the economy. Studies have shown that advertising has
the ability to stimulate purchase of goods.
For imagery production practitioners the study is significance in that the information
provides a basis of information that enables the application of methodologies that
uphold conceptual thinking, and support the creation of persuasive, meaningful
communicative visuals using the doctrines of design.
18
1.7 Scope and Limitations of the Study
Scope
The illustrations employed to advertise products in Kenyan magazines targeted at the
female 20 to 34 years age groups largely utilise photography. It is believed that this
style of art communicates the advertisers’ messages succinctly to the target audience. In
contemporary advertising, particularly in Western countries, the use of other styles of
art to communicate a specific message to a specific target audience is quite common. It
has been said to do so effectively. This study sets out to see if the alternate art style of
expressionism and pop art could communicate a unified message to a specific target
audience. It also set out to investigate if the demographics of social class, age, and level
of education affected the response to an art style. The lifestyle magazines used in the
study were targeted at women. As, such, the study was carried out only on women.
The study was carried out the in eight zones in Nairobi, the capital city of Kenya, which
is located on the Central, East coast of Africa. The participants came from Embakasi,
Langata, Kamukunji, Dagoretti, Westlands, Starehe, Makadara, and Kasarani. The
Qualitative part of the study had forty four respondents and the quantitative section two
hundred and sixteen respondents.
The study was located under social studies in the genre of media and communication
for marketing.
The study was carried out over a two year period. The Theory of Visual Rhetoric and
Schema Theory were used to interpret the response of the target audience to images
19
generated using Photographic Realism, Expressionism and Pop Art. The Copy Theory
was the converse to the two aforementioned.
Limitations
The ideal conditions under which advertising visual imagery experiments are carried
out dictate unforced exposure. In the experiments carried out, forced exposure
occurred. Participants were notified or distinctly aware as they were shown
advertisements and asked questions pertaining to them. Promulgation from the mass
media does not incorporate involuntary engagement with broadcast messages. They
must of their own efforts “win attention, and be persuasive (Scott & Batra, 2003, p.
216).” This brings into question the objectivity of the research where this was not the
case. However, during this empirical research where specific variables are under
scrutiny, it was necessary to isolate them in order to study them. As such, this limitation
was not surmountable.
Participants were required to respond and give verbal reactions to visual imagery that
was processed mentally. This put them in a position in which they were translating
from visual imagery to verbal forms. Wherever translation occurs from one mode to
another, there is loss and muddling up of data, due to differences in forms of expression
inherent in different modes of communication. This did not augur well for the data
collected (Mick & Politi, 1989, p. 8), (Rossiter, 1982). Non-visual communication is
the only way in which the respondents in this study were able to transmit their
perceptions. It was not a limitation that could be easily overcome.
20
It was noted that lack of visual literacy was common among the Nairobi populace.
However, this claim could not be conclusively stated due to the absence of scientific
evidence to support this statement. It manifested itself when data was being collected
and respondents were not capable of expressing themselves optimally, as they did not
have the language to do so. It has been scientifically demonstrated that education in
aesthetic appreciation improves an individual’s ability to perceive and critique visual
imagery (Schonborn & Anderson, 2006). Research on extent of visual literacy in the
West European States and the United States of America has been carried out and it has
been found wanting there as well (Pauwels, 2008, p. 79).
21
1.8 Definition of Terms
Advertising is a means of structured, non-personal communication, intended to inform,
persuade or influence a consumer of goods customarily paid for by the sender of
the message (Arens & Weigold, 2017, p. 633).
ANOVA the “Analysis of variance (ANOVA) is a hypothesis-testing procedure that is
used to evaluate mean differences between two or more treatments (or
populations) (Gravetter & Wallnau, 2007, p. 389).”
Artful deviation is a nonconformity from the conventional that refers to a departure
from the way that a consumer typically encounters visual images (Callister &
Stern, 2008, p. 143).
Audience response is an aesthetic and rhetorical reaction caused by exposure to a visual
image stimulus that employs the elements and principles of design to encode a
message that is created to induce interactivity in advertisement images.
Cognitive structure is a stored mental construct, or schema, comprising a concept,
general pattern, or stylistic illustrative samples.
Connotative meaning is subjective, flexible perception that emanates from a thought
process influenced by a recipient’s culture and mode of evaluation (McQuail,
2005, p. 348).
Consumers, consumer market are the populace who purchase goods and services for
personal or other people’s use (Arens & Weigold, 2017, p. 632)
Copy are the words used in an advertisement (Arens & Weigold, 2017, p. 632).
Creatives are persons with a variety of design specialisations working in the creative
department of a magazine. (Arens & Weigold, 2017, p. 638).
22
Creative Mix are a series of elements that are considered and controlled in order to
achieve an advertising objective when designing an advertising strategy, they
include: “the product concept, target audience, advertising message, and
communications media (Arens & Weigold, 2017, p. 279 & 638).”
Decoding is “the interpretation of a message by the receiver (Arens & Weigold, 2017,
p. 639).”
Defamiliarisation is converting that which is known to the unknown and unorthodox,
thus drawing attention to it.
Demographic segmentation are grouped divisions founded on a population’s
quantifiable characteristics such as sex, age, level of education, social class,
income, among others (Arens & Weigold, 2017, p. 639) .
Denotative meaning is characterised by universality; it is objective and fixed (McQuail,
2005, p. 348).
Elaboration is mental activity attendant with a consumer’s counter to images. It
indicates the complexity, quantity, or variety of cognitive action caused by a
stimulus (MacInnis & Price, 1987, p. 475).
Elements of Art and Design are the visual components of colour, form, line, shape,
space, texture, and value among others. Line is a continuous mark that is created
on a surface by moving from one point to another. A shape is a flat, enclosed
space defined by height and width. Form is a three-dimensional, enclosed unit
defined by volume, and comprises of height, width and depth. The lightest or
darkest tones of a colour are referred to as Value. Space defines the negative
and positive areas of an image. It is employed to create a sense of depth in a
image so that shapes are able to be perceived as two or three-dimensional
objects. Colour is made of three properties that are value, hue, and intensity.
23
Value it’s qualities of lightness and darkness as influenced by the addition of
black or white. Hue is the colour concerned and Intensity is the quality of purity
and brightness. While low intensity colours are dull and faint, high intensity
colours read as bright and strong. Texture refers to the surface quality of an
image. This is reflected in expressed visually implied looks such as rough, soft,
smooth (Brommer, 2010).
Encoding is translating an idea, concept or message into illustrations (Arens &
Weigold, 2017, p. 640).
Enthymeme is a particular means of expressing a logical argument that engages
deductive reasoning in which has one proposition is suppressed. This can be
either a premise or a conclusion (Smith V. J., Winter-Spring 2007).
Hyperbolic illustration is the deliberate exaggerated use of visual rhetoric by excessive
dramatising of the elements and principles of design in an image for effect
(Sinclair, 2001, p. 716).
Image defines an aspect of the reality in a space plan. It creates a visual language using
symbols that require cognitive skills to decipher. Image is a semantic and
syntactic combination of visual objects and principles (Mzoughi & Abdelhak,
2011).
Implicature denotes a message that goes beyond the explicitly portrayed communique
(Callister & Stern, 2008, p. 148).
Lifestyle consumer magazines are periodicals targeting a population who purchase
goods for personal or other people’s use. They often seek to inform, entertain
and educate their target audience as well (Arens & Weigold, 2017, p. 632).
MANOVA the Multivariate analysis of variance (MANOVA) is simply an ANOVA
with several dependent variables. MANOVA “is a hypothesis-testing procedure
24
that is used to evaluate mean differences between vectors of means (Gravetter &
Wallnau, 2007, p. 389).”
Market segmentation Strategy is the segregation of a populace based on utility needs
and characteristics of the mutual products they consume (Arens & Weigold,
2017, p. 645)
Marketing strategy is a company’s statement of actions to be implemented to attain its
marketing objectives. It incorporates the marketing plan, and is dictated by the
marketing mix (Arens & Weigold, 2017, p. 645).
Millennial generation represents those born roughly between the late 1970s or early
1980s and the late 1990s or early 2000s (Carlson, 2011; Gardner, 2006;
Matchar, 2012; Tuttle, 2012; Valentine & Powers, 2013; Wesner & Miller,
2008, p. 1)
Persuasion is the attempt to change behaviour, belief, attitude, or intent generated by an
advertisement (Arens & Weigold, 2017, p. 647).
Picture is a visual representation of a tangible or intangible object (Sinclair, 2001, p.
1134). It projects a visual sensory analogue (Scott, 1994), and can be symbolic
or non-symbolic. It is also referred to as an image.
Principles of Art and Design are balance, emphasis, movement, proportion, rhythm,
contrast, gradation, harmony, and variety among others. They are the means an
artist uses to organize elements within a work of art. Rhythm seeks to show
movement. It is simulated by the care placement of repeated elements to cause a
visual pulse. Balance combines elements to create the feel of equipoise.
Contrast emphasizes differences between elements. Emphasis aids in drawing a
viewer's eye to select objects. Proportion the correlation between elements in
relation to size. Gradation is the regular and measured changes in specific
25
elements, such as colour in a pre-designated manner. Harmony is the
combination of comparable elements to highlight their likenesses, which can be
attained via arrangements such as repetition. Variety is a principle of design
which embraces multiplicity or disparity, this can be promulgated by the use of
the elements of design. Movement creates the sensation of motion and which
directs the viewer’s eye across a visual surface (Brommer, 2010).
Psychographic segmentation divides a market into sections based on interests, views,
customs, or behaviour, values or opinions among other personality traits
(Shilbury, Westerbeek, Quick, & Funk, 2009, p. 75).
Psychographics is the clustering of consumers market segments based on psychological
classification such as lifestyle, attitudes, values, or personality, among others
(Arens & Weigold, 2017, p. 652).
Rhetoric is the effort to create and stimulate public audience through the act of
producing persuasive symbolic material that is then broadcast. This material has
traditionally been verbal in nature.
Rhetorical Figure is a method of expression that is an artful deviation from the literal
(or expected) method of expression (DeRosia, 2008, p. 23).
Semantic condensation are immense messages that have been succinctly condensed into
smaller visual units or images that a viewer is able to comprehend more easily,
particularly when time constrained (Kjeldsen, 2012, p. 241).
Schema is a mechanism of recall that uses imagery which serves as a data structure that
stores a broad variety of concepts and keeps these in memory. The meaning it
proffers exists beyond immediate visual cognition.
26
Semiotics is the study of signs and symbols as an integral part of visual
communication. A semioticis the visible structure in a composition that is used
to convey meaning.
Stimulus is physical information received through the Senses (Arens & Weigold, 2017,
p. 653).
Stylistic properties is defined as the artistic aspects of an image that can be altered
excluding semiotics and content (McQuarrie & Mick 1999). They impact the
manner in which visual material is presented and perceived due to the
manipulation of the elements and principles of design. They also comprise
attributes such as camera angle, layout and positioning of objects, perspective
(Wang & Peracchio, 2008, p. 211).
Symbol is an image that denotes or represents something else (Sinclair, 2001, p. 1527).
It is created by common social agreement or convention (Scott, 1994).
Target audience is the precise group at which an advertisement is directed (Arens &
Weigold, 2017, p. 653).
Target market is the market segment towards which marketing activities are directed
(Arens & Weigold, 2017, p. 653).
Visual is that which has to do with all that pertains to our endeavour to make sense of
the world around us using our sense of vision. It also applies to the materials,
tools, items, and objects we use in this attempt. This may include but is not
limited to items such as photographs, television, computer monitors and other
media.
Visual rhetoric is first a tangible visual object or artefact, and secondly, a deliberate,
creative attempt to communicate applying the measured use of design elements
to communicate (Foss S. , 2004, pp. 304 - 305).
27
Visual Rhetorical theory is interpretative in nature and is engaged when rhetorical
discourse occurs. It involves an audience who are stakeholders in an exigency.
A rhetorical theorist addresses the exigency using signs, symbols, and icons
(Foss K. A., 2009).
1.9 Assumptions
The opportunity to process an advertisement refers to the degree to which a viewer has
the opportunity to pay attention to an image. It is assumed that the viewer will be
paying adequate attention to the advertisement presented to them (Scott & Batra, 2003).
Attention can be taken away for the viewer in a variety of ways.
Certain individuals are more motivated to process imagery due to their need for mental
challenge and engage in deciphering an advertisement due to this factor. Some persons,
due to higher levels of intelligence may also have the ability the process advertisements
more elaborately than others. It is assumed that all participants have a reasonable
ability, and motivation to process the advertisements proffered to them (Scott & Batra,
2003).
1.10 Chapter Summary
The use of the image in print advertising has become an accepted and expected industry
standard in magazines found in Nairobi (Schroeder J. E., 2008). However, in a crowded
media environment, it is necessary to find a way to garner the attention of the target
audience and deliver a reasonably precise message to them in a succinct manner. This
study in visual communication looks into Nairobi’s female millennial generations’
28
perception of different art styles in print media advertisement and looks at the span of
messages various art genre proffered them convey. It proposes that lifestyle magazine
consumers across the different social classes, age and levels of education in Nairobi do
not necessarily perceive the same message from realistic, photographic images
published in print media and delves into their response to these based on their
demographic background. The information generated is of importance to designers and
advertisers as it gives them a knowledgeable basis from which to create images that
communicate to their target audience. This study is significant in that it hopes to
contribute towards the development of an imagery formulation framework. Though it
was noted that lack of visual literacy was common among the Nairobi populace was
assumed that all participants have a reasonable ability, and motivation to process the
advertisements proffered to them.
29
2 CHAPTER TWO – REVIEW OF RELATED LITERATURE
2.1 Introduction
The Literature Review begun with a brief explanation of techniques used to gather
information along with the purpose and scope of the review. Advertising
communication was situated within communication. Visual Rhetoric was then defined
and discussed. Articles relevant to the study were reviewed and examined. Theories and
constructs related visual to communication were explored. Key variables such as art
styles and demographics as well as their operationalisation were considered.
Measurements used in the researches reviewed were scrutinised. An example of
successful use of visual communication in advertising was shared.
2.2 Visual rhetoric
Visual rhetoric can be viewed in two ways. First, it could be looked at as a tangible
visual object or artefact. Secondly, and in this case, it was the deliberate and, creative
“production or arrangement of colours, forms, and other elements to communicate with
an audience (Foss S. , 2004, pp. 304 - 305).”
“In this meaning of the term, visual rhetoric constitutes a theoretical perspective
that involves the analysis of the symbolic or communicative aspects of visual
artefacts. It is a critical–analytical tool or a way of approaching and analyzing
visual data that highlights the communicative dimensions of images or objects.
[...] Key to a rhetorical perspective on visual artefacts is its focus on a rhetorical
response to an artefact rather than an aesthetic one. An aesthetic response
consists of a viewer's direct perceptual encounter with the sensory aspects of the
artefact. [...] In a rhetorical response, in contrast, meaning is attributed to the
artefact. Colours, lines, textures, and rhythms in an artefact provide a basis for
the viewer to infer the existence of images, emotions, and ideas. […] A
rhetorical response, […] is a process of accrual in which past experiences merge
with the evidence of the canvas to construct a meaning” (Foss S. , 2004, pp. 306
- 307).
30
2.3 Situating advertising communication within mass communication
This study looks into process of communication as opposed to the systems used to
transmit information. Communication is "a process of sharing or exchange of ideas,
information, knowledge, attitude or feeling among two or more persons through certain
signs and symbols. (Manohar, 2006, p. 1)". It serves to inform, entertain, persuade,
influence, instruct among other functions (Manohar, 2006, p. 3). According to Usmani
(2008, pp. 256 - 257) there are five basic types of communication. These are Mass,
Public, Small-Group, Interpersonal and Intrapersonal. Mass communication in the
context of this study refers to the distribution of one-sided messages by print media to
the general public (Nayyar, 2007, p. 85). Print media and by extension magazines are
one of the offshoots of mass communication. Print advertisement communications are
contained in magazines that are distributed to the masses, by this very act, they are part
and parcel of mass communication.
2.4 Situating Visual Rhetoric within Communication Studies
“Visual rhetoric is a term used to describe the study of imagery within the discipline of
rhetoric (Foss S. K., 2005, p. 141).” The term rhetoric essentially alludes to what is
now referred to as communication. Rhetoric is any “artefact that may formulate, sustain
or modify attention, perception, attitude or behaviour” (Foss S. K., 2005, p. 141) of a
subject. Douglas Ehninger, proposed that rhetoric should not discriminate against non-
verbal forms of communication. Other scholars define it as simply that which can be
employed to influence and manage meaning, promote the suitability of discourse
between imagery and rhetoric and by extension the discipline of communication.
31
2.5 Situating Visual Rhetoric within Advertising Communication
Because “rhetoric is persuasive communication; advertising is rhetoric” (Pracejus,
Olsen, & O'Guinn, 2006, p. 82). It invariably attempts to alter or adjust in some form or
another, an audiences’ perception of something. The advertiser uses “the most effective
devices for informing, reminding and persuading the target market … it is the
persuasive use of symbols, including pictures,” (Bulmer & Buchanan-Oliver, 2006b, p.
55) that is conceptualised as visual rhetoric (Kaufer & Butler, 2013). In order to
achieve this, advertising depends on the use of various tools, conventions and
techniques.
Visual rhetoric is the image employed in the advertisement that creatives generate,
using “visual symbols for the purpose of communicating. It is the tangible evidence […
that] constitutes the data of study for rhetorical scholars interested in visual symbols.
Visual rhetoric is symbolic action where neither the viewer nor the originator of a
visual message own it, or are entirely in control of the process, it is a joint effort
between the two (Shroeder, 2006, p. 304). Nevertheless, the target audience, through
experience gained from relating to visual images in advertisements have learnt to
decipher their meaning. These visuals are in contrast to signs, where a natural
relationship exists between the symbols “and the object to which it is connected (Foss
S. , 2004, pp. 304 - 305).” With a sign, the meaning is also more likely to be fixed and
not open to interpretation.
Visual rhetoricians engaged in creating advertisements are often said to engage in
hyperbolic illustration. It has been posited that advertisers tend to be pragmatic and
32
resolute in their quest to communicate. The images encoded by advertisers are not
necessarily completely or partially untrue, but the tenacity and visual embellishment
techniques used in the visuals by the advertisers to communicate leaves some viewers
uncomfortable, and questioning what degree of truth is actually held in the
advertisement viewed. However, it should be noted that rhetoricians do not view
themselves as being in a discipline occupied in truth seeking (McQuarrie & Phillips,
2008). They view themselves as communicators. The key role of a communicator
demands that they communicate in any way possible, as long as the intended message
is passed along to the viewer. In all of this, the advertiser and the message encoder
assume a degree of artistic license, which is a distortion of realism as it may be known
or seen to an image consumer.
2.6 Rhetoric as a Perspective
The information that a specific design element expresses in a particular message is
arrived at by borrowing from the pool of knowledge of the shared “learned system of
pictorial convention” (Scott, 1994, p. 253) developed by society as a whole. These
systems evolve because of or in spite of societies’ workings, growing out of everyday
interactions and interactions of its members. They eventually loosely agree to a system
of symbols which they use to communicate (Singer, 2010, p. 82). Culture is the lens
through which the individual views interrogates, synthesises and ultimately proceeds to
evaluate phenomenon (Craig & Douglas, 2005, p. 323; Hagtvedt, Hagtvedt, & Patrick,
2008, p. 198). In order to imbibe, process, understand, translate, and generally work
with stylised images, an individual must have gone through some form of acculturation
or training (Lopes, 1996, p. 16; Heffernan, 2006, p. 18). As such, images borrow
33
heavily from specific cultural systems where cultural metaphors are the universal
“activities, phenomenon, or institutions which members of a given culture emotionally
and / or cognitively identify” (Soares, 2007, p. 278). They are an intrinsic part of
individuals within a society, whether or not they are aware of it (Scott, 1994; Felten,
2008). This can be referred to as the contextualisation. However, it cannot be claimed
that due to contextualisation, a particular style will communicate in every situated
encountered (Brumberger, 2011, p. 66; Shroeder, 2006).
Consumer behaviour can be studied using “relevant cultural variables” (Soares, 2007,
p. 278) and applying these as a measure as appropriate to a situation. Class structure,
age, level of education, beliefs, art, law, are some of a wide variety of suitable variables
(Craig & Douglas, 2005, p. 323; Soares, 2007, p. 278).
2.6.1 Elements of design as a form of rhetoric
A rhetorician constitutes and employs the elements and principles of design “so as to
maximize the probability of a possible audience response.” These elements, namely
line, form, shape, colour, tone, texture, proportion are capable of “representing
concepts, abstractions, actions, metaphors, and modifiers (Scott, 1994, p. 253)”, Cyr
(2009, p. 26) and Bu, Kim & Lee (2009) concur. The visual images created bear an
intricate structure that are heavy with meaning (Bulmer & Buchanan, 2006a; Cyr, 2009,
p. 26; McQuarrie & Mick., 2003; Pauwels, 2008, p. 79), (Phillips, 1997; Scott, 1994;
Shroeder, 2006). As such, they can be used and manipulated to craft arguments that can
be adjusted and altered to produce caustic images and the application of causal
knowledge (McQuarrie & Phillips, 2008). This manipulation creates Style which in this
research is defined as the artistic aspects of an image that can be influenced excluding
34
semiotics and advertisement content (McQuarrie & Mick., 1999). Style here, also
referred to as art style is created using the elements and principles of design (Brommer
& Kohl, 1988; Barnes, 2011).
Stylisation in images means that a picture can be altered so that it conveys not only
explicit messages, but implicit messages as well. However, a bias towards implicit
information is fundamental in creating the ability to carry a larger volume of nuances in
information. Implicit information moves away from the simple and ideologically banal
(McQuarrie & Phillips, 2005; Phillips & McQuarrie, 2014). However, it must be noted
that in the sheer complexity of images sometimes lies a danger. Meaning can be lost or
confused in intricate encoding of messages (Bulmer & Buchanan, 2006a). According to
Scott and Batra (2003), rhetoric in advertising, focuses on the ‘how’ (which is the
process, conventions and tools employed) as opposed to the ‘what’, (or the semiotics)
regarding image execution. In order to effectively study rhetoric, the “how” must be
separated from the “what” and each given prominence in its’ own right (McQuarrie &
Phillips, 2008, p. 13).
2.7 Related Literature
Photographs versus artistic renditions of advertisements
Miller and Stoica (2003) “compared the effects of a photograph versus two artistic
renditions of a beach scene contained in a direct-response print ad for a fictional
Caribbean resort island. [...] The two impressionistic artistic renditions included a
watercolour painting based on the photograph and an electronically altered version of
the photograph (Miller & Stoica, 2003, p. 11).” Of relevance to this study, they sought
35
to find out how the visual stimuli offered influenced the attention of the
advertisements’ viewer “along with the quantity and vividness of mental imagery
(cognition), and affective quality of mental imagery attitude towards the ad (affect)
(Miller & Stoica, 2003, p. 13).”
Results pointed towards artistic renderings of the beach scenes being “superior to the
photograph in drawing attention (Miller & Stoica, 2003, p. 11).” However, this did not
translate into effective message transmission. “The photograph was found to be better
for evoking greater quantity, more vivid and more affectively positive mental imagery
(Miller & Stoica, 2003, p. 11).” “The photograph was also superior in generating more
favourable attitudes towards the ad and the resort and stronger behavioural intent
(Miller & Stoica, 2003, p. 11).”
Cupchik, Vartanian, Crawley, & Mikulis (2009, p. 85) explain what happens in the pre-
attentive stage when global processing of a style in question occurs when images such
as those in the Miller and Stoica study are viewed. First order, visual elements
information such as colour, tone and texture is taken in. A focal attentive stage follows
next. “The physical/sensory information, derived from pre-attentive processing during
the first glance, provide[s] an expressive context within which more detailed features
are perceived.” At this point, second order properties which include not only the
elements but also the principles of design exemplified in the artwork for instance
complexity, symmetry, harmony and contrast are considered. After ten seconds, the
viewer begins to mull over personal memories (Cupchik, Vartanian, Crawley, &
Mikulis, 2009, p. 85). The viewer takes on all these stimuli and processes them
individually and collectively, considering each against and along-side each other.
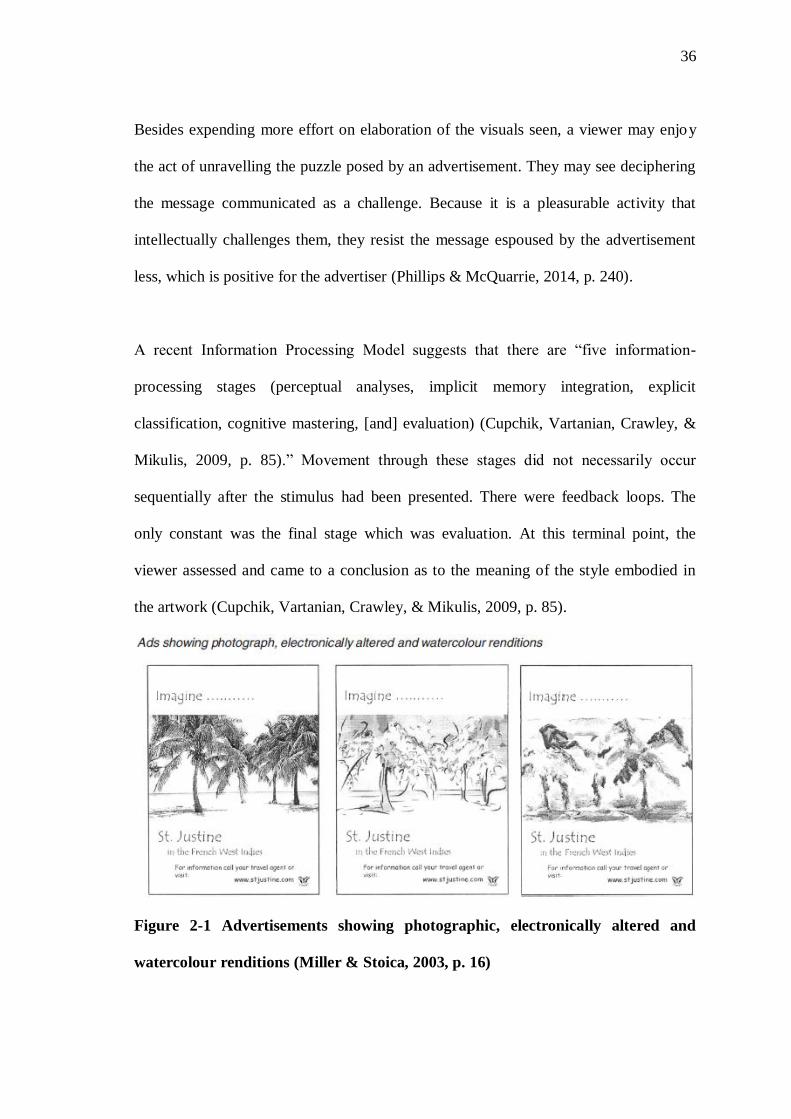
36
Besides expending more effort on elaboration of the visuals seen, a viewer may enjoy
the act of unravelling the puzzle posed by an advertisement. They may see deciphering
the message communicated as a challenge. Because it is a pleasurable activity that
intellectually challenges them, they resist the message espoused by the advertisement
less, which is positive for the advertiser (Phillips & McQuarrie, 2014, p. 240).
A recent Information Processing Model suggests that there are “five information-
processing stages (perceptual analyses, implicit memory integration, explicit
classification, cognitive mastering, [and] evaluation) (Cupchik, Vartanian, Crawley, &
Mikulis, 2009, p. 85).” Movement through these stages did not necessarily occur
sequentially after the stimulus had been presented. There were feedback loops. The
only constant was the final stage which was evaluation. At this terminal point, the
viewer assessed and came to a conclusion as to the meaning of the style embodied in
the artwork (Cupchik, Vartanian, Crawley, & Mikulis, 2009, p. 85).
Figure 2-1 Advertisements showing photographic, electronically altered and
watercolour renditions (Miller & Stoica, 2003, p. 16)
37
Denotative communication with pictures
A study carried out by Scott and Vargas (2007), like Miller and Stoica (2003) also
looked at stylisation as a variable. It subsumed parallel schools of thought, one which
proclaimed visuals as sensory data, and the other which promulgated rhetorical theory
and went further to offer an empirically supported alternative explanation that
combined and synthesized the two bringing forth a hybrid rational. The study was
heavily informed by one undertaken earlier by Mitchell and Olson (1981). Mitchell and
Olson scrutinized attitude towards the advertisement as their basic area of investigation.
The respondents were required to state what stylised images told them about a fictitious
brand of tissue paper. The three images presented comprising a realistic cat, a sunset
and an abstract picture. The brand attributes being tested for were softness, absorbency,
colourfulness, strength and price. The first, a cat was to denote softness and absorbency
to the respondents. The second, the sunset, was seen to represent the varieties of
colours the product was available in, and the third, an abstract was seen as representing
a low quality, low priced product (Mitchell & Olson, 1981; Scott, 1994; Scott &
Vargas, 2007). The results of these experiments demonstrated clearly that the images
shown to the respondents caused them converge on one strong message. This expressed
meaning was referred to as strong implicature. Several other secondary or tertiary
meanings may have been generated. These less dominant meanings are said to have
weak implicatures (Phillips & McQuarrie, 2014, p. 239).
In Scott and Vargas (2007), 31 different stylised images were used in the experiment.
They were to inform the rhetorical stream of thought “by demonstrating the potential
for a system of visual conventions and associations to signify at a” primary level the
units of construction used for creating writing (Scott & Vargas, 2007, p. 341). As such,
38
the focus was “on demonstrating that images can communicate simple declarative
statements (or even lists) of product attributes (Scott & Vargas, 2007, p. 341).” The
importance of this set of experiments is that they served as a basis from which
researchers’ opened the door to varying the artistic style of an image in experiments to
see if they had any effects on the attitude of an audience. Researchers moved into using
the same semiotic symbol, for example a cat, but varying the style that was used to
produce the image. So for example, they showed a cat drawn in a scraggly Halloween
style, the picture of a wooden cat with hard wooden surface texture, a cat drawn in the
cartoon style (Mitchell & Olson, 1981; Scott, 1994; Scott & Vargas, 2007).
By making reference to art styles that use artistic conventions to communicate, these
experiments were successful in communicating certain implicit messages to their target
audience. However, it must be remembered that artistic styles are guidelines that are
largely adhered to from which a designer can deviate to a certain degree, which is not
in itself defined. As such, style cannot be distilled or isolated into one, distinct formula
(Brommer & Kohl, 1988).
Miller and Stoica (2003) discuss vivid mental imagery which are strong and clear
images. In resonance with this, the Scott and Vargas (2007) study consider strong
implicature as one of the results of images that communicate.
Not all scholars are in agreement that visual images are capable of communicating, or
engaging a viewer in rhetorical discourse. In their view rhetorical discourse has to
consist of a reasoned, distinct, organised line of argument whose points are laid out
systematically. This can be and is often the case with verbal rhetoric, but it cannot be
39
said to be the same with visual rhetoric or images where the viewer is charged with the
task of creating and arranging the proposition that will lead to a conclusive statement. It
is said that visual images are capable of producing unconscious thoughts but not
conscious reasoned consistently consensual arguments. As such, it is stated that though
images can be used to communicate, they are not capable of engaging rhetoric and
simply offer a platform for a “visually manifested process (Smith V. J., Winter-Spring
2007).”
Professional use of Visual Rhetoric in Communication
Both moving and still advertisements in non-print media mediums have taken a lead in
the use of Pop Art and Expressionism, where they are touted as being highly successful
in communicating to millennials in Nairobi. Campaigns using alternative art genre
targeted at these age bracket are becoming more common. On the 13th of March 2017,
Commercial Bank of Africa announced a consumer banking service, named “Loop”,
targeting millennials. Eric Muriuki (Maina, 2017) who is the General Manager in
charge of New Business Ventures at the Commercial Bank of Africa posits that the
banking sector has over the years been effective at catering for the older customer. It
has however not done the same for the millennials, and when launched a product Loop
by CBA(Commercial Bank of Africa, 2018) pandering to their changing behaviour
chose to also change their communication strategy. They moved away from the
traditional and in its place opted for more relatable visuals that placed their customers
first (Maina, 2017). Other examples of this trend include campaigns carried out by
Telkom (Telkom Kenya Ltd., 2017), Blaze Grit (Safaricom Ltd., 2018), and Absolut
(Absolut, 2017; Absolut, 2018). However, lifestyle magazines targeted at female
millennials in Nairobi are as yet to follow this trend.
40
Though research on the perception of the millennial generation on images on print
media has not been carried out, opinion leaders in the field spoke about the
phenomenon. They were asked if in their opinion the Kenyan public who had no formal
art education were capable of understanding, deciphering and appreciating
advertisement messages in different art genre such as expressionism and pop art.
Celestine Wamiru an eminent Kenyan illustrator, cartoonist and animator said that they
would be incapable of doing this unless there was an effective campaign to familiarize
them with the “new” fresh representation. The nuances and attitudes in pop art would
usually be expressed and consumed in literacy-dependent visual media such as
Television, Posters and Billboards and product packaging, often with brief explainers to
guide the consumer to the intended message. It is highly likely that visually illiterate or
semi-illiterate audiences, who do not keep-up with latest trends in pop culture, will
miss subliminal messages. She went on to state that, however, younger urbanite
audiences, as represented by the female millennial generation in Nairobi, despite the
lack of formal art education were more likely to have the capacity to understand and
appreciate such art because they are exposed to trends and may be more receptive to
alternative forms of visual artistic expressions. Lilac Osanjo, a designer and
academician of many year standing posited that there was a real danger in that the
target audience may misinterpret stylised images. Teresa Lubano, an experiential
designer with years of experience postulated that all in all, most Kenyans may not
capable of perceiving most forms of visual styling, and as a result of this designers/
creatives minimised their use in the crafting of messaging to the wider audience – and
therefore mainly focused on the use of realism and thus photography.
41
When asked if they thought that using art genre in advertising images would in any way
contribute to the improvement of sales of consumer goods, they were of the opinion
that they would. Celestine Wamiru, stated, that it would work well, but only for a
selected category of products because of perception. She posited that certain
“conservative” products and brands may be negatively affected by an easy, fun-loving
and expressive approach that may be the look and feel artistic. This is because they are
usually associated with daring, audacious, free spirited persons thereby alienating a
section of would be consumers. This may not necessarily be a disadvantage as
millennials targeted here, are associated with having a sense of joie de vivre. Lilac
Osanjo was in agreement with this sentiment, saying that a product may actually choose
to ride on the narrative and use pop art or expressionism. Teresa Lubano goes on to
explain that there is a need to start moving away from the over reliance of pure
photography and explore different art genre in print media advertising. There is a need
to disrupt the established space and create advertisements that are use symbolism, and
are less literal, visually arresting, and memorable and are able to cut through the clutter.
She suggests that consistent, and beautiful application of new forms of art stylization
will in the long run help build brands. This will elevate advertising from a piece of
communication to a visual story. Teresa informs that we are seeing a mesh between
authentic African art forms and empathy in celebrating creativity as a stronger form of
communication than just pure stylization or the crafting of communication. She says
that this recognition is important. It will increase the Return on Investment for brands,
marketing & advertising agencies who need to endear the customer to purchase or try a
product. Creative need to be emotive and intentional in echoing consumer lifestyle and
aspirations
42
Art and Content and Manner
Hagtvedt and Patrick (2011, p. 1624) posit that artwork when viewed as illustrations
specific to products, must be considered context dependent. This is in converse to
artwork being viewed as a work of art, where it is context independent. This means that
a person looking at an image related to a product will infer the qualities found on the
illustration directly to the product. This is in congruence with the experiments done by
Scott and Vargas (2007), where the qualities inferred from the cat, sunset and abstract
are projected directly unto the tissue paper in the experiment.
Hagtvedt and Patrick (2011) postulate that art confers a notion of favourable qualities
unto that which it is associated with. In a study, participants were shown various art and
non-art images both positively and negatively attractive. The positively attractive art
images, regardless of whether or not they matched the context of the product they were
attached to, had favourable reviews. This was not the case with the non-art images. It
was suggested by the authors of the article that art has a positive effect on a viewer
because it is associated with that which is cultured. Hagtvedt & Patrick (2008) say that
a representative image conveys information. What elevates art unto a pedestal is the
manner also referred to as style, in which it is presented. This specialness is what
causes a viewer raise art unto a platform along with that which it is attached to. This
line of thought concurs with Miller and Stoica (2003). Hagtvedt and Patrick (2011) go
on to theorize the viewers’ mind-set play a role in determining how manner or style
will be interpreted.
43
Cultural factors in consumer interpretation of visually complex advertising
Bulmer and Buchanan-Oliver (2006b) study was “concerned with variations in
consumer interpretation of visually complex advertising due to non-identical cultural
factors between two disparate groups (Bulmer & Buchanan-Oliver, 2006b, p. 66).” The
study asked for detailed descriptions and feelings about, as well as opinions concerning
a set of three television advertisements that were fairly familiar to the respondents. The
respondents “were encouraged to interpret what the advertiser was trying to
communicate and to articulate (2006b, p. 60)” what the reasons for their opinion were.
The authors went into the study recognising that attracting the attention of a target
audience and communicating a message to them is a challenging task, particularly in
the face of many competing distractions in the environment. They also acknowledged
that pictures, though they may be viewed as universal, are subject to nuances of
interpretation influenced by a recipients’ cultural background. Their views were shaped
by the visual rhetoric perspective. The study “provided evidence that television viewers
drew on their culturally-sited knowledge of advertising texts and visual signs in order
to interpret commercials.” “They also demonstrated, [...] that pictures are not universal
(Bulmer & Buchanan-Oliver, 2006b, p. 66).” Their study conceded that visual images
in their current form were not capable of conveying precise messages and meaning.
They were viewed as visual writings that stimulate thoughts, that convey ideas, and
concepts, and that were capable of influencing and modifying thoughts. Images were to
be seen as such, and not directly compared with the current Roman alphabet system, to
which we are accustomed, in the way they conveyed messages. Reading images
involves a symbiotic relationship between cultural knowledge and what was presented
to or encountered by a viewer.
44
2.8 Research Gap
Hagtvedt and Patrick (2011, p. 1630) give an extensive and diverse set of future
recommendations as to the directions that research should take to further knowledge in
the field of visual rhetoric. They state that it is necessary that future research investigate
the perception and evaluation of an array of goods and services. Indeed, the effect of art
and different stylistic renditions in advertising may convey dissimilar perception and
evaluation when used to embellish advertisement meant for disparate goods and
services. They point out that the reaction to illustration style on images may be affected
by the ambience in which it is experienced as well as the viewers’ mood. Cognisance
must be given to the fact that this goes further to encompass a wide variety of factors
such as, temperament and even character of the viewer.
Hagtvedt and Patrick (2011, p. 1630) go further to discuss the role of style elements
which they refer to as manner. They query if the eye and mind are drawn to only
content displayed, or the style in which this content is displayed. They posit that the
“brush strokes, textures, or colour use (Hagtvedt & Patrick, 2011, p. 1630),” and in
addition, the combination of the specific elements used to build visual content,” may
have an effect on viewers’ perceptions and evaluation. This effect extends to the art
genre selected and the objects with which the illustration is associated with.
Bulmer and Buchanan-Oliver (2006b, p. 66), concur with Hagtvedt and Patrick (2011)
that the visuals and product expectations, a consumer has from one product to another
influence their reactions to the images use in advertising the specific products. They
recommend that research should look into the processes of acculturation. All these
45
studies should go into the realms of appreciating the processes that transpire in the
interpretation and comprehension of presented advertising visuals. They further
recommend that comprehensive studies should be undertaken with specific ethnic
contexts as a consideration. Ethnic context in their study take the form of divergent
international communities’ (macro). It must be noted that ethnic disparity can also be
viewed at a local level (micro), where a researcher takes into consideration differences
found among social classes, age sets, and levels of education.
Miller and Stoica 2003, propound that student samples collected under a laboratory
setting may be detrimental to the external validity of the results even though they
promote internal validity. They postulate that future studies should be carried out in
setting that is more realistic, and samples a wider variety of consumers (Miller &
Stoica, 2003, p. 19).
Scott and Vargas (2007, p. 353), seek to promote the concept that images are analogous
writing systems in their communication abilities and recommend that research along
this vein in pursued.
That marketers and advertisement designers in the West who used illustrations in their
advertisements showed that there was belief that art communicated to a target audience.
Though little research had been undertaken to show that this was the case, the
researcher questioned whether the same was true for advertisements targeted at
millennial females in Nairobi. Indeed, it was said that pictures could be read by a large
number of the populace who were regularly exposed to advertising (Mick & Politi,
1989; Scott & Vargas, 2007). But what remained to be seen was the degree to which
46
the different demographic groups in the study were able to read images. It was not
enough to know that they were capable of reading them, it was necessary to know who
was capable of comprehending what, and what they made of it. Only then could the
information be of applicable use. Literature showed that there was a gap in knowledge
and as such, this research sought to establish whether this was the case so as to avoid
working from experience and intuition as was the current practise in Western countries
(Hagtvedt & Patrick, 2008, p. 379).
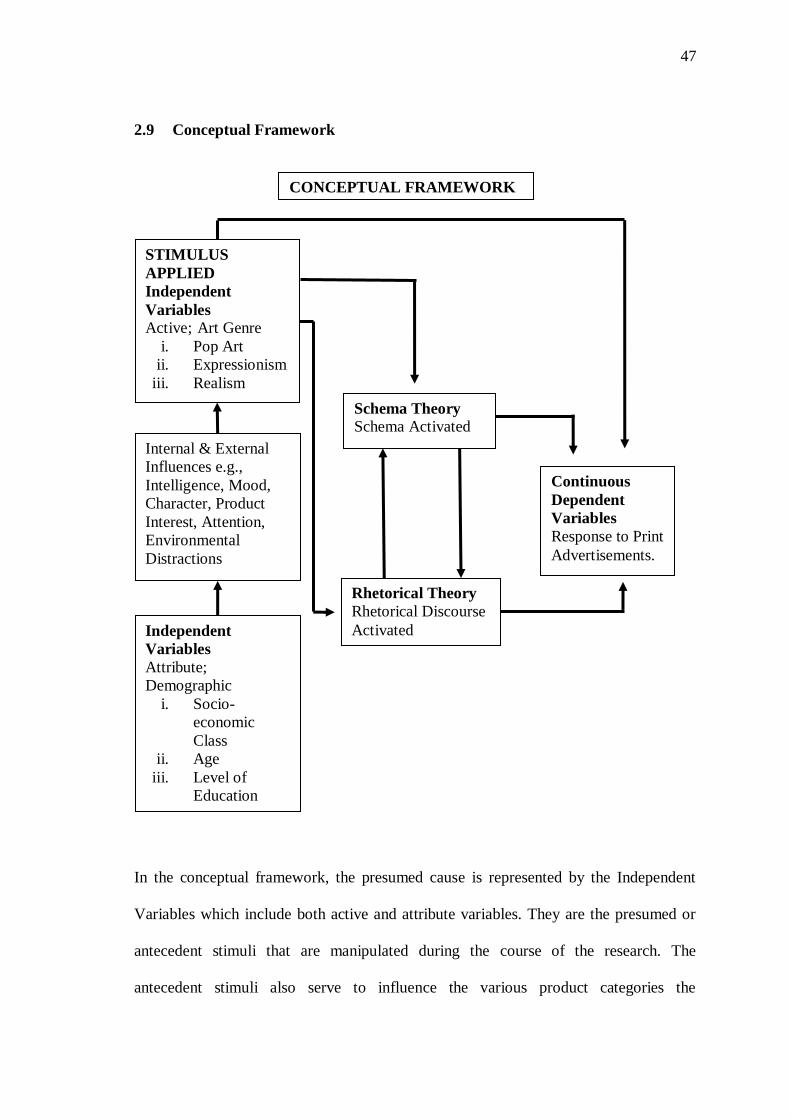
47
2.9 Conceptual Framework
In the conceptual framework, the presumed cause is represented by the Independent
Variables which include both active and attribute variables. They are the presumed or
antecedent stimuli that are manipulated during the course of the research. The
antecedent stimuli also serve to influence the various product categories the
Rhetorical Theory
Rhetorical Discourse
Activated
STIMULUS
APPLIED
Independent
Variables
Active; Art Genre
i. Pop Art
ii. Expressionism
iii. Realism
Schema Theory
Schema Activated
Continuous
Dependent
Variables
Response to Print
Advertisements.
CONCEPTUAL FRAMEWORK
Independent
Variables
Attribute;
Demographic
i. Socio-
economic
Class
ii. Age
iii. Level of
Education
Internal & External
Influences e.g.,
Intelligence, Mood,
Character, Product
Interest, Attention,
Environmental
Distractions
48
respondents are interested in. These, predecessors are further influenced by the
moderated and mediating variables that are represented by Intelligence levels,
temperament, and character and impact the Schema activated. The Schema activated is
additionally influenced by pre-existing knowledge of art style, and attention levels to
contribute to the presumed effects. These are represented in the (Continuous)
Dependent Variables which are the response to print advertisements.
2.10 Theoretical Framework
Many theories have been put forward to assist researcher elucidate the process of
decoding and decipher the communication process. Generally, researchers use
“information processing models” (Bulmer & Buchanan, 2006a, p. 54), to explain the
role of visual images in communication (McQuarrie & Mick., 1997).
2.10.1 Information-Processing Theories
Information Processing Theories are a series of diverse theories that all attempt to
explain exactly how human beings cope with sensory information. They are engaged in
studying both the media audience and individual activity. A theory related to
information processing models that fits well with decoding of images is the Schema
Theory. It works with the idea of schema which is a construct that engages our
cognitive structures. Constituent elements of cognition such as perception,
comprehension, and our ability to discern, among others, are employed in organising
knowledge about conditions, events and individuals that have been derived and
processed from prior experiences. This is used to process new information, as well as
pre-existing information that has been stored in our memory (Severin & Tankard,
49
2010). It can be viewed as a pre-set model or template with a pre-existing storyline that
we use to process information. It was initially developed by cognitive psychologist to
help elucidate how people access stored information to help scrutinise pictures and
evaluate them.
Cognitive structures are of importance when quick attention, cognition, analysis and
conclusions are called for when viewing images in the mass media. We receive a large
amount of information on a regular basis from a wide variety of stimuli around us. All
this is taken in by our sensory organs which include the visual, auditory, tactile,
gustatory and olfactory functions. Though our conscious minds may act to oversee
cognitive processes, only a small amount of the information that is cognitively
recognised actually registers in our conscious thinking minds. Most humans are not in
direct control of a large degree of their cognitive faculties (Baran & Davis, 2006). It is
easy to rely on these highly structured sets of patterns of information processing and
categorisation, as they give us a certain degree of conscious control over incoming
information. They are not perfect, but are adequate for dealing with the complexity of
information that requires decoding (Baran & Davis, Mass Communication Theory:
Foundations, Ferment, and Future , 2006; Severin & Tankard, 2010).
Strengths and Weaknesses of Information-Processing Theories.
Information-Processing Theories have a variety of pros and cons. Some of these may
change depending on whether it is a media audience or individual activity being
studied. Information-Processing Theories act to provide more definite details of what
may be considered normal activities. These theories have been said to concentrate too
much on the micro level, but can be seen as a distinct advantage if the research in
question concerns micro activities. They are easily rendered impotent if research is
50
done without an attempt to decipher any pattern in activities observed. On the converse,
it can be argued that by drawing attention to specific features or elements of an image,
undue importance is given to it, hence skewing their significance to the image as a
whole.
Because Information-Processing Theories involve categorisation and a systematic
ordering of events and information, they enable a researcher explore a wide variety of
media content unhampered by the volume of data or information they have to handle.
They are touted to produce dependable and uniform results across different but related
subject matter.
Information-Processing Theories are perceived as focusing excessively on cognition as
opposed to other elements that may contribute strongly to decoding of visual images
such as a subjects individual and social experiences, assumptions, motivation, attitudes,
emotions, mood, and other psychological factors (Baran & Davis, Mass
Communication Theory: Foundations, Ferment, and Future , 2006, p. 290; Severin &
Tankard, 2010).
It must be noted thatinformation processingtheoriesare not as straight forward and
coherent as other communication theories and tend to be open-ended and not yet fully
developed. They, so far, have not been able to explain precise media effects on a media
audience. They seek instead to articulate processes (Baran & Davis, Mass
Communication Theory: Foundations, Ferment, and Future , 2006)
51
Information processing theory “makes a number of implicit assumptions that suggest
there is nothing to be gained by a research program on visual communication”
(Janiszewski, 2008, p. 277). The theory assumes that people process all information in
the same way regardless of the source of stimulus, whether verbal, auditory, or tactile.
It assumes that since there is a bounty of research done in sphere of verbal and by
extension text based communication, then this too can serve visual communication
(Janiszewski, 2008, p. 278). This has resulted in a situation where the study of visual
communication in under-represented under this theory.
2.10.2 Rhetorical Theory
Traditionally, rhetoric was seen as related to that which was verbal or spoken (Kenney
& Scott, 2003, p. 19). Rhetoric did not spread to embrace visual communication as
visuals were viewed as of lesser consequence or inferior to verbal rhetoric (Hill &
Helmers, 2004, pp. 203 - 204). Increasingly this was challenged, and premises put
forward that rhetoric embraced a wider range communication (Hill & Helmers, 2004),
(Kenney & Scott, 2003).” Lectures by Ferdinand de Saussure and also the writings of
Charles Peirce, generally classified pictures as “iconic” or “indexical” signs and
suggested that they were capable of communicating pre-determined messages
sanctioned by social convention. These were the beginnings of the thinking that images
were a form of visual rhetoric (Kenney & Scott, 2003). More recently this premise is
being supported by a new crop of authors (Olson, 2007).
Rhetorical Theory is interpretive in nature and is viewed as one parties attempt to
influence another by designing, packaging and encoding communication materials that
are to be transmitted to gain effect. Rhetorical Theory is not formed by a single
52
prescriptive or descriptive proclamation that is suited to all generic rhetorical situations.
Rhetoric as translates to the visual, was not the production of a series of objective
images, or the creation of theory, but preferably an image “that needed to be interpreted
and evaluated in” a specific context (Lucaites, Condit, & Caudill, 1999).” According to
Sonja Foss, “visual rhetoric as a perspective is not a theory with constructs and axioms
that describe specific rhetorical components of visual imagery; it is not composed of
certain kinds of content or knowledge about visual imagery,” (Foss S. K., 2005, p.
145). Instead, it is a system of thought from which information emerges on
communicative artefacts and visual rhetoric as a standpoint; “a critical-analytical tool
or a way of approaching and analysing visual data that highlights the communicative
dimensions of images” (Foss S. K., 2005, p. 145). Each rhetorical situation was to be
evaluated on its merit taking into cognisance the tenets that governed the theoretic
rhetorical schools of thought. The act of designing a message includes consideration of
the meaning therein and the argument it holds, the sequence in which the argument or
information is structured, the audiences’ perception and reception of the material to be
conveyed, the approach that will be employed to deliver the message and the way or
style in which the narrative will be delivered. The person(s) who craft the message are
aware of the socio-cultural elements that affect the delivery of messages to its target
audience and the traditional methods and conventions and vocabularies used to
communicate (McQuarrie & Mick, 1992; Mick & Buhl, 1992; Scott, 1990; Scott, 1994;
Stern, 1990). If a theory of visual rhetoric were to be formulated it can be applied to
visual communication as it adheres to all of the requirements of rhetoric as listed above,
even though rhetoric was not conventionally crafted to represent that which is visual.
53
A visual is that which has to do with all that pertains to our endeavour to represent and
make sense of the world around us using our sense of vision. It is manifested by the
materials, tools, items, and objects we use in this attempt. Visual creations and artefacts
may include but is not limited to items such as photographs, television, computer
monitors and other media. Therefore, visual rhetoric is that which would pertain to the
use of these to communicate. As the Rhetoric Theory was not developed for visual
images, but for verbal communication, certain shortcomings are evident concerning it
and the explanation of events exclusive to visual communication. Research and studies
in the area are as yet to produce a coherent theory (Foss S. K., 2005). This endeavour is
underway in writings by researchers such as Bruce Gronbeck and Sonja Foss (Hill &
Helmers, 2004; Olson, Finnegan, & Hope., 2008).
However, McQuarrie and Mick (1999)posit that the rhetorical theory is well suited to
producing specific predictions that can be used in experiments that delve into how
stylistic variation can influence advertising visuals.
Strengths of Rhetorical Theory
The theory of rhetoric contains an appropriate basis for rhetorical communication and
forms an elementary basis for evaluating visual communication, though still
rudimentary. Rhetorical theories accommodate contextualisation when evaluating a
message. Rhetorical theories by their very principles, accept multiple interpretations of
and formulations in a visual message. This is essential to the satisfactory
comprehension of visual images as used in communication. It gives the rhetorical
theory a distinct advantage over empirical laws based theories.
54
Weaknesses of Rhetorical Theory
The Theory of Rhetoric as it stands was developed for verbal communication. Some
theories used to evaluate rhetorical messages are not exploratory enough to reveal
dynamics behind a message and the cycle of communication behind it, particularly as
involves visual communication.
2.10.3 The Copy Theory
Mention must be made of the Copy Theory which is the converse of the Rhetorical
theory. It is of importance as it is the theory that is widely touted as the de facto theory
in regards to images in advertising. The Copy Theory postulates that pictures represent
reality as it is, and are natural (Scott, 1994; Bu, Kim, & Lee, 2009).
Pictures, paintings and carvings done in Western countries traditionally aimed to
reproduce reality as accurately as possible. This pursuit is known as mimesis. It was
and still is highly valued in the western world and increasingly in the developing world
as well due to the influence of the western art education systems widely adopted by
developing countries, which promotes this art form. Mimesis found its roots in
Classical Greek works and continued as a discipline through the Renaissance, Baroque,
Neoclassic, and Romantic and Realistic era, only beginning to be challenged by the
Impressionists in the Western World. Belief in mimesis was solidified with the
introduction of the ‘Rules of Perspective’ during the Renaissance when the view was
taken that they represented exactly how reality looked in two-dimension (Brommer &
Kohl, 1988).
55
Conventionally mimesis was the western idea of reality. People from other cultures
traditionally viewed their reality in systems of representation that did not include, or
were not exclusive to mimesis. This has a heavy bearing on what can be defined as a
realistic image in non-western cultures (Scott, 1994).
Strengths and Weaknesses of the Copy Theory.
At best, the degree to which a picture can be said to represent the object its visual
qualities copy is difficult to judge. At worst, it can bear resemblance to the object it
seeks to imitate visually even though there is no similarity between them. This is due to
set social conventions of image representation. It became evident in time that the
western traditional art which glorified mimesis was not necessarily understood by
inhabitants of non-western cultures. Some communities translate or read into visuals
messages that may not necessarily be intended by the image designer. As such, it is
now evident that if communication with an image oriented audience is to be optimal,
their traditional understanding of visual conventions must be studied and understood. If
a pictures’ decoder is not capable of verifying what a picture seeks to represent without
prior knowledge of what the encoder sought to depict, “then the claim that pictures are
interpreted by recognizing what they resemble, independently of what they represent,
has [to] been relinquished” (Lopes, 1996, p. 19).
2.11 Theory for Consumer Response to Advertising Images
In (1994) Scott critiqued and analysed existing research on images and published an
article that moved away from the traditional considerations of visual images and
advanced the need for a theory of visual rhetoric. Scott critiqued the Copy theory and
posited that visuals were a “convention-based symbolic system” (Scott, 1994, p.
56
252)that were processed cognitively and were by extension connotative, rather than
denotative representations. Scott postulated as a theoretical framework that images are
a multiplex form of visual rhetoric. In time other researchers such as Smith (Winter-
Spring 2007), promulgated the same. Smith advanced the explanation that in an
advertisements’ image, rhetoric could be expressed as an enthymeme argument. As
such, rhetoric became an object that could not be looked at and studied in isolation. It
was a process that was to be understood, a model that could be used, and an outlook
that could be adapted and applied in discourse with visual images. The image gave the
viewer an entry proposition. The viewer then supplied a second proposition that gave
rise to the final conclusive proposition. This second proposition was often excluded.
This was intentional. This missing proposition which was willingly supplied by most
viewers was often implicit and loaned to giving the visual image rhetorical credence.
The proposition was coloured by the viewers’ socio-cultural background. Offering an
implicit proposition drawing the viewer into the visual discussion, this ensured that
their levels of engaged elaboration were high. Because the viewer was involved in the
process of formulating the conclusion based on their existing personal truths, they were
more likely to believe the outcome of the interaction.
According to Aristotle, an enthymeme, “is an argument that is drawn from premises
that do not need to be stated, since the hearer supplies it (Smith V. J., Winter-Spring
2007).” The encoder of an image, though they may hope or assume that an audience
member will utilise a premise as per their design, has no control over what the audience
member will insert and use as their proposition. An encoder can only try to limit the
range of selected propositions by employing tools of visual rhetoric that consider
57
outlooks in the context of the audiences’ culture and integrating them into their visual
message design (Smith V. J., Winter-Spring 2007).
Scott went on to illustrate that advertisers sometimes presented a figurative rhetorical
argument in the way of a trope, that could be demonstrated as a metaphor, simile or in
other rhetorical forms. In the illustrations employed in this research, the images could
be viewed as metaphors. The selected artistic style was directly applied to the images
under question. What then remained to be seen was if the respondents would engage in
the level of metaphorical thought necessary to manifest the thoughts that the images’
decoder intended. (Scott, 1994)
2.11.1 Information Processing and Schema Theory
The schemata theory seeks to signify how knowledge is denoted. A schema is a data
structure that stores a broad variety of concepts and keeps these in memory.
(Rumelhart, 1980, p. 34).
A schema holds what is seen as the standard module of knowledge that directs a
specific concept. This module represents what generally transpires with an object, in an
event, situation, or sequence of events. It is a generic module that can be applied to
tangible or intangible items or events. However, it must be acknowledged that its tenets
are not carved in stone. “A schema theory embodies a prototype theory of meaning.
That is, inasmuch as a schema underlying a concept stored in memory corresponds to
the meaning of that concept, meanings are encoded in terms of the typical or normal
situations or events that instantiate that concept (Rumelhart, 1980, p. 34).”
58
Rumelhart (1980, pp. 33 - 34) writings on schemata are related to linguistics and
reading, but can be applied to visual communication. He says that, “… schemata truly
are the building blocks of cognition. Schemata are employed in the process of
interpreting sensory data (both linguistic and non-linguistic), [and] in retrieving
information from memory […].” (Rumelhart, 1980, pp. 33 - 34). It can be said that the
main function of schemata as far as images are concerned, is to aid in the ‘interpretation
of” a visual image (Rumelhart, 1980, p. 37).” He goes on to explain that it is because
schemata are capable of a very wide variety of deeds that schemata are as yet to be
comprehensively explained and understood.
In order to understand an advertisement image, it is necessary that the correct schema is
picked to help in the construction of comprehension. Sometimes, a viewer fails to
correctly understand or decode the message in an image. According to Rumelhart,
(1980)the reasons this may occur vary. First, the viewer may not have or may not select
the appropriate schemata. Secondly, the viewer may have selected appropriate
schemata, but the clues given by the visual encoder may not be appropriate or sufficient
quality or quantity to aid comprehension of an image. Thirdly, sometimes a viewer sees
and interprets an encoded image to the best of their ability and understanding, using
what they identify as the correct schema for the task at hand. However, the viewer may
have misinterpreted the image in the eyes of the encoder, who did not intend to
communicate the message as interpreted by the decoder.
Seeking out precise design variables and by extension, their attributes, helps identify
specific cues that distinguish explicit situations that are covered by a particular schema
(Rumelhart, 1980, pp. 34 - 35). These variables serve to delineate a range of values that
59
they represent. These values cannot be quantified precisely. It must also be noted that
what any variable represents, is liable to change or be slightly altered depending on
what other variables are present in an image. There can be changes instigated to both
the variable and values without rendering the schema void (Rumelhart, 1980).
Rumelhart suggest “it is perhaps most useful to think of variable constraints as forming
a kind of multivariate distribution with correlations among the several variables”
(Rumelhart, 1980, p. 36).
Advertisers are aware that with time viewers become indifferent to advertisements that
use established communication, procedures and strategies. They then become more
difficult to reach. They are therefore often on the quest to find new ways to garner the
attention of the target audiences. One of the ways they do this is by creating ‘schema
incongruity’ which acts to jolt the viewer back to exercising elaboration(Callister &
Stern, 2008, p. 138).
2.11.2 Other Theories employed in studying consumer response to images
According to Miller and Stoica (2003) the hierarchy of effects model was used in their
study because it explained “the sequence of cognitive and affective responses
experienced by consumers as they process advertising information (Miller & Stoica,
2003, p. 12)” from first viewing of the advertising communication to purchase of the
product. According to Miller and Stoica (2003) mental imagery “is a cognitive process
in which perceptual information is represented in working memory [...] and involves
the activation of concrete representations of the beliefs and feelings related to personal
experience (Miller & Stoica, 2003, p. 12).” This school of thought is very akin to what
is discussed by authors who promulgate the workings of schema. However, the
60
Hierarchy of effects model is used mainly in marketing communications research that is
not overtly directed at visual rhetoric. As such, it would not serve this research as well
as a theory that manifests the tenets of visual rhetoric.
2.11.3 Theory of Visual Rhetoric
Scott and Vargas (2007) discuss theory being influenced by stimuli that is emitted
either as sensory data or communicative artefacts. They claim that prior research
proves that that advertising symbols have been shown to function as semantic as
opposed to sensory (Scott & Vargas, 2007, p. 343). Their article takes as point of
departure Mitchell and Olson’s studies where the “objective was to test Fishbein’s
theory of attitude formation (Scott & Vargas, 2007, p. 344).” However, their interest
did not lie in proving or disproving this theory, it fundamentally lay with proving the
varied and intense communicative qualities of images based on context and stylisation
of an image. The experiments conducted successfully prove empirically, that it is
possible to communicate predetermined information in a predictable manner using
pictures. This supports the rhetorical school of thought and by extension the theory of
visual rhetoric as suitable for research in visual communication, as opposed to theory
that promulgates sensory stimuli. Indeed, in support of this, Scott and Vargas further go
on to conclude that they “would like to see the treatment of pictures as sensory data
atrophy in the literature (Scott & Vargas, 2007, p. 353).”
The view that use of the Visual Rhetoric Approach is ideal for studying visual images
and variations that may arise due to cultural differences is further supported by Bulmer
and Buchanan-Oliver. It supports the interpretation of advertisements, and the
understanding of how meaning is given to them and inference conferred by the viewer.
61
In their study of disparity in interpretation of images on television among dissimilar
cultures, they recommend its use as it makes it possible to unearth “differences in
consumer interpretation of visually complex advertising (Bulmer & Buchanan, 2006a,
p. 58).”
2.11.4 Art Infusion Effect
Hagtvedt and Patrick (2011, p. 1625) engage in a study that uses the Art Infusion Effect
as a guiding theory. It seeks to promulgate that art images bestow a complimentary
effect on that with which they are associated. The influence is not based on the content
of the image, but simply on the fact that the image has been classified as art by the
viewer. This it is explained is usually due to the manner of the image. Manner is
defined as structural qualities of the elements and principles of design as employed in
the image. Though this theory considers both content and manner that are fundamental
to the research at hand, the authors largely seek to explore the complimentary effects of
art on consumer goods and not the mechanics of visual image interpretation. As such,
the theory falls short of what is required to methodically explore visual image
elucidation in advertising.
2.12 Defining the Key Variables
Miller and Stoica (2003) present three visual independent variables. They fall under the
aegis of the art genres of realism, expressionism and impressionism. This is closely
linked to Scott and Vargas, (2007) who employ a wide variety of art genre both in the
second and third dimensions and cover realism, impressionism, expressionism, pop art,
abstract art, and cubism, among others. Scott, (1994) is a soliloquy extolling the virtues
62
of creating a theory of visual rhetoric, hence does not lend itself to the use of
independent variables. However, similar to Scott and Vargas, (2007), it uses several
exemplars in a wide variety of art genres to elucidate its’ doctrine. Bulmer and
Buchanan-Oliver, (2006b) besides the use of visuals, employ demographics segregated
by nationality. Hagtvedt and Patrick, (2011) follow a similar path, segregated by age
and gender.
2.12.1 Art style and expression
Styleis read by observing the characteristic handling of the elements and principles of
art and design as used in the image (Barrett, 2005). Academic rhetorical pursuits seek
to find ideal conventions and systematized ways to arrange images so that they convey
a message as intended by its encoder. Systems employed in this research use set content
material without necessarily altering the existing semiotic substance and do not
consider written material. The rhetoric of the selected style is supreme in the
communication exercise of this study and not the semiotic content (McQuarrie &
Phillips, 2008).
Expressionism
Expressionism is an attitude rather than a style and is often used in advertising images
to evoke specific attitudes. It embraces several styles of art such as Fauvism, Cubism
and Abstract Art. It emphasises subjectivity over objectivity in creating visual images
that represent an event or object. Expressionists are concerned with communicating
emotions, thoughts and ideas rather than reproducing a copy of the object at hand.
Expressionist artists are not true to the form of an object because they consider it
secondary to expressing emotion. This is ideal for contemporary commerce and
advertising, branding goods that have become commodities due to the proliferation of
63
similar competing items on the market to differentiate them and communicate
intangible qualities of products. In order to convey a message, strong, non-naturalistic,
intense colour, exaggerated brush strokes with strong movement, distorted form and
shape are used. This contributes to the quest to portray inner, often cosmic feelings,
done with a spirit of feverish haste (Bassie, 2012; Brommer & Kohl, 1988; Smith K.
A., 2014).
Cartoon in Pop Art
Cartoon art has been produced under the aegis of Pop Art style, which can also be
described as popular art that is transient in nature. Pop art fuses a variety of art styles,
embracing Dadaism, Neo Dadaism, Surrealism, and Abstract Expressionism
movements among others. From these, Pop Art gains a sense of rebellion, spontaneity,
and conceptual freedom. Cartoons tend to be objective in their production of visual
images. They edit the elements of the object illustrated, simplifying and abbreviating it,
yet leaving it at a state in which the original item is still recognisable. The images
portray hard lines, are flat, simple in nature, and employ bold, flat colour. Perspective is
often collapsed. Lucie-Smith, (1997), posits that cartoons are removed from their
subject matter, embracing a distant stand and do not get involved in the emotionality of
the issue to be tackled or portrayed.(Lucie-Smith, 1997, pp. 152 - 154).
The low costs of production of cartoon material, often promotes the thought that it is
cheap, cheery, attainable, easily accessible and expendable, unwittingly transferring
this impression to the goods it is used to advertise. These qualities make it ideal for
advertising homogenous, commodified fast moving consumer goods. Cartoons are
often used for campaigns targeted at a young, vibrant audience, including toddlers,
64
children, teens, and young adults, though their appeal may be wider (Lucie-Smith,
1997).
Realism and Photography
Although there are a myriad ways of creating realism and photographic reality, here we
look at photographic reality as captured by the camera, with the use of film or light
sensitive material (Kjeldsen, 2012, p. 240). Onlookers seldom consider that much as
they capture what is laid out in front of them, photographic images can be manipulated
to express the encoders’ views and messages, as it is not a purely mechanical process.
Manipulation of photographic images can be achieved through a variety of techniques.
Selecting an angle that acts as a vantage point or an angle that supports the message to
be communicated is one among many methods. Framing composition to be
photographed thus editing out what the encoder does not want included as part of the
communication is another. Strong framing can be achieved by connecting elements
within a composition by coordinating their colours, shapes, forms, among other
elements of design. Weak framing within a composition on the converse can achieved
by creating visible boundaries within a composition by for example leaving in or
exaggerating white space between elements or objects in the composition. Lighting can
be controlled to influence the mood of the image and show or disguise unwanted
features in the image. Focus, a technique used to define the depth of the images’ field
of vision and can be used to influence what can or cannot be seen, or place emphasis on
a particular aspect of the image. Composition, also known as salience which is the
arrangement of the elements in the images’ composition can be designed to influence
emphasis among other aspects of an images message, downplay or bring to prominence
elements within the composition. Manual manipulation, which involves the direct
65
changing of visual elements on an image, is also particularly common with photographs
perceived as real in advertising (Baker F. W., 2012).
The use of photography as a medium in advertising in the print media is widely
acclaimed by marketers as a means to portray their commodities in a strategic light.
2.12.2 Demographics
Of the studies looked at, the vast majority chose to work with university students as
respondents. This is because they form a readily accessible source of respondents.
They can also be argued to be homogenous to a degree that allows for more stable
results. Detailed demographic breakdowns were mostly not a consideration. Only two
researchers segregated their respondents. Sandy and Buchanan-Oliver (2006b, p. 62)
segregated their respondents who were university students by the demographic of
nationality. Hagtvedt and Patrick (2011, p. 1626), chose to analyse their results taking
into consideration the age and gender of the respondents who were also university
students.
Several researchers believe that demographic segmentation alone is not enough, though
it can be used as an introduction into gaining an understanding of consumers’ choices
(Amine & Smith, 2009). To create insightful segregation of a consumer base, divisions
in spheres such as geographical, psychographic and behavioural segments are ideal
(Silayoi & Speece, 2007, p. 1496). Silayoi and Speece (2007) believe that “often the
standard ways of segmenting fail to yield very useful results in developing countries
(Silayoi & Speece, 2007, p. 1496).” Further to this, postmodernist argue that modernist
market segmentation no longer sufficiently serve to understand and market products
66
successfully. They posit that the consumer market has become highly fragmented due
to changing consumer realities resulting in “multi-dimensionality, unpredictability,
inconsistency (Amine & Smith, 2009)” in the consumers’ lifestyle, thoughts and habits,
and by extension, consumption patterns. The unique, diverse, plural, and idiosyncratic
nature of the current consumer defies segmentation as it has been practised and brings
into question whether or not it will be of benefit in this study.
The research at hand utilised demographic segmentation to stratify data collection, the
respondents were classified according to age, social class, and level of education.
However, as much as the researcher included these variables in the study at hand it,
must be noted that “there were no differences when gender and age were included as
covariates in the analysis” of Hagtvedt and Patrick (2011, p. 1626). The researcher
opined that it was unfit to make assumptions that the same would apply and that it was
necessary to investigate whether or not this would be true for respondents in Nairobi as
well. An element of geographical segmentation is included by dividing Nairobi into
eight areas from which data is collected. The researcher believes that psychographic
and behavioural segmentation would benefit the study. However, as is the case also for
the articles observed in the study, this is not possible. The financial resources and by
extension the effort and time required to profile respondents are not within the reach of
the researcher.
2.13 Operationalisation of Stylistic Properties in a Visual Image
Considering the stylistic properties of advertisements independently still remained a
valuable way to go about investigating them. The provision of information of how to
67
encode and manipulate images using single elements and principles of design made for
easier comprehension and work for the message encoder, rather than information on
amalgamated elements and principles of design. (Wang & Peracchio, 2008). Rhetorical
differentiation was more acceptable as a scientific discipline if the elements of design
in images could be studied as constitutive properties of a whole. The goal of
rhetoricians should therefore ideally have been to create classification systems that
were like the periodic tables found in chemistry, which offered predictive and
descriptive accounts of the properties of matter (McQuarrie E. F., 2008, p. 262). With a
well-structured table it became easier to dissect an image and independently manipulate
the individual elements within it in a controlled manner (McQuarrie E. F., 2008).
Computer classification systems are integrally algorithmic and as such mechanical in
nature. This can be viewed as an anathema to creativity, rising from the assumption
that, that which is creative is subjective. However, mathematical systems can be beheld
asadvantageous over humans in scrupulously selecting creative solutions bereft of bias
caused by acculturation, notoriously recognised as common sense reasoning. A
framework would serve as the formalised capturing of creative associations. A Word to
Image-Based Search System would generate creative perceptual metaphors using
linguistic tags to match images (Indurkhya , Kattalay, Ojha, & Tandon, July 7-9 2008).
However, it must be noted that stylistic properties in images, due to the very nature of
images cannot occur independently. In order to propagate an image, the basic elements
of line, shape and colour must all come together, as an integrated cardinal entity.
Considering the number of the elements and principles of design, it quickly becomes
apparent that it is possible to create an enormous number of possible combinations of
these that can be used in constructing of images. Designing research that would then
68
scrutinise the contributory effects of the elements and principles of design on each
other would then involve the collection of vast amounts of data, data analysis, results,
conclusions and recommendations that may not be profitable to its’ proposed
beneficiaries. As such, images can only practically be dealt with as a whole which are
traditionally classified under various genre or styles.
It must be noted that this study is not a study of fine art. It looks exclusively at
communication via designed artefacts as embodied by images in print media. These
images differ from those exclusive to fine art in a number of ways. They are created to
communicate a specific message to a specific target audience. Pure art, though it may
consider some form of communication, does not have this as its core goal. The encoder
or artist can and may choose to produce art for an alternate purpose such a medium
purely for self-expression.
Miller and Stoica (2003, pp. 16 - 17) measured imagery quantity using a bipolar ratings
scale with three points, with indications “that many, very few and a lot of images came
to mind when they thought about either service attributes or benefits. The vividness of
the imagery evoked by” the images “was measured with five [...] semantic differential
items (vivid-vague, clear-unclear, sharp-dull, intense-weak, well defined-fuzzy)” on a
seven point bipolar ratings scale. Scott and Vargas 2007 presented the research
participants with “five standardized question stems (2007, p. 345).” These were
measured on a bipolar ratings scale with a four point response option. “Finally, an
overall evaluation question with a seven-point response scale was presented (2007, p.
345).” Hagtvedt and Patrick elected to evaluate their test products on a “five 7-point
semantic differential scales (unfavourable–favourable, negative–positive, bad–good,
69
unpleasant–pleasant, dislike very much–like very much) (2011, p. 1626).” Bulmer and
Buchanan-Oliver (2006b) carried out qualitative research, employing procedures
standard to this method of research such as recording discussions, taking notes, coding,
identifying key works and synonyms, and using software to further refine the analysis
of data collected. This study employs both the quantitative and qualitative methods of
measurement as used in the research above as they can be seen to have yielded
satisfactory results.
The Miller and Stoica 2003, study deploy experimental research that utilise quantitative
methods of research. Attention-getting qualities of images were evaluated using chi-
square tests. Frequencies, means, and standard deviations were use to express
descriptive statistics of the dependent variable. “Differences across the treatments on
the dependent variables were assessed with MANOVA (2003, pp. 17 - 18).” Scott and
Vargas (2007, p. 345) choose to subject mean scores in their experimental research “to
univariate t-tests examining differences from the midpoint of the scales.” They also
engage in using interviews for qualitative research. In their experiment governed by the
tenets of quantitative research, Hagtvedt and Patrick (2011, p. 1626) elect to conduct
“an ANOVA with fit and salience as the independent variables and product evaluation
as the dependent variable.” Bulmer and Buchanan-Oliver (2006b) engage the use of
qualitative research methods. Emanating from these research methods, having been
deployed to successfully conduct research under the aegis of a similar field of topics,
the study at hand elects to use qualitative research methods and the analysis of
variance. The research methods used in the studies in the literature review, demonstrate
the importance of quantitative and qualitative research methods and highlight both their
contributions to the research of visual rhetoric. The combination of the two methods is
70
ideal in the creation of a sensible logic of inference. Scott and Vargas (2007) who use
mixed methods demonstrate the complementarity of the same. It is acknowledged that
an integrating framework of different paradigmatic approaches, may present
philosophical obstacles, but the advantages gained from the results accrued far
outweigh the disadvantages.
2.14 Millennial Generation
The Millennial Generation also referred to as Generation “Y”, Generation Next, Net
Generation, or Echo Boomers among many other names. Female millennials were
selected as the focus of this research, as they were the target market of the magazines
studied. The Generational change (Valentine & Powers, 2013) dictates that marketers
re-think the way they are addressed in visuals presented in the print advertising media.
This generation are the best educated generation to have entered the workforce in
Nairobi. This generation has grown up not only with print advertising media, but more
fundamentally, in the digital era which has indelibly affected and influenced their
perception of images in all other media (Valentine & Powers, 2013). They tend to mix
and match media and move between a variety of image types. The millennial
generation continuously encounters impressive, well thought out visuals and easily
interact with them. They like brash graphics (Djamasbia, Siegelb, & Tullisb, 2010).
Their exposure to a wide variety of images pandering for their attention predisposed
them towards striking visuals that catch and hold their attention.
Gender affects elaboration of printed advertisements. It has been said “that women are
more visually and intrinsically motivated than men” and are more accurate at decoding
“the nonverbal cues in an advertisement, (Valentine & Powers, 2013, p. 600)”
71
preferring more complex advertisements, as opposed to men. However, the question
begs as to whether men are equally motivated but less verbally expressive. Since the
only way to collect data on this phenomenon is by verbal means, men may be
motivated but unable to or not accustomed to verbally expressing their thoughts and
emotions (Valentine & Powers, 2013, p. 600).
2.15 Professional use of Rhetorical Theory in Communication
The Absolut Vodka visual bottle advertising campaign began in 1981 and has been
touted as a premier campaign that used art style in some of its advertisements as a
means of communicating a succinct marketing message (Hagtvedt & Patrick, 2008, p.
379). It is a campaign that brought together art and images of the Absolut bottle in a
witty manner. The encoder of the print advertisement message was charged with
designing an image that expressed a tangible or intangible quality of the product that
was supported by only two words of copy (Hagtvedt & Patrick, 2008, p. 379; Wharton,
2013). The campaign utilised a variety of art styles, included among them were
Expressionism and Pop Art, and Realism. The consumers’ imagination and sense of
creativity and being in a sense a co-creator of the message stimulated, challenged,
excited, educated, entertained, and amused them, among other emotions, depending on
what the image portrayed. The memorable, successful award winning campaign was
created by the advertising agency Tragos, Bonnange, Wiesendanger, Ajroldi, (TBWA).
It is renown not only for its longevity, but also for innovative designs and the jump in
sales achieved by Absolut Vodka. Sales went up 14,900% in fourteen years from 1981,
“from 10,000 cases in 1980 to nearly 5 million as the new millennium began
(Gianatasio, 2015).” This increase in sales like all others takes into account that though
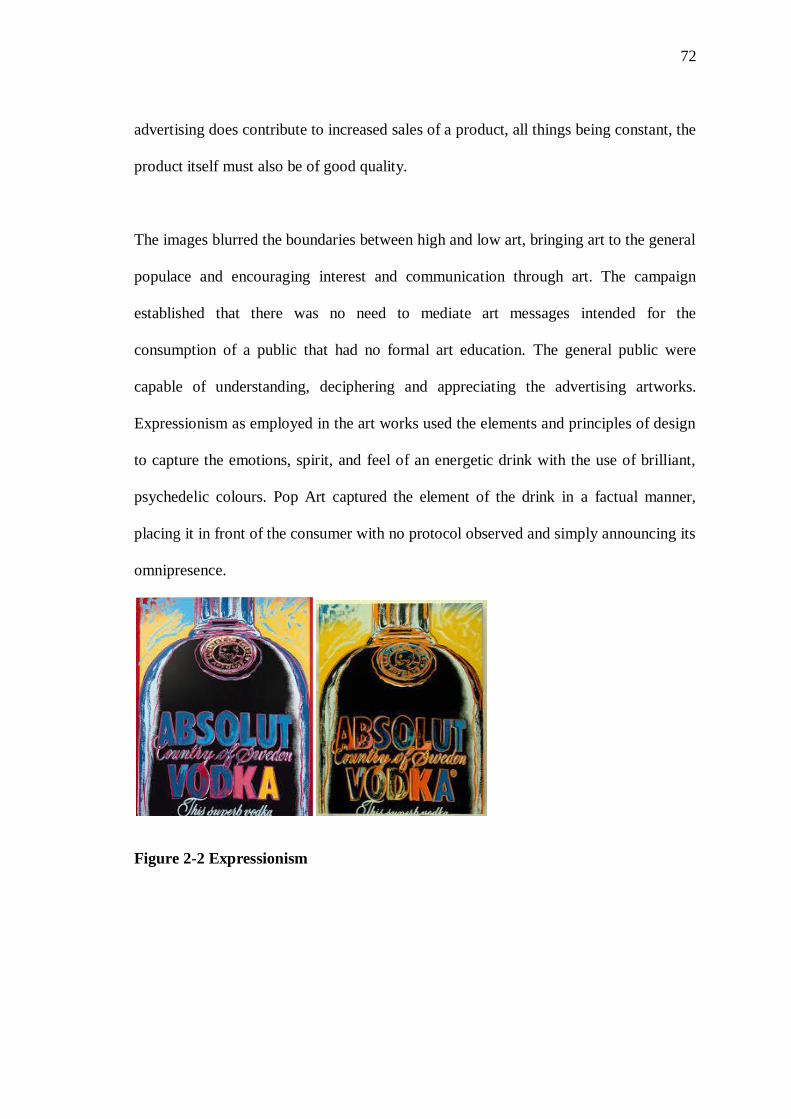
72
advertising does contribute to increased sales of a product, all things being constant, the
product itself must also be of good quality.
The images blurred the boundaries between high and low art, bringing art to the general
populace and encouraging interest and communication through art. The campaign
established that there was no need to mediate art messages intended for the
consumption of a public that had no formal art education. The general public were
capable of understanding, deciphering and appreciating the advertising artworks.
Expressionism as employed in the art works used the elements and principles of design
to capture the emotions, spirit, and feel of an energetic drink with the use of brilliant,
psychedelic colours. Pop Art captured the element of the drink in a factual manner,
placing it in front of the consumer with no protocol observed and simply announcing its
omnipresence.
Figure 2-2 Expressionism
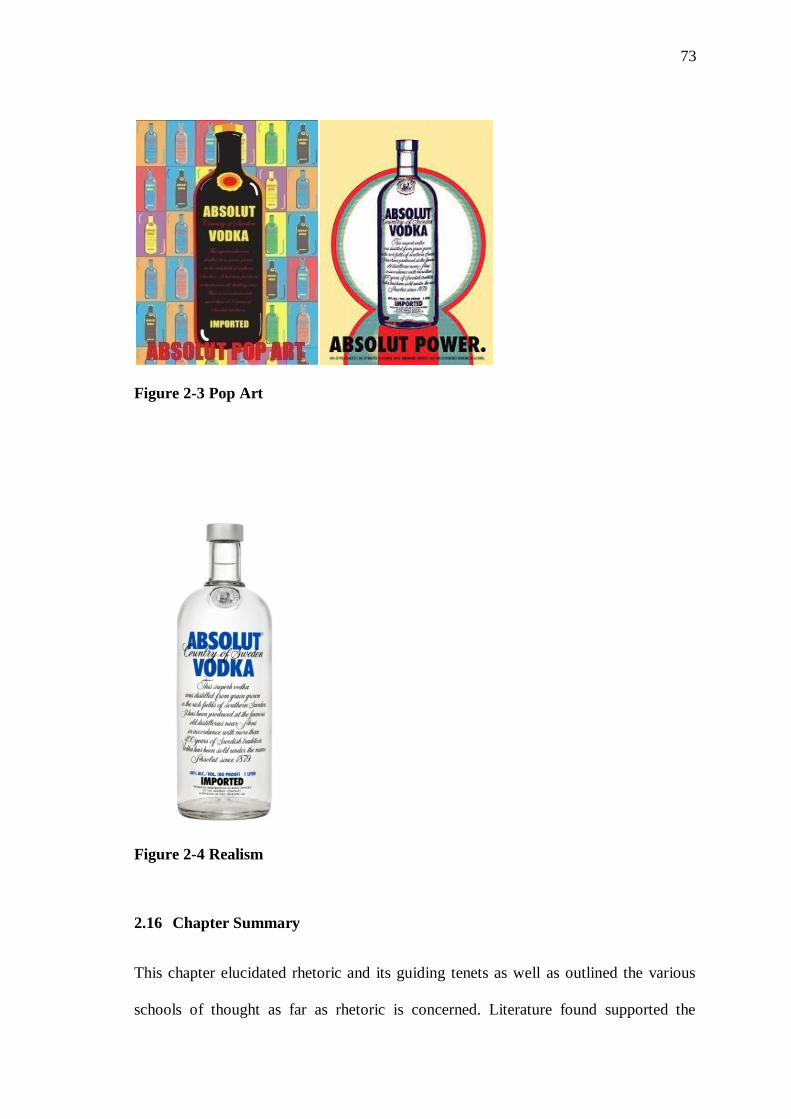
73
Figure 2-3 Pop Art
Figure 2-4 Realism
2.16 Chapter Summary
This chapter elucidated rhetoric and its guiding tenets as well as outlined the various
schools of thought as far as rhetoric is concerned. Literature found supported the
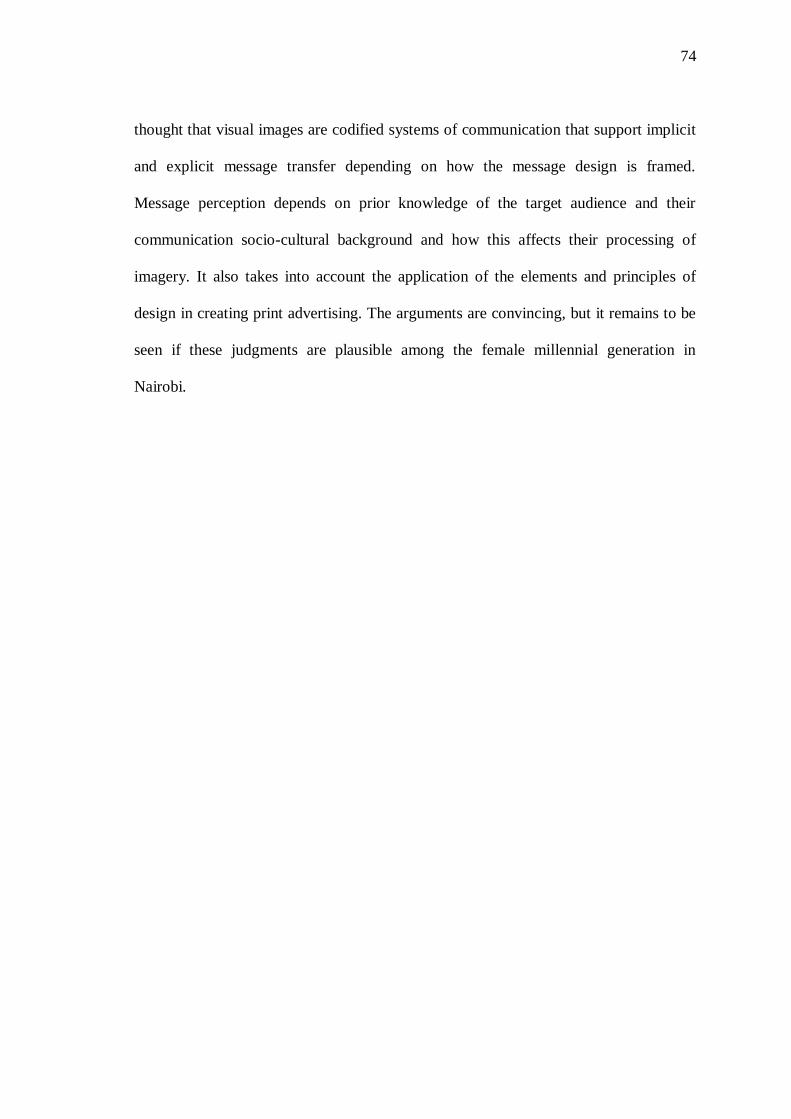
74
thought that visual images are codified systems of communication that support implicit
and explicit message transfer depending on how the message design is framed.
Message perception depends on prior knowledge of the target audience and their
communication socio-cultural background and how this affects their processing of
imagery. It also takes into account the application of the elements and principles of
design in creating print advertising. The arguments are convincing, but it remains to be
seen if these judgments are plausible among the female millennial generation in
Nairobi.
75
3 CHAPTER THREE – RESEARCH METHODOLOGY
3.1 Introduction
This chapter took into account pre-existing schools of thoughts in visual
communication and sought to employ research methodology that were capable of
bringing forth the necessary empirical scientific evidence to answer the research
questions and test the stated hypotheses put forward. Under the aegis of pragmatism, it
outlined the approach taken which employs exploratory sequential mixed methods. The
selection of advertisements, product categories, and geographical locations are
delineated. The stratified, purposive methods for the qualitative and Two-Stage Cluster
for the quantitative part of the study as well as the selection of sample groups are
defended. The procedures used to design instrumentation, validity, reliability,
generalisability of data and collecting the data such as the interview protocol are
explained. The statistical procedures used to analyse the data were elucidated. Ethical
considerations were also discussed.
The population researched is a medium audience defined by the fact that it reads
magazine. The groups researched are females within the millennial generation aged 20
to 34 years who view and use print advertisement images in lifestyle magazines and
also form the main target market for the magazines.
The researcher set out to explore how the different art genre in print media
advertisements influenced the degree of consensus of message(s) communicated
between demographic groupings.
76
3.2 Research Paradigm
Research paradigm informed the overall manner in which this research was planned
from inception of theoretical foundations to data analysis. It encompassed the
philosophical position of the accepted worldview in this study (Creswell, 2009). It
addressed the assumptions that supported “the research strategy and the methods
chosen as part of (Ihuah & Eaton, 2013, p. 936)” the research paradigm. The viewer
was seen as an “active being, influenced by personal history and cultural affiliations,
which shaped their world view, and their definition of what the truth encompassed.
(Mills, Bonner, & Francis, 2006, p. 26).” The research methods asdesigned would be
difficult to understand without a definition of research philosophies held by the
researcher.In order to ensure that the research carried out was sound, and aligned with
the requirements of the research, there was an interrogation of what the ontological
persuasion was. This helped point towards the epistemological, and then
methodological direction the exercise took.
3.2.1 Ontology
It was the researchers belief that the viewers’ opinion of and subsequent response to the
image seen was not an impulsive, mechanical reaction to what was observed. They
based their reactions on a thought process. It was a reaction to a realty (Ihuah & Eaton,
2013, p. 936). The nature of reality was acknowledged by the researcher who chose to
expropriate Constructivism as a research paradigm for the Qualitative section of the
research (Creswell, 2009). Constructivism denies the existence of an objective reality.
It propagates “that realities are social constructions of the mind, and that there exist as
many such constructions as there are individuals,” accepting that many of these
77
constructions may be shared among different individuals (Mills, Bonner, & Francis,
2006, p. 26). For the quantitative part of the study, the researcher noted that the reality
was objective and embraced Objectivism(Creswell, 2009). In order to achieve
acceptable, informative outcome, the researcher had to work independently from the
study.
3.2.2 Epistemology
The nature of the interrelationship between the researcher and participant, in the
qualitative section was interpretive and involved the co-construction of meaning
(Creswell, 2009). The researcher in this study by their “humanness,” was part and
parcel of the research endeavour and a possible influence to the outcome of research
(Mills, Bonner, & Francis, 2006, p. 26).
The quantitative part of the study, due to the need for objectivity leans towards
positivism. The researcher is independent of the respondents of the study.
3.2.3 Pragmatism
The philosophy that is Pragmatism advised that it was untenable to select one research
viewpoint over another whether ontology, or epistemology when they were all capable
of contributing towards producing a holistic, tenable answer to the research questions
and hypotheses at hand. Both qualitative and quantitative methods provided satisfactory
responses to the research queries and were applied. (Ihuah & Eaton, 2013, p. 937;
Creswell, 2009)
78
3.3 Research Approach
A combination of methods served to help proffer a better understanding of the problem
than a single method would have offered (Tashakkori & Teddlie, 1998, p. 40). The
Exploratory Sequential Strategy which is a form of Intra Method Mixing(Bowling &
Ebrahim, 2005, p. 235) was applied. Sequential mixed method design was also seen as
ideal manner in which to proceed as the researcher had inadequate baseline information
from the review of literature. The “logic of inquiry includes the use of induction (or
discovery of patterns), deduction (testing of theories and hypotheses), and abduction
(uncovering and relying on the best of a set of explanations for understanding one’s
results)” (Onwuegbuzie & Leech, 2006, p. 474). An inductive base carried out using
focus group discussions supported beginning with “fragmentary details to a connected
view of” the situation and assisted explore the phenomenon. It made it possible to
establish whether or not there were discernible differences in response to the disparate
art styles used in print media advertising across the varied demographic groupings. This
was followed by analysis and then a deductive phase which began with a universal
view of the situation, working towards specific aspects of the research (Gray, 2014). It
encompassed the collection of quantitative data and analysis. It sought to develop and
enlarge the understanding of the factors that contributed to the response found in the
prior phase. The researcher was able to examine the results and see where and how they
confirmed as well as contradicted each other. There were cases of both convergence
and divergence. This enhanced the validity of the results. With complementarity, the
strengths of the qualitative phase of research contributed towards refining the
quantitative phase, as well as the later phase contributing towards validating the former
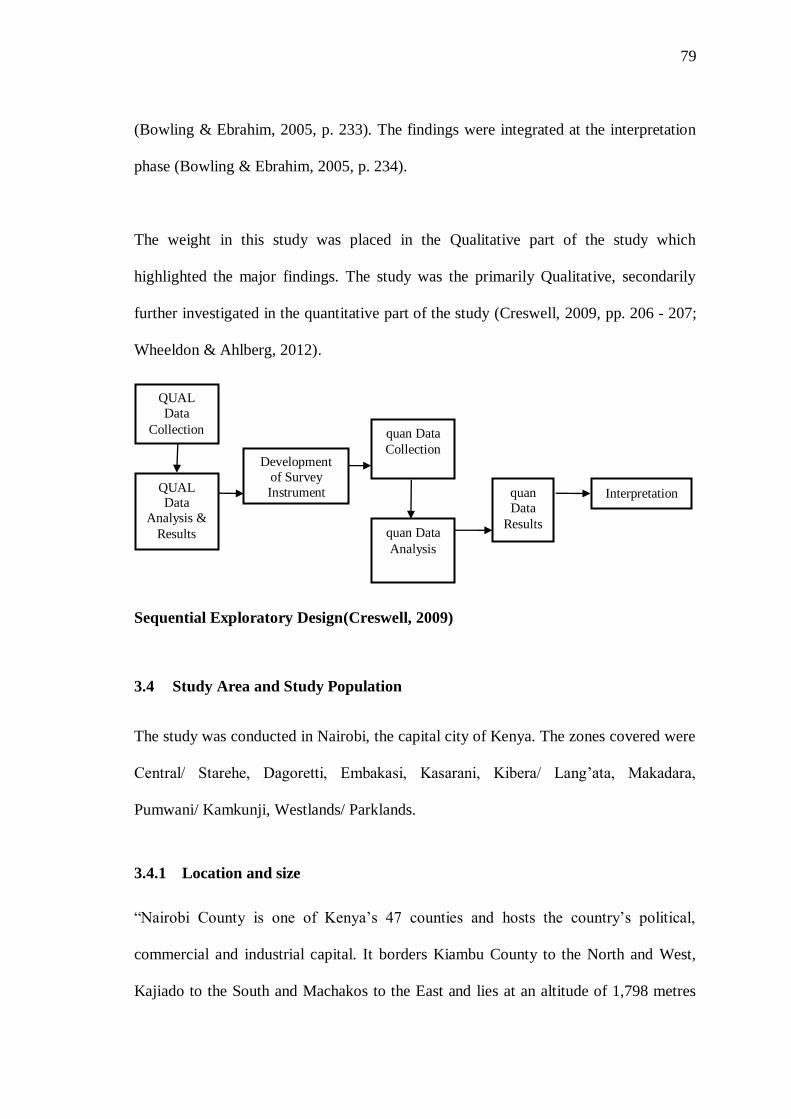
79
(Bowling & Ebrahim, 2005, p. 233). The findings were integrated at the interpretation
phase (Bowling & Ebrahim, 2005, p. 234).
The weight in this study was placed in the Qualitative part of the study which
highlighted the major findings. The study was the primarily Qualitative, secondarily
further investigated in the quantitative part of the study (Creswell, 2009, pp. 206 - 207;
Wheeldon & Ahlberg, 2012).
Sequential Exploratory Design(Creswell, 2009)
3.4 Study Area and Study Population
The study was conducted in Nairobi, the capital city of Kenya. The zones covered were
Central/ Starehe, Dagoretti, Embakasi, Kasarani, Kibera/ Lang’ata, Makadara,
Pumwani/ Kamkunji, Westlands/ Parklands.
3.4.1 Location and size
“Nairobi County is one of Kenya’s 47 counties and hosts the country’s political,
commercial and industrial capital. It borders Kiambu County to the North and West,
Kajiado to the South and Machakos to the East and lies at an altitude of 1,798 metres
Interpretation
QUAL
Data
Collection
QUAL Data
Analysis &
Results
Development
of Survey
Instrument
quan Data
Collection
quan
Data
Results quan Data
Analysis
80
above sea level. The county has a total area of 696.1 Km2”(Agriculture Sector
Development Support Programme, 2016).
The research site was selected because of proximity to the researcher. It was easily
accessible making monitoring the site area convenient. The researcher could also
benefit from previous geographical and socio-economical knowledge of the site. The
site area was endowed with the study’s appropriate target population, who were female
millennial consumers of lifestyle magazines. Their qualities embodied the demographic
in question. The researcher had had positive previous research interaction and
experiences at the site.
For purposes of the study, Nairobi was divided into its eight residential areas (UNEP).
Each of these zones formed a single land mass (See map in APPENDIX 10).
Participants were picked from each of these areas for the study.
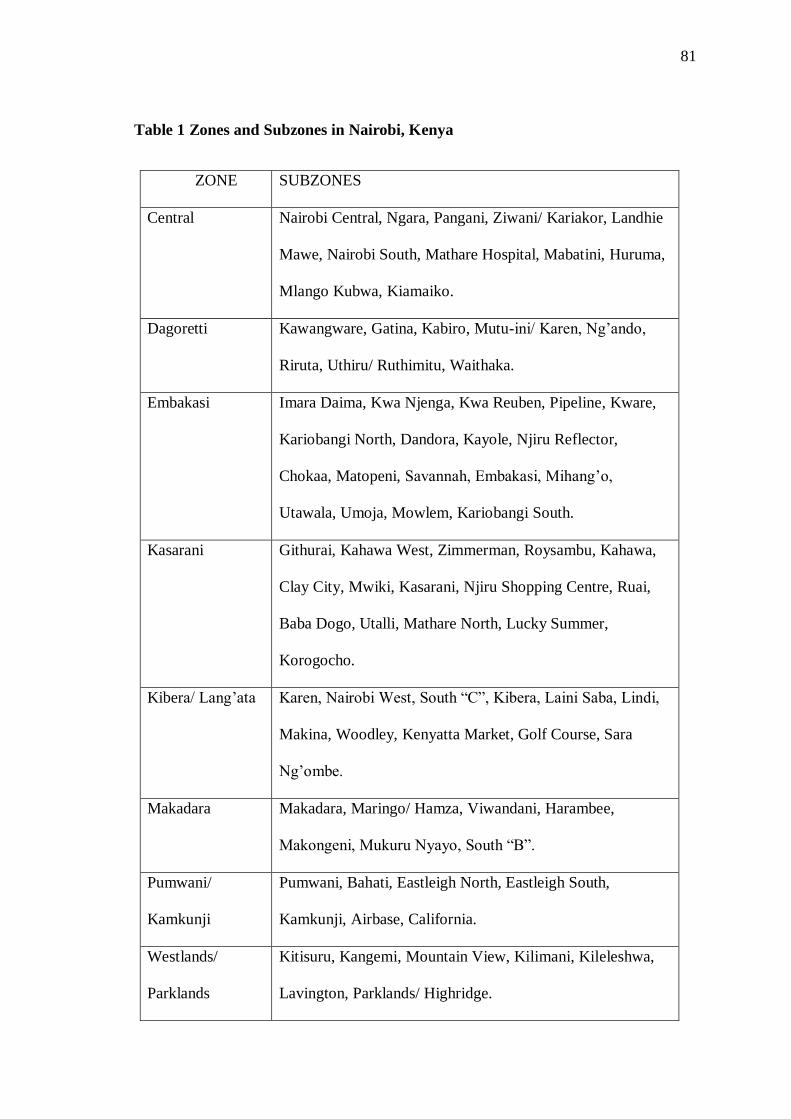
81
Table 1 Zones and Subzones in Nairobi, Kenya
ZONE SUBZONES
Central Nairobi Central, Ngara, Pangani, Ziwani/ Kariakor, Landhie
Mawe, Nairobi South, Mathare Hospital, Mabatini, Huruma,
Mlango Kubwa, Kiamaiko.
Dagoretti Kawangware, Gatina, Kabiro, Mutu-ini/ Karen, Ng’ando,
Riruta, Uthiru/ Ruthimitu, Waithaka.
Embakasi Imara Daima, Kwa Njenga, Kwa Reuben, Pipeline, Kware,
Kariobangi North, Dandora, Kayole, Njiru Reflector,
Chokaa, Matopeni, Savannah, Embakasi, Mihang’o,
Utawala, Umoja, Mowlem, Kariobangi South.
Kasarani Githurai, Kahawa West, Zimmerman, Roysambu, Kahawa,
Clay City, Mwiki, Kasarani, Njiru Shopping Centre, Ruai,
Baba Dogo, Utalli, Mathare North, Lucky Summer,
Korogocho.
Kibera/ Lang’ata Karen, Nairobi West, South “C”, Kibera, Laini Saba, Lindi,
Makina, Woodley, Kenyatta Market, Golf Course, Sara
Ng’ombe.
Makadara Makadara, Maringo/ Hamza, Viwandani, Harambee,
Makongeni, Mukuru Nyayo, South “B”.
Pumwani/
Kamkunji
Pumwani, Bahati, Eastleigh North, Eastleigh South,
Kamkunji, Airbase, California.
Westlands/
Parklands
Kitisuru, Kangemi, Mountain View, Kilimani, Kileleshwa,
Lavington, Parklands/ Highridge.
82
3.5 Qualitative Population and Sampling
The Unit of analysis were the individual magazine readers who were exposed to the
images in print media advertisements. The magazines they consumed in this study were
‘Parents’, ‘True Love’, ‘Drum’, ‘Passion’ and ‘African Woman’. They were female
millennials aged between 20 and 34. They were resident in Nairobi.
3.5.1 Qualitative Population and Sampling
The qualitative respondents were selected using stratified, purposive sampling (Klaus,
2002, p. 239), as it was necessary to have both wide representation throughout the
selected geographical area as well as participants who had interacted with the materials
to be researched and were capable of giving informed, knowledgeable responses
(Groenewald, 2004). The respondents were picked from a list created for qualitative
sample selection generated by a leading research company. They formed three focus
groups in each of the two sessions that represent the AB, C1 and C2, (See Appendix 2)
demographic respectively. There was to be one representative member from each of
eight zones in Nairobi in each of the separate focus group discussions to make a total of
eight. This study comprised two focus groups sessions. The first group had twenty three
participants, the second twenty one, bringing the total number of participants in the
focus group discussions to forty four. The respondents were randomly selected from
lists maintained by a professional research firm. Theoretical saturation was achieved in
the Focus Group Discussions. However, it is generally thought to occur at the number
of 20 (Dworkin, 2012, p. 1320; Guest, Bunce, & Johnson, 2006, p. 74; Auerbach &
Silverstein, 2003, p. 20). It was opined that at this stage, no new information will
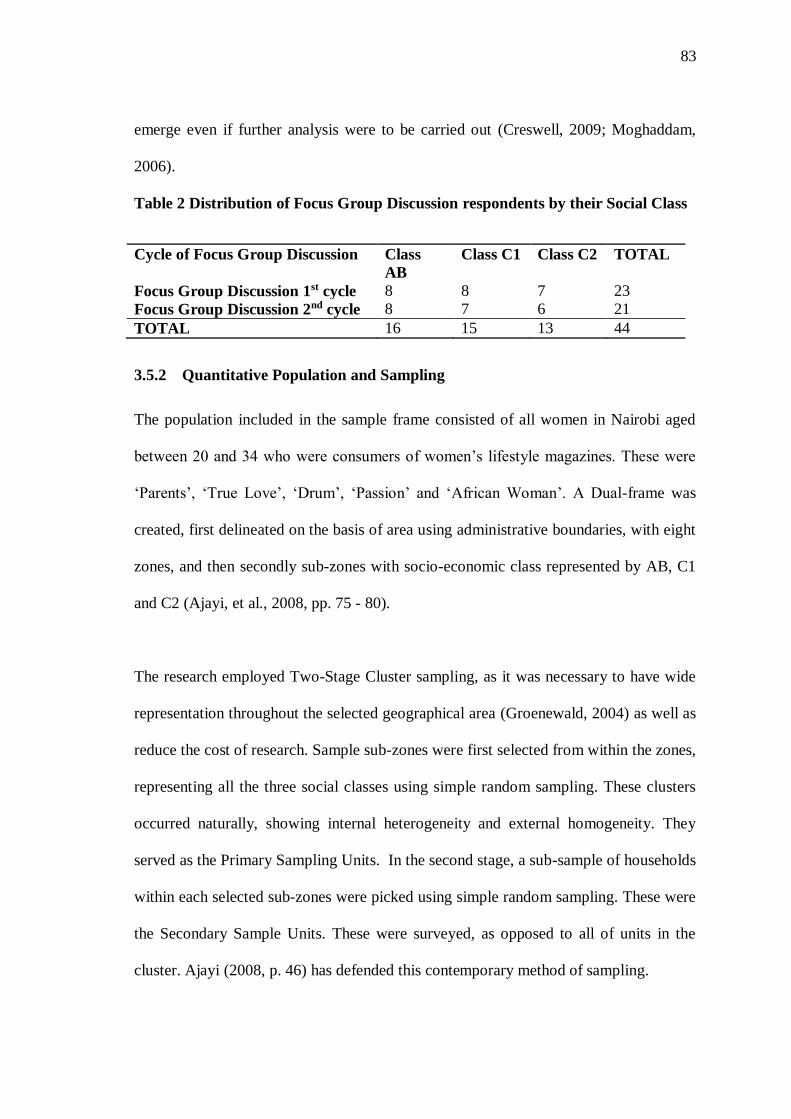
83
emerge even if further analysis were to be carried out (Creswell, 2009; Moghaddam,
2006).
Table 2 Distribution of Focus Group Discussion respondents by their Social Class
Cycle of Focus Group Discussion Class
AB
Class C1 Class C2 TOTAL
Focus Group Discussion 1st cycle 8 8 7 23
Focus Group Discussion 2nd cycle 8 7 6 21
TOTAL 16 15 13 44
3.5.2 Quantitative Population and Sampling
The population included in the sample frame consisted of all women in Nairobi aged
between 20 and 34 who were consumers of women’s lifestyle magazines. These were
‘Parents’, ‘True Love’, ‘Drum’, ‘Passion’ and ‘African Woman’. A Dual-frame was
created, first delineated on the basis of area using administrative boundaries, with eight
zones, and then secondly sub-zones with socio-economic class represented by AB, C1
and C2 (Ajayi, et al., 2008, pp. 75 - 80).
The research employed Two-Stage Cluster sampling, as it was necessary to have wide
representation throughout the selected geographical area (Groenewald, 2004) as well as
reduce the cost of research. Sample sub-zones were first selected from within the zones,
representing all the three social classes using simple random sampling. These clusters
occurred naturally, showing internal heterogeneity and external homogeneity. They
served as the Primary Sampling Units. In the second stage, a sub-sample of households
within each selected sub-zones were picked using simple random sampling. These were
the Secondary Sample Units. These were surveyed, as opposed to all of units in the
cluster. Ajayi (2008, p. 46) has defended this contemporary method of sampling.
84
Probability sampling meant that balanced representation could be achieved and
unbiased inferences could be made to the study population (LaVange, et al., 2010, p.
3).It was envisaged that due to intra-cluster correlation there would be a reduction of
precision. Increasing the number of randomly select clusters as opposed to randomly
selecting more points within any particular cluster was used to mitigate this effect.
Selecting more clusters provided more information as opposed to selecting extra points
within a cluster.
Participants were sought out by going to the Simple Random Sampling pre-selected
points. Within each of the sub-zone, housing types were profiled as occupied by the
selected demographic with the assistance of assistant researchers. Pre-existing lists used
to select qualitative sampling respondents were used to select the respondents. The
researcher then requested the occupants to join the study (Schutt & Bachman, 2011, p.
173; Kumar, 2011, p. 207). If accepted, the researcher would view the interior of
household to further verify the participants’ economic status. The researcher ensured
that the participants selected did not come from an advertising or marketing
communication background which may compromise the neutrality of the respondents in
the study (Phillips, 1997; Foss S. , 2004, pp. 306 - 307). Final selection was narrowed
down and directed to ensure respondents belonged to the demographic that reads the
magazines in question and conform to the research respondent requirement parameters.
If the occupant was unavailable or unwilling to participate, an alternative pre-selected
site following on the random listing was used.
The social demographic numbers of AB, C1 and C2, (See Appendix 2) are at a 15%,
36% and 49% ratio. Cumulatively they form a total of 69% of the urban population.
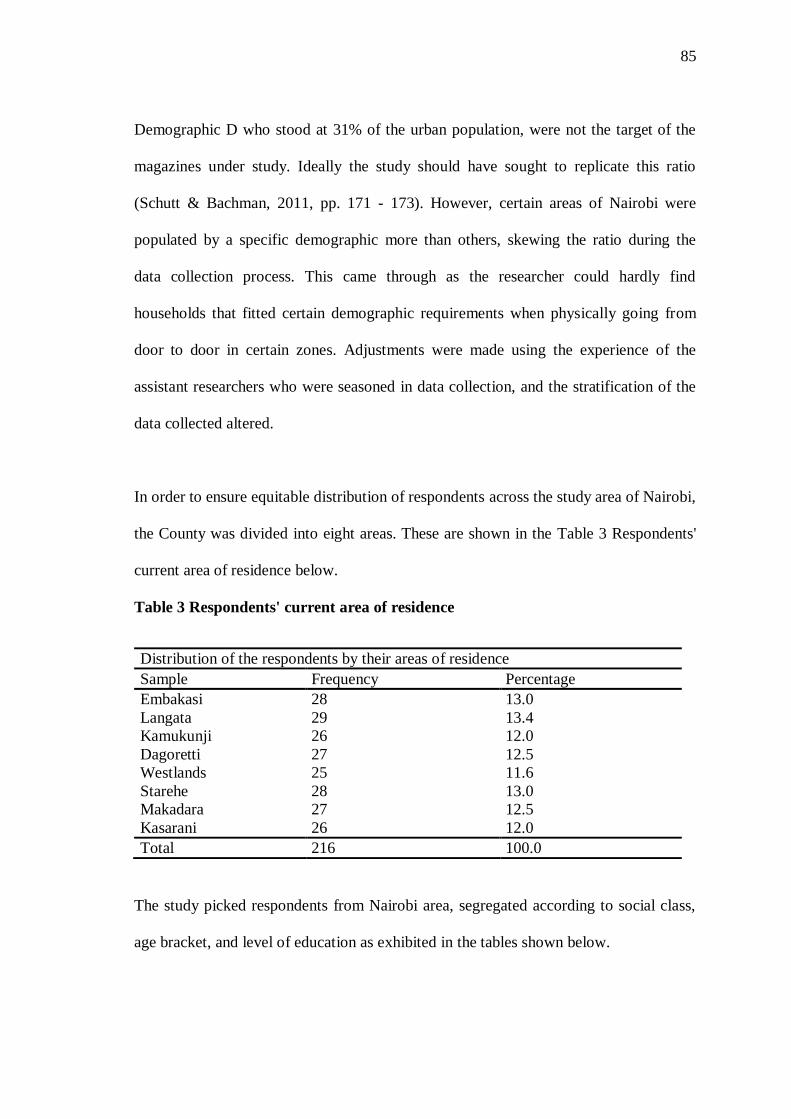
85
Demographic D who stood at 31% of the urban population, were not the target of the
magazines under study. Ideally the study should have sought to replicate this ratio
(Schutt & Bachman, 2011, pp. 171 - 173). However, certain areas of Nairobi were
populated by a specific demographic more than others, skewing the ratio during the
data collection process. This came through as the researcher could hardly find
households that fitted certain demographic requirements when physically going from
door to door in certain zones. Adjustments were made using the experience of the
assistant researchers who were seasoned in data collection, and the stratification of the
data collected altered.
In order to ensure equitable distribution of respondents across the study area of Nairobi,
the County was divided into eight areas. These are shown in the Table 3 Respondents'
current area of residence below.
Table 3 Respondents' current area of residence
Distribution of the respondents by their areas of residence
Sample Frequency Percentage
Embakasi 28 13.0
Langata 29 13.4
Kamukunji 26 12.0
Dagoretti 27 12.5
Westlands 25 11.6
Starehe 28 13.0
Makadara 27 12.5
Kasarani 26 12.0
Total 216 100.0
The study picked respondents from Nairobi area, segregated according to social class,
age bracket, and level of education as exhibited in the tables shown below.
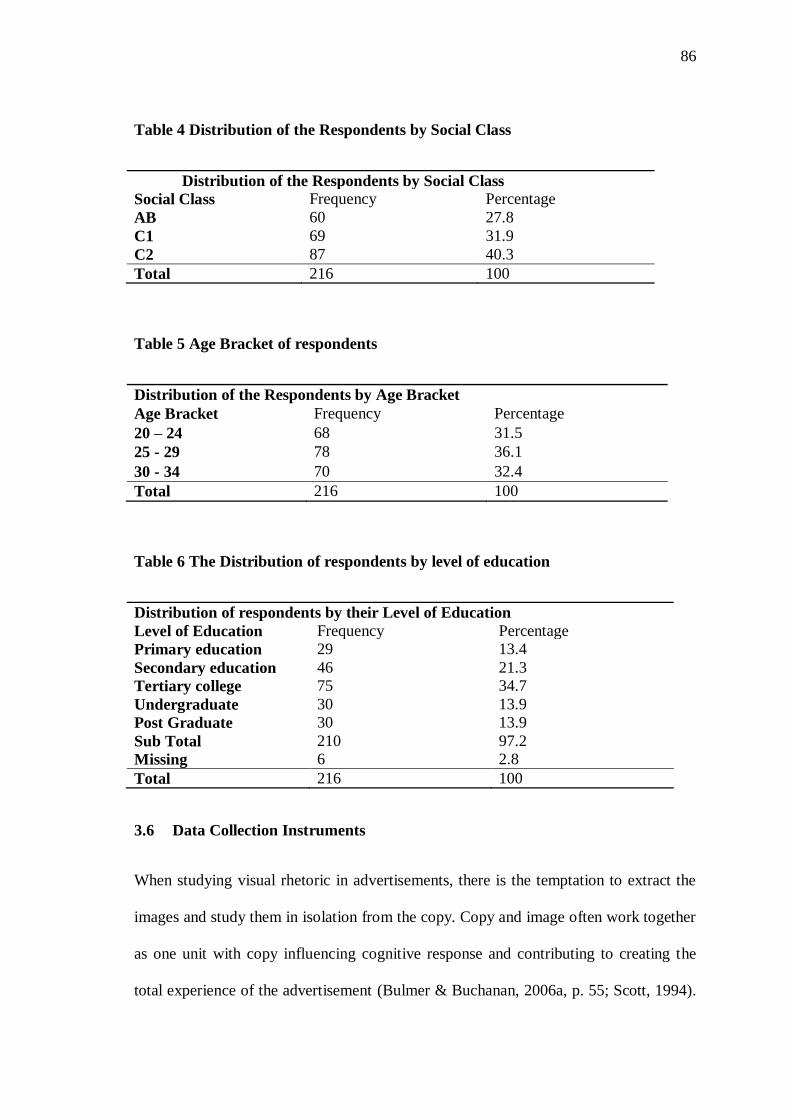
86
Table 4 Distribution of the Respondents by Social Class
Distribution of the Respondents by Social Class
Social Class Frequency Percentage
AB 60 27.8
C1 69 31.9
C2 87 40.3
Total 216 100
Table 5 Age Bracket of respondents
Distribution of the Respondents by Age Bracket
Age Bracket Frequency Percentage
20 – 24 68 31.5
25 - 29 78 36.1
30 - 34 70 32.4
Total 216 100
Table 6 The Distribution of respondents by level of education
Distribution of respondents by their Level of Education
Level of Education Frequency Percentage
Primary education 29 13.4
Secondary education 46 21.3
Tertiary college 75 34.7
Undergraduate 30 13.9
Post Graduate 30 13.9
Sub Total 210 97.2
Missing 6 2.8
Total 216 100
3.6 Data Collection Instruments
When studying visual rhetoric in advertisements, there is the temptation to extract the
images and study them in isolation from the copy. Copy and image often work together
as one unit with copy influencing cognitive response and contributing to creating the
total experience of the advertisement (Bulmer & Buchanan, 2006a, p. 55; Scott, 1994).
87
It can be argued that separating visual from verbal destroys the advertisement to the
point that it is bereft of meaning, or mutilated to the point that its meaning is altered
(Scott, 1994). However, in this research, including copy may have biased the consumer.
In order to mitigate this occurrence, images that contain no copy were employed
(Phillips, 1997; Morgan & Reichert, 1999).
Other variables existed that may also affect the data, such as brand type used in the
selected advertisements. In order to eliminate bias on this count by respondents, other
research has in the past has used fictitious brands, not aligned to their study, but
appropriate to it (Orth & Malkewitz, 2008, p. 67; Underwood & Klein, 2002; Laczniak,
DeCarlo, & Sridhar, 2001; Scott & Vargas, 2007; Mitchell & Olson, 1981). The latter
was done in this study too, the images selected, though they closely mimicked those
used in advertisements, had never themselves been used for advertising purposes.
The study may also have been affected by the respondent’s bias towards a particular
product category. To mitigate this bias as much as is possible, the research included
two product categories in the interviews.
The ideal setting in which to study advertising images is as it occurs in its natural
setting (Klaus, 2002). However, it was not lost to the researcher that in order to make
cause and effect inferences regarding theoretical concepts, control of the research
setting was required. Under these circumstances, a laboratory setting was ideal.
Variables that may have affected the data collected had to be controlled or eliminated
as where necessary and possible.
88
In a study of visual metaphor, Phillips (1997) uses students who are not engaged in the
study of advertising, because they have no direct involvement with the discipline and
are believed not to have developed fixed opinions in matters related to advertising. The
same conviction was applied in this study as a result of which it engaging participants
who were not in the business of design, marketing, or advertising to offer neutrality of
thought (Hagtvedt, Hagtvedt, & Patrick, 2008, pp. 212 - 213).
Sample Size Calculation
The population size of approximately 700,000 (Kenya, August 2010, p. 28) had an
estimated intra-class coefficient of 0.65, reflecting acceptable homogeneity of sample.
In calculating the sample size, it was assumed that 95% of the population had a factor
of interest as women’s lifestyle magazine consumers. This assumption was made due to
information given by magazine producers. Parents’ magazine for example, in 2014
quoted a circulation of 40,000 and a readership of 6.5 million (Godia, 2014). Keep in
mind that the KNBS figures state that this is the population of women in the country in
the age cohort studied. The researcher took into consideration that not all copies printed
were sold, and copies sold were not all read by a maximum of 6 persons as stated by
the magazine publishers, and cognisance given to the fact that to reach the quoted
readership, each copy would have to be read by an average of 150 people. After
conversations with seasoned data collectors and researchers a realistic response rate of
60% was envisaged. Additionally, according to a Media Council of Kenya study carried
out in 2014, 4% of the total media consuming population are magazine consumers
(Media Council of Kenya, 2012, p. 41). This gives us total of 28,000 possible readers.
60% of this is 16,800. As a result of these expectations, the sample size calculated was
122. This was for an estimated expected proportion of 5% absolute precision and 95%
89
confidence levels. In order to cater for drop offs, and to mitigate against the effects of
intra-cluster correlation this was increased. As such, a new sample size of 184 was
calculated (Ministry of Industry, Canada, 2003; Molenberghs, 2010). In order to satisfy
the requirement of representing all the socio-economic classes in all the 8 zones
proportionate to the population structure, 216 respondents were engaged.
3.6.1 Selecting advertisement and product categories
Magazines were selected out of the various visual print media that exist because they
form a distinct media category separate from the other print media such as books,
brochures, or newspapers. They were viewed as having a discrete target readership and
marketing strategy that earmark a clear demographic or psychographic consumer
audience (McQuarrie E. F., 2008, p. 265). In this research, the magazines examined
have been narrowed further to women’s magazines which are a subcategory of
magazines found in Nairobi. The advertisements in them are targeted at the readership.
The advertisements found in this subcategory form a wide enough base for
investigation.
Five popular lifestyle magazines on the Nairobi market were selected due to their
readership. These were ‘Parents’, ‘True Love’, ‘Drum’, ‘Passion’ and ‘African
Woman’ (Media Council of Kenya, 2012, pp. 41 - 42). All these are published in full
colour and generally tend to attract the same advertisers because they reach a similar
demographic that the advertisers are interested in. These magazines tend to be similar
in content aimed at the millennial generation of women in the AB, C1 and C2
demographic group aged mainly between 20 and 35 (Media Council of Kenya, 2012, p.
42). They feature beauty, society news, views and images, gossip, entertainment,
90
fashion, relationships, pregnancy, birth and parenthood, marriage and sex,
inspiration,real life experiences,spiritual guidance, personality profiles, leisure, interior
and garden décor, money management and finance, cars, health, nutrition, recipes,
horoscopes, agony aunts. Parents magazine though not strictly a lifestyle magazine in
the ilk of the preceding magazines was picked because of its success, staying power
and dominance on the Kenyan market, where it has been published every month since
July 1986. It was viewed as family magazine and offered the same material which was
covered by the other magazines mentioned above (McQuarrie E. F., 2008, p. 275).
However, it was noted that ‘Parents’, unlike the other magazines picked for review,
generally did not cover high society events (Parents, Magazine).
The study chose full page advertisements that had a full pictorial backdrop and were of
the photo-realistic style. The image representing a single product was in full colour.
These were then quantified and used as a guide to select similar images that had not yet
been published on the Kenyan print media. They were then manipulated into photo-
realism, pop art, and expressionism. Only advertisements from product industries as
opposed to service industries were selected.
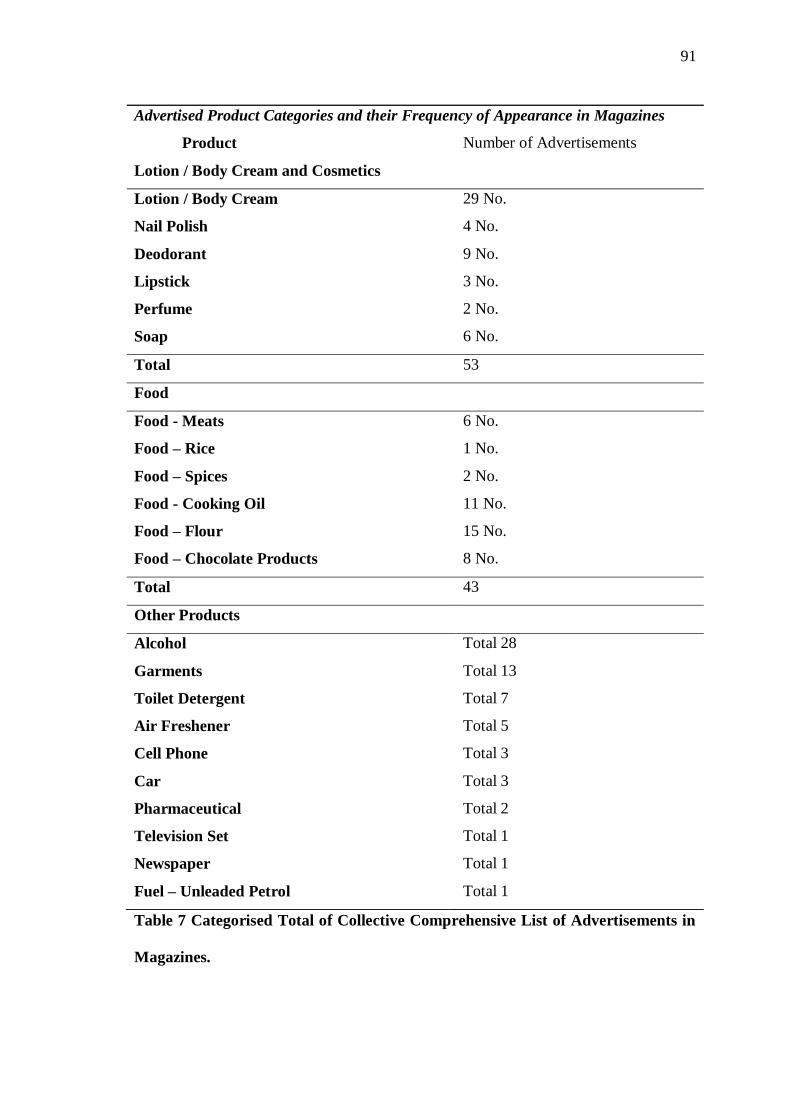
91
Table 7 Categorised Total of Collective Comprehensive List of Advertisements in
Magazines.
Advertised Product Categories and their Frequency of Appearance in Magazines
Product Number of Advertisements
Lotion / Body Cream and Cosmetics
Lotion / Body Cream
Nail Polish
Deodorant
Lipstick
Perfume
Soap
29 No.
4 No.
9 No.
3 No.
2 No.
6 No.
Total 53
Food
Food - Meats
Food – Rice
Food – Spices
Food - Cooking Oil
Food – Flour
Food – Chocolate Products
6 No.
1 No.
2 No.
11 No.
15 No.
8 No.
Total 43
Other Products
Alcohol Total 28
Garments Total 13
Toilet Detergent Total 7
Air Freshener Total 5
Cell Phone Total 3
Car Total 3
Pharmaceutical Total 2
Television Set Total 1
Newspaper Total 1
Fuel – Unleaded Petrol Total 1
92
The two categories picked were the most highly represented among the product types,
with one advert image for food, and the other cosmetics (lotion). These products were
ideal because they were also popular, non-controversial products, whose use cut across
the demographics in question (Mick & Politi, 1989, p. 5).
3.6.2 Selection of featured Art Styles
In order to decide what art styles to feature, the most popular art styles in the
commercial world were considered. It was thought that they are an indication of what
the consumer wanted or is attracted to. Unfortunately, information specific to Nairobi
was not available as part of a peer reviewed publication to the researcher. The
researcher used information from sales figures at eBay an international online market of
repute to gauge what was most popular (Aguilar, Guthmann, Strusani, & Williams,
February 2014).
The top five contenders in descending order were Abstract Expressionism, Surrealism,
Conceptual Art, Pop Art and finally Photo Realism. At the top of the list was Abstract
Art. Abstract expressionism which is part and parcel of abstract art met the required
criteria. This was followed by Surrealism which was ruled out because its basic tenets
required altering the base image from which all the images used in research were
derived, too drastically. For purposes of the research, because the participants were
being asked to give their response to images concerning their opinions on a cosmetic
product and a food product, it was deemed necessary to use illustration that had a
higher degree of realism. Subsequently following was Conceptual Art. All the images
used had to be outputted in two dimension. This ruled out conceptual art which usually
has a third or fourth dimensional component to it. Finally Pop Art and Photorealism
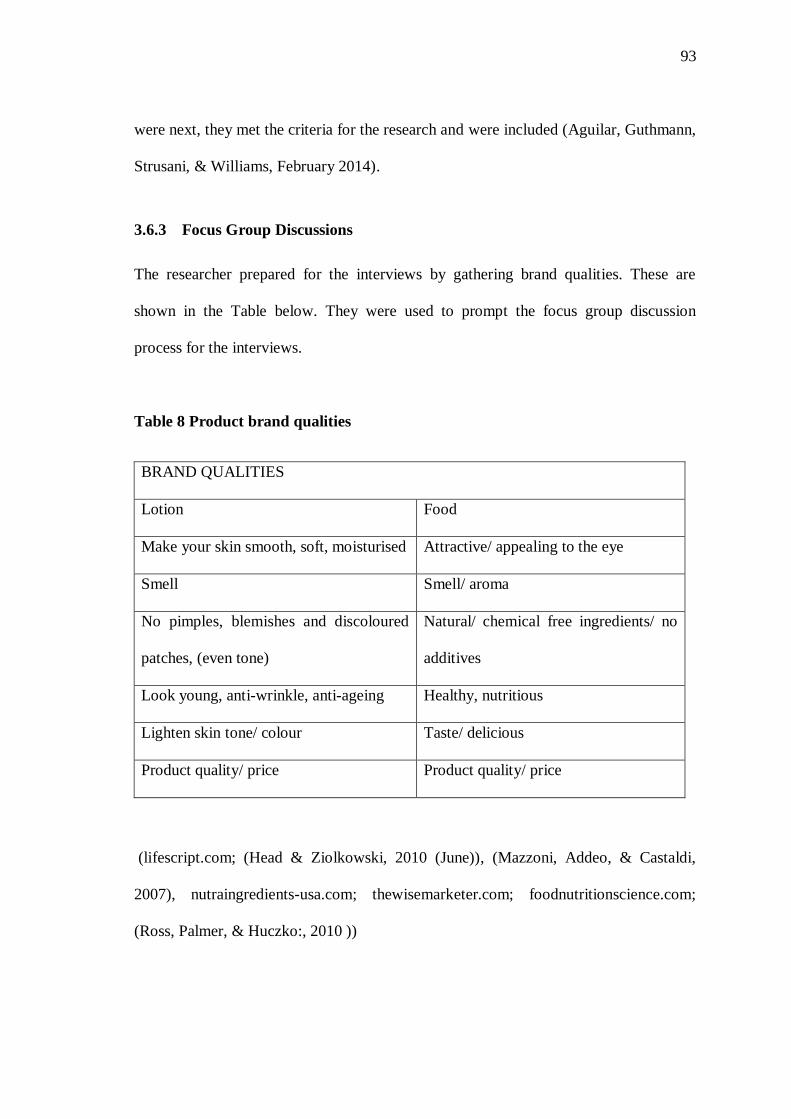
93
were next, they met the criteria for the research and were included (Aguilar, Guthmann,
Strusani, & Williams, February 2014).
3.6.3 Focus Group Discussions
The researcher prepared for the interviews by gathering brand qualities. These are
shown in the Table below. They were used to prompt the focus group discussion
process for the interviews.
Table 8 Product brand qualities
BRAND QUALITIES
Lotion Food
Make your skin smooth, soft, moisturised Attractive/ appealing to the eye
Smell Smell/ aroma
No pimples, blemishes and discoloured
patches, (even tone)
Natural/ chemical free ingredients/ no
additives
Look young, anti-wrinkle, anti-ageing Healthy, nutritious
Lighten skin tone/ colour Taste/ delicious
Product quality/ price Product quality/ price
(lifescript.com; (Head & Ziolkowski, 2010 (June)), (Mazzoni, Addeo, & Castaldi,
2007), nutraingredients-usa.com; thewisemarketer.com; foodnutritionscience.com;
(Ross, Palmer, & Huczko:, 2010 ))
94
The respondents were given information pertaining to the study and sensitised as to its
objectives and importance, as well as what will be done with the results of the study.
The respondents were also enlightened as to why they were chosen as individuals to
participate in the study. The participants were assured of their anonymity and informed
that they were at liberty to pull out of the Focus Group discussions at any point. A short
trial run was conducted to sensitise the participants as to how the session will be carried
out.
The researcher sought to establish rapport with the respondent so as to create a setting
where the views and perceptions of the interviewee were discussed, explored and
collected freely from a demographically homogenous social grouping. As such, the
three demographic groups were interviewed separately. It has been shown that focus
groups formed of a populace that is not socially homogenous inhibit participation of
members who are deemed to be or feel inferior or superior to others (Daymon &
Holloway, 2002, p. 199). Interview guidelines were used to elicit insights into the
meanings of the participants’ experiences as opposed to relying on descriptions (El
Hussein, Hirst, Salyers, & Osuji, 2014, p. 10). Focus groups were selected as opposed
to individual interviews because ideas were brought up, shared and bounced off
participants and explored more thoroughly (Auerbach & Silverstein, 2003, p. 17).
Group dynamics and symbiosis were enablers, contributing to the capturing of
participants’ complex perceptions towards the images shown them and assisting extract
a variety of views (Peek & Fothergill, 2009, p. 31). The researcher was also able
interview more people in the time and within the budget allocated.
95
Though Focus Group discussions were not naturally occurring events, but staged to
achieve a goal, the moderator did not influence the contributions from the floor and
acted mainly as a guide to steer the discussions. It can be argued that a focus group can
be dominated by an individual who is outspoken, but the moderator was able to
navigate through this challenge, and gently direct the group discussions back to reflect
the general groups’ views (Hansen, 2006).
The researcher endeavoured not to ask more than about four to five key questions and
probe these extensively. It was thought that asking more questions than this would
result in very long discussions that would tire the participants and would not yield the
level of detailed response required to divulge fruitful, comprehensive information.
Cognisance was given to the fact that what the respondent wished to share was of
utmost importance and was given a degree of precedence in the discussion sessions
(Auerbach & Silverstein, 2003, p. 16).
The respondents were presented with six images comprising three face images and
three food images. Both the Face and Food images represented the same basic picture
done in three different art styles, namely cartoon, expressionist painting and realistic
photograph styles.
In the first session images to be used were prepared and presented using individual
hand held A4 size picture cards. The discussions that followed pertaining to each
picture sought to establish the audience response to the questions at hand. The focus
group sessions which spanned an average of two hours each, were conducted by two
moderators, with the researcher acting as the lead moderator. Only where discussions
96
came to a standstill or become unproductive were gentle prodding for response and
verbal direction given. In the first few rounds of images shown to the participants, the
images were presented in no particular order. It was soon noted that whenever the
photograph was seen first, the participants assumed it to be the baseline by which the
other two images, namely the cartoon and the abstract image were to be judged. This
brought in unnecessary bias that was harmful to the study because it skewed the
opinions of the participants, introducing unwanted biases and prejudice. The
introduction of the abstract image before the cartoon also raised a situation where there
was undue comparison between the cartoon and the abstract image, with the abstract
image judged negatively as inferior. It was immediately decided that the photograph
would be presented last among the three images, the cartoon first.
The second session followed a pattern similar to the first. However, due to failure in the
first session by the participants to convey what were considered effective descriptions
of the elements and principles of design and their effects on their perceptions of the
image, a difference was incorporated in the mode of questioning. The questions used in
the second session of focus group discussions were a modification of those used in the
first. Emphasis was laid on the participants responding to queries that had to do with
their perceptions of the images were as opposed to the elements and principles of
design. The respondents were required to verbalise their thoughts and explain their
pronouncements more so in the second focus group session. The second session was a
more interactive exercise. When conducting the focus group discussions, the researcher
clarified issues and details that were raised, immediately and directly with the
respondents (Daymon & Holloway, 2002, p. 167).
97
Data was collected using digital recording equipment and written notes. The responses
to these questions were then transferred into transcript form and reviewed by two
parties, one of whom was the lead researcher. This was to ensure higher accuracy in
transcription (Oppenheim, 1992, p. 52).
Further to the activity outlined above, statements that appeared regularly were extracted
to be used as questions in the quantitative stage of research.
3.6.4 Questionnaire
The questionnaires incorporated an attitudinal scale capable for measuring response in
quantitative research. The prospective responses were categorised and presented on a
Summated rating scale of 1 to 5. It has been said that Summated rating scales cannot be
effectively used to quantify data that is governed by emotions or feelings as the
distance between each number on a Summated rating scale is not equal. What the
summation scale did was to measure the respondents’ strength of attitude in relation to
an absolute. The given absolute was subjective due to inherent features such as the
respondents’ personality and auxiliary factors such as preceding questions in the
questionnaire. One cannot easily mitigate for this. (Kumar, 2011, p. 170).
It has also been postulated that respondents, in a bid not to appear as extremists, tend to
avoid the extreme ends of a Summated rating scale, causing skewing towards a central
neutral tendency. Respondents’ active thought over the subject at hand was queried as
respondents can indiscreetly pick out any option from a Summated rating scale as they
engage in reflexive response, avoiding the contextualisation of the topics being
questioned. Despite all of this, it was noted that Summated rating scale type
98
questionnaires were useful in the context of this study. A large number of informants
were knowledgeable in how to use them, having encountered them before, meaning that
there was no need for lengthy training on how to use them, yielding fewer redundant
responses. Use of the questionnaire format accommodated the large number of people
involved in the quantitative part of the study, information was produced that was easily
computed and quantifiable and could be subjected to inferential statistical analysis.
Internally valid, description of the characteristics of the population which was
statistically significant was made available. Because the questionnaires were
standardised and the participants provided an equal stimulus, data were scientifically
more tenable.
The questionnaires were distributed out in the field. The participants were first given
information introducing them to the study. They were sensitised as to the objectives and
importance of the study and informed that they were at liberty to opt out of the study at
any point. The participants were assured of their anonymity. They were then issued
with the questionnaires. The advertisements to be used as stimuli for the research
appeared in an ordered fashion in the sequence in which the questions were asked.
They were displayed for the entire period of answering the specific questions at hand
(Ireland, 2003, p. 25).
3.7 Data Analysis
Pragmatism was the general research method used here, it did not dictate adherence to
any school of thought or discipline. Both inductive and deductive research analysis
methods were used as both qualitative and quantitative methods of research were
99
employed and as an extension of this, the data analysis methods straddle both methods
of research analysis.
3.7.1 Qualitative Data Analysis
The researcher, with the assistance of a professional communicator examined the
participants’ responses recurrently to code and establish categories and themes. This
helped ensure that the coding exercise was not clouded by the researchers’ views and
biases (Auerbach & Silverstein, 2003, p. 45).
The qualitative data was grouped into categories which were determined inductively,
starting from the specific and working its way to the general. Open coding was used to
break down the data into “separate units of meaning” (Moghaddam, 2006). The main
purposes this exercise was to “conceptualise and label data” (Moghaddam, 2006).
Content analysis was performed to conceptualise the core issues emanating from the
data collected (Moghaddam, 2006). This supported constructivism in its thought. The
Developmental Research Sequence of James Spradley appeared the best fit with the
degree of analyses required to attain beneficial information from the respondents on
their perception of images in advertising. This is one of the Emerging Themes Analyses
methods (Tashakkori & Teddlie, 1998). Coding by ‘microanalysis’ as recommended by
Moghaddam (2006) “which consists of analysing data word-by-word and coding the
meaning found in words or groups of words" was also done. This method of analysis
brought with it challenges. “Dividing the data into individual words sometimes causes
the analysis to become lost within the details of data. Therefore, it is useful to identify
key points (rather than individual words) and let concepts emerge” (Moghaddam,
2006). Coding also was said to only further exacerbate the problem as it was said to
100
have the possibility of being influenced by the researchers’ subjectivity, due to a variety
of reasons such as their interests, biases, prejudices.
The codes were then organised into recurring themes. The analytic tactic was Constant
Comparison between the social classes for which Thematic Coding was employed.
Subsequently, these descriptive themes used Evaluative Analysis measured using Scale
Coding as an Analytic Technique (Evers, 2016). This process involved counting themes
so as to measure their magnitude and calculate the effect size (Bowling & Ebrahim,
2005, p. 235; Bazeley, 2004; Saldana, 2012, pp. 72 - 73). These figures were then
compared across the three demographic classes namely AB, C1 and C2. In Mills
(2006, p. 31) it is advocated “that the researchers as authors include raw data in their
theoretical memos [...] to keep the participant’s voice and meaning present in the
theoretical outcome.” This was done and expanded to the inclusion of raw data, as thick
descriptions in the data analysis (Mills, Bonner, & Francis, 2006, p. 32). In this
research the researcher postulated about the quantity of message(s) represented by
frequency of occurrence of similar themes across and within the demographic groups,
as opposed to only the verbal or linguistic content of the message(s). This data was
presented in tables of raw numbers, graphs and tables of summary scores, and
frequency distribution tables.
3.7.2 Quantitative Data Analysis
Key phrases taken from the qualitative stage of the study were incorporated into the
quantitative stage of the study. The data collected was subject to a series of statistical
tests to ascertain their statistical significance.
101
This study involved proving or disproving Hypotheses. The data collected was a
complex set of data with several variables to analyse. There were three Independent
variables used singly against nine dependent variables in the advertisement on
cosmetics and seven dependent variables in the advertisement on food. Multivariate
analysis techniques of data analysis were invaluable because they could be used to
estimate relationships between the various variables in question and to decipher where
there was significance between them (Boushey, Harris, Bruemmer, & Archer, 2008, p.
683).
Two hundred and sixteen respondents answered the questionnaires. The one way
multivariate analysis of variance (MANOVA) allowed the researcher look for and find
possible relationships between variables. This gave a deeper understanding of the
bigger picture and provided an authoritative test of significance as opposed to a
univariate technique. The Multivariate Test was conducted using Wilks’ Lambda and
Pillai’s Trace Test where the assumption of homogeneity of variance-covariance had
been violated. The Box’s Test of Equality of Covariance Matrices was also consulted.
On the Univariate level, it was planned that an ANOVA be conducted if the
Multivariate tests proved to be significant. Levene’s Test of Equality of Error Variance
and Tests of Between-Subjects Effects were also to be viewed where necessary.
3.8 Validity and Reliability
The study at hand tried to ensure that validity and reliability were not compromised.
Under the Qualitative research, the emphasis was on promoting validity as opposed to
reliability. The thrust of the data collected and subsequent analysis, was not
102
replicability, but an understanding of the respondent and their thought variability as far
as visual communication was concerned (Hayes, 2000, p. 169).
3.8.1 Validity
Validity of response could have been influenced by the particular advertisements
selected for the study. The researcher had to make sure that the respondents’ view of an
advertisements’ production, such as layout or storyline, or how much they like an
advertisement, as well as/or their opinion of the product being advertised for example
did not influence their response(s) to perception. This was circumvented by using two
advertisements selected from two different product ranges, so as to counterbalance
skewed perceptions.
Experimental validity was also considered to gauge whether or not the research
conducted was reflective of what existed in the population and among individuals. The
research instruments were reviewed using respondents selected due to convenience and
availability to conduct a pilot test. Though the pilot groups were not representative of
the population being studied, they assisted highlight some errors in the instruments of
research that influenced and/or compromised the results obtained. This exercise was not
perfect, and some errors still leaked through. The quest to gain experimental validity
was further advanced by the use of both qualitative and quantitative research methods
to ensure that the advantages of both were acquired (Sonnenwald & Iivonen, 1999).
Concurrent validity can be ascertained after the research instrument has been applied to
respondents and the results obtained correlated to similar data from comparable
103
previous research. Since research exactly akin to this has not been carried out before, it
was difficult to conclusively carry out acceptable concurrent validity tests.
Construct validity in this study related to how efficiently and effectively an instrument
measured a psychological construct which was linked to perception. The constructs
engaged in this study could not be directly observed, so ways had to be found to ensure
that they were correctly measured. One of these was to make sure that there was
convergent validity where the results obtained mirrored or were close to those from
theoretically similar researches as well as discriminant validity where research results
were dissimilar to research studies at hand. Similar research studies include that carried
out by Scott and Vargas, (2007). However, this study was not comparable enough to
attempt correlation of results obtained (Gliner, Morgan, & Leech, 2011; Tashakkori &
Teddlie, 1998; Malim & Birch, 1997).
3.8.2 Reliability
Measurement reliability was of importance in validating the study. The construct of
perception was not directly observable and had to be deduced from other observables.
The specific elements of design that delivered a message in the intended fashion
between the sender and receiver had to be identified so that they could be used to
generate valid inquest material for the exploration of perception in communication. In
order to assist this happen, the researcher conducted qualitative research to garner
information on what the respondents voiced as communicated elements. The results
obtained from this were used in generating quantitative questionnaires that were then
administered on respondents to gather further data on the questions at hand.
104
Further to this, Cronbach’s Alpha was administered to test the internal consistency
reliability of the questionnaire. Picardi & Kevin, (2014, p. 51) as well as Mangal &
Mangal, (2013, p. 575) posit that a reliability coefficient alpha that is greater than or
equal to 0.7 is generally an acceptable value indicating high reliability of a
questionnaire. This value therefore selected as the benchmark for this study. Other
studies in visual communication such as by Mulken, Rob & Forceville (2010, p. 3423)
concerning the perception, complexity, deviation and comprehension of the visual
metaphor as found in images used in advertising, also accept the reliability coefficient
alpha of 0.7. Questionnaires tested on the degree of perceived complexity using a seven
point Likert scale returned a Cronbach’s alpha at 0.83. Questionnaire used to test
deviation returned a Cronbach’s alpha of 0.85. Gelbrich, Gathke, & Westjohn, (2012, p.
404) who also carried out test in visual communication on questionnaires that were
used to ascertain the effectiveness of absurdity in advertising images presented a
Cronbach’s alpha of 0.88. The Cronbach’s Alpha Coefficient for this study was 0.777,
which fell above the acceptable range. The questionnaire had an N = 48 items and
employed a five point Likert Scale.
A situation where the research could be repeated on respondents at a later date to
confirm consistency in response would be ideal. However, this retest was not possible
due to the costs involved (Auerbach & Silverstein, 2003, pp. 79 - 80; Tashakkori &
Teddlie, 1998; Malim & Birch, 1997). Box’s tests were carried to find out if the data
violates the assumption of homogeneity of variance-covariance matrices. Levene’s tests
were conducted to ascertain whether the assumption of equality of variance for the
variable in question has been violated (Pallant, 2007, p. 286).
105
3.8.3 Generalisability
The quantitative research methods were used in the second part of the study. Sample
groups selected were representative to what exists in society and by extension the
population from which the samples were selected. They were selected using probability
sampling via two stage cluster sampling. There was an estimated expected proportion
of 5% absolute precision and 95% confidence levels. Though dependability of the
extension was not total, it was statistically plausible. The findings of this study thus can
be generalised to a larger population or the study population studied. (Bachman &
Schutt, 2011; Creswell, 2009; Auerbach & Silverstein, 2003, pp. 80 - 82).
3.9 Ethical Considerations
The research engaged with research human populations, as such ethics needed to be
considered when designing the research tools. Though there are no distinct ethical
interview guidelines (Kvale, 2007, p. 49), conceptual contexts do exist (Kvale, 2007,
pp. 42 - 43). These did not give definite answers to the typical choices that had to be
made during the research project. These texts were largely interpretive and were
considered in respect to the situation at hand. The ethical practises exemplified in local
research communities provided guidance as to what was acceptable and legitimate.
Informed consent, confidentiality, and consequences of the participant were deemed as
crucial ethical factors.
3.9.1 Research respondents and participants
Although empirical research such as this one, rarely are life threatening, they can have
social and emotional implications, particularly if the respondents are not sufficiently
106
anonymous. In order to ensure anonymity of the participants, during the qualitative
phase of research, in the transcription stage of the study, the respondents were
identified only by their first names (Grinnell & Unrau, 2005, p. 407). Their identity is
omitted from the final presentations.
Informed consent for participation was obtained in advance of any interview via a form
that was administered to all potential respondents (See Appendix 1, Focus Group
Discussion Informed Consent Form and Questionnaire Informed Consent Form).
Participants were well informed as to the objectives of the study, as well as of what use
it was to be and how it would be carried out. (Klaus, 2002).
Any literature used in the research that was to be accessed by and used by the
respondents was in a language that they understood. Where the respondent for any
reason appeared not to be comfortable with the language in use, a full translation was
provided. Though the researcher avoided the use of slang or colloquialisms, if it was
the only language the respondents understood well or was more comfortable with, then
it was used to ensure that they fully comprehended what was going on.
To ensure that they were fully aware of the nature of the questions, the participants
were provided with sample questions in the study before interviewing commenced so as
to give them an idea of the nature of questions they would be answering.
The participants were made aware that by taking part in the study, no benefits accrued
them. Due to this, a small number of potential participants chose not to engage in the
research. They explained that they had partaken of research exercises in the past with
107
reputable companies and were always compensated with free product(s), gifts or
money.
The respondents were informed of the approximate length of time the interview would
take if they chose participate. They were informed that they are free to withdraw from
the study at any moment they so choose and were also free to decide not to answer any
question(s). These rights were fully exercised by the participants who withdrew at will
citing a variety of reasons ranging from time constraints to fatigue due to the longevity
of the questionnaires, or focus group discussions. They were also at liberty to ask
questions. It was impressed upon the respondents that there was no retribution
whatsoever attached to withdrawal from the study or refusal to answer any questions
(Groenewald, 2004; University, Waterloo of, 2011).
The researcher also complied with the terms and conditions laid down by the
Government of Kenya and Moi University Senate for research done within the country
and at the institution of higher learning (Creswell, 2009, p. 90). The Informed Consent
Forms can be viewed in Appendix 1. The National Council for Science and Technology
issued permit No. NCST/RCD/14/012/734 for the Study. This can be viewed in
Appendix 9.
3.10 Chapter Summary
Conducting research on a variety of three demographic groups’ perception of three
different art styles can be a daunting task taking into account the target audiences’
widespread lack of visual literacy. Coupled with this is the fact that there is no
108
reference for methodology used to study a similar phenomenon with the same group. It
is imperative that the researcher tread with caution and try to encapsulate epistemology
that will shed light on the question and hypotheses at hand. As such, an eclectic
research solution is probably the best. The use of mixed methods administered
sequentially with qualitative research done first takes these challenges into account, as
does the use of both focus group and respondents selected using Two-Stage Cluster
sampling in the quantitative section of the research.
109
4 CHAPTER FOUR - DATA PRESENTATION AND ANALYSIS
4.1 Introduction
This chapter lays out and analyses results of the focus group discussions. It seeks to
answer how do different art genre in print media advertisements influence the degree of
consensus of message(s) communicated between and among members of demographic
groupings. It also seeks to answer how different art style influence the degree of
elaboration of message(s) communicated, as well as what the effect of demographic
groupings is on the degree of elaboration, and therefore, scope of message(s)
communicated by different art styles in print media advertisement (See APPENDIX 6).
It also sets out to prove or disapprove the null hypotheses that state that there is no
significant difference in the respondents' perception of various art styles used in print
media advertising when classified by social class, age, and level of education. In line
with this, it employs the analysis of key themes and interpretation of inferential
statistics to help derive and display information on the research questions.
4.2 Findings and Analysis for Focus Group Discussions: Qualitative Data Focus
Group Key Themes - Presentation of Findings
Qualitative Research Question 1
How do different art genre in print media advertisements influence the degree of
consensus of avert message(s) communicated between demographic groupings?
It is important to note that what was of importance was not the content the message
conveyed. It was the degree of diversity of message interpretation, measured using the
110
variety of different messages put across that was of importance. This was neither a
study in the semiotics employed, nor their efficacy. It was a study that sought to
explore the ability of a graphic to express a universal message to a distinct target
audience, regardless of what the message was. As such, the researcher did not lay
importance to the message that was perceived, but whether or not the messages
received by the respondents bore similarity or not. This variety was what was
enumerated.
The respondents were segregated according to three social classes, namely AB, C1, and
C2. There were two focus group discussions carried out, with a total of 23 in the first
cycle, and 21 in the second cycle, making a total of 44.
4.2.1 Themes Generated from Focus Groups 1 and 2, Face and Food
The responses ranged from only one class enunciating a particular key theme to all
three classes expressing and agreeing that a particular image communicated a singular
key theme. These opinions flowed from the participants of the focus groups and were
not suggested to them. Disparate opinions between the classes was classified as one
response, referring to only one social class selecting a key theme was articulated by an
image, followed by two and then three responses with two and then three social classes
sharing the opinion that an image articulating a similar key theme.
Focus Groups 1 and 2, Face
Lack of Concurrence of opinion across classes
A very high number of respondents from all three classes AB, C1, and C2 hold
divergent views in their response to the images presented. They have differing opinions
111
as to what the images represents. This stands between a low of 58.06% and a high of
80.77% averaging at 69.42%.
Regarding the effects of the product on the skin, a respondent in the AB class, focus
group 1, looking at the cartoon says that it ““looks like maybe she tried using some oil
eeh, and it and then it reacted with the body””. A respondent from the C1 class focus
group 1 cartoon, simply states of the product that ““it burns”” the model. Yet another
respondent from the same group says that the product did, ““not””react with the
model’s skin. A C2 respondent in focus group 1 face cartoon is non–committal and
states that ““Maybe it can affect you, your face””.
On what social class the model may belong to, a C2 focus group 1 face cartoon
respondent says that, ““she looks common””. Another member of the same group
thinks that she looks ““Middle class””. An AB focus group 2 face cartoon respondent
differs with these two and says that she is, ““not a normal, person. It’s a lady who is
well known””. A C2 focus group 2 face cartoon respondent, reckons that the model is
somewhat anonymous. She explains that, ““This person, we may not know, I, I, mean,
we may not know she. Where he’s coming from, her background, but this one, is
somehow a bit public. Even if you put it in a place when she is well known, nobody can
identify her that easy.””
Concurrence of opinion across only two classes
There is a mid-ground with similar responses between two social classes that ranges
from a low of 13.46% and a high of 32.26% averaging at 22.86%.
A group 1, AB face cartoon respondent looking at the cartoon face says of the model
that ““she’s very artificial, too artificial””, a C1 respondent concurs and says that
112
““there is no person that looks like this ...you cannot say that skin is mine””. C2 do not
directly call out the model on being artificial.
With focus group 2, when discussing the face cartoon, ABs state that ““her complexion
is even””. C1 concur and say that ““She has a smooth face, or probably she’s used
foundation””. However, C2 are not just silent on the matter, they go on to state the
converse, saying that ““The skin is rough””.
An AB focus group 2, face photograph, respondent looking at the models’ smile, feels
that it is not genuine. ““…the smile looks forced. The eyes are not smiling. She’s, she’s
smiling, but there’s something, there’s something missing.”” C1 feels that ““the smile,
Is really a fake one””, C2 is silent on the matter.
Concurrence of opinion across all three classes
All three classes agree on the same communicative message at a low of 5.77% and a
high of 15.79% averaging at 10.78%. These figures are low and bear testimony to a
high rate of divergence of opinion.
All the respondents from across the three classes in focus group 1, viewing the cartoon
face perceive the product as being expensive. An AB respondent says that it is ““much
more expensive because I think it does a lot to her skin like toning and making it a little
bit flawless””. A C1 respondent says that it ““Must be expensive, these are the types of
oils that are just expensive””. A C2 respondent states that ““800 ... Like for ‘Milke’,
very expensive but it is good””.
113
All the respondents from across the three classes in focus group 1, viewing the face
abstract painting agree that it is extreme in its use of colour. The AB respondent says
that ““I would leave this one for ‘Peter Marangi’ [colour comedy character]””. The
C2 respondent says that the face looks like a ““witchdoctor””. A colleague chimes in
that ““she has so many colours, you can even ... I cannot even describe which colour
she is. The make-up, you know, she’s not uniform in applying eehh. She was trying
...””. The C2 respondent concurs and says that ““she looks pathetic ... She has very
many colours, there is purple, there is pink, there is yellow, brown””. The respondents
state that model will probably not smell nice with AB saying that she ““will have not a
very good smell””, C1 stating that she ““smells so bad””, and C2 saying that,
““would smell very bad””. The respondents believe that the model reacted to
something she tried. The AB respondent says ““maybe she tried using some oil eeh,
and it and then it reacted with the body””. C1 agrees and states that ““there was a
reaction””, and C2 says that ““she is trying to portray that when you put some make
ups, they bring some effects ... some of these make ups and the rest they are made of
chemicals””. All three social classes use the word ““cheap”” to describe the value of
the product.
Focus group 1, all think that the face photograph gives the impression that the product
smells good. An AB respondent says that ““it is smelling good””. C1 also agree that
““it smells good””, and C2 say the scent is ““nice””. They also would all go for the
product, an AB respondent says they would ““rather go for this one””, C1, ““Of
course ... yeah””, and C2 ““people would go for them””.
114
When looking at the face abstract painting, all three social classes in focus group 2,
believe that lighting is important in an image. An AB respondent says that they ““think
if you want to bring out the best in a person for advertising, you have to make sure the
lighting is perfect””. They state that what is used in the picture is ““way too much””.
The C1 respondent concurs, saying that ““there’s too much lighting ... too much.
Probably if they will have toned-down on the lighting a bit, you wouldn’t have been
seeing some discrepancies on that, on the texture of the face and the colour. Yeah, it’s
true there too much light””. C2 also state that ““there’s problem with the lighting””.
A graph is used to give a visual summary of the scaled qualitative data collected from
the 2 focus group discussions. It is representative because this is qualitative data
analysis and represents a continuous variable. Response is not an absolute, and there
are going to be varying opinions other than an absolute (Hayes, 2000, p. 283).
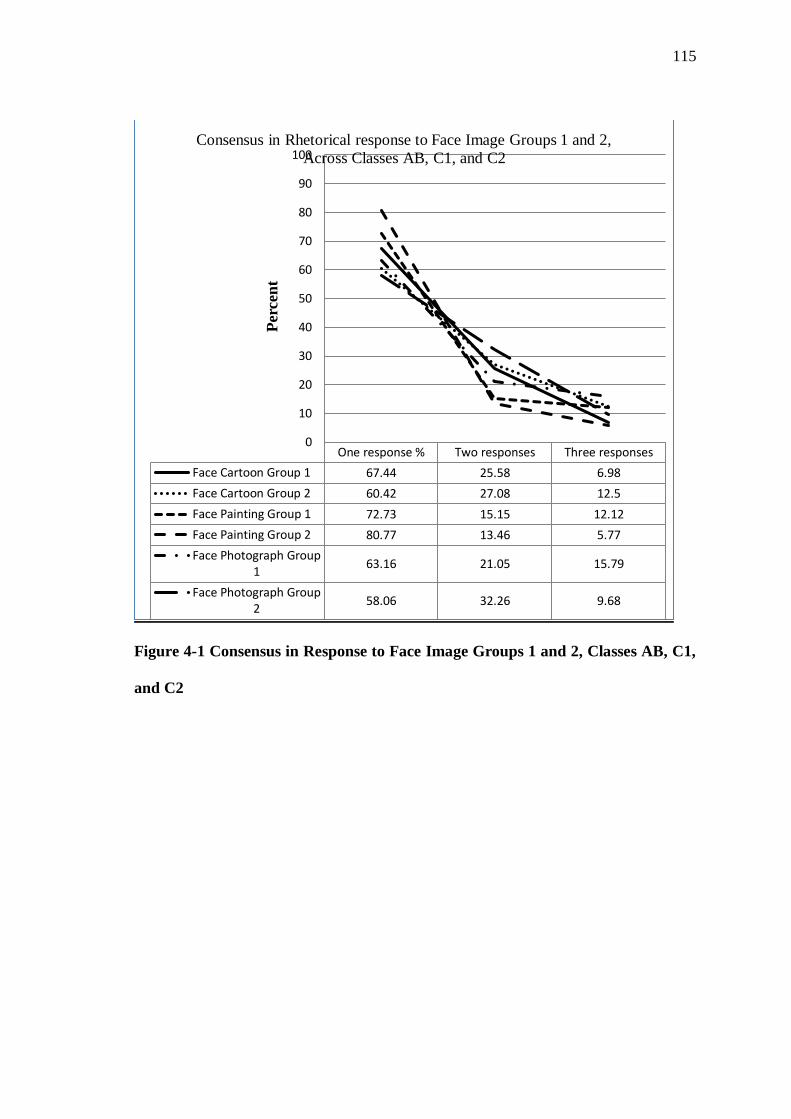
115
Figure 4-1 Consensus in Response to Face Image Groups 1 and 2, Classes AB, C1,
and C2
One response % Two responses Three responses
Face Cartoon Group 1 67.44 25.58 6.98
Face Cartoon Group 2 60.42 27.08 12.5
Face Painting Group 1 72.73 15.15 12.12
Face Painting Group 2 80.77 13.46 5.77
Face Photograph Group1
63.16 21.05 15.79
Face Photograph Group2
58.06 32.26 9.68
0
10
20
30
40
50
60
70
80
90
100
Per
cen
t
Consensus in Rhetorical response to Face Image Groups 1 and 2,
Across Classes AB, C1, and C2
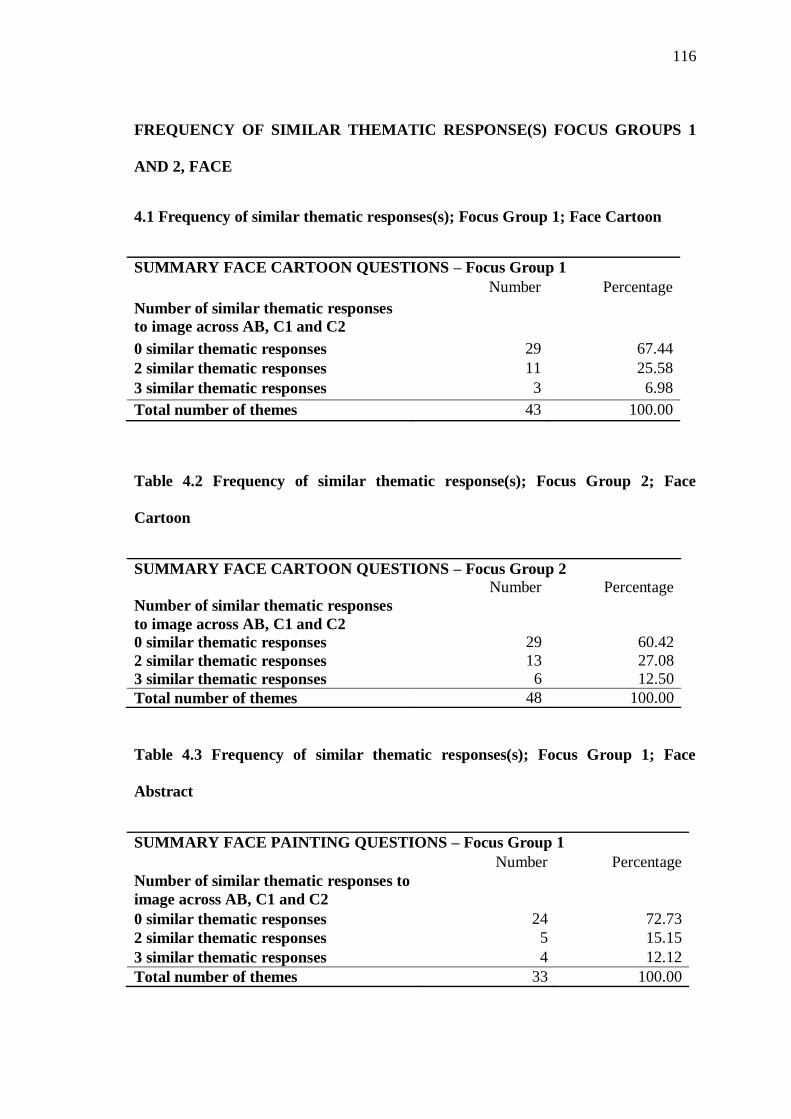
116
FREQUENCY OF SIMILAR THEMATIC RESPONSE(S) FOCUS GROUPS 1
AND 2, FACE
4.1 Frequency of similar thematic responses(s); Focus Group 1; Face Cartoon
SUMMARY FACE CARTOON QUESTIONS – Focus Group 1
Number Percentage
Number of similar thematic responses
to image across AB, C1 and C2
0 similar thematic responses 29 67.44
2 similar thematic responses 11 25.58
3 similar thematic responses 3 6.98
Total number of themes 43 100.00
Table 4.2 Frequency of similar thematic response(s); Focus Group 2; Face
Cartoon
SUMMARY FACE CARTOON QUESTIONS – Focus Group 2
Number Percentage
Number of similar thematic responses
to image across AB, C1 and C2
0 similar thematic responses 29 60.42
2 similar thematic responses 13 27.08
3 similar thematic responses 6 12.50
Total number of themes 48 100.00
Table 4.3 Frequency of similar thematic responses(s); Focus Group 1; Face
Abstract
SUMMARY FACE PAINTING QUESTIONS – Focus Group 1
Number Percentage
Number of similar thematic responses to
image across AB, C1 and C2
0 similar thematic responses 24 72.73
2 similar thematic responses 5 15.15
3 similar thematic responses 4 12.12
Total number of themes 33 100.00
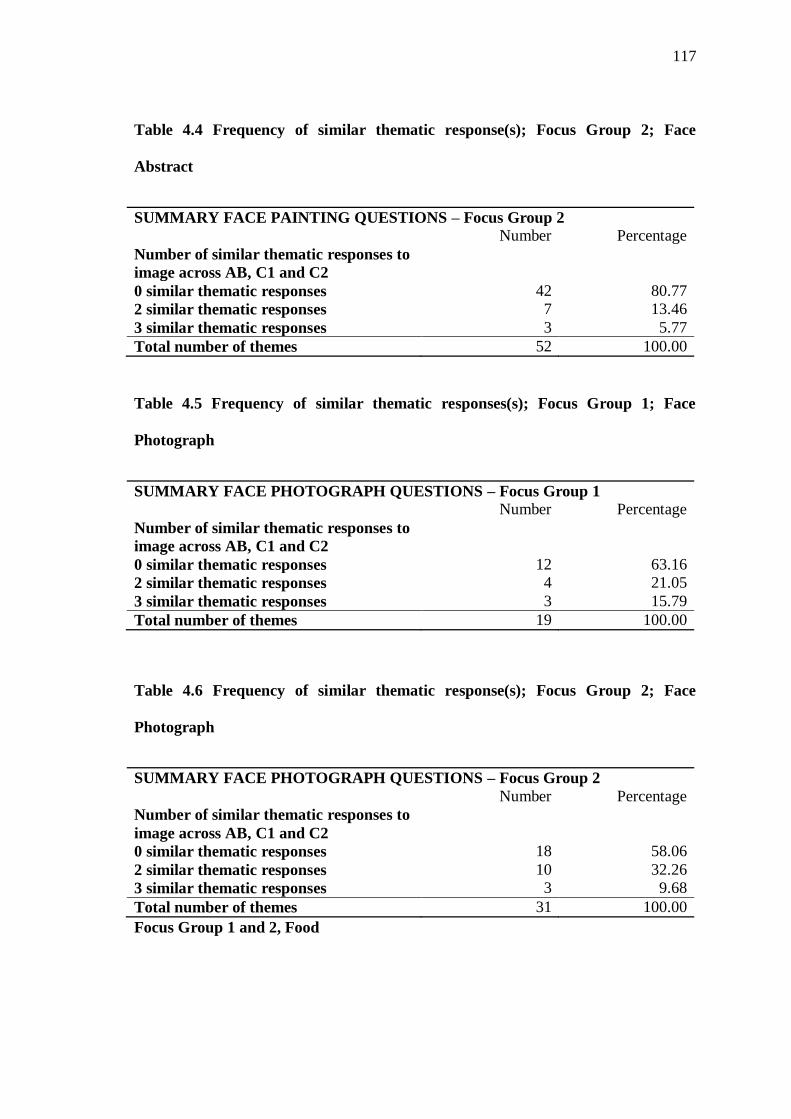
117
Table 4.4 Frequency of similar thematic response(s); Focus Group 2; Face
Abstract
SUMMARY FACE PAINTING QUESTIONS – Focus Group 2
Number Percentage
Number of similar thematic responses to
image across AB, C1 and C2
0 similar thematic responses 42 80.77
2 similar thematic responses 7 13.46
3 similar thematic responses 3 5.77
Total number of themes 52 100.00
Table 4.5 Frequency of similar thematic responses(s); Focus Group 1; Face
Photograph
SUMMARY FACE PHOTOGRAPH QUESTIONS – Focus Group 1
Number Percentage
Number of similar thematic responses to
image across AB, C1 and C2
0 similar thematic responses 12 63.16
2 similar thematic responses 4 21.05
3 similar thematic responses 3 15.79
Total number of themes 19 100.00
Table 4.6 Frequency of similar thematic response(s); Focus Group 2; Face
Photograph
SUMMARY FACE PHOTOGRAPH QUESTIONS – Focus Group 2
Number Percentage
Number of similar thematic responses to
image across AB, C1 and C2
0 similar thematic responses 18 58.06
2 similar thematic responses 10 32.26
3 similar thematic responses 3 9.68
Total number of themes 31 100.00
Focus Group 1 and 2, Food
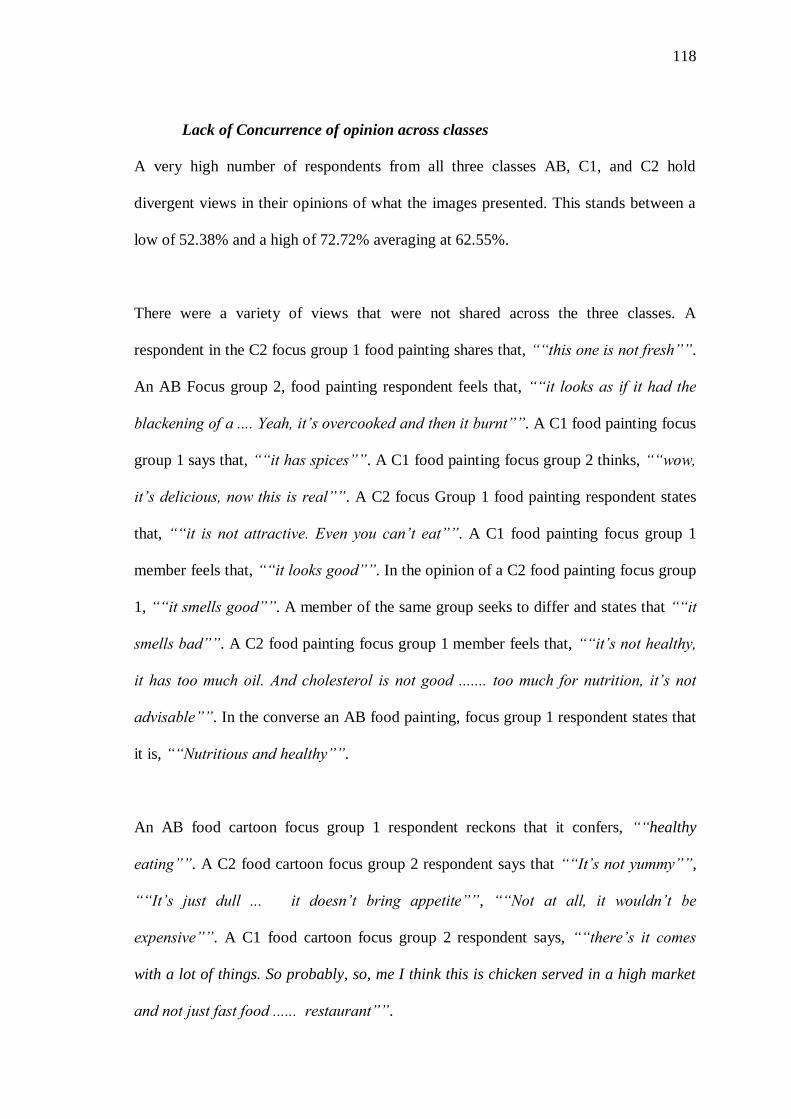
118
Lack of Concurrence of opinion across classes
A very high number of respondents from all three classes AB, C1, and C2 hold
divergent views in their opinions of what the images presented. This stands between a
low of 52.38% and a high of 72.72% averaging at 62.55%.
There were a variety of views that were not shared across the three classes. A
respondent in the C2 focus group 1 food painting shares that, ““this one is not fresh””.
An AB Focus group 2, food painting respondent feels that, ““it looks as if it had the
blackening of a .... Yeah, it’s overcooked and then it burnt””. A C1 food painting focus
group 1 says that, ““it has spices””. A C1 food painting focus group 2 thinks, ““wow,
it’s delicious, now this is real””. A C2 focus Group 1 food painting respondent states
that, ““it is not attractive. Even you can’t eat””. A C1 food painting focus group 1
member feels that, ““it looks good””. In the opinion of a C2 food painting focus group
1, ““it smells good””. A member of the same group seeks to differ and states that ““it
smells bad””. A C2 food painting focus group 1 member feels that, ““it’s not healthy,
it has too much oil. And cholesterol is not good ....... too much for nutrition, it’s not
advisable””. In the converse an AB food painting, focus group 1 respondent states that
it is, ““Nutritious and healthy””.
An AB food cartoon focus group 1 respondent reckons that it confers, ““healthy
eating””. A C2 food cartoon focus group 2 respondent says that ““It’s not yummy””,
““It’s just dull ... it doesn’t bring appetite””, ““Not at all, it wouldn’t be
expensive””. A C1 food cartoon focus group 2 respondent says, ““there’s it comes
with a lot of things. So probably, so, me I think this is chicken served in a high market
and not just fast food ...... restaurant””.
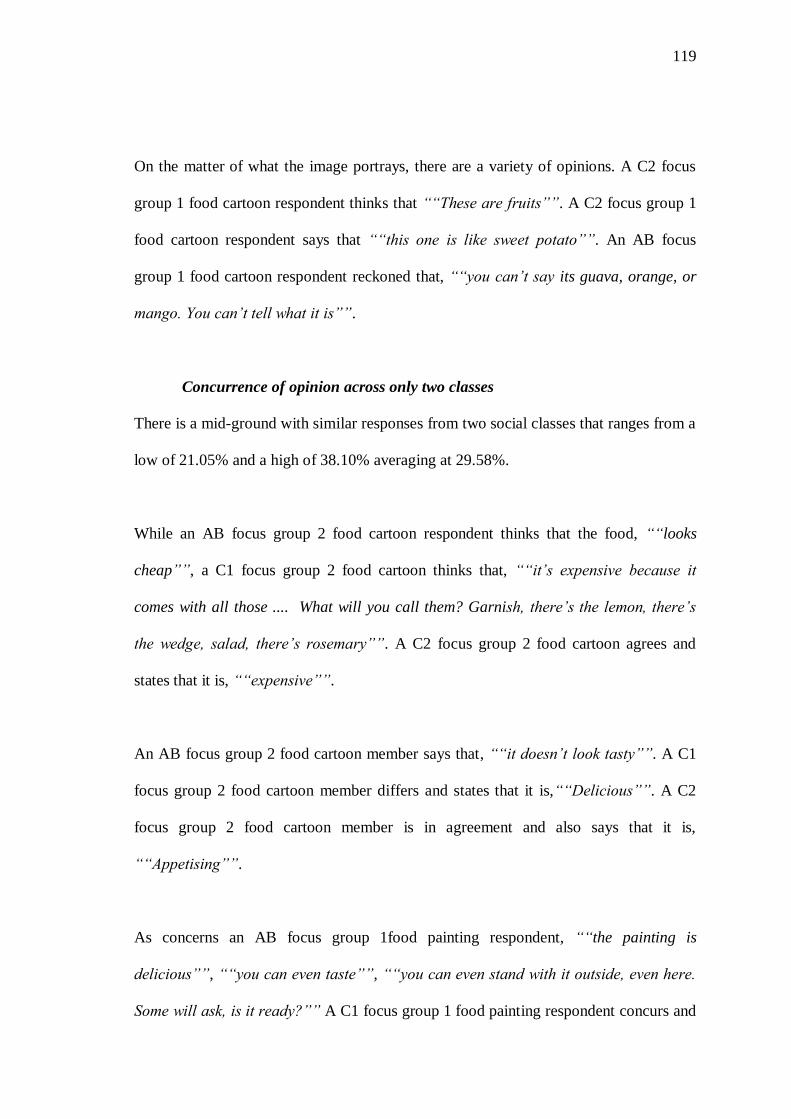
119
On the matter of what the image portrays, there are a variety of opinions. A C2 focus
group 1 food cartoon respondent thinks that ““These are fruits””. A C2 focus group 1
food cartoon respondent says that ““this one is like sweet potato””. An AB focus
group 1 food cartoon respondent reckoned that, ““you can’t say its guava, orange, or
mango. You can’t tell what it is””.
Concurrence of opinion across only two classes
There is a mid-ground with similar responses from two social classes that ranges from a
low of 21.05% and a high of 38.10% averaging at 29.58%.
While an AB focus group 2 food cartoon respondent thinks that the food, ““looks
cheap””, a C1 focus group 2 food cartoon thinks that, ““it’s expensive because it
comes with all those .... What will you call them? Garnish, there’s the lemon, there’s
the wedge, salad, there’s rosemary””. A C2 focus group 2 food cartoon agrees and
states that it is, ““expensive””.
An AB focus group 2 food cartoon member says that, ““it doesn’t look tasty””. A C1
focus group 2 food cartoon member differs and states that it is,““Delicious””. A C2
focus group 2 food cartoon member is in agreement and also says that it is,
““Appetising””.
As concerns an AB focus group 1food painting respondent, ““the painting is
delicious””, ““you can even taste””, ““you can even stand with it outside, even here.
Some will ask, is it ready?”” A C1 focus group 1 food painting respondent concurs and
120
states that it is ““Appetising””. Another from the same group describes it as a
““Delicious meal””. A C2 focus group 1 food painting respondent when asked if the
food is delicious, disagrees and says““no””.
An AB focus group 1 food painting respondent says that the food““smells nice””. A
C1 focus group 1 food painting respondent agrees and says ““its smell too is tasty””. A
C2 focus group 1 food painting respondent disagrees and says, ““I don’t think it smells
nice. The look!””
An AB focus group 1food painting respondent states that the food is,““Nutritious and
healthy””. A C1 focus group 1 food painting respondent when asked if the food bears
element of it being healthy, responds with a““Yeah””. A C2 focus group 1 food
painting respondent answers this question in the negative, saying that it is unhealthy by
stating that ““we should avoid the fatty, fatty food””.
Concurrence of opinion across all three classes
All three classes agree on the same communicative message at a low of 3.7% and a
high of 17.65% averaging at 10.68%. These figures bear testimony to a high rate of
divergence of opinion.
All the respondents are doubtful as to what the food cartoon image portrays. An AB
focus group 1 food cartoon respondent states that, ““the cartoon is not revealing
anything, in fact you’ll just know it is chicken because of the leg here but you don’t
know because if you put like this it looks like meat””, ““they don’t look anything to
me””, ““the only thing that will make you know that it is a chicken it’s these parts.
121
[Drumstick]””. A C1 focus group 1 food cartoon respondent concurs and states that,
““this looks like eeeh, chicken. But now, a chicken is not like this. This brown,
something like orange, brown here””. A C2 focus group 1 food cartoon agrees saying,
““but you can’t tell what is on the plate””, ““you can’t say it’s guava, orange, or
mango. You can’t tell what it is the arrangement, you cannot see what is it””.
When the food painting is looked at, an AB focus group 1 respondent says of it that““it
smells nice””. A C1 focus group 1 respondent agrees and says that ““its smell too is
tasty”” and a C2 focus group 1 respondent says ““it can also smell sweet””.
Concerning focus group 1 and the food photograph, an AB respondent states that it is
““very, very attractive””. A C1 respondent goes further to say that, ““the food is more
attractive””. A C2 respondent says that, ““it looks very good””.
When focus group 1 discusses the food photograph, an AB respondent reckons that““if
he’s setting up like this that means the price must be a little bit high end””. A C1
respondent is more direct and states that it is ““expensive””. A C1 respondent says
that, ““it’s 500 maybe, but, it’s not affordable to everyone, 500 is expensive””.
When focus group 2 discusses the food photograph, an AB respondent says that, ““this
picture is nice””. A C1 respondent agrees and says that ““it attracts””. A C2
respondent’s says that it is ““attractive””.
The food is deemed as tasty across the three focus group 2 food photography
respondents. An AB respondent says it is ““tasty””. A C1 focus respondent simply
122
says ““wow, it’s delicious””. A C2 respondent thinks that it is ““tasty from the look of
it. Ooo–ooooo Yes””.
The Focus group 2 food photograph respondents feel that the image portrays the
chicken as it really is. An AB respondent says, ““now this is real. [Laughter]. Now you
are talking. Now this one ...””. A C1 respondent says, ““that one is chicken””. A C2
respondent states that it is ““convincing””.
A graph is used to give a visual summary of the scaled qualitative data collected from
the 2 focus group discussions. It is representative because this is qualitative data
analysis and represents a continuous variable. Response is not an absolute, and there
are going to be varying opinions other than an absolute (Hayes, 2000, p. 283).

123
Figure 4-2 Consensus in Response to Food Image Groups 1 and 2, Classes AB, C1,
and C2
One Response %Two Responses
%Three
Responses %
Food Cartoon Group 1 74.07 22.22 3.7
Food Cartoon Group 2 58.82 23.53 17.65
Food Painting Group 1 72.72 22.73 4.55
Food Painting Group 2 52.38 38.1 9.52
Food Photograph Group1
68.42 21.05 10.53
Food Photograph Group2
58.82 23.53 17.65
0
10
20
30
40
50
60
70
80
90
100
Per
cen
t
Consensus in Rhetorical Response to Food Image Groups 1 and 2,
Across Classes AB, C1, and C2
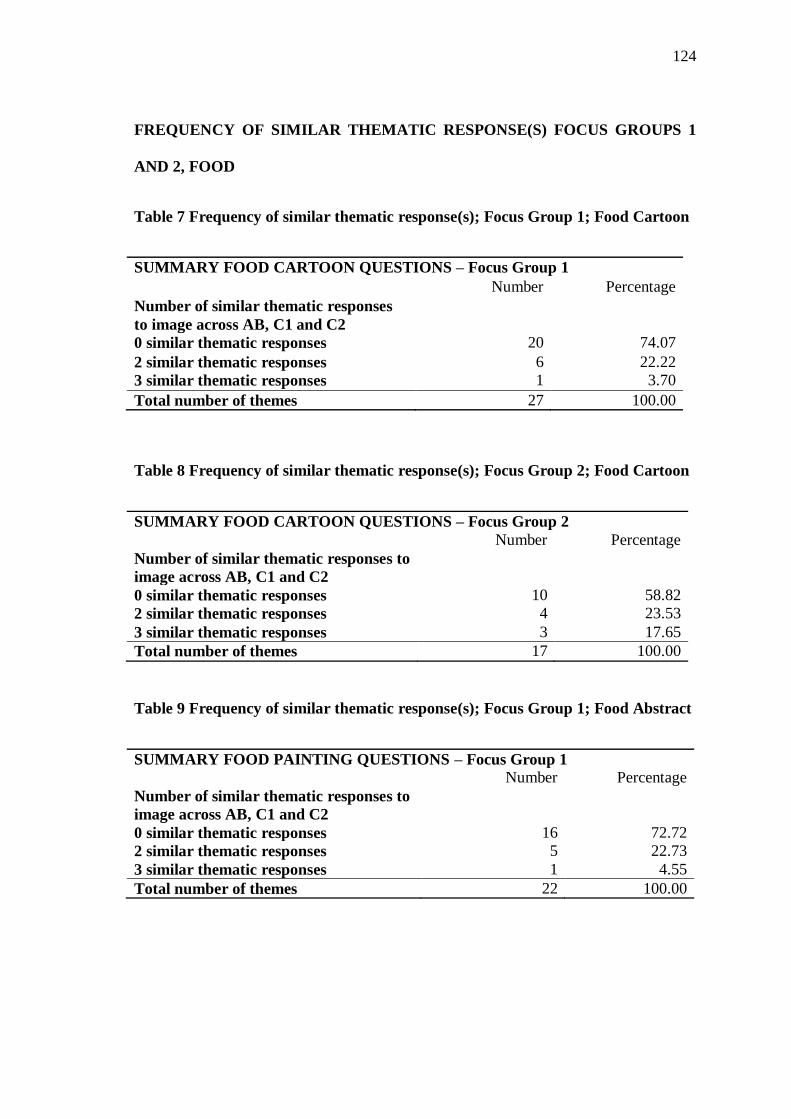
124
FREQUENCY OF SIMILAR THEMATIC RESPONSE(S) FOCUS GROUPS 1
AND 2, FOOD
Table 7 Frequency of similar thematic response(s); Focus Group 1; Food Cartoon
SUMMARY FOOD CARTOON QUESTIONS – Focus Group 1
Number Percentage
Number of similar thematic responses
to image across AB, C1 and C2
0 similar thematic responses 20 74.07
2 similar thematic responses 6 22.22
3 similar thematic responses 1 3.70
Total number of themes 27 100.00
Table 8 Frequency of similar thematic response(s); Focus Group 2; Food Cartoon
SUMMARY FOOD CARTOON QUESTIONS – Focus Group 2
Number Percentage
Number of similar thematic responses to
image across AB, C1 and C2
0 similar thematic responses 10 58.82
2 similar thematic responses 4 23.53
3 similar thematic responses 3 17.65
Total number of themes 17 100.00
Table 9 Frequency of similar thematic response(s); Focus Group 1; Food Abstract
SUMMARY FOOD PAINTING QUESTIONS – Focus Group 1
Number Percentage
Number of similar thematic responses to
image across AB, C1 and C2
0 similar thematic responses 16 72.72
2 similar thematic responses 5 22.73
3 similar thematic responses 1 4.55
Total number of themes 22 100.00
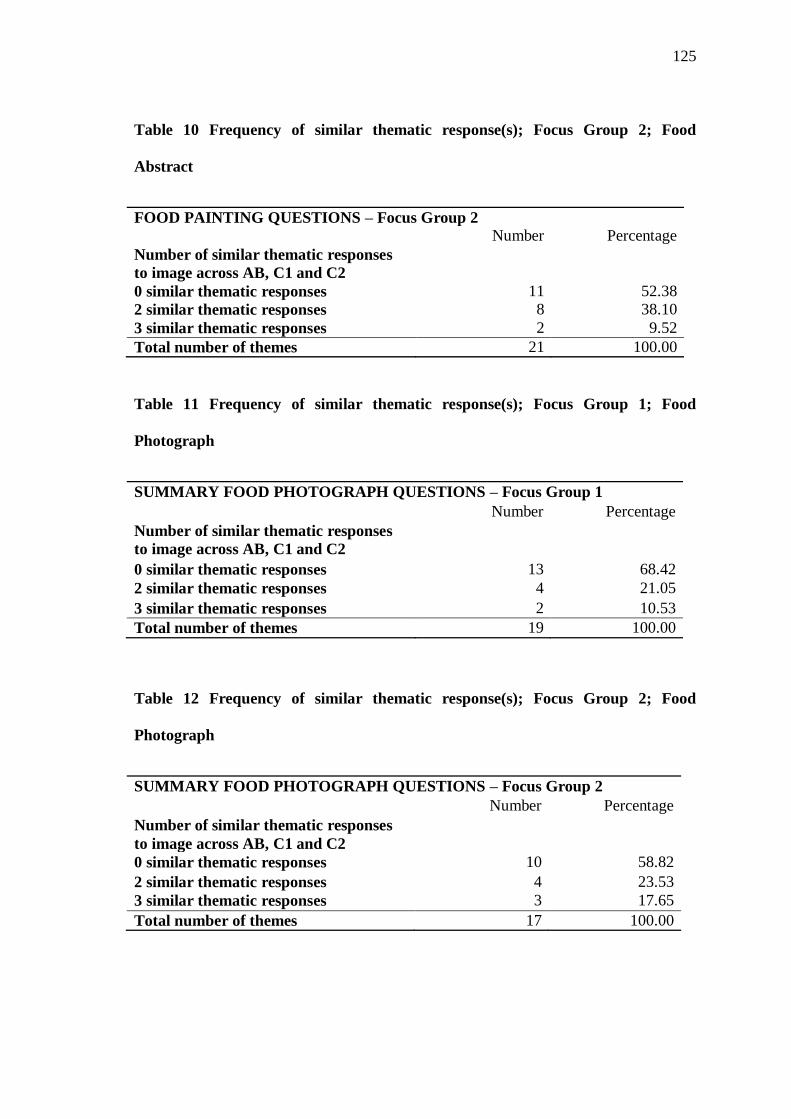
125
Table 10 Frequency of similar thematic response(s); Focus Group 2; Food
Abstract
FOOD PAINTING QUESTIONS – Focus Group 2
Number Percentage
Number of similar thematic responses
to image across AB, C1 and C2
0 similar thematic responses 11 52.38
2 similar thematic responses 8 38.10
3 similar thematic responses 2 9.52
Total number of themes 21 100.00
Table 11 Frequency of similar thematic response(s); Focus Group 1; Food
Photograph
SUMMARY FOOD PHOTOGRAPH QUESTIONS – Focus Group 1
Number Percentage
Number of similar thematic responses
to image across AB, C1 and C2
0 similar thematic responses 13 68.42
2 similar thematic responses 4 21.05
3 similar thematic responses 2 10.53
Total number of themes 19 100.00
Table 12 Frequency of similar thematic response(s); Focus Group 2; Food
Photograph
SUMMARY FOOD PHOTOGRAPH QUESTIONS – Focus Group 2
Number Percentage
Number of similar thematic responses
to image across AB, C1 and C2
0 similar thematic responses 10 58.82
2 similar thematic responses 4 23.53
3 similar thematic responses 3 17.65
Total number of themes 17 100.00
126
4.2.2 Synopsis of Face and Food Results between Demographic Groupings
It was believed that the three different cohorts AB, C1, and C2 would have divergent
views on the images presented to them. The results posted for both face and food
responses across both focus groups 1 and 2 confirmed these beliefs to be true. They
clearly showed that respondents from the different groups have high levels of divergent
views, displaying similar patterns throughout. See Figure 4-1 Response to Face Image
Groups 1 and 2, Across Classes AB, C1, and C2 and Figure 4-2 Response to Food
Image Groups 1 and 2, Across Classes AB, C1, and C2.
Results representing the face image focus groups both 1 and 2 amalgamated in Table 4.
showed that an average of 69.42% of the responses given, were attributed to only one
social class cohort. Meaning that these were singular thematic responses in that the
opinions, ideas and thoughts they propagated were not shared with any other cohort.
22.86% of the responses were similar in two cohorts and only 10.78% of the views cut
across and were shared by all three social class cohorts.
The results for the food images in both focus groups 1 and 2 did not differ much, also
supporting the belief the three cohorts had divergent views. An average of 62.55% of
the responses were single responses that were not shared by any of the other two social
class cohorts. 29.58% of the responses are shared among two cohorts and only 10.68%
of the responses were common to all 3 cohorts.
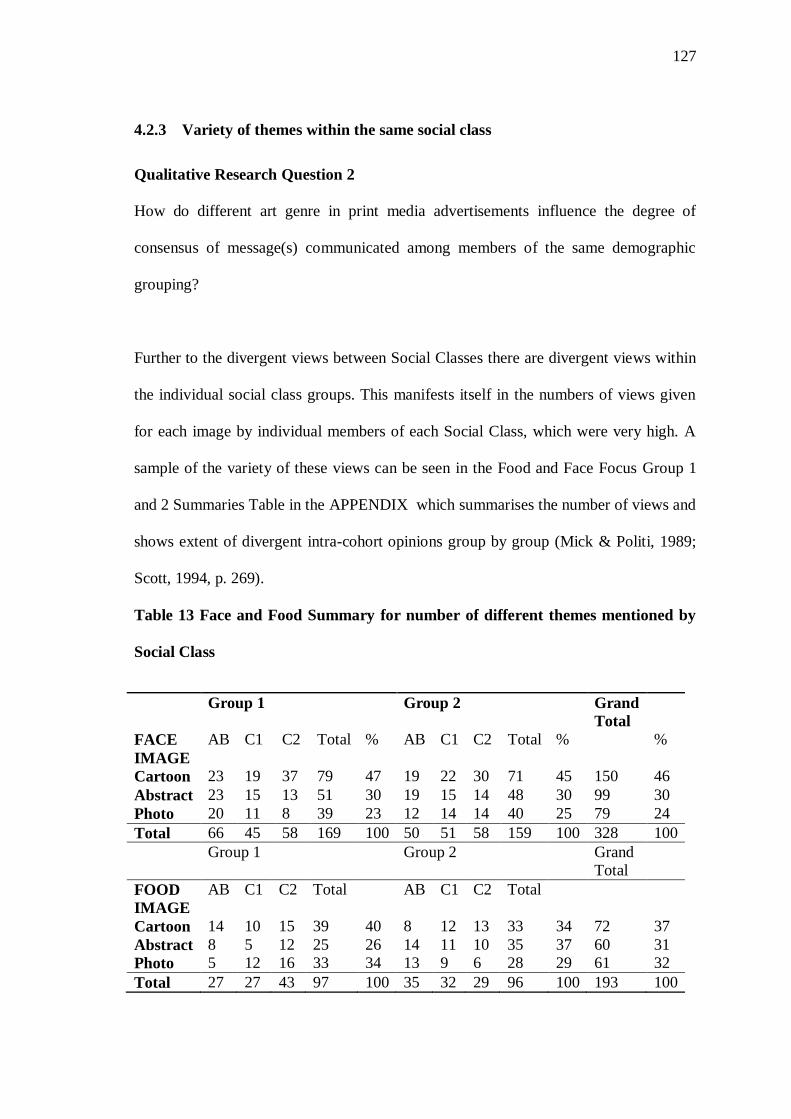
127
4.2.3 Variety of themes within the same social class
Qualitative Research Question 2
How do different art genre in print media advertisements influence the degree of
consensus of message(s) communicated among members of the same demographic
grouping?
Further to the divergent views between Social Classes there are divergent views within
the individual social class groups. This manifests itself in the numbers of views given
for each image by individual members of each Social Class, which were very high. A
sample of the variety of these views can be seen in the Food and Face Focus Group 1
and 2 Summaries Table in the APPENDIX which summarises the number of views and
shows extent of divergent intra-cohort opinions group by group (Mick & Politi, 1989;
Scott, 1994, p. 269).
Table 13 Face and Food Summary for number of different themes mentioned by
Social Class
Group 1 Group 2 Grand
Total
FACE
IMAGE
AB C1 C2 Total % AB C1 C2 Total % %
Cartoon 23 19 37 79 47 19 22 30 71 45 150 46
Abstract 23 15 13 51 30 19 15 14 48 30 99 30
Photo 20 11 8 39 23 12 14 14 40 25 79 24
Total 66 45 58 169 100 50 51 58 159 100 328 100
Group 1 Group 2 Grand
Total
FOOD
IMAGE
AB C1 C2 Total AB C1 C2 Total
Cartoon 14 10 15 39 40 8 12 13 33 34 72 37
Abstract 8 5 12 25 26 14 11 10 35 37 60 31
Photo 5 12 16 33 34 13 9 6 28 29 61 32
Total 27 27 43 97 100 35 32 29 96 100 193 100
128
As seen in Table 13, it must be noted that the themes mentioned were sometimes
repeated across the various social classes. Besides the diversity of themes mentioned,
there was also contradiction of opinions on specific themes.
The great diversity of opinion within the social classes goes against the assumption that
cultural homogeneity within the social classes would yield homogenous thoughts
concerning the images. In Group 1 of the focus group discussion, the Face Cartoon
elicited 43 different views. The Face Abstract Painting had 33 views, and the Face
Photograph19 differing views. The Food Cartoon in Group 1 had 27 views, the Food
Abstract Painting 22 views, and the Food Photograph 19 views. In Group 2 of the focus
group discussion the Face Cartoon elicited 48 different views, the Face Abstract
Painting had 52, and the Face Photograph had 31 differing views. The Food Cartoon in
Group 2 had 17, the Food Abstract Painting 21 views, and the Food Photograph 17
views.
In the AB focus group 1 Face cartoon, there are contradictory messages within groups
such as, ““there’s nothing that captures my eye as a person”” followed by another
respondent who in converse states, ““what can make you look at it twice is maybe the
skin of the lady””.
An AB respondent in focus group 1 believes that the Face painting is a good piece of
artwork and says ““it shows how this person can really do something ….. he can do
something out of his art””. Another respondent from the same group disagrees and
goes on to say, ““the painting should have been finer. I would not buy””.
129
An AB respondent in focus group 1 says of the face painting that they ““would say
[that the lotion is] natural””, yet another respondent in the same group confides that,
““the lotion has some hard chemical on it””.
An AB respondent in focus group 1 looking at the Food painting, thinks that ““the
painting is more attractive ... it looks ... it has a 3D effect to it. It looks like your looking
at something real””. A member of the same group begs to differ and says that, ““it is
not chicken that is going to attract you when you’re looking to eat in a good place it’s
just for a hungry stomach. It doesn’t look good””.
It would appear that the social classes studied herein do not possess a singular
interpretation of the art styles as presented. They may not have formed one as yet, or
suffer another challenge, as they clearly did not decipher congruent messages from the
images as presented.
This second observation, put the first observation on the disparity between groups into
question, and may have rendered it of no major consequence. The first observation
would have only been appreciable if the second confirmed the internal group consensus
of respondent views. As it was, the second observation portrays that the dissonance
between groups may be due to lack of conformity within groups. This indicates that the
incongruity between groups may not be due to factors related to the demographics
studied.
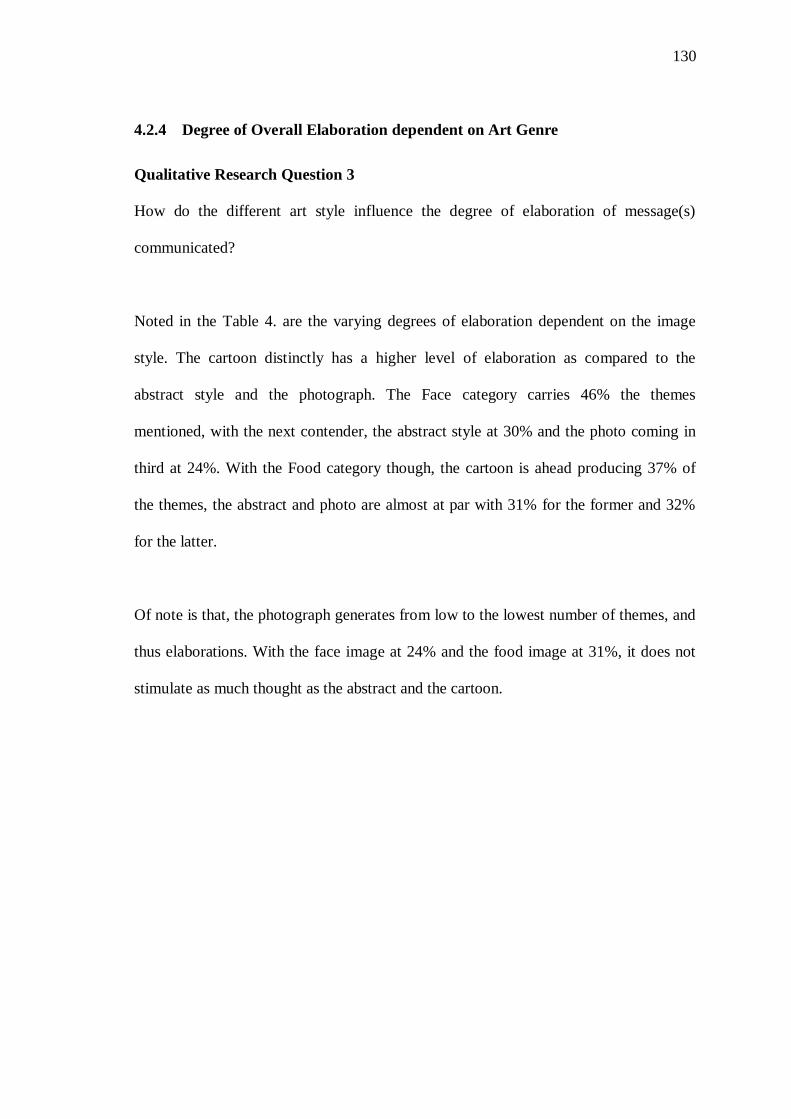
130
4.2.4 Degree of Overall Elaboration dependent on Art Genre
Qualitative Research Question 3
How do the different art style influence the degree of elaboration of message(s)
communicated?
Noted in the Table 4. are the varying degrees of elaboration dependent on the image
style. The cartoon distinctly has a higher level of elaboration as compared to the
abstract style and the photograph. The Face category carries 46% the themes
mentioned, with the next contender, the abstract style at 30% and the photo coming in
third at 24%. With the Food category though, the cartoon is ahead producing 37% of
the themes, the abstract and photo are almost at par with 31% for the former and 32%
for the latter.
Of note is that, the photograph generates from low to the lowest number of themes, and
thus elaborations. With the face image at 24% and the food image at 31%, it does not
stimulate as much thought as the abstract and the cartoon.
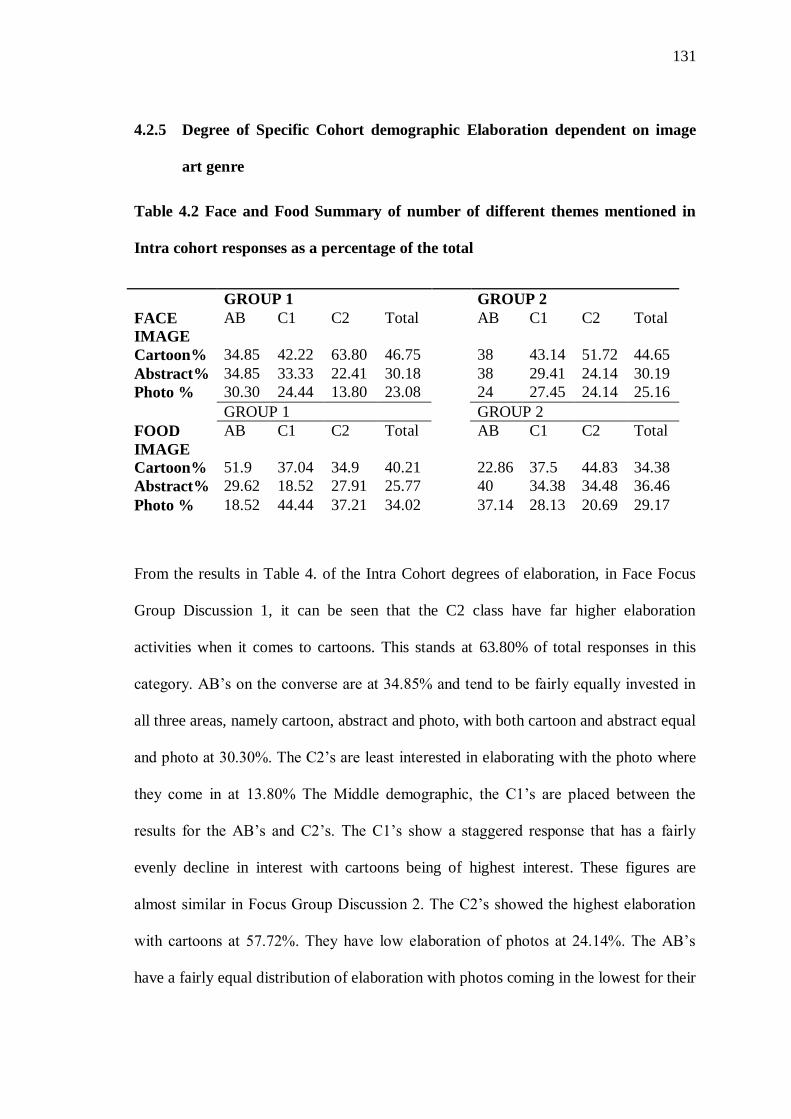
131
4.2.5 Degree of Specific Cohort demographic Elaboration dependent on image
art genre
Table 4.2 Face and Food Summary of number of different themes mentioned in
Intra cohort responses as a percentage of the total
GROUP 1 GROUP 2
FACE
IMAGE
AB C1 C2 Total AB C1 C2 Total
Cartoon% 34.85 42.22 63.80 46.75 38 43.14 51.72 44.65
Abstract% 34.85 33.33 22.41 30.18 38 29.41 24.14 30.19
Photo % 30.30 24.44 13.80 23.08 24 27.45 24.14 25.16
GROUP 1 GROUP 2
FOOD
IMAGE
AB C1 C2 Total AB C1 C2 Total
Cartoon% 51.9 37.04 34.9 40.21 22.86 37.5 44.83 34.38
Abstract% 29.62 18.52 27.91 25.77 40 34.38 34.48 36.46
Photo % 18.52 44.44 37.21 34.02 37.14 28.13 20.69 29.17
From the results in Table 4. of the Intra Cohort degrees of elaboration, in Face Focus
Group Discussion 1, it can be seen that the C2 class have far higher elaboration
activities when it comes to cartoons. This stands at 63.80% of total responses in this
category. AB’s on the converse are at 34.85% and tend to be fairly equally invested in
all three areas, namely cartoon, abstract and photo, with both cartoon and abstract equal
and photo at 30.30%. The C2’s are least interested in elaborating with the photo where
they come in at 13.80% The Middle demographic, the C1’s are placed between the
results for the AB’s and C2’s. The C1’s show a staggered response that has a fairly
evenly decline in interest with cartoons being of highest interest. These figures are
almost similar in Focus Group Discussion 2. The C2’s showed the highest elaboration
with cartoons at 57.72%. They have low elaboration of photos at 24.14%. The AB’s
have a fairly equal distribution of elaboration with photos coming in the lowest for their
132
category at 24%, and both cartoons and abstract at 38%. The C1 group again come in
between AB’s and C2’s with a staggered distribution of elaboration.
These figures do not carry across to the Food. Here, with Focus Group Discussion 1,
the AB’s are most interested in elaborating on the cartoons. They come in at 51.9% and
the C2’s at 34.9%. Their figure patterns are literally exchanged with the C2’s having
fairly equal distribution of elaboration ranging from 27.91% for Abstract and a high of
34.9% for Cartoon. The AB’s have a low of 18.52% for photo, which is low as
compared to their elaboration levels for face. The C1’s here have a high of 44.44% for
photo and a low of 18.52 on abstract. Their cartoon elaboration stands at 37.04%. They
are interested in the photo and cartoon, but not so much in the abstract image. There is
no discernible pattern here. With the food Focus Group Discussion 2, there is a mild
reflection of what was seen with Focus Group Discussion 1. The AB’s prefer to
elaborate on the Abstract image at 40.00% and least on the cartoon at 22.86%. The
C2’s elaborated most on the cartoon at 44.83% and least on the photo at 20.69%. This
pattern is consistent with what was seen with the face, where the cartoon held the most
interest for the C2’s. The C1’s follow the trend they set for the face and have a
staggered reduction in their elaboration interests that go from a high of 37.5% with the
carton, through to 34.38% with the abstract and a low of 28.13% with the photo.
Generally, it can be observed that the cartoon held the highest level of elaboration
interest for the C2’s at the cost of the other two style types. The AB’s appear to have
interests that are spread out between the three areas of style. The C1’s have the highest
interest in the cartoons that are staggered and decrease gradually through the abstract,
with the lowest level interest in the photo.
133
The respondents reacted to the elements and principles of design as portrayed by the
images in a variety of ways. This was reflected in their responses.
When the AB focus group 1 looks at the face painting, a respondent thinks that, ““the
skin is good””, with another stating that, ““there’s glow, so there’s richness””, and yet
another that the model appears, ““natural””. It is viewed by a respondent as reflecting
the face realistically, and goes on to say,
““The painting is real, you can see all the marks, even her hands the way they
are, they are real. Even the way that the sun has reflected on her face you can
see it’s a shining face so it is a real thing.””
Another respondent feels that the painting communicates and says that, ““I would go
with the painting because there is more of a connection””. However, there is a
difference of opinion as to the degree of expressionistic leanings that the painting
should embrace. Two respondents had this to say, ““the painting should have been
finer. I would not buy [painting], (crosstalk) I would go for the cartoon”” and, ““I
agree with what [name withheld] is saying, (painting should have been finer) but I
think it’s very real [painting]””. The level of acceptance of abstraction of a painting is
subjective. A respondent feels that, ““the painting is artificial””, and yet another who
concurs feels that the painting simply does not communicate as it should, and that the
expressionism style has been applied to the extreme saying that,
““I would leave this one for ‘Peter Marangi’ [wall paint advertisement
TV comedy character] ... if you look at it, I am just seeing so many colours.
There’s, you see this side uuhhhh, Yeah, she’s uuhhh green. Some places are ...
I don’t know. I can’t even tell what is going on. She’s applying some ... I can’t
say. I can’t tell anything, Yeah, Maybe if the paint had ... Yeah, he overdid it.””
134
One respondent views the variety of colours on the painting as signifying that the
model, ““will have not a very good smell””, while an alternate respondent feels that,
““she was trying to bleach herself””, and yet another that, ““she applied something to
her body that reacted””. There is also a thought by a respondent that the painting
conveys, ““a tired woman who has work””, with another saying that, ““she’s not
taken good care of herself to know what is going to make her skin look nice””.
As concerns the face photograph, an AB focus group 1 respondent feels that it does not
attract attention. She says, ““if the photo was in a newspaper for an advert, I would not
look at it actually ... photos, they’re always there””. Another says, ““I’d definitely not
look at it””. Beyond this, the art genre used is not mentioned.
4.2.6 More visually complex art styles elicit more elaboration
Of the total comments, an average of 42.49% comments came from the face and food
cartoon images combined. The face and Food abstract painting combined yielded
33.55% of the comments, and the face and food photograph generated 23.97% of the
comments. The more complex cartoon image generated the highest degree of
elaboration, with the photograph, which is the least complex or deviated image in the
eyes of the public eliciting the lowest amount of elaboration and generating the least
amount of themes (Mohanty & Ratneshwar, 2014; Schroeder J. E., 2002; Scott, 1994).
The cartoon image elicits a far greater level of elaboration for the C2 class. There
interests in the photo are not as high. The AB’s tend to have a fairly distributed interest
in the three style types, with only slightly higher interest in the cartoon. The C1’s
straddle between the AB’s and the C2’s reflecting a staggered interest which descends
gradually from a high in the cartoon and a low in the photograph. These patterns are
135
discernable in the Table 4.. Their formation seems to be affected by demographic class
of the respondents. This gives a strong suggestion that demographic groupings and thus
socialisation does have some effect on the response and thus the levels of elaboration of
an individual.
Discerned, is that the face images show a distinct difference from the food images in
the perception to the three art styles employed. The face image responses show a
distinct three tier response where the cartoon, abstract and photo have stepped
differences at 46%, 30%, and 24% respectively. The differences for the food images are
however divided into two distinct tiers with the cartoon at one level at 37%, and the
abstract and photo bundled together at 31%, and 32%. There is more elaboration about
the cartoon in the Food images.
4.3 Findings from Questionnaires
The second part of this research which is quantitative in nature, uses inferential
statistics. Cross tabulations are carried out between the research questions and the
social class, age and level of education of the respondents. The various tests carried out
such as the Levene’s test of equality error variances that show the way forward with the
ideal consequent tests to carry out are discussed. The inferential statistics that employ
the use of one way multivariate analysis of variance (MANOVA) are also discussed in
detail in relation to the data collected.
136
4.3.1 Inferential Statistics Tests: Results of Descriptive, Box’s and Multivarite
Tests
A One–way multiple analysis of variance (MANOVA) was used to carry out the study,
as there were several dependent variables in play. These dependent variables needed to
be considered together as they were related. The MANOVA test was able to indicate
whether or not there were significant differences between the groups at hand therefore
allowing the acceptance or rejection of the null hypothesis.
Interpretation of output
The Primary Data was collected and entered into SPSS.
i) Descriptive Statistics
The Descriptive Statistics generated the mean, Standard Deviation and numbers of
respondents classified by the social class, age and level of education of the respondents.
It also gave the totals for each dependent variable considered. The mean and standard
deviation were not considered in this study as what was being examined was not the
departure from central tendencies, but the diversity of opinions. The N statistic in the
descriptive statistics was used to check if there were no violations of normality or
equality of variance. To make certain of this, it was necessary to see that the dependent
variables had a total of 30 or more cases. Furthermore, the ideal maximum variation of
the case numbers between the dependent variables ideally should not have stood at
more than1.5, in order to augur well for constituting a composite dependable variable
(Pallant, 2007, p. 286). Both of these factors were checked in the Descriptive Statistics
tables.
137
ii) Box’s Test of Equality of Covariance Matrices
Box’s Test of equality of covariance matrices was used next to check for violation of
the assumption of homogeneity of variances-covariance matrices. Box’s test is very
sensitive to departures from normality, so a significance value to larger than .001 was
taken as a non-violation of the assumption. The use of a p value of p > than .001 is
quite common.
When the Significance value in the Box’s Test of Equality of Covariance Matrices is
larger than .001, which is the preferred selection criterion, the assumption of
homogeneity of variance-covariance matrices has not been violated. In this case the use
of Wilk’s Lambda was appropriate and was employed. In the case that the assumption
of homogeneity of variance-covariance matrices was violated, the more robust Pillai’s
Trace Test was used because it is “not highly linked to assumptions about the normality
of the distribution of data (Northern Arizona University, 2015).”
iii) Multivariate Tests
Multivariate tests were then carried out to ascertain “whether there were statistically
significant differences among the groups on a linear combination of dependent
variables (Pallant, 2007).” There are a number of these to select from, with Wilk’s
Lambda and Pillai’s Trace Test being used here. When the significance level was below
.05, it was concluded that there was a difference among the groups. If it was above this,
it was deemed statistically insignificant. The demographic of social class, age or level
education did not have a significant effect on the dependent variable. Being statistically
insignificant, it was then not necessary to carry out further between-subject effects tests
which examine the univariate one way Analysis of variance (ANOVA).
138
4.3.2 Social Class and Face Cartoon Art Style results from MANOVA
A one way between groups multivariate analysis of variance was performed to
investigate social class differences in response to face images in print media cartoon
advertisement images. Nine dependent variables were used.
Descriptive Statistics
Each of the nine dependable variables in the N Column of the Descriptive Statistics
Table had more than the ideal of 30 cases, with AB at 60, C1 at 62, C2 at 84 making a
total of 206 cases. Furthermore, the ideal maximum variation of case numbers between
variables stood at 1.5. The case numbers here were equal with all dependent variables.
This met the ideal maximum variation and augured well for constituting a composite
dependent variable (Pallant, 2007, p. 286).
Box’s Test of Equality of Covariance Matrices
The Significance value in the Box’s Test of Equality of Covariance Matrices stood at
.114. It was larger than .001, the selected criterion. The assumption of homogeneity of
variance-covariance matrices had not been violated, therefore Wilk’s Lambda was the
appropriate test to use.
Multivariate Test
There was no significant difference, in response to the face cartoon images in social
classes AB, C1, and C2. F (18,390) = 1.240, p = .226, Wilk’s .895, partial 2 =
.054.
Results
The MANOVA investigated the social class differences in response to face images in
print media cartoon advertisement images. Nine dependent variables were used.
Preliminary assumption testing was conducted to check for normality, linearity,
139
univariate and multivariate outliers, homogeneity of variance-covariance, and
multicollinearity, with no serious violations noted. The p value was greater than .05.
There was no significant difference between AB, C1, and C2 when considered jointly
on the combined dependent variables of bleaching qualities, smooth skin, skin
reactions, product goodness, dry skin, product expense, product quality, harsh
chemicals in product, and artificial look. Wilk’s .895, F (18,390) = 1.240, p = .226,
partial 2 = .054.
With these results, it was not necessary to conduct a separate ANOVA for each
dependent variable. The null hypothesis was accepted. Social class does not create a
significant difference in respondents’ perception of the cartoon styles as used in print
media advertising.
4.3.3 Social class and Face Abstract Painting Art Style results from MANOVA
A one way between groups multivariate analysis of variance was performed to
investigate social class differences in response to images in print media abstract
advertisement images. Nine dependent variables were used.
Descriptive Statistics
Each of the nine dependent variables in the N Column of the Descriptive Statistics
Table had more than the ideal of 30 cases, with AB at 55, C1 at 67, C2 at 83 making a
total of 205 cases. Furthermore, the ideal maximum variation of case numbers between
variables stood at 1.5. The case numbers here were equal with all dependent variables.
This met the ideal maximum variation and augured well for constituting a composite
dependent variable (Pallant, 2007, p. 286).
140
Box’s Test of Equality of Covariance Matrices
The Significant value in the Box’s Test of Equality of Covariance Matrices stood at
.000. It was smaller than Sig. Value of .001, the selected criterion. In this case, the
assumption of homogeneity of variance-covariance matrices had been violated. Wilks’
Lambda test, had been carried out with the majority of the data in this study but was not
appropriate here. A more robust test, Pillai’s Trace was used (Northern Arizona
University, 2015).
Multivariate Test
There was no significant difference, in response to the face abstract painting images in
social classes AB, C1, and C2. F (18,390) = .674, p = .837, Pillai’s Trace.060,
partial 2 = .030.
Results
The MANOVA investigated the social class differences in response to face images in
print media abstract advertisement images. Nine dependent variables were used.
Preliminary assumption testing was conducted to check for normality, linearity,
univariate and multivariate outliers, homogeneity of variance-covariance, and
multicollinearity, with violations detected in the Box’s Test at p = .000 using an alpha
level of .001. Pillai’s Trace test was therefore used as the Multivarite Test of choice.
There was no significant difference between AB, C1, and C2 when considered jointly
on the combined dependent variables of bleaching qualities, smooth skin, skin
reactions, product goodness, dry skin, product expense, product quality, harsh
chemicals in product, and artificial look. Pillai’s Trace.060, F (18,390) = 674, p =
.837, partial 2 = .030.
141
With these results, it was not necessary to conduct a separate ANOVA for each
dependent variable. The null hypothesis was accepted. Social class does not create a
significant difference in respondents’ perception of the abstract style as used in print
media advertising.
4.3.4 Social class and Face Photograph Art Style results from MANOVA
A one way between groups multivariate analysis of variance was performed to
investigate social class differences in response to images in print media photograph
advertisement images. Nine dependent variables were used.
Descriptive Statistics
Each of the nine dependent variables in the N Column of the Descriptive Statistics
Table had more than the ideal of 30 cases, with AB at 54, C1 at 62, C2 at 81 making a
total of 197 cases. Furthermore, the ideal maximum variation of case numbers between
variables stood at 1.5. The case numbers here were equal with all dependent variables.
This met the ideal maximum variation and augured well for constituting a composite
dependent variable (Pallant, 2007, p. 286).
Box’s Test of Equality of Covariance Matrices
The Significance value in the Box’s Test of Equality of Covariance Matrices stood at
.000. It was smaller than Sig. Value of .001, the selected criterion. In this case, the
assumption of homogeneity of variance-covariance matrices had been violated. The use
of Wilks’ Lambda test, which had been carried out with the majority of the data in this
study was not appropriate here. A more robust test, Pillai’s Trace was used (Northern
Arizona University, 2015).
142
Multivariate Tests
There was no significant difference, in response to the face photograph images in social
classes AB, C1, and C2. F (18,374) = .679, p = .832, Pillai’s Trace.063, partial 2 =
.032.
Results
The MANOVA investigated the social class differences in response to face, photograph
advertisement images in print media. Nine dependent variables were used. Preliminary
assumption testing was conducted to check for normality, linearity, univariate and
multivariate outliers, homogeneity of variance-covariance, and multicollinearity, with
violations detected in the Box’s Test at p = .000 using an alpha level of .001. Pillai’s
Trace test was therefore used as the Multivarite Test of choice. There was no
significant difference between AB, C1, and C2 when considered jointly on the
combined dependent variables of bleaching qualities, smooth skin, skin reactions,
product goodness, dry skin, product expense, product quality, harsh chemicals in
product, and artificial look. Pillai’s Trace.063, F (18,374) = 679, p = .832, partial 2
= .032.
With these results, it was not necessary to conduct a separate ANOVA for each
dependent variable. The null hypothesis was accepted. Social class does not create a
significant difference in respondents’ perception of the photograph style as used in print
media advertising.
143
4.3.5 Social Class and Food Cartoon Art Style Results from MANOVA
A one way between groups multivariate analysis of variance was performed to
investigate social class differences in response to images in print media cartoon
advertisement images. Seven dependent variables were used.
Descriptive Statistics
Each of the seven dependent variables in the N Column of the Descriptive Statistics
Table had more than the ideal of 30 cases, with AB at 57, C1 at 68, C2 at 81 making a
total of 206 cases. Furthermore, the ideal maximum variation of case numbers between
variables stood at 1.5. The case numbers here were equal with all dependent variables.
This met the ideal maximum variation and augured well for constituting a composite
dependent variable (Pallant, 2007, p. 286).
Box’s Test of Equality of Covariance Matrices
The Significance value in the Box’s Test of Equality of Covariance Matrices stood at
.072. It was larger than .001, the selected criterion. The assumption of homogeneity of
variance-covariance matrices had not been violated, therefore Wilk’s Lambda was the
appropriate test to use.
Multivariate Test
There was no significant difference, in response to the food cartoon images in social
classes AB, C1, and C2. F (14,394) = 1.528, p = .098, Wilk’s .900, partial 2 =
.052.
Results
The MANOVA investigated the social class differences in response to food cartoon
advertisement images in print media. Seven dependent variables were used. Preliminary
assumption testing was conducted to check for normality, linearity, univariate and
144
multivariate outliers, homogeneity of variance-covariance, and multicollinearity, with
no serious violations detected for the Box’s Test at p = .072. There was no significant
difference between AB, C1, and C2 when considered jointly on the combined
dependent variables of food freshness, natural appearance of food, nutritious
appearance of food, delicious appearance of food, food quality, expense of food,
spiciness of food. Wilk’s .900, F (14,394) = 1.528, p = .098, partial 2 = .052.
With these results, it was not necessary to conduct a separate ANOVA for each
dependent variable. The null hypothesis was accepted. Social class does not create a
significant difference in respondents’ perception of the cartoon style as used in print
media advertising.
4.3.6 Social Class and Food Abstract Art Style Results from MANOVA
A one way between groups multivariate analysis of variance was performed to
investigate social class differences in response to images in print media abstract
advertisement images. Seven dependent variables were used.
Descriptive Statistics
Each of the seven dependent variables in the N Column of the Descriptive Statistics
Table had more than the ideal of 30 cases, with AB at 57, C1 at 69, C2 at 82 making a
total of 208 cases. Furthermore, the ideal maximum variation of case numbers between
variables stood at 1.5. The case numbers here were equal with all dependent variables.
This met the ideal maximum variation and augured well for constituting a composite
dependent variable (Pallant, 2007, p. 286).
145
Box’s Test of Equality of Covariance Matrices
The Significance value in the Box’s Test of Equality of Covariance Matrices stands at
.017. It was larger than .001, the selected criterion. The assumption of homogeneity of
variance-covariance matrices had not been violated, therefore Wilk’s Lambda was the
appropriate test to use.
Multivariate Tests
There was no significant difference, in response to the food abstract painting images in
social classes AB, C1, and C2. F (14,398) = 1.502, p = .107, Wilk’s .902, partial 2
= .050.
Results
The MANOVA investigated the social class differences in response to abstract food
advertisement images in print media. Seven dependent variables were used. Preliminary
assumption testing was conducted to check for normality, linearity, univariate and
multivariate outliers, homogeneity of variance-covariance, and multicollinearity, with
no serious violations detected for the Box’s Test at p = .017. There was no significant
difference between AB, C1, and C2 when considered jointly on the combined
dependent variables of food freshness, natural appearance of food, nutritious
appearance of food, delicious appearance of food, food quality, expense of food,
spiciness of food. Wilk’s .902, F (14,398) = 1.502, p = .107, partial 2 = .050.
With these results, it was not necessary to conduct a separate ANOVA for each
dependent variable. The null hypothesis was accepted. Social class does not create a
significant difference in respondents’ perception of the abstract style as used in print
media advertising.
146
4.3.7 Social Class and Food Photograph Art Style Results from MANOVA
A one way between groups multivariate analysis of variance was performed to
investigate social class differences in response to images in print media photograph
advertisement images. Seven dependent variables were used.
Descriptive Statistics
Each of the seven dependent variables in the N Column of the Descriptive Statistics
Table had more than the ideal of 30 cases, with AB at 55, C1 at 67, C2 at 81 making a
total of 203 cases. Furthermore, the ideal maximum variation of case numbers between
variables stood at 1.5. The case numbers here were equal with all dependent variables.
This met the ideal maximum variation and augured well for constituting a composite
dependent variable (Pallant, 2007, p. 286).
Box’s Test of Equality of Covariance Matrices
The Significance value in the Box’s Test of Equality of Covariance Matrices stands at
.174. It was larger than .001, the selected criterion. The assumption of homogeneity of
variance-covariance matrices had not been violated, therefore Wilk’s Lambda was the
appropriate test to use.
Multivariate Tests
There was no significant difference, in response to the food photograph images in
social classes AB, C1, and C2. F (14,388) = 2.448, p = .003, Wilk’s .844, partial 2
= .081.
Results
The MANOVA investigated the social class differences in response to food photograph
advertisement images in the print media. Seven dependent variables were used.
Preliminary assumption testing was conducted to check for normality, linearity,
147
univariate and multivariate outliers, homogeneity of variance-covariance, and
multicollinearity, with no serious violations detected for the Box’s Test at p = .174.
There was significant difference between AB, C1, and C2 when considered jointly on
the variables of food freshness, natural appearance of food, nutritious appearance of
food, delicious appearance of food, food quality, expense of food, spiciness of food.
Wilk’s .844, F (14,388) = 2.448, p = .003, partial 2 = .081.
With these results, it was not necessary to conduct a separate ANOVA for each
dependent variable. The null hypothesis was accepted. Social class does not create a
significant difference in respondents’ perception of the photograph style as used in print
media advertising.
4.3.8 Age and Face Cartoon Art Style Results from MANOVA
A one way between groups multivariate analysis of variance was performed to
investigate age related differences in response to images in print media cartoon
advertisement images. Nine dependent variables were used.
Descriptive Statistics
Each of the nine dependent variables in the N Column of the Descriptive Statistics
Table had more than the ideal of 30 cases, with 20-24 at 65, 25-29 at 75, 30-34 at 66
making a total of 206 cases. Furthermore, the ideal maximum variation of case numbers
between variables stood at 1.5. The case numbers here were equal with all dependent
variables. This met the ideal maximum variation and augured well for constituting a
composite dependent variable (Pallant, 2007, p. 286).
148
Box’s Test of Equality of Covariance Matrices
The Significance value in the Box’s Test of Equality of Covariance Matrices stood at
.304. It was larger than .001, the selected criterion. The assumption of homogeneity of
variance-covariance matrices had not been violated, therefore Wilk’s Lambda was the
appropriate test to use.
Multivariate Tests
There was no significant difference, in response to the face cartoon images in ages 20 –
24, 25 – 29, 30- 34. F (18,390) = .636, p = .871, Wilk’s .944, partial 2 = .029.
Results
The MANOVA investigated age related differences in response to print media face
cartoon advertisement images. Nine dependent variables were used. Preliminary
assumption testing was conducted to check for normality, linearity, univariate and
multivariate outliers, homogeneity of variance-covariance, and multicollinearity, with
no serious violations detected for the Box’s Test at p = .304. There was no significant
difference between 20 - 24, 25 – 29, and 30 – 34 when considered jointly on the
combined dependent variables of bleaching qualities, smooth skin, skin reactions,
product goodness, dry skin, product expense, product quality, harsh chemicals in
product, and artificial look. Wilk’s .944, F (18,390) = 636, p = .871, partial 2 =
.029.
With these results, it was not necessary to conduct a separate ANOVA for each
dependent variable. The null hypothesis was accepted. Age does not create a significant
difference in respondents’ perception of the cartoon style as used in print media
advertising.
149
4.3.9 Age and Face Abstract Art Style Results from MANOVA
A one way between groups multivariate analysis of variance was performed to
investigate age related differences in response to images in print media cartoon
advertisement images. Nine dependent variables were used.
Descriptive Statistics
Each of the nine dependent variables in the N Column of the Descriptive Statistics
Table had more than the ideal of 30 cases, with 20-24 at 65, 25-29 at 72, 30-34 at 68
making a total of 205 cases. Furthermore, the ideal maximum variation of case numbers
between variables stood at 1.5. The case numbers here were equal with all dependent
variables. This met the ideal maximum variation and augured well for constituting a
composite dependent variable (Pallant, 2007, p. 286).
Box’s Test of Equality of Covariance Matrices
The Significance value in the Box’s Test of Equality of Covariance Matrices stood at
.714. It was larger than .001, the selected criterion. The assumption of homogeneity of
variance-covariance matrices had not been violated, therefore Wilk’s Lambda was the
appropriate test to use.
Multivariate Tests
There was no significant difference, in response to the face abstract painting images in
ages 20 – 24, 25 – 29, 30 - 34. F (18,388) = .896, p = .584, Wilk’s .922, partial 2
= .040.
Results
The MANOVA investigated age related differences in response to print media face,
abstract advertisement images. A one way between groups multivariate analysis of
variance was performed to investigate age related differences in response to images in
150
print media cartoon advertisement images. Nine dependent variables were used.
Preliminary assumption testing was conducted to check for normality, linearity,
univariate and multivariate outliers, homogeneity of variance-covariance, and
multicollinearity, with no serious violations detected for the Box’s Test at p = .714.
There was no significant difference between 20 - 24, 25 – 29, and 30 – 34 when
considered jointly on the combined dependent variables of bleaching qualities, smooth
skin, skin reactions, product goodness, dry skin, product expense, product quality,
harsh chemicals in product, and artificial look. Wilk’s .922, F (18,388) = 935, p =
.584, partial 2 = .040.
With these results, it was not necessary to conduct a separate ANOVA for each
dependent variable. The null hypothesis was accepted. Age does not create a significant
difference in respondents’ perception of the cartoon style as used in print media
advertising.
4.3.10 Age and Face Photograph Art Style Results from MANOVA
A one way between groups multivariate analysis of variance was performed to
investigate age related differences in response to images in print media face photograph
advertisement images. Nine dependent variables were used.
Descriptive Statistics
Each of the nine dependent variables in the N Column of the Descriptive Statistics
Table had more than the ideal of 30 cases, with 20-24 at 61, 25-29 at 70, 30-34 at 66
making a total of 197 cases. Furthermore, the ideal maximum variation of case numbers
between variables stood at 1.5. The case numbers here were equal with all dependent
151
variables. This met the ideal maximum variation and augured well for constituting a
composite dependent variable (Pallant, 2007, p. 286).
Box’s Test of Equality of Covariance Matrices
The Significance value in the Box’s Test of Equality of Covariance Matrices stood at
.000. It was smaller than Sig. Value of .001, the selected criterion. In this case, the
assumption of homogeneity of variance-covariance matrices had been violated. The use
of Wilks’ Lambda test, which had been carried out with the majority of the data in this
study was not appropriate here. A more robust test, Pillai’s Trace was used (Northern
Arizona University, 2015).
Multivarite Tests
There was no significant difference, in response to the face photograph images in ages
20 – 24, 25 – 29, 30 - 34. F (18,374) = 1.293, p = .189, Pillai”s Trace.117, partial 2
= .059.
Results
The MANOVA investigated age related differences in response to print media face
photograph advertisement images. Nine dependent variables were used. Preliminary
assumption testing was conducted to check for normality, linearity, univariate and
multivariate outliers, homogeneity of variance-covariance, and multicollinearity, with
violations detected for the Box’s Test at p = .000. There was no significant difference
between 20 - 24, 25 – 29, and 30 – 34 when considered jointly on the combined
dependent variables of bleaching qualities, smooth skin, skin reactions, product
goodness, dry skin, product expense, product quality, harsh chemicals in product, and
artificial look. Pillai’s Trace.117, F (18,374) = 1.293, p = .189, partial 2 = .059.
152
With these results, it was not necessary to conduct a separate ANOVA for each
dependent variable. The null hypothesis was accepted. Age does not create a significant
difference in respondents’ perception of the photograph style as used in print media
advertising.
4.3.11 Age and Food Cartoon Art Style Results from MANOVA
A one way between groups multivariate analysis of variance was performed to
investigate age differences in response to images in print media food cartoon
advertisement images. Seven dependent variables were used.
Descriptive Statistics
Each of the seven dependent variables in the N Column of the Descriptive Statistics
Table had more than the ideal of 30 cases, with 20-24 at 68, 25-29 at 73, 30-34 at 65
making a total of 206 cases. Furthermore, the ideal maximum variation of case numbers
between variables stood at 1.5. The case numbers here were equal with all dependent
variables. This met the ideal maximum variation and augured well for constituting a
composite dependent variable (Pallant, 2007, p. 286).
Box’s Test of Equality of Covariance Matrices
The Significance value in the Box’s Test of Equality of Covariance Matrices stood at
.146. It was larger than .001, the selected criterion. The assumption of homogeneity of
variance-covariance matrices had not been violated, therefore Wilk’s Lambda was the
appropriate test to use.
Multivariate Tests
There was no significant difference, in response to the food cartoon images in ages 20 –
24, 25 – 29, 30 - 34. F (14,394) = .619, p = .850, Wilk’s .957, partial 2 = .022.
153
Results
The MANOVA investigated age related differences in response to print media food
cartoon advertisement images. Seven dependent variables were used. Preliminary
assumption testing was conducted to check for normality, linearity, univariate and
multivariate outliers, homogeneity of variance-covariance, and multicollinearity, with
no serious violations detected for the Box’s Test at p = .146. There was no significant
difference between 20 - 24, 25 – 29, and 30 – 34 when considered jointly on the
combined dependent variables of food freshness, natural appearance of food, nutritious
appearance of food, delicious appearance of food, food quality, expense of food,
spiciness of food. Wilk’s .957, F (14,394) = .619, p = .850, partial 2 = .022.
With these results, it was not necessary to conduct a separate ANOVA for each
dependent variable. The null hypothesis was accepted. Age does not create a significant
difference in respondents’ perception of the cartoon style as used in print media
advertising.
4.3.12 Age and Food Abstract Art Style Results from MANOVA
A one way between groups multivariate analysis of variance was performed to
investigate age differences in response to images in print media food abstract
advertisement images. Seven dependent variables were used.
Descriptive Statistics
Each of the seven dependent variables in the N Column of the Descriptive Statistics
Table had more than the ideal of 30 cases, with 20-24 at 66, 25-29 at 74, 30-34 at 68
making a total of 208 cases. Furthermore, the ideal maximum variation of case numbers
between variables stood at 1.5. The case numbers here were equal with all dependent
154
variables. This met the ideal maximum variation and augured well for constituting a
composite dependent variable (Pallant, 2007, p. 286).
Box’s Test of Equality of Covariance Matrices
The Significance value in the Box’s Test of Equality of Covariance Matrices stood at
.389. It was larger than .001, the selected criterion. The assumption of homogeneity of
variance-covariance matrices had not been violated, therefore Wilk’s Lambda was the
appropriate test to use.
Multivariate Test
There was no significant difference, in response to the food abstract painting images in
ages 20 – 24, 25 – 29, 30 - 34. F (14,398) = 1.444, p = .130, Wilk’s .906, partial 2
= .048.
Results
The MANOVA investigated age related differences in response to print media food,
abstract advertisement images. Seven dependent variables were used. Preliminary
assumption testing was conducted to check for normality, linearity, univariate and
multivariate outliers, homogeneity of variance-covariance, and multicollinearity, with
no serious violations detected for the Box’s Test at p = .389. There was no significant
difference between 20 - 24, 25 – 29, and 30 – 34 when considered jointly on the
combined dependent variables of food freshness, natural appearance of food, nutritious
appearance of food, delicious appearance of food, food quality, expense of food,
spiciness of food. Wilk’s .906, F (14,398) = 1.444, p = .130, partial 2 = .048.
With these results, it was not necessary to conduct a separate ANOVA for each
dependent variable. The null hypothesis was accepted. Age does not create a significant
155
difference in respondents’ perception of the abstract s style used in print media
advertising.
4.3.13 Age and Food Photograph Art Style Results from MANOVA
A one way between groups multivariate analysis of variance was performed to
investigate age differences in response to images in print media food photograph
advertisement images. Seven dependent variables were used.
Descriptive Statistics
Each of the seven dependent variables in the N Column of the Descriptive Statistics
Table had more than the ideal of 30 cases, with 20-24 at 67, 25-29 at 71, 30-34 at 65
making a total of 203 cases. Furthermore, the ideal maximum variation of case numbers
between variables stood at 1.5. The case numbers here were equal with all dependent
variables. This met the ideal maximum variation and augured well for constituting a
composite dependent variable (Pallant, 2007, p. 286).
Box’s Test of Equality of Covariance Matrices
The Significance value in the Box’s Test of Equality of Covariance Matrices stood at
.295. It was larger than .001, the selected criterion. The assumption of homogeneity of
variance-covariance matrices had not been violated, therefore Wilk’s Lambda was the
appropriate test to use.
Multivariate Test
There was no significant difference, in response to the food photograph images in ages
20 – 24, 25 – 29, 30 - 34. F (14,388) = .508, p = .928, Wilk’s .964, partial 2 =
.018.
156
Results
The MANOVA investigated age related differences in response to print media food
photograph advertisement images. Seven dependent variables were used. Preliminary
assumption testing was conducted to check for normality, linearity, univariate and
multivariate outliers, homogeneity of variance-covariance, and multicollinearity, with
no serious violations detected for the Box’s Test at p = .295. There was no significant
difference between 20 - 24, 25 – 29, and 30 – 34 when considered jointly on the
combined dependent variables of food freshness, natural appearance of food, nutritious
appearance of food, delicious appearance of food, food quality, expense of food,
spiciness of food. Wilk’s .964, F (14,388) = .508, p = .928, partial 2 = .018.
With these results, it was not necessary to conduct a separate ANOVA for each
dependent variable. The null hypothesis was accepted. Age does not create a significant
difference in respondents’ perception of the photograph style as used in print media
advertising.
4.3.14 Education Level and Face Cartoon Art Style Results from MANOVA
A one way between groups multivariate analysis of variance was performed to
investigate Education Level differences in response to images in print media face
cartoon advertisement images. Nine dependent variables were used.
Descriptive Statistics
The nine dependent variables in the N Column of the Descriptive Statistics Table had
more than the ideal of 30 cases, with Primary at 29, Secondary at 44, Tertiary college at
71, Undergrad at 27, and Post grad at 30 making a total of 201 cases. Furthermore, the
ideal maximum variation of case numbers between variables stood at 1.5. The case
157
numbers here were equal with all dependent variables. This met the ideal maximum
variation and augured well for constituting a composite dependent variable (Pallant,
2007, p. 286).
Box’s Test of Equality of Covariance Matrices
The Significance value in the Box’s Test of Equality of Covariance Matrices stood at
.032. It was larger than .001, the selected criterion. The assumption of homogeneity of
variance-covariance matrices had not been violated, therefore Wilk’s Lambda was the
appropriate test to use.
Multivariate Tests
There was no significant difference, in response to the face cartoon images in level of
education classified as primary, secondary, tertiary college, undergrad, and post grad. F
(36,706) = 1.402, p = .061, Wilk’s .772, partial 2 = .063.
Results
The MANOVA investigated Education Level related differences in response to print
media face cartoon advertisement images. Nine dependent variables were used.
Preliminary assumption testing was conducted to check for normality, linearity,
univariate and multivariate outliers, homogeneity of variance-covariance, and
multicollinearity, with no serious violations detected for the Box’s Test at p = .032.
There was no significant difference between primary, secondary, tertiary college,
undergraduate and postgraduate when considered jointly on the combined dependent
variables of bleaching qualities, smooth skin, skin reactions, product goodness, dry
skin, product expense, product quality, harsh chemicals in product, and artificial look.
Wilk’s .772, F (36,706.260) = 1.402, p = .061, partial 2 = .063.
158
With these results, it was not necessary to conduct a separate ANOVA for each
dependent variable. The null hypothesis was accepted. Education Level does not create
a significant difference in respondents’ perception of the cartoon style as used in print
media advertising.
4.3.15 Education Level and Face Abstract Art Style results from MANOVA
A one way between groups multivariate analysis of variance was performed to
investigate Education Level differences in response to images in print media face
abstract advertisement images. Nine dependent variables were used.
Descriptive Statistics
Each of the nine dependent variables in the N Column of the Descriptive Statistics
Table had more than the ideal of 30 cases, with Primary at 28, Secondary at 44,
Tertiary college at 72, Undergrad at 28, and Post grad at 27 making a total of 199 cases.
Furthermore, the ideal maximum variation of case numbers between variables stood at
1.5. The case numbers here were equal with all dependent variables. This met the ideal
maximum variation and augured well for constituting a composite dependent variable
(Pallant, 2007, p. 286).
Box’s Test of Equality of Covariance Matrices
The Significance value in the Box’s Test of Equality of Covariance Matrices stood at
.349. It was larger than .001, the selected criterion. The assumption of homogeneity of
variance-covariance matrices had not been violated, therefore Wilk’s Lambda was the
appropriate test to use.
159
Multivarite Tests
There was no significant difference, in response to the face abstract painting images in
level of education classified as primary, secondary, tertiary college, undergrad, and post
grad. F (36,698.675) = .754, p = .852, Wilk’s .867, partial 2 = .035.
Results
The MANOVA investigated Education Level related differences in response to print
media face, abstract advertisement images. Nine dependent variables were used.
Preliminary assumption testing was conducted to check for normality, linearity,
univariate and multivariate outliers, homogeneity of variance-covariance, and
multicollinearity, with violations detected for the Box’s Test at p = .349. There was no
significant difference between primary, secondary, tertiary college, undergraduate and
postgraduate when considered jointly on the combined dependent variables of
bleaching qualities, smooth skin, skin reactions, product goodness, dry skin, product
expense, product quality, harsh chemicals in product, and artificial look. Wilk’s
.876, F (36,698.765) = .754, p = .852, partial 2 = .035.
With these results, it was not necessary to conduct a separate ANOVA for each
dependent variable. The null hypothesis was accepted. Education Level does not create
a significant difference in respondents’ perception of the abstract style as used in print
media advertising.
4.3.16 Education Level and Face Photograph Art Style results from MANOVA
A one way between groups multivariate analysis of variance was performed to
investigate education Level related differences in response to images in print media
photograph advertisement images. Nine dependent variables were used.
160
Descriptive Statistics
Each of the nine dependent variables in the N Column of the Descriptive Statistics
Table had more than the ideal of 30 cases, with Primary at 27, Secondary at 43,
Tertiary college at 69, Undergrad at 27, and Post grad at 25 making a total of 191 cases.
Furthermore, the ideal maximum variation of case numbers between variables stood at
1.5. The case numbers here were equal with all dependent variables. This met the ideal
maximum variation and augured well for constituting a composite dependent variable
(Pallant, 2007, p. 286).
Box’s Test of Equality of Covariance Matrices
The Significance value in the Box’s Test of Equality of Covariance Matrices stood at
.092. It was larger than .001, the selected criterion. The assumption of homogeneity of
variance-covariance matrices had not been violated, therefore Wilk’s Lambda was the
appropriate test to use.
Multivariate Tests
There was no significant difference, in response to the face photograph images in level
of education classified as primary, secondary, tertiary college, undergrad, and post
grad. F (36,668.786) = 1.185, p = .214, Wilk’s .793, partial 2 = .056.
Results
The MANOVA investigated Education Level related differences in response to print
media face photograph advertisement images. Nine dependent variables were used.
Preliminary assumption testing was conducted to check for normality, linearity,
univariate and multivariate outliers, homogeneity of variance-covariance, and
multicollinearity, with no serious violations detected for the Box’s Test at p = .092.
There was no significant difference between primary, secondary, tertiary college,
undergraduate and postgraduate when considered jointly on the combined dependent
161
variables of bleaching qualities, smooth skin, skin reactions, product goodness, dry
skin, product expense, product quality, harsh chemicals in product, and artificial look.
Wilk’s .793, F 36,668.786) = 1.185, p = .214, partial 2 = .056.
With these results, it was not necessary to conduct a separate ANOVA for each
dependent variable. The null hypothesis was accepted. Education Level does not create
a significant difference in respondents’ perception of the photograph style as used in
print media advertising.
4.3.17 Education Level and Food Cartoon Art Style results from MANOVA
A one way between groups multivariate analysis of variance was performed to
investigate Education Level differences in response to images in print media food
cartoon advertisement images. Seven dependent variables were used.
Descriptive Statistics
Each of the seven dependent variables in the N Column of the Descriptive Statistics
Table had more than the ideal of 30 cases, with Primary at 28, Secondary at 42,
Tertiary college at 73, Undergrad at 29, and Post grad at 28 making a total of 200 cases.
Furthermore, the ideal maximum variation of case numbers between variables stood at
1.5. The case numbers here were equal with all dependent variables. This meets the
ideal maximum variation and augured well for constituting a composite dependent
variable (Pallant, 2007, p. 286).
Box’s Test of Equality of Covariance Matrices
The Significance value in the Box’s Test of Equality of Covariance Matrices stood at
.063. It was larger than .001, the selected criterion. The assumption of homogeneity of
162
variance-covariance matrices had not been violated, therefore Wilk’s Lambda was the
appropriate test to use.
Multivariate Tests
There was no significant difference, in response to the food cartoon images in level of
education classified as primary, secondary, tertiary college, undergrad, and post grad. F
(28,682.871) = 11.72, p = .249, Wilk’s .844, partial 2 = .041.
Results
The MANOVA investigated Education Level related differences in response to print
media food, cartoon advertisement images. Seven dependent variables were used.
Preliminary assumption testing was conducted to check for normality, linearity,
univariate and multivariate outliers, homogeneity of variance-covariance, and
multicollinearity, with no serious violations detected for the Box’s Test at p = .063.
There was no significant difference between primary, secondary, tertiary college,
undergraduate and postgraduate when considered jointly on the combined dependent
variables of food freshness, natural appearance of food, nutritious appearance of food,
delicious appearance of food, food quality, expense of food, spiciness of food. Wilk’s
.844, F (28,682.871) = 1.172, p = .249, partial 2 = .041.
With these results, it was not necessary to conduct a separate ANOVA for each
dependent variable. The null hypothesis was accepted. Education Level does not create
a significant difference in respondents’ perception of the cartoon style as used in print
media advertising.
163
4.3.18 Education Level and Food Abstract Art Style Results from MANOVA
A one way between groups multivariate analysis of variance was performed to
investigate Education Level differences in response to images in print media food
abstract advertisement images. Seven dependent variables were used.
Descriptive Statistics
Each of the seven dependent variables in the N Column of the Descriptive Statistics
Table had more than the ideal of 30 cases, with Primary at 28, Secondary at 44,
Tertiary college at 72, Undergrad at 29, and Post grad at 30 making a total of 203 cases.
Furthermore, the ideal maximum variation of case numbers between variables stood at
1.5. The case numbers here were equal with all dependent variables. This met the ideal
maximum variation and augured well for constituting a composite dependent variable
(Pallant, 2007, p. 286).
Box’s Test of Equality of Covariance Matrices
The Significance value in the Box’s Test of Equality of Covariance Matrices stood at
.023. It was larger than .001, the selected criterion. The assumption of homogeneity of
variance-covariance matrices had not been violated, therefore Wilk’s Lambda was the
appropriate test to use.
Multivariate Tests
There was no significant difference, in response to the food abstract painting images in
level of education classified as primary, secondary, tertiary college, undergrad, and post
grad. F (28,693.688) = 1.574, p = .031, Wilk’s .801, partial 2 = .054.
Results
The MANOVA investigated Education Level related differences in response to print
media food, abstract advertisement images. Seven dependent variables were used.
164
Preliminary assumption testing was conducted to check for normality, linearity,
univariate and multivariate outliers, homogeneity of variance-covariance, and
multicollinearity, with no serious violations detected for the Box’s Test at p = .023.
There was no significant difference between primary, secondary, tertiary college,
undergraduate and postgraduate when considered jointly on the combined dependent
variables of food freshness, natural appearance of food, nutritious appearance of food,
delicious appearance of food, food quality, expense of food, spiciness of food. Wilk’s
.801, F (28,693.688) = 1.574, p = .031, partial 2 = .054.
With these results, it is not necessary to conduct a separate ANOVA for each dependent
variable. The null hypothesis is accepted. Education Level does not create a significant
difference in respondents’ perception of the abstract style as used in print media
advertising.
4.3.19 Education Level and Food Photograph Art Style Results from MANOVA
A one way between groups multivariate analysis of variance was performed to
investigate Education Level differences in response to images in print media food
Photograph advertisement images. Seven dependent variables were used.
Descriptive Statistics
Each of the seven dependent variables in the N Column of the Descriptive Statistics
Table had more than the ideal of 30 cases, with Primary at 28, Secondary at 42,
Tertiary college at 70, Undergrad at 28, and Post grad at 30 making a total of 198 cases.
Furthermore, the ideal maximum variation of case numbers between variables stood at
1.5. The case numbers here were equal with all dependent variables. This met the ideal
165
maximum variation and augured well for constituting a composite dependent variable
(Pallant, 2007, p. 286).
Box’s Test of Equality of Covariance Matrices
The Significance value in the Box’s Test of Equality of Covariance Matrices stood at
.389. It was larger than .002, the selected criterion. The assumption of homogeneity of
variance-covariance matrices had not been violated, therefore Wilk’s Lambda was the
appropriate test to use.
Multivariate Tests
There was no significant difference, in response to the food photograph images in level
of education classified as primary, secondary, tertiary college, undergrad, and post
grad. F (28,675.660) = 1.408, p = .080, Wilk’s .815, partial 2 = .050.
Results
The MANOVA investigated Education Level related differences in response to print
media food, photograph advertisement images. Seven dependent variables were used.
Preliminary assumption testing was conducted to check for normality, linearity,
univariate and multivariate outliers, homogeneity of variance-covariance, and
multicollinearity, with no serious violations detected for the Box’s Test at p = .002.
There was no significant difference between primary, secondary, tertiary college,
undergraduate and postgraduate when considered jointly on the combined dependent
variables of food freshness, natural appearance of food, nutritious appearance of food,
delicious appearance of food, food quality, expense of food, spiciness of food. Wilk’s
.815, F (28,675.660) = 1.408, p = .080, partial 2 = .050.
166
With these results, it was not necessary to conduct a separate ANOVA for each
dependent variable. The null hypothesis was accepted. Education Level does not create
a significant difference in respondents’ perception of the photograph style as used in
print media advertising.
4.4 Chapter Summary
The results as posted revealed that the respondents had divergent views between social
classes and unexpectedly, within the social class group members as well. It was seen
that response to the different art styles shown was a very personal occurrence that was
not necessarily modified by the variables as presented in the research. Also noted was
that the non-realistic images elicited a higher variety of responses. In response to the
Quantitative exploration the null hypothesis to there being a significant difference in
the respondents' perception of various art styles used in print media advertising when
classified by social class, age, and education level were accepted throughout. The tests
show that social class, age and education level do not create a significant difference in
respondents’ perception of the cartoon, abstract painting, and photograph style in both
face and food images as used in print media advertising.
167
5 CHAPTER FIVE - DISCUSSION OF FINDINGS
5.1 Introduction
This chapter sets out to discuss the findings chapter in response to the problems spelt
out in chapter one of this thesis. The main overarching research query concerns the
effect of demographic background on an individuals’ response to disparate art genre in
print media advertising. It delves into the scope of messages communicated between
and within socio economic groupings in response to different art genre. It examines
messages communicated by different art genre. The quantitative section of the analysis
begins with an explanation of how and why questions picked for the research were
selected. The researcher sought to gauge if there was any significant difference between
art style used in print media and its’ perceptions by respondents’ from diverse social
classes, age groups, and levels of education. The study looks at inferential statistics
and their implications of these findings on Information Processing, Rhetorical, and
Copy theories proffered as well as policy implications. The chapter is rounded off with
the delimitations of the study.
5.1.1 Scope of message(s) communicated between socio-economic groupings in
response to different art genre in print media advertisements.
This question sought to find out if there was concurrence of minds between the
demographic classes AB, C1 and C2 concerning their opinions on the various themes
that were suggested concerning the images in question. This was measured by listing all
the suggestions as to what the images were thought to communicate and tallying the
number of respondents in the three groups who concurred with the stated concept. The
168
literature review strongly stated that audiences of dissimilar backgrounds, in this case,
disparate demographic extraction, should have discerned a different message(s) from an
image style due to heterogeneity in their socialisation. Their diverse, distinct
backgrounds were postulated as fundamental in producing diversity in thought
processes that they engaged in when formulating their beliefs of any image style
proffered them. This, according to the data analysis turned out to be the case to the
degree that was augured as true. The respondents did not veer from the expected
prognosis.
Bulmer and Buchanan-Oliver (2006b) study looked at how cultural differences affected
consumer interpretation of visually complex advertising” (Bulmer & Buchanan-Oliver,
2006b, p. 66).” The study provided evidence that response to visual rhetoric drew from
“culturally-sited knowledge of advertising [...] visual signs [...] to interpret
commercials.” Reading images involved a symbiotic relationship between cultural
knowledge present and the images presented to the viewer. Their study corroborated
that the communication value of images was not pervasive. (Bulmer & Buchanan-
Oliver, 2006b, p. 66). Visual images in their current form were not capable of
conveying precise messages and meaning to a heterogeneous audience. It was seen that
the images presented to the respondents were viewed as visual writings that assisted
stimulate varied thoughts. They prompted elaboration that abetted the conveyance of
ideas, and concepts, that were capable of creating, influencing and modifying thoughts.
This was demonstrated by the large number of perceptions that were presented in the
messages furnished by the respondents. Images were to be seen as objects stimulating
rumination and suggesting conception direction, and not objects that directly compared
169
to the Roman alphabetical system in their methods, intentions and capabilities for
communication.
In time other researchers such as Smith (Winter-Spring 2007), promulgated the same.
The images shown bear visual rhetoric that is expressed as an enthymeme argument. As
such, the rhetoric they presented was a visual discourse that was looked at as part of a
whole communication process. The image gave the viewer an entry proposition. The
viewer then supplied a second proposition that was coloured by their socio-cultural
background, which gave rise to the respondent’s final conclusive proposition. The
second proposition was excluded in the presentation process of the image. This was
intentional. This missing proposition was supplied by most viewers and was often
implicit and loaned to give the visual image rhetorical credence. It drew the viewer into
the visual discussion, ensuring that their levels of engaged elaboration was high.
Because the viewer was involved in the process of formulating the conclusion based on
their existing personal truths, they were more likely to believe that what they have
formulated is true about the image.
5.1.2 Scope of message(s) communicated among members of the same socio-
economic group in response to different art genre in print media
advertisements.
Contrary to what Olson, Finnegan, & Hope (2008, p. 3), and Mulken (2010, p. 3420)
state, all the results from both the face and food images, show that they are not static
fixed visuals that put across a precise, fixed message to a divergent target audience.
The results concur with McQuarrie and Mick (2003), Miniard, Bhatla, Lord, Dickson,
170
and Unnava (1991), Scott (1994, p. 269), Mick and Politi (1989), and Mitchell and
Olson (1981) and support their premise.
It was noted that messages that were concurrent among the respondents tended to be
largely informed by semiotic based stimulus as opposed to stimulus occasioned by the
elements and principles of design. The more complex messages were informed by the
nuances found in the art genre employed. They were more varied in range and less
frequent among the respondent’s replies. This line of thought is corroborated by authors
such as Bulmer and Buchanan (2006a), Cyr (2009, p. 26), McQuarrie and Mick (2003),
Pauwels (2008, p. 79), Phillips (1997), Scott (1994), and Shroeder (2006).
The results of the experiments show that the more removed an art styles were from
photo reality, the more the audience processed them (McQuarrie & Mick., 1999). This
is true across all demographic groupings. The greater thought put into fathoming the
intricacies of image the greater the degree of elaboration and by extension, a higher the
number of themes expressed by the respondents. The various art styles on display
served to highlight features on model’s face and in the food that would otherwise have
gone un-noticed. The figures presented show that art styles used, do have an impact on
the degree of processing of the image. Looking at the sheer number of varying
comments made in APPENDIX , Group 1 and Group 2,it can clearly be seen that the
images with the cartoon and painting elicit far more comments than the photograph.
This is corroborated by a variety of authors (McQuarrie & Mick., 1999; Mohanty &
Ratneshwar, 2014; Mulken M. v., 2003, p. 114; Shimp, 2003).
171
There is a distinct increase in elaboration of the cartoon with the Food images. Does the
type of product being portrayed in advertising images pique the individual respondents’
curiosity in a discrete manner so as to affect the degree of elaboration? Does the
participant’s level of interest in a product inadvertently have an effect on their degree of
elaboration? Far more research and data would have to be collected to verify and
conclusively accept this specific finding on degree of processing stimulated by different
art styles, as well as the effect of product type of response.
What comes to be viewed as rhetorical convention, gains its currency from common
social and cultural agreement of its meaning. This is formulated in and by a society as a
cohesive body that grows dependently. It is not a predetermined, or static definition, but
meaning that grows out of common understanding, and acceptance, that can evolve or
mutate (Brumberger, 2011, p. 66; Mick & Politi, 1989; Pracejus, Olsen, & O'Guinn,
2006; Scott, 1994, p. 253; Singer, 2010). As pertains to the study at hand, this is
probably made possible by mass media that has proliferated around the urban area
particularly in the digital sphere.
With the wide variety of wide-ranging and convoluted occurrences affecting human
beings, it is not uncommon for individuals to generate differing meaning from the same
image even when it is received at the same time and place (Severin & Tankard, 2010).
However, this begs the question, what art style is an effective means of communication,
if any? Or is there no such single art style that can be used to communicate a specific
idea to a specific a target audience? Or are the respondents in the cohorts as we know
them so disparate that identifying a single art style that communicates effectively is not
feasible? Or have the respondents simply been confused by the images at hand, keeping
172
in mind that in the sheer complexity of images lays the danger of meaning being lost in
intricate encoding and decoding of messages? Messages can be misunderstood or
simply not understood by the viewers (Bulmer & Buchanan, 2006a) Are there
independent factors at play that contributed to the divergent opinions in the results
shown, for example visual illiteracy which makes it impossible for them to decipher
messages as expected by the message encoder? (Schonborn & Anderson, 2006).
5.1.3 Scope of message(s) communicated by different art styles.
The divergence in opinion over notions the various art styles portrayed between groups
extended to variation of opinion within the groups as well. For an image that is
designed and expected to send out a singular communication, to members of the same
homogenous demographic group, the face and food images in the three different styles
of cartoon, abstract and photograph were not successful. They prompted the
respondents to proffer a very wide variety of ideas, creating a diversity of impressions.
This clearly showed that the various image styles, cartoon, abstract and photograph did
not transmit a singular, cohesive message to respondents of the same demographic
grouping. The literature review implicitly stated that audiences from a similar
demographic background, as was the case in this study, discerned a similar message(s)
from an image style due to their homogenous socialisation. Uniform backgrounds were
postulated as fundamental in producing like-mindedness and congruent worldviews.
The Schema Theory postulates that we process and formulate new information by
absorbing that which we immediately experience blended with prior experiences
(Severin & Tankard, 2010). Though this was the concept researchers engaged with,
respondents veered from the expected prognosis. This may have happened for any
173
number of reasons. It is necessary that further research is carried out to understand the
reason(s).
Literature suggested that people from divergent demographic background would have
divergent views on what message an image communicated (Eppler & Ge, April 2007;
McQuarrie & Mick, 2003b, p. 194). Other literature went on to suggest that a specific
art style sent out a similar message to an audience (Mitchell & Olson, 1981; Scott,
1994; Scott & Vargas, 2007). This literature did not show whether the target
audience(s) was segregated, or classified in any way. It did not state distinctly and
specifically and/ or experiment to show that persons from the same demographic
background would have similar views. It was simply assumed that persons’ from a
similar background had analogous views due to comparable acculturation. There was
no study found that covered both external and internal variations of opinion. Studies
that have to do with rhetorical response to images bolster the belief that one needed
only uncover differences between groups as opposed to those within groups. This may
explain the dearth of studies concerning intra-group perceptions.
As such, one can only assume based on the paucity of studies to prove otherwise, that
Buchanan and Oliver’s (2006b, p. 66) assertions on the inability of images to send a
unified message to a diverse target audience applies. This study is similar to universal
Bulmer & Buchanan-Oliver(2006b, p. 66) in that it provided evidence that the
respondent’s, “drew on their culturally-sited knowledge of advertising texts and visual
signs in order to interpret commercials.” However, unexpectedly, it went further to
show that this happened at the individuals’ level as well between disparate
demographic groups.
174
Hagtvedt and Patrick (2011, p. 1624) posit that artwork when viewed as illustrations
specific to products, must be considered context dependent. This means that a person
looking at an image related to a product will infer the qualities found on the illustration
directly to the product. This is tempered by the respondent’s socio-cultural leanings.
From the results as viewed, there appears to be a link between individuals’
demographic background and their response to a stylised image, and by extension their
degree of elaboration when confronted with an image.
The C2’s, appear to have a far greater propensity to elaborate more when viewing
cartoons, as opposed to abstract or photographic images. Lucie and Smith (1997, pp.
152 - 154) explain that cartoons are cheap and cheery to produce transferring this
impression onto the goods they are used to advertise which are low cost, attainable,
easily accessible and expendable. These are often the category of goods aimed at the
C2 demographic, as their economic capacity is not very high. As such, they may a
higher propensity to unwittingly identify with this genre of images as they are familiar
with it, expending more time and effort elaborating on them.
Miller and Stoica “compared the effects of a photograph versus two artistic renditions
(Miller & Stoica, 2003, p. 11).” Of relevance and similarity to this study, they sought to
find out how the visual stimuli offered influenced the attention of the advertisements’
viewer and how it weighed in on “quantity and vividness of mental imagery (cognition)
(Miller & Stoica, 2003, p. 13).” Results pointed towards artistic renderings being
“superior to the photograph in drawing attention (Miller & Stoica, 2003, p. 11).” This
was also the case in the study carried out. The un-natural application of the elements
175
and principles of design contributed towards this. However, it should be noted that this
did not necessarily translate into effective, explicit message transmission. In Miller &
Stoica’s study, “The photograph was found to be better for evoking greater quantity,
more vivid and more affectively positive mental imagery (Miller & Stoica, 2003, p.
11).” This was not the case in the study at hand. The photograph actually elicited a
lower quantity, of less vivid imagery. There was far less diversity in the range of
messages proclaimed which suggested that that a photograph passed on a more unified
message.
A study carried out by Scott and Vargas (2007), like Miller and Stoica (2003) also
looked at stylisation as a variable. The respondents assembled from two different
demographic groups one being local and the other foreign, stated what stylised images
told them about a fictitious brand of tissue paper (Mitchell & Olson, 1981; Scott, 1994;
Scott & Vargas, 2007). Scott and Vargas set out to demonstrate that imagery could be
used to “communicate simple declarative statements (or even lists) of product attributes
(Scott & Vargas, 2007, p. 341).” The results of these experiments clearly revealed that
images shown to the two different respondent demographics caused them converge on
two distinct substantial messages. This expressed meaning was referred to as strong
implicature. This was in converse to the results shown in this study. Whereas the
images did cause the respondents to come to a decision as to what the images
portrayed, the impressions reported were diverse, and presented images with weak
implicature. Smith (Winter-Spring 2007), who bears the same opinion as Scott and
Vargas (2007) explained that visual rhetoric is capable to eliciting unconscious
thoughts, however, this does not translate to conscious reasoned consistently
consensual arguments. As a result of this, it is not possible for imagery to cause an
176
audience generate consistent perceptions of a single image. Since images lack the
ability to pass on a consistent message, it may simply have been offering a platform for
a “visually manifested process (Smith V. J., Winter-Spring 2007).”
5.2 Selection of questions for quantitative research
Formulation of research instrument
The method of research was sequential exploratory. The questions used in the
quantitative phase of the research were generated and crystallised from the salient
themes from the qualitative phase. They had been stated as questions, concerns,
perceptions or queries, but were reformulated into questions forms for purposes of use
in the second phase of research.
The questions carried in the interview schedules are listed below;
Face Images
How natural do you find the product advertised by this image?
Does this product bleach the skin?
How soft does this product make the model’s skin?
How smooth does the product make the models’ skin?
Does the product make the model’s skin react?
How good is the product for the skin?
How dry would the product make the model’s skin?
How pleasant would the product smell?
How expensive would the product be?
How would you rate the product quality?
Is the product made from harsh chemicals?
177
Does the product age the skin?
Does the product make the lady look artificial (fake)?
Does the product make the lady have a weird skin colour?
Does the product make the model look like a star/ celebrity?
Does the product make the lady look modern?
Does the product make the lady confident?
Is the product relevant to you?
Is the picture creative?
Does this picture inform you about the product?
How Captivating and Attractive do you find this picture?
If deciding between this product and a competing product, how much would this image
influence you to buy this product?
Question picked or further Investigation under Quantitative techniques face images
were;
Does this product bleach the skin?
How smooth does the product make the models’ skin?
Does the product make the model’s skin react?
How good is the product for the skin?
How dry would the product make the model’s skin?
How expensive would the product be?
How would you rate the product quality?
Is the product made from harsh chemicals?
Does the product make the lady look artificial (fake)?

178
The questions carried in the interview schedules are listed below;
Food Images
How eye catching do you find the food?
Do you find the food appetising?
Does the food have a pleasant smell?
Would you say it is fresh?
Do you think the food is natural?
Does the food look nutritious?
Does the food look delicious?
How would you rate the quality of the food?
How expensive do you find the food?
How spicy do you find the food?
Would you eat the food?
Would you buy this food?
Question picked or further Investigation under Quantitative techniques food images
were;
Would you say it is fresh?
Do you think the food is natural?
Does the food look nutritious?
Does the food look delicious?
How would you rate the quality of the food?
How expensive do you find the food?
How spicy do you find the food?
179
Reasons for some question exclusions from final results and data analysis.
The researcher had designed questionnaires that had 22 questions on the face images
and 12 questions for the food images as listed above. However, some of them turned
out not to contribute positively to the research at hand, for various reasons. Though all
these questions were thought to be relevant at the outset of the research, the
respondents being untrained in visual design and literacy and by extension, the
language used in this field were unable to express their thought on issues that had to do
with the elements and principles of design.
A large number of the respondents felt that they were not in a position to answer some
of the questions as the images provided gave no indication as to how to gauge, visual,
tactile, olfactory, and gustatory values. This included questions such as;
Face Image
How soft does this product make the model’s skin?
Does the product age the skin?
Food Image
Do you find the food appetising?
Does the food have a pleasant smell?
The respondents felt that some questions were repetitive and did not add informational
value to the research. This included questions such as;
Face Image
How natural do you find the product advertised by this image?
Does the product make the lady have a weird skin colour?
Food Image
180
How eye catching do you find the food?
Some questions did not directly contribute to the research question, such as;
Face Image
Does the product make the model look like a star/ celebrity?
Does the product make the lady look modern?
Does the product make the lady confident?
Food Image
Would you eat the food?
Would you buy this food?
The large amount of questions increased the amount of data to be processed, making
for a large amount of unwieldy data produced for analysis that did not add
informational value but contributed to bulkiness and confusion.
5.3 Inferential Statistics
One Way Multivariate Analysis of Variance
In all the eighteen One Way Multivariate Analysis of Variance tests conducted, the null
hypothesis was accepted. These results clearly pointed to the fact that Social Class, Age
and Level of Education did not create a significant difference in the respondents’
perception of the images shown. Simply put, this may have pointed to the current social
phenomenon that consumer behaviour can no longer be defined by class structure, age
or level of education. It may also have been that class structure, age of level of
education were so intertwined with other aspects that denote cultural variables that it
181
was not possible to isolate any of these and individually apportion responsibility for
its’ contribution to a respondents’ perception of images (Silayoi & Speece, 2007).
The ever growing networks of mass communication have no respect for socio-cultural
or class boundaries. They spread cultural influences across all groups meaning that
there may no longer be boundaries between the classes, ages and levels of education as
perceived at the outset of this study. Common personal influences as propagated and
fuelled by the mass media and changing social norms, meant that the different classes
were stimulated from the same cultural script. The internet has ensured through various
social networks that ideas are shared between persons who in the past would never have
had the chance to associate with each other and exchange cultural material. “Cultural
interpenetration” has occurred that has caused the fusion and enrichment of elements of
different cultures, dilution of pre - existing cultures, and as a result, the alteration of
individual cultures (Craig & Douglas, 2005; Silayoi & Speece, 2007).
Respondents may find that they are constantly switching from one cultural mind set
along with its’ script to another. Individuals may now be capable of taking on more
cultural roles than they could or would in the past. Similarly, their responses to queries
may vary depending on the distinct cultural group they have mentally donned at the
time of interview, which may be any of the ones they are familiar with. This may have
resulted in a situation where the responses given to interview queries were fluid since
the respondents possess’ a variety of opinions. This does not augur well for research
designed as this one, where an attempt was made to discern patterns among specific
groups, as it was dependent on the existence of distinct social classes (Lizardo, 2006).
182
The study may benefit more from considering psycho graphics as opposed to
demographics (Shroeder, 2006). Looking into groups of persons who are tied together
by similar interests or activities, for instance sport, religion or institution attended may
yield groupings that converge in terms of similarities in perception of images.
However, it is to be noted that it is simply near impossible for all character and mood
defining elements to converge in two individuals. So, the outcome of exposure to a
stimulus such as an image, will not necessarily be the same for members of a similar
group, but may also be based on personal culture.
5.3.1 Information Processing Theory as pertains to inter and intra social class
perception of art styles
In as far as the empirical findings of studies in the Literature Review were concerned,
the Schema Theory held where demographic groups are viewed as a single, solid unit.
There appeared to be no consensus between the demographic groups on response to art
styles, which was acceptable, as they are deemed to have different socio-cultural
backgrounds. However, this lack of conformity of opinion and notions also held true
within members of demographic groups. Though not dismissed, this was simply not
catered for in studies found in the Literature Review. However, it is noted that
according to the Schema Theory the respondents used a pre-existing depository of
experiences and knowledge to process the images, engaging in selective perception to
decode them (Severin & Tankard, 2010). In line with this theory, the results displayed
may therefore be explained by multiplicity found due to the individual respondent’s
backgrounds. If the premise that individual and social experiences, assumptions,
motivation, attitudes, emotions, mood, and other psychological factors greatly
influenced the respondent’s perception of images is true (Phillips, 1997; Schroeder J.
183
E., 2008) then at a micro level, the Schema Theory can be deemed as valid. It is
plausible and therefore acceptable that there be no consensus among members of the
same demographic group on response to art styles.
Schemata and Understanding Discourse
As expounded in the quoted theory, respondents engaged in an intricate thought
process, in a relationship with the images. This thought process did not necessarily
follow a prescribed identical path for respondents from a similar, or dissimilar
demographic background. This research as designed, was not capable of explaining
precisely why the audience was making independent decisions on what message(s) the
images conferred.
According to Rumelhart, (1980) a variety of occurrences may have caused the
diversity. First, the viewer may not have or may have selected the appropriate
schemata. With the wrong schemata used to decode the image, it was thus not possible
to comprehend or decode the concept being communicated as intended by the encoder.
Secondly, the viewer may have selected the appropriate schemata, but the clues given
by the visual encoder may not have been appropriate or sufficient to aid
comprehension. Or, it may have been that the image stylisation was not the problem,
but the fact that the encoder lacked satisfactory expertise and / or technical proficiency
to create an image that communicated effectively. Additional cues may have been
necessary to increase the viewers’ level of understanding.
Thirdly, the viewer may have seen and interpreted the encoded image to the best of
their ability and understanding, using what they identified as the correct schema for the
184
task at hand. However, the viewer may have misinterpreted the image in the eyes of the
encoder, who did not intend to communicate the message as interpreted by the decoder.
5.3.2 The Rhetorical Theory and the relationship between the respondents’
perception of various art styles used in print media advertising and social
class
Rhetorical Theory is interpretive in nature and is viewed as one parties attempt to
influence another by designing, packaging and encoding communication materials that
are to be transmitted to gain effect (Lucaites, Condit, & Caudill, 1999). The images as
employed in the study partially supported the Rhetorical Theory. It posited that art
styles are programmed signs and conventions designed to communicate pre-determined
messages as sanctioned by social convention. Cartoons, expressionist paintings, and
realistic photographs communicated as per the set goals of these styles of art to the AB,
C1 and C2 population of Nairobi. Cartoons were widely perceived as playful and not
solemn in the gravity of message to be conveyed. The messages portrayed by the
cartoon bore these qualities. Expressionist images were generally observed as
portraying specific subjective ideas influenced by the way the elements and principles
of design were applied to articulate precise thoughts. These qualities were attracted by
the abstract painting images. Realistic images were broadly thought to be objective and
show an item exactly as the article appears, portraying distinct qualities. This applied to
the photographs.
Visual rhetoric as a perspective demands that a respondent react to the image in
question rhetorically as opposed to aesthetically. It was noted that respondents, of
whose views the researcher had no direct control over, responded to images in both
185
ways. They tended to first respond aesthetically and then rhetorically (Foss S. , 2004,
pp. 306 - 307). It is not known why this was the case. It may have been due to the
inability to react rhetorically due to visual illiteracy, or a host of other factors unknown
to the researcher. Further research would be necessary to establish the cause for this.
In their study of disparity in interpretation of images among dissimilar cultures, Bulmer
& Buchanan recommended the rhetorical approach as it made it possible to unearth
“differences in consumer interpretation of visually complex advertising (Bulmer &
Buchanan, 2006a, p. 58).” It supported the interpretation of advertisements, and the
understanding of how meaning was given to them and inference conferred by the
viewer. As per Scott and Vargas (2007) discussion on theory, the images had an
influence on perception due to communicative artefacts as presented by the elements
and principles of design utilised, as opposed to sensory stimulation (Scott & Vargas,
2007, p. 343). This belief that visual rhetoric bore varied and intense communicative
qualities based on their context and stylisation was supported by the study at hand.
However, it was at cross roads with the rhetoric theory in that it was unable to support
the notion that the communicative artefacts could broadcast predetermined information
in a predictable manner. It may not be advisable to throw out the theory in its entirety.
The fact that the study may not be able to determine variables that create unforeseen
discrepancies does not negate the influencing factor of art styles.
5.3.3 Copy Theory and the relationship between the respondents’ perception of
various art styles used in print media advertising and social class
The Copy Theory postulates that pictures represent reality as it is, and are natural (Bu,
Kim, & Lee, 2009; Scott, 1994). The target audience is familiar with photography. In
186
all magazines checked for use of style of art styles employed for advertising of the kind
considered in this research, photography was in exclusive use. It appeared to be viewed
as the most effective way to communicate with the target audience when advertisers
sought to pass on a singular message to their audiences. It is assumed that if a
photographic message was well encoded, it would be decoded as required and
expected. As such, it would have been expected that photography produced results
with far more similar views as opposed to the cartoon and painting. However, this was
not the case. As seen inTable 13 photography like the cartoon and painting images
presented varying thematic interpretations, though not to as great an extent as the
former two. This would lead one to the conclusion that not only did all presented art
styles pass divergent messages, but they were all ineffective at their key function of
passing on a distinct message. From the results, it would appear that the interpretation
of an image was very person centric. The response mechanisms employed by the
respondents may have taken an objective or subjective processing path, but was a
singular exercise specific to an individual. This goes against the Copy Theory (Bu,
Kim, & Lee, 2009; Scott, 1994) where a singular message as is the case with written
text should have been conveyed.
5.4 Theoretical Implications Hypothesis
1. There is no significant difference between art style used in print media and
its’ perceptions by respondents’ from diverse social classes.
2. There is no significant difference between art style used in print media and
its’ perception by respondents’ from diverse age groups.
187
3. There is no significant difference between art style used in print media and
its’ perception by respondents’ from diverse levels of education.
The inferential statistics results of the research show that social class as stratified with
AB, CI, and C2, age as delineated as 20 – 24, 25 – 29, and 30 – 34, and level of
education demarcated according to primary, secondary, tertiary college, undergraduate
and postgraduate levels have no significant effects on the respondents perception of the
visual images shown them. These results were unexpected. It was presumed that these
parameters commonly used to distinguish the different groups within a populace and
cluster their commonalities would translate to guidelines that assisted classify the
individual groups perception style. This could point to a variety of factors. The
researcher suggests that these variables are probably co-influenced by other variables
that were not tested in this study. There are probably confounding variables to be
reckoned with. The type of classification used to cluster the respondents for purposes of
research could have been wrong and other types of classification should have been
sought. The target audience could simply have been so divergent as to defy any
classification of their perception patterns. The types of art style selected for research
purposes could be incapable of communicating a message as encoded. The reasons as
picked up during the research were legion and only further research could begin to
locate where solutions lay.
The fact that the results show that social class, age and level of education are not
determining factors in image perception validates the schema theory that chooses to
isolate factors as varied as personality traits and mood. However, in all of this, it must
be noted thatinformation processingtheories including the schema theoryare not as
188
straight forward and coherent as other communication theories. They cannot be used to
explain precise media effects on a media audience. They seek simply articulate
processes (Baran & Davis, Mass Communication Theory: Foundations, Ferment, and
Future , 2006).
5.5 Proposed Framework
The proposed framework was advanced as a visual structure to help organise the
information and ideas developed from research, so as to assist designers work more
effectively on the problem. It puts forward best practices that to abstracts routine tasks
into a generic module that can be reused. The framework hopes to allow the image
developer focus on tasks that are unique to a specific project, rather than reinventing
the wheel each time around. It will contribute to defining, learning, experimenting and
building, so as to generate results for testing and eventually iteration of the process.
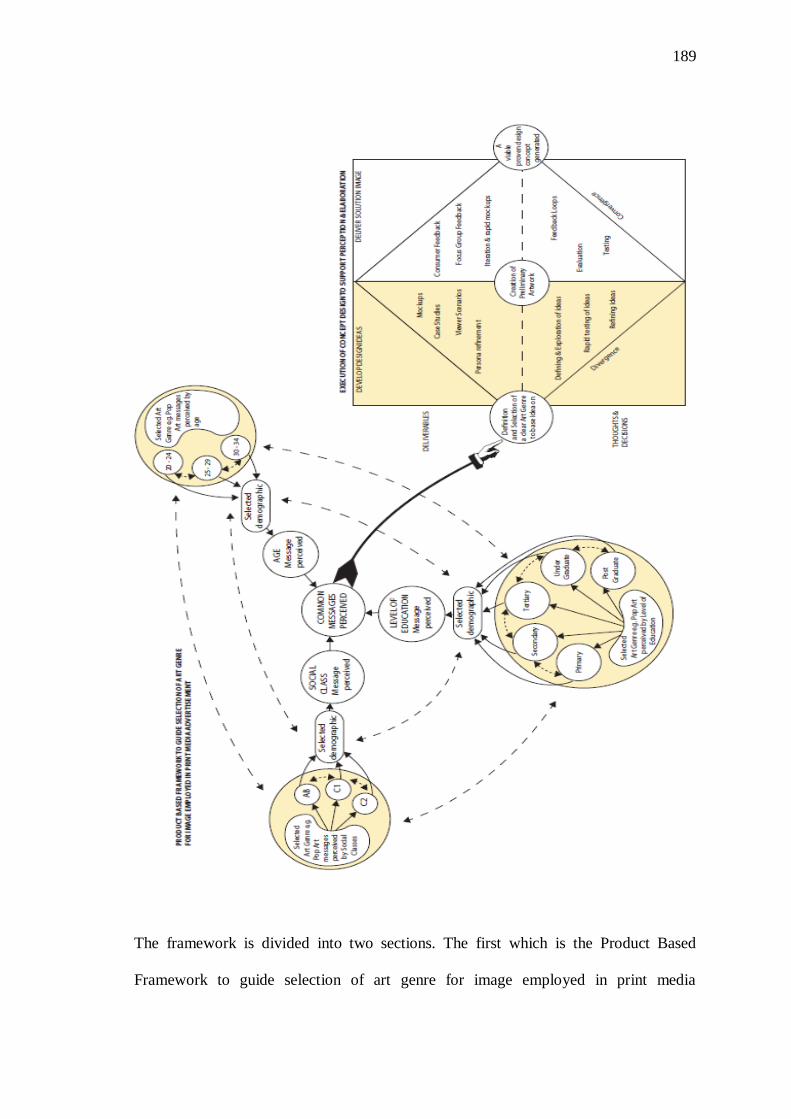
189
The framework is divided into two sections. The first which is the Product Based
Framework to guide selection of art genre for image employed in print media
190
advertising and the second section which is the Execution of Concept Design to support
perception and elaboration. In the first section of the study, all the art genre messages
from a specific art genre, such as Pop art for example as perceived by the respondents
are fed into their respective sections. All the messages from the social class section, age
section, and level of education section are inserted into their designated slots. These are
then filtered according to the first tier of demographics as nominated by a designer.
These are AB, C1, C2, 20 – 24, 25 – 29, 30 – 34, Primary, Secondary, Tertiary,
Undergraduate, and Postgraduate. They produce a list of messages that are then filtered
a second time to across the lists produced from the three demographic sectors of social
class, age, and level of education. They produce a hybrid list that display only the
perceived messages that are common to all the input messages. From this, it is possible
to decipher what messages are promulgated by a specific art genre in the view of
selected demographics. If the art genre in question meets the criteria of the designer,
they then taken to the second stage of development.
The second stage is the Execution of Concept Design to support perception and
elaboration. It is heavily informed by the Double Diamond generated by the Design
Council in the United Kingdom (Design Council, 2020). The designer first contends
with the development of design ideas and finally the delivery of a solution image. In
both these phases, they are faced with both deliverable artefacts and thoughts and
decisions, which should assist converge at a single solution. The deliverable artefacts
under the development of design ideas, include but are not limited to viewer scenarios,
persona refinement, case studies, mock-ups. Under thoughts and decisions, the
designers seeks to explore and refine their ideas. They are in a state of divergence
where they generate as many outcomes as possible. With the delivery of solutions
191
images, the deliverable artefacts originate from activities such as consumer feedback
and focus group discussions. Their views are elicited form rapid mock-ups which are
subject to refinement and further evaluation and subsequent iteration. The thoughts and
decisions of the designer are characterised by testing and feedback loops. These finally
converge at a viable proven design concept portrayed by an image in the desired art
genre that communicates as anticipated.
The first section of the framework represents the core of the study. The study hoped to
generate accurate information that would be fed into the selected Art Genre message(s)
at the inception of the concentric circles that lead to the point of common message(s)
perceived. This did not occur as the messages generated where too disparate to
precipitate and accurate information.
5.6 Policy Implications
Currently there is not written, official policy or document on the use of art styles that
recommends or matches specific image types or styles for communication to the
specific cohorts to be reached, for the use of Art Director or Designers in Nairobi. This
gap in advertising formulation information is particularly noticeable in this study that
comprises women from the AB, C1 and C2 social class, aged between 20 and 34, and
from all levels of education. Advertisers have tended to rely on experience and tradition
to select the art style to be used to target this group. By and large, photography is the
preferred mode of visual communication. As the results of this research stand, it is not
possible to offer precise, undisputable advice on which art style to use for specific
audiences. The experiments have not yielded precise results but instead confirmed that
192
not only does diversity occur between cohorts, it also occurs within cohorts. This points
to a situation where the schema theory is not rejected or solidly confirmed but indicates
similar occurrences within and without cohorts and also acts to raise new questions
about what should be going on in the field of visual advertising. The situation calls for
more research.
5.7 Delimitations
The conditions under which conventional experiments are carried out with visual
imagery are such that there is distinctunforced exposure, forced exposure and forced
non-exposure in play. Respondents are notified or distinctly aware that they will be
shown advertisements and asked questions pertaining to them. The problem with these
conditions, as far as understanding advertising research is concerned, is their forced
character. Advertising experiments are not carried out under natural conditions, as
would be found in the world. “Conversely, the distinctive characteristic of mass-media
advertising, relative to virtually any other category of persuasion or influence attempt,
is that exposure and processing are the option of the audience. Under conditions of
unforced exposure, ads must simultaneously win attention, and be persuasive,” (Scott &
Batra, 2003, p. 216). This brings into question the objectivity of the research where this
is not the case.
Participants are required to respond and give verbal reactions to visual imagery that is
processed mentally. This puts them in a position in which they are translating from
visual imagery to verbal forms. Wherever translation occurs from one mode to another,
there is loss and muddling up of data, due to differences in forms of expression inherent
193
in different modes of communication. This does not augur well for the data collected
(Mick & Politi, 1989, p. 8; Rossiter, 1982).
It was noted that lack of visual literacy is common among the Nairobi populace.
However, this claim could not be conclusively stated due to lack of literature to support
this statement. It manifests itself when research on visual images is to be carried out
among a populace and they are not capable of expressing themselves optimally. In
order for research on visual communication to occur effectively, there must be visual
literacy among the respondents to be interviewed.
Some participant’s ability to express themselves was limited by their command of
spoken language and their levels of perspicuity.
Under the Quantitative section of the research, with the correlation tests carried out,
there was an attempt to predict the behaviour of one variable based on another variable.
The researcher questioned whether the apparent lack of relationship between the
variables could be generalised as there was an inability to isolate the specific
confounding factors that may have led to this lack of relationship.
5.8 Chapter Summary
The qualitative results as posted reveal that the respondents had divergent views. The
views held between and within the social classes in response to the different art styles
reflected personal occurrences that is not necessarily modified by the variables as
presented in this research. Its’ influences remained uncovered by this research and
194
should be investigated further. Non photographic images elicited a higher variety of
responses. This goes to show that they may stimulate more thought from the viewer,
thus possibly being of more interest to them. In all the eighteen One Way Multivariate
Analysis of Variance tests conducted, the null hypothesis was accepted. These results
clearly pointed to the fact that Social Class, Age and Level of Education did not create
a significant difference in the respondents’ perception of the images shown. The results
upheld the tenets of the Rhetorical Theory and Information Processing Theory as
elucidated by the use of Schemata. It must be noted that these results were achieved
under un-natural experimental conditions among an audience with a high rate of visual
illiteracy. This is bound to have affected the results to a certain degree.
195
6 CHAPTER SIX - CONCLUSIONS AND RECOMMENDATIONS FOR
FUTURE RESEARCH
6.1 Introduction
The researcher set out to find out what the degree of consensus of message, and
therefore scope of message(s) communicated between demographic groupings in
response to different art genre in print media advertisements was. It was initially
believed that the three different cohorts AB, C1, and C2 would have divergent views on
the images presented to them. The results for both face and food responses across both
focus groups 1 and 2 confirmed this. Also in question, was what the degree of
consensus of message, and therefore scope of message(s) communicated among
members of the same demographic group in response to different art genre in print
media advertisements could be. It would appear that the social classes studied herein do
not possess a singular interpretation of the art styles as presented. The degree of
elaboration, and therefore scope of message(s) communicated by different art styles
was questioned. The more complex cartoon image generated the highest degree of
elaboration, with the photograph, which is the least complex or deviated image in the
eyes of the public eliciting the lowest amount of elaboration and generating the least
amount of themes. Three hypotheses were put forward that stated that there was no
significant difference between art style used in print media and its’ perceptions by
respondents’ from diverse social classes, age groups and levels of education. In all the
eighteen One Way Multivariate Analysis of Variance tests conducted, the null
hypothesis was accepted. These results clearly pointed to the fact that Social Class, Age
196
and Level of Education did not create a significant difference in the respondents’
perception of the images shown.
This research was carried out with a view to providing recommendation for ideal art
styles to use when communicating particular, pre-determined messages to specific
target audiences. It did not entirely successfully answer this question but did shed light
on issues such as degree of consensus on response between in within demographic
cohorts, as well as relationship between artistic style of image and social class, age and
level of education. The study was also able to unearth suggested areas for further
research based on questions that arose that needed further clarification during the
course of the inquiry in order to assist answer the key research question.
6.2 Conclusions
The degree of consensus of message, and therefore scope of message(s) communicated
between demographic groupings in response to different art genre in print media
advertisements was questioned. The results posted for both face and food responses
across both focus groups 1 and 2 confirmed that AB, C1, and C2 have divergent views
on the images presented to them. This outcome confirms the proposition put forward by
both the Rhetorical and Schema Theories. However, the viability of this premise is
tested by the results to the question on what the degree of consensus of message, and
therefore scope of message(s) communicated among members of the same
demographic group in response to different art genre in print media advertisements is,
which were unexpected. It is noted here that there was a wide diversity of opinions as
to what the images presented represented. This was common to both face and food
197
images. This was the case despite what was thought to be homogenous socialisation of
the respondents within the same social class. This goes against the Schema Theory and
renders any heterogeneity in opinions between groups ineffectual. This due to the fact
that any inter-group differences will most likely exist due to under-laying, pre-existing
intra-group differences.
The degree of elaboration, and therefore scope of message(s) communicated by
different art styles was questioned. Results showed that the more complex cartoon
images generated the highest degree of elaboration, and the photograph, which is the
least complex or deviated image in the eyes of the public eliciting the lowest amount of
elaboration. This falls in line with the concepts postulated by the Rhetorical Theory.
In general, the results from the face images differed slightly from those of the food
images. Is this difference coincidental or is there a reason behind it?
The hypotheses as advanced stated that there was no significant difference between art
style used in print media and its’ perceptions by respondents’ from diverse social
classes, age groups, and diverse levels of education. Results from the research showed
that social class, age and level of education are not of much consequence in decision
making for perception of images among the respondents.
Demographic(s) may have an effect on response to the different art styles in print media
advertisement. It may affect the degree to which a respondent discharges elaboration,
and the type and scope of message(s) communicated and subsequent response given to
different art styles in print media advertisement. However, demographics as defined in
198
this study which encompasses social class, age and level of education does not have a
distinct effect on response to the different art styles in print media advertisement. It
must be noted that this does not give the researcher license to reject the Schema Theory
or the Rhetorical Theory. It is necessary that further research is carried out to reveal if
there are any confounding variables that influence the findings of the study.
6.3 Contribution to knowledge
Hagtvedt and Patrick (2011, p. 1630) recommended that it was necessary to investigate
the target audience’s’ perception and evaluation of images conveying information about
disparate goods. They believed that dissimilar perception and evaluation may be raised
when stylised images are used to advertise disparate goods. This research showed that
this was indeed the case with female millennials in Nairobi. Results between face and
food showed dissimilarities in the study population.
Hagtvedt and Patrick (2011, p. 1630) questioned the role of style elements used in
advertising images. They feared that the eye and mind may only be attracted to content
displayed, or the ambience around the goods displayed. They posited that stylisation of
an image (Hagtvedt & Patrick, 2011, p. 1630),” and as well as, the combination of
design elements may have an effect on viewers’ perceptions and evaluation. The results
in this research confirmed this to be the case in the study population.
Bulmer and Buchanan-Oliver (2006b, p. 66), concur with Hagtvedt and Patrick (2011)
recommend that research should look into the specifics of ethnic contexts as a
consideration. In the study at hand, this was looked at, at the micro level. The divergent
199
cultures of the study population were studied under the aegis of demographics. The
study goes on to show that demographics within the study population are of no
consequence when social class, age, level of education considered.
Scott and Vargas (2007, p. 353), seek to posited that images were akin to a writing
system in their communication abilities. The disparity in perception of images between
and among the study population in this research showed that this was clearly not the
case.
6.4 Recommendations
Research needs to be carried out to investigate further why the intra group diversity of
views occurs. Information garnered from this may then contribute towards informing
inter-group differences.
Further research needs to be done to uncover if the differences in the results from the
face images that differ slightly from those of the food images is coincidental. This is
because any results garnered for response to image style that are based a specific
product category may only hold true for that category of products. This means that an
independent test on respondents’ response to images must be carried out in every
product category to determine what holds true for each product category as results
cannot be generalised to all product types.
Further research needs to be carried out to uncover the confounding variables and / or
factors that contributed to the production of divergent views where there should have
200
been consensus, as least according to theories such as the Schema Theory. This would
assist deliver design research studies that may produce more perspicacious results.
There is a need to test other disparate social factors beyond class, age and level of
education to see if there are other demographics or psychographics that affect
perception of images. These may lead to answers on whether or not the target audience
in the groups as we know them are so dissimilar that identifying a single art style that
communicates effectively is not feasible.
6.5 Chapter Summary
“Half the money I spend on advertising is wasted; the trouble is, I don’t know which
half” is a quote often used in advertising and attributed to John Wanamaker (Fox, 2009,
p. 273). Though an ironical statement it serves to lay emphasis on the complexities of
advertising and visual communications and how frustrating and befuddling it can be to
decipher that which pertains to it. In the same statement lies the concern on
expenditure, which is an issue of disquiet for most advertisers. It is necessary that
advertisers not only communicate, but communicate spending their funds judiciously.
In order to achieve this, it is necessary to have prudent information on hand to employ
when making decisions that consider both communication and resources available. For
this reason, it is necessary that the information is collected and published in manner
that is useful to the trade. It is necessary that issues such as demographics and if or how
they affect response to the different art styles in print media advertisement be answered.
201
REFERENCES
Agriculture Sector Development Support Programme. (2016). Agriculture Sector
Development Support Programme. Retrieved April 24, 2016, from Agriculture
Sector Development Support Programme: www.asdsp.co.ke/index.php/nairobi-
county
Aguilar, A., Guthmann, T., Strusani, D., & Williams, C. (February 2014). The
Omnichannel opprotunity: Unlocking the power of the connected consumer; A
Report for eBay. London: The Creative Studio at Deloitte: Deloitte Touche
Tohmatsu.
Albakry, N. S., & Daimin, G. (2014). The Visual Rhetoric in Public Awareness Print
Advertising toward Malaysia Perceptive Sociolcultural Design. Procedia -
Social and Behavioural Sciences.155, pp. 28 - 33. Langkawi - Malaysia:
Elsevier: Science Direct.
Almeida, D. (2009). Where Have All the Children Gone? A Visual Semiotic Account
of Advertisements for Fashion Dolls. Visual Communication , 481 - 501.
Amine, L. S., & Smith, A. J. (2009). Challenges to Modern Consumer Segmentation in
a Changing World: The Need for a Second Step. Multinational Business
Review, 17 (3), 71+.
An, D. (2007). Advertising visuals in global brands’ local websites: a six-country
comparison. International Journal of Advertising, 26 (3), 303–332.
Atzmon, L. (2011). Visual Rhetoric and the Eloquence of Design. (L. Atzmon, Ed.)
Anderson, SC, USA: Parlor Press.
Auerbach, C. F., & Silverstein, L. B. (2003). Qualitative Data: An Introduction to
Coding and Analysis. New York: New York University Press.
Bachman, R., & Schutt, K. R. (2011). The Practice of Research in Criminology and
Criminal Justice (4 ed.). Los Angeles, USA: Sage.
Baker, F. W. (2012). Media Litereacy in the K-12 Classroom. U.S.A.: International
Society for Technology in Education.
Baker, R., Brick, M. J., Bates, N., Battaglia, M., Couper, M. P., Dever, J. A., et al.
(2013). Summary Report of the AAPOR Task Force on Non-Probability
Sampling. Rockville, USA: Oxford University Press.
Baran, S. J., & Davis, D. K. (2006). Mass Communication Theory: Foundations,
Ferment, and Future . Australia: Thomson Wadsworth.
Baran, S. J., Davis, D. K., & Striby, K. (2014). Mass Communication Theory :
Foundations, Ferment, and Future. Andover; GB: Cengage Learning.
202
Barnes, S. B. (2011). An Introduction to Visual Communication: From Cave Art to
Second Life. New York: Peter Lang.
Barrett, T. (2005). Criticizing Photographs: An Introduction to Understanding Images
(4th ed.). New York: McGraw-Hil.
Bassie, A. (2012). Art of Century : Expressionism. New York: Parkstone International.
Bazeley, P. (2004). Issues in Mixing Qualitative and Quantitative Approaches to
Research. In R. Buber, J. Gadner, & L. Richards, Applying Qualitative Methods
to marketing management Resrach. UK: Palgrave Macmillan
Bourdieu, P. (1993). Outline of a Sociological Theory of Art Perception. In P.
Bourdieu, The Field of Cultural Production: Essays on Art and Literature (pp.
215 - 237). Columbia, USA: Columbia University Press.
Boushey, C. J., Harris, J., Bruemmer, B., & Archer, S. L. (2008). Publishing Nutrition
Research: A Review of Sampling, Sample Size, Statistical Analysix, and Other
Key Elements of Manuscript Preparation, Part 2. Journal of the American
Dietetic Association, 108, 679 - 688.
Bowling, A., & Ebrahim, S. (2005). Handbook of Health Research Methods:
Investigation, Measurement and Analysis. Maidenhead, England: Open
University Press.
Breckenridge, J. P., Jones, D., Elliot, I., & Nicol, M. (2012). Choosing a
Methodological Path: Reflections on the Constructivist Turn. Grounded Theory
Review: An International Journal, 11 (1).
Brick, M. J. (2011). The Future of Survey Sampling. Public Opinion Quarterly , 872 -
888.
Brommer, G. F., & Kohl, D. (1988). Discovering Art History (Vol. 2nd ed.). Worcester,
Massachusetts: Davis Publications Inc.
Brumberger, E. (2011). Visual Literacy and the Digital Native: An Examination of the
Millennial Learner. Journal of Visual Literacy, 30 (1), 19–46.
Bryman, A. (1994). Analysing Qualitative Data. London:: Routledge.
Bu, K., Kim, D., & Lee, S.-y. (2009). Determinants of visual forms used in print
advertising: A cross-cultural comparison. International Journal of Advertising,
28 (1), 13-47.
Bulmer, S., & Buchanan, M.-O. (2006a). Visual Rhetoric and Global Advertising
Imagery. Journal of Marketing Communication, 12 (1), 49-61.
203
Bulmer, S., & Buchanan-Oliver, M. (2006b). Advertising across Cultures:
Interpretations of Visually Complex Advertising. Journal of Current Issues and
Research in Advertising, 28 (1), 57 - 71.
Bush, M. D. (2007). Facilitating the integration of culture and vocabulary learning: The
categorization and use of pictures in the classroom. Foreign Language Annals,
40 (4), 727 - 745.
Callister, M. A., & Stern, L. A. (2008). Inspecting the Unexpected: Schema and theh
Processing of Visual Deviations. In E. F. McQuarrie, & B. J. Philips, Go
Figure! New Directions in Advertising Rhetoric (pp. 137 - 156). Armonk, USA:
M. E. Sharpe.
Callow, M. A., & Schiffman, L. G. (2002). Implicit meaning in visual print
advertisements: a cross-cultural examination of the contextual communication
effect. International Journal of Advertising, 21 (2), 259-277.
Carlson, E. (2011). "20th-Century U.S. Generations”. Retrieved 09 19, 2012, from
Population Reference Bureau:
http://www.prb.org/Publications/Reports/2009/20thcenturyusgenerations.aspx
Cisneros, D. J., McCauliff, K. L., & Beasley, V. B. (2009). The Rhetorical Perspective;
Doing, Being, Shaping, and Seeing. In W. D. Stacks, & M. B. Salwen (Eds.),
An Integrated Approach to Communication Theory and Research (pp. 232 -
244). New York: Routledge.
Coulter, K. S. (2005). An Examination of Qualitataive vs. Quantitative Elaboration
Likelihood Effects. Psychology and Marketing, 22 (1), 31 - 49.
Craig, S. C., & Douglas, S. P. (2005). Beyond National Culture: implications of
cultural dynamics for consumer Research. International Marketing Review, 23
(3, (2006)), 322-342.
Cranwell, E. (n.d.). Kibera, Nairobi Urban Study. Retrieved May 11, 2016, from
Where is Kibera Located: http://cranwellkiberaproject.weebly.com/where-is-
kibera-located.html
Creswell, J. W. (2009). Research Design; Qualitative, Quantitative, and Mixed
Methods Approaches (3 ed.). Los Angeles: Sage Publications.
Crystal, D. (1987). The Cambridge Encyclopedia of Language. Cambridge:
Cambridgae Universtiy Press.
Cupchik, G. C., Vartanian, O., Crawley, A., & Mikulis, D. J. (2009). Viewing artworks:
Contributions of cognitive control and perceptual facilitation. Brain and
Cognition, 70, 84 - 91.
Cyr, L. L. (2009). Art Revolution: Alternative Approaches for Fine Artists and
Illustrators. Cincinatti , OH: North Light Books.
204
Davis, C. S., Myers, S. A., & Gallardo, H. P. (2011). Straight Talk about
Communication Reserach Methods. Dubuque, Iowa, USA: Kendall Hunt
Publishing Company.
Davis, D. K., Kelli, S., & Stanley. (2014). Baran, Stanley, Davis, Dennis, and Striby,
Kelli. Mass Communication Theory : Foundations, Ferment, and Future.
Andover: GB: Cengage Learning.
Daymon, C., & Holloway, I. (2002). Qualitative Research Methods in Public Relations
and Marketing Communications. London: Routledge.
Deepak, N. (2007). Modern Mass Communication (Concepts and Processes). Delhi:
Oxford Book Company.
DeRosia, E. D. (2008). Rediscovering Theory: integrated Ancient and modern
Empirical Evidence of the Audience - Response Effects of Rhetorical Figures.
In E. F. McQuarrie, & B. J. Philips, Go Figure! New Directions in Advertising
Rhetoric (pp. 23 - 50). Armonk, New York, USA: M. E. Sharpe.
Djamasbia, S., Siegelb, M., & Tullisb, T. (2010). Generation Y, Web Design, and Eye
Tracking. International Journal of Human-Computer Studies , 307 - 323.
Dworkin, S. L. (2012). Sample Size Policy for Qualitative Studies Using In-Depth
Interviews. Archives of Sexual Behaviour , 1319 - 1320.
eBay. (2014, April 28). eBay.com. Retrieved December 21, 2015, from 10 Most
Popular Modern Painting Styles: www. ebay.com/gds/10-Most-Popular-
Modern-Painting-Styles-/10000000177628177/g.html
Edwards, T. C., Cutler, R. D., Zimmermann, N. E., Geiser, L., & Moisen, G. G. (2006).
Effects of Sample Survey Deesign o the Accuracy of Classification Tree
Models in Species Distribution Models. Ecologicl Modeling, 199, 132 - 141.
El Hussein, M., Hirst, S., Salyers, V., & Osuji, J. (2014). Using Grounded Theory as a
Method of Inquiry: Advantages and Disadvantages. The Qualitative Report
2014,, 19 (13), 1 - 15.
Eppler, M. J., & Ge, J. (April 2007). Communicating with Diagrams: How Intuitive and
Cross-cultural are Business Graphics?: Results of Image Sorting Experiments
with Strategy Students in the United Kingdom and China. Euroasia Journal of
Management , Paper #1/2007.
Esgate, A., Groome, D., Baker, K., Heathcote, D., Kemp, R., Maguire, M., et al.
(2005). An Introduction to Applied Cognitive Psychology. Hove, England,
United Kingdom: Psychology Press.
Fawcett, L. (2003, Spring). Comparative Sculpture Lesson Plan. Retrieved January 13,
2016, from Allen Memorial Art Museum; Arts of Asia in Reach:
http://oberlin.edu/amam/asia/sculpture/Default.html
205
Felten, P. (2008). Visual Literacy. Change: The Magazine of Higher, 40 (6), 60 - 64.
Foss, S. (2004). Framing the Study of Visual Rhetoric Toward a Transformation of
Rhetorical Theory. In C. A. Hill, & M. Helmers (Eds.), Defining Visual
Rhetorics (pp. 303 - 313). Mahwah, NJ: Lawrence Erlbaum Associates.
Foss, S. K. (2005). Theory of Visual Rhetoric. In K. Smith, S. Moriarty, & ,. G.
Barbatsis (Eds.), Handbook of Visual Communication; Theory, Methods, and
Media (pp. 141 - 152). Mahwah, NJ: Lawrence Erlbaum Associates.
Fox, S. C. (2009). E-Riches 2.0: Next-Generation Marketing Strategies for Making
Millions Online. New York: American Management Association.
Gardner, S. F. (2006). Preparing for the Nexters. American journal of pharmaceutical
education, 70 (4), 87.
Gelbrich, K., Gathke, D., & Westjohn, S. A. (2012). Effectiveness of Absurdity in
Advertising Across Cultures. Journal of Promotion Management, 18, 393 - 413.
Gianatasio, D. (2015, September 28). How Blending Art andCommerce Drove Absolut
Vodka"s Campaigns: Messages Inspired by a Bottle. Adweek Magazine .
Gkiouzepas, L., & Hogg, M. (2011). Articulating a New Framework for Visual
Metaphors in Advertising: A Structural, Conceptual, and Pragmatic
Investigation. The Journal of Advertising, 40 (1), 103 - 120.
Gliner, J. K., Morgan, G. A., & Leech, N. L. (2011). Research Methods in Applied
Settings: An Integrated Approach to Design and Analysis. New York:
Routledge.
Gonzalez, H., Heilbron, J., & Ortiz, A. W. Science Diet: Husband. Science Diet.
Cerebro, Young and Rubicam, Panama, Panama.
Gravetter, F. J., & Wallnau, L. B. (2007). Statistics for Behavioural Sciences (7 ed.).
United Kingdom: Thomson Wadsworth.
Gray, D. E. (2014). Doing Research in the Real World (3 ed.). London: Sage.
Grinnell, J. R., & Unrau, Y. A. (2005). Social Work Research and Evaluation:
Quantitative and Qualitative Approaches (7 ed.). New York: Oxford University
Press.
Groenewald, T. (2004). A Phenomenological Research Design Illustrated. International
Journal of Qualitative Methods, 3 (1), 1 - 26.
Guest, G., Bunce, A., & Johnson, L. (2006). How Many Interviews are Enough?: An
Experiment with Data Saturation and Varibility. Field Methods , 59 - 82.
206
Hagtvedt, H., & Patrick, V. M. (2011). Turning Art Into Mere Illustration: Concretizing
Art Renders Its Influence Context Dependent. Personality and Social
Psychology Bulletin, 37 (12), 1624 - 1632.
Hagtvedt, H., Hagtvedt, R., & Patrick, V. M. (2008). The Perception & Evaluation of
Visual Arts. Empirical Studies of the ARts, 26 (2), 197 - 218.
Hagtvedt, H., Hagtvedt, R., & Patrick, V. M. (2008). The perception and evaluation of
visual art. Empirical Studies of the Arts, 26(2), 197 - 218.
Hagtvedt, P., & Patrick, V. M. (2008). Art Infusion: The Infuence of Visual Art on the
Perception and Evaluation of Consumer Products. Journal of Marketing
Research, XLV, 379 - 389.
Hansen, E. C. (2006). Successful Qualitative Health Research: A Practical
Introduction. Crows Nest, N.S.W.: Allen & Unwin.
Harrison, C. (2003). Visual social semiotics: understanding how still images make
meaning. Technical Communication (Applied Theory), 50 (1 (February 2003)),
46 - 60.
Harrison, S. (2001). Pop Art and the Origins of Post-Modernism. Cambridge, England:
Cambridge University Press.
Hatfield, K. L., Hinck, A., & Birkhoht, M. J. (2007). Seeing the Visual in
Argumentation: A Rhetorical Analysis of UNICEF Belgium's Smurf Public
Service Annoucement. Argumentation and Advocacy, 43 (Winter Spring 2007),
144 - 151.
Hayes, N. (2000). Doing Psychological Research: Gathering and Analysing Data.
Philadelphia: Open University Press.
Head, M., & Ziolkowski, N. (2010 (June)). Understanding Student Attitudes of Mobile
Phone Applications and Tools: A Study Using Conjoint, Cluster and SEM
Analyses . 18th European Conference on Information Systems (ECIS 2010) (p.
161). Pretoria, South Africa: European Conference on Information Systems
(ECIS).
Heffernan, J. A. (2006). Cultivating Picturacy: Visual Art and Verbal Interventions.
Waco, TX: Baylor University Press.
Hetsroni, A., & Tukachinsky, R. H. (2005). The use of fine art in advertising: A survey
of creatives and content analysis of advertisements. Journal of Current Issues &
Research in Advertising, 27 (1), 93-107.
Hill, C. A., & Helmers, M. (2004). Defining Visual Rhetorics. Mahwah, NJ: . Lawrence
Erlbaum Associates.
207
Hopperstad, M. H. (2010). Studying Meaning in Children's Drawings. Journal of Early
Childhood Literacy, 10 (4), 430 - 452.
Huhmann, B. A. (2008). A Model of the Cognitive and Emitonal Processing of
Rhetorical Works in Advertising. In E. F. McQuarrie, & B. J. Philips, Go
Figure! New Directions in Advertising Rhetoric (pp. 85 - 113). Armonk, New
York, USA: M. E. Sharpe.
Ihuah, P. W., & Eaton, D. (2013). The Pragmatic Research Approach: A Framework
for Sustainable Managaemnt of Public Housing Estates in Nigeria. Journal of
US-China Public Administration, 10 (10), 933 - 944.
Ireland, C. (2003). Qualitative Methods: From Boring to Brilliant. In B. Laurel (Ed.),
Design Research. Cambridge, Massachusetts: The MIT Press.
Janiszewski, C. (2008). Rethinking Visual Communication Research: Updating Old
Constructs and Considering New Metaphors. In M. Wedel, & R. Pieters, Visual
Marketing: From Attention to Action (pp. 277 - 293). New York: Lawrence
Erlbaum Assocates: Taylor and Francis.
Johnson, B., & Onwuegbuzie, A. J. (2004). Mixed Methods Research: A Research
Paradigm Whose Time Has Come. Educational Researcher, 33 (7), 14 - 26.
Junior, P., Sato, M. J., Livi, J., Macias, L., Degen, P., & Gustavo, N. On Internet Some
things are not what they seem to be. internetsegura.br. Talent Marcel, Sao
Paulo, Brazil.
Kaindl, K. (2004). Multimodality in the translation o fhumour in comics In:
Perspectives on Multimodality. (E. Ventola, C. Charles, & M. Kaltenbacher,
Eds.) Amsterdam: John Benjamins Publishing company.
Kaufer, D. S., & Butler, B. S. (2013). Rhetoric and the Arts of Design. New York:
Routledge.
Kenney, K., & Scott, L. M. (2003). A review of the visual rhetoric literature. In L.
Scott, & R. Batra (Eds.), Persuasive Imagery: A Consumer Response
Perspective (pp. 17-56). Mahwah, NJ: Lawrence Erlbaum Publishers.
Kenya, G. o. (August 2010). The 2009 Kenya Population and Housing Census:
Population Distribution by Age, Sex and Administrative Units. Ministry of
Planning and National Development. Nairobi: Kenya National Bureau of
Statistics.
Kjeldsen, J. E. (2012). Pictorial Argumentation in Advertising: Visual Tropes and
Figures as a Way of Creating Visual Argumentation. In F. F. van Eemeren, &
B. Garssen, Topical Thesmes in Argumentation Theory: Twenty Exploratory
Studies (pp. 239 - 255). Netherlands: Springer.
208
Klaus, B. J. (2002). A Handbook of Media and Communication Research: Qualitative
and Quantitative Methodologies. London: Routledge.
Kleingeld, T., Wessels, E., Hofmeyr, A., Eccles, J., & Cloete, C. See the Reality Before
it's Too Late: Tipping Point. Sanccob. Bittersuite, South Africa.
Kumar, R. (2011). Research Methodology: a step by step guide for beginners. London:
Sage.
Laczniak, R. N., DeCarlo, T. E., & Sridhar, R. N. (2001). Consumers' Responses to
Negative Word-of-Mouth Communication: An attribution theory perspective.
Journal of Consumer Psychology , 57 - 73.
Lajer, K. (2007). Statistical Tests as Inappropriate Tools for Data Analysis Performed
on Non-Random Samples of Plant Communities. Folia Geobotanica, 42, 115 -
122.
Larsen, V. (2008). What the Symbol Can't the Icon Can: The Indispensable Icon/
Symbol Distinction. In E. F. McQuarrie, & B. J. Philips, Go Figure! New
Directions in Advertising Rhetoric (pp. 68 - 82). Armonk, New York, USA: M.
E. Sharpe.
Larsen, V., Luna, D., & Peracchio, L. A. (2004). Points of View and Pieces of Time: A
Taxonomy of Image Attributes. Jouranl of Consumer Research, 3, 102 - 111.
Lizardo, O. (2006). How cultural tastes shape personal networks. American
Sociological Review, 75 (1), 778 - 807.
Lopes, D. (1996). Understanding Pictures. Oxford: Clarendon Press.
Lucaites, J. L., Condit, C. M., & Caudill, S. (1999). Contemporary Rhetorical Theory:
A Reader. New York: The Guilford Press.
Lucie-Smith, E. (1997). Moments in Art Since 1945: Issues and Concepts. London:
Thames and Hudson.
MacInnis, D. J., & Price, L. L. (1987). The Role of Imagery in Information Processing:
Review and Extensions. Journal of Consumer Resaerch , 473 - 491.
MacInnis, D. J., Moorman, C., & Jaworski, B. J. (1991). Enhancing and measuring
consumers' motivation, opportunity and ability to process brand information
from ads. Journal of Marketing, 55, 32–53.
Mackenzie, N., & Knipe, S. (2006). Research dilemmas: Paradigms, methods and
methodology. Issues In Educational Research, 16 (2), 193-205.
Madupu, V., Sen, S., & Ranganathan, S. (2013). The Imppact of Visual Structure
Complexity on Ad Liking, Elaboration and Comprehension. Marketing
Management Journal, 23 (2), 58 - 70.
209
Malim, T., & Birch, A. (1997). Research Methods and Statistics. London: MacMillan.
Malmelin, N. (2010). What Is Advertising Literacy? Exploring the Dimensions of
Advertising Literacy. Journal of Visual Literacy, 29 (2 (Autumn 2010)), 129.
Mangal, S. K., & Mangal, S. (2013). Research Methodology in Behavioural Sciences.
Delhi: PHI Learning Private Limited.
Manohar, P. (2006). Outlines of Mass Communication. Delhi, INDIA: Pragun
Publications.
Market, R. S. (2006). Occupation groupings: a job dictionary. Retrieved 07 7, 2011,
from Market Research Society:
http://www.mrs.org.uk/publications/publications.htm.
Matchar, E. (2012, 08 16). How those spoiled millennials will make the workplace
better for everyone. Retrieved 09 19, 2012, from Washington Post:
www.washingtonpost.com/opinions/how-those-spoiled-millennials-will-make-
the-work-place-better-for-everyone/2012/08/16/814af692-d5d8-11e1-a0cc-
8954acd5f90c_story.html
Mazzoni, C., Addeo, F., & Castaldi, L. (2007). Consumer Behaviour in the Italian
Mobile Telecommunication Market. Telecommunications Policy, 31 (10-11),
632 – 647.
McQuail, D. (2005). McQuail’s Mass Communication Theory (5 ed.). London: Sage.
McQuarrie, E. F. (2008). Developing aToolkit for Differentiating Advertising. In E. F.
McQuarrie, & B. J. Phillips, Go Figure! New Directions in Advertising Style
(pp. 257 - 276). Armonk, New York, USA: M.E. Sharpe.
McQuarrie, E. F., & Mick, D. G. (1996). Figures of rhetoric in advertising language.
Journal of Consumer Research, 22 (4), 424-438.
McQuarrie, E. F., & Mick, D. G. (1992). On resonance: A critical pluralistic inquiry
into advertising rhetoric. Journal of Consumer Research, 19, 180–197.
McQuarrie, E. F., & Mick, D. G. (2003b). The Contribution of Semiotic. In L. M.
Scott, & R. Batra (Eds.), Persuasive Imagery: A Consumer Response
Perspective (pp. 191 - 222). Mahwah, NJ: Lawrence Erlbaum Associates.
McQuarrie, E. F., & Mick., D. G. (2003). Visual and verbal rhetorical figures under
directed processing versus incidental exposure to advertising. Journal of
Consumer Research, 29 (4), 579-587.
McQuarrie, E. F., & Mick., D. G. (1997). Visual rhetoric in advertising: an
experimental inquiry. Advances in Consumer Research, 26, 24 - 99.
210
McQuarrie, E. F., & Mick., D. G. (1999). Visual Rhetoric in Advertising: Text-
Interpretive, experimental, and Reader-Response Analyses. Journal of
Consumer Research, 26, 37 – 54.
McQuarrie, E. F., & Phillips, B. J. (2008). Advertising Rhetoric: An Introduction. In E.
F. McQuarrie, B. J. Phillips, E. F. McQuarrie, & B. J. Phillips (Eds.), Go
Figure! New Directions in Advertising Rhetoric (pp. 3 - 19). Armonk, New
York, USA: M.E. Sharpe, Inc.
McQuarrie, E. F., & Phillips, B. J. (2005). Indirect Persuasion in Advertising: How
Consumers Process Metaphors Presented in Pictures and Words. Journal of
Advertising , 7 - 20.
Mick, D. G. (1986). Consumer Research and Semiotics: exploring the Morphology of
Signs, Symbols and Significance. Journal of Consumer Research, 13
(September), 196-213.
Mick, D. G. (1992b). Levels of Subjective Comprehension in Advertising Processing
and Their Relations to Ad Perceptions, Attitudes, and Memory. Journal of
Consumer Research, 18 (4 (March 1992)), 411-424.
Mick, D. G., & Buhl, C. (1992). A Meaning-based Model of Advertising Experiences.
Journal of Consumer Research, 19 (December), 317-338.
Mick, D. G., & Politi, L. G. (1989). Consumers' Interpretations of Advertising Imagery:
A Visit To The Hell Of Connotation. Special Volumes - icr,: Association for
Consumer Research , 85-96.
Mick, D. G., & Politi, L. G. (1989). Consumers' Interpretations of Advertising Imagery:
A Visit to the Hell of Connotations. Interpretive Consumer Research , 85-96.
Miller, W. D., & Stoica, M. (2003). Comparing the effects of a photograph versus
artistic renditions of a beach scene in a direct-response print ad for a Caribbean
resort island: A mental imagery prespective. Journal of Vacation Marketing, 10
(1), 11 - 21.
Mills, J., Bonner, A., & Francis, K. (2006). The Development of Constructivist
Grounded Theory. International Journal of Qualitative Methods, 5 (1), 25 - 35.
Miniard, P. W., Bhatla, S., Lord, K. R., Dickson, P. R., & Unnava, R. H. (1991).
Picture-based persuasion processes and the moderating role of involvement.
Journal of Consumer Research, 18, 92–107.
Mitchell, A. A., & Olson, J. C. (1981). Are product attribute beliefs the only mediator
of advertising effects on brand attitude? Journal of Marketing Research, 18,
318–322.
211
Moghaddam, A. (2006). Coding issues in grounded theory. Issues In Educational
Research, 16 (1), 52 - 66.
Mohanty, P., & Ratneshwar, S. (2014). Did You Get It? Factors Influencing Subjective
Comprehension of Visual Metaphors in Advertising. Journal of Advertising, 44
(3), 232 - 242.
Mooji, d. M., & Hofstede, G. (2002). Convergence and Divergence in Consumer
Behaviour: Implications for International Retailing. Journal of Retailing, 78
(2002), 61 – 69.
Morgan, S. E., & Reichert, T. (1999). The Message is in the Metaphor: Assessing the
Comprehension of Metaphors in Advertisements. Journal of Advertising, 28 (4),
1-12.
Mostafa, M. (2005). An experimental investigation of the Egyptian consumers’
attitudes towards Surrealism in advertising. International Journal of Consumer
Studies, 29 (1), 216-231.
Muers, L. v., & Aristoff, M. (2009). Split Second Recognition: What Makes Outdoor
Advertising Work. Journal of Advertising Research, 49 (1).
Mulken, M. v. (2003). Analysing Rhetorical Devices in Print Advertisements.
Document Design, 4 (2), 114-128.
Mulken, M. V., Rob, P. l., & Forceville, C. (2010). The Impact of Perceived
Complexity, Deviation and Comprehension on the Appreciation of Visual
Metaphor in Advertising Across Three European Countries. Journal of
Pragmatics, 42 (2010), 3418-3430.
Murray, J. (2013). Likert Data: What to Use, Parametric or Non-Parametric?
International Journal of Business and Social Science, 4 (11), 258 - 264.
Mzoughi, N., & Abdelhak, S. (2011). The Impact of Visual and Verbal Rhetoric in
Advertising on Mental Imagery and Recall. International Journal of Business
and Social Science, 2 (9), 257 - 267.
Nagla, S. (2013). Iconclasm: The Loss of iconic image in art and
communicationVolume. Technoetic Arts: A Journal of Speculative Research, 11
(3), 335-341.
Nayyar, D. (2007). Modern Mass Communication (Concepts and Processes). Jaipur:
Oxford Book Company.
Nordstokke, D. W., & Zumbo, D. B. (2007). A Cautionary Tale About Levene's Tests
for Equal Variances. Journal of Educational Research & Policy Studies, 7 (1
Sspring), 1-2.
212
O’Hair, D., Kreps, G. L., & Frey, L. R. (1990). Conceptual Issues. In D. O’Hair, & G.
L. Kreps (Eds.), Applied Communication Theory and Research (pp. 3 - 22).
Hillsdale, NJ: Lawrence Erlbaum Associates.
Olson, L. C. (2007). Intellectual and Conceptual Resurces for Visual Rhetoric: A Re-
Examination of Scholarship since 1950. The Review of Communication, 7 (1), 1
- 20.
Olson, L. C., Finnegan, C. A., & Hope., D. S. (2008). Visual Rhetoric in
Communication: Continuing Questions and Contemporary Issues. In L. C.
Olson, C. A. Finnegan, & D. S. Hope (Eds.), Visual Rhetoric: A Reader in
Communication and American Culture (pp. 1 - 14). California: Sage
Publications Inc.
Onwuegbuzie, A. J., & Leech, N. L. (2006). Linking Research Questions to Mixed
Methods Data Analysis Procedures. The Qualitative Report, 11 (3), 474 - 498.
Oppenheim, A. N. (1992). Questionnaire design and attitude measurement. New York,
NY: Basic Books.
Orth, U. R., & Malkewitz, K. (2008). Holistic Package Design and Consumer Brand
Impressions. Journal of Marketing, 72, 64–81.
Ovum, I. T. (September 2015). Entertainment and Media Outlook: South Africa-
Nigeria-Kenya. Johannesburg: Pricewaterhousecoopers.
Pallant, J. (2007). SPSS, Survival Manual. New York: Open University Press.
Pauwels, L. (2008). Visual Literacy and Visual Culture: Reflections on Developing
More Varied and Explicit Visual Competencies. The Open Communication
Journal, 2008 (2), 79-85.
Peek, L., & Fothergill, A. (2009). Using focus groups: lessons from studying daycare
centers, 9/11, and Hurricane Katrina. Qualitative Research, 9 (1), 31 – 59.
Perry, D. K. (2001). American Pragmatism and Co
Pettersson, R. (1994). Associations from Pictures. , Oct. 12–16. 1994. (pp. 136 - 144).
Tempe, Arizona: 26th Annual Conference of the International Visual Literacy
Association.
Pettersson, R. (2013). Information Design 3: Image Design. Tullinge, Sweden: Institute
of Infology.
Pettersson, R. (1988). Interpretation of Image Content. Educational Communication
and Technology, 1, 45 - 55.
213
Petty, R. E., Cacioppo, J. T., & Kasmer, J. A. (2015). Petty, R. E., Cacioppo, J. T., &
Kasmer, J. A. (2015). The role of affect in the elaboration likelihood model of
persuasion. Communication, Social Cognition, and Affect (PLE: Emotion), 117.
(L. Donohew, H. E. Sypher, & T. E. Higgins, Eds.) New York: Psychology
Press, Taylor and Francis Group.
Phillips, B. J. (1997). Thinking into it: consumer interpretation of complex advertising
images. Journal of Advertising, 26 (2), 77-87.
Phillips, B. J., & McQuarrie, E. F. (2004). Beyond Visaula Metaphor: A New Typology
of Visual Rhetoric in Advertising. Marketing Theory Articles, 4 (1/2), 113 -
136.
Phillips, B. J., & McQuarrie, E. F. (2014). Visual Rhetoric and International
Advertising. In H. Cheng, The Handbook of International Research (p. 238).
NJ., USA.: Wiley and Sons Ltd.
Picardi, C. A., & Masick, K. D. (2014). Resaerch Methods: Designing and Conducting
Research With a Real World Focus. London: Sage.
Pracejus, J. W. (2003). Visuals are information: how meaning is transferred to
consumers through executional elements in advertising. Advances in Consumer
Research, 30 (1), 174-176.
Pracejus, J. W., Olsen, D. G., & O'Guinn, T. C. (2006). How Nothing Became
Something: White Space, Rhetoric, History, and Meaning. Journal of Consumer
Research, 33, 82 – 90.
Pratt, M. G. (2009). For the Lack of a Boilerplate: Tips on writing up (and reviewing)
qualitative research. Academy of Management Journal, 52 (5), 856 - 862.
Roque, G. (2009). What is Visual in Visual Argumentation. In J. Ritola (Ed.),
Argument Cultures: Proceedings of OSSA 09 (pp. 1 - 9). Paris: Universitiy of
Windsor.
Ross, J., Palmer, M., & Huczko:, T. (2010 , September). Government of South
Australia. South Australia. South Australian Food Centre. PIRSA. . Retrieved
November 22, 2011, from
http://www.safoodcentre.com.au/__data/assets/pdf_file/0014/145211/safood_co
nsumers_report.pdf
Rossiter, J. R. (1982). Visual Imagery: applications to advertising. Advances in
Consumer Research, 9 (1), 101-106.
Rumelhart, D. E. (1980). Schemata: The Building Blocks of Cognition. In R. J. Spiro,
B. C. Betram, & W. F. Brewer (Eds.), Theoretical Issues in Reading
Comprehension: Perspectives from Cognitive Psychology, Linguistics, Artificial
Intelligence, and Education (pp. 35 - 58). Hillside, NJ: Lawrence Erlbaum
Associates Publications.
214
Schonborn, K. J., & Anderson, T. R. (2006). The Importance of Visual Literacy In
Education of Biochemists. Biochemistry and Molecular Biology Education, 34
(2), 94 - 102.
Schroeder, J. E. (2008). Visual Analysis of Images in Brand Culture. In B. J. Philips, &
E. McQuarrie, Go Figure: New Directions in Advertising Rhetoric (pp. 277 -
296). Armonk, New York: Sharpe.
Schroeder, J. E. (2002). Visual Communication. London: Routledge.
Schroeder, J. (2005). Researching visual consumption. Advances in Consumer
Research, 32 (1), 71-71.
Schutt, R. K., & Bachman, R. (2011). The Practice of Research in Criminology and
Criminal Justice (4 ed.). Los Angeles, USA: Sage.
Scott, L. M. (1994). Images in advertising: The need for a theory of visual rhetoric.
Journal of Consumer Research, 21 (2), 252-273.
Scott, L. M. (1990). Understanding jingles and needledrop: A rhetorical approach to
music in advertising. Journal of Consumer Research, 17 (September), 223-237.
Scott, L. M., & Batra, R. M. (2003). Persuasive Imagery: A Consumer Response
Perspective. Mahwah, NJ: Lawrence Erlbaum Associates.
Scott, L. M., & Vargas, P. M. (2007). Writing with pictures: Toward a unifying theory
of consumer response to images. Journal of Consumer Research, 34 (October),
341-356.
Severin, W. J., & Tankard, J. W. (2010). Communication Theories Origins: Methods,
and uses in the Mass Media. New York: Addison Wesley Longman.
Shilbury, D., Westerbeek, H., Quick, S., & Funk, D. (2009). Strategic Sport Marketing.
Crow's Nest, New South Wales: Allen and Unwin.
Shimp, T. (2003). Advertising, Promotion: and Supplemental Aspects of Integrated
Marketing Communications (6 ed.). Australia: Thomson South-Western.
Shroeder, J. E. (2006). Critical Visual Analysis In Handbook of Qualtitative Methods in
Marketing. (R. W. Belk, Ed.) Cheltenham, U.K.: Edward Elgar Publishing Ltd.
Silayoi, P., & Speece, M. (2007). The importance of packaging attributes: a conjoint
analysis approach. European Journal of Marketing, 41 (11/12), 1495 - 1517.
Sinclair, J. M. (2001). Collins Concise Dictionary (5 ed.). England: Collins.
215
Singer, W. (2010). The brain’s view of the world depends on what it has to know. In A.
Berthoz, & Y. Christen (Eds.), Neurobiology of “Umwelt”: How living beings
perceive the world (pp. 39–52). Berlin: Springer.
Smith, K. A. (2014). The Expressionist Turn in Art History: A critical anthology.
England: Ashgate Publishing Ltd.
Smith, V. J. (Winter-Spring 2007). Aristotle's Classical Enthymeme and the Visual,
Argumentation of the Twenty-First Century. Argumentation and Advocacy, 43
(3-4), 114.
Smith, V. (2008). Visual Persuasion: Issues in the Translation of the Visual in
Advertising. Meta: Translators' Journal, 53 (1 (2008)), 44-61.
Soares, M. A. (2007). Hofstede’s dimensions of culture in international marketing
studies. Journal of Business Research, 60 (2007), 277-284.
Sonnenwald, D. H., & Iivonen, M. (1999). An Integrated Human Information
Behaviour Research Framework for Information Studies. Library & Information
Science Research, 21 (4), 429 - 457.
Stern, B. (1990). Other-speak: Classical allegory and contemporary advertising.
Journal of Advertising, 19 (3), 14-26.
Tan, J., & Ma, Y. WWF Saving Pandas is Not Our Only Mission. WWF. BBH
Shanghai China, Shanghai, China.
Tashakkori, A., & Teddlie, C. (1998). Mixed Methodology, Combining Qualitative and
Quantitative Approaches. California, Thousand Oaks: Sage Publications.
Townsend, C., & Shu, S. B. (2010, June 29). When and How Aesthetics Influences
Financial Decisions. Journal of Consumer Technology , 452 - 458.
Tuttle, B. (2012, April 27). Millennials are the biggest Suckers for Selfish Impulse
buys27 April 2012. Retrieved 19 September 2012. Time Magazine .
Underwood, R. L., & Klein, N. M. (2002). Packaging as Brand Communication:
Effects of Product Pictures on Consumer Responses to the Package and Brand.
Journal of Marketing and Practice, 10 (4), 58–68.
UNEP, P. R. (n.d.). City of Nairobi Environmental Outlook. Retrieved July 13, 2012,
from United Nations Environmental Programme:
http://www.unep.org/geo/pdfs/NCEO_Report_FF_New_Text.PDF
University, Waterloo of. (2011). Checklist for Review of Human Research
Applications; Required Information on ORE 101 Form. Waterloo, Ontario,
Canada: Office of Research Ethics. Retrieved from Accessed on 1. Retrieved
February 18, 2011, from University of Waterloo:
http://iris,uwaterloo.ca/ethics/form101/checlist.htm.
216
Usmani, B. (2008). The Encyclopaedia of Mass Communication. Delhi: Himalaya
Books Pvt. Ltd.
Valentine, D. B., & Powers, T. L. (2013). Generation Y values and lifestyle segments.
Journal of Consumer Marketing, 30 (7), 597 - 606.
Walters, G., Sparks, B., & Herington, C. (2007). The effectiveness of print advertising
stimuli in evoking elaborate consumption visions for potential travellers.
Journal of Travel Research, 1, 24 - 34.
Wang, K.-Y., & Peracchio, L. (2008). Reading Pictures: Understanding the Stylistic
Properties of Advertising Images. In E. F. McQuarrie, & B. J. Philips, Go
Figure! New Directions in Advertising Rhetoric (pp. 205 - 226). Armonk, USA:
M.E. Sharpe.
Wesner, M. S., & Miller, T. (2008). Boomers and Millennials have much in common.
Organization Development Journal, 26 (3), 89+.
Wittrock, M. C. (1981). Reading Comprehension. In F. J. Pirozzolo, & M. C. Wittrock
(Eds.), Neuropsychological and Cognitive Processing in Reading (pp. 229-259).
Wittrock, New York: Academic Press.
Wood, B. Twin Lady First Shaver. BICWorld Project. Ben Wood illustrations, USA,
USA.
217
APPENDIX I: Informed Consent Forms
FOCUS GROUP DISCUSSION INFORMED CONSENT FORM
RESPONSE TO STYLE IN VISUAL IMAGES IN PRINT MEDIA
ADVERTISING AMONG THE FEMALE YOUTH IN NAIROBI CITY
COUNTY, KENYA
My Name: Francisca Okwiri Odundo
MOI UNIVERSITY, SCHOOL OF HUMAN RESOURCE DEVELOPMENT
Student Registration Number: SHRD/D.PHIL/02/09
Contact Address MOI UNIVERSITY: P.O.BOX 3900-30100, ELDORET
REPUBLIC OF KENYA; RESEARCH CLEARANCE PERMIT No.
NCST/RCD/14/012/734
Introduction
You are kindly being asked to take part in a research study of what young ladies in
Nairobi think of pictures used in advertisements in magazines. You have been asked to
participate having been selected randomly. Please read this form carefully and ask any
questions you may have before agreeing to take part in the study. I can also read it to
you and explain the points to you if you prefer.
Purpose of Study
The purpose of the study is to try and understand what ladies think when they see
pictures in advertisements in magazines. The information collected from the research
will help the people who design magazine advertisements create pictures that ladies can
understand better. The data collected from your participation will be used for a PhD
thesis being studied at Moi University, in Eldoret.
Description of Focus Group Discussion
If you agree to be in this study, we will conduct a Focus Group Discussion with you. It
will include at least 7 other participants, a Moderator and an assistant Moderator. The
Focus Group Discussion will include questions about these advertisement pictures here
(show sample pictures) and what you think about them. The Focus Group Discussion
will take about 1 hour and 30 minutes to complete. With your permission, we would
also like to tape-record the Focus Group Discussion.
Risk of being in Study

218
The questions to be asked are not seen as offensive by most people, and I do not
anticipate any risks to you participating in this study.
Benefits of being in the study
There are no benefits to you whatsoever for being in the study. You will not receive
any payments or gifts.
Confidentiality
This study is anonymous. No information about your identity and /or habits shall be, or
is being collected. Your answers will be confidential.
Taking part in this study is completely voluntary. You may choose not to answer any of
the questions that you do not want to answer. You are also free to withdraw at any time
during the interview without giving a reason, and additionally, you have the right to
request that the interviewer not use any or all of your interview material.
Statement of Consent: I have read the above information, and understand the
information and have received answers to any questions I asked. I consent to take part
in the study.
In addition to agreeing to participate, I also consent to having the Focus Group
Discussion tape-recorded. YES (___________), NO (___________)
In addition to agreeing to participate, I also consent to the use of anonymous quotes
from me in publications. YES (___________), NO (___________)
Your Signature ___________________Date ___________________________
Your Name (OPTIONAL) ___________________________________________
Signature of person obtaining consent __________________________
Date _____________________
QUESTIONNAIRE INFORMED CONSENT FORM
RESPONSE TO STYLE IN VISUAL IMAGES IN PRINT MEDIA
ADVERTISING AMONG FEMALE YOUTH IN NAIROBI CIT COUNTY,
KENYA
My name: Francisca Okwiri Odundo
MOI UNIVERSITY, SCHOOL OF HUMAN RESOURCE DEVELOPMENT
219
Student Registration Number: SHRD/D.PHIL/02/09
Contact Address MOI UNIVERSITY: P.O.BOX 3900-30100, ELDORET
REPUBLIC OF KENYA; RESEARCH CLEARANCE PERMIT No.
NCST/RCD/14/012/734
Introduction
You are kindly being asked to take part in a research study of what young ladies in
Nairobi think of pictures used in advertisements in magazines. You have been asked to
participate having been selected randomly. Please read this form carefully and ask any
questions you may have before agreeing to take part in the study. I can also read it to
you and explain the points to you if you prefer.
Purpose of Study
The purpose of the study is to try and understand what ladies think when they see
pictures in advertisements in magazines. The information collected from the research
will help the people who design magazine advertisements create pictures that ladies can
understand better. The data collected from your participation will be used for a PhD
thesis being studied at Moi University, in Eldoret.
Description of Interview
If you agree to be in this study, we will conduct a Questionnaire with you. The
interview will include questions about these advertisement pictures here (show sample
pictures) and what you think about them. The interview will take about 30 minutes to
complete.
Risk of being in Study
The questions to be asked are not seen as offensive by most people, and I do not
anticipate any risks to you participating in this study.
Benefits of being in the study
There are no benefits to you whatsoever for being in the study. You will not receive
any payments or gifts.
Confidentiality
This study is anonymous. No information about your identity and /or habits shall be, or
is being collected. Your answers will be confidential.

220
Taking part in this study is completely voluntary. You may choose not to answer any of
the questions that you do not want to answer. You are also free to withdraw at any time
during the interview without giving a reason, and additionally, you have the right to
request that the interviewer not use any or all of your interview material.
Statement of Consent: I have read the above information, and understand the
information and have received answers to any questions I asked. I consent to take part
in the study.
In addition to agreeing to participate, I also consent to the use of anonymous quotes
from me in publications. YES (___________), NO (___________)
Your Signature ___________________Date ___________________________
Your Name (OPTIONAL) ___________________________________________
Signature of person obtaining consent __________________________
Date _____________________
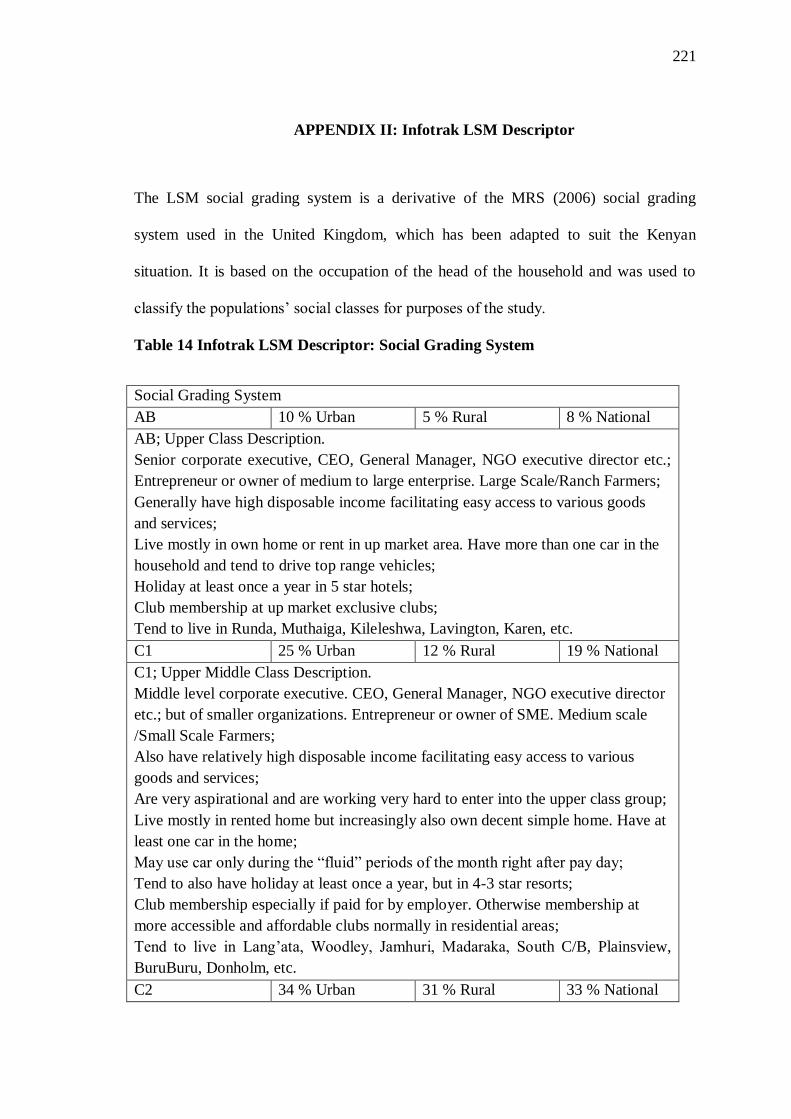
221
APPENDIX II: Infotrak LSM Descriptor
The LSM social grading system is a derivative of the MRS (2006) social grading
system used in the United Kingdom, which has been adapted to suit the Kenyan
situation. It is based on the occupation of the head of the household and was used to
classify the populations’ social classes for purposes of the study.
Table 14 Infotrak LSM Descriptor: Social Grading System
Social Grading System
AB 10 % Urban 5 % Rural 8 % National
AB; Upper Class Description.
Senior corporate executive, CEO, General Manager, NGO executive director etc.;
Entrepreneur or owner of medium to large enterprise. Large Scale/Ranch Farmers;
Generally have high disposable income facilitating easy access to various goods
and services;
Live mostly in own home or rent in up market area. Have more than one car in the
household and tend to drive top range vehicles;
Holiday at least once a year in 5 star hotels;
Club membership at up market exclusive clubs;
Tend to live in Runda, Muthaiga, Kileleshwa, Lavington, Karen, etc.
C1 25 % Urban 12 % Rural 19 % National
C1; Upper Middle Class Description.
Middle level corporate executive. CEO, General Manager, NGO executive director
etc.; but of smaller organizations. Entrepreneur or owner of SME. Medium scale
/Small Scale Farmers;
Also have relatively high disposable income facilitating easy access to various
goods and services;
Are very aspirational and are working very hard to enter into the upper class group;
Live mostly in rented home but increasingly also own decent simple home. Have at
least one car in the home;
May use car only during the “fluid” periods of the month right after pay day;
Tend to also have holiday at least once a year, but in 4-3 star resorts;
Club membership especially if paid for by employer. Otherwise membership at
more accessible and affordable clubs normally in residential areas;
Tend to live in Lang’ata, Woodley, Jamhuri, Madaraka, South C/B, Plainsview,
BuruBuru, Donholm, etc.
C2 34 % Urban 31 % Rural 33 % National
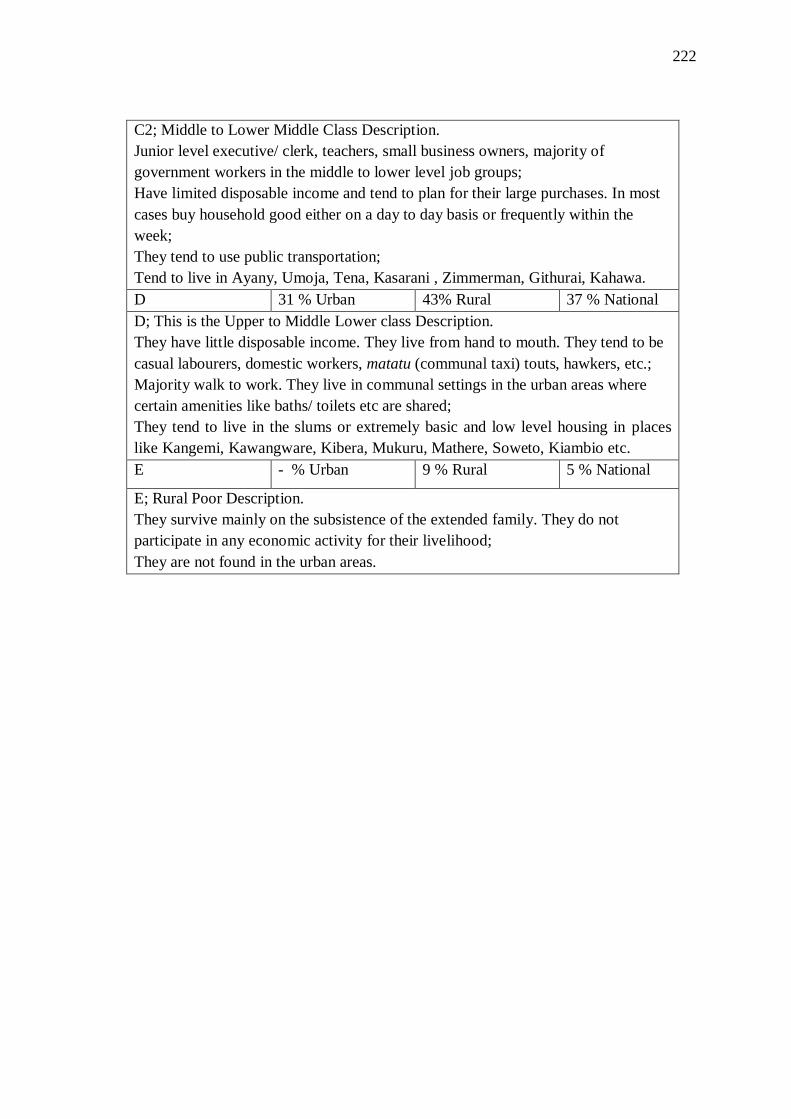
222
C2; Middle to Lower Middle Class Description.
Junior level executive/ clerk, teachers, small business owners, majority of
government workers in the middle to lower level job groups;
Have limited disposable income and tend to plan for their large purchases. In most
cases buy household good either on a day to day basis or frequently within the
week;
They tend to use public transportation;
Tend to live in Ayany, Umoja, Tena, Kasarani , Zimmerman, Githurai, Kahawa.
D 31 % Urban 43% Rural 37 % National
D; This is the Upper to Middle Lower class Description.
They have little disposable income. They live from hand to mouth. They tend to be
casual labourers, domestic workers, matatu (communal taxi) touts, hawkers, etc.;
Majority walk to work. They live in communal settings in the urban areas where
certain amenities like baths/ toilets etc are shared;
They tend to live in the slums or extremely basic and low level housing in places
like Kangemi, Kawangware, Kibera, Mukuru, Mathere, Soweto, Kiambio etc.
E - % Urban 9 % Rural 5 % National
E; Rural Poor Description.
They survive mainly on the subsistence of the extended family. They do not
participate in any economic activity for their livelihood;
They are not found in the urban areas.
223
APPENDIX III: Focus Group Discussion Guide 1
Focus Group Discussion Guide
INTRODUCTION
Moderator to introduce the session
Ask them to express own views and honest opinions
Ask participants to speak clearly, and one at a time during the discussion
No right or wrong answers
Honest opinion
Learning process
Explain that this is a free discussion, and there are not right or wrong answers
Assure the respondents of confidentiality on the discussion and recording
Give directions on the location of rest rooms
Ask the respondent to switching off of mobile phones or activate vibration/ silent mode
Explain session length as (1.5-2.0 hours)
Respondents to introduce themselves
Single Name (Optional – Nickname is acceptable), marital status, age, residence, level
of education, area of education, business they are in (if any)/ job/ occupation,
Aspirations, hopes and fears
1: PREAMBLE
Where do you get access to information? Which channels on television do you watch
and why? When do you watch them and with who?
224
What about radio? Which stations do you listen to and why? When do you listen to
radio?
Where do you go to get information about personal care and why? What would you say
are the interesting channels (radio, TV, newspapers, magazines) that can be used to get
information about businesses?
Do you read magazines?
What kind/ type of magazines do you read?
Which is your favourite magazine? Why (Probe for Likes and /Dislikes)
How frequent do you read your favourite magazines?
Which are your areas of interest in the magazine(s) that you read? (Probe: type of
information sought)
Which is your favourite magazine advert? Why?
What is your opinion on magazine advertising?
Do you think that magazine advertisements are there to give you a message? What
makes you think they are trying to give/ not give you a message?
What type of information do you get from magazine advertisements?
2: CONCEPT EVALUATION: FOCUS ON THE INDIVIDUAL PICTURES
MOD: I would like us to engage in an exercise. I will show you an idea that I have. I
want you to first look at it and let me know what you think about it. Remember that you
are allowed to have different opinions from your other group members, (Show the
sketches; start with the cartoon, then the painting, and finally the real picture)
(Rotate the concepts when conducting the same exercise for the other group)
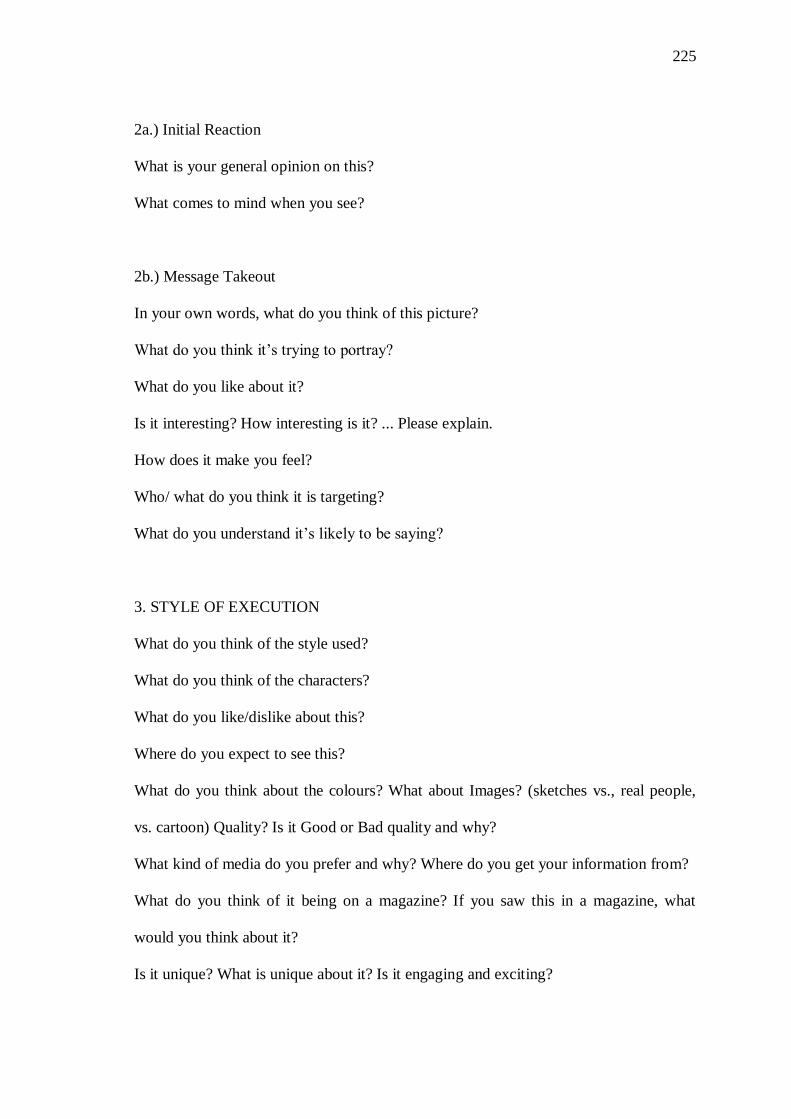
225
2a.) Initial Reaction
What is your general opinion on this?
What comes to mind when you see?
2b.) Message Takeout
In your own words, what do you think of this picture?
What do you think it’s trying to portray?
What do you like about it?
Is it interesting? How interesting is it? ... Please explain.
How does it make you feel?
Who/ what do you think it is targeting?
What do you understand it’s likely to be saying?
3. STYLE OF EXECUTION
What do you think of the style used?
What do you think of the characters?
What do you like/dislike about this?
Where do you expect to see this?
What do you think about the colours? What about Images? (sketches vs., real people,
vs. cartoon) Quality? Is it Good or Bad quality and why?
What kind of media do you prefer and why? Where do you get your information from?
What do you think of it being on a magazine? If you saw this in a magazine, what
would you think about it?
Is it unique? What is unique about it? Is it engaging and exciting?
226
Now ignore what the advertiser may have intended to communicate and tell us your
personal true opinion and feelings about what’s going on in this picture. Why do you
say this? PROBE
After unleashing the real picture
BRAND
Who do you think is behind this?
Are you surprised?
What do you expect from the one who is behind this?
Do you think the person who is behind this has achieved his / her objective? Why?
Call to action
Would you buy any product, that is being advertised? Why
What do you think this magazine advertisement picture communicates about the
product? PROBE
Which part of the picture gives you an indication of what the advert is communicating
about the product? PROBE
What makes you feel that this is where the message about the product lays? PROBE
What else in the advertisement contributes to the delivery of the message about the
product? PROBE
What makes you think this part of the advertisement also contributes to delivery of the
message about the product?
Would it motivate you to do anything? What would you do? Why?

227
4. AREAS OF IMPROVEMENTS
What if anything, do you think the advertiser should add and or exclude from the
pictures to make it communicate this idea/ thought more clearly?
THANK RESPONDENTS AND END DISCUSSION
228
APPENDIX IV: Focus Group Discussion Guide 2
RESPONSE TO STYLISATION OF VISUAL IMAGES IN PRINT MEDIA
ADVERTISING AMONG THE FEMALE MILLENNIAL GENERATION
RECRUITMENT QUESTIONNAIRE
DEMOGRAPHICS and PSYCHOGRAPHICS
Single Name (Optional – Nickname is acceptable)
Age
22 - 34
Social Status
AB, C1, C2
Level of education
Secondary and tertiary, ratio of 50:50
Area of education if tertiary training has been attained
Job-Work-Occupation
Non-design
Residence
What print sources do you use (newspapers / magazines)?
Explain which content of the magazine is read/ looked at
229
RESPONSE TO STYLISATION OF VISUAL IMAGES IN PRINT MEDIA
ADVERTISING AMONG THE MILLENNIAL GENERATION
ODUNDO, FRANCISCA EMILY OBIERO OKWIRI
INSTRUMENTATION FOR PHD RESEARCH
A. INTRODUCTION
Welcome the respondents and introduce self, and purpose of the research.
Inform the respondents that the session will be recorded and the reason for this.
Encourage the respondents to decide on the language to be used
Explain that this is a free discussion, and there are no right or wrong answers
Assure the respondents of confidentiality on the discussion and recording
Encourage everyone to participate and offer their very honest opinions
Ask participants to speak clearly, one at a time during the discussion
Give directions on the location of rest rooms
Ask the respondent to switching off of mobile phones or activate vibration / silent mode
Explain session length as [1.0 – 1.5 hours]
B. PREAMBLE
What is your opinion on magazine advertising?
Do you think that magazine advertisements are there to give you a message?
What makes you think they are trying to give/ not give you a message?
What kind of information do you normally look for in magazine
advertisements?
What type of information do you get from magazine advertisements?
230
C. FOCUS ON THE INDIVIDUAL PICTURES
I would like us to engage in an exercise in groups;
Using the stationery provided, please discuss in groups what the PICTURES in
front of you are about and then describe them using criteria that you will explain
us. Remember that you are allowed to have different opinions from your other
group members, and that you should list all your group opinions.
Do you like this magazine advertisement picture?
Why? PROBE
Would you buy this product?
Why? PROBE
Now ignore what the advertiser may have intended to communicate and tell us
your personal true opinions and feelings about what's going on in this picture.
PROBE
Why do you say this? PROBE
What do you think this magazine advertisement picture communicates about the
product? PROBE
Which part of the picture gives you an indication of what the advert is
communicating about the product?
What makes you feel that this is where the message about the product lays?
PROBE
What else in the advertisement contributes to the delivery of the message about
the product? PROBE
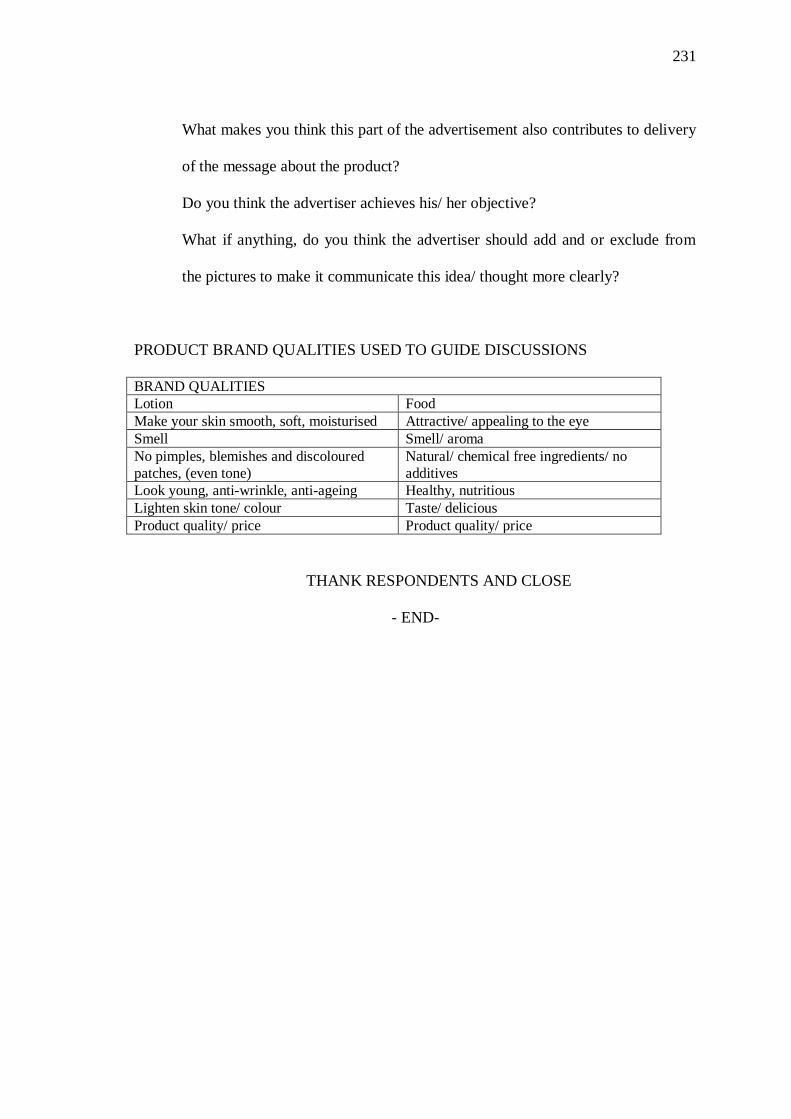
231
What makes you think this part of the advertisement also contributes to delivery
of the message about the product?
Do you think the advertiser achieves his/ her objective?
What if anything, do you think the advertiser should add and or exclude from
the pictures to make it communicate this idea/ thought more clearly?
PRODUCT BRAND QUALITIES USED TO GUIDE DISCUSSIONS
BRAND QUALITIES
Lotion Food
Make your skin smooth, soft, moisturised Attractive/ appealing to the eye
Smell Smell/ aroma
No pimples, blemishes and discoloured
patches, (even tone)
Natural/ chemical free ingredients/ no
additives
Look young, anti-wrinkle, anti-ageing Healthy, nutritious
Lighten skin tone/ colour Taste/ delicious
Product quality/ price Product quality/ price
THANK RESPONDENTS AND CLOSE
- END-
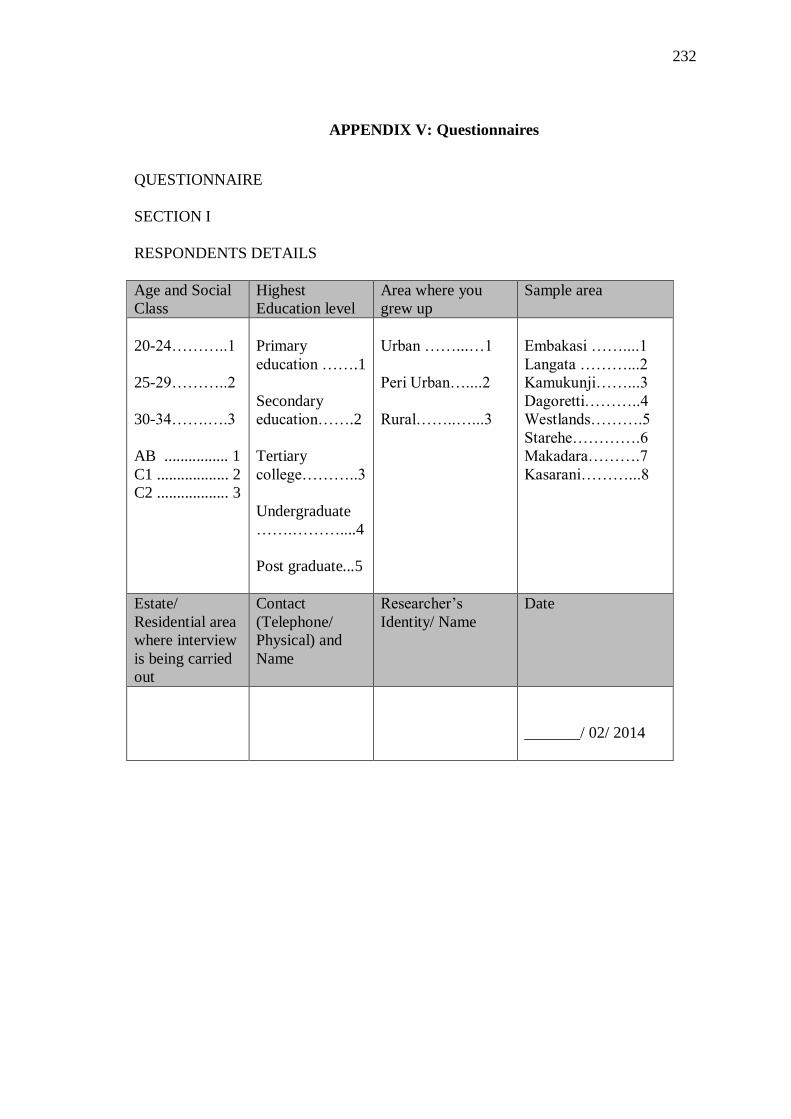
232
APPENDIX V: Questionnaires
QUESTIONNAIRE
SECTION I
RESPONDENTS DETAILS
Age and Social
Class
Highest
Education level
Area where you
grew up
Sample area
20-24………..1
25-29………..2
30-34…….….3
AB ................ 1
C1 .................. 2
C2 .................. 3
Primary
education …….1
Secondary
education…….2
Tertiary
college………..3
Undergraduate
…….………....4
Post graduate...5
Urban ……...…1
Peri Urban…....2
Rural……..…...3
Embakasi ……....1
Langata ………...2
Kamukunji……...3
Dagoretti………..4
Westlands……….5
Starehe………….6
Makadara……….7
Kasarani………...8
Estate/
Residential area
where interview
is being carried
out
Contact
(Telephone/
Physical) and
Name
Researcher’s
Identity/ Name
Date
_______/ 02/ 2014
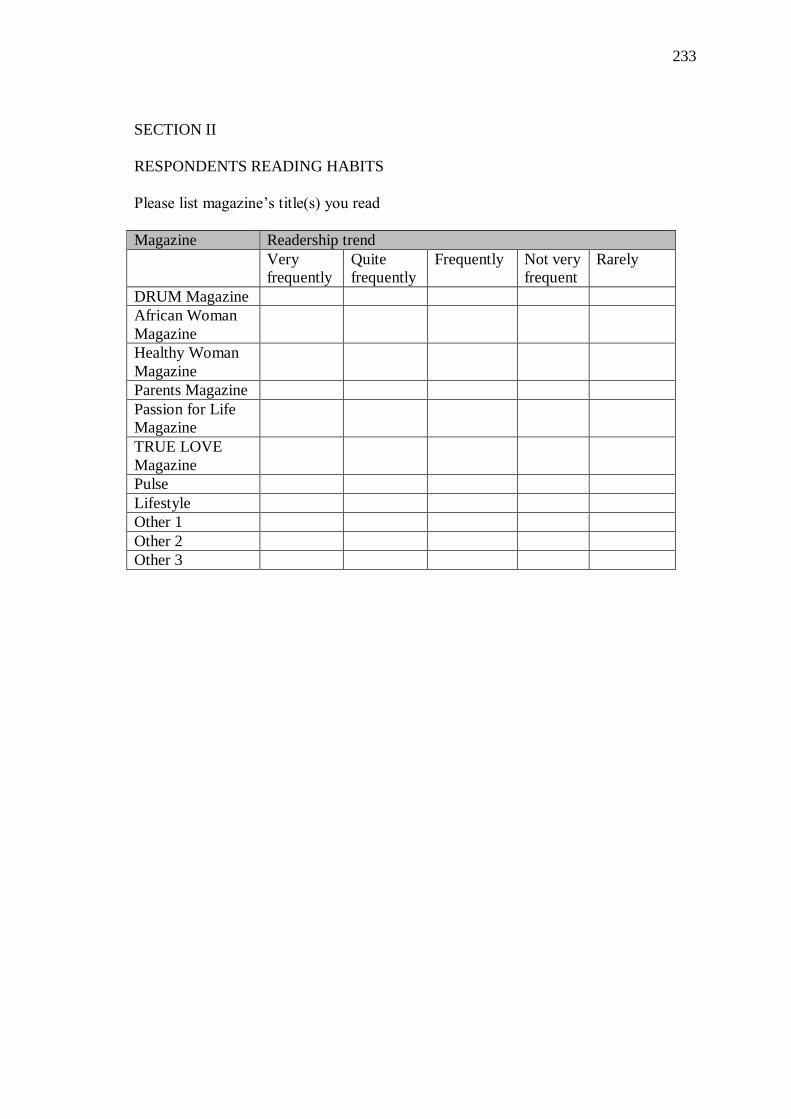
233
SECTION II
RESPONDENTS READING HABITS
Please list magazine’s title(s) you read
Magazine Readership trend
Very
frequently
Quite
frequently
Frequently Not very
frequent
Rarely
DRUM Magazine
African Woman
Magazine
Healthy Woman
Magazine
Parents Magazine
Passion for Life
Magazine
TRUE LOVE
Magazine
Pulse
Lifestyle
Other 1
Other 2
Other 3
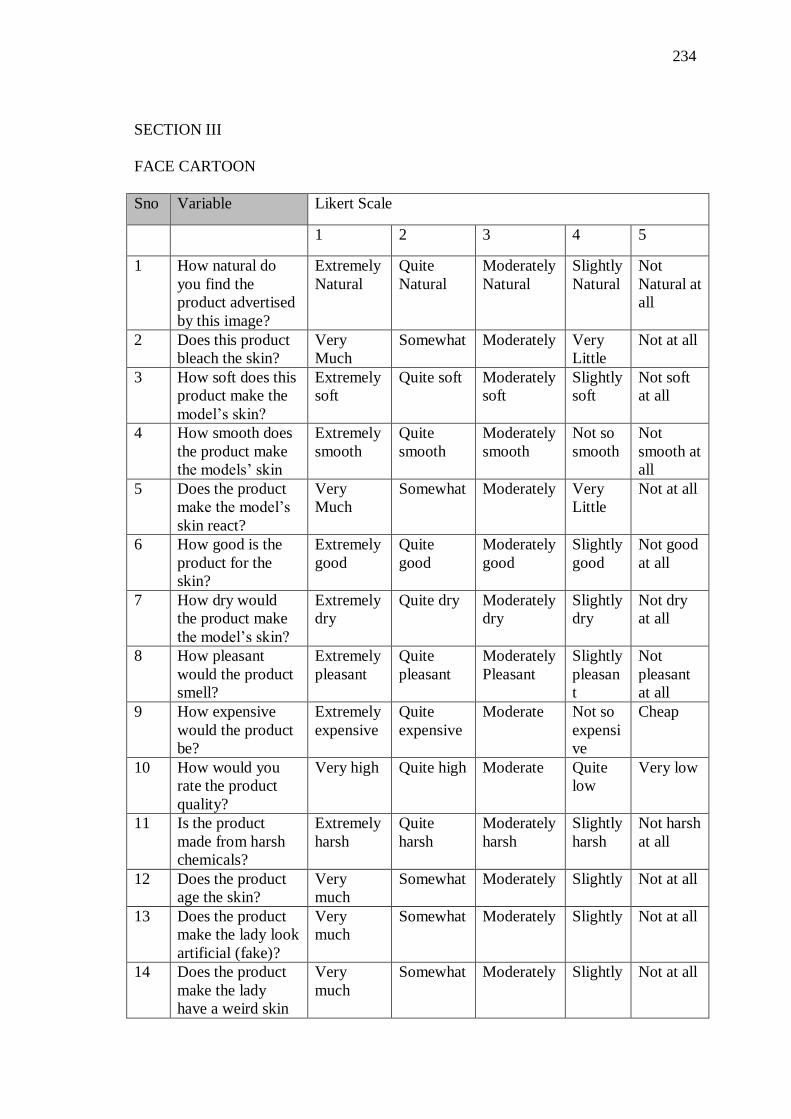
234
SECTION III
FACE CARTOON
Sno Variable Likert Scale
1 2 3 4 5
1 How natural do
you find the
product advertised
by this image?
Extremely
Natural
Quite
Natural
Moderately
Natural
Slightly
Natural
Not
Natural at
all
2 Does this product
bleach the skin?
Very
Much
Somewhat Moderately Very
Little
Not at all
3 How soft does this
product make the
model’s skin?
Extremely
soft
Quite soft Moderately
soft
Slightly
soft
Not soft
at all
4 How smooth does
the product make
the models’ skin
Extremely
smooth
Quite
smooth
Moderately
smooth
Not so
smooth
Not
smooth at
all
5 Does the product
make the model’s
skin react?
Very
Much
Somewhat Moderately Very
Little
Not at all
6 How good is the
product for the
skin?
Extremely
good
Quite
good
Moderately
good
Slightly
good
Not good
at all
7 How dry would
the product make
the model’s skin?
Extremely
dry
Quite dry Moderately
dry
Slightly
dry
Not dry
at all
8 How pleasant
would the product
smell?
Extremely
pleasant
Quite
pleasant
Moderately
Pleasant
Slightly
pleasan
t
Not
pleasant
at all
9 How expensive
would the product
be?
Extremely
expensive
Quite
expensive
Moderate Not so
expensi
ve
Cheap
10 How would you
rate the product
quality?
Very high Quite high Moderate Quite
low
Very low
11 Is the product
made from harsh
chemicals?
Extremely
harsh
Quite
harsh
Moderately
harsh
Slightly
harsh
Not harsh
at all
12 Does the product
age the skin?
Very
much
Somewhat Moderately Slightly Not at all
13 Does the product
make the lady look
artificial (fake)?
Very
much
Somewhat Moderately Slightly Not at all
14 Does the product
make the lady
have a weird skin
Very
much
Somewhat Moderately Slightly Not at all
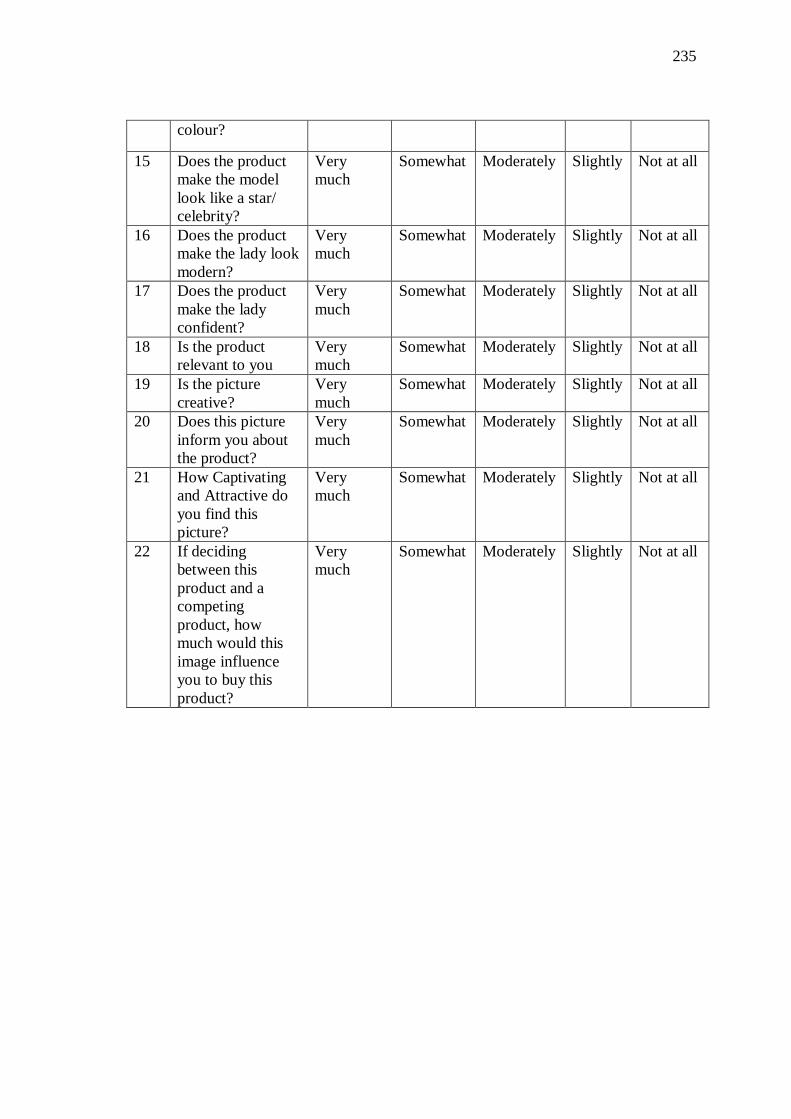
235
colour?
15 Does the product
make the model
look like a star/
celebrity?
Very
much
Somewhat Moderately Slightly Not at all
16 Does the product
make the lady look
modern?
Very
much
Somewhat Moderately Slightly Not at all
17 Does the product
make the lady
confident?
Very
much
Somewhat Moderately Slightly Not at all
18 Is the product
relevant to you
Very
much
Somewhat Moderately Slightly Not at all
19 Is the picture
creative?
Very
much
Somewhat Moderately Slightly Not at all
20 Does this picture
inform you about
the product?
Very
much
Somewhat Moderately Slightly Not at all
21 How Captivating
and Attractive do
you find this
picture?
Very
much
Somewhat Moderately Slightly Not at all
22 If deciding
between this
product and a
competing
product, how
much would this
image influence
you to buy this
product?
Very
much
Somewhat Moderately Slightly Not at all
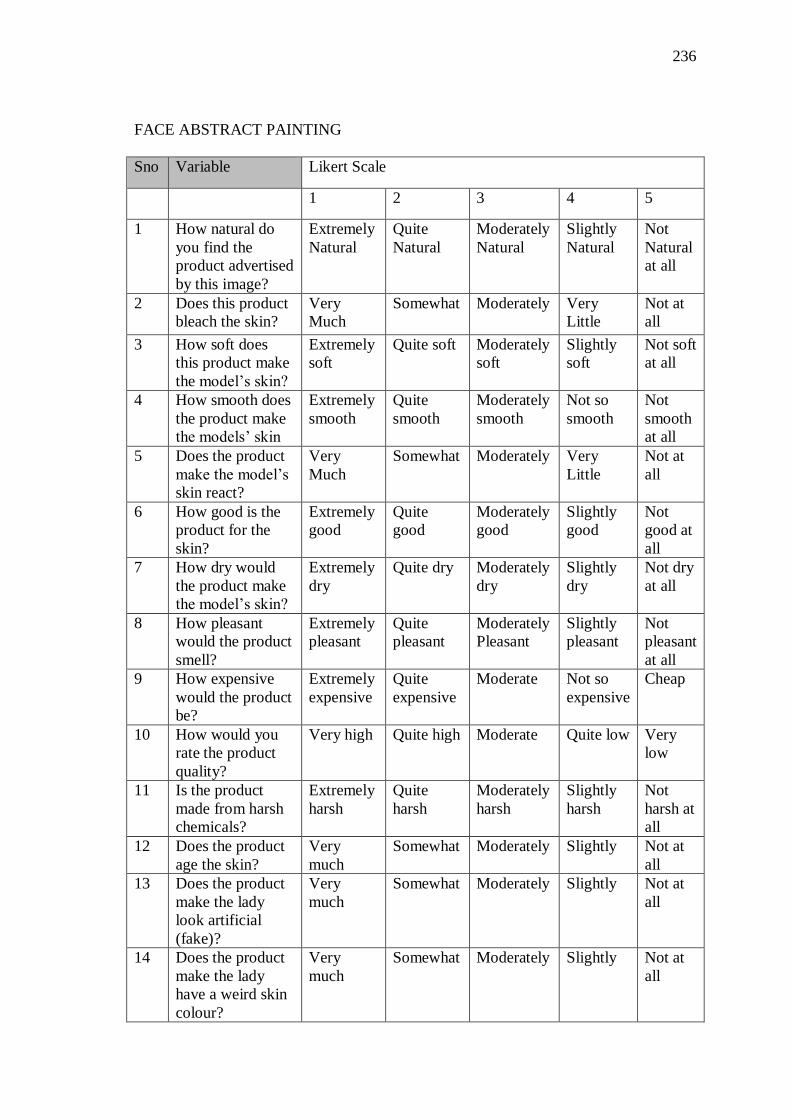
236
FACE ABSTRACT PAINTING
Sno Variable Likert Scale
1 2 3 4 5
1 How natural do
you find the
product advertised
by this image?
Extremely
Natural
Quite
Natural
Moderately
Natural
Slightly
Natural
Not
Natural
at all
2 Does this product
bleach the skin?
Very
Much
Somewhat Moderately Very
Little
Not at
all
3 How soft does
this product make
the model’s skin?
Extremely
soft
Quite soft Moderately
soft
Slightly
soft
Not soft
at all
4 How smooth does
the product make
the models’ skin
Extremely
smooth
Quite
smooth
Moderately
smooth
Not so
smooth
Not
smooth
at all
5 Does the product
make the model’s
skin react?
Very
Much
Somewhat Moderately Very
Little
Not at
all
6 How good is the
product for the
skin?
Extremely
good
Quite
good
Moderately
good
Slightly
good
Not
good at
all
7 How dry would
the product make
the model’s skin?
Extremely
dry
Quite dry Moderately
dry
Slightly
dry
Not dry
at all
8 How pleasant
would the product
smell?
Extremely
pleasant
Quite
pleasant
Moderately
Pleasant
Slightly
pleasant
Not
pleasant
at all
9 How expensive
would the product
be?
Extremely
expensive
Quite
expensive
Moderate Not so
expensive
Cheap
10 How would you
rate the product
quality?
Very high Quite high Moderate Quite low Very
low
11 Is the product
made from harsh
chemicals?
Extremely
harsh
Quite
harsh
Moderately
harsh
Slightly
harsh
Not
harsh at
all
12 Does the product
age the skin?
Very
much
Somewhat Moderately Slightly Not at
all
13 Does the product
make the lady
look artificial
(fake)?
Very
much
Somewhat Moderately Slightly Not at
all
14 Does the product
make the lady
have a weird skin
colour?
Very
much
Somewhat Moderately Slightly Not at
all
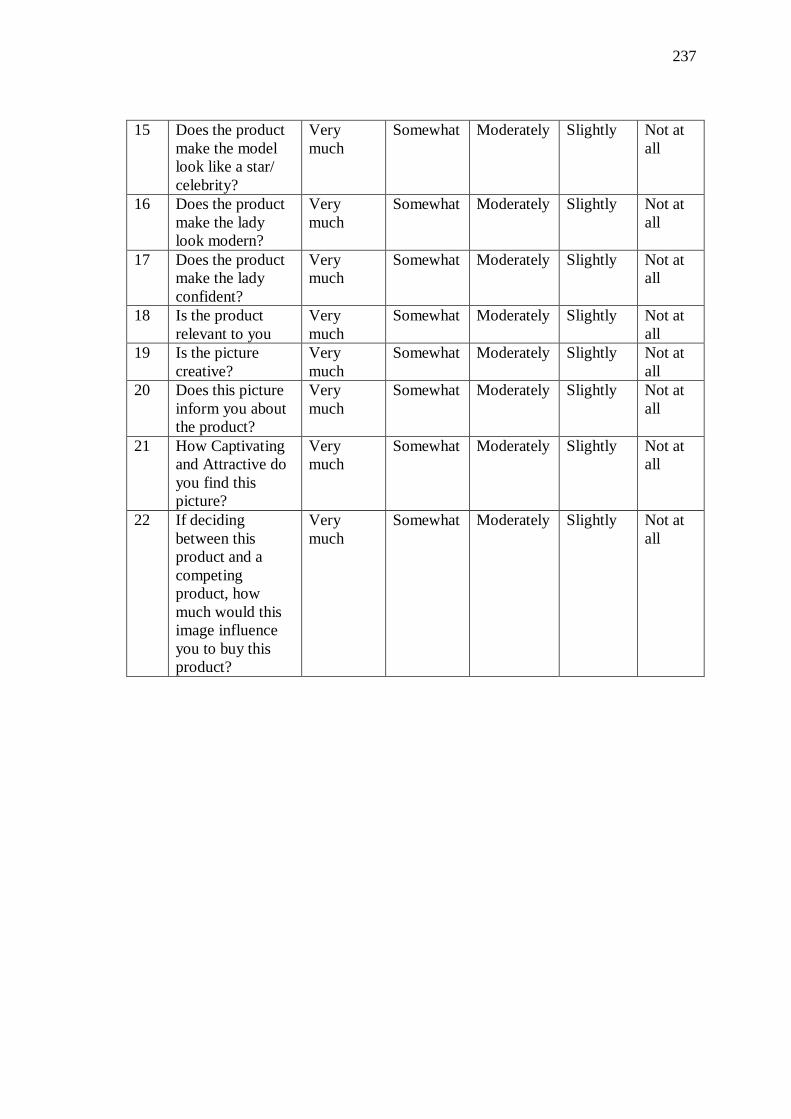
237
15 Does the product
make the model
look like a star/
celebrity?
Very
much
Somewhat Moderately Slightly Not at
all
16 Does the product
make the lady
look modern?
Very
much
Somewhat Moderately Slightly Not at
all
17 Does the product
make the lady
confident?
Very
much
Somewhat Moderately Slightly Not at
all
18 Is the product
relevant to you
Very
much
Somewhat Moderately Slightly Not at
all
19 Is the picture
creative?
Very
much
Somewhat Moderately Slightly Not at
all
20 Does this picture
inform you about
the product?
Very
much
Somewhat Moderately Slightly Not at
all
21 How Captivating
and Attractive do
you find this
picture?
Very
much
Somewhat Moderately Slightly Not at
all
22 If deciding
between this
product and a
competing
product, how
much would this
image influence
you to buy this
product?
Very
much
Somewhat Moderately Slightly Not at
all
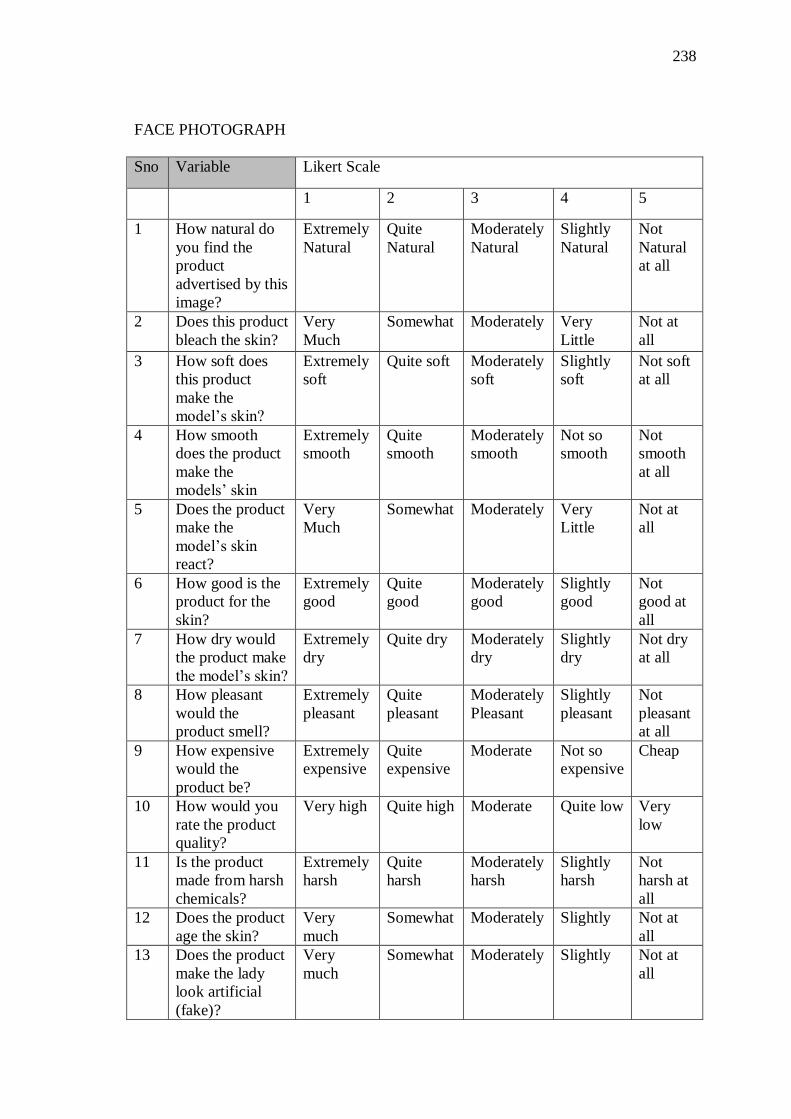
238
FACE PHOTOGRAPH
Sno Variable Likert Scale
1 2 3 4 5
1 How natural do
you find the
product
advertised by this
image?
Extremely
Natural
Quite
Natural
Moderately
Natural
Slightly
Natural
Not
Natural
at all
2 Does this product
bleach the skin?
Very
Much
Somewhat Moderately Very
Little
Not at
all
3 How soft does
this product
make the
model’s skin?
Extremely
soft
Quite soft Moderately
soft
Slightly
soft
Not soft
at all
4 How smooth
does the product
make the
models’ skin
Extremely
smooth
Quite
smooth
Moderately
smooth
Not so
smooth
Not
smooth
at all
5 Does the product
make the
model’s skin
react?
Very
Much
Somewhat Moderately Very
Little
Not at
all
6 How good is the
product for the
skin?
Extremely
good
Quite
good
Moderately
good
Slightly
good
Not
good at
all
7 How dry would
the product make
the model’s skin?
Extremely
dry
Quite dry Moderately
dry
Slightly
dry
Not dry
at all
8 How pleasant
would the
product smell?
Extremely
pleasant
Quite
pleasant
Moderately
Pleasant
Slightly
pleasant
Not
pleasant
at all
9 How expensive
would the
product be?
Extremely
expensive
Quite
expensive
Moderate Not so
expensive
Cheap
10 How would you
rate the product
quality?
Very high Quite high Moderate Quite low Very
low
11 Is the product
made from harsh
chemicals?
Extremely
harsh
Quite
harsh
Moderately
harsh
Slightly
harsh
Not
harsh at
all
12 Does the product
age the skin?
Very
much
Somewhat Moderately Slightly Not at
all
13 Does the product
make the lady
look artificial
(fake)?
Very
much
Somewhat Moderately Slightly Not at
all
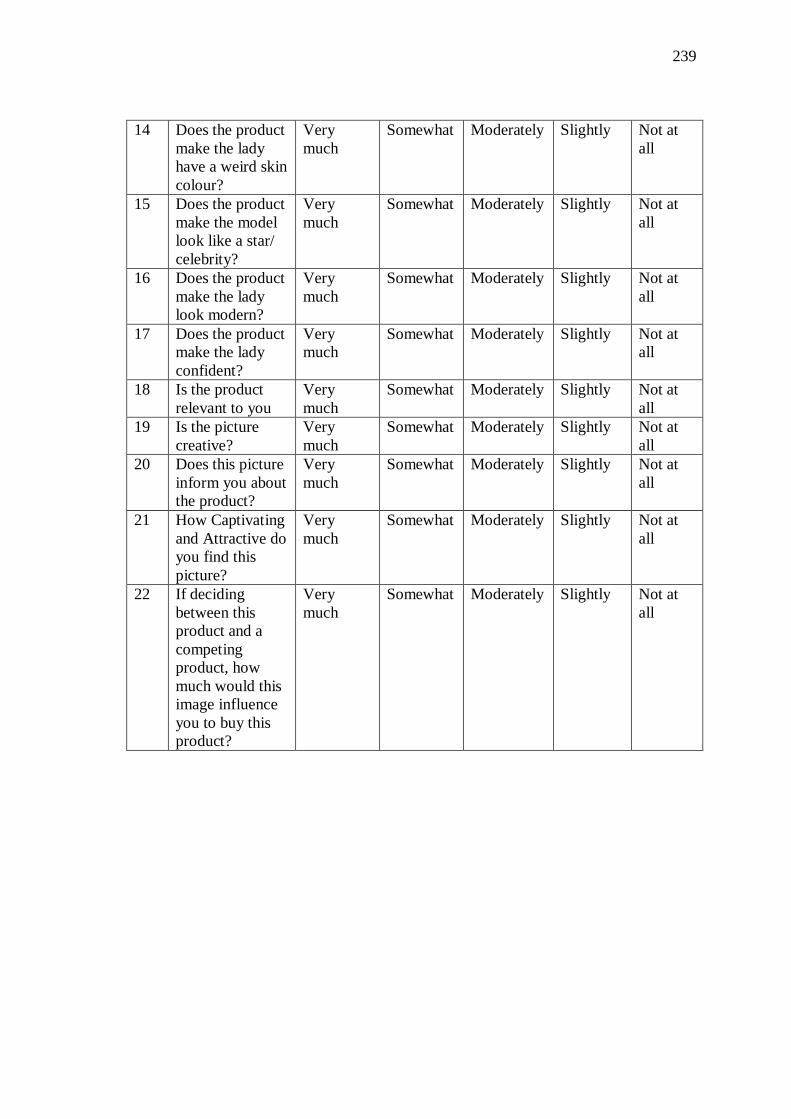
239
14 Does the product
make the lady
have a weird skin
colour?
Very
much
Somewhat Moderately Slightly Not at
all
15 Does the product
make the model
look like a star/
celebrity?
Very
much
Somewhat Moderately Slightly Not at
all
16 Does the product
make the lady
look modern?
Very
much
Somewhat Moderately Slightly Not at
all
17 Does the product
make the lady
confident?
Very
much
Somewhat Moderately Slightly Not at
all
18 Is the product
relevant to you
Very
much
Somewhat Moderately Slightly Not at
all
19 Is the picture
creative?
Very
much
Somewhat Moderately Slightly Not at
all
20 Does this picture
inform you about
the product?
Very
much
Somewhat Moderately Slightly Not at
all
21 How Captivating
and Attractive do
you find this
picture?
Very
much
Somewhat Moderately Slightly Not at
all
22 If deciding
between this
product and a
competing
product, how
much would this
image influence
you to buy this
product?
Very
much
Somewhat Moderately Slightly Not at
all
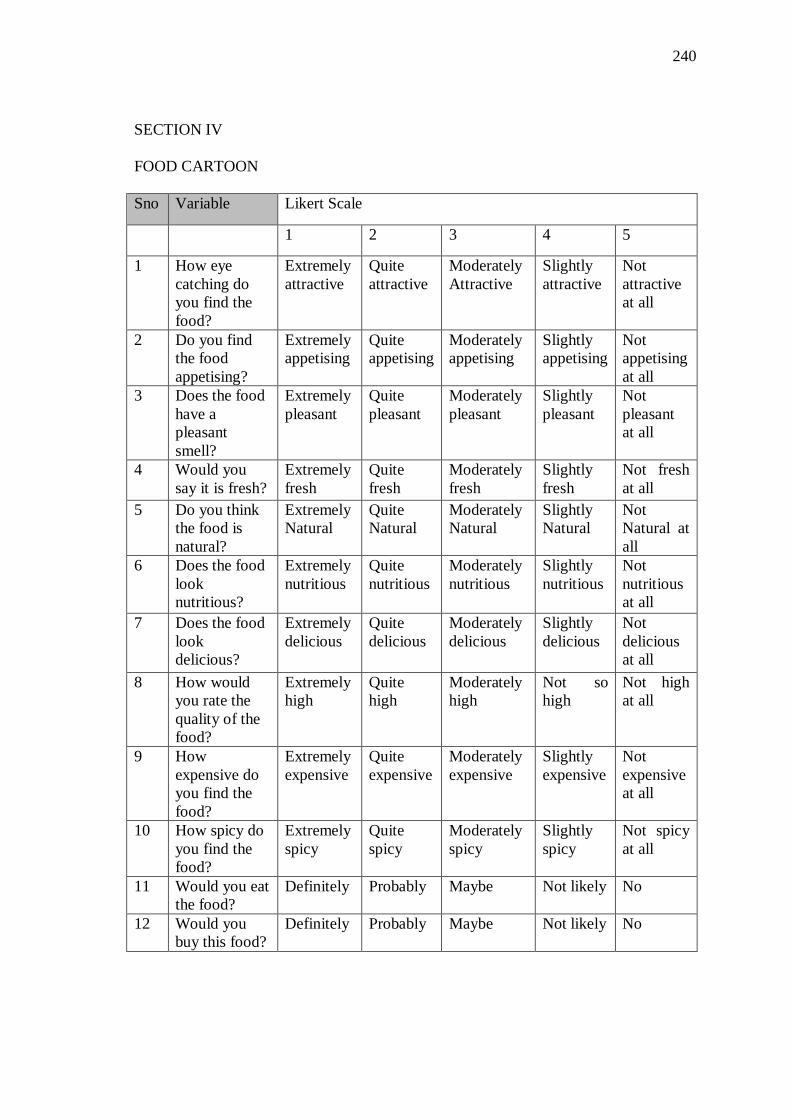
240
SECTION IV
FOOD CARTOON
Sno Variable Likert Scale
1 2 3 4 5
1 How eye
catching do
you find the
food?
Extremely
attractive
Quite
attractive
Moderately
Attractive
Slightly
attractive
Not
attractive
at all
2 Do you find
the food
appetising?
Extremely
appetising
Quite
appetising
Moderately
appetising
Slightly
appetising
Not
appetising
at all
3 Does the food
have a
pleasant
smell?
Extremely
pleasant
Quite
pleasant
Moderately
pleasant
Slightly
pleasant
Not
pleasant
at all
4 Would you
say it is fresh?
Extremely
fresh
Quite
fresh
Moderately
fresh
Slightly
fresh
Not fresh
at all
5 Do you think
the food is
natural?
Extremely
Natural
Quite
Natural
Moderately
Natural
Slightly
Natural
Not
Natural at
all
6 Does the food
look
nutritious?
Extremely
nutritious
Quite
nutritious
Moderately
nutritious
Slightly
nutritious
Not
nutritious
at all
7 Does the food
look
delicious?
Extremely
delicious
Quite
delicious
Moderately
delicious
Slightly
delicious
Not
delicious
at all
8 How would
you rate the
quality of the
food?
Extremely
high
Quite
high
Moderately
high
Not so
high
Not high
at all
9 How
expensive do
you find the
food?
Extremely
expensive
Quite
expensive
Moderately
expensive
Slightly
expensive
Not
expensive
at all
10 How spicy do
you find the
food?
Extremely
spicy
Quite
spicy
Moderately
spicy
Slightly
spicy
Not spicy
at all
11 Would you eat
the food?
Definitely Probably Maybe Not likely No
12 Would you
buy this food?
Definitely Probably Maybe Not likely No
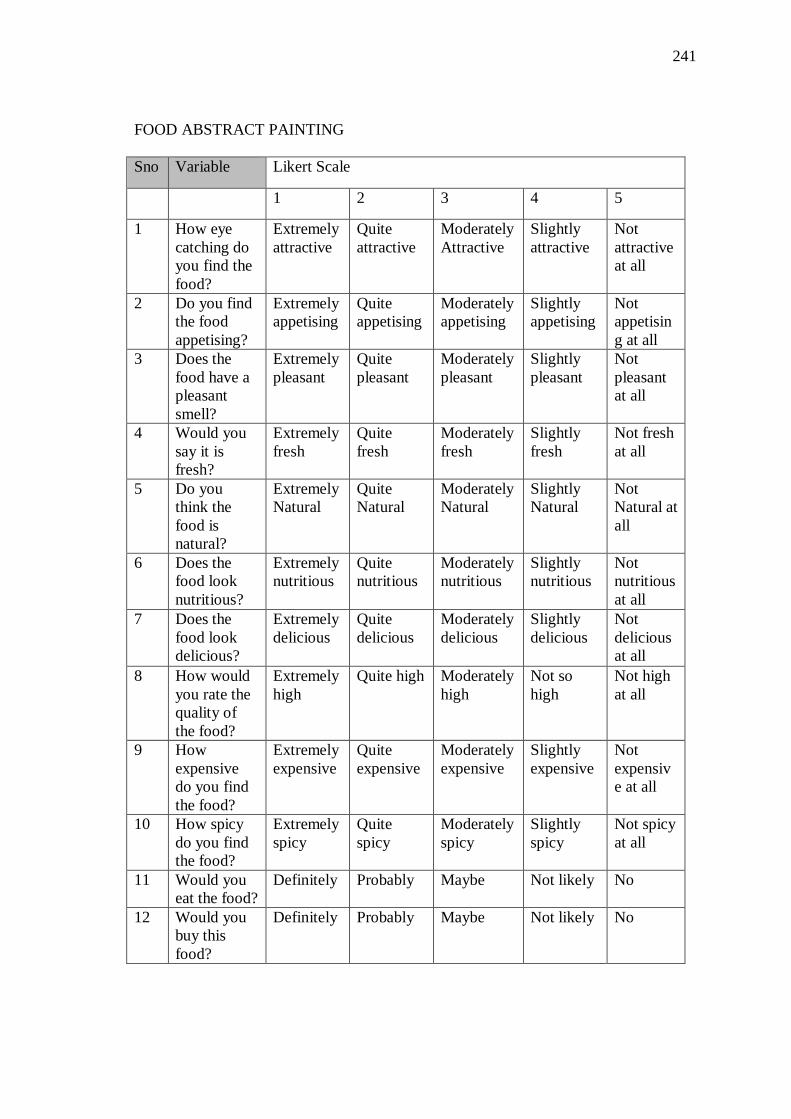
241
FOOD ABSTRACT PAINTING
Sno Variable Likert Scale
1 2 3 4 5
1 How eye
catching do
you find the
food?
Extremely
attractive
Quite
attractive
Moderately
Attractive
Slightly
attractive
Not
attractive
at all
2 Do you find
the food
appetising?
Extremely
appetising
Quite
appetising
Moderately
appetising
Slightly
appetising
Not
appetisin
g at all
3 Does the
food have a
pleasant
smell?
Extremely
pleasant
Quite
pleasant
Moderately
pleasant
Slightly
pleasant
Not
pleasant
at all
4 Would you
say it is
fresh?
Extremely
fresh
Quite
fresh
Moderately
fresh
Slightly
fresh
Not fresh
at all
5 Do you
think the
food is
natural?
Extremely
Natural
Quite
Natural
Moderately
Natural
Slightly
Natural
Not
Natural at
all
6 Does the
food look
nutritious?
Extremely
nutritious
Quite
nutritious
Moderately
nutritious
Slightly
nutritious
Not
nutritious
at all
7 Does the
food look
delicious?
Extremely
delicious
Quite
delicious
Moderately
delicious
Slightly
delicious
Not
delicious
at all
8 How would
you rate the
quality of
the food?
Extremely
high
Quite high Moderately
high
Not so
high
Not high
at all
9 How
expensive
do you find
the food?
Extremely
expensive
Quite
expensive
Moderately
expensive
Slightly
expensive
Not
expensiv
e at all
10 How spicy
do you find
the food?
Extremely
spicy
Quite
spicy
Moderately
spicy
Slightly
spicy
Not spicy
at all
11 Would you
eat the food?
Definitely Probably Maybe Not likely No
12 Would you
buy this
food?
Definitely Probably Maybe Not likely No
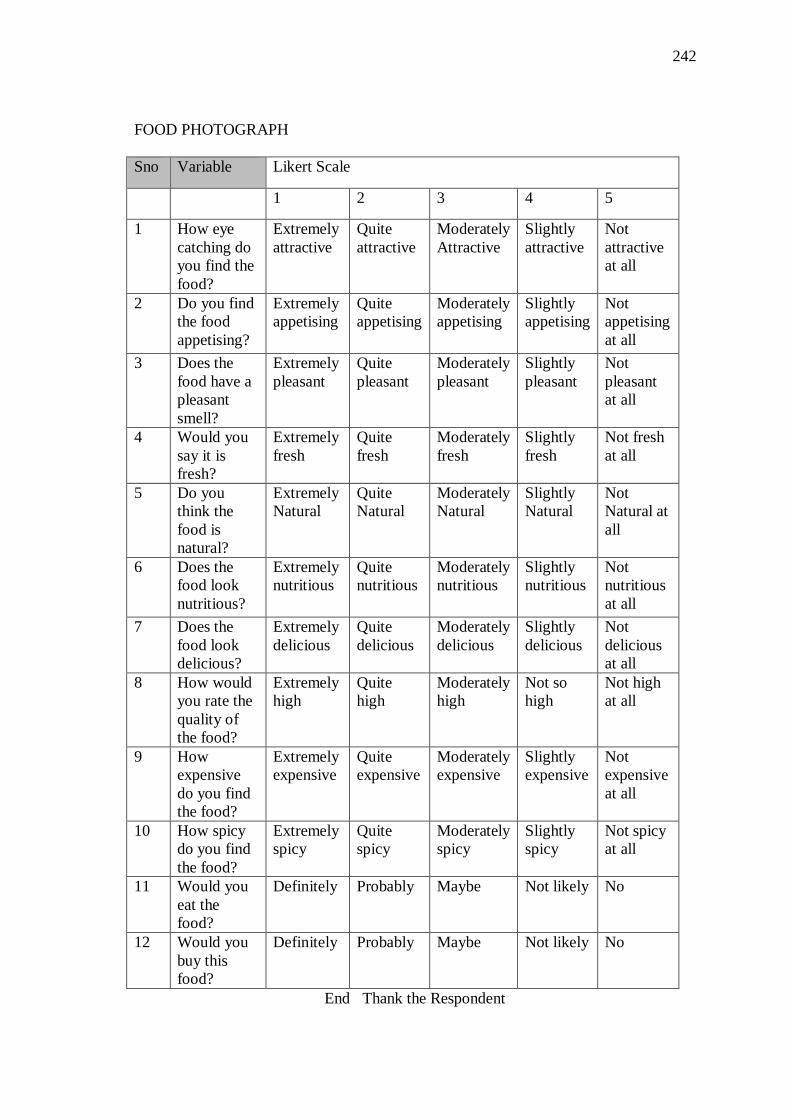
242
FOOD PHOTOGRAPH
Sno Variable Likert Scale
1 2 3 4 5
1 How eye
catching do
you find the
food?
Extremely
attractive
Quite
attractive
Moderately
Attractive
Slightly
attractive
Not
attractive
at all
2 Do you find
the food
appetising?
Extremely
appetising
Quite
appetising
Moderately
appetising
Slightly
appetising
Not
appetising
at all
3 Does the
food have a
pleasant
smell?
Extremely
pleasant
Quite
pleasant
Moderately
pleasant
Slightly
pleasant
Not
pleasant
at all
4 Would you
say it is
fresh?
Extremely
fresh
Quite
fresh
Moderately
fresh
Slightly
fresh
Not fresh
at all
5 Do you
think the
food is
natural?
Extremely
Natural
Quite
Natural
Moderately
Natural
Slightly
Natural
Not
Natural at
all
6 Does the
food look
nutritious?
Extremely
nutritious
Quite
nutritious
Moderately
nutritious
Slightly
nutritious
Not
nutritious
at all
7 Does the
food look
delicious?
Extremely
delicious
Quite
delicious
Moderately
delicious
Slightly
delicious
Not
delicious
at all
8 How would
you rate the
quality of
the food?
Extremely
high
Quite
high
Moderately
high
Not so
high
Not high
at all
9 How
expensive
do you find
the food?
Extremely
expensive
Quite
expensive
Moderately
expensive
Slightly
expensive
Not
expensive
at all
10 How spicy
do you find
the food?
Extremely
spicy
Quite
spicy
Moderately
spicy
Slightly
spicy
Not spicy
at all
11 Would you
eat the
food?
Definitely Probably Maybe Not likely No
12 Would you
buy this
food?
Definitely Probably Maybe Not likely No
End Thank the Respondent
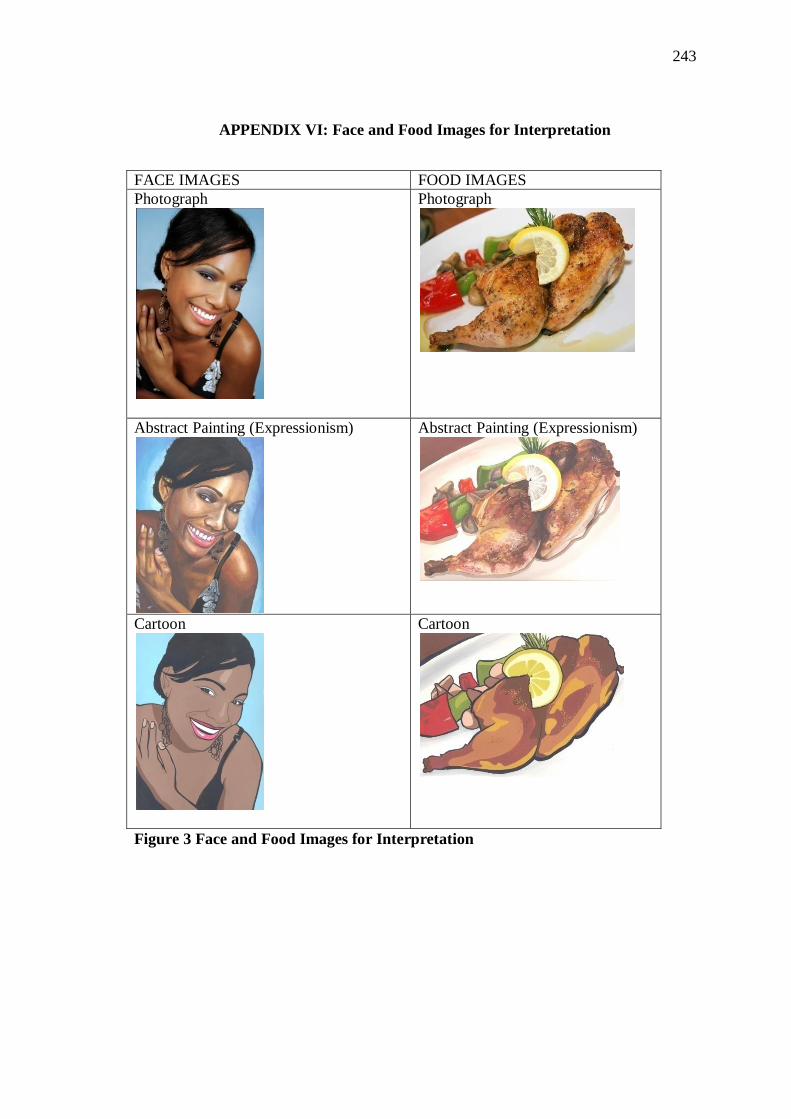
243
APPENDIX VI: Face and Food Images for Interpretation
FACE IMAGES FOOD IMAGES
Photograph
Photograph
Abstract Painting (Expressionism)
Abstract Painting (Expressionism)
Cartoon
Cartoon
Figure 3 Face and Food Images for Interpretation
244
APPENDIX VII: Summary of Generated Themes Focus Group 1 and 2,
Face and Food (Amalgamation of AB, C1, and C2)
Themes Focus Group 1: Face Cartoon Theme
FACE CARTOON THEME
1 The advertisement does not communicate a message.
2 The precise item in the advertisement being promoted is not clear.
3 The texture of the models skin is captivating/flawless
4 The model is beautiful
5 The model’s skin has blemishes
6 The mode’s skin colour is varied
7 The model has natural skin
8 The models skin is artificial
9 The model’s skin does not shine
10 The models skin is plain and dry
11 The model’s skin is soft
12 The model’s skin is bleached
13 The model has a beautiful smile
14 The image guarantees you happiness
15 If you use the same product as the model in the cartoon images, your
complexion colour will change
16 The model’s skin has reacted negatively to the product
17 The model’s skin has not reacted to the product
18 The cartoon model looks fresh and smells good
19 The cartoon model smells bad
20 The Product used by the cartoon model is expensive
21 The Product used by the cartoon model is not expensive
22 The model has applied a lot of make-up
23 The model has applied make-up
24 The model has not applied make-up
25 The product is artificial
26 The product is natural
27 The cartoon image attracts a specific age group
28 The work looks incomplete.
29 The artistic style selected lacks visual clarity
30 The artistic style is not captivating
31 The artistic style looks artificial and is misleading as to the true nature of items
32 The cartoon is the preferred artistic style
33 The model is sweating
34 The lack of even skin tone is due to shadows in the image
35 The model has posed well for the photo shot
36 The image is not suitable for advertising
37 The make-up being promoted by the image is of good quality
245
38 The make-up being promoted by the image is of poor quality
39 The model likes her personal appearance
40 The model could improve on her looks by altering her make-up
41 The model appears Asian
42 The model is wealthy
43 The model looks like a commoner
Themes Focus Group 2: Face Cartoon Theme
FACE CARTOON THEME
1 The model is happy
2 The model is sad
3 The models’ complexion is even
4 The model’s skin texture is rough
5 The model’s skin colour is natural
6 This picture does not indicate the texture of her skin.
7 The model has worn make-up
8 The model shows how a star would dress up
9 The model is a famous person
10 The model is a modern woman
11 The girl in the image though very beautiful, has “the girl next door” look
12 There’s a lot of emphasis on the earrings
13 It is unclear what product the model is promoting
14 From the models’ stance, one would query her emotions
15 The model communicates that, she loves what she’s doing at the moment.
16 From the models’ smile, she knows she’s put her make-up on well and
everything is well she looks beautiful
17 The model looks very confident. Looks like she’s feeling really good about
herself
18 The models’ skin texture is nice
19 The model has overdone her make-up
20 The models’ make-up lacks colour co-ordination
21 The model is experimenting in order to create new make-up designs
22 The colours used in this image are dull. The complexion colour does not
represent an existing skin colour
23 The colours used in the image seek attention
24 The colours on the models’ face would stand out more and sparkle if there
was greater contrast of colour between the models’ face and the background
25 The shadow effect on the models’ face looks like a scar
26 The white coloured highlight on the lips looks like an error
27 The white coloured highlight on the lips looks like water
28 The white coloured highlight on the lips looks like a highlight
29 The dark coloured lowlight on the models’ face is a shadow
30 The dark coloured lowlight on the models’ face is a burn mark
31 The artwork is complete
32 The artwork is not complete
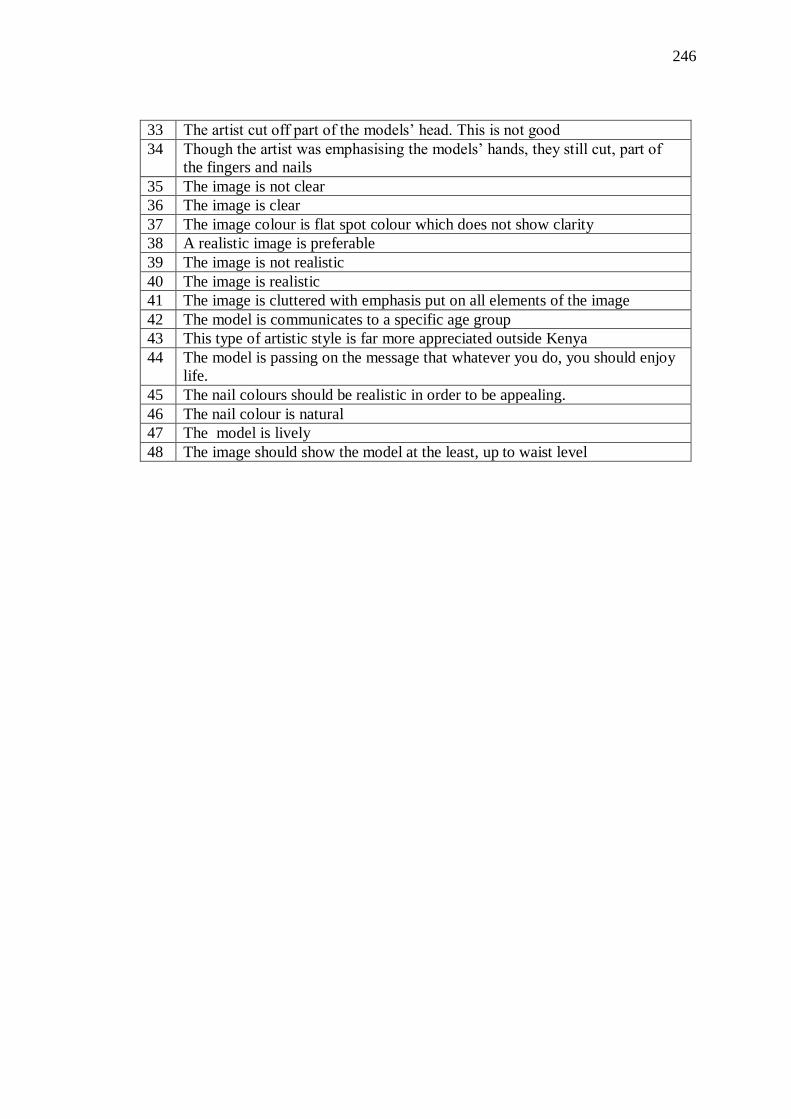
246
33 The artist cut off part of the models’ head. This is not good
34 Though the artist was emphasising the models’ hands, they still cut, part of
the fingers and nails
35 The image is not clear
36 The image is clear
37 The image colour is flat spot colour which does not show clarity
38 A realistic image is preferable
39 The image is not realistic
40 The image is realistic
41 The image is cluttered with emphasis put on all elements of the image
42 The model is communicates to a specific age group
43 This type of artistic style is far more appreciated outside Kenya
44 The model is passing on the message that whatever you do, you should enjoy
life.
45 The nail colours should be realistic in order to be appealing.
46 The nail colour is natural
47 The model is lively
48 The image should show the model at the least, up to waist level
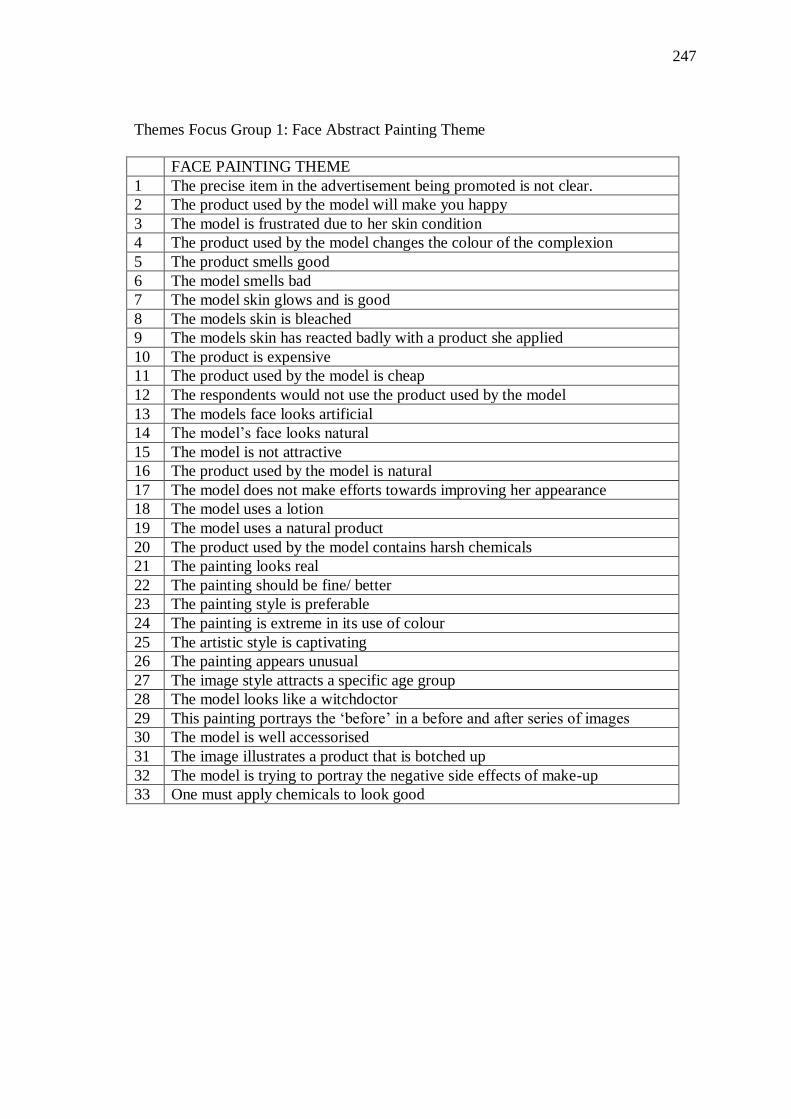
247
Themes Focus Group 1: Face Abstract Painting Theme
FACE PAINTING THEME
1 The precise item in the advertisement being promoted is not clear.
2 The product used by the model will make you happy
3 The model is frustrated due to her skin condition
4 The product used by the model changes the colour of the complexion
5 The product smells good
6 The model smells bad
7 The model skin glows and is good
8 The models skin is bleached
9 The models skin has reacted badly with a product she applied
10 The product is expensive
11 The product used by the model is cheap
12 The respondents would not use the product used by the model
13 The models face looks artificial
14 The model’s face looks natural
15 The model is not attractive
16 The product used by the model is natural
17 The model does not make efforts towards improving her appearance
18 The model uses a lotion
19 The model uses a natural product
20 The product used by the model contains harsh chemicals
21 The painting looks real
22 The painting should be fine/ better
23 The painting style is preferable
24 The painting is extreme in its use of colour
25 The artistic style is captivating
26 The painting appears unusual
27 The image style attracts a specific age group
28 The model looks like a witchdoctor
29 This painting portrays the ‘before’ in a before and after series of images
30 The model is well accessorised
31 The image illustrates a product that is botched up
32 The model is trying to portray the negative side effects of make-up
33 One must apply chemicals to look good
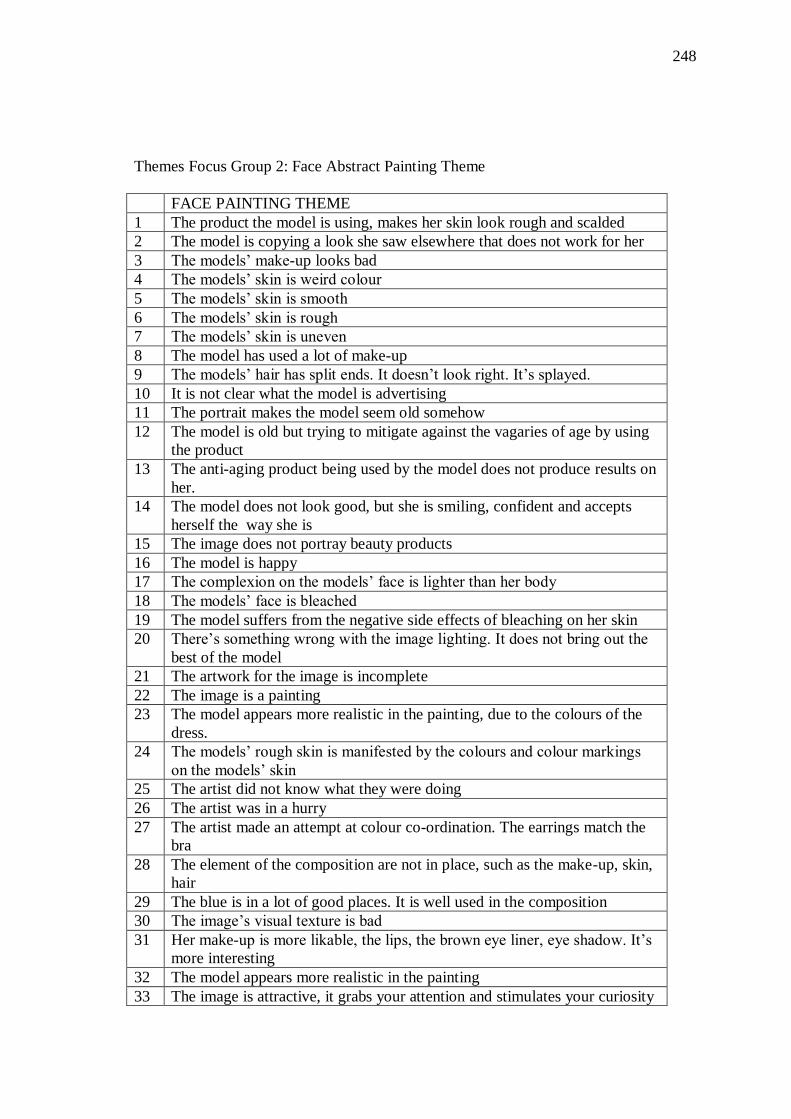
248
Themes Focus Group 2: Face Abstract Painting Theme
FACE PAINTING THEME
1 The product the model is using, makes her skin look rough and scalded
2 The model is copying a look she saw elsewhere that does not work for her
3 The models’ make-up looks bad
4 The models’ skin is weird colour
5 The models’ skin is smooth
6 The models’ skin is rough
7 The models’ skin is uneven
8 The model has used a lot of make-up
9 The models’ hair has split ends. It doesn’t look right. It’s splayed.
10 It is not clear what the model is advertising
11 The portrait makes the model seem old somehow
12 The model is old but trying to mitigate against the vagaries of age by using
the product
13 The anti-aging product being used by the model does not produce results on
her.
14 The model does not look good, but she is smiling, confident and accepts
herself the way she is
15 The image does not portray beauty products
16 The model is happy
17 The complexion on the models’ face is lighter than her body
18 The models’ face is bleached
19 The model suffers from the negative side effects of bleaching on her skin
20 There’s something wrong with the image lighting. It does not bring out the
best of the model
21 The artwork for the image is incomplete
22 The image is a painting
23 The model appears more realistic in the painting, due to the colours of the
dress.
24 The models’ rough skin is manifested by the colours and colour markings
on the models’ skin
25 The artist did not know what they were doing
26 The artist was in a hurry
27 The artist made an attempt at colour co-ordination. The earrings match the
bra
28 The element of the composition are not in place, such as the make-up, skin,
hair
29 The blue is in a lot of good places. It is well used in the composition
30 The image’s visual texture is bad
31 Her make-up is more likable, the lips, the brown eye liner, eye shadow. It’s
more interesting
32 The model appears more realistic in the painting
33 The image is attractive, it grabs your attention and stimulates your curiosity
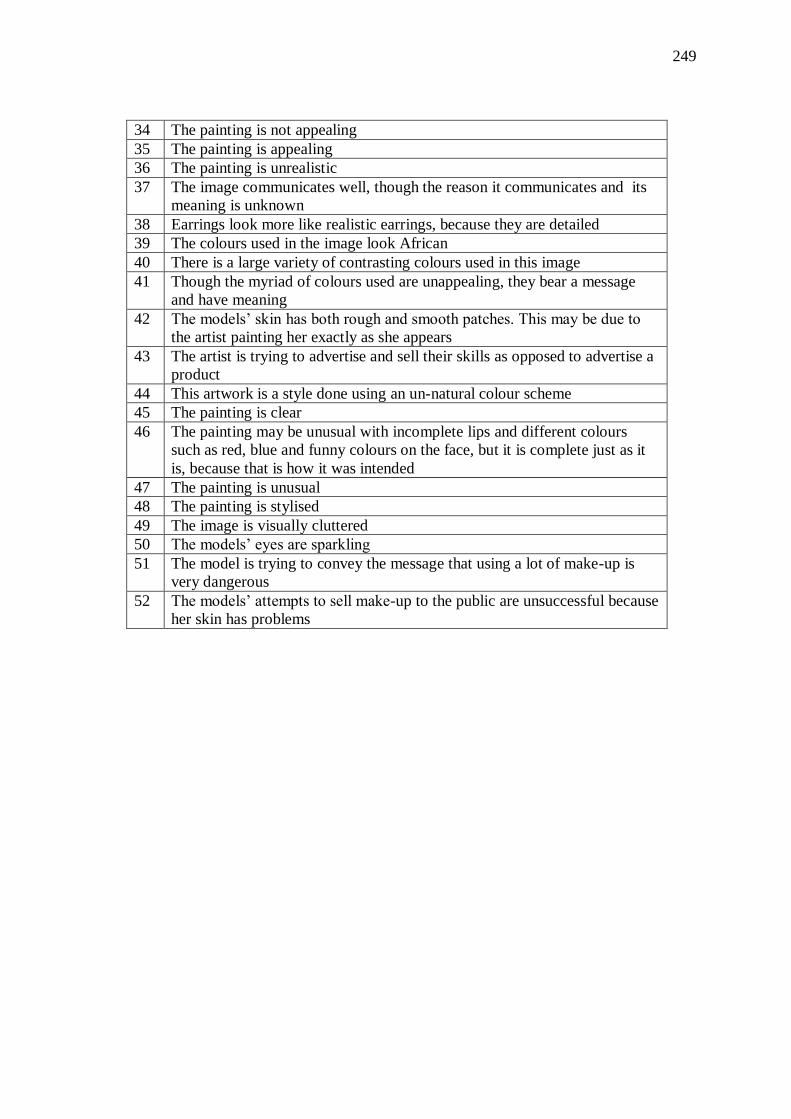
249
34 The painting is not appealing
35 The painting is appealing
36 The painting is unrealistic
37 The image communicates well, though the reason it communicates and its
meaning is unknown
38 Earrings look more like realistic earrings, because they are detailed
39 The colours used in the image look African
40 There is a large variety of contrasting colours used in this image
41 Though the myriad of colours used are unappealing, they bear a message
and have meaning
42 The models’ skin has both rough and smooth patches. This may be due to
the artist painting her exactly as she appears
43 The artist is trying to advertise and sell their skills as opposed to advertise a
product
44 This artwork is a style done using an un-natural colour scheme
45 The painting is clear
46 The painting may be unusual with incomplete lips and different colours
such as red, blue and funny colours on the face, but it is complete just as it
is, because that is how it was intended
47 The painting is unusual
48 The painting is stylised
49 The image is visually cluttered
50 The models’ eyes are sparkling
51 The model is trying to convey the message that using a lot of make-up is
very dangerous
52 The models’ attempts to sell make-up to the public are unsuccessful because
her skin has problems
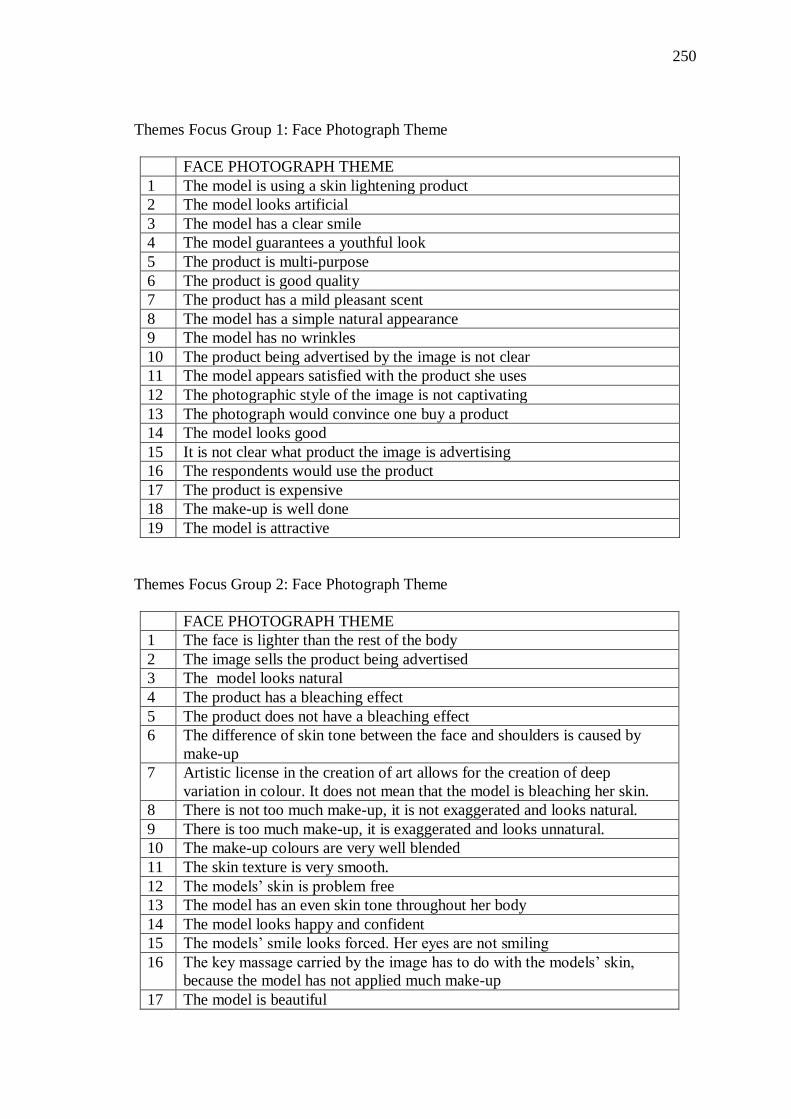
250
Themes Focus Group 1: Face Photograph Theme
FACE PHOTOGRAPH THEME
1 The model is using a skin lightening product
2 The model looks artificial
3 The model has a clear smile
4 The model guarantees a youthful look
5 The product is multi-purpose
6 The product is good quality
7 The product has a mild pleasant scent
8 The model has a simple natural appearance
9 The model has no wrinkles
10 The product being advertised by the image is not clear
11 The model appears satisfied with the product she uses
12 The photographic style of the image is not captivating
13 The photograph would convince one buy a product
14 The model looks good
15 It is not clear what product the image is advertising
16 The respondents would use the product
17 The product is expensive
18 The make-up is well done
19 The model is attractive
Themes Focus Group 2: Face Photograph Theme
FACE PHOTOGRAPH THEME
1 The face is lighter than the rest of the body
2 The image sells the product being advertised
3 The model looks natural
4 The product has a bleaching effect
5 The product does not have a bleaching effect
6 The difference of skin tone between the face and shoulders is caused by
make-up
7 Artistic license in the creation of art allows for the creation of deep
variation in colour. It does not mean that the model is bleaching her skin.
8 There is not too much make-up, it is not exaggerated and looks natural.
9 There is too much make-up, it is exaggerated and looks unnatural.
10 The make-up colours are very well blended
11 The skin texture is very smooth.
12 The models’ skin is problem free
13 The model has an even skin tone throughout her body
14 The model looks happy and confident
15 The models’ smile looks forced. Her eyes are not smiling
16 The key massage carried by the image has to do with the models’ skin,
because the model has not applied much make-up
17 The model is beautiful
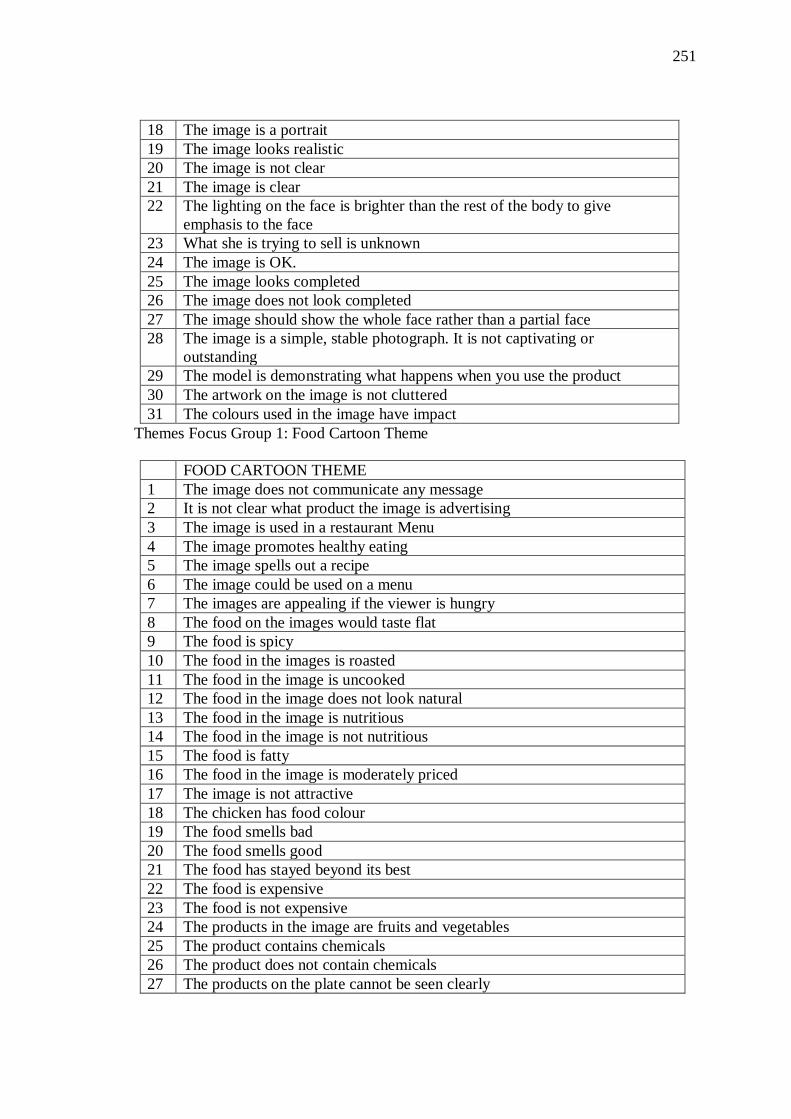
251
18 The image is a portrait
19 The image looks realistic
20 The image is not clear
21 The image is clear
22 The lighting on the face is brighter than the rest of the body to give
emphasis to the face
23 What she is trying to sell is unknown
24 The image is OK.
25 The image looks completed
26 The image does not look completed
27 The image should show the whole face rather than a partial face
28 The image is a simple, stable photograph. It is not captivating or
outstanding
29 The model is demonstrating what happens when you use the product
30 The artwork on the image is not cluttered
31 The colours used in the image have impact
Themes Focus Group 1: Food Cartoon Theme
FOOD CARTOON THEME
1 The image does not communicate any message
2 It is not clear what product the image is advertising
3 The image is used in a restaurant Menu
4 The image promotes healthy eating
5 The image spells out a recipe
6 The image could be used on a menu
7 The images are appealing if the viewer is hungry
8 The food on the images would taste flat
9 The food is spicy
10 The food in the images is roasted
11 The food in the image is uncooked
12 The food in the image does not look natural
13 The food in the image is nutritious
14 The food in the image is not nutritious
15 The food is fatty
16 The food in the image is moderately priced
17 The image is not attractive
18 The chicken has food colour
19 The food smells bad
20 The food smells good
21 The food has stayed beyond its best
22 The food is expensive
23 The food is not expensive
24 The products in the image are fruits and vegetables
25 The product contains chemicals
26 The product does not contain chemicals
27 The products on the plate cannot be seen clearly
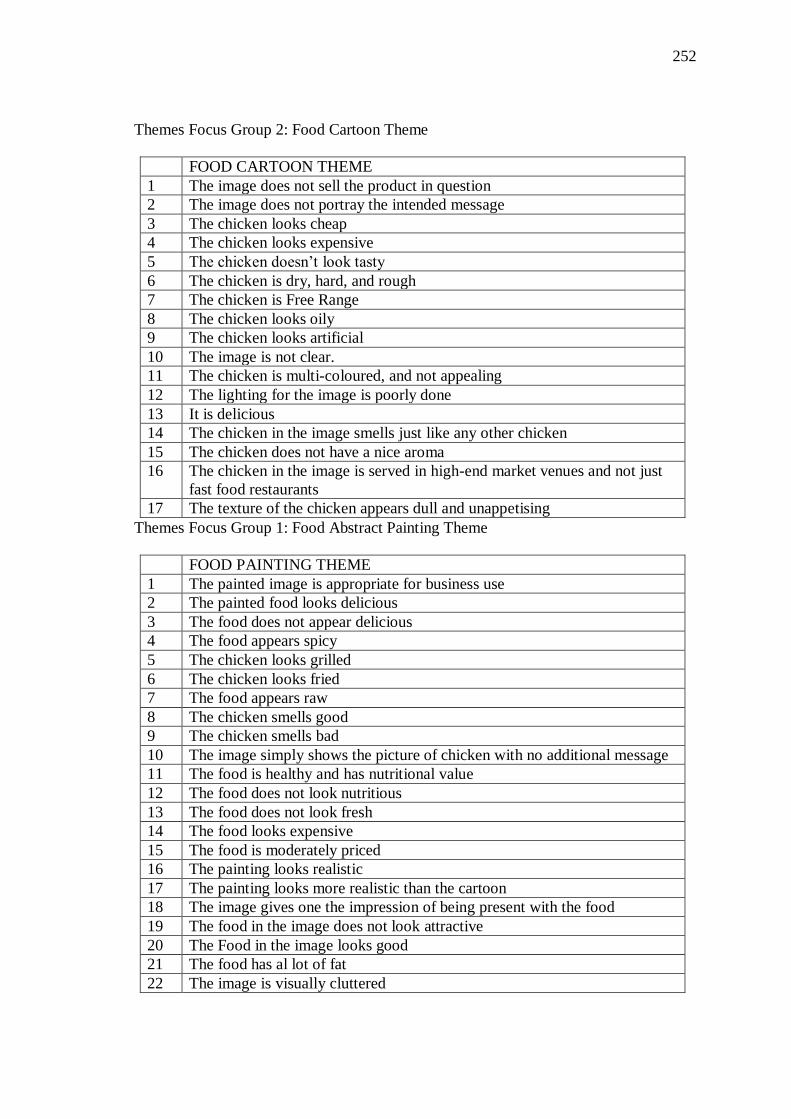
252
Themes Focus Group 2: Food Cartoon Theme
FOOD CARTOON THEME
1 The image does not sell the product in question
2 The image does not portray the intended message
3 The chicken looks cheap
4 The chicken looks expensive
5 The chicken doesn’t look tasty
6 The chicken is dry, hard, and rough
7 The chicken is Free Range
8 The chicken looks oily
9 The chicken looks artificial
10 The image is not clear.
11 The chicken is multi-coloured, and not appealing
12 The lighting for the image is poorly done
13 It is delicious
14 The chicken in the image smells just like any other chicken
15 The chicken does not have a nice aroma
16 The chicken in the image is served in high-end market venues and not just
fast food restaurants
17 The texture of the chicken appears dull and unappetising
Themes Focus Group 1: Food Abstract Painting Theme
FOOD PAINTING THEME
1 The painted image is appropriate for business use
2 The painted food looks delicious
3 The food does not appear delicious
4 The food appears spicy
5 The chicken looks grilled
6 The chicken looks fried
7 The food appears raw
8 The chicken smells good
9 The chicken smells bad
10 The image simply shows the picture of chicken with no additional message
11 The food is healthy and has nutritional value
12 The food does not look nutritious
13 The food does not look fresh
14 The food looks expensive
15 The food is moderately priced
16 The painting looks realistic
17 The painting looks more realistic than the cartoon
18 The image gives one the impression of being present with the food
19 The food in the image does not look attractive
20 The Food in the image looks good
21 The food has al lot of fat
22 The image is visually cluttered
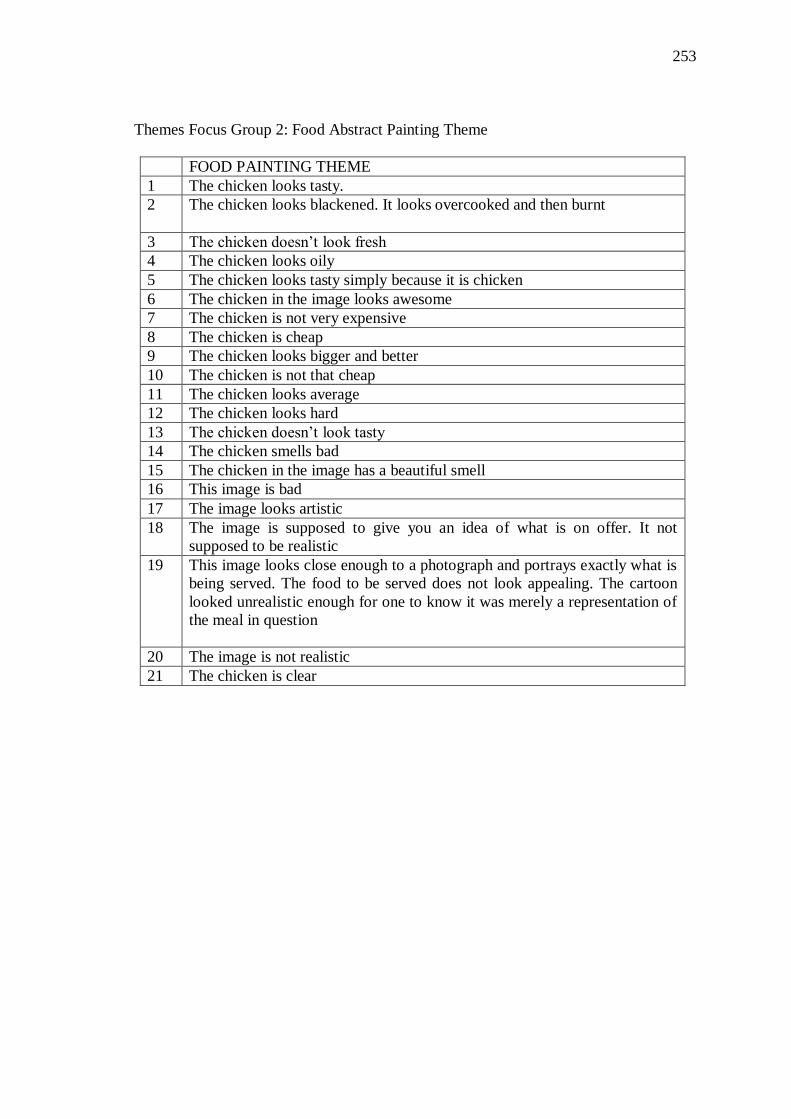
253
Themes Focus Group 2: Food Abstract Painting Theme
FOOD PAINTING THEME
1 The chicken looks tasty.
2 The chicken looks blackened. It looks overcooked and then burnt
3 The chicken doesn’t look fresh
4 The chicken looks oily
5 The chicken looks tasty simply because it is chicken
6 The chicken in the image looks awesome
7 The chicken is not very expensive
8 The chicken is cheap
9 The chicken looks bigger and better
10 The chicken is not that cheap
11 The chicken looks average
12 The chicken looks hard
13 The chicken doesn’t look tasty
14 The chicken smells bad
15 The chicken in the image has a beautiful smell
16 This image is bad
17 The image looks artistic
18 The image is supposed to give you an idea of what is on offer. It not
supposed to be realistic
19 This image looks close enough to a photograph and portrays exactly what is
being served. The food to be served does not look appealing. The cartoon
looked unrealistic enough for one to know it was merely a representation of
the meal in question
20 The image is not realistic
21 The chicken is clear
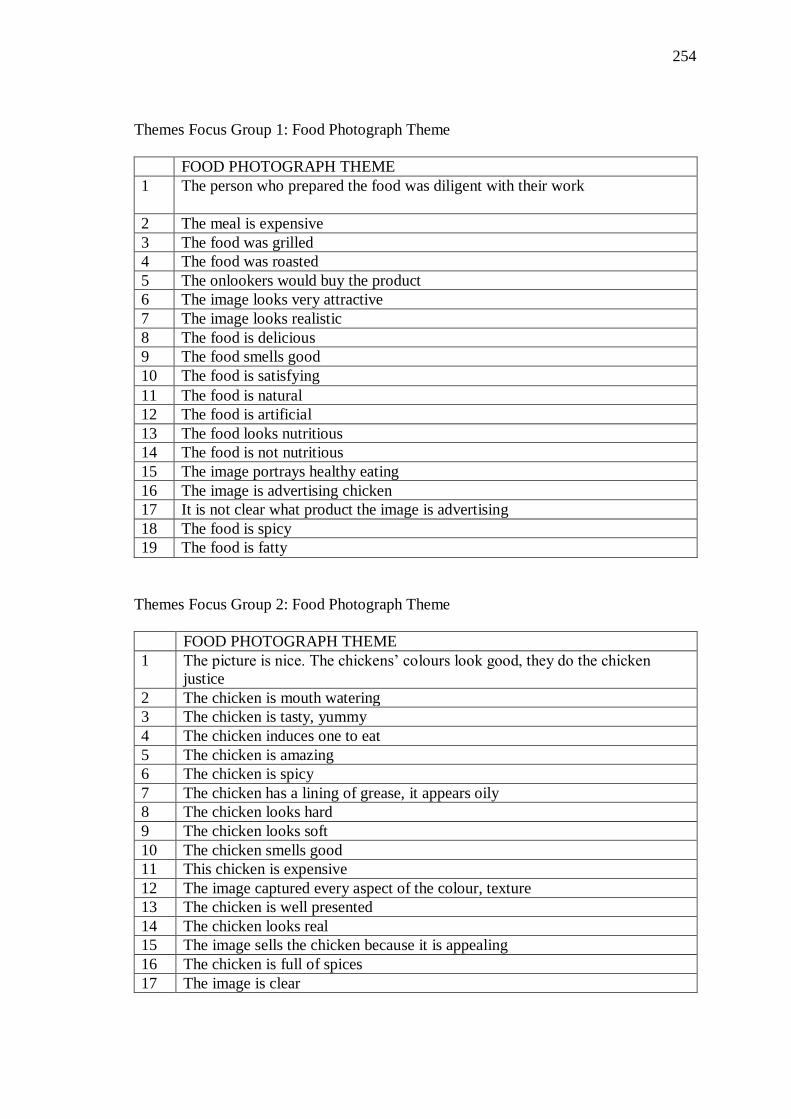
254
Themes Focus Group 1: Food Photograph Theme
FOOD PHOTOGRAPH THEME
1 The person who prepared the food was diligent with their work
2 The meal is expensive
3 The food was grilled
4 The food was roasted
5 The onlookers would buy the product
6 The image looks very attractive
7 The image looks realistic
8 The food is delicious
9 The food smells good
10 The food is satisfying
11 The food is natural
12 The food is artificial
13 The food looks nutritious
14 The food is not nutritious
15 The image portrays healthy eating
16 The image is advertising chicken
17 It is not clear what product the image is advertising
18 The food is spicy
19 The food is fatty
Themes Focus Group 2: Food Photograph Theme
FOOD PHOTOGRAPH THEME
1 The picture is nice. The chickens’ colours look good, they do the chicken
justice
2 The chicken is mouth watering
3 The chicken is tasty, yummy
4 The chicken induces one to eat
5 The chicken is amazing
6 The chicken is spicy
7 The chicken has a lining of grease, it appears oily
8 The chicken looks hard
9 The chicken looks soft
10 The chicken smells good
11 This chicken is expensive
12 The image captured every aspect of the colour, texture
13 The chicken is well presented
14 The chicken looks real
15 The image sells the chicken because it is appealing
16 The chicken is full of spices
17 The image is clear

255
APPENDIX VIII: Research Permit
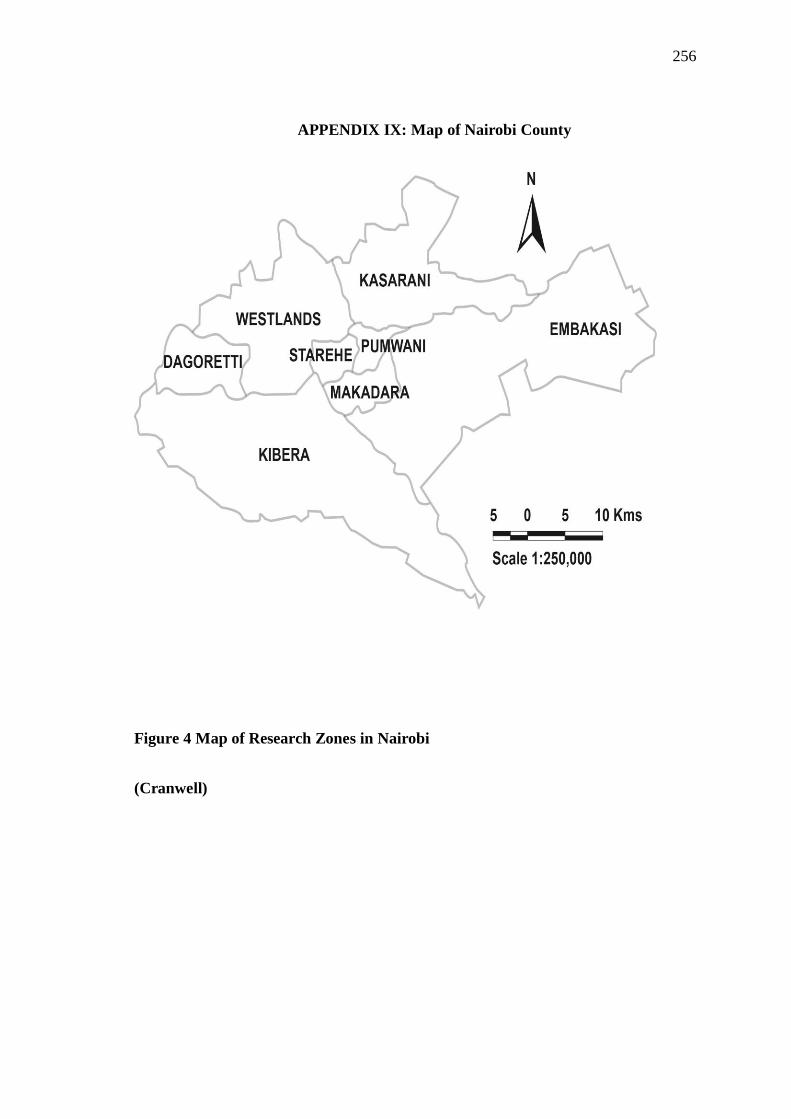
256
APPENDIX IX: Map of Nairobi County
Figure 4 Map of Research Zones in Nairobi
(Cranwell)