characterization of the paradoxical growth effect of candida
TRANSCRIPT
Characterization of the Paradoxical Growth Effect of Candida albicans Exposed to Caspofungin
by
Amy Elizabeth Delorme
A thesis submitted in partial fulfillment of the requirements for the degree of
Doctor of Philosophy in
Medical Sciences - Laboratory Medicine and Pathology
University of Alberta
© Amy Elizabeth Delorme, 2015
2
Abstract Candida albicans is an opportunistic pathogen and major cause of
invasive fungal infections. Choice of antifungal therapy is complicated by the
underlying associated diseases of patients infected, other drug interactions, and in
vitro susceptibility of the isolate. Echinocandins are emerging as a preferred first
line therapy in candidiasis, as they have few drug interactions or patient side
effects, and have a fungal specific mode of action. However, in vitro
susceptibility testing of caspofungin by broth microdilution has revealed an
unexplained paradoxical growth (PG) effect in which there is noticeable growth at
concentrations above the minimum inhibitory concentration (MIC) of susceptible
isolates. This effect has not been fully characterized, but is believed to be a
strictly in vitro phenomenon. The incidence of the PG effect varies between
Candida strains, species, and growth forms and is affected my growth medium
composition. My objectives were to more fully understand this effect by
evaluating factors that affect in vitro growth with the echinocandin caspofungin
(CASPO), including inoculum density and medium carbon source. I demonstrated
that all C. albicans demonstrate the PG effect while C. glabrata, suggesting an
intrinsic difference between species that demonstrate PG. Sequence and
phylogenetic evaluation of the echinocandin target, glucan synthase, does not
correlate with MIC or PG. Further in vitro evaluation by time kill analysis
determined that medium carbon source modulates the PG effect. My research
findings contribute to the growing body of evidence that suggests the action of
echinocandins is not entirely concentration dependent and highlights the

3
significant physiological differences between yeast grown at PG and inhibitory
CASPO concentrations.
4
Acknowledgements I would like to extend my gratitude, appreciation, and thanks to Dr.
Rennie for his patience, mentorship, and guidance throughout this endeavor. He
provided me the opportunity to become a truly independent investigator.
I would like to thank my co-supervisor Dr. Gregory Tyrrell and committee
member Dr. Jeff Fuller for their guidance and insightful discussions. I would also
like to thank LeeAnn Turnbull, Brad Jansen, and Sandy Shokoples, who were
essential to my daily dealings.
Lastly, I would like to thank my friends and family who have stuck by me
through the thickest, especially my very patient parents. As for those who didn’t...

5
Table of Contents Abstract....................................................................................................................ii Acknowledgments..................................................................................................iv Table of Contents.....................................................................................................v List of Tables........................................................................................................viii List of Figures.........................................................................................................ix Abbreviations..........................................................................................................xi Chapter 1: Introduction........................................................................................1 1.1. Candida albicans..............................................................................................2 1.1.1. Epidemiology of Candida albicans infections..................................2 1.1.2. Colonization and infection.................................................................3 1.1.3. Diagnosis of fungal infections...........................................................5 1.1.4. Antifungal therapy and resistance......................................................6 1.2. Echinocandins...................................................................................................7 1.2.1. Pharmacology....................................................................................7 1.2.2. Glucan synthase...............................................................................10 1.2.2.1. The yeast cell wall............................................................10 1.2.2.2. Glucan synthase is the target of echinocandins................11 1.2.2.3. Fks1p.................................................................................12 1.2.2.4. Rho1p................................................................................15 1.2.3. Spectrum of activity.........................................................................20 1.2.4. Echinocandin resistance...................................................................21 1.2.4.1. Intrinsic resistance............................................................21 1.2.4.2. Acquired resistance...........................................................22
1.2.5. Susceptibility testing and clinical breakpoints.................................23 1.3. The paradoxical growth effect........................................................................24
1.3.1. Incidence..........................................................................................24 1.3.2. Cellular characteristics.....................................................................26 1.3.3. Potential mechanisms.......................................................................27
1.4. Clinical significance........................................................................................30 1.5. Research objectives.........................................................................................34 1.6. References.......................................................................................................44 Chapter 2: Materials and methods.....................................................................60 2.1. PG screening of yeast isolates.........................................................................61 2.1.1. Yeast isolates...................................................................................61

6
2.1.2. Broth microdilution assays..............................................................61 2.1.3. Microscopy......................................................................................64 2.1.4. Statistical analysis............................................................................65 2.2. Phylogenetic and sequence analysis of GS.....................................................66 2.2.1. Sequence data...................................................................................66 2.2.2. Sequence analysis............................................................................66 2.2.3. Phylogenetic analysis.......................................................................67 2.3. Effect of medium carbon source on PG..........................................................68 2.3.1. Yeast isolates...................................................................................68 2.3.2. Broth microdilution screening.........................................................68 2.3.3. Time kill analysis.............................................................................69 2.3.4. Statistical analysis of time kill analysis...........................................70 2.4. Cell cycle analysis by flow cytometry............................................................72 2.4.1. Flow cytometry: sample collection..................................................72 2.4.2. Flow cytometry: analysis.................................................................73 2.5. References.......................................................................................................78 Chapter 3: Results................................................................................................80 3.1. Effect of inoculum density on PG...................................................................81 3.2. Evolution of GS in fungi.................................................................................82 3.2.1. Optimizing multiple sequence alignment of GS genes....................82 3.2.2. Phylogenetic analysis.......................................................................83 3.2.3. FKS gene duplications in yeast........................................................86 3.2.4. FKS gene structures.........................................................................86 3.3. Effect of carbon source on the PG effect........................................................87 3.4. Cell cycle analysis...........................................................................................91 3.4.1. Fluorescence of echinocandins affects cell cycle analysis..............91 3.4.2. CASPO blocks the cell cycle at PG concentrations.........................92 3.5. References ....................................................................................................127 Chapter 4: Discussion........................................................................................129 4.1. General remarks............................................................................................130 4.2. Influence of inoculum on the PG effect of C. albicans exposed to
CASPO.........................................................................................................131 4.3. Evolution of GS in fungi...............................................................................137 4.3.1. GS in fungi.....................................................................................137 4.3.2. Phylogenetic and sequence analysis of fungal GS.........................139 4.3.3. FKS gene duplications in yeast......................................................140 4.3.4. FKS gene structures.......................................................................143 4.4. Medium carbon source impacts the degree of PG in C. albicans.................146

vii
4.4.1. Effect of carbon source on PG by time kill analysis......................146 4.4.2. Correlation of central carbon metabolism and PG.........................151 4.4.3.Differences in PG morphology in fermentable and non-fermentable
carbon sources..........................................................................................155 4.6. References.....................................................................................................162 Chapter 5: Conclusions.....................................................................................171 5.1. Future directions...........................................................................................172 5.1.1. Clinical significance of the PG effect............................................173 5.2. Major findings...............................................................................................180 5.3. Conclusions...................................................................................................181 5.4. References.....................................................................................................183 Bibliography.......................................................................................................186 Appendices..........................................................................................................215 Appendix 1. Stereomicroscopy of C. albicans microdilution growth patterns.............................................216 Appendix 2. Stereomicroscopy of C. glabrata microdilution growth patterns.............................................225 Appendix 3. C. albicans PG microdilution absorbance profiles.............230 Appendix 4. C. glabrata PG microdilution absorbance profiles.............234
8
List of Tables
Table 1.1. Antifungal therapy................................................................................36
Table 1.2. Echinocandin clinical breakpoints........................................................37
Table 2.1. Clinical yeast isolates............................................................................75
Table 2.2. GS sequence list....................................................................................76
Table 3.1. Effects of inoculum density on PG.......................................................94
Table 3.2. Significance testing of PG in C. albicans with an elevated inoculum....................................................................................................95
Table 3.3. Fks1p mutations conferring decreased echinocandin susceptibility.....97

9
List of Figures
Figure 1.1. Echinocandin chemical structures.......................................................38
Figure 1.2. The yeast cell wall...............................................................................39
Figure 1.3. Putative Fks1p topology......................................................................40
Figure 1.4. Functions of Rho1p.............................................................................41
Figure 1.5. Cellular characteristics of PG cells......................................................42
Figure 1.6. Cell wall stress pathways induced by echinocandins..........................43
Figure 2.1. Flow cytometry sample analysis.........................................................77
Figure 3.1. Absorbance profiles of CASPO microdilution growth patterns..........98
Figure 3.2. Stereomicroscopy of CASPO microdilution growth patterns...........100
Figure 3.3. “Hot-spot” sequence comparisons.....................................................103
Figure 3.4. Phylogenetic analysis of FKS protein dataset...................................104
Figure 3.5. Phylogenetic analysis of FKS nucleotide dataset..............................105
Figure 3.6. FKS gene duplications in yeast.........................................................106
Figure 3.7. FKS gene structures...........................................................................107
Figure 3.8. Time kill analysis of C. albicans ATCC® 90028™ exposed to CASPO grown in different carbon sources............................................................108
Figure 3.9. Comparative analysis of time kill endpoints: C. albicans ATCC® 90028™.....................................................................................................112
Figure 3.10. Time kill analysis of C. albicans M10MY4874 exposed to CASPO grown in different carbon sources...........................................................114
Figure 3.11. Comparative analysis of time kill endpoints: C. albicans M10MY4874...........................................................................................118
Figure 3.12. Time kill analysis of C. glabrata ATCC® 15126™ exposed to CASPO grown in different carbon sources..............................................120
10
Figure 3.13. Comparative analysis of time kill endpoints: C. glabrata ATCC® 15126™ ....................................................................................................122
Figure 3.14. Light microscopy of yeast exposed to CASPO in different carbon sources......................................................................................................124
Figure 3.15. Cell cycle analysis by flow cytometry.............................................126
Figure 4.1. C. albicans central carbon metabolism.............................................161

11
Abbreviations
oC degrees Celsius mg/L milligram per litre mM millimolar ANOVA Analysis of variance ATCC American Type Culture Collection ATP Adenosine triphosphate C Cytosine CASPO Caspofungin CAZY Carbohydrate Active enZYmes CFU Colony forming unit CLSI Clinical Laboratory Standards Institute CWI Cell wall integrity DMSO dimethyl sulfoxide DNA Deoxyribonucleic acid ETC Electron transport chain EUCAST European Committee on Antimicrobial Susceptibility Testing FKS1 FK506 Sensitivity protein, GS catalytic subunit G Guanine GAP GTPase activating protein GC Growth control GDP Guanosine diphosphate GEF Guanine nucleotide exchange factor GS 1,3-!-Glucan synthase GT Glycosyltransferase GTP Guanosine triphosphate HOG High osmolarity glycerol IFI Invasive fungal infection MAPK Mitogen activated protein MIC Minimum inhibitory concentration
12
MLST Multilocus sequence typing OD600 Optical density at 600 nanometers PAFE Post-antifungal effects PCR Polymerase chain reaction PG Paradoxical growth RHO1 Ras Homolog protein, GS regulatory subunit RNA Ribonucleic acid ROS Reactive oxygen species RPMI Roswell Park Memorial Institute SAAMF Synthetic amino acid medium fungi SDA Sabouraud dextrose agar SSD Small scale duplication TCA Tricarboxylic acid cycle UDP-Glc uridine diphosphate glucose WGD Whole genome duplication YNB Yeast nitrogen broth

1
Chapter 1: Introduction

2
1.1. Candida albicans
1.1.1. Epidemiology of Candida infections
Opportunistic fungal infections are a significant cause of severe human
disease due to an increasing population at risk. Invasive fungal infections (IFI)
affect normally sterile body fluids and deep tissues; infections occur most often
from opportunistic organisms that are present in the body as part of the normal
flora or in the environment that become pathogenic when immune defenses are
unable to fight infection. Increased risk for opportunistic infections occur with
disruptions to the normal flora, immune status, and skin or mucosal barriers. The
most common fungi related to opportunistic infections are Candida spp.,
Aspergillus spp., and Cryptococcus neoformans.(1) The list of medically
important fungi is ever increasing, but Candida albicans remains the most
significant opportunistic pathogen worldwide.(2)
Candidemia is the fourth most common nosocomial bloodstream infection
in the USA, affecting 10 cases per 100,000 population.(3) There are more than 20
Candida species associated with human disease, with the majority of infections
(!50%) attributable to Candida albicans.(4,5) Species distribution differs by
geographic region(3), and underlying condition of the patient.(5) Infections
caused by Candida spp., are associated with increased length of hospital stay, a
14.5% increase in mortality among hospitalized patients, and substantial financial
cost to healthcare.(6-9)
C. albicans is a highly adaptable organism, utilizing a number of strategies
to evolve to suit changing host and environmental conditions. This is

3
demonstrated by multilocus sequence typing (MLST), which differentiates 70%
of C. albicans isolates into four closely related clades (strain types), each
demonstrating distinct evolutionary histories.(10) While there are no absolute
phenotypic associations attributable to any one clade, there are strong associations
among clades for geographic regions, antifungal resistance, and phenotypic
characteristics including acid phosphatase activity and growth in 2 M sodium
chloride.(11,12) However, no significant associations can be made between
virulence and sequence type(13), likely do to the multitude of genetic traits and
environmental factors that contribute to virulence.
1.1.2. Colonization and infection
C. albicans colonization of skin, genital mucosa, and/or intestinal mucosa
is highly prevalent, affecting 30-70% of healthy individuals.(14,15) Inhibition of
growth by nutrient competition and secondary metabolite production of healthy
gut bacteria and appropriate host immune modulation of colonized yeast prevent
overgrowth and infections.(16) A disruption of the mucosal barrier, normal
bacterial flora, and/or host immune system can allow colonized yeast to invade
host tissue. Yeast adhere to host cells and undergo the morphological switch to
hyphae, which penetrate tissue and disseminate into vasculature and other
tissues.(14) C. albicans has a number of traits that contribute to the progression
from colonization to disease that enhance its ability to adhere to host cells, switch
morphological forms, and evade host immune cells.
4
C. albicans has specialized cell wall and secreted proteins that are
essential for cell adhesion, nutrient uptake, and evasion of the host immune
system. Adhesins, such as agglutinin-like sequence proteins, allow adhesion to
other yeast cells, host tissues, and medical devices.(14) Hydrolytic enzymes,
including lipases, phospholipases, and aspartyl proteases, are secreted to degrade
host tissues and immune proteins, thereby enhancing nutrient acquisition and
evasion of host immune cells.(17)
C. albicans grows as yeast (blastospores), pseudohyphae, and hyphae
depending on environmental cues such as pH, cell density, and nutrient
availability.(18) Morphological transitions are required for infection, as hyphal
forms are required for tissue invasion while yeast forms are required for
dissemination.(19) C. albicans mutants locked in either yeast or hyphal forms are
avirulent in animal models, suggesting the ability to switch morphologies, rather
than any one form, significantly contributes to virulence.(20-22)
The ability to switch morphological forms also contributes to biofilm
formation. Biofilms consist of layered organized communities of heterogeneous
cell types embedded within an extracellular matrix.(23,24) C. albicans yeast
adhere to host tissue or medical devices, transition to hyphal growth, and produce
an extracellular matrix composed of carbohydrates, proteins, phosphorous, and
hexosamine.(25,26) Biofilms are more resistant to host defenses and antifungal
therapy, as the biofilm structure provides defense against phagocytic cells, limits
diffusion of antifungal drugs, and alters the transcription of cellular processes,
including upregulation of adhesins and secreted proteins.(26,27)

5
1.1.3. Diagnosis of fungal infections
Accurate and timely diagnosis of fungal infections is necessary for
appropriate and effective treatment. Identification of the organism to the species
level helps evaluate the isolate’s clinical significance, as certain species from
specific specimen types correlate to more severe disease outcomes, and species-
specific susceptibilities dictate choice of antifungal therapy.(28) Standard
methods for diagnosis of fungal infections rely on the integration of microbiology
cultures, histological identification, and clinical presentation. However, diagnosis
of fungal infections remains difficult: culture techniques may not support
organisms requiring specific media supplementation, and may be difficult to
interpret as colonized opportunistic organisms can be isolated from non-sterile
sites or from improper collection from sterile sites; histology samples require
invasive procedures which may be contraindicated for immunocompromised
patients; and the clinical presentation of fungal infections is often non-specific
and easily mistaken for symptoms of any underlying disease.(28-30)
New methods to enhance diagnosis include amplification of fungal
deoxyribonucleic acid (DNA) by polymerase chain reaction (PCR) and detection
of fungal cell wall 1,3-!-glucans. These methods are not yet a standard for
clinical practice as there is limited data on the efficacy in diagnosis of fungal
infections in large-scale prospective clinical studies.(30,31) More research is
needed to improve the sensitivity and accuracy of fungal diagnostics, as any delay
in treatment significantly reduces prognosis and increases mortality.(32)
6
1.1.4. Antifungal therapy and resistance
Antifungal therapy currently includes azoles, polyenes, pyrimidine
analogues, and echinocandins.(Table 1.1) The type and duration of antifungal
treatment is dependent on patient age, immune status, severity of infection,
underlying conditions, concomitant medications, fungal species, and antifungal
susceptibility profiling. The current guidelines for treatment of candidemia or
invasive candidiasis include fluconazole or echinocandins as preferred first line
therapy for non-neutropenic patients, and lipid formulations of amphotericin B or
caspofungin for neutropenic patients.(33,34) Treatment is usually continued for
two weeks after the last positive blood culture and the signs and symptoms of
candidemia have resolved.(35,36) The duration of antifungal therapy is debatable,
as it must be sufficient to resolve the infection while limiting exposure to
antifungals to reduce unwanted side effects and the potential for development of
antifungal resistance.
Antifungal resistance can be intrinsic, occurring naturally in an organism
regardless of prior antifungal exposure, or acquired, occurring after exposure to
antifungals. Resistance generally occurs through four mechanisms: upregulation
of drug transporters, antifungal target alterations, compensatory regulation of
metabolic pathways, and biofilm formation.(37) In vitro susceptibility testing of
antifungals aims to predict in vivo clinical response by identifying organisms that
are susceptible or resistant to a given therapy. While in vitro susceptibility
profiles are an indicator of therapy success, outcome of antifungal therapy is
7
affected by the type and severity of underlying disease, drug interactions, and
drug metabolism.(38) No one antifungal therapy is without limitations; the
toxicities associated with broad spectrum amphotericin B and fluconazole are
undesirable side effects that can further complicate patient outcome while other
therapies have a limited spectrum of activity. Emerging resistance and the limited
treatment options for many fungal species highlights the importance of evaluating
new and existing antifungal therapies.
An ideal antifungal would be fungicidal to a broad spectrum of fungal
pathogens, have a fungal-specific target, and no drug interactions. While no one
antifungal developed to date is ideal, the echinocandins are the most promising
prospect for management of fungal infections, as they have a fungal specific
target, no significant drug interactions or side effects, and are effective against the
most common Candida spp. associated with disease.
1.2. Echinocandins
1.2.1. Pharmacology
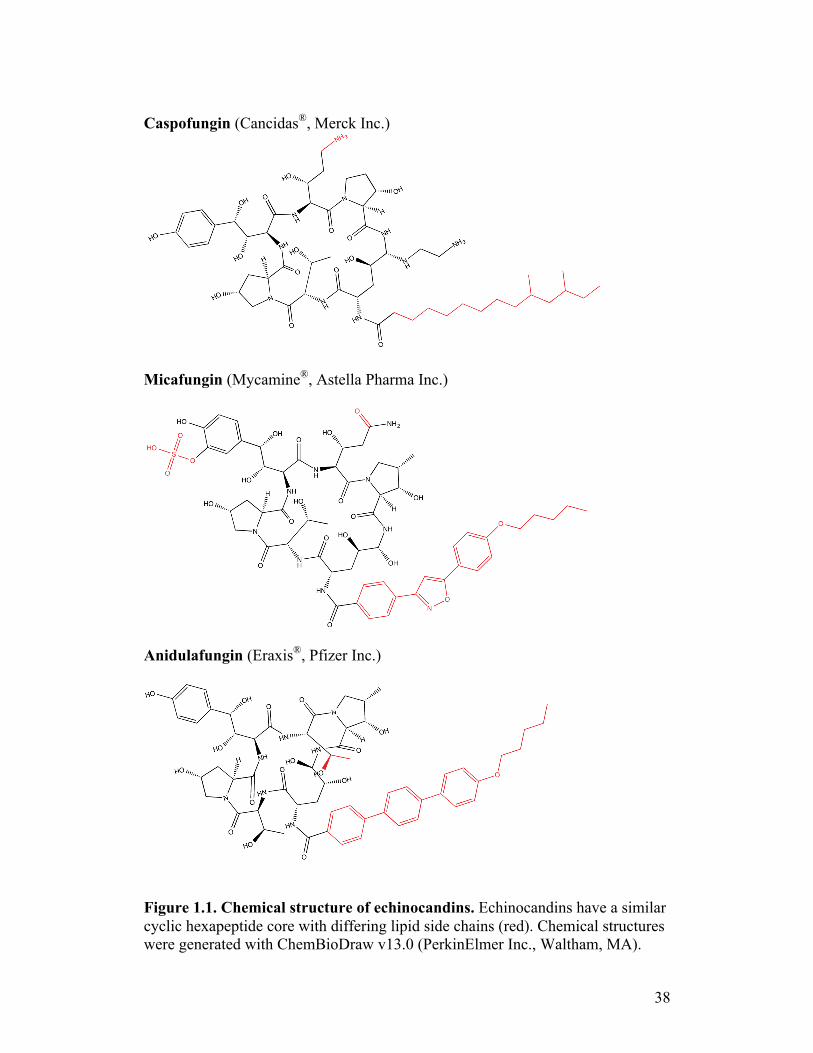
The echinocandins caspofungin (CASPO, Cancidas®, Merk Inc.),
micafungin (Mycamine®, Astellas Pharmaceuticals Inc.), and anidulafungin
(Eraxis®, Pfizer Inc.) are semisynthetic lipopeptides derived from the natural
fungal products of Glarea lozoyensis, Coleophoma empedri, and Aspergillus
nidulans, respectively.(39) They share a similar cyclic hexapeptide core with
differing N-linked acyl lipid side chains (Figure 1.1).(40,41) Efficacy of these
drugs over other derivatives is dependent on the hydroxy proline residue in the

8
core and the side chain interactions with the target.(42,43) The echinocandins are
the newest class of antifungals developed, with caspofungin first approved for
clinical use in the United States (2001), followed by micafungin (2005) and
anidulafungin (2006).(44-46) All three are currently approved for invasive and
esophageal Candida infections and treatment of candidemia in non-neutropenic
patients, while CASPO is approved for use with invasive Aspergillus infections
that are unresponsive to other treatment options.
Echinocandins inhibit the incorporation of 1,3-!-glucan into the fungal
cell wall by noncompetitive binding of 1,3-!-glucan synthase (GS) in a dose-
dependent manner.(47) 1,3-!-glucan is a major structural component of the cell
wall and its depletion causes osmotic fragility and cell lysis in actively dividing
yeast cells.(48) In vitro studies with osmotic stabilizers have shown that they
reduce the inhibitory effects of echinocandins(49), indicating altered cell walls by
these agents. The cell wall glucans are absent from mammalian cells, resulting in
a drug target that is specific for fungal cells and limits undesirable side effects
present with other antifungal therapies.
All three echinocandins have similar properties that make them desirable
for antifungal therapy of invasive infections, although they have a low (<10%)
bioavailability and require intravenous administration.(50) Adverse effects occur
infrequently (<2%) but can include infusion-related reactions, nausea, vomiting,
fever, leucopenia, and elevation of liver enzymes.(51) The echinocandins have
few drug interactions as they are not substantial substrates, inhibitors, or inducers
of the cytochrome P450 enzymes or P-glycoprotein transporters.(52) They are

9
degraded by hydrolysis, N-acetylation, and slow chemical degradation to inactive
metabolites in the liver and bile.(53,54)
Echinocandins rapidly distribute into tissues such as lung, liver, kidney,
spleen, and white blood cells, but have little distribution in cerebrospinal or
vitreous fluids.(55-57) Plasma concentrations quickly decline following
administration but these agents are excreted essentially unchanged.(54,55,58)
With an initial loading dose of 70 mg of CASPO, peak plasma concentrations
reach 11-12 mg/L; plasma levels and clearance of CASPO are determined by the
rate of re-distribution from tissues.(54) Echinocandins are highly protein bound
(>99%), and a portion of the drug bound to proteins may be irreversible; the
percent of unbound CASPO concentrations is only 3.5% of the peak plasma
concentration.(54)
Echinocandins have long half lives and can persist in tissue long after
plasma levels decline.(59) The effect of drug persisting in tissues is still under
investigation, as organs seem to act as drug release reservoirs, which may affect
efficacy and dosing requirements. The effect of extensive protein binding is also
unknown; while it may limit the amount of available active drug, there are other
antifungal drugs that are highly protein bound, such as amphotericin B and
itraconazole, that are effective in treating fungal infections.(39) In vitro studies
have demonstrated extensive concentration dependent post-antifungal effects
(PAFE) where growth inhibition is maintained after short exposure and removal
of drug.(60-63) These effects are likely due to prolonged direct interactions with
GS.(64) The effect of extensive protein binding on drug efficacy is unknown, and

10
it will be important to determine the drug-GS and drug-tissue affinity to fully
understand the in vivo consequences of protein binding on echinocandin efficacy.
1.2.2. Glucan Synthase
1.2.2.1. The yeast cell wall
The cell wall is the outermost layer of fungi that provides structural
support and environmental protection, and functions in cell morphogenesis and
cell-cell recognition.(65) The cell wall provides a mechanical barrier against
excessive stretch of the plasma membrane, preventing cell lysis from an ever-
changing environment. The cell wall is freely permeable to small molecules,
allowing interaction of nutrients and signaling molecules to interact with receptors
and transporters at the plasma membrane.(66) Adaptation of the fungal cell wall
contributes to the persistence of these organisms as infectious agents.
The major components of fungal cell walls vary by species but consist
mainly of glucans, chitin, and mannoproteins.(Figure 1.2) Electron micrographs
of yeast cell walls demonstrated two distinct layers: an inner electron transparent
layer consisting mainly of glucans, and an outer electron dense layer consisting
mainly of mannoproteins.(67) 1,3-!-glucans are an integral part of the yeast cell
wall, making up 35% of the dry cell weight; it consists of long linear fibrils
averaging 60 glucose residues that are only soluble in alkali.(68,69) A smaller
fraction of 1,3-!-glucan is branched with 1,6-!-glucans or chitin; this glucan
network provides the framework for attachment of glycosylphosphatidylinsitol
(GPI) and Pir proteins (proteins with internal repeats) to the cell wall.(70,71) O-
11
and N-linked manno-oligosaccharides (mannoproteins) make up the majority of
the external cell wall layer attached to either the branched glucans or the plasma
membrane.(67) Most of the cell wall proteins are hydrolytic enzymes, agglutinins,
or are structural components of the cell wall.(72)
The composition of the cell wall varies between fungal species and
reproductive states. For example, 1,3-!-glucans are only present in the
sporangiospore of zygomycetes and Schizosaccharomyces pombe lacks chitin in
vegetative cell walls.(73-75) However, the general structural components of
glucans, chitin, and mannoproteins are consistent among medically important
fungi, making the fungal cell wall a desirable target for antifungal drugs.
1.2.2.2. Glucan synthase is the target of echinocandins
Actively dividing cells treated with echinocandins are unable to
incorporate 1,3-!-glucans into the cell wall, resulting in altered cell wall
mechanical properties with increased susceptibility to osmotic forces(76,77) The
GS enzyme complex was discovered to consist of a membrane bound putative
catalytic subunit (Fks1p) and a soluble regulatory component (Rho1p) through
partial purification by product entrapment.(78) Due to the size and complexity of
the enzyme complex, the requirement of other proteins in the enzyme complex
cannot be excluded, as GS has only been partially purified from crude membrane
preparations.
Echinocandins bind to and inhibit GS, demonstrated by direct interaction
of photoactivated echinocandin analogs with GS in crude plasma membrane
12
preparations of Saccharomyces cerevisiae.(79) The drug’s interaction with GS
requires both the hexapeptide core structure and the lipophilic side chain(80);
variation in these components between echinocandins and echinocandin
derivatives accounts for the differences in potency.(81) Topological modeling of
Fks1p suggests a model where the hexapeptide core binds exterior to the cell
membrane to a single domain comprised of the three “hot-spot” regions, while the
lipid tail interacts with the plasma membrane.(Figure 1.3)(82-84)
1.2.2.3. Fks1p
The catalytic subunit Fks1p (FK506 sensitivity protein) was first
discovered through mutant studies with altered sensitivities to FK506
(tacrolimus), cyclosporine A, calcofluor white, echinocandin B, and papulacandin
B in the model yeast S. cerevisiae; FKS1 is also known as calcineurin dependent
protein 1 (CND1), calcofluor white hypersensitivity protein 53 (CWH53),
echinocandin target protein 1 (ETG1), glucan synthase of cerevisiae protein 1
(GSC1), and papulacandin B resistance protein 1 (PBR1).(85,86) S. cerevisiae has
three highly similar FKS genes involved in glucan synthesis that are differentially
expressed: FKS1 expression is induced during cell wall remodeling and is cell
cycle regulated during vegetative growth;(47,87) FKS2 expression is calcineurin
dependent and is induced during sporulation, starvation, and in response to mating
pheromones;(88) and FKS3 expression is required for regulation of spore wall
formation.(89) Fks1p and Fks2p are two distinct subunits with some overlapping
function, as null mutants in either gene are not lethal and over-expression of either

13
can modulate the mutation effects. The function of Fks1p and Fks2p is essential,
as !fks1!fks2 mutants are not viable.(88) The function of Fks3p is unknown but
appears to be distinct from Fks1p and Fks2p; deletion of FKS3 results in
abnormal spore formation that is not rescued by over expression of either FKS1 or
FKS2.(89) Most yeast, including C. albicans, contain multiple FKS genes, while
most filamentous fungi contain only a single FKS gene.(90,91) All single copy
FKS genes appear to be essential for viability.(92-96) The significance of multiple
versus single copy FKS genes in GS function and regulation is unknown.
S. cerevisiae Fks1p is a large plasma membrane protein consisting of 1876
amino acids with 16 predicted and 13 experimentally confirmed transmembrane
regions.(82) Based on sequence similarities and enzyme kinetics, Fks1p is
classified as glycosyltransferase (GT) family 48 in the Carbohydrate Active
enZYmes (CAZY) database.(97) Its systematic name (UDP-glucose:(1"3)-#-D-
glucan 3-#-D-glucosyltransferase, EC 2.4.1.34) is descriptive of its catalytic
mechanism for the addition of a donor uridine diphosphate glucose (UDP-Glc) to
an acceptor glucose.(98) Direct binding of UDP-Glc as the donor substrate to
Fks1p was demonstrated in Neurospora crassa(95); Fks1p is tightly bound to its
1,3-!-glucan products in the presence of UDP-Glc and rapidly dissociates from it
in the absence of UDP-Glc, thus allowing partial purification through product
entrapment.(99) Fks1p is unique among GTs as it lacks any known UDP-Glc
binding domains that are conserved in other UDP-Glc utilizing GTs, including
cellulose, chitin, and glycogen synthases.(100,101) Large scale analysis of protein
interactions demonstrates that GS does not associate with any known transporters
14
of sugars(102), and it is assumed that Fks1p is responsible for both the production
of 1,3-!-glucans and its transport through the plasma membrane.(103,104)
The fungal cell wall is exposed to a variety of constantly changing
environmental stimuli and stressors that have led fungal cell wall proteins to
evolve faster than proteins involved in other cell processes, such as
metabolism.(105) The few highly conserved cell wall proteins are related to cell
wall biogenesis, including Fks1p, which is indicative of the importance of cell
wall construction in the evolution of fungi. A phylogenetic review of fungal cell
wall proteins conducted by Ruiz-Herrera et al. described the acquisition of the
FKS genes by horizontal gene transfer from an ancestor common to plants before
the separation of Ascomycota and Basidiomycota from the other phyla in
kingdom Fungi.(73) However, the high conservation of cell wall components and
sequence similarity of GS across phyla suggests that a single evolutionary gain in
a universal common ancestor is more likely to explain the evolution of GS.
GS localizes to bud sites and areas of active cell wall remodeling to
maintain a uniform cell wall, which is important for maintenance of cell size,
shape, and morphogenesis.(106) In addition to production of cell wall 1,3-!-
glucan, Fks1p may be involved in other cellular functions: deletion of FKS1
results in multiple cellular effects, including alterations of 1,6-!-glucan,
mannoprotein, and chitin contents of the cell wall(104); and mutation of Fks1p
domains results in alterations to cell wall construction, endocytosis, and
regulation of cell polarity.(107) It is unknown whether Fks1p plays an active role
in the formation of other cell wall components or in other cellular pathways, as
15
the effects of deletion and mutational studies could result from protein
interactions, unknown regulatory mechanisms, or a general stress response.
The significance of potential additional functions of Fks1p is unknown,
but the different effects of GS inhibitors in different fungi suggest that these
functions, or other unknown functions, significantly contribute to cell viability
and drug tolerance. Papulocandin, also an inhibitor of GS, inhibits in vitro growth
of S. cerevisiae, yet has little activity against partially purified GS(108); it is
unknown whether papulocandin has some other unknown cellular effect, or if GS
has other functions that were not evaluated by these experiments. Echinocandins
exhibit an opposite effect in C. neoformans as they have very little inhibitory
effects on in vitro growth yet the catalytic activity of isolated GS is inhibited by
concentrations of CASPO considered within the therapeutic range of susceptible
organisms.(109) Most studies evaluate echinocandin effects by measuring enzyme
kinetics of GS from isolated plasma membranes and inhibition of growth, neither
of which identifies other cellular effects. The evaluation of additional Fks1p
functions in echinocandin tolerance will be important to fully understand the
effects of echinocandins in clinical therapy of fungal infections.
1.2.2.4. Rho1p
The GS subunit Rho1p (Ras homolog 1) was established to be the
regulatory component through product entrapment, co-immunoprecipitation, 1,3-
!-glucan biosynthesis assays, and the rescue of glucan synthesis deficiencies with
recombinant Rho1p.(110,111) It is one of six Rho GTPases found in the model
16
yeast S. cerevisiae, all functioning in establishing cell polarity.(85) Rho proteins
are highly conserved in eukaryotes, functioning as pathway regulators through
highly conserved protein sequences for guanosine triphosphate (GTP) binding and
localization to the plasma membrane.(112)
Rho1p undergoes conformational changes in its transition to an active
state; it is inactive when bound to guanosine diphostate (GDP) and activated by
binding GTP. The GDP/GTP exchange is regulated by interaction with guanine
nucleotide exchange factors (GEFs) and GTPase activating proteins (GAPs) that
stimulate the release of GDP and GTP, respectively.(113) Once activated, Rho1p
elicits its cellular effects by activating effector proteins and their subsequent
functional pathways; effectors of Rho1p include Pkc1p (Protein Kinase C1),
Bni1p (Bud Neck Involved, also known as formin), Sec3p (Secretory), Skn7p
(Suppressor of Kre Null), and Fks1p.(85) Rho1p is essential for viability as it is a
significant mediator of polarized cell growth through the regulation of glucan
synthesis, cell polarity, and the cell wall integrity (CWI) pathways.(Figure
1.4)(112)
Rho1p is the cytoplasmic GS regulatory protein that when associated with
GTP regulate the localization of and activates the membrane bound Fks1p, and
induces the transcription of FKS1/FKS2 genes.(110,114) Fks1p and Rho1p are
transported to the plasma membrane in secretory vesicles, and co-localize to sites
of active growth corresponding to active bud sites.(106,115) The involvement of
Rho1p in the glucan synthase complex is dependent on the post-translational
modification to the C-terminus of Rho1p with a lipophilic geranylgeranyl
17
isoprene. This modification acts as a lipid anchor to the plasma membrane and is
required for both association with and activation of Fks1p.(116) Cell growth, cell
wall stress, and growth on nonfermentable carbon sources induces the activation
of Rho1p via PAS kinase (Psk1p) signaling causing glucose to be partitioned for
cell wall glucan production over other cellular processes utilizing UDP-Glc, such
as glycogen synthesis.(117)
Cell polarity is the asymmetric organization of cellular components to
facilitate mating, morphogenesis, and proliferation.(118) This tightly regulated
process involves the signaling and activation of the cytoskeleton, allowing the
asymmetric redistribution of cellular components to allow for growth. In addition
to regulating glucan synthesis to accommodate cell wall growth, Rho1p regulates
cell polarity by activating proteins involved in the actin cytoskeleton. Bni1p
assembles linear actin cables necessary for actin cytoskeleton remodeling; the
precise role of Pkc1p in actin organization is unknown, but is implicated in actin
and microtubule organization.(119)
Polarized cell growth involves remodeling of the cell wall and plasma
membrane, requiring the secretory pathway to transport cell wall digestive
enzymes and new membranes to cell surface growth sites.(120) Rho1p is required
for the polarized localization of Sec3p and exocyst formation, a protein complex
that facilitates vesicle trafficking.(121). While the interaction of Rho1p with
Sec3p is independent of the actin cytoskeleton, Rho1p also acts indirectly on the
exocyst through interaction with Pck1p and Bni1p, as it requires the intact
organization of actin cables for delivery of the exocyst to the cell surface.(122)

18
Endocytosis is the process by which the plasma membrane is internalized
to create a vesicle and internalize material outside of the cell that is unable to pass
freely through the plasma membrane. While the direct function of endocytosis in
polarized cell growth has yet to be determined, there are strong phenotypic
correlations in mutants defective in endocytosis and in actin cortical patch
organization.(122) It is suggested cells change the rate of endocytosis to
accommodate changes in cell volume during polarized cell growth.(123) Rho1p
and Fks1p are implicated in controlling the internalization step of endocytosis
through Tor2p (Target of Rapamycin) in S. cerevisiae.(124) This role of Rho1p
and Fks1p is unaffected by absence of a cell wall or other Rho1p effector
pathways, suggesting this function is independent of the other known functions of
Rho1p and Fks1p. Rho1p also promotes endocytosis through interactions with
Bni1p in an alternative endocytic pathway when the normal endocytic machinery
is impaired.(125) It is unknown under which conditions this alternative pathway is
utilized, but may be required for as yet undetermined cargo or in response to
specific cell stress.
Cell stress from polarized growth, changing environmental stimuli, and
mating is managed by the CWI pathway regulated by Rho1p.(126) The CWI
pathway is one of four mitogen activated protein kinase (MAPK) pathways in
yeast characterized by a phosphorylation cascade that transmits signals from
the plasma membrane to the nucleus.(85) Pkc1p is activated by
phosphatidylserine when associated with GTP-bound Rho1p.(127) Activated
Pkc1p initiates the phosphorylation cascade, stimulating transcription
19
regulators for cell wall synthesis and cell cycle-dependent cell wall synthesis
genes. In addition to the activation of Pkc1p, Rho1p also activates the
transcriptional regulator Skn7, which initializes the transcription of genes
involved in cell integrity and oxidative stress.(128) While mostly evaluated for
maintaining cell wall integrity in response to stress, the CWI pathway has been
implicated in oxidative, pH, and DNA stress in S. cerevisiae, and in nutritional
stress in S. pombe.(129-132)
In addition to the well-established functions associated with polarized
growth and cell integrity, Rho1p has been implicated in a number of additional
cellular processes. Rho1p is involved in cytokinesis by promoting the
cytokinetic actomyosin ring assembly, as well as septum formation and
dissolution through its regulation of glucan synthesis, secretion, and actin
organization.(133) Rho1p has recently been shown to activate Ycf1p (Yeast
cadmium factor), a vacuolar transporter involved in oxidative stress.(134) Most
recently, Rho1p is implicated as the regulator of a membrane fluidity
homeostasis pathway, a potentially new MAPK pathway involving similar
components of the CWI pathway.(135) The multitude of cell functions Rho1p
participates in highlights its essentiality, but several questions remain
regarding how specific Rho1p effectors are targeted.
The regulation of Rho1p effector proteins is determined by the
appropriate function, localization, and activation of Rho1p by GEFs and GAPs.
The Rho1p GEFs include Tus1p (TOR Unique function Suppressor) and Rom2
(RhO1 Multicopy suppressor); they activate and recruit Rho1p to the plasma

20
membrane, bud tip, and site of cytokinesis.(113,133) The Rho1p GAPs include
Sac7p (Suppressor of Actin), Bag7p (paralog of Sac7) Bem2p (Bud
Emergence), and Lrg1p (Lim-Rho Gap homolog).(85) It is unknown how the
GEFs and GAPs achieve specificity in their regulation of Rho1p effector
pathways, since different GAPs and GEFs affect different Rho1p effectors. For
example, Rom2p can be activated by Tor2p in S. cerevisiae, affecting actin
organization but not glucan synthesis.(136) It may be that the activation or
inhibition of specific Rho1p effector pathways is dependent on unknown
mechanisms of localizing Rho1p, such as through as yet unknown protein
partners.
1.2.3. Spectrum of activity
Echinocandins are fungicidal against Candida species, including: C.
albicans, C. parapsilosis, C. tropicalis, C. glabrata, C. krusei, C. guilliermondii,
and C. lusitaniae.(51,137,138) Ultrastructural analysis of cells treated with
inhibitory concentrations of CASPO demonstrated the absence of bud scars,
wrinkling, and severe lesions resulting in the release of cellular contents.(139) In
vivo models show echinocandins to be effective in the treatment of azole resistant
Candida spp., and treatment of invasive candidiasis with CASPO demonstrated
success rates of >70%.(51) CASPO is comparable to treatment with amphotericin
B liposomal therapy for empirical therapy in persistent febrile
neutropenia.(44,140)
21
Echinocandins are primarily fungistatic against Aspergillus spp. as the
active incorporation of 1,3-!-glucans by GS occurs at the apical tips of growing
hyphae. In vitro growth assays demonstrate reduced growth but incomplete killing
of Aspergillus cells, which are characterized by swollen, truncated hyphal tips yet
unchanged hyphal bases.(141) CASPO demonstrates some fungicidal activity as
increased cell lysis is seen with microcolony analysis.(142) In vivo data indicates
that echinocandins may be as effective as amphotericin B in reducing fungal
burdens and increasing survival times, and are effective in the treatment of
invasive aspergillosis.(143-145)
Most fungi contain some amount of 1,3-!-glucans in their cell wall, yet
despite the presence of 1,3-!-glucans and GS, many fungi remain resistant to
echinocandins. They have little in vitro activity against Cryptococcus, Fusarium,
Rhizopus, Paecilomyces, and Scedosporium spp.(146-149) Despite having in vitro
activity against the filamentous forms of the dimorphic fungi Histoplasma
capsulatum and Blastomyces dermatitidis, echinocandins are ineffective in
vivo.(150-152)
1.2.4. Echinocandin resistance
1.2.4.1. Intrinsic resistance
The echinocandins have little activity against Cryptococcus spp.(148)
FKS1 is an essential gene in C. neoformans and demonstrates high sequence
similarity with fungi susceptible to echinocandins.(92) Analysis of the cell wall
demonstrated the presence of both 1,3- and 1,6-!-glucans in the cryptococcal cell

22
wall and their subsequent depletion with caspofungin treatment.(153) It has also
been shown that anti-!-glucan antibodies inhibit in vitro growth of C. neoformans
and may confer protection in vivo, demonstrating the essential nature of !-glucans
in the cell wall.(154)
The two important virulence factors for Cryptococcus spp. are its
substantial polysaccharide capsule and melanin production.(155) C. neoformans
GS isolated from plasma membranes is inhibited by CASPO, while whole cells
remain resistant in both capsular and acapsular isolates, which suggests that the
capsule is not a barrier to echinocandin penetration to GS.(109) Melanin has been
shown to bind CASPO(156), but the effects of melanization and binding of
CASPO does not fully resolve the discrepancy with in vitro susceptibility profiles
between Cryptococcus spp. as not all Cryptococcus isolates produce melanin yet
all isolates are resistant to echinocandins. These data suggest there may be other
unknown mechanistic features of GS that render Cryptococcus spp. (and other
fungi) intrinsically resistant to echinocandins.
1.2.4.2. Acquired Resistance
Even with the increasing use of echinocandins since the introduction of
CASPO in 2001, acquired resistance remains rare.(157) Acquired echinocandin
resistance is associated with amino acid mutations in three specific “hot-spot”
regions of that map to the S. cerevisiae Fks1p at amino acids 635-649 (HS1),
1354-1361 (HS2), and 690-700 (HS3). (Figure 1.3) FKS mutants in yeast
demonstrate cross-resistance to all echinocandins, reduced in vitro susceptibility
23
profiles, and an increased kinetic inhibition constant of partially purified
GS.(158,159) Despite reduced in vitro susceptibilities of FKS mutants, different
in vivo models have demonstrated contrasting results. A significantly higher
effective dose was required for spontaneous clinical Fks1p mutants in a murine
model of disseminated candidiasis(160), yet laboratory derived Fks1p mutants
have been shown to be less virulent than wild type measured in toll-deficient
Drosophila melanogaster flies and a different murine model of disseminated
candidiasis.(161) Monitoring emerging mutant populations and clinical outcomes
from echinocandin therapies is needed to determine the significance of acquired
Fks1p mutants in clinical and laboratory strains.
Some Candida spp., including C. parapsilosis, C. orthopsilosis, and C.
metapsilosis, demonstrate elevated MIC values and have an intrinsic Fks1p
P647A (HS1) mutation resulting in decreased enzyme sensitivity to
echinocandins.(162) Despite the increased MICs, clinical outcomes with these
Candida spp. are comparable to C. albicans.(51) This discrepancy between in
vitro and in vivo data challenges the clinical significance of Fks1p mutations in
echinocandin therapy.
1.2.5. Susceptibility testing and clinical breakpoints
Evaluation of susceptibility to echinocandins is determined by minimum
inhibitory concentration (MIC) by broth microdilution assays as outlined by the
Clinical Laboratory Standards Institute (CLSI) and the European Committee on
Antimicrobial Susceptibility Testing (EUCAST).(163-165) Both reference

24
methods use serial dilutions of echinocandin concentrations in Roswell Park
Memorial Institute (RPMI) 1640 broth as the testing medium, assay interpretation
at 24 hours incubation, and define the MIC as the lowest concentration which
demonstrates a prominent (50%) decrease in turbidity. The methods differ in
inoculum density (103 CLSI, 105 EUCAST), medium glucose content (0.2%
CLSI, 2% EUCAST), microdilution plates (round-bottom with CLSI, flat-bottom
with EUCAST), and method of endpoint evaluation (visual reading with CLSI,
spectrophotometric with EUCAST). Comparison of the two reference methods
with yeast demonstrates >90% essential agreement for most species.(164)
Reports of clinical failures are uncommon and acquired resistance to
echinocandins remains rare. However, due to the increasing awareness and
reporting of Fks1p mutations, clinical breakpoints to detect non-susceptible
strains have been established for the CLSI reference method that incorporate
molecular and MIC data.(166) (Table 1.2) Clinical breakpoints from MIC testing
are set to define susceptible isolates as those with an increased likelihood of
therapeutic success; while the significance of Fks1p mutations are unknown, the
current guidelines are set to help detect mutants in MIC testing.
1.3. The paradoxical growth effect
1.3.1. Incidence
In vitro susceptibility testing by broth microdilution of echinocandins has
revealed a paradoxical growth (PG) effect in which there is reduced fungal killing
at concentrations well above the MIC of susceptible isolates that is not observed

25
with any other antifungals.(167) The PG effect is distinct from other growth
phenotypes demonstrating growth above MIC concentrations, such as the trailing
effect or resistance: the PG effect is defined as the re-emergence of strong growth
in consecutive wells that is !2 drug dilutions above the MIC after 48 hr; the
trailing effect is persistent but notably reduced growth in drug concentrations
above a defined MIC; and resistance is the persistent growth in drug
concentrations resulting in an elevated MIC and designation of the isolate as non-
susceptible.(168,169)
The frequency of the PG effect varies within and between different
Candida species, as well as between the echinocandin drugs.(168) The PG effect
has been reported to be as frequent as 14-40% in Candida spp., occurring most
frequently with C. dubliensis, C. parapsilosis, and C. albicans treated with
caspofungin, micafungin, and anidulafungin, respectively.(167,169,170) The PG
effect is notably absent from all C. glabrata isolates.(169) All isolates
demonstrated the PG effect more frequently and over a wider range of drug
concentrations when grown as biofilms than when grown as blastospores.(168)
The differences in drug structure (and thereby interaction with cells) and the
different properties between biofilms and yeast within different species and
strains is assumed to play a role in the mechanism of the PG effect.
Animal models of different invasive fungal infections have demonstrated
an in vivo PG effect, but these reports have been inconsistent and not reproducible
in duplicate experiments.(171-173) In vivo model outcomes are generally
measured by tissue fungal burden and survival rates, and higher doses of
26
caspofungin have demonstrated increased tissue burdens while not significantly
affecting the overall survival rates. The lack of substantial experimental evidence
from in vivo models has led many to assume the PG effect is a limited in vitro
phenomenon. However, the complexity and progression of human disease is not
always well represented by acute infectious animal models, especially when the
outcome of human disease should consider the disease severity, duration, and
complications rather than rely solely on survival rates. The potential for and
significance of the PG effect during the course of echinocandin therapy warrants
further investigation as it could have a significant impact on disease outcome and
antifungal therapy.
Different growth media influence the frequency and severity of the PG
effect. Stevens et al demonstrated less pronounced PG with Synthetic Amino Acid
Medium Fungi (SAAMF), RPMI, and yeast nitrogen broth (YNB),
respectively.(167) These media vary in the type and concentration of
supplemented nutrients, amino acids, and carbon sources. While it has been
determined that different glucose concentrations in RPMI 1640 does not affect
MIC testing(174), other media conditions can affect susceptibility of fungi to
echinocandins.(175) Growth nutrients have been shown to affect cell wall
composition, antifungal susceptibilities, and resistance to oxidative
stress.(176,177) The significance of media components on the frequency and
severity of the PG effect warrants further investigation.
1.3.2. Cellular characteristics
27
There are several morphological features of yeast at PG concentrations
with echinocandins that may be indicative of its mechanism.(Figure 1.5) Yeast
treated with CASPO at PG concentrations demonstrate highly aggregated yeast
absent of filamentation, with abnormal budding and often incomplete separation
of progeny cells.(178) Composition of PG cell walls demonstrate a significant
decrease in 1,3- and 1,6-!-glucans by 81% and 73%, respectively, as well as a
significant 8-fold increase in chitin.(178,179)
1.3.3. Potential mechanisms
The morphological features of PG cells are similar to those of resistant
cells, which also demonstrate increased levels of cell wall chitin.(180,181)
Despite the similar morphological features, there are differences in broth
microdilution growth patterns and MICs between resistant and PG yeast.
Assuming that increased cell wall chitin is responsible for resistance and PG
oversimplifies the cellular processes involved in persistence of growth under a
multitude of conditions and treatments.
The first investigations into the mechanisms for PG involved the drug
quality and changes to GS. It was determined that the concentrations of CASPO
over a 24 hour incubation were stable, and there was no degradation of drug by
yeast.(167,182) There is no relationship between MIC and incidence of PG(169),
and subsequent testing of PG cell progeny demonstrates a reproducible
effect.(167,182) PG cells demonstrate a decrease in GS activity and the
significant inhibition of glucan production by echinocandins is evidence that up-

28
regulation of GS is unlikely to be the underlying cause for the PG. The decrease
in GS activity is similar to non-susceptible strains with Fks1p mutations, though
no mutations in HS1 or HS2 of Fks1p correlate with the PG effect.(183) The hot
spot regions of Fks1p only comprise 150 amino acids of a total of ~1800 amino
acids. With a protein of this size and complexity, full sequence analysis may
warrant further investigation, as mutations may arise affecting protein function
without affecting the echinocandin binding site at HS1 or HS2. Also, the role of
Rho1p in the PG effect has not been investigated; given that Rho1p has regulatory
roles in a multitude of cellular functions, including stress response pathways, it is
highly plausible that it could play an important role in mediating growth above
MIC concentrations.
The genetic relatedness of C. albicans isolates demonstrating the PG
effect was conducted by microsatellite analysis of three loci.(184) The authors
concluded that there is no significant population structure associated with the
incidence of PG, and the trait allowing such growth was gained or lost too rapidly
to detect by the stable genetic markers used in multilocus microsatellite typing.
However, the study drew conclusions based on a combination of isolates
demonstrating the PG and trailing effects and assumed these traits are found in the
same populations. Since the mechanisms for these growth phenotypes are
unknown, it cannot be assumed that they are the same. Microsatellite typing is
useful for population genetics as it provides fast, reproducible data for high
throughput studies; however, microsatellite analysis of these loci has proven to be
less accurate than multilocus sequence typing.(185) As a result, this study lacked
29
an appropriate stratification of populations for analysis, insufficient power due to
a low sample size (4 PG isolates), and potentially insufficient discriminatory
power of the microsatellite markers used. Further investigation into the population
structure by MLST may detect differences in sequence types between
echinocandin susceptible and PG isolates.
The relationships of PAFEs and the PG effect were investigated to
determine the significance of a brief exposure to CASPO, using concentrations
similar to those achieved at peak levels in vivo.(64) This study described
enhanced killing by PAFEs and the elimination of the PG effect after short
exposures (<15 minutes). The authors argued that the PG effect would only be
clinically relevant if high concentrations were maintained throughout treatment,
which at current doses is unachievable. Although this may be true for plasma
levels, the high sequestration of echinocandins in tissues at concentrations in
which the PG effect is achievable in vitro has not been taken into consideration.
The effect of protein binding on the activity of echinocandins is unknown
and has been investigated in vitro by adding human serum to susceptibility testing
media. Shields et al evaluated the effect of human serum on MIC and PG(186);
the addition of 10% human serum had no affect on MIC values but increased the
median concentration at which PG occurs varies from 2 to 32 mg/L, while the
addition of 50% serum increased MIC values 2-fold and eliminated the PG effect
in concentrations up to 64 mg/L. These results are similar to others including 10%
serum demonstrating an increase in MIC value up to 4-fold.(167) The changes to
MIC and PG concentrations with the addition of serum indicate there may be less

30
available active drug, thereby requiring more drug to elicit the same effects. It is
plausible that the echinocandin concentration range tested was insufficient to
determine whether the PG effect was truly eliminated by human serum or whether
these concentration ranges are were high enough to detect an increase
concetration required to elicit the PG effect, similar to increased MICs with the
addition of serum.
Cell wall damage caused by echinocandins induces highly conserved
stress response pathways including the CWI, high osmolarity glycerol (HOG) and
calcineurin pathways. (Figure 1.6) The heat shock protein 90 (Hsp90p) is a
molecular chaperone that stabilizes the structure and function of proteins in the
stress pathways including calcineurin and Mkc1p (mitogen activated protein of C.
albicans) of the CWI pathway.(187) Null mutants of Mkc1p and chemical
inhibition of calcineurin or Hsp90p significantly reduced growth of C. albicans at
PG concentrations of CASPO.(188,189) These pathways are also necessary for
survival at elevated echinocandin concentrations(190,191), but it is not known
whether these pathways are sufficient to account for the PG effect.
1.4. Clinical significance
The clinical significance of the PG effect has been deemed questionable
as PG isolates have clear MIC values that fall within the susceptible range, animal
models are inconclusive, and it is debatable whether plasma concentrations are
maintained high enough for PG to occur in vivo. The PG effect has not been
demonstrated clinically, and it is recommended that this effect be ignored in
31
evaluating echinocandin MICs.(192) However, the possibility of persistent growth
at elevated echinocandin concentrations poses a potentially significant drawback
to a drug class that is otherwise assumed safe and effective for IFIs, and further in
vitro study of this phenomenon may help determine its significance to treatment
failure.
Due to the low toxicity of echinocandins compared to other antifungals,
dose escalation studies are being evaluated for safety and efficacy in the treatment
of IFIs. In doses as high as 150 mg daily, no significant differences in therapeutic
response are observed between the current standard- and high-dose.(193,194)
High doses of CASPO of 150 and 210 mg daily demonstrate higher peak plasma
concentrations of 29.4 and 33.5 mg/L(195), concentrations at which PG is known
to occur in vitro. The higher doses are safe and have similar pharmacokinetics to
standard doses(196), so is an attractive option in the hopes of increasing efficacy,
but it remains unclear whether dose escalation truly improves clinical outcomes.
In addition to the potential for treatment failure if the PG effect occurred in vivo,
the physiological characteristics of yeast grown at PG concentrations, such as
altered cell wall components or increased aggregation, could have significant
impacts on infection establishment, host immune recognition, effectiveness of
concomitant therapy, and diagnostic or prognostic markers.
The stages of biofilm formation involve fungal attachment to a surface,
microcolony formation, and the development of an extracellular matrix.(26) There
is a higher incidence of the PG effect tested against fully formed biofilms in vitro,
but it has not been considered whether the increased cellular aggregation or cell-
32
cell adhesion associated with PG yeast could increase the likelihood of biofilm
development after exposure to PG concentrations of echinocandins. CASPO at or
below the MIC decreases adherence of C. albicans to plastic surfaces(197), but
the adherence properties to abiotic surfaces has not been investigated for PG
concentrations.
The host immune response generated by IFIs is largely mediated by the
fungal cell wall. Immune cells recognize and bind fungal 1,3-!-glucans by the
dectin-1 receptor on the surface of neutrophils and macrophages., resulting in the
phagocytosis and elimination from the host.(198) Control of infections via dectin-
1 is strain dependent in C. albicans(199). Chitin may interfere with immune
recognition of fungi by blocking dectin-1 recognition of fungal cells.(200) Sub-
therapeutic doses of CASPO enhances the exposure of cell wall !-glucans,
thereby enhancing immune recognition of yeast in vivo and rendering C. albicans
more susceptible to the host immune system.(201) However, it has not been
investigated how cell wall alterations, such as the decreased glucan and increased
chitin in PG cells, affects this influence of echinocandins on host response.
Moreover, C. albicans isolates with increased cell wall chitin are less susceptible
to echinocandins both in vitro and in vivo.(180)
Fungal cell wall components can adapt to the stress of antifungal
treatment, as well as from nutrient availability and other environmental signals.
Different host niches often differ in nutrient availability which can modulate the
cell wall, potentially altering its response to stress or host immune cells.(202) The
difference in the PG frequency in different media could be due to the different

33
supplemented nutrients. The differences in host niches and potential nutrient
influences on the PG effect may also contribute to the inconsistency of the PG
effect in animal models. The PG effect has been demonstrated inconsistently in
Candida spp. blood stream infections(171-173), while the PG is more consistently
observed in an invasive pulmonary aspergillosis model by measuring
inflammatory responses.(203) It could be that differences in the animal models
used between species can account for the incidence discrepancy of the PG effect
between in vivo and in vitro experiments.
Due to the high mortality of Candida infections, sensitive and timely
diagnostics are required for the most favorable therapeutic outcomes. A newer
method for detecting IFIs measures serum 1,3-!-glucan levels; while this method
will likely never be used alone in fungal diagnostics, it can give an earlier
indication of an IFI before cultures, which often require several days for
detection.(204) Glucans may also be a useful prognostic marker in response to
echinocandin therapy, as a decrease in 1,3-!-glucan levels strongly correlates with
a positive response to therapy.(205) If the PG effect could occur in vivo, the use
of 1,3-!-glucan in diagnostics would likely be impair the detection given the
characteristic cell wall changes associated with the PG effect.
A major drawback to the current echinocandin research is that the majority
of experiments are conducted at sub-inhibitory concentrations and do not consider
the PG effect. As such, the data cannot be extrapolated to yeast grown at PG
concentrations, as there is likely a physiological difference (as evidenced by
morphological differences) that allows yeast to grow at elevated echinocandin
34
concentrations. Regardless of the potential for PG in vivo, further understanding
of the influence of media on antifungal response, and cell wall stress responses
has the potential to identify possible compensatory mechanisms contributing to
persistent growth that could be used to identify new antifungal targets or enhance
those drugs already in use.
1.5. Research objectives
There remains several anomalies regarding the activity of echinocandins,
most notably, the PG effect in susceptible Candida spp. and the intrinsic
resistance of many fungi despite high similarity in the target protein GS. There is
little evidence for or against a similar cellular mechanism for PG and intrinsic
resistance, and there is no consensus among echinocandin researchers as to the
significance of the PG effect or its potential to contribute to treatment failure.
Further investigation into the cellular effects of echinocandins at elevated
concentrations is essential to determine its potential to occur in vivo.
1. Identify PG positive C. albicans isolates among a clinical collection.
2. Evaluate the influence of inoculum density on the PG effect.
3. Reconstruct the evolutionary history of GS in medically important fungi.
4. Correlate GS sequence with CASPO MIC.
5. Understand the relationship between cellular morphology and PG.
6. Determine the effect of medium carbon source on PG effect.

35
This research describes my investigation into the cellular effects of C.
albicans exposed to CASPO. I chose to use CASPO as it was the first
echinocandin to be approved for clinical use, thus has been used in the majority of
the echinocandin research; likewise, C. albicans was utilized as a large portion of
the previous research has utilized this clinically significant yeast as a model to
study the effects of echinocandins.

36
Table 1.1. Antifungal therapy. Summary of mechanisms, efficacy, and resistance of antifungal therapy.(33,206)
Drug class
Polyenes
Azoles
Pyrimidine analogues
Echinocandins
Antifungal
Amphotericin B Nystatin
Fluconazole Itraconazole Voriconazole Ketoconazole Posaconazole
Flucytosine Caspofungin Micafungin Anidulafungin
Putative mechanism of action
Disrupts plasma membrane stability by directly binding ergosterol, causing cell leakage and lysis
Inhibits lanosterol 1,4-a-demethylase (ERG11) in ergosterol biosynthesis, leads to accumulation of toxic sterol intermediates and affects plasma membrane integrity
Interferes with pyrimidine metabolism (DNA/RNA synthesis) and protein synthesis
Inhibition of 1,3-!-glucan synthesis
Spectrum of activity
Candida spp., Aspergillus spp., C. neoformans, Zygomycetes, dimorphic fungi, some dematiaceous fungi
Candida spp., Aspergillus spp., C. neoformans, dimorphic fungi
Candida spp. and C. neoformans
Candida and Aspergillus spp.
Resistance: mechanisms and frequency
Intrinsic resistance: C. lusitaniae, C. guillermondii
Increasing resistance with widespread use due to: target (ERG11) mutations and upregulation; upregulation of efflux pumps Little activity against C. krusei, C. glabrata
High prevalence of acquired resistance due to: increased synthesis of pyrimidines out-compete flucytosine; decreased cellular uptake.
Target mutations: Glucan synthase (Fks1p, Fks2p) mutations. Resistance is uncommon.
Safety, efficacy
Binds sterols of mammalian cells, resulting in toxicity. Severe side effects: nephrotoxicity, infusional toxicity
Inhibit cytochrome P450, potential for drug interactions.
Limited use in monotherapy due to resistance. Anti-proliferative actions, especially affecting bone marrow and GI.
Effective against azole resistant isolates, and biofilms. Few side effects or drug interactions.

37
Table 1.2. Echinocandin clinical breakpoints for Candida spp. for CLSI broth microdilution methods.(166) MIC interpretive breakpoints (mg/L) incorporate susceptibility data for isolates with confirmed FKS1/FKS2 mutations and clinical data to define the boundaries of susceptible, intermediate or resistant organisms.
Antifungal Agent Species Susceptible Intermediate Resistant Anidulafungin C. albicans $0.25 0.5 !1 C. glabrata $0.12 0.25 !0.5 C. tropicalis $0.25 0.5 !1 C. krusei $0.25 0.5 !1 C. parapsilosis $2 4 !8 C. guilliermondii $2 4 !8 Caspofungin C. albicans $0.25 0.5 !1 C. glabrata $0.12 0.25 !0.5 C. tropicalis $0.25 0.5 !1 C. krusei $0.25 0.5 !1 C. parapsilosis $2 4 !8 C. guilliermondii $2 4 !8 Micafungin C. albicans $0.25 0.12 !1 C. glabrata $0.06 0.25 !0.25 C. tropicalis $0.25 0.5 !1 C. krusei $0.25 0.5 !1 C. parapsilosis $2 4 !8 C. guilliermondii $2 4 !8
38
Caspofungin (Cancidas®, Merck Inc.)
Micafungin (Mycamine®, Astella Pharma Inc.)
Anidulafungin (Eraxis®, Pfizer Inc.)
Figure 1.1. Chemical structure of echinocandins. Echinocandins have a similar cyclic hexapeptide core with differing lipid side chains (red). Chemical structures were generated with ChemBioDraw v13.0 (PerkinElmer Inc., Waltham, MA).
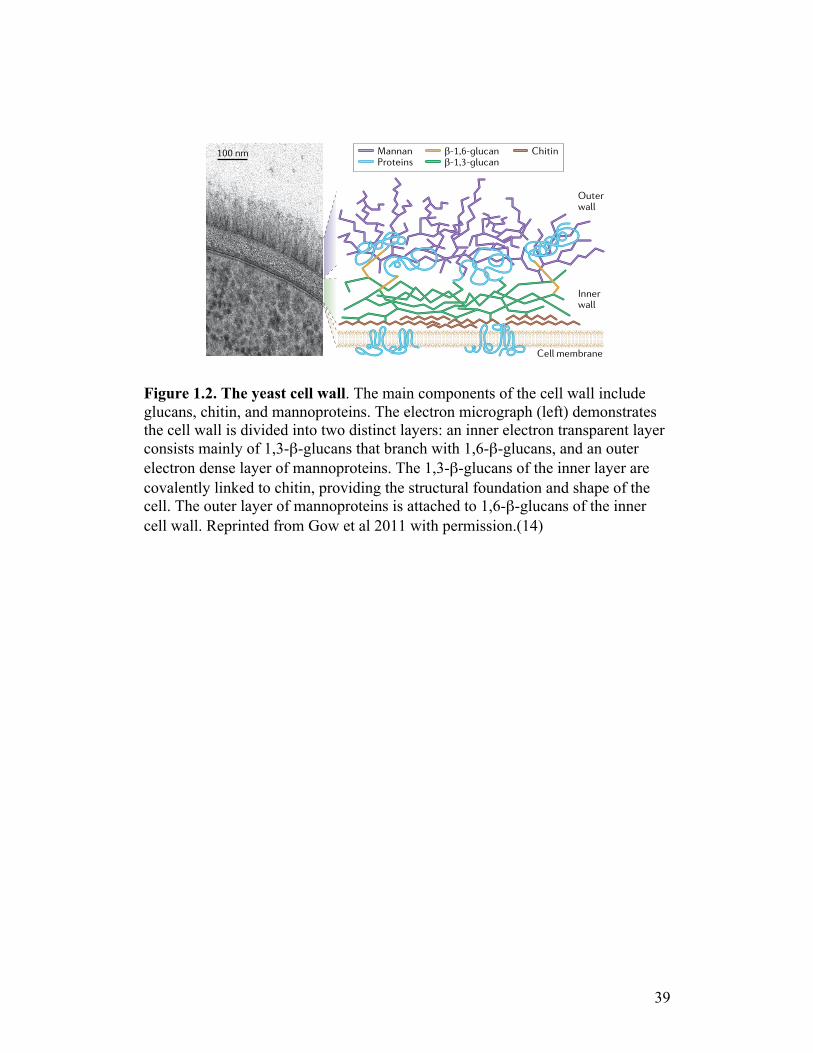
39
Figure 1.2. The yeast cell wall. The main components of the cell wall include glucans, chitin, and mannoproteins. The electron micrograph (left) demonstrates the cell wall is divided into two distinct layers: an inner electron transparent layer consists mainly of 1,3-!-glucans that branch with 1,6-!-glucans, and an outer electron dense layer of mannoproteins. The 1,3-!-glucans of the inner layer are covalently linked to chitin, providing the structural foundation and shape of the cell. The outer layer of mannoproteins is attached to 1,6-!-glucans of the inner cell wall. Reprinted from Gow et al 2011 with permission.(14)
!"#$%&'(&)*&+,'!'-*.%/0*/1/23
"#$$#$%&'()*$+
!,-./,0123#$!,-.4,0123#$
56*(*$
72()&89#11
5)118:):;&#$)
<$$)&89#11
-==8$:
Muramyl dipeptide The minimal structural unit of peptidoglycan in Gram-positive bacteria that is recognized by the intracellular receptor NOD2 (nucleotide-binding oligomerization domain- containing 2).
CyclinA family of proteins for which expression is normally periodic within the cell cycle and which control the progression of cells through the cell cycle by activating cyclin-dependent kinases.
SeptinsEvolutionarily conserved proteins that have essential functions in bud evagination and cytokinesis, and more subtle roles throughout the cell cycle.
ChlamydosporesThick-walled spores that are produced by Candida albicans on carbohydrate-rich media in!vivo. The presence of chlamydospores in human tissues has yet to be firmly established.
GenotoxicPertaining to a substance: able to cause mutations by damaging DNA.
induced by several mechanisms (FIG.!3) that are activated by various environmental triggers which might have different effects on the fungal cell surface. Therefore, C.!albicans probably generates subtly different forms of hyphae in different host niches, thereby affecting the host immune response in a niche-specific manner.
Protein kinase A signalling. Signalling through cyclic AMP–protein kinase A complex (PKA) is the major pathway by which hyphal growth is induced in C.!albi-cans (FIG.!3a). A range of environmental signals regu-late cAMP–PKA signalling, with most inputs being co ordinated through the adenylyl cyclase Cyr1 (also called Cdc35). Some signals appear to act directly on the adenylyl cyclase itself, such as serum muramyl dipeptide (MDP) and CO2 (REFS!28,29). Other signals, such as glu-cose and amino acids30–32, act indirectly on the adenylyl cyclase by upstream signalling through the small GTPase Ras1 or through guanine-nucleotide-binding (G)! protein-coupled receptor!1 (Gpr1) and the associated G!protein!"2 subunit (Gpa2), respectively. Additional environmental signals influence cAMP–PKA signalling, although their exact mode of action has not yet been clarified. For example, hyphal development is inhibited at temperatures below 35 °C through the action of the molecular chaperone heat shock protein 90 (Hsp90)33. Also, the quorum sensing molecule farnesol, which accumulates at high C.!albicans cell densities, inhibits hyphal formation by downregulating cAMP–PKA sig-nalling34, indicating that cell density probably affects morphogenesis at the site of infection.
Adenylyl cyclase activation leads to an elevated level of cAMP, which causes dissociation of the PKA regulatory subunit (Bcy1) from the catalytic subunits (Tpk1 and Tpk2), thereby activating the kinase. PKA is thereafter thought to phosphorylate and activate the transcription factor Efg1 (REF.!35), which is essential for
the activation of hypha-specific genes in C.!albicans36. These genes include those encoding the cell surface adhesins, invasins and immune modulators Als3, Hwp1 and Hyr1, as well as the hypha-specific cyclin Hgc1. Hgc1 interacts with the cyclin-dependent kinase (Cdk) cell division cycle!28 (Cdc28) to mediate phosphorylation of the septins Cdc11 and Sep7, thereby promoting polar-ized growth and cell separation37 (FIG.!3a). These inputs promote the maintenance of hyphal development after polarized growth has been triggered by the Cdc28–Ccn1 (G1–S-specific cyclin) complex, which binds to septin complexes and phosphorylates Cdc11 (REF.!38).
Alternative signalling mechanisms. Additional environ-mental signals stimulate hyphal development through alternative signalling mechanisms (FIG.!3b). Low levels of nitrogen as a result of starvation activate hyphal devel-opment through a mitogen-activated protein kinase (MAPK) cascade as well as the cAMP–PKA pathway. This MAPK cascade, which includes proteins with struc-tural similarity to MAPK components in other organ-isms (namely, Hst7 and Cek1 (also known as Erk1), subsequently activates the transcription factor Cph1 (REF.!32) (FIG.!3b). Cph1 also plays a part in pheromone signalling during mating in C.!albicans39. Whether in response to starvation or mating pheromone, the acti-vation of this MAPK pathway has an important role in the formation of chlamydospores, which are thought to promote C.!albicans survival in unfavourable condi-tions40. Ambient pH also influences morphogenesis and CWP synthesis through the Rim101 pathway. Rim101 is a zinc-finger-containing transcription factor that is inactive under acidic conditions but activated at neu-tral to alkaline conditions and alters gene expression41,42. Hyphal development can also be stimulated by hypoxia and by embedding C.!albicans cells in a matrix. These inputs activate morphogenesis through additional alter-native pathways that involve the transcription factors Efg1 and Efh1 during hypoxia-induced hypha formation and the morphogenetic regulator Czf1 during matrix-induced hypha formation43,44 (FIG.!3b).
Genotoxic stress. C.!albicans morphogenesis can also be driven by other mechanisms. Genotoxic stresses that disturb cell cycle progression can stimulate filamentous growth in C.!albicans45 (FIG.!3c). For example, mutations that interfere with DNA damage repair, or the pharma-cological inhibition of DNA replication (for example with hydroxyurea), can trigger hyphal growth46,47. These genotoxic insults can act through the DNA damage or DNA replication checkpoints to promote hyphal devel-opment through Rad53, a checkpoint kinase45. Reactive oxygen species generated by phagocytic cells also induce genotoxic stress. For example, hydrogen peroxide acti-vates hyphal development through Rad53 signalling48. Therefore, the C.!albicans hyphae that escape from macrophages might not be equivalent to the hyphae that invade mucosal surfaces, further complicating the host–pathogen interaction.
Clearly, C.!albicans morphogenesis is controlled by a complex regulatory network that coordinates an array
!"#$%&'(')'!"#$%"$#&'()'"*&'!"#$%$"&"'(%)"#*'%&++',-++.'*+,'-./&%0'1.2'3&'4"05"2#$"06&4'"2'56&' '1&--'+.--7'*6&',$5&%'-./&%'"0'6"#6-/'&2%"16&4'+"56'!8'.24'"8-"29&4':.22,0&';,-/:&%0'<:.22.20='56.5'.%&'1,>.-&25-/'.00,1".5&4'+"56';%,5&"20'5,'?,%:'#-/1,;%,5&"20@'+6&%&.0'56&'"22&%'-./&%'1,25."20'56&'09&-&5.-';,-/0.116.%"4&0'16"5"2'.24'#8A@B8#-$1.2@'+6"16'1,2?&%'05%&2#56'.24'1&--'06.;&7'*6&',$5&%'1&--'+.--';%,5&"20'.%&'.55.16&4'5,'56"0'"22&%'+.--'?%.:&+,%9';%&4,:"2.25-/'3/'#-/1,0/-;6,0;6.5"4/-"2,0"5,-'<CDE='%&:2.250'56.5'.%&'-"29&4'5,'56&'09&-&5,2'56%,$#6'.':,%&'?-&F"3-&'#8A@G8#-$1.27
!"#$"%&
!!"#| FEBRUARY 2012 | VOLUME 10 ',,,./-"$#&.%(01#&23&,4103%#(
© 2012 Macmillan Publishers Limited. All rights reserved

40
Figure 1.3. Putative Fks1p topology. Similar to the proposed structure of callose synthase in plants(103), my representation of GS incorporates a catalytic and transport function. It is not known how the formed glucan fibrils are transported to the cell’s exterior, but it is likely the 13 experimentally confirmed transmembrane regions (numbered cylinders) facilitate its transport through the plasma membrane. As determined by Edlind et al(82), the three “hot-spot” regions (shown in red) determine the susceptibility of Candida spp. to echinocandins; the hexapeptide core likely interacts with these regions while the lipid tail interacts with the adjacent plasma membrane.
! "
#
$
"%&
'
(
"""& "!
)*+,-./0
12+3430
1556
"7&8 890:;/.
<=

41
Figure 1.4. Functions of Rho1p. In summary of section 1.2.2.4, Rho1p is involved in the regulation of the cell wall, polarized growth, cytokinesis, and stress responses. Rho1p is activated when bound to GTP (*), activated by GEFs and suppressed by GAPs. GTP bound Rho1p activates effector proteins and their functional pathways: Fks1p, Sec3p, Bni1p, Pkc1p, and Skn7p.

42
Figure 1.5. Cellular characteristics of PG cells. PG cells of C. albicans (E-H) demonstrate distinct morphological features from the growth control cells (A-D). Scanning election microscopy (A, B, E, F) demonstrates the absence of contractile rings at the bud site, absence of filamentation and enlarged unseparated yeasts forming aggregates. PG cells also exhibit increased chitin staining by calcofluor white (C, G), and significant cell wall alterations demonstrated with transmission electron microscopy (D, H). Control cells demonstrate two cell wall layers, as expected (D), while PG cells have a single cell wall layer, largely composed of electron dense chitin. Reprinted from Bizerra et al 2011 with permission.(178)

43
Figure 1.6. Cell wall stress pathways induced by echinocandins. In summary of p.30, The highly conserved stress responses required for the PG effect and resistance to echinocandins include the CWI, HOG, and calcineurin pathways, as well as the Hsp90p. Inhibition of these pathways or Hsp90p significantly reduces C. albicans tolerance to elevated echinocandin concentrations and the PG effect.(188-191)

44
1.6. References 1. Pfaller MA, Diekema DJ. Epidemiology of invasive mycoses in North
America. Crit Rev Microbiol. 2010;36(1):1–53. 2. Pfaller MA, Diekema DJ. Epidemiology of invasive candidiasis: a
persistent public health problem. Clin Microbiol Rev. 2007;20(1):133–63. 3. Falagas ME, Roussos N, Vardakas KZ. Relative frequency of albicans
and the various non-albicans Candida spp among candidemia isolates from inpatients in various parts of the world: a systematic review. Int J Infect Dis. International Society for Infectious Diseases; 2010;14(11):e954–66.
4. Pfaller MA, Pappas PG, Wingard JR. Invasive fungal pathogens: current epidemiological trend. Clin Infect Dis. 2006 Jun 26;43((Suppl 1)):S3–S14.
5. Pfaller MA, Neofytos D, Diekema D, Azie N, Meier-Kriesche H-U, Quan S-P, et al. Epidemiology and outcomes of candidemia in 3648 patients: data from the Prospective Antifungal Therapy (PATH Alliance®) registry, 2004–2008. Diagn Microbiol Infect Dis. 2012 Dec;74(4):323–31.
6. Azie N, Neofytos D, Pfaller MA, Meier-Kriesche H-U, Quan S-P, Horn D. The PATH (Prospective Antifungal Therapy) Alliance® registry and invasive fungal infections: update 2012. Diagn Microbiol Infect Dis. 2012 Aug;73(4):293–300.
7. De Rosa FG, Trecarichi EM, Montrucchio C, Losito AR, Raviolo S, Posteraro B, et al. Mortality in patients with early- or late-onset candidaemia. J Antimicrob Chemother. 2013;68(4):927–35.
8. Dodds Ashley E, Drew R, Johnson M, Danna R, Dabrowski D, Walker V, et al. Cost of invasive fungal infections in the era of new diagnostics and expanded treatment options. Pharmacotherapy. 2012 Oct;32(10):890–901.
9. Zaoutis TE, Argon J, Chu J, Berlin JA, Walsh TJ, Feudtner C. The epidemiology and attributable outcomes of candidemia in adults and children hospitalized in the United States: a propensity analysis. Clin Infect Dis. 2005 Nov 1;41(9):1232–9.
10. Odds FC, Bougnoux ME, Shaw DJ, Bain JM, Davidson AD, Diogo D, et al. Molecular phylogenetics of Candida albicans. Eukaryot Cell. 2007 Jun 7;6(6):1041–52.
11. MacCallum DM, Castillo L, Nather K, Munro CA, Brown AJP, Gow NAR, et al. Property differences among the four major Candida albicans strain clades. Eukaryot Cell. 2009 Mar;8(3):373–87.
12. Odds FC. In Candida albicans, resistance to flucytosine and terbinafine is linked to MAT locus homozygosity and multilocus sequence typing clade 1. FEMS Yeast Res. 2009 Nov;9(7):1091–101.
13. Tavanti A, Davidson AD, Fordyce MJ, Gow NAR, Maiden MCJ, Odds FC. Population structure and properties of Candida albicans, as determined by multilocus sequence typing. J Clin Microbiol. 2005 Nov;43(11):5601–13.

45
14. Gow NAR, van de Veerdonk FL, Brown AJP, Netea MG. Candida albicans morphogenesis and host defence: discriminating invasion from colonization. Nat Rev Microbiol. Nature Publishing Group; 2011;10(2):112–22.
15. Perlroth J, Choi B, Spellberg B. Nosocomial fungal infections: epidemiology, diagnosis, and treatment. Med Mycol. 2007 Jan;45(4):321–46.
16. Netea MG, Brown GD. Fungal infections: the next challenge. Curr Opin Microbiol. 2012 Aug;15(4):403–5.
17. Sorgo AG, Heilmann CJ, Brul S, de Koster CG, Klis FM. Beyond the wall: Candida albicans secret(e)s to survive. FEMS Microbiol Lett. 2012 Nov 30;338(1):10–7.
18. Berman J, Sudbery PE. Candida albicans: A molecular revolution built on lessons from budding yeast. Nat Rev Genet. 2002 Dec;3(12):918–32.
19. Saville SP, Lazzell AL, Monteagudo C, Lopez-Ribot JL. Engineered control of cell morphology in vivo reveals distinct roles for yeast and filamentous forms of Candida albicans during infection. Eukaryot Cell. 2003 Oct;2(5):1053–60.
20. Lo HJ, Köhler JR, DiDomenico B, Loebenberg D, Cacciapuoti A, Fink GR. Nonfilamentous C. albicans mutants are avirulent. Cell. 1997 Sep 5;90(5):939–49.
21. Braun BR, Johnson AD. Control of filament formation in Candida albicans by the transcriptional repressor TUP1. Science. 1997 Jul 4;277(5322):105–9.
22. Braun BR, Head WS, Wang MX, Johnson AD. Identification and characterization of TUP1-regulated genes in Candida albicans. Genetics. 2000 Sep;156(1):31–44.
23. Sardi JCO, Scorzoni L, Bernardi T, Fusco-Almeida AM, Mendes Giannini MJS. Candida species: current epidemiology, pathogenicity, biofilm formation, natural antifungal products and new therapeutic options. J Med Microbiol. 2012 Dec 6;62(Pt_1):10–24.
24. Chandra J, Kuhn DM, Mukherjee PK, Hoyer LL, McCormick T, Ghannoum MA. Biofilm formation by the fungal pathogen Candida albicans: development, architecture, and drug resistance. J Bacteriol. 2001 Sep 15;183(18):5385–94.
25. Baillie GS, Douglas LJ. Matrix polymers of Candida biofilms and their possible role in biofilm resistance to antifungal agents. J Antimicrob Chemother. 2000 Sep;46(3):397–403.
26. Blankenship JR, Mitchell AP. How to build a biofilm: a fungal perspective. Curr Opin Microbiol. 2006 Dec;9(6):588–94.
27. Cate ten JM, Klis FM, Pereira-Cenci T, Crielaard W, de Groot PWJ. Molecular and cellular mechanisms that lead to Candida biofilm formation. J Dent Res. 2009 Mar 5;88(2):105–15.
28. Denning DW, Kibbler CC, Barnes RA. British Society for Medical Mycology proposed standards of care for patients with invasive fungal infections. Lancet Infect Dis. 2003 Apr;3(4):230–40.
46
29. Guery BP, Arendrup MC, Auzinger G, Azoulay É, Borges Sá M, Johnson EM, et al. Management of invasive candidiasis and candidemia in adult non-neutropenic intensive care unit patients: Part II. Treatment. Intensive Care Med. 2008 Oct 30;35(2):206–14.
30. Cuenca-Estrella M, Verweij PE, Arendrup MC, Arikan-Akdagli S, Bille J, Donnelly JP, et al. ESCMID* guideline for the diagnosis and management of Candida diseases 2012: diagnostic procedures. Clin Microbiol Infect. 2012 Nov 9;18:9–18.
31. Nguyen MH, Wissel MC, Shields RK, Salomoni MA, Hao B, Press EG, et al. Performance of Candida real-time polymerase chain reaction, beta-D-glucan assay, and blood cultures in the diagnosis of invasive candidiasis. Clin Infect Dis. 2012 Apr 9;54(9):1240–8.
32. Garey KW, Rege M, Pai MP, Mingo DE, Suda KJ, Turpin RS, et al. Time to initiation of fluconazole therapy impacts mortality in patients with candidemia: a multi-institutional study. Clin Infect Dis. 2006 Jul 1;43(1):25–31.
33. Pappas PG, Kauffman CA, Andes D, Benjamin DK Jr, Calandra TF, Edwards JE Jr, et al. Clinical practice guidelines for the management of candidiasis: 2009 Update by the Infectious Diseases Society of America. Clin Infect Dis. 2009 Mar;48(5):503–35.
34. Bow E, Evans G, Fuller J, Laverdiere M, Rotstein C, Rennie RP, et al. Canadian clinical practice guidelines for invasive candiddiasis in adults. Can J Infect Dis Med Microbiol. 2010;21(4):e122–50.
35. Rex JH, Walsh TJ, Sobel JD, Filler SG, Pappas PG, Dismukes WE, et al. Practice guidelines for the treatment of candidiasis. Clin Infect Dis. Clinical Infectious Diseases; 2000;30(4):662–78.
36. Cornely OA, Bassetti M, Calandra T, Garbino J, Kullberg BJ, Lortholary O, et al. ESCMID* guideline for the diagnosis and management of Candida diseases 2012: non-neutropenic adult patients. Clin Microbiol Infect. 2012 Nov 9;18:19–37.
37. Sanglard D, Coste A, Ferrari S. Antifungal drug resistance mechanisms in fungal pathogens from the perspective of transcriptional gene regulation. FEMS Yeast Res. 2009 Nov;9(7):1029–50.
38. Pfaller MA, Diekema DJ. Progress in antifungal susceptibility testing of Candida spp. by use of clinical and laboratory standards institute broth microdilution methods, 2010 to 2012. J Clin Microbiol. 2012 Aug 15;50(9):2846–56.
39. Chen SC-A, Slavin MA, Sorrell TC. Echinocandin antifungal drugs in fungal infections. Drugs. 2011.
40. Morris MI, Villmann M. Echinocandins in the management of invasive fungal infections, Part 2. Am J Health Syst Pharm. 2006 Oct 1;63(19):1813–20.
41. Knox C, Law V, Jewison T, Liu P, Ly S, Frolkis A, et al. DrugBank 3.0: a comprehensive resource for “Omics” research on drugs. Nucleic Acids Res. 2010 Dec 22;39(Database):D1035–41.
42. Green LJ, Marder P, Mann LL, Chio LC, Current WL. LY303366

47
exhibits rapid and potent fungicidal activity in flow cytometric assays of yeast viability. Antimicrob Agents Chemother. 1999 Apr;43(4):830–5.
43. Mulder MPC, Fodran P, Kemmink J, Breukink EJ, Kruijtzer JAW, Minnaard AJ, et al. Mutual influence of backbone proline substitution and lipophilic tail character on the biological activity of simplified analogues of caspofungin. Org Biomol Chem. 2012;10(37):7491.
44. Cancidas. Merck & Co., Inc; 2013. pp. 1–24. 45. Eraxis. Pfizer Inc; 2012. pp. 1–19. 46. Mycamine. Astellas Pharmaceuticals US, Inc; 2012. pp. 1–20. 47. Douglas CM, D'Ippolito JA, Shei GJ, Meinz M, Onishi J, Marrinan JA, et
al. Identification of the FKS1 gene of Candida albicans as the essential target of 1,3-beta-D-glucan synthase inhibitors. Antimicrob Agents Chemother. 1997 Nov;41(11):2471–9.
48. Cassone A, Mason RE, Kerridge D. Lysis of growing yeast-form cells of Candida albicans by echinocandin: a cytological study. Sabouraudia. 1981 Jun;19(2):97–110.
49. Nishiyama Y, Uchida K, Yamaguchi H. Morphological changes of Candida albicans induced by micafungin (FK463), a water-soluble echinocandin-like lipopeptide. J Electron Microsc. 2002;51(4):247–55.
50. Morris MI, Villmann M. Echinocandins in the management of invasive fungal infections, part 1. Am J Health Syst Pharm. 2006 Sep 15;63(18):1693–703.
51. Colombo AL, Ngai AL, Bourque M, Bradshaw SK, Strohmaier KM, Taylor AF, et al. Caspofungin use in patients with invasive candidiasis caused by common non-albicans Candida species: review of the caspofungin database. Antimicrob Agents Chemother. 2010 Apr 19;54(5):1864–71.
52. Sakaeda T, Iwaki K, Kakumoto M, Nishikawa M, Niwa T, Jin J-S, et al. Effect of micafungin on cytochrome P450 3A4 and multidrug resistance protein 1 activities, and its comparison with azole antifungal drugs. J Pharm Pharmacol. 2005 Jun 1;57(6):759–64.
53. Damle BD, Dowell JA, Walsky RL, Weber GL, Stogniew M, Inskeep PB. In vitro and in vivo studies to characterize the clearance mechanism and potential cytochrome P450 interactions of anidulafungin. Antimicrob Agents Chemother. 2009 Mar 1;53(3):1149–56.
54. Stone JA, Xu X, Winchell GA, Deutsch PJ, Pearson PG, Migoya EM, et al. Disposition of caspofungin: role of distribution in determining pharmacokinetics in plasma. Antimicrob Agents Chemother. 2004 Feb 24;48(3):815–23.
55. Sandhu P, Xu X, Bondiskey PJ, Balani SK, Morris ML, Tang YS, et al. Disposition of caspofungin, a novel antifungal agent, in mice, rats, rabbits, and monkeys. Antimicrob Agents Chemother. 2004 Apr;48(4):1272–80.
56. Goldblum D, Fausch K, Frueh BE, Theurillat R, Thormann W, Zimmerli S. Ocular penetration of caspofungin in a rabbit uveitis model. Graefe's Arch Clin Exp Ophthalmol. 2006 Nov 22;245(6):825–33.
48
57. Okugawa S, Ota Y, Tatsuno K, Tsukada K, Kishino S, Koike K. A case of invasive central nervous system aspergillosis treated with micafungin with monitoring of micafungin concentrations in the cerebrospinal fluid. Scand J Infect Dis. 2007 Jan;39(4):344–6.
58. Farowski F, Cornely OA, Vehreschild JJ, Bauer T, Hartmann P, Steinbach A, et al. Intracellular concentrations of micafungin in different cellular compartments of the peripheral blood. Int J Antimicrob Agents. Elsevier B.V; 2012 Mar 1;39(3):228–31.
59. Louie A, Deziel M, Liu W, Drusano MF, Gumbo T, Drusano GL. Pharmacodynamics of caspofungin in a murine model of systemic candidiasis: importance of persistence of caspofungin in tissues to understanding drug activity. Antimicrob Agents Chemother. 2005 Nov 22;49(12):5058–68.
60. Smith RP, Baltch A, Bopp LH, Ritz WJ, Michelsen PP. Post-antifungal effects and time-kill studies of anidulafungin, caspofungin, and micafungin against Candida glabrata and Candida parapsilosis. Diagn Microbiol Infect Dis. Elsevier B.V; 2011;71(2):131–8.
61. Nguyen KT, Ta P, Hoang BT, Cheng S, Hao B, Nguyen MH, et al. Characterising the post-antifungal effects of micafungin against Candida albicans, Candida glabrata, Candida parapsilosis and Candida krusei isolates. Int J Antimicrob Agents. 2010;35(1):80–4.
62. Manavathu EK. A comparative study of the post-antifungal effect (PAFE) of amphotericin B, triazoles and echinocandins on Aspergillus fumigatus and Candida albicans. J Antimicrob Chemother. 2004 Jan 16;53(2):386–9.
63. Clancy CJ, Huang H, Cheng S, Derendorf H, Nguyen MH. Characterizing the effects of caspofungin on Candida albicans, Candida parapsilosis, and Candida glabrata isolates by simultaneous time-kill and postantifungal-effect experiments. Antimicrob Agents Chemother. 2006;50(7):2569–72.
64. Shields RK, Nguyen MH, Press EG, Clancy CJ. Five-minute exposure to caspofungin results in prolonged postantifungal effects and eliminates the paradoxical growth of Candida albicans. Antimicrob Agents Chemother. 2011;55(7):3598–602.
65. Smits GJ, Kapteyn JC, van den Ende H, Klis FM. Cell wall dynamics in yeast. Curr Opin Microbiol. 1999 Aug 1;2(4):348–52.
66. González M, de Groot PWJ, Klis FM, Lipke PN. Glycoconjugate structure and function in fungal cell walls. In: Microbial glycobiology: structures, relevance, and applications. Elsevier Inc; 2009. pp. 169–83.
67. Orlean P. Architecture and biosynthesis of the Saccharomyces cerevisiae cell wall. Genetics. 2012;192(3):775–818.
68. Shematek EM, Braatz JA, Cabib E. Biosynthesis of the yeast cell wall. I. Preparation and properties of beta-(1,3)glucan synthetase. J Biol Chem. 1980 Feb 10;255(3):888–94.
69. Larriba G, Morales M, Ruiz-Herrera J. Biosynthesis of beta-glucan microfibrils by cell-free extracts from Saccharomyces cerevisiae. Journal

49
of General microbiology. 1981;124:375–83. 70. Kapteyn JC, Montijn RC, Dijkgraaf GJ, van den Ende H, Klis FM.
Covalent association of beta-1,3-glucan with beta-1,6-glucosylated mannoproteins in cell walls of Candida albicans. J Bacteriol. 1995;177(13):3788–92.
71. Pittet M, Conzelmann A. Biosynthesis and function of GPI proteins in the yeast Saccharomyces cerevisiae. Biochim Biophys Acta. 2007;1771(3):405–20.
72. Frevert J, Ballou CE. Saccharomyces cerevisiae structural cell wall mannoprotein. Biochemistry. 1985;24(3):753–9.
73. Ruiz-Herrera J, Ortiz-Castellanos L. Analysis of the phylogenetic relationships and evolution of the cell walls from yeasts and fungi. FEMS Yeast Res. 2010;10(3):225–43.
74. Xie X, Lipke PN. On the evolution of fungal and yeast cell walls. Yeast. 2010 Aug;27(8):479–88.
75. Bartnicki-Garcia S. Cell wall chemistry, morphogenesis, and taxonomy of fungi. Annu Rev Microbiol. 1968;22:87–108.
76. Letscher-Bru V. Caspofungin: the first representative of a new antifungal class. J Antimicrob Chemother. 2003 Jan 28;51(3):513–21.
77. El-Kirat-Chatel S, Beaussart A, Alsteens D, Jackson DN, Lipke PN, Dufrêne YF. Nanoscale analysis of caspofungin-induced cell surface remodelling in Candida albicans. Nanoscale. 2013;5(3):1105.
78. Inoue SBB, Takewaki N, Takasuka T, Mio T, Adachi M, Fujii Y, et al. Characterization and gene cloning of 1,3-beta-D-glucan synthase from Saccharomyces cerevisiae. Eur. J. Biochem. 1995;231(3):845–54.
79. Radding JA, Heidler SA, Turner WW. Photoaffinity analog of the semisynthetic echinocandin LY303366: identification of echinocandin targets in Candida albicans. Antimicrob Agents Chemother. 1998;42(5):1187–94.
80. Taft CS, Selitrennikoff CP. Cilofungin inhibition of (1-3)-beta-glucan synthase: the lipophilic side chain is essential for inhibition of enzyme activity. J Antibiot. 1990 Apr;43(4):433–7.
81. Yao J, Liu H, Zhou T, Chen H, Miao Z, Dong G, et al. Total synthesis and structure-activity relationships of caspofungin-like macrocyclic antifungal lipopeptides. Tetrahedron. Elsevier Ltd; 2012 Apr 8;68(14):3074–85.
82. Johnson ME, Edlind TD. Topological and mutational analysis of Saccharomyces cerevisiae Fks1. Eukaryot Cell. 2012;11(7):952–60.
83. Ko YT, Ludescher RD, Frost DJ, Wasserman BP. Use of cilofungin as direct fluorescent probe for monitoring antifungal drug-membrane interaction. Antimicrob Agents Chemother. 1994 Jun 1;38(6):1378–85.
84. Ko YT, Frost DJ, Ho CT, Ludescher RD, Wasserman BP. Inhibition of yeast (1,3)-beta-glucan synthase by phospholipase A2 and its reaction products. Biochim Biophys Acta. 1994 Jul 13;1193(1):31–40.
85. Cherry JM, Hong EL, Amundsen C, Balakrishnan R, Binkley G, Chan ET, et al. Saccharomyces Genome Database: the genomics resource of

50
budding yeast. Nucleic Acids Res. 2011 Dec 22;40(D1):D700–5. 86. The UniProt Consortium. Reorganizing the protein space at the Universal
Protein Resource (UniProt). Nucleic Acids Res. 2011 Dec 22;40(D1):D71–5.
87. Ram AF, Brekelmans SS, Oehlen LJ, Klis FM. Identification of two cell cycle regulated genes affecting the beta 1,3-glucan content of cell walls in Saccharomyces cerevisiae. FEBS Lett. 1995 Jan 23;358(2):165–70.
88. Mazur P, Morin N, Baginsky W, el-Sherbeini M, Clemas JA, Nielsen JB, et al. Differential expression and function of two homologous subunits of yeast 1,3-beta-D-glucan synthase. Mol Cell Biol. 1995 Oct;15(10):5671–81.
89. Ishihara S, Hirata A, Nogami S, Beauvais A, Latge JP, Ohya Y. Homologous subunits of 1,3-beta-glucan synthase are important for spore wall assembly in Saccharomyces cerevisiae. Eukaryot Cell. 2007;6(2):143–56.
90. Mio T, Adachi-Shimizu M, Tachibana Y, Tabuchi H, Inoue SBB, Yabe T, et al. Cloning of the Candida albicans homolog of Saccharomyces cerevisiae GSC1/FKS1 and its involvement in beta-1,3-glucan synthesis. J Bacteriol. 1997;179(13):4096–105.
91. Ishiguro J, Saitou A, Duran A, Ribas JC. cps1+, a Schizosaccharomyces pombe gene homolog of Saccharomyces cerevisiae FKS genes whose mutation confers hypersensitivity to cyclosporin A and papulacandin B. J Bacteriol. 1997;179(24):7653–62.
92. Thompson JR, Douglas CM, Li W, Jue CK, Pramanik B, Yuan X, et al. A glucan synthase FKS1 homolog in Cryptococcus neoformans is single copy and encodes an essential function. J Bacteriol. 1999;181(2):444–53.
93. Beauvais A, Bruneau JM, Mol PC, Buitrago MJ, Legrand R, Latge JP. Glucan synthase complex of Aspergillus fumigatus. J Bacteriol. 2001;183(7):2273–9.
94. Kelly R, Register E, Hsu M-J, Kurtz M, Nielsen J. Isolation of a gene involved in 1,3-beta-glucan synthesis in Aspergillus nidulans and purification of the corresponding protein. J Bacteriol. 1996;178(15):4381–91.
95. Schimoler-O'Rourke R, Renault S, Mo W, Selitrennikoff CP. Neurospora crassa FKS protein binds to the (1,3)-beta-glucan synthase substrate, UDP-glucose. Curr Microbiol. 2003;46(6):408–12.
96. Ibrahim AS, Bowman JC, Avanessian V, Brown K, Spellberg B, Edwards JE, et al. Caspofungin inhibits Rhizopus oryzae 1,3-beta-D-glucan synthase, lowers burden in brain measured by quantitative PCR, and improves survival at a low but not a high dose during murine disseminated zygomycosis. Antimicrob Agents Chemother. 2005 Feb;49(2):721–7.
97. Cantarel BL, Coutinho PM, Rancurel C, Bernard T, Lombard V, Henrissat B. The Carbohydrate-Active EnZymes database (CAZy): an expert resource for glycogenomics. Nucleic Acids Res. 2009;37(Database):D233–8.

51
98. Kanehisa M, Goto S. KEGG: kyoto encyclopedia of genes and genomes. Nucleic Acids Res. 2000 Jan 1;28(1):27–30.
99. Inoue SBB, Qadota H, Arisawa M, Anraku Y, Watanabe T, Ohya Y. Signaling toward yeast 1,3-beta-glucan synthesis. Cell Struct Funct. 1996 Oct;21(5):395–402.
100. Campbell JA, Davies GJ, Bulone V, Henrissat B. A classification of nucleotide-diphospho-sugar glycosyltransferases based on amino acid sequence similarities. Biochem J. 1997 Sep 15;326 ( Pt 3):929–39.
101. Farkas I, Hardy TA, DePaoli-Roach AA, Roach PJ. Isolation of the GSY1 gene encoding yeast glycogen synthase and evidence for the existence of a second gene. J Biol Chem. 1990 Dec 5;265(34):20879–86.
102. Stark C. BioGRID: a general repository for interaction datasets. Nucleic Acids Res. 2006 Jan 1;34(90001):D535–9.
103. Davis JK. Combining polysaccharide biosynthesis and transport in a single enzyme: dual-function cell wall glycan synthases. Front Plant Sci. Frontiers; 2012;3:1–5.
104. Dijkgraaf GJP, Abe M, Ohya Y, Bussey H. Mutations in Fks1p affect the cell wall content of beta-1,3- and beta-1,6-glucan in Saccharomyces cerevisiae. Yeast. 2002;19(8):671–90.
105. Coronado JE, Mneimneh S, Epstein SL, Qiu WG, Lipke PN. Conserved processes and lineage-specific proteins in fungal cell wall evolution. Eukaryot Cell. 2007 Dec 7;6(12):2269–77.
106. Utsugi T, Minemura M, Hirata A, Abe M, Watanabe D, Ohya Y. Movement of yeast 1,3-beta-glucan synthase is essential for uniform cell wall synthesis. Genes Cells. 2002 Jan;7(1):1–9.
107. Okada H, Abe M, Asakawa-Minemura M, Hirata A, Qadota H, Morishita K, et al. Multiple functional domains of the Yeast l,3-beta-glucan synthase subunit Fks1p revealed by quantitative phenotypic analysis of temperature-sensitive mutants. Genetics. 2010;184(4):1013–24.
108. Kang MS, Szaniszlo PJ, Notario V, Cabib E. The effect of papulacandin B on (1,3)-beta-D-glucan synthetases. A possible relationship between inhibition and enzyme conformation. Carbohydr Res. 1986 Jun 1;149(1):13–21.
109. Maligie MA, Selitrennikoff CP. Cryptococcus neoformans resistance to echinocandins: (1,3)-beta-glucan synthase activity is sensitive to echinocandins. Antimicrob Agents Chemother. 2005;49(7):2851–6.
110. Qadota H, Python CP, Inoue SBB, Arisawa M, Anraku Y, Zheng Y, et al. Identification of yeast Rho1p GTPase as a regulatory subunit of 1,3-beta-glucan synthase. Science. 1996 Apr 12;272(5259):279–81.
111. Baginsky W. In vitro activity of 1,3-beta-D-glucan synthase requires the GTP-binding protein Rho1. J Biol Chem. 1996;271(24):14604–9.
112. Madaule P, Axel R, Myers AM. Characterization of two members of the rho gene family from the yeast Saccharomyces cerevisiae. Proc. Natl. Acad. Sci. U.S.A. 1987 Feb;84(3):779–83.
113. Yamochi W, Tanaka K, Nonaka H, Maeda A, Musha T, Takai Y. Growth site localization of Rho1 small GTP-binding protein and its involvement

52
in bud formation in Saccharomyces cerevisiae. J Cell Biol. 1994;125(5):1077–93.
114. Delley PA, Hall MN. Cell wall stress depolarizes cell growth via hyperactivation of RHO1. J Cell Biol. 1999 Oct 4;147(1):163–74.
115. Abe M, Qadota H, Hirata A, Ohya Y. Lack of GTP-bound Rho1p in secretory vesicles of Saccharomyces cerevisiae. J Cell Biol. 2003 Jul 7;162(1):85–97.
116. Inoue SBB. Prenylation of Rho1p Is required for activation of yeast 1,3-beta-glucan synthase. J Biol Chem. 1999;274(53):38119–24.
117. Cardon CM, Beck T, Hall MN, Rutter J. PAS kinase promotes cell survival and growth through activation of Rho1. Sci Signal. 2012;5(209):1–9.
118. Perez P, Rincón SA. Rho GTPases: regulation of cell polarity and growth in yeasts. Biochem J. 2010 Feb 24;426(3):243–53.
119. Imamura H, Tanaka K, Hihara T, Umikawa M, Kamei T, Takahashi K, et al. Bni1p and Bnr1p: downstream targets of the Rho family small G-proteins which interact with profilin and regulate actin cytoskeleton in Saccharomyces cerevisiae. EMBO J. 1997;16(10):2745–55.
120. Pruyne D, Bretscher A. Polarization of cell growth in yeast. I. Establishment and maintenance of polarity states. J Cell Sci. 2000 Feb;113 ( Pt 3):365–75.
121. Guo W, Tamanoi F, Novick P. Spatial regulation of the exocyst complex by Rho1 GTPase. Nat Cell Biol. 2001 Apr;3(4):353–60.
122. Pruyne D, Bretscher A. Polarization of cell growth in yeast. J Cell Sci. 2000 Feb;113 ( Pt 4):571–85.
123. Morris CE, Homann U. Cell surface area regulation and membrane tension. J Membr Biol. 2001 Jan 15;179(2):79–102.
124. deHart AKA, Schnell JD, Allen DA, Tsai J-Y, Hicke L. Receptor internalization in yeast requires the Tor2-Rho1 signaling pathway. Mol Biol Cell. 2003 Nov;14(11):4676–84.
125. Prosser DC, Drivas TG, Maldonado-Baez L, Wendland B. Existence of a novel clathrin-independent endocytic pathway in yeast that depends on Rho1 and formin. J Cell Biol. 2011 Nov 14;195(4):657–71.
126. Levin DEE. Cell wall integrity signaling in Saccharomyces cerevisiae. Microbiol Mol Biol Rev. 2005;69(2):262–91.
127. Qadota H. Activation of Yeast Protein Kinase C by Rho1 GTPase. J Biol Chem. 1996 Apr 19;271(16):9193–6.
128. Alberts AS. Analysis of RhoA-binding proteins reveals an interaction domain conserved in heterotrimeric G protein beta subunits and the yeast response regulator protein Skn7. J Biol Chem. 1998;273(15):8616–22.
129. Vilella F. Pkc1 and the upstream elements of the cell integrity pathway in Saccharomyces cerevisiae, Rom2 and Mtl1, Are required for cellular responses to oxidative stress. J Biol Chem. 2004;280(10):9149–59.
130. Lucena RM, Elsztein C, Simões DA, Morais MA Jr. Participation of CWI, HOG and Calcineurin pathways in the tolerance of Saccharomyces cerevisiae to low pH by inorganic acid. J. Appl. Microbiol.

53
2012;113(3):629–40. 131. Dardalhon M, Agoutin B, Watzinger M, Averbeck D. Slt2 (Mpk1) MAP
kinase is involved in the response of Saccharomyces cerevisiae to 8-methoxypsoralen plus UVA. J Photochem Photobiol B. 2009 Jun;95(3):148–55.
132. Madrid M, Fernández-Zapata J, Sánchez-Mir L, Soto T, Franco A, Vicente-Soler J, et al. Role of the fission yeast cell integrity MAPK pathway in response to glucose limitation. BMC Microbiol. 2013;13:34.
133. Yoshida S, Bartolini S, Pellman D. Mechanisms for concentrating Rho1 during cytokinesis. Genes Dev. 2009 Apr 1;23(7):810–23.
134. Lee ME, Singh K, Snider J, Shenoy A, Paumi CM, Stagljar I, et al. The Rho1 GTPase acts together with a vacuolar glutathione S-sonjugate transporter to protect yeast cells from oxidative stress. Genetics. 2011;188(4):859–70.
135. Lockshon D, Olsen CP, Brett CL, Chertov A, Merz AJ, Lorenz DA, et al. Rho signaling participates in membrane fluidity homeostasis. Arkowitz RA, editor. PLoS ONE. 2012;7(10):e45049.
136. Helliwell SB, Schmidt A, Ohya Y, Hall MN. The Rho1 effector Pkc1, but not Bni1, mediates signalling from Tor2 to the actin cytoskeleton. Curr Biol. 1998 Nov 5;8(22):1211–4.
137. Nelson PW, Lozano-Chiu M, Rex JH. In vitro growth-inhibitory activity of pneumocandins L-733,560 and L-743,872 against putatively amphotericin B- and fluconazole-resistant Candida isolates: influence of assay conditions. J. Med. Vet. Mycol. 1997;35(4):285–7.
138. Abruzzo GK, Flattery AM, Gill CJ, Kong L, Smith JG, Pikounis VB, et al. Evaluation of the echinocandin antifungal MK-0991 (L-743,872): efficacies in mouse models of disseminated aspergillosis, candidiasis, and cryptococcosis. Antimicrob Agents Chemother. 1997 Nov;41(11):2333–8.
139. Dunyach C, Drakulovski P, Bertout S, Jouvert S, Reynes J, Mallié M. Fungicidal activity and morphological alterations of Candida albicans induced by echinocandins: study of strains with reduced caspofungin susceptibility. Mycoses. 2010 Jan 27;54(4):e62–8.
140. Walsh TJ, Teppler H, Donowitz GR, Maertens JA, Baden LR, Dmoszynska A, et al. Caspofungin versus liposomal amphotericin B for empirical antifungal therapy in patients with persistent fever and neutropenia. N. Engl. J. Med. 2004 Sep 30;351(14):1391–402.
141. Kurtz MB, Heath IB, Marrinan J, Dreikorn S, Onishi J, Douglas CM. Morphological effects of lipopeptides against Aspergillus fumigatus correlate with activities against (1,3)-beta-D-glucan synthase. Antimicrob Agents Chemother. 1994 Jul 1;38(7):1480–9.
142. Ingham CJ, Schneeberger PM. Microcolony imaging of Aspergillus fumigatus treated with echinocandins reveals both fungistatic and fungicidal activities. PLoS ONE. 2012;7(4):e35478.
143. Bowman JC, Abruzzo GK, Flattery AM, Gill CJ, Hickey EJ, Hsu M-J, et al. Efficacy of caspofungin against Aspergillus flavus, Aspergillus

54
terreus, and Aspergillus nidulans. Antimicrob Agents Chemother. 2006 Nov 22;50(12):4202–5.
144. Calvo E, Pastor FJ, Mayayo E, Salas V, Guarro J. In vitro activity and in vivo efficacy of anidulafungin in murine infections by Aspergillus flavus. Antimicrob Agents Chemother. 2011;55(3):1290–2.
145. Kohno S, Izumikawa K, Yoshida M, Takesue Y, Oka S, Kamei K, et al. A double-blind comparative study of the safety and efficacy of caspofungin versus micafungin in the treatment of candidiasis and aspergillosis. Eur J Clin Microbiol Infect Dis. 2012 Oct 3;32(3):387–97.
146. Del Poeta M, Schell WA, Perfect JR. In vitro antifungal activity of pneumocandin L-743,872 against a variety of clinically important molds. Antimicrob Agents Chemother. 1997;41(8):1835–6.
147. Pfaller MA, Marco F, Messer SA, Jones RN. In vitro activity of two echinocandin derivatives, LY303366 and MK-0991 (L-743,792), against clinical isolates of Aspergillus, Fusarium, Rhizopus, and other filamentous fungi. Diagn Microbiol Infect Dis. 1998;30(4):251–5.
148. Roling EE, Klepser ME, Wasson A, Lewis RE, Ernst EJ, Pfaller MA. Antifungal activities of fluconazole, caspofungin (MK0991), and anidulafungin (LY 303366) alone and in combination against Candida spp. and Crytococcus neoformans via time-kill methods. Diagn Microbiol Infect Dis. 2002;43(1):13–7.
149. Serena C, Fernandez-Torres B, Pastor FJ, Trilles L, Lazera MDS, Nolard N, et al. In vitro interactions of micafungin with other antifungal drugs against clinical isolates of four species of Cryptococcus. Antimicrob Agents Chemother. 2005;49(7):2994–6.
150. Espinel-Ingroff A. Comparison of in vitro activities of the new triazole SCH56592 and the echinocandins MK-0991 (L-743,872) and LY303366 against opportunistic filamentous and dimorphic fungi and yeasts. J Clin Microbiol. 1998 Oct;36(10):2950–6.
151. Kohler S, Wheat LJ, Connolly P, Schnizlein-Bick C, Durkin M, Smedema M, et al. Comparison of the echinocandin caspofungin with amphotericin B for treatment of histoplasmosis following pulmonary challenge in a murine model. Antimicrob Agents Chemother. 2000;44(7):1850–4.
152. Hage CA, Connolly P, Horan D, Durkin M, Smedema M, Zarnowski R, et al. Investigation of the efficacy of micafungin in the treatment of histoplasmosis using two North American strains of Histoplasma capsulatum. Antimicrob Agents Chemother. 2011;55(9):4447–50.
153. Feldmesser M, Kress Y, Mednick A, Casadevall A. The effect of the echinocandin analogue caspofungin on cell wall glucan synthesis by Cryptococcus neoformans. J Infect Dis. 2000;182(6):1791–5.
154. Rachini A, Pietrella D, Lupo P, Torosantucci A, Chiani P, Bromuro C, et al. An anti-beta-glucan monoclonal antibody inhibits growth and capsule formation of Cryptococcus neoformans in vitro and exerts therapeutic, anticryptococcal activity in vivo. Infect Immun. 2007;75(11):5085–94.
155. Karkowska-Kuleta J, Rapala-Kozik M, Kozik A. Fungi pathogenic to

55
humans: molecular bases of virulence of Candida albicans, Cryptococcus neoformans and Aspergillus fumigatus. Acta Biochim Pol. 2009;56(2):211–24.
156. van Duin D, Casadevall A, Nosanchuk JD. Melanization of Cryptococcus neoformans and Histoplasma capsulatum reduces their susceptibilities to amphotericin B and caspofungin. Antimicrob Agents Chemother. 2002 Nov;46(11):3394–400.
157. Castanheira M, Woosley LN, Diekema DJ, Messer SA, Jones RN, Pfaller MA. Low prevalence of fks1 hot spot 1 mutations in a worldwide collection of Candida strains. Antimicrob Agents Chemother. 2010;54(6):2655–9.
158. Garcia-Effron G, Lee S, Park S, Cleary JD, Perlin DS. Effect of Candida glabrata FKS1 and FKS2 mutations on echinocandin sensitivity and kinetics of 1,3-beta-D-glucan synthase: implication for the existing susceptibility breakpoint. Antimicrob Agents Chemother. 2009;53(9):3690–9.
159. Garcia-Effron G, Park S, Perlin DS. Correlating echinocandin MIC and kinetic inhibition of fks1 mutant glucan synthases for Candida albicans: implications for interpretive breakpoints. Antimicrob Agents Chemother. 2009;53(1):112–22.
160. Park S, Kelly R, Kahn JN, Robles J, Hsu M-J, Register E, et al. Specific substitutions in the echinocandin target Fks1p account for reduced susceptibility of rare laboratory and clinical Candida sp. isolates. Antimicrob Agents Chemother. 2005;49(8):3264–73.
161. Ben-Ami R, Garcia-Effron G, Lewis RE, Gamarra S, Leventakos K, Perlin DS, et al. Fitness and virulence costs of Candida albicans FKS1 hot spot mutations associated with echinocandin resistance. J Infect Dis. 2011;204(4):626–35.
162. Garcia-Effron G, Katiyar SK, Park S, Edlind TD, Perlin DS. A naturally occurring proline-to-alanine amino acid change in Fks1p in Candida parapsilosis, Candida orthopsilosis, and Candida metapsilosis accounts for reduced echinocandin susceptibility. Antimicrob Agents Chemother. 2008;52(7):2305–12.
163. Rex JH, Alexander BD, Andes D, Arthington-Skaggs BA, Brown SD, Chaturvedi V, et al. Reference method for broth dilution antifungal susceptibility testing of yeasts; approved standard-3rd edition. CLSI document M27-A3. 27(null) ed. Clinical and Laboratory Standards Institute. Wayne, PA: Clinical and Laboratory Standards Institute; 2008. pp. 1–40.
164. Pfaller MA, Castanheira M, Diekema DJ, Messer SA, Moet GJ, Jones RN. Comparison of European Committee on Antimicrobial Susceptibility Testing (EUCAST) and Etest methods with the CLSI broth microdilution method for echinocandin susceptibility testing of Candida species. J Clin Microbiol. 2010;48(5):1592–9.
165. Rodriguez-Tudela JL, Arendrup MC, Barchiesi F, Bille J, Chryssanthou E, Cuenca-Estrella M, et al. EUCAST Definitive Document EDef 7.1:

56
method for the determination of broth dilution MICs of antifungal agents for fermentative yeasts. Clin Microbiol Infect. 2008 Apr;14(4):398–405.
166. Pfaller MA, Diekema DJ, Andes D, Arendrup MC, Brown SD, Lockhart SR, et al. Clinical breakpoints for the echinocandins and Candida revisited: Integration of molecular, clinical, and microbiological data to arrive at species-specific interpretive criteria. Drug Resist Updat. 2011;14(3):164–76.
167. Stevens DA, Espiritu M, Parmar R. Paradoxical effect of caspofungin: reduced activity against Candida albicans at high drug concentrations. Antimicrob Agents Chemother. 2004;48(9):3407–11.
168. Melo ASA, Colombo AL, Arthington-Skaggs BA. Paradoxical growth effect of caspofungin observed on biofilms and planktonic cells of five different Candida species. Antimicrob Agents Chemother. 2007;51(9):3081–8.
169. Chamilos G, Lewis RE, Albert N, Kontoyiannis DP. Paradoxical effect of echinocandins across Candida species in vitro: evidence for echinocandin-specific and Candida species-related differences. Antimicrob Agents Chemother. 2007;51(6):2257–9.
170. Marine M, Pastor FJ, Sahand IH, Ponton J, Quindos G, Guarro J. Paradoxical growth of Candida dubliniensis does not preclude in vivo response to echinocandin therapy. Antimicrob Agents Chemother. 2009;53(12):5297–9.
171. Wiederhold NP, Kontoyiannis DP, Chi J, Prince RA, Tam VH, Lewis RE. Pharmacodynamics of caspofungin in a murine model of invasive pulmonary aspergillosis: evidence of concentration-dependent activity. J Infect Dis. 2004 Oct 15;190(8):1464–71.
172. Clemons KV, Espiritu M, Parmar R, Stevens DA. Assessment of the paradoxical effect of caspofungin in therapy of candidiasis. Antimicrob Agents Chemother. 2006 Apr;50(4):1293–7.
173. Bayegan S, Majoros L, Kardos G, Kemény-Beke A, Miszti C, Kovacs R, et al. In vivo studies with a Candida tropicalis isolate exhibiting paradoxical growth in vitro in the presence of high concentration of caspofungin. J Microbiol. 2010;48(2):170–3.
174. Rodriguez-Tudela J-LL, Gomez-Lopez A, Arendrup MC, Garcia-Effron G, Perlin DS, Lass-Flörl C, et al. Comparison of caspofungin MICs by means of EUCAST method EDef 7.1 using two different concentrations of glucose. Antimicrob Agents Chemother. 2010 Jul;54(7):3056–7.
175. Clavaud C, Beauvais A, Barbin L, Munier-Lehmann H, Latge JP. The composition of the culture medium influences the beta-1,3-glucan metabolism of Aspergillus fumigatus and the antifungal activity of inhibitors of beta-1,3-glucan synthesis. Antimicrob Agents Chemother. 2012 May 12;56(6):3428–31.
176. Ene IV, Adya AK, Wehmeier S, Brand AC, MacCallum DM, Gow NAR, et al. Host carbon sources modulate cell wall architecture, drug resistance and virulence in a fungal pathogen. Cell Microbiol. 2012 Jun 5;14(9):1319–35.

57
177. Ene IV, Cheng SC, Netea MG, Brown AJP. Growth of Candida albicans cells on the physiologically relevant carbon source lactate affects their recognition and phagocytosis by immune cells. Infect Immun. 2012;81(1):238–48.
178. Bizerra FC, Melo ASA, Katchburian E, Freymüller E, Straus AH, Takahashi HK, et al. Changes in cell wall synthesis and ultrastructure during paradoxical growth effect of caspofungin on four different Candida species. Antimicrob Agents Chemother. 2011;55(1):302–10.
179. Stevens DA, Ichinomiya M, Koshi Y, Horiuchi H. Escape of Candida from caspofungin inhibition at concentrations above the MIC (paradoxical effect) accomplished by increased cell wall chitin; evidence for beta-1,6-glucan synthesis inhibition by caspofungin. Antimicrob Agents Chemother. 2006;50(9):3160–1.
180. Lee KK, MacCallum DM, Jacobsen MD, Walker LA, Odds FC, Gow NAR, et al. Elevated cell wall chitin in Candida albicans confers echinocandin resistance in vivo. Antimicrob Agents Chemother. 2011;56(1):208–17.
181. Walker LA, Gow NAR, Munro CA. Elevated chitin content reduces the susceptibility of Candida species to caspofungin. Antimicrob Agents Chemother. 2012;57(1):146–54.
182. Rueda C, Cuenca-Estrella M, Zaragoza O. Paradoxical growth of Candida albicans in the presence of caspofungin is associated with multiple cell wall rearrangements and decreased virulence. Antimicrob Agents Chemother. 2014;58(2):1071–83.
183. Stevens DA, White TC, Perlin DS, Selitrennikoff CP. Studies of the paradoxical effect of caspofungin at high drug concentrations. Diagn Microbiol Infect Dis. 2005 Mar 1;51(3):173–8.
184. Khlif M, Bogreau H, Michel-Nguyen A, Ayadi A, Ranque S. Trailing or paradoxical growth of Candida albicans when exposed to caspofungin is not associated with microsatellite genotypes. Antimicrob Agents Chemother. 2010;54(3):1365–8.
185. Garcia-Hermoso D, Cabaret O, Lecellier G, Desnos-Ollivier M, Hoinard D, Raoux D, et al. Comparison of microsatellite length polymorphism and multilocus sequence typing for DNA-based typing of Candida albicans. J Clin Microbiol. 2007;45(12):3958–63.
186. Shields RK, Nguyen MH, Du C, Press E, Cheng S, Clancy CJ. Paradoxical effect of caspofungin against Candida bloodstream isolates is mediated by multiple pathways but eliminated in human serum. Antimicrob Agents Chemother. 2011;55(6):2641–7.
187. LaFayette SL, Collins C, Zaas AK, Schell WA, Betancourt-Quiroz M, Gunatilaka AAL, et al. PKC signaling regulates drug resistance of the fungal pathogen Candida albicans via circuitry comprised of Mkc1, calcineurin, and Hsp90. Mitchell AP, editor. PLoS Pathog. 2010;6(8):e1001069.
188. Wiederhold NP, Kontoyiannis DP, Prince RA, Lewis RE. Attenuation of the activity of caspofungin at high concentrations against Candida
58
albicans: possible role of cell wall integrity and calcineurin pathways. Antimicrob Agents Chemother. 2005;49(12):5146–8.
189. Kaneko Y, Ohno H, Imamura Y, Kohno S, Miyazaki Y. The effects of an hsp90 inhibitor on the paradoxical effect. Jpn J Infect Dis. 2009 Sep 1;62(5):392–3.
190. Reinoso-Martín C, Schüller C, Schuetzer-Muehlbauer M, Kuchler K. The yeast protein kinase C cell integrity pathway mediates tolerance to the antifungal drug caspofungin through activation of Slt2p mitogen-activated protein kinase signaling. Eukaryot Cell. 2003 Dec;2(6):1200–10.
191. Walker LA, Gow NAR, Munro CA. Fungal echinocandin resistance. Fungal Genet Biol. 2010 Feb 1;47(2):117–26.
192. Pfaller MA, Diekema DJ, Ostrosky-Zeichner L, Rex JH, Alexander BD, Andes D, et al. Correlation of MIC with outcome for Candida species tested against caspofungin, anidulafungin, and micafungin: analysis and proposal for interpretive MIC breakpoints. J Clin Microbiol. 2008;46(8):2620–9.
193. Klepser ME. Safety and efficacy data for high-dose caspofungin. Curr Fungal Infect Rep. 2010;4(2):59–61.
194. Betts RF, Nucci M, Talwar D, Gareca M, Queiroz Telles F, Bedimo RJ, et al. A multicenter, double-blind trial of a high-dose caspofungin treatment regimen versus a standard caspofungin treatment regimen for adult patients with invasive candidiasis. Clin Infect Dis. 2009;48(12):1676–84.
195. Migoya EM, Mistry GC, Stone JA, Comisar W, Sun P, Norcross A, et al. Safety and pharmacokinetics of higher doses of caspofungin in healthy adult participants. J Clin Pharmacol. 2011;51(2):202–11.
196. Wurthwein G, Cornely OA, Trame MN, Vehreschild JJ, Vehreschild MJGT, Farowski F, et al. Population pharmacokinetics of escalating doses of caspofungin in a phase II study of patients with invasive aspergillosis. Antimicrob Agents Chemother. 2013;57(4):1664–71.
197. Soustre J. Caspofungin modulates in vitro adherence of Candida albicans to plastic coated with extracellular matrix proteins. J Antimicrob Chemother. 2004;53(3):522–5.
198. Goodridge HS, Wolf AJ, Underhill DM. Beta-glucan recognition by the innate immune system. Immunol Rev. 2009 Jul;230(1):38–50.
199. Marakalala MJ, Vautier S, Potrykus J, Walker LA, Shepardson KM, Hopke A, et al. Differential adaptation of Candida albicans in vivo modulates immune recognition by Dectin-1. Klein BS, editor. PLoS Pathog. 2013 Apr 18;9(4):e1003315.
200. Mora-Montes HM, Netea MG, Ferwerda G, Lenardon MD, Brown GD, Mistry AR, et al. Recognition and blocking of innate immunity cells by Candida albicans chitin. Infect Immun. 2011 Apr 19;79(5):1961–70.
201. Wheeler RT, Kombe D, Agarwala SD, Fink GR. Dynamic, morphotype-specific Candida albicans #-glucan exposure during infection and drug treatment. Mitchell AP, editor. PLoS Pathog. 2008;4(12):e1000227.

59
202. Shepardson KM, Cramer RA. Fungal cell wall dynamics and infection site microenvironments: signal integration and infection outcome. Curr Opin Microbiol. 2013 Aug;16(4):385–90.
203. Moretti S, Bozza S, D'Angelo C, Casagrande A, Fazia Della MA, Pitzurra L, et al. Role of innate immune receptors in paradoxical caspofungin activity in vivo in preclinical aspergillosis. Antimicrob Agents Chemother. 2012;56(8):4268–76.
204. Held J, Kohlberger I, Rappold E, Busse Grawitz A, Hacker G. Comparison of (1,3)-beta-D-glucan, mannan/anti-mannan antibodies, and Cand-Tec Candida antigen as serum biomarkers for candidemia. J Clin Microbiol. 2013;51(4):1158–64.
205. Jaijakul S, Vazquez JA, Swanson RN, Ostrosky-Zeichner L. (1,3)-D-Glucan as a prognostic marker of treatment response in invasive candidiasis. Clin Infect Dis. 2012;55(4):521–6.
206. Loeffler J, Stevens DA. Antifungal drug resistance. Clin Infect Dis. 2003;36(Suppl 1):S31–41.

60
Chapter 2: Materials and Methods

61
2.1. PG screening of yeast isolates
2.1.1. Yeast isolates
C. albicans was chosen to test the incidence of the PG effect as it is well
documented to demonstrate the PG effect with CASPO, it is the most frequent
cause of candidemia, and is used in many experiments as a model organism for
Candida related diseases.(1) C. glabrata is believed to be PG negative and was
chosen to test this assumption comparing inoculum densities.
Twenty four C. albicans and twelve C. glabrata clinical and American
Type Culture Collection (ATCC®) yeast isolates differing in patient demographics
and source of infection were selected from the Reference Mycology collection,
Provincial Laboratory of Public Health, University of Alberta Hospital,
Edmonton, Alberta. The isolation, identification, and susceptibility testing of
isolates were performed according the CLSI standards by Reference
Mycology.(Table 2.1) All isolates were stored at -70oC in skim milk and
subcultured twice on Sabouraud Dextrose Agar (SDA, BD DifcoTM, Sparks, MD)
at 35oC before experimental use.
Yeast isolates chosen were susceptible to CASPO and did not demonstrate
other in vitro phenomena, such as the trailing endpoint. This allowed the
evaluation of the PG effect independent of known factors contributing to CASPO
resistance or other in vitro effects.
2.1.2. Broth microdilution assays
62
The frequency of the PG effect can vary by species, strain, echinocandin,
and is influenced by media composition.(2,3) Consequently, it was important to
determine a subset of yeast isolates that reproducibly demonstrate PG. It was also
important to evaluate the effects of starting inoculum density on the incidence of
PG, as inocula differ between microdilution assays macrodilution assays, such as
time kill analysis.
The CLSI broth microdilution method was performed to identify yeast
isolates demonstrating the PG effect with CASPO.(4) Reagent grade CASPO was
obtained from Merck & Co. (Whitehouse Station, NJ) through Reference
Mycology or purchased from Sigma-Aldrich (St. Louis, MO). Stock solutions
(10,000 mg/L) were prepared in dimethyl sulfoxide (DMSO) and stored at -70oC.
Microdilution trays were prepared according to the CLSI document M27-A3.(4)
Two times the required volume of the highest CASPO concentration (128 mg/L)
was prepared in RPMI 1640 medium (0.2% w/v glucose, with L-glutamine,
without bicarbonate) with 0.165 M 3-(N-morpholino)propanesulfonic acid
(MOPS) buffer at pH 7 ±0.1 (Sigma-Aldrich, St. Louis, MO) and serially diluted
1:1 nine times in RPMI1640-MOPS medium to acquire the final dilution (0.25
mg/L). Aliquots of each dilution were dispensed in 100 µl volumes into wells of
clear U-shaped bottom 96-well microdilution plates (Grenier CellStar®, Sigma-
Aldrich, St. Louis, MO). The dispensed CASPO dilutions were further diluted 1:1
upon addition of yeast suspension resulting in final CASPO concentrations
ranging from 0.125 to 64 mg/L after inoculation. The CASPO concentration range
tested was modified from the M27-A3 procedure (from 0.0313 – 16 mg/L) to

63
broaden the upper limit and increase the detection of isolates demonstrating
paradoxical growth at elevated CASPO concentrations.
Subcultured isolates were grown for 24 hours at 35oC on SDA. Several
isolated colonies were suspended in 0.85% sterile saline and adjusted with a
spectrophotometer to a transmittance equal to that of a 1.0 McFarland standard at
530 nm, corresponding to approximately 1 to 5 x 10⁷ cells per ml. This stock
suspension was diluted 1/10 in RPMI 1640-MOPS medium to achieve a 1 to 5 x
106 cells per ml inoculum, then further diluted 1/5 in water followed by 1/200 in
RPMI 1640-MOPS medium for a 1 to 5 x 10³ cells per ml inoculum.
Microdilution trays were inoculated with 100 µl of the final yeast dilution,
resulting in a final inoculum density of 0.5 to 2.5 x 10⁶ and 0.5 to 2.5 x 10³ cells
per ml. Trays were inoculated within 30 minutes of preparation of yeast
suspension and the inoculum of one isolate from each tray was plated in triplicate
to SDA plates for colony count evaluation to estimate dilutions.
Quality control of the microdilution trays was achieved by evaluating C.
krusei ATCC® 6258 and C. parapsilosis ATCC® 22019 MICs (0.12 – 1.0 mg/L
and 0.25 – 1.0 mg/L, respectively) as recommended by the CLSI. Drug free
growth and sterility controls assessed the reagent quality and technical
competence, containing 100 µl of RPMI 1640-MOPS medium with 100 µl
inoculum and 200 µl RPMI 1640-MOPS medium, respectively.
Microdilution trays were incubated at 35oC without agitation for 24 hours
and evaluated for growth manually and spectrophotometrically. Growth patterns
were first evaluated for the presence or absence of visible growth with the aid of a

64
reading mirror. After manual reading of plates, pellets were re-suspended by
pipetting 5 times with a multiwell pipettor to ensure optimal even cell
distributions to read absorbances at 405 nm using an Opsys MR™ microplate
reader (Dynex Technologies Inc., Chantilly, VA, USA) using Revelation
Quicklink v4.25 software (Dynex Technologies, Inc.). The absorbance values of
the negative control wells (containing RPMI 1640-MOPS only) were subtracted
from test well values. Experiments were replicated three times on separate days.
MIC endpoints were interpreted as the lowest CASPO concentration
resulting in a prominent decrease in turbidity compared to the growth control and
a !50% reduction in absorbance at 405 nm compared to the growth control.
Paradoxical growth was defined as re-emergence of growth in the presence of
drug concentrations !2 drug dilutions above the MIC assessed by visual reading
and or a statistically significant increase in absorbance at 405 nm compared to the
media control.
2.1.3. Microscopy
Images of microdilution plates were obtained with an Olympus SZ61
stereomicroscope (Olympus American Inc., Centre Valley, PA, USA) equipped
with an MDC320 microscope digital camera examined at 1.2X magnification, and
processed with ScopeTek ScopePhoto v3.1.312 software (ScopeTek Opto-Electric
Co., Ltd., Hangzhou, China). Images were resized, cropped, and enhanced for
contrast and exposure in Adobe Photoshop CS5 extended v12.1x64 (Adobe
65
Systems Inc., San Jose, CA, USA). All adjustments were made equally to each
image.
2.1.4. Statistical analysis
The absorbance values at 405 nm for each inoculated well were compared
to the absorbance of the negative control (media only) to assess magnitude of
growth. This comparison tests the hypothesis that growth in each inoculated well
will result in a significant increase in absorbance at 405 nm compared to the
negative control:
HO: µinoc_Xmg/LCASPO – µneg = 0
HA: µinoc_Xmg/LCASPO – µneg > 0
Where µinoc_Xmg/LCASPO is the mean absorbance readings of the inoculated wells at
each CASPO concentration (inoc_Xmg/LCASPO, X = 0—64 mg/L for each
isolate at 103 and 106 cells per ml), and µneg is the mean absorbance readings of
the negative control. Mean absorbance readings from three independent replicates
were analyzed by a one-tailed paired t-test, with a p value less than 0.05
considered significant support for increased absorbance readings compared to the
negative control and indicative of growth. Graphing and statistics of absorbance
readings was executed with GraphPad Prism v6.0d (GraphPad Software Inc., La
Jolla, CA, USA).
66
2.2. Phylogenetic and sequence analysis of GS
2.2.1. Sequence data
Data was obtained for organisms that represent a diverse representation of
medically important and related fungal species for which publically available and
manually curated data is available. Complete DNA and protein sequences of FKS
homologs of 30 medically important fungi were obtained from the Fungal
Genome Initiative, the Candida Genome Database(5), and the Saccharomyces
Genome Database.(1,6)(Table 2.2)
2.2.2. Sequence analysis
Protein sequences were aligned with PSI-coffee under default parameters
(unweighted with gap open and gap extension penalties of 0).(2,3,7) The protein
sequence alignment was used as a guide to align exon sequences by codon using
TranslatorX.(4,8) Annotated expressed sequence tag data from each respective
genome database was used to identify intron positions and boundaries. The exon
sequence alignment was manually adjusted using the intron boundaries to
minimize the possibility of intron sliding over an amino acid insertion or deletion
as the former event occurs less frequently.(4,9) Intron sequences were extracted
and aligned with T-coffee,(5,10) then inserted into the exon sequence alignment
within the determined intron boundaries. Intron phases are defined by codon
position: splicing occurring after the third, first, or second nucleotide of the codon
is a phase 0, 1, and 2 intron, respectively. Extracted intron sequences were
evaluated for similarity using the BLASTx plugin in Geneious v6.0.5. Gene
67
structures were produced using Webscipio(6,11) and analyzed using
GenePainter.(7,12)
2.2.3. Phylogenetic analysis
Phylogenetic trees were generated using the nucleotide and protein
alignments without partitions and equal weighting of characters and character
state transformations. Rhizopus oryzae was used as outgroup for tree rooting as it
is the earliest known ancestor of the sampled taxa. Trees were generated using
maximum likelihood, Bayesian, and maximum parsimony inference. The most
appropriate model of evolution for the nucleotide data was the general-time-
reversible model with a proportion of invariant sites and gamma distributed rates
(GTR+I+!), determined by Akaike and Bayesian information criterion in
jModelTest v2.1.3.(13,14) The JTT distance model was applied to the protein
data. Bayesian analysis was conducted under default priors using MrBayes
v3.1.2(15,16) for 1x10⁶ generations sampling every 100 generations for two
independent searches, each with four chains. Convergence was assessed by the
standard deviation of the split frequencies approaching and stabilizing at 0.005,
and the first 3,300 trees were excluded from analysis as burn-in. Maximum
likelihood trees were generated in MEGA5 v2.2(17) with a nearest-neighbor-
joining heuristic search with 1000 random addition bootstrap replicates.
Parsimony analysis was performed in Paup*4.0b10 (Sinauer Associates,
Sunderland, MA); most parsimonious trees were generated by a heuristic search
with 1000 random addition bootstrap replicates with tree bisection connection
68
branch swapping. A species tree was generated using the primary FKS protein
sequences (Fks1p or Bgs4p for budding and fission yeast, respectively) and used
to reconcile the gene tree using Notung v2.6.(18,19) Phylogenetic trees were
visualized in TreeViewX v0.5(20) and edited with Adobe Illustrator CS5.1
(Adobe Systems Inc., San Jose, CA).
2.3. Effect of medium carbon source on PG
2.3.1. Yeast isolates
Two C. albicans strains were used in all subsequent testing; the clinical
yeast isolate M10MY4874 and reference strain ATCC® 90028™ were chosen as
both demonstrated prominent growth at PG concentrations of CASPO, and
ATCC® 90028™ is the reference strain recommended for CASPO susceptibility
testing by the CLSI standards M27-A3.(4) The ATCC® 15126™ C. glabrata
reference strain was used as a negative control for the PG effect.
2.3.2. Broth microdilution screening.
Broth microdilution assays were performed as described above to screen
for the CASPO concentrations PG occurs with each carbon source evaluated.
Broth microdilution trays were prepared using RPMI 1640-MOPS (containing
0.2% glucose) or minimal medium containing 2% w/v glucose, galactose,
sodium-L-lactate (Sigma-Aldrich, St. Louis, MO), or 3% v/v glycerol (Bio-Rad
Laboratories, Inc., Herucles, CA) in 0.67% yeast nitrogen based without amino
acids (YNB, BD DifcoTM, Sparks, MD) pH 5.4 ±0.1.

69
Inoculation of trays was performed as described above. Fresh (<48 hour)
yeast cultures on SDA were suspended in sterile 0.85% saline and adjusted to a
1.0 McFarland standard, and diluted 1/10 in the corresponding carbon source
medium to achieve a 1 to 5 x 10⁶ cells per ml inoculum. Aliquots of 100 µl were
dispensed in the microdilution trays for a final inoculum of 0.5 to 2.5 X 10⁶ cells
per ml. Microdilution trays were incubated at 35oC without agitation and
evaluated for the presence or absence of visible growth with the aid of a reading
mirror. Due to the slow growth of yeast in the non-fermentable carbon sources,
trays were evaluated for growth at 48 hours.
2.3.3. Time kill analysis.
Time kill analysis was performed on yeast exposed to zero, sub-inhibitory,
inhibitory, and PG concentrations of CASPO, the concentrations of which were
determined by broth microdilution screening. Yeast isolates were inoculated to
minimal media containing 2% carbon source from fresh SDA cultures and
incubated overnight at 35oC with agitation (150 rpm). Overnight cultures were
diluted to ~1.5 x 10⁶ cells per ml in 40 ml of fresh media in a 50 ml conical tube
containing the appropriate concentration of CAS and incubated at 35oC with
agitation. Growth was monitored by collecting 1.5 ml samples at predetermined
time points (0, 3, 6, 9, 12, 24, 48, 72 hours) and evaluated for colony forming
units (CFU) and optical density at 600 nm (OD600).
Colony counts (CFU) were obtained by serially diluting samples 10-fold
with sterile 0.85% saline and plating 100 µl aliquots in triplicate, streaking for

70
confluent growth. Plates were incubated at 35oC and the number of colonies per
ml was counted at 48 h. Two optical density readings were taken per sample and
read at 600 nm with a DU®700 series Beckman Coulter spectrophotometer
(Beckman Coulter Inc., Brea, CA). The spectrophotometer was blanked with
YNB (with respective carbon sources) before each measurement Experiments
were repeated three times on separate days.
2.3.4. Statistical analysis of time kill experiments
Growth curves were used to assess the growth response of yeast to
CASPO grown in different carbon sources over time. As described by Klepser et
al(21), a fungistatic response was defined as a <99.9% reduction in CFU/ml from
the starting inoculum, and a fungistatic response was defined as a !99.9%
reduction in CFU/ml from the starting inoculum.
The final growth (endpoint) of C. albicans exposed to 0, 0.075, 2, and 16
mg/L CASPO in each respective carbon source at 72 hours was evaluated by CFU
and OD600. The endpoints for each carbon source were compared against the
starting inoculum to test the hypothesis that there is significantly decreased
growth at sub-inhibitory and inhibitory concentrations and significantly increased
growth at PG concentrations of CASPO and in the growth control (GC):
HO: µGC, µ0.075 mg/L, µ2 mg/L, µ16 mg/L = starting inoculum
HA: µGC, µ0.075 mg/L, µ2 mg/L, µ16 mg/L < or > starting inoculum
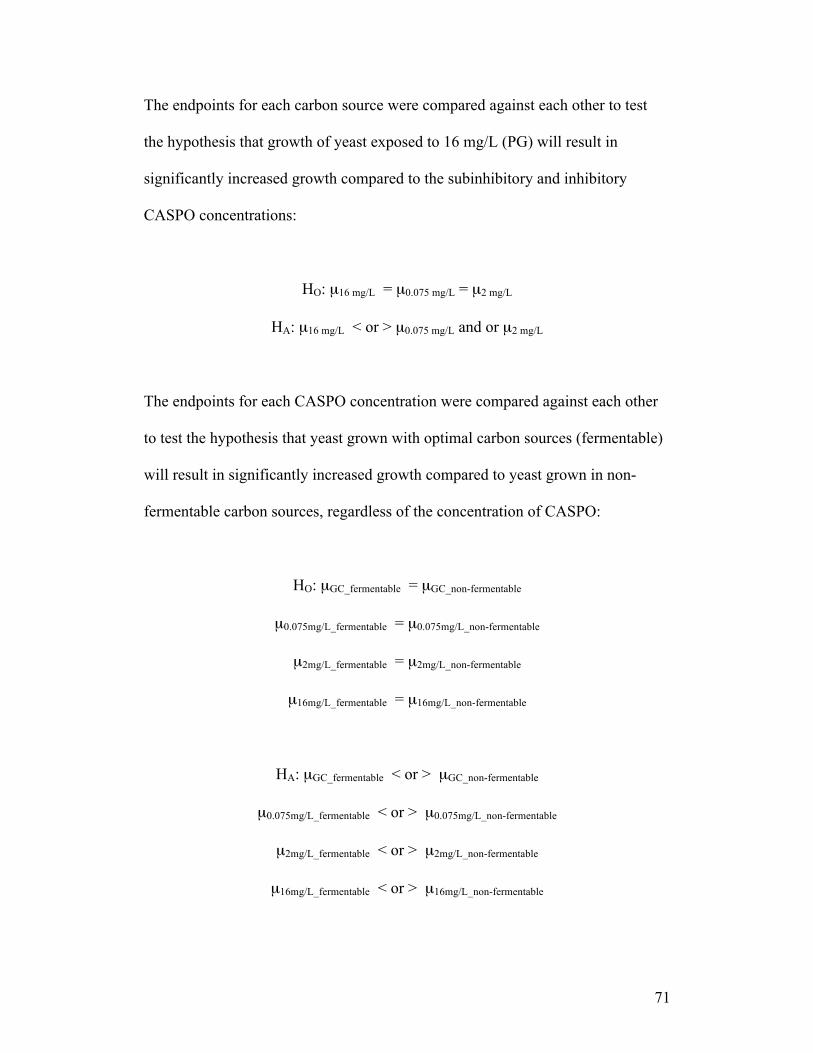
71
The endpoints for each carbon source were compared against each other to test
the hypothesis that growth of yeast exposed to 16 mg/L (PG) will result in
significantly increased growth compared to the subinhibitory and inhibitory
CASPO concentrations:
HO: µ16 mg/L = µ0.075 mg/L = µ2 mg/L
HA: µ16 mg/L < or > µ0.075 mg/L and or µ2 mg/L
The endpoints for each CASPO concentration were compared against each other
to test the hypothesis that yeast grown with optimal carbon sources (fermentable)
will result in significantly increased growth compared to yeast grown in non-
fermentable carbon sources, regardless of the concentration of CASPO:
HO: µGC_fermentable = µGC_non-fermentable
µ0.075mg/L_fermentable = µ0.075mg/L_non-fermentable
µ2mg/L_fermentable = µ2mg/L_non-fermentable
µ16mg/L_fermentable = µ16mg/L_non-fermentable
HA: µGC_fermentable < or > µGC_non-fermentable
µ0.075mg/L_fermentable < or > µ0.075mg/L_non-fermentable
µ2mg/L_fermentable < or > µ2mg/L_non-fermentable
µ16mg/L_fermentable < or > µ16mg/L_non-fermentable
72
The mean OD600 or CFU endpoint values (µ) of each CASPO concentration for a
given carbon source from three experimental replicates were analyzed by a one-
way paired analysis of variance (ANOVA) to compare all the means for an
endpoint and Tukey’s multiple comparisons test to compare every mean with
every other mean. A p value less than 0.05 was considered significant support for
differences in endpoint growth for a given CASPO concentration. Graphing and
statistics of absorbance readings was executed with GraphPad Prism v6.0d
(GraphPad Software Inc., La Jolla, CA, USA).
2.4. Cell cycle analysis by flow cytometry
2.4.1. Flow cytometry: sample collection
Yeast isolates were made to a 0.5 McFarland Standard from a fresh (<48
hour) SDA plate in 1ml 0.85% sterile saline, inoculated to 9ml RPMI 1640-
MOPS, and incubated overnight (~18 hours) at 35oC with shaking at 150 rpm on a
rotary shaker.
Similar to Zhang et al, cells were synchronized in S phase with incubation
of 0.2 M hydroxyurea (Sigma-Aldrich, St. Louis, MO) for 1 hour at 35oC with
shaking at 150 rpm on a rotary shaker.(22) Cells were washed once with fresh
RPMI 1640-MOPS medium and the cell density adjusted to approximately 106
cells per ml. Cells were incubated 1 hour at 35oC with shaking to allow recovery
from the hydroxyurea treatment and progression through the cell cycle. At time
zero (t0), CASPO was added to the final concentration of 0 (growth control),
73
0.075 (sub-inhibitory), or 16 mg/L (PG). 1 ml samples were collected in 20-
minute intervals from t0 to t120 minutes.
Samples were centrifuged at 13,000 revolutions per minute (rpm) for 10
minutes; the supernatant was decanted and the pellet was fixed in 1 ml 70%
ethanol at 4oC for a minimum of 18 hours or until analyzed by flow cytometry.
The ethanol fixative was decanted after centrifugation at 13,000 rpm for 10
minutes, and the sample was rehydrated in 750 µl of 1X phosphate buffered saline
(PBS) and 1 mg/ml ribonuclease A (RNAse A, Sigma-Aldrich, St. Louis, MO) at
35oC for 1 hour. Samples were stained with 3 µl stock Picogreen (Invitrogen,
Carlsbad, CA) for 15 minutes in the dark. Immediately before analysis, cells were
sonicated for 10 seconds at low output to limit cell clumping. Experiments were
replicated three times on separate days.
2.4.2. Flow cytometry: analysis
A minimum of 10,000 ungated events were analyzed with an LSR-
Fortessa flow cytometer (BD Biosciences, Mississauga, ON) with a laser
excitation of 488 nm and filter detecting emissions at 530 nm. Results were
visualized and analyzed using FlowJo software v10.0.7 (Treestar, Inc., Ashland,
OR). Single cells were manually gated from doublets and debris by visualizing
with a fluorescent area versus width histogram; the fluorescent area represents the
total fluorescence of a cell while the fluorescent width represents the transit time
of a cell and correlates to its total fluorescence or DNA content and cell size,
respectively.(Figure 2.1) DNA content histograms were generated from the single

74
cell population was manually gated for the G1/G0, S, and G2/M phases.
Histograms images were exported to and edited with Adobe Illustrator CS5.1
(Adobe Systems Inc., San Jose, CA).
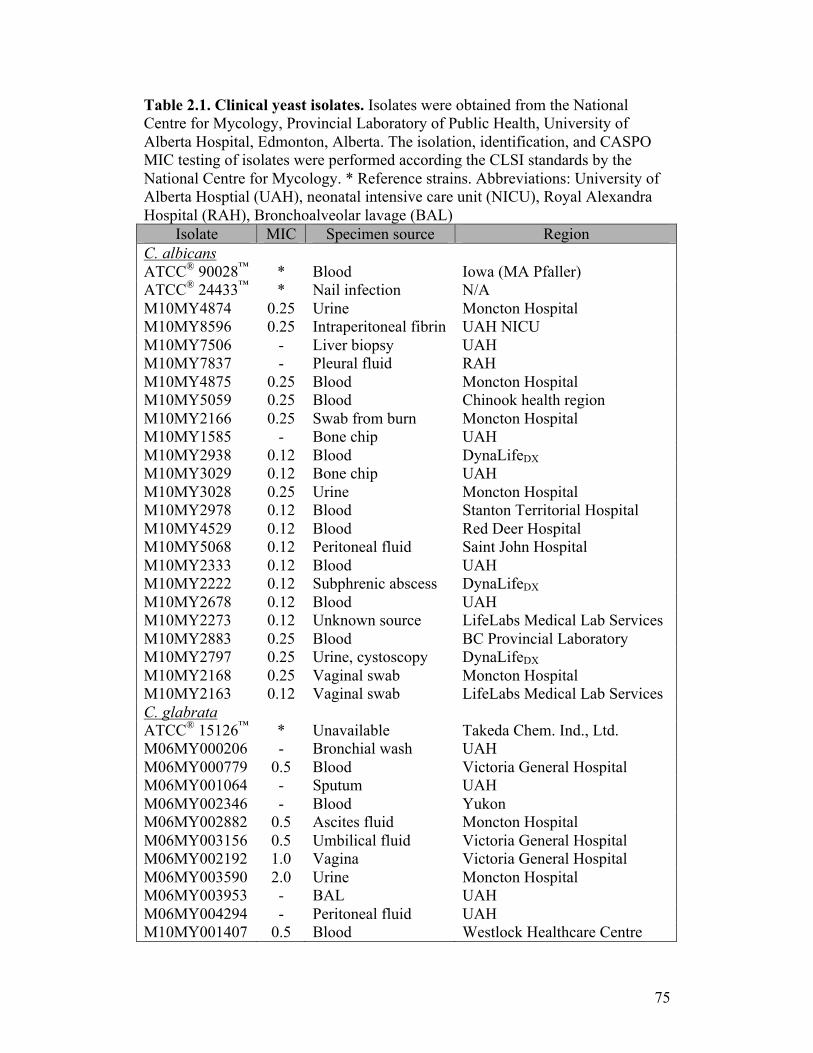
75
Table 2.1. Clinical yeast isolates. Isolates were obtained from the National Centre for Mycology, Provincial Laboratory of Public Health, University of Alberta Hospital, Edmonton, Alberta. The isolation, identification, and CASPO MIC testing of isolates were performed according the CLSI standards by the National Centre for Mycology. * Reference strains. Abbreviations: University of Alberta Hosptial (UAH), neonatal intensive care unit (NICU), Royal Alexandra Hospital (RAH), Bronchoalveolar lavage (BAL)
Isolate MIC Specimen source Region C. albicans ATCC® 90028™ * Blood Iowa (MA Pfaller) ATCC® 24433™ * Nail infection N/A M10MY4874 0.25 Urine Moncton Hospital M10MY8596 0.25 Intraperitoneal fibrin UAH NICU M10MY7506 - Liver biopsy UAH M10MY7837 - Pleural fluid RAH M10MY4875 0.25 Blood Moncton Hospital M10MY5059 0.25 Blood Chinook health region M10MY2166 0.25 Swab from burn Moncton Hospital M10MY1585 - Bone chip UAH M10MY2938 0.12 Blood DynaLifeDX M10MY3029 0.12 Bone chip UAH M10MY3028 0.25 Urine Moncton Hospital M10MY2978 0.12 Blood Stanton Territorial Hospital M10MY4529 0.12 Blood Red Deer Hospital M10MY5068 0.12 Peritoneal fluid Saint John Hospital M10MY2333 0.12 Blood UAH M10MY2222 0.12 Subphrenic abscess DynaLifeDX M10MY2678 0.12 Blood UAH M10MY2273 0.12 Unknown source LifeLabs Medical Lab Services M10MY2883 0.25 Blood BC Provincial Laboratory M10MY2797 0.25 Urine, cystoscopy DynaLifeDX M10MY2168 0.25 Vaginal swab Moncton Hospital M10MY2163 0.12 Vaginal swab LifeLabs Medical Lab Services C. glabrata ATCC® 15126™ * Unavailable Takeda Chem. Ind., Ltd. M06MY000206 - Bronchial wash UAH M06MY000779 0.5 Blood Victoria General Hospital M06MY001064 - Sputum UAH M06MY002346 - Blood Yukon M06MY002882 0.5 Ascites fluid Moncton Hospital M06MY003156 0.5 Umbilical fluid Victoria General Hospital M06MY002192 1.0 Vagina Victoria General Hospital M06MY003590 2.0 Urine Moncton Hospital M06MY003953 - BAL UAH M06MY004294 - Peritoneal fluid UAH M10MY001407 0.5 Blood Westlock Healthcare Centre
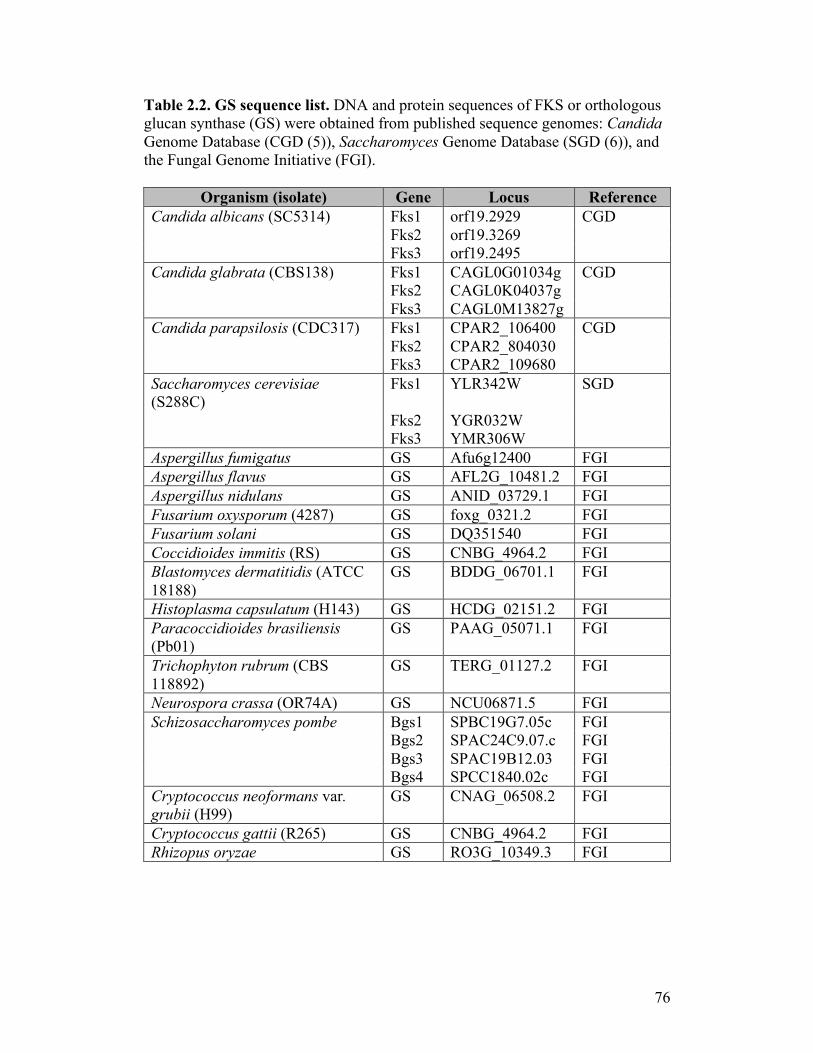
76
Table 2.2. GS sequence list. DNA and protein sequences of FKS or orthologous glucan synthase (GS) were obtained from published sequence genomes: Candida Genome Database (CGD (5)), Saccharomyces Genome Database (SGD (6)), and the Fungal Genome Initiative (FGI).
Organism (isolate) Gene Locus Reference Candida albicans (SC5314) Fks1 orf19.2929 CGD Fks2 orf19.3269 Fks3 orf19.2495 Candida glabrata (CBS138) Fks1 CAGL0G01034g CGD Fks2 CAGL0K04037g Fks3 CAGL0M13827g Candida parapsilosis (CDC317) Fks1 CPAR2_106400 CGD Fks2 CPAR2_804030 Fks3 CPAR2_109680 Saccharomyces cerevisiae (S288C)
Fks1 YLR342W SGD
Fks2 YGR032W Fks3 YMR306W Aspergillus fumigatus GS Afu6g12400 FGI Aspergillus flavus GS AFL2G_10481.2 FGI Aspergillus nidulans GS ANID_03729.1 FGI Fusarium oxysporum (4287) GS foxg_0321.2 FGI Fusarium solani GS DQ351540 FGI Coccidioides immitis (RS) GS CNBG_4964.2 FGI Blastomyces dermatitidis (ATCC 18188)
GS BDDG_06701.1 FGI
Histoplasma capsulatum (H143) GS HCDG_02151.2 FGI Paracoccidioides brasiliensis (Pb01)
GS PAAG_05071.1 FGI
Trichophyton rubrum (CBS 118892)
GS TERG_01127.2 FGI
Neurospora crassa (OR74A) GS NCU06871.5 FGI Schizosaccharomyces pombe Bgs1 SPBC19G7.05c FGI Bgs2 SPAC24C9.07.c FGI Bgs3 SPAC19B12.03 FGI Bgs4 SPCC1840.02c FGI Cryptococcus neoformans var. grubii (H99)
GS CNAG_06508.2 FGI
Cryptococcus gattii (R265) GS CNBG_4964.2 FGI Rhizopus oryzae GS RO3G_10349.3 FGI
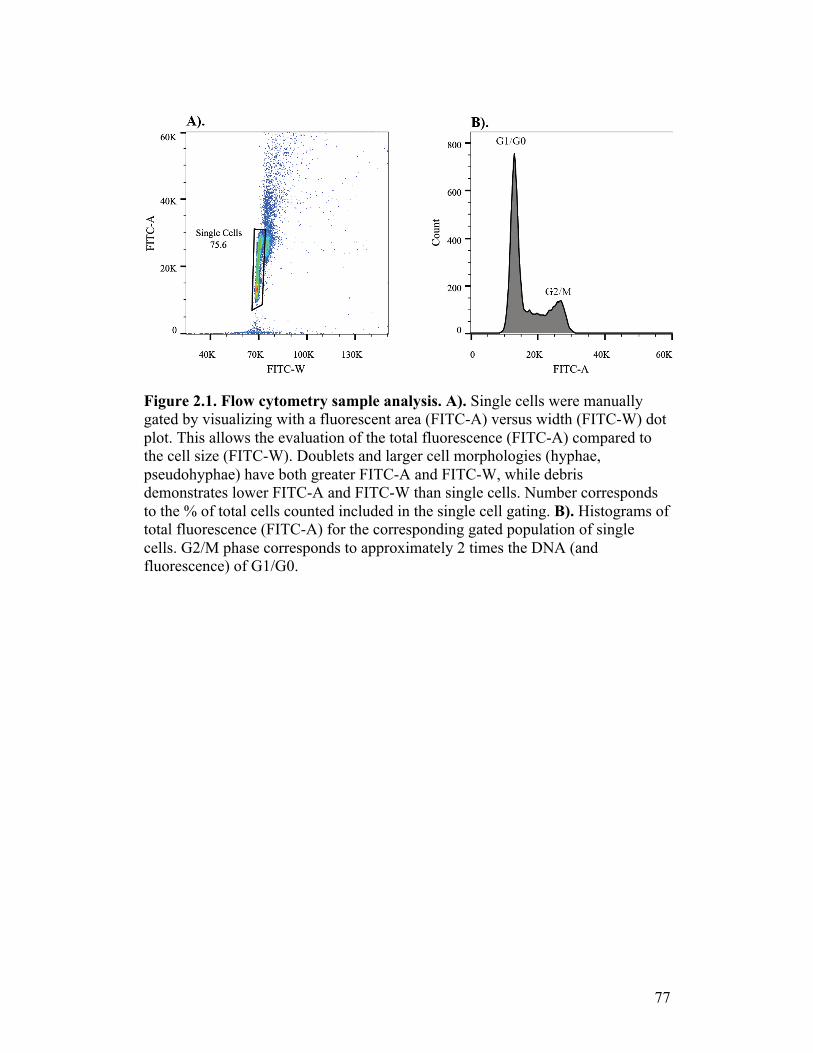
77
Figure 2.1. Flow cytometry sample analysis. A). Single cells were manually gated by visualizing with a fluorescent area (FITC-A) versus width (FITC-W) dot plot. This allows the evaluation of the total fluorescence (FITC-A) compared to the cell size (FITC-W). Doublets and larger cell morphologies (hyphae, pseudohyphae) have both greater FITC-A and FITC-W, while debris demonstrates lower FITC-A and FITC-W than single cells. Number corresponds to the % of total cells counted included in the single cell gating. B). Histograms of total fluorescence (FITC-A) for the corresponding gated population of single cells. G2/M phase corresponds to approximately 2 times the DNA (and fluorescence) of G1/G0.
78
2.5 References: 1. Berman J, Sudbery PE. Candida albicans: A molecular revolution built on
lessons from budding yeast. Nat Rev Genet. 2002 Dec;3(12):918–32. 2. Chamilos G, Lewis RE, Albert N, Kontoyiannis DP. Paradoxical effect of
echinocandins across Candida species in vitro: evidence for echinocandin-specific and Candida species-related differences. Antimicrob Agents Chemother. 2007;51(6):2257–9.
3. Stevens DA, Espiritu M, Parmar R. Paradoxical effect of caspofungin: reduced activity against Candida albicans at high drug concentrations. Antimicrob Agents Chemother. 2004;48(9):3407–11.
4. Rex JH, Alexander BD, Andes D, Arthington-Skaggs BA, Brown SD, Chaturvedi V, et al. Reference method for broth dilution antifungal susceptibility testing of yeasts; approved standard-3rd edition. CLSI document M27-A3. 27(null) ed. Clinical and Laboratory Standards Institute. Wayne, PA: Clinical and Laboratory Standards Institute; 2008. pp. 1–40.
5. Inglis DO, Arnaud MB, Binkley J, Shah P, Skrzypek MS, Wymore F, et al. The Candida genome database incorporates multiple Candida species: multispecies search and analysis tools with curated gene and protein information for Candida albicans and Candida glabrata. Nucleic Acids Res. 2011;40(D1):D667–74.
6. Cherry JM, Hong EL, Amundsen C, Balakrishnan R, Binkley G, Chan ET, et al. Saccharomyces Genome Database: the genomics resource of budding yeast. Nucleic Acids Res. 2011 Dec 22;40(D1):D700–5.
7. Chang J-M, Di Tommaso P, Taly J-F, Notredame C. Accurate multiple sequence alignment of transmembrane proteins with PSI-Coffee. BMC Bioinformatics. BioMed Central Ltd; 2012 Mar 28;13(Suppl 4):S1.
8. Abascal F, Zardoya R, Telford MJ. TranslatorX: multiple alignment of nucleotide sequences guided by amino acid translations. Nucleic Acids Res. 2010 Jun 24;38:W7–W13.
9. Roy SW. Intronization, de-intronization and intron sliding are rare in Cryptococcus. BMC Evol Biol. 2009;9(1):192.
10. Notredame C, Higgins DG, Heringa J. T-coffee: a novel method for fast and accurate multiple sequence alignment. J Mol Biol. 2000 Sep;302(1):205–17.
11. Hatje K, Keller O, Hammesfahr B, Pillmann H, Waack S, Kollmar M. Cross-species protein sequence and gene structure prediction with fine-tuned Webscipio 2.0 and Scipio. BMC Res Notes. 2011;4:265.
12. Hammesfahr B, Odronitz F, Mühlhausen S, Waack S, Kollmar M. GenePainter: a fast tool for aligning gene structures of eukaryotic protein families, visualizing the alignments and mapping gene structures onto protein structures. BMC Bioinformatics. 2013;14:77.
13. Guindon SXP, Gascuel O. A simple, fast, and accurate algorithm to estimate large phylogenies by maximum likelihood. Systematic Biol. 2003;52(5):696–704.
14. Darriba D, Taboada GL, Doallo R, Posada D. jModelTest 2: more models,
79
new heuristics and parallel computing. Nat Meth. 2012 Jul 30;9(8):772–2. 15. Huelsenbeck JP, Ronquist F. MRBAYES: Bayesian inference of
phylogenetic trees. Bioinformatics. 2001 Aug;17(8):754–5. 16. Ronquist F, Huelsenbeck JP. MrBayes 3: Bayesian phylogenetic inference
under mixed models. Bioinformatics. 2003 Aug 11;19(12):1572–4. 17. Tamura K, Peterson D, Peterson N, Stecher G, Nei M, Kumar S. MEGA5:
molecular evolutionary genetics analysis using maximum likelihood, evolutionary distance, and maximum parsimony methods. Mol Biol Evol. 2011;28(10):2731–9.
18. Chen K, Durand D, Farach-Colton M. NOTUNG: a program for dating gene duplications and optimizing gene family trees. J Comput Biol. 2000;7(3-4):429–47.
19. Durand D, Halldórsson BV, Vernot B. A hybrid micro-macroevolutionary approach to gene tree reconstruction. J Comput Biol. 2006 Mar;13(2):320–35.
20. Page RD. TreeView: an application to display phylogenetic trees on personal computers. Comput Appl Biosci. 1996 Aug;12(4):357–8.
21. Klepser ME, Ernst EJ, Lewis RE, Ernst ME, Pfaller MA. Influence of test conditions on antifungal time-kill curve results: proposal for standardized methods. Antimicrob Agents Chemother. 1998 May;42(5):1207–12.
22. Zhang Y-Q, Rao R. Global disruption of cell cycle progression and nutrient response by the antifungal agent amiodarone. J Biol Chem. 2007 Dec 28;282(52):37844–53.

80
Chapter 3: Results
81
3.1. Effect of inoculum density on PG
Visual assessment of growth compares the degree of yeast exposed to
different CASPO concentrations to the growth control. The U-shaped bottom of
the 96 well plates allows the yeast to aggregate and pellet towards the bottom.
The growth control of the standard (103 cells per ml) inoculum appeared as a
pellet in the majority of the isolates.(Appendix 1, 2) The growth control of the
elevated (106 cells per ml) inoculum demonstrated greater variability, with an
overall increased dispersed growth across the entire well compared to the standard
inoculum growth controls. PG appeared mostly dispersed across the wells, with
little pelleting.
Concentrations of CASPO for MICs and PG determined by visual and
spectrophotometric methods for standard and elevated starting inocula are listed
in Table 3.1. All isolates demonstrated MICs within the susceptible range (!0.25
mg/L CASPO)(1), regardless of the inoculum used. Due to the lowest CASPO
concentration (0.125 mg/L) being several dilutions higher than used in standard
CASPO MIC testing, isolates were determined to have an MIC !0.125 mg/L
when the first well containing CASPO demonstrated a prominent decrease in
growth. While not affecting the interpretation of the MIC, there was an overall
trend of decreased growth at low CASPO concentrations using the elevated
inoculum, observed as a left shift in plotted absorbance profiles (Figure 3.1) and
decreased visible growth in one less dilution compared to the standard inoculum
(Appendix 1, 2). This data confirms previous analyses demonstrating MICs are
not significantly influenced by inoculum density.(2)

82
The frequency of PG was variable using a 103 inoculum (9 of 24 isolates),
and only detected visually as the growth was not sufficient to cause a significant
increase in absorbance (Figure 3.2). PG using a 106 inoculum was sufficient to
observe a statistically significant increase in absorbance compared to the media
control as observed for 23 of 24 C. albicans isolates (Table 3.2, Figure 3.1) and
visually confirmed in 24 of 24 C. albicans isolates. The PG concentration range
was wider with a 106 starting inoculum (8—32 mg/L) than with a 103 starting
inoculum (16 mg/L). PG was not observed with C. glabrata (0 of 12 isolates),
regardless of inoculum used
3.2. Evolution of GS in fungi.
3.2.1. Optimizing multiple sequence alignment of GS genes
30 GS sequences from 19 medically important fungi (see Table 2.2) were
initially aligned with ClustalW2 plugin with Geneious v6.0.5 (Biomatters Ltd.,
Auckland, NZ) under default conditions (gap open penalty of 15 and gap
extension penalty of 6.66).(3) The Clustal software is a fast and reliable method
that often gives a good representation of the true sequence alignment. However,
this software preferentially down-weights terminal gaps and rarely inserts internal
gaps near the end of the alignment, regardless of the optimum criteria used.(4)
The nucleotide alignment with ClustalW2 had obvious inaccuracies, largely due
to the multiple introns present in the majority of fungi. Given that the FKS genes
of fungi are highly conserved, especially within the central domain that putatively
contains the catalytic site, gaps are more likely to be within the ends of the N- and
83
C-termini. The protein alignment generated with ClustalW2 demonstrated gaps
that were inappropriate given the domain structure known for S. cerevisiae Fks1p.
To resolve the obvious inaccuracies with the nucleotide alignment, FKS
protein sequences were aligned with PSI-coffee and reverse translated to aligned
nucleotide coding sequences with TranslatorX. The PSI-coffee software
incorporates hidden markov models for pairwise comparisons of secondary
structure and domain structure predictions from publically available databases.(5)
While slower due to the incorporation of protein structure data into the alignment,
PSI-coffee provided a more accurate protein alignment that incorporated
information of the FKS structure, largely modeled from experimental
determinations from Fks1p of S. cerevisiae. TranslatorX was used to align exon
sequences by codon guided by the PSI-coffee protein alignment. The intron
positions were mapped to the alignments to evaluate conservation of intron
position. Nucleotide sequences of conserved introns were aligned with T-coffee
and inserted into appropriate sites within the exon alignment. Gaps were inserted
into exon sequences that did not contain introns or where introns were at non-
conserved sites. This stepwise alignment method allowed the final nucleotide
alignment to incorporate data from the protein structure using PSI-coffee, more
accurately determine non-synonymous or synonymous mutations by codon
comparisons with TranslatorX, and compare gene structures and intron diversity.
3.2.2. Phylogenetic analysis
84
The overall sequence identity for the 30 FKS fungal genes from 19 species
is 52.7% and 53.2% for the nucleotide and protein alignments, respectively. The
primary domains of the Fks1p in S. cerevisiae have recently been identified as the
terminal ends, the putative cytosolic central domain and 13 experimentally
confirmed transmembrane regions.(6) Sequence diversity of the FKS proteins is
largely within the amino- and carboxy-termini, with 38.8% and 12% sequence
similarity respectively. The central domain is highly conserved with 72.7%
identity.
The “hot-spot” regions corresponding to S. cerevisiae Fks1p at amino
acids 635-649 (HS1), 690-700 (HS3), and 1354-1361 (HS2) were extracted from
the protein alignment to evaluate for correlations in “hot-spot” sequence and
intrinsic susceptibilities.(Figure 3.3) The Bayesian tree was used to evaluate
protein sequences against organism clustering. Documented acquired mutations
associated with decreased echinocandin susceptibility were highlighted to
compare “hot-spot” sequences of intrinsically susceptible or resistant organisms.
(Table 3.3) The “hot-spot” sequences of the primary fungal GS (Fks1p or Bgs4p)
demonstrate high sequence similarity, with 7 of 15 identical sites in HS1, 5 of 11
identical sites in HS3, and 3 of 8 identical sites in HS2. Interestingly, few of the
intrinsically resistant fungi have sequence variability at amino acid sites known to
confer resistance in intrinsically susceptible fungi. This suggests the intrinsic
susceptibility of an organism cannot be predicted by “hot-spot” sequence
comparisons.
85
The protein data produced an alignment of 2,221 total characters with
1,692 variable sites. Parsimony, Bayesian, and likelihood analyses demonstrated
similar support for a topology that resembles the accepted species tree for
fungi.(7)(Figure 3.4) Parsimony analysis generated 1,346 most parsimonious trees
with a length of 10,352 steps. Bayesian analysis generated 12,002 trees with a log
likelihood of -62653.81, and maximum likelihood analysis generated an optimum
tree with a log likelihood of -27,244.84.
The FKS nucleotide dataset of 30 medically important fungi produced a
nucleotide alignment of 7,884 total characters with 5,262 variable sites.
Parsimony, Bayesian, and likelihood analyses demonstrated consistent tree
topologies and similar branch supports.(Figure 3.5) Parsimony analysis generated
1,096 most parsimonious trees with a length of 33,769 steps. Bayesian analysis
generated 13,402 trees with a log likelihood of -129,050.73, and maximum
likelihood analysis generated an optimum tree with a log likelihood of -77,880.17.
There are significant differences between the trees of the nucleotide and
protein data. The taxa sampled are species from the phyla Zygomycota,
Basidiomycota, and Ascomycota. Ascomycota is further sub-divided into the sub-
phyla Taphrinomycotina (fission yeast), Saccharomycotina (budding yeast), and
Pezizomycotina (filamentous ascomycetes). The phylogenetic tree from the
protein sequence alignment is consistent with the known species tree, where
Taphrinomycotina are the earliest diverging group of Ascomycota.(7) However,
the nucleotide dataset produces a tree incongruent with the accepted species tree
that supports the Pezizomycotina as the earliest divergent clade.

86
3.2.3. FKS gene duplications in yeast.
Gene copy number varied among species, with multiple copies in the
budding and fission yeast, but only a single copy in all the other fungi sampled. A
reconciled tree for those species with multiple FKS copies is shown in Figure 3.6.
Analysis reveals six gene duplications and one loss event: S. pombe has four gene
copies as a result of three small scale duplications (SSD) events; C. albicans and
C. parapsilosis have three gene copies as a result of two SSD events; and C.
glabrata and S. cerevisiae have three gene copies as a result of two SSD , a single
gene loss event, and a whole genome duplication (WGD) event.
3.2.4. FKS gene structures.
The Ascomycete yeasts contain multiple copies of FKS genes but lack
introns, while all other fungi have a single copy of FKS with multiple
introns.(Figure 3.7) The positions of the two introns in filamentous ascomycetes
are conserved at the N- and C- termini, except for H. capsulatum in which a large
portion of the N-terminus is truncated in comparison to other fungi. F. oxysporum
contains a unique additional intron in the central domain, the sequence of which
aligns with the coding regions of all other fungi, indicating intron acquisition
from the coding sequence. C. neoformans and C. gattii contain seven and eleven
introns, respectively; five of these introns share exact positions while the
remaining two introns vary in length and affect the alignment of the
corresponding amino acid positions. R. oryzae, the earliest known ancestor of the

87
taxa selected, shares no common positions with the other fungi of its five introns.
The lack of common introns suggests independent intron acquisitions after the
divergence of each subphylum from the common ancestor sequence.
The source of the intron sequences could not be determined by blast
search, as no significant sequence similarity excluding self-hits could be
determined for any of the introns. However, the sixth and seventh intron of C.
gattii aligns with the coding region of the other fungi, suggesting the generation
of this intron from within the exon sequence.
3.3 Effect of carbon source on the PG.
I performed broth microdilution assays to screen for CASPO
concentrations at which PG occurs in medium with fermentable (glucose,
galactose) and non-fermentable (lactate, glycerol) carbon sources to use in time
kill experiments. For minimal medium with 2% glucose, there was growth in all
CASPO concentrations except in 2 mg/L at 48 hours. The PG effect is the re-
emergence of growth in the presence of drug concentrations "2 drug dilutions
above the MIC, and the lack of separation between wells of inhibition and growth
prevents the use of 2% glucose in minimal medium for time kill experiments.
Minimal medium with 0.2% glucose and RPMI 1640-MOPS, which also contains
0.2% glucose, demonstrated the same MIC and PG values.(see Figure 3.1) Since
RPMI 1640-MOPS is the primary medium for CLSI broth microdilution testing
and demonstrated the same broth microdilution growth pattern as minimal
medium with 0.2% glucose with preliminary screening, I chose to use it as the
88
representative glucose medium. Media containing galactose, lactate, and glycerol
varied in the degree and CASPO concentrations at which PG occurred, but all
media demonstrated growth inhibition at 2 mg/L. PG was significantly reduced or
questionable in the non-fermentable carbon sources, but 16 mg/L was chosen as
PG is the most reproducible in the media tested.
C. glabrata does not utilize galactose as a sole carbon source(8), and grew
very poorly in minimal medium with 2% lactate. As this isolate was included as a
negative control for the PG effect, I deemed it sufficient to evaluate in RPMI
1640-MOPS (fermentable) and 2% glycerol (non-fermentable).
The growth of yeast in minimal media with 2% galactose, 2% lactate, 3%
glycerol, and RPMI 1640-MOPS exposed to 0 (growth control), 0.075 (sub-
inhibitory), 2 (inhibitory), and 16 mg/L (PG) CASPO was determined by
monitoring CFU and OD600. The assays were conducted over 72 hours to
accommodate the slower growth in non-fermentable carbon sources. The effect of
carbon source on yeast response to CASPO was evaluated by comparing the final
growth (endpoints) for each CASPO concentration for a given carbon source and
by comparing the endpoints for a given CASPO concentration for all carbon
sources.
The growth of yeast exposed to CASPO grown with different carbon
sources was illustrated by plotting the log10 CFU or OD600 versus time. The final
growth endpoints for each growth condition were compared to evaluate for
growth, fungicidal, or fungistatic activity in response to CASPO.(Figures 3.8—
3.13)
89
Growth curves of C. albicans ATCC® 90028™ for CFU and OD600
determination demonstrated exponential growth for the GC during the initial 12
hours that plateaued at maximum growth for the remaining 60 hours when grown
in RPMI, 2% galactose, and 3% glycerol. The GC grown in 2% lactate
demonstrated increasing growth over 72 hours by CFU and OD600 determination.
C. albicans ATCC® 90028™ grown at sub-inhibitory CASPO (0.075 mg/L)
demonstrated similar exponential growth when grown in RPMI and 2% galactose,
but was fungicidal when grown in 2% lactate and 3% glycerol. 2 mg/L CASPO
was fungicidal against C. albicans ATCC® 90028™ in all media tested. The PG
effect was evident at 16 mg/L CASPO in RPMI and 2% galactose by an increase
in OD600 over 72 hours. There was less PG evident by CFU than OD600 (Figure
3.9), likely due to the increased cell growth of large yeast aggregates that grow as
a single CFU but increase overall in cell mass.(Figure 3.14) A statistically
significant increase (p<0.05) in PG OD600 was observed in 2% lactate, but given
the CFU counts are unchanged from the starting inoculum, the increase in
absorbance is likely due to the increase in size of the blastospores and not from
active growth.
Growth curves of C. albicans M10MY4874 for CFU determination
demonstrated exponential growth for the GC during the initial 12 hours that
plateaued at maximum growth for the remaining 60 hours when grown in RPMI,
2% galactose, and 2% lactate. The growth control demonstrated an extended lag
period, only exhibiting increased CFU counts after 48 hours. The GC
demonstrated increased OD600 over the 72 hours, with a 12 hour lag period in 2%

90
lactate and 3% glycerol. 0.075 and 2 mg/L CASPO was fungicidal against C.
albicans M10MY4874 in all media tested. In lactate and glycerol, a significant
increase in OD600 compared to the starting inoculum was observed for 2 mg/L
CASPO, which is contrary to the significant decrease in CFU observed after 72
hours. This could be due to the presence of non-viable blastospores in the sample,
which would contribute to OD600 readings but would not grow in culture. Overall
these results demonstrate a killing effect of CASPO at sub-inhibitory and
inhibitory concentrations. C. albicans M10MY4874 grown at 16 mg/L CASPO
demonstrates the PG effect, in which there is decreased killing compared to the
lower, inhibitory concentrations. No change in growth from the starting inoculum
was observed by CFU determination at 16 mg/L CASPO at 72 hours. Growth
determination by CFU counts is indicative of a fungistatic effect that is not
influenced by carbon source. No significant differences in endpoint OD600
measurements were observed between 2% galactose and RPMI 1640-MOPS , or
between 2% lactate and 3% glycerol.
Despite not achieving statistically significant growth or OD600 readings at
16 mg/L CASPO in all carbon sources, the PG concentrations demonstrated
greater growth than 2 mg/L CASPO for C. albicans ATCC® 90028™ in
fermentable carbon sources and greater growth than the 0.075 and 2 mg/L
CASPO of C. albicans M10MY4874 in all media. The increase in large cell
aggregates in fermentable carbon sources not seen in non-fermentable carbon
sources correlates with a significant difference in degree of PG that is carbon
source dependent.(Figure 3.14)
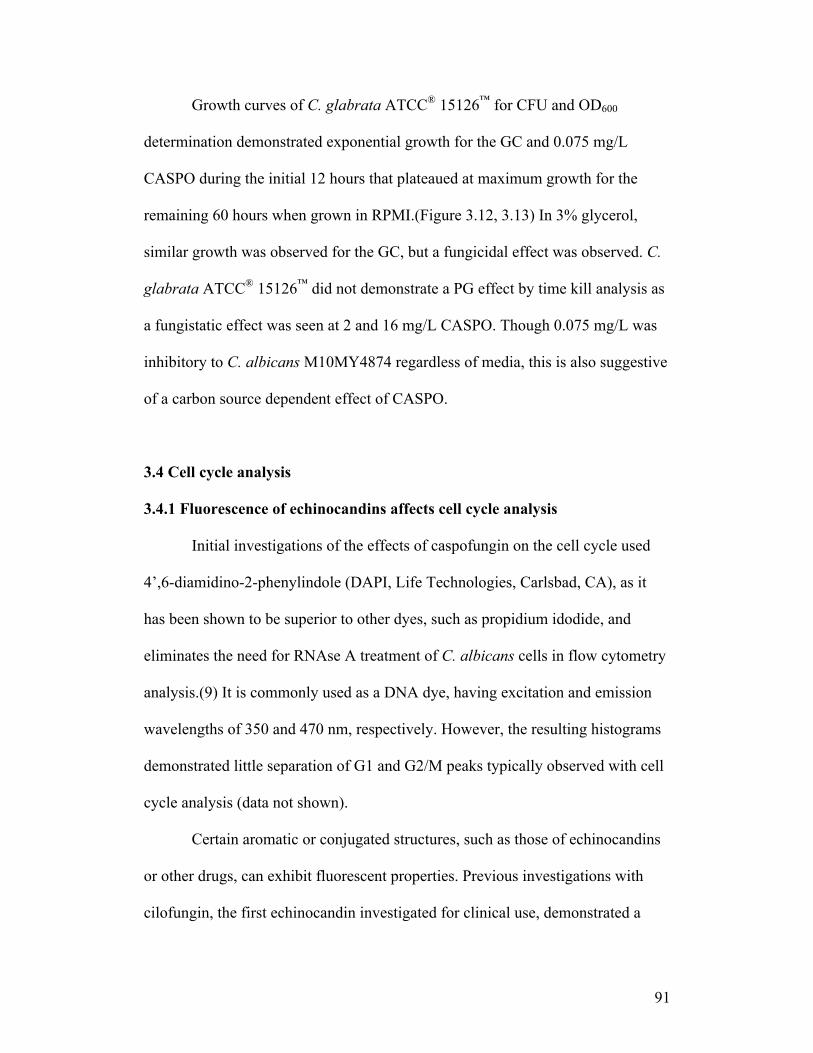
91
Growth curves of C. glabrata ATCC® 15126™ for CFU and OD600
determination demonstrated exponential growth for the GC and 0.075 mg/L
CASPO during the initial 12 hours that plateaued at maximum growth for the
remaining 60 hours when grown in RPMI.(Figure 3.12, 3.13) In 3% glycerol,
similar growth was observed for the GC, but a fungicidal effect was observed. C.
glabrata ATCC® 15126™ did not demonstrate a PG effect by time kill analysis as
a fungistatic effect was seen at 2 and 16 mg/L CASPO. Though 0.075 mg/L was
inhibitory to C. albicans M10MY4874 regardless of media, this is also suggestive
of a carbon source dependent effect of CASPO.
3.4 Cell cycle analysis
3.4.1 Fluorescence of echinocandins affects cell cycle analysis
Initial investigations of the effects of caspofungin on the cell cycle used
4’,6-diamidino-2-phenylindole (DAPI, Life Technologies, Carlsbad, CA), as it
has been shown to be superior to other dyes, such as propidium idodide, and
eliminates the need for RNAse A treatment of C. albicans cells in flow cytometry
analysis.(9) It is commonly used as a DNA dye, having excitation and emission
wavelengths of 350 and 470 nm, respectively. However, the resulting histograms
demonstrated little separation of G1 and G2/M peaks typically observed with cell
cycle analysis (data not shown).
Certain aromatic or conjugated structures, such as those of echinocandins
or other drugs, can exhibit fluorescent properties. Previous investigations with
cilofungin, the first echinocandin investigated for clinical use, demonstrated a

92
blue-shift in emission spectrum when incubated with yeast membranes.(10) While
the chemical structures between the echinocandins are slightly different, it is
likely that the blue-shift fluorescence could interfere with fluorescence readings in
flow cytometry, especially within the blue spectrum (as with DAPI).
Picogreen is a fluorochrome with excitation and emission wavelengths of
502 and 523 nm, and is commonly used in quantifying double stranded DNA.
While no reports exist for its use in cell cycle analysis of yeast, it has been used
with human cells,(11) and the emission spectrum sufficiently different from the
blue spectrum to eliminate the interference from the echinocandin blue-shift. Cell
cycle histograms using Picogreen demonstrated well defined G1 and G2/M peaks.
The difference in histograms between the DAPI and Picogreen fluorochromes
demonstrates that the choice of fluorochrome should be taken into consideration
in future fluorescent analyses with echinocandins.
3.4.2 Caspofungin blocks cell cycle at PG concentrations.
C. albicans M10MY4874 and ATCC® 90028™ isolates were analyzed for
DNA content by flow cytometry over 140 minutes, sampling every 20 minutes.
This time period examined the course of one cell division (approximately 2
hours).(12) The growth control demonstrated an increasing population of cells in
G2 (t0—t120) as cells duplicated DNA content.(Figure 3.15) At 140 minutes, the
proportion of cells in G1 began to increase as cells completed the cell division
with mother and daughter cells separating. Cells treated with 16 mg/L CASPO
(PG) demonstrate a increased proportion of cells in G2 compared to the growth
93
control. The time point (t140) demonstrated almost no PG cells in G1, indicating
an inhibition of the cell cycle at G2 or M at 0.075 mg/L, no effects were observed
for C. albicans ATCC® 90028™, but detrimental cell cycle effects were observed
in C. albicans M10MY4874. The cell cycle of C. glabrata ATCC® 15126™ was
not synchronized by hydroxyurea, but no changes to the cell cycle at any
concentration were observed.

94
Table 3.1. Effects of inoculum density on PG. CASPO concentrations (mg/L) for MIC and PG of 24 C. albicans and 12 C. glabrata isolates evaluated for visible growth and absorbance at 405 nm after 24 hours. Concentrations at which PG resulted in statistically significant increase in absorbance compared to the media control (p<0.05), and concentrations in which PG was only observed by manual plate readings are denoted in brackets. 103 starting inoculum 106 starting inoculum
Isolate MIC PG MIC PG C. albicans
M10MY4874 !0.125 (16) !0.125 16 ATCC® 90028™ !0.125 (16) !0.125 16 (8-32) ATCC® 24433™ !0.125 - !0.125 16-32
M10MY2168 !0.125 - !0.125 8-16 (8-32) M10MY8596 !0.125 (16) !0.125 16 M10MY7506 0.25 (16) 0.25 8-16 M10MY7837 !0.125 - !0.125 16-32 M10MY4875 !0.125 - !0.125 16 (16-32) M10MY5059 !0.125 - !0.125 8 (8-16) M10MY2166 !0.125 - !0.125 8 (8-32) M10MY1585 !0.125 (16) !0.125 16 (8-32) M10MY2938 !0.125 (16) !0.125 16-32 M10MY3029 0.25 - !0.125 16-32 M10MY3028 0.25 - !0.125 8-16 (8-32) M10MY2978 !0.125 - !0.125 (16) M10MY4529 !0.125 - !0.125 16 (16-32) M10MY5068 !0.125 (16) !0.125 16-32 M10MY2333 !0.125 (16) !0.125 16-32 M10MY2222 !0.125 - !0.125 8-16 (8-32) M10MY2678 0.25 (16) !0.125 16 (16-32) M10MY2273 !0.125 - !0.125 16 (16-32) M10MY2883 !0.125 - !0.125 16 (8-32) M10MY2797 0.25 - !0.125 8-16 (8-32) M10MY2163 0.!0.125 - !0.125 16 (8-32)
C. glabrata M06MY000206 0.5 - 0.25 - M06MY000779 0.5 - 0.25 - M06MY001064 0.5 - 0.5 - M06MY002192 0.5 - 0.5 - M06MY002346 0.5 - 0.5 - M06MY002882 0.5 - 0.5 - M06MY003156 0.5 - 0.5 - M06MY003590 1.0 - 1.0 - M06MY003953 0.5 - 0.5 - M06MY004294 0.5 - 0.5 - M10MY001407 0.5 - 0.5 - ATCC® 15126™ 0.5 - 0.5 -
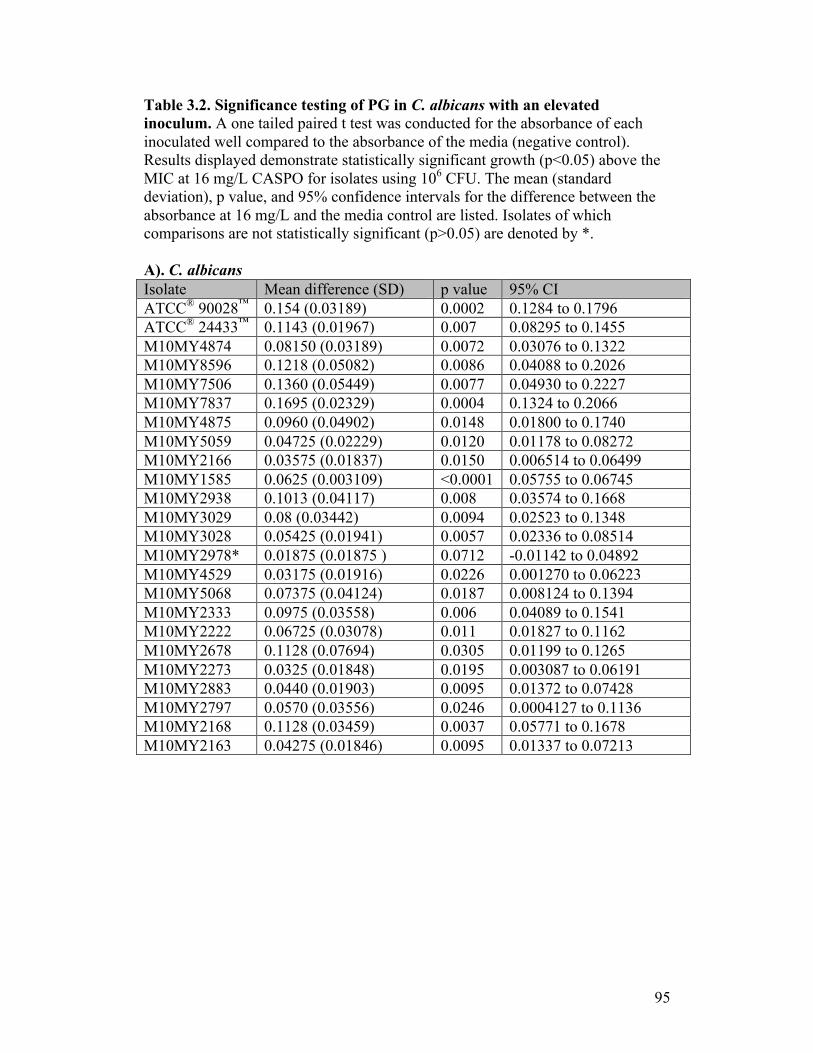
95
Table 3.2. Significance testing of PG in C. albicans with an elevated inoculum. A one tailed paired t test was conducted for the absorbance of each inoculated well compared to the absorbance of the media (negative control). Results displayed demonstrate statistically significant growth (p<0.05) above the MIC at 16 mg/L CASPO for isolates using 106 CFU. The mean (standard deviation), p value, and 95% confidence intervals for the difference between the absorbance at 16 mg/L and the media control are listed. Isolates of which comparisons are not statistically significant (p>0.05) are denoted by *. A). C. albicans Isolate Mean difference (SD) p value 95% CI ATCC® 90028™ 0.154 (0.03189) 0.0002 0.1284 to 0.1796 ATCC® 24433™ 0.1143 (0.01967) 0.007 0.08295 to 0.1455 M10MY4874 0.08150 (0.03189) 0.0072 0.03076 to 0.1322 M10MY8596 0.1218 (0.05082) 0.0086 0.04088 to 0.2026 M10MY7506 0.1360 (0.05449) 0.0077 0.04930 to 0.2227 M10MY7837 0.1695 (0.02329) 0.0004 0.1324 to 0.2066 M10MY4875 0.0960 (0.04902) 0.0148 0.01800 to 0.1740 M10MY5059 0.04725 (0.02229) 0.0120 0.01178 to 0.08272 M10MY2166 0.03575 (0.01837) 0.0150 0.006514 to 0.06499 M10MY1585 0.0625 (0.003109) <0.0001 0.05755 to 0.06745 M10MY2938 0.1013 (0.04117) 0.008 0.03574 to 0.1668 M10MY3029 0.08 (0.03442) 0.0094 0.02523 to 0.1348 M10MY3028 0.05425 (0.01941) 0.0057 0.02336 to 0.08514 M10MY2978* 0.01875 (0.01875 ) 0.0712 -0.01142 to 0.04892 M10MY4529 0.03175 (0.01916) 0.0226 0.001270 to 0.06223 M10MY5068 0.07375 (0.04124) 0.0187 0.008124 to 0.1394 M10MY2333 0.0975 (0.03558) 0.006 0.04089 to 0.1541 M10MY2222 0.06725 (0.03078) 0.011 0.01827 to 0.1162 M10MY2678 0.1128 (0.07694) 0.0305 0.01199 to 0.1265 M10MY2273 0.0325 (0.01848) 0.0195 0.003087 to 0.06191 M10MY2883 0.0440 (0.01903) 0.0095 0.01372 to 0.07428 M10MY2797 0.0570 (0.03556) 0.0246 0.0004127 to 0.1136 M10MY2168 0.1128 (0.03459) 0.0037 0.05771 to 0.1678 M10MY2163 0.04275 (0.01846) 0.0095 0.01337 to 0.07213

96
Table 3.2, continued B). C. glabrata Isolate Mean difference (SD) p value 95% CI M06MY000206* 0.00333 (0.007024) 0.2487 -0.01411 to 0.02078 M06MY000779* 0.0003333 (0.004726) 0.4570 -0.01141 to 0.01207 M06MY001064* -0.006667 (0.006351) 0.1053 -0.02244 to 0.009110 M06MY002192* -0.00200 (0.003606) 0.2190 -0.01096 to 0.006957 M06MY002346* 0.004333 (0.003215) 0.0723 -0.003652 to 0.01232 M06MY002882* 0.003313 (0.003215) 0.1072 -0.004652 to 0.01132 M06MY003156* -0.0006667 (0.003786) 0.3946 -0.01007 to 0.008738 M06MY003590* 0.008667 (0.01779) 0.2438 -0.03552 to 0.05285 M06MY003953* -0.000000 (0.005292) 0.5 -0.01314 to 0.01314 M06MY004294* -0.001333 (0.004726) 0.3367 -0.01307 to 0.01041 M10MY001407* 0.0006667 (0.003786) 0.3946 -0.008738 to 0.01007 ATCC® 15126™* 0.01533 (0.01365) 0.0956 -0.01858 to 0.04924
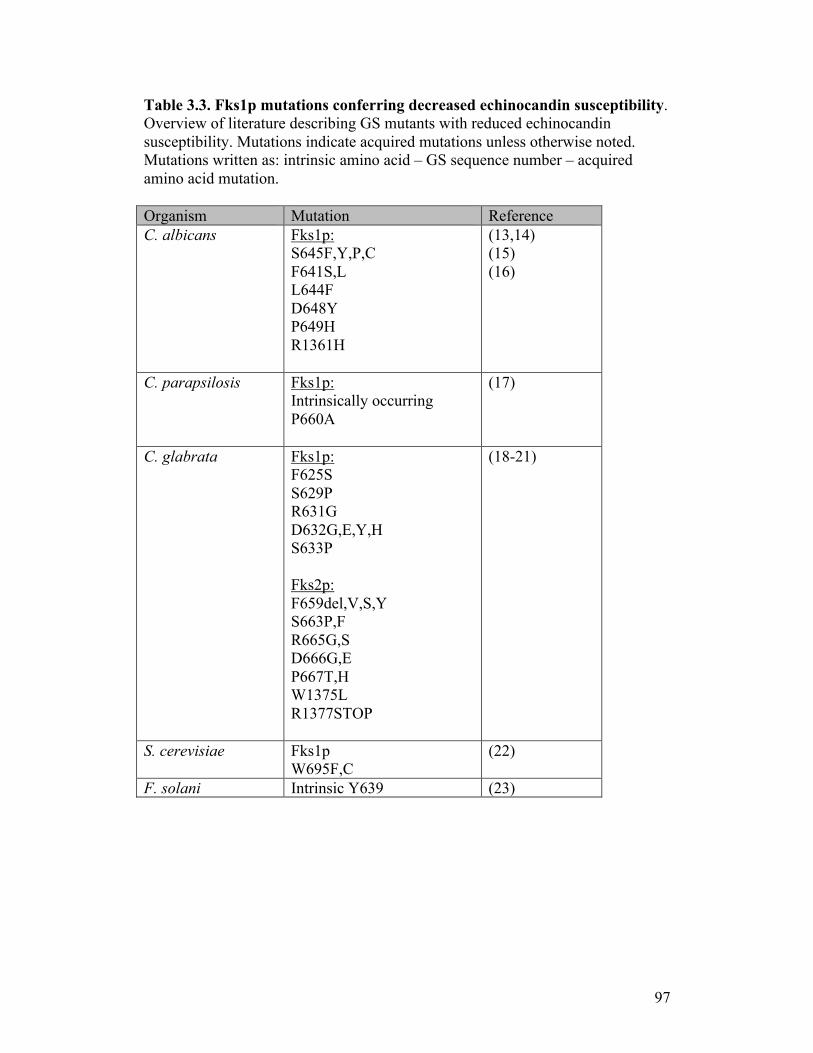
97
Table 3.3. Fks1p mutations conferring decreased echinocandin susceptibility. Overview of literature describing GS mutants with reduced echinocandin susceptibility. Mutations indicate acquired mutations unless otherwise noted. Mutations written as: intrinsic amino acid – GS sequence number – acquired amino acid mutation. Organism Mutation Reference C. albicans Fks1p:
S645F,Y,P,C F641S,L L644F D648Y P649H R1361H
(13,14) (15) (16)
C. parapsilosis Fks1p: Intrinsically occurring P660A
(17)
C. glabrata Fks1p: F625S S629P R631G D632G,E,Y,H S633P Fks2p: F659del,V,S,Y S663P,F R665G,S D666G,E P667T,H W1375L R1377STOP
(18-21)
S. cerevisiae Fks1p W695F,C
(22)
F. solani Intrinsic Y639 (23)

98
A).
Figure 3.1. Absorbance profiles of CASPO microdilution growth patterns. Absorbance readings of A). C. albicans ATCC® 90028™, B). C. albicans ATCC® 24433™, and C). C. glabrata ATCC® 15126™ exposed to CASPO at 103 (blue) and 106 (red) starting inocula assessed by broth microdilution at 24 hours. Plotted absorbance readings (405nm) represent the average of three independent replicates after removal of baseline (media control). Error bars represent standard error of measure. *Statistically significant growth above the MIC (p<0.05)
00.1
25 0.25 0.5 1 2 4 8 16 32 64
0.0
0.2
0.4
0.6
0.8
1.0 C. albicans ATCC® 90028™
CASPO (mg/L)
Abs
orba
nce (
405
nm)
***

99
B).
C).
Figure 3.1, continued
00.1
25 0.25 0.5 1 2 4 8 16 32 64
0.0
0.2
0.4
0.6
0.8
1.0 C. albicans ATCC® 24433™
CASPO (mg/L)
Abs
orba
nce (
405
nm)
* *
00.1
25 0.25 0.5 1 2 4 8 16 32 64
0.0
0.2
0.4
0.6
0.8
1.0 C. glabrata ATCC® 15126™
CASPO (mg/L)
Abs
orba
nce (
405
nm)

(A).
C. a
lbic
ans A
TC
C® 9
0028
™
Fi
gure
3.2
. Ste
reom
icro
scop
y of
CA
SPO
mic
rodi
lutio
n gr
owth
pat
tern
s. In
divi
dual
wel
ls o
f 96-
wel
l mic
rodi
lutio
n pl
ates
co
ntai
ning
C. a
lbic
ans o
r C. g
labr
ata
expo
sed
to C
ASP
O fo
r 24
hour
s wer
e vi
sual
ized
and
pho
togr
aphe
d un
der a
ster
eom
icro
scop
e at
1.
2X m
agni
ficat
ion
to c
ompa
re P
G o
f sta
ndar
d (1
03 , upp
er im
age)
and
incr
ease
d (1
06 , low
er im
age)
inoc
ula.
Ref
eren
ce st
rain
s (A
) C.
albi
cans
ATC
C®
900
28™
and
(B) C
. gla
brat
a A
TCC
® 1
5126
™ a
re sh
own
as re
pres
enta
tive
orga
nism
s. N
umbe
rs a
bove
imag
es
indi
cate
CA
SPO
con
cent
ratio
ns (m
g/L)
, the
gro
wth
con
trol (
GC
), an
d ne
gativ
e co
ntro
l (N
eg).
Scal
e ba
rs re
pres
ent 1
mm
. (C
). U
ncom
pres
sed
imag
es o
f C. a
lbic
ans A
TCC
® 9
0028
™ d
emon
stra
te a
den
se p
elle
t of t
he g
row
th c
ontro
ls c
ompa
red
to th
e hi
ghly
di
sper
sed
grow
th o
f PG
cel
ls. S
cale
bar
s rep
rese
nt 0
.5 m
m.

(B).
C. g
labr
ata
AT
CC
® 1
5126
™
Fi
gure
3.2
, con
tinue
d
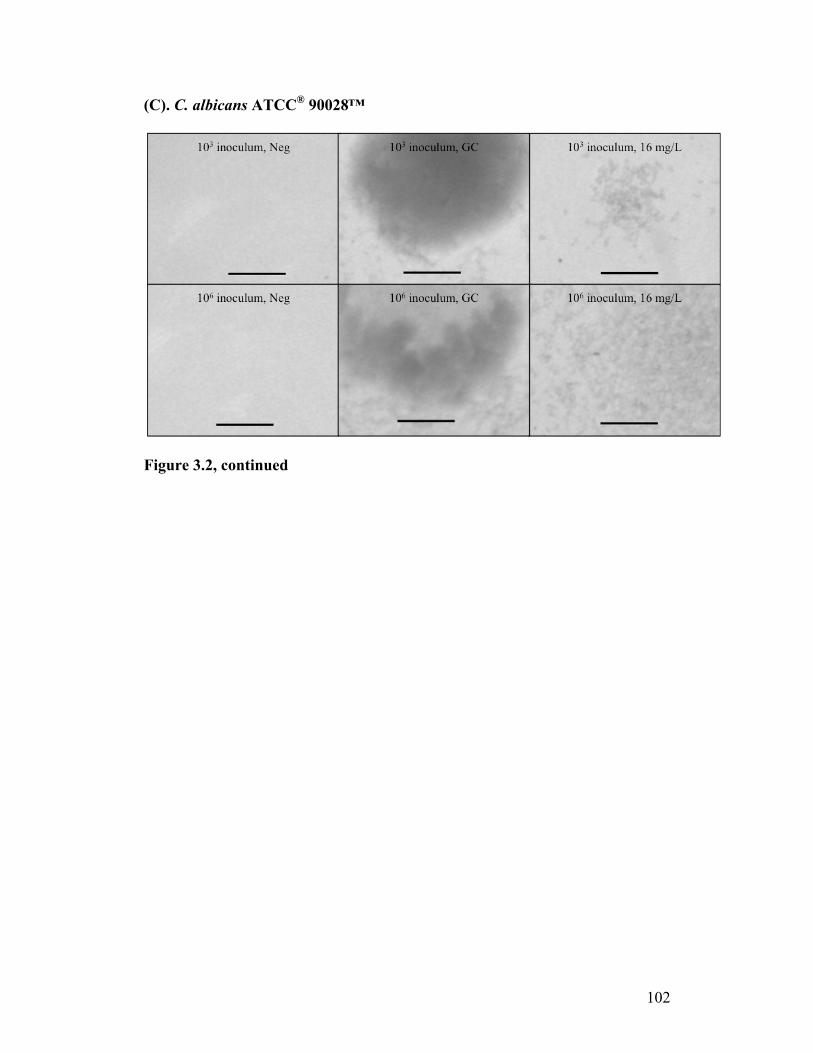
102
(C). C. albicans ATCC® 90028™
Figure 3.2, continued

103
Figure 3.3. “Hot-spot” sequence comparisons. Aligned sequences corresponding to S. cerevisiae Fks1p at amino acids 635-649 (HS1), 690-700 (HS3), and 1354-1361 (HS2) were examined to evaluate correlations between hot-spot sequence and response to CASPO. HS1-3 are the putative binding sites of echinocandins with GS and mutations in susceptible organisms correlate with decreased susceptibility; amino acids associated with decreased susceptibility when mutated are highlighted in yellow. Conserved sites in the primary GS (Fks1p or Bgs4p) are denoted by *.
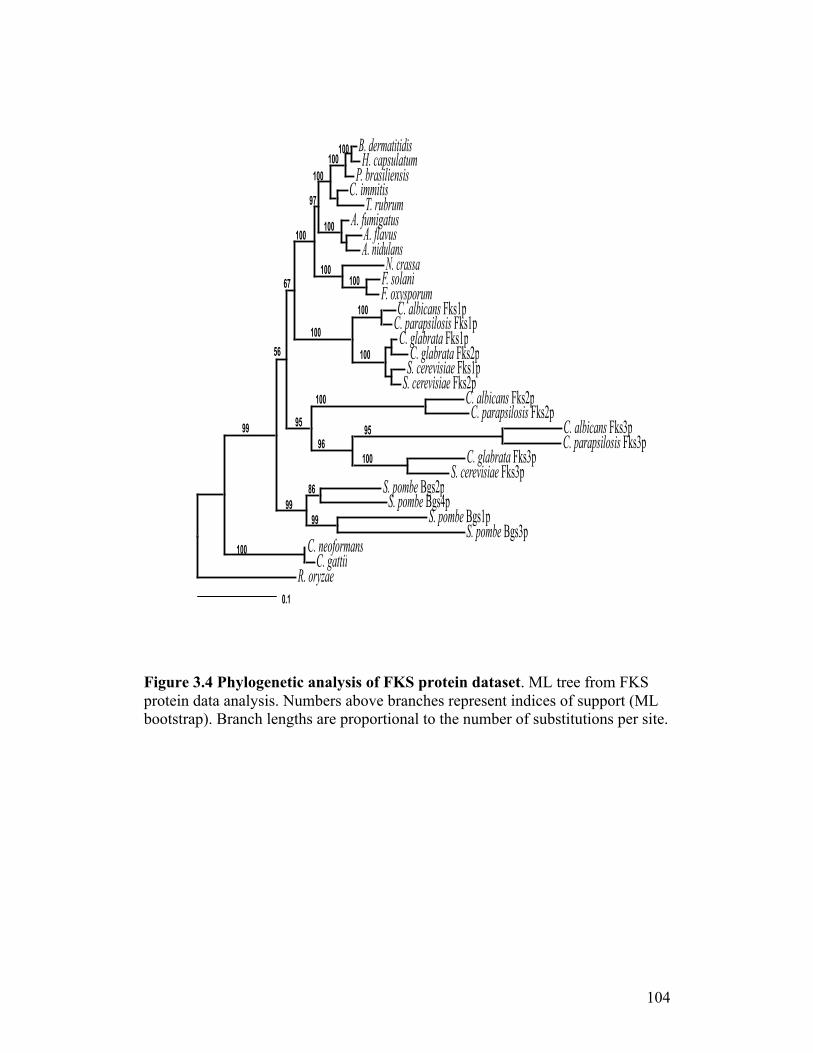
104
Figure 3.4 Phylogenetic analysis of FKS protein dataset. ML tree from FKS protein data analysis. Numbers above branches represent indices of support (ML bootstrap). Branch lengths are proportional to the number of substitutions per site.
8"#57)%-&$&$5$'>"#0-,'*.-&*%A"#+)-'$.$71'$'!"#$%%$&$'
("#)*+)*%2"#3*%$9-&*'2"#3.-4*'2"#1$5*.-1'
:"#0)-''-;"#'/.-1$;"#/<=',/)*%
!"#-.+$0-1'#"#$%&!"#,-)-,'$./'$'!"#$%&!"#9.-+)-&-!"#$%&!"#9.-+)-&-!"#$'&6"#07)74$'$-7!"#$%&6"#07)74$'$-7!"#$'&
!"#-.+$0-1'#"#$'&!"#,-)-,'$./'$'!"#$'&
!"#-.+$0-1'#"#$*&!"#,-)-,'$./'$'!"#$*&
!"#9.-+)-&-!"#$*&6"#07)74$'$-7!"#$*&
6"#,/%+7!()$'&6"#,/%+7!()$+&
6"#,/%+7!()$%&6"#,/%+7!()$*&
!"#17/3/)%-1'!"#9-&&$$
?"#/)=@-7"(!
!""
##
!""
$%
!""
!""
!""
!""
!""!""
!""
!""!""
!""
#&
%&
'%
#%
#'
####
#'
!""

105
Figure 3.5. Phylogenetic analysis of FKS nucleotide dataset. ML tree from FKS nucleotide data analysis. Numbers above branches represent indices of support (ML bootstrap). Branch lengths are proportional to nucleotide substitutions per site. The red branch (S. pombe) is divergent from the known species tree.

106
Figure 3.6. FKS gene duplications in yeast. Reconciled FKS gene tree from known species tree generated by Notung v2.6. Red squares indicate gene duplication events; other than the WGD event for C. glabrata and S. cerevisiae, all duplications are SSD. Blue strike through on blue branches indicates gene loss.
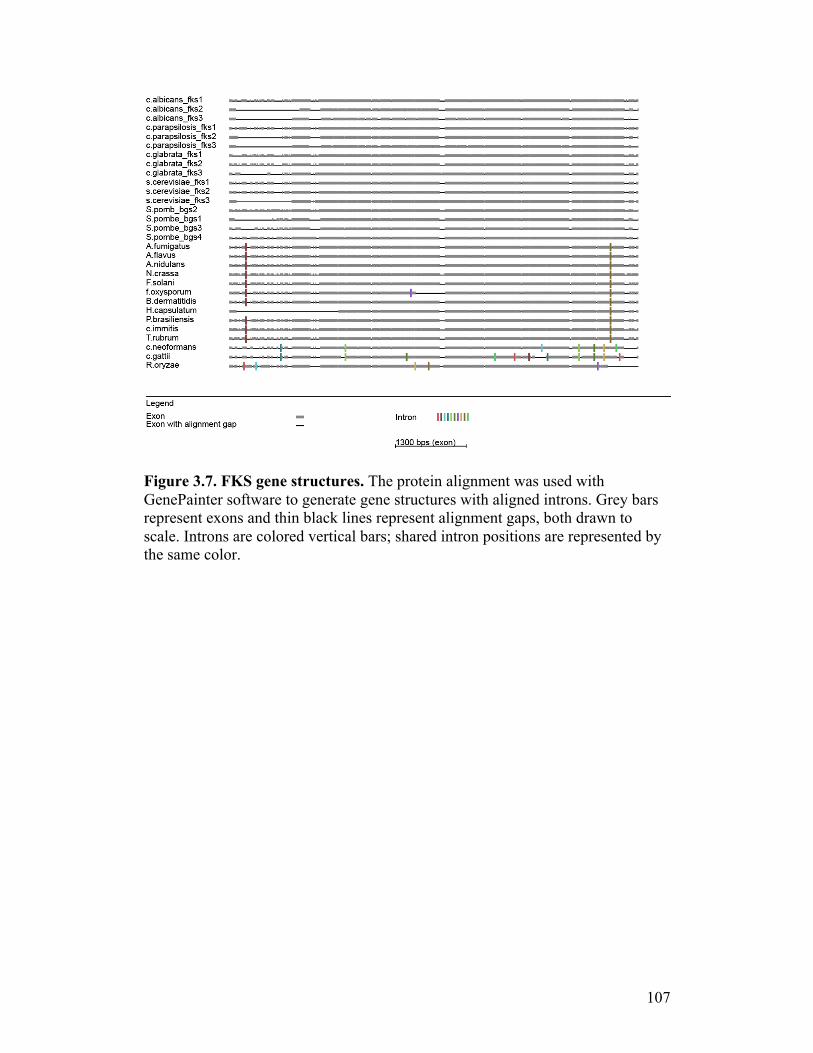
107
Figure 3.7. FKS gene structures. The protein alignment was used with GenePainter software to generate gene structures with aligned introns. Grey bars represent exons and thin black lines represent alignment gaps, both drawn to scale. Introns are colored vertical bars; shared intron positions are represented by the same color.

108
A). C. albicans ATCC® 90028™ - RPMI
Figure 3.8. Time kill analysis of C. albicans ATCC® 90028™ exposed to CASPO grown in different carbon sources. Growth of C. albicans ATCC® 90028™ exposed to 0 (blue), 0.075 (red), 2 (green), and 16 mg/L (purple) CASPO in A). RPMI, B). 2% galactose, C). 2% lactate, and D). 3% glycerol. Growth was measured over 72 hours by CFU and OD600. Overall growth at 72 hours (endpoint) was evaluated for CFU and OD600 by comparing endpoint and starting inoculum by student’s t-test. Figures represent three experimental repeats (mean ±SD). Significant inhibition below or growth above the starting inoculum (p < 0.05) is indicated by *. GC for all media tested demonstrated significant growth. Dotted line represents the starting inoculum (average of t0).
0 20 40 60
104
105
106
107
108
Time (hr)
CFU
(cell
s per
ml)
CFU RPMI
0 20 40 600.0
0.2
0.4
0.6
0.8
1.0
Time (hr)
Abs
orba
nce (
OD
600)
OD600 RPMI
104
105
106
107
108
CFU
(cel
ls p
er m
l)
CFU RPMI 72 hr endpoints
*
*
*
0.0
0.2
0.4
0.6
0.8
1.0A
bsor
banc
e (O
D60
0)OD600 RPMI 72 hr endpoints
*
*
GC 0.075 mg/L 2 mg/L PG (16 mg/L)

109
B) C. albicans ATCC® 90028™ - 2% Galactose
Figure 3.8, continued
0 20 40 60
103
104
105
106
107
108
Time (hr)
CFU
(cel
ls p
er m
l)
CFU 2% Galactose
0 20 40 600.0
0.2
0.4
0.6
0.8
1.0
1.2
1.4
Time (hr)
Abs
orba
nce (
OD
600)
OD600 2% Galactose
103
104
105
106
107
108
CFU
(cel
ls p
er m
l)
CFU 2% Galactose 72 hr endpoints
*
*
*
0.0
0.2
0.4
0.6
0.8
1.0
1.2
1.4
Abs
orba
nce (
OD
600)
OD600 2% Galactose 72 hr endpoints
**
*
GC 0.075 mg/L 2 mg/L PG (16 mg/L)

110
C). C. albicans ATCC® 90028™ - 2% Lactates
Figure 3.8, continued
0 20 40 60
105
106
107
108
109
Time (hr)
CFU
(cell
s per
ml)
CFU 2% Lactate
0 20 40 600.0
0.2
0.4
0.6
Time (hr)
Abs
orba
nce (
OD
600)
OD600 2% Lactate
105
106
107
108
109
CFU
(cel
ls p
er m
l)
CFU 2% Lactate 72 hr endpoints
**
0.0
0.2
0.4
0.6
Abs
orba
nce (
OD
600)
OD600 2% Lactate 72 hr endpoints
*
GC 0.075 mg/L 2 mg/L PG (16 mg/L)
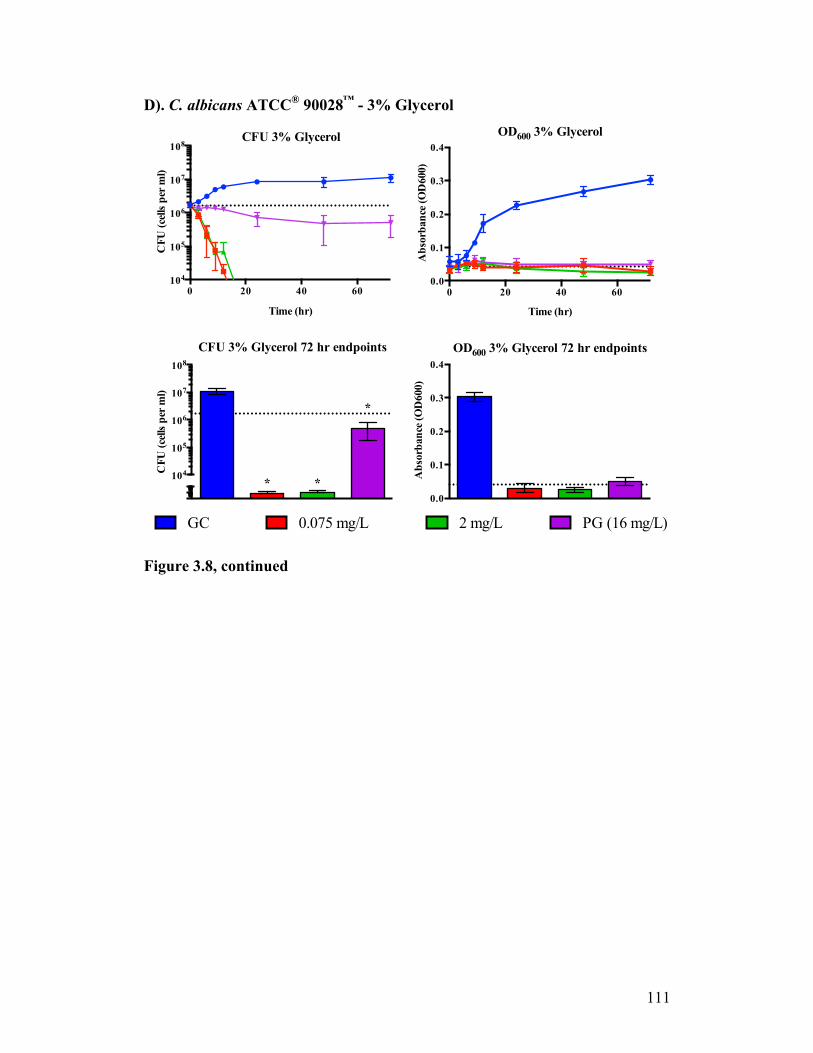
111
D). C. albicans ATCC® 90028™ - 3% Glycerol
Figure 3.8, continued
0 20 40 60104
105
106
107
108
Time (hr)
CFU
(cel
ls p
er m
l)
CFU 3% Glycerol
0 20 40 600.0
0.1
0.2
0.3
0.4
Time (hr)
Abs
orba
nce (
OD
600)
OD600 3% Glycerol
104
105
106
107
108
CFU
(cel
ls p
er m
l)
CFU 3% Glycerol 72 hr endpoints
* *
*
0.0
0.1
0.2
0.3
0.4
Abs
orba
nce (
OD
600)
OD600 3% Glycerol 72 hr endpoints
GC 0.075 mg/L 2 mg/L PG (16 mg/L)

112
A). C. albicans ATCC® 90028™ - CFU endpoint comparisons
Figure 3.9. Comparative analysis of time kill endpoints: C. albicans ATCC® 90028™. Final growth (endpoints) were determined by A). CFU and B). OD600 for C. albicans ATCC® 90028™ grown in 2% galactose, RPMI, 2% lactate, or 3% glycerol exposed to 0, 0.075, 2, and 16 mg/L CASPO after 72 hours. Endpoints for a given growth condition were compared by a repeated measures one-way ANOVA with the Greisser-Greenhouse correction. For those comparisons indicating a statistically significant difference between one or more growth conditions by ANOVA, a Tukey’s corrected comparison was performed to compare every mean to every other mean. Figures represent three experimental repeats (mean ±SD). Significant differences between endpoints (p < 0.05) are indicated by *.
106
107
108
109C
FU (c
ells
per
ml)
GC 72 hr endpoints - CFU
***
*
104
105
106
107
CFU
(cel
ls p
er m
l)
16 mg/L (PG) 72 hr endpoints - CFU
* *
100
101
102
103
104
105
106
107
108
CFU
(cel
ls p
er m
l)
0.075 mg/L 72 hr endpoints - CFU
*
*
100
101
102
103
104
105
106
107
CFU
(cel
ls p
er m
l)
2 mg/L 72 hr endpoints - CFU
*
Galactose RPMI Lactate Glycerol

113
B). C. albicans ATCC® 90028™ - OD600 endpoint comparisons
Figure 3.9, continued
0.0
0.5
1.0
1.5
2.0O
D60
0GC 72 hr endpoints - OD600
*
**
0.0
0.1
0.2
0.3
0.4
0.5
OD
600
PG (16 mg/L) 72 hr endpoints - OD600
*
**
0.0
0.2
0.4
0.6
0.8
1.0
OD
600
0.075 mg/L 72 hr endpoints - OD600
*
**
0.00
0.05
0.10
0.15
OD
600
2 mg/L 72 hr endpoints - OD600
*
Galactose RPMI Lactate Glycerol

114
A). C. albicans M10MY4874 - RPMI
Figure 3.10. Time kill analysis of C. albicans M10MY4874 exposed to CASPO grown in different carbon sources. Growth of C. albicans M10MY4874 exposed to 0 (blue), 0.075 (red), 2 (green), and 16 mg/L (purple) CASPO in A). RPMI, B). 2% galactose, C). 2% lactate, and D). 3% glycerol. Growth was measured over 72 hours by CFU and OD600. Overall growth at 72 hours (endpoint) was evaluated for CFU and OD600 by comparing endpoint and starting inoculum by student’s t-test. Figures represent 3 experimental repeats (mean ±SD). Significant inhibition below or growth above the starting inoculum (p < 0.05) is indicated by *. GC for all media tested demonstrated significant growth. Dotted line represents the starting inoculum (average of t0).
0 20 40 60
104
105
106
107
108
Time (hr)
CFU
(cell
s per
ml)
RPMI - CFU
0 20 40 600.0
0.2
0.4
0.6
0.8
1.0
Time (hr)
Abs
orba
nce (
OD
600)
RPMI - OD600
104
105
106
107
108
CFU
(cel
ls p
er m
l)
RPMI 72 hr endpoints - CFU
* *
0.0
0.2
0.4
0.6
0.8
1.0
Abs
orba
nce (
OD
600)
RPMI 72 hr endpoints - OD600
*
GC 0.075 mg/L 2 mg/L PG (16 mg/L)

115
B). C. albicans M10MY4874 - 2% Galactose
Figure 3.10, continued
0 20 40 60
103
104
105
106
107
108
Time (hr)
CFU
(cel
ls p
er m
l)
2% Galactose - CFU
0 20 40 600.0
0.5
1.0
1.5
2.0
Time (hr)
Abs
orba
nce (
OD
600)
2% Galactose - OD600
103
104
105
106
107
108
CFU
(cel
ls p
er m
l)
2% Galactose 72 hr endpoints - CFU
* *
0.0
0.5
1.0
1.5
2.0
Abs
orba
nce (
OD
600)
2% Galactose 72 hr endpoints - OD600
*
GC 0.075 mg/L 2 mg/L PG (16 mg/L)
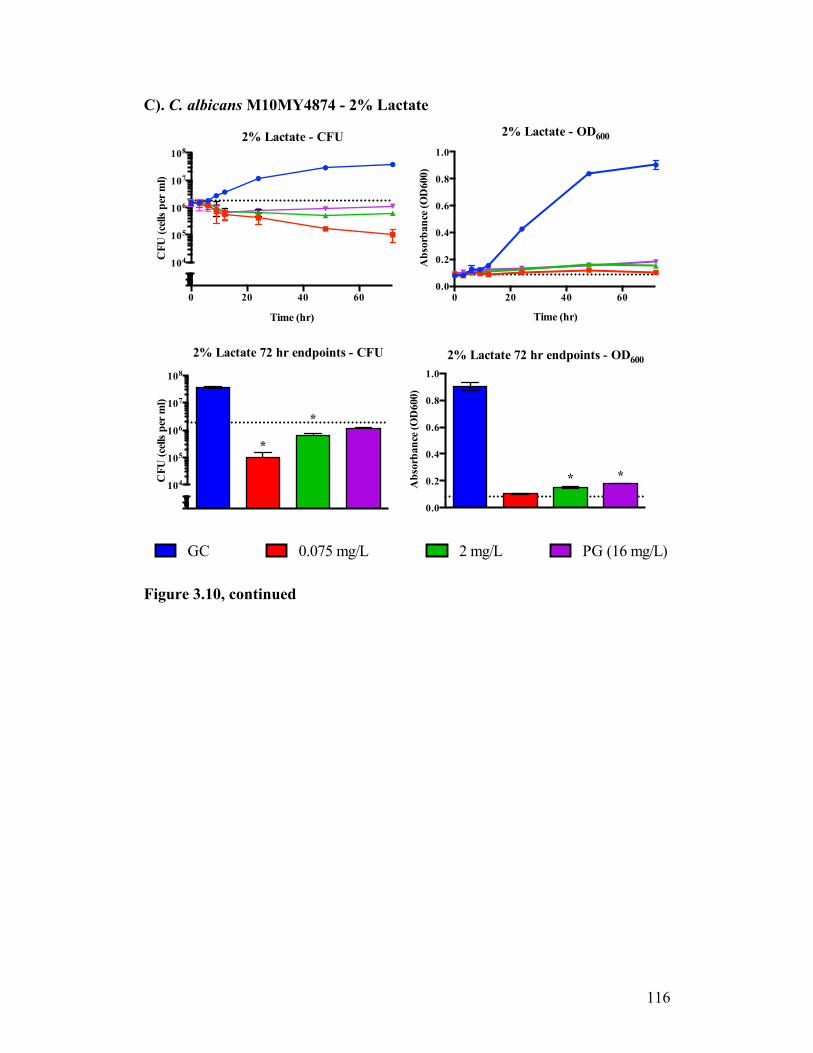
116
C). C. albicans M10MY4874 - 2% Lactate
Figure 3.10, continued
0 20 40 60
104
105
106
107
108
Time (hr)
CFU
(cell
s per
ml)
2% Lactate - CFU
0 20 40 600.0
0.2
0.4
0.6
0.8
1.0
Time (hr)
Abs
orba
nce (
OD
600)
2% Lactate - OD600
104
105
106
107
108
CFU
(cel
ls p
er m
l)
2% Lactate 72 hr endpoints - CFU
*
*
0.0
0.2
0.4
0.6
0.8
1.0
Abs
orba
nce (
OD
600)
2% Lactate 72 hr endpoints - OD600
* *
GC 0.075 mg/L 2 mg/L PG (16 mg/L)
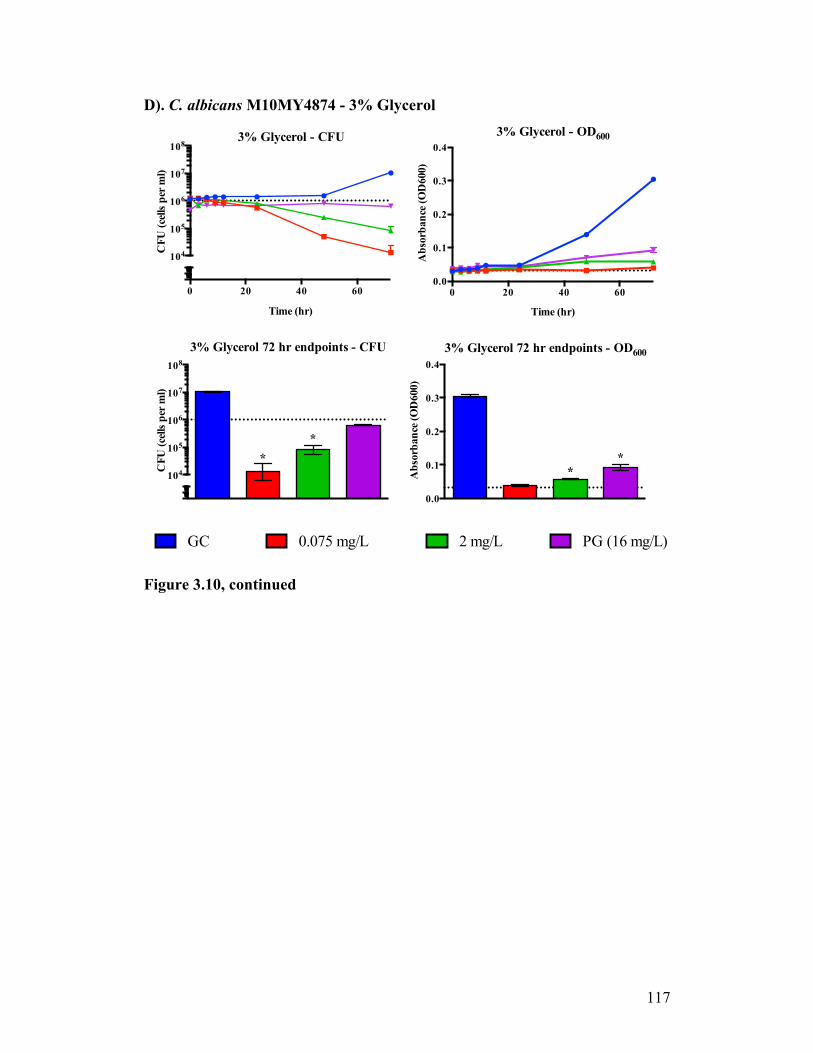
117
D). C. albicans M10MY4874 - 3% Glycerol
Figure 3.10, continued
0 20 40 60
104
105
106
107
108
Time (hr)
CFU
(cel
ls p
er m
l)
3% Glycerol - CFU
0 20 40 600.0
0.1
0.2
0.3
0.4
Time (hr)
Abs
orba
nce (
OD
600)
3% Glycerol - OD600
104
105
106
107
108
CFU
(cel
ls p
er m
l)
3% Glycerol 72 hr endpoints - CFU
**
0.0
0.1
0.2
0.3
0.4
Abs
orba
nce (
OD
600)
3% Glycerol 72 hr endpoints - OD600
**
GC 0.075 mg/L 2 mg/L PG (16 mg/L)
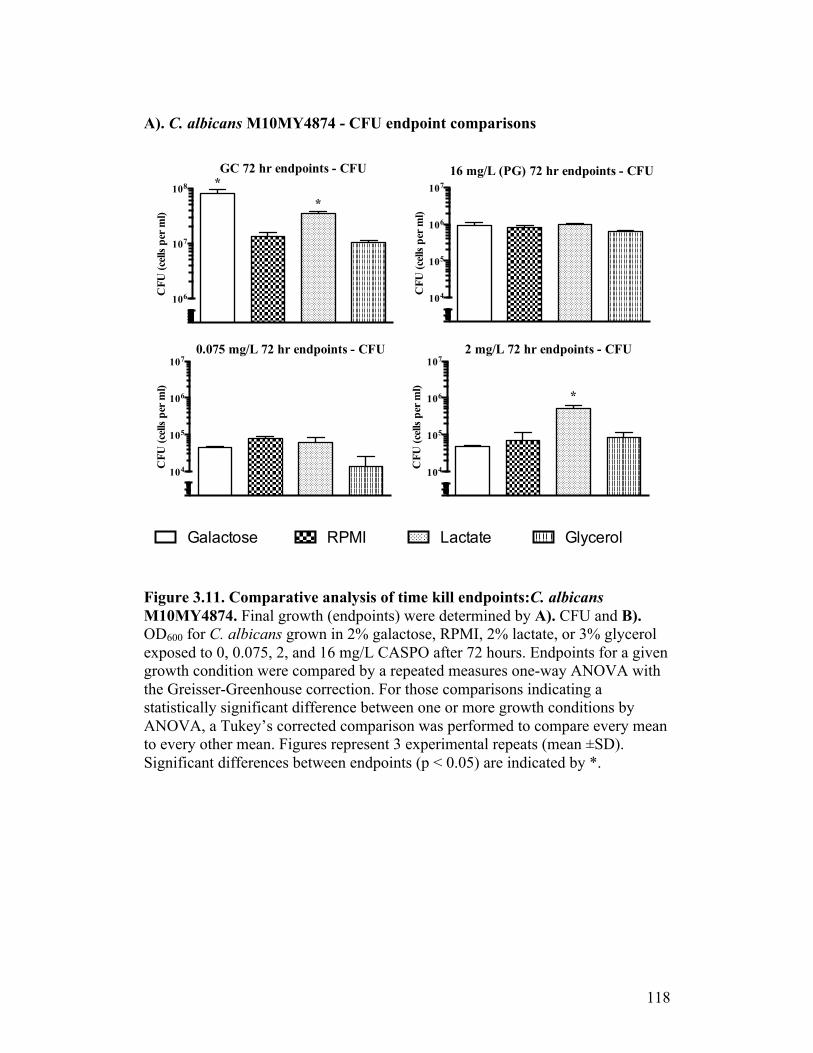
118
A). C. albicans M10MY4874 - CFU endpoint comparisons
Figure 3.11. Comparative analysis of time kill endpoints:C. albicans M10MY4874. Final growth (endpoints) were determined by A). CFU and B). OD600 for C. albicans grown in 2% galactose, RPMI, 2% lactate, or 3% glycerol exposed to 0, 0.075, 2, and 16 mg/L CASPO after 72 hours. Endpoints for a given growth condition were compared by a repeated measures one-way ANOVA with the Greisser-Greenhouse correction. For those comparisons indicating a statistically significant difference between one or more growth conditions by ANOVA, a Tukey’s corrected comparison was performed to compare every mean to every other mean. Figures represent 3 experimental repeats (mean ±SD). Significant differences between endpoints (p < 0.05) are indicated by *.
106
107
108
CFU
(cel
ls p
er m
l)GC 72 hr endpoints - CFU
*
*
104
105
106
107
CFU
(cel
ls p
er m
l)
16 mg/L (PG) 72 hr endpoints - CFU
104
105
106
107
CFU
(cel
ls p
er m
l)
0.075 mg/L 72 hr endpoints - CFU
104
105
106
107
CFU
(cel
ls p
er m
l)
2 mg/L 72 hr endpoints - CFU
*
Galactose RPMI Lactate Glycerol

119
B). C. albicans M10MY4874 - OD600 endpoint comparisons
Figure 3.11, continued
0.0
0.5
1.0
1.5
2.0O
D60
0GC 72 hr endpoints - OD600
ns
*
*
0.0
0.1
0.2
0.3
0.4
0.5
OD
600
PG (16 mg/L) 72 hr endpoints - OD600
*
0.00
0.05
0.10
0.15
0.20
OD
600
0.075 mg/L 72 hr endpoints - OD600
*
0.00
0.05
0.10
0.15
0.20
OD
600
2 mg/L 72 hr endpoints - OD600*
Galactose RPMI Lactate Glycerol
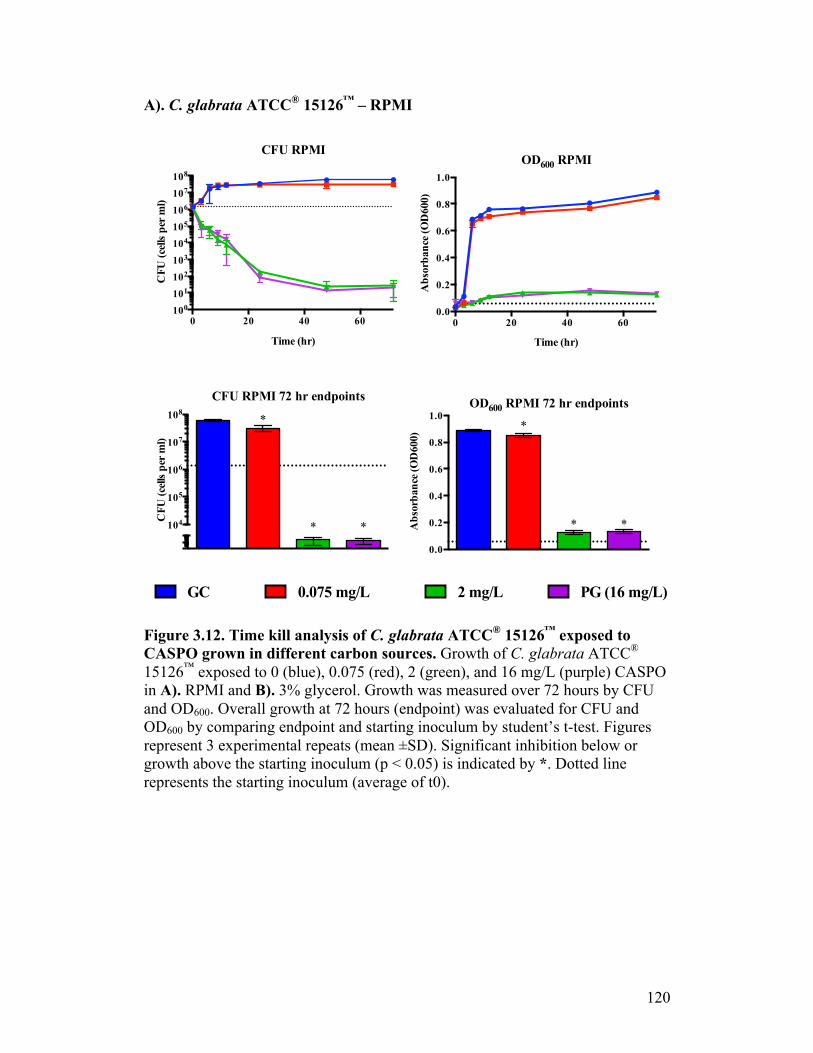
120
A). C. glabrata ATCC® 15126™ – RPMI
Figure 3.12. Time kill analysis of C. glabrata ATCC® 15126™ exposed to CASPO grown in different carbon sources. Growth of C. glabrata ATCC® 15126™ exposed to 0 (blue), 0.075 (red), 2 (green), and 16 mg/L (purple) CASPO in A). RPMI and B). 3% glycerol. Growth was measured over 72 hours by CFU and OD600. Overall growth at 72 hours (endpoint) was evaluated for CFU and OD600 by comparing endpoint and starting inoculum by student’s t-test. Figures represent 3 experimental repeats (mean ±SD). Significant inhibition below or growth above the starting inoculum (p < 0.05) is indicated by *. Dotted line represents the starting inoculum (average of t0).
0 20 40 60100
101
102
103
104
105
106
107
108
Time (hr)
CFU
(cell
s per
ml)
CFU RPMI
0 20 40 600.0
0.2
0.4
0.6
0.8
1.0
Time (hr)
Abs
orba
nce (
OD
600)
OD600 RPMI
104
105
106
107
108
CFU
(cel
ls p
er m
l)
CFU RPMI 72 hr endpoints
**
*
0.0
0.2
0.4
0.6
0.8
1.0A
bsor
banc
e (O
D60
0)OD600 RPMI 72 hr endpoints
*
* *
GC 0.075 mg/L 2 mg/L PG (16 mg/L)
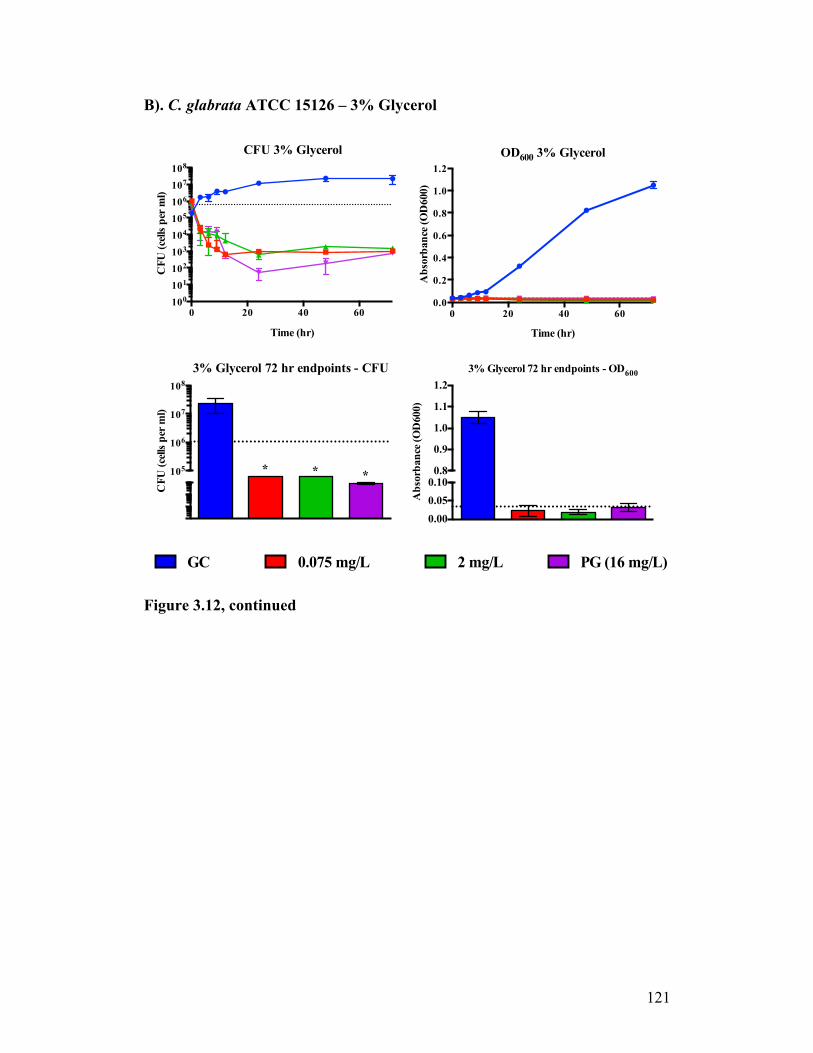
121
B). C. glabrata ATCC 15126 – 3% Glycerol
Figure 3.12, continued
0 20 40 60100
101
102
103
104
105
106
107
108
Time (hr)
CFU
(cel
ls p
er m
l)CFU 3% Glycerol
0 20 40 600.0
0.2
0.4
0.6
0.8
1.0
1.2
Time (hr)
Abs
orba
nce (
OD
600)
OD600 3% Glycerol
105
106
107
108
CFU
(cel
ls p
er m
l)
3% Glycerol 72 hr endpoints - CFU
***
0.000.050.100.8
0.9
1.0
1.1
1.2
Abs
orba
nce (
OD
600)
3% Glycerol 72 hr endpoints - OD600
GC 0.075 mg/L 2 mg/L PG (16 mg/L)

122
A) C. glabrata ATCC® 15126™ - CFU endpoint comparisons
Figure 3.13. Comparative analysis of time kill endpoints: C. glabrata ATCC® 15126™ . Final growth (endpoints) were determined by A). CFU and B). OD600 for C. glabrata ATCC® 15126™ grown in RPMI or 3% glycerol exposed to 0, 0.075, 2, and 16 mg/L CASPO after 72 hours. Endpoints for a given growth condition were compared by a two-tailed paired student’s t-test. Figures represent 3 experimental repeats (mean ±SD). Significant differences between endpoints (p < 0.05) are indicated by *.
106
107
108
CFU
(cel
ls p
er m
l)
GC 72 hr endpoints - CFU
*
1
10
100
1000
CFU
(cel
ls p
er m
l)
16 mg/L (PG) 72 hr endpoints - CFU*
100
101
102
103
104
105
106
107
108
CFU
(cel
ls p
er m
l)
0.075 mg/L 72 hr endpoints - CFU*
1
10
100
1000
10000
CFU
(cel
ls p
er m
l)
2 mg/L 72 hr endpoints - CFU
*
RPMI Glycerol

123
B). C. glabrata ATCC® 15126™ - OD600 endpoint comparisons
Figure 3.13, continued
0.0
0.2
0.4
0.6
0.8
1.0
1.2
1.4
OD
600
GC 72 hr endpoints - OD600
*
0.00
0.05
0.10
0.15
0.20
OD
600
PG (16 mg/L) 72 hr endpoints - OD600
*
0.0
0.2
0.4
0.6
0.8
1.0
OD
600
0.075 mg/L 72 hr endpoints - OD600
*
0.00
0.05
0.10
0.15
OD
600
2 mg/L 72 hr endpoints - OD600
*
RPMI Glycerol

124
A) C. albicans ATCC® 90028™
Figure 3.14. Light microscopy of yeast exposed to CASPO in different carbon sources. Samples were photographed by light microscopy (400X) after 72 hours.
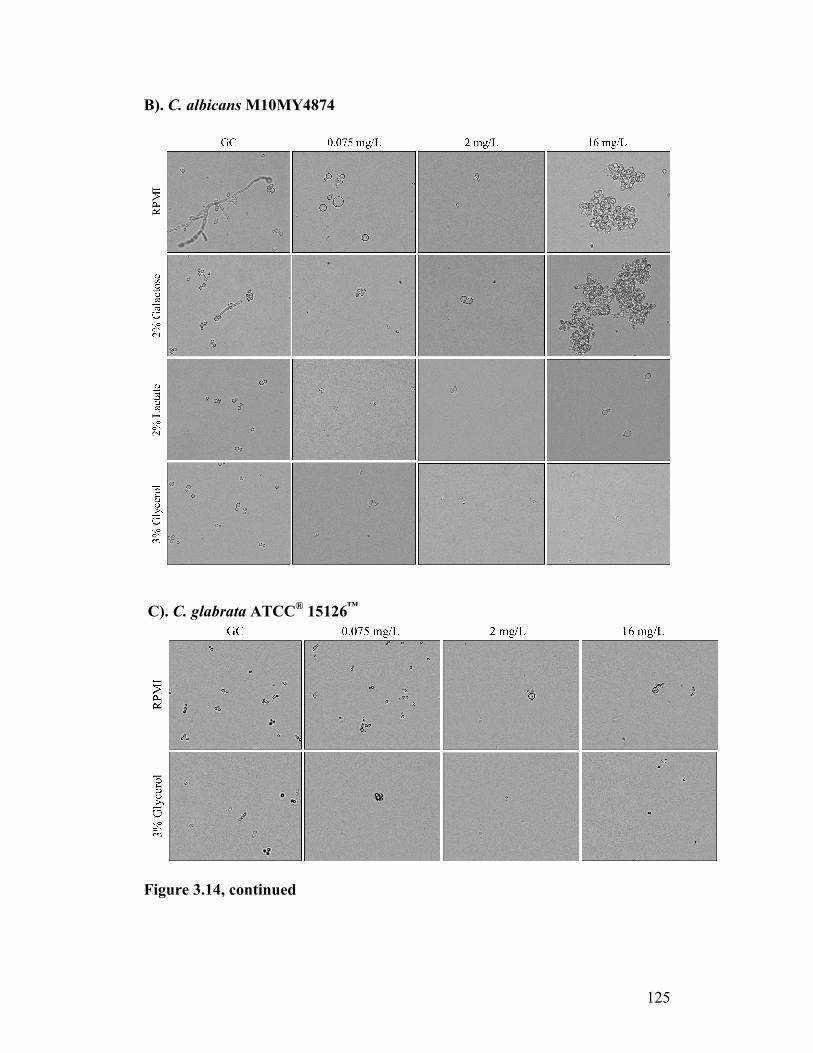
125
B). C. albicans M10MY4874
C). C. glabrata ATCC® 15126™
Figure 3.14, continued
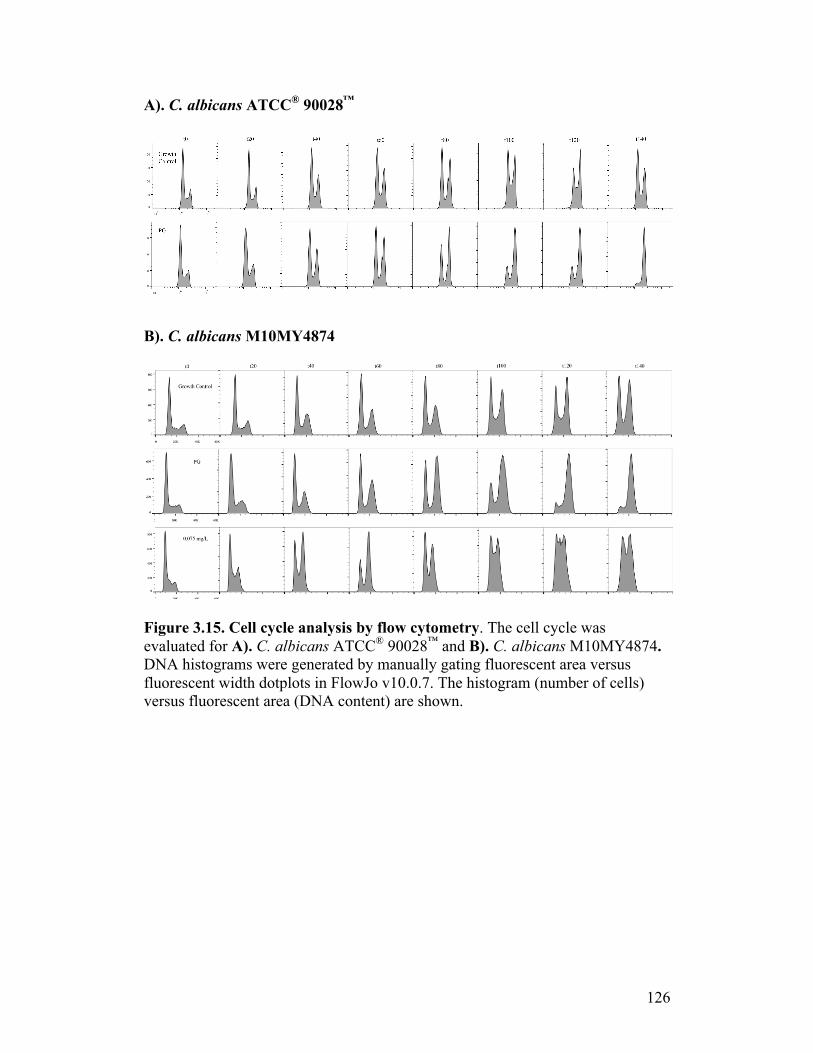
126
A). C. albicans ATCC® 90028™
B). C. albicans M10MY4874
Figure 3.15. Cell cycle analysis by flow cytometry. The cell cycle was evaluated for A). C. albicans ATCC® 90028™ and B). C. albicans M10MY4874. DNA histograms were generated by manually gating fluorescent area versus fluorescent width dotplots in FlowJo v10.0.7. The histogram (number of cells) versus fluorescent area (DNA content) are shown.

127
3.5. References 1. Pfaller MA, Diekema DJ, Andes D, Arendrup MC, Brown SD, Lockhart
SR, et al. Clinical breakpoints for the echinocandins and Candida revisited: Integration of molecular, clinical, and microbiological data to arrive at species-specific interpretive criteria. Drug Resist Updat. 2011;14(3):164–76.
2. Bartizal C, Odds FC. Influences of methodological variables on susceptibility testing of caspofungin against Candida species and Aspergillus fumigatus. Antimicrob Agents Chemother. 2003;47(7):2100–7.
3. Thompson JD, Higgins DG, Gibson TJ. CLUSTAL W: improving the sensitivity of progressive multiple sequence alignment through sequence weighting, position-specific gap penalties and weight matrix choice. Nucleic Acids Res. 1994;22(22):4673–80.
4. Morrison DA. L. A. S. JOHNSON REVIEW No. 8. Multiple sequence alignment for phylogenetic purposes. Aust Systematic Bot. 2006;19(6):479.
5. Chang J-M, Di Tommaso P, Taly J-F, Notredame C. Accurate multiple sequence alignment of transmembrane proteins with PSI-Coffee. BMC Bioinformatics. BioMed Central Ltd; 2012 Mar 28;13(Suppl 4):S1.
6. Johnson ME, Edlind TD. Topological and mutational analysis of Saccharomyces cerevisiae Fks1. Eukaryot Cell. 2012;11(7):952–60.
7. James TY, Kauff F, Schoch CL, Matheny PB, Hofstetter V, Cox CJ, et al. Reconstructing the early evolution of fungi using a six-gene phylogeny. Nature. 2006;443(7113):818–22.
8. Rodrigues CF, Silva S, Henriques M. Candida glabrata: a review of its features and resistance. Eur J Clin Microbiol Infect Dis. 2013;33(5):673–88.
9. Stover AG, L W-J, Mathews HL. A method for flow cytometric analysis of Candida albicans DNA. J Microbiol Methods. 1998;:1–6.
10. Ko YT, Ludescher RD, Frost DJ, Wasserman BP. Use of cilofungin as direct fluorescent probe for monitoring antifungal drug-membrane interaction. Antimicrob Agents Chemother. 1994 Jun 1;38(6):1378–85.
11. Ashley N, Harris D, Poulton J. Detection of mitochondrial DNA depletion in living human cells using PicoGreen staining. Exp Cell Res. 2005 Feb;303(2):432–46.
12. Berman J. Morphogenesis and cell cycle progression in Candida albicans. Curr Opin Microbiol. 2006;9(6):595–601.
13. Slater JL, Howard SJ, Sharp A, Goodwin J, Gregson LM, Alastruey-Izquierdo A, et al. Disseminated candidiasis caused by Candida albicans with amino acid substitutions in Fks1 at position Ser645 cannot be successfully treated with micafungin. Antimicrob Agents Chemother. 2011;55(7):3075–83.
14. Park S, Kelly R, Kahn JN, Robles J, Hsu M-J, Register E, et al. Specific substitutions in the echinocandin target Fks1p account for reduced susceptibility of rare laboratory and clinical Candida sp. isolates. Antimicrob Agents Chemother. 2005;49(8):3264–73.

128
15. Balashov SV, Park S, Perlin DS. Assessing resistance to the echinocandin antifungal drug caspofungin in Candida albicans by profiling mutations in FKS1. Antimicrob Agents Chemother. 2006;50(6):2058–63.
16. Garcia-Effron G, Park S, Perlin DS. Correlating echinocandin MIC and kinetic inhibition of fks1 mutant glucan synthases for Candida albicans: implications for interpretive breakpoints. Antimicrob Agents Chemother. 2009;53(1):112–22.
17. Garcia-Effron G, Katiyar SK, Park S, Edlind TD, Perlin DS. A naturally occurring proline-to-alanine amino acid change in Fks1p in Candida parapsilosis, Candida orthopsilosis, and Candida metapsilosis accounts for reduced echinocandin susceptibility. Antimicrob Agents Chemother. 2008;52(7):2305–12.
18. Garcia-Effron G, Lee S, Park S, Cleary JD, Perlin DS. Effect of Candida glabrata FKS1 and FKS2 mutations on echinocandin sensitivity and kinetics of 1,3-beta-D-glucan synthase: implication for the existing susceptibility breakpoint. Antimicrob Agents Chemother. 2009;53(9):3690–9.
19. Zimbeck AJ, Iqbal N, Ahlquist AM, Farley MM, Harrison LH, Chiller T, et al. FKS mutations and elevated echinocandin MIC values among Candida glabrata isolates from U.S. population-based surveillance. Antimicrob Agents Chemother. 2010;54(12):5042–7.
20. Shields RK, Nguyen MH, Press EG, Kwa AL, Cheng S, Du C, et al. The presence of an FKS mutation rather than MIC is an independent risk factor for failure of echinocandin therapy among patients with invasive candidiasis due to Candida glabrata. Antimicrob Agents Chemother. 2012;56(9):4862–9.
21. Alexander BD, Johnson MD, Pfeiffer CD, Jimenez-Ortigosa C, Catania J, Booker R, et al. Increasing echinocandin resistance in Candida glabrata: clinical failure correlates with presence of FKS mutations and elevated minimum inhibitory concentrations. Clin Infect Dis. 2013;56(12):1724–32.
22. Johnson ME, Katiyar SK, Edlind TD. New Fks hot spot for acquired echinocandin resistance in Saccharomyces cerevisiae and its contribution to intrinsic resistance of Scedosporium species. Antimicrob Agents Chemother. 2011;55(8):3774–81.
23. Katiyar SK, Edlind TD. Role for Fks1 in the intrinsic echinocandin resistance of Fusarium solani as evidenced by bybrid expression in Saccharomyces cerevisiae. Antimicrob Agents Chemother. 2009;53(5):1772–8.

129
Chapter 4: Discussion

130
4.1. General remarks
Severe fungal infections are a major concern in healthcare, especially with
an ever-increasing population at risk. The underlying conditions of patients, the
high morbidity and mortality of IFIs, and the limitations of treatment options
including scope of antifungals, increasing rates of resistance, and nonspecific
antifungal targets complicate the management of IFIs. An ideal antifungal would
be fungicidal to a broad spectrum of fungal pathogens, have a fungal-specific
target, and no other drug interactions. While no one antifungal developed to date
is ideal, the echinocandins are the most promising prospect for management of
fungal infections, as they have a fungal specific target, no significant drug
interactions or side effects, and are effective against the most common Candida
spp. associated with disease. A limitation of echinocandins is their efficacy
profile, as they are fungistatic or ineffective against many species of fungi, despite
the high similarity of the drug target in all fungi.(see Introduction, p21-22)
In addition to the unexplained disparities in efficacy among fungi(1), an
unexplained PG effect is demonstrated in vitro in which there is re-emergence of
noticeable growth at concentrations above the MIC of susceptible isolates.(2) The
clinical significance of the PG effect is unknown. This effect is reversible, as
serial passages of cells collected from PG concentrations repeat the same growth
patterns as the parent cell, and is not associated with known resistance phenotypes
involving changes to GS in hot-spot regions.(2,3) Current standards recommend
disregarding the PG effect in routine clinical testing, as it is not associated with
MICs.(4) While the clinical significance of the PG effect is unknown,
131
understanding the morphological and physiological changes that allow growth at
elevated concentrations will contribute to our overall understanding of the cellular
effects of echinocandins in fungi, which could be utilized to improve management
of IFIs through the design of more effective antifungals or combination drug
therapies. This research aimed to better understand the PG effect to advance our
overall understanding of echinocandins by evaluating the effects of elevated
CASPO concentrations on C. albicans.
4.2. Influence of inoculum on the PG effect of C. albicans exposed to CASPO
In order to evaluate the characteristics of the PG effect, it was first
essential to screen yeast isolates to identify PG positive and negative isolates for
use in further testing. Previous reports on the incidence of the PG effect with
echinocandins used standard CLSI methods of broth microdilution susceptibility
testing and reported different frequencies of PG between different Candida spp.
and strains.(4) However, the incidence of the PG effect is variable by study and
test conditions used.(2,4,5) The most notable difference between assays to assess
the PG effect is starting inocula, which differ between international standards,
planktonic and biofilm assays, and between broth microdilution screens and larger
scale experiments, such as time kill analysis. These assays have been the standard
to assess the incidence of the PG effect between strains and physiological states,
but should not be directly compared due to differences in growth conditions,
particularly in the starting inoculum used. The use of the same starting inoculum
would provide more reliable comparisons between studies and eliminate the

132
possibility of the effects of cell density being a confounder in the interpretation of
PG results. This study tested the hypothesis that increased inoculum density
influences the incidence and degree of PG in Candida albicans. Data from the 24
hour microdilution experiments supports a correlation between increased cell
density and paradoxical growth in C. albicans exposed to CASPO.
Similar to previous reports, 9 of 24 (38%) C. albicans isolates
demonstrated PG with a standard starting inoculum of 103 cells per ml by visual
evaluation but not spectrophotometric assessment of microdilution trays.
However, the PG effect was observed in all C. albicans isolates with an elevated
starting inoculum of 106 cells per ml. Stereomicroscope examination showed the
degree of PG in many isolates was not sufficient to cause a statistically significant
change in absorbance. Nonetheless, observing any growth at CASPO
concentrations above which there is complete inhibition is suggestive of a cellular
response that permits growth above a susceptible MIC. While the PG effect has
been considered “not uncommon”(5,6), this is the first report to demonstrate PG
in all C. albicans within a selection of isolates differing in patient demographics
and source of infection. The PG effect was not observed in any C. glabrata strain
tested, regardless of starting inoculum used, confirming the previous study that
concluded C. glabrata does not demonstrate PG with CASPO assessed by broth
microdilution testing at 24 hours.(4)
While inoculum density influences the PG effect in C. albicans, it does not
have a significant affect on MIC.(Table 3.1) Using an elevated starting inoculum
resulted in a lower MIC compared to the standard inoculum for several isolates;

133
these values correlated within one dilution and had no affect on the MIC
interpretation as CASPO susceptible. This has been similarly observed in
comparing EUCAST and CLSI methods(7-9); while these standardized methods
differ in inoculum density, medium glucose concentration, and endpoint
evaluation, there is high essential agreement between the two methods, with the
main discrepancies resulting from overall lower MICs (!1 dilution) tested by
EUCAST standards.(8) While not significant to the interpretation of MIC, this is
also a paradox in CASPO’s action, as it would be assumed that higher inocula
(and a higher organism or target to drug ratio) would result in higher MICs.
Lower MICs with higher inocula, did not alter the interpretation of the MIC as
susceptible, which highlights a cellular response to CASPO that is not
concentration dependent.
The criteria for the PG effect varies by study, but is typically defined as a
significant resurgence of growth, such as "50% of that in the drug free control, at
caspofungin concentrations "2 dilutions above the MIC. While a statistically
significant change in growth is desirable to support the presence of the PG effect,
the previous criteria defining the PG effect have resulted in isolates deemed
negative despite visual confirmation of growth at CASPO concentrations above
the MIC.(10) Any resurgence of growth following complete inhibition is suggests
a change in the cellular response to CASPO. By defining the PG effect as re-
emergence of any growth above which there is complete inhibition, this study is
more accurate in determining the incidence of PG.

134
Many studies utilize the XTT assay to correlate metabolic activity to
viability and growth.(5) While this method is sensitive to small changes in
metabolic activity, there is significant variability between strains and not
necessarily a linear correlation between the metabolic activity and cell number,
especially at increased inocula density.(11) The XTT method is an indirect
determination of growth and assumes that growth is proportional to the cell’s
capacity for aerobic respiration. While C. albicans primarily uses aerobic
respiration to generate ATP, it is capable of adapting to different situations by
fluctuating metabolic pathways depending on need.(12) Two methods of
evaluation I used to directly assess changes in growth of yeast exposed to
CASPO, and avoided the pitfalls of indirect methods of growth assessment, such
as with XTT.
The PG effect has been compared for Candida spp. grown as planktonic
cells and biofilms by Melos et al, with biofilms demonstrating a higher frequency
of the PG effect.(5) However, this study failed to account for the methodological
differences used to assess PG in the different growth forms, as they assessed
planktonic PG using standard broth microdilution assays with a 103 starting
inoculum, but used 24 hour preformed biofilms from a 106 starting inoculum.
Biofilms demonstrate increased resistance to antifungals compared to planktonic
cells that is not wholly due to inoculum density(13), likely because the biofilm
structure limits diffusion of antifungal drugs and alters transcription of cellular
processes.(14,15) The physiological differences between planktonic and biofilm
cells may contribute to the difference in incidence of the PG effect, but the

135
significant difference in PG between the 103 and 106 inocula suggests that cell
density, not the growth form, significantly alters the potential for PG at elevated
concentrations of CASPO. Inoculum density affects cell growth, affecting
morphology and quorum sensing(16), which may impact cell changes correlated
with PG cells, including cell wall alterations and cell aggregation.(3) Further
investigation into the physiology of PG cells affected by inoculum density should
elucidate potential mechanisms for growth of fungi at elevated echinocandin
concentrations.
Identifying the PG effect in all C. albicans but not in C. glabrata provides
insight to its mechanism of action. It has been previously hypothesized that the
PG mechanism likely involved a genetic component, as the incidence appeared
variable among strains and species.(4) However, the data from this study
demonstrates this effect is more likely species specific, not strain dependent. This
is further supported by the lack of genetic associations of isolates positive for PG
by microsatellite typing in C. albicans performed by Khilf et al.(17) The authors
assumed that the PG effect was only present in certain strains, and concluded that
the PG phenotype was “gained or lost too rapidly to be predicted by more stable
genomic markers”. However, my data suggests the PG effect is likely present in
all C. albicans and therefore would not be associated with any one genetically
related strain or clade.
The use of echinocandins in the management of Candida spp. infections is
increasing, as they are approved for first line therapy of candidiasis.(18) Despite
increasing use since the introduction of CASPO in 2001, isolation of resistant

136
isolates remains rare(19), and reports of breakthrough infections are limited to
case reports.(20) With little evidence of clinical failure, the clinical significance
of the PG effect is poorly understood. PG cells are slower growing than control
yeast, with several experiments requiring a 48—120 hour evaluation period to
demonstrate PG by time kill or broth micro-dilution methods.(2,3) Echinocandins
are administered daily (24 hours); if PG requires an extended growth period for
measurable in vitro effects, it could be assumed that the 24 hour dosing regimen
would not support PG in vivo. However, given that I have demonstrated PG is
achievable at 24 hours in vitro, 24 hour daily dosing could result in CASPO
concentrations that may support PG in vivo.
There is little evidence for PG during echinocandin therapy, and it is
controversial whether in vivo mammalian models of candidiasis demonstrate the
PG effect.(21,22) It is recommended that this effect be ignored in evaluating
echinocandin MICs by CLSI guidelines as it is not associated with MIC or
treatment failure.(23) Invasive yeast infections result from dissemination of yeast
following a breech in a colonized mucosal barrier (as described, p. 3) Most in vivo
models for candidiasis involve the induction of disseminated blood stream
infections through intravenous or intraperitoneal injections.(24) While this model
is comparable to disseminated yeast infections in humans, it may not be
representative of the whole infection process from colonization to tissue invasion,
as evidenced by different organs infected in intravenous versus colonization and
dissemination murine models of candidiasis.(25) In murine models, this may limit
the evaluation of echinocandin therapy and the potential for PG with, for example,
137
prophylatic echinocandin therapy. The potential for PG in an established infection
is unknown, as is the potential of PG to influence the infection process from
colonization to invasion. Given that animal models may not be representative of
human infections via host colonization and that these results show that all tested
strains of C. albicans have the potential for PG, there may be greater clinical
potential for PG than had been previously assumed. Further understanding of the
morphological and physiological changes that allow growth at elevated
echinocandin concentrations will likely contribute to our overall understanding of
Candida spp. that contribute to the infection process.
Given that PG occurs in C. albicans but not C. glabrata, the factors
contributing to PG are likely intrinsic to specific species. While most medically
important yeast are phylogenetically closely related to C. albicans, C. glabrata is
most closely related to S. cerevisiae and differs from other Candida spp. in
genome evolution and many metabolic pathways.(26) Exploring the differences
between C. glabrata and C. albicans will likely identify mechanisms contributing
to the PG effect.
4.3. Evolution of glucan synthase in fungi
4.3.1. Glucan synthase in fungi
C. albicans and C. glabrata are the most frequently isolated yeast species
associated with invasive disease and are attributable for up to 75% of all cases of
candidiasis.(27) Both species colonize the skin and mucosal surfaces of healthy
individuals, and are capable of causing severe systemic infections in

138
immunocompromised populations. While C. glabrata is often grouped with the
medically important Candida spp., it is actually most closely related to S.
cerevisiae; S. cerevisiae is a model organism that has been an important tool used
in echinocandin and glucan synthase research, as genetic manipulations are more
easily accomplished than in other budding yeast species. However, it is rarely
pathogenic and differs in many fundamental cellular processes as a result of its
different evolutionary history.
The data from the inoculum density studies indicates the PG effect is
intrinsic to specific species. Similarly, the susceptibility of fungi to echinocandins
is due to an undetermined species-specific factor. Decreased antifungal
susceptibility is most often associated with biofilm formation, compensatory
regulation of metabolic pathways, upregulation of drug transporters, and
antifungal target alterations.(28) While biofilms may contribute to the decreased
susceptibility of some fungi to echinocandins, many fungi are intrinsically
resistant regardless of growth form.(29) Upregulation of the HOG, calcineurin,
and chitin synthesis pathways are observed in PG and resistant cells(30-32), but
cannot fully account for the intrinsic differences between different species. The
best proposed mode of action for echinocandins is the inhibition of GS by binding
exterior to the cell.(33)(Figure 1.3) Therefore, drug transporters are unlikely to
significantly influence the cellular response to echinocandins. Acquired resistance
to echinocandins is associated with point mutations in “hot-spot” regions of GS,
but it is not clear why many fungi demonstrate intrinsic resistance to
echinocandins.
139
To evaluate the contribution of differences in GS to the cellular response
of fungi to echinocandins, sequence analysis of GS homologs was conducted for
19 medically important fungi. The evolutionary history of fungal GS was
evaluated in a previous study.(34) However, the resulting reconstruction was
represented by an inaccurate phylogenetic topology, due to unrooted trees without
consideration of gene duplications. The objective of this analysis was to
reconstruct a more accurate evolutionary history of GS to provide further insights
into the differences in cellular response of some species to echinocandins.
4.3.2. Phylogenetic and sequence analysis of fungal glucan synthase
Despite the high overall similarity in DNA and protein sequences,
phylogenies may be difficult to resolve due to the presence of introns, gene
duplication or loss events, and the appropriate selection for rooting. Previous
phylogenetic analysis of FKS sequences resulted in unresolved tree topologies
that were inconsistent with known species evolution.(34) That analysis
acknowledged the presence of gene expansion by duplication in Ascomycota but
failed to resolve these relationships, resulting in an inaccurate representation of
FKS evolution.
In contrast to the previous study(34), the present analysis optimized the
multiple sequence alignment, resolving the inaccuracies of the nucleotide
alignment due to introns, resolved the gene tree to assess duplications and loss
events, and rooted the trees with R. oryzae, the earliest known ancestor of the
selected fungi, to better define the context of the FKS lineage. These steps
140
resolved the topologies of fungal FKS sequences and provided better inference of
the GS evolutionary history. The multiple sequence alignments demonstrated the
number and sequence of amino acids is highly conserved, which further highlights
the conservation of 1,3-!-glucans in the cell walls of medically important fungi.
There is evidence for the indispensable function of GS by the essentiality of
single copy FKS genes and of particular FKS genes in multicopy
organisms.(29,35-37)
The discrepancy in the nucleotide and protein data can be explained by
examining the nucleotide composition of each gene. The signal from nucleotide
compositional bias in unrelated species can overwhelm the phylogenetic signal of
the data to group unrelated species with similar GC content together.(38) The
percentage of guanine (G) and cytosine (C) in the FKS genes in the fission and
budding yeast is consistent with the genomic averages(39-41), which is much
lower than other fungi. Because the protein sequence is so highly conserved, it is
less affected by the bias in GC composition and is representative of the true
phylogeny.
4.3.3. FKS gene duplications in yeast
Gene and genome duplication events are important mechanisms for
genetic innovation. Duplicated genes are more frequently lost than retained, and
gene retention is influenced by the partitioning of ancestral functions
(subfunctionalization) or by the emergence of new functions
(neofunctionalization).(42) This evolution appears through modification of

141
transcriptional regulation, and posttranslational control (particularly increased
phosphorylation).(43) Duplications can occur by small scale duplications (SSD)
or whole genome duplication events (WGD), and can differ in functions and
mode of evolution.(44) WGD paralogs are more likely to share functions, thus are
able to compensate for the loss of the other gene copy, and are more likely to
evolve by subfunctionalization; SSD paralogs are more likely to evolve by
neofunctionalization and have a greater diversity and number of interaction
partners.(42) Not all genes are equally gained or lost, as conserved genes with a
greater number or complexity of functional domains are more likely to be retained
after duplication events.(45)
The FKS gene products are large transmembrane proteins that provide an
essential function, as double FKS1/FKS2 knockouts are non-viable in S.
cerevisiae. While FKS2 is primarily involved in spore wall assembly and
transcriptionally regulated by calcineurin, it can compensate for the loss of FKS1
(as described, p. 12). The different transcriptional regulation and
subfunctionalization of FKS2 is consistent with the current knowledge of WGD
paralog evolution. Fks1p is likely a multifunction protein, as targeted mutations in
S. cerevisiae Fks1p affect glucan synthesis, endocytosis, and cell polarity. It is
unknown the extent each paralog contributes to these functions, or what other
functions may have evolved through altered transcriptional regulation, sub-
cellular localization, or protein interaction partners.
Nearly all studies on the structure and function of Fks1p have been
conducted in the model yeast S. cerevisiae, despite having significant cellular

142
differences as a result of its whole genome duplication. While it is an ideal model
organism as it is more amenable to genetic manipulations, it lacks essential
factors in other yeast associated with virulence, such as proteases, lipases, or a
true hyphal form.(46) This is likely why it remains a rare cause of IFIs.(47) Given
that echinocandins are approved for use in Candida spp., it is important to
understand the nuances in functional complexity and regulation of Candida spp.
paralogs.
The three FKS copies in S. cerevisiae and C. glabrata evolved through
two SSD, a single gene loss event, and retention of both WGD paralogs.(Figure
3.6) This is in contrast to other Candida spp. in which all three FKS copies
evolved from two SSD; given the differences in evolution and functional
divergence of SSD and WGD paralogs, it would be expected that there are
differences in regulation, localization, and interaction partners of C. albicans (and
other closely related Candida spp.) FKS proteins. Fully understanding species-
specific differences in FKS proteins could significantly improve our
understanding of GS inhibition by echinocandins.
C. glabrata is an increasingly important cause of invasive candidiasis, and
while it retains the “Candida” genus, it is more closely related to S. cerevisiae
than the other Candida spp. The difference in the evolutionary history of FKS
genes from other Candida spp. is apparent in the increasing reporting of in vitro
resistance due to FKS1 and FKS2 mutations in C. glabrata.(48,49) C. glabrata is
a haploid organism and contains a single allele of FKS1 and FKS2, making it
easier to acquire echinocandin resistance through a mutation in either loci.

143
Acquired Fks1p mutations in other Candida spp. contribute to resistance, while
mutations in Fks2p or Fks3p have not been reported for changes in echinocandin
susceptibility.
Evidence from topological modeling of S. cerevisiae Fks1p predicts the
binding of echinocandins exterior to the cell, the drug’s hexapeptide core
interacting with the “hot-spot” regions of the protein.(33)(Figure 1.3) The high
conservation of sequence similarity in paralogs suggests a similar structure, and it
would be reasonable to assume they would also bind echinocandins. Since SSD
paralogs typically evolve through neofunctionalization and changes to sub-
cellular localization, it is feasible that intracellular accumulation of echinocandins
could exert unknown effects to FKS paralogs. S. cerevisiae Fks1p and Fks3p have
been isolated from highly purified mitochondria in high-throughput studies(50-
52); while echinocandins likely bind Fks1p exterior to the cell, the possibility of
intracellular interactions cannot be excluded. Confirmation of paralog sub-cellular
localization and functions will likely provide evidence for mechanisms of
resistance without Fks1p mutations and or the paradoxical growth effect.
4.3.4. FKS gene structures.
There is a striking difference in the gene structure of single and multiple
FKS copy genes. The multicopy FKS genes in the fission and budding yeast do
not contain any introns while the single-copy FKS genes contain multiple introns
with apparent independent acquisitions along fungal lineages. This is consistent
with the known genomic structures of yeast and other fungi, as the evolution of

144
both fission and budding yeast favored intron loss while the basidiomycetes have
remained intron dense. The most striking difference in gene structure is between
the Cryptococcus spp. and other medically important fungi. Since it is unknown
why Cryptococcus spp. are resistant to echinocandins, the gene structure may be
important to the function of GS and its resistance.
Cryptococcus spp. have a greater number of introns per gene than most
fungi (~5.5). For example, A. fumigatus contains ~2 introns per gene while S.
cerevisiae only contains a few hundred introns in the entire genome.(53) The
Cryptococcus spp. have a higher number of introns in the FKS gene than the
genomic average, with 7 and 11 introns in the FKS gene that are predominantly
distributed within the last 25% of the coding sequence. Introns may contain
regulatory or other functional elements, and can be alternatively spliced to
generate transcript and protein diversity.(54) The presence of multiple introns
may be significant as alternative splicing is frequent in Cryptococcus spp.(55)
The retention of yeast paralogs is indicative of the potential complexity
and multifunctionality of the protein, yet most other fungi retain only a single
copy. Alternative splicing may account for this difference, as it increases
proteomic diversity and results in different mRNA transcripts that may result in
alternate functional proteins, differential targeting of protein localization, and
altered transcriptional regulation.(56,57) Alternative splicing can result in exon
skipping, intron retention, or alternative 5’ or 3’ splice sites; in fungi, intron
retention is most prevalent.(58) Intron retention within the FKS gene in the
Cryptococcus spp. would most likely produce a premature stop codon, though
145
most of the introns are towards the C-terminus and could result in a truncated yet
functional protein. Introns in C. neoformans transcripts affect the abundance of
mRNA accumulation, altering rate of translation and transcripts with pre-mature
stop codons are regulated and degraded by the nonsense mediated mRNA decay
pathway.(59) More information on the structure, function, and regulation of FKS
is necessary to understand how alternative splicing could affect the function of GS
or its sensitivity to inhibitors.
The two important virulence factors for Cryptococcus spp. are its
substantial polysaccharide capsule and melanin production.(60) C. neoformans
GS isolated from plasma membranes is sensitive to CASPO, while whole cells
remain resistant in both capsular and acapsular isolates.(61) Melanin has been
shown to bind CASPO,(62) but the effects of melanization and binding of
CASPO does not fully resolve the discrepancy with in vitro susceptibility profiles
between Cryptococcus spp. and other echinocandin susceptible fungi. Deletion of
Ccr4p, a protein involved in the nonsense mediated mRNA decay pathway,
results in CASPO susceptibility in C. neoformans(63), and is implicated in
osmotic stress and cell wall integrity in S. cerevisiae.(64,65) Collectively, this
suggests there may be other unknown mechanistic features of GS that render
Cryptococcus spp. intrinsically resistant to echinocandins, such as alternative
splicing of FKS.
Analysis of the evolution of FKS homologs in medically important fungi
demonstrates: (i) the importance of a fully resolved gene phylogeny to accurately
infer gene evolution; (ii) the differences in FKS paralog evolution in yeast and
146
highlights the pitfalls of extrapolating knowledge from the model yeast S.
cerevisiae to evolutionary divergent yeast; and (iii) the significance of identifying
variance in gene structures to study differences in protein function and regulation.
Further characterization of the differences between FKS proteins will identify the
potential differences in organism susceptibilities to GS inhibitors, thus providing
new insights on optimum treatment options for invasive fungal infections.
4.4. Medium carbon source impacts the degree of PG in C. albicans
4.4.1. Effect of carbon source on PG by time kill analysis
The high sequence similarity among fungal GS, especially among budding
yeast, suggests that differences in GS do not account for the differences in
response to CASPO at elevated concentrations and that other intrinsic differences
between these species contribute to PG. Despite being closely related
phylogenetically, C. albicans and C. glabrata evolved differently to utilize
nutrients to colonize and invade the host: virulence of C. albicans is dependent on
its ability to switch between yeast and hyphal forms, and can utilize multiple
carbon sources simultaneously predominantly through aerobic respiration; C.
glabrata does not have a true hyphal form and is a facultative anaerobe,
preferentially fermenting sugars even in the presence of oxygen.(66)
Interestingly, another unexplained anomaly regarding the PG effect is its
variability in frequency when tested in different growth media, which vary most
notably in the amount and types of carbon source.(2,67,68) Given the intrinsic
differences between the two species in metabolism and the variability of PG in
147
different media, the PG effect could be influenced by carbon source. This study
tested the hypothesis that the type of carbon source influences the degree of C.
albicans PG. Data from the 72 hour time kill analysis of C. albicans exposed to
CASPO with different carbon sources demonstrates increased PG in fermentable
sugars compared to non-fermentable carbon sources.
This study demonstrated considerable variability in endpoint growth for C.
albicans in different carbon sources. Despite this, a clear trend was observed in all
media evaluated: exponential growth of the GC, and fungicidal activity at
inhibitory (2 mg/L) CASPO concentrations. Growth at 16 mg/L CASPO was
fungistatic by CFU determination for all media tested; however, by OD600
evaluation, C. albicans grown in fermentable sugars grew as large cell aggregates
and demonstrated a significant increase in PG compared to the un-budded yeast
observed in non-fermentable sugars. The difference in growth observed between
CASPO concentrations and medium carbon source further adds to the evidence
for a physiological difference between PG cells and yeast grown at inhibitory
CASPO concentrations.
The carbon sources chosen for these experiments represent physiologically
important sugars in different host environments. Dietary sources of glucose and
galactose are absorbed from the gastrointestinal tract into the bloodstream,
reaching concentrations up to 0.1-0.15% (6-8 mM), and can be excreted into the
urine.(69,70) Lactate is present in the gastrointestinal tract and vagina from
bacterial metabolites, and in anaerobic sites from host metabolism.(71) While
glycerol is not present in significant quantities in the host, it can be metabolized

148
via aerobic respiration in the absence of a more optimal source of carbon; it is
also a significant osmolyte, protecting cells against hyper-osmotic stress.(72)
Central carbon metabolism is the fundamental process involving the
breakdown of carbon sources that is required for cellular energy and provides
building blocks for biosynthetic processes of proteins, lipids, nucleotides, and
carbohydrates. It is not only essential for cellular function and replication,
changes to C. albicans central carbon metabolism and growth in different carbon
sources are known to affect antifungal susceptibility, morphogenesis, virulence,
and interaction with host immune cells.(73-75) As such, it is not surprising that
carbon source also affects the PG response to CASPO.
Adaptability in carbon source assimilation is essential to survival in
different host niches and at different stages of infection, as evidenced by
transcriptional changes to central carbon metabolism upon nutrient limitation and
interaction with host immune cells.(12,71) C. albicans mutants of specific carbon
metabolic pathways are unable to cause infection in some host environments
while fully virulent in others.(12) Given that PG cells are unable to proliferate in
non-fermentable carbon sources the potential to demonstrate this phenomenon in
vivo is questionable, but is likely dependent on the host environment of the
infection model.
Only two in vivo investigations into the PG effect have been conducted for
Candida spp. in mammals: an intraperitoneal abscess murine model with C.
tropicalis, and a murine model of systemic candidiasis with C. albicans.(21,22)
Both studies demonstrated decreased effectiveness of CASPO with increased
149
dosages in one or more isolates by measuring CFU per abscess or CFU per kidney
pair, respectively, but were not reproducible in subsequent experiments. The
authors concluded there were insufficient evidence for an in vivo PG effect but
could not exclude it entirely. In contrast, the PG effect was reproducibly
demonstrated in a neutropenic murine model of invasive pulmonary aspergillosis,
in which increased fungal burdens and inflammatory pathology was
observed.(76,77) This investigation was superior as it evaluated fungal burden by
real-time quantitative PCR, CFU per lung, and histological examination of lung
tissue. I have demonstrated significant differences between methods of detecting
PG in vitro, and the ability to detect PG in vivo will also require multiple
methods, including both culture and non-culture methods, to evaluate the
infection burden.
In addition to the mammalian models to evaluate PG in vivo, there have
been two investigations using invertebrates: a toll-deficient Drosophila
melanogaster (fruit fly) model(78), and a Galleria mellonella (wax moth)
model(3). Both models evaluated virulence by survival rates of the host infected
with C. albicans pre-exposed to CASPO. There was no difference in virulence of
PG cells in the fly model, though this could have been due to the low infecting
inoculum (102 cells per fly). There was a significant decrease in virulence
observed in the moth model, as a significant increase in survival was observed for
PG cells compared to the control. PG cells also demonstrated increased
encapsulation and melanization, a process of the innate immune response of the
moth to clear the infection.(79) It was suggested that this decreased virulence of
150
PG cells could account for the failure to reproducibly demonstrate this effect in
murine models.(3) However, it is premature to extend these conclusions to animal
models or clinical data, as these invertebrate models have several major
deficiencies. Firstly, both invertebrate models pre-treated C. albicans with only
one CASPO concentration. The authors in the moth study demonstrated the PG
effect is reversible, as PG cells will revert to normal growth in the absence of
CASPO. The moth model, therefore, does not account for changes that could
result from the absence of drug over the course of the infection. This study could
also not determine whether these effects are specific to PG or whether these
effects are seen at all CASPO concentrations, as only one CASPO concentration
was evaluated. Secondly, while these models have an innate immune system
required to control fungal infections(80), they likely lack the complexity of a
mammalian model that provides greater confidence in extrapolating results to
humans. A more thorough investigation using invertebrate models may be useful,
but the multiple cellular adaptations of PG cells suggest that particular host niches
may play a role in vivo.
I have demonstrated an increase in PG with fermentable carbon sources,
and host environments rich in these sugars are likely more amenable to PG in
vivo. As such, infection models evaluating PG must take this into account in the
design and evaluation of PG by fungal burden. Tissue, such as kidney, is
frequently collected and cultured to assess infection burden in disseminated
candidiasis, as was the case for the study evaluating the PG with C. albicans in
murine models.(22) However, the nutrient availability in tissues is likely transient,

151
requiring the utilization of multiple carbon sources simultaneously. This is
evidenced by the upregulation of the seemingly opposite pathways of glycolysis,
gluconeogenesis, and the glyoxylate cycle simultaneously.(12) If PG cells cannot
persist in environments with non-fermentable carbon sources, as in tissues, this
effect may not be significant in vivo, or at least not readily detected. The
evaluation of multiple sample types that represent environments rich and poor in
fermentable carbon sources, such as blood and tissue, respectively, will more fully
clarify the potential for PG in vivo.
Infection model outcomes are affected by a multitude of factors, including
the growth medium of the infecting inoculum, the inoculum density, the animal
species and strain, and the infection site evaluated.(81) I have demonstrated that
both the inoculum density and the carbon source of the growth medium affect PG
of C. albicans in vitro, and these factors likely influence the ability to detect PG
in vivo. There have been insufficient investigations into the in vivo potential of PG
to contribute to treatment failure with CASPO, as previous studies tested
insufficient numbers of isolates in two similar animal models, only evaluating for
the presence or absence of growth.(21,22) Further in vivo investigations are
required, utilizing multiple infection sites in a disseminated mammalian model of
candidiasis evaluating the fungal burden by multiple methods.
4.4.2. Correlation of central carbon metabolism and PG
Previous analyses on the effect of media carbon source demonstrated
changes to C. albicans proteome, secretome, and antifungal susceptibility.(75)
152
Most notably, yeast grown in alternative carbon sources, such as fatty acids and
non-fermentable carbon sources, are more resistant to osmotic stress and
antifungals.(74) In particular, lactate grown cells demonstrated altered cell wall
architecture that renders them less susceptible to recognition and killing by the
host immune system compared to glucose grown cells.(82) Lactate grown cells
are more resistant to cell wall stress, postulated to be due to cell wall changes
associated with this carbon source, it was expected that the PG effect would be
enhanced in a lactate containing medium. Likewise, since glycerol is an osmolyte
that is imported into the cell to modulate the effects of osmotic or cationic stress,
it was assumed that growth in glycerol would also increase PG by modulating the
osmotic stress induced by CASPO. Instead, the opposite was observed in which a
significant decrease in PG was observed in non-fermentable carbon sources.
The fungistatic cellular response of PG cells grown in non-fermentable
carbon sources as a sole energy source is suggestive of a reduced or inhibited
respiratory capacity. Non-fermentable carbon sources are metabolized through the
tricarboxylic acid cycle (TCA) and oxidative phosphorylation through the
electron transport chain (ETC).(40)(Figure 4.1) In C. albicans, inhibition of part
of the respiratory chain (ETC) can result in either a severe growth defect or
complete inhibition of growth on non-fermentable carbon sources.(83) Inhibition
of the ETC in C. parapsilosis results in increased susceptibility to CASPO(84),
further demonstrating a link between respiration and cellular response to CASPO.
The ETC utilizes the byproducts of the TCA and oxygen to transfer
electrons through a series of mitochondrial inner membrane proteins to produce a

153
proton gradient and generate adenosine triphosphate (ATP). C. albicans has
several pathways in the ETC: the classical (primary) respiratory chain, the parallel
respiratory chain, and the alternative respiratory chain.(83) Fungi vary in their
capacity for respiration, but most have evolved to contain both the classical and
alternative pathways.(85) Importantly, S. cerevisiae and C. glabrata do not have
an alternative or parallel respiratory pathway.(86)
Reactive oxygen species (ROS) are produced during aerobic respiration
and neutralized under normal circumstances by key mitochondrial enzymes.
However, mitochondrial dysfunction from cellular stress can lead to ROS
accumulation, causing DNA damage, lipid degradation, protein damage, and
apoptosis, as demonstrated by C. albicans exposed to low concentrations of
CASPO.(87) One of the ways C. albicans manages ROS accumulation is by
modifying its ETC, by increasing the transfer of electrons through the alternative
pathway and significantly reducing ROS production.(83) Induction of this
pathway decreases the susceptibility of C. albicans to azoles(88), but the role of
the alternative pathway has not been investigated in the response of C. albicans to
CASPO. It is a promising pathway to investigate in its contribution to the PG
effect, given the difference in metabolism of PG cells and the lack of alternative
respiration in the PG negative C. glabrata.
The decreased PG in yeast grown in non-fermentable carbon sources may
also be due to increased energy demands of coping with CASPO induced stress.
PG cells are known to have cell wall alterations, with an increase in chitin and
decrease in !-glucans.(Figure 1.5) C. albicans grown in fermentable carbon
154
sources derive biosynthetic components for some amino acids, nucleosides, and
other carbohydrates through glycolysis, partitioning pathway intermediates for
use in the cell wall as required.(40)(Figure 4.1) In non-fermentable carbon
sources cell wall biosynthetic components are derived from gluconeogenesis,
requiring the input of energy first to convert pyruvate to glucose and or fructose
intermediates and secondly to generate cell wall components. PG cells may not be
able to produce enough energy from non-fermentable carbon sources to cope with
CASPO induced stress and proliferate, especially if there is indeed a reduced or
inhibited respiratory capacity.
There is growing evidence for a link between metabolism, stress
responses, morphogenesis, and cell wall remodeling. Studies with null mutants to
evaluate specific cellular traits are demonstrating detrimental effects in
unexpected and seemingly unrelated pathways, often with altered susceptibility to
cell wall inhibitors. For example, null mutants of the Sorting and Assembly
Machinery 37 protein (Sam37p), a subunit of the complex required for
mitochondrial membrane biogenesis, are slow growing, hypo-filamentous cells
that have a media dependent increased CASPO susceptibility.(89,90) Similarly, a
null mutant in Growth and Oxidant Adaptation 1 (Goa1p), a protein that
relocalizes to mitochondria in response to oxidative stress, is a slow growing,
hypo-filamentous yeast with reduced respiratory capacity and increased
sensitivity to cell wall inhibitors.(91,92) My data demonstrate PG cells are slow
growing with altered carbon metabolism and morphology. The similarities
between mitochondrial mutants defective in cell wall regulation and PG cells
155
suggests the PG effect may be a model to further investigate the common thread
between metabolism, morphology, and cell wall integrity.
4.4.3 Differences in PG morphology in fermentable and non-fermentable
carbon sources.
C. albicans is a pleomorphic organism, transitioning between yeast,
hyphae, and pseudohyphae. Yeast appear as unicellular ovoid cells, hyphae are
cylindrical filaments that grow from the tips, and pseudohyphae are filaments of
unseparated buds distinguishable from true hyphae by their constrictions (septa) at
the growth point from the bud. The ability to switch between morphologies is
believed to be important for its evolution as a pathogen: yeast forms are essential
for colonization and dissemination; hyphae are important for tissue invasion; and
mutants defective in morphogenesis are associated with decreased
virulence.(93,94) Morphogenesis is essential to C. albicans survival under diverse
environments, and evaluating morphology in response to CASPO will elucidate
its physiological state.
PG cells previously characterized by electron microscopy demonstrate
morphological alterations with cell clumping, abnormal septa, enlarged cells, and
absence of hyphae.(6) Similarly, I observed large yeast-like aggregates with
incomplete bud separation with PG in fermentable carbon sources. However, I
observed the enlargement of yeast with cessation of budding with PG in non-
fermentable carbon sources. This difference in growth and morphology between

156
PG in fermentable and non-fermentable carbon sources has never been identified,
and may be indicative of the mechanisms for the PG effect in C. albicans.
A number of factors affect the morphogenesis of C. albicans, including
temperature, pH, bacterial metabolites, inoculum density, and carbon
source.(95,96) Of particular interest is the difference in morphology of C.
albicans grown in different carbon sources. Depending on the concentration of
fermentable sugars, C. albicans appears as yeast, pseudohyphae, and hyphae to
varying degrees; when grown on non-fermentable carbon sources, C. albicans
typically grows only in yeast form.(96,97) This correlates with the difference in
metabolism between the two forms, as yeast predominantly utilize aerobic
respiration to generate energy, while hyphae have a tendency towards
fermentation.(98,99) This difference in metabolism between the two forms is also
demonstrated when C. albicans is grown anaerobically where cells can only
utilize fermentation, and only hyphae are observed.(100) While suppression of
respiration is not essential for the transition of yeast to hyphae, there is substantial
evidence for a correlation with carbon metabolism and respiration between yeast
and hyphae.(99)
The distinct morphology of PG cells has been characterized as
“incomplete separation” of budded yeast with the absence of filamentation,
attributed to the changes in cell wall composition.(3,6) However, this morphology
is too similar to pseudohyphae to assume that these cell aggregates are yeast that
remain attached after budding. While the distinction of morphology may seem
insignificant, there are physiological distinctions between yeast and hyphae
157
demonstrated by transcriptional and metabolomic analyses.(101,102) These
differences are believed to contribute to survival in different environments and
virulence in the host. Considering these differences and their significance, it
would be prudent to fully evaluate the morphology of PG cells.
In relation to their morphology of unseparated elongated buds,
pseudohyphae are characterized by the capability of invading agar and an
extended period of polarized growth compared to yeast, resulting in a delay in G2
of the cell cycle.(103) By evaluating the delayed growth of PG cells by cell cycle
analysis, I demonstrated that PG cells have a noticeable delay in the G2/M phase
not observed with low concentrations of CASPO. The G2/M delay and the PG
cell morphology is suggestive of pseudohyphae growth.
Cell proliferation is the fundamental goal after cell survival, requiring the
accurate duplication and partitioning of cellular components regulated by the cell
cycle. The cell cycle is sensitive to changes in energy metabolism and ROS
accumulation, and oxidative stress can lead to cell cycle arrest, often in
G2/M.(104) In C. albicans, G2/M arrests tend towards polarized growth(103), as
seen with genetic mutations in some cell cycle transcription factors and proteins
required for septum formation that demonstrate a G2 delay and constitutive
pseudohyphae morphology.(105,106) Integration of cell wall components for
septum formation and cytokinesis, especially the linkage of chitin to !-1,3-
glucans, is essential for the control of bud growth and cell cycle progression.(107)
C. albicans resistant to CASPO demonstrate increased chitin synthesis and

158
alternative septum formation(108,109), and a similar mechanism may contribute
to the PG effect.
CASPO induces the HOG, calcineurin, and CWI pathways in C.
albicans.(110)(Figure 1.6) These pathways contribute to resistance caused by GS
“hot spot” mutations and the PG effect(30,31), likely due to the upregulation of
chitin synthesis by these pathways.(111) Increased cell wall chitin is associated
with increased CASPO MICs and can be associated with abnormal cellular
morphology.(109) The increase in chitin after exposure to CASPO is conserved in
Candida spp., but is notably absent in C. glabrata.(112) Given that I have
confirmed PG does not occur in C. glabrata by broth micro-dilution testing, this
could explain the difference in PG between species. However, Rueda et al
demonstrated that increased cell wall chitin “is necessary but not sufficient for
CASPO adaptation” at PG concentrations, as a significant increase in cell wall
chitin was observed in yeast grown in CASPO concentrations as low as the MIC
yet growth was inhibited at the MIC.(3) Also, other conditions result in elevated
cell wall chitin content. For example, pseudohyphae of S. cerevisiae demonstrate
increased cell wall chitin that accumulates over the entire cell surface(113),
similar to that observed in PG cells. Therefore, while the stimulation of stress
pathways at PG CASPO concentrations coordinates the activation of multiple
cellular processes that includes increased chitin synthesis, other unknown cellular
factors contribute to the adaptation and morphology of PG cells.
Pseudohyphae and hyphae are often collectively referred to as the
filamentous or invasive forms of C. albicans, as both can invade solid media in

159
vitro and are believed to have developed to forage for nutrients. However, these
forms represent distinct cellular states, as they are induced under different
conditions and demonstrate critical differences in their cell cycles.(114) Likewise,
there are physiological differences between pseudohyphae and yeast. In addition
to differences in cell cycle, pseudohyphae express low levels of some hyphae-
specific proteins.(115) The pseudohyphae morphology is assumed to be an
intermediate between yeast and hyphae, regulated by a shared transcriptional
regulation in a dose dependent manner with hyphae.(116) Despite being
considered a distinct yet intermediate state between yeast and hyphae as
pseudohyphae demonstrate similarities of both, pseudohyphae generally do not
develop true hyphae and vice versa.(106) PG cells do not resemble hyphae, but
the distinction between unseparated yeast and pseudohyphae may have
implications for infection models, as pseudohyphae are an invasive morphology.
Increased fermentative metabolism is associated with hyphae, but the
metabolic status of pseudohyphae is unknown. The ability to invade tissues in
vivo and solid agar media in vitro likely requires cells to cope with micro-
aerophilic or anaerobic environments, suggesting similar metabolic preferences of
hyphae and pseudohyphae. In S. cerevisiae there are three defined pathways
regulating pseudohyphal growth that are conserved in C. albicans: the MAPK
pathway, the protein kinase A pathway, and the sucrose non-fermentable
pathway. These pathways are also involved in regulating the cell response to
nutrient availability and either directly target mitochondrial function or are
influenced by mitochondrial function.(117,118) Although these pathways are
160
conserved between S. cerevisiae and C. albicans, the response to respiratory
dysfunction is not. This further supports future investigations of mitochondrial
function and respiratory capacity in the mechanism of the PG effect.
Investigations into the effects of specific cellular factors has revealed that
no one factor dictates morphology, as combinatorial factors in complex
environments affect morphogenesis differently than manipulations of any one
single factor. As stated by Brown and Ene of general compensatory mechanisms
to antifungals(12), are these changes to morphology and metabolism a
requirement for the cell to adapt to the antifungal or is this response an indirect
by-product of exposure to the antifungal agent? Further investigation into the PG
effect is required to answer this, along with the many questions regarding the
clinical potential and significance in antifungal therapy.
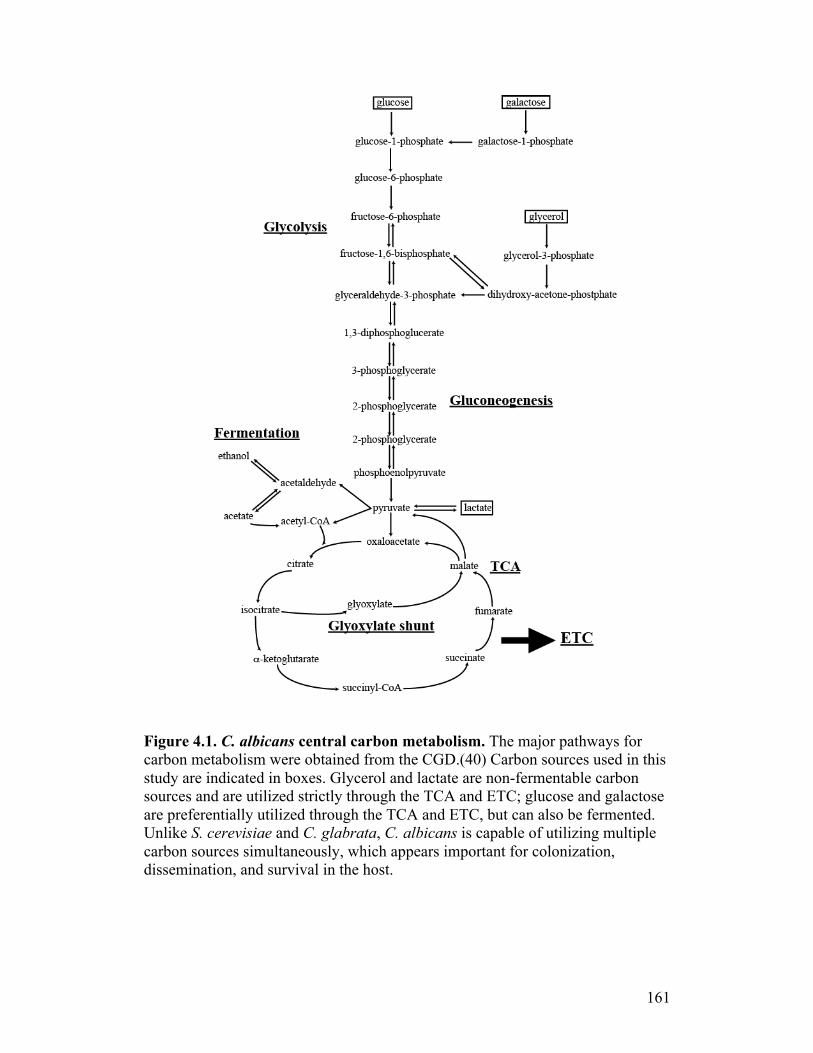
161
Figure 4.1. C. albicans central carbon metabolism. The major pathways for carbon metabolism were obtained from the CGD.(40) Carbon sources used in this study are indicated in boxes. Glycerol and lactate are non-fermentable carbon sources and are utilized strictly through the TCA and ETC; glucose and galactose are preferentially utilized through the TCA and ETC, but can also be fermented. Unlike S. cerevisiae and C. glabrata, C. albicans is capable of utilizing multiple carbon sources simultaneously, which appears important for colonization, dissemination, and survival in the host.
162
4.6. References 1. Chen SC-A, Slavin MA, Sorrell TC. Echinocandin antifungal drugs in
fungal infections. Drugs. 2011. 2. Stevens DA, Espiritu M, Parmar R. Paradoxical effect of caspofungin:
reduced activity against Candida albicans at high drug concentrations. Antimicrob Agents Chemother. 2004;48(9):3407–11.
3. Rueda C, Cuenca-Estrella M, Zaragoza O. Paradoxical growth of Candida albicans in the presence of caspofungin is associated with multiple cell wall rearrangements and decreased virulence. Antimicrob Agents Chemother. 2014;58(2):1071–83.
4. Chamilos G, Lewis RE, Albert N, Kontoyiannis DP. Paradoxical effect of echinocandins across Candida species in vitro: evidence for echinocandin-specific and Candida species-related differences. Antimicrob Agents Chemother. 2007;51(6):2257–9.
5. Melo ASA, Colombo AL, Arthington-Skaggs BA. Paradoxical growth effect of caspofungin observed on biofilms and planktonic cells of five different Candida species. Antimicrob Agents Chemother. 2007;51(9):3081–8.
6. Bizerra FC, Melo ASA, Katchburian E, Freymüller E, Straus AH, Takahashi HK, et al. Changes in cell wall synthesis and ultrastructure during paradoxical growth effect of caspofungin on four different Candida species. Antimicrob Agents Chemother. 2011;55(1):302–10.
7. Rex JH, Alexander BD, Andes D, Arthington-Skaggs BA, Brown SD, Chaturvedi V, et al. Reference method for broth dilution antifungal susceptibility testing of yeasts; approved standard-3rd edition. CLSI document M27-A3. 27(null) ed. Clinical and Laboratory Standards Institute. Wayne, PA: Clinical and Laboratory Standards Institute; 2008. pp. 1–40.
8. Pfaller MA, Castanheira M, Diekema DJ, Messer SA, Moet GJ, Jones RN. Comparison of European Committee on Antimicrobial Susceptibility Testing (EUCAST) and Etest methods with the CLSI broth microdilution method for echinocandin susceptibility testing of Candida species. J Clin Microbiol. 2010;48(5):1592–9.
9. Rodriguez-Tudela JL, Arendrup MC, Barchiesi F, Bille J, Chryssanthou E, Cuenca-Estrella M, et al. EUCAST Definitive Document EDef 7.1: method for the determination of broth dilution MICs of antifungal agents for fermentative yeasts. Clin Microbiol Infect. 2008 Apr;14(4):398–405.
10. Ku TSN, Bernardo SM, Lee SA. In vitro assessment of the antifungal and paradoxical activity of different echinocandins against Candida tropicalis biofilms. J Med Microbiol. 2011;60(11):1708–10.
11. Kuhn DM, Balkis M, Chandra J, Mukherjee PK, Ghannoum MA. Uses and limitations of the XTT assay in studies of Candida growth and metabolism. J Clin Microbiol. 2003;41(1):506–8.
12. Ene IV, Brown AJ. Integration of metabolism with virulence in Candida albicans. Fungal Genomics. Springer Science & Business Media; 2014.

163
pp. 1–22. 13. Seneviratne CJ, Jin LJ, Samaranayake YH, Samaranayake LP. Cell
density and cell aging as factors modulating antifungal resistance of Candida albicans biofilms. Antimicrob Agents Chemother. 2008;52(9):3259–66.
14. Blankenship JR, Mitchell AP. How to build a biofilm: a fungal perspective. Curr Opin Microbiol. 2006 Dec;9(6):588–94.
15. Cate ten JM, Klis FM, Pereira-Cenci T, Crielaard W, de Groot PWJ. Molecular and cellular mechanisms that lead to Candida biofilm formation. J Dent Res. 2009 Mar 5;88(2):105–15.
16. Gow NAR, van de Veerdonk FL, Brown AJP, Netea MG. Candida albicans morphogenesis and host defence: discriminating invasion from colonization. Nat Rev Microbiol. Nature Publishing Group; 2011;10(2):112–22.
17. Khlif M, Bogreau H, Michel-Nguyen A, Ayadi A, Ranque S. Trailing or paradoxical growth of Candida albicans when exposed to caspofungin is not associated with microsatellite genotypes. Antimicrob Agents Chemother. 2010;54(3):1365–8.
18. Bow E, Evans G, Fuller J, Laverdiere M, Rotstein C, Rennie RP, et al. Canadian clinical practice guidelines for invasive candiddiasis in adults. Can J Infect Dis Med Microbiol. 2010;21(4):e122–50.
19. Castanheira M, Woosley LN, Diekema DJ, Messer SA, Jones RN, Pfaller MA. Low prevalence of fks1 hot spot 1 mutations in a worldwide collection of Candida strains. Antimicrob Agents Chemother. 2010;54(6):2655–9.
20. Gamaletsou MN, Daikos GL, Walsh TJ, Perlin DS, Ortigosa CJ, Psaroulaki A, et al. Breakthrough candidaemia caused by phenotypically susceptible Candida spp. in patients with haematological malignancies does not correlate with established interpretive breakpoints. Int J Antimicrob Agents. 2014 Sep;44(3):248–55.
21. Bayegan S, Majoros L, Kardos G, Kemény-Beke A, Miszti C, Kovacs R, et al. In vivo studies with a Candida tropicalis isolate exhibiting paradoxical growth in vitro in the presence of high concentration of caspofungin. J Microbiol. 2010;48(2):170–3.
22. Clemons KV, Espiritu M, Parmar R, Stevens DA. Assessment of the paradoxical effect of caspofungin in therapy of candidiasis. Antimicrob Agents Chemother. 2006 Apr;50(4):1293–7.
23. Pfaller MA, Diekema DJ, Ostrosky-Zeichner L, Rex JH, Alexander BD, Andes D, et al. Correlation of MIC with outcome for Candida species tested against caspofungin, anidulafungin, and micafungin: analysis and proposal for interpretive MIC breakpoints. J Clin Microbiol. 2008;46(8):2620–9.
24. Szabo EK, MacCallum DM. The contribution of mouse models to our understanding of systemic candidiasis. FEMS Microbiol Lett. 2011 Mar 24;320(1):1–8.
25. Koh AY. Murine models of Candida gastrointestinal colonization and
164
dissemination. Eukaryot Cell. 2013 Oct 25;12(11):1416–22. 26. Roetzer A, Gabaldón T, Schüller C. From Saccharomyces cerevisiae to
Candida glabrata in a few easy steps: important adaptations for an opportunistic pathogen. FEMS Microbiol Lett. 2010 Sep 16;314(1):1–9.
27. Perlroth J, Choi B, Spellberg B. Nosocomial fungal infections: epidemiology, diagnosis, and treatment. Med Mycol. 2007 Jan;45(4):321–46.
28. Sanglard D, Coste A, Ferrari S. Antifungal drug resistance mechanisms in fungal pathogens from the perspective of transcriptional gene regulation. FEMS Yeast Res. 2009 Nov;9(7):1029–50.
29. Thompson JR, Douglas CM, Li W, Jue CK, Pramanik B, Yuan X, et al. A glucan synthase FKS1 homolog in Cryptococcus neoformans is single copy and encodes an essential function. J Bacteriol. 1999;181(2):444–53.
30. LaFayette SL, Collins C, Zaas AK, Schell WA, Betancourt-Quiroz M, Gunatilaka AAL, et al. PKC signaling regulates drug resistance of the fungal pathogen Candida albicans via circuitry comprised of Mkc1, calcineurin, and Hsp90. Mitchell AP, editor. PLoS Pathog. 2010;6(8):e1001069.
31. Wiederhold NP, Kontoyiannis DP, Prince RA, Lewis RE. Attenuation of the activity of caspofungin at high concentrations against Candida albicans: possible role of cell wall integrity and calcineurin pathways. Antimicrob Agents Chemother. 2005;49(12):5146–8.
32. Reinoso-Martín C, Schüller C, Schuetzer-Muehlbauer M, Kuchler K. The yeast protein kinase C cell integrity pathway mediates tolerance to the antifungal drug caspofungin through activation of Slt2p mitogen-activated protein kinase signaling. Eukaryot Cell. 2003 Dec;2(6):1200–10.
33. Johnson ME, Edlind TD. Topological and mutational analysis of Saccharomyces cerevisiae Fks1. Eukaryot Cell. 2012;11(7):952–60.
34. Ruiz-Herrera J, Ortiz-Castellanos L. Analysis of the phylogenetic relationships and evolution of the cell walls from yeasts and fungi. FEMS Yeast Res. 2010;10(3):225–43.
35. Mio T, Adachi-Shimizu M, Tachibana Y, Tabuchi H, Inoue SBB, Yabe T, et al. Cloning of the Candida albicans homolog of Saccharomyces cerevisiae GSC1/FKS1 and its involvement in beta-1,3-glucan synthesis. J Bacteriol. 1997;179(13):4096–105.
36. Mazur P, Morin N, Baginsky W, el-Sherbeini M, Clemas JA, Nielsen JB, et al. Differential expression and function of two homologous subunits of yeast 1,3-beta-D-glucan synthase. Mol Cell Biol. 1995 Oct;15(10):5671–81.
37. Kelly R, Register E, Hsu M-J, Kurtz M, Nielsen J. Isolation of a gene involved in 1,3-beta-glucan synthesis in Aspergillus nidulans and purification of the corresponding protein. J Bacteriol. 1996;178(15):4381–91.
38. Mooers A, Holmes E. The evolution of base composition and phylogenetic inference. Trends Ecol. Evol. (Amst.). 2000 Sep;15(9):365–
165
9. 39. Cherry JM, Hong EL, Amundsen C, Balakrishnan R, Binkley G, Chan
ET, et al. Saccharomyces Genome Database: the genomics resource of budding yeast. Nucleic Acids Res. 2011 Dec 22;40(D1):D700–5.
40. Inglis DO, Arnaud MB, Binkley J, Shah P, Skrzypek MS, Wymore F, et al. The Candida genome database incorporates multiple Candida species: multispecies search and analysis tools with curated gene and protein information for Candida albicans and Candida glabrata. Nucleic Acids Res. 2011;40(D1):D667–74.
41. Wood V, Gwilliam R, Rajandream M-A, Lyne M, Lyne R, Stewart A, et al. The genome sequence of Schizosaccharomyces pombe. Nature. 2002 Feb 21;415(6874):871–80.
42. Fares MA, Keane OM, Toft C, Carretero-Paulet L, Jones GW. The roles of whole-genome and small-scale duplications in the functional specialization of Saccharomyces cerevisiae genes. Akey JM, editor. PLoS Genet. 2013;9(1):e1003176.
43. Amoutzias GD, He Y, Gordon J, Mossialos D, Oliver SG, Van de Peer Y. Posttranslational regulation impacts the fate of duplicated genes. Proceedings of the National Academy of Sciences. 2010 Feb 16;107(7):2967–71.
44. Li J, Yuan Z, Zhang Z. The cellular robustness by genetic redundancy in budding yeast. PLoS Genet. 2010 Nov;6(11):e1001187.
45. He X, Zhang J. Gene complexity and gene duplicability. Curr Biol. 2005 Jun;15(11):1016–21.
46. Berman J, Sudbery PE. Candida albicans: A molecular revolution built on lessons from budding yeast. Nat Rev Genet. 2002 Dec;3(12):918–32.
47. Enache-Angoulvant A, Hennequin C. Invasive Saccharomyces infection: a comprehensive review. Clin Infect Dis. 2005 Dec 1;41(11):1559–68.
48. Pfeiffer CD, Garcia-Effron G, Zaas AK, Perfect JR, Perlin DS, Alexander BD. Breakthrough invasive candidiasis in patients on micafungin. J Clin Microbiol. 2010 Jun 29;48(7):2373–80.
49. Alexander BD, Johnson MD, Pfeiffer CD, Jimenez-Ortigosa C, Catania J, Booker R, et al. Increasing echinocandin resistance in Candida glabrata: clinical failure correlates with presence of FKS mutations and elevated minimum inhibitory concentrations. Clin Infect Dis. 2013;56(12):1724–32.
50. Prokisch H, Scharfe C, Camp DG, Xiao W, David L, Andreoli C, et al. Integrative analysis of the mitochondrial proteome in yeast. Plos Biol. 2004;2(6):e160.
51. Sickmann A. The proteome of Saccharomyces cerevisiae mitochondria. Proceedings of the National Academy of Sciences. 2003 Nov 3;100(23):13207–12.
52. Reinders J, Zahedi RP, Pfanner N, Meisinger C, Sickmann A. Toward the complete yeast mitochondrial proteome: multidimensional separation techniques for mitochondrial proteomics. J. Proteome Res. 2006 Jul;5(7):1543–54.

166
53. Jeffares DC, Mourier T, Penny D. The biology of intron gain and loss. Trends in Genetics. 2006 Jan;22(1):16–22.
54. Croll D, McDonald BA. Intron gains and losses in the evolution of Fusarium and Cryptococcus fungi. Genome Biol Evol. 2012;4(11):1148–61.
55. Loftus BJ, Fung E, Roncaglia P, Rowley D, Amedeo P, Bruno D, et al. The genome of the basidiomycetous yeast and human pathogen Cryptococcus neoformans. Science. 2005 Feb 25;307(5713):1321–4.
56. Mastrangelo AM, Marone D, Laidò G, De Leonardis AM, De Vita P. Alternative splicing: Enhancing ability to cope with stress via transcriptome plasticity. Plant Science. Elsevier Ireland Ltd; 2012 Apr 1;185-186:40–9.
57. Freitag J, Ast J, Bölker M. Cryptic peroxisomal targeting via alternative splicing and stop codon read-through in fungi. Nature. 2012 May 23;485(7399):522–5.
58. Grutzmann K, Szafranski K, Pohl M, Voigt K, Petzold A, Schuster S. Fungal alternative splicing is associated with multicellular complexity and virulence: a genome-wide multi-species study. DNA Research. 2013 Oct 11.
59. Goebels C, Thonn A, Gonzalez-Hilarion S, Rolland O, Moyrand F, Beilharz TH, et al. Introns regulate gene expression in Cryptococcus neoformans in a Pab2p dependent pathway. Madhani HD, editor. PLoS Genet. 2013;9(8):e1003686.
60. Karkowska-Kuleta J, Rapala-Kozik M, Kozik A. Fungi pathogenic to humans: molecular bases of virulence of Candida albicans, Cryptococcus neoformans and Aspergillus fumigatus. Acta Biochim Pol. 2009;56(2):211–24.
61. Maligie MA, Selitrennikoff CP. Cryptococcus neoformans resistance to echinocandins: (1,3)-beta-glucan synthase activity is sensitive to echinocandins. Antimicrob Agents Chemother. 2005;49(7):2851–6.
62. van Duin D, Casadevall A, Nosanchuk JD. Melanization of Cryptococcus neoformans and Histoplasma capsulatum reduces their susceptibilities to amphotericin B and caspofungin. Antimicrob Agents Chemother. 2002 Nov;46(11):3394–400.
63. Panepinto JC, Komperda KW, Hacham M, Shin S, Liu X, Williamson PR. Binding of serum mannan binding lectin to a cell integrity-defective Cryptococcus neoformans ccr4 Mutant. Infect Immun. 2007 Sep 19;75(10):4769–79.
64. Garré E, Romero-Santacreu L, Barneo-Muñoz M, Miguel A, Pérez-Ortín JE, Alepuz P. Nonsense-mediated mRNA cecay controls the changes in yeast ribosomal protein pre-mRNAs levels upon osmotic stress. Bardoni B, editor. PLoS ONE. 2013;8(4):e61240.
65. Ito W, Li X, Irie K, Mizuno T, Irie K. RNA-binding protein Khd1 and Ccr4 deadenylase play overlapping roles in the cell wall integrity pathway in Saccharomyces cerevisiae. Eukaryot Cell. 2011 Sep 29;10(10):1340–7.
167
66. Brunke S, Hube B. Two unlike cousins: Candida albicans and C.!glabrata infection strategies. Cell Microbiol. 2013 Jan 14;15(5):701–8.
67. Pai MP, Jones AL, Mullen CK. Micafungin activity against Candida bloodstream isolates: effect of growth medium and susceptibility testing method. Diagn Microbiol Infect Dis. 2007 May;58(1):129–32.
68. Canton E, Peman J, Romero M, Valentín A, Gobernado M. The fungicidal activity and paradoxical effect of caspofungin against yeast. Influence of culture medium and incubation time. Rev Esp Quimioter. 2007 Dec;20(4):433–41.
69. Sabina J, Brown V. Glucose sensing network in Candida albicans: a sweet spot for fungal morphogenesis. Eukaryot Cell. 2009;8(9):1314–20.
70. Brock M. Fungal metabolism in host niches. Curr Opin Microbiol. 2009 Aug;12(4):371–6.
71. Barelle CJ, Priest CL, MacCallum DM, Gow NAR, Odds FC, Brown AJP. Niche-specific regulation of central metabolic pathways in a fungal pathogen. Cell Microbiol. 2006 Jun;8(6):961–71.
72. Hohmann S. Control of high osmolarity signalling in the yeast Saccharomyces cerevisiae. FEBS Lett. 2009 Dec;583(24):4025–9.
73. Han T-L, Cannon RD, Villas-Bôas SG. The metabolic basis of Candida albicans morphogenesis and quorum sensing. Fungal Genet Biol. Elsevier Inc; 2011;48(8):747–63.
74. Ene IV, Adya AK, Wehmeier S, Brand AC, MacCallum DM, Gow NAR, et al. Host carbon sources modulate cell wall architecture, drug resistance and virulence in a fungal pathogen. Cell Microbiol. 2012 Jun 5;14(9):1319–35.
75. Ene IV, Heilmann CJ, Sorgo AG, Walker LA, de Koster CG, Munro CA, et al. Carbon source-induced reprogramming of the cell wall proteome and secretome modulates the adherence and drug resistance of the fungal pathogen Candida albicans. Proteomics. 2012 Oct 29;12(21):3164–79.
76. Moretti S, Bozza S, D'Angelo C, Casagrande A, Fazia Della MA, Pitzurra L, et al. Role of innate immune receptors in paradoxical caspofungin activity in vivo in preclinical aspergillosis. Antimicrob Agents Chemother. 2012;56(8):4268–76.
77. Lewis RE, Albert ND, Kontoyiannis DP. Comparison of the dose-dependent activity and paradoxical effect of caspofungin and micafungin in a neutropenic murine model of invasive pulmonary aspergillosis. J Antimicrob Chemother. 2008 Mar 6;61(5):1140–4.
78. Zanette RA, Kontoyiannis DP. Paradoxical effect to caspofungin in Candida species does not confer survival advantage in a Drosophila model of candidiasis. Virulence. 2013 Aug 15;4(6):497–8.
79. Jiravanichpaisal P, Lee BL, Söderhäll K. Cell-mediated immunity in arthropods: Hematopoiesis, coagulation, melanization and opsonization. Immunobiology. 2006 Jun;211(4):213–36.
80. MacCallum DM. Hosting infection: experimental models to assay Candida virulence. Int J Microbiol. 2012;2012(3):1–12.
81. Odds FC, Van Nuffel L, Gow NAR. Survival in experimental Candida

168
albicans infections depends on inoculum growth conditions as well as animal host. Microbiol. 2000 Aug;146 ( Pt 8):1881–9.
82. Ene IV, Cheng SC, Netea MG, Brown AJP. Growth of Candida albicans cells on the physiologically relevant carbon source lactate affects their recognition and phagocytosis by immune cells. Infect Immun. 2012;81(1):238–48.
83. Ruy F, Vercesi AE, Kowaltowski AJ. Inhibition of specific electron transport pathways leads to oxidative stress and decreased Candida albicans proliferation. J. Bioenerg. Biomembr. 2006 Oct 12;38(2):129–35.
84. Chamilos G, Lewis RE, Kontoyiannis DP. Inhibition of Candida parapsilosis mitochondrial respiratory pathways enhances susceptibility to caspofungin. Antimicrob Agents Chemother. 2006 Feb;50(2):744–7.
85. Marcet-Houben M, Gabaldón T. Evolution of fungi and their respiratory metabolism. In: Pontarotti P, editor. Berlin, Heidelberg: Springer Berlin Heidelberg; 2011. pp. 257–72.
86. VEIGA A, Arrabaça JD, Loureiro-Dias MC. Cyanide-resistant respiration is frequent, but confined to yeasts incapable of aerobic fermentation. FEMS Microbiol Lett. 2000 Sep 1;190(1):93–7.
87. Hao B, Cheng S, Clancy CJ, Nguyen MH. Caspofungin kills Candida albicans by causing both cellular apoptosis and necrosis. Antimicrob Agents Chemother. 2012;57(1):326–32.
88. Yan L, Li M, Cao Y, Gao P, Cao Y, Wang Y, et al. The alternative oxidase of Candida albicans causes reduced fluconazole susceptibility. J Antimicrob Chemother. 2009 Sep 9;64(4):764–73.
89. Dagley MJ, Gentle IE, Beilharz TH, Pettolino FA, Djordjevic JT, Lo TL, et al. Cell wall integrity is linked to mitochondria and phospholipid homeostasis in Candida albicans through the activity of the post-transcriptional regulator Ccr4-Pop2. Mol Microbiol. 2010 Dec 30;79(4):968–89.
90. Qu Y, Jelicic B, Pettolino F, Perry A, Lo TL, Hewitt VL, et al. Mitochondrial sorting and assembly machinery subunit Sam37 in Candida albicans: insight into the roles of mitochondria in fitness, cell wall integrity, and virulence. Eukaryot Cell. 2012 Mar 29;11(4):532–44.
91. Bambach A, Fernandes MP, Ghosh A, Kruppa M, Alex D, Li D, et al. Goa1p of Candida albicans localizes to the mitochondria during stress and is required for mitochondrial function and virulence. Eukaryot Cell. 2009 Oct 30;8(11):1706–20.
92. She X, Zhang L, Chen H, Calderone R, Li D. Cell surface changes in the Candida albicans mitochondrial mutant goa1# are associated with reduced recognition by innate immune cells. Cell Microbiol. 2013;15(9):1572–84.
93. Saville SP, Lazzell AL, Monteagudo C, Lopez-Ribot JL. Engineered control of cell morphology in vivo reveals distinct roles for yeast and filamentous forms of Candida albicans during infection. Eukaryot Cell. 2003 Oct;2(5):1053–60.
169
94. Lo HJ, Köhler JR, DiDomenico B, Loebenberg D, Cacciapuoti A, Fink GR. Nonfilamentous C. albicans mutants are avirulent. Cell. 1997 Sep 5;90(5):939–49.
95. Shareck J, Belhumeur P. Modulation of morphogenesis in Candida albicans by various small molecules. Eukaryot Cell. 2011 Aug 2;10(8):1004–12.
96. Maidan MM, Thevelein JM, Van Dijck P. Carbon source induced yeast-to-hypha transition in Candida albicans is dependent on the presence of amino acids and on the G-protein-coupled receptor Gpr1. Biochem Soc Trans. 2005 Feb;33(Pt 1):291–3.
97. Shepherd MG, Sullivan PA. The production and growth characteristics of yeast and mycelial forms of Candida albicans in continuous culture. Journal of General microbiology. 1976 Apr;93(2):361–70.
98. Odds FC. Morphogenesis in Candida albicans. Crit Rev Microbiol. 1985;12(1):45–93.
99. Land GA, McDonald WC, Stjernholm RL, Friedman L. Factors affecting filamentation in Candida albicans: changes in respiratory activity of Candida albicans during filamentation. Infect Immun. 1975 Jul;12(1):119–27.
100. Dumitru R, Hornby JM, Nickerson KW. Defined anaerobic growth medium for studying Candida albicans basic biology and resistance to eight antifungal drugs. Antimicrob Agents Chemother. 2004 Jul;48(7):2350–4.
101. Han T-L, Cannon RD, Villas-Bôas SG. Metabolome analysis during the morphological transition of Candida albicans. Metabolomics. 2012 Mar 24;8(6):1204–17.
102. Nantel A, Dignard D, Bachewich C, Harcus D, Marcil A, Bouin A-P, et al. Transcription profiling of Candida albicans cells undergoing the yeast-to-hyphal transition. Mol Biol Cell. 2002 Oct;13(10):3452–65.
103. Berman J. Morphogenesis and cell cycle progression in Candida albicans. Curr Opin Microbiol. 2006;9(6):595–601.
104. Burhans WC, Heintz NH. The cell cycle is a redox cycle: Linking phase-specific targets to cell fate. Free Radic. Biol. Med. 2009 Nov;47(9):1282–93.
105. Veses V, Gow NAR. Pseudohypha budding patterns of Candida albicans. Med Mycol. 2009;47(3):268–75.
106. Wightman R. In Candida albicans, the Nim1 kinases Gin4 and Hsl1 negatively regulate pseudohypha formation and Gin4 also controls septin organization. J Cell Biol. 2004 Feb 17;164(4):581–91.
107. Blanco N, Reidy M, Arroyo J, Cabib E. Crosslinks in the cell wall of budding yeast control morphogenesis at the mother-bud neck. J Cell Sci. 2013 Feb 18;125(23):5781–9.
108. Walker LA, Lenardon MD, Preechasuth K, Munro CA, Gow NAR. Cell wall stress induces alternative fungal cytokinesis and septation strategies. J Cell Sci. 2013 Jun 20;126(12):2668–77.
109. Walker LA, Munro CA, de Bruijn I, Lenardon MD, McKinnon A, Gow
170
NAR. Stimulation of chitin synthesis rescues Candida albicans from echinocandins. PLoS Pathog. 2008 Apr 1;4(4):e1000040.
110. Walker LA, Gow NAR, Munro CA. Fungal echinocandin resistance. Fungal Genet Biol. 2010 Feb 1;47(2):117–26.
111. Munro CA, Selvaggini S, de Bruijn I, Walker L, Lenardon MD, Gerssen B, et al. The PKC, HOG and Ca 2+signalling pathways co-ordinately regulate chitin synthesis in Candida albicans. Mol Microbiol. 2007 Mar;63(5):1399–413.
112. Walker LA, Gow NAR, Munro CA. Elevated chitin content reduces the susceptibility of Candida species to caspofungin. Antimicrob Agents Chemother. 2012;57(1):146–54.
113. Gancedo JM. Control of pseudohyphae formation in Saccharomyces cerevisiae. FEMS Microbiology Reviews. 2001 Jan;25(1):107–23.
114. Sudbery P, Gow NAR, Berman J. The distinct morphogenic states of Candida albicans. Trends Microbiol. 2004 Jul;12(7):317–24.
115. Berman J, Gow NAR. Cell cycle of fungal pathogens. In: San-Blas G, Calderone R, editors. Pathogenic fungi: structural biology and taxonomy. Caister Academic Press; 2004. pp. 101–27.
116. Carlisle PL, Banerjee M, Lazzell A, Monteagudo C, Lopez-Ribot JL, Kadosh D. Expression levels of a filament-specific transcriptional regulator are sufficient to determine Candida albicans morphology and virulence. Proc Natl Acad Sci. 2009 Jan 13;106(2):599–604.
117. Johnson C, Kweon HK, Sheidy D, Shively CA, Mellacheruvu D, Nesvizhskii AI, et al. The yeast Sks1p kinase signaling network regulates pseudohyphal growth and glucose response. Erdman S, editor. PLoS Genet. 2014 Mar 6;10(3):e1004183.
118. Aun A, Tamm T, Sedman J. Dysfunctional mitochondria modulate cAMP-PKA signaling and filamentous and invasive growth of Saccharomyces cerevisiae. Genetics. 2013 Feb 8;193(2):467–81.

171
Chapter 5: Conclusions

172
5.1. Future directions
This project began when I noticed a trend of unexplained anomalies in
echinocandin research, in particular the noticeable growth above the MIC and the
unexplained intrinsic resistance of some species despite highly similar GS
sequences. The assumption regarding the mechanism of action of echinocandins
is that they inhibit glucan synthesis, resulting in cell wall fragility and eventual
lysis due to overwhelming osmotic forces. However, the anomalies surrounding
the response of fungi to echinocandins are suggestive of additional cellular effects
not necessarily associated with the cell wall. To me, these anomalies are an
opportunity to evaluate the cellular effects of echinocandins in the hope of
maximizing their therapeutic potential. Perhaps it is as the late Isaac Asimov said:
“The most exciting phrase to hear in science, the one that heralds new discoveries,
is not ‘Eureka’ but ‘That’s funny...’ ”
My research has contributed to the overall understanding of what is
happening in PG cells, but has not determined why it is happening or why it is
only happening at elevated concentrations. Based on the significant
morphological and physiological differences in PG cells, future investigations into
this effect to answer these questions will likely provide significant insight into the
connections between cellular response to cell wall stress, cellular metabolism, and
antimicrobial resistance. Identifying the mechanism of PG will contribute to our
understanding of mechanisms of intrinsic echinocandin resistance, may provide a
means of increasing the efficacy profile to include more fungal species, and
determine the potential for this effect to contribute in treatment failure.

173
5.1.1. Clinical significance of the PG effect
C. albicans is an important organism. It is not only a significant
contributor to human disease, it is a model organism to study morphogenesis,
virulence, and pathogenesis of fungi. It is a fast growing organism, and in my
opinion this yeast is easier than, for example, filamentous fungi to manipulate in
the laboratory. S. cerevisiae is the most widely studied fungus but is not an ideal
model as it is rarely pathogenic. Approximately 80% of C. albicans’ genes are
homologous to S. cerevisiae’s, allowing a direct comparison of conserved cell
pathways and functions between the two organisms; however, at least 13% of
genes are unique to C. albicans, and highlight the importance of investigating
species specific cell functions, especially those pertaining to pathogenesis or
antifungal response.(1) In addition to being an important human pathogen, C.
albicans is an excellent organism to investigate due to its practicality in ease of
use and extensive genetic information available.
C. albicans is one of the most prevalent fungi in humans,
asymptomatically colonizing the skin, genital-, and intestinal-mucosa of up to
70% of healthy individuals.(2) Candida spp. are responsible for over 70% of all
IFIs in North America, with C. albicans accounting for almost 50%.(3) The
annual incidence of invasive disease caused by C. albicans in the Calgary Health
Region is 1.5 per 100,000.(4) This is similar to other regions, which are also
demonstrating increasing rates of candidemia.(5) The burden of these infections is
significant in terms of cost to both the patient and the health care system, and

174
warrants continuing efforts to decrease the risk and progression of these
infections.
C. albicans becomes an opportunistic pathogen when host defense barriers
become compromised, such as a break in the mucosal barrier or disruption of the
host immune system. Superficial infections affect a significant proportion of the
population; oral candidiasis is prevalent among HIV and cancer patients receiving
chemotherapy or radiation, and many women suffer from recurrent vulvovaginal
candidiasis.(6) While generally not life threatening, these infections are often
persistent and cause discomfort and distress to patients. Systemic infections occur
after yeast gain access to the bloodstream or tissues, often secondary to invasive
medical procedures, the use of broad-spectrum antibiotics, and immune
suppressing therapies, diseases, and infections.(7) While the incidence of
candidemia is increasing in parallel with increasing populations at risk, the
mortality rate has remained the same.(5) Still, the mortality rate remains high, as
candidemia is associated with a 14.5% and 10% increase in mortality in adult and
pediatric patients, respectively.(8)
The severe impact to morbidity and mortality associated with Candida spp.
infections highlights the imminent need for appropriate diagnostics, prevention,
and treatment.
The current Canadian guidelines for first line therapy of candidemia
caused by C. albicans is fluconazole or echinocandins, and due to the increasing
resistance to fluconazole, echinocandins are preferred first line therapy if there is
a previous exposure to azoles.(1,9) Fluconazole is an effective first line therapy

175
with minimal side effects, but resistance is increasing with widespread use, and
prior exposure significantly increases the risk of recovering Candida spp. isolates
with decreased fluconazole susceptibility.(2,10) Although there are increasing
reports of clinical isolates with FKS mutations conferring resistance to
echinocandins, the overall prevalence of resistance remains low with only 2-3%
of C. albicans and related species.(3,4,11,12)
The high safety and efficacy of echinocandins in treating C. albicans is
due to their limited drug interactions and fungal specific target. Because of this,
the use of echinocandins is increasing, with more than 60% of candidemia
patients receiving an echinocandin(5,12), and their use in high dose strategies is
an attractive option to increase efficacy. With the current dosing regimen of a 70
mg CASPO loading dose, peak plasma concentrations reach 11—12 mg/L.(6,13)
My data demonstrate this concentration range is too low to stimulate PG in vitro
in most isolates, as only 13 of the 24 C. albicans isolates I evaluated demonstrated
PG within this concentration range (8—32 mg/L), and only with an elevated
starting inoculum. If the PG effect can occur in vivo, it is not likely to occur with
the current dosing regimen. Dose escalation to 150 and 200 mg CASPO can
achieve peak plasma concentrations of 29.4 and 33.5 mg/L, respectively(7,14),
concentrations at which PG occurs in vitro. However, plasma concentrations are
continuously fluctuating and it is unknown how this could affect PG.
Echinocandins are highly protein bound and are sequestered in tissues
even after plasma concentrations begin to decline.(5,13,15) Addition of serum to
MIC testing medium results in increased MIC values 2- to 4-fold and eliminates

176
the PG effect with concentrations up to 64 mg/L.(8,16,17) However, due to a
several fold increase in MIC, it is likely that the concentrations were not high
enough to properly evaluate the effects of serum on PG, as it is likely the PG
concentrations also increase by this factor. Whether PG is achievable in the
presence of serum is dependent on if these concentrations (>64 mg/L) could be
sustained in vivo, even with dose escalation. Peak and trough plasma
concentrations, the effects of protein binding, and the high sequestration of
echinocandins in tissues are all complex factors that must be addressed to fully
understand appropriate dosing for treatment management as well as the potential
for PG in vivo.
Dose escalation could increase efficacy for isolates with increased MICs,
providing a means to treat yeast isolates with FKS mutations. However, in a
murine model of invasive candidiasis, CASPO dose escalation was not
consistently effective against C. albicans isolates with FKS1 mutations.(18) The
authors only evaluated 3 isolates and did not determine pharmacokinetics, but the
lack of treatment success with increasing concentrations is a cause for concern. A
similar study also determined that dose escalation was not effective against C.
albicans with hetero- or homozygous FKS1 mutations; moreover, this study
determined that while the EUCAST clinical breakpoints could predict in vivo
responses with standard dosing, they could not predict responses with elevated
doses.(19) The maximum tolerated dose of CASPO is unknown, but high doses
are well tolerated in patients with invasive candidiasis and aspergillosis up to 210
mg.(20) The use of dose escalation in empirical therapy is appealing, but it is not

177
known whether these treatment failures correlate with in vivo PG or if increased
exposure with dose escalation could further contribute to acquired echinocandin
resistance.
One potential infection model that is of particular interest in regards to the
PG effect is antifungal (or catheter) lock therapy. Long-term intravascular
devices, such as central venous and hemodialysis catheters, are prone to biofilm
formation.(21) Biofilms are organized communities of cells embedded within an
extracellular matrix that can adhere to abiotic surfaces, such as a catheter lumen,
and are more resistant to host defenses and antifungal therapy.(22,23) Current
guidelines for catheter associated blood stream infections by Candida spp.
recommend removal of the device and reinsertion at an alternate site.(24)
However, this process can contribute to morbidity and mortality, and may not be
practical in patients in which another site is not accessible. Antifungal lock
therapy involves administering highly concentrated drug solution to sterilize the
device; while this is generally not applied clinically yet, the use of amphotericin
B, ethanol, and echinocandins are potential antifungal lock therapy agents based
on animal studies and a collection of case reports.(21) There have been no
consensus on dosage for echinocandin use in antifungal lock therapy as some
demonstrated success with as little as 2 mg/L CASPO(25), therefore it is
premature to draw conclusions or extrapolate the potential for PG from in vitro
data. However, given that antifungal lock therapy utilizes highly concentrated
drug, this application has the potential to demonstrate PG if echinocandin
concentrations used were within the PG range.
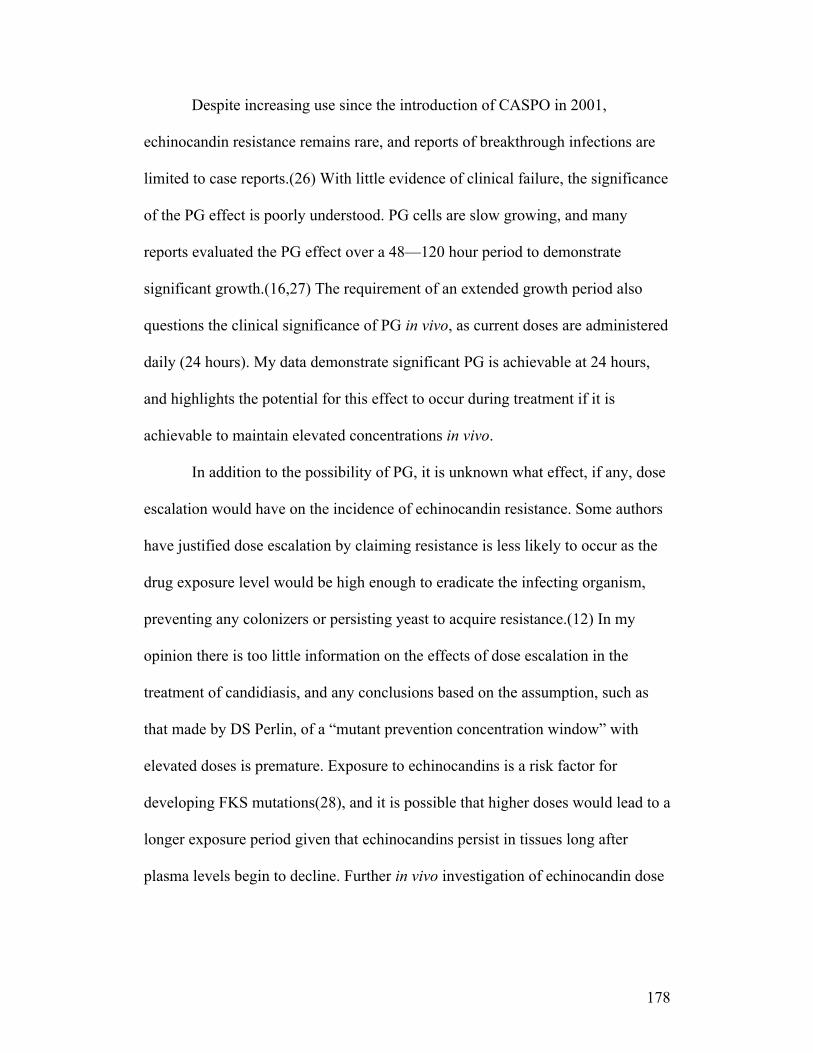
178
Despite increasing use since the introduction of CASPO in 2001,
echinocandin resistance remains rare, and reports of breakthrough infections are
limited to case reports.(26) With little evidence of clinical failure, the significance
of the PG effect is poorly understood. PG cells are slow growing, and many
reports evaluated the PG effect over a 48—120 hour period to demonstrate
significant growth.(16,27) The requirement of an extended growth period also
questions the clinical significance of PG in vivo, as current doses are administered
daily (24 hours). My data demonstrate significant PG is achievable at 24 hours,
and highlights the potential for this effect to occur during treatment if it is
achievable to maintain elevated concentrations in vivo.
In addition to the possibility of PG, it is unknown what effect, if any, dose
escalation would have on the incidence of echinocandin resistance. Some authors
have justified dose escalation by claiming resistance is less likely to occur as the
drug exposure level would be high enough to eradicate the infecting organism,
preventing any colonizers or persisting yeast to acquire resistance.(12) In my
opinion there is too little information on the effects of dose escalation in the
treatment of candidiasis, and any conclusions based on the assumption, such as
that made by DS Perlin, of a “mutant prevention concentration window” with
elevated doses is premature. Exposure to echinocandins is a risk factor for
developing FKS mutations(28), and it is possible that higher doses would lead to a
longer exposure period given that echinocandins persist in tissues long after
plasma levels begin to decline. Further in vivo investigation of echinocandin dose

179
escalation utilizing a recovery mammalian model is warranted to monitor clinical
efficacy for signs of emerging resistance and the PG effect.
Echinocandin resistance and the PG effect are distinguished by MICs:
resistance refers to an elevated MIC based on clinical breakpoints that predict
clinical failure, while the PG effect does not correlate with MIC. This lack of
correlation with MIC, and presumably clinical therapy, is the reason the PG effect
has generally been discounted. Resistance mechanisms of C. albicans are
generally attributable for rendering an isolate untreatable with an echinocandin,
such as a mutation in FKS1; the PG effect has been considered an in vitro
phenomenon of echinocandin tolerance as a result of an adaptive physiological
mechanism in response to cell wall damage.(27,29) There are marked similarities
in resistant FKS mutants and PG cells, most notably significant increases in cell
wall chitin as a result of upregulated calcineurin and CWI pathways.(30) The PG
effect is not associated with FKS1 mutations(16,27), but the similarity is response
pathways may be indicative of shared compensatory mechanisms for the PG
effect and resistance. There are no reports of clinical failure due to C. albicans
without an FKS1 mutation, and only one report of a laboratory mutant with
reduced susceptibility to CASPO as a result of mutations in two chitinase genes
(but no FKS1 mutations).(31)
The possibility of persistent growth, either due to a mechanism for
resistance or PG, at elevated echinocandin concentrations poses a significant
drawback to a drug class that is otherwise proven safe and effective for
candidiasis. Further study of the PG phenomenon will help determine its

180
significance to treatment failure, identify cellular response mechanisms
contributing to resistance, identify ways to fight it, and improve options for
antifungal therapy.
5.2. Major findings
The major findings of this thesis that contribute to the field of
echinocandin research can be summarized as follows:
1. All C. albicans demonstrate the PG effect when exposed to elevated
concentrations of CASPO.
2. Demonstration of the PG effect in C. albicans with in vitro broth
microdilution is dependent on the starting inoculum.
3. Confirmation that C. glabrata does not demonstrate the PG effect under
the same test conditions as C. albicans.
4. GS sequence alone does not account for or predict the cellular response
of different fungal species to echinocandins.
5. The PG effect is modulated by carbon source.
181
6. PG cells demonstrate a marked cell cycle delay in G2/M not observed
with inhibitory concentrations of CASPO.
5.3 Conclusions
Due to the lack of correlation between MIC or treatment failure and the
PG effect, it has been assumed to be a purely in vitro phenomenon and irrelevant
in the management of infections. While the in vivo potential of this effect has yet
to be fully evaluated for candidiasis, my research demonstrates how growth
conditions influence the degree of PG and may influence the testing and
evaluation of PG in vivo. Inoculum density influences the PG effect, and this
research demonstrates that all C. albicans but no C. glabrata exhibit PG with in
vitro broth microdilution testing. This has two major implications: first, the
clinical potential of this effect has been previously underestimated by assuming
only a subset of strains is capable of PG; and secondly, the differences between
these organisms can be utilized to investigate the mechanism for PG. I also
demonstrated that carbon source modulates the PG effect, where this effect is
significantly more prominent in fermentable carbon sources. While murine
models of candidiasis have been inconclusive in the demonstration of a
reproducible PG effect, this research provides evidence for investigating PG in
different infection models to investigate whether different host niches are more
amenable to the PG effect due to differing nutrient availabilities.
My research findings contribute to the growing body of evidence that
suggests the action of echinocandins is not entirely concentration dependent. Most

182
studies only evaluate sub-inhibitory or PG concentrations of echinocandins. This
research highlights the significant physiological differences between yeast grown
at PG and inhibitory CASPO concentrations, including changes to metabolism,
morphology, and cell cycle inhibition, demonstrating the need to evaluate
subinhibitory, inhibitory and PG concentrations to fully understand the cellular
effects of echinocandins.
The echinocandins have variable efficacy among different fungal species,
limiting their use in management of IFIs. My research provided a fully resolved
gene phylogeny to accurately infer the evolution of GS and highlights the lack of
correlation between susceptibility and amino acid sequence of the putative GS
echinocandin binding sites. My findings further our understanding of GS and
provide the foundation for future research to investigate the sub-cellular
localization and post-transcriptional regulation of GS that contributes to decreased
susceptibility in some fungi.

183
5.4. References 1. Kabir MA, Hussain MA, Ahmad Z. Candida albicans: A model organism
for studying fungal pathogens. ISRN Microbiology. 2012;2012(5):1–15. 2. Gow NAR, van de Veerdonk FL, Brown AJP, Netea MG. Candida
albicans morphogenesis and host defence: discriminating invasion from colonization. Nat Rev Microbiol. Nature Publishing Group; 2011;10(2):112–22.
3. Azie N, Neofytos D, Pfaller MA, Meier-Kriesche H-U, Quan S-P, Horn D. The PATH (Prospective Antifungal Therapy) Alliance® registry and invasive fungal infections: update 2012. Diagn Microbiol Infect Dis. 2012 Aug;73(4):293–300.
4. Laupland KB, Gregson DB, Church DL, Ross T, Elsayed S. Invasive Candida species infections: a 5 year population-based assessment. J Antimicrob Chemother. 2005 Sep 1;56(3):532–7.
5. Fortún J, Martín-Dávila P, Gómez-García de la Pedrosa E, Pintado V, Cobo J, Fresco G, et al. Emerging trends in candidemia: A higher incidence but a similar outcome. Journal of Infection. 2012 Jul;65(1):64–70.
6. Hay RJ. The management of superficial candidiasis. J. Am. Acad. Dermatol. 1999 Jun;40(6 Pt 2):S35–42.
7. Pfaller MA, Diekema DJ. Epidemiology of invasive candidiasis: a persistent public health problem. Clin Microbiol Rev. 2007;20(1):133–63.
8. Zaoutis TE, Argon J, Chu J, Berlin JA, Walsh TJ, Feudtner C. The epidemiology and attributable outcomes of candidemia in adults and children hospitalized in the United States: a propensity analysis. Clin Infect Dis. 2005 Nov 1;41(9):1232–9.
9. Bow E, Evans G, Fuller J, Laverdiere M, Rotstein C, Rennie RP, et al. Canadian clinical practice guidelines for invasive candidiasis in adults. Can J Infect Dis Med Microbiol. 2010;21(4):e122–50.
10. Lortholary O, Desnos-Ollivier M, Sitbon K, Fontanet A, Bretagne S, FF D, et al. Recent Exposure to Caspofungin or Fluconazole Influences the Epidemiology of Candidemia: a Prospective Multicenter Study Involving 2,441 Patients. Antimicrob Agents Chemother. 2011 Jan 20;55(2):532–8.
11. Castanheira M, Woosley LN, Diekema DJ, Messer SA, Jones RN, Pfaller MA. Low prevalence of fks1 hot spot 1 mutations in a worldwide collection of Candida strains. Antimicrob Agents Chemother. 2010;54(6):2655–9.
12. Perlin DS. Echinocandin resistance, susceptibility testing and prophylaxis: implications for patient management. Drugs. 2014;74(14):1573–85.
13. Stone JA, Xu X, Winchell GA, Deutsch PJ, Pearson PG, Migoya EM, et al. Disposition of caspofungin: role of distribution in determining pharmacokinetics in plasma. Antimicrob Agents Chemother. 2004 Feb 24;48(3):815–23.
14. Migoya EM, Mistry GC, Stone JA, Comisar W, Sun P, Norcross A, et al. Safety and pharmacokinetics of higher doses of caspofungin in healthy adult participants. J Clin Pharmacol. 2011;51(2):202–11.
15. Louie A, Deziel M, Liu W, Drusano MF, Gumbo T, Drusano GL.

184
Pharmacodynamics of caspofungin in a murine model of systemic candidiasis: importance of persistence of caspofungin in tissues to understanding drug activity. Antimicrob Agents Chemother. 2005 Nov 22;49(12):5058–68.
16. Stevens DA, Espiritu M, Parmar R. Paradoxical effect of caspofungin: reduced activity against Candida albicans at high drug concentrations. Antimicrob Agents Chemother. 2004;48(9):3407–11.
17. Shields RK, Nguyen MH, Du C, Press E, Cheng S, Clancy CJ. Paradoxical effect of caspofungin against Candida bloodstream isolates is mediated by multiple pathways but eliminated in human serum. Antimicrob Agents Chemother. 2011;55(6):2641–7.
18. Wiederhold NP, Najvar LK, Bocanegra RA, Kirkpatrick WR, Patterson TF. Caspofungin dose escalation for invasive candidiasis due to resistant Candida albicans. Antimicrob Agents Chemother. 2011 Jun 16;55(7):3254–60.
19. Lackner M, Tscherner M, Schaller M, Kuchler K, Mair C, Sartori B, et al. Positions and numbers of FKS mutations in Candida albicans selectively influence in vitro and in vivo susceptibilities to echinocandin treatment. Antimicrob Agents Chemother. 2014 Jun 12;58(7):3626–35.
20. Betts RF, Nucci M, Talwar D, Gareca M, Queiroz Telles F, Bedimo RJ, et al. A multicenter, double-blind trial of a high-dose caspofungin treatment regimen versus a standard caspofungin treatment regimen for adult patients with invasive candidiasis. Clin Infect Dis. 2009;48(12):1676–84.
21. Walraven CJ, Lee SA. Antifungal lock therapy. Antimicrob Agents Chemother. 2012;57(1):1–8.
22. Sardi JCO, Scorzoni L, Bernardi T, Fusco-Almeida AM, Mendes Giannini MJS. Candida species: current epidemiology, pathogenicity, biofilm formation, natural antifungal products and new therapeutic options. J Med Microbiol. 2012 Dec 6;62(Pt_1):10–24.
23. Blankenship JR, Mitchell AP. How to build a biofilm: a fungal perspective. Curr Opin Microbiol. 2006 Dec;9(6):588–94.
24. Mermel LA, Allon M, Bouza E, Craven DE, Flynn P, O’Grady NP, et al. Clinical Practice Guidelines for the Diagnosis and Management of Intravascular Catheter-Related Infection: 2009 Update by the Infectious Diseases Society of America. Clin Infect Dis. 2009;49(1):1–45.
25. Cateau E, Rodier MH, Imbert C. In vitro efficacies of caspofungin or micafungin catheter lock solutions on Candida albicans biofilm growth. J Antimicrob Chemother. 2008 Apr 1;62(1):153–5.
26. Gamaletsou MN, Daikos GL, Walsh TJ, Perlin DS, Ortigosa CJ, Psaroulaki A, et al. Breakthrough candidaemia caused by phenotypically susceptible Candida spp. in patients with haematological malignancies does not correlate with established interpretive breakpoints. Int J Antimicrob Agents. 2014 Sep;44(3):248–55.
27. Rueda C, Cuenca-Estrella M, Zaragoza O. Paradoxical growth of Candida albicans in the presence of caspofungin is associated with multiple cell wall rearrangements and decreased virulence. Antimicrob Agents
185
Chemother. 2014;58(2):1071–83. 28. Dannaoui E, Desnos-Ollivier M, Garcia-Hermoso D, Grenouillet F,
Cassaing S, Baixench M-T, et al. Candida spp. with acquired echinocandin resistance, France, 2004–2010. Emerg. Infect. Dis. 2012 Jan;18(1):86–90.
29. Lewis RE, Liao G, Hou J, Prince RA, Kontoyiannis DP. Comparative in vivo dose-dependent activity of caspofungin and anidulafungin against echinocandin-susceptible and -resistant Aspergillus fumigatus. J Antimicrob Chemother. 2011 May 11;66(6):1324–31.
30. Walker LA, Munro CA, de Bruijn I, Lenardon MD, McKinnon A, Gow NAR. Stimulation of chitin synthesis rescues Candida albicans from echinocandins. PLoS Pathog. 2008 Apr 1;4(4):e1000040.
31. Drakulovski P, Dunyach C, Bertout S, Reynes J, Mallié M. A Candida albicans strain with high MIC for caspofungin and no FKS1 mutations exhibits a high chitin content and mutations in two chitinase genes. Med Mycol. 2011;:1–8.

186
Bibliography
187
Abascal F, Zardoya R, Telford MJ. TranslatorX: multiple alignment of nucleotide sequences guided by amino acid translations. Nucleic Acids Res. 2010 Jun 24;38:W7–W13.
Abe M, Qadota H, Hirata A, Ohya Y. Lack of GTP-bound Rho1p in secretory vesicles of Saccharomyces cerevisiae. J Cell Biol. 2003 Jul 7;162(1):85–97.
Abruzzo GK, Flattery AM, Gill CJ, Kong L, Smith JG, Pikounis VB, et al. Evaluation of the echinocandin antifungal MK-0991 (L-743,872): efficacies in mouse models of disseminated aspergillosis, candidiasis, and cryptococcosis. Antimicrob Agents Chemother. 1997 Nov;41(11):2333–8.
Alberts AS. Analysis of RhoA-binding proteins reveals an interaction domain conserved in heterotrimeric G protein beta subunits and the yeast response regulator protein Skn7. J Biol Chem. 1998;273(15):8616–22.
Alexander BD, Johnson MD, Pfeiffer CD, Jimenez-Ortigosa C, Catania J, Booker R, et al. Increasing echinocandin resistance in Candida glabrata: clinical failure correlates with presence of FKS mutations and elevated minimum inhibitory concentrations. Clin Infect Dis. 2013;56(12):1724–32.
Amoutzias GD, He Y, Gordon J, Mossialos D, Oliver SG, Van de Peer Y. Posttranslational regulation impacts the fate of duplicated genes. Proceedings of the National Academy of Sciences. 2010 Feb 16;107(7):2967–71.
Ashley N, Harris D, Poulton J. Detection of mitochondrial DNA depletion in living human cells using PicoGreen staining. Exp Cell Res. 2005 Feb;303(2):432–46.
Aun A, Tamm T, Sedman J. Dysfunctional mitochondria modulate cAMP-PKA signaling and filamentous and invasive growth of Saccharomyces cerevisiae. Genetics. 2013 Feb 8;193(2):467–81.
Azie N, Neofytos D, Pfaller MA, Meier-Kriesche H-U, Quan S-P, Horn D. The PATH (Prospective Antifungal Therapy) Alliance® registry and invasive fungal infections: update 2012. Diagn Microbiol Infect Dis. 2012 Aug;73(4):293–300.
Baillie GS, Douglas LJ. Matrix polymers of Candida biofilms and their possible role in biofilm resistance to antifungal agents. J Antimicrob Chemother. 2000 Sep;46(3):397–403.
Baginsky W. In vitro activity of 1,3-beta-D-glucan synthase requires the GTP-binding protein Rho1. J Biol Chem. 1996;271(24):14604–9.
Balashov SV, Park S, Perlin DS. Assessing resistance to the echinocandin antifungal drug caspofungin in Candida albicans by profiling mutations in FKS1.
188
Antimicrob Agents Chemother. 2006;50(6):2058–63.
Bambach A, Fernandes MP, Ghosh A, Kruppa M, Alex D, Li D, et al. Goa1p of Candida albicans localizes to the mitochondria during stress and is required for mitochondrial function and virulence. Eukaryot Cell. 2009 Oct 30;8(11):1706–20.
Barelle CJ, Priest CL, MacCallum DM, Gow NAR, Odds FC, Brown AJP. Niche-specific regulation of central metabolic pathways in a fungal pathogen. Cell Microbiol. 2006 Jun;8(6):961–71.
Bartizal C, Odds FC. Influences of methodological variables on susceptibility testing of caspofungin against Candida species and Aspergillus fumigatus. Antimicrob Agents Chemother. 2003;47(7):2100–7.
Bartnicki-Garcia S. Cell wall chemistry, morphogenesis, and taxonomy of fungi. Annu Rev Microbiol. 1968;22:87–108.
Bayegan S, Majoros L, Kardos G, Kemény-Beke A, Miszti C, Kovacs R, et al. In vivo studies with a Candida tropicalis isolate exhibiting paradoxical growth in vitro in the presence of high concentration of caspofungin. J Microbiol. 2010;48(2):170–3.
Beauvais A, Bruneau JM, Mol PC, Buitrago MJ, Legrand R, Latge JP. Glucan synthase complex of Aspergillus fumigatus. J Bacteriol. 2001;183(7):2273–9.
Ben-Ami R, Garcia-Effron G, Lewis RE, Gamarra S, Leventakos K, Perlin DS, et al. Fitness and virulence costs of Candida albicans FKS1 hot spot mutations associated with echinocandin resistance. J Infect Dis. 2011;204(4):626–35.
Berman J. Morphogenesis and cell cycle progression in Candida albicans. Curr Opin Microbiol. 2006;9(6):595–601.
Berman J, Gow NAR. Cell cycle of fungal pathogens. In: San-Blas G, Calderone R, editors. Pathogenic fungi: structural biology and taxonomy. Caister Academic Press; 2004. pp. 101–27.
Berman J, Sudbery PE. Candida albicans: A molecular revolution built on lessons from budding yeast. Nat Rev Genet. 2002 Dec;3(12):918–32.
Betts RF, Nucci M, Talwar D, Gareca M, Queiroz Telles F, Bedimo RJ, et al. A multicenter, double-blind trial of a high-dose caspofungin treatment regimen versus a standard caspofungin treatment regimen for adult patients with invasive candidiasis. Clin Infect Dis. 2009;48(12):1676–84.
Bizerra FC, Melo ASA, Katchburian E, Freymüller E, Straus AH, Takahashi HK, et al. Changes in cell wall synthesis and ultrastructure during paradoxical growth effect of caspofungin on four different Candida species. Antimicrob Agents Chemother. 2011;55(1):302–10.
189
Blanco N, Reidy M, Arroyo J, Cabib E. Crosslinks in the cell wall of budding yeast control morphogenesis at the mother-bud neck. J Cell Sci. 2013 Feb 18;125(23):5781–9.
Blankenship JR, Mitchell AP. How to build a biofilm: a fungal perspective. Curr Opin Microbiol. 2006 Dec;9(6):588–94.
Bow E, Evans G, Fuller J, Laverdiere M, Rotstein C, Rennie RP, et al. Canadian clinical practice guidelines for invasive candidiasis in adults. Can J Infect Dis Med Microbiol. 2010;21(4):e122–50.
Bowman JC, Abruzzo GK, Flattery AM, Gill CJ, Hickey EJ, Hsu M-J, et al. Efficacy of caspofungin against Aspergillus flavus, Aspergillus terreus, and Aspergillus nidulans. Antimicrob Agents Chemother. 2006 Nov 22;50(12):4202–5.
Braun BR, Head WS, Wang MX, Johnson AD. Identification and characterization of TUP1-regulated genes in Candida albicans. Genetics. 2000 Sep;156(1):31–44.
Braun BR, Johnson AD. Control of filament formation in Candida albicans by the transcriptional repressor TUP1. Science. 1997 Jul 4;277(5322):105–9.
Brock M. Fungal metabolism in host niches. Curr Opin Microbiol. 2009 Aug;12(4):371–6.
Brunke S, Hube B. Two unlike cousins: Candida albicans and C.!glabrata infection strategies. Cell Microbiol. 2013 Jan 14;15(5):701–8.
Burhans WC, Heintz NH. The cell cycle is a redox cycle: Linking phase-specific targets to cell fate. Free Radic. Biol. Med. 2009 Nov;47(9):1282–93.
Calvo E, Pastor FJ, Mayayo E, Salas V, Guarro J. In vitro activity and in vivo efficacy of anidulafungin in murine infections by Aspergillus flavus. Antimicrob Agents Chemother. 2011;55(3):1290–2.
Campbell JA, Davies GJ, Bulone V, Henrissat B. A classification of nucleotide-diphospho-sugar glycosyltransferases based on amino acid sequence similarities. Biochem J. 1997 Sep 15;326 ( Pt 3):929–39.
Cancidas. Merck & Co., Inc; 2013. pp. 1–24.
Cantarel BL, Coutinho PM, Rancurel C, Bernard T, Lombard V, Henrissat B. The Carbohydrate-Active EnZymes database (CAZy): an expert resource for glycogenomics. Nucleic Acids Res. 2009;37(Database):D233–8.
Canton E, Peman J, Romero M, Valentín A, Gobernado M. The fungicidal

190
activity and paradoxical effect of caspofungin against yeast. Influence of culture medium and incubation time. Rev Esp Quimioter. 2007 Dec;20(4):433–41.
Cardon CM, Beck T, Hall MN, Rutter J. PAS kinase promotes cell survival and growth through activation of Rho1. Sci Signal. 2012;5(209):1–9.
Carlisle PL, Banerjee M, Lazzell A, Monteagudo C, Lopez-Ribot JL, Kadosh D. Expression levels of a filament-specific transcriptional regulator are sufficient to determine Candida albicans morphology and virulence. Proc Natl Acad Sci. 2009 Jan 13;106(2):599–604.
Cassone A, Mason RE, Kerridge D. Lysis of growing yeast-form cells of Candida albicans by echinocandin: a cytological study. Sabouraudia. 1981 Jun;19(2):97–110.
Castanheira M, Woosley LN, Diekema DJ, Messer SA, Jones RN, Pfaller MA. Low prevalence of fks1 hot spot 1 mutations in a worldwide collection of Candida strains. Antimicrob Agents Chemother. 2010;54(6):2655–9.
Cate ten JM, Klis FM, Pereira-Cenci T, Crielaard W, de Groot PWJ. Molecular and cellular mechanisms that lead to Candida biofilm formation. J Dent Res. 2009 Mar 5;88(2):105–15.
Cateau E, Rodier MH, Imbert C. In vitro efficacies of caspofungin or micafungin catheter lock solutions on Candida albicans biofilm growth. J Antimicrob Chemother. 2008 Apr 1;62(1):153–5.
Chamilos G, Lewis RE, Albert N, Kontoyiannis DP. Paradoxical effect of echinocandins across Candida species in vitro: evidence for echinocandin-specific and Candida species-related differences. Antimicrob Agents Chemother. 2007;51(6):2257–9.
Chamilos G, Lewis RE, Kontoyiannis DP. Inhibition of Candida parapsilosis mitochondrial respiratory pathways enhances susceptibility to caspofungin. Antimicrob Agents Chemother. 2006 Feb;50(2):744–7.
Chandra J, Kuhn DM, Mukherjee PK, Hoyer LL, McCormick T, Ghannoum MA. Biofilm formation by the fungal pathogen Candida albicans: development, architecture, and drug resistance. J Bacteriol. 2001 Sep 15;183(18):5385–94.
Chang J-M, Di Tommaso P, Taly J-F, Notredame C. Accurate multiple sequence alignment of transmembrane proteins with PSI-Coffee. BMC Bioinformatics. BioMed Central Ltd; 2012 Mar 28;13(Suppl 4):S1.
Chen K, Durand D, Farach-Colton M. NOTUNG: a program for dating gene duplications and optimizing gene family trees. J Comput Biol. 2000;7(3-4):429–47.

191
Chen SC-A, Slavin MA, Sorrell TC. Echinocandin antifungal drugs in fungal infections. Drugs. 2011.
Cherry JM, Hong EL, Amundsen C, Balakrishnan R, Binkley G, Chan ET, et al. Saccharomyces Genome Database: the genomics resource of budding yeast. Nucleic Acids Res. 2011 Dec 22;40(D1):D700–5.
Clancy CJ, Huang H, Cheng S, Derendorf H, Nguyen MH. Characterizing the effects of caspofungin on Candida albicans, Candida parapsilosis, and Candida glabrata isolates by simultaneous time-kill and postantifungal-effect experiments. Antimicrob Agents Chemother. 2006;50(7):2569–72.
Clavaud C, Beauvais A, Barbin L, Munier-Lehmann H, Latge JP. The composition of the culture medium influences the beta-1,3-glucan metabolism of Aspergillus fumigatus and the antifungal activity of inhibitors of beta-1,3-glucan synthesis. Antimicrob Agents Chemother. 2012 May 12;56(6):3428–31.
Clemons KV, Espiritu M, Parmar R, Stevens DA. Assessment of the paradoxical effect of caspofungin in therapy of candidiasis. Antimicrob Agents Chemother. 2006 Apr;50(4):1293–7.
Colombo AL, Ngai AL, Bourque M, Bradshaw SK, Strohmaier KM, Taylor AF, et al. Caspofungin use in patients with invasive candidiasis caused by common non-albicans Candida species: review of the caspofungin database. Antimicrob Agents Chemother. 2010 Apr 19;54(5):1864–71.
Cornely OA, Bassetti M, Calandra T, Garbino J, Kullberg BJ, Lortholary O, et al. ESCMID* guideline for the diagnosis and management of Candida diseases 2012: non-neutropenic adult patients. Clin Microbiol Infect. 2012 Nov 9;18:19–37.
Coronado JE, Mneimneh S, Epstein SL, Qiu WG, Lipke PN. Conserved processes and lineage-specific proteins in fungal cell wall evolution. Eukaryot Cell. 2007 Dec 7;6(12):2269–77.
Cuenca-Estrella M, Verweij PE, Arendrup MC, Arikan-Akdagli S, Bille J, Donnelly JP, et al. ESCMID* guideline for the diagnosis and management of Candida diseases 2012: diagnostic procedures. Clin Microbiol Infect. 2012 Nov 9;18:9–18.
Croll D, McDonald BA. Intron gains and losses in the evolution of Fusarium and Cryptococcus fungi. Genome Biol Evol. 2012;4(11):1148–61.
Dagley MJ, Gentle IE, Beilharz TH, Pettolino FA, Djordjevic JT, Lo TL, et al. Cell wall integrity is linked to mitochondria and phospholipid homeostasis in Candida albicans through the activity of the post-transcriptional regulator Ccr4-
192
Pop2. Mol Microbiol. 2010 Dec 30;79(4):968–89.
Damle BD, Dowell JA, Walsky RL, Weber GL, Stogniew M, Inskeep PB. In vitro and in vivo studies to characterize the clearance mechanism and potential cytochrome P450 interactions of anidulafungin. Antimicrob Agents Chemother. 2009 Mar 1;53(3):1149–56.
Dannaoui E, Desnos-Ollivier M, Garcia-Hermoso D, Grenouillet F, Cassaing S, Baixench M-T, et al. Candida spp. with acquired echinocandin resistance, France, 2004–2010. Emerg. Infect. Dis. 2012 Jan;18(1):86–90.
Dardalhon M, Agoutin B, Watzinger M, Averbeck D. Slt2 (Mpk1) MAP kinase is involved in the response of Saccharomyces cerevisiae to 8-methoxypsoralen plus UVA. J Photochem Photobiol B. 2009 Jun;95(3):148–55.
Darriba D, Taboada GL, Doallo R, Posada D. jModelTest 2: more models, new heuristics and parallel computing. Nat Meth. 2012 Jul 30;9(8):772–2.
Davis JK. Combining polysaccharide biosynthesis and transport in a single enzyme: dual-function cell wall glycan synthases. Front Plant Sci. Frontiers; 2012;3:1–5.
deHart AKA, Schnell JD, Allen DA, Tsai J-Y, Hicke L. Receptor internalization in yeast requires the Tor2-Rho1 signaling pathway. Mol Biol Cell. 2003 Nov;14(11):4676–84.
Del Poeta M, Schell WA, Perfect JR. In vitro antifungal activity of pneumocandin L-743,872 against a variety of clinically important molds. Antimicrob Agents Chemother. 1997;41(8):1835–6.
Delley PA, Hall MN. Cell wall stress depolarizes cell growth via hyperactivation of RHO1. J Cell Biol. 1999 Oct 4;147(1):163–74.
Denning DW, Kibbler CC, Barnes RA. British Society for Medical Mycology proposed standards of care for patients with invasive fungal infections. Lancet Infect Dis. 2003 Apr;3(4):230–40.
De Rosa FG, Trecarichi EM, Montrucchio C, Losito AR, Raviolo S, Posteraro B, et al. Mortality in patients with early- or late-onset candidaemia. J Antimicrob Chemother. 2013;68(4):927–35.
Dijkgraaf GJP, Abe M, Ohya Y, Bussey H. Mutations in Fks1p affect the cell wall content of beta-1,3- and beta-1,6-glucan in Saccharomyces cerevisiae. Yeast. 2002;19(8):671–90.
Dodds Ashley E, Drew R, Johnson M, Danna R, Dabrowski D, Walker V, et al. Cost of invasive fungal infections in the era of new diagnostics and expanded treatment options. Pharmacotherapy. 2012 Oct;32(10):890–901.

193
Douglas CM, D'Ippolito JA, Shei GJ, Meinz M, Onishi J, Marrinan JA, et al. Identification of the FKS1 gene of Candida albicans as the essential target of 1,3-beta-D-glucan synthase inhibitors. Antimicrob Agents Chemother. 1997 Nov;41(11):2471–9.
Drakulovski P, Dunyach C, Bertout S, Reynes J, Mallié M. A Candida albicans strain with high MIC for caspofungin and no FKS1 mutations exhibits a high chitin content and mutations in two chitinase genes. Med Mycol. 2011;:1–8.
Dumitru R, Hornby JM, Nickerson KW. Defined anaerobic growth medium for studying Candida albicans basic biology and resistance to eight antifungal drugs. Antimicrob Agents Chemother. 2004 Jul;48(7):2350–4.
Dunyach C, Drakulovski P, Bertout S, Jouvert S, Reynes J, Mallié M. Fungicidal activity and morphological alterations of Candida albicans induced by echinocandins: study of strains with reduced caspofungin susceptibility. Mycoses. 2010 Jan 27;54(4):e62–8.
Durand D, Halldórsson BV, Vernot B. A hybrid micro-macroevolutionary approach to gene tree reconstruction. J Comput Biol. 2006 Mar;13(2):320–35.
El-Kirat-Chatel S, Beaussart A, Alsteens D, Jackson DN, Lipke PN, Dufrêne YF. Nanoscale analysis of caspofungin-induced cell surface remodelling in Candida albicans. Nanoscale. 2013;5(3):1105.
Enache-Angoulvant A, Hennequin C. Invasive Saccharomyces infection: a comprehensive review. Clin Infect Dis. 2005 Dec 1;41(11):1559–68.
Ene IV, Adya AK, Wehmeier S, Brand AC, MacCallum DM, Gow NAR, et al. Host carbon sources modulate cell wall architecture, drug resistance and virulence in a fungal pathogen. Cell Microbiol. 2012 Jun 5;14(9):1319–35.
Ene IV, Brown AJ. Integration of metabolism with virulence in Candida albicans. Fungal Genomics. Springer Science & Business Media; 2014. pp. 1–22.
Ene IV, Cheng SC, Netea MG, Brown AJP. Growth of Candida albicans cells on the physiologically relevant carbon source lactate affects their recognition and phagocytosis by immune cells. Infect Immun. 2012;81(1):238–48.
Ene IV, Heilmann CJ, Sorgo AG, Walker LA, de Koster CG, Munro CA, et al. Carbon source-induced reprogramming of the cell wall proteome and secretome modulates the adherence and drug resistance of the fungal pathogen Candida albicans. Proteomics. 2012 Oct 29;12(21):3164–79.
Eraxis. Pfizer Inc; 2012. pp. 1–19.
Espinel-Ingroff A. Comparison of in vitro activities of the new triazole SCH56592 and the echinocandins MK-0991 (L-743,872) and LY303366 against

194
opportunistic filamentous and dimorphic fungi and yeasts. J Clin Microbiol. 1998 Oct;36(10):2950–6.
Falagas ME, Roussos N, Vardakas KZ. Relative frequency of albicans and the various non-albicans Candida spp among candidemia isolates from inpatients in various parts of the world: a systematic review. Int J Infect Dis. International Society for Infectious Diseases; 2010;14(11):e954–66.
Fares MA, Keane OM, Toft C, Carretero-Paulet L, Jones GW. The roles of whole-genome and small-scale duplications in the functional specialization of Saccharomyces cerevisiae genes. Akey JM, editor. PLoS Genet. 2013;9(1):e1003176.
Farkas I, Hardy TA, DePaoli-Roach AA, Roach PJ. Isolation of the GSY1 gene encoding yeast glycogen synthase and evidence for the existence of a second gene. J Biol Chem. 1990 Dec 5;265(34):20879–86.
Farowski F, Cornely OA, Vehreschild JJ, Bauer T, Hartmann P, Steinbach A, et al. Intracellular concentrations of micafungin in different cellular compartments of the peripheral blood. Int J Antimicrob Agents. Elsevier B.V; 2012 Mar 1;39(3):228–31.
Feldmesser M, Kress Y, Mednick A, Casadevall A. The effect of the echinocandin analogue caspofungin on cell wall glucan synthesis by Cryptococcus neoformans. J Infect Dis. 2000;182(6):1791–5.
Fortún J, Martín-Dávila P, Gómez-García de la Pedrosa E, Pintado V, Cobo J, Fresco G, et al. Emerging trends in candidemia: A higher incidence but a similar outcome. Journal of Infection. 2012 Jul;65(1):64–70.
Freitag J, Ast J, Bölker M. Cryptic peroxisomal targeting via alternative splicing and stop codon read-through in fungi. Nature. 2012 May 23;485(7399):522–5.
Frevert J, Ballou CE. Saccharomyces cerevisiae structural cell wall mannoprotein. Biochemistry. 1985;24(3):753–9.
Gamaletsou MN, Daikos GL, Walsh TJ, Perlin DS, Ortigosa CJ, Psaroulaki A, et al. Breakthrough candidaemia caused by phenotypically susceptible Candida spp. in patients with haematological malignancies does not correlate with established interpretive breakpoints. Int J Antimicrob Agents. 2014 Sep;44(3):248–55.
Gancedo JM. Control of pseudohyphae formation in Saccharomyces cerevisiae. FEMS Microbiology Reviews. 2001 Jan;25(1):107–23.
Garcia-Effron G, Katiyar SK, Park S, Edlind TD, Perlin DS. A naturally occurring proline-to-alanine amino acid change in Fks1p in Candida parapsilosis, Candida orthopsilosis, and Candida metapsilosis accounts for reduced echinocandin susceptibility. Antimicrob Agents Chemother. 2008;52(7):2305–12.
195
Garcia-Effron G, Lee S, Park S, Cleary JD, Perlin DS. Effect of Candida glabrata FKS1 and FKS2 mutations on echinocandin sensitivity and kinetics of 1,3-beta-D-glucan synthase: implication for the existing susceptibility breakpoint. Antimicrob Agents Chemother. 2009;53(9):3690–9.
Garcia-Effron G, Park S, Perlin DS. Correlating echinocandin MIC and kinetic inhibition of fks1 mutant glucan synthases for Candida albicans: implications for interpretive breakpoints. Antimicrob Agents Chemother. 2009;53(1):112–22.
Garcia-Hermoso D, Cabaret O, Lecellier G, Desnos-Ollivier M, Hoinard D, Raoux D, et al. Comparison of microsatellite length polymorphism and multilocus sequence typing for DNA-based typing of Candida albicans. J Clin Microbiol. 2007;45(12):3958–63.
Garey KW, Rege M, Pai MP, Mingo DE, Suda KJ, Turpin RS, et al. Time to initiation of fluconazole therapy impacts mortality in patients with candidemia: a multi-institutional study. Clin Infect Dis. 2006 Jul 1;43(1):25–31.
Garré E, Romero-Santacreu L, Barneo-Muñoz M, Miguel A, Pérez-Ortín JE, Alepuz P. Nonsense-mediated mRNA cecay controls the changes in yeast ribosomal protein pre-mRNAs levels upon osmotic stress. Bardoni B, editor. PLoS ONE. 2013;8(4):e61240.
Goebels C, Thonn A, Gonzalez-Hilarion S, Rolland O, Moyrand F, Beilharz TH, et al. Introns regulate gene expression in Cryptococcus neoformans in a Pab2p dependent pathway. Madhani HD, editor. PLoS Genet. 2013;9(8):e1003686.
Goldblum D, Fausch K, Frueh BE, Theurillat R, Thormann W, Zimmerli S. Ocular penetration of caspofungin in a rabbit uveitis model. Graefe's Arch Clin Exp Ophthalmol. 2006 Nov 22;245(6):825–33.
González M, de Groot PWJ, Klis FM, Lipke PN. Glycoconjugate structure and function in fungal cell walls. In: Microbial glycobiology: structures, relevance, and applications. Elsevier Inc; 2009. pp. 169–83.
Goodridge HS, Wolf AJ, Underhill DM. Beta-glucan recognition by the innate immune system. Immunol Rev. 2009 Jul;230(1):38–50.
Gow NAR, van de Veerdonk FL, Brown AJP, Netea MG. Candida albicans morphogenesis and host defence: discriminating invasion from colonization. Nat Rev Microbiol. Nature Publishing Group; 2011;10(2):112–22.
Green LJ, Marder P, Mann LL, Chio LC, Current WL. LY303366 exhibits rapid and potent fungicidal activity in flow cytometric assays of yeast viability. Antimicrob Agents Chemother. 1999 Apr;43(4):830–5.
Grutzmann K, Szafranski K, Pohl M, Voigt K, Petzold A, Schuster S. Fungal alternative splicing is associated with multicellular complexity and virulence: a
196
genome-wide multi-species study. DNA Research. 2013 Oct 11.
Guery BP, Arendrup MC, Auzinger G, Azoulay É, Borges Sá M, Johnson EM, et al. Management of invasive candidiasis and candidemia in adult non-neutropenic intensive care unit patients: Part II. Treatment. Intensive Care Med. 2008 Oct 30;35(2):206–14.
Guindon SXP, Gascuel O. A simple, fast, and accurate algorithm to estimate large phylogenies by maximum likelihood. Systematic Biol. 2003;52(5):696–704.
Guo W, Tamanoi F, Novick P. Spatial regulation of the exocyst complex by Rho1 GTPase. Nat Cell Biol. 2001 Apr;3(4):353–60.
Hage CA, Connolly P, Horan D, Durkin M, Smedema M, Zarnowski R, et al. Investigation of the efficacy of micafungin in the treatment of histoplasmosis using two North American strains of Histoplasma capsulatum. Antimicrob Agents Chemother. 2011;55(9):4447–50.
Hammesfahr B, Odronitz F, Mühlhausen S, Waack S, Kollmar M. GenePainter: a fast tool for aligning gene structures of eukaryotic protein families, visualizing the alignments and mapping gene structures onto protein structures. BMC Bioinformatics. 2013;14:77.
Han T-L, Cannon RD, Villas-Bôas SG. Metabolome analysis during the morphological transition of Candida albicans. Metabolomics. 2012 Mar 24;8(6):1204–17.
Han T-L, Cannon RD, Villas-Bôas SG. The metabolic basis of Candida albicans morphogenesis and quorum sensing. Fungal Genet Biol. Elsevier Inc; 2011;48(8):747–63.
Hao B, Cheng S, Clancy CJ, Nguyen MH. Caspofungin kills Candida albicans by causing both cellular apoptosis and necrosis. Antimicrob Agents Chemother. 2012;57(1):326–32.
Hatje K, Keller O, Hammesfahr B, Pillmann H, Waack S, Kollmar M. Cross-species protein sequence and gene structure prediction with fine-tuned Webscipio 2.0 and Scipio. BMC Res Notes. 2011;4:265.
Hay RJ. The management of superficial candidiasis. J. Am. Acad. Dermatol. 1999 Jun;40(6 Pt 2):S35–42.
He X, Zhang J. Gene complexity and gene duplicability. Curr Biol. 2005 Jun;15(11):1016–21.
Held J, Kohlberger I, Rappold E, Busse Grawitz A, Hacker G. Comparison of (1,3)-beta-D-glucan, mannan/anti-mannan antibodies, and Cand-Tec Candida antigen as serum biomarkers for candidemia. J Clin Microbiol. 2013;51(4):1158–

197
64.
Helliwell SB, Schmidt A, Ohya Y, Hall MN. The Rho1 effector Pkc1, but not Bni1, mediates signalling from Tor2 to the actin cytoskeleton. Curr Biol. 1998 Nov 5;8(22):1211–4.
Hohmann S. Control of high osmolarity signalling in the yeast Saccharomyces cerevisiae. FEBS Lett. 2009 Dec;583(24):4025–9.
Huelsenbeck JP, Ronquist F. MRBAYES: Bayesian inference of phylogenetic trees. Bioinformatics. 2001 Aug;17(8):754–5.
Ibrahim AS, Bowman JC, Avanessian V, Brown K, Spellberg B, Edwards JE, et al. Caspofungin inhibits Rhizopus oryzae 1,3-beta-D-glucan synthase, lowers burden in brain measured by quantitative PCR, and improves survival at a low but not a high dose during murine disseminated zygomycosis. Antimicrob Agents Chemother. 2005 Feb;49(2):721–7.
Imamura H, Tanaka K, Hihara T, Umikawa M, Kamei T, Takahashi K, et al. Bni1p and Bnr1p: downstream targets of the Rho family small G-proteins which interact with profilin and regulate actin cytoskeleton in Saccharomyces cerevisiae. EMBO J. 1997;16(10):2745–55.
Ingham CJ, Schneeberger PM. Microcolony imaging of Aspergillus fumigatus treated with echinocandins reveals both fungistatic and fungicidal activities. PLoS ONE. 2012;7(4):e35478.
Inglis DO, Arnaud MB, Binkley J, Shah P, Skrzypek MS, Wymore F, et al. The Candida genome database incorporates multiple Candida species: multispecies search and analysis tools with curated gene and protein information for Candida albicans and Candida glabrata. Nucleic Acids Res. 2011;40(D1):D667–74.
Inoue SBB. Prenylation of Rho1p Is required for activation of yeast 1,3-beta-glucan synthase. J Biol Chem. 1999;274(53):38119–24.
Inoue SBB, Qadota H, Arisawa M, Anraku Y, Watanabe T, Ohya Y. Signaling toward yeast 1,3-beta-glucan synthesis. Cell Struct Funct. 1996 Oct;21(5):395–402.
Inoue SBB, Takewaki N, Takasuka T, Mio T, Adachi M, Fujii Y, et al. Characterization and gene cloning of 1,3-beta-D-glucan synthase from Saccharomyces cerevisiae. Eur. J. Biochem. 1995;231(3):845–54.
Ishiguro J, Saitou A, Duran A, Ribas JC. cps1+, a Schizosaccharomyces pombe gene homolog of Saccharomyces cerevisiae FKS genes whose mutation confers hypersensitivity to cyclosporin A and papulacandin B. J Bacteriol.

198
1997;179(24):7653–62.
Ishihara S, Hirata A, Nogami S, Beauvais A, Latge JP, Ohya Y. Homologous subunits of 1,3-beta-glucan synthase are important for spore wall assembly in Saccharomyces cerevisiae. Eukaryot Cell. 2007;6(2):143–56.
Ito W, Li X, Irie K, Mizuno T, Irie K. RNA-binding protein Khd1 and Ccr4 deadenylase play overlapping roles in the cell wall integrity pathway in Saccharomyces cerevisiae. Eukaryot Cell. 2011 Sep 29;10(10):1340–7.
Jaijakul S, Vazquez JA, Swanson RN, Ostrosky-Zeichner L. (1,3)-D-Glucan as a prognostic marker of treatment response in invasive candidiasis. Clin Infect Dis. 2012;55(4):521–6.
James TY, Kauff F, Schoch CL, Matheny PB, Hofstetter V, Cox CJ, et al. Reconstructing the early evolution of fungi using a six-gene phylogeny. Nature. 2006;443(7113):818–22.
Jeffares DC, Mourier T, Penny D. The biology of intron gain and loss. Trends in Genetics. 2006 Jan;22(1):16–22.
Jiravanichpaisal P, Lee BL, Söderhäll K. Cell-mediated immunity in arthropods: Hematopoiesis, coagulation, melanization and opsonization. Immunobiology. 2006 Jun;211(4):213–36.
Johnson C, Kweon HK, Sheidy D, Shively CA, Mellacheruvu D, Nesvizhskii AI, et al. The yeast Sks1p kinase signaling network regulates pseudohyphal growth and glucose response. Erdman S, editor. PLoS Genet. 2014 Mar 6;10(3):e1004183.
Johnson ME, Edlind TD. Topological and mutational analysis of Saccharomyces cerevisiae Fks1. Eukaryot Cell. 2012;11(7):952–60.
Johnson ME, Katiyar SK, Edlind TD. New Fks hot spot for acquired echinocandin resistance in Saccharomyces cerevisiae and its contribution to intrinsic resistance of Scedosporium species. Antimicrob Agents Chemother. 2011;55(8):3774–81.
Kabir MA, Hussain MA, Ahmad Z. Candida albicans: A model organism for studying fungal pathogens. ISRN Microbiology. 2012;2012(5):1–15.
Kanehisa M, Goto S. KEGG: kyoto encyclopedia of genes and genomes. Nucleic Acids Res. 2000 Jan 1;28(1):27–30.
Kaneko Y, Ohno H, Imamura Y, Kohno S, Miyazaki Y. The effects of an hsp90 inhibitor on the paradoxical effect. Jpn J Infect Dis. 2009 Sep 1;62(5):392–3.
199
Kang MS, Szaniszlo PJ, Notario V, Cabib E. The effect of papulacandin B on (1,3)-beta-D-glucan synthetases. A possible relationship between inhibition and enzyme conformation. Carbohydr Res. 1986 Jun 1;149(1):13–21.
Kapteyn JC, Montijn RC, Dijkgraaf GJ, van den Ende H, Klis FM. Covalent association of beta-1,3-glucan with beta-1,6-glucosylated mannoproteins in cell walls of Candida albicans. J Bacteriol. 1995;177(13):3788–92.
Karkowska-Kuleta J, Rapala-Kozik M, Kozik A. Fungi pathogenic to humans: molecular bases of virulence of Candida albicans, Cryptococcus neoformans and Aspergillus fumigatus. Acta Biochim Pol. 2009;56(2):211–24.
Katiyar SK, Edlind TD. Role for Fks1 in the intrinsic echinocandin resistance of Fusarium solani as evidenced by bybrid expression in Saccharomyces cerevisiae. Antimicrob Agents Chemother. 2009;53(5):1772–8.
Kelly R, Register E, Hsu M-J, Kurtz M, Nielsen J. Isolation of a gene involved in 1,3-beta-glucan synthesis in Aspergillus nidulans and purification of the corresponding protein. J Bacteriol. 1996;178(15):4381–91.
Khlif M, Bogreau H, Michel-Nguyen A, Ayadi A, Ranque S. Trailing or paradoxical growth of Candida albicans when exposed to caspofungin is not associated with microsatellite genotypes. Antimicrob Agents Chemother. 2010;54(3):1365–8.
Klepser ME. Safety and efficacy data for high-dose caspofungin. Curr Fungal Infect Rep. 2010;4(2):59–61.
Klepser ME, Ernst EJ, Lewis RE, Ernst ME, Pfaller MA. Influence of test conditions on antifungal time-kill curve results: proposal for standardized methods. Antimicrob Agents Chemother. 1998 May;42(5):1207–12.
Knox C, Law V, Jewison T, Liu P, Ly S, Frolkis A, et al. DrugBank 3.0: a comprehensive resource for “Omics” research on drugs. Nucleic Acids Res. 2010 Dec 22;39(Database):D1035–41.
Ko YT, Frost DJ, Ho CT, Ludescher RD, Wasserman BP. Inhibition of yeast (1,3)-beta-glucan synthase by phospholipase A2 and its reaction products. Biochim Biophys Acta. 1994 Jul 13;1193(1):31–40.
Ko YT, Ludescher RD, Frost DJ, Wasserman BP. Use of cilofungin as direct fluorescent probe for monitoring antifungal drug-membrane interaction. Antimicrob Agents Chemother. 1994 Jun 1;38(6):1378–85.
Koh AY. Murine models of Candida gastrointestinal colonization and dissemination. Eukaryot Cell. 2013 Oct 25;12(11):1416–22.
Kohler S, Wheat LJ, Connolly P, Schnizlein-Bick C, Durkin M, Smedema M, et

200
al. Comparison of the echinocandin caspofungin with amphotericin B for treatment of histoplasmosis following pulmonary challenge in a murine model. Antimicrob Agents Chemother. 2000;44(7):1850–4.
Kohno S, Izumikawa K, Yoshida M, Takesue Y, Oka S, Kamei K, et al. A double-blind comparative study of the safety and efficacy of caspofungin versus micafungin in the treatment of candidiasis and aspergillosis. Eur J Clin Microbiol Infect Dis. 2012 Oct 3;32(3):387–97.
Ku TSN, Bernardo SM, Lee SA. In vitro assessment of the antifungal and paradoxical activity of different echinocandins against Candida tropicalis biofilms. J Med Microbiol. 2011;60(11):1708–10.
Kuhn DM, Balkis M, Chandra J, Mukherjee PK, Ghannoum MA. Uses and limitations of the XTT assay in studies of Candida growth and metabolism. J Clin Microbiol. 2003;41(1):506–8.
Kurtz MB, Heath IB, Marrinan J, Dreikorn S, Onishi J, Douglas CM. Morphological effects of lipopeptides against Aspergillus fumigatus correlate with activities against (1,3)-beta-D-glucan synthase. Antimicrob Agents Chemother. 1994 Jul 1;38(7):1480–9.
Lackner M, Tscherner M, Schaller M, Kuchler K, Mair C, Sartori B, et al. Positions and numbers of FKS mutations in Candida albicans selectively influence in vitro and in vivo susceptibilities to echinocandin treatment. Antimicrob Agents Chemother. 2014 Jun 12;58(7):3626–35.
LaFayette SL, Collins C, Zaas AK, Schell WA, Betancourt-Quiroz M, Gunatilaka AAL, et al. PKC signaling regulates drug resistance of the fungal pathogen Candida albicans via circuitry comprised of Mkc1, calcineurin, and Hsp90. Mitchell AP, editor. PLoS Pathog. 2010;6(8):e1001069.
Land GA, McDonald WC, Stjernholm RL, Friedman L. Factors affecting filamentation in Candida albicans: changes in respiratory activity of Candida albicans during filamentation. Infect Immun. 1975 Jul;12(1):119–27.
Larriba G, Morales M, Ruiz-Herrera J. Biosynthesis of beta-glucan microfibrils by cell-free extracts from Saccharomyces cerevisiae. Journal of General microbiology. 1981;124:375–83.
Laupland KB, Gregson DB, Church DL, Ross T, Elsayed S. Invasive Candida species infections: a 5 year population-based assessment. J Antimicrob Chemother. 2005 Sep 1;56(3):532–7.
Lee KK, MacCallum DM, Jacobsen MD, Walker LA, Odds FC, Gow NAR, et al. Elevated cell wall chitin in Candida albicans confers echinocandin resistance in

201
vivo. Antimicrob Agents Chemother. 2011;56(1):208–17.
Lee ME, Singh K, Snider J, Shenoy A, Paumi CM, Stagljar I, et al. The Rho1 GTPase acts together with a vacuolar glutathione S-sonjugate transporter to protect yeast cells from oxidative stress. Genetics. 2011;188(4):859–70.
Letscher-Bru V. Caspofungin: the first representative of a new antifungal class. J Antimicrob Chemother. 2003 Jan 28;51(3):513–21.
Levin DEE. Cell wall integrity signaling in Saccharomyces cerevisiae. Microbiol Mol Biol Rev. 2005;69(2):262–91.
Lewis RE, Liao G, Hou J, Prince RA, Kontoyiannis DP. Comparative in vivo dose-dependent activity of caspofungin and anidulafungin against echinocandin-susceptible and -resistant Aspergillus fumigatus. J Antimicrob Chemother. 2011 May 11;66(6):1324–31.
Li J, Yuan Z, Zhang Z. The cellular robustness by genetic redundancy in budding yeast. PLoS Genet. 2010 Nov;6(11):e1001187.
Lo HJ, Köhler JR, DiDomenico B, Loebenberg D, Cacciapuoti A, Fink GR. Nonfilamentous C. albicans mutants are avirulent. Cell. 1997 Sep 5;90(5):939–49.
Lockshon D, Olsen CP, Brett CL, Chertov A, Merz AJ, Lorenz DA, et al. Rho signaling participates in membrane fluidity homeostasis. Arkowitz RA, editor. PLoS ONE. 2012;7(10):e45049.
Loeffler J, Stevens DA. Antifungal drug resistance. Clin Infect Dis. 2003;36(Suppl 1):S31–41.
Loftus BJ, Fung E, Roncaglia P, Rowley D, Amedeo P, Bruno D, et al. The genome of the basidiomycetous yeast and human pathogen Cryptococcus neoformans. Science. 2005 Feb 25;307(5713):1321–4.
Lortholary O, Desnos-Ollivier M, Sitbon K, Fontanet A, Bretagne S, FF D, et al. Recent Exposure to Caspofungin or Fluconazole Influences the Epidemiology of Candidemia: a Prospective Multicenter Study Involving 2,441 Patients. Antimicrob Agents Chemother. 2011 Jan 20;55(2):532–8.
Louie A, Deziel M, Liu W, Drusano MF, Gumbo T, Drusano GL. Pharmacodynamics of caspofungin in a murine model of systemic candidiasis: importance of persistence of caspofungin in tissues to understanding drug activity. Antimicrob Agents Chemother. 2005 Nov 22;49(12):5058–68.
Lucena RM, Elsztein C, Simões DA, Morais MA Jr. Participation of CWI, HOG and Calcineurin pathways in the tolerance of Saccharomyces cerevisiae to low pH by inorganic acid. J. Appl. Microbiol. 2012;113(3):629–40.
202
MacCallum DM. Hosting infection: experimental models to assay Candida virulence. Int J Microbiol. 2012;2012(3):1–12.
MacCallum DM, Castillo L, Nather K, Munro CA, Brown AJP, Gow NAR, et al. Property differences among the four major Candida albicans strain clades. Eukaryot Cell. 2009 Mar;8(3):373–87.
Madaule P, Axel R, Myers AM. Characterization of two members of the rho gene family from the yeast Saccharomyces cerevisiae. Proc. Natl. Acad. Sci. U.S.A. 1987 Feb;84(3):779–83.
Madrid M, Fernández-Zapata J, Sánchez-Mir L, Soto T, Franco A, Vicente-Soler J, et al. Role of the fission yeast cell integrity MAPK pathway in response to glucose limitation. BMC Microbiol. 2013;13:34.
Maidan MM, Thevelein JM, Van Dijck P. Carbon source induced yeast-to-hypha transition in Candida albicans is dependent on the presence of amino acids and on the G-protein-coupled receptor Gpr1. Biochem Soc Trans. 2005 Feb;33(Pt 1):291–3.
Maligie MA, Selitrennikoff CP. Cryptococcus neoformans resistance to echinocandins: (1,3)-beta-glucan synthase activity is sensitive to echinocandins. Antimicrob Agents Chemother. 2005;49(7):2851–6.
Manavathu EK. A comparative study of the post-antifungal effect (PAFE) of amphotericin B, triazoles and echinocandins on Aspergillus fumigatus and Candida albicans. J Antimicrob Chemother. 2004 Jan 16;53(2):386–9.
Marakalala MJ, Vautier S, Potrykus J, Walker LA, Shepardson KM, Hopke A, et al. Differential adaptation of Candida albicans in vivo modulates immune recognition by Dectin-1. Klein BS, editor. PLoS Pathog. 2013 Apr 18;9(4):e1003315.
Marcet-Houben M, Gabaldón T. Evolution of fungi and their respiratory metabolism. In: Pontarotti P, editor. Berlin, Heidelberg: Springer Berlin Heidelberg; 2011. pp. 257–72.
Marine M, Pastor FJ, Sahand IH, Ponton J, Quindos G, Guarro J. Paradoxical growth of Candida dubliniensis does not preclude in vivo response to echinocandin therapy. Antimicrob Agents Chemother. 2009;53(12):5297–9.
Mastrangelo AM, Marone D, Laidò G, De Leonardis AM, De Vita P. Alternative splicing: Enhancing ability to cope with stress via transcriptome plasticity. Plant Science. Elsevier Ireland Ltd; 2012 Apr 1;185-186:40–9.
Mazur P, Morin N, Baginsky W, el-Sherbeini M, Clemas JA, Nielsen JB, et al. Differential expression and function of two homologous subunits of yeast 1,3-beta-D-glucan synthase. Mol Cell Biol. 1995 Oct;15(10):5671–81.
203
Melo ASA, Colombo AL, Arthington-Skaggs BA. Paradoxical growth effect of caspofungin observed on biofilms and planktonic cells of five different Candida species. Antimicrob Agents Chemother. 2007;51(9):3081–8.
Mermel LA, Allon M, Bouza E, Craven DE, Flynn P, O’Grady NP, et al. Clinical Practice Guidelines for the Diagnosis and Management of Intravascular Catheter-Related Infection: 2009 Update by the Infectious Diseases Society of America. Clin Infect Dis. 2009;49(1):1–45.
Migoya EM, Mistry GC, Stone JA, Comisar W, Sun P, Norcross A, et al. Safety and pharmacokinetics of higher doses of caspofungin in healthy adult participants. J Clin Pharmacol. 2011;51(2):202–11.
Mio T, Adachi-Shimizu M, Tachibana Y, Tabuchi H, Inoue SBB, Yabe T, et al. Cloning of the Candida albicans homolog of Saccharomyces cerevisiae GSC1/FKS1 and its involvement in beta-1,3-glucan synthesis. J Bacteriol. 1997;179(13):4096–105.
Mooers A, Holmes E. The evolution of base composition and phylogenetic inference. Trends Ecol. Evol. (Amst.). 2000 Sep;15(9):365–9.
Mora-Montes HM, Netea MG, Ferwerda G, Lenardon MD, Brown GD, Mistry AR, et al. Recognition and blocking of innate immunity cells by Candida albicans chitin. Infect Immun. 2011 Apr 19;79(5):1961–70.
Moretti S, Bozza S, D'Angelo C, Casagrande A, Fazia Della MA, Pitzurra L, et al. Role of innate immune receptors in paradoxical caspofungin activity in vivo in preclinical aspergillosis. Antimicrob Agents Chemother. 2012;56(8):4268–76.
Morris CE, Homann U. Cell surface area regulation and membrane tension. J Membr Biol. 2001 Jan 15;179(2):79–102.
Morris MI, Villmann M. Echinocandins in the management of invasive fungal infections, part 1. Am J Health Syst Pharm. 2006 Sep 15;63(18):1693–703.
Morris MI, Villmann M. Echinocandins in the management of invasive fungal infections, Part 2. Am J Health Syst Pharm. 2006 Oct 1;63(19):1813–20.
Morrison DA. L. A. S. JOHNSON REVIEW No. 8. Multiple sequence alignment for phylogenetic purposes. Aust Systematic Bot. 2006;19(6):479.
Mulder MPC, Fodran P, Kemmink J, Breukink EJ, Kruijtzer JAW, Minnaard AJ, et al. Mutual influence of backbone proline substitution and lipophilic tail character on the biological activity of simplified analogues of caspofungin. Org Biomol Chem. 2012;10(37):7491.
Munro CA, Selvaggini S, de Bruijn I, Walker L, Lenardon MD, Gerssen B, et al. The PKC, HOG and Ca 2+signalling pathways co-ordinately regulate chitin

204
synthesis in Candida albicans. Mol Microbiol. 2007 Mar;63(5):1399–413.
Mycamine. Astellas Pharmaceuticals US, Inc; 2012. pp. 1–20.
Nantel A, Dignard D, Bachewich C, Harcus D, Marcil A, Bouin A-P, et al. Transcription profiling of Candida albicans cells undergoing the yeast-to-hyphal transition. Mol Biol Cell. 2002 Oct;13(10):3452–65.
Nelson PW, Lozano-Chiu M, Rex JH. In vitro growth-inhibitory activity of pneumocandins L-733,560 and L-743,872 against putatively amphotericin B- and fluconazole-resistant Candida isolates: influence of assay conditions. J. Med. Vet. Mycol. 1997;35(4):285–7.
Netea MG, Brown GD. Fungal infections: the next challenge. Curr Opin Microbiol. 2012 Aug;15(4):403–5.
Nguyen KT, Ta P, Hoang BT, Cheng S, Hao B, Nguyen MH, et al. Characterising the post-antifungal effects of micafungin against Candida albicans, Candida glabrata, Candida parapsilosis and Candida krusei isolates. Int J Antimicrob Agents. 2010;35(1):80–4.
Nguyen MH, Wissel MC, Shields RK, Salomoni MA, Hao B, Press EG, et al. Performance of Candida real-time polymerase chain reaction, beta-D-glucan assay, and blood cultures in the diagnosis of invasive candidiasis. Clin Infect Dis. 2012 Apr 9;54(9):1240–8.
Nishiyama Y, Uchida K, Yamaguchi H. Morphological changes of Candida albicans induced by micafungin (FK463), a water-soluble echinocandin-like lipopeptide. J Electron Microsc. 2002;51(4):247–55.
Notredame C, Higgins DG, Heringa J. T-coffee: a novel method for fast and accurate multiple sequence alignment. J Mol Biol. 2000 Sep;302(1):205–17.
Odds FC. In Candida albicans, resistance to flucytosine and terbinafine is linked to MAT locus homozygosity and multilocus sequence typing clade 1. FEMS Yeast Res. 2009 Nov;9(7):1091–101.
Odds FC. Morphogenesis in Candida albicans. Crit Rev Microbiol. 1985;12(1):45–93.
Odds FC, Bougnoux ME, Shaw DJ, Bain JM, Davidson AD, Diogo D, et al. Molecular phylogenetics of Candida albicans. Eukaryot Cell. 2007 Jun 7;6(6):1041–52.
Odds FC, Van Nuffel L, Gow NAR. Survival in experimental Candida albicans infections depends on inoculum growth conditions as well as animal host.

205
Microbiol. 2000 Aug;146 ( Pt 8):1881–9.
Okada H, Abe M, Asakawa-Minemura M, Hirata A, Qadota H, Morishita K, et al. Multiple functional domains of the Yeast l,3-beta-glucan synthase subunit Fks1p revealed by quantitative phenotypic analysis of temperature-sensitive mutants. Genetics. 2010;184(4):1013–24.
Okugawa S, Ota Y, Tatsuno K, Tsukada K, Kishino S, Koike K. A case of invasive central nervous system aspergillosis treated with micafungin with monitoring of micafungin concentrations in the cerebrospinal fluid. Scand J Infect Dis. 2007 Jan;39(4):344–6.
Orlean P. Architecture and biosynthesis of the Saccharomyces cerevisiae cell wall. Genetics. 2012;192(3):775–818.
Page RD. TreeView: an application to display phylogenetic trees on personal computers. Comput Appl Biosci. 1996 Aug;12(4):357–8.
Pai MP, Jones AL, Mullen CK. Micafungin activity against Candida bloodstream isolates: effect of growth medium and susceptibility testing method. Diagn Microbiol Infect Dis. 2007 May;58(1):129–32.
Panepinto JC, Komperda KW, Hacham M, Shin S, Liu X, Williamson PR. Binding of serum mannan binding lectin to a cell integrity-defective Cryptococcus neoformans ccr4 Mutant. Infect Immun. 2007 Sep 19;75(10):4769–79.
Pappas PG, Kauffman CA, Andes D, Benjamin DK Jr, Calandra TF, Edwards JE Jr, et al. Clinical practice guidelines for the management of candidiasis: 2009 Update by the Infectious Diseases Society of America. Clin Infect Dis. 2009 Mar;48(5):503–35.
Park S, Kelly R, Kahn JN, Robles J, Hsu M-J, Register E, et al. Specific substitutions in the echinocandin target Fks1p account for reduced susceptibility of rare laboratory and clinical Candida sp. isolates. Antimicrob Agents Chemother. 2005;49(8):3264–73.
Perez P, Rincón SA. Rho GTPases: regulation of cell polarity and growth in yeasts. Biochem J. 2010 Feb 24;426(3):243–53.
Perlin DS. Echinocandin resistance, susceptibility testing and prophylaxis: implications for patient management. Drugs. 2014;74(14):1573–85.
Perlroth J, Choi B, Spellberg B. Nosocomial fungal infections: epidemiology, diagnosis, and treatment. Med Mycol. 2007 Jan;45(4):321–46.
Pfaller MA, Castanheira M, Diekema DJ, Messer SA, Moet GJ, Jones RN. Comparison of European Committee on Antimicrobial Susceptibility Testing (EUCAST) and Etest methods with the CLSI broth microdilution method for

206
echinocandin susceptibility testing of Candida species. J Clin Microbiol. 2010;48(5):1592–9.
Pfaller MA, Diekema DJ. Epidemiology of invasive candidiasis: a persistent public health problem. Clin Microbiol Rev. 2007;20(1):133–63.
Pfaller MA, Diekema DJ. Epidemiology of invasive mycoses in North America. Crit Rev Microbiol. 2010;36(1):1–53.
Pfaller MA, Diekema DJ. Progress in antifungal susceptibility testing of Candida spp. by use of clinical and laboratory standards institute broth microdilution methods, 2010 to 2012. J Clin Microbiol. 2012 Aug 15;50(9):2846–56.
Pfaller MA, Diekema DJ, Andes D, Arendrup MC, Brown SD, Lockhart SR, et al. Clinical breakpoints for the echinocandins and Candida revisited: Integration of molecular, clinical, and microbiological data to arrive at species-specific interpretive criteria. Drug Resist Updat. 2011;14(3):164–76.
Pfaller MA, Diekema DJ, Ostrosky-Zeichner L, Rex JH, Alexander BD, Andes D, et al. Correlation of MIC with outcome for Candida species tested against caspofungin, anidulafungin, and micafungin: analysis and proposal for interpretive MIC breakpoints. J Clin Microbiol. 2008;46(8):2620–9.
Pfaller MA, Marco F, Messer SA, Jones RN. In vitro activity of two echinocandin derivatives, LY303366 and MK-0991 (L-743,792), against clinical isolates of Aspergillus, Fusarium, Rhizopus, and other filamentous fungi. Diagn Microbiol Infect Dis. 1998;30(4):251–5.
Pfaller MA, Neofytos D, Diekema D, Azie N, Meier-Kriesche H-U, Quan S-P, et al. Epidemiology and outcomes of candidemia in 3648 patients: data from the Prospective Antifungal Therapy (PATH Alliance®) registry, 2004–2008. Diagn Microbiol Infect Dis. 2012 Dec;74(4):323–31.
Pfaller MA, Pappas PG, Wingard JR. Invasive fungal pathogens: current epidemiological trend. Clin Infect Dis. 2006 Jun 26;43((Suppl 1)):S3–S14.
Pfeiffer CD, Garcia-Effron G, Zaas AK, Perfect JR, Perlin DS, Alexander BD. Breakthrough invasive candidiasis in patients on micafungin. J Clin Microbiol. 2010 Jun 29;48(7):2373–80.
Pittet M, Conzelmann A. Biosynthesis and function of GPI proteins in the yeast Saccharomyces cerevisiae. Biochim Biophys Acta. 2007;1771(3):405–20.
Prokisch H, Scharfe C, Camp DG, Xiao W, David L, Andreoli C, et al. Integrative analysis of the mitochondrial proteome in yeast. Plos Biol. 2004;2(6):e160.
Prosser DC, Drivas TG, Maldonado-Baez L, Wendland B. Existence of a novel clathrin-independent endocytic pathway in yeast that depends on Rho1 and
207
formin. J Cell Biol. 2011 Nov 14;195(4):657–71.
Pruyne D, Bretscher A. Polarization of cell growth in yeast. I. Establishment and maintenance of polarity states. J Cell Sci. 2000 Feb;113 ( Pt 3):365–75.
Pruyne D, Bretscher A. Polarization of cell growth in yeast. J Cell Sci. 2000 Feb;113 ( Pt 4):571–85.
Qadota H. Activation of Yeast Protein Kinase C by Rho1 GTPase. J Biol Chem. 1996 Apr 19;271(16):9193–6.
Qadota H, Python CP, Inoue SBB, Arisawa M, Anraku Y, Zheng Y, et al. Identification of yeast Rho1p GTPase as a regulatory subunit of 1,3-beta-glucan synthase. Science. 1996 Apr 12;272(5259):279–81.
Qu Y, Jelicic B, Pettolino F, Perry A, Lo TL, Hewitt VL, et al. Mitochondrial sorting and assembly machinery subunit Sam37 in Candida albicans: insight into the roles of mitochondria in fitness, cell wall integrity, and virulence. Eukaryot Cell. 2012 Mar 29;11(4):532–44.
Rachini A, Pietrella D, Lupo P, Torosantucci A, Chiani P, Bromuro C, et al. An anti-beta-glucan monoclonal antibody inhibits growth and capsule formation of Cryptococcus neoformans in vitro and exerts therapeutic, anticryptococcal activity in vivo. Infect Immun. 2007;75(11):5085–94.
Radding JA, Heidler SA, Turner WW. Photoaffinity analog of the semisynthetic echinocandin LY303366: identification of echinocandin targets in Candida albicans. Antimicrob Agents Chemother. 1998;42(5):1187–94.
Ram AF, Brekelmans SS, Oehlen LJ, Klis FM. Identification of two cell cycle regulated genes affecting the beta 1,3-glucan content of cell walls in Saccharomyces cerevisiae. FEBS Lett. 1995 Jan 23;358(2):165–70.
Reinders J, Zahedi RP, Pfanner N, Meisinger C, Sickmann A. Toward the complete yeast mitochondrial proteome: multidimensional separation techniques for mitochondrial proteomics. J. Proteome Res. 2006 Jul;5(7):1543–54.
Reinoso-Martín C, Schüller C, Schuetzer-Muehlbauer M, Kuchler K. The yeast protein kinase C cell integrity pathway mediates tolerance to the antifungal drug caspofungin through activation of Slt2p mitogen-activated protein kinase signaling. Eukaryot Cell. 2003 Dec;2(6):1200–10.
Rex JH, Alexander BD, Andes D, Arthington-Skaggs BA, Brown SD, Chaturvedi V, et al. Reference method for broth dilution antifungal susceptibility testing of yeasts; approved standard-3rd edition. CLSI document M27-A3. 27(null) ed. Clinical and Laboratory Standards Institute. Wayne, PA: Clinical and Laboratory Standards Institute; 2008. pp. 1–40.
208
Rex JH, Walsh TJ, Sobel JD, Filler SG, Pappas PG, Dismukes WE, et al. Practice guidelines for the treatment of candidiasis. Clin Infect Dis. Clinical Infectious Diseases; 2000;30(4):662–78.
Rodrigues CF, Silva S, Henriques M. Candida glabrata: a review of its features and resistance. Eur J Clin Microbiol Infect Dis. 2013;33(5):673–88.
Rodriguez-Tudela JL, Arendrup MC, Barchiesi F, Bille J, Chryssanthou E, Cuenca-Estrella M, et al. EUCAST Definitive Document EDef 7.1: method for the determination of broth dilution MICs of antifungal agents for fermentative yeasts. Clin Microbiol Infect. 2008 Apr;14(4):398–405.
Rodriguez-Tudela JL, Gomez-Lopez A, Arendrup MC, Garcia-Effron G, Perlin DS, Lass-Flörl C, et al. Comparison of caspofungin MICs by means of EUCAST method EDef 7.1 using two different concentrations of glucose. Antimicrob Agents Chemother. 2010 Jul;54(7):3056–7.
Roetzer A, Gabaldón T, Schüller C. From Saccharomyces cerevisiae to Candida glabrata in a few easy steps: important adaptations for an opportunistic pathogen. FEMS Microbiol Lett. 2010 Sep 16;314(1):1–9.
Roling EE, Klepser ME, Wasson A, Lewis RE, Ernst EJ, Pfaller MA. Antifungal activities of fluconazole, caspofungin (MK0991), and anidulafungin (LY 303366) alone and in combination against Candida spp. and Crytococcus neoformans via time-kill methods. Diagn Microbiol Infect Dis. 2002;43(1):13–7.
Ronquist F, Huelsenbeck JP. MrBayes 3: Bayesian phylogenetic inference under mixed models. Bioinformatics. 2003 Aug 11;19(12):1572–4.
Roy SW. Intronization, de-intronization and intron sliding are rare in Cryptococcus. BMC Evol Biol. 2009;9(1):192.
Rueda C, Cuenca-Estrella M, Zaragoza O. Paradoxical growth of Candida albicans in the presence of caspofungin is associated with multiple cell wall rearrangements and decreased virulence. Antimicrob Agents Chemother. 2014;58(2):1071–83.
Ruiz-Herrera J, Ortiz-Castellanos L. Analysis of the phylogenetic relationships and evolution of the cell walls from yeasts and fungi. FEMS Yeast Res. 2010;10(3):225–43.
Ruy F, Vercesi AE, Kowaltowski AJ. Inhibition of specific electron transport pathways leads to oxidative stress and decreased Candida albicans proliferation. J. Bioenerg. Biomembr. 2006 Oct 12;38(2):129–35.
Sabina J, Brown V. Glucose sensing network in Candida albicans: a sweet spot for fungal morphogenesis. Eukaryot Cell. 2009;8(9):1314–20.

209
Sakaeda T, Iwaki K, Kakumoto M, Nishikawa M, Niwa T, Jin J-S, et al. Effect of micafungin on cytochrome P450 3A4 and multidrug resistance protein 1 activities, and its comparison with azole antifungal drugs. J Pharm Pharmacol. 2005 Jun 1;57(6):759–64.
Sandhu P, Xu X, Bondiskey PJ, Balani SK, Morris ML, Tang YS, et al. Disposition of caspofungin, a novel antifungal agent, in mice, rats, rabbits, and monkeys. Antimicrob Agents Chemother. 2004 Apr;48(4):1272–80.
Sanglard D, Coste A, Ferrari S. Antifungal drug resistance mechanisms in fungal pathogens from the perspective of transcriptional gene regulation. FEMS Yeast Res. 2009 Nov;9(7):1029–50.
Sardi JCO, Scorzoni L, Bernardi T, Fusco-Almeida AM, Mendes Giannini MJS. Candida species: current epidemiology, pathogenicity, biofilm formation, natural antifungal products and new therapeutic options. J Med Microbiol. 2012 Dec 6;62(Pt_1):10–24.
Saville SP, Lazzell AL, Monteagudo C, Lopez-Ribot JL. Engineered control of cell morphology in vivo reveals distinct roles for yeast and filamentous forms of Candida albicans during infection. Eukaryot Cell. 2003 Oct;2(5):1053–60.
Schimoler-O'Rourke R, Renault S, Mo W, Selitrennikoff CP. Neurospora crassa FKS protein binds to the (1,3)-beta-glucan synthase substrate, UDP-glucose. Curr Microbiol. 2003;46(6):408–12.
Seneviratne CJ, Jin LJ, Samaranayake YH, Samaranayake LP. Cell density and cell aging as factors modulating antifungal resistance of Candida albicans biofilms. Antimicrob Agents Chemother. 2008;52(9):3259–66.
Serena C, Fernandez-Torres B, Pastor FJ, Trilles L, Lazera MDS, Nolard N, et al. In vitro interactions of micafungin with other antifungal drugs against clinical isolates of four species of Cryptococcus. Antimicrob Agents Chemother. 2005;49(7):2994–6.
Shareck J, Belhumeur P. Modulation of morphogenesis in Candida albicans by various small molecules. Eukaryot Cell. 2011 Aug 2;10(8):1004–12.
She X, Zhang L, Chen H, Calderone R, Li D. Cell surface changes in the Candida albicans mitochondrial mutant goa1! are associated with reduced recognition by innate immune cells. Cell Microbiol. 2013;15(9):1572–84.
Shematek EM, Braatz JA, Cabib E. Biosynthesis of the yeast cell wall. I. Preparation and properties of beta-(1,3)glucan synthetase. J Biol Chem. 1980 Feb 10;255(3):888–94.
Shepardson KM, Cramer RA. Fungal cell wall dynamics and infection site microenvironments: signal integration and infection outcome. Curr Opin

210
Microbiol. 2013 Aug;16(4):385–90.
Shepherd MG, Sullivan PA. The production and growth characteristics of yeast and mycelial forms of Candida albicans in continuous culture. Journal of General microbiology. 1976 Apr;93(2):361–70.
Shields RK, Nguyen MH, Du C, Press E, Cheng S, Clancy CJ. Paradoxical effect of caspofungin against Candida bloodstream isolates is mediated by multiple pathways but eliminated in human serum. Antimicrob Agents Chemother. 2011;55(6):2641–7.
Shields RK, Nguyen MH, Press EG, Clancy CJ. Five-minute exposure to caspofungin results in prolonged postantifungal effects and eliminates the paradoxical growth of Candida albicans. Antimicrob Agents Chemother. 2011;55(7):3598–602.
Shields RK, Nguyen MH, Press EG, Kwa AL, Cheng S, Du C, et al. The presence of an FKS mutation rather than MIC is an independent risk factor for failure of echinocandin therapy among patients with invasive candidiasis due to Candida glabrata. Antimicrob Agents Chemother. 2012;56(9):4862–9.
Sickmann A. The proteome of Saccharomyces cerevisiae mitochondria. Proc Natl Acad Sci. 2003 Nov 3;100(23):13207–12.
Slater JL, Howard SJ, Sharp A, Goodwin J, Gregson LM, Alastruey-Izquierdo A, et al. Disseminated candidiasis caused by Candida albicans with amino acid substitutions in Fks1 at position Ser645 cannot be successfully treated with micafungin. Antimicrob Agents Chemother. 2011;55(7):3075–83.
Smith RP, Baltch A, Bopp LH, Ritz WJ, Michelsen PP. Post-antifungal effects and time-kill studies of anidulafungin, caspofungin, and micafungin against Candida glabrata and Candida parapsilosis. Diagn Microbiol Infect Dis. Elsevier B.V; 2011;71(2):131–8.
Smits GJ, Kapteyn JC, van den Ende H, Klis FM. Cell wall dynamics in yeast. Curr Opin Microbiol. 1999 Aug 1;2(4):348–52.
Sorgo AG, Heilmann CJ, Brul S, de Koster CG, Klis FM. Beyond the wall: Candida albicans secret(e)s to survive. FEMS Microbiol Lett. 2012 Nov 30;338(1):10–7.
Soustre J. Caspofungin modulates in vitro adherence of Candida albicans to plastic coated with extracellular matrix proteins. J Antimicrob Chemother. 2004;53(3):522–5.
Stark C. BioGRID: a general repository for interaction datasets. Nucleic Acids Res. 2006 Jan 1;34(90001):D535–9.

211
Stevens DA, Espiritu M, Parmar R. Paradoxical effect of caspofungin: reduced activity against Candida albicans at high drug concentrations. Antimicrob Agents Chemother. 2004;48(9):3407–11.
Stevens DA, Ichinomiya M, Koshi Y, Horiuchi H. Escape of Candida from caspofungin inhibition at concentrations above the MIC (paradoxical effect) accomplished by increased cell wall chitin; evidence for beta-1,6-glucan synthesis inhibition by caspofungin. Antimicrob Agents Chemother. 2006;50(9):3160–1.
Stevens DA, White TC, Perlin DS, Selitrennikoff CP. Studies of the paradoxical effect of caspofungin at high drug concentrations. Diagn Microbiol Infect Dis. 2005 Mar 1;51(3):173–8.
Stone JA, Xu X, Winchell GA, Deutsch PJ, Pearson PG, Migoya EM, et al. Disposition of caspofungin: role of distribution in determining pharmacokinetics in plasma. Antimicrob Agents Chemother. 2004 Feb 24;48(3):815–23.
Stover AG, L W-J, Mathews HL. A method for flow cytometric analysis of Candida albicans DNA. J Microbiol Methods. 1998;:1–6.
Sudbery P, Gow NAR, Berman J. The distinct morphogenic states of Candida albicans. Trends Microbiol. 2004 Jul;12(7):317–24.
Szabo EK, MacCallum DM. The contribution of mouse models to our understanding of systemic candidiasis. FEMS Microbiol Lett. 2011 Mar 24;320(1):1–8.
Taft CS, Selitrennikoff CP. Cilofungin inhibition of (1-3)-beta-glucan synthase: the lipophilic side chain is essential for inhibition of enzyme activity. J Antibiot. 1990 Apr;43(4):433–7.
Tamura K, Peterson D, Peterson N, Stecher G, Nei M, Kumar S. MEGA5: molecular evolutionary genetics analysis using maximum likelihood, evolutionary distance, and maximum parsimony methods. Mol Biol Evol. 2011;28(10):2731–9.
Tavanti A, Davidson AD, Fordyce MJ, Gow NAR, Maiden MCJ, Odds FC. Population structure and properties of Candida albicans, as determined by multilocus sequence typing. J Clin Microbiol. 2005 Nov;43(11):5601–13.
The UniProt Consortium. Reorganizing the protein space at the Universal Protein Resource (UniProt). Nucleic Acids Res. 2011 Dec 22;40(D1):D71–5.
Thompson JD, Higgins DG, Gibson TJ. CLUSTAL W: improving the sensitivity of progressive multiple sequence alignment through sequence weighting, position-specific gap penalties and weight matrix choice. Nucleic Acids Res. 1994;22(22):4673–80.
Thompson JR, Douglas CM, Li W, Jue CK, Pramanik B, Yuan X, et al. A glucan

212
synthase FKS1 homolog in Cryptococcus neoformans is single copy and encodes an essential function. J Bacteriol. 1999;181(2):444–53.
Utsugi T, Minemura M, Hirata A, Abe M, Watanabe D, Ohya Y. Movement of yeast 1,3-beta-glucan synthase is essential for uniform cell wall synthesis. Genes Cells. 2002 Jan;7(1):1–9.
van Duin D, Casadevall A, Nosanchuk JD. Melanization of Cryptococcus neoformans and Histoplasma capsulatum reduces their susceptibilities to amphotericin B and caspofungin. Antimicrob Agents Chemother. 2002 Nov;46(11):3394–400.
Veiga A, Arrabaça JD, Loureiro-Dias MC. Cyanide-resistant respiration is frequent, but confined to yeasts incapable of aerobic fermentation. FEMS Microbiol Lett. 2000 Sep 1;190(1):93–7.
Veses V, Gow NAR. Pseudohypha budding patterns of Candida albicans. Med Mycol. 2009;47(3):268–75.
Vilella F. Pkc1 and the upstream elements of the cell integrity pathway in Saccharomyces cerevisiae, Rom2 and Mtl1, Are required for cellular responses to oxidative stress. J Biol Chem. 2004;280(10):9149–59.
Walker LA, Gow NAR, Munro CA. Elevated chitin content reduces the susceptibility of Candida species to caspofungin. Antimicrob Agents Chemother. 2012;57(1):146–54.
Walker LA, Gow NAR, Munro CA. Fungal echinocandin resistance. Fungal Genet Biol. 2010 Feb 1;47(2):117–26.
Walker LA, Lenardon MD, Preechasuth K, Munro CA, Gow NAR. Cell wall stress induces alternative fungal cytokinesis and septation strategies. J Cell Sci. 2013 Jun 20;126(12):2668–77.
Walker LA, Munro CA, de Bruijn I, Lenardon MD, McKinnon A, Gow NAR. Stimulation of chitin synthesis rescues Candida albicans from echinocandins. PLoS Pathog. 2008 Apr 1;4(4):e1000040.
Walraven CJ, Lee SA. Antifungal lock therapy. Antimicrob Agents Chemother. 2012;57(1):1–8.
Walsh TJ, Teppler H, Donowitz GR, Maertens JA, Baden LR, Dmoszynska A, et al. Caspofungin versus liposomal amphotericin B for empirical antifungal therapy in patients with persistent fever and neutropenia. N. Engl. J. Med. 2004 Sep 30;351(14):1391–402.
Wheeler RT, Kombe D, Agarwala SD, Fink GR. Dynamic, morphotype-specific Candida albicans "-glucan exposure during infection and drug treatment.
213
Mitchell AP, editor. PLoS Pathog. 2008;4(12):e1000227.
Wiederhold NP, Kontoyiannis DP, Chi J, Prince RA, Tam VH, Lewis RE. Pharmacodynamics of caspofungin in a murine model of invasive pulmonary aspergillosis: evidence of concentration-dependent activity. J Infect Dis. 2004 Oct 15;190(8):1464–71.
Wiederhold NP, Kontoyiannis DP, Prince RA, Lewis RE. Attenuation of the activity of caspofungin at high concentrations against Candida albicans: possible role of cell wall integrity and calcineurin pathways. Antimicrob Agents Chemother. 2005;49(12):5146–8.
Wiederhold NP, Najvar LK, Bocanegra RA, Kirkpatrick WR, Patterson TF. Caspofungin dose escalation for invasive candidiasis due to resistant Candida albicans. Antimicrob Agents Chemother. 2011 Jun 16;55(7):3254–60.
Wightman R. In Candida albicans, the Nim1 kinases Gin4 and Hsl1 negatively regulate pseudohypha formation and Gin4 also controls septin organization. J Cell Biol. 2004 Feb 17;164(4):581–91.
Wood V, Gwilliam R, Rajandream M-A, Lyne M, Lyne R, Stewart A, et al. The genome sequence of Schizosaccharomyces pombe. Nature. 2002 Feb 21;415(6874):871–80.
Wurthwein G, Cornely OA, Trame MN, Vehreschild JJ, Vehreschild MJGT, Farowski F, et al. Population pharmacokinetics of escalating doses of caspofungin in a phase II study of patients with invasive aspergillosis. Antimicrob Agents Chemother. 2013;57(4):1664–71.
Xie X, Lipke PN. On the evolution of fungal and yeast cell walls. Yeast. 2010 Aug;27(8):479–88.
Yamochi W, Tanaka K, Nonaka H, Maeda A, Musha T, Takai Y. Growth site localization of Rho1 small GTP-binding protein and its involvement in bud formation in Saccharomyces cerevisiae. J Cell Biol. 1994;125(5):1077–93.
Yan L, Li M, Cao Y, Gao P, Cao Y, Wang Y, et al. The alternative oxidase of Candida albicans causes reduced fluconazole susceptibility. J Antimicrob Chemother. 2009 Sep 9;64(4):764–73.
Yao J, Liu H, Zhou T, Chen H, Miao Z, Dong G, et al. Total synthesis and structure-activity relationships of caspofungin-like macrocyclic antifungal lipopeptides. Tetrahedron. Elsevier Ltd; 2012 Apr 8;68(14):3074–85.
Yoshida S, Bartolini S, Pellman D. Mechanisms for concentrating Rho1 during cytokinesis. Genes Dev. 2009 Apr 1;23(7):810–23.
Zanette RA, Kontoyiannis DP. Paradoxical effect to caspofungin in Candida
214
species does not confer survival advantage in a Drosophila model of candidiasis. Virulence. 2013 Aug 15;4(6):497–8.
Zaoutis TE, Argon J, Chu J, Berlin JA, Walsh TJ, Feudtner C. The epidemiology and attributable outcomes of candidemia in adults and children hospitalized in the United States: a propensity analysis. Clin Infect Dis. 2005 Nov 1;41(9):1232–9.
Zhang Y-Q, Rao R. Global disruption of cell cycle progression and nutrient response by the antifungal agent amiodarone. J Biol Chem. 2007 Dec 28;282(52):37844–53.
Zimbeck AJ, Iqbal N, Ahlquist AM, Farley MM, Harrison LH, Chiller T, et al. FKS mutations and elevated echinocandin MIC values among Candida glabrata isolates from U.S. population-based surveillance. Antimicrob Agents Chemother. 2010;54(12):5042–7.

215
Appendices
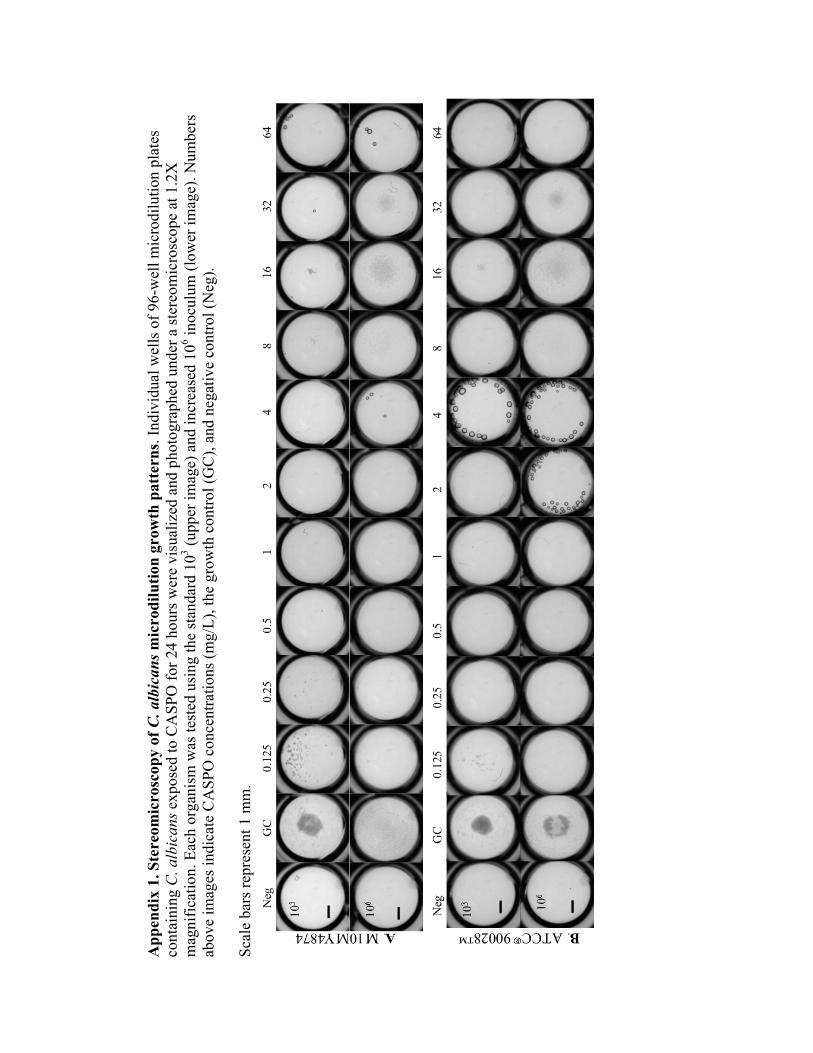
App
endi
x 1.
Ste
reom
icro
scop
y of
C. a
lbic
ans m
icro
dilu
tion
grow
th p
atte
rns.
Indi
vidu
al w
ells
of 9
6-w
ell m
icro
dilu
tion
plat
es
cont
aini
ng C
. alb
ican
s exp
osed
to C
ASP
O fo
r 24
hour
s wer
e vi
sual
ized
and
pho
togr
aphe
d un
der a
ster
eom
icro
scop
e at
1.2
X
mag
nific
atio
n. E
ach
orga
nism
was
test
ed u
sing
the
stan
dard
103 (u
pper
imag
e) a
nd in
crea
sed
106 in
ocul
um (l
ower
imag
e). N
umbe
rs
abov
e im
ages
indi
cate
CA
SPO
con
cent
ratio
ns (m
g/L)
, the
gro
wth
con
trol (
GC
), an
d ne
gativ
e co
ntro
l (N
eg).
Sc
ale
bars
repr
esen
t 1 m
m.


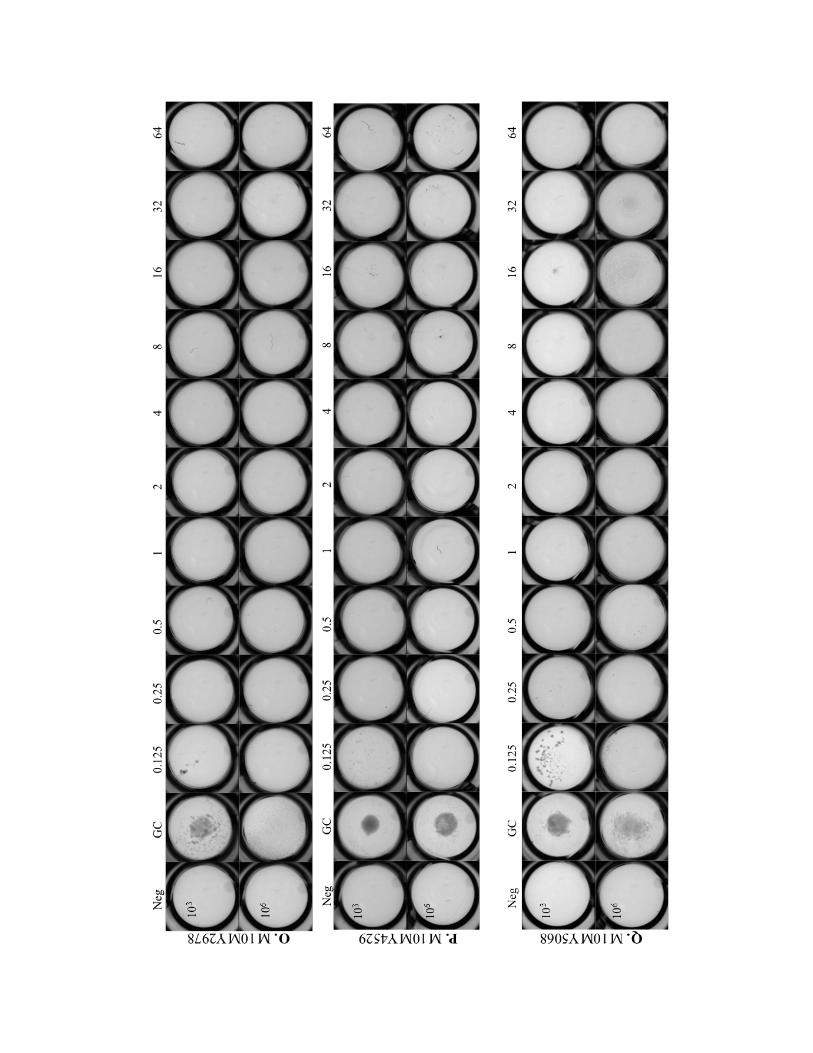


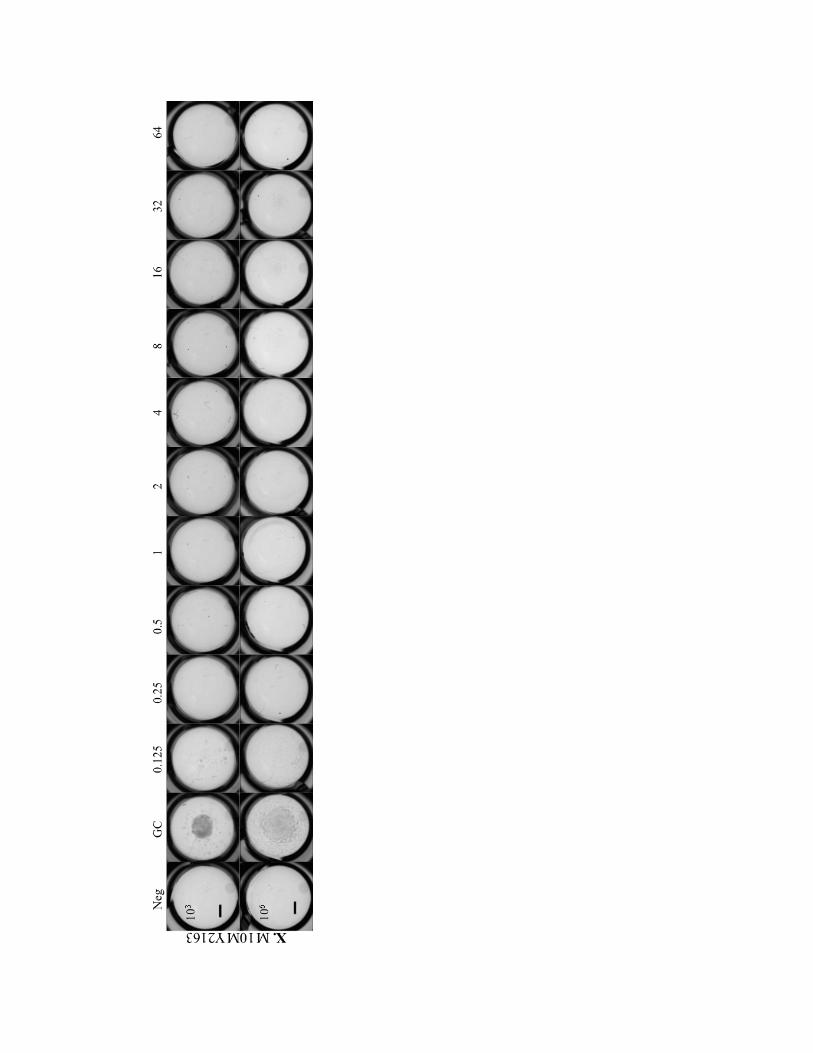

App
endi
x 2.
Ste
reom
icro
scop
y of
C. g
labr
ata
mic
rodi
lutio
n gr
owth
pat
tern
s. In
divi
dual
wel
ls o
f 96-
wel
l mic
rodi
lutio
n pl
ates
co
ntai
ning
C. g
labr
ata
expo
sed
to C
ASP
O fo
r 24
hour
s wer
e vi
sual
ized
and
pho
togr
aphe
d un
der a
ster
eom
icro
scop
e at
1.2
X
mag
nific
atio
n. E
ach
orga
nism
was
test
ed u
sing
the
stan
dard
103 (u
pper
imag
e) a
nd in
crea
sed
106 in
ocul
um (l
ower
imag
e). N
umbe
rs
abov
e im
ages
indi
cate
CA
SPO
con
cent
ratio
ns (m
g/L)
, the
gro
wth
con
trol (
GC
), an
d ne
gativ
e co
ntro
l (N
eg).
Sc
ale
bars
repr
esen
t 1 m
m.
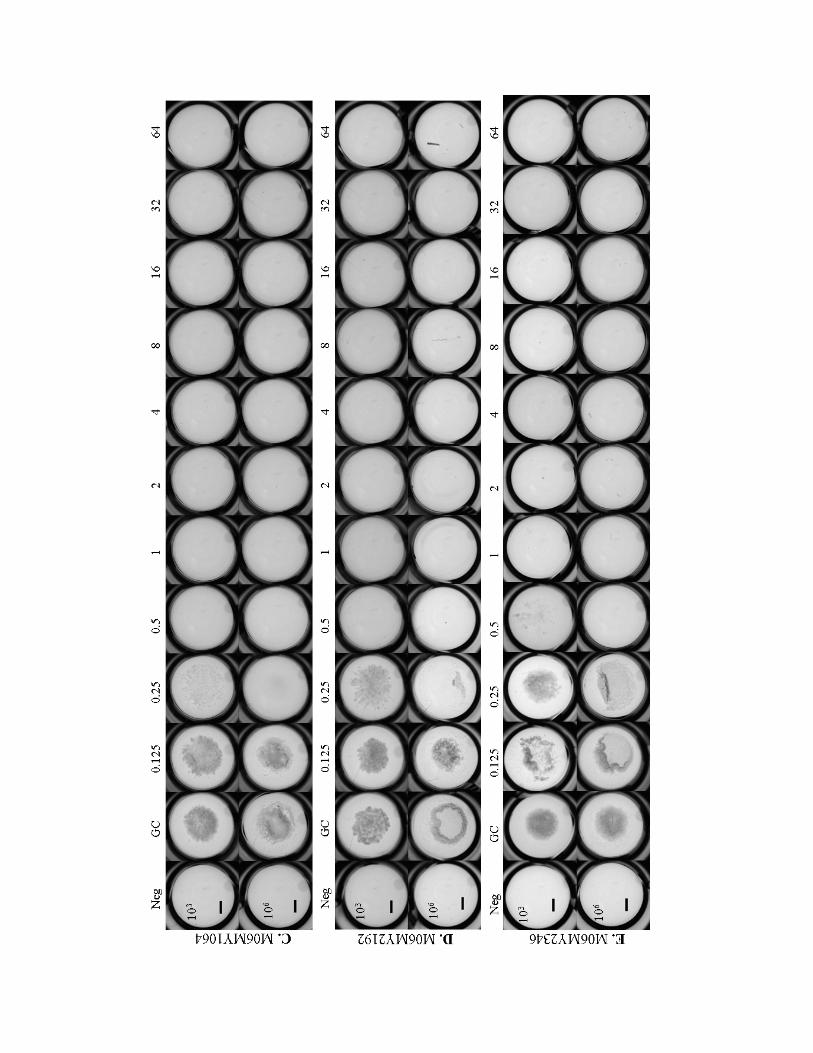
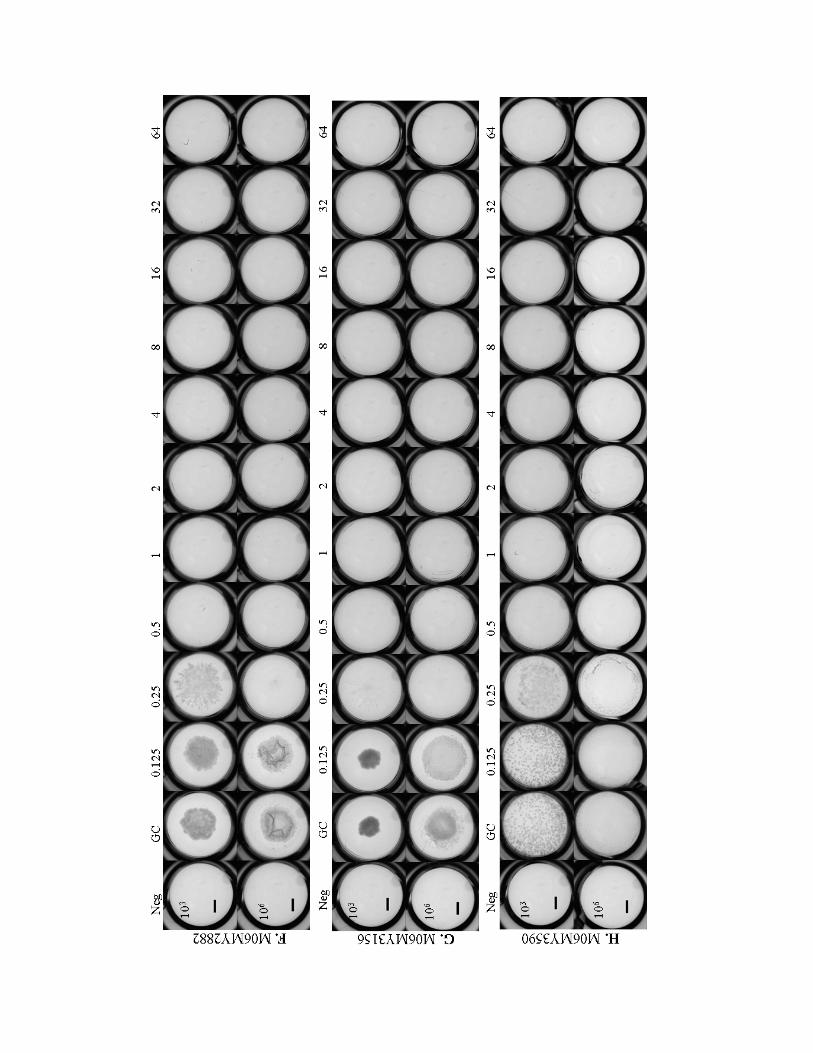
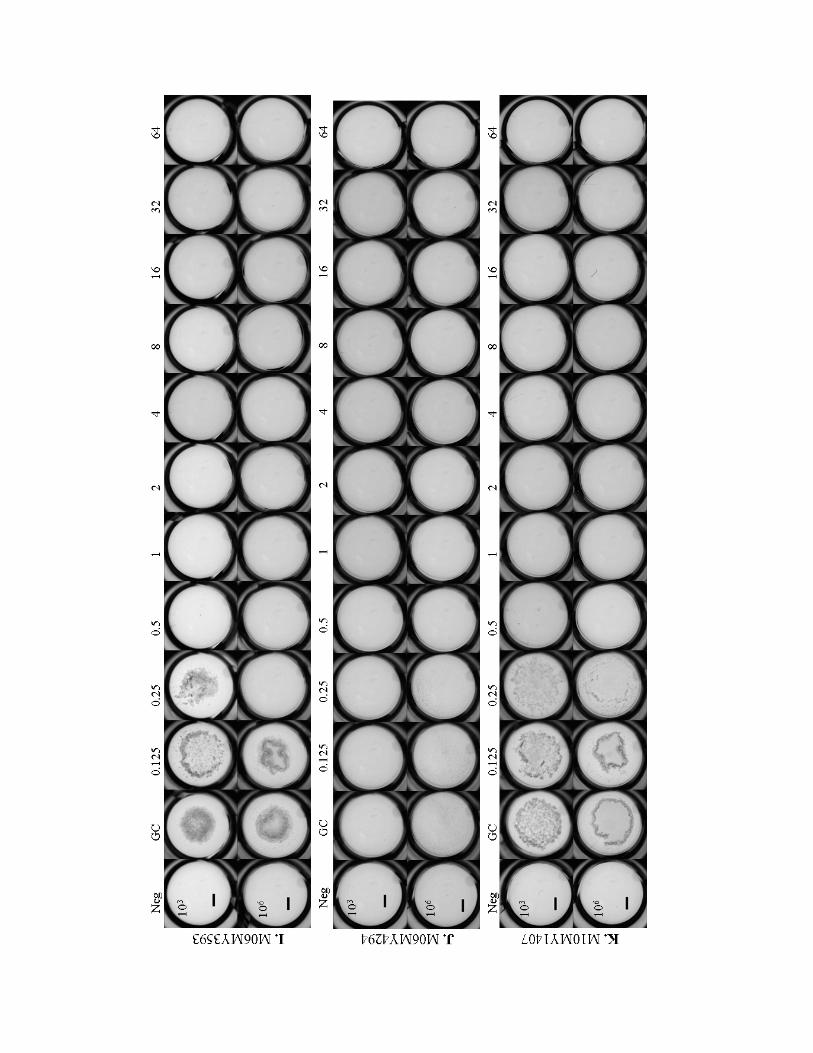
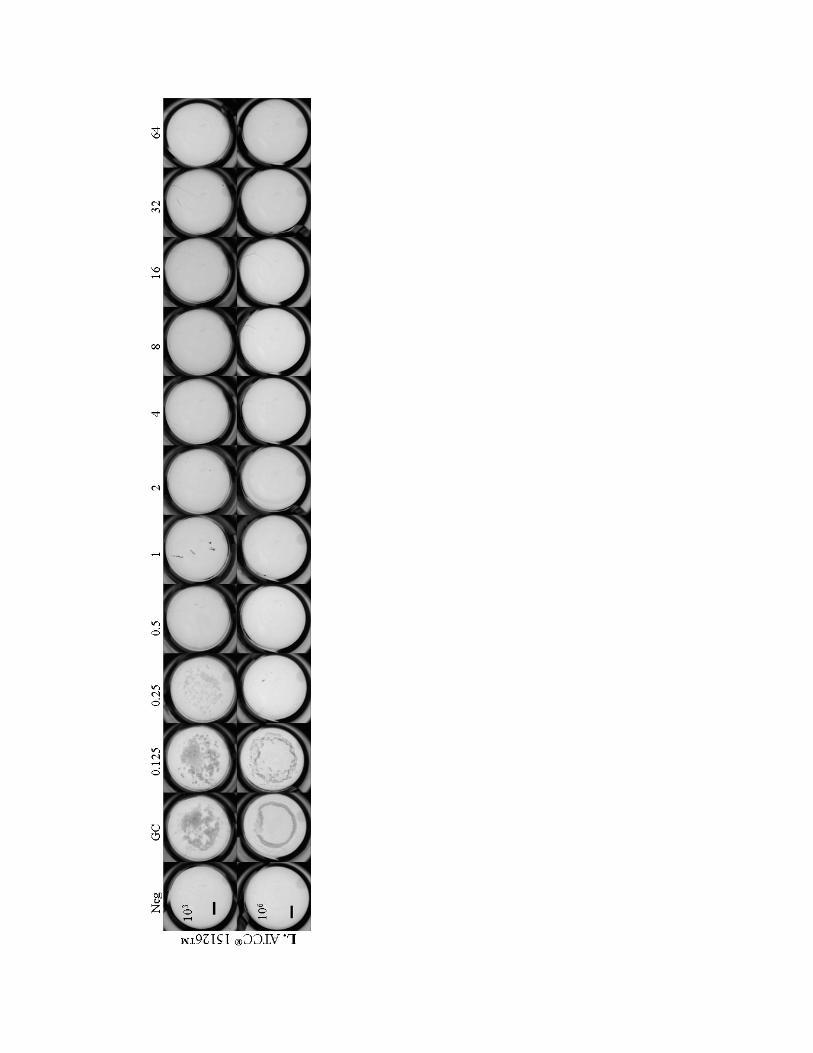
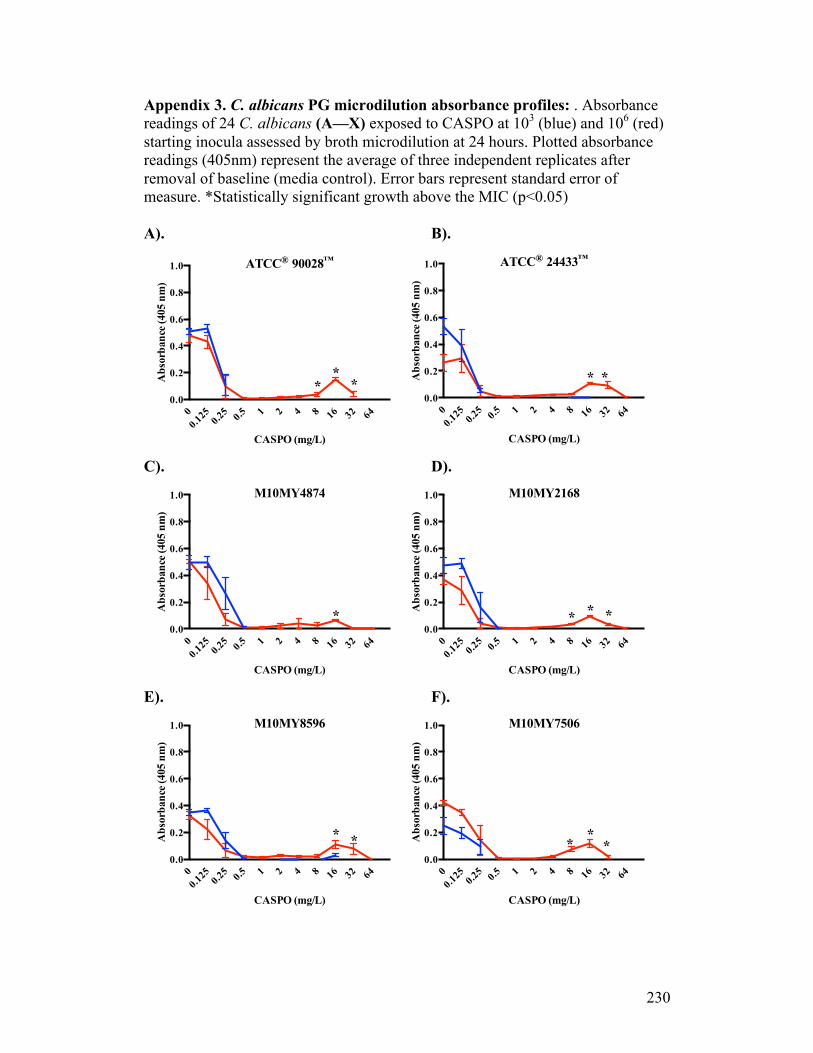
230
Appendix 3. C. albicans PG microdilution absorbance profiles: . Absorbance readings of 24 C. albicans (A—X) exposed to CASPO at 103 (blue) and 106 (red) starting inocula assessed by broth microdilution at 24 hours. Plotted absorbance readings (405nm) represent the average of three independent replicates after removal of baseline (media control). Error bars represent standard error of measure. *Statistically significant growth above the MIC (p<0.05) A). B).
C). D).
E). F).
00.1
25 0.25 0.5 1 2 4 8 16 32 64
0.0
0.2
0.4
0.6
0.8
1.0 ATCC® 90028™
CASPO (mg/L)
Abs
orba
nce (
405
nm)
***
00.1
25 0.25 0.5 1 2 4 8 16 32 64
0.0
0.2
0.4
0.6
0.8
1.0 ATCC® 24433™
CASPO (mg/L)
Abs
orba
nce (
405
nm)
* *
00.1
25 0.25 0.5 1 2 4 8 16 32 64
0.0
0.2
0.4
0.6
0.8
1.0 M10MY4874
CASPO (mg/L)
Abs
orba
nce (
405
nm)
*
00.1
25 0.25 0.5 1 2 4 8 16 32 64
0.0
0.2
0.4
0.6
0.8
1.0 M10MY2168
CASPO (mg/L)
Abs
orba
nce (
405
nm)
* **
00.1
25 0.25 0.5 1 2 4 8 16 32 64
0.0
0.2
0.4
0.6
0.8
1.0 M10MY8596
CASPO (mg/L)
Abs
orba
nce (
405
nm)
* *
00.1
25 0.25 0.5 1 2 4 8 16 32 64
0.0
0.2
0.4
0.6
0.8
1.0 M10MY7506
CASPO (mg/L)
Abs
orba
nce (
405
nm)
***
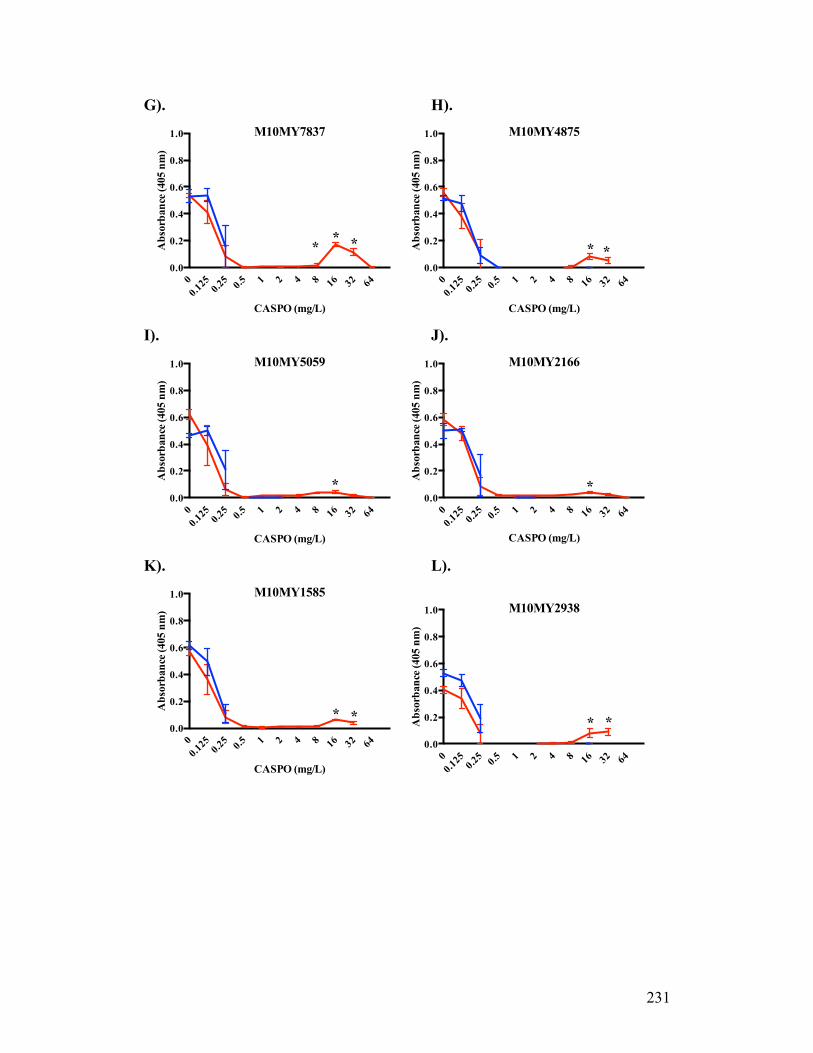
231
G). H).
I). J).
K). L).
00.1
25 0.25 0.5 1 2 4 8 16 32 64
0.0
0.2
0.4
0.6
0.8
1.0 M10MY7837
CASPO (mg/L)
Abs
orba
nce (
405
nm)
* **
00.1
25 0.25 0.5 1 2 4 8 16 32 64
0.0
0.2
0.4
0.6
0.8
1.0 M10MY4875
CASPO (mg/L)
Abs
orba
nce (
405
nm)
* *
00.1
25 0.25 0.5 1 2 4 8 16 32 64
0.0
0.2
0.4
0.6
0.8
1.0 M10MY5059
CASPO (mg/L)
Abs
orba
nce (
405
nm)
*
00.1
25 0.25 0.5 1 2 4 8 16 32 64
0.0
0.2
0.4
0.6
0.8
1.0 M10MY2166
CASPO (mg/L)
Abs
orba
nce (
405
nm)
*
00.1
25 0.25 0.5 1 2 4 8 16 32 64
0.0
0.2
0.4
0.6
0.8
1.0 M10MY1585
CASPO (mg/L)
Abs
orba
nce (
405
nm)
* *
00.1
25 0.25 0.5 1 2 4 8 16 32 64
0.0
0.2
0.4
0.6
0.8
1.0 M10MY2938
Abs
orba
nce
(405
nm
)
* *

232
M). N).
O). P).
Q). R).
00.1
25 0.25 0.5 1 2 4 8 16 32 64
0.0
0.2
0.4
0.6
0.8
1.0 M10MY3029
CASPO (mg/L)
Abs
orba
nce (
405
nm)
* *
00.1
25 0.25 0.5 1 2 4 8 16 32 64
0.0
0.2
0.4
0.6
0.8
1.0 M10MY3028
CASPO (mg/L)
Abs
orba
nce (
405
nm)
**
00.1
25 0.25 0.5 1 2 4 8 16 32 64
0.0
0.2
0.4
0.6
0.8
1.0 M10MY2978
CASPO (mg/L)
Abs
orba
nce (
405
nm)
00.1
25 0.25 0.5 1 2 4 8 16 32 64
0.0
0.2
0.4
0.6
0.8
1.0 M10MY4529
CASPO (mg/L)
Abs
orba
nce (
405
nm)
*
00.1
25 0.25 0.5 1 2 4 8 16 32 64
0.0
0.2
0.4
0.6
0.8
1.0 M10MY5068
CASPO (mg/L)
Abs
orba
nce (
405
nm)
*
00.1
25 0.25 0.5 1 2 4 8 16 32 64
0.0
0.2
0.4
0.6
0.8
1.0 M10MY2333
CASPO (mg/L)
Abs
orba
nce (
405
nm)
* *
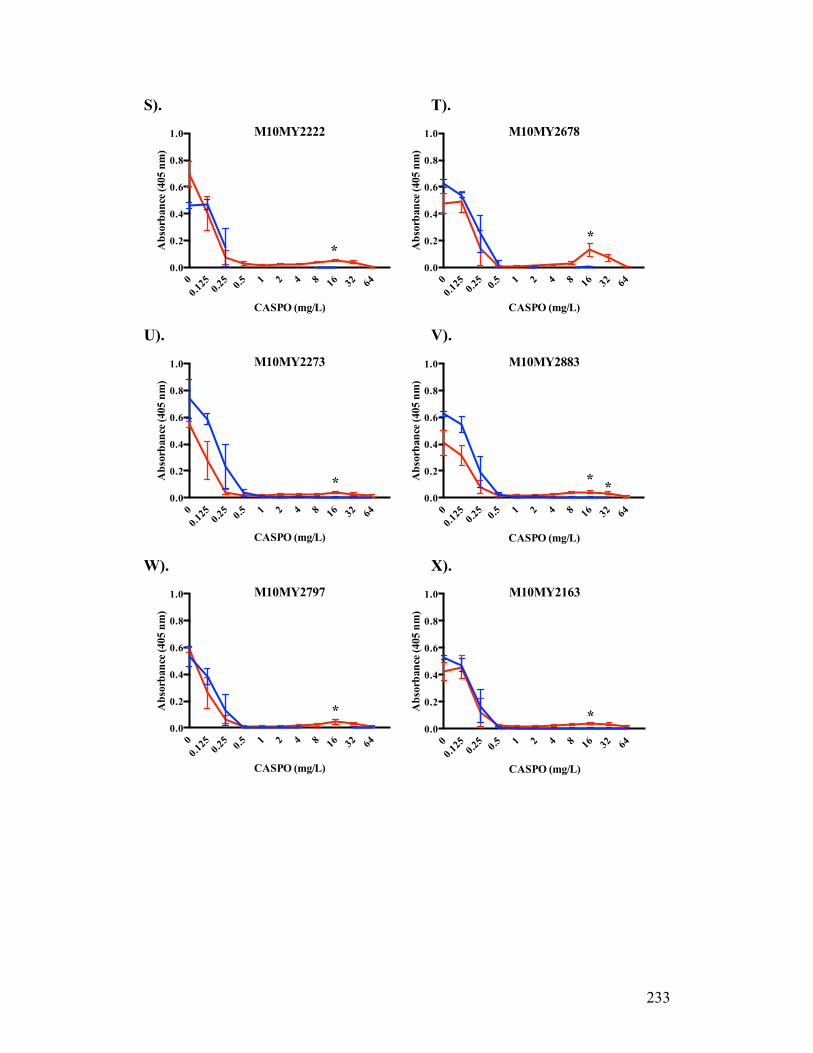
233
S). T).
U). V).
W). X).
00.1
25 0.25 0.5 1 2 4 8 16 32 64
0.0
0.2
0.4
0.6
0.8
1.0 M10MY2222
CASPO (mg/L)
Abs
orba
nce (
405
nm)
*
00.1
25 0.25 0.5 1 2 4 8 16 32 64
0.0
0.2
0.4
0.6
0.8
1.0 M10MY2678
CASPO (mg/L)
Abs
orba
nce (
405
nm)
*
00.1
25 0.25 0.5 1 2 4 8 16 32 64
0.0
0.2
0.4
0.6
0.8
1.0 M10MY2273
CASPO (mg/L)
Abs
orba
nce (
405
nm)
*
00.1
25 0.25 0.5 1 2 4 8 16 32 64
0.0
0.2
0.4
0.6
0.8
1.0 M10MY2883
CASPO (mg/L)
Abs
orba
nce (
405
nm)
**
00.1
25 0.25 0.5 1 2 4 8 16 32 64
0.0
0.2
0.4
0.6
0.8
1.0 M10MY2797
CASPO (mg/L)
Abs
orba
nce (
405
nm)
*
00.1
25 0.25 0.5 1 2 4 8 16 32 64
0.0
0.2
0.4
0.6
0.8
1.0 M10MY2163
CASPO (mg/L)
Abs
orba
nce (
405
nm)
*

234
Appendix 4. C. glabrata PG microdilution absorbance profiles: Absorbance readings of 12 C. glabrata (A—L) exposed to CASPO at 103 (blue) and 106 (red) starting inocula assessed by broth microdilution at 24 hours. Plotted absorbance readings (405nm) represent the average of three independent replicates after removal of baseline (media control). Error bars represent standard error of measure. *Statistically significant growth above the MIC (p<0.05) A). B).
C). D).
E). F).
00.1
25 0.25 0.5 1 2 4 8 16 32 64
0.0
0.2
0.4
0.6
0.8
1.0 M06MY0206
CASPO (mg/L)
Abs
orba
nce (
405
nm)
00.1
25 0.25 0.5 1 2 4 8 16 32 64
0.0
0.2
0.4
0.6
0.8
1.0 M06MY0779
CASPO (mg/L)A
bsor
banc
e (40
5 nm
)
00.1
25 0.25 0.5 1 2 4 8 16 32 64
0.0
0.2
0.4
0.6
0.8
1.0 M06MY1064
CASPO (mg/L)
Abs
orba
nce (
405
nm)
00.1
25 0.25 0.5 1 2 4 8 16 32 64
0.0
0.2
0.4
0.6
0.8
1.0 M06MY2192
CASPO (mg/L)
Abs
orba
nce (
405
nm)
00.1
25 0.25 0.5 1 2 4 8 16 32 64
0.0
0.2
0.4
0.6
0.8
1.0 M06MY2346
CASPO (mg/L)
Abs
orba
nce (
405
nm)
00.1
25 0.25 0.5 1 2 4 8 16 32 64
0.0
0.2
0.4
0.6
0.8
1.0 M06MY2882
CASPO (mg/L)
Abs
orba
nce (
405
nm)
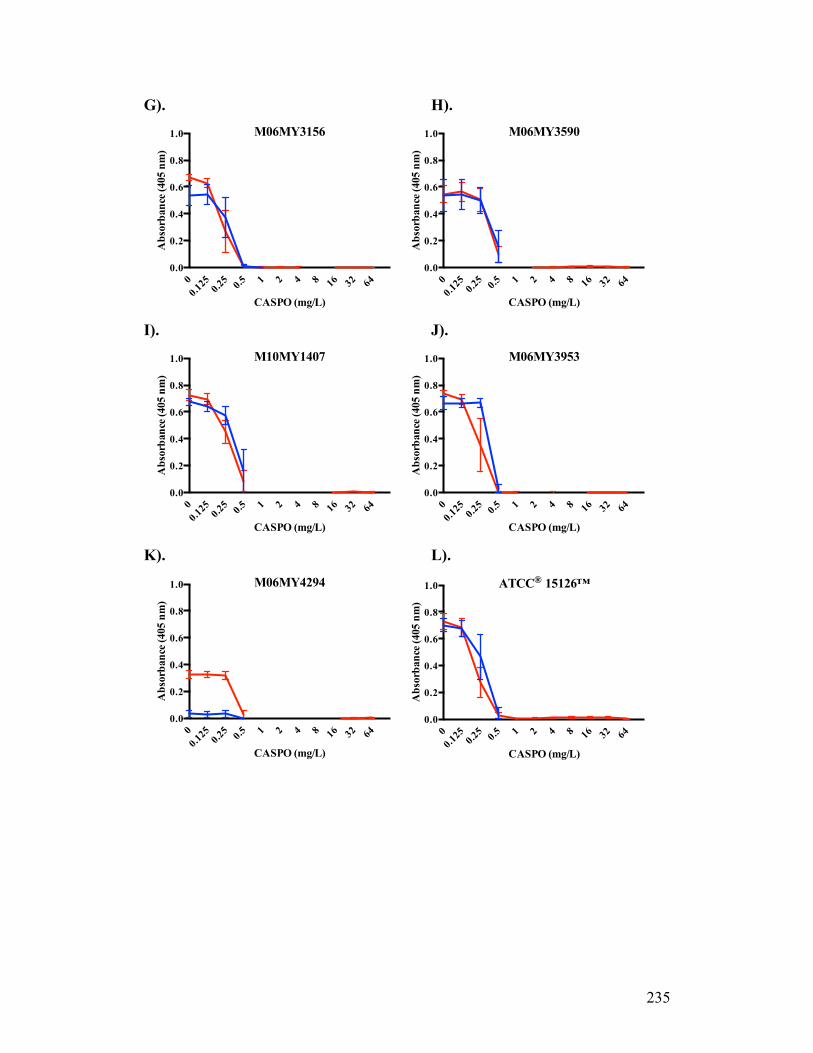
235
G). H).
I). J).
K). L).
00.1
25 0.25 0.5 1 2 4 8 16 32 64
0.0
0.2
0.4
0.6
0.8
1.0 M06MY3156
CASPO (mg/L)
Abs
orba
nce (
405
nm)
00.1
25 0.25 0.5 1 2 4 8 16 32 64
0.0
0.2
0.4
0.6
0.8
1.0 M06MY3590
CASPO (mg/L)
Abs
orba
nce (
405
nm)
00.1
25 0.25 0.5 1 2 4 8 16 32 64
0.0
0.2
0.4
0.6
0.8
1.0 M10MY1407
CASPO (mg/L)
Abs
orba
nce (
405
nm)
00.1
25 0.25 0.5 1 2 4 8 16 32 64
0.0
0.2
0.4
0.6
0.8
1.0 M06MY3953
CASPO (mg/L)
Abs
orba
nce (
405
nm)
00.1
25 0.25 0.5 1 2 4 8 16 32 64
0.0
0.2
0.4
0.6
0.8
1.0 M06MY4294
CASPO (mg/L)
Abs
orba
nce (
405
nm)
00.1
25 0.25 0.5 1 2 4 8 16 32 64
0.0
0.2
0.4
0.6
0.8
1.0 ATCC® 15126™
CASPO (mg/L)
Abs
orba
nce (
405
nm)