characterization of cyanobacterial glna gene diversity and gene expression in marine environments:...
TRANSCRIPT

Characterizationof cyanobacterial glnAgenediversityandgeneexpression inmarine environmentsAngela H. Gibson1, Bethany D. Jenkins1, Frances P. Wilkerson2, Steven M. Short1 & Jonathan P. Zehr1
1Ocean Sciences, University of California Santa Cruz, Santa Cruz, CA, USA and 2Romberg Tiburon Center, San Francisco State University, Tiburon,
CA, USA
Correspondence: Angela Gibson, Earth and
Marine Sciences Building, University of
California, Santa Cruz, CA 95064, USA.
Tel: 11 831 459 4752; fax: 11 831 459 4882;
e-mail: [email protected]
Present address: Steven M. Short,
Department of Biological Sciences, University
of Denver, 2190 E. Iliff Avenue, Denver,
CO 80208, USA.
Received 23 May 2005; revised 18 August
2005; accepted 23 September 2005.
First published online 10 January 2006.
doi:10.1111/j.1574.6941.2005.00050.x
Editor: Riks Laanbroek
Keywords
glnA; glutamine synthetase; marine;
cyanobacteria; Synechococcus.
Abstract
PCR primers were designed and used to amplify glnA, the gene that encodes
glutamine synthetase, from pure cultures of cyanobacteria and four samples from
different marine environments. The glnA phylogeny was similar to that of the 16S
rRNA gene, indicating that glnA gene sequences can be used to identify
cyanobacteria expressing the glnA gene. Diverse unicellular cyanobacteria glnA
genes were recovered from the North Pacific Subtropical Gyre, Monterey Bay,
Chesapeake Bay and waters off the New Jersey coast. The majority of sequences
were closely related to sequences from Synechococcus strains (78–88% identical
DNA sequences). A few sequences that clustered with Prochlorococcus glnA genes
were recovered from Monterey Bay and the North Pacific Subtropical Gyre. The
expression of glnA was assayed by reverse transcriptase PCR to determine if there
was a daily pattern in gene expression of samples collected from New Jersey’s
Longterm Environmental Observatory site (LEO-15). glnA expression varied over
the day, with different glnA sequence types exhibiting different daily cycles. Results
showed that the glnA gene can be used to characterize the diversity of natural
populations of cyanobacteria, and to characterize gene expression patterns of
individual species or strains.
Introduction
Nitrogen is a major nutrient controlling primary productiv-
ity in marine environments (Sharp, 1983). The major forms
of inorganic nitrogen used by phytoplankton are nitrate and
ammonium. The use of different nitrogen compounds is the
basis for the model of regenerated and new production
(Dugdale & Goering, 1967), which is conceptually linked to
nitrogen and carbon export (Eppley & Peterson, 1979). It is
usually assumed that phytoplankton preferentially utilize
ammonium, because there are energetic costs of transport-
ing and using nitrate relative to ammonium. Ammonium
is assimilated by cyanobacteria primarily through the
glutamine synthetase–glutamine:2-oxoglutarate amido-
transferase (GS-GOGAT) pathway (Flores & Herrero, 1994;
Merrick & Edwards, 1995; Eisenberg et al., 2000; Herrero
et al., 2001). GS-GOGAT catalyses a two-step process in
which glutamine synthetase (GS) first converts glutamate to
glutamine in an ATP-dependent reaction and then gluta-
mate synthase (GOGAT) transfers the amide group of
glutamine to 2-oxoglutarate, producing two molecules of
glutamate in an NADPH-dependent reaction (Flores &
Herrero, 1994; Merrick & Edwards, 1995). Although another
pathway for directly incorporating ammonium into gluta-
mate exists, the glutamate dehydrogenase (GDH) pathway,
it has a high Km =�1 mM that is inefficient for cells growing
under ammonium limitation (Flores & Herrero, 1994). The
GS-GOGAT pathway has a higher affinity for ammonium
and is more efficient at NH41 assimilation when ammonium
concentrations are low (Flores & Herrero, 1994).
Although tracer experiments or biogeochemical measure-
ments can be used to determine community nitrogen
metabolism in different size classes of phytoplankton, the
use of molecular approaches (targeting DNA or mRNA) can
identify specifically which taxa or phylotypes are capable of
using different nitrogen sources (e.g. nitrogen, nitrate or, in
this case, ammonium), and which are actively expressing
genes for metabolism of individual compounds (Scanlan &
West, 2002). Genomic information shows that some cyano-
bacteria, such as Prochlorococcus strains MED4 and MIT
9313, do not have assimilatory nitrate reductase genes (Ro-
cap et al., 2002). And one marine Synechococcus isolate (MIT
S9220) from the Equatorial Pacific does not use nitrate as a
source of nitrogen (Moore et al., 2002). Thus, there are
FEMS Microbiol Ecol 55 (2006) 391–402 c� 2005 Federation of European Microbiological SocietiesPublished by Blackwell Publishing Ltd. All rights reserved
cyanobacterial communities that are composed of strains
that use only ammonium, or ammonium and nitrite, or all
three nitrogen compounds.
The objective of this study was to design glutamine
synthetase PCR primers to amplify cyanobacteria glnA
genes, in order to develop a molecular approach for
characterizing cyanobacterial populations and glnA gene
expression in marine systems.
Materials andmethods
Sample collection
Seawater samples for DNA analysis were collected from the
Choptank River and Chesapeake Bay samples from the R/V
Cape Henlopen in October 2000, and April and July 2001.
The lower Choptank River site (CT200) is located at
381460N, 761090W. The mid- and lower Chesapeake Bay
sites (CB200 and CB300) are located at 381340N, 761270W
and 371160N, 761090W, respectively. Samples were collected
from two Monterey Bay stations (M1 and M2) on 18
December 2001 [R/V Pt. Lobos, Monterey Bay Aquarium
Research Institute (MBARI) cruise no. 35201] and 22
February 2002 (R/V Pt. Lobos, MBARI cruise no. 2357).
The M1 and M2 mooring sampling locations are located at
36.751N, 122.031W, and 36.701N, 122.391W, respectively. In
order to see how the glnA gene is expressed by natural
populations, RNA samples were collected as part of a
collaborative Department of Energy (DOE)-supported pro-
gram (Bi-OMP) at the Longterm Environmental Observa-
tory site (LEO-15, located at 391270N, 741140W) on 22 July
2002, known as the Geochemical Rate-RNA Integration
Study, or ‘GRIST’ (Corredor et al., 2004). Samples for DNA
analysis were collected from the Hawai’i Ocean Time series
(HOT) site at station ALOHA (A Long Term Oligotrophic
Habitat Assessment, located at 221450N, 1581W), near
Hawai’i on 13 December 2002 (R/V Kilo Moana).
For the Monterey Bay samples, a Sea-Bird CTD (Sea-Bird
Electronics Inc., Kilo Moana Bellevue, WA) rosette of twelve
10 L Niskin bottles was used to collect samples from several
depths in the water column. Approximately 4–5 L of water
was prefiltered through 2.5 in diameter, 5 mm pore-size
Nytex filters held in a filter holder and attached to the
Niskin bottles with silicone tubing. Aliquots (500 mL) of the
prefiltered water were then filtered through 25 mm dia-
meter, 0.2mm pore-size Supor (Pall Gelman) filters. Each
filter was then stored in 250 mL of 1�TE buffer solution
(50 mM Tris-HCl, 50 mM EDTA) at � 80 1C. Samples were
collected from depths of 0–200 m (every 20 m) at the M1
and M2 stations. Additional Monterey Bay DNA extracts
from M1 (collected 22 February 2002) were provided by Dr
Ed DeLong (MIT).
Samples from the Chesapeake Bay, LEO and HOT (ALO-
HA) sites were collected by filtration of �1 L of seawater
through a SterivexTM capsule (Millipore, Bedford, MA)
using a peristaltic pump. Excess water was evacuated from
the filter by running air through the pump. Filter capsules
were stored at �80 1C for later analysis. Samples from
Chesapeake Bay were collected from the surface, mid-depth
and 1.5 m above the bottom at each station. Samples were
collected from a depth profile (0–200 m) at station ALOHA.
Only surface-water samples were collected at the LEO site.
Cyanobacteria cultures
In addition to the environmental samples, cultures of
cyanobacteria were obtained from the Pasteur Culture
Collection of Cyanobacteria, the Deutsche Sammlung von
Mickroorganismen und Zellkuturen GmbH, and the Agri-
culture Research Culture Collection. Synechococcus DNA
extracts (strains WH8008, WH8009, WH8104 and
WH8108) were also obtained for the study, courtesy of
Dr L. Campbell (Texas A1M). The Synechococcus strains
used in this study are given in Table 1. In order to cover a
broad range of cyanobacteria morphology and taxonomy,
other strains were used, including the filamentous hetero-
cystous (Tolypothrix sp. PCC7101, Nostoc sp. UTEX486 and
Anabaena sp. UTEX629) and the filamentous nonheterocys-
tous (Symploca sp. PCC8002, Lyngbya sp. UTEX7419).
DNAextraction
DNA was extracted from environmental and culture samples
using STE buffer [20% weight in volume (w/v) sucrose,
50 mM Tris-HCl, 50 mM EDTA] containing 5 mg mL�1
lysozyme, followed by proteinase K digestion (2 mg mL�1
final concentration), SDS addition (sodium dodecyl sul-
phate, 1% w/v final concentration) and PCI (phenol chloro-
form isoamyl alcohol 25 : 24 : 1) extraction as outlined in
(Steward et al., 2004). The ALOHA station samples were
extracted using the xanthogenate method described in
(Tillett & Neilan, 2000).
Primerdesign
To design glnA-specific primers, cyanobacterial and pro-
chlorophyte glnA DNA sequences, along with several of the
most closely related bacterial sequences from GenBank
(based on BLAST homology), were assembled and their
protein translations aligned (Fig. 1) using the Block Maker
algorithm (http://bioinformatics.weizmann.ac.il/Blocks/).
From the local alignment, regions of high conservation
among the cyanobacterial sequences were searched with the
CODEHOP (Consensus-Degenerate Hybrid Oligonuc-
leotide Primers) program, which generated several possible
primers at each block from a consensus of amino acid
FEMS Microbiol Ecol 55 (2006) 391–402c� 2005 Federation of European Microbiological SocietiesPublished by Blackwell Publishing Ltd. All rights reserved
392 A.H. Gibson et al.
residues using an amino acid position-specific scoring
matrix (Rose et al., 1998). The best possible glnA primers
were designed from this consensus. The primers bracket a
region of the glnA gene that covers the latter half of the gene.
The outer pair are GLNcdhpCOF (50GACATCCGCACGAR
ATGYTNYT30) and GLNcdhpGOR (50CAATCGTAGTACA
TGGAGAATTCGTRNGGRTGN GG30), at positions 586
and 1409 bp, respectively, of the Synechococcus WH7803
glnA sequence. The inner primers are GLNcdhpCIF (50CG
GCGTCCCCATCGARAARCANCA30) and GLNcdhpGIR
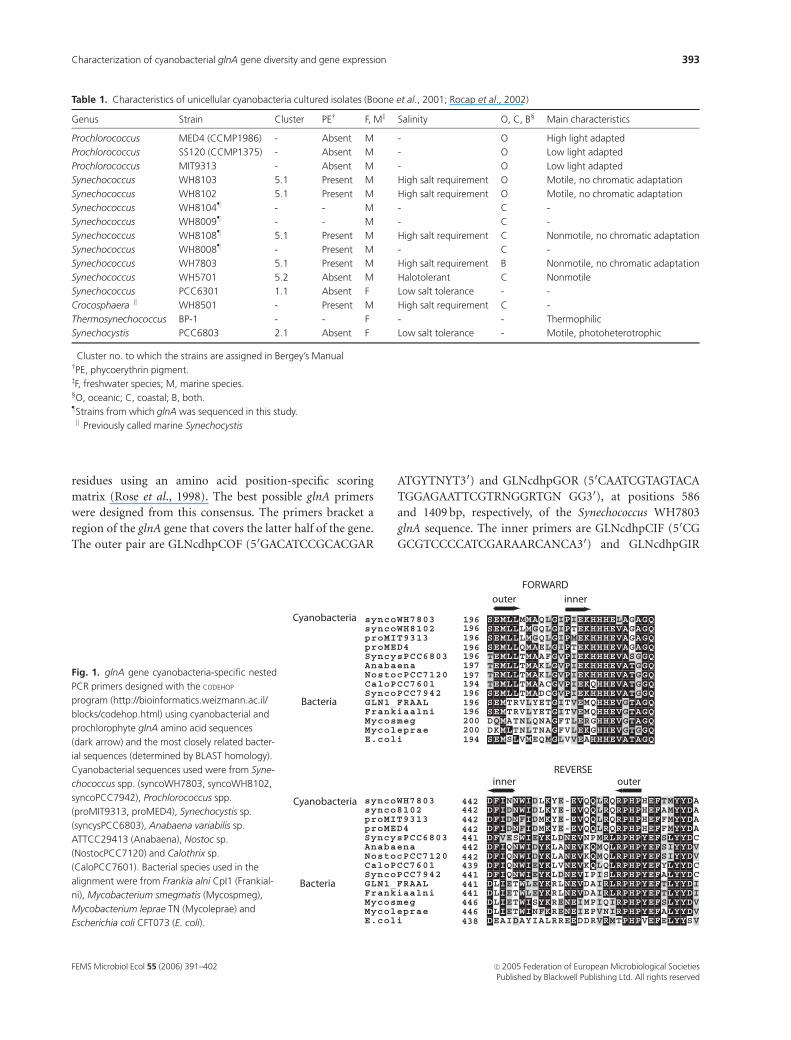
Table 1. Characteristics of unicellular cyanobacteria cultured isolates (Boone et al., 2001; Rocap et al., 2002)
Genus Strain Cluster� PEw F, Mz Salinity O, C, B‰ Main characteristics
Prochlorococcus MED4 (CCMP1986) - Absent M - O High light adapted
Prochlorococcus SS120 (CCMP1375) - Absent M - O Low light adapted
Prochlorococcus MIT9313 - Absent M - O Low light adapted
Synechococcus WH8103 5.1 Present M High salt requirement O Motile, no chromatic adaptation
Synechococcus WH8102 5.1 Present M High salt requirement O Motile, no chromatic adaptation
Synechococcus WH8104z - - M - C -
Synechococcus WH8009z - - M - C -
Synechococcus WH8108z 5.1 Present M High salt requirement C Nonmotile, no chromatic adaptation
Synechococcus WH8008z - Present M - C -
Synechococcus WH7803 5.1 Present M High salt requirement B Nonmotile, no chromatic adaptation
Synechococcus WH5701 5.2 Absent M Halotolerant C Nonmotile
Synechococcus PCC6301 1.1 Absent F Low salt tolerance - -
Crocosphaera k WH8501 - Present M High salt requirement C -
Thermosynechococcus BP-1 - - F - - Thermophilic
Synechocystis PCC6803 2.1 Absent F Low salt tolerance - Motile, photoheterotrophic
�Cluster no. to which the strains are assigned in Bergey’s ManualwPE, phycoerythrin pigment.zF, freshwater species; M, marine species.‰O, oceanic; C, coastal; B, both.zStrains from which glnA was sequenced in this study.k Previously called marine Synechocystis
syncoWH7803 SEMLLMMAQLGIPIEKHHHELAGAGQsyncoWH8102 SEMLLLMGQLGIPTEKHHHEVAGAGQproMIT9313 SEMLLLMGQLGIPMEKHHHEVAGAGQproMED4 SEMLLQMAELGIPTEKHHHEVAGAGQSyncysPCC6803 TEMLLTMAAFGVPIEKHHHEVASGGQAnabaena TEMLLTMAKLGVPIEKHHHEVATGGQNostocPCC7120 TEMLLTMAKLGVPIEKHHHEVATGGQCaloPCC7601 TEMLLTMAACGVPIEKQHHEVATGGQSyncoPCC7942 SEMLLTMADCGVPIEKHHHEVATGGQGLN1_FRAAL SEMTRVLYETGITVEMQHHEVGTAGQFrankiaalni SEMTRVLYETGITVEMQHHEVGTAGQMycosmeg DQMATNLQNAGFTLERGHHEVGTAGQMycoleprae DKMLTNLTNAGFVLEKGHHEVGTGGQE.coli SEMSLVMEQMGLVVEAHHHEVATAGQ
outer inner
Cyanobacteria
Bacteria
syncoWH7803 DFINNWIDLKYE-EVQQLRQRPHPHEFTMYYDAsynco8102 DFIDNWIDLKYE-EVQQLRQRPHPHEFAMYYDAproMIT9313 DFIDNFIDMKYE-EVQQLRQRPHPHEFFMYYDAproMED4 DFIDNFIDMKYE-EVQQLRQRPHPHEFFMYYDASyncysPCC6803 DFVESWIEYKLDNEVNPMRLRPHPYEFSLYYDCAnabaena DFIQNWIDYKLANEVKQMQLRPHPYEFSIYYDVNostocPCC7120 DFIQNWIDYKLANEVKQMQLRPHPYEFSIYYDVCaloPCC7601 DFIQNWIEYKLVNEVKQLQLRPHPYEFYLYYDCSyncoPCC7942 DFIQNWIEYKLDNEVIPISLRPHPYEFALYYDCGLN1_FRAAL DLIETWLEYKRLNEVDAIRLRPHPYEFTLYYDIFrankiaalni DLIETWLEYKRLNEVDAIRLRPHPYEFTLYYDIMycosmeg DLIETWISYKRENEIMPIQIRPHPYEFSLYYDVMycoleprae DLIETWINFKRENEIEPVNIRPHPYEFALYYDVE.coli DEAIDAYIALRREEDDRVRMTPHPVEFELYYSV
Cyanobacteria
Bacteria
outer inner
196196196196196197197194196196196200200194
442442442442441442442439441441441446446438
REVERSE
FORWARD
Fig. 1. glnA gene cyanobacteria-specific nested
PCR primers designed with the CODEHOP
program (http://bioinformatics.weizmann.ac.il/
blocks/codehop.html) using cyanobacterial and
prochlorophyte glnA amino acid sequences
(dark arrow) and the most closely related bacter-
ial sequences (determined by BLAST homology).
Cyanobacterial sequences used were from Syne-
chococcus spp. (syncoWH7803, syncoWH8102,
syncoPCC7942), Prochlorococcus spp.
(proMIT9313, proMED4), Synechocystis sp.
(syncysPCC6803), Anabaena variabilis sp.
ATTCC29413 (Anabaena), Nostoc sp.
(NostocPCC7120) and Calothrix sp.
(CaloPCC7601). Bacterial species used in the
alignment were from Frankia alni CpI1 (Frankial-
ni), Mycobacterium smegmatis (Mycospmeg),
Mycobacterium leprae TN (Mycoleprae) and
Escherichia coli CFT073 (E. coli).
FEMS Microbiol Ecol 55 (2006) 391–402 c� 2005 Federation of European Microbiological SocietiesPublished by Blackwell Publishing Ltd. All rights reserved
393Characterization of cyanobacterial glnA gene diversity and gene expression
(50TCGTATTTGTAATCGATCCAGTTTTBNAYRAARTC30),
at positions 628 and 1334 bp, respectively, of the Synecho-
coccus WH7803 glnA sequence. The primers were synthe-
sized by Integrated DNA Technology Inc. (Coraville, IA).
The primers were tested against several noncyanobacter-
ial strains for specificity: Methanococcus sp. DSMZ 1224 and
Clostridium sp. NRRL B-527, Heliobacter sp. NRRL B-14647
and Sinorhizobium sp. NRRL L-45. The GlnA gene was not
amplified.
PCRamplification
The first-round PCR reactions (50mL) included 37.5mL
deionized water, 5mL of 10�ExTaqTM buffer solution
(Takara Bio Inc., Otsu, Shigu, Japan), 4 mL of 2.5 mM
dNTPs, 0.5 mL of 100mM GLNcdhpCOF primer, 0.5mL of
100mM GLNcdhpGOR primer and 0.5 mL ExTaqTM poly-
merase (5 UmL�1), along with 15–40 ng of genomic DNA
extract (2mL). All reaction mixes prior to addition of
ExTaqTM enzyme were filtered through a 100-kDa filter
(Millipore) at 5000 r.p.m. (3000 g). At least two negative
controls (no DNA extract) were included in every set of
reactions. The cycling times were one cycle at 94 1C for
5 min, followed by 30 amplification cycles (94 1C for 1 min,
50 1C for 1 min and 72 1C for 70 s) and a 7 min extension at
72 1C. A second round of PCR reactions (50mL) was repeated
using 2mL of the first reaction with 0.5mL of 100mM
GLNcdhpCIF primer and 0.5mL of 100mM GLNcdhpGIR
primer. Core mixes were filtered in the same manner as
described for the first round. The nested reactions were
amplified for one cycle at 94 1C for 5 min, followed by 30
cycles (94 1C for 1 min, 50 1C for 1 min and 72 1C for 1 min)
and ending with a 7 min extension at 72 1C.
RT-PCRamplificationofLEOsamples
RNA was collected at five time points taken at the LEO site
(07:04, 11:15, 16:00, 19:10 and 22:00 hours). RNA was
extracted using a RNeasys Mini Kit (Qiagen, Hilden,
Germany). A nested reverse transcriptase PCR (RT-PCR)
was performed using the glnA primers. For RT-PCR, a Super
ScriptTM One Step RT-PCR with the Platinums Taq DNA
Polymerase kit (Invitrogen Corp., Carlsbad, CA) was used
with 2mL (�13 ng) of RNA extract added to a 25mL reaction
for the first round. A control reaction was run without RT to
test for contaminating DNA. Two blank controls were
included with each reaction. The RT reaction mix consisted
of 9.5mL of sterile water filtered through a 5 kDa filter
(Millipore), 12.5 mL 2� buffer solution, 0.25 mL of 100 mM
GLNcdhpCOF primer, 0.25 mL of 100 mM GLNcdhpGOR
primer and 0.5 mL SuperscriptTM II RT. For the reaction mix
containing no RT the following were added: 9.9 mL of sterile
filtered water, 12.5mL 2� buffer, 0.25mL GLNcdhpCOF
primer, 0.25 mL GLNcdhpGOR primer and 0.1mL
Platinums Taq polymerase mix. The amplification protocol
was one cycle of 50 1C for 30 min and 94 1C for 2 min,
followed by 40 amplification cycles (94 1C for 30 s, 50 1C for
30 s, and 72 1C for 1 min), and a final 7 min extension step at
72 1C. The second round reaction was a 50 mL PCR reaction
containing 37.5mL water, 5 mL of 10� ExTaqTM buffer solu-
tion, 4mL of 2.5 mM dNTPs and 0.5 mL of 100mM
GLNcdhpCIF primer, 0.5 mL of 100 mM GLNcdhpGIR pri-
mer and 0.5 mL ExTaqTM polymerase (5 U mL�1), along with
2 mL of first round RT-PCR product. The amplification
protocol was one cycle at 94 1C, followed by 30 amplification
cycles (94 1C for 1 min, 50 1C for 1 min and 72 1C for 1 min)
and a 7 min extension cycle at 72 1C.
Cloningandplasmid isolation
PCR products from the second round were resolved on a 1%
agarose gel at �94 V. Gel fragments were excised and
purified using a QIAquick Gel Extraction Kit (Qiagen).
Amplification products were ligated and transformed using
a pGem T-system II vector kit (Promega Corp., Madison,
WI). Transformations were plated on LB-agar plates con-
taining 100 mg mL�1 carbenicillin disodium salt, 0.5 mM
isopropyl-b-D-thiogalactopyranosid (IPTG) and 80 mg mL�1
5-brom-4-chloro-3-indolyl-beta-D-galactopyranosid (X-
GAL) and incubated overnight at 37 1C. Individual colonies
were picked from the agar plates and grown overnight in
2–3 mL of LB broth and 100mg mL�1 ampicillin at 37 1C
with shaking (300–320 rpm). Either QIAprep Spin Miniprep
(Qiagen) or Montage Plasmid Miniprep (Millipore) kits was
used to purify the plasmids.
Sequencing
Purified plasmids were cycle sequenced using the ABI Prism
BigDye Terminator v3.0 Cycle Sequencing kit (Applied
Biosystems, Foster City, CA) and SP6 primer (Promega) for
27 cycles (96 1C for 10 s, 50 1C for 5 s and 60 1C for 4 min). A
Montage sequencing reaction cleanup kit (Millipore) was
used to clean up the sequence reactions. Products were
sequenced using an ABI Prism 310 or 3100 automated
sequencer (Applied Biosystems). The opposite strand was
sequenced using the T7 primer (Promega) for the represen-
tative sequences, which were submitted to GenBank under
accession numbers DQ020039–DQ020041, DQ020044–
DQ020056, DQ020058–DQ020061, DQ020064, DQ066752–
DQ066772, DQ070874–DQ070876, DQ070878–DQ070881
and DQ154120–DQ154134.
Phylogenetic analysis
DNA sequences were edited in GCG (Accelrys Inc., San
Diego, CA, USA) and translated. The Institute for Genomic
Research protein family sequences (TIGR-FAM) were
downloaded (www.tigr.org/TIGRFAMS) as a seed to create
FEMS Microbiol Ecol 55 (2006) 391–402c� 2005 Federation of European Microbiological SocietiesPublished by Blackwell Publishing Ltd. All rights reserved
394 A.H. Gibson et al.
the HMMER alignment using the HMMR program in GCG.
The predicted amino acid sequences were then aligned with
HMMER in GCG, and then imported into the ARB software
package (Ludwig et al., 2004). The DNA sequences were
then aligned according to the protein alignment using ARB.
Neighbor-joining trees (Saitou & Nei, 1987) for both
protein and DNA alignments were generated with TREE-
CON for Windows (VanDePeer & Dewachter, 1994). The
phylogenetic distances between DNA sequences were calcu-
lated with a Jukes–Cantor distance correction in TREECON.
The Tajima–Nei correction was used for protein trees. Boot-
strap values were generated with 100 replicates for each tree.
The glnA-like sequence from the Archaea Thermoplasma
acidophilum (accession no. NC_002578) was used as the
outgroup to root both trees. Individual representative
sequences were selected from groups of sequences that
showed Z98% sequence similarity to construct the phylo-
genetic trees.
Results anddiscussion
glnA sequences fromcultivated isolates
Sequences of the glnA gene contained regions of conserved
amino acid sequences that allowed construction of cyano-
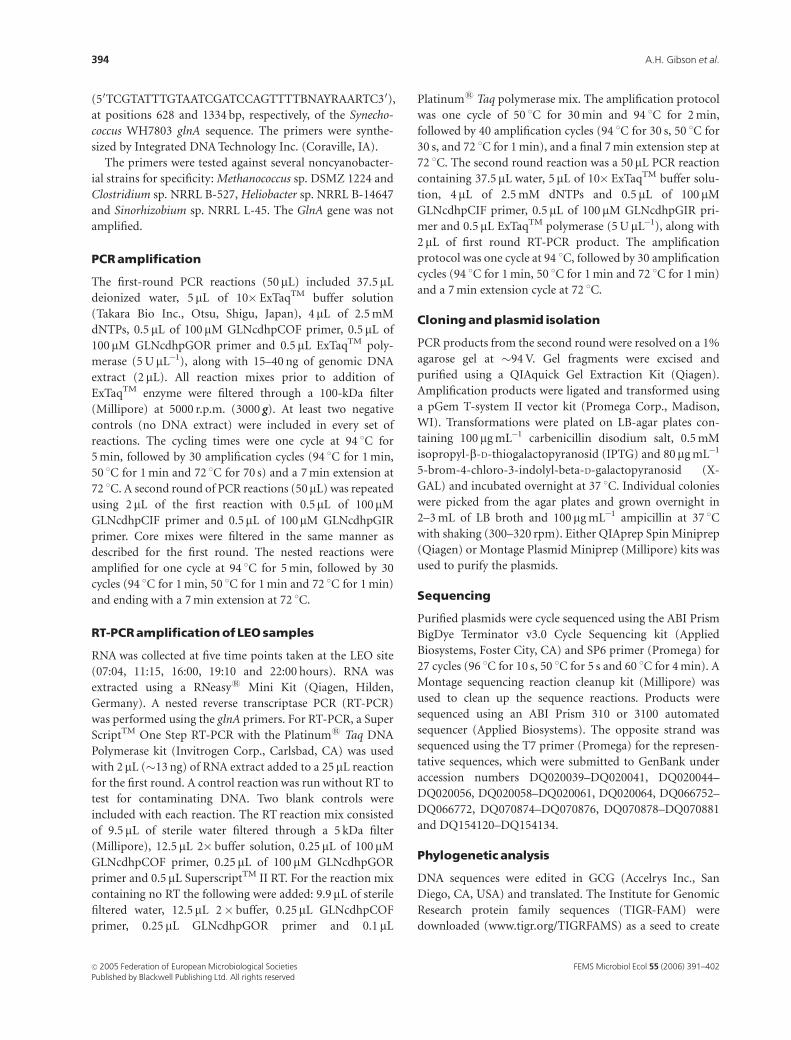
bacteria-specific CODEHOP primers for glnA (Fig. 1). The
specificity of the primers for cyanobacteria was checked by
testing the primers in reactions with DNA extracted from
cyanobacteria and heterotrophic bacteria (Fig. 2). None of
the heterotrophic bacterial strains amplified with the glnA
primers, indicating that the primers are selective if not
specific for cyanobacteria glnA. Of all subsequent amplifica-
tions of the glnA gene from environmental samples, only
two bacterial sequences were recovered.
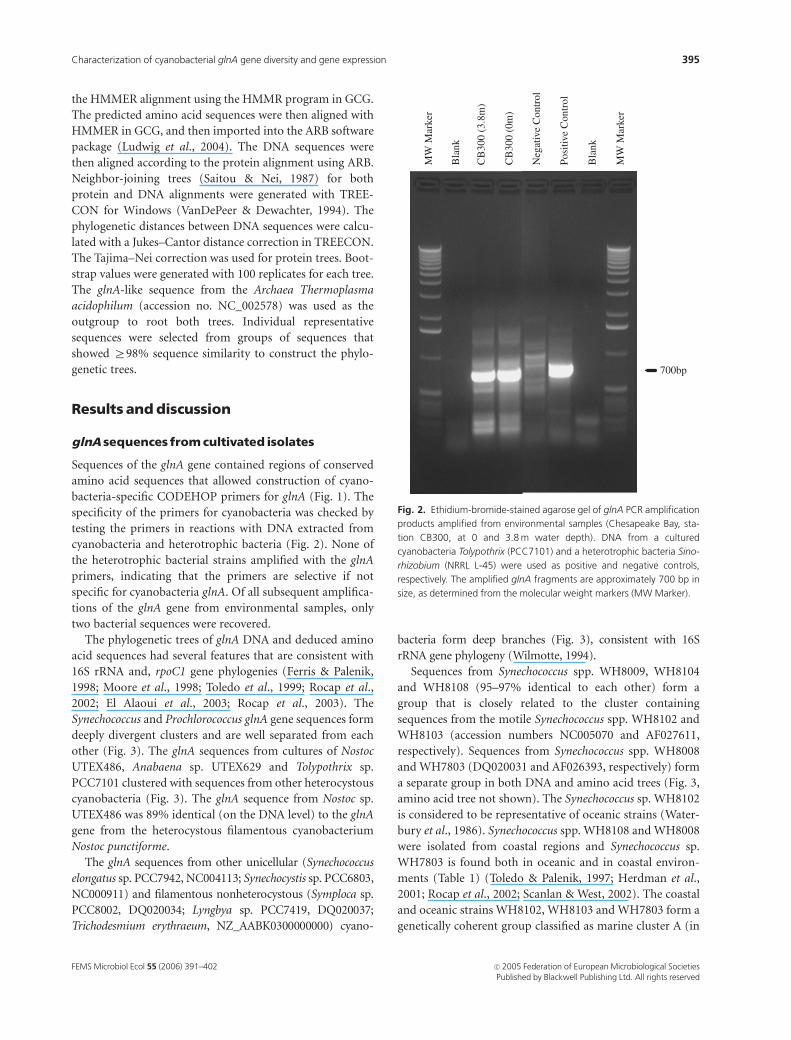
The phylogenetic trees of glnA DNA and deduced amino
acid sequences had several features that are consistent with
16S rRNA and, rpoC1 gene phylogenies (Ferris & Palenik,
1998; Moore et al., 1998; Toledo et al., 1999; Rocap et al.,
2002; El Alaoui et al., 2003; Rocap et al., 2003). The
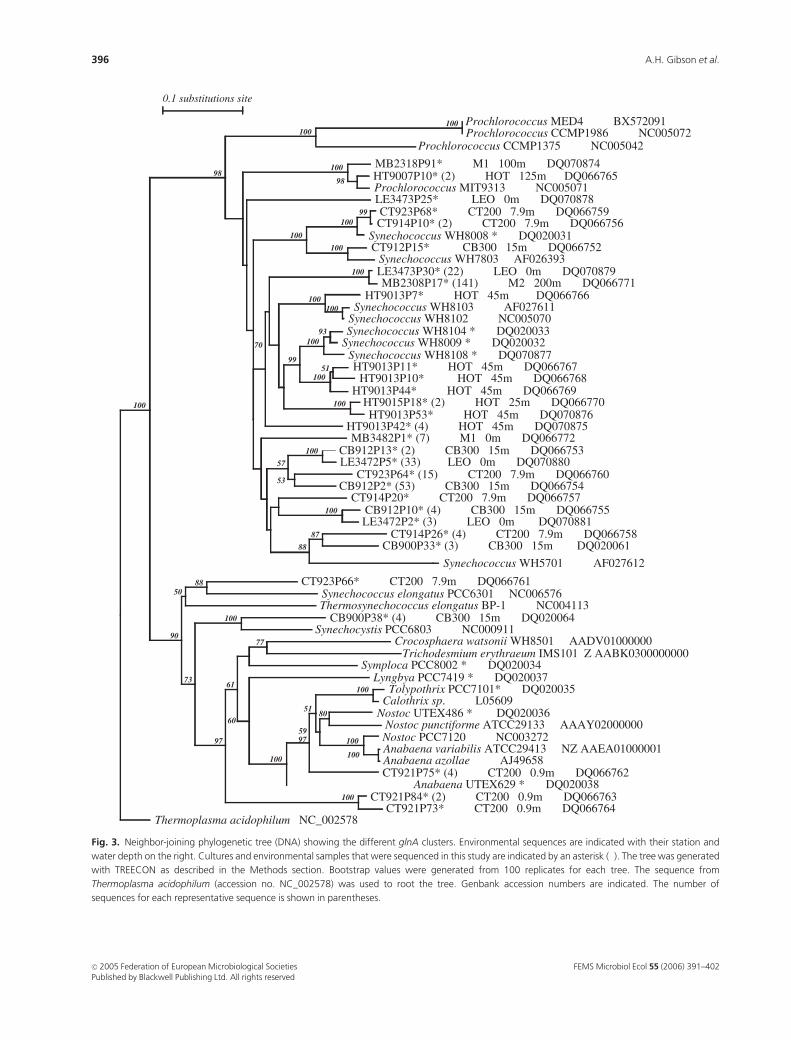
Synechococcus and Prochlorococcus glnA gene sequences form
deeply divergent clusters and are well separated from each
other (Fig. 3). The glnA sequences from cultures of Nostoc
UTEX486, Anabaena sp. UTEX629 and Tolypothrix sp.
PCC7101 clustered with sequences from other heterocystous
cyanobacteria (Fig. 3). The glnA sequence from Nostoc sp.
UTEX486 was 89% identical (on the DNA level) to the glnA
gene from the heterocystous filamentous cyanobacterium
Nostoc punctiforme.
The glnA sequences from other unicellular (Synechococcus
elongatus sp. PCC7942, NC004113; Synechocystis sp. PCC6803,
NC000911) and filamentous nonheterocystous (Symploca sp.
PCC8002, DQ020034; Lyngbya sp. PCC7419, DQ020037;
Trichodesmium erythraeum, NZ_AABK0300000000) cyano-
bacteria form deep branches (Fig. 3), consistent with 16S
rRNA gene phylogeny (Wilmotte, 1994).
Sequences from Synechococcus spp. WH8009, WH8104
and WH8108 (95–97% identical to each other) form a
group that is closely related to the cluster containing
sequences from the motile Synechococcus spp. WH8102 and
WH8103 (accession numbers NC005070 and AF027611,
respectively). Sequences from Synechococcus spp. WH8008
and WH7803 (DQ020031 and AF026393, respectively) form
a separate group in both DNA and amino acid trees (Fig. 3,
amino acid tree not shown). The Synechococcus sp. WH8102
is considered to be representative of oceanic strains (Water-
bury et al., 1986). Synechococcus spp. WH8108 and WH8008
were isolated from coastal regions and Synechococcus sp.
WH7803 is found both in oceanic and in coastal environ-
ments (Table 1) (Toledo & Palenik, 1997; Herdman et al.,
2001; Rocap et al., 2002; Scanlan & West, 2002). The coastal
and oceanic strains WH8102, WH8103 and WH7803 form a
genetically coherent group classified as marine cluster A (in
700bp
MW
Mar
ker
Posi
tive
Con
trol
Bla
nk
Neg
ativ
e C
ontr
ol
CB
300
(0m
)
CB
300
(3.8
m)
MW
Mar
ker
Bla
nk
Fig. 2. Ethidium-bromide-stained agarose gel of glnA PCR amplification
products amplified from environmental samples (Chesapeake Bay, sta-
tion CB300, at 0 and 3.8 m water depth). DNA from a cultured
cyanobacteria Tolypothrix (PCC7101) and a heterotrophic bacteria Sino-
rhizobium (NRRL L-45) were used as positive and negative controls,
respectively. The amplified glnA fragments are approximately 700 bp in
size, as determined from the molecular weight markers (MW Marker).
FEMS Microbiol Ecol 55 (2006) 391–402 c� 2005 Federation of European Microbiological SocietiesPublished by Blackwell Publishing Ltd. All rights reserved
395Characterization of cyanobacterial glnA gene diversity and gene expression
0.1 substitutions site
Thermoplasma acidophilum NC_002578
LE3473P25* LEO 0m DQ070878
HT9013P42* (4) HOT 45m DQ070875MB3482P1* (7) M1 0m DQ066772
Lyngbya PCC7419 * DQ020037
Anabaena UTEX629 * DQ020038CT921P75* (4) CT200 0.9m DQ066762
Prochlorococcus CCMP1375 NC005042
MB2318P91* M1 100m DQ070874
Nostoc PCC7120 NC003272
Synechococcus WH8008 * DQ020031
Symploca PCC8002 * DQ020034
HT9013P7* HOT 45m DQ066766
HT9013P44* HOT 45m DQ066769
Thermosynechococcus elongatus BP-1 NC004113
Synechococcus WH8108 * DQ070877
CT914P20* CT200 7.9m DQ066757
HT9013P11* HOT 45m DQ066767HT9013P10* HOT 45m DQ066768
Synechococcus WH8104 * DQ020033Synechococcus WH8009 * DQ020032
HT9015P18* (2) HOT 25m DQ066770HT9013P53* HOT 45m DQ070876
Synechococcus WH8103 AF027611Synechococcus WH8102 NC005070
LE3473P30* (22) LEO 0m DQ070879MB2308P17* (141) M2 200m DQ066771
CB912P13* (2) CB300 15m DQ066753LE3472P5* (33) LEO 0m DQ070880
CT923P64* (15) CT200 7.9m DQ066760CB912P2* (53) CB300 15m DQ066754
CB912P10* (4) CB300 15m DQ066755 LE3472P2* (3) LEO 0m DQ070881
CT914P26* (4) CT200 7.9m DQ066758CB900P33* (3) CB300 15m DQ020061
Synechococcus WH5701 AF027612
CT912P15* CB300 15m DQ066752 Synechococcus WH7803 AF026393
CT923P68* CT200 7.9m DQ066759CT914P10* (2) CT200 7.9m DQ066756
HT9007P10* (2) HOT 125m DQ066765Prochlorococcus MIT9313 NC005071
Prochlorococcus MED4 BX572091Prochlorococcus CCMP1986 NC005072
CT923P66* CT200 7.9m DQ066761Synechococcus elongatus PCC6301 NC006576
CB900P38* (4) CB300 15m DQ020064 Synechocystis PCC6803 NC000911
CT921P84* (2) CT200 0.9m DQ066763CT921P73* CT200 0.9m DQ066764
Crocosphaera watsonii WH8501 AADV01000000Trichodesmium erythraeum IMS101 Z AABK0300000000
Tolypothrix PCC7101* DQ020035 Calothrix sp. L05609
Nostoc UTEX486 * DQ020036 Nostoc punctiforme ATCC29133 AAAY02000000
Anabaena variabilis ATCC29413 NZ AAEA01000001 Anabaena azollae AJ49658
100
98
90
73
97
61
70
60
100
97
51
99
59
100
88
57
100
100
100
100
100
100
50
100
51
93
100
100
100
100
53
100
87
100
99
98
100
88
100
100
77
100
80
100
Fig. 3. Neighbor-joining phylogenetic tree (DNA) showing the different glnA clusters. Environmental sequences are indicated with their station and
water depth on the right. Cultures and environmental samples that were sequenced in this study are indicated by an asterisk (�). The tree was generated
with TREECON as described in the Methods section. Bootstrap values were generated from 100 replicates for each tree. The sequence from
Thermoplasma acidophilum (accession no. NC_002578) was used to root the tree. Genbank accession numbers are indicated. The number of
sequences for each representative sequence is shown in parentheses.
FEMS Microbiol Ecol 55 (2006) 391–402c� 2005 Federation of European Microbiological SocietiesPublished by Blackwell Publishing Ltd. All rights reserved
396 A.H. Gibson et al.
Boone et al., 1989, p. 721; cluster 5.1 in Boone et al., 2001, p.
721) and are characterized by having C-phycoerythrin as
their major light-harvesting pigment (Herdman et al., 2001;
Rocap et al., 2002; Scanlan & West, 2002). In addition,
Synechococcus spp. WH8102 and WH8103 form a distinct
subgroup within group A and are not capable of chromatic
adaptation (Scanlan & West, 2002).
Prochlorococcus glnA gene sequences form separate
branches from the Synechococcus glnA gene sequences, with
deep divergence between sequences of the Prochlorococcus
sp. MIT9313 and Prochlorococcus sp. MED4 low- and high-
light ecotypes, respectively. The sequences from Prochloro-
coccus spp. MED4 and CCMP1986 are identical as they are
the same strain maintained in different culture collections.
Sequences from Prochlorococcus spp. MIT9313, MED4
(also CCMP1986) and CCMP1375 (also SS120) form two
divergent groups on the basis of rpoC1 or rRNA intergenic
spacer regions (Toledo & Palenik, 1997; Ferris &
Palenik, 1998; Rocap et al., 2003), which is consistent with
the light adaptation phenotypes of MIT9313 and
CCMP1375 (SS120) (low-light) and MED4 (high-light).
CCMP1375 (SS120) and MIT9313 consistently cluster
together on the basis of molecular markers, including the
glnA gene.
Overall, the clustering of representative cyanobacterial
glnA sequences was similar between the DNA and amino
acid trees (data not shown), but there is greater sequence
divergence in the former, as would be expected. The
similarity of topologies of the phylogenetic trees of the glnA
gene and other genes provides a way to classify uncultivated
cyanobacteria that express the glnA gene.
Cyanobacterial glnAdiversity inmarineplankton
glnA sequences were amplified from a variety of marine
environments, including a coastal shelf (coastal environ-
ments on the west and east coast of North America, open
ocean and an estuary), to test the ability of the primers to
amplify the glnA gene from different marine environments.
Different phylogenetic groups of glnA sequences were re-
covered from the different sites.
The Chesapeake Bay estuary (including the Choptank
River) had a diverse set of glnA sequences that were closely
related to sequences from the filamentous heterocystous
cyanobacteria genera, Anabaena and Nostoc, and other
sequences that clustered among the divergent cyanobacterial
glnA sequences from Synechococcus elongatus sp. PCC6301
and Synechocystis sp. PCC6803 (Table 2, Fig. 3). It was the
only site studied that had the glnA gene from these groups of
cyanobacteria, consistent with the influence of freshwater
inputs. The Chesapeake Bay estuary is fed by a number of
rivers, including the Choptank River, that influence salinity,
nutrient concentrations and turbidity (Fisher et al., 1988;
Heidelberg et al., 2002). Filamentous cyanobacteria, in
particular heterocystous species, are commonly found in
freshwater and brackish environments (Herdman et al.,
2001).
All of the glnA sequences recovered from the
North Pacific Subtropical Gyre station ALOHA of the
HOT program, from Monterey Bay and from the LEO
site clustered with Synechococcus and Prochlorococcus
sequences.
Some of the glnA sequences from the Choptank River and
the Chesapeake River grouped with Synechococcus as well,
but formed separate clusters from the sequence groups from
oceanic samples (Monterey Bay, Station ALOHA) (Fig. 3).
The Choptank River and Chesapeake Bay glnA sequences
were most closely related to Synechococcus sp. WH8008,
WH7803 and WH5701 (Table 2, Fig. 3). The glnA sequences
from the LEO site clustered alone (LE3473P25) or with
Chesapeake Bay (LE3472P2, LE3472P5) or Monterey Bay
(LE3473P30) sequences. Most of the Monterey Bay Synecho-
coccus glnA sequences clustered with this LEO LE3473P30
sequence type. Some of the Monterey Bay sequences were
within the Synechococcus cluster but distant from either of
the large clusters containing the oceanic or estuarine glnA
types (MB3482P1).
Synechococcus glnA sequences from the oceanic site (Sta-
tion ALOHA of the HOT program) clustered with Synecho-
coccus sequences (Synechococcus sp. WH8102, WH8103,
WH8009, WH8104) (Table 2, Fig. 3), but formed several
small clusters that may represent several ecotypes or strains
(Fig. 3). Isolates WH8102 and WH8103 are in the marine
cluster of Synechococcus known as group A (or MC-A),
which is characterized by an elevated salt requirement,
C-phycoerythrin and nonflagellated motility (Toledo et al.,
1999; Moore et al., 2002; Scanlan & West, 2002) (Table 1).
These strains are abundant in the oligotrophic regions of the
open ocean and are generally not found in coastal regions
(Waterbury et al., 1986). Thus, the recovery of glnA
sequences similar to those of Synechococcus sp. WH8102 is
consistent with the expected phylotypes at the oligotrophic
ocean station ALOHA.
Prochlorococcus glnA sequences were only detected in
Monterey Bay and at station ALOHA. The Prochlorococcus-
like sequences recovered from station ALOHA branched
most closely with the sequence from Prochlorococcus sp.
MIT9313 (Table 2, Fig. 3), the low-light-adapted phylotype
(Moore et al., 1998, 2002; El Alaoui et al., 2003). The
sequences (DNA 97% identical to Prochlorococcus sp.
MIT9313) were obtained from a water depth of 125 m,
below the chlorophyll maximum at about 85–90 m (0.21
mg L�1) and within the nitracline at about 80 m. Only a few
samples and sequences from station ALOHA were analysed
for the glnA gene in this study and no Prochlorococcus
sequences were recovered from depths shallower than
FEMS Microbiol Ecol 55 (2006) 391–402 c� 2005 Federation of European Microbiological SocietiesPublished by Blackwell Publishing Ltd. All rights reserved
397Characterization of cyanobacterial glnA gene diversity and gene expression
125 m. Therefore, it was not possible to conclude whether
there was a depth distribution of low- and high-light-
adapted phylotypes based on the glnA sequences analysed
here.
Prochlorococcus abundance always exceeds Synechococcus
abundance by two orders of magnitude at station ALOHA
(Campbell et al., 1997). Only 15 glnA sequences were
recovered, two of which were Prochlorococcus. The low
recovery of Prochlorococcus glnA relative to Synechococcus at
the open ocean site (station ALOHA) suggests primer bias,
or differences in extraction efficiency, but only a relatively
low number of sequences were analysed in this study.
Two Prochlorococcus sp. glnA sequences were recovered
from Monterey Bay. The two Prochlorococcus-like glnA
sequences (one partial sequence not shown in the glnA tree)
were recovered from 100 m at M1 in December 2001,
clustering with glnA from Prochlorococcus sp. MIT9313.
The recovery of this sequence from a deep sample is
consistent with the fact that Prochlorococcus sp. MIT9313 is
adapted to low-light conditions (Moore et al., 2002; Scanlan
& West, 2002; El Alaoui et al., 2003). The recovery of only a
few Prochlorococcus glnA sequences is consistent with the
low abundance of Prochlorococcus in Monterey Bay and
coastal environments in general.
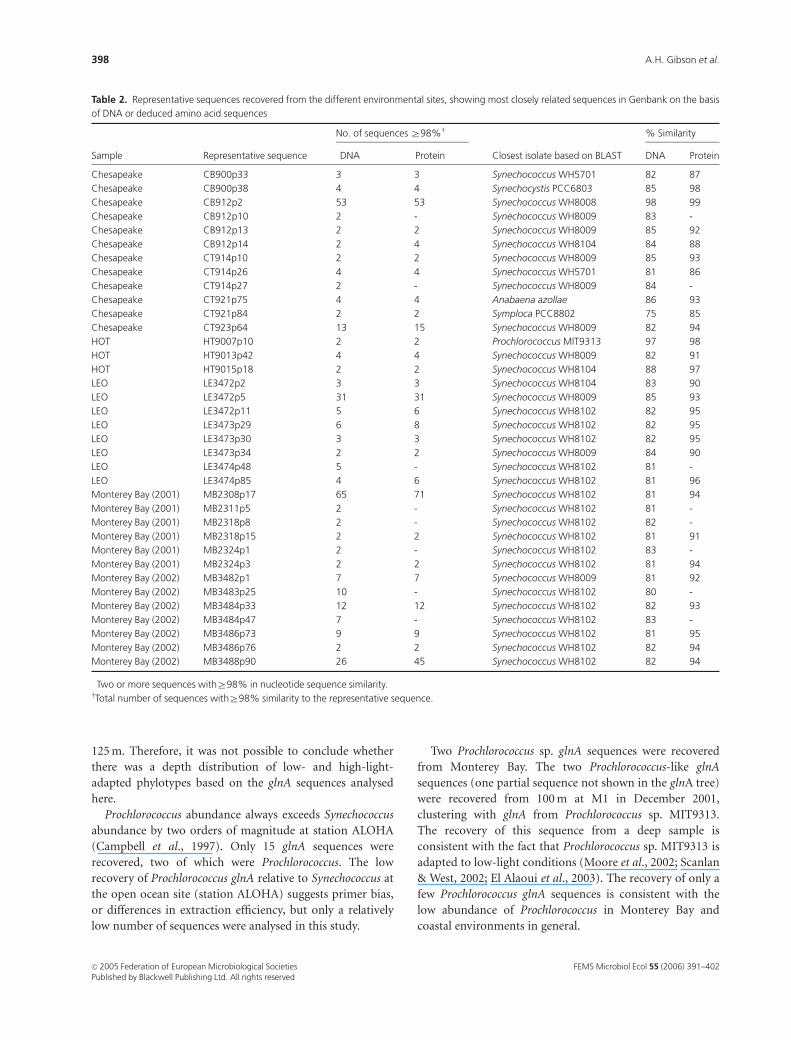
Table 2. Representative sequences recovered from the different environmental sites, showing most closely related sequences in Genbank on the basis
of DNA or deduced amino acid sequences
Sample Representative sequence�
No. of sequences Z98%w
Closest isolate based on BLAST
% Similarity
DNA Protein DNA Protein
Chesapeake CB900p33 3 3 Synechococcus WH5701 82 87
Chesapeake CB900p38 4 4 Synechocystis PCC6803 85 98
Chesapeake CB912p2 53 53 Synechococcus WH8008 98 99
Chesapeake CB912p10 2 - Synechococcus WH8009 83 -
Chesapeake CB912p13 2 2 Synechococcus WH8009 85 92
Chesapeake CB912p14 2 4 Synechococcus WH8104 84 88
Chesapeake CT914p10 2 2 Synechococcus WH8009 85 93
Chesapeake CT914p26 4 4 Synechococcus WH5701 81 86
Chesapeake CT914p27 2 - Synechococcus WH8009 84 -
Chesapeake CT921p75 4 4 Anabaena azollae 86 93
Chesapeake CT921p84 2 2 Symploca PCC8802 75 85
Chesapeake CT923p64 13 15 Synechococcus WH8009 82 94
HOT HT9007p10 2 2 Prochlorococcus MIT9313 97 98
HOT HT9013p42 4 4 Synechococcus WH8009 82 91
HOT HT9015p18 2 2 Synechococcus WH8104 88 97
LEO LE3472p2 3 3 Synechococcus WH8104 83 90
LEO LE3472p5 31 31 Synechococcus WH8009 85 93
LEO LE3472p11 5 6 Synechococcus WH8102 82 95
LEO LE3473p29 6 8 Synechococcus WH8102 82 95
LEO LE3473p30 3 3 Synechococcus WH8102 82 95
LEO LE3473p34 2 2 Synechococcus WH8009 84 90
LEO LE3474p48 5 - Synechococcus WH8102 81 -
LEO LE3474p85 4 6 Synechococcus WH8102 81 96
Monterey Bay (2001) MB2308p17 65 71 Synechococcus WH8102 81 94
Monterey Bay (2001) MB2311p5 2 - Synechococcus WH8102 81 -
Monterey Bay (2001) MB2318p8 2 - Synechococcus WH8102 82 -
Monterey Bay (2001) MB2318p15 2 2 Synechococcus WH8102 81 91
Monterey Bay (2001) MB2324p1 2 - Synechococcus WH8102 83 -
Monterey Bay (2001) MB2324p3 2 2 Synechococcus WH8102 81 94
Monterey Bay (2002) MB3482p1 7 7 Synechococcus WH8009 81 92
Monterey Bay (2002) MB3483p25 10 - Synechococcus WH8102 80 -
Monterey Bay (2002) MB3484p33 12 12 Synechococcus WH8102 82 93
Monterey Bay (2002) MB3484p47 7 - Synechococcus WH8102 83 -
Monterey Bay (2002) MB3486p73 9 9 Synechococcus WH8102 81 95
Monterey Bay (2002) MB3486p76 2 2 Synechococcus WH8102 82 94
Monterey Bay (2002) MB3488p90 26 45 Synechococcus WH8102 82 94
�Two or more sequences withZ98% in nucleotide sequence similarity.wTotal number of sequences withZ98% similarity to the representative sequence.
FEMS Microbiol Ecol 55 (2006) 391–402c� 2005 Federation of European Microbiological SocietiesPublished by Blackwell Publishing Ltd. All rights reserved
398 A.H. Gibson et al.
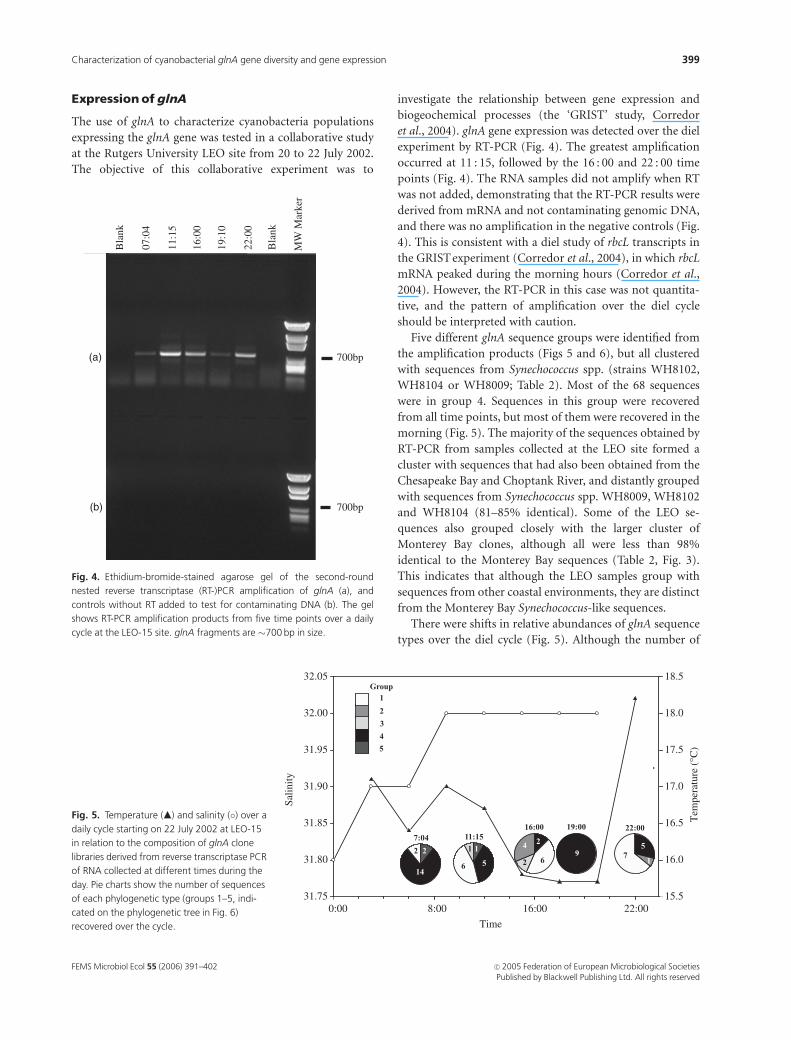
ExpressionofglnA
The use of glnA to characterize cyanobacteria populations
expressing the glnA gene was tested in a collaborative study
at the Rutgers University LEO site from 20 to 22 July 2002.
The objective of this collaborative experiment was to
investigate the relationship between gene expression and
biogeochemical processes (the ‘GRIST’ study, Corredor
et al., 2004). glnA gene expression was detected over the diel
experiment by RT-PCR (Fig. 4). The greatest amplification
occurred at 11 : 15, followed by the 16 : 00 and 22 : 00 time
points (Fig. 4). The RNA samples did not amplify when RT
was not added, demonstrating that the RT-PCR results were
derived from mRNA and not contaminating genomic DNA,
and there was no amplification in the negative controls (Fig.
4). This is consistent with a diel study of rbcL transcripts in
the GRIST experiment (Corredor et al., 2004), in which rbcL
mRNA peaked during the morning hours (Corredor et al.,
2004). However, the RT-PCR in this case was not quantita-
tive, and the pattern of amplification over the diel cycle
should be interpreted with caution.
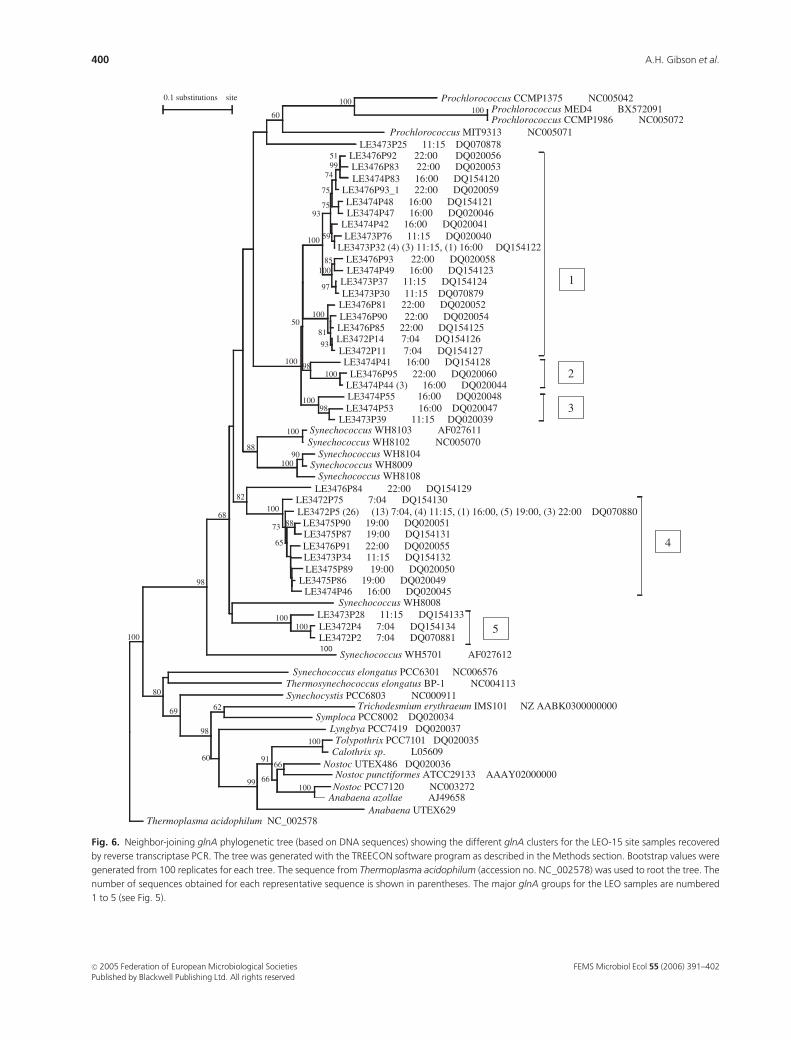
Five different glnA sequence groups were identified from
the amplification products (Figs 5 and 6), but all clustered
with sequences from Synechococcus spp. (strains WH8102,
WH8104 or WH8009; Table 2). Most of the 68 sequences
were in group 4. Sequences in this group were recovered
from all time points, but most of them were recovered in the
morning (Fig. 5). The majority of the sequences obtained by
RT-PCR from samples collected at the LEO site formed a
cluster with sequences that had also been obtained from the
Chesapeake Bay and Choptank River, and distantly grouped
with sequences from Synechococcus spp. WH8009, WH8102
and WH8104 (81–85% identical). Some of the LEO se-
quences also grouped closely with the larger cluster of
Monterey Bay clones, although all were less than 98%
identical to the Monterey Bay sequences (Table 2, Fig. 3).
This indicates that although the LEO samples group with
sequences from other coastal environments, they are distinct
from the Monterey Bay Synechococcus-like sequences.
There were shifts in relative abundances of glnA sequence
types over the diel cycle (Fig. 5). Although the number of
700bp
700bp
Bla
nk
22:0
0
19:1
0
16:0
0
11:1
5
07:0
4
Bla
nk
MW
Mar
ker
(a)
(b)
Fig. 4. Ethidium-bromide-stained agarose gel of the second-round
nested reverse transcriptase (RT-)PCR amplification of glnA (a), and
controls without RT added to test for contaminating DNA (b). The gel
shows RT-PCR amplification products from five time points over a daily
cycle at the LEO-15 site. glnA fragments are �700 bp in size.
Time
0:00 8:00 16:00 22:00
Sal
init
y
31.75
31.80
31.85
31.90
31.95
32.00
32.05
Tem
pera
ture
(°C
)
15.5
16.0
16.5
17.0
17.5
18.0
18.5Group
1
5
4
3
2
7:04 11:15
16:00 19:00 22:00
2
4
6
2
7
5
19
6
1122
514
Fig. 5. Temperature (m) and salinity (�) over a
daily cycle starting on 22 July 2002 at LEO-15
in relation to the composition of glnA clone
libraries derived from reverse transcriptase PCR
of RNA collected at different times during the
day. Pie charts show the number of sequences
of each phylogenetic type (groups 1–5, indi-
cated on the phylogenetic tree in Fig. 6)
recovered over the cycle.
FEMS Microbiol Ecol 55 (2006) 391–402 c� 2005 Federation of European Microbiological SocietiesPublished by Blackwell Publishing Ltd. All rights reserved
399Characterization of cyanobacterial glnA gene diversity and gene expression
0.1 substitutions site
LE3476P84 22:00 DQ154129LE3472P75 7:04 DQ154130LE3472P5 (26) (13) 7:04, (4) 11:15, (1) 16:00, (5) 19:00, (3) 22:00 DQ070880
LE3476P91 22:00 DQ020055
LE3473P25 11:15 DQ070878
LE3476P81 22:00 DQ020052
LE3473P34 11:15 DQ154132
LE3476P93_1 22:00 DQ020059
LE3475P89 19:00 DQ020050
LE3474P55 16:00 DQ020048
LE3474P41 16:00 DQ154128
LE3473P28 11:15 DQ154133
LE3474P42 16:00 DQ020041
LE3474P83 16:00 DQ154120
LE3476P92 22:00 DQ020056LE3476P83 22:00 DQ020053
LE3474P48 16:00 DQ154121 LE3474P47 16:00 DQ020046
LE3473P76 11:15 DQ020040LE3473P32 (4) (3) 11:15, (1) 16:00 DQ154122
LE3476P93 22:00 DQ020058LE3474P49 16:00 DQ154123
LE3473P37 11:15 DQ154124LE3473P30 11:15 DQ070879
LE3476P90 22:00 DQ020054LE3476P85 22:00 DQ154125LE3472P14 7:04 DQ154126LE3472P11 7:04 DQ154127
LE3476P95 22:00 DQ020060LE3474P44 (3) 16:00 DQ020044
LE3474P53 16:00 DQ020047LE3473P39 11:15 DQ020039
LE3475P90 19:00 DQ020051LE3475P87 19:00 DQ154131
LE3475P86 19:00 DQ020049LE3474P46 16:00 DQ020045
LE3472P4 7:04 DQ154134LE3472P2 7:04 DQ070881100
98
68
100
50
80
100
69
98
82
100
93
73
60
65
99
91
75
88
100
60
81
66
100
74
100
100
98
100
99
100
51
75
59
85
97
93
100
98
100
100
90
88
100
100
62
100
66
100
Prochlorococcus CCMP1375 NC005042Prochlorococcus MED4 BX572091Prochlorococcus CCMP1986 NC005072
Prochlorococcus MIT9313 NC005071
Synechococcus WH8008
Synechococcus WH8103 AF027611Synechococcus WH8102 NC005070
Synechococcus WH8104Synechococcus WH8009
Synechococcus WH8108
Synechococcus WH5701 AF027612
Synechococcus elongatus PCC6301 NC006576Thermosynechococcus elongatus BP-1 NC004113Synechocystis PCC6803 NC000911
Trichodesmium erythraeum IMS101 NZ AABK0300000000
Anabaena UTEX629Anabaena azollae AJ49658Nostoc PCC7120 NC003272Nostoc punctiformes ATCC29133 AAAY02000000
Nostoc UTEX486 DQ020036 Calothrix sp. L05609Tolypothrix PCC7101 DQ020035
Lyngbya PCC7419 DQ020037Symploca PCC8002 DQ020034
Thermoplasma acidophilum NC_002578
1
4
5
2
3
Fig. 6. Neighbor-joining glnA phylogenetic tree (based on DNA sequences) showing the different glnA clusters for the LEO-15 site samples recovered
by reverse transcriptase PCR. The tree was generated with the TREECON software program as described in the Methods section. Bootstrap values were
generated from 100 replicates for each tree. The sequence from Thermoplasma acidophilum (accession no. NC_002578) was used to root the tree. The
number of sequences obtained for each representative sequence is shown in parentheses. The major glnA groups for the LEO samples are numbered
1 to 5 (see Fig. 5).
FEMS Microbiol Ecol 55 (2006) 391–402c� 2005 Federation of European Microbiological SocietiesPublished by Blackwell Publishing Ltd. All rights reserved
400 A.H. Gibson et al.
clones that were sequenced from each time point was
relatively small, the data indicate that different species or
strains of Synechococcus are expressing glnA at different
times over the daily cycle.
Summary
Primers for amplification of cyanobacterial glnA were devel-
oped that amplified glnA from a variety of cyanobacteria
(including Prochlorococcus, filamentous and freshwater spe-
cies). These primers also successfully amplified glnA from a
number of aquatic environments. The majority of sequences
amplified from the aquatic environments using the glnA
primers were closely related to sequences from Synechococ-
cus culture isolates, consistent with the known abundance
and importance of this group in aquatic environments. A
few sequences that were closely related to Prochlorococcus
glnA were detected in oceanic environments, demonstrating
that these primers could be useful in characterizing both
Prochlorococcus and Synechococcus populations in the envir-
onment. However, the reasons for the low recovery of
Prochlorococcus glnA genes at station ALOHA are unknown,
but suggest either primer bias or differential extraction
efficiency.
The primers were shown to be useful in detecting patterns
of glnA expression by RT-PCR. The diversity of glnA
transcripts differed with time of day, indicating that differ-
ent species have different daily patterns of glnA gene
expression. Gene expression studies will have to take time
of day into account in order to assess the diversity of
populations actively expressing glnA. The results show that
glnA can provide a phylogenetic and functional gene marker
for basic nitrogen metabolism in cyanobacteria, and when
combined with markers for other nitrogen-utilization path-
ways, can provide a means for determining the nitrogen
metabolic pathways in natural populations of marine cya-
nobacteria.
Acknowledgments
We are grateful to all of the students and postdoctoral
researchers in the laboratory for help in research and
manuscript preparation. Special thanks go to Dr Bess Ward
for providing the Chesapeake Bay samples, Dr Lisa Camp-
bell for providing DNA from cultivated cyanobacteria and
Dr Deborah Bronk for providing nitrogen chemistry data.
This project was supported by the DOE Bi-OMP program.
References
Boone RW, Castenholz RW & Garrity GM (1989) Bergey’s Manual
of Systematic Bacteriology, Vol. 1. Springer-Verlag, New York.
Boone RW, Castenholz RW & Garrity GM (2001) Bergey’s Manual
of Systematic Bacteriology, Vol. 2. Springer-Verlag, New York.
Campbell L, Liu HB, Nolla HA & Vaulot D (1997) Annual
variability of phytoplankton and bacteria in the subtropical
North Pacific Ocean at Station ALOHA during the 1991–1994
ENSO event. Deep-Sea Res. Part I Oceanogr. Res. Pap. 44:
167–192.
Corredor JE, Wawrik B, Paul JH, Tran H, Kerkhof L, Lopez JM,
Dieppa A & Cardenas O (2004) Geochemical rate–RNA
integrated study: ribulose-1,5-bisphosphate carboxylase/
oxygenase gene transcription and photosynthetic capacity of
planktonic photoautotrophs. Appl Environ Microbiol 70:
5459–5468.
Dugdale RC & Goering JJ (1967) Uptake of new and regenerated
forms of nitrogen in primary productivity. Limnol Oceanogr
12: 196–206.
Eisenberg D, Gill HS, Pfluegl GMU & Rotstein SH (2000)
Structure–function relationships of glutamine synthetases.
BBA-Protein Struct M 1477: 122–145.
El Alaoui S, Diez J, Toribio F, Gomez-Baena G, Dufresne A &
Garcia-Fernandez JM (2003) Glutamine synthetase from the
marine cyanobacteria Prochlorococcus spp.: characterization,
phylogeny and response to nutrient limitation. Environ
Microbiol 5: 412–423.
Eppley RW & Peterson BJ (1979) Particulate organic matter flux
and planktonic new production in the deep ocean. Nature 282:
677–680.
Ferris MJ & Palenik B (1998) Niche adaptation in ocean
cyanobacteria. Nature 396: 226–228.
Fisher TR, Harding LW, Stanley DW & Ward LG (1988)
Phytoplankton, nutrients, and turbidity in the Chesapeake,
Delaware, and Hudson estuaries. Estuar Coast Shelf Sci 27:
61–93.
Flores E & Herrero A (1994) Assimilatory nitrogen metabolism
and its regulation. The Molecular Biology of Cyanobacteria
(Bryant DA, ed), pp. 487–517. Kluwer Academic Publishers,
the Netherlands.
Heidelberg JF, Heidelberg KB & Colwell RR (2002) Seasonality of
Chesapeake Bay bacterioplankton species. Appl Environ
Microbiol 68: 5488–5497.
Herdman MR, Castenholz RW, Iteman I, Waterbury JB & Rippka
R (2001) Subsection I (Formerly Chroococcales Wettstein
1924, emend. Rippka, Deruelles, Waterbury, Herdman and
Stanier 1979). Bergey’s Manual of Systematic Bacteriology, Vol. 1
(Boone RW & Castenholz RW, eds), pp. 443–514. Springer,
New York.
Herrero A, Muro-Pastor AM & Flores E (2001) Nitrogen control
in cyanobacteria. J Bacteriol 183: 411–425.
Ludwig W, Strunk O, Westram R, et al. (2004) ARB: a software
environment for sequence data. Nucleic Acids Res 32:
1363–1371.
Merrick MJ & Edwards RA (1995) Nitrogen control in bacteria.
Microbiol Rev 59: 604–622.
FEMS Microbiol Ecol 55 (2006) 391–402 c� 2005 Federation of European Microbiological SocietiesPublished by Blackwell Publishing Ltd. All rights reserved
401Characterization of cyanobacterial glnA gene diversity and gene expression
Moore LR, Rocap G & Chisholm SW (1998) Physiology and
molecular phylogeny of coexisting Prochlorococcus ecotypes.
Nature 393: 464–467.
Moore LR, Post AF, Rocap G & Chisholm SW (2002) Utilization of
different nitrogen sources by the marine cyanobacteria
Prochlorococcus and Synechococcus. Limnol Oceanogr 47: 989–996.
Rocap G, Distel DL, Waterbury JB & Chisholm SW (2002)
Resolution of Prochlorococcus and Synechococcus ecotypes by
using 16S–23S ribosomal DNA internal transcribed spacer
sequences. Appl Environ Microbiol 68: 1180–1191.
Rocap G, Larimer FW, Lamerdin J, et al. (2003) Genome
divergence in two Prochlorococcus ecotypes reflects oceanic
niche differentiation. Nature 424: 1042–1047.
Rose TM, Schultz ER, Henikoff JG, Pietrokovski S, McCallum
CM & Henikoff S (1998) Consensus-degenerate hybrid
oligonucleotide primers for amplification of distantly-related
sequences. Nucleic Acids Res 26: 1628–1635.
Saitou N & Nei M (1987) The neighbor-joining method: a new
method for reconstructing phylogenetic trees. Mol Biol Evol 4:
406–425.
Scanlan DJ & West NJ (2002) Molecular ecology of the marine
cyanobacterial genera Prochlorococcus and Synechococcus.
FEMS Microbiol Ecol 40: 1–12.
Sharp JH (1983) The distribution of inorganic nitrogen and
dissolved and particulate organic nitrogen in the sea. Nitrogen
in the Marine Environment (Carpenter EJ & Capone DG, eds),
pp. 1–36. Academic Press, New York.
Steward GF, Jenkins BD, Ward BB & Zehr JP (2004)
Development and testing of a DNA macroarray to assess
nitrogenase (nifH) gene diversity. Appl Environ Microbiol 70:
1455–1465.
Tillett D & Neilan BA (2000) Xanthogenate nucleic acid isolation
from cultured and environmental cyanobacteria. J Phycol 36:
251–258.
Toledo G & Palenik B (1997) Synechococcus diversity in the
California current as seen by RNA polymerase (rpoC1) gene
sequences of isolated strains. Appl Environ Microbiol 63:
4298–4303.
Toledo G, Palenik B & Brahamsha B (1999) Swimming marine
Synechococcus strains with widely different photosynthetic
pigment ratios form a monophyletic group. Appl Environ
Microbiol 65: 5247–5251.
VanDePeer Y & Dewachter R (1994) Treecon for windows - a
software package for the construction and drawing of
evolutionary trees for the Microsoft Windows Environment.
Comput Appl Biosci 10: 569–570.
Waterbury JB, Watson SW, Valois FW & Franks DG (1986)
Biological and ecological characterization of the marine
unicellular cyanobacteria Synechococcus. Photosynthetic
Picoplankton (Platt T & Li WKW, eds) Canadian Bulletin of
Fisheries and Aquatic Sciences, 214: 71–120.
Wilmotte A (1994) Molecular evolution and taxonomy of the
cyanobacteria. The Molecular Biology of the Cyanobacteria, Vol.
(Bryant DA, ed), pp. 1–25. Kluwer Academic Publishers, the
Netherlands.
FEMS Microbiol Ecol 55 (2006) 391–402c� 2005 Federation of European Microbiological SocietiesPublished by Blackwell Publishing Ltd. All rights reserved
402 A.H. Gibson et al.